UNITED STATES
SECURITIES AND EXCHANGE COMMISSION
Washington, D.C. 20549
FORM N-CSR
CERTIFIED SHAREHOLDER REPORT OF REGISTERED
MANAGEMENT INVESTMENT COMPANIES
Investment Company Act file number 811-4118
Fidelity Securities Fund
(Exact name of registrant as specified in charter)
245 Summer St., Boston, MA 02210
(Address of principal executive offices) (Zip code)
William C. Coffey, Secretary
245 Summer St.
Boston, Massachusetts 02210
(Name and address of agent for service)
Registrant's telephone number, including area code:
617-563-7000
| |
Date of fiscal year end: | July 31 |
|
|
Date of reporting period: | January 31, 2019 |
Item 1.
Reports to Stockholders
Fidelity® Blue Chip Growth Fund
Semi-Annual Report January 31, 2019 |
 |
Beginning on January 1, 2021, as permitted by regulations adopted by the Securities and Exchange Commission, paper copies of a fund’s shareholder reports will no longer be sent by mail, unless you specifically request paper copies of the reports from the fund or from your financial intermediary, such as a financial advisor, broker-dealer or bank. Instead, the reports will be made available on a website, and you will be notified by mail each time a report is posted and provided with a website link to access the report.
If you already elected to receive shareholder reports electronically, you will not be affected by this change and you need not take any action. You may elect to receive shareholder reports and other communications from a fund electronically, by contacting your financial intermediary. For Fidelity customers, visit Fidelity's web site or call Fidelity using the contact information listed below.
You may elect to receive all future reports in paper free of charge. If you wish to continue receiving paper copies of your shareholder reports, you may contact your financial intermediary or, if you are a Fidelity customer, visit Fidelity’s website, or call Fidelity at the applicable toll-free number listed below. Your election to receive reports in paper will apply to all funds held with the fund complex/your financial intermediary.
| Account Type | Website | Phone Number |
| Brokerage, Mutual Fund, or Annuity Contracts: | fidelity.com/mailpreferences | 1-800-343-3548 |
| Employer Provided Retirement Accounts: | netbenefits.fidelity.com/preferences (choose 'no' under Required Disclosures to continue to print) | 1-800-343-0860 |
| Advisor Sold Accounts Serviced Through Your Financial Intermediary: | Contact Your Financial Intermediary | Your Financial Intermediary's phone number |
| Advisor Sold Accounts Serviced by Fidelity: | institutional.fidelity.com | 1-877-208-0098 |
Contents
To view a fund's proxy voting guidelines and proxy voting record for the 12-month period ended June 30, visit http://www.fidelity.com/proxyvotingresults or visit the Securities and Exchange Commission's (SEC) web site at http://www.sec.gov.
You may also call 1-800-544-8544 if you’re an individual investing directly with Fidelity, call 1-800-835-5092 if you’re a plan sponsor or participant with Fidelity as your recordkeeper or call 1-877-208-0098 on institutional accounts or if you’re an advisor or invest through one to request a free copy of the proxy voting guidelines.
Standard & Poor's, S&P and S&P 500 are registered service marks of The McGraw-Hill Companies, Inc. and have been licensed for use by Fidelity Distributors Corporation.
Other third-party marks appearing herein are the property of their respective owners.
All other marks appearing herein are registered or unregistered trademarks or service marks of FMR LLC or an affiliated company. © 2019 FMR LLC. All rights reserved.
This report and the financial statements contained herein are submitted for the general information of the shareholders of the Fund. This report is not authorized for distribution to prospective investors in the Fund unless preceded or accompanied by an effective prospectus.
A fund files its complete schedule of portfolio holdings with the SEC for the first and third quarters of each fiscal year on Form N-Q. Forms N-Q are available on the SEC’s web site at http://www.sec.gov. A fund's Forms N-Q may be reviewed and copied at the SEC’s Public Reference Room in Washington, DC. Information regarding the operation of the SEC's Public Reference Room may be obtained by calling 1-800-SEC-0330.
For a complete list of a fund's portfolio holdings, view the most recent holdings listing, semiannual report, or annual report on Fidelity's web site at http://www.fidelity.com, http://www.institutional.fidelity.com, or http://www.401k.com, as applicable.
NOT FDIC INSURED •MAY LOSE VALUE •NO BANK GUARANTEE
Neither the Fund nor Fidelity Distributors Corporation is a bank.
Investment Summary (Unaudited)
Top Ten Stocks as of January 31, 2019
| | % of fund's net assets |
| Amazon.com, Inc. | 7.7 |
| Alphabet, Inc. Class A | 7.2 |
| Apple, Inc. | 5.6 |
| Microsoft Corp. | 4.4 |
| Facebook, Inc. Class A | 3.8 |
| Salesforce.com, Inc. | 3.1 |
| JUUL Labs, Inc. Series C | 2.6 |
| Broadcom, Inc. | 2.5 |
| Tesla, Inc. | 2.2 |
| Visa, Inc. Class A | 2.2 |
| | 41.3 |
Top Five Market Sectors as of January 31, 2019
| | % of fund's net assets |
| Information Technology | 31.9 |
| Consumer Discretionary | 24.5 |
| Communication Services | 16.7 |
| Health Care | 12.8 |
| Consumer Staples | 5.6 |
Asset Allocation (% of fund's net assets)
| As of January 31, 2019* |
| | Stocks | 94.9% |
| | Convertible Securities | 5.3% |
| | Short-Term Investments and Net Other Assets (Liabilities)** | (0.2)% |

* Foreign investments - 7.8%
** Short-Term Investments and Net Other Assets (Liabilities) are not included in the pie chart
Schedule of Investments January 31, 2019 (Unaudited)
Showing Percentage of Net Assets
| Common Stocks - 94.8% | | | |
| | | Shares | Value (000s) |
| COMMUNICATION SERVICES - 16.7% | | | |
| Entertainment - 4.3% | | | |
| Activision Blizzard, Inc. | | 5,356,448 | $253,039 |
| Electronic Arts, Inc. (a) | | 301,330 | 27,795 |
| Lions Gate Entertainment Corp. Class A (b) | | 145,509 | 2,673 |
| NetEase, Inc. ADR | | 54,570 | 13,748 |
| Netflix, Inc. (a) | | 1,280,760 | 434,818 |
| Nintendo Co. Ltd. | | 50,400 | 15,286 |
| Nintendo Co. Ltd. ADR | | 200,375 | 7,462 |
| Take-Two Interactive Software, Inc. (a) | | 344,192 | 36,329 |
| The Walt Disney Co. | | 2,238,092 | 249,592 |
| WME Entertainment Parent, LLC Class A (a)(c)(d)(e) | | 9,739,286 | 27,757 |
| | | | 1,068,499 |
| Interactive Media & Services - 12.3% | | | |
| Alphabet, Inc.: | | | |
| Class A (a) | | 1,596,504 | 1,797,488 |
| Class C (a) | | 110,506 | 123,366 |
| ANGI Homeservices, Inc. Class A (a) | | 1,461,310 | 24,842 |
| CarGurus, Inc. Class A (a) | | 567,147 | 24,257 |
| Facebook, Inc. Class A (a) | | 5,764,968 | 960,963 |
| Momo, Inc. ADR (a) | | 403,222 | 12,270 |
| Tencent Holdings Ltd. | | 2,714,100 | 120,817 |
| Twitter, Inc. (a) | | 625,102 | 20,978 |
| | | | 3,084,981 |
| Media - 0.0% | | | |
| Charter Communications, Inc. Class A (a) | | 7,500 | 2,483 |
| Wireless Telecommunication Services - 0.1% | | | |
| T-Mobile U.S., Inc. (a) | | 425,068 | 29,593 |
|
| TOTAL COMMUNICATION SERVICES | | | 4,185,556 |
|
| CONSUMER DISCRETIONARY - 24.1% | | | |
| Auto Components - 0.0% | | | |
| Aptiv PLC | | 34,200 | 2,706 |
| Automobiles - 2.2% | | | |
| Tesla, Inc. (a)(b) | | 1,800,811 | 552,885 |
| Hotels, Restaurants & Leisure - 2.1% | | | |
| Boyd Gaming Corp. | | 776,674 | 21,219 |
| Caesars Entertainment Corp. (a)(b) | | 1,660,188 | 15,174 |
| Chipotle Mexican Grill, Inc. (a) | | 9,200 | 4,872 |
| Eldorado Resorts, Inc. (a) | | 925,148 | 43,130 |
| Gaming VC Holdings SA | | 629,352 | 5,547 |
| Haidilao International Holding Ltd. (f) | | 2,657,860 | 6,247 |
| Hilton Grand Vacations, Inc. (a) | | 252,593 | 7,664 |
| Hilton Worldwide Holdings, Inc. | | 247,533 | 18,436 |
| Hyatt Hotels Corp. Class A | | 68,244 | 4,771 |
| Kambi Group PLC (a) | | 493,218 | 11,174 |
| Marriott International, Inc. Class A | | 648,681 | 74,293 |
| McDonald's Corp. | | 360,868 | 64,516 |
| MGM Mirage, Inc. | | 634,541 | 18,681 |
| Penn National Gaming, Inc. (a) | | 648,094 | 15,710 |
| Planet Fitness, Inc. (a) | | 966,913 | 56,004 |
| PlayAGS, Inc. (a) | | 417,728 | 10,468 |
| Restaurant Brands International, Inc. | | 426,029 | 26,704 |
| Royal Caribbean Cruises Ltd. | | 441,499 | 53,002 |
| Sea Ltd. ADR (a)(b) | | 569,200 | 7,974 |
| Shake Shack, Inc. Class A (a) | | 487,500 | 23,283 |
| Starbucks Corp. | | 117,997 | 8,040 |
| Wynn Resorts Ltd. | | 244,534 | 30,080 |
| | | | 526,989 |
| Household Durables - 0.3% | | | |
| D.R. Horton, Inc. | | 574,789 | 22,101 |
| iRobot Corp. (a) | | 66,510 | 5,972 |
| Lennar Corp. Class A | | 502,408 | 23,824 |
| Mohawk Industries, Inc. (a) | | 38,200 | 4,920 |
| Roku, Inc. Class A (a) | | 454,372 | 20,424 |
| | | | 77,241 |
| Internet & Direct Marketing Retail - 10.1% | | | |
| Alibaba Group Holding Ltd. sponsored ADR (a) | | 1,222,325 | 205,950 |
| Amazon.com, Inc. (a) | | 1,126,203 | 1,935,631 |
| eBay, Inc. | | 513,100 | 17,266 |
| Etsy, Inc. (a) | | 412,634 | 22,550 |
| GrubHub, Inc. (a) | | 172,317 | 13,854 |
| JD.com, Inc. sponsored ADR (a) | | 1,918,605 | 47,677 |
| Meituan Dianping Class B | | 3,163,704 | 20,414 |
| The Booking Holdings, Inc. (a) | | 110,316 | 202,188 |
| The Honest Co., Inc. (a)(d)(e) | | 150,143 | 1,480 |
| Wayfair LLC Class A (a) | | 567,569 | 62,126 |
| | | | 2,529,136 |
| Multiline Retail - 1.2% | | | |
| Avenue Supermarts Ltd. (a)(f) | | 135,551 | 2,626 |
| Dollar General Corp. | | 147,086 | 16,978 |
| Dollar Tree, Inc. (a) | | 2,495,724 | 241,661 |
| Ollie's Bargain Outlet Holdings, Inc. (a) | | 133,589 | 10,443 |
| Target Corp. | | 337,730 | 24,654 |
| | | | 296,362 |
| Specialty Retail - 5.1% | | | |
| American Eagle Outfitters, Inc. | | 1,466,621 | 30,975 |
| At Home Group, Inc. (a)(b) | | 2,189,547 | 48,258 |
| Best Buy Co., Inc. | | 602,714 | 35,705 |
| Burlington Stores, Inc. (a) | | 374,163 | 64,248 |
| Carvana Co. Class A (a)(b) | | 407,952 | 15,155 |
| Five Below, Inc. (a) | | 398,709 | 49,332 |
| Floor & Decor Holdings, Inc. Class A (a)(b) | | 796,156 | 27,300 |
| Home Depot, Inc. | | 2,311,691 | 424,265 |
| Lowe's Companies, Inc. | | 2,558,057 | 245,983 |
| RH (a)(b) | | 729,430 | 99,108 |
| Ross Stores, Inc. | | 532,465 | 49,051 |
| TCNS Clothing Co. Ltd. (a)(f) | | 321,124 | 3,286 |
| The Children's Place Retail Stores, Inc. | | 77,400 | 7,489 |
| Tiffany & Co., Inc. | | 365,521 | 32,433 |
| TJX Companies, Inc. | | 1,776,268 | 88,334 |
| Ulta Beauty, Inc. (a) | | 217,911 | 63,613 |
| | | | 1,284,535 |
| Textiles, Apparel & Luxury Goods - 3.1% | | | |
| adidas AG | | 512,143 | 121,754 |
| Allbirds, Inc. (d)(e) | | 36,216 | 1,986 |
| Canada Goose Holdings, Inc. (a) | | 102,191 | 5,257 |
| lululemon athletica, Inc. (a) | | 1,441,675 | 213,094 |
| Moncler SpA | | 698,000 | 26,285 |
| NIKE, Inc. Class B | | 2,260,713 | 185,107 |
| Pinduoduo, Inc. ADR (b) | | 1,984,306 | 57,962 |
| PVH Corp. | | 837,217 | 91,349 |
| Skechers U.S.A., Inc. Class A (sub. vtg.) (a) | | 961,871 | 26,134 |
| Tory Burch LLC (c)(d)(e) | | 293,611 | 16,351 |
| Under Armour, Inc. Class C (non-vtg.) (a)(b) | | 2,042,894 | 38,692 |
| | | | 783,971 |
|
| TOTAL CONSUMER DISCRETIONARY | | | 6,053,825 |
|
| CONSUMER STAPLES - 2.7% | | | |
| Beverages - 0.4% | | | |
| Fever-Tree Drinks PLC | | 1,309,003 | 44,141 |
| Keurig Dr. Pepper, Inc. | | 1,953,564 | 53,176 |
| Monster Beverage Corp. (a) | | 112,396 | 6,434 |
| Pernod Ricard SA | | 14,375 | 2,386 |
| | | | 106,137 |
| Food & Staples Retailing - 1.0% | | | |
| BJ's Wholesale Club Holdings, Inc. | | 2,648,359 | 69,678 |
| Costco Wholesale Corp. | | 791,198 | 169,815 |
| Kroger Co. | | 418,321 | 11,851 |
| | | | 251,344 |
| Food Products - 0.1% | | | |
| Blue Bottle Coffee, Inc. Class C (Escrow) (a)(d)(e) | | 632,822 | 930 |
| Darling International, Inc. (a) | | 537,823 | 11,439 |
| Lamb Weston Holdings, Inc. | | 44,728 | 3,234 |
| Nestle SA (Reg. S) | | 31,388 | 2,737 |
| The a2 Milk Co. Ltd. (a) | | 692,600 | 6,056 |
| | | | 24,396 |
| Household Products - 0.0% | | | |
| Procter & Gamble Co. | | 77,100 | 7,438 |
| Personal Products - 0.4% | | | |
| Coty, Inc. Class A | | 4,642,138 | 36,023 |
| Estee Lauder Companies, Inc. Class A | | 396,098 | 54,036 |
| | | | 90,059 |
| Tobacco - 0.8% | | | |
| Altria Group, Inc. | | 3,866,933 | 190,833 |
| JUUL Labs, Inc. (a)(d)(e) | | 6,625 | 1,653 |
| JUUL Labs, Inc. Class A (d)(e) | | 21,148 | 5,277 |
| | | | 197,763 |
|
| TOTAL CONSUMER STAPLES | | | 677,137 |
|
| ENERGY - 1.0% | | | |
| Oil, Gas & Consumable Fuels - 1.0% | | | |
| Anadarko Petroleum Corp. | | 531,500 | 25,156 |
| Berry Petroleum Corp. | | 468,800 | 5,527 |
| Continental Resources, Inc. (a) | | 797,252 | 36,809 |
| Diamondback Energy, Inc. | | 96,755 | 9,977 |
| Hess Corp. | | 117,400 | 6,340 |
| Pioneer Natural Resources Co. | | 161,800 | 23,027 |
| Reliance Industries Ltd. | | 4,777,338 | 82,617 |
| Whiting Petroleum Corp. (a) | | 2,049,518 | 58,678 |
| | | | 248,131 |
| FINANCIALS - 2.5% | | | |
| Banks - 1.0% | | | |
| Bank of America Corp. | | 5,624,643 | 160,134 |
| Coastal Financial Corp. of Washington (a) | | 40,875 | 608 |
| ICICI Bank Ltd. sponsored ADR | | 501,495 | 5,120 |
| IndusInd Bank Ltd. | | 184,465 | 3,914 |
| JPMorgan Chase & Co. | | 586,591 | 60,712 |
| Kotak Mahindra Bank Ltd. | | 615,886 | 10,899 |
| | | | 241,387 |
| Capital Markets - 0.5% | | | |
| Charles Schwab Corp. | | 1,459,242 | 68,249 |
| Edelweiss Financial Services Ltd. | | 1,204,598 | 2,615 |
| HDFC Asset Management Co. Ltd. (a)(f) | | 1,726 | 33 |
| Morgan Stanley | | 114,300 | 4,835 |
| TD Ameritrade Holding Corp. | | 1,161,761 | 65,001 |
| | | | 140,733 |
| Diversified Financial Services - 0.7% | | | |
| Berkshire Hathaway, Inc. Class B (a) | | 833,100 | 171,235 |
| GDS Holdings Ltd. ADR (a)(b) | | 419,636 | 11,918 |
| | | | 183,153 |
| Insurance - 0.1% | | | |
| eHealth, Inc. (a) | | 330,200 | 20,195 |
| Thrifts & Mortgage Finance - 0.2% | | | |
| Housing Development Finance Corp. Ltd. | | 697,722 | 18,902 |
| LendingTree, Inc. (a)(b) | | 78,267 | 23,194 |
| | | | 42,096 |
|
| TOTAL FINANCIALS | | | 627,564 |
|
| HEALTH CARE - 12.5% | | | |
| Biotechnology - 5.2% | | | |
| ACADIA Pharmaceuticals, Inc. (a) | | 258,633 | 5,892 |
| Acceleron Pharma, Inc. (a) | | 187,901 | 7,967 |
| Agios Pharmaceuticals, Inc. (a) | | 297,210 | 15,930 |
| Aimmune Therapeutics, Inc. (a) | | 529,126 | 12,445 |
| Alexion Pharmaceuticals, Inc. (a) | | 1,940,769 | 238,637 |
| Alkermes PLC (a) | | 9,114 | 300 |
| Allakos, Inc. (a) | | 154,853 | 6,186 |
| Allogene Therapeutics, Inc. (b) | | 114,004 | 3,458 |
| Alnylam Pharmaceuticals, Inc. (a) | | 820,242 | 68,515 |
| Amgen, Inc. | | 223,850 | 41,885 |
| AnaptysBio, Inc. (a) | | 179,814 | 11,925 |
| Arena Pharmaceuticals, Inc. (a) | | 360,379 | 16,567 |
| Argenx SE ADR (a) | | 46,500 | 4,934 |
| Array BioPharma, Inc. (a) | | 484,048 | 9,037 |
| Ascendis Pharma A/S sponsored ADR (a) | | 385,209 | 27,527 |
| BeiGene Ltd. | | 595,700 | 5,902 |
| BeiGene Ltd. ADR (a) | | 138,663 | 17,954 |
| bluebird bio, Inc. (a) | | 318,291 | 42,470 |
| Blueprint Medicines Corp. (a) | | 53,582 | 3,863 |
| Cellectis SA sponsored ADR (a) | | 130,720 | 2,310 |
| Cibus Global Ltd. Series C (c)(d)(e) | | 3,045,600 | 3,320 |
| Coherus BioSciences, Inc. (a) | | 579,456 | 7,799 |
| Crinetics Pharmaceuticals, Inc. (a) | | 120,350 | 3,163 |
| CytomX Therapeutics, Inc. (a) | | 151,186 | 2,567 |
| CytomX Therapeutics, Inc. (a)(f) | | 378,621 | 6,429 |
| Deciphera Pharmaceuticals, Inc. (a) | | 64,232 | 1,726 |
| Denali Therapeutics, Inc. (a)(b) | | 758,737 | 14,462 |
| Editas Medicine, Inc. (a)(b) | | 450,970 | 9,800 |
| Epizyme, Inc. (a) | | 303,472 | 3,101 |
| Esperion Therapeutics, Inc. (a)(b) | | 229,791 | 10,674 |
| Exact Sciences Corp. (a) | | 176,900 | 15,935 |
| FibroGen, Inc. (a) | | 323,068 | 18,334 |
| Global Blood Therapeutics, Inc. (a) | | 646,724 | 30,985 |
| Heron Therapeutics, Inc. (a) | | 193,580 | 5,207 |
| Immunomedics, Inc. (a) | | 356,700 | 5,276 |
| Intellia Therapeutics, Inc. (a)(b) | | 554,183 | 7,836 |
| Intercept Pharmaceuticals, Inc. (a) | | 260,309 | 31,414 |
| Ionis Pharmaceuticals, Inc. (a) | | 115,271 | 6,686 |
| Ironwood Pharmaceuticals, Inc. Class A (a) | | 973,061 | 13,292 |
| Mirati Therapeutics, Inc. (a) | | 89,500 | 5,914 |
| Moderna, Inc. (b) | | 218,996 | 3,635 |
| Momenta Pharmaceuticals, Inc. (a) | | 88,218 | 1,046 |
| Natera, Inc. (a) | | 819,525 | 11,137 |
| Neurocrine Biosciences, Inc. (a) | | 578,685 | 51,052 |
| Portola Pharmaceuticals, Inc. (a)(b) | | 348,523 | 9,445 |
| Principia Biopharma, Inc. | | 102,416 | 3,104 |
| Regeneron Pharmaceuticals, Inc. (a) | | 495,613 | 212,752 |
| Rubius Therapeutics, Inc. | | 126,883 | 1,737 |
| Sage Therapeutics, Inc. (a) | | 445,877 | 63,578 |
| Sarepta Therapeutics, Inc. (a) | | 411,958 | 57,555 |
| Scholar Rock Holding Corp. | | 131,828 | 1,992 |
| Synthorx, Inc. | | 228,900 | 3,225 |
| Ultragenyx Pharmaceutical, Inc. (a) | | 137,155 | 6,764 |
| Vertex Pharmaceuticals, Inc. (a) | | 530,106 | 101,203 |
| Viking Therapeutics, Inc. (a)(b) | | 260,794 | 2,128 |
| Xencor, Inc. (a) | | 415,719 | 15,007 |
| Zai Lab Ltd. ADR (a) | | 294,407 | 7,946 |
| | | | 1,300,930 |
| Health Care Equipment & Supplies - 3.4% | | | |
| Abiomed, Inc. (a) | | 18,400 | 6,460 |
| Align Technology, Inc. (a) | | 135,082 | 33,629 |
| Atricure, Inc. (a) | | 179,079 | 5,542 |
| Axonics Modulation Technologies, Inc. (a) | | 306,851 | 4,480 |
| Becton, Dickinson & Co. | | 200,407 | 49,994 |
| Boston Scientific Corp. (a) | | 7,852,328 | 299,566 |
| Danaher Corp. | | 424,572 | 47,094 |
| DexCom, Inc. (a) | | 154,171 | 21,743 |
| Edwards Lifesciences Corp. (a) | | 35,104 | 5,982 |
| Establishment Labs Holdings, Inc. (a) | | 376,385 | 9,978 |
| Insulet Corp. (a) | | 218,610 | 17,749 |
| Intuitive Surgical, Inc. (a) | | 469,897 | 246,057 |
| iRhythm Technologies, Inc. (a) | | 431,455 | 36,674 |
| Masimo Corp. (a) | | 21,493 | 2,674 |
| Novocure Ltd. (a) | | 145,232 | 7,116 |
| Penumbra, Inc. (a) | | 33,557 | 4,883 |
| Quanterix Corp. (a) | | 145,678 | 3,068 |
| Stryker Corp. | | 104,273 | 18,516 |
| Tandem Diabetes Care, Inc. (a) | | 330,144 | 14,355 |
| ViewRay, Inc. (a)(b) | | 541,794 | 3,895 |
| Wright Medical Group NV (a) | | 305,167 | 9,106 |
| | | | 848,561 |
| Health Care Providers & Services - 2.9% | | | |
| Anthem, Inc. | | 91,704 | 27,786 |
| Centene Corp. (a) | | 92,511 | 12,079 |
| Guardant Health, Inc. (b) | | 303,901 | 12,259 |
| HCA Holdings, Inc. | | 586,643 | 81,796 |
| Humana, Inc. | | 628,731 | 194,272 |
| National Vision Holdings, Inc. (a) | | 118,110 | 3,751 |
| Notre Dame Intermedica Participacoes SA | | 989,000 | 9,106 |
| OptiNose, Inc. (a) | | 745,650 | 4,802 |
| UnitedHealth Group, Inc. | | 1,286,905 | 347,722 |
| Wellcare Health Plans, Inc. (a) | | 112,731 | 31,168 |
| | | | 724,741 |
| Health Care Technology - 0.1% | | | |
| Evolent Health, Inc. (a) | | 303,159 | 5,360 |
| Teladoc Health, Inc. (a)(b) | | 282,275 | 18,122 |
| | | | 23,482 |
| Life Sciences Tools & Services - 0.0% | | | |
| Thermo Fisher Scientific, Inc. | | 20,100 | 4,938 |
| Pharmaceuticals - 0.9% | | | |
| Akcea Therapeutics, Inc. (a)(b) | | 798,889 | 21,234 |
| Allergan PLC | | 63,900 | 9,200 |
| Assembly Biosciences, Inc. (a) | | 100,335 | 2,286 |
| AstraZeneca PLC sponsored ADR | | 1,100,689 | 40,263 |
| Bristol-Myers Squibb Co. | | 1,231,927 | 60,820 |
| Chiasma, Inc. warrants 12/16/24 (a) | | 55,391 | 46 |
| Dova Pharmaceuticals, Inc. (a)(b) | | 201,722 | 1,549 |
| Jazz Pharmaceuticals PLC (a) | | 292,011 | 36,761 |
| MyoKardia, Inc. (a) | | 98,554 | 4,078 |
| Nektar Therapeutics (a) | | 890,754 | 37,715 |
| The Medicines Company (a) | | 483,516 | 11,174 |
| TherapeuticsMD, Inc. (a)(b) | | 951,572 | 4,996 |
| Theravance Biopharma, Inc. (a) | | 56,382 | 1,469 |
| Zogenix, Inc. (a) | | 109,425 | 4,787 |
| | | | 236,378 |
|
| TOTAL HEALTH CARE | | | 3,139,030 |
|
| INDUSTRIALS - 3.9% | | | |
| Aerospace & Defense - 1.3% | | | |
| Elbit Systems Ltd. | | 49,992 | 6,151 |
| Northrop Grumman Corp. | | 258,842 | 71,324 |
| Space Exploration Technologies Corp.: | | | |
| Class A (a)(d)(e) | | 242,545 | 45,113 |
| Class C (a)(d)(e) | | 2,783 | 518 |
| The Boeing Co. | | 487,312 | 187,917 |
| United Technologies Corp. | | 161,418 | 19,059 |
| | | | 330,082 |
| Airlines - 0.9% | | | |
| American Airlines Group, Inc. | | 974,803 | 34,869 |
| Delta Air Lines, Inc. | | 1,218,384 | 60,225 |
| JetBlue Airways Corp. (a) | | 135,900 | 2,445 |
| Spirit Airlines, Inc. (a) | | 1,447,153 | 85,122 |
| United Continental Holdings, Inc. (a) | | 595,248 | 51,947 |
| | | | 234,608 |
| Building Products - 0.1% | | | |
| Fortune Brands Home & Security, Inc. | | 626,079 | 28,361 |
| Commercial Services & Supplies - 0.1% | | | |
| HomeServe PLC | | 938,811 | 11,618 |
| Tomra Systems ASA | | 583,300 | 15,112 |
| | | | 26,730 |
| Construction & Engineering - 0.1% | | | |
| MasTec, Inc. (a) | | 375,469 | 16,663 |
| Electrical Equipment - 0.1% | | | |
| Fortive Corp. | | 432,934 | 32,466 |
| Industrial Conglomerates - 0.4% | | | |
| General Electric Co. | | 4,103,672 | 41,693 |
| Honeywell International, Inc. | | 425,217 | 61,074 |
| | | | 102,767 |
| Machinery - 0.6% | | | |
| Aumann AG (f) | | 32,600 | 1,345 |
| Deere & Co. | | 591,338 | 96,979 |
| Rational AG | | 14,985 | 9,382 |
| Xylem, Inc. | | 396,973 | 28,288 |
| | | | 135,994 |
| Road & Rail - 0.3% | | | |
| Knight-Swift Transportation Holdings, Inc. Class A | | 1,948,772 | 61,874 |
| Union Pacific Corp. | | 47,900 | 7,619 |
| | | | 69,493 |
| Trading Companies & Distributors - 0.0% | | | |
| Ferguson PLC | | 30,276 | 2,023 |
|
| TOTAL INDUSTRIALS | | | 979,187 |
|
| INFORMATION TECHNOLOGY - 30.2% | | | |
| Communications Equipment - 0.2% | | | |
| Arista Networks, Inc. (a) | | 157,082 | 33,738 |
| Telefonaktiebolaget LM Ericsson (B Shares) sponsored ADR | | 1,553,570 | 13,842 |
| | | | 47,580 |
| Electronic Equipment & Components - 0.1% | | | |
| Corning, Inc. | | 903,406 | 30,047 |
| IT Services - 5.7% | | | |
| Adyen BV (f) | | 21,470 | 15,917 |
| Akamai Technologies, Inc. (a) | | 872,106 | 56,774 |
| Endava PLC ADR (a) | | 88,976 | 2,091 |
| GoDaddy, Inc. (a) | | 429,772 | 29,495 |
| Keywords Studios PLC | | 112,912 | 1,765 |
| MasterCard, Inc. Class A | | 1,944,157 | 410,470 |
| Netcompany Group A/S (f) | | 94,000 | 3,171 |
| Okta, Inc. (a) | | 49,702 | 4,097 |
| PayPal Holdings, Inc. (a) | | 2,641,027 | 234,418 |
| Shopify, Inc. Class A (a) | | 284,548 | 47,899 |
| Square, Inc.(a) | | 295,745 | 21,101 |
| Total System Services, Inc. | | 59,482 | 5,330 |
| Twilio, Inc. Class A (a) | | 53,486 | 5,954 |
| Visa, Inc. Class A | | 4,063,340 | 548,592 |
| Wix.com Ltd. (a) | | 380,597 | 41,618 |
| | | | 1,428,692 |
| Semiconductors & Semiconductor Equipment - 8.2% | | | |
| Acacia Communications, Inc. (a) | | 152,912 | 6,653 |
| Advanced Micro Devices, Inc. (a) | | 1,763,394 | 43,044 |
| Analog Devices, Inc. | | 352,248 | 34,823 |
| ASML Holding NV | | 64,353 | 11,264 |
| Broadcom, Inc. | | 2,351,697 | 630,843 |
| Inphi Corp. (a) | | 703,792 | 27,758 |
| Lam Research Corp. | | 468,242 | 79,404 |
| Marvell Technology Group Ltd. | | 23,619,898 | 437,677 |
| Micron Technology, Inc. (a) | | 1,530,186 | 58,484 |
| Monolithic Power Systems, Inc. | | 434,304 | 54,966 |
| NVIDIA Corp. | | 3,178,398 | 456,895 |
| NXP Semiconductors NV | | 1,076,694 | 93,705 |
| ON Semiconductor Corp. (a) | | 529,800 | 10,617 |
| Qualcomm, Inc. | | 1,229,445 | 60,882 |
| Semtech Corp. (a) | | 131,426 | 6,382 |
| Xilinx, Inc. | | 351,158 | 39,309 |
| | | | 2,052,706 |
| Software - 10.4% | | | |
| Adobe, Inc. (a) | | 1,070,135 | 265,201 |
| Altair Engineering, Inc. Class A (a) | | 89,853 | 2,909 |
| Atom Tickets LLC (a)(c)(d)(e) | | 1,204,239 | 3,565 |
| Bilibili, Inc. ADR (a)(b) | | 467,210 | 8,601 |
| CyberArk Software Ltd. (a) | | 33,181 | 2,912 |
| DocuSign, Inc. | | 534,745 | 26,443 |
| Dropbox, Inc. Class A (a) | | 1,082,290 | 26,743 |
| HubSpot, Inc. (a) | | 139,048 | 22,013 |
| Intuit, Inc. | | 217,215 | 46,879 |
| Microsoft Corp. | | 10,569,946 | 1,103,819 |
| Nutanix, Inc. Class B (a)(f) | | 482,746 | 24,731 |
| Paycom Software, Inc. (a) | | 410,389 | 60,836 |
| RingCentral, Inc. (a) | | 460,895 | 42,605 |
| SailPoint Technologies Holding, Inc. (a) | | 285,336 | 8,146 |
| Salesforce.com, Inc. (a) | | 5,051,175 | 767,627 |
| ServiceNow, Inc. (a) | | 25,958 | 5,711 |
| Splunk, Inc. (a) | | 93,927 | 11,726 |
| StoneCo Ltd. Class A (a)(b) | | 100,633 | 2,226 |
| Tanium, Inc. Class B (a)(d)(e) | | 554,900 | 4,824 |
| The Trade Desk, Inc. (a)(b) | | 414,121 | 59,087 |
| Ultimate Software Group, Inc. (a) | | 9,608 | 2,624 |
| Workday, Inc. Class A (a) | | 478,734 | 86,905 |
| Zendesk, Inc. (a) | | 290,148 | 19,594 |
| Zuora, Inc. | | 717,307 | 15,523 |
| | | | 2,621,250 |
| Technology Hardware, Storage & Peripherals - 5.6% | | | |
| Apple, Inc. | | 8,402,356 | 1,398,488 |
|
| TOTAL INFORMATION TECHNOLOGY | | | 7,578,763 |
|
| MATERIALS - 1.1% | | | |
| Chemicals - 1.1% | | | |
| CF Industries Holdings, Inc. | | 1,939,008 | 84,638 |
| DowDuPont, Inc. | | 576,628 | 31,028 |
| FMC Corp. | | 120,225 | 9,594 |
| LG Chemical Ltd. | | 25,506 | 8,438 |
| Nutrien Ltd. | | 679,117 | 35,182 |
| Sherwin-Williams Co. | | 6,339 | 2,672 |
| The Chemours Co. LLC | | 1,899,704 | 67,914 |
| The Mosaic Co. | | 1,108,550 | 35,784 |
| Westlake Chemical Corp. | | 126,800 | 9,371 |
| | | | 284,621 |
| REAL ESTATE - 0.1% | | | |
| Equity Real Estate Investment Trusts (REITs) - 0.1% | | | |
| Ant International Co. Ltd. Class C (d)(e) | | 4,367,660 | 24,503 |
| Real Estate Management & Development - 0.0% | | | |
| Parsvnath Developers Ltd. (a) | | 15,293,447 | 1,379 |
|
| TOTAL REAL ESTATE | | | 25,882 |
|
| TOTAL COMMON STOCKS | | | |
| (Cost $13,770,772) | | | 23,799,696 |
|
| Preferred Stocks - 5.4% | | | |
| Convertible Preferred Stocks - 5.3% | | | |
| CONSUMER DISCRETIONARY - 0.4% | | | |
| Hotels, Restaurants & Leisure - 0.2% | | | |
| MOD Super Fast Pizza Holdings LLC Series 3 Preferred (a)(c)(d)(e) | | 74,995 | 11,108 |
| Neutron Holdings, Inc.: | | | |
| Series C (d)(e) | | 50,654,200 | 12,284 |
| Series D (d)(e) | | 85,315,542 | 20,689 |
| Topgolf International, Inc. Series F (a)(d)(e) | | 415,730 | 4,947 |
| | | | 49,028 |
| Internet & Direct Marketing Retail - 0.1% | | | |
| The Honest Co., Inc.: | | | |
| Series C (a)(d)(e) | | 350,333 | 13,540 |
| Series D (a)(d)(e) | | 77,448 | 3,544 |
| Series E (a)(d)(e) | | 551,397 | 10,807 |
| | | | 27,891 |
| Leisure Products - 0.1% | | | |
| Peloton Interactive, Inc. Series E (a)(d)(e) | | 1,341,716 | 19,375 |
| Textiles, Apparel & Luxury Goods - 0.0% | | | |
| Allbirds, Inc.: | | | |
| Series A (d)(e) | | 14,293 | 784 |
| Series B (d)(e) | | 2,512 | 138 |
| Series C (d)(e) | | 23,999 | 1,316 |
| | | | 2,238 |
| TOTAL CONSUMER DISCRETIONARY | | | 98,532 |
| CONSUMER STAPLES - 2.9% | | | |
| Food & Staples Retailing - 0.2% | | | |
| Roofoods Ltd. Series F (a)(d)(e) | | 41,941 | 10,864 |
| Sweetgreen, Inc. Series H (d)(e) | | 3,242,523 | 42,282 |
| | | | 53,146 |
| Food Products - 0.1% | | | |
| Agbiome LLC Series C (d)(e) | | 1,091,300 | 6,912 |
| Tobacco - 2.6% | | | |
| JUUL Labs, Inc.: | | | |
| Series C (a)(d)(e) | | 2,613,078 | 652,094 |
| Series D (d)(e) | | 13,822 | 3,449 |
| Series E (d)(e) | | 14,959 | 3,733 |
| | | | 659,276 |
| TOTAL CONSUMER STAPLES | | | 719,334 |
| FINANCIALS - 0.0% | | | |
| Consumer Finance - 0.0% | | | |
| Oportun Finance Corp. Series H (a)(d)(e) | | 3,552,125 | 7,921 |
| HEALTH CARE - 0.2% | | | |
| Biotechnology - 0.1% | | | |
| 23andMe, Inc. Series F (a)(d)(e) | | 800,982 | 13,897 |
| Axcella Health, Inc. Series C (a)(d)(e) | | 545,634 | 6,095 |
| Generation Bio Series B (d)(e) | | 460,500 | 3,224 |
| Immunocore Ltd. Series A (a)(d)(e) | | 11,275 | 1,109 |
| | | | 24,325 |
| Health Care Providers & Services - 0.1% | | | |
| Mulberry Health, Inc. Series A8 (a)(d)(e) | | 2,728,716 | 19,499 |
| Pharmaceuticals - 0.0% | | | |
| Castle Creek Pharmaceutical Holdings, Inc. Series B (d)(e) | | 3,301 | 1,070 |
| TOTAL HEALTH CARE | | | 44,894 |
| INDUSTRIALS - 0.1% | | | |
| Aerospace & Defense - 0.1% | | | |
| Space Exploration Technologies Corp.: | | | |
| Series G (a)(d)(e) | | 97,277 | 18,094 |
| Series H (a)(d)(e) | | 25,767 | 4,793 |
| | | | 22,887 |
| Professional Services - 0.0% | | | |
| YourPeople, Inc. Series C (a)(d)(e) | | 692,196 | 2,679 |
| TOTAL INDUSTRIALS | | | 25,566 |
| INFORMATION TECHNOLOGY - 1.7% | | | |
| Internet Software & Services - 0.1% | | | |
| ContextLogic, Inc. Series G (a)(d)(e) | | 133,922 | 19,321 |
| Reddit, Inc. Series B (a)(d)(e) | | 524,232 | 11,369 |
| Starry, Inc. Series C (a)(d)(e) | | 5,833,836 | 5,379 |
| | | | 36,069 |
| IT Services - 0.0% | | | |
| AppNexus, Inc. Series E (Escrow) (a)(d)(e) | | 646,522 | 624 |
| Jet.Com, Inc. Series B1 (Escrow) (a)(d)(e) | | 2,928,086 | 133 |
| | | | 757 |
| Software - 1.6% | | | |
| Bird Rides, Inc. Series C (d)(e) | | 2,114,013 | 24,830 |
| Cloudflare, Inc. Series D, 8.00% (a)(d)(e) | | 1,160,525 | 12,766 |
| Compass, Inc. Series E (a)(d)(e) | | 53,263 | 6,315 |
| Dataminr, Inc. Series D (a)(d)(e) | | 277,250 | 5,639 |
| Delphix Corp. Series D (a)(d)(e) | | 675,445 | 4,390 |
| Lyft, Inc.: | | | |
| Series H (a)(d)(e) | | 719,567 | 33,769 |
| Series I (d)(e) | | 547,120 | 25,676 |
| Malwarebytes Corp. Series B (a)(d)(e) | | 1,056,193 | 15,885 |
| Taboola.Com Ltd. Series E (a)(d)(e) | | 634,902 | 12,152 |
| Uber Technologies, Inc.: | | | |
| Series D, 8.00% (a)(d)(e) | | 5,107,956 | 249,115 |
| Series E, 8.00% (a)(d)(e) | | 101,698 | 4,960 |
| | | | 395,497 |
| TOTAL INFORMATION TECHNOLOGY | | | 432,323 |
|
| TOTAL CONVERTIBLE PREFERRED STOCKS | | | 1,328,570 |
|
| Nonconvertible Preferred Stocks - 0.1% | | | |
| CONSUMER DISCRETIONARY - 0.0% | | | |
| Textiles, Apparel & Luxury Goods - 0.0% | | | |
| Allbirds, Inc. (d)(e) | | 7,680 | 421 |
| HEALTH CARE - 0.1% | | | |
| Pharmaceuticals - 0.1% | | | |
| Castle Creek Pharmaceutical Holdings, Inc. Series A4 (d)(e) | | 29,758 | 9,646 |
|
| TOTAL NONCONVERTIBLE PREFERRED STOCKS | | | 10,067 |
|
| TOTAL PREFERRED STOCKS | | | |
| (Cost $462,346) | | | 1,338,637 |
|
| Money Market Funds - 3.1% | | | |
| Fidelity Cash Central Fund, 2.43% (g) | | 39,217 | 39 |
| Fidelity Securities Lending Cash Central Fund 2.43% (g)(h) | | 782,663,525 | 782,742 |
| TOTAL MONEY MARKET FUNDS | | | |
| (Cost $782,781) | | | 782,781 |
| TOTAL INVESTMENT IN SECURITIES - 103.3% | | | |
| (Cost $15,015,899) | | | 25,921,114 |
| NET OTHER ASSETS (LIABILITIES) - (3.3)% | | | (819,252) |
| NET ASSETS - 100% | | | $25,101,862 |
Legend
(a) Non-income producing
(b) Security or a portion of the security is on loan at period end.
(c) Investment is owned by a wholly-owned subsidiary (Subsidiary) that is treated as a corporation for U.S. tax purposes.
(d) Restricted securities - Investment in securities not registered under the Securities Act of 1933 (excluding 144A issues). At the end of the period, the value of restricted securities (excluding 144A issues) amounted to $1,475,914,000 or 5.9% of net assets.
(e) Level 3 security
(f) Security exempt from registration under Rule 144A of the Securities Act of 1933. These securities may be resold in transactions exempt from registration, normally to qualified institutional buyers. At the end of the period, the value of these securities amounted to $63,785,000 or 0.3% of net assets.
(g) Affiliated fund that is generally available only to investment companies and other accounts managed by Fidelity Investments. The rate quoted is the annualized seven-day yield of the fund at period end. A complete unaudited listing of the fund's holdings as of its most recent quarter end is available upon request. In addition, each Fidelity Central Fund's financial statements are available on the SEC's website or upon request.
(h) Investment made with cash collateral received from securities on loan.
Additional information on each restricted holding is as follows:
| Security | Acquisition Date | Acquisition Cost (000s) |
| 23andMe, Inc. Series F | 8/31/17 | $11,121 |
| Agbiome LLC Series C | 6/29/18 | $6,912 |
| Allbirds, Inc. | 10/9/18 | $1,986 |
| Allbirds, Inc. | 10/9/18 | $421 |
| Allbirds, Inc. Series A | 10/9/18 | $784 |
| Allbirds, Inc. Series B | 10/9/18 | $138 |
| Allbirds, Inc. Series C | 10/9/18 | $1,316 |
| Ant International Co. Ltd. Class C | 5/16/18 | $24,503 |
| AppNexus, Inc. Series E (Escrow) | 8/1/14 | $12,951 |
| Atom Tickets LLC | 8/15/17 | $7,000 |
| Axcella Health, Inc. Series C | 1/30/15 | $5,500 |
| Bird Rides, Inc. Series C | 12/21/18 | $24,830 |
| Blue Bottle Coffee, Inc. Class C (Escrow) | 10/30/17 | $1,455 |
| Castle Creek Pharmaceutical Holdings, Inc. Series A4 | 9/29/16 | $9,831 |
| Castle Creek Pharmaceutical Holdings, Inc. Series B | 10/9/18 | $1,360 |
| Cibus Global Ltd. Series C | 2/16/18 | $6,396 |
| Cloudflare, Inc. Series D, 8.00% | 11/5/14 - 9/10/18 | $9,459 |
| Compass, Inc. Series E | 11/3/17 | $3,594 |
| ContextLogic, Inc. Series G | 10/24/17 | $18,017 |
| Dataminr, Inc. Series D | 3/6/15 | $3,535 |
| Delphix Corp. Series D | 7/10/15 | $6,079 |
| Generation Bio Series B | 2/21/18 | $4,212 |
| Immunocore Ltd. Series A | 7/27/15 | $2,122 |
| Jet.Com, Inc. Series B1 (Escrow) | 9/19/16 | $-- |
| JUUL Labs, Inc. | 11/21/17 | $-- |
| JUUL Labs, Inc. Class A | 12/20/17 - 7/6/18 | $453 |
| JUUL Labs, Inc. Series C | 5/22/15 - 7/6/18 | $-- |
| JUUL Labs, Inc. Series D | 6/25/18 - 7/6/18 | $-- |
| JUUL Labs, Inc. Series E | 12/20/17 - 7/6/18 | $321 |
| Lyft, Inc. Series H | 11/22/17 | $28,600 |
| Lyft, Inc. Series I | 6/27/18 | $25,908 |
| Malwarebytes Corp. Series B | 12/21/15 | $10,958 |
| MOD Super Fast Pizza Holdings LLC Series 3 Preferred | 11/3/16 - 12/14/17 | $10,293 |
| Mulberry Health, Inc. Series A8 | 1/20/16 | $18,432 |
| Neutron Holdings, Inc. Series C | 7/3/18 | $9,262 |
| Neutron Holdings, Inc. Series D | 1/25/19 | $20,689 |
| Oportun Finance Corp. Series H | 2/6/15 | $10,114 |
| Peloton Interactive, Inc. Series E | 3/31/17 | $7,266 |
| Reddit, Inc. Series B | 7/26/17 | $7,442 |
| Roofoods Ltd. Series F | 9/12/17 | $14,829 |
| Space Exploration Technologies Corp. Class A | 10/16/15 - 9/11/17 | $23,515 |
| Space Exploration Technologies Corp. Class C | 9/11/17 | $376 |
| Space Exploration Technologies Corp. Series G | 1/20/15 | $7,535 |
| Space Exploration Technologies Corp. Series H | 8/4/17 | $3,479 |
| Starry, Inc. Series C | 12/8/17 | $5,379 |
| Sweetgreen, Inc. Series H | 11/9/18 | $42,282 |
| Taboola.Com Ltd. Series E | 12/22/14 | $6,619 |
| Tanium, Inc. Class B | 4/21/17 | $2,755 |
| The Honest Co., Inc. | 8/21/14 | $4,062 |
| The Honest Co., Inc. Series C | 8/21/14 | $9,479 |
| The Honest Co., Inc. Series D | 8/3/15 | $3,544 |
| The Honest Co., Inc. Series E | 9/28/17 | $10,810 |
| Topgolf International, Inc. Series F | 11/10/17 | $5,751 |
| Tory Burch LLC | 5/14/15 | $20,890 |
| Uber Technologies, Inc. Series D, 8.00% | 6/6/14 | $79,240 |
| Uber Technologies, Inc. Series E, 8.00% | 12/5/14 | $3,388 |
| WME Entertainment Parent, LLC Class A | 4/13/16 - 8/16/16 | $19,025 |
| YourPeople, Inc. Series C | 5/1/15 | $10,314 |
Affiliated Central Funds
Information regarding fiscal year to date income earned by the Fund from investments in Fidelity Central Funds is as follows:
| Fund | Income earned |
| | (Amounts in thousands) |
| Fidelity Cash Central Fund | $287 |
| Fidelity Securities Lending Cash Central Fund | 2,984 |
| Total | $3,271 |
Amounts in the income column in the above table include any capital gain distributions from underlying funds, which are presented in the corresponding line-item in the Statement of Operations, if applicable.
Investment Valuation
The following is a summary of the inputs used, as of January 31, 2019, involving the Fund's assets and liabilities carried at fair value. The inputs or methodology used for valuing securities may not be an indication of the risk associated with investing in those securities. For more information on valuation inputs, and their aggregation into the levels used below, please refer to the Investment Valuation section in the accompanying Notes to Financial Statements.
| | Valuation Inputs at Reporting Date: |
| Description | Total | Level 1 | Level 2 | Level 3 |
| (Amounts in thousands) | | | | |
| Investments in Securities: | | | | |
| Equities: | | | | |
| Communication Services | $4,185,556 | $4,021,696 | $136,103 | $27,757 |
| Consumer Discretionary | 6,152,778 | 6,007,347 | 26,661 | 118,770 |
| Consumer Staples | 1,396,471 | 666,540 | 2,737 | 727,194 |
| Energy | 248,131 | 248,131 | -- | -- |
| Financials | 635,485 | 627,564 | -- | 7,921 |
| Health Care | 3,193,570 | 3,129,762 | 5,948 | 57,860 |
| Industrials | 1,004,753 | 933,556 | -- | 71,197 |
| Information Technology | 8,011,086 | 7,570,374 | -- | 440,712 |
| Materials | 284,621 | 284,621 | -- | -- |
| Real Estate | 25,882 | 1,379 | -- | 24,503 |
| Money Market Funds | 782,781 | 782,781 | -- | -- |
| Total Investments in Securities: | $25,921,114 | $24,273,751 | $171,449 | $1,475,914 |
The following is a reconciliation of Investments in Securities for which Level 3 inputs were used in determining value:
| (Amounts in thousands) | |
| Investments in Securities: | |
| Equities - Consumer Staples | |
| Beginning Balance | $476,524 |
| Net Realized Gain (Loss) on Investment Securities | 378,437 |
| Net Unrealized Gain (Loss) on Investment Securities | 233,833 |
| Cost of Purchases | 42,282 |
| Proceeds of Sales | (403,882) |
| Amortization/Accretion | -- |
| Transfers into Level 3 | -- |
| Transfers out of Level 3 | -- |
| Ending Balance | $727,194 |
| The change in unrealized gain (loss) for the period attributable to Level 3 securities held at January 31, 2019 | $235,649 |
| Equities - Information Technology | |
| Beginning Balance | $388,432 |
| Net Realized Gain (Loss) on Investment Securities | (7,293) |
| Net Unrealized Gain (Loss) on Investment Securities | 43,625 |
| Cost of Purchases | 38,442 |
| Proceeds of Sales | (22,494) |
| Amortization/Accretion | -- |
| Transfers into Level 3 | -- |
| Transfers out of Level 3 | -- |
| Ending Balance | $440,712 |
| The change in unrealized gain (loss) for the period attributable to Level 3 securities held at January 31, 2019 | $36,286 |
| Other Investments in Securities | |
| Beginning Balance | $295,337 |
| Net Realized Gain (Loss) on Investment Securities | 54 |
| Net Unrealized Gain (Loss) on Investment Securities | (4,144) |
| Cost of Purchases | 36,591 |
| Proceeds of Sales | (19,830) |
| Amortization/Accretion | -- |
| Transfers into Level 3 | -- |
| Transfers out of Level 3 | -- |
| Ending Balance | $308,008 |
| The change in unrealized gain (loss) for the period attributable to Level 3 securities held at January 31, 2019 | $7,020 |
The information used in the above reconciliations represents fiscal year to date activity for any Investments in Securities identified as using Level 3 inputs at either the beginning or the end of the current fiscal period. Transfers in or out of Level 3 represent the beginning value of any Security or Instrument where a change in the pricing level occurred from the beginning to the end of the period. The cost of purchases and the proceeds of sales may include securities received or delivered through corporate actions or exchanges. Realized and unrealized gains (losses) disclosed in the reconciliations are included in Net Gain (Loss) on the Fund's Statement of Operations.
See accompanying notes which are an integral part of the financial statements.
Financial Statements
Statement of Assets and Liabilities
| Amounts in thousands (except per-share amounts) | | January 31, 2019 (Unaudited) |
| Assets | | |
Investment in securities, at value (including securities loaned of $768,238) — See accompanying schedule:
Unaffiliated issuers (cost $14,233,118) | $25,138,333 | |
| Fidelity Central Funds (cost $782,781) | 782,781 | |
| Total Investment in Securities (cost $15,015,899) | | $25,921,114 |
| Cash | | 1,789 |
| Restricted cash | | 606 |
| Foreign currency held at value (cost $375) | | 375 |
| Receivable for investments sold | | 148,274 |
| Receivable for fund shares sold | | 39,878 |
| Dividends receivable | | 3,437 |
| Distributions receivable from Fidelity Central Funds | | 371 |
| Prepaid expenses | | 31 |
| Other receivables | | 966 |
| Total assets | | 26,116,841 |
| Liabilities | | |
| Payable for investments purchased | $144,843 | |
| Payable for fund shares redeemed | 70,045 | |
| Accrued management fee | 13,832 | |
| Other affiliated payables | 2,607 | |
| Other payables and accrued expenses | 948 | |
| Collateral on securities loaned | 782,704 | |
| Total liabilities | | 1,014,979 |
| Net Assets | | $25,101,862 |
| Net Assets consist of: | | |
| Paid in capital | | $13,823,585 |
| Total distributable earnings (loss) | | 11,278,277 |
| Net Assets | | $25,101,862 |
| Net Asset Value and Maximum Offering Price | | |
| Blue Chip Growth: | | |
| Net Asset Value, offering price and redemption price per share ($19,992,954 ÷ 216,954 shares) | | $92.15 |
| Class K: | | |
| Net Asset Value, offering price and redemption price per share ($5,108,908 ÷ 55,367 shares) | | $92.27 |
See accompanying notes which are an integral part of the financial statements.
Statement of Operations
| Amounts in thousands | | Six months ended January 31, 2019 (Unaudited) |
| Investment Income | | |
| Dividends | | $87,032 |
| Income from Fidelity Central Funds | | 3,271 |
| Total income | | 90,303 |
| Expenses | | |
| Management fee | | |
| Basic fee | $68,877 | |
| Performance adjustment | 6,353 | |
| Transfer agent fees | 15,652 | |
| Accounting and security lending fees | 1,018 | |
| Custodian fees and expenses | 209 | |
| Independent trustees' fees and expenses | 83 | |
| Registration fees | 234 | |
| Audit | 68 | |
| Legal | 49 | |
| Interest | 75 | |
| Miscellaneous | 74 | |
| Total expenses before reductions | 92,692 | |
| Expense reductions | (238) | |
| Total expenses after reductions | | 92,454 |
| Net investment income (loss) | | (2,151) |
| Realized and Unrealized Gain (Loss) | | |
| Net realized gain (loss) on: | | |
| Investment securities: | | |
| Unaffiliated issuers | 814,362 | |
| Fidelity Central Funds | (4) | |
| Foreign currency transactions | (193) | |
| Total net realized gain (loss) | | 814,165 |
| Change in net unrealized appreciation (depreciation) on: | | |
| Investment securities: | | |
| Unaffiliated issuers | (1,546,274) | |
| Assets and liabilities in foreign currencies | (72) | |
| Total change in net unrealized appreciation (depreciation) | | (1,546,346) |
| Net gain (loss) | | (732,181) |
| Net increase (decrease) in net assets resulting from operations | | $(734,332) |
See accompanying notes which are an integral part of the financial statements.
Statement of Changes in Net Assets
| Amounts in thousands | Six months ended January 31, 2019 (Unaudited) | Year ended July 31, 2018 |
| Increase (Decrease) in Net Assets | | |
| Operations | | |
| Net investment income (loss) | $(2,151) | $34,241 |
| Net realized gain (loss) | 814,165 | 2,451,922 |
| Change in net unrealized appreciation (depreciation) | (1,546,346) | 2,830,656 |
| Net increase (decrease) in net assets resulting from operations | (734,332) | 5,316,819 |
| Distributions to shareholders | (1,427,021) | – |
| Distributions to shareholders from net investment income | – | (24,826) |
| Distributions to shareholders from net realized gain | – | (955,924) |
| Total distributions | (1,427,021) | (980,750) |
| Share transactions - net increase (decrease) | 879,600 | (610,765) |
| Total increase (decrease) in net assets | (1,281,753) | 3,725,304 |
| Net Assets | | |
| Beginning of period | 26,383,615 | 22,658,311 |
| End of period | $25,101,862 | $26,383,615 |
| Other Information | | |
| Undistributed net investment income end of period | | $19,407 |
See accompanying notes which are an integral part of the financial statements.
Financial Highlights
Fidelity Blue Chip Growth Fund
| | Six months ended (Unaudited) January 31, | Years endedJuly 31, | | | | |
| | 2019 | 2018 | 2017 | 2016 | 2015 | 2014 |
| Selected Per–Share Data | | | | | | |
| Net asset value, beginning of period | $99.75 | $83.20 | $69.52 | $75.25 | $66.72 | $59.65 |
| Income from Investment Operations | | | | | | |
| Net investment income (loss)A | (.02) | .11B | .11 | .09 | .05 | .15 |
| Net realized and unrealized gain (loss) | (2.27) | 20.20 | 16.30 | (2.16) | 12.56 | 11.63 |
| Total from investment operations | (2.29) | 20.31 | 16.41 | (2.07) | 12.61 | 11.78 |
| Distributions from net investment income | (.11) | (.08) | (.15) | (.03) | (.09) | (.24) |
| Distributions from net realized gain | (5.20) | (3.68) | (2.58) | (3.63) | (3.99) | (4.47) |
| Total distributions | (5.31) | (3.76) | (2.73) | (3.66) | (4.08) | (4.71) |
| Net asset value, end of period | $92.15 | $99.75 | $83.20 | $69.52 | $75.25 | $66.72 |
| Total ReturnC,D | (2.45)% | 25.21% | 24.48% | (2.59)% | 19.72% | 21.07% |
| Ratios to Average Net AssetsE,F | | | | | | |
| Expenses before reductions | .75%G | .72% | .70% | .82% | .89% | .80% |
| Expenses net of fee waivers, if any | .74%G | .72% | .70% | .82% | .89% | .80% |
| Expenses net of all reductions | .74%G | .72% | .69% | .82% | .88% | .80% |
| Net investment income (loss) | (.04)%G | .12%B | .15% | .13% | .07% | .23% |
| Supplemental Data | | | | | | |
| Net assets, end of period (in millions) | $19,993 | $20,714 | $16,993 | $14,230 | $15,346 | $11,970 |
| Portfolio turnover rateH | 44%G,I | 41%I | 43%I | 50%I | 51%I | 57%I |
A Calculated based on average shares outstanding during the period.
B Net investment income per share reflects a large, non-recurring dividend which amounted to $.09 per share. Excluding this non-recurring dividend, the ratio of net investment income (loss) to average net assets would have been .02%.
C Total returns for periods of less than one year are not annualized.
D Total returns would have been lower if certain expenses had not been reduced during the applicable periods shown.
E Fees and expenses of any underlying Fidelity Central Funds are not included in the Fund's expense ratio. The Fund indirectly bears its proportionate share of the expenses of any underlying Fidelity Central Funds.
F Expense ratios reflect operating expenses of the class. Expenses before reductions do not reflect amounts reimbursed by the investment adviser or reductions from brokerage service arrangements or reductions from other expense offset arrangements and do not represent the amount paid by the class during periods when reimbursements or reductions occur. Expenses net of fee waivers reflect expenses after reimbursement by the investment adviser but prior to reductions from brokerage service arrangements or other expense offset arrangements. Expenses net of all reductions represent the net expenses paid by the class.
G Annualized
H Amount does not include the portfolio activity of any underlying Fidelity Central Funds.
I Portfolio turnover rate excludes securities received or delivered in-kind.
See accompanying notes which are an integral part of the financial statements.
Fidelity Blue Chip Growth Fund Class K
| | Six months ended (Unaudited) January 31, | Years endedJuly 31, | | | | |
| | 2019 | 2018 | 2017 | 2016 | 2015 | 2014 |
| Selected Per–Share Data | | | | | | |
| Net asset value, beginning of period | $99.92 | $83.34 | $69.67 | $75.36 | $66.82 | $59.74 |
| Income from Investment Operations | | | | | | |
| Net investment income (loss)A | .03 | .20B | .19 | .16 | .13 | .23 |
| Net realized and unrealized gain (loss) | (2.29) | 20.22 | 16.32 | (2.15) | 12.57 | 11.64 |
| Total from investment operations | (2.26) | 20.42 | 16.51 | (1.99) | 12.70 | 11.87 |
| Distributions from net investment income | (.19) | (.16) | (.27) | (.07) | (.17) | (.33) |
| Distributions from net realized gain | (5.20) | (3.68) | (2.58) | (3.63) | (3.99) | (4.47) |
| Total distributions | (5.39) | (3.84) | (2.84)C | (3.70) | (4.16) | (4.79)D |
| Net asset value, end of period | $92.27 | $99.92 | $83.34 | $69.67 | $75.36 | $66.82 |
| Total ReturnE,F | (2.41)% | 25.33% | 24.63% | (2.47)% | 19.84% | 21.23% |
| Ratios to Average Net AssetsG,H | | | | | | |
| Expenses before reductions | .65%I | .62% | .59% | .70% | .78% | .68% |
| Expenses net of fee waivers, if any | .65%I | .62% | .59% | .70% | .77% | .68% |
| Expenses net of all reductions | .65%I | .62% | .58% | .70% | .77% | .67% |
| Net investment income (loss) | .06%I | .22%B | .26% | .25% | .19% | .36% |
| Supplemental Data | | | | | | |
| Net assets, end of period (in millions) | $5,109 | $5,669 | $5,665 | $5,158 | $5,898 | $4,612 |
| Portfolio turnover rateJ | 44%I,K | 41%K | 43%K | 50%K | 51%K | 57%K |
A Calculated based on average shares outstanding during the period.
B Net investment income per share reflects a large, non-recurring dividend which amounted to $.09 per share. Excluding this non-recurring dividend, the ratio of net investment income (loss) to average net assets would have been .12%.
C Total distributions of $2.84 per share is comprised of distributions from net investment income of $.267 and distributions from net realized gain of $2.576 per share.
D Total distributions of $4.79 per share is comprised of distributions from net investment income of $.325 and distributions from net realized gain of $4.466 per share.
E Total returns for periods of less than one year are not annualized.
F Total returns would have been lower if certain expenses had not been reduced during the applicable periods shown.
G Fees and expenses of any underlying Fidelity Central Funds are not included in the Fund's expense ratio. The Fund indirectly bears its proportionate share of the expenses of any underlying Fidelity Central Funds.
H Expense ratios reflect operating expenses of the class. Expenses before reductions do not reflect amounts reimbursed by the investment adviser or reductions from brokerage service arrangements or reductions from other expense offset arrangements and do not represent the amount paid by the class during periods when reimbursements or reductions occur. Expenses net of fee waivers reflect expenses after reimbursement by the investment adviser but prior to reductions from brokerage service arrangements or other expense offset arrangements. Expenses net of all reductions represent the net expenses paid by the class.
I Annualized
J Amount does not include the portfolio activity of any underlying Fidelity Central Funds.
K Portfolio turnover rate excludes securities received or delivered in-kind.
See accompanying notes which are an integral part of the financial statements.
Notes to Financial Statements (Unaudited)
For the period ended January 31, 2019
(Amounts in thousands except percentages)
1. Organization.
Fidelity Blue Chip Growth Fund (the Fund) is a fund of Fidelity Securities Fund (the Trust) and is authorized to issue an unlimited number of shares. The Trust is registered under the Investment Company Act of 1940, as amended (the 1940 Act), as an open-end management investment company organized as a Massachusetts business trust. The Fund offers Blue Chip Growth and Class K shares, each of which has equal rights as to assets and voting privileges. Each class has exclusive voting rights with respect to matters that affect that class.
2. Investments in Fidelity Central Funds.
The Fund invests in Fidelity Central Funds, which are open-end investment companies generally available only to other investment companies and accounts managed by the investment adviser and its affiliates. The Fund's Schedule of Investments lists each of the Fidelity Central Funds held as of period end, if any, as an investment of the Fund, but does not include the underlying holdings of each Fidelity Central Fund. As an Investing Fund, the Fund indirectly bears its proportionate share of the expenses of the underlying Fidelity Central Funds.
The Money Market Central Funds seek preservation of capital and current income and are managed by Fidelity Investments Money Management, Inc. (FIMM), an affiliate of the investment adviser. Annualized expenses of the Money Market Central Funds as of their most recent shareholder report date are less than .005%.
A complete unaudited list of holdings for each Fidelity Central Fund is available upon request or at the Securities and Exchange Commission (the SEC) website at www.sec.gov. In addition, the financial statements of the Fidelity Central Funds are available on the SEC website or upon request.
3. Significant Accounting Policies.
The Fund is an investment company and applies the accounting and reporting guidance of the Financial Accounting Standards Board (FASB) Accounting Standards Codification Topic 946 Financial Services – Investments Companies. The financial statements have been prepared in conformity with accounting principles generally accepted in the United States of America (GAAP), which require management to make certain estimates and assumptions at the date of the financial statements. Actual results could differ from those estimates. Subsequent events, if any, through the date that the financial statements were issued have been evaluated in the preparation of the financial statements. The following summarizes the significant accounting policies of the Fund:
Investment Valuation. Investments are valued as of 4:00 p.m. Eastern time on the last calendar day of the period. The Board of Trustees (the Board) has delegated the day to day responsibility for the valuation of the Fund's investments to the Fair Value Committee (the Committee) established by the Fund's investment adviser. In accordance with valuation policies and procedures approved by the Board, the Fund attempts to obtain prices from one or more third party pricing vendors or brokers to value its investments. When current market prices, quotations or currency exchange rates are not readily available or reliable, investments will be fair valued in good faith by the Committee, in accordance with procedures adopted by the Board. Factors used in determining fair value vary by investment type and may include market or investment specific events. The frequency with which these procedures are used cannot be predicted and they may be utilized to a significant extent. The Committee oversees the Fund's valuation policies and procedures and reports to the Board on the Committee's activities and fair value determinations. The Board monitors the appropriateness of the procedures used in valuing the Fund's investments and ratifies the fair value determinations of the Committee.
The Fund categorizes the inputs to valuation techniques used to value its investments into a disclosure hierarchy consisting of three levels as shown below:
- Level 1 – quoted prices in active markets for identical investments
- Level 2 – other significant observable inputs (including quoted prices for similar investments, interest rates, prepayment speeds, etc.)
- Level 3 – unobservable inputs (including the Fund's own assumptions based on the best information available)
Valuation techniques used to value the Fund's investments by major category are as follows:
Equity securities, including restricted securities, for which market quotations are readily available, are valued at the last reported sale price or official closing price as reported by a third party pricing vendor on the primary market or exchange on which they are traded and are categorized as Level 1 in the hierarchy. In the event there were no sales during the day or closing prices are not available, securities are valued at the last quoted bid price or may be valued using the last available price and are generally categorized as Level 2 in the hierarchy. For foreign equity securities, when market or security specific events arise, comparisons to the valuation of American Depositary Receipts (ADRs), futures contracts, Exchange-Traded Funds (ETFs) and certain indexes as well as quoted prices for similar securities may be used and would be categorized as Level 2 in the hierarchy. For equity securities, including restricted securities, where observable inputs are limited, assumptions about market activity and risk are used and these securities may be categorized as Level 3 in the hierarchy. Equity securities, including restricted securities, for which observable inputs are not available are valued using alternate valuation approaches, including the market approach and the income approach and are categorized as Level 3 in the hierarchy. The market approach generally consists of using comparable market transactions while the income approach generally consists of using the net present value of estimated future cash flows, adjusted as appropriate for liquidity, credit, market and/or other risk factors.
Investments in open-end mutual funds, including the Fidelity Central Funds, are valued at their closing net asset value (NAV) each business day and are categorized as Level 1 in the hierarchy.
The following provides information on Level 3 securities held by the Fund that were valued at period end based on unobservable inputs. These amounts exclude valuations provided by a broker.
| Asset Type | Fair Value | Valuation Technique(s) | Unobservable Input | Amount or Range/Weighted Average | Impact to Valuation from an Increase in Input (a) |
| Equities | $ 1,475,914 | Market approach | Transaction price | $0.24 - $277.28 / $173.24 | Increase |
| | | | Discount rate | 10.0% | Decrease |
| | | Recovery value | Recovery value | 0.0% - 1.5% / 1.2% | Increase |
| | | Market comparable | Transaction price | $9.15 - $411.85 / $220.01 | Increase |
| | | | Enterprise value/Sales multiple (EV/S) | 1.1 - 10.2 / 3.0 | Increase |
| | | | Discount rate | 7.5% - 78.0% / 32.3% | Decrease |
| | | | Price/Earnings multiple (P/E) | 11.0 | Increase |
| | | | Discount for lack of marketability | 10.0% - 25.0% / 11.8% | Decrease |
| | | | Conversion ratio | 3.0 | Increase |
| | | | Proxy discount | 21.3% - 26.0% / 22.1% | Decrease |
| | | | Premium rate | 6.0% - 9.0% / 8.3% | Increase |
| | | | Proxy premium | 10.8% | Increase |
| | | | Liquidity preference | $14.90 - $45.76 / $30.66 | Increase |
| | | Discount cash flow | Discount rate | 24.1% - 25.0% / 24.6% | Decrease |
| | | | Growth rate | 3.0% | Increase |
(a) Represents the directional change in the fair value of the Level 3 investments that could have resulted from an increase in the corresponding input as of period end. A decrease to the unobservable input would have had the opposite effect. Significant changes in these inputs may have resulted in a significantly higher or lower fair value measurement at period end.
Changes in valuation techniques may result in transfers in or out of an assigned level within the disclosure hierarchy. The aggregate value of investments by input level as of January 31, 2019, as well as a roll forward of Level 3 investments, is included at the end of the Fund's Schedule of Investments.
Foreign Currency. The Fund may use foreign currency contracts to facilitate transactions in foreign-denominated securities. Gains and losses from these transactions may arise from changes in the value of the foreign currency or if the counterparties do not perform under the contracts' terms.
Foreign-denominated assets, including investment securities, and liabilities are translated into U.S. dollars at the exchange rates at period end. Purchases and sales of investment securities, income and dividends received and expenses denominated in foreign currencies are translated into U.S. dollars at the exchange rate in effect on the transaction date.
The effects of exchange rate fluctuations on investments are included with the net realized and unrealized gain (loss) on investment securities. Other foreign currency transactions resulting in realized and unrealized gain (loss) are disclosed separately.
Investment Transactions and Income. For financial reporting purposes, the Fund's investment holdings and NAV include trades executed through the end of the last business day of the period. The NAV per share for processing shareholder transactions is calculated as of the close of business of the New York Stock Exchange (NYSE), normally 4:00 p.m. Eastern time and includes trades executed through the end of the prior business day. Gains and losses on securities sold are determined on the basis of identified cost and include proceeds received from litigation. Dividend income is recorded on the ex-dividend date, except for certain dividends from foreign securities where the ex-dividend date may have passed, which are recorded as soon as the Fund is informed of the ex-dividend date. Non-cash dividends included in dividend income, if any, are recorded at the fair market value of the securities received. Income and capital gain distributions from Fidelity Central Funds, if any, are recorded on the ex-dividend date. Certain distributions received by the Fund represent a return of capital or capital gain. The Fund determines the components of these distributions subsequent to the ex-dividend date, based upon receipt of tax filings or other correspondence relating to the underlying investment. These distributions are recorded as a reduction of cost of investments and/or as a realized gain. Investment income is recorded net of foreign taxes withheld where recovery of such taxes is uncertain.
Class Allocations and Expenses. Investment income, realized and unrealized capital gains and losses, common expenses of the Fund, and certain fund-level expense reductions, if any, are allocated daily on a pro-rata basis to each class based on the relative net assets of each class to the total net assets of the Fund. Each class differs with respect to transfer agent fees incurred. Certain expense reductions may also differ by class. For the reporting period, the allocated portion of income and expenses to each class as a percent of its average net assets may vary due to the timing of recording these transactions in relation to fluctuating net assets of the classes. Expenses directly attributable to a fund are charged to that fund. Expenses attributable to more than one fund are allocated among the respective funds on the basis of relative net assets or other appropriate methods. Expense estimates are accrued in the period to which they relate and adjustments are made when actual amounts are known.
Deferred Trustee Compensation. Under a Deferred Compensation Plan (the Plan) for the Fund, certain independent Trustees have elected to defer receipt of a portion of their annual compensation. Deferred amounts are invested in a cross-section of Fidelity funds, are marked-to-market and remain in the Fund until distributed in accordance with the Plan. The investment of deferred amounts and the offsetting payable to the Trustees of $772 are included in the accompanying Statement of Assets and Liabilities in other receivables and other payables and accrued expenses, respectively.
Income Tax Information and Distributions to Shareholders. Each year, the Fund intends to qualify as a regulated investment company under Subchapter M of the Internal Revenue Code, including distributing substantially all of its taxable income and realized gains. As a result, no provision for U.S. Federal income taxes is required. The Fund files a U.S. federal tax return, in addition to state and local tax returns as required. The Fund's federal income tax returns are subject to examination by the Internal Revenue Service (IRS) for a period of three fiscal years after they are filed. State and local tax returns may be subject to examination for an additional fiscal year depending on the jurisdiction. Foreign taxes are provided for based on the Fund's understanding of the tax rules and rates that exist in the foreign markets in which it invests.
Distributions are declared and recorded on the ex-dividend date. Income and capital gain distributions are declared separately for each class. Income and capital gain distributions are determined in accordance with income tax regulations, which may differ from GAAP.
Capital accounts within the financial statements are adjusted for permanent book-tax differences. These adjustments have no impact on net assets or the results of operations. Capital accounts are not adjusted for temporary book-tax differences which will reverse in a subsequent period.
Book-tax differences are primarily due to foreign currency transactions, passive foreign investment companies (PFIC), redemptions in kind, partnerships, deferred trustees compensation and losses deferred due to wash sales.
As of period end, the cost and unrealized appreciation (depreciation) in securities, and derivatives if applicable, for federal income tax purposes were as follows:
| Gross unrealized appreciation | $11,461,702 |
| Gross unrealized depreciation | (596,186) |
| Net unrealized appreciation (depreciation) | $10,865,516 |
| Tax cost | $15,055,598 |
Restricted Securities. The Fund may invest in securities that are subject to legal or contractual restrictions on resale. These securities generally may be resold in transactions exempt from registration or to the public if the securities are registered. Disposal of these securities may involve time-consuming negotiations and expense, and prompt sale at an acceptable price may be difficult. Information regarding restricted securities is included at the end of the Fund's Schedule of Investments.
Consolidated Subsidiary. The Fund invests in certain investments through a wholly-owned subsidiary ("Subsidiary"), which may be subject to federal and state taxes upon disposition.
As of period end, the Fund held an investment of $62,707 in these Subsidiaries, representing .25% of the Fund's net assets. The financial statements have been consolidated and include accounts of the Fund and each Subsidiary. Accordingly, all inter-company transactions and balances have been eliminated.
Any cash held by the Subsidiaries is restricted as to its use and is presented as Restricted cash in the Statement of Assets and Liabilities.
New Rule Issuance. During August 2018, the U.S. Securities and Exchange Commission issued Final Rule Release No. 33-10532, Disclosure Update and Simplification. This Final Rule includes amendments specific to registered investment companies that are intended to eliminate overlap in disclosure requirements between Regulation S-X and GAAP. In accordance with these amendments, certain line-items in the Fund's financial statements have been combined or removed for the current period as outlined in the table below.
| Financial Statement | Current Line-Item Presentation (As Applicable) | Prior Line-Item Presentation (As Applicable) |
| Statement of Assets and Liabilities | Total distributable earnings (loss) | Undistributed/Distributions in excess of/Accumulated net investment income (loss)
Accumulated/Undistributed net realized gain (loss)
Net unrealized appreciation (depreciation) |
| Statement of Changes in Net Assets | N/A - removed | Undistributed/Distributions in excess of/Accumulated net investment income (loss) end of period |
| Statement of Changes in Net Assets | Distributions to shareholders | Distributions to shareholders from net investment income
Distributions to shareholders from net realized gain |
| Distributions to Shareholders Note to Financial Statements | Distributions to shareholders | Distributions to shareholders from net investment income
Distributions to shareholders from net realized gain |
4. Purchases and Sales of Investments.
Purchases and sales of securities, other than short-term securities and in-kind transactions, aggregated $5,800,780 and $5,664,862, respectively.
Unaffiliated Redemptions In-Kind. During the period, 2,554 shares of the Fund were redeemed in-kind for investments and cash with a value of $219,238. The net realized gain of $130,867 on investments delivered through in-kind redemptions is included in the accompanying Statement of Operations. The amount of the in-kind redemptions is included in share transactions in the accompanying Statement of Changes in Net Assets as well as the Notes to Financial Statements. The Fund recognized no gain or loss for federal income tax purposes.
Prior Fiscal Year Redemptions In-Kind. During the prior period, 15,023 shares of the Fund held by unaffiliated entities were redeemed in-kind for investments and cash with a value of $1,335,342. The Fund had a net realized gain of $811,963 on investments delivered through in-kind redemptions. The amount of the in-kind redemptions is included in share transactions in the accompanying Statement of Changes in Net Assets as well as the Notes to Financial Statements. The Fund recognized no gain or loss for federal income tax purposes.
5. Fees and Other Transactions with Affiliates.
Management Fee. Fidelity Management & Research Company (the investment adviser) and its affiliates provide the Fund with investment management related services for which the Fund pays a monthly management fee. The management fee is the sum of an individual fund fee rate that is based on an annual rate of .30% of the Fund's average net assets and an annualized group fee rate that averaged .24% during the period. The group fee rate is based upon the average net assets of all the mutual funds advised by the investment adviser, including any mutual funds previously advised by the investment adviser that are currently advised by Fidelity SelectCo, LLC, an affiliate of the investment adviser. The group fee rate decreases as assets under management increase and increases as assets under management decrease. In addition, the management fee is subject to a performance adjustment (up to a maximum of +/- .20% of the Fund's average net assets over a 36 month performance period). The upward or downward adjustment to the management fee is based on the relative investment performance of Blue Chip Growth as compared to its benchmark index, the Russell 1000 Growth Index, over the same 36 month performance period. For the reporting period, the total annualized management fee rate, including the performance adjustment, was .59% of the Fund's average net assets. The performance adjustment included in the management fee rate may be higher or lower than the maximum performance adjustment rate due to the difference between the average net assets for the reporting and performance periods.
Transfer Agent Fees. Fidelity Investments Institutional Operations Company, Inc., (FIIOC), an affiliate of the investment adviser, is the transfer, dividend disbursing and shareholder servicing agent for each class of the Fund. FIIOC receives account fees and asset-based fees that vary according to the account size and type of account of the shareholders of Blue Chip Growth, except for Class K. FIIOC receives an asset-based fee of Class K's average net assets. FIIOC pays for typesetting, printing and mailing of shareholder reports, except proxy statements.
For the period, transfer agent fees for each class were as follows:
| | Amount | % of Class-Level Average Net Assets(a) |
| Blue Chip Growth | $14,400 | .14 |
| Class K | 1,252 | .05 |
| | $15,652 | |
(a) Annualized
Accounting and Security Lending Fees. Fidelity Service Company, Inc. (FSC), an affiliate of the investment adviser, maintains the Fund's accounting records. The accounting fee is based on the level of average net assets for each month. Under a separate contract, FSC administers the security lending program. The security lending fee is based on the number and duration of lending transactions. For the period, the fees were equivalent to an annualized rate of .01%.
Brokerage Commissions.The Fund placed a portion of its portfolio transactions with brokerage firms which are affiliates of the investment adviser. Brokerage commissions are included in net realized gain (loss) and change in net unrealized appreciation (depreciation) in the Statement of Operations. The commissions paid to these affiliated firms were $136 for the period.
Interfund Lending Program. Pursuant to an Exemptive Order issued by the SEC, the Fund, along with other registered investment companies having management contracts with Fidelity Management & Research Company (FMR) or other affiliated entities of FMR, may participate in an interfund lending program. This program provides an alternative credit facility allowing the funds to borrow from, or lend money to, other participating affiliated funds. At period end, there were no interfund loans outstanding. The Fund's activity in this program during the period for which loans were outstanding was as follows:
| Borrower or Lender | Average Loan Balance | Weighted Average Interest Rate | Interest Expense |
| Borrower | $29,045 | 2.45% | $75 |
Interfund Trades. The Fund may purchase from or sell securities to other Fidelity Funds under procedures adopted by the Board. The procedures have been designed to ensure these interfund trades are executed in accordance with Rule 17a-7 of the 1940 Act. Interfund trades are included within the respective purchases and sales amounts shown in the Purchases and Sales of Investments note.
6. Committed Line of Credit.
The Fund participates with other funds managed by the investment adviser or an affiliate in a $4.25 billion credit facility (the "line of credit") to be utilized for temporary or emergency purposes to fund shareholder redemptions or for other short-term liquidity purposes. The Fund has agreed to pay commitment fees on its pro-rata portion of the line of credit, which amounted to $34 and is reflected in Miscellaneous expenses on the Statement of Operations. During the period, the Fund did not borrow on this line of credit.
7. Security Lending.
The Fund lends portfolio securities through a lending agent from time to time in order to earn additional income. For equity securities, a lending agent is used and may loan securities to certain qualified borrowers, including Fidelity Capital Markets (FCM), a broker-dealer affiliated with the Fund. On the settlement date of the loan, the Fund receives collateral (in the form of U.S. Treasury obligations, letters of credit and/or cash) against the loaned securities and maintains collateral in an amount not less than 100% of the market value of the loaned securities during the period of the loan. The market value of the loaned securities is determined at the close of business of the Fund and any additional required collateral is delivered to the Fund on the next business day. The Fund or borrower may terminate the loan at any time, and if the borrower defaults on its obligation to return the securities loaned because of insolvency or other reasons, the Fund may apply collateral received from the borrower against the obligation. The Fund may experience delays and costs in recovering the securities loaned. Any cash collateral received is invested in the Fidelity Securities Lending Cash Central Fund. The value of loaned securities and cash collateral at period end are disclosed on the Fund's Statement of Assets and Liabilities. The value of securities loaned to FCM at period end was $7,810. Security lending income represents the income earned on investing cash collateral, less rebates paid to borrowers and any lending agent fees associated with the loan, plus any premium payments received for lending certain types of securities. Security lending income is presented in the Statement of Operations as a component of income from Fidelity Central Funds. Total security lending income during the period amounted to $2,984, including $89 from securities loaned to FCM.
8. Expense Reductions.
Commissions paid to certain brokers with whom the investment adviser, or its affiliates, places trades on behalf of the Fund include an amount in addition to trade execution, which may be rebated back to the Fund to offset certain expenses. This amount totaled $121 for the period. In addition through arrangements with the Fund's custodian, credits realized as a result of certain uninvested cash balances were used to reduce the Fund's expenses. During the period, these credits reduced the Fund's custody by $24.
In addition, during the period the investment adviser reimbursed and/or waived a portion of fund-level operating expenses in the amount of $93.
9. Distributions to Shareholders.
Distributions to shareholders of each class were as follows:
| | Six months ended
January 31, 2019 | Year ended
July 31, 2018 |
| Distributions to shareholders | | |
| Blue Chip Growth | $1,117,762 | $– |
| Class K | 309,259 | – |
| Total | $1,427,021 | $– |
| From net investment income | | |
| Blue Chip Growth | $– | $14,640 |
| Class K | – | 10,186 |
| Total | $– | $24,826 |
| From net realized gain | | |
| Blue Chip Growth | $– | $722,426 |
| Class K | – | 233,498 |
| Total | $– | $955,924 |
10. Share Transactions.
Share transactions for each class were as follows and may contain automatic conversions between classes or exchanges between affiliated funds:
| | Shares | Shares | Dollars | Dollars |
| | Six months ended January 31, 2019 | Year ended July 31, 2018 | Six months ended January 31, 2019 | Year ended July 31, 2018 |
| Blue Chip Growth | | | | |
| Shares sold | 21,452 | 40,439 | $2,001,231 | $3,709,387 |
| Reinvestment of distributions | 11,015 | 8,154 | 1,055,428 | 698,554 |
| Shares redeemed | (23,166) | (45,177) | (2,108,117) | (4,036,931) |
| Net increase (decrease) | 9,301 | 3,416 | $948,542 | $371,010 |
| Class K | | | | |
| Shares sold | 6,959 | 14,932 | $661,178 | $1,373,508 |
| Reinvestment of distributions | 3,225 | 2,843 | 309,259 | 243,684 |
| Shares redeemed | (11,555)(a) | (29,012)(b) | (1,039,379)(a) | (2,598,967)(b) |
| Net increase (decrease) | (1,371) | (11,237) | $(68,942) | $(981,775) |
(a) Amount includes in-kind redemptions (see the Unaffiliated Redemptions In-Kind note for additional details).
(b) Amount includes in-kind redemptions (see the Prior Fiscal Year Redemptions In-Kind note for additional details).
11. Other.
The Fund's organizational documents provide former and current trustees and officers with a limited indemnification against liabilities arising in connection with the performance of their duties to the Fund. In the normal course of business, the Fund may also enter into contracts that provide general indemnifications. The Fund's maximum exposure under these arrangements is unknown as this would be dependent on future claims that may be made against the Fund. The risk of material loss from such claims is considered remote.
Shareholder Expense Example
As a shareholder of the Fund, you incur two types of costs: (1) transaction costs and (2) ongoing costs, including management fees and other Fund expenses. This Example is intended to help you understand your ongoing costs (in dollars) of investing in the Fund and to compare these costs with the ongoing costs of investing in other mutual funds.
The Example is based on an investment of $1,000 invested at the beginning of the period and held for the entire period (August 1, 2018 to January 31, 2019).
Actual Expenses
The first line of the accompanying table for each class of the Fund provides information about actual account values and actual expenses. You may use the information in this line, together with the amount you invested, to estimate the expenses that you paid over the period. Simply divide your account value by $1,000.00 (for example, an $8,600 account value divided by $1,000.00 = 8.6), then multiply the result by the number in the first line for a class of the Fund under the heading entitled "Expenses Paid During Period" to estimate the expenses you paid on your account during this period. In addition, the Fund, as a shareholder in the underlying Fidelity Central Funds, will indirectly bear its pro-rata share of the fees and expenses incurred by the underlying Fidelity Central Funds. These fees and expenses are not included in the Fund's annualized expense ratio used to calculate the expense estimate in the table below.
Hypothetical Example for Comparison Purposes
The second line of the accompanying table for each class of the Fund provides information about hypothetical account values and hypothetical expenses based on a Class' actual expense ratio and an assumed rate of return of 5% per year before expenses, which is not the Class' actual return. The hypothetical account values and expenses may not be used to estimate the actual ending account balance or expenses you paid for the period. You may use this information to compare the ongoing costs of investing in the Fund and other funds. To do so, compare this 5% hypothetical example with the 5% hypothetical examples that appear in the shareholder reports of the other funds. In addition, the Fund, as a shareholder in the underlying Fidelity Central Funds, will indirectly bear its pro-rata share of the fees and expenses incurred by the underlying Fidelity Central Funds. These fees and expenses are not included in the Fund's annualized expense ratio used to calculate the expense estimate in the table below.
Please note that the expenses shown in the table are meant to highlight your ongoing costs only and do not reflect any transaction costs. Therefore, the second line of the table is useful in comparing ongoing costs only, and will not help you determine the relative total costs of owning different funds.
| | Annualized Expense Ratio-A | Beginning
Account Value
August 1, 2018 | Ending
Account Value
January 31, 2019 | Expenses Paid
During Period-B
August 1, 2018
to January 31, 2019 |
| Blue Chip Growth | .74% | | | |
| Actual | | $1,000.00 | $975.50 | $3.68 |
| Hypothetical-C | | $1,000.00 | $1,021.48 | $3.77 |
| Class K | .65% | | | |
| Actual | | $1,000.00 | $975.90 | $3.24 |
| Hypothetical-C | | $1,000.00 | $1,021.93 | $3.31 |
A Annualized expense ratio reflects expenses net of applicable fee waivers.
B Expenses are equal to each Class' annualized expense ratio, multiplied by the average account value over the period, multiplied by 184/365 (to reflect the one-half year period).
C 5% return per year before expenses
Board Approval of Investment Advisory Contracts and Management Fees
Fidelity Blue Chip Growth Fund
Each year, the Board of Trustees, including the Independent Trustees (together, the Board), votes on the renewal of the management contract with Fidelity Management & Research Company (FMR) and the sub-advisory agreements (together, the Advisory Contracts) for the fund. FMR and the sub-advisers are referred to herein as the Investment Advisers. The Board, assisted by the advice of fund counsel and Independent Trustees' counsel, requests and considers a broad range of information relevant to the renewal of the Advisory Contracts throughout the year.
The Board meets regularly and, at each of its meetings, covers an extensive agenda of topics and materials and considers factors that are relevant to its annual consideration of the renewal of the fund's Advisory Contracts, including the services and support provided to the fund and its shareholders. The Board has established various standing committees (Committees), each composed of and chaired by Independent Trustees with varying backgrounds, to which the Board has assigned specific subject matter responsibilities in order to enhance effective decision-making by the Board. The Board, acting directly and through its Committees, requests and receives information concerning the annual consideration of the renewal of the fund's Advisory Contracts. The Board also meets as needed to review matters specifically related to the Board's annual consideration of the renewal of the Advisory Contracts. Members of the Board may also meet with trustees of other Fidelity funds through joint ad hoc committees to discuss certain matters relevant to all of the Fidelity funds.
At its January 2019 meeting, the Board unanimously determined to renew the fund's Advisory Contracts. In reaching its determination, the Board considered all factors it believed relevant, including (i) the nature, extent, and quality of the services to be provided to the fund and its shareholders (including the investment performance of the fund); (ii) the competitiveness of the fund's management fee and total expense ratio relative to peer funds; (iii) the total costs of the services to be provided by and the profits to be realized by Fidelity from its relationships with the fund; and (iv) the extent to which, if any, economies of scale exist and would be realized as the fund grows, and whether any economies of scale are appropriately shared with fund shareholders.
In considering whether to renew the Advisory Contracts for the fund, the Board reached a determination, with the assistance of fund counsel and Independent Trustees' counsel and through the exercise of its business judgment, that the renewal of the Advisory Contracts was in the best interests of the fund and its shareholders and that the compensation payable under the Advisory Contracts was fair and reasonable. The Board's decision to renew the Advisory Contracts was not based on any single factor, but rather was based on a comprehensive consideration of all the information provided to the Board at its meetings throughout the year. The Board, in reaching its determination to renew the Advisory Contracts, was aware that shareholders of the fund have a broad range of investment choices available to them, including a wide choice among funds offered by Fidelity's competitors, and that the fund's shareholders, who have the opportunity to review and weigh the disclosure provided by the fund in its prospectus and other public disclosures, have chosen to invest in this fund, which is part of the Fidelity family of funds.
Nature, Extent, and Quality of Services Provided. The Board considered Fidelity's staffing as it relates to the fund, including the backgrounds of investment personnel of Fidelity, and also considered the fund's investment objective, strategies, and related investment philosophy. The Independent Trustees also had discussions with senior management of Fidelity's investment operations and investment groups. The Board considered the structure of the investment personnel compensation program and whether this structure provides appropriate incentives to act in the best interests of the fund. Additionally, the Board considered the portfolio managers' investments, if any, in the funds that they manage.
Resources Dedicated to Investment Management and Support Services. The Board and the Fund Oversight and Research Committees reviewed the general qualifications and capabilities of Fidelity's investment staff, including its size, education, experience, and resources, as well as Fidelity's approach to recruiting, training, managing, and compensating investment personnel. The Board noted that Fidelity has continued to increase the resources devoted to non-U.S. offices, including expansion of Fidelity's global investment organization. The Board also noted that Fidelity's analysts have extensive resources, tools and capabilities that allow them to conduct sophisticated quantitative and fundamental analysis, as well as credit analysis of issuers, counterparties and guarantors. Further, the Board considered that Fidelity's investment professionals have sufficient access to global information and data so as to provide competitive investment results over time, and that those professionals also have access to sophisticated tools that permit them to assess portfolio construction and risk and performance attribution characteristics continuously, as well as to transmit new information and research conclusions rapidly around the world. Additionally, in its deliberations, the Board considered Fidelity's trading, risk management, compliance, and technology and operations capabilities and resources, which are integral parts of the investment management process.
Shareholder and Administrative Services. The Board considered (i) the nature, extent, quality, and cost of advisory, administrative, and shareholder services performed by the Investment Advisers and their affiliates under the Advisory Contracts and under separate agreements covering transfer agency, pricing and bookkeeping, and securities lending services for the fund; (ii) the nature and extent of the supervision of third party service providers, principally custodians, subcustodians, and pricing vendors; and (iii) the resources devoted to, and the record of compliance with, the fund's compliance policies and procedures. The Board also reviewed the allocation of fund brokerage, including allocations to brokers affiliated with the Investment Advisers, the use of brokerage commissions to pay fund expenses, and the use of "soft" commission dollars to pay for research services.
The Board noted that the growth of fund assets over time across the complex allows Fidelity to reinvest in the development of services designed to enhance the value and convenience of the Fidelity funds as investment vehicles. These services include 24-hour access to account information and market information through telephone representatives and over the Internet, investor education materials and asset allocation tools, and the expanded availability of Fidelity Investor Centers.
The Board noted that it and the boards of certain other Fidelity funds had formed an ad hoc Committee on Transfer Agency Fees to review the variety of transfer agency fee structures throughout the industry and Fidelity's competitive positioning with respect to industry participants.
Investment in a Large Fund Family. The Board considered the benefits to shareholders of investing in a Fidelity fund, including the benefits of investing in a fund that is part of a large family of funds offering a variety of investment disciplines and providing a large variety of mutual fund investor services. The Board noted that Fidelity had taken, or had made recommendations that resulted in the Fidelity funds taking, a number of actions over the previous year that benefited particular funds, including: (i) continuing to dedicate additional resources to Fidelity's investment research process, which includes meetings with management of issuers of securities in which the funds invest, and to the support of the senior management team that oversees asset management; (ii) continuing efforts to enhance Fidelity's global research capabilities; (iii) launching new funds and making other enhancements to meet client needs; (iv) launching new share classes of existing funds; (v) eliminating purchase minimums and broadening eligibility requirements for certain funds and share classes; (vi) reducing management fees and total expenses for certain growth equity funds and index funds; (vii) lowering expense caps for certain existing funds and classes, and converting certain voluntary expense caps to contractual caps, to reduce expenses borne by shareholders; (viii) eliminating short-term redemption fees for funds that had such fees; (ix) rationalizing product lines and gaining increased efficiencies from fund mergers and share class consolidations; (x) continuing to develop, acquire and implement systems and technology to improve services to the funds and shareholders, strengthen information security, and increase efficiency; and (xi) continuing to implement enhancements to further strengthen Fidelity's product line to increase investors' probability of success in achieving their investment goals, including retirement income goals.
Investment Performance. The Board considered whether the fund has operated in accordance with its investment objective, as well as its record of compliance with its investment restrictions and its performance history.
The Board took into account discussions that occur at Board meetings throughout the year with representatives of the Investment Advisers about fund investment performance. In this regard the Board noted that as part of regularly scheduled fund reviews and other reports to the Board on fund performance, the Board considers annualized return information for the fund for different time periods, measured against an appropriate securities market index ("benchmark index") and a peer group of funds with similar objectives ("peer group"), if any. In its evaluation of fund investment performance, the Board gave particular attention to information indicating changes in performance of certain Fidelity funds for specific time periods and discussed with the Investment Advisers the reasons for any overperformance or underperformance.
In addition to reviewing absolute and relative fund performance, the Independent Trustees periodically consider the appropriateness of fund performance metrics in evaluating the results achieved. In general, the Independent Trustees believe that fund performance should be evaluated based on net performance (after fees and expenses) of both the highest performing and lowest performing fund share classes, where applicable, compared to appropriate benchmark indices, over appropriate time periods that may include full market cycles, and compared to peer groups, as applicable, over the same periods, taking into account relevant factors including the following: general market conditions; issuer-specific information; and fund cash flows and other factors.
The Independent Trustees recognize that shareholders evaluate performance on a net basis over their own holding periods, for which one-, three-, and five-year periods are often used as a proxy. For this reason, the performance information reviewed by the Board also included net cumulative total return information for the fund and an appropriate benchmark index and peer group for the most recent one-, three-, and five-year periods ended June 30, 2018, as shown below. Returns are shown compared to the 25th percentile (top of box, 75% beaten) and 75th percentile (bottom of box, 25% beaten) of the peer universe.
Fidelity Blue Chip Growth Fund
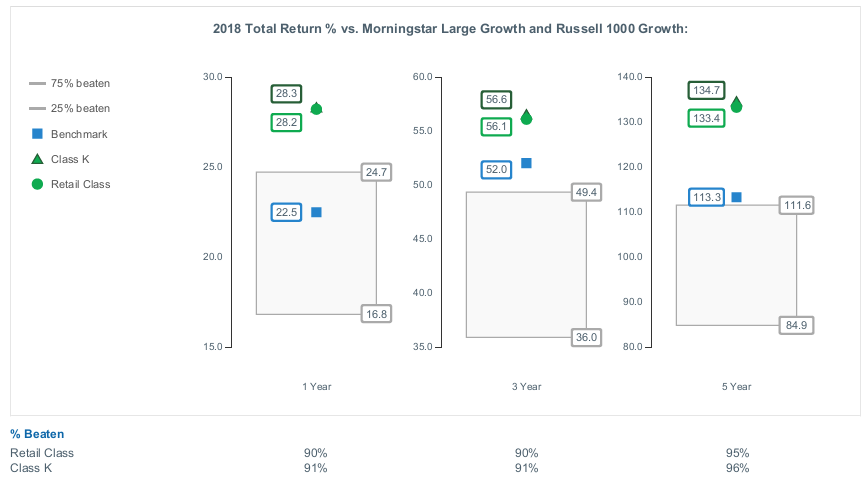
The Board also considered that the fund's management fee is subject to upward or downward adjustment depending upon whether, and to what extent, the fund's investment performance for the performance period (a rolling 36-month period) exceeds, or is exceeded by, a securities index, thus leading to a performance adjustment for the same period. The Board noted that the performance adjustment provides FMR with a strong economic incentive to seek to achieve superior long-term performance for the fund's shareholders and helps to more closely align the interests of FMR and the shareholders of the fund.
Based on its review, the Board concluded that the nature, extent, and quality of services provided to the fund under the Advisory Contracts should continue to benefit the shareholders of the fund.
Competitiveness of Management Fee and Total Expense Ratio. The Board considered the fund's management fee and total expense ratio compared to "mapped groups" of competitive funds and classes created for the purpose of facilitating the Trustees' competitive analysis of management fees and total expenses. Fidelity creates "mapped groups" by combining similar Lipper investment objective categories that have comparable investment mandates. Combining Lipper investment objective categories aids the Board's management fee and total expense ratio comparisons by broadening the competitive group used for comparison.
Management Fee. The Board considered two proprietary management fee comparisons for the 12-month periods (ended June 30 for 2018 and December 31 for prior periods) shown in basis points (BP) in the chart below. The group of Lipper funds used by the Board for management fee comparisons is referred to below as the "Total Mapped Group." The Total Mapped Group comparison focuses on a fund's standing in terms of gross management fees before expense reimbursements or caps, and without giving effect to the fund's performance adjustment, relative to the total universe of funds with comparable investment mandates, regardless of whether their management fee structures also are comparable. Funds with comparable investment mandates offer exposure to similar types of securities. Funds with comparable management fee structures have similar management fee contractual arrangements (
e.g., flat rate charged for advisory services, all-inclusive fee rate,
etc.). "TMG %" represents the percentage of funds in the Total Mapped Group that had management fees that were lower than the fund's. For example, a hypothetical TMG % of 20% would mean that 80% of the funds in the Total Mapped Group had higher, and 20% had lower, management fees than the fund. The fund's actual TMG %s and the number of funds in the Total Mapped Group are in the chart below. The "Asset-Size Peer Group" (ASPG) comparison focuses on a fund's standing relative to a subset of non-Fidelity funds within the Total Mapped Group that are similar in size and management fee structure without taking into account performance adjustments, if any. For example, if a fund is in the first quartile of the ASPG, the fund's management fee ranks in the least expensive or lowest 25% of funds in the ASPG. The ASPG represents at least 15% of the funds in the Total Mapped Group with comparable asset size and management fee structures, subject to a minimum of 50 funds (or all funds in the Total Mapped Group if fewer than 50). Additional information, such as the ASPG quartile in which the fund's management fee rate ranked and the impact of the fund's performance adjustment, is also included in the chart and was considered by the Board.
Fidelity Blue Chip Growth Fund

The Board noted that the fund's management fee rate ranked below the median of its Total Mapped Group and below the median of its ASPG for the 12-month period ended June 30, 2018. The Board also noted the effect of the fund's performance adjustment, if any, on the fund's management fee ranking.
The Board noted that it and the boards of other Fidelity funds formed an ad hoc Committee on Group Fee, which meets periodically, to conduct an in-depth review of the "group fee" component of the management fee of funds with such management fee structures. The Committee's focus included the mechanics of the group fee, the competitive landscape of group fee structures, Fidelity funds with no group fee component and investment products not included in group fee assets. The Board also considered that, for funds subject to the group fee, FMR agreed to voluntarily waive fees over a specified period of time in amounts designed to account for assets converted from certain funds to certain collective investment trusts.
The Board also noted that, in 2013, the ad hoc Committee on Management Fees was formed to conduct an in-depth review of the management fee rates of Fidelity's active equity mutual funds. The Committee focused on the following areas: (i) standard fee structures; (ii) research consumption and trading evolution; (iii) management fee competitiveness/profitability by category; and (iv) factors that drive institutional pricing.
Based on its review, the Board concluded that the fund's management fee is fair and reasonable in light of the services that the fund receives and the other factors considered.
Total Expense Ratio. In its review of each class's total expense ratio, the Board considered the fund's management fee rate as well as other fund or class expenses, as applicable, such as transfer agent fees, pricing and bookkeeping fees, and custodial, legal, and audit fees. The Board noted the impact of the fund's performance adjustment. The Board also noted that Fidelity may agree to waive fees and expenses from time to time, and the extent to which, if any, it has done so for the fund. As part of its review, the Board also considered the current and historical total expense ratios of each class of the fund compared to competitive fund median expenses. Each class of the fund is compared to those funds and classes in the Total Mapped Group (used by the Board for management fee comparisons) that have a similar sales load structure.
The Board noted that the total expense ratio of each class ranked below the competitive median for the 12-month period ended June 30, 2018.
Fees Charged to Other Fidelity Clients. The Board also considered Fidelity fee structures and other information with respect to clients of Fidelity, such as other funds advised or subadvised by Fidelity, pension plan clients, and other institutional clients with similar mandates. The Board noted that a joint ad hoc committee created by it and the boards of other Fidelity funds periodically reviews and compares Fidelity's institutional investment advisory business with its business of providing services to the Fidelity funds and also noted the most recent findings of the committee. The Board noted that the committee's review included a consideration of the differences in services provided, fees charged, and costs incurred, as well as competition in the markets serving the different categories of clients.
Based on its review of total expense ratios and fees charged to other Fidelity clients, the Board concluded that the total expense ratio of each class of the fund was reasonable in light of the services that the fund and its shareholders receive and the other factors considered.
Costs of the Services and Profitability. The Board considered the revenues earned and the expenses incurred by Fidelity in conducting the business of developing, marketing, distributing, managing, administering and servicing the fund and servicing the fund's shareholders. The Board also considered the level of Fidelity's profits in respect of all the Fidelity funds.
On an annual basis, Fidelity presents to the Board information about the profitability of its relationships with the fund. Fidelity calculates profitability information for each fund, as well as aggregate profitability information for groups of Fidelity funds and all Fidelity funds, using a series of detailed revenue and cost allocation methodologies which originate with the books and records of Fidelity on which Fidelity's audited financial statements are based. The Audit Committee of the Board reviews any significant changes from the prior year's methodologies.
PricewaterhouseCoopers LLP (PwC), auditor to Fidelity and certain Fidelity funds, has been engaged annually by the Board as part of the Board's assessment of Fidelity's profitability analysis. PwC's engagement includes the review and assessment of the methodologies used by Fidelity in determining the revenues and expenses attributable to Fidelity's mutual fund business, and completion of agreed-upon procedures in respect of the mathematical accuracy of the fund profitability information and its conformity to established allocation methodologies. After considering PwC's reports issued under the engagement and information provided by Fidelity, the Board concluded that while other allocation methods may also be reasonable, Fidelity's profitability methodologies are reasonable in all material respects.
The Board also reviewed Fidelity's non-fund businesses and potential indirect benefits such businesses may have received as a result of their association with Fidelity's mutual fund business (i.e., fall-out benefits) as well as cases where Fidelity's affiliates may benefit from the fund's business. The Board noted that changes to fall-out benefits year-over-year reflect business developments at Fidelity's various businesses.
The Board considered the costs of the services provided by and the profits realized by Fidelity in connection with the operation of the fund and was satisfied that the profitability was not excessive.
Economies of Scale. The Board considered whether there have been economies of scale in respect of the management of the Fidelity funds, whether the Fidelity funds (including the fund) have appropriately benefited from any such economies of scale, and whether there is potential for realization of any further economies of scale. The Board considered the extent to which the fund will benefit from economies of scale as assets grow through increased services to the fund, through waivers or reimbursements, or through fee or expense ratio reductions. The Board also noted that a committee (the Economies of Scale Committee) created by it and the boards of other Fidelity funds periodically analyzes whether Fidelity attains economies of scale in respect of the management and servicing of the Fidelity funds, whether the Fidelity funds have appropriately benefited from such economies of scale, and whether there is potential for realization of any further economies of scale.
The Board recognized that the fund's management contract incorporates a "group fee" structure, which provides for lower group fee rates as total group assets increase, and for higher group fee rates as total group assets decrease (with "group assets" defined to include fund assets under FMR's management plus the assets of sector funds previously under FMR's management). FMR calculates the group fee rates based on a tiered asset "breakpoint" schedule that varies based on asset class. The Board considered that the group fee is designed to deliver the benefits of economies of scale to fund shareholders when total Fidelity fund assets increase, even if assets of any particular fund are unchanged or have declined, because some portion of Fidelity's costs are attributable to services provided to all Fidelity funds, and all funds benefit if those costs can be allocated among more assets. The Board concluded that, given the group fee structure, fund shareholders will benefit from lower management fees as group assets increase at the fund complex level, regardless of whether Fidelity achieves any such economies of scale.
The Board concluded, taking into account the analysis of the Economies of Scale Committee, that economies of scale, if any, are being appropriately shared between fund shareholders and Fidelity.
Additional Information Requested by the Board. In order to develop fully the factual basis for consideration of the Fidelity funds' advisory contracts, the Board requested and received additional information on certain topics, including: (i) fund performance trends, in particular the underperformance of certain funds, and Fidelity's long-term strategies for certain funds; (ii) Fidelity's fund profitability methodology, profitability trends for certain funds, and the impact of certain factors on fund profitability results; (iii) metrics for evaluating index fund and ETF performance and information about ETF trading characteristics; (iv) the methodology with respect to the evaluation of competitive fund data and peer group classifications and fee comparisons; (v) the expense structures for different funds and classes; (vi) information regarding other accounts managed by Fidelity, including collective investment trusts; and (vii) Fidelity's philosophies and strategies for evaluating funds and classes with lower or declining asset levels.
Based on its evaluation of all of the conclusions noted above, and after considering all factors it believed relevant, the Board concluded that the advisory fee arrangements are fair and reasonable, and that the fund's Advisory Contracts should be renewed.

BCF-SANN-0319
1.700126.122
Fidelity® Blue Chip Growth K6 Fund
Semi-Annual Report January 31, 2019 |
|
Beginning on January 1, 2021, as permitted by regulations adopted by the Securities and Exchange Commission, paper copies of a fund’s shareholder reports will no longer be sent by mail, unless you specifically request paper copies of the reports from the fund or from your financial intermediary, such as a financial advisor, broker-dealer or bank. Instead, the reports will be made available on a website, and you will be notified by mail each time a report is posted and provided with a website link to access the report.
If you already elected to receive shareholder reports electronically, you will not be affected by this change and you need not take any action. You may elect to receive shareholder reports and other communications from a fund electronically, by contacting your financial intermediary. For Fidelity customers, visit Fidelity's web site or call Fidelity using the contact information listed below.
You may elect to receive all future reports in paper free of charge. If you wish to continue receiving paper copies of your shareholder reports, you may contact your financial intermediary or, if you are a Fidelity customer, visit Fidelity’s website, or call Fidelity at the applicable toll-free number listed below. Your election to receive reports in paper will apply to all funds held with the fund complex/your financial intermediary.
| Account Type | Website | Phone Number |
| Brokerage, Mutual Fund, or Annuity Contracts: | fidelity.com/mailpreferences | 1-800-343-3548 |
| Employer Provided Retirement Accounts: | netbenefits.fidelity.com/preferences (choose 'no' under Required Disclosures to continue to print) | 1-800-343-0860 |
| Advisor Sold Accounts Serviced Through Your Financial Intermediary: | Contact Your Financial Intermediary | Your Financial Intermediary's phone number |
| Advisor Sold Accounts Serviced by Fidelity: | institutional.fidelity.com | 1-877-208-0098 |
Contents
To view a fund's proxy voting guidelines and proxy voting record for the 12-month period ended June 30, visit http://www.fidelity.com/proxyvotingresults or visit the Securities and Exchange Commission's (SEC) web site at http://www.sec.gov.
You may also call 1-800-835-5092 to request a free copy of the proxy voting guidelines.
Standard & Poor's, S&P and S&P 500 are registered service marks of The McGraw-Hill Companies, Inc. and have been licensed for use by Fidelity Distributors Corporation.
Other third-party marks appearing herein are the property of their respective owners.
All other marks appearing herein are registered or unregistered trademarks or service marks of FMR LLC or an affiliated company. © 2019 FMR LLC. All rights reserved.
This report and the financial statements contained herein are submitted for the general information of the shareholders of the Fund. This report is not authorized for distribution to prospective investors in the Fund unless preceded or accompanied by an effective prospectus.
A fund files its complete schedule of portfolio holdings with the SEC for the first and third quarters of each fiscal year on Form N-Q. Forms N-Q are available on the SEC’s web site at http://www.sec.gov. A fund's Forms N-Q may be reviewed and copied at the SEC’s Public Reference Room in Washington, DC. Information regarding the operation of the SEC's Public Reference Room may be obtained by calling 1-800-SEC-0330.
For a complete list of a fund's portfolio holdings, view the most recent holdings listing, semiannual report, or annual report on Fidelity's web site at http://www.fidelity.com, http://www.institutional.fidelity.com, or http://www.401k.com, as applicable.
NOT FDIC INSURED •MAY LOSE VALUE •NO BANK GUARANTEE
Neither the Fund nor Fidelity Distributors Corporation is a bank.
Investment Summary (Unaudited)
Top Ten Stocks as of January 31, 2019
| | % of fund's net assets |
| Amazon.com, Inc. | 7.9 |
| Alphabet, Inc. Class A | 7.3 |
| Apple, Inc. | 5.6 |
| Microsoft Corp. | 4.7 |
| Facebook, Inc. Class A | 4.1 |
| Salesforce.com, Inc. | 3.2 |
| Broadcom, Inc. | 2.7 |
| Visa, Inc. Class A | 2.3 |
| Tesla, Inc. | 2.3 |
| NVIDIA Corp. | 1.9 |
| | 42.0 |
Top Five Market Sectors as of January 31, 2019
| | % of fund's net assets |
| Information Technology | 32.3 |
| Consumer Discretionary | 24.8 |
| Communication Services | 17.4 |
| Health Care | 12.8 |
| Industrials | 4.3 |
Asset Allocation (% of fund's net assets)
| As of January 31, 2019* |
| | Stocks | 98.5% |
| | Convertible Securities | 1.5% |

* Foreign investments - 7.6%
Schedule of Investments January 31, 2019 (Unaudited)
Showing Percentage of Net Assets
| Common Stocks - 98.5% | | | |
| | | Shares | Value |
| COMMUNICATION SERVICES - 17.4% | | | |
| Entertainment - 4.4% | | | |
| Activision Blizzard, Inc. | | 394,994 | $18,659,517 |
| Electronic Arts, Inc. (a) | | 22,221 | 2,049,665 |
| Lions Gate Entertainment Corp. Class A | | 10,303 | 189,266 |
| NetEase, Inc. ADR | | 4,024 | 1,013,766 |
| Netflix, Inc. (a) | | 94,437 | 32,061,362 |
| Nintendo Co. Ltd. | | 3,600 | 1,091,837 |
| Nintendo Co. Ltd. ADR | | 14,382 | 535,586 |
| Take-Two Interactive Software, Inc. (a) | | 24,728 | 2,610,040 |
| The Walt Disney Co. | | 163,720 | 18,258,054 |
| | | | 76,469,093 |
| Interactive Media & Services - 12.9% | | | |
| Alphabet, Inc.: | | | |
| Class A (a) | | 112,647 | 126,828,131 |
| Class C (a) | | 10,993 | 12,272,255 |
| ANGI Homeservices, Inc. Class A (a) | | 97,257 | 1,653,369 |
| CarGurus, Inc. Class A (a) | | 38,376 | 1,641,342 |
| Facebook, Inc. Class A (a) | | 424,918 | 70,829,581 |
| Momo, Inc. ADR (a) | | 27,447 | 835,212 |
| Tencent Holdings Ltd. | | 200,100 | 8,907,375 |
| Twitter, Inc. (a) | | 42,484 | 1,425,763 |
| | | | 224,393,028 |
| Media - 0.0% | | | |
| Charter Communications, Inc. Class A (a) | | 500 | 165,525 |
| Wireless Telecommunication Services - 0.1% | | | |
| T-Mobile U.S., Inc. (a) | | 28,904 | 2,012,296 |
|
| TOTAL COMMUNICATION SERVICES | | | 303,039,942 |
|
| CONSUMER DISCRETIONARY - 24.6% | | | |
| Auto Components - 0.0% | | | |
| Aptiv PLC | | 2,400 | 189,912 |
| Automobiles - 2.3% | | | |
| Tesla, Inc. (a)(b) | | 130,366 | 40,024,969 |
| Hotels, Restaurants & Leisure - 2.2% | | | |
| Boyd Gaming Corp. | | 55,000 | 1,502,600 |
| Caesars Entertainment Corp. (a)(b) | | 117,500 | 1,073,950 |
| Chipotle Mexican Grill, Inc. (a) | | 600 | 317,766 |
| Eldorado Resorts, Inc. (a) | | 66,222 | 3,087,270 |
| Gaming VC Holdings SA | | 42,701 | 376,365 |
| Haidilao International Holding Ltd. (c) | | 180,000 | 423,091 |
| Hilton Grand Vacations, Inc. (a) | | 17,360 | 526,702 |
| Hilton Worldwide Holdings, Inc. | | 16,806 | 1,251,711 |
| Hyatt Hotels Corp. Class A | | 4,730 | 330,674 |
| Kambi Group PLC (a) | | 34,100 | 772,572 |
| Marriott International, Inc. Class A | | 46,768 | 5,356,339 |
| McDonald's Corp. | | 26,732 | 4,779,147 |
| MGM Mirage, Inc. | | 44,821 | 1,319,530 |
| Penn National Gaming, Inc. (a) | | 46,100 | 1,117,464 |
| Planet Fitness, Inc. (a) | | 70,047 | 4,057,122 |
| PlayAGS, Inc. (a) | | 29,289 | 733,982 |
| Restaurant Brands International, Inc. | | 29,828 | 1,869,656 |
| Royal Caribbean Cruises Ltd. | | 32,642 | 3,918,672 |
| Sea Ltd. ADR (a) | | 39,500 | 553,395 |
| Shake Shack, Inc. Class A (a) | | 34,374 | 1,641,702 |
| Starbucks Corp. | | 8,701 | 592,886 |
| Wynn Resorts Ltd. | | 16,928 | 2,082,313 |
| | | | 37,684,909 |
| Household Durables - 0.3% | | | |
| D.R. Horton, Inc. | | 39,955 | 1,536,270 |
| iRobot Corp. (a) | | 4,478 | 402,080 |
| Lennar Corp. Class A | | 34,943 | 1,656,997 |
| Mohawk Industries, Inc. (a) | | 2,700 | 347,733 |
| Roku, Inc. Class A (a) | | 31,897 | 1,433,770 |
| | | | 5,376,850 |
| Internet & Direct Marketing Retail - 10.3% | | | |
| Alibaba Group Holding Ltd. sponsored ADR (a) | | 90,136 | 15,187,015 |
| Amazon.com, Inc. (a) | | 79,477 | 136,599,494 |
| eBay, Inc. | | 35,500 | 1,194,575 |
| Etsy, Inc. (a) | | 28,088 | 1,535,009 |
| GrubHub, Inc. (a) | | 13,266 | 1,066,586 |
| JD.com, Inc. sponsored ADR (a) | | 141,481 | 3,515,803 |
| The Booking Holdings, Inc. (a) | | 8,135 | 14,909,909 |
| Wayfair LLC Class A (a) | | 35,879 | 3,927,315 |
| | | | 177,935,706 |
| Multiline Retail - 1.2% | | | |
| Avenue Supermarts Ltd. (a)(c) | | 3,665 | 71,009 |
| Dollar General Corp. | | 10,081 | 1,163,650 |
| Dollar Tree, Inc. (a) | | 182,342 | 17,656,176 |
| Ollie's Bargain Outlet Holdings, Inc. (a) | | 8,628 | 674,451 |
| Target Corp. | | 23,931 | 1,746,963 |
| | | | 21,312,249 |
| Specialty Retail - 5.3% | | | |
| American Eagle Outfitters, Inc. | | 103,944 | 2,195,297 |
| At Home Group, Inc. (a) | | 158,862 | 3,501,318 |
| Best Buy Co., Inc. | | 42,136 | 2,496,137 |
| Burlington Stores, Inc. (a) | | 26,760 | 4,594,960 |
| Carvana Co. Class A (a) | | 27,945 | 1,038,157 |
| Five Below, Inc. (a) | | 28,012 | 3,465,925 |
| Floor & Decor Holdings, Inc. Class A (a) | | 54,074 | 1,854,197 |
| Home Depot, Inc. | | 169,908 | 31,183,215 |
| Lowe's Companies, Inc. | | 186,611 | 17,944,514 |
| RH (a) | | 47,257 | 6,420,809 |
| Ross Stores, Inc. | | 39,218 | 3,612,762 |
| The Children's Place Retail Stores, Inc. | | 5,400 | 522,504 |
| Tiffany & Co., Inc. | | 25,383 | 2,252,234 |
| TJX Companies, Inc. | | 130,985 | 6,513,884 |
| Ulta Beauty, Inc. (a) | | 15,390 | 4,492,649 |
| | | | 92,088,562 |
| Textiles, Apparel & Luxury Goods - 3.0% | | | |
| adidas AG | | 37,766 | 8,978,240 |
| Allbirds, Inc. (d)(e) | | 2,352 | 128,974 |
| Canada Goose Holdings, Inc. (a) | | 7,536 | 387,654 |
| lululemon athletica, Inc. (a) | | 86,743 | 12,821,483 |
| Moncler SpA | | 48,600 | 1,830,147 |
| NIKE, Inc. Class B | | 166,485 | 13,631,792 |
| Pinduoduo, Inc. ADR (b) | | 141,380 | 4,129,710 |
| PVH Corp. | | 61,272 | 6,685,388 |
| Skechers U.S.A., Inc. Class A (sub. vtg.) (a) | | 53,107 | 1,442,917 |
| Under Armour, Inc. Class C (non-vtg.) (a) | | 144,126 | 2,729,746 |
| | | | 52,766,051 |
|
| TOTAL CONSUMER DISCRETIONARY | | | 427,379,208 |
|
| CONSUMER STAPLES - 3.1% | | | |
| Beverages - 0.4% | | | |
| Fever-Tree Drinks PLC | | 93,862 | 3,165,143 |
| Keurig Dr. Pepper, Inc. | | 142,277 | 3,872,780 |
| Monster Beverage Corp. (a) | | 8,503 | 486,712 |
| Pernod Ricard SA | | 926 | 153,685 |
| | | | 7,678,320 |
| Food & Staples Retailing - 1.1% | | | |
| BJ's Wholesale Club Holdings, Inc. | | 187,427 | 4,931,204 |
| Costco Wholesale Corp. | | 58,344 | 12,522,373 |
| Kroger Co. | | 30,848 | 873,924 |
| | | | 18,327,501 |
| Food Products - 0.1% | | | |
| Darling International, Inc. (a) | | 35,935 | 764,337 |
| Lamb Weston Holdings, Inc. | | 3,200 | 231,360 |
| Nestle SA (Reg. S) | | 2,130 | 185,702 |
| The a2 Milk Co. Ltd. (a) | | 46,900 | 410,079 |
| | | | 1,591,478 |
| Household Products - 0.0% | | | |
| Procter & Gamble Co. | | 5,400 | 520,938 |
| Personal Products - 0.4% | | | |
| Coty, Inc. Class A | | 325,339 | 2,524,631 |
| Estee Lauder Companies, Inc. Class A | | 29,395 | 4,010,066 |
| | | | 6,534,697 |
| Tobacco - 1.1% | | | |
| Altria Group, Inc. | | 268,641 | 13,257,433 |
| JUUL Labs, Inc. Class A (d)(e) | | 23,134 | 5,773,090 |
| | | | 19,030,523 |
|
| TOTAL CONSUMER STAPLES | | | 53,683,457 |
|
| ENERGY - 1.0% | | | |
| Oil, Gas & Consumable Fuels - 1.0% | | | |
| Anadarko Petroleum Corp. | | 39,194 | 1,855,052 |
| Berry Petroleum Corp. | | 65,000 | 766,350 |
| Continental Resources, Inc. (a) | | 58,791 | 2,714,380 |
| Diamondback Energy, Inc. | | 7,135 | 735,761 |
| Hess Corp. | | 8,100 | 437,400 |
| Pioneer Natural Resources Co. | | 11,328 | 1,612,201 |
| Reliance Industries Ltd. | | 327,142 | 5,657,445 |
| Whiting Petroleum Corp. (a) | | 141,546 | 4,052,462 |
| | | | 17,831,051 |
| FINANCIALS - 2.6% | | | |
| Banks - 1.0% | | | |
| Bank of America Corp. | | 414,362 | 11,796,886 |
| Coastal Financial Corp. of Washington (a) | | 2,710 | 40,298 |
| ICICI Bank Ltd. sponsored ADR | | 34,778 | 355,083 |
| IndusInd Bank Ltd. | | 8,949 | 189,870 |
| JPMorgan Chase & Co. | | 43,522 | 4,504,527 |
| Kotak Mahindra Bank Ltd. | | 18,502 | 327,422 |
| | | | 17,214,086 |
| Capital Markets - 0.6% | | | |
| Charles Schwab Corp. | | 107,607 | 5,032,779 |
| Edelweiss Financial Services Ltd. | | 58,486 | 126,970 |
| HDFC Asset Management Co. Ltd. (a)(c) | | 110 | 2,112 |
| Morgan Stanley | | 7,900 | 334,170 |
| TD Ameritrade Holding Corp. | | 85,670 | 4,793,237 |
| | | | 10,289,268 |
| Diversified Financial Services - 0.8% | | | |
| Berkshire Hathaway, Inc. Class B (a) | | 61,184 | 12,575,759 |
| GDS Holdings Ltd. ADR (a)(b) | | 28,366 | 805,594 |
| | | | 13,381,353 |
| Insurance - 0.1% | | | |
| eHealth, Inc. (a) | | 22,900 | 1,400,564 |
| Thrifts & Mortgage Finance - 0.1% | | | |
| Housing Development Finance Corp. Ltd. | | 20,960 | 567,819 |
| LendingTree, Inc. (a)(b) | | 5,330 | 1,579,492 |
| | | | 2,147,311 |
|
| TOTAL FINANCIALS | | | 44,432,582 |
|
| HEALTH CARE - 12.8% | | | |
| Biotechnology - 5.3% | | | |
| ACADIA Pharmaceuticals, Inc. (a) | | 15,823 | 360,448 |
| Acceleron Pharma, Inc. (a) | | 12,877 | 545,985 |
| Agios Pharmaceuticals, Inc. (a) | | 18,305 | 981,148 |
| Aimmune Therapeutics, Inc. (a) | | 35,129 | 826,234 |
| Alexion Pharmaceuticals, Inc. (a) | | 143,116 | 17,597,543 |
| Allakos, Inc. (a) | | 10,554 | 421,632 |
| Allogene Therapeutics, Inc. | | 7,718 | 234,087 |
| Alnylam Pharmaceuticals, Inc. (a) | | 58,652 | 4,899,202 |
| Amgen, Inc. | | 16,507 | 3,088,625 |
| AnaptysBio, Inc. (a) | | 11,556 | 766,394 |
| Arena Pharmaceuticals, Inc. (a) | | 23,713 | 1,090,087 |
| Argenx SE ADR (a) | | 3,200 | 339,552 |
| Array BioPharma, Inc. (a) | | 32,924 | 614,691 |
| Ascendis Pharma A/S sponsored ADR (a) | | 24,344 | 1,739,622 |
| BeiGene Ltd. | | 39,500 | 391,329 |
| BeiGene Ltd. ADR (a) | | 9,024 | 1,168,428 |
| bluebird bio, Inc. (a) | | 21,806 | 2,909,575 |
| Blueprint Medicines Corp. (a) | | 1,577 | 113,686 |
| Cellectis SA sponsored ADR (a) | | 8,282 | 146,343 |
| Cibus Global Ltd. Series C (d)(e)(f) | | 133,810 | 145,853 |
| Coherus BioSciences, Inc. (a) | | 37,674 | 507,092 |
| Crinetics Pharmaceuticals, Inc. (a) | | 8,123 | 213,472 |
| CytomX Therapeutics, Inc. (a) | | 9,200 | 156,216 |
| Deciphera Pharmaceuticals, Inc. (a) | | 4,273 | 114,816 |
| Denali Therapeutics, Inc. (a) | | 49,447 | 942,460 |
| Editas Medicine, Inc. (a) | | 30,119 | 654,486 |
| Epizyme, Inc. (a) | | 19,717 | 201,508 |
| Esperion Therapeutics, Inc. (a)(b) | | 15,539 | 721,787 |
| Exact Sciences Corp. (a) | | 12,200 | 1,098,976 |
| FibroGen, Inc. (a) | | 21,658 | 1,229,092 |
| Global Blood Therapeutics, Inc. (a) | | 42,920 | 2,056,297 |
| Heron Therapeutics, Inc. (a) | | 12,225 | 328,853 |
| Immunomedics, Inc. (a) | | 24,700 | 365,313 |
| Intellia Therapeutics, Inc. (a)(b) | | 35,953 | 508,375 |
| Intercept Pharmaceuticals, Inc. (a) | | 16,298 | 1,966,843 |
| Ionis Pharmaceuticals, Inc. (a) | | 7,064 | 409,712 |
| Ironwood Pharmaceuticals, Inc. Class A (a) | | 64,432 | 880,141 |
| Liquidia Technologies, Inc. | | 91,934 | 1,322,930 |
| Mirati Therapeutics, Inc. (a) | | 6,300 | 416,304 |
| Moderna, Inc. (b) | | 15,418 | 255,939 |
| Momenta Pharmaceuticals, Inc. (a) | | 5,432 | 64,424 |
| Natera, Inc. (a) | | 56,364 | 765,987 |
| Neurocrine Biosciences, Inc. (a) | | 36,224 | 3,195,681 |
| Portola Pharmaceuticals, Inc. (a)(b) | | 22,645 | 613,680 |
| Principia Biopharma, Inc. | | 6,895 | 208,987 |
| Regeneron Pharmaceuticals, Inc. (a) | | 36,547 | 15,688,531 |
| Rubius Therapeutics, Inc. | | 8,440 | 115,544 |
| Sage Therapeutics, Inc. (a) | | 26,623 | 3,796,174 |
| Sarepta Therapeutics, Inc. (a) | | 29,379 | 4,104,540 |
| Scholar Rock Holding Corp. | | 10,753 | 162,478 |
| Synthorx, Inc. | | 16,137 | 227,370 |
| Ultragenyx Pharmaceutical, Inc. (a) | | 8,990 | 443,387 |
| Vertex Pharmaceuticals, Inc. (a) | | 39,091 | 7,462,863 |
| Viking Therapeutics, Inc. (a)(b) | | 16,798 | 137,072 |
| Xencor, Inc. (a) | | 26,021 | 939,358 |
| Zai Lab Ltd. ADR (a) | | 19,582 | 528,518 |
| | | | 91,185,670 |
| Health Care Equipment & Supplies - 3.5% | | | |
| Abiomed, Inc. (a) | | 1,300 | 456,391 |
| Align Technology, Inc. (a) | | 9,535 | 2,373,738 |
| Atricure, Inc. (a) | | 12,142 | 375,795 |
| Axonics Modulation Technologies, Inc. (a) | | 20,786 | 303,476 |
| Becton, Dickinson & Co. | | 14,778 | 3,686,520 |
| Boston Scientific Corp. (a) | | 579,045 | 22,090,567 |
| Danaher Corp. | | 29,844 | 3,310,296 |
| DexCom, Inc. (a) | | 9,956 | 1,404,095 |
| Edwards Lifesciences Corp. (a) | | 2,326 | 396,397 |
| Establishment Labs Holdings, Inc. (a) | | 27,755 | 735,785 |
| Insulet Corp. (a) | | 13,963 | 1,133,656 |
| Intuitive Surgical, Inc. (a) | | 34,651 | 18,144,650 |
| iRhythm Technologies, Inc. (a) | | 28,931 | 2,459,135 |
| Masimo Corp. (a) | | 1,441 | 179,246 |
| Novocure Ltd. (a) | | 8,772 | 429,828 |
| Penumbra, Inc. (a) | | 2,214 | 322,159 |
| Quanterix Corp. (a) | | 9,609 | 202,366 |
| Stryker Corp. | | 7,124 | 1,265,009 |
| Tandem Diabetes Care, Inc. (a) | | 22,869 | 994,344 |
| ViewRay, Inc. (a) | | 36,834 | 264,836 |
| Wright Medical Group NV (a) | | 20,683 | 617,181 |
| | | | 61,145,470 |
| Health Care Providers & Services - 3.0% | | | |
| Anthem, Inc. | | 6,307 | 1,911,021 |
| Centene Corp. (a) | | 6,377 | 832,645 |
| Guardant Health, Inc. (b) | | 20,741 | 836,692 |
| HCA Holdings, Inc. | | 42,075 | 5,866,517 |
| Humana, Inc. | | 43,328 | 13,387,919 |
| National Vision Holdings, Inc. (a) | | 8,978 | 285,141 |
| Notre Dame Intermedica Participacoes SA | | 67,300 | 619,635 |
| OptiNose, Inc. (a) | | 39,618 | 255,140 |
| UnitedHealth Group, Inc. | | 94,472 | 25,526,334 |
| Wellcare Health Plans, Inc. (a) | | 7,838 | 2,167,050 |
| | | | 51,688,094 |
| Health Care Technology - 0.1% | | | |
| Evolent Health, Inc. (a) | | 19,782 | 349,746 |
| Teladoc Health, Inc. (a)(b) | | 17,170 | 1,102,314 |
| | | | 1,452,060 |
| Life Sciences Tools & Services - 0.0% | | | |
| Thermo Fisher Scientific, Inc. | | 1,400 | 343,938 |
| Pharmaceuticals - 0.9% | | | |
| Akcea Therapeutics, Inc. (a)(b) | | 50,074 | 1,330,967 |
| Allergan PLC | | 4,600 | 662,308 |
| Assembly Biosciences, Inc. (a) | | 6,992 | 159,278 |
| AstraZeneca PLC sponsored ADR | | 76,877 | 2,812,161 |
| Bristol-Myers Squibb Co. | | 87,100 | 4,300,127 |
| Dova Pharmaceuticals, Inc. (a)(b) | | 13,129 | 100,831 |
| Jazz Pharmaceuticals PLC (a) | | 19,904 | 2,505,715 |
| MyoKardia, Inc. (a) | | 6,487 | 268,432 |
| Nektar Therapeutics (a) | | 60,617 | 2,566,524 |
| The Medicines Company (a) | | 29,424 | 679,989 |
| TherapeuticsMD, Inc. (a) | | 64,200 | 337,050 |
| Theravance Biopharma, Inc. (a) | | 3,439 | 89,586 |
| Zogenix, Inc. (a) | | 7,213 | 315,569 |
| | | | 16,128,537 |
|
| TOTAL HEALTH CARE | | | 221,943,769 |
|
| INDUSTRIALS - 4.3% | | | |
| Aerospace & Defense - 1.6% | | | |
| Elbit Systems Ltd. | | 3,219 | 396,034 |
| Northrop Grumman Corp. | | 18,812 | 5,183,647 |
| The Boeing Co. | | 54,550 | 21,035,571 |
| United Technologies Corp. | | 10,985 | 1,296,999 |
| | | | 27,912,251 |
| Airlines - 1.0% | | | |
| American Airlines Group, Inc. | | 68,463 | 2,448,922 |
| Delta Air Lines, Inc. | | 90,302 | 4,463,628 |
| JetBlue Airways Corp. (a) | | 9,400 | 169,106 |
| Spirit Airlines, Inc. (a) | | 101,136 | 5,948,820 |
| United Continental Holdings, Inc. (a) | | 43,895 | 3,830,717 |
| | | | 16,861,193 |
| Building Products - 0.1% | | | |
| Fortune Brands Home & Security, Inc. | | 44,154 | 2,000,176 |
| Commercial Services & Supplies - 0.1% | | | |
| HomeServe PLC | | 60,608 | 750,021 |
| Tomra Systems ASA | | 38,900 | 1,007,790 |
| | | | 1,757,811 |
| Construction & Engineering - 0.1% | | | |
| MasTec, Inc. (a) | | 26,600 | 1,180,508 |
| Electrical Equipment - 0.1% | | | |
| Fortive Corp. | | 31,753 | 2,381,157 |
| Industrial Conglomerates - 0.4% | | | |
| General Electric Co. | | 285,869 | 2,904,429 |
| Honeywell International, Inc. | | 31,197 | 4,480,825 |
| | | | 7,385,254 |
| Machinery - 0.6% | | | |
| Deere & Co. | | 42,506 | 6,970,984 |
| Rational AG | | 1,002 | 627,348 |
| Xylem, Inc. | | 26,832 | 1,912,048 |
| | | | 9,510,380 |
| Road & Rail - 0.3% | | | |
| Knight-Swift Transportation Holdings, Inc. Class A | | 141,678 | 4,498,277 |
| Union Pacific Corp. | | 3,300 | 524,931 |
| | | | 5,023,208 |
| Trading Companies & Distributors - 0.0% | | | |
| Ferguson PLC | | 1,850 | 123,604 |
|
| TOTAL INDUSTRIALS | | | 74,135,542 |
|
| INFORMATION TECHNOLOGY - 31.4% | | | |
| Communications Equipment - 0.2% | | | |
| Arista Networks, Inc. (a) | | 10,685 | 2,294,924 |
| Telefonaktiebolaget LM Ericsson (B Shares) sponsored ADR | | 105,066 | 936,138 |
| | | | 3,231,062 |
| Electronic Equipment & Components - 0.1% | | | |
| Corning, Inc. | | 67,696 | 2,251,569 |
| IT Services - 6.0% | | | |
| Adyen BV (c) | | 1,578 | 1,169,862 |
| Akamai Technologies, Inc. (a) | | 63,662 | 4,144,396 |
| Endava PLC ADR (a) | | 5,939 | 139,567 |
| GoDaddy, Inc. (a) | | 29,399 | 2,017,653 |
| Keywords Studios PLC | | 7,518 | 117,538 |
| MasterCard, Inc. Class A | | 143,266 | 30,247,751 |
| Netcompany Group A/S (c) | | 6,300 | 212,498 |
| Okta, Inc. (a) | | 3,132 | 258,171 |
| PayPal Holdings, Inc. (a) | | 194,678 | 17,279,619 |
| Shopify, Inc. Class A (a) | | 18,800 | 3,164,644 |
| Square, Inc. (a) | | 19,529 | 1,393,394 |
| Total System Services, Inc. | | 3,960 | 354,856 |
| Twilio, Inc. Class A (a) | | 3,802 | 423,239 |
| Visa, Inc. Class A | | 299,638 | 40,454,126 |
| Wix.com Ltd. (a) | | 26,370 | 2,883,560 |
| | | | 104,260,874 |
| Semiconductors & Semiconductor Equipment - 8.7% | | | |
| Acacia Communications, Inc. (a) | | 10,210 | 444,237 |
| Advanced Micro Devices, Inc. (a) | | 128,917 | 3,146,864 |
| Analog Devices, Inc. | | 24,310 | 2,403,287 |
| ASML Holding NV | | 4,351 | 761,556 |
| Broadcom, Inc. | | 172,454 | 46,260,786 |
| Inphi Corp. (a) | | 42,776 | 1,687,085 |
| Lam Research Corp. | | 34,495 | 5,849,662 |
| Marvell Technology Group Ltd. | | 1,733,928 | 32,129,686 |
| Micron Technology, Inc. (a) | | 111,419 | 4,258,434 |
| Monolithic Power Systems, Inc. | | 32,026 | 4,053,211 |
| NVIDIA Corp. | | 234,331 | 33,685,081 |
| NXP Semiconductors NV | | 79,041 | 6,878,938 |
| ON Semiconductor Corp. (a) | | 37,800 | 757,512 |
| Qualcomm, Inc. | | 92,350 | 4,573,172 |
| Semtech Corp. (a) | | 4,093 | 198,756 |
| Xilinx, Inc. | | 26,078 | 2,919,171 |
| | | | 150,007,438 |
| Software - 10.8% | | | |
| Adobe, Inc. (a) | | 78,914 | 19,556,467 |
| Altair Engineering, Inc. Class A (a) | | 5,505 | 178,252 |
| Bilibili, Inc. ADR (a) | | 33,092 | 609,224 |
| CyberArk Software Ltd. (a) | | 2,263 | 198,601 |
| DocuSign, Inc. | | 36,737 | 1,816,645 |
| Dropbox, Inc. Class A (a) | | 29,570 | 730,675 |
| HubSpot, Inc. (a) | | 8,302 | 1,314,290 |
| Intuit, Inc. | | 16,018 | 3,457,005 |
| Microsoft Corp. | | 779,085 | 81,359,847 |
| Paycom Software, Inc. (a) | | 29,333 | 4,348,324 |
| RingCentral, Inc. (a) | | 32,562 | 3,010,031 |
| SailPoint Technologies Holding, Inc. (a) | | 14,573 | 416,059 |
| Salesforce.com, Inc. (a) | | 371,283 | 56,423,878 |
| ServiceNow, Inc. (a) | | 1,828 | 402,197 |
| Splunk, Inc. (a) | | 6,125 | 764,645 |
| StoneCo Ltd. Class A (a)(b) | | 6,792 | 150,239 |
| The Trade Desk, Inc. (a) | | 30,538 | 4,357,162 |
| Ultimate Software Group, Inc. (a) | | 718 | 196,064 |
| Workday, Inc. Class A (a) | | 34,684 | 6,296,187 |
| Zendesk, Inc. (a) | | 16,435 | 1,109,856 |
| Zuora, Inc. | | 49,769 | 1,077,001 |
| | | | 187,772,649 |
| Technology Hardware, Storage & Peripherals - 5.6% | | | |
| Apple, Inc. | | 587,409 | 97,768,354 |
|
| TOTAL INFORMATION TECHNOLOGY | | | 545,291,946 |
|
| MATERIALS - 1.2% | | | |
| Chemicals - 1.2% | | | |
| CF Industries Holdings, Inc. | | 140,845 | 6,147,884 |
| DowDuPont, Inc. | | 41,970 | 2,258,406 |
| FMC Corp. | | 7,708 | 615,098 |
| LG Chemical Ltd. | | 500 | 165,404 |
| Nutrien Ltd. | | 47,268 | 2,448,748 |
| Sherwin-Williams Co. | | 412 | 173,666 |
| The Chemours Co. LLC | | 169,484 | 6,059,053 |
| The Mosaic Co. | | 81,081 | 2,617,295 |
| Westlake Chemical Corp. | | 9,200 | 679,880 |
| | | | 21,165,434 |
| REAL ESTATE - 0.1% | | | |
| Equity Real Estate Investment Trusts (REITs) - 0.1% | | | |
| Ant International Co. Ltd. Class C (d)(e) | | 274,458 | 1,539,709 |
| TOTAL COMMON STOCKS | | | |
| (Cost $1,547,734,061) | | | 1,710,442,640 |
|
| Preferred Stocks - 1.5% | | | |
| Convertible Preferred Stocks - 1.5% | | | |
| CONSUMER DISCRETIONARY - 0.2% | | | |
| Hotels, Restaurants & Leisure - 0.2% | | | |
| Neutron Holdings, Inc.: | | | |
| Series C (d)(e) | | 3,178,083 | 770,685 |
| Series D (d)(e) | | 5,904,173 | 1,431,762 |
| Topgolf International, Inc. Series F (a)(d)(e) | | 9,181 | 109,254 |
| | | | 2,311,701 |
| Internet & Direct Marketing Retail - 0.0% | | | |
| The Honest Co., Inc. Series E (a)(d)(e) | | 11,802 | 231,319 |
| Textiles, Apparel & Luxury Goods - 0.0% | | | |
| Allbirds, Inc.: | | | |
| Series A (d)(e) | | 928 | 50,888 |
| Series B (d)(e) | | 163 | 8,938 |
| Series C (d)(e) | | 1,558 | 85,434 |
| | | | 145,260 |
| TOTAL CONSUMER DISCRETIONARY | | | 2,688,280 |
| CONSUMER STAPLES - 0.4% | | | |
| Food & Staples Retailing - 0.2% | | | |
| Roofoods Ltd. Series F (a)(d)(e) | | 337 | 87,290 |
| Sweetgreen, Inc. Series H (d)(e) | | 211,642 | 2,759,812 |
| | | | 2,847,102 |
| Food Products - 0.0% | | | |
| Agbiome LLC Series C (d)(e) | | 68,700 | 435,125 |
| Tobacco - 0.2% | | | |
| JUUL Labs, Inc. Series E (d)(e) | | 12,508 | 3,121,371 |
| TOTAL CONSUMER STAPLES | | | 6,403,598 |
| HEALTH CARE - 0.0% | | | |
| Biotechnology - 0.0% | | | |
| 23andMe, Inc. Series F (a)(d)(e) | | 6,504 | 112,844 |
| Generation Bio Series B (d)(e) | | 22,400 | 156,800 |
| | | | 269,644 |
| INFORMATION TECHNOLOGY - 0.9% | | | |
| Internet Software & Services - 0.0% | | | |
| ContextLogic, Inc. Series G (a)(d)(e) | | 2,862 | 412,901 |
| Starry, Inc. Series C (a)(d)(e) | | 158,250 | 145,907 |
| | | | 558,808 |
| Software - 0.9% | | | |
| Bird Rides, Inc. Series C (d)(e) | | 146,154 | 1,716,652 |
| Cloudflare, Inc. Series D, 8.00% (a)(d)(e) | | 30,300 | 333,300 |
| Compass, Inc. Series E (a)(d)(e) | | 1,181 | 140,031 |
| Lyft, Inc.: | | | |
| Series H (a)(d)(e) | | 100,639 | 4,722,988 |
| Series I (d)(e) | | 177,388 | 8,324,819 |
| | | | 15,237,790 |
| TOTAL INFORMATION TECHNOLOGY | | | 15,796,598 |
|
| TOTAL CONVERTIBLE PREFERRED STOCKS | | | 25,158,120 |
|
| Nonconvertible Preferred Stocks - 0.0% | | | |
| CONSUMER DISCRETIONARY - 0.0% | | | |
| Textiles, Apparel & Luxury Goods - 0.0% | | | |
| Allbirds, Inc. (d)(e) | | 499 | 27,363 |
| TOTAL PREFERRED STOCKS | | | |
| (Cost $21,556,673) | | | 25,185,483 |
|
| Money Market Funds - 1.4% | | | |
| Fidelity Securities Lending Cash Central Fund 2.43% (g)(h) | | | |
| (Cost $24,198,995) | | 24,196,575 | 24,198,995 |
| TOTAL INVESTMENT IN SECURITIES - 101.4% | | | |
| (Cost $1,593,489,729) | | | 1,759,827,118 |
| NET OTHER ASSETS (LIABILITIES) - (1.4)% | | | (23,968,371) |
| NET ASSETS - 100% | | | $1,735,858,747 |
Legend
(a) Non-income producing
(b) Security or a portion of the security is on loan at period end.
(c) Security exempt from registration under Rule 144A of the Securities Act of 1933. These securities may be resold in transactions exempt from registration, normally to qualified institutional buyers. At the end of the period, the value of these securities amounted to $1,878,572 or 0.1% of net assets.
(d) Restricted securities - Investment in securities not registered under the Securities Act of 1933 (excluding 144A issues). At the end of the period, the value of restricted securities (excluding 144A issues) amounted to $32,773,109 or 1.9% of net assets.
(e) Level 3 security
(f) Investment is owned by a wholly-owned subsidiary (Subsidiary) that is treated as a corporation for U.S. tax purposes.
(g) Affiliated fund that is generally available only to investment companies and other accounts managed by Fidelity Investments. The rate quoted is the annualized seven-day yield of the fund at period end. A complete unaudited listing of the fund's holdings as of its most recent quarter end is available upon request. In addition, each Fidelity Central Fund's financial statements are available on the SEC's website or upon request.
(h) Investment made with cash collateral received from securities on loan.
Additional information on each restricted holding is as follows:
| Security | Acquisition Date | Acquisition Cost |
| 23andMe, Inc. Series F | 8/31/17 | $90,303 |
| Agbiome LLC Series C | 6/29/18 | $435,125 |
| Allbirds, Inc. | 10/9/18 | $128,974 |
| Allbirds, Inc. | 10/9/18 | $27,363 |
| Allbirds, Inc. Series A | 10/9/18 | $50,888 |
| Allbirds, Inc. Series B | 10/9/18 | $8,938 |
| Allbirds, Inc. Series C | 10/9/18 | $85,434 |
| Ant International Co. Ltd. Class C | 5/16/18 | $1,539,709 |
| Bird Rides, Inc. Series C | 12/21/18 | $1,716,652 |
| Cibus Global Ltd. Series C | 2/16/18 | $281,001 |
| Cloudflare, Inc. Series D, 8.00% | 9/10/18 | $333,300 |
| Compass, Inc. Series E | 11/3/17 | $79,692 |
| ContextLogic, Inc. Series G | 10/24/17 | $385,033 |
| Generation Bio Series B | 2/21/18 | $204,864 |
| JUUL Labs, Inc. Class A | 12/20/17 - 7/6/18 | $645,585 |
| JUUL Labs, Inc. Series E | 12/20/17 - 7/6/18 | $342,963 |
| Lyft, Inc. Series H | 11/22/17 | $4,000,008 |
| Lyft, Inc. Series I | 6/27/18 | $8,400,014 |
| Neutron Holdings, Inc. Series C | 7/3/18 | $581,081 |
| Neutron Holdings, Inc. Series D | 1/25/19 | $1,431,762 |
| Roofoods Ltd. Series F | 9/12/17 | $119,153 |
| Starry, Inc. Series C | 12/8/17 | $145,907 |
| Sweetgreen, Inc. Series H | 11/9/18 | $2,759,812 |
| The Honest Co., Inc. Series E | 9/28/17 | $231,376 |
| Topgolf International, Inc. Series F | 11/10/17 | $127,005 |
Affiliated Central Funds
Information regarding fiscal year to date income earned by the Fund from investments in Fidelity Central Funds is as follows:
| Fund | Income earned |
| Fidelity Cash Central Fund | $229,584 |
| Fidelity Securities Lending Cash Central Fund | 136,254 |
| Total | $365,838 |
Amounts in the income column in the above table include any capital gain distributions from underlying funds, which are presented in the corresponding line-item in the Statement of Operations, if applicable.
Investment Valuation
The following is a summary of the inputs used, as of January 31, 2019, involving the Fund's assets and liabilities carried at fair value. The inputs or methodology used for valuing securities may not be an indication of the risk associated with investing in those securities. For more information on valuation inputs, and their aggregation into the levels used below, please refer to the Investment Valuation section in the accompanying Notes to Financial Statements.
| | Valuation Inputs at Reporting Date: |
| Description | Total | Level 1 | Level 2 | Level 3 |
| Investments in Securities: | | | | |
| Equities: | | | | |
| Communication Services | $303,039,942 | $293,040,730 | $9,999,212 | $-- |
| Consumer Discretionary | 430,094,851 | 426,827,143 | 423,091 | 2,844,617 |
| Consumer Staples | 60,087,055 | 47,724,665 | 185,702 | 12,176,688 |
| Energy | 17,831,051 | 17,831,051 | -- | -- |
| Financials | 44,432,582 | 44,432,582 | -- | -- |
| Health Care | 222,213,413 | 221,406,587 | 391,329 | 415,497 |
| Industrials | 74,135,542 | 74,135,542 | -- | -- |
| Information Technology | 561,088,544 | 545,291,946 | -- | 15,796,598 |
| Materials | 21,165,434 | 21,165,434 | -- | -- |
| Real Estate | 1,539,709 | -- | -- | 1,539,709 |
| Money Market Funds | 24,198,995 | 24,198,995 | -- | -- |
| Total Investments in Securities: | $1,759,827,118 | $1,716,054,675 | $10,999,334 | $32,773,109 |
The following is a reconciliation of Investments in Securities and Derivative Instruments for which Level 3 inputs were used in determining value:
| Investments in Securities: | |
| Beginning Balance | $23,490,491 |
| Net Realized Gain (Loss) on Investment Securities | (76,525) |
| Net Unrealized Gain (Loss) on Investment Securities | 8,077,472 |
| Cost of Purchases | 7,531,670 |
| Proceeds of Sales | (6,249,999) |
| Amortization/Accretion | -- |
| Transfers into Level 3 | -- |
| Transfers out of Level 3 | -- |
| Ending Balance | $32,773,109 |
| The change in unrealized gain (loss) for the period attributable to Level 3 securities held at January 31, 2019 | $8,077,472 |
The information used in the above reconciliation represents fiscal year to date activity for any Investments in Securities identified as using Level 3 inputs at either the beginning or the end of the current fiscal period. Transfers in or out of Level 3 represent the beginning value of any Security or Instrument where a change in the pricing level occurred from the beginning to the end of the period. The cost of purchases and the proceeds of sales may include securities received or delivered through corporate actions or exchanges. Realized and unrealized gains (losses) disclosed in the reconciliation{s} are included in Net Gain (Loss) on the Fund's Statement of Operations.
See accompanying notes which are an integral part of the financial statements.
Financial Statements
Statement of Assets and Liabilities
| | | January 31, 2019 (Unaudited) |
| Assets | | |
Investment in securities, at value (including securities loaned of $23,821,723) — See accompanying schedule:
Unaffiliated issuers (cost $1,569,290,734) | $1,735,628,123 | |
| Fidelity Central Funds (cost $24,198,995) | 24,198,995 | |
| Total Investment in Securities (cost $1,593,489,729) | | $1,759,827,118 |
| Foreign currency held at value (cost $170,218) | | 170,218 |
| Receivable for investments sold | | 10,536,575 |
| Receivable for fund shares sold | | 2,600,826 |
| Dividends receivable | | 205,480 |
| Distributions receivable from Fidelity Central Funds | | 27,639 |
| Other receivables | | 12,592 |
| Total assets | | 1,773,380,448 |
| Liabilities | | |
| Payable to custodian bank | $1,078,782 | |
| Payable for investments purchased | 9,808,158 | |
| Payable for fund shares redeemed | 1,796,311 | |
| Accrued management fee | 629,907 | |
| Other payables and accrued expenses | 9,848 | |
| Collateral on securities loaned | 24,198,695 | |
| Total liabilities | | 37,521,701 |
| Net Assets | | $1,735,858,747 |
| Net Assets consist of: | | |
| Paid in capital | | $1,620,287,432 |
| Total distributable earnings (loss) | | 115,571,315 |
| Net Assets, for 142,438,262 shares outstanding | | $1,735,858,747 |
| Net Asset Value, offering price and redemption price per share ($1,735,858,747 ÷ 142,438,262 shares) | | $12.19 |
See accompanying notes which are an integral part of the financial statements.
Statement of Operations
| | | Six months ended January 31, 2019 (Unaudited) |
| Investment Income | | |
| Dividends | | $6,050,668 |
| Income from Fidelity Central Funds | | 365,838 |
| Total income | | 6,416,506 |
| Expenses | | |
| Management fee | $3,837,486 | |
| Independent trustees' fees and expenses | 5,326 | |
| Interest | 2,716 | |
| Commitment fees | 2,253 | |
| Total expenses before reductions | 3,847,781 | |
| Expense reductions | (14,855) | |
| Total expenses after reductions | | 3,832,926 |
| Net investment income (loss) | | 2,583,580 |
| Realized and Unrealized Gain (Loss) | | |
| Net realized gain (loss) on: | | |
| Investment securities: | | |
| Unaffiliated issuers | (35,729,325) | |
| Fidelity Central Funds | 3,023 | |
| Foreign currency transactions | (17,239) | |
| Total net realized gain (loss) | | (35,743,541) |
| Change in net unrealized appreciation (depreciation) on: | | |
| Investment securities: | | |
| Unaffiliated issuers (net of decrease in deferred foreign taxes of $65,666) | (40,117,356) | |
| Assets and liabilities in foreign currencies | (5,175) | |
| Total change in net unrealized appreciation (depreciation) | | (40,122,531) |
| Net gain (loss) | | (75,866,072) |
| Net increase (decrease) in net assets resulting from operations | | $(73,282,492) |
See accompanying notes which are an integral part of the financial statements.
Statement of Changes in Net Assets
| | Six months ended January 31, 2019 (Unaudited) | Year ended July 31, 2018 |
| Increase (Decrease) in Net Assets | | |
| Operations | | |
| Net investment income (loss) | $2,583,580 | $4,595,244 |
| Net realized gain (loss) | (35,743,541) | (14,265,282) |
| Change in net unrealized appreciation (depreciation) | (40,122,531) | 207,757,843 |
| Net increase (decrease) in net assets resulting from operations | (73,282,492) | 198,087,805 |
| Distributions to shareholders | (7,070,490) | – |
| Distributions to shareholders from net investment income | – | (737,285) |
| Distributions to shareholders from net realized gain | – | (113,428) |
| Total distributions | (7,070,490) | (850,713) |
| Share transactions | | |
| Proceeds from sales of shares | 385,725,131 | 1,506,071,314 |
| Reinvestment of distributions | 7,070,490 | 850,713 |
| Cost of shares redeemed | (256,628,245) | (204,338,016) |
| Net increase (decrease) in net assets resulting from share transactions | 136,167,376 | 1,302,584,011 |
| Total increase (decrease) in net assets | 55,814,394 | 1,499,821,103 |
| Net Assets | | |
| Beginning of period | 1,680,044,353 | 180,223,250 |
| End of period | $1,735,858,747 | $1,680,044,353 |
| Other Information | | |
| Undistributed net investment income end of period | | $3,740,420 |
| Shares | | |
| Sold | 32,000,059 | 130,929,525 |
| Issued in reinvestment of distributions | 568,533 | 75,151 |
| Redeemed | (21,507,612) | (17,090,266) |
| Net increase (decrease) | 11,060,980 | 113,914,410 |
See accompanying notes which are an integral part of the financial statements.
Financial Highlights
Fidelity Blue Chip Growth K6 Fund
| | Six months ended (Unaudited) January 31, | Years endedJuly 31, | |
| | 2019 | 2018 | 2017 A |
| Selected Per–Share Data | | | |
| Net asset value, beginning of period | $12.79 | $10.32 | $10.00 |
| Income from Investment Operations | | | |
| Net investment income (loss)B | .02 | .05C | –D |
| Net realized and unrealized gain (loss) | (.57) | 2.44 | .32 |
| Total from investment operations | (.55) | 2.49 | .32 |
| Distributions from net investment income | (.05) | (.01) | – |
| Distributions from net realized gain | – | –D | – |
| Total distributions | (.05) | (.02)E | – |
| Net asset value, end of period | $12.19 | $12.79 | $10.32 |
| Total ReturnF,G | (4.30)% | 24.10% | 3.20% |
| Ratios to Average Net AssetsH,I | | | |
| Expenses before reductions | .45%J | .45% | .45%J |
| Expenses net of fee waivers, if any | .45%J | .45% | .45%J |
| Expenses net of all reductions | .45%J | .45% | .45%J |
| Net investment income (loss) | .30%J | .45%C | (.24)%J |
| Supplemental Data | | | |
| Net assets, end of period (000 omitted) | $1,735,859 | $1,680,044 | $180,223 |
| Portfolio turnover rateK | 48%J,L | 40%L | 3%L,M |
A For the period May 25, 2017 (commencement of operations) to July 31, 2017.
B Calculated based on average shares outstanding during the period.
C Net investment income per share reflects a large, non-recurring dividend which amounted to $.02 per share. Excluding this non-recurring dividend, the ratio of net investment income (loss) to average net assets would have been .29%.
D Amount represents less than $.005 per share.
E Total distributions of $.02 per share is comprised of distributions from net investment income of $.013 and distributions from net realized gain of $.002 per share.
F Total returns for periods of less than one year are not annualized.
G Total returns would have been lower if certain expenses had not been reduced during the applicable periods shown.
H Fees and expenses of any underlying Fidelity Central Funds are not included in the Fund's expense ratio. The Fund indirectly bears its proportionate share of the expenses of any underlying Fidelity Central Funds.
I Expense ratios reflect operating expenses of the Fund. Expenses before reductions do not reflect amounts reimbursed by the investment adviser or reductions from brokerage service arrangements or reductions from other expense offset arrangements and do not represent the amount paid by the Fund during periods when reimbursements or reductions occur. Expense ratios before reductions for start-up periods may not be representative of longer term operating periods. Expenses net of fee waivers reflect expenses after reimbursement by the investment adviser but prior to reductions from brokerage service arrangements or other expense offset arrangements. Expenses net of all reductions represent the net expenses paid by the Fund.
J Annualized
K Amount does not include the portfolio activity of any underlying Fidelity Central Funds.
L Portfolio turnover rate excludes securities received or delivered in-kind.
M Amount not annualized.
See accompanying notes which are an integral part of the financial statements.
Notes to Financial Statements (Unaudited)
For the period ended January 31, 2019
1. Organization.
Fidelity Blue Chip Growth K6 Fund (the Fund) is a fund of Fidelity Securities Fund (the Trust) and is authorized to issue an unlimited number of shares. Share transactions on the Statement of Changes in Net Assets may contain exchanges between affiliated funds. The Trust is registered under the Investment Company Act of 1940, as amended (the 1940 Act), as an open-end management investment company organized as a Massachusetts business trust. Shares generally are available only to employer-sponsored retirement plans that are recordkept by Fidelity, or to certain employer-sponsored retirement plans that are not recordkept by Fidelity.
2. Investments in Fidelity Central Funds.
The Fund invests in Fidelity Central Funds, which are open-end investment companies generally available only to other investment companies and accounts managed by the investment adviser and its affiliates. The Fund's Schedule of Investments lists each of the Fidelity Central Funds held as of period end, if any, as an investment of the Fund, but does not include the underlying holdings of each Fidelity Central Fund. As an Investing Fund, the Fund indirectly bears its proportionate share of the expenses of the underlying Fidelity Central Funds.
The Money Market Central Funds seek preservation of capital and current income and are managed by Fidelity Investments Money Management, Inc. (FIMM), an affiliate of the investment adviser. Annualized expenses of the Money Market Central Funds as of their most recent shareholder report date are less than .005%.
A complete unaudited list of holdings for each Fidelity Central Fund is available upon request or at the Securities and Exchange Commission (the SEC) website at www.sec.gov. In addition, the financial statements of the Fidelity Central Funds are available on the SEC website or upon request.
3. Significant Accounting Policies.
The Fund is an investment company and applies the accounting and reporting guidance of the Financial Accounting Standards Board (FASB) Accounting Standards Codification Topic 946 Financial Services – Investments Companies. The financial statements have been prepared in conformity with accounting principles generally accepted in the United States of America (GAAP), which require management to make certain estimates and assumptions at the date of the financial statements. Actual results could differ from those estimates. Subsequent events, if any, through the date that the financial statements were issued have been evaluated in the preparation of the financial statements. The following summarizes the significant accounting policies of the Fund:
Investment Valuation. Investments are valued as of 4:00 p.m. Eastern time on the last calendar day of the period. The Board of Trustees (the Board) has delegated the day to day responsibility for the valuation of the Fund's investments to the Fair Value Committee (the Committee) established by the Fund's investment adviser. In accordance with valuation policies and procedures approved by the Board, the Fund attempts to obtain prices from one or more third party pricing vendors or brokers to value its investments. When current market prices, quotations or currency exchange rates are not readily available or reliable, investments will be fair valued in good faith by the Committee, in accordance with procedures adopted by the Board. Factors used in determining fair value vary by investment type and may include market or investment specific events. The frequency with which these procedures are used cannot be predicted and they may be utilized to a significant extent. The Committee oversees the Fund's valuation policies and procedures and reports to the Board on the Committee's activities and fair value determinations. The Board monitors the appropriateness of the procedures used in valuing the Fund's investments and ratifies the fair value determinations of the Committee.
The Fund categorizes the inputs to valuation techniques used to value its investments into a disclosure hierarchy consisting of three levels as shown below:
- Level 1 – quoted prices in active markets for identical investments
- Level 2 – other significant observable inputs (including quoted prices for similar investments, interest rates, prepayment speeds, etc.)
- Level 3 – unobservable inputs (including the Fund's own assumptions based on the best information available)
Valuation techniques used to value the Fund's investments by major category are as follows:
Equity securities, including restricted securities, for which market quotations are readily available, are valued at the last reported sale price or official closing price as reported by a third party pricing vendor on the primary market or exchange on which they are traded and are categorized as Level 1 in the hierarchy. In the event there were no sales during the day or closing prices are not available, securities are valued at the last quoted bid price or may be valued using the last available price and are generally categorized as Level 2 in the hierarchy. For foreign equity securities, when market or security specific events arise, comparisons to the valuation of American Depositary Receipts (ADRs), futures contracts, Exchange-Traded Funds (ETFs) and certain indexes as well as quoted prices for similar securities may be used and would be categorized as Level 2 in the hierarchy. For equity securities, including restricted securities, where observable inputs are limited, assumptions about market activity and risk are used and these securities may be categorized as Level 3 in the hierarchy. Equity securities, including restricted securities, for which observable inputs are not available are valued using alternate valuation approaches, including the market approach and the income approach and are categorized as Level 3 in the hierarchy. The market approach generally consists of using comparable market transactions while the income approach generally consists of using the net present value of estimated future cash flows, adjusted as appropriate for liquidity, credit, market and/or other risk factors.
Investments in open-end mutual funds, including the Fidelity Central Funds, are valued at their closing net asset value (NAV) each business day and are categorized as Level 1 in the hierarchy.
The following provides information on Level 3 securities held by the Fund that were valued at period end based on unobservable inputs. These amounts exclude valuations provided by a broker.
| Asset Type | Fair Value | Valuation Technique (s) | Unobservable Input | Amount or Range / Weighted Average | Impact to Valuation from an Increase in Input(a) |
| Equities | $ 32,773,109 | Market approach | Transaction price | $0.24 - $277.28 / $138.48 | Increase |
| | | | Discount rate | 10.0% | Decrease |
| | | Market comparable | Transaction price | $9.15 | Increase |
| | | | Enterprise value/Sales multiple (EV/S) | 1.2 - 3.2 / 2.6 | Increase |
| | | | Discount rate | 30.0% - 78.0% / 30.4% | Decrease |
| | | | Discount for lack of marketability | 10.0% | Decrease |
| | | | Proxy discount | 23.4% | Decrease |
| | | | Premium rate | 9.0% | Increase |
| | | | Liquidity preference | $19.60 | Increase |
| | | Discount cash flow | Discount rate | 24.1% - 25.0% / 24.6% | Decrease |
| | | | Growth rate | 3.0% | Increase |
(a) Represents the directional change in the fair value of the Level 3 investments that could have resulted from an increase in the corresponding input as of period end. A decrease to the unobservable input would have had the opposite effect. Significant changes in these inputs may have resulted in a significantly higher or lower fair value measurement at period end.
Changes in valuation techniques may result in transfers in or out of an assigned level within the disclosure hierarchy. The aggregate value of investments by input level as of January 31, 2019, as well as a roll forward of Level 3 investments, is included at the end of the Fund's Schedule of Investments.
Foreign Currency. The Fund may use foreign currency contracts to facilitate transactions in foreign-denominated securities. Gains and losses from these transactions may arise from changes in the value of the foreign currency or if the counterparties do not perform under the contracts' terms.
Foreign-denominated assets, including investment securities, and liabilities are translated into U.S. dollars at the exchange rates at period end. Purchases and sales of investment securities, income and dividends received and expenses denominated in foreign currencies are translated into U.S. dollars at the exchange rate in effect on the transaction date.
The effects of exchange rate fluctuations on investments are included with the net realized and unrealized gain (loss) on investment securities. Other foreign currency transactions resulting in realized and unrealized gain (loss) are disclosed separately.
Investment Transactions and Income. For financial reporting purposes, the Fund's investment holdings and NAV include trades executed through the end of the last business day of the period. The NAV per share for processing shareholder transactions is calculated as of the close of business of the New York Stock Exchange (NYSE), normally 4:00 p.m. Eastern time and includes trades executed through the end of the prior business day. Gains and losses on securities sold are determined on the basis of identified cost. Dividend income is recorded on the ex-dividend date, except for certain dividends from foreign securities where the ex-dividend date may have passed, which are recorded as soon as the Fund is informed of the ex-dividend date. Non-cash dividends included in dividend income, if any, are recorded at the fair market value of the securities received. Income and capital gain distributions from Fidelity Central Funds, if any, are recorded on the ex-dividend date. Certain distributions received by the Fund represent a return of capital or capital gain. The Fund determines the components of these distributions subsequent to the ex-dividend date, based upon receipt of tax filings or other correspondence relating to the underlying investment. These distributions are recorded as a reduction of cost of investments and/or as a realized gain. Investment income is recorded net of foreign taxes withheld where recovery of such taxes is uncertain.
Expenses. Expenses directly attributable to a fund are charged to that fund. Expenses attributable to more than one fund are allocated among the respective funds on the basis of relative net assets or other appropriate methods. Expense estimates are accrued in the period to which they relate and adjustments are made when actual amounts are known.
Income Tax Information and Distributions to Shareholders. Each year, the Fund intends to qualify as a regulated investment company under Subchapter M of the Internal Revenue Code, including distributing substantially all of its taxable income and realized gains. As a result, no provision for U.S. Federal income taxes is required. The Fund files a U.S. federal tax return, in addition to state and local tax returns as required. The Fund's federal income tax returns are subject to examination by the Internal Revenue Service (IRS) for a period of three fiscal years after they are filed. State and local tax returns may be subject to examination for an additional fiscal year depending on the jurisdiction. Foreign taxes are provided for based on the Fund's understanding of the tax rules and rates that exist in the foreign markets in which it invests. The Fund is subject to a tax imposed on capital gains by certain countries in which it invests. An estimated deferred tax liability for net unrealized appreciation on the applicable securities is included in Other payables and accrued expenses on the Statement of Assets & Liabilities.
Distributions are declared and recorded on the ex-dividend date. Income and capital gain distributions are determined in accordance with income tax regulations, which may differ from GAAP.
Capital accounts within the financial statements are adjusted for permanent book-tax differences. These adjustments have no impact on net assets or the results of operations. Capital accounts are not adjusted for temporary book-tax differences which will reverse in a subsequent period.
Book-tax differences are primarily due to the foreign currency transactions, passive foreign investment companies (PFIC), partnerships, capital loss carryforwards and losses deferred due to wash sales.
As of period end, the cost and unrealized appreciation (depreciation) in securities, and derivatives if applicable, for federal income tax purposes were as follows:
| Gross unrealized appreciation | $229,495,851 |
| Gross unrealized depreciation | (70,024,685) |
| Net unrealized appreciation (depreciation) | $159,471,166 |
| Tax cost | $1,600,355,952 |
Capital loss carryforwards are only available to offset future capital gains of the Fund to the extent provided by regulations and may be limited. Under the Regulated Investment Company Modernization Act of 2010 (the Act), the Fund is permitted to carry forward capital losses incurred in taxable years beginning after December 22, 2010 for an unlimited period and such capital losses are required to be used prior to any losses that expire. The capital loss carryforward information presented below, including any applicable limitation, is estimated as of prior fiscal period end and is subject to adjustment.
| No expiration | |
| Short-term | $(12,463,098) |
| Long-term | (10,192) |
| Total capital loss carryforward | $(12,473,290) |
Restricted Securities. The Fund may invest in securities that are subject to legal or contractual restrictions on resale. These securities generally may be resold in transactions exempt from registration or to the public if the securities are registered. Disposal of these securities may involve time-consuming negotiations and expense, and prompt sale at an acceptable price may be difficult. Information regarding restricted securities is included at the end of the Fund's Schedule of Investments.
Consolidated Subsidiary. The Fund invests in certain investments through a wholly-owned subsidiary ("Subsidiary"), which may be subject to federal and state taxes upon disposition.
As of period end, the Fund held an investment of $145,853 in this Subsidiary, representing .01% of the Fund's net assets. The financial statements have been consolidated and include accounts of the Fund and the Subsidiary. Accordingly, all inter-company transactions and balances have been eliminated.
New Rule Issuance. During August 2018, the U.S. Securities and Exchange Commission issued Final Rule Release No. 33-10532, Disclosure Update and Simplification. This Final Rule includes amendments specific to registered investment companies that are intended to eliminate overlap in disclosure requirements between Regulation S-X and GAAP. In accordance with these amendments, certain line-items in the Fund's financial statements have been combined or removed for the current period as outlined in the table below.
| Financial Statement | Current Line-Item Presentation (As Applicable) | Prior Line-Item Presentation (As Applicable) |
| Statement of Assets and Liabilities | Total distributable earnings (loss) | Undistributed/Distributions in excess of/Accumulated net investment income (loss)
Accumulated/Undistributed net realized gain (loss)
Net unrealized appreciation (depreciation) |
| Statement of Changes in Net Assets | N/A - removed | Undistributed/Distributions in excess of/Accumulated net investment income (loss) end of period |
| Statement of Changes in Net Assets | Distributions to shareholders | Distributions to shareholders from net investment income
Distributions to shareholders from net realized gain |
4. Purchases and Sales of Investments.
Purchases and sales of securities, other than short-term securities and in-kind transactions, aggregated $513,206,412 and $404,848,126, respectively.
Unaffiliated Exchanges In-Kind. During the period, the Fund received investments and cash valued at $59,495,841 in exchange for 5,142,673 shares of the Fund. The amount of in-kind exchanges is included in share transactions in the accompanying Statement of Changes in Net Assets.
Prior Fiscal Year Exchanges In-Kind. During the prior period, an unaffiliated entity completed an exchange in-kind with the Fund. The unaffiliated entity delivered investments and cash, valued at $1,068,331,023 in exchange for 93,987,183 shares of the Fund. The amount of in-kind exchanges is included in share transactions in the accompanying Statement of Changes in Net Assets. The Fund recognized no gain or loss for federal income tax purposes.
5. Fees and Other Transactions with Affiliates.
Management Fee. Fidelity Management & Research Company (the investment adviser) and its affiliates provide the Fund with investment management related services for which the Fund pays a monthly management fee that is based on an annual rate of .45% of average net assets. Under the management contract, the investment adviser or an affiliate pays all other expenses of the Fund, excluding fees and expenses of the independent Trustees, and certain miscellaneous expenses such as proxy and shareholder meeting expenses.
Brokerage Commissions. The Fund placed a portion of its portfolio transactions with brokerage firms which are affiliates of the investment adviser. Brokerage commissions are included in net realized gain (loss) and change in net unrealized appreciation (depreciation) in the Statement of Operations. The commissions paid to these affiliated firms were $10,199 for the period.
Interfund Lending Program. Pursuant to an Exemptive Order issued by the SEC, the Fund, along with other registered investment companies having management contracts with Fidelity Management & Research Company (FMR) or other affiliated entities of FMR, may participate in an interfund lending program. This program provides an alternative credit facility allowing the funds to borrow from, or lend money to, other participating affiliated funds. At period end, there were no interfund loans outstanding. The Fund's activity in this program during the period for which loans were outstanding was as follows:
| Borrower or Lender | Average Loan Balance | Weighted Average Interest Rate | Interest Expense |
| Borrower | $18,412,500 | 2.65% | $2,716 |
Interfund Trades. The Fund may purchase from or sell securities to other Fidelity Funds under procedures adopted by the Board. The procedures have been designed to ensure these interfund trades are executed in accordance with Rule 17a-7 of the 1940 Act. Interfund trades are included within the respective purchases and sales amounts shown in the Purchases and Sales of Investments note.
6. Committed Line of Credit.
The Fund participates with other funds managed by the investment adviser or an affiliate in a $4.25 billion credit facility (the "line of credit") to be utilized for temporary or emergency purposes to fund shareholder redemptions or for other short-term liquidity purposes. The Fund has agreed to pay commitment fees on its pro-rata portion of the line of credit, which amounted to $2,253 and is reflected in Commitment fees on the Statement of Operations. During the period, the Fund did not borrow on this line of credit.
7. Security Lending.
The Fund lends portfolio securities through a lending agent from time to time in order to earn additional income. For equity securities, a lending agent is used and may loan securities to certain qualified borrowers, including Fidelity Capital Markets (FCM), a broker-dealer affiliated with the Fund. On the settlement date of the loan, the Fund receives collateral (in the form of U.S. Treasury obligations, letters of credit and/or cash) against the loaned securities and maintains collateral in an amount not less than 100% of the market value of the loaned securities during the period of the loan. The market value of the loaned securities is determined at the close of business of the Fund and any additional required collateral is delivered to the Fund on the next business day. The Fund or borrower may terminate the loan at any time, and if the borrower defaults on its obligation to return the securities loaned because of insolvency or other reasons, the Fund may apply collateral received from the borrower against the obligation. The Fund may experience delays and costs in recovering the securities loaned. Any cash collateral received is invested in the Fidelity Securities Lending Cash Central Fund. The value of loaned securities and cash collateral at period end are disclosed on the Fund's Statement of Assets and Liabilities. The value of securities loaned to FCM at period end was $339,085. Security lending income represents the income earned on investing cash collateral, less rebates paid to borrowers and any lending agent fees associated with the loan, plus any premium payments received for lending certain types of securities. Security lending income is presented in the Statement of Operations as a component of income from Fidelity Central Funds. Total security lending income during the period amounted to $136,254, including $4,713 from securities loaned to FCM.
8. Expense Reductions.
Commissions paid to certain brokers with whom the investment adviser, or its affiliates, places trades on behalf of the Fund include an amount in addition to trade execution, which may be rebated back to the Fund to offset certain expenses. This amount totaled $13,261 for the period. In addition, through arrangements with the Fund's custodian, credits realized as a result of certain uninvested cash balances were used to reduce the Fund's expenses. During the period, these credits reduced the Fund's custody expenses by $1,594.
9. Other.
The Fund's organizational documents provide former and current trustees and officers with a limited indemnification against liabilities arising in connection with the performance of their duties to the Fund. In the normal course of business, the Fund may also enter into contracts that provide general indemnifications. The Fund's maximum exposure under these arrangements is unknown as this would be dependent on future claims that may be made against the Fund. The risk of material loss from such claims is considered remote.
Shareholder Expense Example
As a shareholder of the Fund, you incur two types of costs: (1) transaction costs and (2) ongoing costs, including management fees and other Fund expenses. This Example is intended to help you understand your ongoing costs (in dollars) of investing in the Fund and to compare these costs with the ongoing costs of investing in other mutual funds.
The Example is based on an investment of $1,000 invested at the beginning of the period and held for the entire period (August 1, 2018 to January 31, 2019).
Actual Expenses
The first line of the accompanying table provides information about actual account values and actual expenses. You may use the information in this line, together with the amount you invested, to estimate the expenses that you paid over the period. Simply divide your account value by $1,000.00 (for example, an $8,600 account value divided by $1,000.00 = 8.6), then multiply the result by the number in the first line under the heading entitled "Expenses Paid During Period" to estimate the expenses you paid on your account during this period. In addition, the Fund, as a shareholder in the underlying Fidelity Central Funds, will indirectly bear its pro-rata share of the fees and expenses incurred by the underlying Fidelity Central Funds. These fees and expenses are not included in the Fund's annualized expense ratio used to calculate the expense estimate in the table below.
Hypothetical Example for Comparison Purposes
The second line of the accompanying table provides information about hypothetical account values and hypothetical expenses based on the Fund's actual expense ratio and an assumed rate of return of 5% per year before expenses, which is not the Fund's actual return. The hypothetical account values and expenses may not be used to estimate the actual ending account balance or expenses you paid for the period. You may use this information to compare the ongoing costs of investing in the Fund and other funds. To do so, compare this 5% hypothetical example with the 5% hypothetical examples that appear in the shareholder reports of the other funds. In addition, the Fund, as a shareholder in the underlying Fidelity Central Funds, will indirectly bear its pro-rata share of the fees and expenses incurred by the underlying Fidelity Central Funds. These fees and expenses are not included in the Fund's annualized expense ratio used to calculate the expense estimate in the table below.
Please note that the expenses shown in the table are meant to highlight your ongoing costs only and do not reflect any transaction costs. Therefore, the second line of the table is useful in comparing ongoing costs only, and will not help you determine the relative total costs of owning different funds.
| | Annualized Expense Ratio-A | Beginning
Account Value
August 1, 2018 | Ending
Account Value
January 31, 2019 | Expenses Paid
During Period-B
August 1, 2018
to January 31, 2019 |
| Actual | .45% | $1,000.00 | $957.00 | $2.22 |
| Hypothetical-C | | $1,000.00 | $1,022.94 | $2.29 |
A Annualized expense ratio reflects expenses net of applicable fee waivers.
B Expenses are equal to the Fund's annualized expense ratio, multiplied by the average account value over the period, multiplied by 184/365 (to reflect the one-half year period).
C 5% return per year before expenses
Board Approval of Investment Advisory Contracts and Management Fees
Fidelity Blue Chip Growth K6 Fund
Each year, the Board of Trustees, including the Independent Trustees (together, the Board), votes on the renewal of the management contract with Fidelity Management & Research Company (FMR) and the sub-advisory agreements (together, the Advisory Contracts) for the fund. FMR and the sub-advisers are referred to herein as the Investment Advisers. The Board, assisted by the advice of fund counsel and Independent Trustees' counsel, requests and considers a broad range of information relevant to the renewal of the Advisory Contracts throughout the year.
The Board meets regularly and, at each of its meetings, covers an extensive agenda of topics and materials and considers factors that are relevant to its annual consideration of the renewal of the fund's Advisory Contracts, including the services and support provided to the fund and its shareholders. The Board has established various standing committees (Committees), each composed of and chaired by Independent Trustees with varying backgrounds, to which the Board has assigned specific subject matter responsibilities in order to enhance effective decision-making by the Board. The Board, acting directly and through its Committees, requests and receives information concerning the annual consideration of the renewal of the fund's Advisory Contracts. The Board also meets as needed to review matters specifically related to the Board's annual consideration of the renewal of the Advisory Contracts. Members of the Board may also meet with trustees of other Fidelity funds through joint ad hoc committees to discuss certain matters relevant to all of the Fidelity funds.
At its January 2019 meeting, the Board unanimously determined to renew the fund's Advisory Contracts. In reaching its determination, the Board considered all factors it believed relevant, including (i) the nature, extent, and quality of the services to be provided to the fund and its shareholders (including the investment performance of the fund); (ii) the competitiveness of the fund's management fee and total expense ratio relative to peer funds; (iii) the total costs of the services to be provided by and the profits to be realized by Fidelity from its relationships with the fund; and (iv) the extent to which, if any, economies of scale exist and would be realized as the fund grows, and whether any economies of scale are appropriately shared with fund shareholders.
In considering whether to renew the Advisory Contracts for the fund, the Board reached a determination, with the assistance of fund counsel and Independent Trustees' counsel and through the exercise of its business judgment, that the renewal of the Advisory Contracts was in the best interests of the fund and its shareholders and that the compensation payable under the Advisory Contracts was fair and reasonable. The Board's decision to renew the Advisory Contracts was not based on any single factor, but rather was based on a comprehensive consideration of all the information provided to the Board at its meetings throughout the year. The Board, in reaching its determination to renew the Advisory Contracts, was aware that shareholders of the fund have a broad range of investment choices available to them, including a wide choice among funds offered by Fidelity's competitors, and that the fund's shareholders, who have the opportunity to review and weigh the disclosure provided by the fund in its prospectus and other public disclosures, have chosen to invest in this fund, which is part of the Fidelity family of funds.
Nature, Extent, and Quality of Services Provided. The Board considered Fidelity's staffing as it relates to the fund, including the backgrounds of investment personnel of Fidelity, and also considered the fund's investment objective, strategies, and related investment philosophy. The Independent Trustees also had discussions with senior management of Fidelity's investment operations and investment groups. The Board considered the structure of the investment personnel compensation program and whether this structure provides appropriate incentives to act in the best interests of the fund. Additionally, the Board considered the portfolio managers' investments, if any, in the funds that they manage.
Resources Dedicated to Investment Management and Support Services. The Board and the Fund Oversight and Research Committees reviewed the general qualifications and capabilities of Fidelity's investment staff, including its size, education, experience, and resources, as well as Fidelity's approach to recruiting, training, managing, and compensating investment personnel. The Board noted that Fidelity has continued to increase the resources devoted to non-U.S. offices, including expansion of Fidelity's global investment organization. The Board also noted that Fidelity's analysts have extensive resources, tools and capabilities that allow them to conduct sophisticated quantitative and fundamental analysis, as well as credit analysis of issuers, counterparties and guarantors. Further, the Board considered that Fidelity's investment professionals have sufficient access to global information and data so as to provide competitive investment results over time, and that those professionals also have access to sophisticated tools that permit them to assess portfolio construction and risk and performance attribution characteristics continuously, as well as to transmit new information and research conclusions rapidly around the world. Additionally, in its deliberations, the Board considered Fidelity's trading, risk management, compliance, and technology and operations capabilities and resources, which are integral parts of the investment management process.
Shareholder and Administrative Services. The Board considered (i) the nature, extent, quality, and cost of advisory, administrative, and shareholder services performed by the Investment Advisers and their affiliates under the Advisory Contracts and under separate agreements covering transfer agency, pricing and bookkeeping, and securities lending services for the fund; (ii) the nature and extent of the supervision of third party service providers, principally custodians, subcustodians, and pricing vendors; and (iii) the resources devoted to, and the record of compliance with, the fund's compliance policies and procedures. The Board also reviewed the allocation of fund brokerage, including allocations to brokers affiliated with the Investment Advisers, the use of brokerage commissions to pay fund expenses, and the use of "soft" commission dollars to pay for research services.
The Board noted that the growth of fund assets over time across the complex allows Fidelity to reinvest in the development of services designed to enhance the value and convenience of the Fidelity funds as investment vehicles. These services include 24-hour access to account information and market information through telephone representatives and over the Internet, investor education materials and asset allocation tools, and the expanded availability of Fidelity Investor Centers.
The Board noted that it and the boards of certain other Fidelity funds had formed an ad hoc Committee on Transfer Agency Fees to review the variety of transfer agency fee structures throughout the industry and Fidelity's competitive positioning with respect to industry participants.
Investment in a Large Fund Family. The Board considered the benefits to shareholders of investing in a Fidelity fund, including the benefits of investing in a fund that is part of a large family of funds offering a variety of investment disciplines and providing a large variety of mutual fund investor services. The Board noted that Fidelity had taken, or had made recommendations that resulted in the Fidelity funds taking, a number of actions over the previous year that benefited particular funds, including: (i) continuing to dedicate additional resources to Fidelity's investment research process, which includes meetings with management of issuers of securities in which the funds invest, and to the support of the senior management team that oversees asset management; (ii) continuing efforts to enhance Fidelity's global research capabilities; (iii) launching new funds and making other enhancements to meet client needs; (iv) launching new share classes of existing funds; (v) eliminating purchase minimums and broadening eligibility requirements for certain funds and share classes; (vi) reducing management fees and total expenses for certain growth equity funds and index funds; (vii) lowering expense caps for certain existing funds and classes, and converting certain voluntary expense caps to contractual caps, to reduce expenses borne by shareholders; (viii) eliminating short-term redemption fees for funds that had such fees; (ix) rationalizing product lines and gaining increased efficiencies from fund mergers and share class consolidations; (x) continuing to develop, acquire and implement systems and technology to improve services to the funds and shareholders, strengthen information security, and increase efficiency; and (xi) continuing to implement enhancements to further strengthen Fidelity's product line to increase investors' probability of success in achieving their investment goals, including retirement income goals.
Investment Performance. The Board considered whether the fund has operated in accordance with its investment objective, as well as its record of compliance with its investment restrictions and its performance history.
The Board took into account discussions that occur at Board meetings throughout the year with representatives of the Investment Advisers about fund investment performance. In this regard the Board noted that as part of regularly scheduled fund reviews and other reports to the Board on fund performance, the Board considers annualized return information for the fund for different time periods, measured against an appropriate securities market index ("benchmark index") and a peer group of funds with similar objectives ("peer group"), if any. In its evaluation of fund investment performance, the Board gave particular attention to information indicating changes in performance of certain Fidelity funds for specific time periods and discussed with the Investment Advisers the reasons for any overperformance or underperformance.
In addition to reviewing absolute and relative fund performance, the Independent Trustees periodically consider the appropriateness of fund performance metrics in evaluating the results achieved. In general, the Independent Trustees believe that fund performance should be evaluated based on net performance (after fees and expenses) of both the highest performing and lowest performing fund share classes, where applicable, compared to appropriate benchmark indices, over appropriate time periods that may include full market cycles, and compared to peer groups, as applicable, over the same periods, taking into account relevant factors including the following: general market conditions; issuer-specific information; and fund cash flows and other factors.
The Independent Trustees recognize that shareholders evaluate performance on a net basis over their own holding periods, for which one-, three-, and five-year periods are often used as a proxy. For this reason, the performance information reviewed by the Board also included net total return information for the fund and an appropriate benchmark index and peer group for the most recent one-year period ended June 30, 2018, as shown below. Returns are shown compared to the 25th percentile (top of box, 75% beaten) and 75th percentile (bottom of box, 25% beaten) of the peer universe.
Fidelity Blue Chip Growth K6 Fund

Based on its review, the Board concluded that the nature, extent, and quality of services provided to the fund under the Advisory Contracts should continue to benefit the shareholders of the fund.
Competitiveness of Management Fee and Total Expense Ratio. The Board considered the fund's management fee and total expense ratio compared to "mapped groups" of competitive funds and classes created for the purpose of facilitating the Trustees' competitive analysis of management fees and total expenses. Fidelity creates "mapped groups" by combining similar Lipper investment objective categories that have comparable investment mandates. Combining Lipper investment objective categories aids the Board's management fee and total expense ratio comparisons by broadening the competitive group used for comparison.
Management Fee. The Board considered two proprietary management fee comparisons for the 12-month period ended June 30 shown in basis points (BP) in the chart below. The group of Lipper funds used by the Board for management fee comparisons is referred to below as the "Total Mapped Group." The Total Mapped Group comparison focuses on a fund's standing in terms of gross management fees before expense reimbursements or caps relative to the total universe of funds with comparable investment mandates, regardless of whether their management fee structures also are comparable. Funds with comparable investment mandates offer exposure to similar types of securities. Funds with comparable management fee structures have similar management fee contractual arrangements (
e.g., flat rate charged for advisory services, all-inclusive fee rate,
etc.). "TMG %" represents the percentage of funds in the Total Mapped Group that had management fees that were lower than the fund's. For example, a hypothetical TMG % of 20% would mean that 80% of the funds in the Total Mapped Group had higher, and 20% had lower, management fees than the fund. The fund's actual TMG % and the number of funds in the Total Mapped Group are in the chart below. The "Asset-Size Peer Group" (ASPG) comparison focuses on a fund's standing relative to a subset of non-Fidelity funds within the Total Mapped Group that are similar in size and management fee structure. For example, if a fund is in the first quartile of the ASPG, the fund's management fee ranks in the least expensive or lowest 25% of funds in the ASPG. The ASPG represents at least 15% of the funds in the Total Mapped Group with comparable asset size and management fee structures, subject to a minimum of 50 funds (or all funds in the Total Mapped Group if fewer than 50). Additional information, such as the ASPG quartile in which the fund's management fee rate ranked is also included in the chart and was considered by the Board.
Fidelity Blue Chip Growth K6 Fund

The Board noted that the fund's management fee rate ranked below the median of its Total Mapped Group and below the median of its ASPG for the 12-month period ended June 30, 2018.
The Board noted that it and the boards of other Fidelity funds formed an ad hoc Committee on Group Fee, which meets periodically, to conduct an in-depth review of the "group fee" component of the management fee of funds with such management fee structures. The Committee's focus included the mechanics of the group fee, the competitive landscape of group fee structures, Fidelity funds with no group fee component (such as the fund) and investment products not included in group fee assets. The Board also considered that, for funds subject to the group fee, FMR agreed to voluntarily waive fees over a specified period of time in amounts designed to account for assets converted from certain funds to certain collective investment trusts.
The Board also noted that, in 2013, the ad hoc Committee on Management Fees was formed to conduct an in-depth review of the management fee rates of Fidelity's active equity mutual funds. The Committee focused on the following areas: (i) standard fee structures; (ii) research consumption and trading evolution; (iii) management fee competitiveness/profitability by category; and (iv) factors that drive institutional pricing.
Based on its review, the Board concluded that the fund's management fee is fair and reasonable in light of the services that the fund receives and the other factors considered.
Total Expense Ratio. In its review of the fund's total expense ratio, the Board considered the fund's unitary fee rate as well as other fund expenses paid by FMR under the fund's management contract, such as transfer agent fees, pricing and bookkeeping fees, and custodial, legal, and audit fees. The Board also noted that Fidelity may agree to waive fees and expenses from time to time, and the extent to which, if any, it has done so for the fund. As part of its review, the Board also considered the current total expense ratio of the fund compared to competitive fund median expenses. The fund is compared to those funds in the Total Mapped Group (used by the Board for management fee comparisons) that have a similar sales load structure.
In connection with the renewal of the Advisory Contracts, the Board also approved amendments to the management contract for the fund to clarify that the fund pays its non-operating expenses, including brokerage commissions and fees and expenses associated with the fund's securities lending program. The Board considered that the amendments would not change the services provided to the fund or the party responsible for making such payments under the current management contract.
The Board noted that the fund's total expense ratio ranked below the competitive median for the 12-month period ended June 30, 2018.
Fees Charged to Other Fidelity Clients. The Board also considered Fidelity fee structures and other information with respect to clients of Fidelity, such as other funds advised or subadvised by Fidelity, pension plan clients, and other institutional clients with similar mandates. The Board noted that a joint ad hoc committee created by it and the boards of other Fidelity funds periodically reviews and compares Fidelity's institutional investment advisory business with its business of providing services to the Fidelity funds and also noted the most recent findings of the committee. The Board noted that the committee's review included a consideration of the differences in services provided, fees charged, and costs incurred, as well as competition in the markets serving the different categories of clients.
Based on its review of total expense ratios and fees charged to other Fidelity clients, the Board concluded that the fund's total expense ratio was reasonable in light of the services that the fund and its shareholders receive and the other factors considered.
Costs of the Services and Profitability. The Board considered the revenues earned and the expenses incurred by Fidelity in conducting the business of developing, marketing, distributing, managing, administering and servicing the fund and servicing the fund's shareholders. The Board also considered the level of Fidelity's profits in respect of all the Fidelity funds.
On an annual basis, Fidelity presents to the Board information about the profitability of its relationships with the fund. Fidelity calculates profitability information for each fund, as well as aggregate profitability information for groups of Fidelity funds and all Fidelity funds, using a series of detailed revenue and cost allocation methodologies which originate with the books and records of Fidelity on which Fidelity's audited financial statements are based. The Audit Committee of the Board reviews any significant changes from the prior year's methodologies.
PricewaterhouseCoopers LLP (PwC), auditor to Fidelity and certain Fidelity funds, has been engaged annually by the Board as part of the Board's assessment of Fidelity's profitability analysis. PwC's engagement includes the review and assessment of the methodologies used by Fidelity in determining the revenues and expenses attributable to Fidelity's mutual fund business, and completion of agreed-upon procedures in respect of the mathematical accuracy of the fund profitability information and its conformity to established allocation methodologies. After considering PwC's reports issued under the engagement and information provided by Fidelity, the Board concluded that while other allocation methods may also be reasonable, Fidelity's profitability methodologies are reasonable in all material respects.
The Board also reviewed Fidelity's non-fund businesses and potential indirect benefits such businesses may have received as a result of their association with Fidelity's mutual fund business (i.e., fall-out benefits) as well as cases where Fidelity's affiliates may benefit from the fund's business. The Board noted that changes to fall-out benefits year-over-year reflect business developments at Fidelity's various businesses.
The Board considered the costs of the services provided by and the profits realized by Fidelity in connection with the operation of the fund and was satisfied that the profitability was not excessive.
Economies of Scale. The Board considered whether there have been economies of scale in respect of the management of the Fidelity funds, whether the Fidelity funds (including the fund) have appropriately benefited from any such economies of scale, and whether there is potential for realization of any further economies of scale. The Board considered the extent to which the fund will benefit from economies of scale as assets grow through increased services to the fund, through waivers or reimbursements, or through fee or expense ratio reductions. The Board recognized that, due to the fund's current contractual arrangements, its expense ratio will not decline if the fund's operating costs decrease as assets grow, or rise as assets decrease. The Board also noted that a committee (the Economies of Scale Committee) created by it and the boards of other Fidelity funds periodically analyzes whether Fidelity attains economies of scale in respect of the management and servicing of the Fidelity funds, whether the Fidelity funds have appropriately benefited from such economies of scale, and whether there is potential for realization of any further economies of scale.
The Board concluded, taking into account the analysis of the Economies of Scale Committee, that economies of scale, if any, are being appropriately shared between fund shareholders and Fidelity.
Additional Information Requested by the Board. In order to develop fully the factual basis for consideration of the Fidelity funds' advisory contracts, the Board requested and received additional information on certain topics, including: (i) fund performance trends, in particular the underperformance of certain funds, and Fidelity's long-term strategies for certain funds; (ii) Fidelity's fund profitability methodology, profitability trends for certain funds, and the impact of certain factors on fund profitability results; (iii) metrics for evaluating index fund and ETF performance and information about ETF trading characteristics; (iv) the methodology with respect to the evaluation of competitive fund data and peer group classifications and fee comparisons; (v) the expense structures for different funds and classes; (vi) information regarding other accounts managed by Fidelity, including collective investment trusts; and (vii) Fidelity's philosophies and strategies for evaluating funds and classes with lower or declining asset levels.
Based on its evaluation of all of the conclusions noted above, and after considering all factors it believed relevant, the Board concluded that the advisory fee arrangements are fair and reasonable, and that the fund's Advisory Contracts should be renewed.
BCFK6-SANN-0319
1.9884006.101
Fidelity® Blue Chip Value Fund
Semi-Annual Report January 31, 2019 |
|
Beginning on January 1, 2021, as permitted by regulations adopted by the Securities and Exchange Commission, paper copies of a fund’s shareholder reports will no longer be sent by mail, unless you specifically request paper copies of the reports from the fund or from your financial intermediary, such as a financial advisor, broker-dealer or bank. Instead, the reports will be made available on a website, and you will be notified by mail each time a report is posted and provided with a website link to access the report.
If you already elected to receive shareholder reports electronically, you will not be affected by this change and you need not take any action. You may elect to receive shareholder reports and other communications from a fund electronically, by contacting your financial intermediary. For Fidelity customers, visit Fidelity's web site or call Fidelity using the contact information listed below.
You may elect to receive all future reports in paper free of charge. If you wish to continue receiving paper copies of your shareholder reports, you may contact your financial intermediary or, if you are a Fidelity customer, visit Fidelity’s website, or call Fidelity at the applicable toll-free number listed below. Your election to receive reports in paper will apply to all funds held with the fund complex/your financial intermediary.
| Account Type | Website | Phone Number |
| Brokerage, Mutual Fund, or Annuity Contracts: | fidelity.com/mailpreferences | 1-800-343-3548 |
| Employer Provided Retirement Accounts: | netbenefits.fidelity.com/preferences (choose 'no' under Required Disclosures to continue to print) | 1-800-343-0860 |
| Advisor Sold Accounts Serviced Through Your Financial Intermediary: | Contact Your Financial Intermediary | Your Financial Intermediary's phone number |
| Advisor Sold Accounts Serviced by Fidelity: | institutional.fidelity.com | 1-877-208-0098 |
Contents
To view a fund's proxy voting guidelines and proxy voting record for the 12-month period ended June 30, visit http://www.fidelity.com/proxyvotingresults or visit the Securities and Exchange Commission's (SEC) web site at http://www.sec.gov.
You may also call 1-800-544-8544 to request a free copy of the proxy voting guidelines.
Standard & Poor's, S&P and S&P 500 are registered service marks of The McGraw-Hill Companies, Inc. and have been licensed for use by Fidelity Distributors Corporation.
Other third-party marks appearing herein are the property of their respective owners.
All other marks appearing herein are registered or unregistered trademarks or service marks of FMR LLC or an affiliated company. © 2019 FMR LLC. All rights reserved.
This report and the financial statements contained herein are submitted for the general information of the shareholders of the Fund. This report is not authorized for distribution to prospective investors in the Fund unless preceded or accompanied by an effective prospectus.
A fund files its complete schedule of portfolio holdings with the SEC for the first and third quarters of each fiscal year on Form N-Q. Forms N-Q are available on the SEC’s web site at http://www.sec.gov. A fund's Forms N-Q may be reviewed and copied at the SEC’s Public Reference Room in Washington, DC. Information regarding the operation of the SEC's Public Reference Room may be obtained by calling 1-800-SEC-0330.
For a complete list of a fund's portfolio holdings, view the most recent holdings listing, semiannual report, or annual report on Fidelity's web site at http://www.fidelity.com, http://www.institutional.fidelity.com, or http://www.401k.com, as applicable.
NOT FDIC INSURED •MAY LOSE VALUE •NO BANK GUARANTEE
Neither the Fund nor Fidelity Distributors Corporation is a bank.
Investment Summary (Unaudited)
Top Ten Stocks as of January 31, 2019
| | % of fund's net assets |
| Berkshire Hathaway, Inc. Class B | 4.9 |
| Comcast Corp. Class A | 4.7 |
| Cigna Corp. | 4.6 |
| CVS Health Corp. | 4.2 |
| Amgen, Inc. | 4.2 |
| Exxon Mobil Corp. | 3.7 |
| Wells Fargo & Co. | 3.3 |
| Twenty-First Century Fox, Inc. Class A | 3.2 |
| The Walt Disney Co. | 3.0 |
| CBRE Group, Inc. | 2.8 |
| | 38.6 |
Top Five Market Sectors as of January 31, 2019
| | % of fund's net assets |
| Financials | 24.5 |
| Health Care | 22.4 |
| Communication Services | 13.7 |
| Energy | 9.2 |
| Consumer Staples | 7.2 |
Asset Allocation (% of fund's net assets)
| As of January 31, 2019* |
| | Stocks and Equity Futures | 98.7% |
| | Short-Term Investments and Net Other Assets (Liabilities) | 1.3% |

* Foreign investments - 17.1%
Schedule of Investments January 31, 2019 (Unaudited)
Showing Percentage of Net Assets
| Common Stocks - 94.4% | | | |
| | | Shares | Value |
| COMMUNICATION SERVICES - 13.7% | | | |
| Entertainment - 6.2% | | | |
| The Walt Disney Co. | | 130,200 | $14,519,904 |
| Twenty-First Century Fox, Inc. Class A | | 309,400 | 15,256,514 |
| | | | 29,776,418 |
| Interactive Media & Services - 1.8% | | | |
| Alphabet, Inc. Class A (a) | | 7,700 | 8,669,353 |
| Media - 5.7% | | | |
| Comcast Corp. Class A | | 612,300 | 22,391,811 |
| Interpublic Group of Companies, Inc. | | 206,000 | 4,686,500 |
| | | | 27,078,311 |
|
| TOTAL COMMUNICATION SERVICES | | | 65,524,082 |
|
| CONSUMER DISCRETIONARY - 3.3% | | | |
| Multiline Retail - 1.7% | | | |
| Dollar General Corp. | | 69,600 | 8,033,928 |
| Textiles, Apparel & Luxury Goods - 1.6% | | | |
| PVH Corp. | | 72,200 | 7,877,742 |
|
| TOTAL CONSUMER DISCRETIONARY | | | 15,911,670 |
|
| CONSUMER STAPLES - 7.2% | | | |
| Beverages - 1.9% | | | |
| C&C Group PLC | | 2,411,612 | 9,109,093 |
| Food Products - 5.3% | | | |
| Danone SA | | 110,500 | 8,041,284 |
| The Hershey Co. | | 81,000 | 8,594,100 |
| The J.M. Smucker Co. | | 82,500 | 8,652,600 |
| | | | 25,287,984 |
|
| TOTAL CONSUMER STAPLES | | | 34,397,077 |
|
| ENERGY - 9.2% | | | |
| Energy Equipment & Services - 1.4% | | | |
| Baker Hughes, a GE Co. Class A | | 293,100 | 6,908,367 |
| Oil, Gas & Consumable Fuels - 7.8% | | | |
| Exxon Mobil Corp. | | 240,700 | 17,638,496 |
| GasLog Partners LP | | 296,200 | 6,720,778 |
| Golar LNG Partners LP | | 485,900 | 6,511,060 |
| Teekay LNG Partners LP | | 512,900 | 6,595,894 |
| | | | 37,466,228 |
|
| TOTAL ENERGY | | | 44,374,595 |
|
| FINANCIALS - 24.5% | | | |
| Banks - 5.6% | | | |
| U.S. Bancorp | | 216,797 | 11,091,335 |
| Wells Fargo & Co. | | 325,798 | 15,934,780 |
| | | | 27,026,115 |
| Capital Markets - 2.6% | | | |
| Goldman Sachs Group, Inc. | | 62,000 | 12,276,620 |
| Diversified Financial Services - 4.9% | | | |
| Berkshire Hathaway, Inc. Class B (a) | | 114,900 | 23,616,545 |
| Insurance - 6.2% | | | |
| Chubb Ltd. | | 90,400 | 12,027,720 |
| Prudential PLC | | 305,998 | 5,984,146 |
| The Travelers Companies, Inc. | | 91,700 | 11,512,018 |
| | | | 29,523,884 |
| Mortgage Real Estate Investment Trusts - 5.2% | | | |
| AGNC Investment Corp. | | 498,900 | 8,935,299 |
| Annaly Capital Management, Inc. | | 943,100 | 9,845,964 |
| MFA Financial, Inc. | | 856,200 | 6,275,946 |
| | | | 25,057,209 |
|
| TOTAL FINANCIALS | | | 117,500,373 |
|
| HEALTH CARE - 22.4% | | | |
| Biotechnology - 5.4% | | | |
| Amgen, Inc. | | 107,100 | 20,039,481 |
| Celgene Corp. (a) | | 64,900 | 5,741,054 |
| | | | 25,780,535 |
| Health Care Providers & Services - 11.6% | | | |
| Anthem, Inc. | | 43,700 | 13,241,100 |
| Cigna Corp. | | 111,300 | 22,238,853 |
| CVS Health Corp. | | 309,700 | 20,300,835 |
| | | | 55,780,788 |
| Pharmaceuticals - 5.4% | | | |
| Bayer AG | | 44,942 | 3,406,417 |
| Bristol-Myers Squibb Co. | | 118,800 | 5,865,156 |
| Roche Holding AG (participation certificate) | | 40,790 | 10,851,598 |
| Takeda Pharmaceutical Co. Ltd. ADR | | 291,307 | 5,817,401 |
| | | | 25,940,572 |
|
| TOTAL HEALTH CARE | | | 107,501,895 |
|
| INDUSTRIALS - 3.7% | | | |
| Aerospace & Defense - 1.2% | | | |
| United Technologies Corp. | | 51,100 | 6,033,377 |
| Air Freight & Logistics - 2.5% | | | |
| C.H. Robinson Worldwide, Inc. | | 137,400 | 11,922,198 |
|
| TOTAL INDUSTRIALS | | | 17,955,575 |
|
| INFORMATION TECHNOLOGY - 4.2% | | | |
| IT Services - 4.2% | | | |
| Amdocs Ltd. | | 103,000 | 5,755,640 |
| Cognizant Technology Solutions Corp. Class A | | 135,700 | 9,455,576 |
| The Western Union Co. | | 264,300 | 4,823,475 |
| | | | 20,034,691 |
| MATERIALS - 0.2% | | | |
| Chemicals - 0.2% | | | |
| LyondellBasell Industries NV Class A | | 11,500 | 1,000,155 |
| REAL ESTATE - 4.2% | | | |
| Equity Real Estate Investment Trusts (REITs) - 1.4% | | | |
| Simon Property Group, Inc. | | 36,400 | 6,629,168 |
| Real Estate Management & Development - 2.8% | | | |
| CBRE Group, Inc. (a) | | 291,900 | 13,354,425 |
|
| TOTAL REAL ESTATE | | | 19,983,593 |
|
| UTILITIES - 1.8% | | | |
| Electric Utilities - 1.8% | | | |
| Exelon Corp. | | 180,200 | 8,606,352 |
| TOTAL COMMON STOCKS | | | |
| (Cost $441,807,731) | | | 452,790,058 |
|
| Money Market Funds - 5.1% | | | |
| Fidelity Cash Central Fund, 2.43% (b) | | | |
| (Cost $24,466,004) | | 24,461,216 | 24,466,109 |
| TOTAL INVESTMENT IN SECURITIES - 99.5% | | | |
| (Cost $466,273,735) | | | 477,256,167 |
| NET OTHER ASSETS (LIABILITIES) - 0.5% | | | 2,250,507 |
| NET ASSETS - 100% | | | $479,506,674 |
| Futures Contracts | | | | | |
| | Number of contracts | Expiration Date | Notional Amount | Value | Unrealized Appreciation/(Depreciation) |
| Purchased | | | | | |
| Equity Index Contracts | | | | | |
| CME E-mini Russell 1000 Value Index Contracts (United States) | 352 | March 2019 | $20,709,920 | $1,250,563 | $1,250,563 |
The notional amount of futures purchased as a percentage of Net Assets is 4.3%
Legend
(a) Non-income producing
(b) Affiliated fund that is generally available only to investment companies and other accounts managed by Fidelity Investments. The rate quoted is the annualized seven-day yield of the fund at period end. A complete unaudited listing of the fund's holdings as of its most recent quarter end is available upon request. In addition, each Fidelity Central Fund's financial statements are available on the SEC's website or upon request.
Affiliated Central Funds
Information regarding fiscal year to date income earned by the Fund from investments in Fidelity Central Funds is as follows:
| Fund | Income earned |
| Fidelity Cash Central Fund | $233,060 |
| Fidelity Securities Lending Cash Central Fund | 4,160 |
| Total | $237,220 |
Amounts in the income column in the above table include any capital gain distributions from underlying funds, which are presented in the corresponding line-item in the Statement of Operations, if applicable.
Investment Valuation
The following is a summary of the inputs used, as of January 31, 2019, involving the Fund's assets and liabilities carried at fair value. The inputs or methodology used for valuing securities may not be an indication of the risk associated with investing in those securities. For more information on valuation inputs, and their aggregation into the levels used below, please refer to the Investment Valuation section in the accompanying Notes to Financial Statements.
| | Valuation Inputs at Reporting Date: |
| Description | Total | Level 1 | Level 2 | Level 3 |
| Investments in Securities: | | | | |
| Equities: | | | | |
| Communication Services | $65,524,082 | $65,524,082 | $-- | $-- |
| Consumer Discretionary | 15,911,670 | 15,911,670 | -- | -- |
| Consumer Staples | 34,397,077 | 26,355,793 | 8,041,284 | -- |
| Energy | 44,374,595 | 44,374,595 | -- | -- |
| Financials | 117,500,373 | 111,516,227 | 5,984,146 | -- |
| Health Care | 107,501,895 | 93,243,880 | 14,258,015 | -- |
| Industrials | 17,955,575 | 17,955,575 | -- | -- |
| Information Technology | 20,034,691 | 20,034,691 | -- | -- |
| Materials | 1,000,155 | 1,000,155 | -- | -- |
| Real Estate | 19,983,593 | 19,983,593 | -- | -- |
| Utilities | 8,606,352 | 8,606,352 | -- | -- |
| Money Market Funds | 24,466,109 | 24,466,109 | -- | -- |
| Total Investments in Securities: | $477,256,167 | $448,972,722 | $28,283,445 | $-- |
| Derivative Instruments: | | | | |
| Assets | | | | |
| Futures Contracts | $1,250,563 | $1,250,563 | $-- | $-- |
| Total Assets | $1,250,563 | $1,250,563 | $-- | $-- |
| Total Derivative Instruments: | $1,250,563 | $1,250,563 | $-- | $-- |
Value of Derivative Instruments
The following table is a summary of the Fund's value of derivative instruments by primary risk exposure as of January 31, 2019. For additional information on derivative instruments, please refer to the Derivative Instruments section in the accompanying Notes to Financial Statements.
| Primary Risk Exposure / Derivative Type | Value |
| | Asset | Liability |
| Equity Risk | | |
| Futures Contracts(a) | $1,250,563 | $0 |
| Total Equity Risk | 1,250,563 | 0 |
| Total Value of Derivatives | $1,250,563 | $0 |
(a) Reflects gross cumulative appreciation (depreciation) on futures contracts as presented in the Schedule of Investments. In the Statement of Assets and Liabilities, the period end daily variation margin is included in receivable or payable for daily variation margin on futures contracts, and the net cumulative appreciation (depreciation) is included in net unrealized appreciation (depreciation).
Other Information
Distribution of investments by country or territory of incorporation, as a percentage of Total Net Assets, is as follows (Unaudited):
| United States of America | 82.9% |
| Switzerland | 4.8% |
| Marshall Islands | 4.1% |
| Ireland | 1.9% |
| France | 1.7% |
| United Kingdom | 1.3% |
| Japan | 1.2% |
| Bailiwick of Guernsey | 1.2% |
| Others (Individually Less Than 1%) | 0.9% |
| | 100.0% |
See accompanying notes which are an integral part of the financial statements.
Financial Statements
Statement of Assets and Liabilities
| | | January 31, 2019 (Unaudited) |
| Assets | | |
Investment in securities, at value — See accompanying schedule:
Unaffiliated issuers (cost $441,807,731) | $452,790,058 | |
| Fidelity Central Funds (cost $24,466,004) | 24,466,109 | |
| Total Investment in Securities (cost $466,273,735) | | $477,256,167 |
| Segregated cash with brokers for derivative instruments | | 799,200 |
| Cash | | 407,222 |
| Receivable for investments sold | | 1,194,817 |
| Receivable for fund shares sold | | 554,976 |
| Dividends receivable | | 633,112 |
| Distributions receivable from Fidelity Central Funds | | 52,071 |
| Receivable for daily variation margin on futures contracts | | 149,478 |
| Prepaid expenses | | 456 |
| Other receivables | | 9,790 |
| Total assets | | 481,057,289 |
| Liabilities | | |
| Payable for investments purchased | $498,238 | |
| Payable for fund shares redeemed | 788,682 | |
| Accrued management fee | 149,012 | |
| Other affiliated payables | 82,900 | |
| Other payables and accrued expenses | 31,783 | |
| Total liabilities | | 1,550,615 |
| Net Assets | | $479,506,674 |
| Net Assets consist of: | | |
| Paid in capital | | $478,673,572 |
| Total distributable earnings (loss) | | 833,102 |
| Net Assets, for 25,586,716 shares outstanding | | $479,506,674 |
| Net Asset Value, offering price and redemption price per share ($479,506,674 ÷ 25,586,716 shares) | | $18.74 |
See accompanying notes which are an integral part of the financial statements.
Statement of Operations
| | | Six months ended January 31, 2019 (Unaudited) |
| Investment Income | | |
| Dividends | | $4,050,721 |
| Income from Fidelity Central Funds | | 237,220 |
| Total income | | 4,287,941 |
| Expenses | | |
| Management fee | | |
| Basic fee | $1,095,765 | |
| Performance adjustment | (325,825) | |
| Transfer agent fees | 379,170 | |
| Accounting and security lending fees | 79,025 | |
| Custodian fees and expenses | 5,878 | |
| Independent trustees' fees and expenses | 1,259 | |
| Registration fees | 22,293 | |
| Audit | 33,566 | |
| Legal | 1,976 | |
| Miscellaneous | 1,158 | |
| Total expenses before reductions | 1,294,265 | |
| Expense reductions | (20,846) | |
| Total expenses after reductions | | 1,273,419 |
| Net investment income (loss) | | 3,014,522 |
| Realized and Unrealized Gain (Loss) | | |
| Net realized gain (loss) on: | | |
| Investment securities: | | |
| Unaffiliated issuers | (8,000,318) | |
| Fidelity Central Funds | 2,087 | |
| Foreign currency transactions | 7,967 | |
| Futures contracts | 193,777 | |
| Total net realized gain (loss) | | (7,796,487) |
| Change in net unrealized appreciation (depreciation) on: | | |
| Investment securities: | | |
| Unaffiliated issuers | (7,677,259) | |
| Fidelity Central Funds | 297 | |
| Assets and liabilities in foreign currencies | (422) | |
| Futures contracts | 1,011,530 | |
| Total change in net unrealized appreciation (depreciation) | | (6,665,854) |
| Net gain (loss) | | (14,462,341) |
| Net increase (decrease) in net assets resulting from operations | | $(11,447,819) |
See accompanying notes which are an integral part of the financial statements.
Statement of Changes in Net Assets
| | Six months ended January 31, 2019 (Unaudited) | Year ended July 31, 2018 |
| Increase (Decrease) in Net Assets | | |
| Operations | �� | |
| Net investment income (loss) | $3,014,522 | $5,320,621 |
| Net realized gain (loss) | (7,796,487) | 54,723,253 |
| Change in net unrealized appreciation (depreciation) | (6,665,854) | (34,732,263) |
| Net increase (decrease) in net assets resulting from operations | (11,447,819) | 25,311,611 |
| Distributions to shareholders | (7,544,166) | – |
| Distributions to shareholders from net investment income | – | (4,465,976) |
| Distributions to shareholders from net realized gain | – | (81,343) |
| Total distributions | (7,544,166) | (4,547,319) |
| Share transactions | | |
| Proceeds from sales of shares | 169,632,916 | 65,621,638 |
| Reinvestment of distributions | 6,832,544 | 4,381,389 |
| Cost of shares redeemed | (71,470,293) | (109,494,133) |
| Net increase (decrease) in net assets resulting from share transactions | 104,995,167 | (39,491,106) |
| Total increase (decrease) in net assets | 86,003,182 | (18,726,814) |
| Net Assets | | |
| Beginning of period | 393,503,492 | 412,230,306 |
| End of period | $479,506,674 | $393,503,492 |
| Other Information | | |
| Undistributed net investment income end of period | | $1,761,720 |
| Shares | | |
| Sold | 9,293,193 | 3,406,839 |
| Issued in reinvestment of distributions | 358,609 | 233,439 |
| Redeemed | (3,843,095) | (5,729,568) |
| Net increase (decrease) | 5,808,707 | (2,089,290) |
See accompanying notes which are an integral part of the financial statements.
Financial Highlights
Fidelity Blue Chip Value Fund
| | Six months ended (Unaudited) January 31, | Years endedJuly 31, | | | | |
| | 2019 | 2018 | 2017 | 2016 | 2015 | 2014 |
| Selected Per–Share Data | | | | | | |
| Net asset value, beginning of period | $19.90 | $18.85 | $16.19 | $16.88 | $15.22 | $13.32 |
| Income from Investment Operations | | | | | | |
| Net investment income (loss)A | .14 | .26 | .18 | .19 | .35B | .18 |
| Net realized and unrealized gain (loss) | (.93) | 1.01 | 2.66 | (.59) | 1.54 | 1.81 |
| Total from investment operations | (.79) | 1.27 | 2.84 | (.40) | 1.89 | 1.99 |
| Distributions from net investment income | (.29) | (.21) | (.18) | (.28) | (.23) | (.09) |
| Distributions from net realized gain | (.09) | –C | – | (.01) | – | – |
| Total distributions | (.37)D | (.22)E | (.18) | (.29) | (.23) | (.09) |
| Net asset value, end of period | $18.74 | $19.90 | $18.85 | $16.19 | $16.88 | $15.22 |
| Total ReturnF,G | (3.98)% | 6.79% | 17.68% | (2.31)% | 12.52% | 14.99% |
| Ratios to Average Net AssetsH,I | | | | | | |
| Expenses before reductions | .64%J | .70% | .79% | .88% | .82% | .66% |
| Expenses net of fee waivers, if any | .64%J | .70% | .79% | .88% | .82% | .66% |
| Expenses net of all reductions | .63%J | .70% | .78% | .88% | .82% | .66% |
| Net investment income (loss) | 1.49%J | 1.34% | 1.04% | 1.23% | 2.15%B | 1.28% |
| Supplemental Data | | | | | | |
| Net assets, end of period (000 omitted) | $479,507 | $393,503 | $412,230 | $457,177 | $410,968 | $329,826 |
| Portfolio turnover rateK | 51%J | 45% | 32% | 54% | 138% | 102%L |
A Calculated based on average shares outstanding during the period.
B Net investment income per share reflects a large, non-recurring dividend which amounted to $.13 per share. Excluding this non-recurring dividend, the ratio of net investment income (loss) to average net assets would have been 1.35%.
C Amount represents less than $.005 per share.
D Total distributions of $.37 per share is comprised of distributions from net investment income of $.285 and distributions from net realized gain of $.087 per share.
E Total distributions of $.22 per share is comprised of distributions from net investment income of $.213 and distributions from net realized gain of $.004 per share.
F Total returns for periods of less than one year are not annualized.
G Total returns would have been lower if certain expenses had not been reduced during the applicable periods shown.
H Fees and expenses of any underlying Fidelity Central Funds are not included in the Fund's expense ratio. The Fund indirectly bears its proportionate share of the expenses of any underlying Fidelity Central Funds.
I Expense ratios reflect operating expenses of the Fund. Expenses before reductions do not reflect amounts reimbursed by the investment adviser or reductions from brokerage service arrangements or reductions from other expense offset arrangements and do not represent the amount paid by the Fund during periods when reimbursements or reductions occur. Expenses net of fee waivers reflect expenses after reimbursement by the investment adviser but prior to reductions from brokerage service arrangements or other expense offset arrangements. Expenses net of all reductions represent the net expenses paid by the Fund.
J Annualized
K Amount does not include the portfolio activity of any underlying Fidelity Central Funds.
L Portfolio turnover rate excludes securities received or delivered in-kind.
See accompanying notes which are an integral part of the financial statements.
Notes to Financial Statements (Unaudited)
For the period ended January 31, 2019
1. Organization.
Fidelity Blue Chip Value Fund (the Fund) is a fund of Fidelity Securities Fund (the Trust) and is authorized to issue an unlimited number of shares. Share transactions on the Statement of Changes in Net Assets may contain exchanges between affiliated funds. The Trust is registered under the Investment Company Act of 1940, as amended (the 1940 Act), as an open-end management investment company organized as a Massachusetts business trust.
2. Investments in Fidelity Central Funds.
The Fund invests in Fidelity Central Funds, which are open-end investment companies generally available only to other investment companies and accounts managed by the investment adviser and its affiliates. The Fund's Schedule of Investments lists each of the Fidelity Central Funds held as of period end, if any, as an investment of the Fund, but does not include the underlying holdings of each Fidelity Central Fund. As an Investing Fund, the Fund indirectly bears its proportionate share of the expenses of the underlying Fidelity Central Funds.
The Money Market Central Funds seek preservation of capital and current income and are managed by Fidelity Investments Money Management, Inc. (FIMM), an affiliate of the investment adviser. Annualized expenses of the Money Market Central Funds as of their most recent shareholder report date are less than .005%.
A complete unaudited list of holdings for each Fidelity Central Fund is available upon request or at the Securities and Exchange Commission (the SEC) website at www.sec.gov. In addition, the financial statements of the Fidelity Central Funds are available on the SEC website or upon request.
3. Significant Accounting Policies.
The Fund is an investment company and applies the accounting and reporting guidance of the Financial Accounting Standards Board (FASB) Accounting Standards Codification Topic 946 Financial Services – Investments Companies. The financial statements have been prepared in conformity with accounting principles generally accepted in the United States of America (GAAP), which require management to make certain estimates and assumptions at the date of the financial statements. Actual results could differ from those estimates. Subsequent events, if any, through the date that the financial statements were issued have been evaluated in the preparation of the financial statements. The following summarizes the significant accounting policies of the Fund:
Investment Valuation. Investments are valued as of 4:00 p.m. Eastern time on the last calendar day of the period. The Board of Trustees (the Board) has delegated the day to day responsibility for the valuation of the Fund's investments to the Fair Value Committee (the Committee) established by the Fund's investment adviser. In accordance with valuation policies and procedures approved by the Board, the Fund attempts to obtain prices from one or more third party pricing vendors or brokers to value its investments. When current market prices, quotations or currency exchange rates are not readily available or reliable, investments will be fair valued in good faith by the Committee, in accordance with procedures adopted by the Board. Factors used in determining fair value vary by investment type and may include market or investment specific events. The frequency with which these procedures are used cannot be predicted and they may be utilized to a significant extent. The Committee oversees the Fund's valuation policies and procedures and reports to the Board on the Committee's activities and fair value determinations. The Board monitors the appropriateness of the procedures used in valuing the Fund's investments and ratifies the fair value determinations of the Committee.
The Fund categorizes the inputs to valuation techniques used to value its investments into a disclosure hierarchy consisting of three levels as shown below:
- Level 1 – quoted prices in active markets for identical investments
- Level 2 – other significant observable inputs (including quoted prices for similar investments, interest rates, prepayment speeds, etc.)
- Level 3 – unobservable inputs (including the Fund's own assumptions based on the best information available)
Valuation techniques used to value the Fund's investments by major category are as follows:
Equity securities, including restricted securities, for which market quotations are readily available, are valued at the last reported sale price or official closing price as reported by a third party pricing vendor on the primary market or exchange on which they are traded and are categorized as Level 1 in the hierarchy. In the event there were no sales during the day or closing prices are not available, securities are valued at the last quoted bid price or may be valued using the last available price and are generally categorized as Level 2 in the hierarchy. For foreign equity securities, when market or security specific events arise, comparisons to the valuation of American Depositary Receipts (ADRs), futures contracts, Exchange-Traded Funds (ETFs) and certain indexes as well as quoted prices for similar securities may be used and would be categorized as Level 2 in the hierarchy. For equity securities, including restricted securities, where observable inputs are limited, assumptions about market activity and risk are used and these securities may be categorized as Level 3 in the hierarchy.
Futures contracts are valued at the settlement price established each day by the board of trade or exchange on which they are traded and are categorized as Level 1 in the hierarchy. Investments in open-end mutual funds, including the Fidelity Central Funds, are valued at their closing net asset value (NAV) each business day and are categorized as Level 1 in the hierarchy.
Changes in valuation techniques may result in transfers in or out of an assigned level within the disclosure hierarchy. The aggregate value of investments by input level as of January 31, 2019 is included at the end of the Fund's Schedule of Investments.
Foreign Currency. The Fund may use foreign currency contracts to facilitate transactions in foreign-denominated securities. Gains and losses from these transactions may arise from changes in the value of the foreign currency or if the counterparties do not perform under the contracts' terms.
Foreign-denominated assets, including investment securities, and liabilities are translated into U.S. dollars at the exchange rates at period end. Purchases and sales of investment securities, income and dividends received and expenses denominated in foreign currencies are translated into U.S. dollars at the exchange rate in effect on the transaction date.
The effects of exchange rate fluctuations on investments are included with the net realized and unrealized gain (loss) on investment securities. Other foreign currency transactions resulting in realized and unrealized gain (loss) are disclosed separately.
Investment Transactions and Income. For financial reporting purposes, the Fund's investment holdings and NAV include trades executed through the end of the last business day of the period. The NAV per share for processing shareholder transactions is calculated as of the close of business of the New York Stock Exchange (NYSE), normally 4:00 p.m. Eastern time and includes trades executed through the end of the prior business day. Gains and losses on securities sold are determined on the basis of identified cost and include proceeds received from litigation. Dividend income is recorded on the ex-dividend date, except for certain dividends from foreign securities where the ex-dividend date may have passed, which are recorded as soon as the Fund is informed of the ex-dividend date. Non-cash dividends included in dividend income, if any, are recorded at the fair market value of the securities received. Income and capital gain distributions from Fidelity Central Funds, if any, are recorded on the ex-dividend date. Certain distributions received by the Fund represent a return of capital or capital gain. The Fund determines the components of these distributions subsequent to the ex-dividend date, based upon receipt of tax filings or other correspondence relating to the underlying investment. These distributions are recorded as a reduction of cost of investments and/or as a realized gain. Investment income is recorded net of foreign taxes withheld where recovery of such taxes is uncertain.
Expenses. Expenses directly attributable to a fund are charged to that fund. Expenses attributable to more than one fund are allocated among the respective funds on the basis of relative net assets or other appropriate methods. Expense estimates are accrued in the period to which they relate and adjustments are made when actual amounts are known.
Income Tax Information and Distributions to Shareholders. Each year, the Fund intends to qualify as a regulated investment company under Subchapter M of the Internal Revenue Code, including distributing substantially all of its taxable income and realized gains. As a result, no provision for U.S. Federal income taxes is required. The Fund files a U.S. federal tax return, in addition to state and local tax returns as required. The Fund's federal income tax returns are subject to examination by the Internal Revenue Service (IRS) for a period of three fiscal years after they are filed. State and local tax returns may be subject to examination for an additional fiscal year depending on the jurisdiction. Foreign taxes are provided for based on the Fund's understanding of the tax rules and rates that exist in the foreign markets in which it invests.
Distributions are declared and recorded on the ex-dividend date. Income and capital gain distributions are determined in accordance with income tax regulations, which may differ from GAAP.
Capital accounts within the financial statements are adjusted for permanent book-tax differences. These adjustments have no impact on net assets or the results of operations. Capital accounts are not adjusted for temporary book-tax differences which will reverse in a subsequent period.
Book-tax differences are primarily due to futures contracts, foreign currency transactions, passive foreign investment companies (PFIC), partnerships, capital loss carryforwards and losses deferred due to wash sales.
As of period end, the cost and unrealized appreciation (depreciation) in securities, and derivatives if applicable, for federal income tax purposes were as follows:
| Gross unrealized appreciation | $31,073,434 |
| Gross unrealized depreciation | (22,056,446) |
| Net unrealized appreciation (depreciation) | $9,016,988 |
| Tax cost | $469,489,742 |
New Rule Issuance. During August 2018, the U.S. Securities and Exchange Commission issued Final Rule Release No. 33-10532, Disclosure Update and Simplification. This Final Rule includes amendments specific to registered investment companies that are intended to eliminate overlap in disclosure requirements between Regulation S-X and GAAP. In accordance with these amendments, certain line-items in the Fund's financial statements have been combined or removed for the current period as outlined in the table below.
| Financial Statement | Current Line-Item Presentation (As Applicable) | Prior Line-Item Presentation (As Applicable) |
| Statement of Assets and Liabilities | Total distributable earnings (loss) | Undistributed/Distributions in excess of/Accumulated net investment income (loss)
Accumulated/Undistributed net realized gain (loss)
Net unrealized appreciation (depreciation) |
| Statement of Changes in Net Assets | N/A - removed | Undistributed/Distributions in excess of/Accumulated net investment income (loss) end of period |
| Statement of Changes in Net Assets | Distributions to shareholders | Distributions to shareholders from net investment income
Distributions to shareholders from net realized gain |
4. Derivative Instruments.
Risk Exposures and the Use of Derivative Instruments. The Fund's investment objective allows the Fund to enter into various types of derivative contracts, including futures contracts. Derivatives are investments whose value is primarily derived from underlying assets, indices or reference rates and may be transacted on an exchange or over-the-counter (OTC). Derivatives may involve a future commitment to buy or sell a specified asset based on specified terms, to exchange future cash flows at periodic intervals based on a notional principal amount, or for one party to make one or more payments upon the occurrence of specified events in exchange for periodic payments from the other party.
The Fund primarily used derivatives to increase returns and to manage exposure to certain risks as defined below. The success of any strategy involving derivatives depends on analysis of numerous economic factors, and if the strategies for investment do not work as intended, the Fund may not achieve its objectives.
The Fund's use of derivatives increased or decreased its exposure to the following risk:
| Equity Risk | Equity risk relates to the fluctuations in the value of financial instruments as a result of changes in market prices (other than those arising from interest rate risk or foreign exchange risk), whether caused by factors specific to an individual investment, its issuer, or all factors affecting all instruments traded in a market or market segment.
|
The Fund is also exposed to additional risks from investing in derivatives, such as liquidity risk and counterparty credit risk. Liquidity risk is the risk that the Fund will be unable to close out the derivative in the open market in a timely manner. Counterparty credit risk is the risk that the counterparty will not be able to fulfill its obligation to the Fund. Counterparty credit risk related to exchange-traded futures contracts may be mitigated by the protection provided by the exchange on which they trade.
Investing in derivatives may involve greater risks than investing in the underlying assets directly and, to varying degrees, may involve risk of loss in excess of any initial investment and collateral received and amounts recognized in the Statement of Assets and Liabilities. In addition, there may be the risk that the change in value of the derivative contract does not correspond to the change in value of the underlying instrument.
Futures Contracts. A futures contract is an agreement between two parties to buy or sell a specified underlying instrument for a fixed price at a specified future date. The Fund used futures contracts to manage its exposure to the stock market.
Upon entering into a futures contract, a fund is required to deposit either cash or securities (initial margin) with a clearing broker in an amount equal to a certain percentage of the face value of the contract. Futures contracts are marked-to-market daily and subsequent daily payments (variation margin) are made or received by a fund depending on the daily fluctuations in the value of the futures contracts and are recorded as unrealized appreciation or (depreciation). This receivable and/or payable, if any, is included in daily variation margin on futures contracts in the Statement of Assets and Liabilities. Realized gain or (loss) is recorded upon the expiration or closing of a futures contract. The net realized gain (loss) and change in net unrealized appreciation (depreciation) on futures contracts during the period is presented in the Statement of Operations.
Any open futures contracts at period end are presented in the Schedule of Investments under the caption "Futures Contracts". The notional amount at value reflects each contract's exposure to the underlying instrument or index at period end and is representative of volume of activity during the period. Cash deposited to meet initial margin requirements is presented as segregated cash with brokers for derivative instruments in the Statement of Assets and Liabilities.
5. Purchases and Sales of Investments.
Purchases and sales of securities, other than short-term securities, aggregated $221,961,837 and $98,905,779, respectively.
6. Fees and Other Transactions with Affiliates.
Management Fee. Fidelity Management & Research Company (the investment adviser) and its affiliates provide the Fund with investment management related services for which the Fund pays a monthly management fee. The management fee is the sum of an individual fund fee rate that is based on an annual rate of .30% of the Fund's average net assets and an annualized group fee rate that averaged .24% during the period. The group fee rate is based upon the average net assets of all the mutual funds advised by the investment adviser, including any mutual funds previously advised by the investment adviser that are currently advised by Fidelity SelectCo, LLC, an affiliate of the investment adviser. The group fee rate decreases as assets under management increase and increases as assets under management decrease. In addition, the management fee is subject to a performance adjustment (up to a maximum of +/- .20% of the Fund's average net assets over a 36 month performance period). The upward or downward adjustment to the management fee is based on the Fund's relative investment performance as compared to its benchmark index, the Russell 1000 Value Index, over the same 36 month performance period. For the reporting period, the total annualized management fee rate, including the performance adjustment, was .38% of the Fund's average net assets. The performance adjustment included in the management fee rate may be higher or lower than the maximum performance adjustment rate due to the difference between the average net assets for the reporting and performance periods.
Transfer Agent Fees. Fidelity Investments Institutional Operations Company, Inc. (FIIOC), an affiliate of the investment adviser, is the Fund's transfer, dividend disbursing and shareholder servicing agent. FIIOC receives account fees and asset-based fees that vary according to account size and type of account. FIIOC pays for typesetting, printing and mailing of shareholder reports, except proxy statements. For the period, the transfer agent fees were equivalent to an annualized rate of .19% of average net assets.
Accounting and Security Lending Fees. Fidelity Service Company, Inc. (FSC), an affiliate of the investment adviser, maintains the Fund's accounting records. The accounting fee is based on the level of average net assets for each month. Under a separate contract, FSC administers the security lending program. The security lending fee is based on the number and duration of lending transactions. For the period, the fees were equivalent to an annualized rate of .04%.
Brokerage Commissions. The Fund placed a portion of its portfolio transactions with brokerage firms which are affiliates of the investment adviser. Brokerage commissions are included in net realized gain (loss) and change in net unrealized appreciation (depreciation) in the Statement of Operations. The commissions paid to these affiliated firms were $2,152 for the period.
Interfund Trades. The Fund may purchase from or sell securities to other Fidelity Funds under procedures adopted by the Board. The procedures have been designed to ensure these interfund trades are executed in accordance with Rule 17a-7 of the 1940 Act. Interfund trades are included within the respective purchases and sales amounts shown in the Purchases and Sales of Investments note.
7. Committed Line of Credit.
The Fund participates with other funds managed by the investment adviser or an affiliate in a $4.25 billion credit facility (the "line of credit") to be utilized for temporary or emergency purposes to fund shareholder redemptions or for other short-term liquidity purposes. The Fund has agreed to pay commitment fees on its pro-rata portion of the line of credit, which amounted to $523 and is reflected in Miscellaneous expenses on the Statement of Operations. During the period, the Fund did not borrow on this line of credit.
8. Security Lending.
The Fund lends portfolio securities through a lending agent from time to time in order to earn additional income. For equity securities, a lending agent is used and may loan securities to certain qualified borrowers, including Fidelity Capital Markets (FCM), a broker-dealer affiliated with the Fund. On the settlement date of the loan, the Fund receives collateral (in the form of U.S. Treasury obligations, letters of credit and/or cash) against the loaned securities and maintains collateral in an amount not less than 100% of the market value of the loaned securities during the period of the loan. The market value of the loaned securities is determined at the close of business of the Fund and any additional required collateral is delivered to the Fund on the next business day. The Fund or borrower may terminate the loan at any time, and if the borrower defaults on its obligation to return the securities loaned because of insolvency or other reasons, the Fund may apply collateral received from the borrower against the obligation. The Fund may experience delays and costs in recovering the securities loaned. Any cash collateral received is invested in the Fidelity Securities Lending Cash Central Fund. At period end, there were no security loans outstanding. Security lending income represents the income earned on investing cash collateral, less rebates paid to borrowers and any lending agent fees associated with the loan, plus any premium payments received for lending certain types of securities. Security lending income is presented in the Statement of Operations as a component of income from Fidelity Central Funds. Total security lending income during the period amounted to $4,160. During the period, there were no securities loaned to FCM.
9. Expense Reductions.
Commissions paid to certain brokers with whom the investment adviser, or its affiliates, places trades on behalf of the Fund include an amount in addition to trade execution, which may be rebated back to the Fund to offset certain expenses. This amount totaled $19,147 for the period. In addition, through arrangements with the Fund's custodian, credits realized as a result of certain uninvested cash balances were used to reduce the Fund's expenses. During the period, these credits reduced the Fund's custody expenses by $78.
In addition, during the period the investment adviser reimbursed and/or waived a portion of operating expenses in the amount of $1,621.
10. Other.
The Fund's organizational documents provide former and current trustees and officers with a limited indemnification against liabilities arising in connection with the performance of their duties to the Fund. In the normal course of business, the Fund may also enter into contracts that provide general indemnifications. The Fund's maximum exposure under these arrangements is unknown as this would be dependent on future claims that may be made against the Fund. The risk of material loss from such claims is considered remote.
Shareholder Expense Example
As a shareholder of the Fund, you incur two types of costs: (1) transaction costs and (2) ongoing costs, including management fees and other Fund expenses. This Example is intended to help you understand your ongoing costs (in dollars) of investing in the Fund and to compare these costs with the ongoing costs of investing in other mutual funds.
The Example is based on an investment of $1,000 invested at the beginning of the period and held for the entire period (August 1, 2018 to January 31, 2019).
Actual Expenses
The first line of the accompanying table provides information about actual account values and actual expenses. You may use the information in this line, together with the amount you invested, to estimate the expenses that you paid over the period. Simply divide your account value by $1,000.00 (for example, an $8,600 account value divided by $1,000.00 = 8.6), then multiply the result by the number in the first line under the heading entitled "Expenses Paid During Period" to estimate the expenses you paid on your account during this period. In addition, the Fund, as a shareholder in the underlying Fidelity Central Funds, will indirectly bear its pro-rata share of the fees and expenses incurred by the underlying Fidelity Central Funds. These fees and expenses are not included in the Fund's annualized expense ratio used to calculate the expense estimate in the table below.
Hypothetical Example for Comparison Purposes
The second line of the accompanying table provides information about hypothetical account values and hypothetical expenses based on the Fund's actual expense ratio and an assumed rate of return of 5% per year before expenses, which is not the Fund's actual return. The hypothetical account values and expenses may not be used to estimate the actual ending account balance or expenses you paid for the period. You may use this information to compare the ongoing costs of investing in the Fund and other funds. To do so, compare this 5% hypothetical example with the 5% hypothetical examples that appear in the shareholder reports of the other funds. In addition, the Fund, as a shareholder in the underlying Fidelity Central Funds, will indirectly bear its pro-rata share of the fees and expenses incurred by the underlying Fidelity Central Funds. These fees and expenses are not included in the Fund's annualized expense ratio used to calculate the expense estimate in the table below.
Please note that the expenses shown in the table are meant to highlight your ongoing costs only and do not reflect any transaction costs. Therefore, the second line of the table is useful in comparing ongoing costs only, and will not help you determine the relative total costs of owning different funds.
| | Annualized Expense Ratio-A | Beginning
Account Value
August 1, 2018 | Ending
Account Value
January 31, 2019 | Expenses Paid
During Period-B
August 1, 2018
to January 31, 2019 |
| Actual | .64% | $1,000.00 | $960.20 | $3.16 |
| Hypothetical-C | | $1,000.00 | $1,021.98 | $3.26 |
A Annualized expense ratio reflects expenses net of applicable fee waivers.
B Expenses are equal to the Fund's annualized expense ratio, multiplied by the average account value over the period, multiplied by 184/365 (to reflect the one-half year period).
C 5% return per year before expenses
Board Approval of Investment Advisory Contracts and Management Fees
Fidelity Blue Chip Value Fund
Each year, the Board of Trustees, including the Independent Trustees (together, the Board), votes on the renewal of the management contract with Fidelity Management & Research Company (FMR) and the sub-advisory agreements (together, the Advisory Contracts) for the fund. FMR and the sub-advisers are referred to herein as the Investment Advisers. The Board, assisted by the advice of fund counsel and Independent Trustees' counsel, requests and considers a broad range of information relevant to the renewal of the Advisory Contracts throughout the year.
The Board meets regularly and, at each of its meetings, covers an extensive agenda of topics and materials and considers factors that are relevant to its annual consideration of the renewal of the fund's Advisory Contracts, including the services and support provided to the fund and its shareholders. The Board has established various standing committees (Committees), each composed of and chaired by Independent Trustees with varying backgrounds, to which the Board has assigned specific subject matter responsibilities in order to enhance effective decision-making by the Board. The Board, acting directly and through its Committees, requests and receives information concerning the annual consideration of the renewal of the fund's Advisory Contracts. The Board also meets as needed to review matters specifically related to the Board's annual consideration of the renewal of the Advisory Contracts. Members of the Board may also meet with trustees of other Fidelity funds through joint ad hoc committees to discuss certain matters relevant to all of the Fidelity funds.
At its January 2019 meeting, the Board unanimously determined to renew the fund's Advisory Contracts. In reaching its determination, the Board considered all factors it believed relevant, including (i) the nature, extent, and quality of the services to be provided to the fund and its shareholders (including the investment performance of the fund); (ii) the competitiveness of the fund's management fee and total expense ratio relative to peer funds; (iii) the total costs of the services to be provided by and the profits to be realized by Fidelity from its relationships with the fund; and (iv) the extent to which, if any, economies of scale exist and would be realized as the fund grows, and whether any economies of scale are appropriately shared with fund shareholders.
In considering whether to renew the Advisory Contracts for the fund, the Board reached a determination, with the assistance of fund counsel and Independent Trustees' counsel and through the exercise of its business judgment, that the renewal of the Advisory Contracts was in the best interests of the fund and its shareholders and that the compensation payable under the Advisory Contracts was fair and reasonable. The Board's decision to renew the Advisory Contracts was not based on any single factor, but rather was based on a comprehensive consideration of all the information provided to the Board at its meetings throughout the year. The Board, in reaching its determination to renew the Advisory Contracts, was aware that shareholders of the fund have a broad range of investment choices available to them, including a wide choice among funds offered by Fidelity's competitors, and that the fund's shareholders, who have the opportunity to review and weigh the disclosure provided by the fund in its prospectus and other public disclosures, have chosen to invest in this fund, which is part of the Fidelity family of funds.
Nature, Extent, and Quality of Services Provided. The Board considered Fidelity's staffing as it relates to the fund, including the backgrounds of investment personnel of Fidelity, and also considered the fund's investment objective, strategies, and related investment philosophy. The Independent Trustees also had discussions with senior management of Fidelity's investment operations and investment groups. The Board considered the structure of the investment personnel compensation program and whether this structure provides appropriate incentives to act in the best interests of the fund. Additionally, the Board considered the portfolio managers' investments, if any, in the funds that they manage.
Resources Dedicated to Investment Management and Support Services. The Board and the Fund Oversight and Research Committees reviewed the general qualifications and capabilities of Fidelity's investment staff, including its size, education, experience, and resources, as well as Fidelity's approach to recruiting, training, managing, and compensating investment personnel. The Board noted that Fidelity has continued to increase the resources devoted to non-U.S. offices, including expansion of Fidelity's global investment organization. The Board also noted that Fidelity's analysts have extensive resources, tools and capabilities that allow them to conduct sophisticated quantitative and fundamental analysis, as well as credit analysis of issuers, counterparties and guarantors. Further, the Board considered that Fidelity's investment professionals have sufficient access to global information and data so as to provide competitive investment results over time, and that those professionals also have access to sophisticated tools that permit them to assess portfolio construction and risk and performance attribution characteristics continuously, as well as to transmit new information and research conclusions rapidly around the world. Additionally, in its deliberations, the Board considered Fidelity's trading, risk management, compliance, and technology and operations capabilities and resources, which are integral parts of the investment management process.
Shareholder and Administrative Services. The Board considered (i) the nature, extent, quality, and cost of advisory, administrative, and shareholder services performed by the Investment Advisers and their affiliates under the Advisory Contracts and under separate agreements covering transfer agency, pricing and bookkeeping, and securities lending services for the fund; (ii) the nature and extent of the supervision of third party service providers, principally custodians, subcustodians, and pricing vendors; and (iii) the resources devoted to, and the record of compliance with, the fund's compliance policies and procedures. The Board also reviewed the allocation of fund brokerage, including allocations to brokers affiliated with the Investment Advisers, the use of brokerage commissions to pay fund expenses, and the use of "soft" commission dollars to pay for research services.
The Board noted that the growth of fund assets over time across the complex allows Fidelity to reinvest in the development of services designed to enhance the value and convenience of the Fidelity funds as investment vehicles. These services include 24-hour access to account information and market information through telephone representatives and over the Internet, investor education materials and asset allocation tools, and the expanded availability of Fidelity Investor Centers.
The Board noted that it and the boards of certain other Fidelity funds had formed an ad hoc Committee on Transfer Agency Fees to review the variety of transfer agency fee structures throughout the industry and Fidelity's competitive positioning with respect to industry participants.
Investment in a Large Fund Family. The Board considered the benefits to shareholders of investing in a Fidelity fund, including the benefits of investing in a fund that is part of a large family of funds offering a variety of investment disciplines and providing a large variety of mutual fund investor services. The Board noted that Fidelity had taken, or had made recommendations that resulted in the Fidelity funds taking, a number of actions over the previous year that benefited particular funds, including: (i) continuing to dedicate additional resources to Fidelity's investment research process, which includes meetings with management of issuers of securities in which the funds invest, and to the support of the senior management team that oversees asset management; (ii) continuing efforts to enhance Fidelity's global research capabilities; (iii) launching new funds and making other enhancements to meet client needs; (iv) launching new share classes of existing funds; (v) eliminating purchase minimums and broadening eligibility requirements for certain funds and share classes; (vi) reducing management fees and total expenses for certain growth equity funds and index funds; (vii) lowering expense caps for certain existing funds and classes, and converting certain voluntary expense caps to contractual caps, to reduce expenses borne by shareholders; (viii) eliminating short-term redemption fees for funds that had such fees; (ix) rationalizing product lines and gaining increased efficiencies from fund mergers and share class consolidations; (x) continuing to develop, acquire and implement systems and technology to improve services to the funds and shareholders, strengthen information security, and increase efficiency; and (xi) continuing to implement enhancements to further strengthen Fidelity's product line to increase investors' probability of success in achieving their investment goals, including retirement income goals.
Investment Performance. The Board considered whether the fund has operated in accordance with its investment objective, as well as its record of compliance with its investment restrictions and its performance history.
The Board took into account discussions that occur at Board meetings throughout the year with representatives of the Investment Advisers about fund investment performance. In this regard the Board noted that as part of regularly scheduled fund reviews and other reports to the Board on fund performance, the Board considers annualized return information for the fund for different time periods, measured against an appropriate securities market index ("benchmark index") and a peer group of funds with similar objectives ("peer group"), if any. In its evaluation of fund investment performance, the Board gave particular attention to information indicating changes in performance of certain Fidelity funds for specific time periods and discussed with the Investment Advisers the reasons for any overperformance or underperformance.
In addition to reviewing absolute and relative fund performance, the Independent Trustees periodically consider the appropriateness of fund performance metrics in evaluating the results achieved. In general, the Independent Trustees believe that fund performance should be evaluated based on net performance (after fees and expenses) of both the highest performing and lowest performing fund share classes, where applicable, compared to appropriate benchmark indices, over appropriate time periods that may include full market cycles, and compared to peer groups, as applicable, over the same periods, taking into account relevant factors including the following: general market conditions; issuer-specific information; and fund cash flows and other factors.
The Independent Trustees recognize that shareholders evaluate performance on a net basis over their own holding periods, for which one-, three-, and five-year periods are often used as a proxy. For this reason, the performance information reviewed by the Board also included net cumulative total return information for the fund and an appropriate benchmark index and peer group for the most recent one-, three-, and five-year periods ended June 30, 2018, as shown below. Returns are shown compared to the 25th percentile (top of box, 75% beaten) and 75th percentile (bottom of box, 25% beaten) of the peer universe.
Fidelity Blue Chip Value Fund
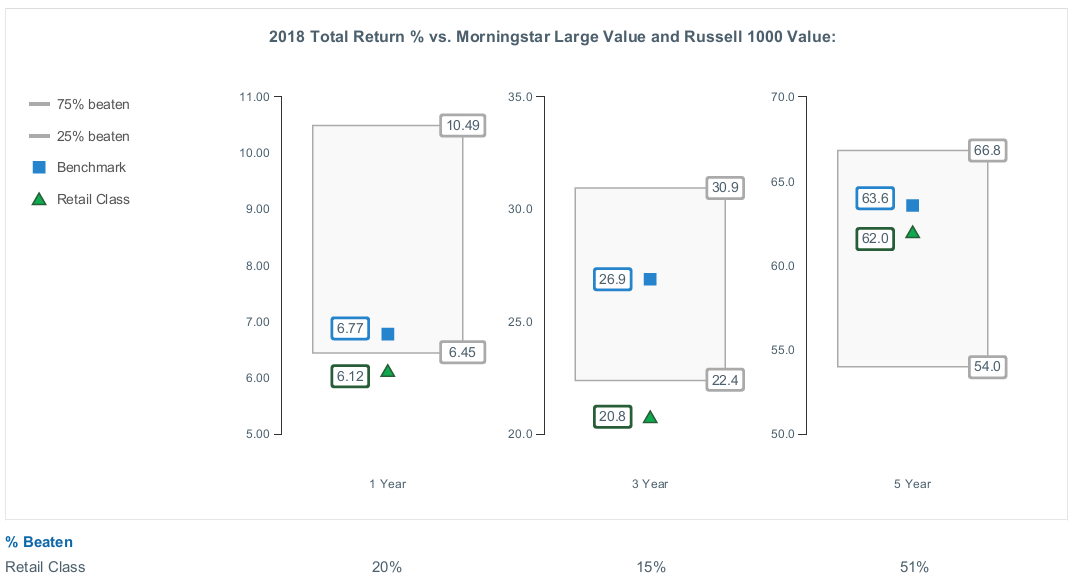
The Board considered the fund's underperformance for different time periods based on the June 30, 2018 data presented above and based on earlier periods ended prior to June 30, 2018. The Board's discussions with FMR regarding underperformance cover topics including, but not limited to: the longer-term track record of a fund's portfolio manager(s); broader trends in the market that may adversely impact a fund's performance; attribution reports on contributors to the fund's underperformance; and the applicable portfolio manager's explanation of his or her underperformance. The Board engages with FMR on steps that might be taken to address a fund's underperformance.
The Board also considered that the fund's management fee is subject to upward or downward adjustment depending upon whether, and to what extent, the fund's investment performance for the performance period (a rolling 36-month period) exceeds, or is exceeded by, a securities index, thus leading to a performance adjustment for the same period. The Board noted that the performance adjustment provides FMR with a strong economic incentive to seek to achieve superior long-term performance for the fund's shareholders and helps to more closely align the interests of FMR and the shareholders of the fund.
Based on its review, the Board concluded that the nature, extent, and quality of services provided to the fund under the Advisory Contracts should continue to benefit the shareholders of the fund.
Competitiveness of Management Fee and Total Expense Ratio. The Board considered the fund's management fee and total expense ratio compared to "mapped groups" of competitive funds and classes created for the purpose of facilitating the Trustees' competitive analysis of management fees and total expenses. Fidelity creates "mapped groups" by combining similar Lipper investment objective categories that have comparable investment mandates. Combining Lipper investment objective categories aids the Board's management fee and total expense ratio comparisons by broadening the competitive group used for comparison.
Management Fee. The Board considered two proprietary management fee comparisons for the 12-month periods (ended June 30 for 2018 and December 31 for prior periods) shown in basis points (BP) in the chart below. The group of Lipper funds used by the Board for management fee comparisons is referred to below as the "Total Mapped Group." The Total Mapped Group comparison focuses on a fund's standing in terms of gross management fees before expense reimbursements or caps, and without giving effect to the fund's performance adjustment, relative to the total universe of funds with comparable investment mandates, regardless of whether their management fee structures also are comparable. Funds with comparable investment mandates offer exposure to similar types of securities. Funds with comparable management fee structures have similar management fee contractual arrangements (
e.g., flat rate charged for advisory services, all-inclusive fee rate,
etc.). "TMG %" represents the percentage of funds in the Total Mapped Group that had management fees that were lower than the fund's. For example, a hypothetical TMG % of 20% would mean that 80% of the funds in the Total Mapped Group had higher, and 20% had lower, management fees than the fund. The fund's actual TMG %s and the number of funds in the Total Mapped Group are in the chart below. The "Asset-Size Peer Group" (ASPG) comparison focuses on a fund's standing relative to a subset of non-Fidelity funds within the Total Mapped Group that are similar in size and management fee structure without taking into account performance adjustments, if any. For example, if a fund is in the first quartile of the ASPG, the fund's management fee ranks in the least expensive or lowest 25% of funds in the ASPG. The ASPG represents at least 15% of the funds in the Total Mapped Group with comparable asset size and management fee structures, subject to a minimum of 50 funds (or all funds in the Total Mapped Group if fewer than 50). Additional information, such as the ASPG quartile in which the fund's management fee rate ranked and the impact of the fund's performance adjustment, is also included in the chart and was considered by the Board.
Fidelity Blue Chip Value Fund

The Board noted that the fund's management fee rate ranked below the median of its Total Mapped Group and below the median of its ASPG for the 12-month period ended June 30, 2018. The Board also noted the effect of the fund's performance adjustment, if any, on the fund's management fee ranking.
The Board noted that it and the boards of other Fidelity funds formed an ad hoc Committee on Group Fee, which meets periodically, to conduct an in-depth review of the "group fee" component of the management fee of funds with such management fee structures. The Committee's focus included the mechanics of the group fee, the competitive landscape of group fee structures, Fidelity funds with no group fee component and investment products not included in group fee assets. The Board also considered that, for funds subject to the group fee, FMR agreed to voluntarily waive fees over a specified period of time in amounts designed to account for assets converted from certain funds to certain collective investment trusts.
The Board also noted that, in 2013, the ad hoc Committee on Management Fees was formed to conduct an in-depth review of the management fee rates of Fidelity's active equity mutual funds. The Committee focused on the following areas: (i) standard fee structures; (ii) research consumption and trading evolution; (iii) management fee competitiveness/profitability by category; and (iv) factors that drive institutional pricing.
Based on its review, the Board concluded that the fund's management fee is fair and reasonable in light of the services that the fund receives and the other factors considered.
Total Expense Ratio. In its review of the fund's total expense ratio, the Board considered the fund's management fee rate as well as other fund expenses, such as transfer agent fees, pricing and bookkeeping fees, and custodial, legal, and audit fees. The Board noted the impact of the fund's performance adjustment. The Board also noted that Fidelity may agree to waive fees and expenses from time to time, and the extent to which, if any, it has done so for the fund. As part of its review, the Board also considered the current and historical total expense ratios of the fund compared to competitive fund median expenses. The fund is compared to those funds and classes in the Total Mapped Group (used by the Board for management fee comparisons) that have a similar sales load structure.
The Board noted that the fund's total expense ratio ranked below the competitive median for the 12-month period ended June 30, 2018.
The Board further considered that FMR has contractually agreed to reimburse the fund to the extent that total operating expenses, with certain exceptions, as a percentage of its average net assets, exceed 1.00% through November 30, 2019.
Fees Charged to Other Fidelity Clients. The Board also considered Fidelity fee structures and other information with respect to clients of Fidelity, such as other funds advised or subadvised by Fidelity, pension plan clients, and other institutional clients with similar mandates. The Board noted that a joint ad hoc committee created by it and the boards of other Fidelity funds periodically reviews and compares Fidelity's institutional investment advisory business with its business of providing services to the Fidelity funds and also noted the most recent findings of the committee. The Board noted that the committee's review included a consideration of the differences in services provided, fees charged, and costs incurred, as well as competition in the markets serving the different categories of clients.
Based on its review of total expense ratios and fees charged to other Fidelity clients, the Board concluded that the fund's total expense ratio was reasonable in light of the services that the fund and its shareholders receive and the other factors considered.
Costs of the Services and Profitability. The Board considered the revenues earned and the expenses incurred by Fidelity in conducting the business of developing, marketing, distributing, managing, administering and servicing the fund and servicing the fund's shareholders. The Board also considered the level of Fidelity's profits in respect of all the Fidelity funds.
On an annual basis, Fidelity presents to the Board information about the profitability of its relationships with the fund. Fidelity calculates profitability information for each fund, as well as aggregate profitability information for groups of Fidelity funds and all Fidelity funds, using a series of detailed revenue and cost allocation methodologies which originate with the books and records of Fidelity on which Fidelity's audited financial statements are based. The Audit Committee of the Board reviews any significant changes from the prior year's methodologies.
PricewaterhouseCoopers LLP (PwC), auditor to Fidelity and certain Fidelity funds, has been engaged annually by the Board as part of the Board's assessment of Fidelity's profitability analysis. PwC's engagement includes the review and assessment of the methodologies used by Fidelity in determining the revenues and expenses attributable to Fidelity's mutual fund business, and completion of agreed-upon procedures in respect of the mathematical accuracy of the fund profitability information and its conformity to established allocation methodologies. After considering PwC's reports issued under the engagement and information provided by Fidelity, the Board concluded that while other allocation methods may also be reasonable, Fidelity's profitability methodologies are reasonable in all material respects.
The Board also reviewed Fidelity's non-fund businesses and potential indirect benefits such businesses may have received as a result of their association with Fidelity's mutual fund business (i.e., fall-out benefits) as well as cases where Fidelity's affiliates may benefit from the fund's business. The Board noted that changes to fall-out benefits year-over-year reflect business developments at Fidelity's various businesses.
The Board considered the costs of the services provided by and the profits realized by Fidelity in connection with the operation of the fund and was satisfied that the profitability was not excessive.
Economies of Scale. The Board considered whether there have been economies of scale in respect of the management of the Fidelity funds, whether the Fidelity funds (including the fund) have appropriately benefited from any such economies of scale, and whether there is potential for realization of any further economies of scale. The Board considered the extent to which the fund will benefit from economies of scale as assets grow through increased services to the fund, through waivers or reimbursements, or through fee or expense ratio reductions. The Board also noted that a committee (the Economies of Scale Committee) created by it and the boards of other Fidelity funds periodically analyzes whether Fidelity attains economies of scale in respect of the management and servicing of the Fidelity funds, whether the Fidelity funds have appropriately benefited from such economies of scale, and whether there is potential for realization of any further economies of scale.
The Board recognized that the fund's management contract incorporates a "group fee" structure, which provides for lower group fee rates as total group assets increase, and for higher group fee rates as total group assets decrease (with "group assets" defined to include fund assets under FMR's management plus the assets of sector funds previously under FMR's management). FMR calculates the group fee rates based on a tiered asset "breakpoint" schedule that varies based on asset class. The Board considered that the group fee is designed to deliver the benefits of economies of scale to fund shareholders when total Fidelity fund assets increase, even if assets of any particular fund are unchanged or have declined, because some portion of Fidelity's costs are attributable to services provided to all Fidelity funds, and all funds benefit if those costs can be allocated among more assets. The Board concluded that, given the group fee structure, fund shareholders will benefit from lower management fees as group assets increase at the fund complex level, regardless of whether Fidelity achieves any such economies of scale.
The Board concluded, taking into account the analysis of the Economies of Scale Committee, that economies of scale, if any, are being appropriately shared between fund shareholders and Fidelity.
Additional Information Requested by the Board. In order to develop fully the factual basis for consideration of the Fidelity funds' advisory contracts, the Board requested and received additional information on certain topics, including: (i) fund performance trends, in particular the underperformance of certain funds, and Fidelity's long-term strategies for certain funds; (ii) Fidelity's fund profitability methodology, profitability trends for certain funds, and the impact of certain factors on fund profitability results; (iii) metrics for evaluating index fund and ETF performance and information about ETF trading characteristics; (iv) the methodology with respect to the evaluation of competitive fund data and peer group classifications and fee comparisons; (v) the expense structures for different funds and classes; (vi) information regarding other accounts managed by Fidelity, including collective investment trusts; and (vii) Fidelity's philosophies and strategies for evaluating funds and classes with lower or declining asset levels.
Based on its evaluation of all of the conclusions noted above, and after considering all factors it believed relevant, the Board concluded that the advisory fee arrangements are fair and reasonable, and that the fund's Advisory Contracts should be renewed.
BCV-SANN-0319
1.789715.116
Fidelity® Dividend Growth Fund
Semi-Annual Report January 31, 2019 |
|
Beginning on January 1, 2021, as permitted by regulations adopted by the Securities and Exchange Commission, paper copies of a fund’s shareholder reports will no longer be sent by mail, unless you specifically request paper copies of the reports from the fund or from your financial intermediary, such as a financial advisor, broker-dealer or bank. Instead, the reports will be made available on a website, and you will be notified by mail each time a report is posted and provided with a website link to access the report.
If you already elected to receive shareholder reports electronically, you will not be affected by this change and you need not take any action. You may elect to receive shareholder reports and other communications from a fund electronically, by contacting your financial intermediary. For Fidelity customers, visit Fidelity's web site or call Fidelity using the contact information listed below.
You may elect to receive all future reports in paper free of charge. If you wish to continue receiving paper copies of your shareholder reports, you may contact your financial intermediary or, if you are a Fidelity customer, visit Fidelity’s website, or call Fidelity at the applicable toll-free number listed below. Your election to receive reports in paper will apply to all funds held with the fund complex/your financial intermediary.
| Account Type | Website | Phone Number |
| Brokerage, Mutual Fund, or Annuity Contracts: | fidelity.com/mailpreferences | 1-800-343-3548 |
| Employer Provided Retirement Accounts: | netbenefits.fidelity.com/preferences (choose 'no' under Required Disclosures to continue to print) | 1-800-343-0860 |
| Advisor Sold Accounts Serviced Through Your Financial Intermediary: | Contact Your Financial Intermediary | Your Financial Intermediary's phone number |
| Advisor Sold Accounts Serviced by Fidelity: | institutional.fidelity.com | 1-877-208-0098 |
Contents
To view a fund's proxy voting guidelines and proxy voting record for the 12-month period ended June 30, visit http://www.fidelity.com/proxyvotingresults or visit the Securities and Exchange Commission's (SEC) web site at http://www.sec.gov.
You may also call 1-800-544-8544 if you’re an individual investing directly with Fidelity, call 1-800-835-5092 if you’re a plan sponsor or participant with Fidelity as your recordkeeper or call 1-877-208-0098 on institutional accounts or if you’re an advisor or invest through one to request a free copy of the proxy voting guidelines.
Standard & Poor's, S&P and S&P 500 are registered service marks of The McGraw-Hill Companies, Inc. and have been licensed for use by Fidelity Distributors Corporation.
Other third-party marks appearing herein are the property of their respective owners.
All other marks appearing herein are registered or unregistered trademarks or service marks of FMR LLC or an affiliated company. © 2019 FMR LLC. All rights reserved.
This report and the financial statements contained herein are submitted for the general information of the shareholders of the Fund. This report is not authorized for distribution to prospective investors in the Fund unless preceded or accompanied by an effective prospectus.
A fund files its complete schedule of portfolio holdings with the SEC for the first and third quarters of each fiscal year on Form N-Q. Forms N-Q are available on the SEC’s web site at http://www.sec.gov. A fund's Forms N-Q may be reviewed and copied at the SEC’s Public Reference Room in Washington, DC. Information regarding the operation of the SEC's Public Reference Room may be obtained by calling 1-800-SEC-0330.
For a complete list of a fund's portfolio holdings, view the most recent holdings listing, semiannual report, or annual report on Fidelity's web site at http://www.fidelity.com, http://www.institutional.fidelity.com, or http://www.401k.com, as applicable.
NOT FDIC INSURED •MAY LOSE VALUE •NO BANK GUARANTEE
Neither the Fund nor Fidelity Distributors Corporation is a bank.
Investment Summary (Unaudited)
Top Ten Stocks as of January 31, 2019
| | % of fund's net assets |
| Berkshire Hathaway, Inc. Class B | 9.7 |
| Comcast Corp. Class A | 6.2 |
| General Electric Co. | 5.1 |
| Altria Group, Inc. | 4.0 |
| Bank of America Corp. | 3.0 |
| Exxon Mobil Corp. | 2.9 |
| Apple, Inc. | 2.7 |
| Verizon Communications, Inc. | 2.3 |
| JPMorgan Chase & Co. | 2.2 |
| Chevron Corp. | 2.2 |
| | 40.3 |
Top Five Market Sectors as of January 31, 2019
| | % of fund's net assets |
| Financials | 26.7 |
| Industrials | 19.1 |
| Communication Services | 11.2 |
| Consumer Staples | 8.4 |
| Health Care | 8.1 |
Asset Allocation (% of fund's net assets)
| As of January 31, 2019* |
| | Stocks | 95.2% |
| | Short-Term Investments and Net Other Assets (Liabilities) | 4.8% |

* Foreign investments - 2.8%
Schedule of Investments January 31, 2019 (Unaudited)
Showing Percentage of Net Assets
| Common Stocks - 95.2% | | | |
| | | Shares | Value (000s) |
| COMMUNICATION SERVICES - 11.2% | | | |
| Diversified Telecommunication Services - 2.3% | | | |
| Verizon Communications, Inc. | | 2,652,100 | $146,025 |
| Media - 8.9% | | | |
| Comcast Corp. Class A | | 11,070,192 | 404,837 |
| GCI Liberty, Inc. (a) | | 571,138 | 29,071 |
| Interpublic Group of Companies, Inc. | | 1,601,300 | 36,430 |
| Liberty Broadband Corp. Class A (a) | | 524,534 | 44,465 |
| Liberty Media Corp. Liberty SiriusXM Series A (a) | | 829,300 | 32,990 |
| Omnicom Group, Inc. | | 402,400 | 31,339 |
| | | | 579,132 |
|
| TOTAL COMMUNICATION SERVICES | | | 725,157 |
|
| CONSUMER DISCRETIONARY - 5.7% | | | |
| Auto Components - 1.2% | | | |
| BorgWarner, Inc. | | 722,200 | 29,538 |
| Gentex Corp. | | 1,231,600 | 26,085 |
| Lear Corp. | | 145,700 | 22,428 |
| | | | 78,051 |
| Distributors - 1.2% | | | |
| LKQ Corp. (a) | | 3,001,500 | 78,699 |
| Household Durables - 2.3% | | | |
| Lennar Corp. Class A | | 289,600 | 13,733 |
| Mohawk Industries, Inc. (a) | | 329,600 | 42,449 |
| NVR, Inc. (a) | | 34,000 | 90,440 |
| | | | 146,622 |
| Multiline Retail - 0.4% | | | |
| Dollar Tree, Inc. (a) | | 288,600 | 27,945 |
| Specialty Retail - 0.2% | | | |
| AutoZone, Inc. (a) | | 15,900 | 13,473 |
| Textiles, Apparel & Luxury Goods - 0.4% | | | |
| PVH Corp. | | 197,701 | 21,571 |
|
| TOTAL CONSUMER DISCRETIONARY | | | 366,361 |
|
| CONSUMER STAPLES - 8.4% | | | |
| Food & Staples Retailing - 0.2% | | | |
| Walgreens Boots Alliance, Inc. | | 173,500 | 12,537 |
| Food Products - 2.3% | | | |
| Ingredion, Inc. | | 373,900 | 37,016 |
| The Kraft Heinz Co. | | 2,316,200 | 111,317 |
| | | | 148,333 |
| Household Products - 1.5% | | | |
| Kimberly-Clark Corp. | | 173,500 | 19,324 |
| Spectrum Brands Holdings, Inc. | | 1,461,875 | 81,690 |
| | | | 101,014 |
| Tobacco - 4.4% | | | |
| Altria Group, Inc. | | 5,292,388 | 261,179 |
| Philip Morris International, Inc. | | 292,400 | 22,433 |
| | | | 283,612 |
|
| TOTAL CONSUMER STAPLES | | | 545,496 |
|
| ENERGY - 6.5% | | | |
| Oil, Gas & Consumable Fuels - 6.5% | | | |
| Chevron Corp. | | 1,210,100 | 138,738 |
| Exxon Mobil Corp. | | 2,594,897 | 190,154 |
| Phillips 66 Co. | | 944,900 | 90,153 |
| | | | 419,045 |
| FINANCIALS - 26.7% | | | |
| Banks - 11.1% | | | |
| Bank of America Corp. | | 6,906,617 | 196,631 |
| JPMorgan Chase & Co. | | 1,352,535 | 139,987 |
| M&T Bank Corp. | | 479,900 | 78,963 |
| PNC Financial Services Group, Inc. | | 721,900 | 88,555 |
| U.S. Bancorp | | 1,663,600 | 85,110 |
| Wells Fargo & Co. | | 2,683,993 | 131,274 |
| | | | 720,520 |
| Capital Markets - 0.3% | | | |
| Oaktree Capital Group LLC Class A | | 536,500 | 21,900 |
| Consumer Finance - 0.9% | | | |
| American Express Co. | | 595,400 | 61,148 |
| Imperial Holdings, Inc. warrants 4/11/19 (a) | | 48,012 | 0 |
| | | | 61,148 |
| Diversified Financial Services - 9.7% | | | |
| Berkshire Hathaway, Inc. Class B (a) | | 3,051,500 | 627,204 |
| Insurance - 4.7% | | | |
| Allstate Corp. | | 304,400 | 26,748 |
| Chubb Ltd. | | 701,700 | 93,361 |
| The Travelers Companies, Inc. | | 1,103,600 | 138,546 |
| Torchmark Corp. | | 510,600 | 42,768 |
| | | | 301,423 |
|
| TOTAL FINANCIALS | | | 1,732,195 |
|
| HEALTH CARE - 8.1% | | | |
| Health Care Providers & Services - 5.4% | | | |
| AmerisourceBergen Corp. | | 324,600 | 27,062 |
| Anthem, Inc. | | 377,400 | 114,352 |
| Cardinal Health, Inc. | | 338,700 | 16,925 |
| Cigna Corp. | | 304,700 | 60,882 |
| CVS Health Corp. | | 221,200 | 14,500 |
| McKesson Corp. | | 216,000 | 27,702 |
| Quest Diagnostics, Inc. | | 319,600 | 27,917 |
| UnitedHealth Group, Inc. | | 217,700 | 58,823 |
| | | | 348,163 |
| Pharmaceuticals - 2.7% | | | |
| Bayer AG | | 518,600 | 39,308 |
| Bristol-Myers Squibb Co. | | 193,100 | 9,533 |
| Johnson & Johnson | | 960,243 | 127,789 |
| | | | 176,630 |
|
| TOTAL HEALTH CARE | | | 524,793 |
|
| INDUSTRIALS - 19.1% | | | |
| Aerospace & Defense - 0.4% | | | |
| General Dynamics Corp. | | 152,100 | 26,035 |
| Air Freight & Logistics - 2.3% | | | |
| FedEx Corp. | | 311,500 | 55,313 |
| United Parcel Service, Inc. Class B | | 883,200 | 93,089 |
| | | | 148,402 |
| Airlines - 1.0% | | | |
| Delta Air Lines, Inc. | | 811,300 | 40,103 |
| Southwest Airlines Co. | | 474,400 | 26,927 |
| | | | 67,030 |
| Electrical Equipment - 0.4% | | | |
| Acuity Brands, Inc. | | 211,100 | 25,524 |
| Industrial Conglomerates - 5.4% | | | |
| General Electric Co. | | 32,223,400 | 327,390 |
| ITT, Inc. | | 367,100 | 19,295 |
| | | | 346,685 |
| Machinery - 4.8% | | | |
| Allison Transmission Holdings, Inc. | | 606,002 | 29,494 |
| Cummins, Inc. | | 367,200 | 54,019 |
| PACCAR, Inc. | | 1,096,000 | 71,810 |
| Snap-On, Inc. | | 453,700 | 75,310 |
| WABCO Holdings, Inc. (a) | | 701,800 | 80,167 |
| | | | 310,800 |
| Road & Rail - 4.8% | | | |
| J.B. Hunt Transport Services, Inc. | | 385,400 | 41,253 |
| Knight-Swift Transportation Holdings, Inc. Class A (b) | | 3,133,400 | 99,485 |
| Norfolk Southern Corp. | | 381,100 | 63,926 |
| Union Pacific Corp. | | 674,300 | 107,261 |
| | | | 311,925 |
|
| TOTAL INDUSTRIALS | | | 1,236,401 |
|
| INFORMATION TECHNOLOGY - 7.0% | | | |
| IT Services - 2.8% | | | |
| Amdocs Ltd. | | 843,900 | 47,157 |
| Cognizant Technology Solutions Corp. Class A | | 759,900 | 52,950 |
| FleetCor Technologies, Inc. (a) | | 258,200 | 52,107 |
| IBM Corp. | | 213,900 | 28,752 |
| | | | 180,966 |
| Software - 1.5% | | | |
| Oracle Corp. | | 1,949,700 | 97,933 |
| Technology Hardware, Storage & Peripherals - 2.7% | | | |
| Apple, Inc. | | 1,067,218 | 177,628 |
|
| TOTAL INFORMATION TECHNOLOGY | | | 456,527 |
|
| MATERIALS - 1.1% | | | |
| Chemicals - 1.1% | | | |
| DowDuPont, Inc. | | 1,284,700 | 69,130 |
| REAL ESTATE - 0.1% | | | |
| Equity Real Estate Investment Trusts (REITs) - 0.1% | | | |
| CorePoint Lodging, Inc. | | 562,656 | 6,887 |
| UTILITIES - 1.3% | | | |
| Electric Utilities - 1.3% | | | |
| PPL Corp. | | 2,725,300 | 85,356 |
| TOTAL COMMON STOCKS | | | |
| (Cost $5,807,990) | | | 6,167,348 |
|
| Money Market Funds - 5.1% | | | |
| Fidelity Cash Central Fund, 2.43% (c) | | 308,348,562 | 308,410 |
| Fidelity Securities Lending Cash Central Fund 2.43% (c)(d) | | 23,444,090 | 23,446 |
| TOTAL MONEY MARKET FUNDS | | | |
| (Cost $331,852) | | | 331,856 |
| TOTAL INVESTMENT IN SECURITIES - 100.3% | | | |
| (Cost $6,139,842) | | | 6,499,204 |
| NET OTHER ASSETS (LIABILITIES) - (0.3)% | | | (22,112) |
| NET ASSETS - 100% | | | $6,477,092 |
Values shown as $0 in the Schedule of Investments may reflect amounts less than $500.
Legend
(a) Non-income producing
(b) Security or a portion of the security is on loan at period end.
(c) Affiliated fund that is generally available only to investment companies and other accounts managed by Fidelity Investments. The rate quoted is the annualized seven-day yield of the fund at period end. A complete unaudited listing of the fund's holdings as of its most recent quarter end is available upon request. In addition, each Fidelity Central Fund's financial statements are available on the SEC's website or upon request.
(d) Investment made with cash collateral received from securities on loan.
Affiliated Central Funds
Information regarding fiscal year to date income earned by the Fund from investments in Fidelity Central Funds is as follows:
| Fund | Income earned |
| | (Amounts in thousands) |
| Fidelity Cash Central Fund | $3,279 |
| Fidelity Securities Lending Cash Central Fund | 19 |
| Total | $3,298 |
Amounts in the income column in the above table include any capital gain distributions from underlying funds, which are presented in the corresponding line-item in the Statement of Operations, if applicable.
Investment Valuation
The following is a summary of the inputs used, as of January 31, 2019, involving the Fund's assets and liabilities carried at fair value. The inputs or methodology used for valuing securities may not be an indication of the risk associated with investing in those securities. For more information on valuation inputs, and their aggregation into the levels used below, please refer to the Investment Valuation section in the accompanying Notes to Financial Statements.
| | Valuation Inputs at Reporting Date: |
| Description | Total | Level 1 | Level 2 | Level 3 |
| (Amounts in thousands) | | | | |
| Investments in Securities: | | | | |
| Equities: | | | | |
| Communication Services | $725,157 | $725,157 | $-- | $-- |
| Consumer Discretionary | 366,361 | 366,361 | -- | -- |
| Consumer Staples | 545,496 | 545,496 | -- | -- |
| Energy | 419,045 | 419,045 | -- | -- |
| Financials | 1,732,195 | 1,732,195 | -- | -- |
| Health Care | 524,793 | 485,485 | 39,308 | -- |
| Industrials | 1,236,401 | 1,236,401 | -- | -- |
| Information Technology | 456,527 | 456,527 | -- | -- |
| Materials | 69,130 | 69,130 | -- | -- |
| Real Estate | 6,887 | 6,887 | -- | -- |
| Utilities | 85,356 | 85,356 | -- | -- |
| Money Market Funds | 331,856 | 331,856 | -- | -- |
| Total Investments in Securities: | $6,499,204 | $6,459,896 | $39,308 | $-- |
See accompanying notes which are an integral part of the financial statements.
Financial Statements
Statement of Assets and Liabilities
| Amounts in thousands (except per-share amounts) | | January 31, 2019 (Unaudited) |
| Assets | | |
Investment in securities, at value (including securities loaned of $21,824) — See accompanying schedule:
Unaffiliated issuers (cost $5,807,990) | $6,167,348 | |
| Fidelity Central Funds (cost $331,852) | 331,856 | |
| Total Investment in Securities (cost $6,139,842) | | $6,499,204 |
| Receivable for investments sold | | 806 |
| Receivable for fund shares sold | | 1,756 |
| Dividends receivable | | 4,572 |
| Distributions receivable from Fidelity Central Funds | | 392 |
| Prepaid expenses | | 8 |
| Other receivables | | 650 |
| Total assets | | 6,507,388 |
| Liabilities | | |
| Payable for fund shares redeemed | $3,957 | |
| Accrued management fee | 1,594 | |
| Other affiliated payables | 817 | |
| Other payables and accrued expenses | 482 | |
| Collateral on securities loaned | 23,446 | |
| Total liabilities | | 30,296 |
| Net Assets | | $6,477,092 |
| Net Assets consist of: | | |
| Paid in capital | | $6,094,839 |
| Total distributable earnings (loss) | | 382,253 |
| Net Assets | | $6,477,092 |
| Net Asset Value and Maximum Offering Price | | |
| Dividend Growth: | | |
| Net Asset Value, offering price and redemption price per share ($5,590,181 ÷ 203,194 shares) | | $27.51 |
| Class K: | | |
| Net Asset Value, offering price and redemption price per share ($886,911 ÷ 32,280 shares) | | $27.48 |
See accompanying notes which are an integral part of the financial statements.
Statement of Operations
| Amounts in thousands | | Six months ended January 31, 2019 (Unaudited) |
| Investment Income | | |
| Dividends | | $83,680 |
| Income from Fidelity Central Funds | | 3,298 |
| Total income | | 86,978 |
| Expenses | | |
| Management fee | | |
| Basic fee | $18,413 | |
| Performance adjustment | (7,122) | |
| Transfer agent fees | 4,581 | |
| Accounting and security lending fees | 580 | |
| Custodian fees and expenses | 35 | |
| Independent trustees' fees and expenses | 22 | |
| Registration fees | 42 | |
| Audit | 40 | |
| Legal | 14 | |
| Miscellaneous | 20 | |
| Total expenses before reductions | 16,625 | |
| Expense reductions | (394) | |
| Total expenses after reductions | | 16,231 |
| Net investment income (loss) | | 70,747 |
| Realized and Unrealized Gain (Loss) | | |
| Net realized gain (loss) on: | | |
| Investment securities: | | |
| Unaffiliated issuers | 135,364 | |
| Fidelity Central Funds | (10) | |
| Foreign currency transactions | (70) | |
| Total net realized gain (loss) | | 135,284 |
| Change in net unrealized appreciation (depreciation) on: | | |
| Investment securities: | | |
| Unaffiliated issuers | (352,130) | |
| Assets and liabilities in foreign currencies | (4) | |
| Total change in net unrealized appreciation (depreciation) | | (352,134) |
| Net gain (loss) | | (216,850) |
| Net increase (decrease) in net assets resulting from operations | | $(146,103) |
See accompanying notes which are an integral part of the financial statements.
Statement of Changes in Net Assets
| Amounts in thousands | Six months ended January 31, 2019 (Unaudited) | Year ended July 31, 2018 |
| Increase (Decrease) in Net Assets | | |
| Operations | | |
| Net investment income (loss) | $70,747 | $143,558 |
| Net realized gain (loss) | 135,284 | 1,791,487 |
| Change in net unrealized appreciation (depreciation) | (352,134) | (993,720) |
| Net increase (decrease) in net assets resulting from operations | (146,103) | 941,325 |
| Distributions to shareholders | (1,248,508) | – |
| Distributions to shareholders from net investment income | – | (127,264) |
| Distributions to shareholders from net realized gain | – | (1,053,472) |
| Total distributions | (1,248,508) | (1,180,736) |
| Share transactions - net increase (decrease) | 604,892 | 76,969 |
| Total increase (decrease) in net assets | (789,719) | (162,442) |
| Net Assets | | |
| Beginning of period | 7,266,811 | 7,429,253 |
| End of period | $6,477,092 | $7,266,811 |
| Other Information | | |
| Undistributed net investment income end of period | | $69,283 |
See accompanying notes which are an integral part of the financial statements.
Financial Highlights
Fidelity Dividend Growth Fund
| | Six months ended (Unaudited) January 31, | Years endedJuly 31, | | | | |
| | 2019 | 2018 | 2017 | 2016 | 2015 | 2014 |
| Selected Per–Share Data | | | | | | |
| Net asset value, beginning of period | $33.79 | $35.06 | $31.51 | $34.46 | $37.27 | $35.33 |
| Income from Investment Operations | | | | | | |
| Net investment income (loss)A | .30 | .65 | .53 | .48 | .49 | .56 |
| Net realized and unrealized gain (loss) | (.78)B | 3.72 | 3.53 | (.61)C | 2.71 | 4.98 |
| Total from investment operations | (.48) | 4.37 | 4.06 | (.13) | 3.20 | 5.54 |
| Distributions from net investment income | (.60) | (.60) | (.51) | (.47) | (.51) | (.37) |
| Distributions from net realized gain | (5.20) | (5.04) | – | (2.36) | (5.49) | (3.23) |
| Total distributions | (5.80) | (5.64) | (.51) | (2.82)D | (6.01)E | (3.60) |
| Net asset value, end of period | $27.51 | $33.79 | $35.06 | $31.51 | $34.46 | $37.27 |
| Total ReturnF,G | (2.03)%B | 13.60% | 13.06% | .26%C | 9.54% | 17.30% |
| Ratios to Average Net AssetsH,I | | | | | | |
| Expenses before reductions | .50%J | .50% | .52% | .62% | .69% | .56% |
| Expenses net of fee waivers, if any | .50%J | .50% | .52% | .61% | .68% | .56% |
| Expenses net of all reductions | .49%J | .49% | .52% | .61% | .68% | .56% |
| Net investment income (loss) | 2.05%J | 1.94% | 1.60% | 1.59% | 1.43% | 1.58% |
| Supplemental Data | | | | | | |
| Net assets, end of period (in millions) | $5,590 | $6,055 | $5,952 | $5,849 | $6,474 | $6,481 |
| Portfolio turnover rateK | 109%J | 115% | 43% | 30% | 64% | 99% |
A Calculated based on average shares outstanding during the period.
B Net realized and unrealized gain (loss) per share reflects proceeds received from litigation which amounted to $.03 per share. Excluding these litigation proceeds, the total return would have been (2.15)%.
C Net realized and unrealized gain (loss) per share reflects proceeds received from litigation which amounted to $.01 per share. Excluding these litigation proceeds, the total return would have been .22%.
D Total distributions of $2.82 per share is comprised of distributions from net investment income of $.465 and distributions from net realized gain of $2.358 per share.
E Total distributions of $6.01 per share is comprised of distributions from net investment income of $.512 and distributions from net realized gain of $5.493 per share.
F Total returns for periods of less than one year are not annualized.
G Total returns would have been lower if certain expenses had not been reduced during the applicable periods shown.
H Fees and expenses of any underlying Fidelity Central Funds are not included in the Fund's expense ratio. The Fund indirectly bears its proportionate share of the expenses of any underlying Fidelity Central Funds.
I Expense ratios reflect operating expenses of the class. Expenses before reductions do not reflect amounts reimbursed by the investment adviser or reductions from brokerage service arrangements or reductions from other expense offset arrangements and do not represent the amount paid by the class during periods when reimbursements or reductions occur. Expenses net of fee waivers reflect expenses after reimbursement by the investment adviser but prior to reductions from brokerage service arrangements or other expense offset arrangements. Expenses net of all reductions represent the net expenses paid by the class.
J Annualized
K Amount does not include the portfolio activity of any underlying Fidelity Central Funds.
See accompanying notes which are an integral part of the financial statements.
Fidelity Dividend Growth Fund Class K
| | Six months ended (Unaudited) January 31, | Years endedJuly 31, | | | | |
| | 2019 | 2018 | 2017 | 2016 | 2015 | 2014 |
| Selected Per–Share Data | | | | | | |
| Net asset value, beginning of period | $33.76 | $35.04 | $31.50 | $34.45 | $37.27 | $35.34 |
| Income from Investment Operations | | | | | | |
| Net investment income (loss)A | .32 | .69 | .56 | .52 | .53 | .60 |
| Net realized and unrealized gain (loss) | (.76)B | 3.71 | 3.53 | (.61)C | 2.70 | 4.97 |
| Total from investment operations | (.44) | 4.40 | 4.09 | (.09) | 3.23 | 5.57 |
| Distributions from net investment income | (.63) | (.64) | (.55) | (.50) | (.56) | (.42) |
| Distributions from net realized gain | (5.20) | (5.04) | – | (2.36) | (5.49) | (3.23) |
| Total distributions | (5.84)D | (5.68) | (.55) | (2.86) | (6.05) | (3.64)E |
| Net asset value, end of period | $27.48 | $33.76 | $35.04 | $31.50 | $34.45 | $37.27 |
| Total ReturnF,G | (1.93)%B | 13.70% | 13.16% | .39%C | 9.65% | 17.44% |
| Ratios to Average Net AssetsH,I | | | | | | |
| Expenses before reductions | .40%J | .40% | .41% | .50% | .57% | .44% |
| Expenses net of fee waivers, if any | .40%J | .40% | .41% | .50% | .57% | .43% |
| Expenses net of all reductions | .39%J | .39% | .41% | .49% | .57% | .43% |
| Net investment income (loss) | 2.16%J | 2.05% | 1.71% | 1.71% | 1.54% | 1.70% |
| Supplemental Data | | | | | | |
| Net assets, end of period (in millions) | $887 | $1,212 | $1,477 | $1,691 | $1,942 | $2,057 |
| Portfolio turnover rateK | 109%J | 115% | 43% | 30% | 64% | 99% |
A Calculated based on average shares outstanding during the period.
B Net realized and unrealized gain (loss) per share reflects proceeds received from litigation which amounted to $.04 per share. Excluding these litigation proceeds, the total return would have been (2.05)%.
C Net realized and unrealized gain (loss) per share reflects proceeds received from litigation which amounted to $.01 per share. Excluding these litigation proceeds, the total return would have been .35%.
D Total distributions of $5.84 per share is comprised of distributions from net investment income of $.632 and distributions from net realized gain of $5.203 per share.
E Total distributions of $3.64 per share is comprised of distributions from net investment income of $.419 and distributions from net realized gain of $3.225 per share.
F Total returns for periods of less than one year are not annualized.
G Total returns would have been lower if certain expenses had not been reduced during the applicable periods shown.
H Fees and expenses of any underlying Fidelity Central Funds are not included in the Fund's expense ratio. The Fund indirectly bears its proportionate share of the expenses of any underlying Fidelity Central Funds.
I Expense ratios reflect operating expenses of the class. Expenses before reductions do not reflect amounts reimbursed by the investment adviser or reductions from brokerage service arrangements or reductions from other expense offset arrangements and do not represent the amount paid by the class during periods when reimbursements or reductions occur. Expenses net of fee waivers reflect expenses after reimbursement by the investment adviser but prior to reductions from brokerage service arrangements or other expense offset arrangements. Expenses net of all reductions represent the net expenses paid by the class.
J Annualized
K Amount does not include the portfolio activity of any underlying Fidelity Central Funds.
See accompanying notes which are an integral part of the financial statements.
Notes to Financial Statements (Unaudited)
For the period ended January 31, 2019
(Amounts in thousands except percentages)
1. Organization.
Fidelity Dividend Growth Fund (the Fund) is a fund of Fidelity Securities Fund (the Trust) and is authorized to issue an unlimited number of shares. The Trust is registered under the Investment Company Act of 1940, as amended (the 1940 Act), as an open-end management investment company organized as a Massachusetts business trust. The Fund offers Dividend Growth and Class K shares, each of which has equal rights as to assets and voting privileges. Each class has exclusive voting rights with respect to matters that affect that class.
2. Investments in Fidelity Central Funds.
The Fund invests in Fidelity Central Funds, which are open-end investment companies generally available only to other investment companies and accounts managed by the investment adviser and its affiliates. The Fund's Schedule of Investments lists each of the Fidelity Central Funds held as of period end, if any, as an investment of the Fund, but does not include the underlying holdings of each Fidelity Central Fund. As an Investing Fund, the Fund indirectly bears its proportionate share of the expenses of the underlying Fidelity Central Funds.
The Money Market Central Funds seek preservation of capital and current income and are managed by Fidelity Investments Money Management, Inc. (FIMM), an affiliate of the investment adviser. Annualized expenses of the Money Market Central Funds as of their most recent shareholder report date are less than .005%.
A complete unaudited list of holdings for each Fidelity Central Fund is available upon request or at the Securities and Exchange Commission (the SEC) website at www.sec.gov. In addition, the financial statements of the Fidelity Central Funds are available on the SEC website or upon request.
3. Significant Accounting Policies.
The Fund is an investment company and applies the accounting and reporting guidance of the Financial Accounting Standards Board (FASB) Accounting Standards Codification Topic 946 Financial Services – Investments Companies. The financial statements have been prepared in conformity with accounting principles generally accepted in the United States of America (GAAP), which require management to make certain estimates and assumptions at the date of the financial statements. Actual results could differ from those estimates. Subsequent events, if any, through the date that the financial statements were issued have been evaluated in the preparation of the financial statements. The following summarizes the significant accounting policies of the Fund:
Investment Valuation. Investments are valued as of 4:00 p.m. Eastern time on the last calendar day of the period. The Board of Trustees (the Board) has delegated the day to day responsibility for the valuation of the Fund's investments to the Fair Value Committee (the Committee) established by the Fund's investment adviser. In accordance with valuation policies and procedures approved by the Board, the Fund attempts to obtain prices from one or more third party pricing vendors or brokers to value its investments. When current market prices, quotations or currency exchange rates are not readily available or reliable, investments will be fair valued in good faith by the Committee, in accordance with procedures adopted by the Board. Factors used in determining fair value vary by investment type and may include market or investment specific events. The frequency with which these procedures are used cannot be predicted and they may be utilized to a significant extent. The Committee oversees the Fund's valuation policies and procedures and reports to the Board on the Committee's activities and fair value determinations. The Board monitors the appropriateness of the procedures used in valuing the Fund's investments and ratifies the fair value determinations of the Committee.
The Fund categorizes the inputs to valuation techniques used to value its investments into a disclosure hierarchy consisting of three levels as shown below:
- Level 1 – quoted prices in active markets for identical investments
- Level 2 – other significant observable inputs (including quoted prices for similar investments, interest rates, prepayment speeds, etc.)
- Level 3 – unobservable inputs (including the Fund's own assumptions based on the best information available)
Valuation techniques used to value the Fund's investments by major category are as follows:
Equity securities, including restricted securities, for which market quotations are readily available, are valued at the last reported sale price or official closing price as reported by a third party pricing vendor on the primary market or exchange on which they are traded and are categorized as Level 1 in the hierarchy. In the event there were no sales during the day or closing prices are not available, securities are valued at the last quoted bid price or may be valued using the last available price and are generally categorized as Level 2 in the hierarchy. For foreign equity securities, when market or security specific events arise, comparisons to the valuation of American Depositary Receipts (ADRs), futures contracts, Exchange-Traded Funds (ETFs) and certain indexes as well as quoted prices for similar securities may be used and would be categorized as Level 2 in the hierarchy. For equity securities, including restricted securities, where observable inputs are limited, assumptions about market activity and risk are used and these securities may be categorized as Level 3 in the hierarchy.
Investments in open-end mutual funds, including the Fidelity Central Funds, are valued at their closing net asset value (NAV) each business day and are categorized as Level 1 in the hierarchy.
Changes in valuation techniques may result in transfers in or out of an assigned level within the disclosure hierarchy. The aggregate value of investments by input level as of January 31, 2019 is included at the end of the Fund's Schedule of Investments.
Foreign Currency. The Fund may use foreign currency contracts to facilitate transactions in foreign-denominated securities. Gains and losses from these transactions may arise from changes in the value of the foreign currency or if the counterparties do not perform under the contracts' terms.
Foreign-denominated assets, including investment securities, and liabilities are translated into U.S. dollars at the exchange rates at period end. Purchases and sales of investment securities, income and dividends received and expenses denominated in foreign currencies are translated into U.S. dollars at the exchange rate in effect on the transaction date.
The effects of exchange rate fluctuations on investments are included with the net realized and unrealized gain (loss) on investment securities. Other foreign currency transactions resulting in realized and unrealized gain (loss) are disclosed separately.
Investment Transactions and Income. For financial reporting purposes, the Fund's investment holdings and NAV include trades executed through the end of the last business day of the period. The NAV per share for processing shareholder transactions is calculated as of the close of business of the New York Stock Exchange (NYSE), normally 4:00 p.m. Eastern time and includes trades executed through the end of the prior business day. Gains and losses on securities sold are determined on the basis of identified cost and include proceeds received from litigation. Dividend income is recorded on the ex-dividend date, except for certain dividends from foreign securities where the ex-dividend date may have passed, which are recorded as soon as the Fund is informed of the ex-dividend date. Non-cash dividends included in dividend income, if any, are recorded at the fair market value of the securities received. Income and capital gain distributions from Fidelity Central Funds, if any, are recorded on the ex-dividend date. Certain distributions received by the Fund represent a return of capital or capital gain. The Fund determines the components of these distributions subsequent to the ex-dividend date, based upon receipt of tax filings or other correspondence relating to the underlying investment. These distributions are recorded as a reduction of cost of investments and/or as a realized gain. Investment income is recorded net of foreign taxes withheld where recovery of such taxes is uncertain.
Class Allocations and Expenses. Investment income, realized and unrealized capital gains and losses, common expenses of the Fund, and certain fund-level expense reductions, if any, are allocated daily on a pro-rata basis to each class based on the relative net assets of each class to the total net assets of the Fund. Each class differs with respect to transfer agent fees incurred. Certain expense reductions may also differ by class. For the reporting period, the allocated portion of income and expenses to each class as a percent of its average net assets may vary due to the timing of recording these transactions in relation to fluctuating net assets of the classes. Expenses directly attributable to a fund are charged to that fund. Expenses attributable to more than one fund are allocated among the respective funds on the basis of relative net assets or other appropriate methods. Expense estimates are accrued in the period to which they relate and adjustments are made when actual amounts are known.
Deferred Trustee Compensation. Under a Deferred Compensation Plan (the Plan) for the Fund, certain independent Trustees have elected to defer receipt of a portion of their annual compensation. Deferred amounts are invested in a cross-section of Fidelity funds, are marked-to-market and remain in the Fund until distributed in accordance with the Plan. The investment of deferred amounts and the offsetting payable to the Trustees of $425 are included in the accompanying Statement of Assets and Liabilities in other receivables and other payables and accrued expenses, respectively.
Income Tax Information and Distributions to Shareholders. Each year, the Fund intends to qualify as a regulated investment company under Subchapter M of the Internal Revenue Code, including distributing substantially all of its taxable income and realized gains. As a result, no provision for U.S. Federal income taxes is required. The Fund files a U.S. federal tax return, in addition to state and local tax returns as required. The Fund's federal income tax returns are subject to examination by the Internal Revenue Service (IRS) for a period of three fiscal years after they are filed. State and local tax returns may be subject to examination for an additional fiscal year depending on the jurisdiction. Foreign taxes are provided for based on the Fund's understanding of the tax rules and rates that exist in the foreign markets in which it invests.
Distributions are declared and recorded on the ex-dividend date. Income and capital gain distributions are declared separately for each class. Income and capital gain distributions are determined in accordance with income tax regulations, which may differ from GAAP.
Capital accounts within the financial statements are adjusted for permanent book-tax differences. These adjustments have no impact on net assets or the results of operations. Capital accounts are not adjusted for temporary book-tax differences which will reverse in a subsequent period.
Book-tax differences are primarily due to foreign currency transactions, partnerships, passive foreign investment companies (PFIC), deferred trustees compensation and losses deferred due to wash sales.
As of period end, the cost and unrealized appreciation (depreciation) in securities, and derivatives if applicable, for federal income tax purposes were as follows:
| Gross unrealized appreciation | $593,089 |
| Gross unrealized depreciation | (280,634) |
| Net unrealized appreciation (depreciation) | $312,455 |
| Tax cost | $6,186,749 |
New Rule Issuance. During August 2018, the U.S. Securities and Exchange Commission issued Final Rule Release No. 33-10532, Disclosure Update and Simplification. This Final Rule includes amendments specific to registered investment companies that are intended to eliminate overlap in disclosure requirements between Regulation S-X and GAAP. In accordance with these amendments, certain line-items in the Fund's financial statements have been combined or removed for the current period as outlined in the table below.
| Financial Statement | Current Line-Item Presentation (As Applicable) | Prior Line-Item Presentation (As Applicable) |
| Statement of Assets and Liabilities | Total distributable earnings (loss) | Undistributed/Distributions in excess of/Accumulated net investment income (loss)
Accumulated/Undistributed net realized gain (loss)
Net unrealized appreciation (depreciation) |
| Statement of Changes in Net Assets | N/A - removed | Undistributed/Distributions in excess of/Accumulated net investment income (loss) end of period |
| Statement of Changes in Net Assets | Distributions to shareholders | Distributions to shareholders from net investment income
Distributions to shareholders from net realized gain |
| Distributions to Shareholders Note to Financial Statements | Distributions to shareholders | Distributions to shareholders from net investment income
Distributions to shareholders from net realized gain |
4. Purchases and Sales of Investments.
Purchases and sales of securities, other than short-term securities, aggregated $3,606,391 and $4,255,766, respectively.
5. Fees and Other Transactions with Affiliates.
Management Fee. Fidelity Management & Research Company (the investment adviser) and its affiliates provide the Fund with investment management related services for which the Fund pays a monthly management fee. The management fee is the sum of an individual fund fee rate that is based on an annual rate of .30% of the Fund's average net assets and an annualized group fee rate that averaged .24% during the period. The group fee rate is based upon the average net assets of all the mutual funds advised by the investment adviser, including any mutual funds previously advised by the investment adviser that are currently advised by Fidelity SelectCo, LLC, an affiliate of the investment adviser. The group fee rate decreases as assets under management increase and increases as assets under management decrease. In addition, the management fee is subject to a performance adjustment (up to a maximum of +/- .20% of the Fund's average net assets over a 36 month performance period). The upward or downward adjustment to the management fee is based on the relative investment performance of Dividend Growth as compared to its benchmark index, the S&P 500 Index, over the same 36 month performance period. For the reporting period, the total annualized management fee rate, including the performance adjustment, was .33% of the Fund's average net assets. The performance adjustment included in the management fee rate may be higher or lower than the maximum performance adjustment rate due to the difference between the average net assets for the reporting and performance periods.
Transfer Agent Fees. Fidelity Investments Institutional Operations Company, Inc., (FIIOC), an affiliate of the investment adviser, is the transfer, dividend disbursing and shareholder servicing agent for each class of the Fund. FIIOC receives account fees and asset-based fees that vary according to the account size and type of account of the shareholders of Dividend Growth, except for Class K. FIIOC receives an asset-based fee of Class K's average net assets. FIIOC pays for typesetting, printing and mailing of shareholder reports, except proxy statements.
For the period, transfer agent fees for each class were as follows:
| | Amount | % of Class-Level Average Net Assets(a) |
| Dividend Growth | $4,335 | .15 |
| Class K | 246 | .05 |
| | $4,581 | |
(a) Annualized
Accounting and Security Lending Fees. Fidelity Service Company, Inc. (FSC), an affiliate of the investment adviser, maintains the Fund's accounting records. The accounting fee is based on the level of average net assets for each month. Under a separate contract, FSC administers the security lending program. The security lending fee is based on the number and duration of lending transactions. For the period, the fees were equivalent to an annualized rate of .02%.
Brokerage Commissions. The Fund placed a portion of its portfolio transactions with brokerage firms which are affiliates of the investment adviser. Brokerage commissions are included in net realized gain (loss) and change in net unrealized appreciation (depreciation) in the Statement of Operations. The commissions paid to these affiliated firms were $94 for the period.
Interfund Trades. The Fund may purchase from or sell securities to other Fidelity Funds under procedures adopted by the Board. The procedures have been designed to ensure these interfund trades are executed in accordance with Rule 17a-7 of the 1940 Act. Interfund trades are included within the respective purchases and sales amounts shown in the Purchases and Sales of Investments note.
Other. During the period, the investment adviser reimbursed the Fund for certain losses in the amount of $50.
6. Committed Line of Credit.
The Fund participates with other funds managed by the investment adviser or an affiliate in a $4.25 billion credit facility (the "line of credit") to be utilized for temporary or emergency purposes to fund shareholder redemptions or for other short-term liquidity purposes. The Fund has agreed to pay commitment fees on its pro-rata portion of the line of credit, which amounted to $9 and is reflected in Miscellaneous expenses on the Statement of Operations. During the period, the Fund did not borrow on this line of credit.
7. Security Lending.
The Fund lends portfolio securities through a lending agent from time to time in order to earn additional income. For equity securities, a lending agent is used and may loan securities to certain qualified borrowers, including Fidelity Capital Markets (FCM), a broker-dealer affiliated with the Fund. On the settlement date of the loan, the Fund receives collateral (in the form of U.S. Treasury obligations, letters of credit and/or cash) against the loaned securities and maintains collateral in an amount not less than 100% of the market value of the loaned securities during the period of the loan. The market value of the loaned securities is determined at the close of business of the Fund and any additional required collateral is delivered to the Fund on the next business day. The Fund or borrower may terminate the loan at any time, and if the borrower defaults on its obligation to return the securities loaned because of insolvency or other reasons, the Fund may apply collateral received from the borrower against the obligation. The Fund may experience delays and costs in recovering the securities loaned. Any cash collateral received is invested in the Fidelity Securities Lending Cash Central Fund. The value of loaned securities and cash collateral at period end are disclosed on the Fund's Statement of Assets and Liabilities. At period end, there were no security loans outstanding with FCM. Security lending income represents the income earned on investing cash collateral, less rebates paid to borrowers and any lending agent fees associated with the loan, plus any premium payments received for lending certain types of securities. Security lending income is presented in the Statement of Operations as a component of income from Fidelity Central Funds. Total security lending income during the period amounted to $19, including $1 from securities loaned to FCM.
8. Expense Reductions.
Commissions paid to certain brokers with whom the investment adviser, or its affiliates, places trades on behalf of the Fund include an amount in addition to trade execution, which may be rebated back to the Fund to offset certain expenses. This amount totaled $367 for the period. In addition, through arrangements with the Fund's custodian, credits realized as a result of certain uninvested cash balances were used to reduce the Fund's expenses. During the period, these credits reduced the Fund's custody expenses by $2.
In addition, during the period the investment adviser reimbursed and/or waived a portion of fund-level operating expenses in the amount of $25.
9. Distributions to Shareholders.
Distributions to shareholders of each class were as follows:
| | Six months ended
January 31, 2019 | Year ended
July 31, 2018 |
| Distributions to shareholders | | |
| Dividend Growth | $1,046,442 | $– |
| Class K | 202,066 | – |
| Total | $1,248,508 | $– |
| From net investment income | | |
| Dividend Growth | $– | $102,569 |
| Class K | – | 24,695 |
| Total | $– | $127,264 |
| From net realized gain | | |
| Dividend Growth | $– | $860,821 |
| Class K | – | 192,651 |
| Total | $– | $1,053,472 |
10. Share Transactions.
Share transactions for each class were as follows and may contain automatic conversions between classes or exchanges between affiliated funds:
| | Shares | Shares | Dollars | Dollars |
| | Six months ended January 31, 2019 | Year ended July 31, 2018 | Six months ended January 31, 2019 | Year ended July 31, 2018 |
| Dividend Growth | | | | |
| Shares sold | 6,823 | 6,817 | $194,082 | $228,121 |
| Reinvestment of distributions | 34,200 | 28,012 | 997,153 | 919,157 |
| Shares redeemed | (17,048) | (25,386) | (484,634) | (851,332) |
| Net increase (decrease) | 23,975 | 9,443 | $706,601 | $295,946 |
| Class K | | | | |
| Shares sold | 2,890 | 6,726 | $84,209 | $224,545 |
| Reinvestment of distributions | 6,925 | 6,626 | 202,066 | 217,347 |
| Shares redeemed | (13,431) | (19,611) | (387,984) | (660,869) |
| Net increase (decrease) | (3,616) | (6,259) | $(101,709) | $(218,977) |
11. Other.
The Fund's organizational documents provide former and current trustees and officers with a limited indemnification against liabilities arising in connection with the performance of their duties to the Fund. In the normal course of business, the Fund may also enter into contracts that provide general indemnifications. The Fund's maximum exposure under these arrangements is unknown as this would be dependent on future claims that may be made against the Fund. The risk of material loss from such claims is considered remote.
Shareholder Expense Example
As a shareholder of the Fund, you incur two types of costs: (1) transaction costs, and (2) ongoing costs, including other Fund expenses. This Example is intended to help you understand your ongoing costs (in dollars) of investing in the Fund and to compare these costs with the ongoing costs of investing in other mutual funds.
The Example is based on an investment of $1,000 invested at the beginning of the period and held for the entire period (August 1, 2018 to January 31, 2019).
Actual Expenses
The first line of the accompanying table for each class of the Fund provides information about actual account values and actual expenses. You may use the information in this line, together with the amount you invested, to estimate the expenses that you paid over the period. Simply divide your account value by $1,000.00 (for example, an $8,600 account value divided by $1,000.00 = 8.6), then multiply the result by the number in the first line for a class of the Fund under the heading entitled "Expenses Paid During Period" to estimate the expenses you paid on your account during this period. In addition, the Fund, as a shareholder in the underlying Fidelity Central Funds, will indirectly bear its pro-rata share of the fees and expenses incurred by the underlying Fidelity Central Funds. These fees and expenses are not included in the Fund's annualized expense ratio used to calculate the expense estimate in the table below.
Hypothetical Example for Comparison Purposes
The second line of the accompanying table for each class of the Fund provides information about hypothetical account values and hypothetical expenses based on a Class' actual expense ratio and an assumed rate of return of 5% per year before expenses, which is not the Class' actual return. The hypothetical account values and expenses may not be used to estimate the actual ending account balance or expenses you paid for the period. You may use this information to compare the ongoing costs of investing in the Fund and other funds. To do so, compare this 5% hypothetical example with the 5% hypothetical examples that appear in the shareholder reports of the other funds. In addition, the Fund, as a shareholder in the underlying Fidelity Central Funds, will indirectly bear its pro-rata share of the fees and expenses incurred by the underlying Fidelity Central Funds. These fees and expenses are not included in the Fund's annualized expense ratio used to calculate the expense estimate in the table below.
Please note that the expenses shown in the table are meant to highlight your ongoing costs only and do not reflect any transaction costs. Therefore, the second line of the table is useful in comparing ongoing costs only, and will not help you determine the relative total costs of owning different funds.
| | Annualized Expense Ratio-A | Beginning
Account Value
August 1, 2018 | Ending
Account Value
January 31, 2019 | Expenses Paid
During Period-B
August 1, 2018
to January 31, 2019 |
| Dividend Growth | .50% | | | |
| Actual | | $1,000.00 | $979.70 | $2.49 |
| Hypothetical-C | | $1,000.00 | $1,022.68 | $2.55 |
| Class K | .40% | | | |
| Actual | | $1,000.00 | $980.70 | $2.00 |
| Hypothetical-C | | $1,000.00 | $1,023.19 | $2.04 |
A Annualized expense ratio reflects expenses net of applicable fee waivers.
B Expenses are equal to each Class' annualized expense ratio, multiplied by the average account value over the period, multiplied by 184/365 (to reflect the one-half year period).
C 5% return per year before expenses
Board Approval of Investment Advisory Contracts and Management Fees
Fidelity Dividend Growth Fund
Each year, the Board of Trustees, including the Independent Trustees (together, the Board), votes on the renewal of the management contract with Fidelity Management & Research Company (FMR) and the sub-advisory agreements (together, the Advisory Contracts) for the fund. FMR and the sub-advisers are referred to herein as the Investment Advisers. The Board, assisted by the advice of fund counsel and Independent Trustees' counsel, requests and considers a broad range of information relevant to the renewal of the Advisory Contracts throughout the year.
The Board meets regularly and, at each of its meetings, covers an extensive agenda of topics and materials and considers factors that are relevant to its annual consideration of the renewal of the fund's Advisory Contracts, including the services and support provided to the fund and its shareholders. The Board has established various standing committees (Committees), each composed of and chaired by Independent Trustees with varying backgrounds, to which the Board has assigned specific subject matter responsibilities in order to enhance effective decision-making by the Board. The Board, acting directly and through its Committees, requests and receives information concerning the annual consideration of the renewal of the fund's Advisory Contracts. The Board also meets as needed to review matters specifically related to the Board's annual consideration of the renewal of the Advisory Contracts. Members of the Board may also meet with trustees of other Fidelity funds through joint ad hoc committees to discuss certain matters relevant to all of the Fidelity funds.
At its January 2019 meeting, the Board unanimously determined to renew the fund's Advisory Contracts. In reaching its determination, the Board considered all factors it believed relevant, including (i) the nature, extent, and quality of the services to be provided to the fund and its shareholders (including the investment performance of the fund); (ii) the competitiveness of the fund's management fee and total expense ratio relative to peer funds; (iii) the total costs of the services to be provided by and the profits to be realized by Fidelity from its relationships with the fund; and (iv) the extent to which, if any, economies of scale exist and would be realized as the fund grows, and whether any economies of scale are appropriately shared with fund shareholders.
In considering whether to renew the Advisory Contracts for the fund, the Board reached a determination, with the assistance of fund counsel and Independent Trustees' counsel and through the exercise of its business judgment, that the renewal of the Advisory Contracts was in the best interests of the fund and its shareholders and that the compensation payable under the Advisory Contracts was fair and reasonable. The Board's decision to renew the Advisory Contracts was not based on any single factor, but rather was based on a comprehensive consideration of all the information provided to the Board at its meetings throughout the year. The Board, in reaching its determination to renew the Advisory Contracts, was aware that shareholders of the fund have a broad range of investment choices available to them, including a wide choice among funds offered by Fidelity's competitors, and that the fund's shareholders, who have the opportunity to review and weigh the disclosure provided by the fund in its prospectus and other public disclosures, have chosen to invest in this fund, which is part of the Fidelity family of funds.
Nature, Extent, and Quality of Services Provided. The Board considered Fidelity's staffing as it relates to the fund, including the backgrounds of investment personnel of Fidelity, and also considered the fund's investment objective, strategies, and related investment philosophy. The Independent Trustees also had discussions with senior management of Fidelity's investment operations and investment groups. The Board considered the structure of the investment personnel compensation program and whether this structure provides appropriate incentives to act in the best interests of the fund. Additionally, the Board considered the portfolio managers' investments, if any, in the funds that they manage.
Resources Dedicated to Investment Management and Support Services. The Board and the Fund Oversight and Research Committees reviewed the general qualifications and capabilities of Fidelity's investment staff, including its size, education, experience, and resources, as well as Fidelity's approach to recruiting, training, managing, and compensating investment personnel. The Board noted that Fidelity has continued to increase the resources devoted to non-U.S. offices, including expansion of Fidelity's global investment organization. The Board also noted that Fidelity's analysts have extensive resources, tools and capabilities that allow them to conduct sophisticated quantitative and fundamental analysis, as well as credit analysis of issuers, counterparties and guarantors. Further, the Board considered that Fidelity's investment professionals have sufficient access to global information and data so as to provide competitive investment results over time, and that those professionals also have access to sophisticated tools that permit them to assess portfolio construction and risk and performance attribution characteristics continuously, as well as to transmit new information and research conclusions rapidly around the world. Additionally, in its deliberations, the Board considered Fidelity's trading, risk management, compliance, and technology and operations capabilities and resources, which are integral parts of the investment management process.
Shareholder and Administrative Services. The Board considered (i) the nature, extent, quality, and cost of advisory, administrative, and shareholder services performed by the Investment Advisers and their affiliates under the Advisory Contracts and under separate agreements covering transfer agency, pricing and bookkeeping, and securities lending services for the fund; (ii) the nature and extent of the supervision of third party service providers, principally custodians, subcustodians, and pricing vendors; and (iii) the resources devoted to, and the record of compliance with, the fund's compliance policies and procedures. The Board also reviewed the allocation of fund brokerage, including allocations to brokers affiliated with the Investment Advisers, the use of brokerage commissions to pay fund expenses, and the use of "soft" commission dollars to pay for research services.
The Board noted that the growth of fund assets over time across the complex allows Fidelity to reinvest in the development of services designed to enhance the value and convenience of the Fidelity funds as investment vehicles. These services include 24-hour access to account information and market information through telephone representatives and over the Internet, investor education materials and asset allocation tools, and the expanded availability of Fidelity Investor Centers.
The Board noted that it and the boards of certain other Fidelity funds had formed an ad hoc Committee on Transfer Agency Fees to review the variety of transfer agency fee structures throughout the industry and Fidelity's competitive positioning with respect to industry participants.
Investment in a Large Fund Family. The Board considered the benefits to shareholders of investing in a Fidelity fund, including the benefits of investing in a fund that is part of a large family of funds offering a variety of investment disciplines and providing a large variety of mutual fund investor services. The Board noted that Fidelity had taken, or had made recommendations that resulted in the Fidelity funds taking, a number of actions over the previous year that benefited particular funds, including: (i) continuing to dedicate additional resources to Fidelity's investment research process, which includes meetings with management of issuers of securities in which the funds invest, and to the support of the senior management team that oversees asset management; (ii) continuing efforts to enhance Fidelity's global research capabilities; (iii) launching new funds and making other enhancements to meet client needs; (iv) launching new share classes of existing funds; (v) eliminating purchase minimums and broadening eligibility requirements for certain funds and share classes; (vi) reducing management fees and total expenses for certain growth equity funds and index funds; (vii) lowering expense caps for certain existing funds and classes, and converting certain voluntary expense caps to contractual caps, to reduce expenses borne by shareholders; (viii) eliminating short-term redemption fees for funds that had such fees; (ix) rationalizing product lines and gaining increased efficiencies from fund mergers and share class consolidations; (x) continuing to develop, acquire and implement systems and technology to improve services to the funds and shareholders, strengthen information security, and increase efficiency; and (xi) continuing to implement enhancements to further strengthen Fidelity's product line to increase investors' probability of success in achieving their investment goals, including retirement income goals.
Investment Performance. The Board considered whether the fund has operated in accordance with its investment objective, as well as its record of compliance with its investment restrictions and its performance history. The fund had a portfolio manager change in April 2017 and January 2018. The Board will continue to monitor closely the fund's performance, taking into account the portfolio manager changes.
The Board took into account discussions that occur at Board meetings throughout the year with representatives of the Investment Advisers about fund investment performance. In this regard the Board noted that as part of regularly scheduled fund reviews and other reports to the Board on fund performance, the Board considers annualized return information for the fund for different time periods, measured against an appropriate securities market index ("benchmark index") and a peer group of funds with similar objectives ("peer group"), if any. In its evaluation of fund investment performance, the Board gave particular attention to information indicating changes in performance of certain Fidelity funds for specific time periods and discussed with the Investment Advisers the reasons for any overperformance or underperformance.
In addition to reviewing absolute and relative fund performance, the Independent Trustees periodically consider the appropriateness of fund performance metrics in evaluating the results achieved. In general, the Independent Trustees believe that fund performance should be evaluated based on net performance (after fees and expenses) of both the highest performing and lowest performing fund share classes, where applicable, compared to appropriate benchmark indices, over appropriate time periods that may include full market cycles, and compared to peer groups, as applicable, over the same periods, taking into account relevant factors including the following: general market conditions; issuer-specific information; and fund cash flows and other factors.
The Independent Trustees recognize that shareholders evaluate performance on a net basis over their own holding periods, for which one-, three-, and five-year periods are often used as a proxy. For this reason, the performance information reviewed by the Board also included net cumulative total return information for the fund and an appropriate benchmark index and peer group for the most recent one-, three-, and five-year periods ended June 30, 2018, as shown below. Returns are shown compared to the 25th percentile (top of box, 75% beaten) and 75th percentile (bottom of box, 25% beaten) of the peer universe.
Fidelity Dividend Growth Fund

The Board considered the fund's underperformance for different time periods based on the June 30, 2018 data presented above and based on earlier periods ended prior to June 30, 2018. The Board noted that the fund's underperformance has continued since the Board approved the management contract in 2016 and 2017. The Board's discussions with FMR regarding underperformance cover topics including, but not limited to: the longer-term track record of a fund's portfolio manager(s); broader trends in the market that may adversely impact a fund's performance; attribution reports on contributors to the fund's underperformance; and the applicable portfolio manager's explanation of his or her underperformance. The Board engages with FMR on steps that might be taken to address a fund's underperformance. For a fund with underperformance over longer periods of time, the Board typically monitors the effect of any remedial actions and other relevant factors.
The Board also considered that the fund's management fee is subject to upward or downward adjustment depending upon whether, and to what extent, the fund's investment performance for the performance period (a rolling 36-month period) exceeds, or is exceeded by, a securities index, thus leading to a performance adjustment for the same period. The Board noted that the performance adjustment provides FMR with a strong economic incentive to seek to achieve superior long-term performance for the fund's shareholders and helps to more closely align the interests of FMR and the shareholders of the fund.
Based on its review, the Board concluded that the nature, extent, and quality of services provided to the fund under the Advisory Contracts should continue to benefit the shareholders of the fund.
Competitiveness of Management Fee and Total Expense Ratio. The Board considered the fund's management fee and total expense ratio compared to "mapped groups" of competitive funds and classes created for the purpose of facilitating the Trustees' competitive analysis of management fees and total expenses. Fidelity creates "mapped groups" by combining similar Lipper investment objective categories that have comparable investment mandates. Combining Lipper investment objective categories aids the Board's management fee and total expense ratio comparisons by broadening the competitive group used for comparison.
Management Fee. The Board considered two proprietary management fee comparisons for the 12-month periods (ended June 30 for 2018 and December 31 for prior periods) shown in basis points (BP) in the chart below. The group of Lipper funds used by the Board for management fee comparisons is referred to below as the "Total Mapped Group." The Total Mapped Group comparison focuses on a fund's standing in terms of gross management fees before expense reimbursements or caps, and without giving effect to the fund's performance adjustment, relative to the total universe of funds with comparable investment mandates, regardless of whether their management fee structures also are comparable. Funds with comparable investment mandates offer exposure to similar types of securities. Funds with comparable management fee structures have similar management fee contractual arrangements (
e.g., flat rate charged for advisory services, all-inclusive fee rate,
etc.). "TMG %" represents the percentage of funds in the Total Mapped Group that had management fees that were lower than the fund's. For example, a hypothetical TMG % of 20% would mean that 80% of the funds in the Total Mapped Group had higher, and 20% had lower, management fees than the fund. The fund's actual TMG %s and the number of funds in the Total Mapped Group are in the chart below. The "Asset-Size Peer Group" (ASPG) comparison focuses on a fund's standing relative to a subset of non-Fidelity funds within the Total Mapped Group that are similar in size and management fee structure without taking into account performance adjustments, if any. For example, if a fund is in the first quartile of the ASPG, the fund's management fee ranks in the least expensive or lowest 25% of funds in the ASPG. The ASPG represents at least 15% of the funds in the Total Mapped Group with comparable asset size and management fee structures, subject to a minimum of 50 funds (or all funds in the Total Mapped Group if fewer than 50). Additional information, such as the ASPG quartile in which the fund's management fee rate ranked and the impact of the fund's performance adjustment, is also included in the chart and was considered by the Board.
Fidelity Dividend Growth Fund

The Board noted that the fund's management fee rate ranked below the median of its Total Mapped Group and below the median of its ASPG for the 12-month period ended June 30, 2018. The Board also noted the effect of the fund's performance adjustment, if any, on the fund's management fee ranking.
The Board noted that it and the boards of other Fidelity funds formed an ad hoc Committee on Group Fee, which meets periodically, to conduct an in-depth review of the "group fee" component of the management fee of funds with such management fee structures. The Committee's focus included the mechanics of the group fee, the competitive landscape of group fee structures, Fidelity funds with no group fee component and investment products not included in group fee assets. The Board also considered that, for funds subject to the group fee, FMR agreed to voluntarily waive fees over a specified period of time in amounts designed to account for assets converted from certain funds to certain collective investment trusts.
The Board also noted that, in 2013, the ad hoc Committee on Management Fees was formed to conduct an in-depth review of the management fee rates of Fidelity's active equity mutual funds. The Committee focused on the following areas: (i) standard fee structures; (ii) research consumption and trading evolution; (iii) management fee competitiveness/profitability by category; and (iv) factors that drive institutional pricing.
Based on its review, the Board concluded that the fund's management fee is fair and reasonable in light of the services that the fund receives and the other factors considered.
Total Expense Ratio. In its review of each class's total expense ratio, the Board considered the fund's management fee rate as well as other fund or class expenses, as applicable, such as transfer agent fees, pricing and bookkeeping fees, and custodial, legal, and audit fees. The Board noted the impact of the fund's performance adjustment. The Board also noted that Fidelity may agree to waive fees and expenses from time to time, and the extent to which, if any, it has done so for the fund. As part of its review, the Board also considered the current and historical total expense ratios of each class of the fund compared to competitive fund median expenses. Each class of the fund is compared to those funds and classes in the Total Mapped Group (used by the Board for management fee comparisons) that have a similar sales load structure.
The Board noted that the total expense ratio of each class ranked below the competitive median for the 12-month period ended June 30, 2018.
Fees Charged to Other Fidelity Clients. The Board also considered Fidelity fee structures and other information with respect to clients of Fidelity, such as other funds advised or subadvised by Fidelity, pension plan clients, and other institutional clients with similar mandates. The Board noted that a joint ad hoc committee created by it and the boards of other Fidelity funds periodically reviews and compares Fidelity's institutional investment advisory business with its business of providing services to the Fidelity funds and also noted the most recent findings of the committee. The Board noted that the committee's review included a consideration of the differences in services provided, fees charged, and costs incurred, as well as competition in the markets serving the different categories of clients.
Based on its review of total expense ratios and fees charged to other Fidelity clients, the Board concluded that the total expense ratio of each class of the fund was reasonable in light of the services that the fund and its shareholders receive and the other factors considered.
Costs of the Services and Profitability. The Board considered the revenues earned and the expenses incurred by Fidelity in conducting the business of developing, marketing, distributing, managing, administering and servicing the fund and servicing the fund's shareholders. The Board also considered the level of Fidelity's profits in respect of all the Fidelity funds.
On an annual basis, Fidelity presents to the Board information about the profitability of its relationships with the fund. Fidelity calculates profitability information for each fund, as well as aggregate profitability information for groups of Fidelity funds and all Fidelity funds, using a series of detailed revenue and cost allocation methodologies which originate with the books and records of Fidelity on which Fidelity's audited financial statements are based. The Audit Committee of the Board reviews any significant changes from the prior year's methodologies.
PricewaterhouseCoopers LLP (PwC), auditor to Fidelity and certain Fidelity funds, has been engaged annually by the Board as part of the Board's assessment of Fidelity's profitability analysis. PwC's engagement includes the review and assessment of the methodologies used by Fidelity in determining the revenues and expenses attributable to Fidelity's mutual fund business, and completion of agreed-upon procedures in respect of the mathematical accuracy of the fund profitability information and its conformity to established allocation methodologies. After considering PwC's reports issued under the engagement and information provided by Fidelity, the Board concluded that while other allocation methods may also be reasonable, Fidelity's profitability methodologies are reasonable in all material respects.
The Board also reviewed Fidelity's non-fund businesses and potential indirect benefits such businesses may have received as a result of their association with Fidelity's mutual fund business (i.e., fall-out benefits) as well as cases where Fidelity's affiliates may benefit from the fund's business. The Board noted that changes to fall-out benefits year-over-year reflect business developments at Fidelity's various businesses.
The Board considered the costs of the services provided by and the profits realized by Fidelity in connection with the operation of the fund and was satisfied that the profitability was not excessive.
Economies of Scale. The Board considered whether there have been economies of scale in respect of the management of the Fidelity funds, whether the Fidelity funds (including the fund) have appropriately benefited from any such economies of scale, and whether there is potential for realization of any further economies of scale. The Board considered the extent to which the fund will benefit from economies of scale as assets grow through increased services to the fund, through waivers or reimbursements, or through fee or expense ratio reductions. The Board also noted that a committee (the Economies of Scale Committee) created by it and the boards of other Fidelity funds periodically analyzes whether Fidelity attains economies of scale in respect of the management and servicing of the Fidelity funds, whether the Fidelity funds have appropriately benefited from such economies of scale, and whether there is potential for realization of any further economies of scale.
The Board recognized that the fund's management contract incorporates a "group fee" structure, which provides for lower group fee rates as total group assets increase, and for higher group fee rates as total group assets decrease (with "group assets" defined to include fund assets under FMR's management plus the assets of sector funds previously under FMR's management). FMR calculates the group fee rates based on a tiered asset "breakpoint" schedule that varies based on asset class. The Board considered that the group fee is designed to deliver the benefits of economies of scale to fund shareholders when total Fidelity fund assets increase, even if assets of any particular fund are unchanged or have declined, because some portion of Fidelity's costs are attributable to services provided to all Fidelity funds, and all funds benefit if those costs can be allocated among more assets. The Board concluded that, given the group fee structure, fund shareholders will benefit from lower management fees as group assets increase at the fund complex level, regardless of whether Fidelity achieves any such economies of scale.
The Board concluded, taking into account the analysis of the Economies of Scale Committee, that economies of scale, if any, are being appropriately shared between fund shareholders and Fidelity.
Additional Information Requested by the Board. In order to develop fully the factual basis for consideration of the Fidelity funds' advisory contracts, the Board requested and received additional information on certain topics, including: (i) fund performance trends, in particular the underperformance of certain funds, and Fidelity's long-term strategies for certain funds; (ii) Fidelity's fund profitability methodology, profitability trends for certain funds, and the impact of certain factors on fund profitability results; (iii) metrics for evaluating index fund and ETF performance and information about ETF trading characteristics; (iv) the methodology with respect to the evaluation of competitive fund data and peer group classifications and fee comparisons; (v) the expense structures for different funds and classes; (vi) information regarding other accounts managed by Fidelity, including collective investment trusts; and (vii) Fidelity's philosophies and strategies for evaluating funds and classes with lower or declining asset levels.
Based on its evaluation of all of the conclusions noted above, and after considering all factors it believed relevant, the Board concluded that the advisory fee arrangements are fair and reasonable, and that the fund's Advisory Contracts should be renewed.
DGF-SANN-0319
1.470802.122
Fidelity Flex℠ Funds Fidelity Flex℠ Large Cap Growth Fund
Semi-Annual Report January 31, 2019 |
|
Beginning on January 1, 2021, as permitted by regulations adopted by the Securities and Exchange Commission, paper copies of a fund’s shareholder reports will no longer be sent by mail, unless you specifically request paper copies of the reports from the fund or from your financial intermediary, such as a financial advisor, broker-dealer or bank. Instead, the reports will be made available on a website, and you will be notified by mail each time a report is posted and provided with a website link to access the report.
If you already elected to receive shareholder reports electronically, you will not be affected by this change and you need not take any action. You may elect to receive shareholder reports and other communications from a fund electronically, by contacting your financial intermediary. For Fidelity customers, visit Fidelity's web site or call Fidelity using the contact information listed below.
You may elect to receive all future reports in paper free of charge. If you wish to continue receiving paper copies of your shareholder reports, you may contact your financial intermediary or, if you are a Fidelity customer, visit Fidelity’s website, or call Fidelity at the applicable toll-free number listed below. Your election to receive reports in paper will apply to all funds held with the fund complex/your financial intermediary.
| Account Type | Website | Phone Number |
| Brokerage, Mutual Fund, or Annuity Contracts: | fidelity.com/mailpreferences | 1-800-343-3548 |
| Employer Provided Retirement Accounts: | netbenefits.fidelity.com/preferences (choose 'no' under Required Disclosures to continue to print) | 1-800-343-0860 |
| Advisor Sold Accounts Serviced Through Your Financial Intermediary: | Contact Your Financial Intermediary | Your Financial Intermediary's phone number |
| Advisor Sold Accounts Serviced by Fidelity: | institutional.fidelity.com | 1-877-208-0098 |
Contents
To view a fund's proxy voting guidelines and proxy voting record for the 12-month period ended June 30, visit http://www.fidelity.com/proxyvotingresults or visit the Securities and Exchange Commission's (SEC) web site at http://www.sec.gov.
You may also call 1-800-835-5092 to request a free copy of the proxy voting guidelines.
Standard & Poor's, S&P and S&P 500 are registered service marks of The McGraw-Hill Companies, Inc. and have been licensed for use by Fidelity Distributors Corporation.
Other third-party marks appearing herein are the property of their respective owners.
All other marks appearing herein are registered or unregistered trademarks or service marks of FMR LLC or an affiliated company. © 2019 FMR LLC. All rights reserved.
This report and the financial statements contained herein are submitted for the general information of the shareholders of the Fund. This report is not authorized for distribution to prospective investors in the Fund unless preceded or accompanied by an effective prospectus.
A fund files its complete schedule of portfolio holdings with the SEC for the first and third quarters of each fiscal year on Form N-Q. Forms N-Q are available on the SEC’s web site at http://www.sec.gov. A fund's Forms N-Q may be reviewed and copied at the SEC’s Public Reference Room in Washington, DC. Information regarding the operation of the SEC's Public Reference Room may be obtained by calling 1-800-SEC-0330.
For a complete list of a fund's portfolio holdings, view the most recent holdings listing, semiannual report, or annual report on Fidelity's web site at http://www.fidelity.com, http://www.institutional.fidelity.com, or http://www.401k.com, as applicable.
NOT FDIC INSURED •MAY LOSE VALUE •NO BANK GUARANTEE
Neither the Fund nor Fidelity Distributors Corporation is a bank.
Investment Summary (Unaudited)
Top Ten Stocks as of January 31, 2019
| | % of fund's net assets |
| Amazon.com, Inc. | 7.9 |
| Alphabet, Inc. Class A | 7.7 |
| Apple, Inc. | 6.1 |
| Microsoft Corp. | 4.5 |
| Facebook, Inc. Class A | 3.9 |
| Salesforce.com, Inc. | 3.2 |
| Broadcom, Inc. | 2.6 |
| Tesla, Inc. | 2.3 |
| Visa, Inc. Class A | 2.3 |
| NVIDIA Corp. | 1.9 |
| | 42.4 |
Top Five Market Sectors as of January 31, 2019
| | % of fund's net assets |
| Information Technology | 32.4 |
| Consumer Discretionary | 24.0 |
| Communication Services | 16.9 |
| Health Care | 12.0 |
| Industrials | 3.5 |
Asset Allocation (% of fund's net assets)
| As of January 31, 2019* |
| | Stocks | 95.5% |
| | Convertible Securities | 1.5% |
| | Short-Term Investments and Net Other Assets (Liabilities) | 3.0% |

* Foreign investments - 7.5%
Schedule of Investments January 31, 2019 (Unaudited)
Showing Percentage of Net Assets
| Common Stocks - 95.5% | | | |
| | | Shares | Value |
| COMMUNICATION SERVICES - 16.9% | | | |
| Entertainment - 4.4% | | | |
| Activision Blizzard, Inc. | | 3,913 | $184,850 |
| Electronic Arts, Inc. (a) | | 161 | 14,851 |
| NetEase, Inc. ADR | | 27 | 6,802 |
| Netflix, Inc. (a) | | 922 | 313,019 |
| Nintendo Co. Ltd. | | 35 | 10,615 |
| Nintendo Co. Ltd. ADR | | 138 | 5,139 |
| Take-Two Interactive Software, Inc. (a) | | 226 | 23,854 |
| The Walt Disney Co. | | 1,963 | 218,914 |
| | | | 778,044 |
| Interactive Media & Services - 12.4% | | | |
| Alphabet, Inc. Class A (a) | | 1,212 | 1,364,579 |
| ANGI Homeservices, Inc. Class A (a) | | 858 | 14,586 |
| CarGurus, Inc. Class A (a) | | 400 | 17,108 |
| Facebook, Inc. Class A (a) | | 4,138 | 689,763 |
| Momo, Inc. ADR (a) | | 231 | 7,029 |
| Tencent Holdings Ltd. | | 2,095 | 93,258 |
| Twitter, Inc. (a) | | 367 | 12,317 |
| | | | 2,198,640 |
| Media - 0.0% | | | |
| Charter Communications, Inc. Class A (a) | | 5 | 1,655 |
| Wireless Telecommunication Services - 0.1% | | | |
| T-Mobile U.S., Inc. (a) | | 261 | 18,171 |
|
| TOTAL COMMUNICATION SERVICES | | | 2,996,510 |
|
| CONSUMER DISCRETIONARY - 23.8% | | | |
| Auto Components - 0.0% | | | |
| Aptiv PLC | | 24 | 1,899 |
| Automobiles - 2.3% | | | |
| Tesla, Inc. (a) | | 1,353 | 415,398 |
| Hotels, Restaurants & Leisure - 2.1% | | | |
| Boyd Gaming Corp. | | 530 | 14,480 |
| Caesars Entertainment Corp. (a) | | 1,133 | 10,356 |
| Chipotle Mexican Grill, Inc. (a) | | 6 | 3,178 |
| Eldorado Resorts, Inc. (a) | | 596 | 27,786 |
| Gaming VC Holdings SA | | 378 | 3,332 |
| Haidilao International Holding Ltd. (b) | | 2,140 | 5,030 |
| Hilton Grand Vacations, Inc. (a) | | 171 | 5,188 |
| Hilton Worldwide Holdings, Inc. | | 143 | 10,651 |
| Hyatt Hotels Corp. Class A | | 46 | 3,216 |
| Kambi Group PLC (a) | | 392 | 8,881 |
| Marriott International, Inc. Class A | | 419 | 47,988 |
| McDonald's Corp. | | 372 | 66,506 |
| MGM Mirage, Inc. | | 437 | 12,865 |
| Penn National Gaming, Inc. (a) | | 445 | 10,787 |
| Planet Fitness, Inc. (a) | | 613 | 35,505 |
| PlayAGS, Inc. (a) | | 320 | 8,019 |
| Restaurant Brands International, Inc. | | 229 | 14,354 |
| Royal Caribbean Cruises Ltd. | | 289 | 34,694 |
| Sea Ltd. ADR (a) | | 402 | 5,632 |
| Shake Shack, Inc. Class A (a) | | 234 | 11,176 |
| Starbucks Corp. | | 100 | 6,814 |
| Wynn Resorts Ltd. | | 147 | 18,082 |
| | | | 364,520 |
| Household Durables - 0.3% | | | |
| D.R. Horton, Inc. | | 330 | 12,689 |
| iRobot Corp. (a) | | 37 | 3,322 |
| Lennar Corp. Class A | | 288 | 13,657 |
| Mohawk Industries, Inc. (a) | | 26 | 3,349 |
| Roku, Inc. Class A (a) | | 310 | 13,935 |
| | | | 46,952 |
| Internet & Direct Marketing Retail - 10.1% | | | |
| Alibaba Group Holding Ltd. sponsored ADR (a) | | 908 | 152,989 |
| Amazon.com, Inc. (a) | | 812 | 1,395,606 |
| eBay, Inc. | | 362 | 12,181 |
| Etsy, Inc. (a) | | 244 | 13,335 |
| GrubHub, Inc. (a) | | 96 | 7,718 |
| JD.com, Inc. sponsored ADR (a) | | 1,356 | 33,697 |
| The Booking Holdings, Inc. (a) | | 79 | 144,792 |
| Wayfair LLC Class A (a) | | 352 | 38,530 |
| | | | 1,798,848 |
| Multiline Retail - 1.2% | | | |
| Avenue Supermarts Ltd. (a)(b) | | 73 | 1,414 |
| Dollar General Corp. | | 86 | 9,927 |
| Dollar Tree, Inc. (a) | | 1,832 | 177,393 |
| Ollie's Bargain Outlet Holdings, Inc. (a) | | 63 | 4,925 |
| Target Corp. | | 207 | 15,111 |
| | | | 208,770 |
| Specialty Retail - 4.7% | | | |
| American Eagle Outfitters, Inc. | | 1,011 | 21,352 |
| At Home Group, Inc. (a) | | 1,433 | 31,583 |
| Best Buy Co., Inc. | | 362 | 21,445 |
| Burlington Stores, Inc. (a) | | 266 | 45,675 |
| Carvana Co. Class A (a) | | 254 | 9,436 |
| Five Below, Inc. (a) | | 254 | 31,427 |
| Floor & Decor Holdings, Inc. Class A (a) | | 570 | 19,545 |
| Home Depot, Inc. | | 1,685 | 309,248 |
| Lowe's Companies, Inc. | | 1,852 | 178,088 |
| Ross Stores, Inc. | | 347 | 31,966 |
| The Children's Place Retail Stores, Inc. | | 54 | 5,225 |
| Tiffany & Co., Inc. | | 235 | 20,852 |
| TJX Companies, Inc. | | 1,328 | 66,041 |
| Ulta Beauty, Inc. (a) | | 155 | 45,248 |
| | | | 837,131 |
| Textiles, Apparel & Luxury Goods - 3.1% | | | |
| adidas AG | | 361 | 85,822 |
| Allbirds, Inc. (c)(d) | | 43 | 2,358 |
| Canada Goose Holdings, Inc. (a) | | 315 | 16,204 |
| lululemon athletica, Inc. (a) | | 1,022 | 151,062 |
| Moncler SpA | | 490 | 18,452 |
| NIKE, Inc. Class B | | 1,613 | 132,072 |
| Pinduoduo, Inc. ADR | | 1,632 | 47,671 |
| PVH Corp. | | 583 | 63,611 |
| Under Armour, Inc. Class C (non-vtg.) (a) | | 1,302 | 24,660 |
| | | | 541,912 |
|
| TOTAL CONSUMER DISCRETIONARY | | | 4,215,430 |
|
| CONSUMER STAPLES - 3.0% | | | |
| Beverages - 0.4% | | | |
| Fever-Tree Drinks PLC | | 845 | 28,494 |
| Keurig Dr. Pepper, Inc. | | 1,400 | 38,108 |
| Monster Beverage Corp. (a) | | 157 | 8,987 |
| Pernod Ricard SA | | 8 | 1,328 |
| | | | 76,917 |
| Food & Staples Retailing - 1.1% | | | |
| BJ's Wholesale Club Holdings, Inc. | | 1,868 | 49,147 |
| Costco Wholesale Corp. | | 603 | 129,422 |
| Kroger Co. | | 368 | 10,425 |
| | | | 188,994 |
| Food Products - 0.1% | | | |
| Darling International, Inc. (a) | | 292 | 6,211 |
| Nestle SA (Reg. S) | | 19 | 1,656 |
| The a2 Milk Co. Ltd. (a) | | 406 | 3,550 |
| | | | 11,417 |
| Household Products - 0.0% | | | |
| MTG Co. Ltd. | | 100 | 4,411 |
| Procter & Gamble Co. | | 54 | 5,209 |
| | | | 9,620 |
| Personal Products - 0.3% | | | |
| Coty, Inc. Class A | | 2,956 | 22,939 |
| Estee Lauder Companies, Inc. Class A | | 273 | 37,243 |
| | | | 60,182 |
| Tobacco - 1.1% | | | |
| Altria Group, Inc. | | 2,710 | 133,739 |
| JUUL Labs, Inc. Class A (c)(d) | | 217 | 54,152 |
| | | | 187,891 |
|
| TOTAL CONSUMER STAPLES | | | 535,021 |
|
| ENERGY - 1.1% | | | |
| Oil, Gas & Consumable Fuels - 1.1% | | | |
| Anadarko Petroleum Corp. | | 426 | 20,163 |
| Berry Petroleum Corp. | | 360 | 4,244 |
| Continental Resources, Inc. (a) | | 630 | 29,087 |
| Diamondback Energy, Inc. | | 89 | 9,178 |
| EOG Resources, Inc. | | 83 | 8,234 |
| Hess Corp. | | 83 | 4,482 |
| Pioneer Natural Resources Co. | | 83 | 11,813 |
| Reliance Industries Ltd. | | 3,518 | 60,839 |
| Whiting Petroleum Corp. (a) | | 1,249 | 35,759 |
| | | | 183,799 |
| FINANCIALS - 2.5% | | | |
| Banks - 1.0% | | | |
| Bank of America Corp. | | 4,187 | 119,204 |
| Coastal Financial Corp. of Washington (a) | | 400 | 5,948 |
| ICICI Bank Ltd. sponsored ADR | | 338 | 3,451 |
| IndusInd Bank Ltd. | | 95 | 2,016 |
| JPMorgan Chase & Co. | | 416 | 43,056 |
| Kotak Mahindra Bank Ltd. | | 291 | 5,150 |
| | | | 178,825 |
| Capital Markets - 0.6% | | | |
| Charles Schwab Corp. | | 968 | 45,273 |
| Edelweiss Financial Services Ltd. | | 619 | 1,344 |
| Morgan Stanley | | 80 | 3,384 |
| TD Ameritrade Holding Corp. | | 817 | 45,711 |
| | | | 95,712 |
| Diversified Financial Services - 0.7% | | | |
| Berkshire Hathaway, Inc. Class B (a) | | 599 | 123,118 |
| GDS Holdings Ltd. ADR (a) | | 247 | 7,015 |
| | | | 130,133 |
| Insurance - 0.1% | | | |
| eHealth, Inc. (a) | | 233 | 14,250 |
| Thrifts & Mortgage Finance - 0.1% | | | |
| Housing Development Finance Corp. Ltd. | | 365 | 9,888 |
| LendingTree, Inc. (a) | | 49 | 14,521 |
| | | | 24,409 |
|
| TOTAL FINANCIALS | | | 443,329 |
|
| HEALTH CARE - 12.0% | | | |
| Biotechnology - 5.0% | | | |
| ACADIA Pharmaceuticals, Inc. (a) | | 144 | 3,280 |
| Acceleron Pharma, Inc. (a) | | 140 | 5,936 |
| Agios Pharmaceuticals, Inc. (a) | | 39 | 2,090 |
| Aimmune Therapeutics, Inc. (a) | | 302 | 7,103 |
| Alexion Pharmaceuticals, Inc. (a) | | 1,398 | 171,898 |
| Allakos, Inc. (a) | | 222 | 8,869 |
| Allogene Therapeutics, Inc. | | 188 | 5,702 |
| Alnylam Pharmaceuticals, Inc. (a) | | 558 | 46,610 |
| Amgen, Inc. | | 384 | 71,850 |
| AnaptysBio, Inc. (a) | | 98 | 6,499 |
| Arena Pharmaceuticals, Inc. (a) | | 187 | 8,596 |
| Argenx SE ADR (a) | | 33 | 3,502 |
| Array BioPharma, Inc. (a) | | 300 | 5,601 |
| Ascendis Pharma A/S sponsored ADR (a) | | 175 | 12,506 |
| BeiGene Ltd. | | 331 | 3,279 |
| BeiGene Ltd. ADR (a) | | 79 | 10,229 |
| bluebird bio, Inc. (a) | | 194 | 25,885 |
| Blueprint Medicines Corp. (a) | | 31 | 2,235 |
| Cellectis SA sponsored ADR (a) | | 40 | 707 |
| Coherus BioSciences, Inc. (a) | | 288 | 3,876 |
| Crinetics Pharmaceuticals, Inc. (a) | | 87 | 2,286 |
| Deciphera Pharmaceuticals, Inc. (a) | | 33 | 887 |
| Denali Therapeutics, Inc. (a) | | 448 | 8,539 |
| Editas Medicine, Inc. (a) | | 238 | 5,172 |
| Epizyme, Inc. (a) | | 139 | 1,421 |
| Esperion Therapeutics, Inc. (a) | | 140 | 6,503 |
| Exact Sciences Corp. (a) | | 125 | 11,260 |
| FibroGen, Inc. (a) | | 186 | 10,556 |
| Global Blood Therapeutics, Inc. (a) | | 316 | 15,140 |
| Heron Therapeutics, Inc. (a) | | 113 | 3,040 |
| Immunomedics, Inc. (a) | | 252 | 3,727 |
| Intellia Therapeutics, Inc. (a) | | 317 | 4,482 |
| Intercept Pharmaceuticals, Inc. (a) | | 143 | 17,257 |
| Ironwood Pharmaceuticals, Inc. Class A (a) | | 524 | 7,158 |
| Liquidia Technologies, Inc. | | 1,234 | 17,757 |
| Mirati Therapeutics, Inc. (a) | | 78 | 5,154 |
| Moderna, Inc. | | 148 | 2,457 |
| Natera, Inc. (a) | | 510 | 6,931 |
| Neurocrine Biosciences, Inc. (a) | | 351 | 30,965 |
| Portola Pharmaceuticals, Inc. (a) | | 199 | 5,393 |
| Principia Biopharma, Inc. | | 201 | 6,092 |
| Regeneron Pharmaceuticals, Inc. (a) | | 361 | 154,966 |
| Rubius Therapeutics, Inc. | | 66 | 904 |
| Sage Therapeutics, Inc. (a) | | 151 | 21,531 |
| Sarepta Therapeutics, Inc. (a) | | 262 | 36,604 |
| Scholar Rock Holding Corp. | | 89 | 1,345 |
| Synthorx, Inc. | | 155 | 2,184 |
| Ultragenyx Pharmaceutical, Inc. (a) | | 71 | 3,502 |
| Vertex Pharmaceuticals, Inc. (a) | | 376 | 71,782 |
| Viking Therapeutics, Inc. (a) | | 151 | 1,232 |
| Xencor, Inc. (a) | | 200 | 7,220 |
| Zai Lab Ltd. ADR (a) | | 255 | 6,882 |
| | | | 886,582 |
| Health Care Equipment & Supplies - 3.3% | | | |
| Abiomed, Inc. (a) | | 13 | 4,564 |
| Align Technology, Inc. (a) | | 78 | 19,418 |
| Atricure, Inc. (a) | | 108 | 3,343 |
| Axonics Modulation Technologies, Inc. (a) | | 188 | 2,745 |
| Becton, Dickinson & Co. | | 133 | 33,178 |
| Boston Scientific Corp. (a) | | 5,678 | 216,616 |
| Danaher Corp. | | 276 | 30,614 |
| DexCom, Inc. (a) | | 86 | 12,129 |
| Edwards Lifesciences Corp. (a) | | 20 | 3,408 |
| Establishment Labs Holdings, Inc. (a) | | 417 | 11,055 |
| Insulet Corp. (a) | | 123 | 9,986 |
| Intuitive Surgical, Inc. (a) | | 340 | 178,038 |
| iRhythm Technologies, Inc. (a) | | 241 | 20,485 |
| Masimo Corp. (a) | | 14 | 1,741 |
| Novocure Ltd. (a) | | 79 | 3,871 |
| Penumbra, Inc. (a) | | 22 | 3,201 |
| Quanterix Corp. (a) | | 83 | 1,748 |
| Stryker Corp. | | 62 | 11,009 |
| Tandem Diabetes Care, Inc. (a) | | 213 | 9,261 |
| ViewRay, Inc. (a) | | 307 | 2,207 |
| Wright Medical Group NV (a) | | 176 | 5,252 |
| | | | 583,869 |
| Health Care Providers & Services - 2.8% | | | |
| Anthem, Inc. | | 60 | 18,180 |
| Centene Corp. (a) | | 57 | 7,442 |
| Guardant Health, Inc. | | 264 | 10,650 |
| HCA Holdings, Inc. | | 383 | 53,402 |
| Humana, Inc. | | 390 | 120,506 |
| National Vision Holdings, Inc. (a) | | 67 | 2,128 |
| Notre Dame Intermedica Participacoes SA | | 663 | 6,104 |
| OptiNose, Inc. (a) | | 764 | 4,920 |
| UnitedHealth Group, Inc. | | 924 | 249,665 |
| Wellcare Health Plans, Inc. (a) | | 78 | 21,565 |
| | | | 494,562 |
| Health Care Technology - 0.1% | | | |
| Evolent Health, Inc. (a) | | 169 | 2,988 |
| Teladoc Health, Inc. (a) | | 142 | 9,116 |
| | | | 12,104 |
| Life Sciences Tools & Services - 0.0% | | | |
| Thermo Fisher Scientific, Inc. | | 14 | 3,439 |
| Pharmaceuticals - 0.8% | | | |
| Akcea Therapeutics, Inc. (a) | | 417 | 11,084 |
| Allergan PLC | | 44 | 6,335 |
| Assembly Biosciences, Inc. (a) | | 67 | 1,526 |
| AstraZeneca PLC sponsored ADR | | 677 | 24,765 |
| Bristol-Myers Squibb Co. | | 848 | 41,866 |
| Dova Pharmaceuticals, Inc. (a) | | 96 | 737 |
| Jazz Pharmaceuticals PLC (a) | | 189 | 23,793 |
| MyoKardia, Inc. (a) | | 53 | 2,193 |
| Nektar Therapeutics (a) | | 550 | 23,287 |
| The Medicines Company (a) | | 248 | 5,731 |
| TherapeuticsMD, Inc. (a) | | 551 | 2,893 |
| Theravance Biopharma, Inc. (a) | | 20 | 521 |
| Zogenix, Inc. (a) | | 59 | 2,581 |
| | | | 147,312 |
|
| TOTAL HEALTH CARE | | | 2,127,868 |
|
| INDUSTRIALS - 3.5% | | | |
| Aerospace & Defense - 1.1% | | | |
| Elbit Systems Ltd. | | 27 | 3,322 |
| Northrop Grumman Corp. | | 177 | 48,772 |
| The Boeing Co. | | 348 | 134,196 |
| United Technologies Corp. | | 112 | 13,224 |
| | | | 199,514 |
| Airlines - 0.9% | | | |
| American Airlines Group, Inc. | | 613 | 21,927 |
| Delta Air Lines, Inc. | | 862 | 42,609 |
| JetBlue Airways Corp. (a) | | 96 | 1,727 |
| Spirit Airlines, Inc. (a) | | 884 | 51,997 |
| United Continental Holdings, Inc. (a) | | 408 | 35,606 |
| | | | 153,866 |
| Building Products - 0.1% | | | |
| Fortune Brands Home & Security, Inc. | | 426 | 19,298 |
| Masco Corp. | | 40 | 1,296 |
| | | | 20,594 |
| Commercial Services & Supplies - 0.1% | | | |
| HomeServe PLC | | 421 | 5,210 |
| Tomra Systems ASA | | 313 | 8,109 |
| | | | 13,319 |
| Construction & Engineering - 0.1% | | | |
| MasTec, Inc. (a) | | 258 | 11,450 |
| Electrical Equipment - 0.1% | | | |
| Fortive Corp. | | 261 | 19,572 |
| Industrial Conglomerates - 0.4% | | | |
| General Electric Co. | | 2,490 | 25,298 |
| Honeywell International, Inc. | | 292 | 41,940 |
| | | | 67,238 |
| Machinery - 0.5% | | | |
| Deere & Co. | | 411 | 67,404 |
| Rational AG | | 8 | 5,009 |
| Xylem, Inc. | | 309 | 22,019 |
| | | | 94,432 |
| Road & Rail - 0.2% | | | |
| Knight-Swift Transportation Holdings, Inc. Class A | | 1,262 | 40,069 |
| Union Pacific Corp. | | 34 | 5,408 |
| | | | 45,477 |
| Trading Companies & Distributors - 0.0% | | | |
| Ferguson PLC | | 8 | 535 |
|
| TOTAL INDUSTRIALS | | | 625,997 |
|
| INFORMATION TECHNOLOGY - 31.5% | | | |
| Communications Equipment - 0.2% | | | |
| Arista Networks, Inc. (a) | | 94 | 20,189 |
| Telefonaktiebolaget LM Ericsson (B Shares) sponsored ADR | | 904 | 8,055 |
| | | | 28,244 |
| Electronic Equipment & Components - 0.1% | | | |
| Corning, Inc. | | 673 | 22,384 |
| IT Services - 6.3% | | | |
| Adyen BV (b) | | 135 | 100,083 |
| Akamai Technologies, Inc. (a) | | 561 | 36,521 |
| Endava PLC ADR (a) | | 155 | 3,643 |
| GoDaddy, Inc. (a) | | 255 | 17,501 |
| Keywords Studios PLC | | 63 | 985 |
| MasterCard, Inc. Class A | | 1,411 | 297,904 |
| Netcompany Group A/S (b) | | 281 | 9,478 |
| Okta, Inc. (a) | | 29 | 2,390 |
| PayPal Holdings, Inc. (a) | | 1,925 | 170,863 |
| Shopify, Inc. Class A (a) | | 151 | 25,418 |
| Square, Inc. (a) | | 183 | 13,057 |
| Total System Services, Inc. | | 32 | 2,868 |
| Twilio, Inc. Class A (a) | | 37 | 4,119 |
| Visa, Inc. Class A | | 2,961 | 399,765 |
| Wix.com Ltd. (a) | | 228 | 24,932 |
| | | | 1,109,527 |
| Semiconductors & Semiconductor Equipment - 8.3% | | | |
| Acacia Communications, Inc. (a) | | 79 | 3,437 |
| Advanced Micro Devices, Inc. (a) | | 1,222 | 29,829 |
| Analog Devices, Inc. | | 212 | 20,958 |
| ASML Holding NV | | 37 | 6,476 |
| Broadcom, Inc. | | 1,731 | 464,341 |
| Inphi Corp. (a) | | 334 | 13,173 |
| Lam Research Corp. | | 328 | 55,622 |
| Marvell Technology Group Ltd. | | 17,197 | 318,660 |
| Micron Technology, Inc. (a) | | 1,166 | 44,565 |
| Monolithic Power Systems, Inc. | | 285 | 36,070 |
| NVIDIA Corp. | | 2,378 | 341,838 |
| NXP Semiconductors NV | | 744 | 64,750 |
| ON Semiconductor Corp. (a) | | 364 | 7,295 |
| Qualcomm, Inc. | | 944 | 46,747 |
| Xilinx, Inc. | | 234 | 26,194 |
| | | | 1,479,955 |
| Software - 10.5% | | | |
| Adobe, Inc. (a) | | 768 | 190,326 |
| Altair Engineering, Inc. Class A (a) | | 276 | 8,937 |
| Bilibili, Inc. ADR (a) | | 320 | 5,891 |
| CyberArk Software Ltd. (a) | | 21 | 1,843 |
| DocuSign, Inc. | | 404 | 19,978 |
| Dropbox, Inc. Class A (a) | | 597 | 14,752 |
| HubSpot, Inc. (a) | | 84 | 13,298 |
| Intuit, Inc. | | 141 | 30,431 |
| Microsoft Corp. | | 7,682 | 802,231 |
| Paycom Software, Inc. (a) | | 250 | 37,060 |
| RingCentral, Inc. (a) | | 270 | 24,959 |
| SailPoint Technologies Holding, Inc. (a) | | 363 | 10,364 |
| Salesforce.com, Inc. (a) | | 3,696 | 561,681 |
| ServiceNow, Inc. (a) | | 17 | 3,740 |
| Splunk, Inc. (a) | | 56 | 6,991 |
| StoneCo Ltd. Class A (a) | | 300 | 6,636 |
| Tanium, Inc. Class B (a)(c)(d) | | 131 | 1,139 |
| The Trade Desk, Inc. (a) | | 266 | 37,953 |
| Ultimate Software Group, Inc. (a) | | 6 | 1,638 |
| Workday, Inc. Class A (a) | | 327 | 59,360 |
| Zendesk, Inc. (a) | | 138 | 9,319 |
| Zuora, Inc. | | 469 | 10,149 |
| | | | 1,858,676 |
| Technology Hardware, Storage & Peripherals - 6.1% | | | |
| Apple, Inc. | | 6,503 | 1,082,359 |
|
| TOTAL INFORMATION TECHNOLOGY | | | 5,581,145 |
|
| MATERIALS - 1.1% | | | |
| Chemicals - 1.1% | | | |
| CF Industries Holdings, Inc. | | 1,371 | 59,844 |
| DowDuPont, Inc. | | 395 | 21,255 |
| FMC Corp. | | 52 | 4,150 |
| LG Chemical Ltd. | | 12 | 3,970 |
| Nutrien Ltd. | | 397 | 20,567 |
| Sherwin-Williams Co. | | 4 | 1,686 |
| The Chemours Co. LLC | | 1,495 | 53,446 |
| The Mosaic Co. | | 756 | 24,404 |
| Westlake Chemical Corp. | | 88 | 6,503 |
| | | | 195,825 |
| REAL ESTATE - 0.1% | | | |
| Equity Real Estate Investment Trusts (REITs) - 0.1% | | | |
| Ant International Co. Ltd. Class C (c)(d) | | 2,450 | 13,745 |
| TOTAL COMMON STOCKS | | | |
| (Cost $14,499,646) | | | 16,918,669 |
|
| Preferred Stocks - 1.5% | | | |
| Convertible Preferred Stocks - 1.5% | | | |
| CONSUMER DISCRETIONARY - 0.2% | | | |
| Hotels, Restaurants & Leisure - 0.1% | | | |
| Neutron Holdings, Inc.: | | | |
| Series C (c)(d) | | 26,100 | 6,329 |
| Series D (c)(d) | | 58,561 | 14,201 |
| Topgolf International, Inc. Series F (a)(c)(d) | | 217 | 2,582 |
| | | | 23,112 |
| Internet & Direct Marketing Retail - 0.1% | | | |
| The Honest Co., Inc. Series E (a)(c)(d) | | 282 | 5,527 |
| Textiles, Apparel & Luxury Goods - 0.0% | | | |
| Allbirds, Inc.: | | | |
| Series A (c)(d) | | 17 | 932 |
| Series B (c)(d) | | 3 | 165 |
| Series C (c)(d) | | 28 | 1,535 |
| | | | 2,632 |
| TOTAL CONSUMER DISCRETIONARY | | | 31,271 |
| CONSUMER STAPLES - 0.4% | | | |
| Food & Staples Retailing - 0.2% | | | |
| Roofoods Ltd. Series F (a)(c)(d) | | 17 | 4,403 |
| Sweetgreen, Inc. Series H(c)(d) | | 1,969 | 25,676 |
| | | | 30,079 |
| Food Products - 0.0% | | | |
| Agbiome LLC Series C (c)(d) | | 557 | 3,528 |
| Tobacco - 0.2% | | | |
| JUUL Labs, Inc. Series E (c)(d) | | 127 | 31,693 |
| TOTAL CONSUMER STAPLES | | | 65,300 |
| HEALTH CARE - 0.0% | | | |
| Biotechnology - 0.0% | | | |
| 23andMe, Inc. Series F (a)(c)(d) | | 339 | 5,882 |
| Generation Bio Series B (c)(d) | | 200 | 1,400 |
| | | | 7,282 |
| INFORMATION TECHNOLOGY - 0.9% | | | |
| Internet Software & Services - 0.0% | | | |
| ContextLogic, Inc. Series G (a)(c)(d) | | 67 | 9,666 |
| Starry, Inc. Series C (a)(c)(d) | | 3,181 | 2,933 |
| | | | 12,599 |
| Software - 0.9% | | | |
| Bird Rides, Inc. Series C(c)(d) | | 1,434 | 16,843 |
| Cloudflare, Inc. Series D, 8.00% (a)(c)(d) | | 300 | 3,300 |
| Compass, Inc. Series E (a)(c)(d) | | 28 | 3,320 |
| Lyft, Inc.: | | | |
| Series H (a)(c)(d) | | 2,516 | 118,076 |
| Series I (c)(d) | | 289 | 13,563 |
| | | | 155,102 |
| TOTAL INFORMATION TECHNOLOGY | | | 167,701 |
|
| TOTAL CONVERTIBLE PREFERRED STOCKS | | | 271,554 |
|
| Nonconvertible Preferred Stocks - 0.0% | | | |
| CONSUMER DISCRETIONARY - 0.0% | | | |
| Textiles, Apparel & Luxury Goods - 0.0% | | | |
| Allbirds, Inc. (c)(d) | | 9 | 494 |
| TOTAL PREFERRED STOCKS | | | |
| (Cost $223,310) | | | 272,048 |
|
| Money Market Funds - 2.9% | | | |
| Fidelity Cash Central Fund, 2.43% (e) | | | |
| (Cost $516,580) | | 516,477 | 516,580 |
| TOTAL INVESTMENT IN SECURITIES - 99.9% | | | |
| (Cost $15,239,536) | | | 17,707,297 |
| NET OTHER ASSETS (LIABILITIES) - 0.1% | | | 11,867 |
| NET ASSETS - 100% | | | $17,719,164 |
Legend
(a) Non-income producing
(b) Security exempt from registration under Rule 144A of the Securities Act of 1933. These securities may be resold in transactions exempt from registration, normally to qualified institutional buyers. At the end of the period, the value of these securities amounted to $116,005 or 0.7% of net assets.
(c) Restricted securities - Investment in securities not registered under the Securities Act of 1933 (excluding 144A issues). At the end of the period, the value of restricted securities (excluding 144A issues) amounted to $343,441 or 1.9% of net assets.
(d) Level 3 security
(e) Affiliated fund that is generally available only to investment companies and other accounts managed by Fidelity Investments. The rate quoted is the annualized seven-day yield of the fund at period end. A complete unaudited listing of the fund's holdings as of its most recent quarter end is available upon request. In addition, each Fidelity Central Fund's financial statements are available on the SEC's website or upon request.
Additional information on each restricted holding is as follows:
| Security | Acquisition Date | Acquisition Cost |
| 23andMe, Inc. Series F | 8/31/17 | $4,707 |
| Agbiome LLC Series C | 6/29/18 | $3,528 |
| Allbirds, Inc. | 10/9/18 | $494 |
| Allbirds, Inc. | 10/9/18 | $2,358 |
| Allbirds, Inc. Series A | 10/9/18 | $932 |
| Allbirds, Inc. Series B | 10/9/18 | $165 |
| Allbirds, Inc. Series C | 10/9/18 | $1,535 |
| Ant International Co. Ltd. Class C | 5/16/18 | $13,745 |
| Bird Rides, Inc. Series C | 12/21/18 | $16,843 |
| Cloudflare, Inc. Series D, 8.00% | 9/10/18 | $3,300 |
| Compass, Inc. Series E | 11/3/17 | $1,889 |
| ContextLogic, Inc. Series G | 10/24/17 | $9,014 |
| Generation Bio Series B | 2/21/18 | $1,829 |
| JUUL Labs, Inc. Class A | 12/20/17 - 7/6/18 | $5,804 |
| JUUL Labs, Inc. Series E | 12/20/17 - 7/6/18 | $3,263 |
| Lyft, Inc. Series H | 11/22/17 | $100,001 |
| Lyft, Inc. Series I | 6/27/18 | $13,685 |
| Neutron Holdings, Inc. Series C | 7/3/18 | $4,772 |
| Neutron Holdings, Inc. Series D | 1/25/19 | $14,201 |
| Roofoods Ltd. Series F | 9/12/17 | $6,011 |
| Starry, Inc. Series C | 12/8/17 | $2,933 |
| Sweetgreen, Inc. Series H | 11/9/18 | $25,676 |
| Tanium, Inc. Class B | 4/21/17 | $650 |
| The Honest Co., Inc. Series E | 9/28/17 | $5,529 |
| Topgolf International, Inc. Series F | 11/10/17 | $3,002 |
Affiliated Central Funds
Information regarding fiscal year to date income earned by the Fund from investments in Fidelity Central Funds is as follows:
| Fund | Income earned |
| Fidelity Cash Central Fund | $3,549 |
| Total | $3,549 |
Amounts in the income column in the above table include any capital gain distributions from underlying funds, which are presented in the corresponding line-item in the Statement of Operations, if applicable.
Investment Valuation
The following is a summary of the inputs used, as of January 31, 2019, involving the Fund's assets and liabilities carried at fair value. The inputs or methodology used for valuing securities may not be an indication of the risk associated with investing in those securities. For more information on valuation inputs, and their aggregation into the levels used below, please refer to the Investment Valuation section in the accompanying Notes to Financial Statements.
| | Valuation Inputs at Reporting Date: |
| Description | Total | Level 1 | Level 2 | Level 3 |
| Investments in Securities: | | | | |
| Equities: | | | | |
| Communication Services | $2,996,510 | $2,892,637 | $103,873 | $-- |
| Consumer Discretionary | 4,247,195 | 4,208,042 | 5,030 | 34,123 |
| Consumer Staples | 600,321 | 479,213 | 1,656 | 119,452 |
| Energy | 183,799 | 183,799 | -- | -- |
| Financials | 443,329 | 443,329 | -- | -- |
| Health Care | 2,135,150 | 2,124,589 | 3,279 | 7,282 |
| Industrials | 625,997 | 625,997 | -- | -- |
| Information Technology | 5,748,846 | 5,580,006 | -- | 168,840 |
| Materials | 195,825 | 195,825 | -- | -- |
| Real Estate | 13,745 | -- | -- | 13,745 |
| Money Market Funds | 516,580 | 516,580 | -- | -- |
| Total Investments in Securities: | $17,707,297 | $17,250,017 | $113,838 | $343,442 |
The following is a reconciliation of Investments in Securities for which Level 3 inputs were used in determining value:
| Investments in Securities: | |
| Beginning Balance | $252,593 |
| Net Realized Gain (Loss) on Investment Securities | (1,531) |
| Net Unrealized Gain (Loss) on Investment Securities | 76,866 |
| Cost of Purchases | 74,572 |
| Proceeds of Sales | (59,058) |
| Amortization/Accretion | -- |
| Transfers into Level 3 | -- |
| Transfers out of Level 3 | -- |
| Ending Balance | $343,442 |
| The change in unrealized gain (loss) for the period attributable to Level 3 securities held at January 31, 2019 | $76,866 |
The information used in the above reconciliation represents fiscal year to date activity for any Investments in Securities identified as using Level 3 inputs at either the beginning or the end of the current fiscal period. Transfers in or out of Level 3 represent the beginning value of any Security or Instrument where a change in the pricing level occurred from the beginning to the end of the period. The cost of purchases and the proceeds of sales may include securities received or delivered through corporate actions or exchanges. Realized and unrealized gains (losses) disclosed in the reconciliation are included in Net Gain (Loss) on the Fund's Statement of Operations.
See accompanying notes which are an integral part of the financial statements.
Financial Statements
Statement of Assets and Liabilities
| | | January 31, 2019 (Unaudited) |
| Assets | | |
Investment in securities, at value — See accompanying schedule:
Unaffiliated issuers (cost $14,722,956) | $17,190,717 | |
| Fidelity Central Funds (cost $516,580) | 516,580 | |
| Total Investment in Securities (cost $15,239,536) | | $17,707,297 |
| Cash | | 1,519 |
| Foreign currency held at value (cost $1,753) | | 1,753 |
| Receivable for investments sold | | 92,407 |
| Receivable for fund shares sold | | 17,857 |
| Dividends receivable | | 2,024 |
| Distributions receivable from Fidelity Central Funds | | 649 |
| Total assets | | 17,823,506 |
| Liabilities | | |
| Payable for investments purchased | $99,207 | |
| Payable for fund shares redeemed | 5,135 | |
| Total liabilities | | 104,342 |
| Net Assets | | $17,719,164 |
| Net Assets consist of: | | |
| Paid in capital | | $15,466,337 |
| Total distributable earnings (loss) | | 2,252,827 |
| Net Assets, for 1,354,899 shares outstanding | | $17,719,164 |
| Net Asset Value, offering price and redemption price per share ($17,719,164 ÷ 1,354,899 shares) | | $13.08 |
See accompanying notes which are an integral part of the financial statements.
Statement of Operations
| | | Six months ended January 31, 2019 (Unaudited) |
| Investment Income | | |
| Dividends | | $55,753 |
| Income from Fidelity Central Funds | | 3,549 |
| Total income | | 59,302 |
| Expenses | | |
| Independent trustees' fees and expenses | $49 | |
| Miscellaneous | 81 | |
| Total expenses before reductions | 130 | |
| Expense reductions | (41) | |
| Total expenses after reductions | | 89 |
| Net investment income (loss) | | 59,213 |
| Realized and Unrealized Gain (Loss) | | |
| Net realized gain (loss) on: | | |
| Investment securities: | | |
| Unaffiliated issuers | (52,253) | |
| Fidelity Central Funds | 4 | |
| Foreign currency transactions | (165) | |
| Total net realized gain (loss) | | (52,414) |
| Change in net unrealized appreciation (depreciation) on: | | |
| Investment securities: | | |
| Unaffiliated issuers (net of decrease in deferred foreign taxes of $459) | (626,563) | |
| Assets and liabilities in foreign currencies | (27) | |
| Total change in net unrealized appreciation (depreciation) | | (626,590) |
| Net gain (loss) | | (679,004) |
| Net increase (decrease) in net assets resulting from operations | | $(619,791) |
See accompanying notes which are an integral part of the financial statements.
Statement of Changes in Net Assets
| | Six months ended January 31, 2019 (Unaudited) | Year ended July 31, 2018 |
| Increase (Decrease) in Net Assets | | |
| Operations | | |
| Net investment income (loss) | $59,213 | $109,903 |
| Net realized gain (loss) | (52,414) | 248,932 |
| Change in net unrealized appreciation (depreciation) | (626,590) | 2,408,903 |
| Net increase (decrease) in net assets resulting from operations | (619,791) | 2,767,738 |
| Distributions to shareholders | (527,366) | – |
| Distributions to shareholders from net investment income | – | (59,022) |
| Distributions to shareholders from net realized gain | – | (32,969) |
| Total distributions | (527,366) | (91,991) |
| Share transactions | | |
| Proceeds from sales of shares | 6,184,274 | 10,131,063 |
| Reinvestment of distributions | 527,366 | 91,990 |
| Cost of shares redeemed | (2,486,363) | (6,834,098) |
| Net increase (decrease) in net assets resulting from share transactions | 4,225,277 | 3,388,955 |
| Total increase (decrease) in net assets | 3,078,120 | 6,064,702 |
| Net Assets | | |
| Beginning of period | 14,641,044 | 8,576,342 |
| End of period | $17,719,164 | $14,641,044 |
| Other Information | | |
| Undistributed net investment income end of period | | $68,832 |
| Shares | | |
| Sold | 457,912 | 808,079 |
| Issued in reinvestment of distributions | 38,970 | 7,709 |
| Redeemed | (184,444) | (530,535) |
| Net increase (decrease) | 312,438 | 285,253 |
See accompanying notes which are an integral part of the financial statements.
Financial Highlights
Fidelity Flex Large Cap Growth Fund
| | Six months ended (Unaudited) January 31, | Years endedJuly 31, | |
| | 2019 | 2018 | 2017 A |
| Selected Per–Share Data | | | |
| Net asset value, beginning of period | $14.04 | $11.33 | $10.00 |
| Income from Investment Operations | | | |
| Net investment income (loss)B | .05 | .11C | .03 |
| Net realized and unrealized gain (loss) | (.56) | 2.69 | 1.30 |
| Total from investment operations | (.51) | 2.80 | 1.33 |
| Distributions from net investment income | (.11) | (.06) | – |
| Distributions from net realized gain | (.35) | (.04) | – |
| Total distributions | (.45)D | (.09)E | – |
| Net asset value, end of period | $13.08 | $14.04 | $11.33 |
| Total ReturnF,G | (3.71)% | 24.90% | 13.30% |
| Ratios to Average Net AssetsH,I | | | |
| Expenses before reductionsJ | - %K | -% | - %K |
| Expenses net of fee waivers, if anyJ | - %K | -% | - %K |
| Expenses net of all reductionsJ | - %K | -% | - %K |
| Net investment income (loss) | .74%K | .87%C | .79%K |
| Supplemental Data | | | |
| Net assets, end of period (000 omitted) | $17,719 | $14,641 | $8,576 |
| Portfolio turnover rateL | 44%K | 65% | 17%M |
A For the period March 8, 2017 (commencement of operations) to July 31, 2017.
B Calculated based on average shares outstanding during the period.
C Net investment income per share reflects a large, non-recurring dividend which amounted to $.01 per share. Excluding this non-recurring dividend, the ratio of net investment income (loss) to average net assets would have been .77%.
D Total distributions of $.45 per share is comprised of distributions from net investment income of $.107 and distributions from net realized gain of $.347 per share.
E Total distributions of $.09 per share is comprised of distributions from net investment income of $.059 and distributions from net realized gain of $.035 per share.
F Total returns for periods of less than one year are not annualized.
G Total returns would have been lower if certain expenses had not been reduced during the applicable periods shown.
H Fees and expenses of any underlying Fidelity Central Funds are not included in the Fund's expense ratio. The Fund indirectly bears its proportionate share of the expenses of any underlying Fidelity Central Funds.
I Expense ratios reflect operating expenses of the Fund. Expenses before reductions do not reflect amounts reimbursed by the investment adviser or reductions from expense offset arrangements and do not represent the amount paid by the Fund during periods when reimbursements or reductions occur. Expenses net of fee waivers reflect expenses after reimbursement by the investment adviser but prior to reductions from expense offset arrangements. Expenses net of all reductions represent the net expenses paid by the Fund.
J Amount represents less than .005%.
K Annualized
L Amount does not include the portfolio activity of any underlying Fidelity Central Funds.
M Amount not annualized.
See accompanying notes which are an integral part of the financial statements.
Notes to Financial Statements (Unaudited)
For the period ended January 31, 2019
1. Organization.
Fidelity Flex Large Cap Growth Fund (the Fund) is a fund of Fidelity Securities Fund (the Trust) and is authorized to issue an unlimited number of shares. Share transactions on the Statement of Changes in Net Assets may contain exchanges between affiliated funds. The Trust is registered under the Investment Company Act of 1940, as amended (the 1940 Act), as an open-end management investment company organized as a Massachusetts business trust. The Fund is available only to certain fee-based accounts offered by Fidelity.
2. Investments in Fidelity Central Funds.
The Fund invests in Fidelity Central Funds, which are open-end investment companies generally available only to other investment companies and accounts managed by the investment adviser and its affiliates. The Fund's Schedule of Investments lists each of the Fidelity Central Funds held as of period end, if any, as an investment of the Fund, but does not include the underlying holdings of each Fidelity Central Fund. As an Investing Fund, the Fund indirectly bears its proportionate share of the expenses of the underlying Fidelity Central Funds.
The Money Market Central Funds seek preservation of capital and current income and are managed by Fidelity Investments Money Management, Inc. (FIMM), an affiliate of the investment adviser. Annualized expenses of the Money Market Central Funds as of their most recent shareholder report date are less than .005%.
A complete unaudited list of holdings for each Fidelity Central Fund is available upon request or at the Securities and Exchange Commission (the SEC) website at www.sec.gov. In addition, the financial statements of the Fidelity Central Funds are available on the SEC website or upon request.
3. Significant Accounting Policies.
The Fund is an investment company and applies the accounting and reporting guidance of the Financial Accounting Standards Board (FASB) Accounting Standards Codification Topic 946 Financial Services – Investments Companies. The financial statements have been prepared in conformity with accounting principles generally accepted in the United States of America (GAAP), which require management to make certain estimates and assumptions at the date of the financial statements. Actual results could differ from those estimates. Subsequent events, if any, through the date that the financial statements were issued have been evaluated in the preparation of the financial statements. The following summarizes the significant accounting policies of the Fund:
Investment Valuation. Investments are valued as of 4:00 p.m. Eastern time on the last calendar day of the period. The Board of Trustees (the Board) has delegated the day to day responsibility for the valuation of the Fund's investments to the Fair Value Committee (the Committee) established by the Fund's investment adviser. In accordance with valuation policies and procedures approved by the Board, the Fund attempts to obtain prices from one or more third party pricing vendors or brokers to value its investments. When current market prices, quotations or currency exchange rates are not readily available or reliable, investments will be fair valued in good faith by the Committee, in accordance with procedures adopted by the Board. Factors used in determining fair value vary by investment type and may include market or investment specific events. The frequency with which these procedures are used cannot be predicted and they may be utilized to a significant extent. The Committee oversees the Fund's valuation policies and procedures and reports to the Board on the Committee's activities and fair value determinations. The Board monitors the appropriateness of the procedures used in valuing the Fund's investments and ratifies the fair value determinations of the Committee.
The Fund categorizes the inputs to valuation techniques used to value its investments into a disclosure hierarchy consisting of three levels as shown below:
- Level 1 – quoted prices in active markets for identical investments
- Level 2 – other significant observable inputs (including quoted prices for similar investments, interest rates, prepayment speeds, etc.)
- Level 3 – unobservable inputs (including the Fund's own assumptions based on the best information available)
Valuation techniques used to value the Fund's investments by major category are as follows:
Equity securities, including restricted securities, for which market quotations are readily available, are valued at the last reported sale price or official closing price as reported by a third party pricing vendor on the primary market or exchange on which they are traded and are categorized as Level 1 in the hierarchy. In the event there were no sales during the day or closing prices are not available, securities are valued at the last quoted bid price or may be valued using the last available price and are generally categorized as Level 2 in the hierarchy. For foreign equity securities, when market or security specific events arise, comparisons to the valuation of American Depositary Receipts (ADRs), futures contracts, Exchange-Traded Funds (ETFs) and certain indexes as well as quoted prices for similar securities may be used and would be categorized as Level 2 in the hierarchy. For equity securities, including restricted securities, where observable inputs are limited, assumptions about market activity and risk are used and these securities may be categorized as Level 3 in the hierarchy. Equity securities, including restricted securities, for which observable inputs are not available are valued using alternate valuation approaches, including the market approach and the income approach and are categorized as Level 3 in the hierarchy. The market approach generally consists of using comparable market transactions while the income approach generally consists of using the net present value of estimated future cash flows, adjusted as appropriate for liquidity, credit, market and/or other risk factors.
Investments in open-end mutual funds, including the Fidelity Central Funds, are valued at their closing net asset value (NAV) each business day and are categorized as Level 1 in the hierarchy.
The following provides information on Level 3 securities held by the Fund that were valued at period end based on unobservable inputs. These amounts exclude valuations provided by a broker.
| Asset Type | Fair Value | Valuation Technique (s) | Unobservable Input | Amount or Range / Weighted Average | Impact to Valuation from an Increase in Input(a) |
| Equities | $343,442 | Market approach | Transaction price | $0.24 - $277.28 / $134.34 | Increase |
| | | | Discount rate | 10.0% | Decrease |
| | | Market comparable | Transaction price | $9.15 | Increase |
| | | | Enterprise value/Sales multiple (EV/S) | 1.2 - 3.2 / 2.6 | Increase |
| | | | Discount rate | 30.0% - 78.0% / 31.7% | Decrease |
| | | | Discount for lack of marketability | 10.0% | Decrease |
| | | | Proxy discount | 23.4% | Decrease |
| | | | Premium rate | 9.0% | Increase |
| | | | Liquidity preference | $19.60 | Increase |
(a) Represents the directional change in the fair value of the Level 3 investments that could have resulted from an increase in the corresponding input as of period end. A decrease to the unobservable input would have had the opposite effect. Significant changes in these inputs may have resulted in a significantly higher or lower fair value measurement at period end.
Changes in valuation techniques may result in transfers in or out of an assigned level within the disclosure hierarchy. The aggregate value of investments by input level as of January 31, 2019, as well as a roll forward of Level 3 investments, is included at the end of the Fund's Schedule of Investments.
Foreign Currency. The Fund may use foreign currency contracts to facilitate transactions in foreign-denominated securities. Gains and losses from these transactions may arise from changes in the value of the foreign currency or if the counterparties do not perform under the contracts' terms.
Foreign-denominated assets, including investment securities, and liabilities are translated into U.S. dollars at the exchange rates at period end. Purchases and sales of investment securities, income and dividends received and expenses denominated in foreign currencies are translated into U.S. dollars at the exchange rate in effect on the transaction date.
The effects of exchange rate fluctuations on investments are included with the net realized and unrealized gain (loss) on investment securities. Other foreign currency transactions resulting in realized and unrealized gain (loss) are disclosed separately.
Investment Transactions and Income. For financial reporting purposes, the Fund's investment holdings and NAV include trades executed through the end of the last business day of the period. The NAV per share for processing shareholder transactions is calculated as of the close of business of the New York Stock Exchange (NYSE), normally 4:00 p.m. Eastern time and includes trades executed through the end of the prior business day. Gains and losses on securities sold are determined on the basis of identified cost. Dividend income is recorded on the ex-dividend date, except for certain dividends from foreign securities where the ex-dividend date may have passed, which are recorded as soon as the Fund is informed of the ex-dividend date. Non-cash dividends included in dividend income, if any, are recorded at the fair market value of the securities received. Income and capital gain distributions from Fidelity Central Funds, if any, are recorded on the ex-dividend date. Certain distributions received by the Fund represent a return of capital or capital gain. The Fund determines the components of these distributions subsequent to the ex-dividend date, based upon receipt of tax filings or other correspondence relating to the underlying investment. These distributions are recorded as a reduction of cost of investments and/or as a realized gain. Interest income is accrued as earned and includes coupon interest and amortization of premium and accretion of discount on debt securities as applicable. Investment income is recorded net of foreign taxes withheld where recovery of such taxes is uncertain.
Expenses. Expenses directly attributable to a fund are charged to that fund. Expenses attributable to more than one fund are allocated among the respective funds on the basis of relative net assets or other appropriate methods. Expense estimates are accrued in the period to which they relate and adjustments are made when actual amounts are known.
Income Tax Information and Distributions to Shareholders. Each year, the Fund intends to qualify as a regulated investment company under Subchapter M of the Internal Revenue Code, including distributing substantially all of its taxable income and realized gains. As a result, no provision for U.S. Federal income taxes is required. The Fund files a U.S. federal tax return, in addition to state and local tax returns as required. The Fund's federal income tax returns are subject to examination by the Internal Revenue Service (IRS) for a period of three fiscal years after they are filed. State and local tax returns may be subject to examination for an additional fiscal year depending on the jurisdiction. Foreign taxes are provided for based on the Fund's understanding of the tax rules and rates that exist in the foreign markets in which it invests.
Distributions are declared and recorded on the ex-dividend date. Income and capital gain distributions are determined in accordance with income tax regulations, which may differ from GAAP.
Capital accounts within the financial statements are adjusted for permanent book-tax differences. These adjustments have no impact on net assets or the results of operations. Capital accounts are not adjusted for temporary book-tax differences which will reverse in a subsequent period.
Book-tax differences are primarily due to foreign currency transactions, partnerships, passive foreign investment companies (PFIC) and losses deferred due to wash sales.
As of period end, the cost and unrealized appreciation (depreciation) in securities, and derivatives if applicable, for federal income tax purposes were as follows:
| Gross unrealized appreciation | $3,016,250 |
| Gross unrealized depreciation | (600,877) |
| Net unrealized appreciation (depreciation) | $2,415,373 |
| Tax cost | $15,291,924 |
Restricted Securities. The Fund may invest in securities that are subject to legal or contractual restrictions on resale. These securities generally may be resold in transactions exempt from registration or to the public if the securities are registered. Disposal of these securities may involve time-consuming negotiations and expense, and prompt sale at an acceptable price may be difficult. Information regarding restricted securities is included at the end of the Fund's Schedule of Investments.
New Rule Issuance. During August 2018, the U.S. Securities and Exchange Commission issued Final Rule Release No. 33-10532, Disclosure Update and Simplification. This Final Rule includes amendments specific to registered investment companies that are intended to eliminate overlap in disclosure requirements between Regulation S-X and GAAP. In accordance with these amendments, certain line-items in the Fund's financial statements have been combined or removed for the current period as outlined in the table below.
| Financial Statement | Current Line-Item Presentation (As Applicable) | Prior Line-Item Presentation (As Applicable) |
| Statement of Assets and Liabilities | Total distributable earnings (loss) | Undistributed/Distributions in excess of/Accumulated net investment income (loss)
Accumulated/Undistributed net realized gain (loss)
Net unrealized appreciation (depreciation) |
| Statement of Changes in Net Assets | N/A - removed | Undistributed/Distributions in excess of/Accumulated net investment income (loss) end of period |
| Statement of Changes in Net Assets | Distributions to shareholders | Distributions to shareholders from net investment income
Distributions to shareholders from net realized gain |
4. Purchases and Sales of Investments.
Purchases and sales of securities, other than short-term securities, aggregated $7,230,934 and $3,477,679, respectively.
5. Fees and Other Transactions with Affiliates.
Management Fee. Fidelity Management & Research Company (the investment adviser) and its affiliates provide the Fund with investment management related services and the Fund does not pay any fees for these services. Under the management contract, the investment adviser or an affiliate pays all other expenses of the Fund, excluding fees and expenses of the independent Trustees, and certain miscellaneous expenses such as proxy and shareholder meeting expenses.
Brokerage Commissions. The Fund placed a portion of its portfolio transactions with brokerage firms which are affiliates of the investment adviser. Brokerage commissions are included in net realized gain (loss) and change in net unrealized appreciation (depreciation) in the Statement of Operations. The commissions paid to these affiliated firms were $341 for the period.
Interfund Trades. The Fund may purchase from or sell securities to other Fidelity Funds under procedures adopted by the Board. The procedures have been designed to ensure these interfund trades are executed in accordance with Rule 17a-7 of the 1940 Act. Interfund trades are included within the respective purchases and sales amounts shown in the Purchases and Sales of Investments note.
6. Committed Line of Credit.
The Fund participates with other funds managed by the investment adviser or an affiliate in a $4.25 billion credit facility (the "line of credit") to be utilized for temporary or emergency purposes to fund shareholder redemptions or for other short-term liquidity purposes. The Fund has agreed to pay commitment fees on its pro-rata portion of the line of credit, which amounted to $20 and is reflected in Miscellaneous expenses on the Statement of Operations. During the period, the Fund did not borrow on this line of credit.
7. Expense Reductions.
Through arrangements with the Fund's custodian, credits realized as a result of certain uninvested cash balances were used to reduce the Fund's expenses. During the period, these credits reduced the Fund's custody expenses by $41.
8. Other.
The Fund's organizational documents provide former and current trustees and officers with a limited indemnification against liabilities arising in connection with the performance of their duties to the Fund. In the normal course of business, the Fund may also enter into contracts that provide general indemnifications. The Fund's maximum exposure under these arrangements is unknown as this would be dependent on future claims that may be made against the Fund. The risk of material loss from such claims is considered remote
At the end of the period, the investment adviser or its affiliates were the owners of record of 38% of the total outstanding shares of the Fund.
Shareholder Expense Example
As a shareholder of the Fund, you incur two types of costs: (1) transaction costs, and (2) ongoing costs, including other Fund expenses. This Example is intended to help you understand your ongoing costs (in dollars) of investing in the Fund and to compare these costs with the ongoing costs of investing in other mutual funds.
The Example is based on an investment of $1,000 invested at the beginning of the period and held for the entire period (August 1, 2018 to January 31, 2019).
Actual Expenses
The first line of the accompanying table provides information about actual account values and actual expenses. You may use the information in this line, together with the amount you invested, to estimate the expenses that you paid over the period. Simply divide your account value by $1,000.00 (for example, an $8,600 account value divided by $1,000.00 = 8.6), then multiply the result by the number in the first line under the heading entitled "Expenses Paid During Period" to estimate the expenses you paid on your account during this period. In addition, the Fund, as a shareholder in the underlying Fidelity Central Funds, will indirectly bear its pro-rata share of the fees and expenses incurred by the underlying Fidelity Central Funds. These fees and expenses are not included in the Fund's annualized expense ratio used to calculate the expense estimate in the table below.
Hypothetical Example for Comparison Purposes
The second line of the accompanying table provides information about hypothetical account values and hypothetical expenses based on the Fund's actual expense ratio and an assumed rate of return of 5% per year before expenses, which is not the Fund's actual return. The hypothetical account values and expenses may not be used to estimate the actual ending account balance or expenses you paid for the period. You may use this information to compare the ongoing costs of investing in the Fund and other funds. To do so, compare this 5% hypothetical example with the 5% hypothetical examples that appear in the shareholder reports of the other funds. In addition, the Fund, as a shareholder in the underlying Fidelity Central Funds, will indirectly bear its pro-rata share of the fees and expenses incurred by the underlying Fidelity Central Funds. These fees and expenses are not included in the Fund's annualized expense ratio used to calculate the expense estimate in the table below.
Please note that the expenses shown in the table are meant to highlight your ongoing costs only and do not reflect any transaction costs. Therefore, the second line of the table is useful in comparing ongoing costs only, and will not help you determine the relative total costs of owning different funds.
| | Annualized Expense Ratio-A | Beginning
Account Value
August 1, 2018 | Ending
Account Value
January 31, 2019 | Expenses Paid
During Period-B
August 1, 2018
to January 31, 2019 |
| Actual | - %-C | $1,000.00 | $962.90 | $--D |
| Hypothetical-E | | $1,000.00 | $1,025.21 | $--D |
A Annualized expense ratio reflects expenses net of applicable fee waivers.
B Expenses are equal to the Fund's annualized expense ratio, multiplied by the average account value over the period, multiplied by 184/365 (to reflect the one-half year period).
C Amount represents less than .005%.
D Amount represents less than $.005.
E 5% return per year before expenses
Board Approval of Investment Advisory Contracts and Management Fees
Fidelity Flex Large Cap Growth Fund
Each year, the Board of Trustees, including the Independent Trustees (together, the Board), votes on the renewal of the management contract with Fidelity Management & Research Company (FMR) and the sub-advisory agreements (together, the Advisory Contracts) for the fund. FMR and the sub-advisers are referred to herein as the Investment Advisers. The Board, assisted by the advice of fund counsel and Independent Trustees' counsel, requests and considers a broad range of information relevant to the renewal of the Advisory Contracts throughout the year.
The Board meets regularly and, at each of its meetings, covers an extensive agenda of topics and materials and considers factors that are relevant to its annual consideration of the renewal of the fund's Advisory Contracts, including the services and support provided to the fund and its shareholders. The Board has established various standing committees (Committees), each composed of and chaired by Independent Trustees with varying backgrounds, to which the Board has assigned specific subject matter responsibilities in order to enhance effective decision-making by the Board. The Board, acting directly and through its Committees, requests and receives information concerning the annual consideration of the renewal of the fund's Advisory Contracts. The Board also meets as needed to review matters specifically related to the Board's annual consideration of the renewal of the Advisory Contracts. Members of the Board may also meet with trustees of other Fidelity funds through joint ad hoc committees to discuss certain matters relevant to all of the Fidelity funds.
At its January 2019 meeting, the Board unanimously determined to renew the fund's Advisory Contracts. In considering whether to renew the Advisory Contracts for the fund, the Board considered all factors it believed relevant and reached a determination, with the assistance of fund counsel and Independent Trustees' counsel and through the exercise of its business judgment, that the renewal of the Advisory Contracts was in the best interests of the fund and its shareholders and the fact that no fee is payable under the management contract was fair and reasonable.
Nature, Extent, and Quality of Services Provided. The Board considered Fidelity's staffing as it relates to the fund, including the backgrounds of investment personnel of Fidelity, and also considered the fund's investment objective, strategies, and related investment philosophy. The Independent Trustees also had discussions with senior management of Fidelity's investment operations and investment groups. The Board considered the structure of the investment personnel compensation program and whether this structure provides appropriate incentives to act in the best interests of the fund. Additionally, the Board considered the portfolio managers' investments, if any, in the funds that they manage.
Resources Dedicated to Investment Management and Support Services. The Board and the Fund Oversight and Research Committees reviewed the general qualifications and capabilities of Fidelity's investment staff, including its size, education, experience, and resources, as well as Fidelity's approach to recruiting, training, managing, and compensating investment personnel. The Board noted that Fidelity has continued to increase the resources devoted to non-U.S. offices, including expansion of Fidelity's global investment organization. The Board also noted that Fidelity's analysts have extensive resources, tools and capabilities that allow them to conduct sophisticated quantitative and fundamental analysis, as well as credit analysis of issuers, counterparties and guarantors. Further, the Board considered that Fidelity's investment professionals have sufficient access to global information and data so as to provide competitive investment results over time, and that those professionals also have access to sophisticated tools that permit them to assess portfolio construction and risk and performance attribution characteristics continuously, as well as to transmit new information and research conclusions rapidly around the world. Additionally, in its deliberations, the Board considered Fidelity's trading, risk management, compliance, and technology and operations capabilities and resources, which are integral parts of the investment management process.
Shareholder and Administrative Services. The Board considered (i) the nature, extent, quality, and cost of advisory, administrative, and shareholder services performed by the Investment Advisers and their affiliates under the Advisory Contracts and under separate agreements covering transfer agency, pricing and bookkeeping, and securities lending services for the fund; (ii) the nature and extent of the supervision of third party service providers, principally custodians, subcustodians, and pricing vendors; and (iii) the resources devoted to, and the record of compliance with, the fund's compliance policies and procedures. The Board also reviewed the allocation of fund brokerage, including allocations to brokers affiliated with the Investment Advisers, the use of brokerage commissions to pay fund expenses, and the use of "soft" commission dollars to pay for research services.
The Board noted that the growth of fund assets over time across the complex allows Fidelity to reinvest in the development of services designed to enhance the value and convenience of the Fidelity funds as investment vehicles. These services include 24-hour access to account information and market information through telephone representatives and over the Internet, investor education materials and asset allocation tools, and the expanded availability of Fidelity Investor Centers.
Investment in a Large Fund Family. The Board considered the benefits to shareholders of investing in a Fidelity fund, including the benefits of investing in a fund that is part of a large family of funds offering a variety of investment disciplines and providing a large variety of mutual fund investor services. The Board noted that Fidelity had taken, or had made recommendations that resulted in the Fidelity funds taking, a number of actions over the previous year that benefited particular funds, including: (i) continuing to dedicate additional resources to Fidelity's investment research process, which includes meetings with management of issuers of securities in which the funds invest, and to the support of the senior management team that oversees asset management; (ii) continuing efforts to enhance Fidelity's global research capabilities; (iii) launching new funds and making other enhancements to meet client needs; (iv) launching new share classes of existing funds; (v) eliminating purchase minimums and broadening eligibility requirements for certain funds and share classes; (vi) reducing management fees and total expenses for certain growth equity funds and index funds; (vii) lowering expense caps for certain existing funds and classes, and converting certain voluntary expense caps to contractual caps, to reduce expenses borne by shareholders; (viii) eliminating short-term redemption fees for funds that had such fees; (ix) rationalizing product lines and gaining increased efficiencies from fund mergers and share class consolidations; (x) continuing to develop, acquire and implement systems and technology to improve services to the funds and shareholders, strengthen information security, and increase efficiency; and (xi) continuing to implement enhancements to further strengthen Fidelity's product line to increase investors' probability of success in achieving their investment goals, including retirement income goals.
Investment Performance. The Board considered whether the fund has operated in accordance with its investment objective, as well as its record of compliance with its investment restrictions. As the fund recently commenced operations, the Board did not believe that it was appropriate to assign significant weight to its limited investment performance.
Based on its review, the Board concluded that the nature, extent, and quality of services provided to the fund under the Advisory Contracts should continue to benefit the shareholders of the fund.
Competitiveness of Management Fee and Total Expense Ratio. The Board noted that the fund is available exclusively to certain Fidelity fee-based programs. The Board considered that the fund does not pay FMR a management fee for investment advisory services, but that FMR is indirectly compensated for its services out of the program fees. The Board also noted that FMR or an affiliate undertakes to pay all operating expenses of the fund with limited exceptions.
In connection with the renewal of the Advisory Contracts, the Board also approved amendments to the management contract for the fund to clarify that the fund pays its non-operating expenses, including brokerage commissions and fees and expenses associated with the fund's securities lending program. The Board considered that the amendments would not change the services provided to the fund or the party responsible for making such payments under the current management contract.
Based on its review, the Board considered that the fund does not pay a management fee and concluded that the total expense ratio of the fund was reasonable in light of the services that the fund and its shareholders receive and the other factors considered.
Costs of the Services and Profitability. The Board considered the level of Fidelity's profits in respect of all the Fidelity funds.
PricewaterhouseCoopers LLP (PwC), auditor to Fidelity and certain Fidelity funds, has been engaged annually by the Board as part of the Board's assessment of Fidelity's profitability analysis. PwC's engagement includes the review and assessment of the methodologies used by Fidelity in determining the revenues and expenses attributable to Fidelity's mutual fund business, and completion of agreed-upon procedures in respect of the mathematical accuracy of the fund profitability information and its conformity to established allocation methodologies. After considering PwC's reports issued under the engagement and information provided by Fidelity, the Board concluded that while other allocation methods may also be reasonable, Fidelity's profitability methodologies are reasonable in all material respects.
The Board also reviewed Fidelity's non-fund businesses and potential indirect benefits such businesses may have received as a result of their association with Fidelity's mutual fund business (i.e., fall-out benefits) as well as cases where Fidelity's affiliates may benefit from the fund's business. The Board noted that changes to fall-out benefits year-over-year reflect business developments at Fidelity's various businesses.
The Board concluded that the costs of the services provided by and the profits realized by Fidelity in connection with the operation of the fund were not relevant to the renewal of the Advisory Contracts because the fund pays no advisory fees and FMR or an affiliate bears all expenses of the fund with limited exceptions.
Economies of Scale. The Board concluded that because the fund pays no advisory fees and FMR bears all expenses of the fund with limited exceptions, the realization of economies of scale was not a material factor in the Board's decision to renew the fund's Advisory Contract.
Additional Information Requested by the Board. In order to develop fully the factual basis for consideration of the Fidelity funds' advisory contracts, the Board requested and received additional information on certain topics, including: (i) fund performance trends, in particular the underperformance of certain funds, and Fidelity's long-term strategies for certain funds; (ii) Fidelity's fund profitability methodology, profitability trends for certain funds, and the impact of certain factors on fund profitability results; (iii) metrics for evaluating index fund and ETF performance and information about ETF trading characteristics; (iv) the methodology with respect to the evaluation of competitive fund data and peer group classifications and fee comparisons; (v) the expense structures for different funds and classes; (vi) information regarding other accounts managed by Fidelity, including collective investment trusts; and (vii) Fidelity's philosophies and strategies for evaluating funds and classes with lower or declining asset levels.
Based on its evaluation of all of the conclusions noted above, and after considering all factors it believed relevant, the Board concluded that the advisory fee arrangements are fair and reasonable, and that the fund's Advisory Contracts should be renewed.
ZLG-SANN-0319
1.9881574.101
Fidelity® Growth & Income Portfolio
Semi-Annual Report January 31, 2019 |
|
Beginning on January 1, 2021, as permitted by regulations adopted by the Securities and Exchange Commission, paper copies of a fund’s shareholder reports will no longer be sent by mail, unless you specifically request paper copies of the reports from the fund or from your financial intermediary, such as a financial advisor, broker-dealer or bank. Instead, the reports will be made available on a website, and you will be notified by mail each time a report is posted and provided with a website link to access the report.
If you already elected to receive shareholder reports electronically, you will not be affected by this change and you need not take any action. You may elect to receive shareholder reports and other communications from a fund electronically, by contacting your financial intermediary. For Fidelity customers, visit Fidelity's web site or call Fidelity using the contact information listed below.
You may elect to receive all future reports in paper free of charge. If you wish to continue receiving paper copies of your shareholder reports, you may contact your financial intermediary or, if you are a Fidelity customer, visit Fidelity’s website, or call Fidelity at the applicable toll-free number listed below. Your election to receive reports in paper will apply to all funds held with the fund complex/your financial intermediary.
| Account Type | Website | Phone Number |
| Brokerage, Mutual Fund, or Annuity Contracts: | fidelity.com/mailpreferences | 1-800-343-3548 |
| Employer Provided Retirement Accounts: | netbenefits.fidelity.com/preferences (choose 'no' under Required Disclosures to continue to print) | 1-800-343-0860 |
| Advisor Sold Accounts Serviced Through Your Financial Intermediary: | Contact Your Financial Intermediary | Your Financial Intermediary's phone number |
| Advisor Sold Accounts Serviced by Fidelity: | institutional.fidelity.com | 1-877-208-0098 |
Contents
To view a fund's proxy voting guidelines and proxy voting record for the 12-month period ended June 30, visit http://www.fidelity.com/proxyvotingresults or visit the Securities and Exchange Commission's (SEC) web site at http://www.sec.gov.
You may also call 1-800-544-8544 if you’re an individual investing directly with Fidelity, call 1-800-835-5092 if you’re a plan sponsor or participant with Fidelity as your recordkeeper or call 1-877-208-0098 on institutional accounts or if you’re an advisor or invest through one to request a free copy of the proxy voting guidelines.
Standard & Poor's, S&P and S&P 500 are registered service marks of The McGraw-Hill Companies, Inc. and have been licensed for use by Fidelity Distributors Corporation.
Other third-party marks appearing herein are the property of their respective owners.
All other marks appearing herein are registered or unregistered trademarks or service marks of FMR LLC or an affiliated company. © 2019 FMR LLC. All rights reserved.
This report and the financial statements contained herein are submitted for the general information of the shareholders of the Fund. This report is not authorized for distribution to prospective investors in the Fund unless preceded or accompanied by an effective prospectus.
A fund files its complete schedule of portfolio holdings with the SEC for the first and third quarters of each fiscal year on Form N-Q. Forms N-Q are available on the SEC’s web site at http://www.sec.gov. A fund's Forms N-Q may be reviewed and copied at the SEC’s Public Reference Room in Washington, DC. Information regarding the operation of the SEC's Public Reference Room may be obtained by calling 1-800-SEC-0330.
For a complete list of a fund's portfolio holdings, view the most recent holdings listing, semiannual report, or annual report on Fidelity's web site at http://www.fidelity.com, http://www.institutional.fidelity.com, or http://www.401k.com, as applicable.
NOT FDIC INSURED •MAY LOSE VALUE •NO BANK GUARANTEE
Neither the Fund nor Fidelity Distributors Corporation is a bank.
Investment Summary (Unaudited)
Top Ten Stocks as of January 31, 2019
| | % of fund's net assets |
| Microsoft Corp.(a) | 4.5 |
| Exxon Mobil Corp. | 3.7 |
| Comcast Corp. Class A | 3.5 |
| Bank of America Corp.(a) | 3.4 |
| Altria Group, Inc. | 3.3 |
| General Electric Co. | 3.3 |
| JPMorgan Chase & Co.(a) | 2.5 |
| Apple, Inc.(a) | 2.3 |
| Wells Fargo & Co. | 2.3 |
| Chevron Corp. | 2.1 |
| | 30.9 |
(a) Security or a portion of the security is pledged as collateral for call options written.
Top Five Market Sectors as of January 31, 2019
| | % of fund's net assets |
| Financials | 19.3 |
| Health Care | 15.0 |
| Information Technology | 14.6 |
| Industrials | 13.0 |
| Energy | 11.8 |
Asset Allocation (% of fund's net assets)
| As of January 31, 2019*,** |
| | Stocks | 96.2% |
| | Convertible Securities | 0.3% |
| | Other Investments | 0.1% |
| | Short-Term Investments and Net Other Assets (Liabilities) | 3.4% |

* Foreign investments - 11.3%
** Written options - 0.0%
Percentages shown as 0.0% may reflect amounts less than 0.05%.
Schedule of Investments January 31, 2019 (Unaudited)
Showing Percentage of Net Assets
| Common Stocks - 96.2% | | | |
| | | Shares | Value (000s) |
| COMMUNICATION SERVICES - 7.5% | | | |
| Diversified Telecommunication Services - 1.6% | | | |
| AT&T, Inc. | | 280,415 | $8,429 |
| Verizon Communications, Inc. (a) | | 1,682,074 | 92,615 |
| | | | 101,044 |
| Entertainment - 1.0% | | | |
| Activision Blizzard, Inc. | | 324,400 | 15,325 |
| Electronic Arts, Inc. (b) | | 7,700 | 710 |
| The Walt Disney Co. | | 188,300 | 20,999 |
| Vivendi SA | | 1,111,200 | 28,334 |
| | | | 65,368 |
| Interactive Media & Services - 0.6% | | | |
| Alphabet, Inc.: | | | |
| Class A (b) | | 18,207 | 20,499 |
| Class C (b) | | 17,536 | 19,577 |
| | | | 40,076 |
| Media - 4.3% | | | |
| Comcast Corp. Class A | | 6,084,600 | 222,514 |
| Interpublic Group of Companies, Inc. | | 1,635,200 | 37,201 |
| Omnicom Group, Inc. | | 198,400 | 15,451 |
| | | | 275,166 |
|
| TOTAL COMMUNICATION SERVICES | | | 481,654 |
|
| CONSUMER DISCRETIONARY - 1.5% | | | |
| Auto Components - 0.1% | | | |
| Gentex Corp. | | 312,400 | 6,617 |
| Specialty Retail - 1.4% | | | |
| L Brands, Inc. | | 600,800 | 16,726 |
| Lowe's Companies, Inc. | | 459,279 | 44,164 |
| Ross Stores, Inc. | | 85,400 | 7,867 |
| TJX Companies, Inc. | | 416,500 | 20,713 |
| | | | 89,470 |
| Textiles, Apparel & Luxury Goods - 0.0% | | | |
| Puma AG | | 2,480 | 1,381 |
|
| TOTAL CONSUMER DISCRETIONARY | | | 97,468 |
|
| CONSUMER STAPLES - 9.7% | | | |
| Beverages - 1.5% | | | |
| The Coca-Cola Co. (a) | | 1,911,403 | 91,996 |
| Food & Staples Retailing - 1.7% | | | |
| Walgreens Boots Alliance, Inc. | | 217,200 | 15,695 |
| Walmart, Inc. | | 975,800 | 93,511 |
| | | | 109,206 |
| Food Products - 0.3% | | | |
| The Hershey Co. | | 198,400 | 21,050 |
| Household Products - 1.7% | | | |
| Colgate-Palmolive Co. | | 20,100 | 1,300 |
| Procter & Gamble Co. (a) | | 937,715 | 90,461 |
| Spectrum Brands Holdings, Inc. | | 312,600 | 17,468 |
| | | | 109,229 |
| Tobacco - 4.5% | | | |
| Altria Group, Inc. | | 4,237,200 | 209,106 |
| British American Tobacco PLC sponsored ADR | | 2,073,000 | 73,135 |
| Philip Morris International, Inc. | | 108,100 | 8,293 |
| | | | 290,534 |
|
| TOTAL CONSUMER STAPLES | | | 622,015 |
|
| ENERGY - 11.7% | | | |
| Energy Equipment & Services - 1.1% | | | |
| Baker Hughes, a GE Co. Class A | | 1,196,500 | 28,202 |
| National Oilwell Varco, Inc. | | 513,700 | 15,144 |
| Oceaneering International, Inc. (b) | | 750,300 | 11,772 |
| Schlumberger Ltd. | | 325,300 | 14,382 |
| | | | 69,500 |
| Oil, Gas & Consumable Fuels - 10.6% | | | |
| BP PLC sponsored ADR | | 2,106,946 | 86,638 |
| Cenovus Energy, Inc. | | 37,200 | 290 |
| Cenovus Energy, Inc. (Canada) | | 9,724,400 | 75,933 |
| Chevron Corp. | | 1,182,396 | 135,562 |
| Enterprise Products Partners LP | | 100,600 | 2,784 |
| Equinor ASA sponsored ADR | | 2,211,600 | 50,380 |
| Exxon Mobil Corp. | | 3,201,200 | 234,584 |
| Hess Corp. | | 351,300 | 18,970 |
| Imperial Oil Ltd. | | 795,300 | 22,565 |
| Kosmos Energy Ltd. (b) | | 3,737,985 | 19,176 |
| Legacy Reserves, Inc. (b) | | 1,051,668 | 1,546 |
| Teekay LNG Partners LP | | 45,140 | 581 |
| The Williams Companies, Inc. (a) | | 976,065 | 26,285 |
| Valero Energy Corp. | | 30,000 | 2,635 |
| | | | 677,929 |
|
| TOTAL ENERGY | | | 747,429 |
|
| FINANCIALS - 19.3% | | | |
| Banks - 13.3% | | | |
| Bank of America Corp. (a) | | 7,734,556 | 220,203 |
| Citigroup, Inc. | | 1,758,130 | 113,329 |
| First Hawaiian, Inc. | | 380,400 | 9,788 |
| JPMorgan Chase & Co. (a) | | 1,543,792 | 159,782 |
| M&T Bank Corp. | | 67,700 | 11,139 |
| PNC Financial Services Group, Inc. | | 568,254 | 69,708 |
| SunTrust Banks, Inc. | | 1,130,066 | 67,149 |
| U.S. Bancorp | | 1,125,073 | 57,559 |
| Wells Fargo & Co. | | 3,029,341 | 148,165 |
| | | | 856,822 |
| Capital Markets - 4.7% | | | |
| Apollo Global Management LLC Class A | | 315,000 | 9,223 |
| Brookfield Asset Management, Inc. | | 48,210 | 2,075 |
| Cboe Global Markets, Inc. | | 45,000 | 4,197 |
| Charles Schwab Corp. | | 652,143 | 30,501 |
| FS KKR Capital Corp. | | 26,109 | 167 |
| KKR & Co. LP | | 1,184,543 | 26,593 |
| Morgan Stanley | | 839,797 | 35,523 |
| Northern Trust Corp. | | 894,564 | 79,133 |
| Oaktree Capital Group LLC Class A | | 365,482 | 14,919 |
| S&P Global, Inc. | | 66,900 | 12,821 |
| State Street Corp. | | 1,239,427 | 87,875 |
| | | | 303,027 |
| Insurance - 1.0% | | | |
| Chubb Ltd. | | 186,500 | 24,814 |
| Marsh & McLennan Companies, Inc. | | 219,607 | 19,367 |
| The Travelers Companies, Inc. | | 144,800 | 18,178 |
| | | | 62,359 |
| Thrifts & Mortgage Finance - 0.3% | | | |
| Radian Group, Inc. | | 864,968 | 16,642 |
|
| TOTAL FINANCIALS | | | 1,238,850 |
|
| HEALTH CARE - 14.7% | | | |
| Biotechnology - 1.2% | | | |
| Alexion Pharmaceuticals, Inc. (b) | | 393,900 | 48,434 |
| Celgene Corp. (b) | | 78,200 | 6,918 |
| Intercept Pharmaceuticals, Inc. (b) | | 179,226 | 21,629 |
| | | | 76,981 |
| Health Care Equipment & Supplies - 0.6% | | | |
| Becton, Dickinson & Co. | | 9,300 | 2,320 |
| Boston Scientific Corp. (b) | | 251,500 | 9,595 |
| Danaher Corp. | | 226,100 | 25,079 |
| | | | 36,994 |
| Health Care Providers & Services - 6.5% | | | |
| AmerisourceBergen Corp. | | 518,300 | 43,211 |
| Anthem, Inc. | | 119,200 | 36,118 |
| Cardinal Health, Inc. | | 902,300 | 45,088 |
| Cigna Corp. | | 286,300 | 57,206 |
| CVS Health Corp. | | 1,715,604 | 112,458 |
| Humana, Inc. | | 39,900 | 12,329 |
| McKesson Corp. | | 497,887 | 63,854 |
| Patterson Companies, Inc. | | 673,370 | 15,009 |
| UnitedHealth Group, Inc. | | 116,800 | 31,559 |
| | | | 416,832 |
| Pharmaceuticals - 6.4% | | | |
| Bayer AG | | 892,386 | 67,639 |
| Bristol-Myers Squibb Co. | | 1,367,910 | 67,534 |
| GlaxoSmithKline PLC sponsored ADR (a) | | 2,551,822 | 100,031 |
| Johnson & Johnson | | 829,569 | 110,399 |
| Novartis AG sponsored ADR | | 58,944 | 5,159 |
| Perrigo Co. PLC | | 160,200 | 7,441 |
| Sanofi SA | | 314,313 | 27,319 |
| Teva Pharmaceutical Industries Ltd. sponsored ADR (b) | | 1,273,620 | 25,281 |
| | | | 410,803 |
|
| TOTAL HEALTH CARE | | | 941,610 |
|
| INDUSTRIALS - 13.0% | | | |
| Aerospace & Defense - 2.1% | | | |
| General Dynamics Corp. | | 162,500 | 27,815 |
| Huntington Ingalls Industries, Inc. | | 34,300 | 7,081 |
| Meggitt PLC | | 218,664 | 1,479 |
| Rolls-Royce Holdings PLC | | 1,143,700 | 13,294 |
| United Technologies Corp. | | 696,182 | 82,198 |
| | | | 131,867 |
| Air Freight & Logistics - 1.8% | | | |
| C.H. Robinson Worldwide, Inc. | | 207,200 | 17,979 |
| Expeditors International of Washington, Inc. | | 9,700 | 672 |
| United Parcel Service, Inc. Class B | | 935,004 | 98,549 |
| | | | 117,200 |
| Building Products - 0.1% | | | |
| A.O. Smith Corp. | | 171,100 | 8,189 |
| Commercial Services & Supplies - 0.4% | | | |
| Healthcare Services Group, Inc. (c) | | 204,900 | 8,938 |
| Interface, Inc. | | 650,200 | 10,670 |
| Ritchie Brothers Auctioneers, Inc. | | 19,100 | 687 |
| Stericycle, Inc. (b) | | 86,075 | 3,794 |
| | | | 24,089 |
| Electrical Equipment - 0.7% | | | |
| Acuity Brands, Inc. | | 196,200 | 23,723 |
| Hubbell, Inc. Class B | | 182,839 | 19,990 |
| Rockwell Automation, Inc. | | 22,400 | 3,797 |
| | | | 47,510 |
| Industrial Conglomerates - 3.3% | | | |
| General Electric Co. | | 20,475,727 | 208,033 |
| Machinery - 0.8% | | | |
| Donaldson Co., Inc. | | 225,700 | 10,671 |
| Flowserve Corp. | | 681,600 | 30,018 |
| Wabtec Corp. (c) | | 158,390 | 10,954 |
| | | | 51,643 |
| Road & Rail - 2.9% | | | |
| J.B. Hunt Transport Services, Inc. | | 446,640 | 47,808 |
| Knight-Swift Transportation Holdings, Inc. Class A | | 1,004,900 | 31,906 |
| Norfolk Southern Corp. | | 227,599 | 38,177 |
| Union Pacific Corp. | | 438,000 | 69,673 |
| | | | 187,564 |
| Trading Companies & Distributors - 0.9% | | | |
| Fastenal Co. (a) | | 364,100 | 22,013 |
| MSC Industrial Direct Co., Inc. Class A | | 102,300 | 8,541 |
| Watsco, Inc. | | 181,792 | 26,811 |
| | | | 57,365 |
|
| TOTAL INDUSTRIALS | | | 833,460 |
|
| INFORMATION TECHNOLOGY - 14.6% | | | |
| Communications Equipment - 0.4% | | | |
| Cisco Systems, Inc. (a) | | 603,352 | 28,533 |
| Electronic Equipment & Components - 0.1% | | | |
| Avnet, Inc. | | 122,500 | 5,047 |
| IT Services - 2.7% | | | |
| IBM Corp. | | 107,000 | 14,383 |
| MasterCard, Inc. Class A | | 49,000 | 10,345 |
| Paychex, Inc. (a) | | 625,752 | 44,303 |
| Unisys Corp. (b) | | 838,218 | 10,964 |
| Visa, Inc. Class A | | 669,884 | 90,441 |
| | | | 170,436 |
| Semiconductors & Semiconductor Equipment - 2.2% | | | |
| Analog Devices, Inc. | | 79,500 | 7,859 |
| Applied Materials, Inc. | | 711,600 | 27,809 |
| Lam Research Corp. | | 98,800 | 16,755 |
| NVIDIA Corp. | | 81,400 | 11,701 |
| NXP Semiconductors NV | | 16,400 | 1,427 |
| Qualcomm, Inc. | | 1,579,346 | 78,209 |
| | | | 143,760 |
| Software - 6.7% | | | |
| Micro Focus International PLC | | 163,762 | 3,122 |
| Microsoft Corp. (a) | | 2,737,899 | 285,922 |
| Oracle Corp. | | 1,803,353 | 90,582 |
| SAP SE sponsored ADR (c) | | 496,700 | 51,369 |
| | | | 430,995 |
| Technology Hardware, Storage & Peripherals - 2.5% | | | |
| Apple, Inc. (a) | | 900,794 | 149,928 |
| Western Digital Corp. | | 222,900 | 10,028 |
| | | | 159,956 |
|
| TOTAL INFORMATION TECHNOLOGY | | | 938,727 |
|
| MATERIALS - 1.2% | | | |
| Chemicals - 1.2% | | | |
| DowDuPont, Inc. | | 479,300 | 25,791 |
| International Flavors & Fragrances, Inc. | | 57,300 | 8,124 |
| Nutrien Ltd. | | 589,680 | 30,549 |
| The Scotts Miracle-Gro Co. Class A | | 195,100 | 14,506 |
| | | | 78,970 |
| REAL ESTATE - 1.6% | | | |
| Equity Real Estate Investment Trusts (REITs) - 1.6% | | | |
| American Tower Corp. | | 153,900 | 26,600 |
| CoreSite Realty Corp. | | 159,700 | 15,777 |
| Equinix, Inc. | | 70,600 | 27,816 |
| Public Storage | | 60,800 | 12,921 |
| Sabra Health Care REIT, Inc. | | 257,800 | 5,295 |
| Simon Property Group, Inc. | | 37,500 | 6,830 |
| Spirit Realty Capital, Inc. | | 183,260 | 7,279 |
| | | | 102,518 |
| UTILITIES - 1.4% | | | |
| Electric Utilities - 1.3% | | | |
| Duke Energy Corp. | | 116,200 | 10,200 |
| Exelon Corp. (a) | | 708,900 | 33,857 |
| PPL Corp. | | 692,100 | 21,677 |
| Southern Co. | | 320,100 | 15,557 |
| | | | 81,291 |
| Multi-Utilities - 0.1% | | | |
| Sempra Energy | | 85,300 | 9,978 |
|
| TOTAL UTILITIES | | | 91,269 |
|
| TOTAL COMMON STOCKS | | | |
| (Cost $5,791,246) | | | 6,173,970 |
|
| Preferred Stocks - 0.2% | | | |
| Convertible Preferred Stocks - 0.2% | | | |
| HEALTH CARE - 0.2% | | | |
| Health Care Equipment & Supplies - 0.2% | | | |
| Becton, Dickinson & Co. Series A, 6.125% | | 155,000 | 9,617 |
| Nonconvertible Preferred Stocks - 0.0% | | | |
| INDUSTRIALS - 0.0% | | | |
| Aerospace & Defense - 0.0% | | | |
| Rolls-Royce Holdings PLC (C Shares) | | 464,310,380 | 609 |
| TOTAL PREFERRED STOCKS | | | |
| (Cost $8,376) | | | 10,226 |
| | | Principal Amount (000s) | Value (000s) |
|
| Convertible Bonds - 0.1% | | | |
| HEALTH CARE - 0.1% | | | |
| Pharmaceuticals - 0.1% | | | |
Bayer Capital Corp. BV 5.625% 11/22/19 (d)
(Cost $7,157) | | EUR 6,700 | 6,227 |
| | | Shares | Value (000s) |
|
| Other - 0.1% | | | |
| ENERGY - 0.1% | | | |
| Oil, Gas & Consumable - 0.1% | | | |
| Utica Shale Drilling Program (non-operating revenue interest) (e)(f)(g) | | | |
| (Cost $18,052) | | 18,052,449 | 9,053 |
|
| Money Market Funds - 4.5% | | | |
| Fidelity Cash Central Fund, 2.43% (h) | | 225,187,423 | 225,232 |
| Fidelity Securities Lending Cash Central Fund 2.43% (h)(i) | | 60,717,274 | 60,723 |
| TOTAL MONEY MARKET FUNDS | | | |
| (Cost $285,950) | | | 285,955 |
| TOTAL INVESTMENT IN SECURITIES - 101.1% | | | |
| (Cost $6,110,781) | | | 6,485,431 |
| NET OTHER ASSETS (LIABILITIES) - (1.1)% | | | (69,398) |
| NET ASSETS - 100% | | | $6,416,033 |
| Written Options | | | | | | |
| | Counterparty | Number of Contracts | Notional Amount (000s) | Exercise Price | Expiration Date | Value (000s) |
| Call Options | | | | | | |
| Apple, Inc. | Chicago Board Options Exchange | 901 | $14,996 | $175.00 | 4/18/19 | $(341) |
| Bank of America Corp. | Chicago Board Options Exchange | 4,010 | 11,416 | 30.00 | 3/15/19 | (114) |
| Bank of America Corp. | Chicago Board Options Exchange | 3,880 | 11,046 | 32.00 | 4/18/19 | (78) |
| Cisco Systems, Inc. | Chicago Board Options Exchange | 598 | 2,828 | 49.00 | 4/18/19 | (77) |
| Exelon Corp. | Chicago Board Options Exchange | 707 | 3,377 | 47.00 | 4/18/19 | (124) |
| Exelon Corp. | Chicago Board Options Exchange | 707 | 3,377 | 48.00 | 4/18/19 | (85) |
| Exelon Corp. | Chicago Board Options Exchange | 707 | 3,377 | 49.00 | 4/18/19 | (53) |
| Fastenal Co. | Chicago Board Options Exchange | 354 | 2,140 | 62.50 | 5/17/19 | (83) |
| Fastenal Co. | Chicago Board Options Exchange | 708 | 4,281 | 65.00 | 5/17/19 | (106) |
| GlaxoSmithKline PLC Spons ADR | Chicago Board Options Exchange | 2,573 | 10,086 | 40.00 | 5/17/19 | (244) |
| GlaxoSmithKline PLC Spons ADR | Chicago Board Options Exchange | 2,573 | 10,086 | 41.00 | 5/17/19 | (161) |
| J.P. Morgan Chase & Co. | Chicago Board Options Exchange | 1,566 | 16,208 | 110.00 | 3/15/19 | (82) |
| Microsoft Corp. | Chicago Board Options Exchange | 2,764 | 28,864 | 115.00 | 3/15/19 | (77) |
| Microsoft Corp. | Chicago Board Options Exchange | 2,734 | 28,551 | 115.00 | 4/18/19 | (236) |
| Paychex, Inc. | Chicago Board Options Exchange | 623 | 4,411 | 72.50 | 6/21/19 | (157) |
| Paychex, Inc. | Chicago Board Options Exchange | 623 | 4,411 | 75.00 | 6/21/19 | (97) |
| Procter & Gamble Co. | Chicago Board Options Exchange | 917 | 8,846 | 95.00 | 3/15/19 | (280) |
| Procter & Gamble Co. | Chicago Board Options Exchange | 926 | 8,933 | 97.50 | 6/21/19 | (333) |
| The Coca-Cola Co. | Chicago Board Options Exchange | 1,883 | 9,063 | 49.00 | 3/15/19 | (112) |
| Verizon Communications, Inc. | Chicago Board Options Exchange | 1,671 | 9,201 | 60.00 | 3/15/19 | (19) |
| The Williams Companies, Inc. | Chicago Board Options Exchange | 956 | 2,575 | 28.00 | 4/18/19 | (57) |
| The Williams Companies, Inc. | Chicago Board Options Exchange | 956 | 2,575 | 29.00 | 4/18/19 | (33) |
| TOTAL WRITTEN OPTIONS | | | | | | $(2,949) |
Currency Abbreviations
EUR – European Monetary Unit
Legend
(a) Security or a portion of the security is pledged as collateral for call options written. At period end, the value of securities pledged amounted to $200,647,000.
(b) Non-income producing
(c) Security or a portion of the security is on loan at period end.
(d) Security exempt from registration under Rule 144A of the Securities Act of 1933. These securities may be resold in transactions exempt from registration, normally to qualified institutional buyers. At the end of the period, the value of these securities amounted to $6,227,000 or 0.1% of net assets.
(e) Investment is owned by a wholly-owned subsidiary (Subsidiary) that is treated as a corporation for U.S. tax purposes.
(f) Restricted securities - Investment in securities not registered under the Securities Act of 1933 (excluding 144A issues). At the end of the period, the value of restricted securities (excluding 144A issues) amounted to $9,053,000 or 0.1% of net assets.
(g) Level 3 security
(h) Affiliated fund that is generally available only to investment companies and other accounts managed by Fidelity Investments. The rate quoted is the annualized seven-day yield of the fund at period end. A complete unaudited listing of the fund's holdings as of its most recent quarter end is available upon request. In addition, each Fidelity Central Fund's financial statements are available on the SEC's website or upon request.
(i) Investment made with cash collateral received from securities on loan.
Additional information on each restricted holding is as follows:
| Security | Acquisition Date | Acquisition Cost (000s) |
| Utica Shale Drilling Program (non-operating revenue interest) | 10/5/16 - 9/1/17 | $18,052 |
Affiliated Central Funds
Information regarding fiscal year to date income earned by the Fund from investments in Fidelity Central Funds is as follows:
| Fund | Income earned |
| | (Amounts in thousands) |
| Fidelity Cash Central Fund | $1,505 |
| Fidelity Securities Lending Cash Central Fund | 192 |
| Total | $1,697 |
Amounts in the income column in the above table include any capital gain distributions from underlying funds, which are presented in the corresponding line-item in the Statement of Operations, if applicable.
Investment Valuation
The following is a summary of the inputs used, as of January 31, 2019, involving the Fund's assets and liabilities carried at fair value. The inputs or methodology used for valuing securities may not be an indication of the risk associated with investing in those securities. For more information on valuation inputs, and their aggregation into the levels used below, please refer to the Investment Valuation section in the accompanying Notes to Financial Statements.
| | Valuation Inputs at Reporting Date: |
| Description | Total | Level 1 | Level 2 | Level 3 |
| (Amounts in thousands) | | | | |
| Investments in Securities: | | | | |
| Equities: | | | | |
| Communication Services | $481,654 | $453,320 | $28,334 | $-- |
| Consumer Discretionary | 97,468 | 97,468 | -- | -- |
| Consumer Staples | 622,015 | 622,015 | -- | -- |
| Energy | 747,429 | 747,429 | -- | -- |
| Financials | 1,238,850 | 1,238,850 | -- | -- |
| Health Care | 951,227 | 846,652 | 104,575 | -- |
| Industrials | 834,069 | 820,775 | 13,294 | -- |
| Information Technology | 938,727 | 935,605 | 3,122 | -- |
| Materials | 78,970 | 78,970 | -- | -- |
| Real Estate | 102,518 | 102,518 | -- | -- |
| Utilities | 91,269 | 91,269 | -- | -- |
| Corporate Bonds | 6,227 | -- | 6,227 | -- |
| Other | 9,053 | -- | -- | 9,053 |
| Money Market Funds | 285,955 | 285,955 | -- | -- |
| Total Investments in Securities: | $6,485,431 | $6,320,826 | $155,552 | $9,053 |
| Derivative Instruments: | | | | |
| Liabilities | | | | |
| Written Options | $(2,949) | $(2,949) | $-- | $-- |
| Total Liabilities | $(2,949) | $(2,949) | $-- | $-- |
| Total Derivative Instruments: | $(2,949) | $(2,949) | $-- | $-- |
Value of Derivative Instruments
The following table is a summary of the Fund's value of derivative instruments by primary risk exposure as of January 31, 2019. For additional information on derivative instruments, please refer to the Derivative Instruments section in the accompanying Notes to Financial Statements.
| Primary Risk Exposure / Derivative Type | Value |
| | Asset | Liability |
| (Amounts in thousands) | | |
| Equity Risk | | |
| Written Options(a) | $0 | $(2,949) |
| Total Equity Risk | 0 | (2,949) |
| Total Value of Derivatives | $0 | $(2,949) |
(a) Gross value is presented in the Statement of Assets and Liabilities in the written options, at value line-item.
Other Information
Distribution of investments by country or territory of incorporation, as a percentage of Total Net Assets, is as follows (Unaudited):
| United States of America | 88.7% |
| United Kingdom | 4.3% |
| Canada | 2.1% |
| Germany | 1.9% |
| Others (Individually Less Than 1%) | 3.0% |
| | 100.0% |
See accompanying notes which are an integral part of the financial statements.
Financial Statements
Statement of Assets and Liabilities
| Amounts in thousands (except per-share amounts) | | January 31, 2019 (Unaudited) |
| Assets | | |
Investment in securities, at value (including securities loaned of $59,963) — See accompanying schedule:
Unaffiliated issuers (cost $5,824,831) | $6,199,476 | |
| Fidelity Central Funds (cost $285,950) | 285,955 | |
| Total Investment in Securities (cost $6,110,781) | | $6,485,431 |
| Restricted cash | | 978 |
| Receivable for investments sold | | 17,798 |
| Receivable for fund shares sold | | 1,209 |
| Dividends receivable | | 7,976 |
| Interest receivable | | 254 |
| Distributions receivable from Fidelity Central Funds | | 411 |
| Prepaid expenses | | 8 |
| Other receivables | | 577 |
| Total assets | | 6,514,642 |
| Liabilities | | |
| Payable for investments purchased | $28,613 | |
| Payable for fund shares redeemed | 2,612 | |
| Accrued management fee | 2,284 | |
| Written options, at value (premium received $2,836) | 2,949 | |
| Other affiliated payables | 830 | |
| Other payables and accrued expenses | 594 | |
| Collateral on securities loaned | 60,727 | |
| Total liabilities | | 98,609 |
| Net Assets | | $6,416,033 |
| Net Assets consist of: | | |
| Paid in capital | | $6,079,171 |
| Total distributable earnings (loss) | | 336,862 |
| Net Assets | | $6,416,033 |
| Net Asset Value and Maximum Offering Price | | |
| Growth and Income: | | |
| Net Asset Value, offering price and redemption price per share ($5,671,603 ÷ 156,320 shares) | | $36.28 |
| Class K: | | |
| Net Asset Value, offering price and redemption price per share ($744,430 ÷ 20,537 shares) | | $36.25 |
See accompanying notes which are an integral part of the financial statements.
Statement of Operations
| Amounts in thousands | | Six months ended January 31, 2019 (Unaudited) |
| Investment Income | | |
| Dividends | | $88,183 |
| Interest | | 218 |
| Income from Fidelity Central Funds | | 1,697 |
| Total income | | 90,098 |
| Expenses | | |
| Management fee | $14,424 | |
| Transfer agent fees | 4,637 | |
| Accounting and security lending fees | 580 | |
| Custodian fees and expenses | 59 | |
| Independent trustees' fees and expenses | 21 | |
| Registration fees | 60 | |
| Audit | 44 | |
| Legal | 9 | |
| Miscellaneous | 19 | |
| Total expenses before reductions | 19,853 | |
| Expense reductions | (71) | |
| Total expenses after reductions | | 19,782 |
| Net investment income (loss) | | 70,316 |
| Realized and Unrealized Gain (Loss) | | |
| Net realized gain (loss) on: | | |
| Investment securities: | | |
| Unaffiliated issuers | 21,485 | |
| Fidelity Central Funds | (12) | |
| Foreign currency transactions | 24 | |
| Written options | 3,428 | |
| Total net realized gain (loss) | | 24,925 |
| Change in net unrealized appreciation (depreciation) on: | | |
| Investment securities: | | |
| Unaffiliated issuers | (479,894) | |
| Fidelity Central Funds | 10 | |
| Assets and liabilities in foreign currencies | (2) | |
| Written options | (255) | |
| Total change in net unrealized appreciation (depreciation) | | (480,141) |
| Net gain (loss) | | (455,216) |
| Net increase (decrease) in net assets resulting from operations | | $(384,900) |
See accompanying notes which are an integral part of the financial statements.
Statement of Changes in Net Assets
| Amounts in thousands | Six months ended January 31, 2019 (Unaudited) | Year ended July 31, 2018 |
| Increase (Decrease) in Net Assets | | |
| Operations | | |
| Net investment income (loss) | $70,316 | $125,267 |
| Net realized gain (loss) | 24,925 | 961,043 |
| Change in net unrealized appreciation (depreciation) | (480,141) | (182,203) |
| Net increase (decrease) in net assets resulting from operations | (384,900) | 904,107 |
| Distributions to shareholders | (148,658) | – |
| Distributions to shareholders from net investment income | – | (140,988) |
| Total distributions | (148,658) | (140,988) |
| Share transactions - net increase (decrease) | 78,094 | (1,137,673) |
| Total increase (decrease) in net assets | (455,464) | (374,554) |
| Net Assets | | |
| Beginning of period | 6,871,497 | 7,246,051 |
| End of period | $6,416,033 | $6,871,497 |
| Other Information | | |
| Distributions in excess of net investment income end of period | | $(8,807) |
See accompanying notes which are an integral part of the financial statements.
Financial Highlights
Fidelity Growth & Income Portfolio
| | Six months ended (Unaudited) January 31, | Years endedJuly 31, | | | | |
| | 2019 | 2018 | 2017 | 2016 | 2015 | 2014 |
| Selected Per–Share Data | | | | | | |
| Net asset value, beginning of period | $39.34 | $35.31 | $30.48 | $30.85 | $29.02 | $25.66 |
| Income from Investment Operations | | | | | | |
| Net investment income (loss)A | .40 | .65 | .61 | .59 | .55 | .51 |
| Net realized and unrealized gain (loss) | (2.61) | 4.12 | 4.68 | (.37) | 1.82B | 3.35 |
| Total from investment operations | (2.21) | 4.77 | 5.29 | .22 | 2.37 | 3.86 |
| Distributions from net investment income | (.43) | (.74) | (.46) | (.58) | (.54) | (.50) |
| Distributions from net realized gain | (.42) | – | – | (.01) | – | (.01) |
| Total distributions | (.85) | (.74) | (.46) | (.59) | (.54) | (.50)C |
| Net asset value, end of period | $36.28 | $39.34 | $35.31 | $30.48 | $30.85 | $29.02 |
| Total ReturnD,E | (5.65)% | 13.66% | 17.48% | .88% | 8.23%B | 15.16% |
| Ratios to Average Net AssetsF,G | | | | | | |
| Expenses before reductions | .61%H | .61% | .63% | .64% | .64% | .65% |
| Expenses net of fee waivers, if any | .61%H | .61% | .63% | .64% | .63% | .65% |
| Expenses net of all reductions | .61%H | .61% | .63% | .64% | .63% | .65% |
| Net investment income (loss) | 2.13%H | 1.76% | 1.84% | 2.05% | 1.83% | 1.86% |
| Supplemental Data | | | | | | |
| Net assets, end of period (in millions) | $5,672 | $6,280 | $6,356 | $5,529 | $6,563 | $6,550 |
| Portfolio turnover rateI | 41%H | 38% | 37% | 29% | 35% | 41%J |
A Calculated based on average shares outstanding during the period.
B Net realized and unrealized gain (loss) per share reflects proceeds received from litigation which amounted to $.06 per share. Excluding these litigation proceeds, the total return would have been 8.03%
C Total distributions of $.50 per share is comprised of distributions from net investment income of $.495 and distributions from net realized gain of $.006 per share.
D Total returns for periods of less than one year are not annualized.
E Total returns would have been lower if certain expenses had not been reduced during the applicable periods shown.
F Fees and expenses of any underlying Fidelity Central Funds are not included in the Fund's expense ratio. The Fund indirectly bears its proportionate share of the expenses of any underlying Fidelity Central Funds.
G Expense ratios reflect operating expenses of the class. Expenses before reductions do not reflect amounts reimbursed by the investment adviser or reductions from brokerage service arrangements or reductions from other expense offset arrangements and do not represent the amount paid by the class during periods when reimbursements or reductions occur. Expenses net of fee waivers reflect expenses after reimbursement by the investment adviser but prior to reductions from brokerage service arrangements or other expense offset arrangements. Expenses net of all reductions represent the net expenses paid by the class.
H Annualized
I Amount does not include the portfolio activity of any underlying Fidelity Central Funds.
J Portfolio turnover rate excludes securities received or delivered in-kind.
See accompanying notes which are an integral part of the financial statements.
Fidelity Growth & Income Portfolio Class K
| | Six months ended (Unaudited) January 31, | Years endedJuly 31, | | | | |
| | 2019 | 2018 | 2017 | 2016 | 2015 | 2014 |
| Selected Per–Share Data | | | | | | |
| Net asset value, beginning of period | $39.31 | $35.28 | $30.46 | $30.82 | $29.00 | $25.64 |
| Income from Investment Operations | | | | | | |
| Net investment income (loss)A | .42 | .69 | .65 | .62 | .59 | .54 |
| Net realized and unrealized gain (loss) | (2.61) | 4.12 | 4.67 | (.35) | 1.81B | 3.36 |
| Total from investment operations | (2.19) | 4.81 | 5.32 | .27 | 2.40 | 3.90 |
| Distributions from net investment income | (.45) | (.78) | (.50) | (.62) | (.58) | (.53) |
| Distributions from net realized gain | (.42) | – | – | (.01) | – | (.01) |
| Total distributions | (.87) | (.78) | (.50) | (.63) | (.58) | (.54) |
| Net asset value, end of period | $36.25 | $39.31 | $35.28 | $30.46 | $30.82 | $29.00 |
| Total ReturnC,D | (5.60)% | 13.79% | 17.60% | 1.04% | 8.34%B | 15.32% |
| Ratios to Average Net AssetsE,F | | | | | | |
| Expenses before reductions | .51%G | .51% | .52% | .52% | .52% | .52% |
| Expenses net of fee waivers, if any | .51%G | .51% | .52% | .52% | .52% | .52% |
| Expenses net of all reductions | .51%G | .50% | .52% | .52% | .52% | .52% |
| Net investment income (loss) | 2.24%G | 1.86% | 1.95% | 2.17% | 1.95% | 1.99% |
| Supplemental Data | | | | | | |
| Net assets, end of period (in millions) | $744 | $591 | $890 | $765 | $862 | $960 |
| Portfolio turnover rateH | 41%G | 38% | 37% | 29% | 35% | 41%I |
A Calculated based on average shares outstanding during the period.
B Net realized and unrealized gain (loss) per share reflects proceeds received from litigation which amounted to $.06 per share. Excluding these litigation proceeds, the total return would have been 8.14%
C Total returns for periods of less than one year are not annualized.
D Total returns would have been lower if certain expenses had not been reduced during the applicable periods shown.
E Fees and expenses of any underlying Fidelity Central Funds are not included in the Fund's expense ratio. The Fund indirectly bears its proportionate share of the expenses of any underlying Fidelity Central Funds.
F Expense ratios reflect operating expenses of the class. Expenses before reductions do not reflect amounts reimbursed by the investment adviser or reductions from brokerage service arrangements or reductions from other expense offset arrangements and do not represent the amount paid by the class during periods when reimbursements or reductions occur. Expenses net of fee waivers reflect expenses after reimbursement by the investment adviser but prior to reductions from brokerage service arrangements or other expense offset arrangements. Expenses net of all reductions represent the net expenses paid by the class.
G Annualized
H Amount does not include the portfolio activity of any underlying Fidelity Central Funds.
I Portfolio turnover rate excludes securities received or delivered in-kind.
See accompanying notes which are an integral part of the financial statements.
Notes to Financial Statements (Unaudited)
For the period ended January 31, 2019
(Amounts in thousands except percentages)
1. Organization.
Fidelity Growth & Income Portfolio (the Fund) is a fund of Fidelity Securities Fund (the Trust) and is authorized to issue an unlimited number of shares. The Trust is registered under the Investment Company Act of 1940, as amended (the 1940 Act), as an open-end management investment company organized as a Massachusetts business trust. The Fund offers Growth & Income and Class K shares, each of which has equal rights as to assets and voting privileges. Each class has exclusive voting rights with respect to matters that affect that class.
2. Investments in Fidelity Central Funds.
The Fund invests in Fidelity Central Funds, which are open-end investment companies generally available only to other investment companies and accounts managed by the investment adviser and its affiliates. The Fund's Schedule of Investments lists each of the Fidelity Central Funds held as of period end, if any, as an investment of the Fund, but does not include the underlying holdings of each Fidelity Central Fund. As an Investing Fund, the Fund indirectly bears its proportionate share of the expenses of the underlying Fidelity Central Funds.
The Money Market Central Funds seek preservation of capital and current income and are managed by Fidelity Investments Money Management, Inc. (FIMM), an affiliate of the investment adviser. Annualized expenses of the Money Market Central Funds as of their most recent shareholder report date are less than .005%.
A complete unaudited list of holdings for each Fidelity Central Fund is available upon request or at the Securities and Exchange Commission (the SEC) website at www.sec.gov. In addition, the financial statements of the Fidelity Central Funds are available on the SEC website or upon request.
3. Significant Accounting Policies.
The Fund is an investment company and applies the accounting and reporting guidance of the Financial Accounting Standards Board (FASB) Accounting Standards Codification Topic 946 Financial Services – Investments Companies. The financial statements have been prepared in conformity with accounting principles generally accepted in the United States of America (GAAP), which require management to make certain estimates and assumptions at the date of the financial statements. Actual results could differ from those estimates. Subsequent events, if any, through the date that the financial statements were issued have been evaluated in the preparation of the financial statements. The following summarizes the significant accounting policies of the Fund:
Investment Valuation. Investments are valued as of 4:00 p.m. Eastern time on the last calendar day of the period. The Board of Trustees (the Board) has delegated the day to day responsibility for the valuation of the Fund's investments to the Fair Value Committee (the Committee) established by the Fund's investment adviser. In accordance with valuation policies and procedures approved by the Board, the Fund attempts to obtain prices from one or more third party pricing vendors or brokers to value its investments. When current market prices, quotations or currency exchange rates are not readily available or reliable, investments will be fair valued in good faith by the Committee, in accordance with procedures adopted by the Board. Factors used in determining fair value vary by investment type and may include market or investment specific events, changes in interest rates and credit quality. The frequency with which these procedures are used cannot be predicted and they may be utilized to a significant extent. The Committee oversees the Fund's valuation policies and procedures and reports to the Board on the Committee's activities and fair value determinations. The Board monitors the appropriateness of the procedures used in valuing the Fund's investments and ratifies the fair value determinations of the Committee.
The Fund categorizes the inputs to valuation techniques used to value its investments into a disclosure hierarchy consisting of three levels as shown below:
- Level 1 – quoted prices in active markets for identical investments
- Level 2 – other significant observable inputs (including quoted prices for similar investments, interest rates, prepayment speeds, etc.)
- Level 3 – unobservable inputs (including the Fund's own assumptions based on the best information available)
Valuation techniques used to value the Fund's investments by major category are as follows:
Equity securities, including restricted securities, for which market quotations are readily available, are valued at the last reported sale price or official closing price as reported by a third party pricing vendor on the primary market or exchange on which they are traded and are categorized as Level 1 in the hierarchy. In the event there were no sales during the day or closing prices are not available, securities are valued at the last quoted bid price or may be valued using the last available price and are generally categorized as Level 2 in the hierarchy. For foreign equity securities, when market or security specific events arise, comparisons to the valuation of American Depositary Receipts (ADRs), futures contracts, Exchange-Traded Funds (ETFs) and certain indexes as well as quoted prices for similar securities may be used and would be categorized as Level 2 in the hierarchy. For equity securities, including restricted securities, where observable inputs are limited, assumptions about market activity and risk are used and these securities may be categorized as Level 3 in the hierarchy.
Debt securities, including restricted securities, are valued based on evaluated prices received from third party pricing vendors or from brokers who make markets in such securities. Corporate bonds are valued by pricing vendors who utilize matrix pricing which considers yield or price of bonds of comparable quality, coupon, maturity and type or by broker-supplied prices. When independent prices are unavailable or unreliable, debt securities may be valued utilizing pricing methodologies which consider similar factors that would be used by third party pricing vendors. Debt securities are generally categorized as Level 2 in the hierarchy but may be Level 3 depending on the circumstances.
Exchange-traded options are valued using the last sale price or, in the absence of a sale, the last offering price and are categorized as Level 1 in the hierarchy. Investments in open-end mutual funds, including the Fidelity Central Funds, are valued at their closing net asset value (NAV) each business day and are categorized as Level 1 in the hierarchy.
Changes in valuation techniques may result in transfers in or out of an assigned level within the disclosure hierarchy. The aggregate value of investments by input level as of January 31, 2019 is included at the end of the Fund's Schedule of Investments.
Foreign Currency. The Fund may use foreign currency contracts to facilitate transactions in foreign-denominated securities. Gains and losses from these transactions may arise from changes in the value of the foreign currency or if the counterparties do not perform under the contracts' terms.
Foreign-denominated assets, including investment securities, and liabilities are translated into U.S. dollars at the exchange rates at period end. Purchases and sales of investment securities, income and dividends received and expenses denominated in foreign currencies are translated into U.S. dollars at the exchange rate in effect on the transaction date.
The effects of exchange rate fluctuations on investments are included with the net realized and unrealized gain (loss) on investment securities. Other foreign currency transactions resulting in realized and unrealized gain (loss) are disclosed separately.
Investment Transactions and Income. For financial reporting purposes, the Fund's investment holdings and NAV include trades executed through the end of the last business day of the period. The NAV per share for processing shareholder transactions is calculated as of the close of business of the New York Stock Exchange (NYSE), normally 4:00 p.m. Eastern time and includes trades executed through the end of the prior business day. Gains and losses on securities sold are determined on the basis of identified cost and include proceeds received from litigation. Dividend income is recorded on the ex-dividend date, except for certain dividends from foreign securities where the ex-dividend date may have passed, which are recorded as soon as the Fund is informed of the ex-dividend date. Non-cash dividends included in dividend income, if any, are recorded at the fair market value of the securities received. Income and capital gain distributions from Fidelity Central Funds, if any, are recorded on the ex-dividend date. Certain distributions received by the Fund represent a return of capital or capital gain. The Fund determines the components of these distributions subsequent to the ex-dividend date, based upon receipt of tax filings or other correspondence relating to the underlying investment. These distributions are recorded as a reduction of cost of investments and/or as a realized gain. Interest income is accrued as earned and includes coupon interest and amortization of premium and accretion of discount on debt securities as applicable. Investment income is recorded net of foreign taxes withheld where recovery of such taxes is uncertain. Debt obligations may be placed on non-accrual status and related interest income may be reduced by ceasing current accruals and writing off interest receivables when the collection of all or a portion of interest has become doubtful based on consistently applied procedures. A debt obligation is removed from non-accrual status when the issuer resumes interest payments or when collectability of interest is reasonably assured.
Class Allocations and Expenses. Investment income, realized and unrealized capital gains and losses, common expenses of the Fund, and certain fund-level expense reductions, if any, are allocated daily on a pro-rata basis to each class based on the relative net assets of each class to the total net assets of the Fund. Each class differs with respect to transfer agent fees incurred. Certain expense reductions may also differ by class. For the reporting period, the allocated portion of income and expenses to each class as a percent of its average net assets may vary due to the timing of recording these transactions in relation to fluctuating net assets of the classes. Expenses directly attributable to a fund are charged to that fund. Expenses attributable to more than one fund are allocated among the respective funds on the basis of relative net assets or other appropriate methods. Expense estimates are accrued in the period to which they relate and adjustments are made when actual amounts are known.
Deferred Trustee Compensation. Under a Deferred Compensation Plan (the Plan) for the Fund, certain independent Trustees have elected to defer receipt of a portion of their annual compensation. Deferred amounts are invested in a cross-section of Fidelity funds, are marked-to-market and remain in the Fund until distributed in accordance with the Plan. The investment of deferred amounts and the offsetting payable to the Trustees of $527 are included in the accompanying Statement of Assets and Liabilities in other receivables and other payables and accrued expenses, respectively.
Income Tax Information and Distributions to Shareholders. Each year, the Fund intends to qualify as a regulated investment company under Subchapter M of the Internal Revenue Code, including distributing substantially all of its taxable income and realized gains. As a result, no provision for U.S. Federal income taxes is required. The Fund files a U.S. federal tax return, in addition to state and local tax returns as required. The Fund's federal income tax returns are subject to examination by the Internal Revenue Service (IRS) for a period of three fiscal years after they are filed. State and local tax returns may be subject to examination for an additional fiscal year depending on the jurisdiction. Foreign taxes are provided for based on the Fund's understanding of the tax rules and rates that exist in the foreign markets in which it invests.
Distributions are declared and recorded on the ex-dividend date. Income and capital gain distributions are declared separately for each class. Income and capital gain distributions are determined in accordance with income tax regulations, which may differ from GAAP.
Capital accounts within the financial statements are adjusted for permanent book-tax differences. These adjustments have no impact on net assets or the results of operations. Capital accounts are not adjusted for temporary book-tax differences which will reverse in a subsequent period.
Book-tax differences are primarily due to foreign currency transactions, partnerships, certain conversion ratio adjustments, equity-debt classifications, deferred trustees compensation, capital loss carryforwards, expiring capital loss carryforwards and losses deferred due to wash sales.
As of period end, the cost and unrealized appreciation (depreciation) in securities, and derivatives if applicable, for federal income tax purposes were as follows:
| Gross unrealized appreciation | $977,970 |
| Gross unrealized depreciation | (605,698) |
| Net unrealized appreciation (depreciation) | $372,272 |
| Tax cost | $6,113,046 |
Restricted Securities. The Fund may invest in securities that are subject to legal or contractual restrictions on resale. These securities generally may be resold in transactions exempt from registration or to the public if the securities are registered. Disposal of these securities may involve time-consuming negotiations and expense, and prompt sale at an acceptable price may be difficult. Information regarding restricted securities is included at the end of the Fund's Schedule of Investments.
Consolidated Subsidiary. The Fund invests in certain investments through a wholly-owned subsidiary ("Subsidiary"), which may be subject to federal and state taxes upon disposition.
As of period end, the Fund held an investment of $10,031 in this Subsidiary, representing .16% of the Fund's net assets. The financial statements have been consolidated and include accounts of the Fund and the Subsidiary. Accordingly, all inter-company transactions and balances have been eliminated.
Any cash held by the Subsidiary is restricted as to its use and is presented as Restricted cash in the Statement of Assets and Liabilities.
New Rule Issuance. During August 2018, the U.S. Securities and Exchange Commission issued Final Rule Release No. 33-10532, Disclosure Update and Simplification. This Final Rule includes amendments specific to registered investment companies that are intended to eliminate overlap in disclosure requirements between Regulation S-X and GAAP. In accordance with these amendments, certain line-items in the Fund's financial statements have been combined or removed for the current period as outlined in the table below.
| Financial Statement | Current Line-Item Presentation (As Applicable) | Prior Line-Item Presentation (As Applicable) |
| Statement of Assets and Liabilities | Total distributable earnings (loss) | Undistributed/Distributions in excess of/Accumulated net investment income (loss)
Accumulated/Undistributed net realized gain (loss)
Net unrealized appreciation (depreciation) |
| Statement of Changes in Net Assets | N/A - removed | Undistributed/Distributions in excess of/Accumulated net investment income (loss) end of period |
| Statement of Changes in Net Assets | Distributions to shareholders | Distributions to shareholders from net investment income
Distributions to shareholders from net realized gain |
| Distributions to Shareholders Note to Financial Statements | Distributions to shareholders | Distributions to shareholders from net investment income
Distributions to shareholders from net realized gain |
4. Derivative Instruments.
Risk Exposures and the Use of Derivative Instruments. The Fund's investment objective allows the Fund to enter into various types of derivative contracts, including options. Derivatives are investments whose value is primarily derived from underlying assets, indices or reference rates and may be transacted on an exchange or over-the-counter (OTC). Derivatives may involve a future commitment to buy or sell a specified asset based on specified terms, to exchange future cash flows at periodic intervals based on a notional principal amount, or for one party to make one or more payments upon the occurrence of specified events in exchange for periodic payments from the other party.
The Fund used derivatives to increase returns and to manage exposure to certain risks as defined below. The success of any strategy involving derivatives depends on analysis of numerous economic factors, and if the strategies for investment do not work as intended, the Fund may not achieve its objectives.
The Fund's use of derivatives increased or decreased its exposure to the following risk:
| Equity Risk | Equity risk relates to the fluctuations in the value of financial instruments as a result of changes in market prices (other than those arising from interest rate risk or foreign exchange risk), whether caused by factors specific to an individual investment, its issuer, or all factors affecting all instruments traded in a market or market segment.
|
The Fund is also exposed to additional risks from investing in derivatives, such as liquidity risk and counterparty credit risk. Liquidity risk is the risk that the Fund will be unable to close out the derivative in the open market in a timely manner. Counterparty credit risk is the risk that the counterparty will not be able to fulfill its obligation to the Fund. Derivative counterparty credit risk is managed through formal evaluation of the creditworthiness of all potential counterparties. On certain OTC derivatives such as options, the Fund attempts to reduce its exposure to counterparty credit risk by entering into an International Swaps and Derivatives Association, Inc. (ISDA) Master Agreement with each of its counterparties. The ISDA Master Agreement gives the Fund the right to terminate all transactions traded under such agreement upon the deterioration in the credit quality of the counterparty beyond specified levels. The ISDA Master Agreement gives each party the right, upon an event of default by the other party or a termination of the agreement, to close out all transactions traded under such agreement and to net amounts owed under each transaction to one net payable by one party to the other. To mitigate counterparty credit risk on bi-lateral OTC derivatives, the Fund receives collateral in the form of cash or securities once the Fund's net unrealized appreciation on outstanding derivative contracts under an ISDA Master Agreement exceeds certain applicable thresholds, subject to certain minimum transfer provisions. The collateral received is held in segregated accounts with the Fund's custodian bank in accordance with the collateral agreements entered into between the Fund, the counterparty and the Fund's custodian bank. The Fund could experience delays and costs in gaining access to the collateral even though it is held by the Fund's custodian bank. The Fund's maximum risk of loss from counterparty credit risk related to bi-lateral OTC derivatives is generally the aggregate unrealized appreciation and unpaid counterparty payments in excess of any collateral pledged by the counterparty to the Fund. The Fund may be required to pledge collateral for the benefit of the counterparties on bi-lateral OTC derivatives in an amount not less than each counterparty's unrealized appreciation on outstanding derivative contracts, subject to certain minimum transfer provisions, and any such pledged collateral is identified in the Schedule of Investments. Counterparty credit risk related to exchange-traded options may be mitigated by the protection provided by the exchange on which they trade.
Investing in derivatives may involve greater risks than investing in the underlying assets directly and, to varying degrees, may involve risk of loss in excess of any initial investment and collateral received and amounts recognized in the Statement of Assets and Liabilities. In addition, there may be the risk that the change in value of the derivative contract does not correspond to the change in value of the underlying instrument.
Options. Options give the purchaser the right, but not the obligation, to buy (call) or sell (put) an underlying security or financial instrument at an agreed exercise or strike price between or on certain dates. Options obligate the seller (writer) to buy (put) or sell (call) an underlying instrument at the exercise or strike price or cash settle an underlying derivative instrument if the holder exercises the option on or before the expiration date.
The Fund used exchange-traded and OTC written covered call options to manage its exposure to the market. When the Fund writes a covered call option, the Fund holds the underlying instrument which must be delivered to the holder upon the exercise of the option.
Upon entering into a written options contract, the Fund will receive a premium. Premiums received are reflected as a liability on the Statement of Assets and Liabilities. Options are valued daily and any unrealized appreciation (depreciation) is reflected on the Statement of Assets and Liabilities. When a written option is exercised, the premium is added to the proceeds from the sale of the underlying instrument in determining the gain or loss realized on that investment. When an option is closed the Fund will realize a gain or loss depending on whether the proceeds or amount paid for the closing sale transaction are greater or less than the premium received. When an option expires, gains and losses are realized to the extent of premiums received. The net realized gain (loss) on closed and expired written options and the change in net unrealized appreciation (depreciation) on written options are presented in the Statement of Operations.
Writing call options tends to decrease exposure to the underlying instrument and risk of loss is the change in value in excess of the premium received.
Any open options at period end are presented in the Schedule of Investments under the caption "Written Options" and are representative of volume of activity during the period.
5. Purchases and Sales of Investments.
Purchases and sales of securities, other than short-term securities, aggregated $1,320,000 and $1,488,854, respectively.
6. Fees and Other Transactions with Affiliates.
Management Fee. Fidelity Management & Research Company (the investment adviser) and its affiliates provide the Fund with investment management related services for which the Fund pays a monthly management fee. The management fee is the sum of an individual fund fee rate that is based on an annual rate of .20% of the Fund's average net assets and an annualized group fee rate that averaged .24% during the period. The group fee rate is based upon the average net assets of all the mutual funds advised by the investment adviser, including any mutual funds previously advised by the investment adviser that are currently advised by Fidelity SelectCo, LLC, an affiliate of the investment adviser. The group fee rate decreases as assets under management increase and increases as assets under management decrease. For the reporting period, the total annualized management fee rate was .44% of the Fund's average net assets.
Transfer Agent Fees. Fidelity Investments Institutional Operations Company, Inc., (FIIOC), an affiliate of the investment adviser, is the transfer, dividend disbursing and shareholder servicing agent for each class of the Fund. FIIOC receives account fees and asset-based fees that vary according to the account size and type of account of the shareholders of Growth & Income, except for Class K. FIIOC receives an asset-based fee of Class K's average net assets. FIIOC pays for typesetting, printing and mailing of shareholder reports, except proxy statements.
For the period, transfer agent fees for each class were as follows:
| | Amount | % of Class-Level Average Net Assets(a) |
| Growth and Income | $4,493 | .15 |
| Class K | 144 | .05 |
| | $4,637 | |
(a) Annualized
Accounting and Security Lending Fees. Fidelity Service Company, Inc. (FSC), an affiliate of the investment adviser, maintains the Fund's accounting records. The accounting fee is based on the level of average net assets for each month. Under a separate contract, FSC administers the security lending program. The security lending fee is based on the number and duration of lending transactions. For the period, the fees were equivalent to an annualized rate of .02%.
Brokerage Commissions. The Fund placed a portion of its portfolio transactions with brokerage firms which are affiliates of the investment adviser. Brokerage commissions are included in net realized gain (loss) and change in net unrealized appreciation (depreciation) in the Statement of Operations. The commissions paid to these affiliated firms were $34 for the period.
Interfund Trades. The Fund may purchase from or sell securities to other Fidelity Funds under procedures adopted by the Board. The procedures have been designed to ensure these interfund trades are executed in accordance with Rule 17a-7 of the 1940 Act. Interfund trades are included within the respective purchases and sales amounts shown in the Purchases and Sales of Investments note.
Other. During the period, the investment adviser reimbursed the Fund for certain losses in the amount of $13.
7. Committed Line of Credit.
The Fund participates with other funds managed by the investment adviser or an affiliate in a $4.25 billion credit facility (the "line of credit") to be utilized for temporary or emergency purposes to fund shareholder redemptions or for other short-term liquidity purposes. The Fund has agreed to pay commitment fees on its pro-rata portion of the line of credit, which amounted to $9 and is reflected in Miscellaneous expenses on the Statement of Operations. During the period, the Fund did not borrow on this line of credit.
8. Security Lending.
The Fund lends portfolio securities through a lending agent from time to time in order to earn additional income. For equity securities, a lending agent is used and may loan securities to certain qualified borrowers, including Fidelity Capital Markets (FCM), a broker-dealer affiliated with the Fund. On the settlement date of the loan, the Fund receives collateral (in the form of U.S. Treasury obligations, letters of credit and/or cash) against the loaned securities and maintains collateral in an amount not less than 100% of the market value of the loaned securities during the period of the loan. The market value of the loaned securities is determined at the close of business of the Fund and any additional required collateral is delivered to the Fund on the next business day. The Fund or borrower may terminate the loan at any time, and if the borrower defaults on its obligation to return the securities loaned because of insolvency or other reasons, the Fund may apply collateral received from the borrower against the obligation. The Fund may experience delays and costs in recovering the securities loaned. Any cash collateral received is invested in the Fidelity Securities Lending Cash Central Fund. The value of loaned securities and cash collateral at period end are disclosed on the Fund's Statement of Assets and Liabilities. Security lending income represents the income earned on investing cash collateral, less rebates paid to borrowers and any lending agent fees associated with the loan, plus any premium payments received for lending certain types of securities. Security lending income is presented in the Statement of Operations as a component of income from Fidelity Central Funds. Total security lending income during the period amounted to $192. During the period, there were no securities loaned to FCM.
9. Expense Reductions.
Commissions paid to certain brokers with whom the investment adviser, or its affiliates, places trades on behalf of the Fund include an amount in addition to trade execution, which may be rebated back to the Fund to offset certain expenses. This amount totaled $40 for the period. In addition, through arrangements with the Fund's custodian, credits realized as a result of certain uninvested cash balances were used to reduce the Fund's expenses. During the period, these credits reduced the Fund's custody expenses by $5. During the period, credits reduced each class' transfer agent expense as noted in the table below.
| | Transfer Agent expense reduction |
| Growth and Income | $2 |
In addition, during the period the investment adviser reimbursed and/or waived a portion of fund-level operating expenses in the amount of $24.
10. Distributions to Shareholders.
Distributions to shareholders of each class were as follows:
| | Six months ended
January 31, 2019 | Year ended
July 31, 2018 |
| Distributions to shareholders | | |
| Growth and Income | $132,399 | $– |
| Class K | 16,259 | – |
| Total | $148,658 | $– |
| From net investment income | | |
| Growth and Income | $– | $124,875 |
| Class K | – | 16,113 |
| Total | $– | $140,988 |
11. Share Transactions.
Share transactions for each class were as follows and may contain automatic conversions between classes or exchanges between affiliated funds:
| | Shares | Shares | Dollars | Dollars |
| | Six months ended January 31, 2019 | Year ended July 31, 2018 | Six months ended January 31, 2019 | Year ended July 31, 2018 |
| Growth and Income | | | | |
| Shares sold | 2,273 | 5,407 | $85,418 | $201,160 |
| Reinvestment of distributions | 3,403 | 3,205 | 125,341 | 118,260 |
| Shares redeemed | (8,984) | (28,976) | (336,090) | (1,077,783) |
| Net increase (decrease) | (3,308) | (20,364) | $(125,331) | $(758,363) |
| Class K | | | | |
| Shares sold | 7,292 | 2,738 | $269,948 | $101,861 |
| Reinvestment of distributions | 445 | 438 | 16,259 | 16,113 |
| Shares redeemed | (2,240) | (13,364) | (82,782) | (497,284) |
| Net increase (decrease) | 5,497 | (10,188) | $203,425 | $(379,310) |
12. Other.
The Fund's organizational documents provide former and current trustees and officers with a limited indemnification against liabilities arising in connection with the performance of their duties to the Fund. In the normal course of business, the Fund may also enter into contracts that provide general indemnifications. The Fund's maximum exposure under these arrangements is unknown as this would be dependent on future claims that may be made against the Fund. The risk of material loss from such claims is considered remote.
Shareholder Expense Example
As a shareholder of the Fund, you incur two types of costs: (1) transaction costs and (2) ongoing costs, including management fees and other Fund expenses. This Example is intended to help you understand your ongoing costs (in dollars) of investing in the Fund and to compare these costs with the ongoing costs of investing in other mutual funds.
The Example is based on an investment of $1,000 invested at the beginning of the period and held for the entire period (August 1, 2018 to January 31, 2019).
Actual Expenses
The first line of the accompanying table for each class of the Fund provides information about actual account values and actual expenses. You may use the information in this line, together with the amount you invested, to estimate the expenses that you paid over the period. Simply divide your account value by $1,000.00 (for example, an $8,600 account value divided by $1,000.00 = 8.6), then multiply the result by the number in the first line for a class of the Fund under the heading entitled "Expenses Paid During Period" to estimate the expenses you paid on your account during this period. In addition, the Fund, as a shareholder in the underlying Fidelity Central Funds, will indirectly bear its pro-rata share of the fees and expenses incurred by the underlying Fidelity Central Funds. These fees and expenses are not included in the Fund's annualized expense ratio used to calculate the expense estimate in the table below.
Hypothetical Example for Comparison Purposes
The second line of the accompanying table for each class of the Fund provides information about hypothetical account values and hypothetical expenses based on a Class' actual expense ratio and an assumed rate of return of 5% per year before expenses, which is not the Class' actual return. The hypothetical account values and expenses may not be used to estimate the actual ending account balance or expenses you paid for the period. You may use this information to compare the ongoing costs of investing in the Fund and other funds. To do so, compare this 5% hypothetical example with the 5% hypothetical examples that appear in the shareholder reports of the other funds. In addition, the Fund, as a shareholder in the underlying Fidelity Central Funds, will indirectly bear its pro-rata share of the fees and expenses incurred by the underlying Fidelity Central Funds. These fees and expenses are not included in the Fund's annualized expense ratio used to calculate the expense estimate in the table below.
Please note that the expenses shown in the table are meant to highlight your ongoing costs only and do not reflect any transaction costs. Therefore, the second line of the table is useful in comparing ongoing costs only, and will not help you determine the relative total costs of owning different funds.
| | Annualized Expense Ratio-A | Beginning
Account Value
August 1, 2018 | Ending
Account Value
January 31, 2019 | Expenses Paid
During Period-B
August 1, 2018
to January 31, 2019 |
| Growth and Income | .61% | | | |
| Actual | | $1,000.00 | $943.50 | $2.99 |
| Hypothetical-C | | $1,000.00 | $1,022.13 | $3.11 |
| Class K | .51% | | | |
| Actual | | $1,000.00 | $944.00 | $2.50 |
| Hypothetical-C | | $1,000.00 | $1,022.63 | $2.60 |
A Annualized expense ratio reflects expenses net of applicable fee waivers.
B Expenses are equal to each Class' annualized expense ratio, multiplied by the average account value over the period, multiplied by 184/365 (to reflect the one-half year period).
C 5% return per year before expenses
Board Approval of Investment Advisory Contracts and Management Fees
Fidelity Growth & Income Portfolio
Each year, the Board of Trustees, including the Independent Trustees (together, the Board), votes on the renewal of the management contract with Fidelity Management & Research Company (FMR) and the sub-advisory agreements (together, the Advisory Contracts) for the fund. FMR and the sub-advisers are referred to herein as the Investment Advisers. The Board, assisted by the advice of fund counsel and Independent Trustees' counsel, requests and considers a broad range of information relevant to the renewal of the Advisory Contracts throughout the year.
The Board meets regularly and, at each of its meetings, covers an extensive agenda of topics and materials and considers factors that are relevant to its annual consideration of the renewal of the fund's Advisory Contracts, including the services and support provided to the fund and its shareholders. The Board has established various standing committees (Committees), each composed of and chaired by Independent Trustees with varying backgrounds, to which the Board has assigned specific subject matter responsibilities in order to enhance effective decision-making by the Board. The Board, acting directly and through its Committees, requests and receives information concerning the annual consideration of the renewal of the fund's Advisory Contracts. The Board also meets as needed to review matters specifically related to the Board's annual consideration of the renewal of the Advisory Contracts. Members of the Board may also meet with trustees of other Fidelity funds through joint ad hoc committees to discuss certain matters relevant to all of the Fidelity funds.
At its January 2019 meeting, the Board unanimously determined to renew the fund's Advisory Contracts. In reaching its determination, the Board considered all factors it believed relevant, including (i) the nature, extent, and quality of the services to be provided to the fund and its shareholders (including the investment performance of the fund); (ii) the competitiveness of the fund's management fee and total expense ratio relative to peer funds; (iii) the total costs of the services to be provided by and the profits to be realized by Fidelity from its relationships with the fund; and (iv) the extent to which, if any, economies of scale exist and would be realized as the fund grows, and whether any economies of scale are appropriately shared with fund shareholders.
In considering whether to renew the Advisory Contracts for the fund, the Board reached a determination, with the assistance of fund counsel and Independent Trustees' counsel and through the exercise of its business judgment, that the renewal of the Advisory Contracts was in the best interests of the fund and its shareholders and that the compensation payable under the Advisory Contracts was fair and reasonable. The Board's decision to renew the Advisory Contracts was not based on any single factor, but rather was based on a comprehensive consideration of all the information provided to the Board at its meetings throughout the year. The Board, in reaching its determination to renew the Advisory Contracts, was aware that shareholders of the fund have a broad range of investment choices available to them, including a wide choice among funds offered by Fidelity's competitors, and that the fund's shareholders, who have the opportunity to review and weigh the disclosure provided by the fund in its prospectus and other public disclosures, have chosen to invest in this fund, which is part of the Fidelity family of funds.
Nature, Extent, and Quality of Services Provided. The Board considered Fidelity's staffing as it relates to the fund, including the backgrounds of investment personnel of Fidelity, and also considered the fund's investment objective, strategies, and related investment philosophy. The Independent Trustees also had discussions with senior management of Fidelity's investment operations and investment groups. The Board considered the structure of the investment personnel compensation program and whether this structure provides appropriate incentives to act in the best interests of the fund. Additionally, the Board considered the portfolio managers' investments, if any, in the funds that they manage.
Resources Dedicated to Investment Management and Support Services. The Board and the Fund Oversight and Research Committees reviewed the general qualifications and capabilities of Fidelity's investment staff, including its size, education, experience, and resources, as well as Fidelity's approach to recruiting, training, managing, and compensating investment personnel. The Board noted that Fidelity has continued to increase the resources devoted to non-U.S. offices, including expansion of Fidelity's global investment organization. The Board also noted that Fidelity's analysts have extensive resources, tools and capabilities that allow them to conduct sophisticated quantitative and fundamental analysis, as well as credit analysis of issuers, counterparties and guarantors. Further, the Board considered that Fidelity's investment professionals have sufficient access to global information and data so as to provide competitive investment results over time, and that those professionals also have access to sophisticated tools that permit them to assess portfolio construction and risk and performance attribution characteristics continuously, as well as to transmit new information and research conclusions rapidly around the world. Additionally, in its deliberations, the Board considered Fidelity's trading, risk management, compliance, and technology and operations capabilities and resources, which are integral parts of the investment management process.
Shareholder and Administrative Services. The Board considered (i) the nature, extent, quality, and cost of advisory, administrative, and shareholder services performed by the Investment Advisers and their affiliates under the Advisory Contracts and under separate agreements covering transfer agency, pricing and bookkeeping, and securities lending services for the fund; (ii) the nature and extent of the supervision of third party service providers, principally custodians, subcustodians, and pricing vendors; and (iii) the resources devoted to, and the record of compliance with, the fund's compliance policies and procedures. The Board also reviewed the allocation of fund brokerage, including allocations to brokers affiliated with the Investment Advisers, the use of brokerage commissions to pay fund expenses, and the use of "soft" commission dollars to pay for research services.
The Board noted that the growth of fund assets over time across the complex allows Fidelity to reinvest in the development of services designed to enhance the value and convenience of the Fidelity funds as investment vehicles. These services include 24-hour access to account information and market information through telephone representatives and over the Internet, investor education materials and asset allocation tools, and the expanded availability of Fidelity Investor Centers.
The Board noted that it and the boards of certain other Fidelity funds had formed an ad hoc Committee on Transfer Agency Fees to review the variety of transfer agency fee structures throughout the industry and Fidelity's competitive positioning with respect to industry participants.
Investment in a Large Fund Family. The Board considered the benefits to shareholders of investing in a Fidelity fund, including the benefits of investing in a fund that is part of a large family of funds offering a variety of investment disciplines and providing a large variety of mutual fund investor services. The Board noted that Fidelity had taken, or had made recommendations that resulted in the Fidelity funds taking, a number of actions over the previous year that benefited particular funds, including: (i) continuing to dedicate additional resources to Fidelity's investment research process, which includes meetings with management of issuers of securities in which the funds invest, and to the support of the senior management team that oversees asset management; (ii) continuing efforts to enhance Fidelity's global research capabilities; (iii) launching new funds and making other enhancements to meet client needs; (iv) launching new share classes of existing funds; (v) eliminating purchase minimums and broadening eligibility requirements for certain funds and share classes; (vi) reducing management fees and total expenses for certain growth equity funds and index funds; (vii) lowering expense caps for certain existing funds and classes, and converting certain voluntary expense caps to contractual caps, to reduce expenses borne by shareholders; (viii) eliminating short-term redemption fees for funds that had such fees; (ix) rationalizing product lines and gaining increased efficiencies from fund mergers and share class consolidations; (x) continuing to develop, acquire and implement systems and technology to improve services to the funds and shareholders, strengthen information security, and increase efficiency; and (xi) continuing to implement enhancements to further strengthen Fidelity's product line to increase investors' probability of success in achieving their investment goals, including retirement income goals.
Investment Performance. The Board considered whether the fund has operated in accordance with its investment objective, as well as its record of compliance with its investment restrictions and its performance history.
The Board took into account discussions that occur at Board meetings throughout the year with representatives of the Investment Advisers about fund investment performance. In this regard the Board noted that as part of regularly scheduled fund reviews and other reports to the Board on fund performance, the Board considers annualized return information for the fund for different time periods, measured against an appropriate securities market index ("benchmark index") and a peer group of funds with similar objectives ("peer group"), if any. In its evaluation of fund investment performance, the Board gave particular attention to information indicating changes in performance of certain Fidelity funds for specific time periods and discussed with the Investment Advisers the reasons for any overperformance or underperformance.
In addition to reviewing absolute and relative fund performance, the Independent Trustees periodically consider the appropriateness of fund performance metrics in evaluating the results achieved. In general, the Independent Trustees believe that fund performance should be evaluated based on net performance (after fees and expenses) of both the highest performing and lowest performing fund share classes, where applicable, compared to appropriate benchmark indices, over appropriate time periods that may include full market cycles, and compared to peer groups, as applicable, over the same periods, taking into account relevant factors including the following: general market conditions; issuer-specific information; and fund cash flows and other factors.
The Independent Trustees recognize that shareholders evaluate performance on a net basis over their own holding periods, for which one-, three-, and five-year periods are often used as a proxy. For this reason, the performance information reviewed by the Board also included net cumulative total return information for the fund and an appropriate benchmark index and peer group for the most recent one-, three-, and five-year periods ended June 30, 2018, as shown below. Returns are shown compared to the 25th percentile (top of box, 75% beaten) and 75th percentile (bottom of box, 25% beaten) of the peer universe.
Fidelity Growth & Income Portfolio
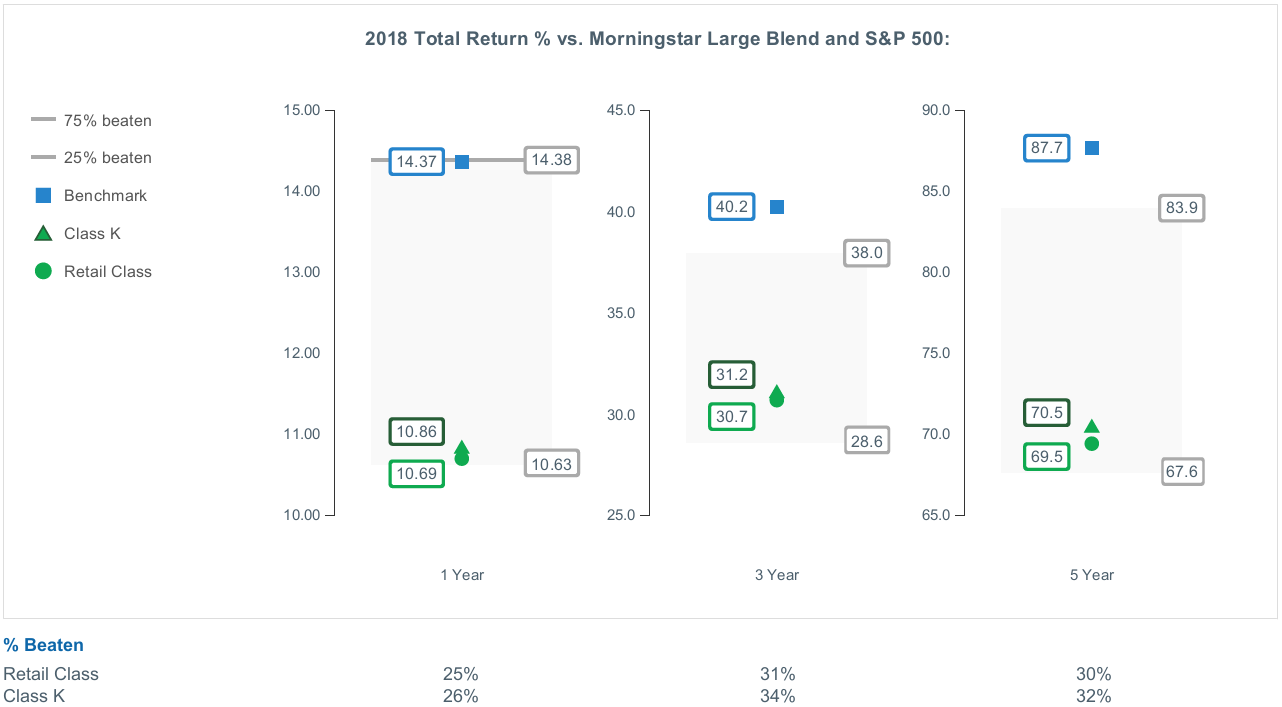
The Board considered the fund's underperformance for different time periods based on the June 30, 2018 data presented above and based on earlier periods ended prior to June 30, 2018. The Board's discussions with FMR regarding underperformance cover topics including, but not limited to: the longer-term track record of a fund's portfolio manager(s); broader trends in the market that may adversely impact a fund's performance; attribution reports on contributors to the fund's underperformance; and the applicable portfolio manager's explanation of his or her underperformance. The Board engages with FMR on steps that might be taken to address a fund's underperformance.
Based on its review, the Board concluded that the nature, extent, and quality of services provided to the fund under the Advisory Contracts should continue to benefit the shareholders of the fund.
Competitiveness of Management Fee and Total Expense Ratio. The Board considered the fund's management fee and total expense ratio compared to "mapped groups" of competitive funds and classes created for the purpose of facilitating the Trustees' competitive analysis of management fees and total expenses. Fidelity creates "mapped groups" by combining similar Lipper investment objective categories that have comparable investment mandates. Combining Lipper investment objective categories aids the Board's management fee and total expense ratio comparisons by broadening the competitive group used for comparison.
Management Fee. The Board considered two proprietary management fee comparisons for the 12-month periods (ended June 30 for 2018 and December 31 for prior periods) shown in basis points (BP) in the chart below. The group of Lipper funds used by the Board for management fee comparisons is referred to below as the "Total Mapped Group." The Total Mapped Group comparison focuses on a fund's standing in terms of gross management fees before expense reimbursements or caps relative to the total universe of funds with comparable investment mandates, regardless of whether their management fee structures also are comparable. Funds with comparable investment mandates offer exposure to similar types of securities. Funds with comparable management fee structures have similar management fee contractual arrangements (
e.g., flat rate charged for advisory services, all-inclusive fee rate,
etc.). "TMG %" represents the percentage of funds in the Total Mapped Group that had management fees that were lower than the fund's. For example, a hypothetical TMG % of 20% would mean that 80% of the funds in the Total Mapped Group had higher, and 20% had lower, management fees than the fund. The fund's actual TMG %s and the number of funds in the Total Mapped Group are in the chart below. The "Asset-Size Peer Group" (ASPG) comparison focuses on a fund's standing relative to a subset of non-Fidelity funds within the Total Mapped Group that are similar in size and management fee structure. For example, if a fund is in the first quartile of the ASPG, the fund's management fee ranks in the least expensive or lowest 25% of funds in the ASPG. The ASPG represents at least 15% of the funds in the Total Mapped Group with comparable asset size and management fee structures, subject to a minimum of 50 funds (or all funds in the Total Mapped Group if fewer than 50). Additional information, such as the ASPG quartile in which the fund's management fee rate ranked, is also included in the chart and was considered by the Board.
Fidelity Growth & Income Portfolio

The Board noted that the fund's management fee rate ranked below the median of its Total Mapped Group and below the median of its ASPG for the 12-month period ended June 30, 2018.
The Board noted that it and the boards of other Fidelity funds formed an ad hoc Committee on Group Fee, which meets periodically, to conduct an in-depth review of the "group fee" component of the management fee of funds with such management fee structures. The Committee's focus included the mechanics of the group fee, the competitive landscape of group fee structures, Fidelity funds with no group fee component and investment products not included in group fee assets. The Board also considered that, for funds subject to the group fee, FMR agreed to voluntarily waive fees over a specified period of time in amounts designed to account for assets converted from certain funds to certain collective investment trusts.
The Board also noted that, in 2013, the ad hoc Committee on Management Fees was formed to conduct an in-depth review of the management fee rates of Fidelity's active equity mutual funds. The Committee focused on the following areas: (i) standard fee structures; (ii) research consumption and trading evolution; (iii) management fee competitiveness/profitability by category; and (iv) factors that drive institutional pricing.
Based on its review, the Board concluded that the fund's management fee is fair and reasonable in light of the services that the fund receives and the other factors considered.
Total Expense Ratio. In its review of each class's total expense ratio, the Board considered the fund's management fee rate as well as other fund or class expenses, as applicable, such as transfer agent fees, pricing and bookkeeping fees, and custodial, legal, and audit fees. The Board also noted that Fidelity may agree to waive fees and expenses from time to time, and the extent to which, if any, it has done so for the fund. As part of its review, the Board also considered the current and historical total expense ratios of each class of the fund compared to competitive fund median expenses. Each class of the fund is compared to those funds and classes in the Total Mapped Group (used by the Board for management fee comparisons) that have a similar sales load structure.
The Board noted that the total expense ratio of each class ranked below the competitive median for the 12-month period ended June 30, 2018.
Fees Charged to Other Fidelity Clients. The Board also considered Fidelity fee structures and other information with respect to clients of Fidelity, such as other funds advised or subadvised by Fidelity, pension plan clients, and other institutional clients with similar mandates. The Board noted that a joint ad hoc committee created by it and the boards of other Fidelity funds periodically reviews and compares Fidelity's institutional investment advisory business with its business of providing services to the Fidelity funds and also noted the most recent findings of the committee. The Board noted that the committee's review included a consideration of the differences in services provided, fees charged, and costs incurred, as well as competition in the markets serving the different categories of clients.
Based on its review of total expense ratios and fees charged to other Fidelity clients, the Board concluded that the total expense ratio of each class of the fund was reasonable in light of the services that the fund and its shareholders receive and the other factors considered.
Costs of the Services and Profitability. The Board considered the revenues earned and the expenses incurred by Fidelity in conducting the business of developing, marketing, distributing, managing, administering and servicing the fund and servicing the fund's shareholders. The Board also considered the level of Fidelity's profits in respect of all the Fidelity funds.
On an annual basis, Fidelity presents to the Board information about the profitability of its relationships with the fund. Fidelity calculates profitability information for each fund, as well as aggregate profitability information for groups of Fidelity funds and all Fidelity funds, using a series of detailed revenue and cost allocation methodologies which originate with the books and records of Fidelity on which Fidelity's audited financial statements are based. The Audit Committee of the Board reviews any significant changes from the prior year's methodologies.
PricewaterhouseCoopers LLP (PwC), auditor to Fidelity and certain Fidelity funds, has been engaged annually by the Board as part of the Board's assessment of Fidelity's profitability analysis. PwC's engagement includes the review and assessment of the methodologies used by Fidelity in determining the revenues and expenses attributable to Fidelity's mutual fund business, and completion of agreed-upon procedures in respect of the mathematical accuracy of the fund profitability information and its conformity to established allocation methodologies. After considering PwC's reports issued under the engagement and information provided by Fidelity, the Board concluded that while other allocation methods may also be reasonable, Fidelity's profitability methodologies are reasonable in all material respects.
The Board also reviewed Fidelity's non-fund businesses and potential indirect benefits such businesses may have received as a result of their association with Fidelity's mutual fund business (i.e., fall-out benefits) as well as cases where Fidelity's affiliates may benefit from the fund's business. The Board noted that changes to fall-out benefits year-over-year reflect business developments at Fidelity's various businesses.
The Board considered the costs of the services provided by and the profits realized by Fidelity in connection with the operation of the fund and was satisfied that the profitability was not excessive.
Economies of Scale. The Board considered whether there have been economies of scale in respect of the management of the Fidelity funds, whether the Fidelity funds (including the fund) have appropriately benefited from any such economies of scale, and whether there is potential for realization of any further economies of scale. The Board considered the extent to which the fund will benefit from economies of scale as assets grow through increased services to the fund, through waivers or reimbursements, or through fee or expense ratio reductions. The Board also noted that a committee (the Economies of Scale Committee) created by it and the boards of other Fidelity funds periodically analyzes whether Fidelity attains economies of scale in respect of the management and servicing of the Fidelity funds, whether the Fidelity funds have appropriately benefited from such economies of scale, and whether there is potential for realization of any further economies of scale.
The Board recognized that the fund's management contract incorporates a "group fee" structure, which provides for lower group fee rates as total group assets increase, and for higher group fee rates as total group assets decrease (with "group assets" defined to include fund assets under FMR's management plus the assets of sector funds previously under FMR's management). FMR calculates the group fee rates based on a tiered asset "breakpoint" schedule that varies based on asset class. The Board considered that the group fee is designed to deliver the benefits of economies of scale to fund shareholders when total Fidelity fund assets increase, even if assets of any particular fund are unchanged or have declined, because some portion of Fidelity's costs are attributable to services provided to all Fidelity funds, and all funds benefit if those costs can be allocated among more assets. The Board concluded that, given the group fee structure, fund shareholders will benefit from lower management fees as group assets increase at the fund complex level, regardless of whether Fidelity achieves any such economies of scale.
The Board concluded, taking into account the analysis of the Economies of Scale Committee, that economies of scale, if any, are being appropriately shared between fund shareholders and Fidelity.
Additional Information Requested by the Board. In order to develop fully the factual basis for consideration of the Fidelity funds' advisory contracts, the Board requested and received additional information on certain topics, including: (i) fund performance trends, in particular the underperformance of certain funds, and Fidelity's long-term strategies for certain funds; (ii) Fidelity's fund profitability methodology, profitability trends for certain funds, and the impact of certain factors on fund profitability results; (iii) metrics for evaluating index fund and ETF performance and information about ETF trading characteristics; (iv) the methodology with respect to the evaluation of competitive fund data and peer group classifications and fee comparisons; (v) the expense structures for different funds and classes; (vi) information regarding other accounts managed by Fidelity, including collective investment trusts; and (vii) Fidelity's philosophies and strategies for evaluating funds and classes with lower or declining asset levels.
Based on its evaluation of all of the conclusions noted above, and after considering all factors it believed relevant, the Board concluded that the advisory fee arrangements are fair and reasonable, and that the fund's Advisory Contracts should be renewed.
GAI-SANN-0319
1.700483.122
Fidelity® Leveraged Company Stock Fund
Semi-Annual Report January 31, 2019 |
|
Beginning on January 1, 2021, as permitted by regulations adopted by the Securities and Exchange Commission, paper copies of a fund’s shareholder reports will no longer be sent by mail, unless you specifically request paper copies of the reports from the fund or from your financial intermediary, such as a financial advisor, broker-dealer or bank. Instead, the reports will be made available on a website, and you will be notified by mail each time a report is posted and provided with a website link to access the report.
If you already elected to receive shareholder reports electronically, you will not be affected by this change and you need not take any action. You may elect to receive shareholder reports and other communications from a fund electronically, by contacting your financial intermediary. For Fidelity customers, visit Fidelity's web site or call Fidelity using the contact information listed below.
You may elect to receive all future reports in paper free of charge. If you wish to continue receiving paper copies of your shareholder reports, you may contact your financial intermediary or, if you are a Fidelity customer, visit Fidelity’s website, or call Fidelity at the applicable toll-free number listed below. Your election to receive reports in paper will apply to all funds held with the fund complex/your financial intermediary.
| Account Type | Website | Phone Number |
| Brokerage, Mutual Fund, or Annuity Contracts: | fidelity.com/mailpreferences | 1-800-343-3548 |
| Employer Provided Retirement Accounts: | netbenefits.fidelity.com/preferences (choose 'no' under Required Disclosures to continue to print) | 1-800-343-0860 |
| Advisor Sold Accounts Serviced Through Your Financial Intermediary: | Contact Your Financial Intermediary | Your Financial Intermediary's phone number |
| Advisor Sold Accounts Serviced by Fidelity: | institutional.fidelity.com | 1-877-208-0098 |
Contents
To view a fund's proxy voting guidelines and proxy voting record for the 12-month period ended June 30, visit http://www.fidelity.com/proxyvotingresults or visit the Securities and Exchange Commission's (SEC) web site at http://www.sec.gov.
You may also call 1-800-544-8544 if you’re an individual investing directly with Fidelity, call 1-800-835-5092 if you’re a plan sponsor or participant with Fidelity as your recordkeeper or call 1-877-208-0098 on institutional accounts or if you’re an advisor or invest through one to request a free copy of the proxy voting guidelines.
Standard & Poor's, S&P and S&P 500 are registered service marks of The McGraw-Hill Companies, Inc. and have been licensed for use by Fidelity Distributors Corporation.
Other third-party marks appearing herein are the property of their respective owners.
All other marks appearing herein are registered or unregistered trademarks or service marks of FMR LLC or an affiliated company. © 2019 FMR LLC. All rights reserved.
This report and the financial statements contained herein are submitted for the general information of the shareholders of the Fund. This report is not authorized for distribution to prospective investors in the Fund unless preceded or accompanied by an effective prospectus.
A fund files its complete schedule of portfolio holdings with the SEC for the first and third quarters of each fiscal year on Form N-Q. Forms N-Q are available on the SEC’s web site at http://www.sec.gov. A fund's Forms N-Q may be reviewed and copied at the SEC’s Public Reference Room in Washington, DC. Information regarding the operation of the SEC's Public Reference Room may be obtained by calling 1-800-SEC-0330.
For a complete list of a fund's portfolio holdings, view the most recent holdings listing, semiannual report, or annual report on Fidelity's web site at http://www.fidelity.com, http://www.institutional.fidelity.com, or http://www.401k.com, as applicable.
NOT FDIC INSURED •MAY LOSE VALUE •NO BANK GUARANTEE
Neither the Fund nor Fidelity Distributors Corporation is a bank.
Investment Summary (Unaudited)
Top Ten Stocks as of January 31, 2019
| | % of fund's net assets |
| Eldorado Resorts, Inc. | 3.9 |
| Alibaba Group Holding Ltd. sponsored ADR | 3.4 |
| Air Canada | 3.0 |
| Alphabet, Inc. Class A | 2.9 |
| Vistra Energy Corp. | 2.5 |
| Amazon.com, Inc. | 2.4 |
| Adobe, Inc. | 2.4 |
| Boyd Gaming Corp. | 2.3 |
| Microchip Technology, Inc. | 2.2 |
| Global Payments, Inc. | 2.2 |
| | 27.2 |
Top Five Market Sectors as of January 31, 2019
| | % of fund's net assets |
| Information Technology | 24.7 |
| Consumer Discretionary | 20.0 |
| Industrials | 10.1 |
| Communication Services | 10.1 |
| Health Care | 9.4 |
Asset Allocation (% of fund's net assets)
| As of January 31, 2019* |
| | Stocks | 95.8% |
| | Convertible Securities | 0.7% |
| | Short-Term Investments and Net Other Assets (Liabilities) | 3.5% |

* Foreign investments – 16.5%
Schedule of Investments January 31, 2019 (Unaudited)
Showing Percentage of Net Assets
| Common Stocks - 95.8% | | | |
| | | Shares | Value (000s) |
| COMMUNICATION SERVICES - 10.1% | | | |
| Entertainment - 0.2% | | | |
| Activision Blizzard, Inc. | | 89,034 | $4,206 |
| Interactive Media & Services - 4.0% | | | |
| Alphabet, Inc. Class A (a) | | 57,000 | 64,176 |
| Facebook, Inc. Class A (a) | | 153,300 | 25,554 |
| | | | 89,730 |
| Media - 3.9% | | | |
| Altice U.S.A., Inc. Class A | | 2,098,100 | 41,207 |
| Comcast Corp. Class A | | 878,300 | 32,119 |
| Nexstar Broadcasting Group, Inc. Class A | | 169,698 | 14,165 |
| | | | 87,491 |
| Wireless Telecommunication Services - 2.0% | | | |
| T-Mobile U.S., Inc. (a) | | 653,000 | 45,462 |
|
| TOTAL COMMUNICATION SERVICES | | | 226,889 |
|
| CONSUMER DISCRETIONARY - 20.0% | | | |
| Hotels, Restaurants & Leisure - 11.9% | | | |
| Boyd Gaming Corp. | | 1,882,700 | 51,435 |
| Eldorado Resorts, Inc. (a) | | 1,900,380 | 88,593 |
| International Game Technology PLC (b) | | 637,400 | 10,428 |
| Marriott International, Inc. Class A | | 158,000 | 18,096 |
| Penn National Gaming, Inc. (a) | | 1,659,400 | 40,224 |
| Red Rock Resorts, Inc. | | 715,947 | 18,171 |
| Royal Caribbean Cruises Ltd. | | 214,400 | 25,739 |
| Wyndham Hotels & Resorts, Inc. | | 289,100 | 14,192 |
| Wynn Resorts Ltd. | | 12,895 | 1,586 |
| | | | 268,464 |
| Household Durables - 0.0% | | | |
| Lennar Corp. Class B | | 6,642 | 253 |
| Internet & Direct Marketing Retail - 5.8% | | | |
| Alibaba Group Holding Ltd. sponsored ADR (a) | | 445,600 | 75,079 |
| Amazon.com, Inc. (a) | | 31,500 | 54,140 |
| | | | 129,219 |
| Media - 0.5% | | | |
| Studio City International Holdings Ltd. ADR (b) | | 695,700 | 10,561 |
| Textiles, Apparel & Luxury Goods - 1.8% | | | |
| adidas AG | | 114,968 | 27,332 |
| Puma AG | | 25,100 | 13,977 |
| | | | 41,309 |
|
| TOTAL CONSUMER DISCRETIONARY | | | 449,806 |
|
| CONSUMER STAPLES - 3.4% | | | |
| Food Products - 3.4% | | | |
| Darling International, Inc. (a) | | 1,664,983 | 35,414 |
| JBS SA | | 10,119,700 | 41,869 |
| | | | 77,283 |
| ENERGY - 4.8% | | | |
| Oil, Gas & Consumable Fuels - 4.8% | | | |
| Cheniere Energy, Inc. (a) | | 319,640 | 20,984 |
| Diamondback Energy, Inc. | | 375,400 | 38,711 |
| MEG Energy Corp. (a) | | 435,900 | 1,801 |
| Parsley Energy, Inc. Class A (a) | | 677,000 | 12,579 |
| Pioneer Natural Resources Co. | | 145,200 | 20,665 |
| Whiting Petroleum Corp. (a) | | 430,473 | 12,324 |
| | | | 107,064 |
| FINANCIALS - 3.6% | | | |
| Banks - 2.0% | | | |
| Bank of America Corp. | | 891,999 | 25,395 |
| JPMorgan Chase & Co. | | 199,700 | 20,669 |
| | | | 46,064 |
| Consumer Finance - 1.0% | | | |
| OneMain Holdings, Inc. (a) | | 720,800 | 21,545 |
| Mortgage Real Estate Investment Trusts - 0.6% | | | |
| Starwood Property Trust, Inc. | | 565,200 | 12,480 |
|
| TOTAL FINANCIALS | | | 80,089 |
|
| HEALTH CARE - 9.4% | | | |
| Biotechnology - 1.5% | | | |
| Alexion Pharmaceuticals, Inc. (a) | | 134,100 | 16,489 |
| Regeneron Pharmaceuticals, Inc. (a) | | 38,600 | 16,570 |
| | | | 33,059 |
| Health Care Providers & Services - 4.6% | | | |
| Cigna Corp. | | 113,300 | 22,638 |
| Humana, Inc. | | 99,400 | 30,714 |
| Tenet Healthcare Corp. (a) | | 691,500 | 15,206 |
| UnitedHealth Group, Inc. | | 124,800 | 33,721 |
| | | | 102,279 |
| Life Sciences Tools & Services - 2.2% | | | |
| IQVIA Holdings, Inc. (a) | | 370,100 | 47,747 |
| Thermo Fisher Scientific, Inc. | | 11,394 | 2,799 |
| | | | 50,546 |
| Pharmaceuticals - 1.1% | | | |
| Bausch Health Cos., Inc. (Canada) (a) | | 56,100 | 1,377 |
| Jazz Pharmaceuticals PLC (a) | | 114,300 | 14,389 |
| Mylan NV (a) | | 323,600 | 9,692 |
| | | | 25,458 |
|
| TOTAL HEALTH CARE | | | 211,342 |
|
| INDUSTRIALS - 10.1% | | | |
| Aerospace & Defense - 1.0% | | | |
| TransDigm Group, Inc. (a) | | 57,700 | 22,561 |
| Air Freight & Logistics - 0.3% | | | |
| XPO Logistics, Inc. (a) | | 123,400 | 7,500 |
| Airlines - 3.7% | | | |
| Air Canada (a) | | 3,009,700 | 67,961 |
| Delta Air Lines, Inc. | | 335,100 | 16,564 |
| | | | 84,525 |
| Commercial Services & Supplies - 0.0% | | | |
| Novus Holdings Ltd. | | 46,866 | 15 |
| Machinery - 1.3% | | | |
| Allison Transmission Holdings, Inc. | | 510,200 | 24,831 |
| Ingersoll-Rand PLC | | 36,901 | 3,692 |
| | | | 28,523 |
| Marine - 0.0% | | | |
| Genco Shipping & Trading Ltd. (a) | | 831 | 6 |
| Trading Companies & Distributors - 3.8% | | | |
| Air Lease Corp. Class A | | 290,920 | 11,038 |
| HD Supply Holdings, Inc. (a) | | 1,016,300 | 42,624 |
| United Rentals, Inc. (a) | | 248,100 | 31,077 |
| | | | 84,739 |
|
| TOTAL INDUSTRIALS | | | 227,869 |
|
| INFORMATION TECHNOLOGY - 24.0% | | | |
| Electronic Equipment & Components - 0.8% | | | |
| CDW Corp. | | 205,900 | 17,145 |
| IT Services - 10.5% | | | |
| EPAM Systems, Inc. (a) | | 302,100 | 42,741 |
| First Data Corp. Class A (a) | | 1,383,200 | 34,096 |
| Global Payments, Inc. | | 441,800 | 49,605 |
| MasterCard, Inc. Class A | | 130,500 | 27,552 |
| PayPal Holdings, Inc. (a) | | 430,100 | 38,176 |
| Visa, Inc. Class A | | 312,800 | 42,231 |
| | | | 234,401 |
| Semiconductors & Semiconductor Equipment - 6.8% | | | |
| Marvell Technology Group Ltd. | | 634,500 | 11,757 |
| Microchip Technology, Inc. (b) | | 622,000 | 49,990 |
| Micron Technology, Inc. (a) | | 596,200 | 22,787 |
| NXP Semiconductors NV | | 379,600 | 33,037 |
| ON Semiconductor Corp. (a) | | 1,788,000 | 35,832 |
| | | | 153,403 |
| Software - 5.9% | | | |
| Adobe, Inc. (a) | | 215,600 | 53,430 |
| Microsoft Corp. | | 205,200 | 21,429 |
| SS&C Technologies Holdings, Inc. | | 804,400 | 41,419 |
| Symantec Corp. | | 809,700 | 17,020 |
| | | | 133,298 |
|
| TOTAL INFORMATION TECHNOLOGY | | | 538,247 |
|
| MATERIALS - 5.6% | | | |
| Chemicals - 4.2% | | | |
| DowDuPont, Inc. | | 778,021 | 41,865 |
| Olin Corp. | | 51,068 | 1,206 |
| The Chemours Co. LLC | | 943,100 | 33,716 |
| Trinseo SA | | 193,200 | 9,476 |
| Westlake Chemical Corp. | | 106,400 | 7,863 |
| | | | 94,126 |
| Containers & Packaging - 0.8% | | | |
| Crown Holdings, Inc. (a) | | 372,400 | 18,992 |
| Metals & Mining - 0.6% | | | |
| First Quantum Minerals Ltd. | | 1,151,600 | 13,331 |
|
| TOTAL MATERIALS | | | 126,449 |
|
| REAL ESTATE - 0.8% | | | |
| Equity Real Estate Investment Trusts (REITs) - 0.8% | | | |
| Crown Castle International Corp. | | 146,400 | 17,138 |
| UTILITIES - 4.0% | | | |
| Electric Utilities - 2.5% | | | |
| Vistra Energy Corp. (a) | | 2,173,665 | 54,581 |
| Independent Power and Renewable Electricity Producers - 1.5% | | | |
| NRG Energy, Inc. | | 837,200 | 34,250 |
|
| TOTAL UTILITIES | | | 88,831 |
|
| TOTAL COMMON STOCKS | | | |
| (Cost $1,887,049) | | | 2,151,007 |
|
| Convertible Preferred Stocks - 0.7% | | | |
| INFORMATION TECHNOLOGY - 0.7% | | | |
| Software - 0.7% | | | |
| Lyft, Inc. Series I (c)(d) | | | |
| (Cost $15,000) | | 316,764 | 14,866 |
|
| Money Market Funds - 5.4% | | | |
| Fidelity Cash Central Fund, 2.43% (e) | | 63,384,710 | 63,397 |
| Fidelity Securities Lending Cash Central Fund 2.43% (e)(f) | | 59,037,757 | 59,044 |
| TOTAL MONEY MARKET FUNDS | | | |
| (Cost $122,438) | | | 122,441 |
| TOTAL INVESTMENT IN SECURITIES - 101.9% | | | |
| (Cost $2,024,487) | | | 2,288,314 |
| NET OTHER ASSETS (LIABILITIES) - (1.9)% | | | (42,355) |
| NET ASSETS - 100% | | | $2,245,959 |
Legend
(a) Non-income producing
(b) Security or a portion of the security is on loan at period end.
(c) Restricted securities - Investment in securities not registered under the Securities Act of 1933 (excluding 144A issues). At the end of the period, the value of restricted securities (excluding 144A issues) amounted to $14,866,000 or 0.7% of net assets.
(d) Level 3 security
(e) Affiliated fund that is generally available only to investment companies and other accounts managed by Fidelity Investments. The rate quoted is the annualized seven-day yield of the fund at period end. A complete unaudited listing of the fund's holdings as of its most recent quarter end is available upon request. In addition, each Fidelity Central Fund's financial statements are available on the SEC's website or upon request.
(f) Investment made with cash collateral received from securities on loan.
Additional information on each restricted holding is as follows:
| Security | Acquisition Date | Acquisition Cost (000s) |
| Lyft, Inc. Series I | 6/27/18 | $15,000 |
Affiliated Central Funds
Information regarding fiscal year to date income earned by the Fund from investments in Fidelity Central Funds is as follows:
| Fund | Income earned |
| | (Amounts in thousands) |
| Fidelity Cash Central Fund | $727 |
| Fidelity Securities Lending Cash Central Fund | 107 |
| Total | $834 |
Amounts in the income column in the above table include any capital gain distributions from underlying funds, which are presented in the corresponding line-item in the Statement of Operations, if applicable.
Investment Valuation
The following is a summary of the inputs used, as of January 31, 2019, involving the Fund's assets and liabilities carried at fair value. The inputs or methodology used for valuing securities may not be an indication of the risk associated with investing in those securities. For more information on valuation inputs, and their aggregation into the levels used below, please refer to the Investment Valuation section in the accompanying Notes to Financial Statements.
| | Valuation Inputs at Reporting Date: |
| Description | Total | Level 1 | Level 2 | Level 3 |
| (Amounts in thousands) | | | | |
| Investments in Securities: | | | | |
| Equities: | | | | |
| Communication Services | $226,889 | $226,889 | $-- | $-- |
| Consumer Discretionary | 449,806 | 449,806 | -- | -- |
| Consumer Staples | 77,283 | 77,283 | -- | -- |
| Energy | 107,064 | 107,064 | -- | -- |
| Financials | 80,089 | 80,089 | -- | -- |
| Health Care | 211,342 | 211,342 | -- | -- |
| Industrials | 227,869 | 227,869 | -- | -- |
| Information Technology | 553,113 | 538,247 | -- | 14,866 |
| Materials | 126,449 | 126,449 | -- | -- |
| Real Estate | 17,138 | 17,138 | -- | -- |
| Utilities | 88,831 | 88,831 | -- | -- |
| Money Market Funds | 122,441 | 122,441 | -- | -- |
| Total Investments in Securities: | $2,288,314 | $2,273,448 | $-- | $14,866 |
Other Information
Distribution of investments by country or territory of incorporation, as a percentage of Total Net Assets, is as follows (Unaudited):
| United States of America | 83.5% |
| Canada | 3.8% |
| Cayman Islands | 3.4% |
| Netherlands | 1.9% |
| Brazil | 1.8% |
| Germany | 1.8% |
| Liberia | 1.1% |
| Others (Individually Less Than 1%) | 2.7% |
| | 100.0% |
See accompanying notes which are an integral part of the financial statements.
Financial Statements
Statement of Assets and Liabilities
| Amounts in thousands (except per-share amounts) | | January 31, 2019 (Unaudited) |
| Assets | | |
Investment in securities, at value (including securities loaned of $57,877) — See accompanying schedule:
Unaffiliated issuers (cost $1,902,049) | $2,165,873 | |
| Fidelity Central Funds (cost $122,438) | 122,441 | |
| Total Investment in Securities (cost $2,024,487) | | $2,288,314 |
| Receivable for investments sold | | 32,225 |
| Receivable for fund shares sold | | 877 |
| Dividends receivable | | 115 |
| Distributions receivable from Fidelity Central Funds | | 125 |
| Prepaid expenses | | 3 |
| Other receivables | | 56 |
| Total assets | | 2,321,715 |
| Liabilities | | |
| Payable for investments purchased | $13,633 | |
| Payable for fund shares redeemed | 1,631 | |
| Accrued management fee | 1,053 | |
| Other affiliated payables | 313 | |
| Other payables and accrued expenses | 79 | |
| Collateral on securities loaned | 59,047 | |
| Total liabilities | | 75,756 |
| Net Assets | | $2,245,959 |
| Net Assets consist of: | | |
| Paid in capital | | $1,990,951 |
| Total distributable earnings (loss) | | 255,008 |
| Net Assets | | $2,245,959 |
| Net Asset Value and Maximum Offering Price | | |
| Leveraged Company Stock: | | |
| Net Asset Value, offering price and redemption price per share ($1,899,341 ÷ 69,673 shares) | | $27.26 |
| Class K: | | |
| Net Asset Value, offering price and redemption price per share ($346,618 ÷ 12,677 shares) | | $27.34 |
See accompanying notes which are an integral part of the financial statements.
Statement of Operations
| Amounts in thousands | | Six months ended January 31, 2019 (Unaudited) |
| Investment Income | | |
| Dividends | | $6,927 |
| Interest | | 10 |
| Income from Fidelity Central Funds | | 834 |
| Total income | | 7,771 |
| Expenses | | |
| Management fee | $7,128 | |
| Transfer agent fees | 1,697 | |
| Accounting and security lending fees | 365 | |
| Custodian fees and expenses | 26 | |
| Independent trustees' fees and expenses | 8 | |
| Registration fees | 26 | |
| Audit | 35 | |
| Legal | 6 | |
| Miscellaneous | 7 | |
| Total expenses before reductions | 9,298 | |
| Expense reductions | (65) | |
| Total expenses after reductions | | 9,233 |
| Net investment income (loss) | | (1,462) |
| Realized and Unrealized Gain (Loss) | | |
| Net realized gain (loss) on: | | |
| Investment securities: | | |
| Unaffiliated issuers | 79,607 | |
| Foreign currency transactions | 64 | |
| Total net realized gain (loss) | | 79,671 |
| Change in net unrealized appreciation (depreciation) on: | | |
| Investment securities: | | |
| Unaffiliated issuers | (286,282) | |
| Fidelity Central Funds | 2 | |
| Assets and liabilities in foreign currencies | (1) | |
| Total change in net unrealized appreciation (depreciation) | | (286,281) |
| Net gain (loss) | | (206,610) |
| Net increase (decrease) in net assets resulting from operations | | $(208,072) |
See accompanying notes which are an integral part of the financial statements.
Statement of Changes in Net Assets
| Amounts in thousands | Six months ended January 31, 2019 (Unaudited) | Year ended July 31, 2018 |
| Increase (Decrease) in Net Assets | | |
| Operations | | |
| Net investment income (loss) | $(1,462) | $2,569 |
| Net realized gain (loss) | 79,671 | 417,957 |
| Change in net unrealized appreciation (depreciation) | (286,281) | (99,616) |
| Net increase (decrease) in net assets resulting from operations | (208,072) | 320,910 |
| Distributions to shareholders | (382,089) | – |
| Distributions to shareholders from net investment income | – | (6,187) |
| Distributions to shareholders from net realized gain | – | (529,539) |
| Total distributions | (382,089) | (535,726) |
| Share transactions - net increase (decrease) | 33,300 | (115,492) |
| Total increase (decrease) in net assets | (556,861) | (330,308) |
| Net Assets | | |
| Beginning of period | 2,802,820 | 3,133,128 |
| End of period | $2,245,959 | $2,802,820 |
| Other Information | | |
| Distributions in excess of net investment income end of period | | $(1,170) |
See accompanying notes which are an integral part of the financial statements.
Financial Highlights
Fidelity Leveraged Company Stock Fund
| | Six months ended (Unaudited) January 31, | Years endedJuly 31, | | | | |
| | 2019 | 2018 | 2017 | 2016 | 2015 | 2014 |
| Selected Per–Share Data | | | | | | |
| Net asset value, beginning of period | $34.31 | $37.25 | $40.68 | $46.90 | $45.82 | $39.44 |
| Income from Investment Operations | | | | | | |
| Net investment income (loss)A | (.02) | .02 | .19 | .41 | .41 | .34 |
| Net realized and unrealized gain (loss) | (2.26) | 3.42B | 5.53 | (3.77) | 1.01 | 6.31 |
| Total from investment operations | (2.28) | 3.44 | 5.72 | (3.36) | 1.42 | 6.65 |
| Distributions from net investment income | – | (.07) | (.37) | (.40) | (.34) | (.27) |
| Distributions from net realized gain | (4.77) | (6.32) | (8.78) | (2.46) | – | – |
| Total distributions | (4.77) | (6.38)C | (9.15) | (2.86) | (.34) | (.27) |
| Redemption fees added to paid in capitalA | – | – | –D | –D | –D | –D |
| Net asset value, end of period | $27.26 | $34.31 | $37.25 | $40.68 | $46.90 | $45.82 |
| Total ReturnE,F | (7.19)% | 10.91%B | 17.45% | (7.23)% | 3.12% | 16.96% |
| Ratios to Average Net AssetsG,H | | | | | | |
| Expenses before reductions | .78%I | .78% | .80% | .80% | .79% | .79% |
| Expenses net of fee waivers, if any | .78%I | .78% | .79% | .80% | .78% | .79% |
| Expenses net of all reductions | .78%I | .77% | .78% | .80% | .78% | .79% |
| Net investment income (loss) | (.14)%I | .07% | .51% | 1.03% | .87% | .81% |
| Supplemental Data | | | | | | |
| Net assets, end of period (in millions) | $1,899 | $2,372 | $2,644 | $2,861 | $3,755 | $4,207 |
| Portfolio turnover rateJ | 67%I | 67% | 100% | 9% | 4% | 10% |
A Calculated based on average shares outstanding during the period.
B Amount includes a reimbursement from the investment adviser for an error which amounted to $.06 per share. Excluding this reimbursement, the total return would have been 10.73%.
C Total distributions of $6.38 per share is comprised of distributions from net investment income of $.066 and distributions from net realized gain of $6.318 per share.
D Amount represents less than $.005 per share.
E Total returns for periods of less than one year are not annualized.
F Total returns would have been lower if certain expenses had not been reduced during the applicable periods shown.
G Fees and expenses of any underlying Fidelity Central Funds are not included in the Fund's expense ratio. The Fund indirectly bears its proportionate share of the expenses of any underlying Fidelity Central Funds.
H Expense ratios reflect operating expenses of the class. Expenses before reductions do not reflect amounts reimbursed by the investment adviser or reductions from brokerage service arrangements or reductions from other expense offset arrangements and do not represent the amount paid by the class during periods when reimbursements or reductions occur. Expenses net of fee waivers reflect expenses after reimbursement by the investment adviser but prior to reductions from brokerage service arrangements or other expense offset arrangements. Expenses net of all reductions represent the net expenses paid by the class.
I Annualized
J Amount does not include the portfolio activity of any underlying Fidelity Central Funds.
See accompanying notes which are an integral part of the financial statements.
Fidelity Leveraged Company Stock Fund Class K
| | Six months ended (Unaudited) January 31, | Years endedJuly 31, | | | | |
| | 2019 | 2018 | 2017 | 2016 | 2015 | 2014 |
| Selected Per–Share Data | | | | | | |
| Net asset value, beginning of period | $34.40 | $37.34 | $40.76 | $47.00 | $45.91 | $39.52 |
| Income from Investment Operations | | | | | | |
| Net investment income (loss)A | – | .06 | .23 | .46 | .46 | .40 |
| Net realized and unrealized gain (loss) | (2.27) | 3.42B | 5.55 | (3.79) | 1.03 | 6.31 |
| Total from investment operations | (2.27) | 3.48 | 5.78 | (3.33) | 1.49 | 6.71 |
| Distributions from net investment income | – | (.11) | (.42) | (.45) | (.40) | (.32) |
| Distributions from net realized gain | (4.79) | (6.32) | (8.78) | (2.46) | – | – |
| Total distributions | (4.79) | (6.42)C | (9.20) | (2.91) | (.40) | (.32) |
| Redemption fees added to paid in capitalA | – | – | –D | –D | –D | –D |
| Net asset value, end of period | $27.34 | $34.40 | $37.34 | $40.76 | $47.00 | $45.91 |
| Total ReturnE,F | (7.14)% | 11.01%B | 17.60% | (7.14)% | 3.26% | 17.10% |
| Ratios to Average Net AssetsG,H | | | | | | |
| Expenses before reductions | .67%I | .67% | .68% | .68% | .67% | .67% |
| Expenses net of fee waivers, if any | .67%I | .67% | .68% | .68% | .67% | .67% |
| Expenses net of all reductions | .67%I | .66% | .67% | .68% | .67% | .67% |
| Net investment income (loss) | (.03)%I | .18% | .63% | 1.15% | .99% | .92% |
| Supplemental Data | | | | | | |
| Net assets, end of period (in millions) | $347 | $431 | $489 | $573 | $991 | $1,173 |
| Portfolio turnover rateJ | 67%I | 67% | 100% | 9% | 4% | 10% |
A Calculated based on average shares outstanding during the period.
B Amount includes a reimbursement form the investment adviser for an error which amounted to $.06 per share. Excluding this reimbursement, the total return would have been 10.83%.
C Total distributions of $6.42 per share is comprised of distributions from net investment income of $.106 and distributions from net realized gain of $6.318 per share.
D Amount represents less than $.005 per share.
E Total returns for periods of less than one year are not annualized.
F Total returns would have been lower if certain expenses had not been reduced during the applicable periods shown.
G Fees and expenses of any underlying Fidelity Central Funds are not included in the Fund's expense ratio. The Fund indirectly bears its proportionate share of the expenses of any underlying Fidelity Central Funds.
H Expense ratios reflect operating expenses of the class. Expenses before reductions do not reflect amounts reimbursed by the investment adviser or reductions from brokerage service arrangements or reductions from other expense offset arrangements and do not represent the amount paid by the class during periods when reimbursements or reductions occur. Expenses net of fee waivers reflect expenses after reimbursement by the investment adviser but prior to reductions from brokerage service arrangements or other expense offset arrangements. Expenses net of all reductions represent the net expenses paid by the class.
I Annualized
J Amount does not include the portfolio activity of any underlying Fidelity Central Funds.
See accompanying notes which are an integral part of the financial statements.
Notes to Financial Statements (Unaudited)
For the period ended January 31, 2019
(Amounts in thousands except percentages)
1. Organization.
Fidelity Leveraged Company Stock Fund (the Fund) is a fund of Fidelity Securities Fund (the Trust) and is authorized to issue an unlimited number of shares. The Trust is registered under the Investment Company Act of 1940, as amended (the 1940 Act), as an open-end management investment company organized as a Massachusetts business trust. The Fund offers Leveraged Company Stock and Class K shares, each of which has equal rights as to assets and voting privileges. Each class has exclusive voting rights with respect to matters that affect that class.
2. Investments in Fidelity Central Funds.
The Fund invests in Fidelity Central Funds, which are open-end investment companies generally available only to other investment companies and accounts managed by the investment adviser and its affiliates. The Fund's Schedule of Investments lists each of the Fidelity Central Funds held as of period end, if any, as an investment of the Fund, but does not include the underlying holdings of each Fidelity Central Fund. As an Investing Fund, the Fund indirectly bears its proportionate share of the expenses of the underlying Fidelity Central Funds.
The Money Market Central Funds seek preservation of capital and current income and are managed by Fidelity Investments Money Management, Inc. (FIMM), an affiliate of the investment adviser. Annualized expenses of the Money Market Central Funds as of their most recent shareholder report date are less than .005%.
A complete unaudited list of holdings for each Fidelity Central Fund is available upon request or at the Securities and Exchange Commission (the SEC) website at www.sec.gov. In addition, the financial statements of the Fidelity Central Funds are available on the SEC website or upon request.
3. Significant Accounting Policies.
The Fund is an investment company and applies the accounting and reporting guidance of the Financial Accounting Standards Board (FASB) Accounting Standards Codification Topic 946 Financial Services – Investments Companies. The financial statements have been prepared in conformity with accounting principles generally accepted in the United States of America (GAAP), which require management to make certain estimates and assumptions at the date of the financial statements. Actual results could differ from those estimates. Subsequent events, if any, through the date that the financial statements were issued have been evaluated in the preparation of the financial statements. The following summarizes the significant accounting policies of the Fund:
Investment Valuation. Investments are valued as of 4:00 p.m. Eastern time on the last calendar day of the period. The Board of Trustees (the Board) has delegated the day to day responsibility for the valuation of the Fund's investments to the Fair Value Committee (the Committee) established by the Fund's investment adviser. In accordance with valuation policies and procedures approved by the Board, the Fund attempts to obtain prices from one or more third party pricing vendors or brokers to value its investments. When current market prices, quotations or currency exchange rates are not readily available or reliable, investments will be fair valued in good faith by the Committee, in accordance with procedures adopted by the Board. Factors used in determining fair value vary by investment type and may include market or investment specific events. The frequency with which these procedures are used cannot be predicted and they may be utilized to a significant extent. The Committee oversees the Fund's valuation policies and procedures and reports to the Board on the Committee's activities and fair value determinations. The Board monitors the appropriateness of the procedures used in valuing the Fund's investments and ratifies the fair value determinations of the Committee.
The Fund categorizes the inputs to valuation techniques used to value its investments into a disclosure hierarchy consisting of three levels as shown below:
- Level 1 – quoted prices in active markets for identical investments
- Level 2 – other significant observable inputs (including quoted prices for similar investments, interest rates, prepayment speeds, etc.)
- Level 3 – unobservable inputs (including the Fund's own assumptions based on the best information available)
Valuation techniques used to value the Fund's investments by major category are as follows:
Equity securities, including restricted securities, for which market quotations are readily available, are valued at the last reported sale price or official closing price as reported by a third party pricing vendor on the primary market or exchange on which they are traded and are categorized as Level 1 in the hierarchy. In the event there were no sales during the day or closing prices are not available, securities are valued at the last quoted bid price or may be valued using the last available price and are generally categorized as Level 2 in the hierarchy. For foreign equity securities, when market or security specific events arise, comparisons to the valuation of American Depositary Receipts (ADRs), futures contracts, Exchange-Traded Funds (ETFs) and certain indexes as well as quoted prices for similar securities may be used and would be categorized as Level 2 in the hierarchy. For equity securities, including restricted securities, where observable inputs are limited, assumptions about market activity and risk are used and these securities may be categorized as Level 3 in the hierarchy.
Investments in open-end mutual funds, including the Fidelity Central Funds, are valued at their closing net asset value (NAV) each business day and are categorized as Level 1 in the hierarchy.
Changes in valuation techniques may result in transfers in or out of an assigned level within the disclosure hierarchy. The aggregate value of investments by input level as of January 31, 2019 is included at the end of the Fund's Schedule of Investments.
Foreign Currency. The Fund may use foreign currency contracts to facilitate transactions in foreign-denominated securities. Gains and losses from these transactions may arise from changes in the value of the foreign currency or if the counterparties do not perform under the contracts' terms.
Foreign-denominated assets, including investment securities, and liabilities are translated into U.S. dollars at the exchange rates at period end. Purchases and sales of investment securities, income and dividends received and expenses denominated in foreign currencies are translated into U.S. dollars at the exchange rate in effect on the transaction date.
The effects of exchange rate fluctuations on investments are included with the net realized and unrealized gain (loss) on investment securities. Other foreign currency transactions resulting in realized and unrealized gain (loss) are disclosed separately.
Investment Transactions and Income. For financial reporting purposes, the Fund's investment holdings and NAV include trades executed through the end of the last business day of the period. The NAV per share for processing shareholder transactions is calculated as of the close of business of the New York Stock Exchange (NYSE), normally 4:00 p.m. Eastern time and includes trades executed through the end of the prior business day. Gains and losses on securities sold are determined on the basis of identified cost and include proceeds received from litigation. Dividend income is recorded on the ex-dividend date, except for certain dividends from foreign securities where the ex-dividend date may have passed, which are recorded as soon as the Fund is informed of the ex-dividend date. Non-cash dividends included in dividend income, if any, are recorded at the fair market value of the securities received. Income and capital gain distributions from Fidelity Central Funds, if any, are recorded on the ex-dividend date. Certain distributions received by the Fund represent a return of capital or capital gain. The Fund determines the components of these distributions subsequent to the ex-dividend date, based upon receipt of tax filings or other correspondence relating to the underlying investment. These distributions are recorded as a reduction of cost of investments and/or as a realized gain. Interest income is accrued as earned and includes coupon interest and amortization of premium and accretion of discount on debt securities as applicable. Investment income is recorded net of foreign taxes withheld where recovery of such taxes is uncertain.
Class Allocations and Expenses. Investment income, realized and unrealized capital gains and losses, common expenses of the Fund, and certain fund-level expense reductions, if any, are allocated daily on a pro-rata basis to each class based on the relative net assets of each class to the total net assets of the Fund. Each class differs with respect to transfer agent fees incurred. Certain expense reductions may also differ by class. For the reporting period, the allocated portion of income and expenses to each class as a percent of its average net assets may vary due to the timing of recording these transactions in relation to fluctuating net assets of the classes. Expenses directly attributable to a fund are charged to that fund. Expenses attributable to more than one fund are allocated among the respective funds on the basis of relative net assets or other appropriate methods. Expense estimates are accrued in the period to which they relate and adjustments are made when actual amounts are known.
Income Tax Information and Distributions to Shareholders. Each year, the Fund intends to qualify as a regulated investment company under Subchapter M of the Internal Revenue Code, including distributing substantially all of its taxable income and realized gains. As a result, no provision for U.S. Federal income taxes is required. The Fund files a U.S. federal tax return, in addition to state and local tax returns as required. The Fund's federal income tax returns are subject to examination by the Internal Revenue Service (IRS) for a period of three fiscal years after they are filed. State and local tax returns may be subject to examination for an additional fiscal year depending on the jurisdiction. Foreign taxes are provided for based on the Fund's understanding of the tax rules and rates that exist in the foreign markets in which it invests.
Distributions are declared and recorded on the ex-dividend date. Income and capital gain distributions are declared separately for each class. Income and capital gain distributions are determined in accordance with income tax regulations, which may differ from GAAP.
Capital accounts within the financial statements are adjusted for permanent book-tax differences. These adjustments have no impact on net assets or the results of operations. Capital accounts are not adjusted for temporary book-tax differences which will reverse in a subsequent period.
Book-tax differences are primarily due to foreign currency transactions, market discount, partnerships and losses deferred due to wash sales and excise tax regulations.
As of period end, the cost and unrealized appreciation (depreciation) in securities, and derivatives if applicable, for federal income tax purposes were as follows:
| Gross unrealized appreciation | $363,162 |
| Gross unrealized depreciation | (104,671) |
| Net unrealized appreciation (depreciation) | $258,491 |
| Tax cost | $2,029,823 |
The Fund intends to elect to defer to its next fiscal year $1,199,814 of ordinary losses recognized during the period January 1, 2018 to July 31, 2018.
Restricted Securities. The Fund may invest in securities that are subject to legal or contractual restrictions on resale. These securities generally may be resold in transactions exempt from registration or to the public if the securities are registered. Disposal of these securities may involve time-consuming negotiations and expense, and prompt sale at an acceptable price may be difficult. Information regarding restricted securities is included at the end of the Fund's Schedule of Investments.
New Rule Issuance. During August 2018, the U.S. Securities and Exchange Commission issued Final Rule Release No. 33-10532, Disclosure Update and Simplification. This Final Rule includes amendments specific to registered investment companies that are intended to eliminate overlap in disclosure requirements between Regulation S-X and GAAP. In accordance with these amendments, certain line-items in the Fund's financial statements have been combined or removed for the current period as outlined in the table below.
| Financial Statement | Current Line-Item Presentation (As Applicable) | Prior Line-Item Presentation (As Applicable) |
| Statement of Assets and Liabilities | Total distributable earnings (loss) | Undistributed/Distributions in excess of/Accumulated net investment income (loss)
Accumulated/Undistributed net realized gain (loss)
Net unrealized appreciation (depreciation) |
| Statement of Changes in Net Assets | N/A - removed | Undistributed/Distributions in excess of/Accumulated net investment income (loss) end of period |
| Statement of Changes in Net Assets | Distributions to shareholders | Distributions to shareholders from net investment income
Distributions to shareholders from net realized gain |
| Distributions to Shareholders Note to Financial Statements | Distributions to shareholders | Distributions to shareholders from net investment income
Distributions to shareholders from net realized gain |
4. Purchases and Sales of Investments.
Purchases and sales of securities, other than short-term securities, aggregated $801,041 and $1,199,030, respectively.
5. Fees and Other Transactions with Affiliates.
Management Fee. Fidelity Management & Research Company (the investment adviser) and its affiliates provide the Fund with investment management related services for which the Fund pays a monthly management fee. The management fee is the sum of an individual fund fee rate that is based on an annual rate of .35% of the Fund's average net assets and an annualized group fee rate that averaged .24% during the period. The group fee rate is based upon the average net assets of all the mutual funds advised by the investment adviser, including any mutual funds previously advised by the investment adviser that are currently advised by Fidelity SelectCo, LLC, an affiliate of the investment adviser. The group fee rate decreases as assets under management increase and increases as assets under management decrease. For the reporting period, the total annualized management fee rate was .59% of the Fund's average net assets.
Transfer Agent Fees. Fidelity Investments Institutional Operations Company, Inc., (FIIOC), an affiliate of the investment adviser, is the transfer, dividend disbursing and shareholder servicing agent for each class of the Fund. FIIOC receives account fees and asset-based fees that vary according to the account size and type of account of the shareholders of Leveraged Company Stock, except for Class K. FIIOC receives an asset-based fee of Class K's average net assets. FIIOC pays for typesetting, printing and mailing of shareholder reports, except proxy statements.
For the period, transfer agent fees for each class were as follows:
| | Amount | % of Class-Level Average Net Assets(a) |
| Leveraged Company Stock | $1,611 | .16 |
| Class K | 86 | .05 |
| | $1,697 | |
(a) Annualized
Accounting and Security Lending Fees. Fidelity Service Company, Inc. (FSC), an affiliate of the investment adviser, maintains the Fund's accounting records. The accounting fee is based on the level of average net assets for each month. Under a separate contract, FSC administers the security lending program. The security lending fee is based on the number and duration of lending transactions. For the period, the fees were equivalent to an annualized rate of .03%.
Brokerage Commissions. The Fund placed a portion of its portfolio transactions with brokerage firms which are affiliates of the investment adviser. Brokerage commissions are included in net realized gain (loss) and change in net unrealized appreciation (depreciation) in the Statement of Operations. The commissions paid to these affiliated firms were $37 for the period.
Interfund Trades. The Funds may purchase from or sell securities to other Fidelity Funds under procedures adopted by the Board. The procedures have been designed to ensure these interfund trades are executed in accordance with Rule 17a-7 of the 1940 Act. Interfund trades are included within the respective purchases and sales amounts shown in the Purchases and Sales of Investments note.
6. Committed Line of Credit.
The Fund participates with other funds managed by the investment adviser or an affiliate in a $4.25 billion credit facility (the "line of credit") to be utilized for temporary or emergency purposes to fund shareholder redemptions or for other short-term liquidity purposes. The Fund has agreed to pay commitment fees on its pro-rata portion of the line of credit, which amounted to $3 and is reflected in Miscellaneous expenses on the Statement of Operations. During the period, the Fund did not borrow on this line of credit.
7. Security Lending.
The Fund lends portfolio securities through a lending agent from time to time in order to earn additional income. For equity securities, a lending agent is used and may loan securities to certain qualified borrowers, including Fidelity Capital Markets (FCM), a broker-dealer affiliated with the Fund. On the settlement date of the loan, the Fund receives collateral (in the form of U.S. Treasury obligations, letters of credit and/or cash) against the loaned securities and maintains collateral in an amount not less than 100% of the market value of the loaned securities during the period of the loan. The market value of the loaned securities is determined at the close of business of the Fund and any additional required collateral is delivered to the Fund on the next business day. The Fund or borrower may terminate the loan at any time, and if the borrower defaults on its obligation to return the securities loaned because of insolvency or other reasons, the Fund may apply collateral received from the borrower against the obligation. The Fund may experience delays and costs in recovering the securities loaned. Any cash collateral received is invested in the Fidelity Securities Lending Cash Central Fund. The value of loaned securities and cash collateral at period end are disclosed on the Fund's Statement of Assets and Liabilities. Security lending income represents the income earned on investing cash collateral, less rebates paid to borrowers and any lending agent fees associated with the loan, plus any premium payments received for lending certain types of securities. Security lending income is presented in the Statement of Operations as a component of income from Fidelity Central Funds. Total security lending income during the period amounted to $107. During the period, there were no securities loaned to FCM.
8. Expense Reductions.
Commissions paid to certain brokers with whom the investment adviser, or its affiliates, places trades on behalf of the Fund include an amount in addition to trade execution, which may be rebated back to the Fund to offset certain expenses. This amount totaled $55 for the period. In addition, through arrangements with the Fund's custodian, credits realized as a result of certain uninvested cash balances were used to reduce the Fund's expenses. During the period, these credits reduced the Fund's custody expenses by $2.
In addition, during the period the investment adviser reimbursed and/or waived a portion of fund-level operating expenses in the amount of $8.
9. Distributions to Shareholders.
Distributions to shareholders of each class were as follows:
| | Six months ended
January 31, 2019 | Year ended
July 31, 2018 |
| Distributions to shareholders | | |
| Leveraged Company Stock | $323,491 | $– |
| Class K | 58,598 | – |
| Total | $382,089 | $– |
| From net investment income | | |
| Leveraged Company Stock | $– | $4,788 |
| Class K | – | 1,399 |
| Total | $– | $6,187 |
| From net realized gain | | |
| Leveraged Company Stock | $– | $447,843 |
| Class K | – | 81,696 |
| Total | $– | $529,539 |
10. Share Transactions.
Share transactions for each class were as follows and may contain automatic conversions between classes or exchanges between affiliated funds:
| | Shares | Shares | Dollars | Dollars |
| | Six months ended January 31, 2019 | Year ended July 31, 2018 | Six months ended January 31, 2019 | Year ended July 31, 2018 |
| Leveraged Company Stock | | | | |
| Shares sold | 964 | 2,261 | $26,871 | $77,379 |
| Reinvestment of distributions | 10,500 | 13,261 | 306,391 | 427,578 |
| Shares redeemed | (10,922) | (17,365) | (305,444) | (594,962) |
| Net increase (decrease) | 542 | (1,843) | $27,818 | $(90,005) |
| Class K | | | | |
| Shares sold | 557 | 989 | $15,606 | $34,063 |
| Reinvestment of distributions | 2,004 | 2,572 | 58,598 | 83,096 |
| Shares redeemed | (2,412) | (4,138) | (68,722) | (142,646) |
| Net increase (decrease) | 149 | (577) | $5,482 | $(25,487) |
11. Other.
The Fund's organizational documents provide former and current trustees and officers with a limited indemnification against liabilities arising in connection with the performance of their duties to the Fund. In the normal course of business, the Fund may also enter into contracts that provide general indemnifications. The Fund's maximum exposure under these arrangements is unknown as this would be dependent on future claims that may be made against the Fund. The risk of material loss from such claims is considered remote.
Shareholder Expense Example
As a shareholder of the Fund, you incur two types of costs: (1) transaction costs, and (2) ongoing costs, including management fees and other Fund expenses. This Example is intended to help you understand your ongoing costs (in dollars) of investing in the Fund and to compare these costs with the ongoing costs of investing in other mutual funds.
The Example is based on an investment of $1,000 invested at the beginning of the period and held for the entire period (August 1, 2018 to January 31, 2019).
Actual Expenses
The first line of the accompanying table for each class of the Fund provides information about actual account values and actual expenses. You may use the information in this line, together with the amount you invested, to estimate the expenses that you paid over the period. Simply divide your account value by $1,000.00 (for example, an $8,600 account value divided by $1,000.00 = 8.6), then multiply the result by the number in the first line for a class of the Fund under the heading entitled "Expenses Paid During Period" to estimate the expenses you paid on your account during this period. In addition, the Fund, as a shareholder in the underlying Fidelity Central Funds, will indirectly bear its pro-rata share of the fees and expenses incurred by the underlying Fidelity Central Funds. These fees and expenses are not included in the Fund's annualized expense ratio used to calculate the expense estimate in the table below.
Hypothetical Example for Comparison Purposes
The second line of the accompanying table for each class of the Fund provides information about hypothetical account values and hypothetical expenses based on a Class' actual expense ratio and an assumed rate of return of 5% per year before expenses, which is not the Class' actual return. The hypothetical account values and expenses may not be used to estimate the actual ending account balance or expenses you paid for the period. You may use this information to compare the ongoing costs of investing in the Fund and other funds. To do so, compare this 5% hypothetical example with the 5% hypothetical examples that appear in the shareholder reports of the other funds. In addition, the Fund, as a shareholder in the underlying Fidelity Central Funds, will indirectly bear its pro-rata share of the fees and expenses incurred by the underlying Fidelity Central Funds. These fees and expenses are not included in the Fund's annualized expense ratio used to calculate the expense estimate in the table below.
Please note that the expenses shown in the table are meant to highlight your ongoing costs only and do not reflect any transaction costs. Therefore, the second line of the table is useful in comparing ongoing costs only, and will not help you determine the relative total costs of owning different funds.
| | Annualized Expense Ratio-A | Beginning
Account Value
August 1, 2018 | Ending
Account Value
January 31, 2019 | Expenses Paid
During Period-B
August 1, 2018
to January 31, 2019 |
| Leveraged Company Stock | .78% | | | |
| Actual | | $1,000.00 | $928.10 | $3.79 |
| Hypothetical-C | | $1,000.00 | $1,021.27 | $3.97 |
| Class K | .67% | | | |
| Actual | | $1,000.00 | $928.60 | $3.26 |
| Hypothetical-C | | $1,000.00 | $1,021.83 | $3.41 |
A Annualized expense ratio reflects expenses net of applicable fee waivers.
B Expenses are equal to each Class' annualized expense ratio, multiplied by the average account value over the period, multiplied by 184/365 (to reflect the one-half year period).
C 5% return per year before expenses
Board Approval of Investment Advisory Contracts and Management Fees
Fidelity Leveraged Company Stock Fund
Each year, the Board of Trustees, including the Independent Trustees (together, the Board), votes on the renewal of the management contract with Fidelity Management & Research Company (FMR) and the sub-advisory agreements (together, the Advisory Contracts) for the fund. FMR and the sub-advisers are referred to herein as the Investment Advisers. The Board, assisted by the advice of fund counsel and Independent Trustees' counsel, requests and considers a broad range of information relevant to the renewal of the Advisory Contracts throughout the year.
The Board meets regularly and, at each of its meetings, covers an extensive agenda of topics and materials and considers factors that are relevant to its annual consideration of the renewal of the fund's Advisory Contracts, including the services and support provided to the fund and its shareholders. The Board has established various standing committees (Committees), each composed of and chaired by Independent Trustees with varying backgrounds, to which the Board has assigned specific subject matter responsibilities in order to enhance effective decision-making by the Board. The Board, acting directly and through its Committees, requests and receives information concerning the annual consideration of the renewal of the fund's Advisory Contracts. The Board also meets as needed to review matters specifically related to the Board's annual consideration of the renewal of the Advisory Contracts. Members of the Board may also meet with trustees of other Fidelity funds through joint ad hoc committees to discuss certain matters relevant to all of the Fidelity funds.
At its January 2019 meeting, the Board unanimously determined to renew the fund's Advisory Contracts. In reaching its determination, the Board considered all factors it believed relevant, including (i) the nature, extent, and quality of the services to be provided to the fund and its shareholders (including the investment performance of the fund); (ii) the competitiveness of the fund's management fee and total expense ratio relative to peer funds; (iii) the total costs of the services to be provided by and the profits to be realized by Fidelity from its relationships with the fund; and (iv) the extent to which, if any, economies of scale exist and would be realized as the fund grows, and whether any economies of scale are appropriately shared with fund shareholders.
In considering whether to renew the Advisory Contracts for the fund, the Board reached a determination, with the assistance of fund counsel and Independent Trustees' counsel and through the exercise of its business judgment, that the renewal of the Advisory Contracts was in the best interests of the fund and its shareholders and that the compensation payable under the Advisory Contracts was fair and reasonable. The Board's decision to renew the Advisory Contracts was not based on any single factor, but rather was based on a comprehensive consideration of all the information provided to the Board at its meetings throughout the year. The Board, in reaching its determination to renew the Advisory Contracts, was aware that shareholders of the fund have a broad range of investment choices available to them, including a wide choice among funds offered by Fidelity's competitors, and that the fund's shareholders, who have the opportunity to review and weigh the disclosure provided by the fund in its prospectus and other public disclosures, have chosen to invest in this fund, which is part of the Fidelity family of funds.
Nature, Extent, and Quality of Services Provided. The Board considered Fidelity's staffing as it relates to the fund, including the backgrounds of investment personnel of Fidelity, and also considered the fund's investment objective, strategies, and related investment philosophy. The Independent Trustees also had discussions with senior management of Fidelity's investment operations and investment groups. The Board considered the structure of the investment personnel compensation program and whether this structure provides appropriate incentives to act in the best interests of the fund. Additionally, the Board considered the portfolio managers' investments, if any, in the funds that they manage.
Resources Dedicated to Investment Management and Support Services. The Board and the Fund Oversight and Research Committees reviewed the general qualifications and capabilities of Fidelity's investment staff, including its size, education, experience, and resources, as well as Fidelity's approach to recruiting, training, managing, and compensating investment personnel. The Board noted that Fidelity has continued to increase the resources devoted to non-U.S. offices, including expansion of Fidelity's global investment organization. The Board also noted that Fidelity's analysts have extensive resources, tools and capabilities that allow them to conduct sophisticated quantitative and fundamental analysis, as well as credit analysis of issuers, counterparties and guarantors. Further, the Board considered that Fidelity's investment professionals have sufficient access to global information and data so as to provide competitive investment results over time, and that those professionals also have access to sophisticated tools that permit them to assess portfolio construction and risk and performance attribution characteristics continuously, as well as to transmit new information and research conclusions rapidly around the world. Additionally, in its deliberations, the Board considered Fidelity's trading, risk management, compliance, and technology and operations capabilities and resources, which are integral parts of the investment management process.
Shareholder and Administrative Services. The Board considered (i) the nature, extent, quality, and cost of advisory, administrative, and shareholder services performed by the Investment Advisers and their affiliates under the Advisory Contracts and under separate agreements covering transfer agency, pricing and bookkeeping, and securities lending services for the fund; (ii) the nature and extent of the supervision of third party service providers, principally custodians, subcustodians, and pricing vendors; and (iii) the resources devoted to, and the record of compliance with, the fund's compliance policies and procedures. The Board also reviewed the allocation of fund brokerage, including allocations to brokers affiliated with the Investment Advisers, the use of brokerage commissions to pay fund expenses, and the use of "soft" commission dollars to pay for research services.
The Board noted that the growth of fund assets over time across the complex allows Fidelity to reinvest in the development of services designed to enhance the value and convenience of the Fidelity funds as investment vehicles. These services include 24-hour access to account information and market information through telephone representatives and over the Internet, investor education materials and asset allocation tools, and the expanded availability of Fidelity Investor Centers.
The Board noted that it and the boards of certain other Fidelity funds had formed an ad hoc Committee on Transfer Agency Fees to review the variety of transfer agency fee structures throughout the industry and Fidelity's competitive positioning with respect to industry participants.
Investment in a Large Fund Family. The Board considered the benefits to shareholders of investing in a Fidelity fund, including the benefits of investing in a fund that is part of a large family of funds offering a variety of investment disciplines and providing a large variety of mutual fund investor services. The Board noted that Fidelity had taken, or had made recommendations that resulted in the Fidelity funds taking, a number of actions over the previous year that benefited particular funds, including: (i) continuing to dedicate additional resources to Fidelity's investment research process, which includes meetings with management of issuers of securities in which the funds invest, and to the support of the senior management team that oversees asset management; (ii) continuing efforts to enhance Fidelity's global research capabilities; (iii) launching new funds and making other enhancements to meet client needs; (iv) launching new share classes of existing funds; (v) eliminating purchase minimums and broadening eligibility requirements for certain funds and share classes; (vi) reducing management fees and total expenses for certain growth equity funds and index funds; (vii) lowering expense caps for certain existing funds and classes, and converting certain voluntary expense caps to contractual caps, to reduce expenses borne by shareholders; (viii) eliminating short-term redemption fees for funds that had such fees; (ix) rationalizing product lines and gaining increased efficiencies from fund mergers and share class consolidations; (x) continuing to develop, acquire and implement systems and technology to improve services to the funds and shareholders, strengthen information security, and increase efficiency; and (xi) continuing to implement enhancements to further strengthen Fidelity's product line to increase investors' probability of success in achieving their investment goals, including retirement income goals.
Investment Performance. The Board considered whether the fund has operated in accordance with its investment objective, as well as its record of compliance with its investment restrictions and its performance history. The Board noted that there was a portfolio management change for the fund in September 2016. The Board will continue to monitor closely the fund's performance, taking into account the portfolio manager change.
The Board took into account discussions that occur at Board meetings throughout the year with representatives of the Investment Advisers about fund investment performance. In this regard the Board noted that as part of regularly scheduled fund reviews and other reports to the Board on fund performance, the Board considers annualized return information for the fund for different time periods, measured against an appropriate securities market index ("benchmark index") and a peer group of funds with similar objectives ("peer group"), if any. In its evaluation of fund investment performance, the Board gave particular attention to information indicating changes in performance of certain Fidelity funds for specific time periods and discussed with the Investment Advisers the reasons for any overperformance or underperformance.
In addition to reviewing absolute and relative fund performance, the Independent Trustees periodically consider the appropriateness of fund performance metrics in evaluating the results achieved. In general, the Independent Trustees believe that fund performance should be evaluated based on net performance (after fees and expenses) of both the highest performing and lowest performing fund share classes, where applicable, compared to appropriate benchmark indices, over appropriate time periods that may include full market cycles, and compared to peer groups, as applicable, over the same periods, taking into account relevant factors including the following: general market conditions; issuer-specific information; and fund cash flows and other factors.
The Independent Trustees recognize that shareholders evaluate performance on a net basis over their own holding periods, for which one-, three-, and five-year periods are often used as a proxy. For this reason, the performance information reviewed by the Board also included net cumulative total return information for the fund and an appropriate benchmark index and peer group for the most recent one-, three-, and five-year periods ended June 30, 2018, as shown below. Returns are shown compared to the 25th percentile (top of box, 75% beaten) and 75th percentile (bottom of box, 25% beaten) of the peer universe.
Fidelity Leveraged Company Stock Fund
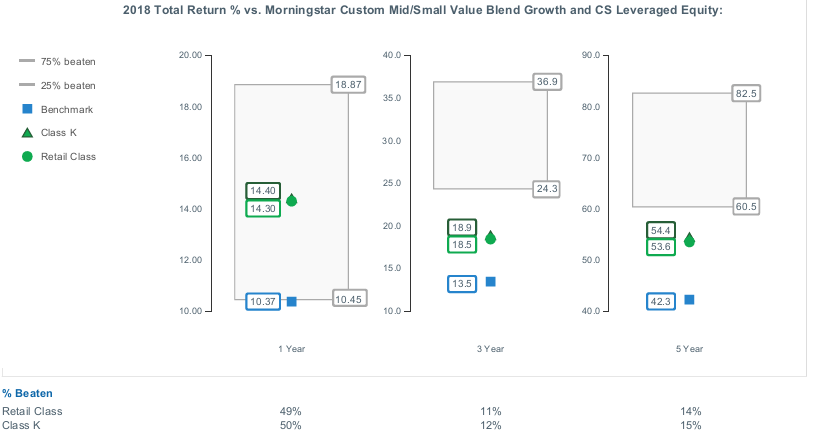
Based on its review, the Board concluded that the nature, extent, and quality of services provided to the fund under the Advisory Contracts should continue to benefit the shareholders of the fund.
Competitiveness of Management Fee and Total Expense Ratio. The Board considered the fund's management fee and total expense ratio compared to "mapped groups" of competitive funds and classes created for the purpose of facilitating the Trustees' competitive analysis of management fees and total expenses. Fidelity creates "mapped groups" by combining similar Lipper investment objective categories that have comparable investment mandates. Combining Lipper investment objective categories aids the Board's management fee and total expense ratio comparisons by broadening the competitive group used for comparison.
Management Fee. The Board considered two proprietary management fee comparisons for the 12-month periods (ended June 30 for 2018 and December 31 for prior periods) shown in basis points (BP) in the chart below. The group of Lipper funds used by the Board for management fee comparisons is referred to below as the "Total Mapped Group." The Total Mapped Group comparison focuses on a fund's standing in terms of gross management fees before expense reimbursements or caps relative to the total universe of funds with comparable investment mandates, regardless of whether their management fee structures also are comparable. Funds with comparable investment mandates offer exposure to similar types of securities. Funds with comparable management fee structures have similar management fee contractual arrangements (
e.g., flat rate charged for advisory services, all-inclusive fee rate,
etc.). "TMG %" represents the percentage of funds in the Total Mapped Group that had management fees that were lower than the fund's. For example, a hypothetical TMG % of 20% would mean that 80% of the funds in the Total Mapped Group had higher, and 20% had lower, management fees than the fund. The fund's actual TMG %s and the number of funds in the Total Mapped Group are in the chart below. The "Asset-Size Peer Group" (ASPG) comparison focuses on a fund's standing relative to a subset of non-Fidelity funds within the Total Mapped Group that are similar in size and management fee structure. For example, if a fund is in the first quartile of the ASPG, the fund's management fee ranks in the least expensive or lowest 25% of funds in the ASPG. The ASPG represents at least 15% of the funds in the Total Mapped Group with comparable asset size and management fee structures, subject to a minimum of 50 funds (or all funds in the Total Mapped Group if fewer than 50). Additional information, such as the ASPG quartile in which the fund's management fee rate ranked, is also included in the chart and was considered by the Board.
Fidelity Leveraged Company Stock Fund
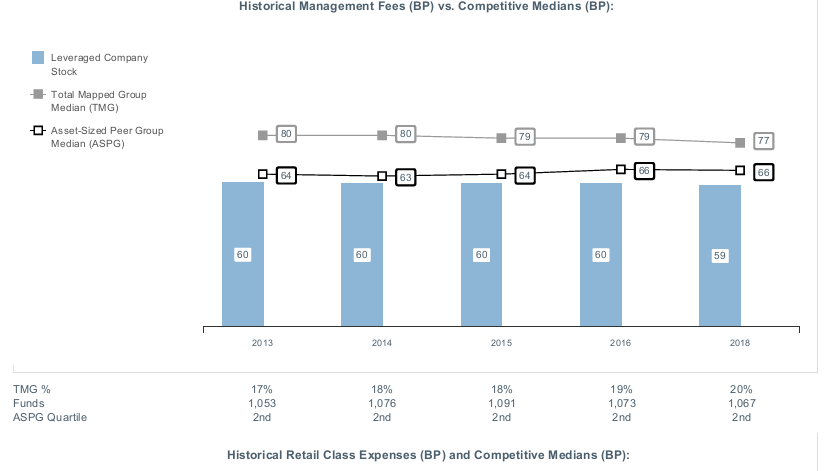
The Board noted that the fund's management fee rate ranked below the median of its Total Mapped Group and below the median of its ASPG for the 12-month period ended June 30, 2018.
The Board noted that it and the boards of other Fidelity funds formed an ad hoc Committee on Group Fee, which meets periodically, to conduct an in-depth review of the "group fee" component of the management fee of funds with such management fee structures. The Committee's focus included the mechanics of the group fee, the competitive landscape of group fee structures, Fidelity funds with no group fee component and investment products not included in group fee assets. The Board also considered that, for funds subject to the group fee, FMR agreed to voluntarily waive fees over a specified period of time in amounts designed to account for assets converted from certain funds to certain collective investment trusts.
The Board also noted that, in 2013, the ad hoc Committee on Management Fees was formed to conduct an in-depth review of the management fee rates of Fidelity's active equity mutual funds. The Committee focused on the following areas: (i) standard fee structures; (ii) research consumption and trading evolution; (iii) management fee competitiveness/profitability by category; and (iv) factors that drive institutional pricing.
Based on its review, the Board concluded that the fund's management fee is fair and reasonable in light of the services that the fund receives and the other factors considered.
Total Expense Ratio. In its review of each class's total expense ratio, the Board considered the fund's management fee rate as well as other fund or class expenses, as applicable, such as transfer agent fees, pricing and bookkeeping fees, and custodial, legal, and audit fees. The Board also noted that Fidelity may agree to waive fees and expenses from time to time, and the extent to which, if any, it has done so for the fund. As part of its review, the Board also considered the current and historical total expense ratios of each class of the fund compared to competitive fund median expenses. Each class of the fund is compared to those funds and classes in the Total Mapped Group (used by the Board for management fee comparisons) that have a similar sales load structure.
The Board noted that the total expense ratio of each class ranked below the competitive median for the 12-month period ended June 30, 2018.
Fees Charged to Other Fidelity Clients. The Board also considered Fidelity fee structures and other information with respect to clients of Fidelity, such as other funds advised or subadvised by Fidelity, pension plan clients, and other institutional clients with similar mandates. The Board noted that a joint ad hoc committee created by it and the boards of other Fidelity funds periodically reviews and compares Fidelity's institutional investment advisory business with its business of providing services to the Fidelity funds and also noted the most recent findings of the committee. The Board noted that the committee's review included a consideration of the differences in services provided, fees charged, and costs incurred, as well as competition in the markets serving the different categories of clients.
Based on its review of total expense ratios and fees charged to other Fidelity clients, the Board concluded that the total expense ratio of each class of the fund was reasonable in light of the services that the fund and its shareholders receive and the other factors considered.
Costs of the Services and Profitability. The Board considered the revenues earned and the expenses incurred by Fidelity in conducting the business of developing, marketing, distributing, managing, administering and servicing the fund and servicing the fund's shareholders. The Board also considered the level of Fidelity's profits in respect of all the Fidelity funds.
On an annual basis, Fidelity presents to the Board information about the profitability of its relationships with the fund. Fidelity calculates profitability information for each fund, as well as aggregate profitability information for groups of Fidelity funds and all Fidelity funds, using a series of detailed revenue and cost allocation methodologies which originate with the books and records of Fidelity on which Fidelity's audited financial statements are based. The Audit Committee of the Board reviews any significant changes from the prior year's methodologies.
PricewaterhouseCoopers LLP (PwC), auditor to Fidelity and certain Fidelity funds, has been engaged annually by the Board as part of the Board's assessment of Fidelity's profitability analysis. PwC's engagement includes the review and assessment of the methodologies used by Fidelity in determining the revenues and expenses attributable to Fidelity's mutual fund business, and completion of agreed-upon procedures in respect of the mathematical accuracy of the fund profitability information and its conformity to established allocation methodologies. After considering PwC's reports issued under the engagement and information provided by Fidelity, the Board concluded that while other allocation methods may also be reasonable, Fidelity's profitability methodologies are reasonable in all material respects.
The Board also reviewed Fidelity's non-fund businesses and potential indirect benefits such businesses may have received as a result of their association with Fidelity's mutual fund business (i.e., fall-out benefits) as well as cases where Fidelity's affiliates may benefit from the fund's business. The Board noted that changes to fall-out benefits year-over-year reflect business developments at Fidelity's various businesses.
The Board considered the costs of the services provided by and the profits realized by Fidelity in connection with the operation of the fund and was satisfied that the profitability was not excessive.
Economies of Scale. The Board considered whether there have been economies of scale in respect of the management of the Fidelity funds, whether the Fidelity funds (including the fund) have appropriately benefited from any such economies of scale, and whether there is potential for realization of any further economies of scale. The Board considered the extent to which the fund will benefit from economies of scale as assets grow through increased services to the fund, through waivers or reimbursements, or through fee or expense ratio reductions. The Board also noted that a committee (the Economies of Scale Committee) created by it and the boards of other Fidelity funds periodically analyzes whether Fidelity attains economies of scale in respect of the management and servicing of the Fidelity funds, whether the Fidelity funds have appropriately benefited from such economies of scale, and whether there is potential for realization of any further economies of scale.
The Board recognized that the fund's management contract incorporates a "group fee" structure, which provides for lower group fee rates as total group assets increase, and for higher group fee rates as total group assets decrease (with "group assets" defined to include fund assets under FMR's management plus the assets of sector funds previously under FMR's management). FMR calculates the group fee rates based on a tiered asset "breakpoint" schedule that varies based on asset class. The Board considered that the group fee is designed to deliver the benefits of economies of scale to fund shareholders when total Fidelity fund assets increase, even if assets of any particular fund are unchanged or have declined, because some portion of Fidelity's costs are attributable to services provided to all Fidelity funds, and all funds benefit if those costs can be allocated among more assets. The Board concluded that, given the group fee structure, fund shareholders will benefit from lower management fees as group assets increase at the fund complex level, regardless of whether Fidelity achieves any such economies of scale.
The Board concluded, taking into account the analysis of the Economies of Scale Committee, that economies of scale, if any, are being appropriately shared between fund shareholders and Fidelity.
Additional Information Requested by the Board. In order to develop fully the factual basis for consideration of the Fidelity funds' advisory contracts, the Board requested and received additional information on certain topics, including: (i) fund performance trends, in particular the underperformance of certain funds, and Fidelity's long-term strategies for certain funds; (ii) Fidelity's fund profitability methodology, profitability trends for certain funds, and the impact of certain factors on fund profitability results; (iii) metrics for evaluating index fund and ETF performance and information about ETF trading characteristics; (iv) the methodology with respect to the evaluation of competitive fund data and peer group classifications and fee comparisons; (v) the expense structures for different funds and classes; (vi) information regarding other accounts managed by Fidelity, including collective investment trusts; and (vii) Fidelity's philosophies and strategies for evaluating funds and classes with lower or declining asset levels.
Based on its evaluation of all of the conclusions noted above, and after considering all factors it believed relevant, the Board concluded that the advisory fee arrangements are fair and reasonable, and that the fund's Advisory Contracts should be renewed.
LSF-SANN-0319
1.753758.119
Fidelity® OTC Portfolio
Semi-Annual Report January 31, 2019 |
|
Beginning on January 1, 2021, as permitted by regulations adopted by the Securities and Exchange Commission, paper copies of a fund’s shareholder reports will no longer be sent by mail, unless you specifically request paper copies of the reports from the fund or from your financial intermediary, such as a financial advisor, broker-dealer or bank. Instead, the reports will be made available on a website, and you will be notified by mail each time a report is posted and provided with a website link to access the report.
If you already elected to receive shareholder reports electronically, you will not be affected by this change and you need not take any action. You may elect to receive shareholder reports and other communications from a fund electronically, by contacting your financial intermediary. For Fidelity customers, visit Fidelity's web site or call Fidelity using the contact information listed below.
You may elect to receive all future reports in paper free of charge. If you wish to continue receiving paper copies of your shareholder reports, you may contact your financial intermediary or, if you are a Fidelity customer, visit Fidelity’s website, or call Fidelity at the applicable toll-free number listed below. Your election to receive reports in paper will apply to all funds held with the fund complex/your financial intermediary.
| Account Type | Website | Phone Number |
| Brokerage, Mutual Fund, or Annuity Contracts: | fidelity.com/mailpreferences | 1-800-343-3548 |
| Employer Provided Retirement Accounts: | netbenefits.fidelity.com/preferences (choose 'no' under Required Disclosures to continue to print) | 1-800-343-0860 |
| Advisor Sold Accounts Serviced Through Your Financial Intermediary: | Contact Your Financial Intermediary | Your Financial Intermediary's phone number |
| Advisor Sold Accounts Serviced by Fidelity: | institutional.fidelity.com | 1-877-208-0098 |
Contents
To view a fund's proxy voting guidelines and proxy voting record for the 12-month period ended June 30, visit http://www.fidelity.com/proxyvotingresults or visit the Securities and Exchange Commission's (SEC) web site at http://www.sec.gov.
You may also call 1-800-544-8544 if you’re an individual investing directly with Fidelity, call 1-800-835-5092 if you’re a plan sponsor or participant with Fidelity as your recordkeeper or call 1-877-208-0098 on institutional accounts or if you’re an advisor or invest through one to request a free copy of the proxy voting guidelines.
Standard & Poor's, S&P and S&P 500 are registered service marks of The McGraw-Hill Companies, Inc. and have been licensed for use by Fidelity Distributors Corporation.
Other third-party marks appearing herein are the property of their respective owners.
All other marks appearing herein are registered or unregistered trademarks or service marks of FMR LLC or an affiliated company. © 2019 FMR LLC. All rights reserved.
This report and the financial statements contained herein are submitted for the general information of the shareholders of the Fund. This report is not authorized for distribution to prospective investors in the Fund unless preceded or accompanied by an effective prospectus.
A fund files its complete schedule of portfolio holdings with the SEC for the first and third quarters of each fiscal year on Form N-Q. Forms N-Q are available on the SEC’s web site at http://www.sec.gov. A fund's Forms N-Q may be reviewed and copied at the SEC’s Public Reference Room in Washington, DC. Information regarding the operation of the SEC's Public Reference Room may be obtained by calling 1-800-SEC-0330.
For a complete list of a fund's portfolio holdings, view the most recent holdings listing, semiannual report, or annual report on Fidelity's web site at http://www.fidelity.com, http://www.institutional.fidelity.com, or http://www.401k.com, as applicable.
NOT FDIC INSURED •MAY LOSE VALUE •NO BANK GUARANTEE
Neither the Fund nor Fidelity Distributors Corporation is a bank.
Investment Summary (Unaudited)
Top Ten Stocks as of January 31, 2019
| | % of fund's net assets |
| Apple, Inc. | 8.4 |
| Alphabet, Inc. Class A | 8.1 |
| Microsoft Corp. | 8.0 |
| Amazon.com, Inc. | 7.1 |
| Facebook, Inc. Class A | 5.4 |
| Alphabet, Inc. Class C | 2.7 |
| NVIDIA Corp. | 2.3 |
| Activision Blizzard, Inc. | 2.0 |
| Netflix, Inc. | 1.8 |
| Adobe, Inc. | 1.7 |
| | 47.5 |
Top Five Market Sectors as of January 31, 2019
| | % of fund's net assets |
| Information Technology | 38.3 |
| Communication Services | 23.7 |
| Consumer Discretionary | 17.5 |
| Health Care | 9.2 |
| Financials | 4.4 |
Asset Allocation (% of fund's net assets)
| As of January 31, 2019* |
| | Stocks | 97.2% |
| | Convertible Securities | 2.5% |
| | Short-Term Investments and Net Other Assets (Liabilities) | 0.3% |

* Foreign investments - 6.8%
Schedule of Investments January 31, 2019 (Unaudited)
Showing Percentage of Net Assets
| Common Stocks - 97.1% | | | |
| | | Shares | Value (000s) |
| COMMUNICATION SERVICES - 23.7% | | | |
| Entertainment - 4.9% | | | |
| Activision Blizzard, Inc. | | 7,485,618 | $353,621 |
| NetEase, Inc. ADR | | 217,940 | 54,906 |
| Netflix, Inc. (a) | | 967,960 | 328,622 |
| Nintendo Co. Ltd. ADR (b) | | 848,000 | 31,580 |
| Take-Two Interactive Software, Inc. (a) | | 854,900 | 90,235 |
| Ubisoft Entertainment SA (a) | | 171,152 | 15,189 |
| | | | 874,153 |
| Interactive Media & Services - 18.8% | | | |
| Alphabet, Inc.: | | | |
| Class A (a) | | 1,289,327 | 1,451,640 |
| Class C (a) | | 435,169 | 485,810 |
| ANGI Homeservices, Inc. Class A (a)(b) | | 4,899,975 | 83,300 |
| CarGurus, Inc. Class A (a) | | 1,792,949 | 76,684 |
| Eventbrite, Inc. (b) | | 25,200 | 756 |
| Facebook, Inc. Class A (a) | | 5,807,314 | 968,021 |
| IAC/InterActiveCorp (a) | | 204,525 | 43,212 |
| Match Group, Inc. (b) | | 467,200 | 24,991 |
| Tencent Holdings Ltd. | | 1,485,500 | 66,126 |
| Tencent Holdings Ltd. sponsored ADR | | 2,104,900 | 93,900 |
| Twitter, Inc. (a) | | 2,948,800 | 98,962 |
| | | | 3,393,402 |
| Media - 0.0% | | | |
| Turn, Inc. (Escrow) (a)(c)(d) | | 1,199,041 | 797 |
| Wireless Telecommunication Services - 0.0% | | | |
| Boingo Wireless, Inc. (a) | | 186,800 | 4,506 |
|
| TOTAL COMMUNICATION SERVICES | | | 4,272,858 |
|
| CONSUMER DISCRETIONARY - 17.5% | | | |
| Automobiles - 0.9% | | | |
| Tesla, Inc. (a)(b) | | 513,821 | 157,753 |
| Diversified Consumer Services - 0.1% | | | |
| Adtalem Global Education, Inc. (a) | | 114,500 | 5,599 |
| Weight Watchers International, Inc. (a) | | 193,100 | 6,179 |
| | | | 11,778 |
| Hotels, Restaurants & Leisure - 2.6% | | | |
| Bluegreen Vacations Corp. | | 470,800 | 6,309 |
| Caesars Entertainment Corp. (a)(b) | | 307,800 | 2,813 |
| Del Frisco's Restaurant Group, Inc. (a) | | 1,176,500 | 9,318 |
| Domino's Pizza, Inc. | | 283,400 | 80,409 |
| Eldorado Resorts, Inc. (a) | | 350,255 | 16,329 |
| Hilton Grand Vacations, Inc. (a) | | 499,300 | 15,149 |
| Hilton Worldwide Holdings, Inc. | | 7,300 | 544 |
| Marriott International, Inc. Class A | | 1,286,700 | 147,366 |
| Marriott Vacations Worldwide Corp. | | 26,700 | 2,364 |
| Planet Fitness, Inc. (a) | | 1,894,400 | 109,724 |
| Restaurant Brands International, Inc. | | 67,300 | 4,218 |
| Royal Caribbean Cruises Ltd. | | 137,300 | 16,483 |
| Texas Roadhouse, Inc. Class A | | 127,300 | 7,745 |
| U.S. Foods Holding Corp. (a) | | 1,069,600 | 36,067 |
| Wingstop, Inc. | | 152,020 | 9,980 |
| | | | 464,818 |
| Internet & Direct Marketing Retail - 9.9% | | | |
| Alibaba Group Holding Ltd. sponsored ADR (a) | | 156,600 | 26,386 |
| Amazon.com, Inc. (a) | | 746,808 | 1,283,561 |
| Delivery Hero AG (a)(e) | | 44,300 | 1,633 |
| eBay, Inc. | | 1,475,900 | 49,664 |
| MercadoLibre, Inc. | | 272,800 | 99,299 |
| The Booking Holdings, Inc. (a) | | 94,660 | 173,494 |
| Yahoo!, Inc. (a) | | 2,139,400 | 146,570 |
| | | | 1,780,607 |
| Media - 0.0% | | | |
| China Literature Ltd. (a)(e) | | 724,800 | 3,582 |
| Multiline Retail - 1.0% | | | |
| Avenue Supermarts Ltd. (a)(e) | | 101,832 | 1,973 |
| Dollar Tree, Inc. (a) | | 1,920,200 | 185,933 |
| | | | 187,906 |
| Specialty Retail - 2.0% | | | |
| Best Buy Co., Inc. | | 867,000 | 51,361 |
| Burlington Stores, Inc. (a) | | 255,400 | 43,855 |
| Five Below, Inc. (a) | | 344,400 | 42,613 |
| Lowe's Companies, Inc. | | 739,500 | 71,110 |
| Ross Stores, Inc. | | 1,143,100 | 105,302 |
| Tiffany & Co., Inc. | | 103,100 | 9,148 |
| Ulta Beauty, Inc. (a) | | 122,710 | 35,822 |
| | | | 359,211 |
| Textiles, Apparel & Luxury Goods - 1.0% | | | |
| G-III Apparel Group Ltd. (a) | | 189,900 | 6,622 |
| lululemon athletica, Inc. (a) | | 1,021,174 | 150,940 |
| LVMH Moet Hennessy - Louis Vuitton SA | | 5,727 | 1,837 |
| PVH Corp. | | 240,700 | 26,263 |
| VF Corp. | | 45,900 | 3,863 |
| | | | 189,525 |
|
| TOTAL CONSUMER DISCRETIONARY | | | 3,155,180 |
|
| CONSUMER STAPLES - 4.1% | | | |
| Beverages - 1.8% | | | |
| Diageo PLC | | 2,344,600 | 89,485 |
| Fever-Tree Drinks PLC | | 2,072,296 | 69,880 |
| Keurig Dr. Pepper, Inc. | | 393,900 | 10,722 |
| Monster Beverage Corp. (a) | | 1,033,740 | 59,171 |
| PepsiCo, Inc. | | 800,500 | 90,192 |
| | | | 319,450 |
| Food & Staples Retailing - 1.7% | | | |
| BJ's Wholesale Club Holdings, Inc. | | 1,763,823 | 46,406 |
| Costco Wholesale Corp. | | 1,057,183 | 226,903 |
| Performance Food Group Co. (a) | | 1,073,000 | 36,654 |
| | | | 309,963 |
| Food Products - 0.4% | | | |
| Darling International, Inc. (a) | | 414,800 | 8,823 |
| Mondelez International, Inc. | | 831,352 | 38,458 |
| The Kraft Heinz Co. | | 591,700 | 28,437 |
| | | | 75,718 |
| Personal Products - 0.2% | | | |
| Coty, Inc. Class A | | 4,669,400 | 36,235 |
|
| TOTAL CONSUMER STAPLES | | | 741,366 |
|
| ENERGY - 0.3% | | | |
| Oil, Gas & Consumable Fuels - 0.3% | | | |
| Cenovus Energy, Inc. (Canada) | | 185,000 | 1,445 |
| Centennial Resource Development, Inc. Class A (a) | | 995,300 | 13,108 |
| Delek U.S. Holdings, Inc. | | 74,600 | 2,425 |
| EOG Resources, Inc. | | 15,300 | 1,518 |
| Reliance Industries Ltd. | | 1,913,673 | 33,094 |
| | | | 51,590 |
| FINANCIALS - 4.4% | | | |
| Banks - 1.2% | | | |
| Bank of America Corp. | | 622,500 | 17,723 |
| Citigroup, Inc. | | 289,800 | 18,681 |
| Commerce Bancshares, Inc. | | 184,915 | 11,058 |
| Cullen/Frost Bankers, Inc. | | 79,300 | 7,714 |
| Huntington Bancshares, Inc. | | 7,447,000 | 98,598 |
| Investors Bancorp, Inc. | | 2,568,700 | 31,184 |
| PacWest Bancorp | | 757,700 | 29,240 |
| | | | 214,198 |
| Capital Markets - 2.6% | | | |
| BlackRock, Inc. Class A | | 44,500 | 18,471 |
| Carlyle Group LP | | 624,800 | 11,802 |
| Cboe Global Markets, Inc. | | 283,300 | 26,423 |
| Charles Schwab Corp. | | 1,056,400 | 49,408 |
| CME Group, Inc. | | 564,400 | 102,879 |
| E*TRADE Financial Corp. | | 511,020 | 23,844 |
| Monex Group, Inc. (b) | | 585,000 | 2,041 |
| Morgan Stanley | | 163,600 | 6,920 |
| Northern Trust Corp. | | 855,400 | 75,669 |
| TD Ameritrade Holding Corp. | | 2,619,900 | 146,583 |
| Virtu Financial, Inc. Class A | | 375,800 | 9,602 |
| | | | 473,642 |
| Consumer Finance - 0.6% | | | |
| Capital One Financial Corp. | | 1,181,200 | 95,193 |
|
| TOTAL FINANCIALS | | | 783,033 |
|
| HEALTH CARE - 8.7% | | | |
| Biotechnology - 5.7% | | | |
| Acceleron Pharma, Inc. (a) | | 312,800 | 13,263 |
| Agios Pharmaceuticals, Inc. (a) | | 214,835 | 11,515 |
| Alexion Pharmaceuticals, Inc. (a) | | 1,232,289 | 151,522 |
| Allakos, Inc. (a) | | 58,200 | 2,325 |
| Alnylam Pharmaceuticals, Inc. (a) | | 270,200 | 22,570 |
| Amgen, Inc. | | 1,129,434 | 211,328 |
| AnaptysBio, Inc. (a) | | 98,700 | 6,546 |
| Array BioPharma, Inc. (a) | | 600 | 11 |
| Audentes Therapeutics, Inc. (a) | | 48,300 | 1,198 |
| bluebird bio, Inc. (a) | | 379,726 | 50,667 |
| Blueprint Medicines Corp. (a) | | 148,000 | 10,669 |
| Cellectis SA sponsored ADR (a) | | 392,100 | 6,928 |
| Chimerix, Inc. (a) | | 51,300 | 120 |
| Crinetics Pharmaceuticals, Inc. (a) | | 93,000 | 2,444 |
| DBV Technologies SA sponsored ADR (a)(b) | | 1,038,200 | 7,008 |
| Deciphera Pharmaceuticals, Inc. (a) | | 49,500 | 1,330 |
| FibroGen, Inc. (a) | | 190,200 | 10,794 |
| GenSight Biologics SA (a)(b)(e) | | 237,548 | 737 |
| Global Blood Therapeutics, Inc. (a) | | 4,200 | 201 |
| Heron Therapeutics, Inc. (a) | | 1,402,915 | 37,738 |
| Intercept Pharmaceuticals, Inc. (a) | | 406,919 | 49,107 |
| Ionis Pharmaceuticals, Inc. (a) | | 417,902 | 24,238 |
| Moderna, Inc. | | 755,351 | 11,285 |
| Neurocrine Biosciences, Inc. (a) | | 1,168,900 | 103,120 |
| Regeneron Pharmaceuticals, Inc. (a) | | 185,800 | 79,758 |
| Sage Therapeutics, Inc. (a) | | 230,975 | 32,935 |
| Sarepta Therapeutics, Inc. (a) | | 281,900 | 39,384 |
| Scholar Rock Holding Corp. | | 101,400 | 1,532 |
| Spark Therapeutics, Inc. (a) | | 322,790 | 15,436 |
| Trevena, Inc. (a)(b) | | 499,321 | 534 |
| uniQure B.V. (a) | | 531,200 | 18,194 |
| Vertex Pharmaceuticals, Inc. (a) | | 388,100 | 74,092 |
| Xencor, Inc. (a) | | 725,187 | 26,179 |
| | | | 1,024,708 |
| Health Care Equipment & Supplies - 1.1% | | | |
| Align Technology, Inc. (a) | | 83,900 | 20,887 |
| AxoGen, Inc. (a) | | 83,800 | 1,383 |
| Boston Scientific Corp. (a) | | 1,336,600 | 50,991 |
| DexCom, Inc. (a) | | 118,100 | 16,656 |
| Insulet Corp. (a) | | 100,800 | 8,184 |
| Intuitive Surgical, Inc. (a) | | 199,546 | 104,490 |
| ViewRay, Inc. (a)(b) | | 1,050,700 | 7,555 |
| | | | 210,146 |
| Health Care Providers & Services - 0.9% | | | |
| Elanco Animal Health, Inc. (b) | | 99,300 | 2,898 |
| G1 Therapeutics, Inc. (a) | | 314,372 | 6,724 |
| Humana, Inc. | | 102,209 | 31,582 |
| National Vision Holdings, Inc. (a) | | 576,995 | 18,325 |
| Neuronetics, Inc. | | 43,200 | 740 |
| R1 RCM, Inc. (a) | | 704,802 | 5,723 |
| UnitedHealth Group, Inc. | | 340,900 | 92,111 |
| | | | 158,103 |
| Health Care Technology - 0.1% | | | |
| Castlight Health, Inc. Class B (a) | | 51,600 | 153 |
| Teladoc Health, Inc. (a)(b) | | 190,400 | 12,224 |
| | | | 12,377 |
| Life Sciences Tools & Services - 0.1% | | | |
| Illumina, Inc. (a) | | 43,700 | 12,227 |
| Pharmaceuticals - 0.8% | | | |
| Akcea Therapeutics, Inc. (a) | | 116,620 | 3,100 |
| Allergan PLC | | 25,800 | 3,715 |
| AstraZeneca PLC sponsored ADR | | 1,248,100 | 45,655 |
| Bristol-Myers Squibb Co. | | 176,240 | 8,701 |
| Collegium Pharmaceutical, Inc. (a)(b) | | 636,600 | 10,192 |
| Jazz Pharmaceuticals PLC (a) | | 146,300 | 18,418 |
| MyoKardia, Inc. (a) | | 121,400 | 5,024 |
| Nektar Therapeutics (a) | | 837,200 | 35,447 |
| The Medicines Company (a) | | 231,600 | 5,352 |
| TherapeuticsMD, Inc. (a)(b) | | 382,900 | 2,010 |
| Theravance Biopharma, Inc. (a) | | 176,300 | 4,593 |
| Zogenix, Inc. (a) | | 274,600 | 12,014 |
| | | | 154,221 |
|
| TOTAL HEALTH CARE | | | 1,571,782 |
|
| INDUSTRIALS - 1.3% | | | |
| Aerospace & Defense - 0.2% | | | |
| Space Exploration Technologies Corp.: | | | |
| Class A (a)(c)(d) | | 203,488 | 37,849 |
| Class C (a)(c)(d) | | 7,092 | 1,319 |
| United Technologies Corp. | | 30,700 | 3,625 |
| | | | 42,793 |
| Airlines - 0.5% | | | |
| American Airlines Group, Inc. | | 265,632 | 9,502 |
| Spirit Airlines, Inc. (a) | | 707,900 | 41,639 |
| United Continental Holdings, Inc. (a) | | 423,700 | 36,976 |
| Wheels Up Partners Holdings LLC Series B (a)(c)(d)(f) | | 1,760,377 | 2,500 |
| | | | 90,617 |
| Commercial Services & Supplies - 0.1% | | | |
| Copart, Inc. (a) | | 262,700 | 13,301 |
| Evoqua Water Technologies Corp. (a) | | 261,500 | 2,827 |
| Tomra Systems ASA | | 354,100 | 9,174 |
| | | | 25,302 |
| Machinery - 0.1% | | | |
| Deere & Co. | | 51,900 | 8,512 |
| Professional Services - 0.0% | | | |
| CoStar Group, Inc. (a) | | 4,800 | 1,876 |
| Recruit Holdings Co. Ltd. | | 70,900 | 1,896 |
| | | | 3,772 |
| Road & Rail - 0.3% | | | |
| J.B. Hunt Transport Services, Inc. | | 315,891 | 33,813 |
| Knight-Swift Transportation Holdings, Inc. Class A | | 473,000 | 15,018 |
| | | | 48,831 |
| Trading Companies & Distributors - 0.1% | | | |
| HD Supply Holdings, Inc. (a) | | 274,200 | 11,500 |
|
| TOTAL INDUSTRIALS | | | 231,327 |
|
| INFORMATION TECHNOLOGY - 36.6% | | | |
| Communications Equipment - 0.0% | | | |
| Cisco Systems, Inc. | | 81,700 | 3,864 |
| IT Services - 4.0% | | | |
| Adyen BV (e) | | 9,662 | 7,163 |
| Akamai Technologies, Inc. (a) | | 507,300 | 33,025 |
| Alliance Data Systems Corp. | | 35,900 | 6,375 |
| FleetCor Technologies, Inc. (a) | | 18,000 | 3,633 |
| Global Payments, Inc. | | 133,500 | 14,989 |
| GoDaddy, Inc. (a) | | 1,254,000 | 86,062 |
| MasterCard, Inc. Class A | | 290,200 | 61,270 |
| Netcompany Group A/S (e) | | 72,500 | 2,445 |
| PayPal Holdings, Inc. (a) | | 2,889,700 | 256,490 |
| Shopify, Inc. Class A (a) | | 524,926 | 88,362 |
| Square, Inc. (a) | | 406,599 | 29,011 |
| Total System Services, Inc. | | 23,600 | 2,115 |
| Visa, Inc. Class A | | 706,600 | 95,398 |
| Wix.com Ltd. (a) | | 237,100 | 25,927 |
| Worldpay, Inc. (a) | | 117,400 | 9,801 |
| | | | 722,066 |
| Semiconductors & Semiconductor Equipment - 9.1% | | | |
| Acacia Communications, Inc. (a) | | 149,000 | 6,483 |
| Analog Devices, Inc. | | 1,244,800 | 123,061 |
| ASML Holding NV | | 395,265 | 69,183 |
| ASML Holding NV (Netherlands) | | 32,000 | 5,596 |
| Broadcom, Inc. | | 737,866 | 197,933 |
| Intel Corp. | | 1,173,200 | 55,281 |
| KLA-Tencor Corp. | | 93,700 | 9,986 |
| Lam Research Corp. | | 818,500 | 138,801 |
| Marvell Technology Group Ltd. | | 9,786,936 | 181,352 |
| Microchip Technology, Inc. (b) | | 140,700 | 11,308 |
| Micron Technology, Inc. (a) | | 2,101,144 | 80,306 |
| NVIDIA Corp. | | 2,834,001 | 407,388 |
| NXP Semiconductors NV | | 517,200 | 45,012 |
| Qorvo, Inc. (a) | | 252,800 | 16,523 |
| Qualcomm, Inc. | | 3,786,276 | 187,496 |
| Skyworks Solutions, Inc. | | 126,700 | 9,254 |
| Taiwan Semiconductor Manufacturing Co. Ltd. sponsored ADR | | 2,489,200 | 93,644 |
| | | | 1,638,607 |
| Software - 14.8% | | | |
| 2U, Inc. (a) | | 260,841 | 14,829 |
| Adobe, Inc. (a) | | 1,255,100 | 311,039 |
| Atom Tickets LLC (a)(c)(d)(f) | | 516,103 | 1,528 |
| Autodesk, Inc. (a) | | 1,074,920 | 158,228 |
| Avalara, Inc. | | 26,668 | 1,063 |
| Black Knight, Inc. (a) | | 870,900 | 42,840 |
| Cadence Design Systems, Inc. (a) | | 237,300 | 11,398 |
| Carbon Black, Inc. | | 30,000 | 465 |
| Cardlytics, Inc. (a) | | 41,132 | 719 |
| Dataminr, Inc. Series E (c)(d) | | 950,001 | 19,323 |
| Dropbox, Inc. Class A (a) | | 215,316 | 5,320 |
| HIVE Blockchain Technologies Ltd. (a)(b) | | 2,809,100 | 780 |
| HIVE Blockchain Technologies Ltd. warrants 11/14/19 (a) | | 2,163,600 | 41 |
| HubSpot, Inc. (a) | | 741,280 | 117,352 |
| Intuit, Inc. | | 767,800 | 165,707 |
| Microsoft Corp. | | 13,796,799 | 1,440,800 |
| Nutanix, Inc.: | | | |
| Class A (a) | | 468,190 | 23,985 |
| Class B (a)(e) | | 311,503 | 15,958 |
| Parametric Technology Corp. (a) | | 53,500 | 4,536 |
| Paylocity Holding Corp. (a) | | 181,900 | 12,920 |
| Pivotal Software, Inc. | | 1,499,400 | 27,724 |
| Pluralsight, Inc. | | 205,100 | 6,149 |
| Proofpoint, Inc. (a) | | 121,300 | 12,357 |
| Salesforce.com, Inc. (a) | | 1,544,848 | 234,771 |
| ServiceNow, Inc. (a) | | 13,300 | 2,926 |
| Talend SA ADR (a) | | 79,900 | 2,972 |
| Tanium, Inc. Class B (a)(c)(d) | | 392,200 | 3,410 |
| Workday, Inc. Class A (a) | | 137,600 | 24,979 |
| Zuora, Inc. | | 611,800 | 13,239 |
| | | | 2,677,358 |
| Technology Hardware, Storage & Peripherals - 8.7% | | | |
| Apple, Inc. | | 9,089,260 | 1,512,810 |
| Samsung Electronics Co. Ltd. | | 1,157,560 | 48,022 |
| | | | 1,560,832 |
|
| TOTAL INFORMATION TECHNOLOGY | | | 6,602,727 |
|
| MATERIALS - 0.2% | | | |
| Chemicals - 0.2% | | | |
| CF Industries Holdings, Inc. | | 177,700 | 7,757 |
| FMC Corp. | | 50,880 | 4,060 |
| LG Chemical Ltd. | | 43,715 | 14,461 |
| | | | 26,278 |
| REAL ESTATE - 0.3% | | | |
| Equity Real Estate Investment Trusts (REITs) - 0.3% | | | |
| Ant International Co. Ltd. Class C (c)(d) | | 6,818,398 | 38,251 |
| Equinix, Inc. | | 42,800 | 16,863 |
| | | | 55,114 |
| Real Estate Management & Development - 0.0% | | | |
| WeWork Companies, Inc. Class A (a)(c)(d) | | 29,911 | 2,231 |
|
| TOTAL REAL ESTATE | | | 57,345 |
|
| TOTAL COMMON STOCKS | | | |
| (Cost $12,178,791) | | | 17,493,486 |
|
| Preferred Stocks - 2.6% | | | |
| Convertible Preferred Stocks - 2.5% | | | |
| COMMUNICATION SERVICES - 0.0% | | | |
| Interactive Media & Services - 0.0% | | | |
| Pinterest, Inc. Series G, 8.00% (a)(c)(d) | | 139,290 | 638 |
| Wireless Telecommunication Services - 0.0% | | | |
| Altiostar Networks, Inc. Series A1 (a)(c)(d) | | 2,113,909 | 2,706 |
| TOTAL COMMUNICATION SERVICES | | | 3,344 |
| CONSUMER DISCRETIONARY - 0.0% | | | |
| Internet & Direct Marketing Retail - 0.0% | | | |
| One Kings Lane, Inc. Series E (Escrow) (a)(c)(d) | | 648,635 | 259 |
| The Honest Co., Inc. Series D (a)(c)(d) | | 75,268 | 3,444 |
| | | | 3,703 |
| CONSUMER STAPLES - 0.1% | | | |
| Food & Staples Retailing - 0.1% | | | |
| Roofoods Ltd. Series F (a)(c)(d) | | 93,930 | 24,330 |
| FINANCIALS - 0.0% | | | |
| Insurance - 0.0% | | | |
| Clover Health Series D (a)(c)(d) | | 620,983 | 5,823 |
| HEALTH CARE - 0.4% | | | |
| Biotechnology - 0.2% | | | |
| 23andMe, Inc.: | | | |
| Series E (a)(c)(d) | | 1,817,170 | 31,528 |
| Series F (a)(c)(d) | | 683,367 | 11,856 |
| | | | 43,384 |
| Health Care Providers & Services - 0.2% | | | |
| Mulberry Health, Inc. Series A8 (a)(c)(d) | | 4,342,250 | 31,029 |
| TOTAL HEALTH CARE | | | 74,413 |
| INDUSTRIALS - 0.2% | | | |
| Aerospace & Defense - 0.2% | | | |
| Space Exploration Technologies Corp.: | | | |
| Series G (a)(c)(d) | | 62,037 | 11,539 |
| Series H (a)(c)(d) | | 65,670 | 12,215 |
| | | | 23,754 |
| Professional Services - 0.0% | | | |
| YourPeople, Inc. Series C (a)(c)(d) | | 335,546 | 1,299 |
| TOTAL INDUSTRIALS | | | 25,053 |
| INFORMATION TECHNOLOGY - 1.7% | | | |
| Internet Software & Services - 0.2% | | | |
| Reddit, Inc.: | | | |
| Series B (a)(c)(d) | | 1,337,584 | 29,007 |
| Series C (a)(c)(d) | | 300,673 | 6,520 |
| Starry, Inc. Series B (a)(c)(d) | | 1,811,120 | 1,670 |
| | | | 37,197 |
| IT Services - 0.0% | | | |
| AppNexus, Inc.: | | | |
| Series E (Escrow) (a)(c)(d) | | 1,416,796 | 1,367 |
| Series F (Escrow) (a)(c)(d) | | 90,913 | 112 |
| Jet.Com, Inc. Series B1 (Escrow) (a)(c)(d) | | 4,896,249 | 222 |
| | | | 1,701 |
| Software - 1.5% | | | |
| Cloudflare, Inc. Series D, 8.00% (a)(c)(d) | | 395,787 | 4,354 |
| Dataminr, Inc. Series D (a)(c)(d) | | 2,219,446 | 45,144 |
| Delphix Corp. Series D (a)(c)(d) | | 427,177 | 2,777 |
| Jello Labs, Inc. Series C (a)(c)(d) | | 302,678 | 0 |
| Lyft, Inc.: | | | |
| Series H (a)(c)(d) | | 595,228 | 27,934 |
| Series I (c)(d) | | 642,291 | 30,143 |
| Taboola.Com Ltd. Series E (a)(c)(d) | | 1,918,392 | 36,718 |
| Uber Technologies, Inc.: | | | |
| Series D, 8.00% (a)(c)(d) | | 2,234,768 | 108,990 |
| Series E, 8.00% (a)(c)(d) | | 148,620 | 7,248 |
| | | | 263,308 |
| TOTAL INFORMATION TECHNOLOGY | | | 302,206 |
| REAL ESTATE - 0.1% | | | |
| Real Estate Management & Development - 0.1% | | | |
| WeWork Companies, Inc.: | | | |
| Series E (a)(c)(d) | | 269,198 | 20,079 |
| Series F (a)(c)(d) | | 14,513 | 1,083 |
| | | | 21,162 |
|
| TOTAL CONVERTIBLE PREFERRED STOCKS | | | 460,034 |
|
| Nonconvertible Preferred Stocks - 0.1% | | | |
| HEALTH CARE - 0.1% | | | |
| Pharmaceuticals - 0.1% | | | |
| Castle Creek Pharmaceutical Holdings, Inc. Series A4 (c)(d) | | 30,303 | 9,822 |
| TOTAL PREFERRED STOCKS | | | |
| (Cost $330,998) | | | 469,856 |
|
| Money Market Funds - 1.1% | | | |
| Fidelity Cash Central Fund, 2.43% (g) | | 11,154,641 | 11,157 |
| Fidelity Securities Lending Cash Central Fund 2.43% (g)(h) | | 191,505,080 | 191,524 |
| TOTAL MONEY MARKET FUNDS | | | |
| (Cost $202,681) | | | 202,681 |
| TOTAL INVESTMENT IN SECURITIES - 100.8% | | | |
| (Cost $12,712,470) | | | 18,166,023 |
| NET OTHER ASSETS (LIABILITIES) - (0.8)% | | | (137,594) |
| NET ASSETS - 100% | | | $18,028,429 |
Values shown as $0 in the Schedule of Investments may reflect amounts less than $500.
Legend
(a) Non-income producing
(b) Security or a portion of the security is on loan at period end.
(c) Restricted securities - Investment in securities not registered under the Securities Act of 1933 (excluding 144A issues). At the end of the period, the value of restricted securities (excluding 144A issues) amounted to $577,063,000 or 3.2% of net assets.
(d) Level 3 security
(e) Security exempt from registration under Rule 144A of the Securities Act of 1933. These securities may be resold in transactions exempt from registration, normally to qualified institutional buyers. At the end of the period, the value of these securities amounted to $33,491,000 or 0.2% of net assets.
(f) Investment is owned by a wholly-owned subsidiary (Subsidiary) that is treated as a corporation for U.S. tax purposes.
(g) Affiliated fund that is generally available only to investment companies and other accounts managed by Fidelity Investments. The rate quoted is the annualized seven-day yield of the fund at period end. A complete unaudited listing of the fund's holdings as of its most recent quarter end is available upon request. In addition, each Fidelity Central Fund's financial statements are available on the SEC's website or upon request.
(h) Investment made with cash collateral received from securities on loan.
Additional information on each restricted holding is as follows:
| Security | Acquisition Date | Acquisition Cost (000s) |
| 23andMe, Inc. Series E | 6/18/15 | $19,675 |
| 23andMe, Inc. Series F | 8/31/17 | $9,488 |
| Altiostar Networks, Inc. Series A1 | 1/10/17 | $9,724 |
| Ant International Co. Ltd. Class C | 5/16/18 | $38,251 |
| AppNexus, Inc. Series E (Escrow) | 8/1/14 - 9/17/14 | $28,382 |
| AppNexus, Inc. Series F (Escrow) | 8/23/16 | $2,364 |
| Atom Tickets LLC | 8/15/17 | $3,000 |
| Castle Creek Pharmaceutical Holdings, Inc. Series A4 | 9/29/16 | $10,011 |
| Cloudflare, Inc. Series D, 8.00% | 11/5/14 | $2,424 |
| Clover Health Series D | 6/7/17 | $5,823 |
| Dataminr, Inc. Series D | 2/18/15 - 3/6/15 | $28,298 |
| Dataminr, Inc. Series E | 7/28/17 - 5/21/18 | $14,368 |
| Delphix Corp. Series D | 7/10/15 | $3,845 |
| Jello Labs, Inc. Series C | 12/22/16 | $4,899 |
| Jet.Com, Inc. Series B1 (Escrow) | 3/19/18 | $0 |
| Lyft, Inc. Series H | 11/22/17 | $23,658 |
| Lyft, Inc. Series I | 6/27/18 | $30,415 |
| Mulberry Health, Inc. Series A8 | 1/20/16 | $29,331 |
| One Kings Lane, Inc. Series E (Escrow) | 1/29/14 | $429 |
| Pinterest, Inc. Series G, 8.00% | 2/27/15 | $1,000 |
| Reddit, Inc. Series B | 7/26/17 | $18,989 |
| Reddit, Inc. Series C | 7/24/17 | $4,743 |
| Roofoods Ltd. Series F | 9/12/17 | $33,211 |
| Space Exploration Technologies Corp. Class A | 10/16/15 - 9/11/17 | $21,156 |
| Space Exploration Technologies Corp. Class C | 9/11/17 | $957 |
| Space Exploration Technologies Corp. Series G | 1/20/15 | $4,805 |
| Space Exploration Technologies Corp. Series H | 8/4/17 | $8,865 |
| Starry, Inc. Series B | 12/1/16 | $980 |
| Taboola.Com Ltd. Series E | 12/22/14 | $20,000 |
| Tanium, Inc. Class B | 4/21/17 | $1,947 |
| The Honest Co., Inc. Series D | 8/3/15 | $3,444 |
| Turn, Inc. (Escrow) | 4/11/17 | $863 |
| Uber Technologies, Inc. Series D, 8.00% | 6/6/14 | $34,668 |
| Uber Technologies, Inc. Series E, 8.00% | 12/5/14 | $4,952 |
| WeWork Companies, Inc. Class A | 6/23/15 | $984 |
| WeWork Companies, Inc. Series E | 6/23/15 | $8,854 |
| WeWork Companies, Inc. Series F | 12/1/16 | $728 |
| Wheels Up Partners Holdings LLC Series B | 9/18/15 | $5,000 |
| YourPeople, Inc. Series C | 5/1/15 | $5,000 |
Affiliated Central Funds
Information regarding fiscal year to date income earned by the Fund from investments in Fidelity Central Funds is as follows:
| Fund | Income earned |
| | (Amounts in thousands) |
| Fidelity Cash Central Fund | $948 |
| Fidelity Securities Lending Cash Central Fund | 1,842 |
| Total | $2,790 |
Amounts in the income column in the above table include any capital gain distributions from underlying funds, which are presented in the corresponding line-item in the Statement of Operations, if applicable.
Investment Valuation
The following is a summary of the inputs used, as of January 31, 2019, involving the Fund's assets and liabilities carried at fair value. The inputs or methodology used for valuing securities may not be an indication of the risk associated with investing in those securities. For more information on valuation inputs, and their aggregation into the levels used below, please refer to the Investment Valuation section in the accompanying Notes to Financial Statements.
| | Valuation Inputs at Reporting Date: |
| Description | Total | Level 1 | Level 2 | Level 3 |
| (Amounts in thousands) | | | | |
| Investments in Securities: | | | | |
| Equities: | | | | |
| Communication Services | $4,276,202 | $4,190,746 | $81,315 | $4,141 |
| Consumer Discretionary | 3,158,883 | 3,149,761 | 5,419 | 3,703 |
| Consumer Staples | 765,696 | 651,881 | 89,485 | 24,330 |
| Energy | 51,590 | 51,590 | -- | -- |
| Financials | 788,856 | 783,033 | -- | 5,823 |
| Health Care | 1,656,017 | 1,560,497 | 11,285 | 84,235 |
| Industrials | 256,380 | 189,659 | -- | 66,721 |
| Information Technology | 6,904,933 | 6,572,870 | 5,596 | 326,467 |
| Materials | 26,278 | 26,278 | -- | -- |
| Real Estate | 78,507 | 16,863 | -- | 61,644 |
| Money Market Funds | 202,681 | 202,681 | -- | -- |
| Total Investments in Securities: | $18,166,023 | $17,395,859 | $193,100 | $577,064 |
The following is a reconciliation of Investments in Securities and Derivative Instruments for which Level 3 inputs were used in determining value:
| (Amounts in thousands) | |
| Investments in Securities: | |
| Equities - Information Technology | |
| Beginning Balance | $359,526 |
| Net Realized Gain (Loss) on Investment Securities | (11,371) |
| Net Unrealized Gain (Loss) on Investment Securities | 9,684 |
| Cost of Purchases | 14,170 |
| Proceeds of Sales | (45,542) |
| Amortization/Accretion | -- |
| Transfers into Level 3 | -- |
| Transfers out of Level 3 | -- |
| Ending Balance | $326,467 |
| The change in unrealized gain (loss) for the period attributable to Level 3 securities held at January 31, 2019 | $(1,722) |
| Equities - Other Investments in Securities | |
| Beginning Balance | $290,448 |
| Net Realized Gain (Loss) on Investment Securities | -- |
| Net Unrealized Gain (Loss) on Investment Securities | (27,861) |
| Cost of Purchases | 10,011 |
| Proceeds of Sales | (22,001) |
| Amortization/Accretion | -- |
| Transfers into Level 3 | -- |
| Transfers out of Level 3 | -- |
| Ending Balance | $250,597 |
| The change in unrealized gain (loss) for the period attributable to Level 3 securities held at January 31, 2019 | $(20,850) |
The information used in the above reconciliations represents fiscal year to date activity for any Investments in Securities identified as using Level 3 inputs at either the beginning or the end of the current fiscal period. Transfers in or out of Level 3 represent the beginning value of any Security or Instrument where a change in the pricing level occurred from the beginning to the end of the period. The cost of purchases and the proceeds of sales may include securities received or delivered through corporate actions or exchanges. Realized and unrealized gains (losses) disclosed in the reconciliations are included in Net Gain (Loss) on the Fund's Statement of Operations.
See accompanying notes which are an integral part of the financial statements.
Financial Statements
Statement of Assets and Liabilities
| Amounts in thousands (except per-share amounts) | | January 31, 2019 (Unaudited) |
| Assets | | |
Investment in securities, at value (including securities loaned of $187,466) — See accompanying schedule:
Unaffiliated issuers (cost $12,509,789) | $17,963,342 | |
| Fidelity Central Funds (cost $202,681) | 202,681 | |
| Total Investment in Securities (cost $12,712,470) | | $18,166,023 |
| Cash | | 20,151 |
| Receivable for investments sold | | 221,254 |
| Receivable for fund shares sold | | 12,579 |
| Dividends receivable | | 1,099 |
| Distributions receivable from Fidelity Central Funds | | 158 |
| Prepaid expenses | | 24 |
| Other receivables | | 507 |
| Total assets | | 18,421,795 |
| Liabilities | | |
| Payable for investments purchased | $89,960 | |
| Payable for fund shares redeemed | 28,179 | |
| Accrued management fee | 11,214 | |
| Notes payable to affiliates | 69,102 | |
| Other affiliated payables | 1,757 | |
| Other payables and accrued expenses | 1,636 | |
| Collateral on securities loaned | 191,518 | |
| Total liabilities | | 393,366 |
| Net Assets | | $18,028,429 |
| Net Assets consist of: | | |
| Paid in capital | | $11,870,103 |
| Total distributable earnings (loss) | | 6,158,326 |
| Net Assets | | $18,028,429 |
| Net Asset Value and Maximum Offering Price | | |
| OTC: | | |
| Net Asset Value, offering price and redemption price per share ($11,842,443 ÷ 1,084,796 shares) | | $10.92 |
| Class K: | | |
| Net Asset Value, offering price and redemption price per share ($6,185,986 ÷ 558,346 shares) | | $11.08 |
See accompanying notes which are an integral part of the financial statements.
Statement of Operations
| Amounts in thousands | | Six months ended January 31, 2019 (Unaudited) |
| Investment Income | | |
| Dividends | | $65,834 |
| Income from Fidelity Central Funds | | 2,790 |
| Total income | | 68,624 |
| Expenses | | |
| Management fee | | |
| Basic fee | $57,654 | |
| Performance adjustment | 11,910 | |
| Transfer agent fees | 10,742 | |
| Accounting and security lending fees | 877 | |
| Custodian fees and expenses | 225 | |
| Independent trustees' fees and expenses | 64 | |
| Registration fees | 166 | |
| Audit | 46 | |
| Legal | 31 | |
| Interest | 49 | |
| Miscellaneous | 98 | |
| Total expenses before reductions | 81,862 | |
| Expense reductions | (75) | |
| Total expenses after reductions | | 81,787 |
| Net investment income (loss) | | (13,163) |
| Realized and Unrealized Gain (Loss) | | |
| Net realized gain (loss) on: | | |
| Investment securities: | | |
| Unaffiliated issuers | 1,280,425 | |
| Fidelity Central Funds | 1 | |
| Foreign currency transactions | 250 | |
| Total net realized gain (loss) | | 1,280,676 |
| Change in net unrealized appreciation (depreciation) on: | | |
| Investment securities: | | |
| Unaffiliated issuers (net of increase in deferred foreign taxes of $59) | (2,747,231) | |
| Assets and liabilities in foreign currencies | (65) | |
| Total change in net unrealized appreciation (depreciation) | | (2,747,296) |
| Net gain (loss) | | (1,466,620) |
| Net increase (decrease) in net assets resulting from operations | | $(1,479,783) |
See accompanying notes which are an integral part of the financial statements.
Statement of Changes in Net Assets
| Amounts in thousands | Six months ended January 31, 2019 (Unaudited) | Year ended July 31, 2018 |
| Increase (Decrease) in Net Assets | | |
| Operations | | |
| Net investment income (loss) | $(13,163) | $(25,774) |
| Net realized gain (loss) | 1,280,676 | 990,764 |
| Change in net unrealized appreciation (depreciation) | (2,747,296) | 2,950,958 |
| Net increase (decrease) in net assets resulting from operations | (1,479,783) | 3,915,948 |
| Distributions to shareholders | (1,313,764) | – |
| Distributions to shareholders from net realized gain | – | (808,260) |
| Total distributions | (1,313,764) | (808,260) |
| Share transactions - net increase (decrease) | 193,578 | 1,722,903 |
| Total increase (decrease) in net assets | (2,599,969) | 4,830,591 |
| Net Assets | | |
| Beginning of period | 20,628,398 | 15,797,807 |
| End of period | $18,028,429 | $20,628,398 |
| Other Information | | |
| Accumulated net investment loss end of period | | $(19,053) |
See accompanying notes which are an integral part of the financial statements.
Financial Highlights
Fidelity OTC Portfolio
| | Six months ended (Unaudited) January 31, | Years endedJuly 31, | | | | |
| | 2019 | 2018A | 2017A | 2016A | 2015A | 2014A |
| Selected Per–Share Data | | | | | | |
| Net asset value, beginning of period | $12.50 | $10.57 | $8.53 | $8.70 | $8.12 | $7.90 |
| Income from Investment Operations | | | | | | |
| Net investment income (loss)B | (.01) | (.02) | (.02) | (.01) | (.01) | (.01) |
| Net realized and unrealized gain (loss) | (.78) | 2.48 | 2.33 | .29 | 1.62 | 1.28 |
| Total from investment operations | (.79) | 2.46 | 2.31 | .28 | 1.61 | 1.27 |
| Distributions from net investment income | – | – | – | – | – | (.01) |
| Distributions from net realized gain | (.79) | (.53) | (.27) | (.45) | (1.03) | (1.04) |
| Total distributions | (.79) | (.53) | (.27) | (.45) | (1.03) | (1.05) |
| Net asset value, end of period | $10.92 | $12.50 | $10.57 | $8.53 | $8.70 | $8.12 |
| Total ReturnC,D | (6.65)% | 24.34% | 27.97% | 3.68% | 21.34% | 17.96% |
| Ratios to Average Net AssetsE,F | | | | | | |
| Expenses before reductions | .87%G | .88% | .81% | .91% | .83% | .77% |
| Expenses net of fee waivers, if any | .87%G | .88% | .81% | .91% | .83% | .77% |
| Expenses net of all reductions | .87%G | .88% | .81% | .90% | .83% | .76% |
| Net investment income (loss) | (.17)%G | (.17)% | (.16)% | (.07)% | (.13)% | (.08)% |
| Supplemental Data | | | | | | |
| Net assets, end of period (in millions) | $11,842 | $13,340 | $12,136 | $9,845 | $9,710 | $7,870 |
| Portfolio turnover rateH | 37%G,I | 38%I | 71%I | 56%I | 66%I | 106% |
A Per share amounts have been adjusted to reflect the impact of the 10 for 1 share split that occurred on May 11, 2018.
B Calculated based on average shares outstanding during the period.
C Total returns for periods of less than one year are not annualized.
D Total returns would have been lower if certain expenses had not been reduced during the applicable periods shown.
E Fees and expenses of any underlying Fidelity Central Funds are not included in the Fund's expense ratio. The Fund indirectly bears its proportionate share of the expenses of any underlying Fidelity Central Funds.
F Expense ratios reflect operating expenses of the class. Expenses before reductions do not reflect amounts reimbursed by the investment adviser or reductions from brokerage service arrangements or reductions from other expense offset arrangements and do not represent the amount paid by the class during periods when reimbursements or reductions occur. Expenses net of fee waivers reflect expenses after reimbursement by the investment adviser but prior to reductions from brokerage service arrangements or other expense offset arrangements. Expenses net of all reductions represent the net expenses paid by the class.
G Annualized
H Amount does not include the portfolio activity of any underlying Fidelity Central Funds.
I Portfolio turnover rate excludes securities received or delivered in-kind.
See accompanying notes which are an integral part of the financial statements.
Fidelity OTC Portfolio Class K
| | Six months ended (Unaudited) January 31, | Years endedJuly 31, | | | | |
| | 2019 | 2018A | 2017A | 2016A | 2015A | 2014A |
| Selected Per–Share Data | | | | | | |
| Net asset value, beginning of period | $12.67 | $10.70 | $8.62 | $8.79 | $8.20 | $7.96 |
| Income from Investment Operations | | | | | | |
| Net investment income (loss)B | –C | (.01) | (.01) | –C | –C | –C |
| Net realized and unrealized gain (loss) | (.80) | 2.52 | 2.36 | .29 | 1.63 | 1.30 |
| Total from investment operations | (.80) | 2.51 | 2.35 | .29 | 1.63 | 1.30 |
| Distributions from net investment income | – | – | – | – | – | (.01) |
| Distributions from net realized gain | (.79) | (.54) | (.27) | (.46) | (1.04) | (1.05) |
| Total distributions | (.79) | (.54) | (.27) | (.46) | (1.04) | (1.06) |
| Net asset value, end of period | $11.08 | $12.67 | $10.70 | $8.62 | $8.79 | $8.20 |
| Total ReturnD,E | (6.64)% | 24.48% | 28.12% | 3.80% | 21.49% | 18.10% |
| Ratios to Average Net AssetsF,G | | | | | | |
| Expenses before reductions | .77%H | .78% | .70% | .79% | .72% | .65% |
| Expenses net of fee waivers, if any | .77%H | .78% | .70% | .79% | .72% | .65% |
| Expenses net of all reductions | .77%H | .77% | .70% | .79% | .71% | .64% |
| Net investment income (loss) | (.07)%H | (.07)% | (.05)% | .05% | (.02)% | .05% |
| Supplemental Data | | | | | | |
| Net assets, end of period (in millions) | $6,186 | $7,288 | $3,662 | $3,508 | $3,836 | $2,906 |
| Portfolio turnover rateI | 37%H,J | 38%J | 71%J | 56%J | 66%J | 106% |
A Per share amounts have been adjusted to reflect the impact of the 10 for 1 share split that occurred on May 11, 2018.
B Calculated based on average shares outstanding during the period.
C Amount represents less than $.005 per share.
D Total returns for periods of less than one year are not annualized.
E Total returns would have been lower if certain expenses had not been reduced during the applicable periods shown.
F Fees and expenses of any underlying Fidelity Central Funds are not included in the Fund's expense ratio. The Fund indirectly bears its proportionate share of the expenses of any underlying Fidelity Central Funds.
G Expense ratios reflect operating expenses of the class. Expenses before reductions do not reflect amounts reimbursed by the investment adviser or reductions from brokerage service arrangements or reductions from other expense offset arrangements and do not represent the amount paid by the class during periods when reimbursements or reductions occur. Expenses net of fee waivers reflect expenses after reimbursement by the investment adviser but prior to reductions from brokerage service arrangements or other expense offset arrangements. Expenses net of all reductions represent the net expenses paid by the class.
H Annualized
I Amount does not include the portfolio activity of any underlying Fidelity Central Funds.
J Portfolio turnover rate excludes securities received or delivered in-kind.
See accompanying notes which are an integral part of the financial statements.
Notes to Financial Statements (Unaudited)
For the period ended January 31, 2019
(Amounts in thousands except percentages)
1. Organization.
Fidelity OTC Portfolio (the Fund) is a non-diversified fund of Fidelity Securities Fund (the Trust) and is authorized to issue an unlimited number of shares. The Trust is registered under the Investment Company Act of 1940, as amended (the 1940 Act), as an open-end management investment company organized as a Massachusetts business trust. The Fund offers OTC and Class K shares, each of which has equal rights as to assets and voting privileges. Each class has exclusive voting rights with respect to matters that affect that class.
2. Investments in Fidelity Central Funds.
The Fund invests in Fidelity Central Funds, which are open-end investment companies generally available only to other investment companies and accounts managed by the investment adviser and its affiliates. The Fund's Schedule of Investments lists each of the Fidelity Central Funds held as of period end, if any, as an investment of the Fund, but does not include the underlying holdings of each Fidelity Central Fund. As an Investing Fund, the Fund indirectly bears its proportionate share of the expenses of the underlying Fidelity Central Funds.
The Money Market Central Funds seek preservation of capital and current income and are managed by Fidelity Investments Money Management, Inc. (FIMM), an affiliate of the investment adviser. Annualized expenses of the Money Market Central Funds as of their most recent shareholder report date are less than .005%.
A complete unaudited list of holdings for each Fidelity Central Fund is available upon request or at the Securities and Exchange Commission (the SEC) website at www.sec.gov. In addition, the financial statements of the Fidelity Central Funds are available on the SEC website or upon request.
3. Significant Accounting Policies.
The Fund is an investment company and applies the accounting and reporting guidance of the Financial Accounting Standards Board (FASB) Accounting Standards Codification Topic 946 Financial Services – Investments Companies. The financial statements have been prepared in conformity with accounting principles generally accepted in the United States of America (GAAP), which require management to make certain estimates and assumptions at the date of the financial statements. Actual results could differ from those estimates. Subsequent events, if any, through the date that the financial statements were issued have been evaluated in the preparation of the financial statements. The following summarizes the significant accounting policies of the Fund:
Investment Valuation. Investments are valued as of 4:00 p.m. Eastern time on the last calendar day of the period. The Board of Trustees (the Board) has delegated the day to day responsibility for the valuation of the Fund's investments to the Fair Value Committee (the Committee) established by the Fund's investment adviser. In accordance with valuation policies and procedures approved by the Board, the Fund attempts to obtain prices from one or more third party pricing vendors or brokers to value its investments. When current market prices, quotations or currency exchange rates are not readily available or reliable, investments will be fair valued in good faith by the Committee, in accordance with procedures adopted by the Board. Factors used in determining fair value vary by investment type and may include market or investment specific events. The frequency with which these procedures are used cannot be predicted and they may be utilized to a significant extent. The Committee oversees the Fund's valuation policies and procedures and reports to the Board on the Committee's activities and fair value determinations. The Board monitors the appropriateness of the procedures used in valuing the Fund's investments and ratifies the fair value determinations of the Committee.
The Fund categorizes the inputs to valuation techniques used to value its investments into a disclosure hierarchy consisting of three levels as shown below:
- Level 1 – quoted prices in active markets for identical investments
- Level 2 – other significant observable inputs (including quoted prices for similar investments, interest rates, prepayment speeds, etc.)
- Level 3 – unobservable inputs (including the Fund's own assumptions based on the best information available)
Valuation techniques used to value the Fund's investments by major category are as follows:
Equity securities, including restricted securities, for which market quotations are readily available, are valued at the last reported sale price or official closing price as reported by a third party pricing vendor on the primary market or exchange on which they are traded and are categorized as Level 1 in the hierarchy. In the event there were no sales during the day or closing prices are not available, securities are valued at the last quoted bid price or may be valued using the last available price and are generally categorized as Level 2 in the hierarchy. For foreign equity securities, when market or security specific events arise, comparisons to the valuation of American Depositary Receipts (ADRs), futures contracts, Exchange-Traded Funds (ETFs) and certain indexes as well as quoted prices for similar securities may be used and would be categorized as Level 2 in the hierarchy. For equity securities, including restricted securities, where observable inputs are limited, assumptions about market activity and risk are used and these securities may be categorized as Level 3 in the hierarchy. Equity securities, including restricted securities, for which observable inputs are not available are valued using alternate valuation approaches, including the market approach and the income approach and are categorized as Level 3 in the hierarchy. The market approach generally consists of using comparable market transactions while the income approach generally consists of using the net present value of estimated future cash flows, adjusted as appropriate for liquidity, credit, market and/or other risk factors.
Investments in open-end mutual funds, including the Fidelity Central Funds, are valued at their closing net asset value (NAV) each business day and are categorized as Level 1 in the hierarchy.
The following provides information on Level 3 securities held by the Fund that were valued at period end based on unobservable inputs. These amounts exclude valuations provided by a broker.
| Asset Type | Fair Value | Valuation Technique (s) | Unobservable Input | Amount or Range / Weighted Average | Impact to Valuation from an Increase in Input(a) |
| Equities | $ 577,064 | Market approach | Transaction price | $0.81 - $186.00 / $56.38 | Increase |
| | | | Conversion ratio | 1.6 | Increase |
| | | Recovery value | Recovery value | 0.0% - 1.2% / 0.8% | Increase |
| | | Market comparable | Transaction price | $411.85 | Increase |
| | | | Enterprise value/Sales multiple (EV/S) | 1.2 - 10.2 / 5.2 | Increase |
| | | | Discount rate | 30.0% - 78.0% / 52.4% | Decrease |
| | | | Discount for lack of marketability | 10.0% - 25.0% / 13.3% | Decrease |
| | | | Conversion ratio | 3.0 | Increase |
| | | | Proxy discount | 21.3% | Decrease |
| | | | Premium rate | 6.0% - 34.0% / 13.4% | Increase |
| | | | Liquidity preference | $14.90 - $45.76 / $37.31 | Increase |
(a) Represents the directional change in the fair value of the Level 3 investments that could have resulted from an increase in the corresponding input as of period end. A decrease to the unobservable input would have had the opposite effect. Significant changes in these inputs may have resulted in a significantly higher or lower fair value measurement at period end.
Changes in valuation techniques may result in transfers in or out of an assigned level within the disclosure hierarchy. The aggregate value of investments by input level as of January 31, 2019, as well as a roll forward of Level 3 investments, is included at the end of the Fund's Schedule of Investments.
Foreign Currency. The Fund may use foreign currency contracts to facilitate transactions in foreign-denominated securities. Gains and losses from these transactions may arise from changes in the value of the foreign currency or if the counterparties do not perform under the contracts' terms.
Foreign-denominated assets, including investment securities, and liabilities are translated into U.S. dollars at the exchange rates at period end. Purchases and sales of investment securities, income and dividends received and expenses denominated in foreign currencies are translated into U.S. dollars at the exchange rate in effect on the transaction date.
The effects of exchange rate fluctuations on investments are included with the net realized and unrealized gain (loss) on investment securities. Other foreign currency transactions resulting in realized and unrealized gain (loss) are disclosed separately.
Investment Transactions and Income. For financial reporting purposes, the Fund's investment holdings and NAV include trades executed through the end of the last business day of the period. The NAV per share for processing shareholder transactions is calculated as of the close of business of the New York Stock Exchange (NYSE), normally 4:00 p.m. Eastern time and includes trades executed through the end of the prior business day. Gains and losses on securities sold are determined on the basis of identified cost and include proceeds received from litigation. Dividend income is recorded on the ex-dividend date, except for certain dividends from foreign securities where the ex-dividend date may have passed, which are recorded as soon as the Fund is informed of the ex-dividend date. Non-cash dividends included in dividend income, if any, are recorded at the fair market value of the securities received. Income and capital gain distributions from Fidelity Central Funds, if any, are recorded on the ex-dividend date. Certain distributions received by the Fund represent a return of capital or capital gain. The Fund determines the components of these distributions subsequent to the ex-dividend date, based upon receipt of tax filings or other correspondence relating to the underlying investment. These distributions are recorded as a reduction of cost of investments and/or as a realized gain. Investment income is recorded net of foreign taxes withheld where recovery of such taxes is uncertain.
Class Allocations and Expenses. Investment income, realized and unrealized capital gains and losses, common expenses of the Fund, and certain fund-level expense reductions, if any, are allocated daily on a pro-rata basis to each class based on the relative net assets of each class to the total net assets of the Fund. Each class differs with respect to transfer agent fees incurred. Certain expense reductions may also differ by class. For the reporting period, the allocated portion of income and expenses to each class as a percent of its average net assets may vary due to the timing of recording these transactions in relation to fluctuating net assets of the classes. Expenses directly attributable to a fund are charged to that fund. Expenses attributable to more than one fund are allocated among the respective funds on the basis of relative net assets or other appropriate methods. Expense estimates are accrued in the period to which they relate and adjustments are made when actual amounts are known.
Deferred Trustee Compensation. Under a Deferred Compensation Plan (the Plan) for the Fund, certain independent Trustees have elected to defer receipt of a portion of their annual compensation. Deferred amounts are invested in a cross-section of Fidelity funds, are marked-to-market and remain in the Fund until distributed in accordance with the Plan. The investment of deferred amounts and the offsetting payable to the Trustees of $422 are included in the accompanying Statement of Assets and Liabilities in other receivables and other payables and accrued expenses, respectively.
Income Tax Information and Distributions to Shareholders. Each year, the Fund intends to qualify as a regulated investment company under Subchapter M of the Internal Revenue Code, including distributing substantially all of its taxable income and realized gains. As a result, no provision for U.S. Federal income taxes is required. The Fund files a U.S. federal tax return, in addition to state and local tax returns as required. The Fund's federal income tax returns are subject to examination by the Internal Revenue Service (IRS) for a period of three fiscal years after they are filed. State and local tax returns may be subject to examination for an additional fiscal year depending on the jurisdiction. Foreign taxes are provided for based on the Fund's understanding of the tax rules and rates that exist in the foreign markets in which it invests. The Fund is subject to a tax imposed on capital gains by certain countries in which it invests. An estimated deferred tax liability for net unrealized appreciation on the applicable securities is included in Other payables and accrued expenses on the Statement of Assets & Liabilities.
Distributions are declared and recorded on the ex-dividend date. Income and capital gain distributions are declared separately for each class. Income and capital gain distributions are determined in accordance with income tax regulations, which may differ from GAAP.
Capital accounts within the financial statements are adjusted for permanent book-tax differences. These adjustments have no impact on net assets or the results of operations. Capital accounts are not adjusted for temporary book-tax differences which will reverse in a subsequent period.
Book-tax differences are primarily due to foreign currency transactions, certain foreign taxes, passive foreign investment companies (PFIC), redemptions in kind, partnerships, deferred trustees compensation, net operating losses and losses deferred due to wash sales, and excise tax regulations.
As of period end, the cost and unrealized appreciation (depreciation) in securities, and derivatives if applicable, for federal income tax purposes were as follows:
| Gross unrealized appreciation | $6,072,052 |
| Gross unrealized depreciation | (654,330) |
| Net unrealized appreciation (depreciation) | $5,417,722 |
| Tax cost | $12,748,301 |
The Fund elected to defer to its next fiscal year $18,461 of ordinary losses recognized during the period January 1, 2018 to July 31, 2018.
Restricted Securities. The Fund may invest in securities that are subject to legal or contractual restrictions on resale. These securities generally may be resold in transactions exempt from registration or to the public if the securities are registered. Disposal of these securities may involve time-consuming negotiations and expense, and prompt sale at an acceptable price may be difficult. Information regarding restricted securities is included at the end of the Fund's Schedule of Investments.
Consolidated Subsidiary. The Fund invests in certain investments through a wholly-owned subsidiary ("Subsidiary"), which may be subject to federal and state taxes upon disposition.
As of period end, the Fund held an investment of $4,028 in these Subsidiaries, representing .02% of the Fund's net assets. The financial statements have been consolidated and include accounts of the Fund and each Subsidiary. Accordingly, all inter-company transactions and balances have been eliminated.
New Rule Issuance. During August 2018, the U.S. Securities and Exchange Commission issued Final Rule Release No. 33-10532, Disclosure Update and Simplification. This Final Rule includes amendments specific to registered investment companies that are intended to eliminate overlap in disclosure requirements between Regulation S-X and GAAP. In accordance with these amendments, certain line-items in the Fund's financial statements have been combined or removed for the current period as outlined in the table below.
| Financial Statement | Current Line-Item Presentation (As Applicable) | Prior Line-Item Presentation (As Applicable) |
| Statement of Assets and Liabilities | Total distributable earnings (loss) | Undistributed/Distributions in excess of/Accumulated net investment income (loss)
Accumulated/Undistributed net realized gain (loss)
Net unrealized appreciation (depreciation) |
| Statement of Changes in Net Assets | N/A - removed | Undistributed/Distributions in excess of/Accumulated net investment income (loss) end of period |
| Statement of Changes in Net Assets | Distributions to shareholders | Distributions to shareholders from net investment income
Distributions to shareholders from net realized gain |
| Distributions to Shareholders Note to Financial Statements | Distributions to shareholders | Distributions to shareholders from net investment income
Distributions to shareholders from net realized gain |
4. Purchases and Sales of Investments.
Purchases and sales of securities, other than short-term securities and in-kind transactions, aggregated $3,685,859 and $4,444,095, respectively.
Unaffiliated Redemptions In-Kind. During the period, 41,188 shares of the Fund were redeemed in-kind for investments and cash with a value of $420,938. The net realized gain of $216,334 on investments delivered through in-kind redemptions is included in the accompanying Statement of Operations. The amount of the in-kind redemptions is included in share transactions in the accompanying Statement of Changes in Net Assets as well as the Notes to Financial Statements. The Fund recognized no gain or loss for federal income tax purposes.
Prior Fiscal Year Redemptions In-Kind.
During the prior period, 6,067* shares of the Fund held by unaffiliated entities were redeemed in-kind for investments and cash with a value of $65,932. The Fund had a net realized gain of $35,542 on investments delivered through the in-kind redemptions. The amount of the in-kind redemptions is included in share transactions in the accompanying Statement of Changes in Net Assets as well as the Notes to Financial Statements. The Fund recognized no gain or loss for federal income tax purposes.
* Share activity prior to May 11, 2018 has been adjusted to reflect the impact of the 10 for 1 share split that occurred on that date.
5. Fees and Other Transactions with Affiliates.
Management Fee. Fidelity Management & Research Company (the investment adviser) and its affiliates provide the Fund with investment management related services for which the Fund pays a monthly management fee. The management fee is the sum of an individual fund fee rate that is based on an annual rate of .35% of the Fund's average net assets and an annualized group fee rate that averaged .24% during the period. The group fee rate is based upon the average net assets of all the mutual funds advised by the investment adviser, including any mutual funds previously advised by the investment adviser that are currently advised by Fidelity SelectCo, LLC, an affiliate of the investment adviser. The group fee rate decreases as assets under management increase and increases as assets under management decrease. In addition, the management fee is subject to a performance adjustment (up to a maximum of +/- .20% of the Fund's average net assets over a 36 month performance period). The upward or downward adjustment to the management fee is based on the relative investment performance of OTC as compared to its benchmark index, the Nasdaq Composite Index, over the same 36 month performance period. For the reporting period, the total annualized management fee rate, including the performance adjustment, was .71% of the Fund's average net assets. The performance adjustment included in the management fee rate may be higher or lower than the maximum performance adjustment rate due to the difference between the average net assets for the reporting and performance periods.
Transfer Agent Fees. Fidelity Investments Institutional Operations Company, Inc., (FIIOC), an affiliate of the investment adviser, is the transfer, dividend disbursing and shareholder servicing agent for each class of the Fund. FIIOC receives account fees and asset-based fees that vary according to the account size and type of account of the shareholders of OTC, except for Class K. FIIOC receives an asset-based fee of Class K's average net assets. FIIOC pays for typesetting, printing and mailing of shareholder reports, except proxy statements.
For the period, transfer agent fees for each class were as follows:
| | Amount | % of Class-Level Average Net Assets(a) |
| OTC | $9,160 | .14 |
| Class K | 1,582 | .05 |
| | $10,742 | |
(a) Annualized
Accounting and Security Lending Fees. Fidelity Service Company, Inc. (FSC), an affiliate of the investment adviser, maintains the Fund's accounting records. The accounting fee is based on the level of average net assets for each month. Under a separate contract, FSC administers the security lending program. The security lending fee is based on the number and duration of lending transactions. For the period, the fees were equivalent to an annualized rate of .01%.
Brokerage Commissions. The Fund placed a portion of its portfolio transactions with brokerage firms which are affiliates of the investment adviser. Brokerage commissions are included in net realized gain (loss) and change in net unrealized appreciation (depreciation) in the Statement of Operations. The commissions paid to these affiliated firms were $91 for the period.
Interfund Lending Program. Pursuant to an Exemptive Order issued by the SEC, the Fund, along with other registered investment companies having management contracts with Fidelity Management & Research Company (FMR) or other affiliated entities of FMR, may participate in an interfund lending program. This program provides an alternative credit facility allowing the funds to borrow from, or lend money to, other participating affiliated funds. Any open loans, including accrued interest, at period end are presented under the caption "Notes payable to affiliates" in the Fund's Statement of Assets and Liabilities. The Fund's activity in this program during the period for which loans were outstanding was as follows:
| Borrower or Lender | Average Loan Balance | Weighted Average Interest Rate | Interest Expense |
| Borrower | $66,900 | 2.64% | $49 |
Interfund Trades. The Fund may purchase from or sell securities to other Fidelity Funds under procedures adopted by the Board. The procedures have been designed to ensure these interfund trades are executed in accordance with Rule 17a-7 of the 1940 Act. Interfund trades are included within the respective purchases and sales amounts shown in the Purchases and Sales of Investments note.
6. Committed Line of Credit.
The Fund participates with other funds managed by the investment adviser or an affiliate in a $4.25 billion credit facility (the "line of credit") to be utilized for temporary or emergency purposes to fund shareholder redemptions or for other short-term liquidity purposes. The Fund has agreed to pay commitment fees on its pro-rata portion of the line of credit, which amounted to $27 and is reflected in Miscellaneous expenses on the Statement of Operations. During the period, the Fund did not borrow on this line of credit.
7. Security Lending.
The Fund lends portfolio securities through a lending agent from time to time in order to earn additional income. For equity securities, a lending agent is used and may loan securities to certain qualified borrowers, including Fidelity Capital Markets (FCM), a broker-dealer affiliated with the Fund. On the settlement date of the loan, the Fund receives collateral (in the form of U.S. Treasury obligations, letters of credit and/or cash) against the loaned securities and maintains collateral in an amount not less than 100% of the market value of the loaned securities during the period of the loan. The market value of the loaned securities is determined at the close of business of the Fund and any additional required collateral is delivered to the Fund on the next business day. The Fund or borrower may terminate the loan at any time, and if the borrower defaults on its obligation to return the securities loaned because of insolvency or other reasons, the Fund may apply collateral received from the borrower against the obligation. The Fund may experience delays and costs in recovering the securities loaned. Any cash collateral received is invested in the Fidelity Securities Lending Cash Central Fund. The value of loaned securities and cash collateral at period end are disclosed on the Fund's Statement of Assets and Liabilities. The value of securities loaned to FCM at period end was $4,942. Security lending income represents the income earned on investing cash collateral, less rebates paid to borrowers and any lending agent fees associated with the loan, plus any premium payments received for lending certain types of securities. Security lending income is presented in the Statement of Operations as a component of income from Fidelity Central Funds. Total security lending income during the period amounted to $1,842, including $63 from securities loaned to FCM.
8. Expense Reductions.
Through arrangements with the Fund's custodian, credits realized as a result of certain uninvested cash balances were used to reduce the Fund's expenses. During the period, these credits reduced the Fund's custody expenses by $4.
During the period, credits reduced each class' transfer agent expense as noted in the table below.
| | Transfer Agent expense reduction |
| OTC | $1 |
In addition, during the period the investment adviser reimbursed and/or waived a portion of fund-level operating expenses in the amount of $70.
9. Distributions to Shareholders.
Distributions to shareholders of each class were as follows:
| | Six months ended
January 31, 2019 | Year ended
July 31, 2018 |
| Distributions to shareholders | | |
| OTC | $854,604 | $– |
| Class K | 459,160 | – |
| Total | $1,313,764 | $– |
| From net realized gain | | |
| OTC | $– | $625,108 |
| Class K | – | 183,152 |
| Total | $– | $808,260 |
10. Share Transactions.
Share transactions for each class were as follows and may contain automatic conversions between classes or exchanges between affiliated funds:
| | Shares | Shares | Dollars | Dollars |
| | Six months ended January 31, 2019 | Year ended July 31, 2018(a) | Six months ended January 31, 2019 | Year ended July 31, 2018 |
| OTC | | | | |
| Shares sold | 100,979 | 331,678 | $1,196,560 | $3,791,174 |
| Reinvestment of distributions | 69,503 | 57,393 | 812,956 | 601,211 |
| Shares redeemed | (152,918) | (470,239) | (1,704,995) | (5,259,220) |
| Net increase (decrease) | 17,564 | (81,168) | $304,521 | $(866,835) |
| Class K | | | | |
| Shares sold | 40,250 | 342,672 | $476,698 | $3,868,013 |
| Reinvestment of distributions | 38,747 | 17,273 | 459,160 | 183,152 |
| Shares redeemed | (95,955)(b) | (126,942)(c) | (1,046,801)(b) | (1,461,427)(c) |
| Net increase (decrease) | (16,958) | 233,003 | $(110,943) | $2,589,738 |
(a) Share activity prior to May 11, 2018 has been adjusted to reflect the impact of the 10 for 1 share split that occurred on that date.
(b) Amount includes in-kind redemptions (see the Redemption In-Kind note for additional details).
(c) Amount includes in-kind redemptions (see the Prior Fiscal Year Redemption In-Kind note for additional details).
11. Other.
The Fund's organizational documents provide former and current trustees and officers with a limited indemnification against liabilities arising in connection with the performance of their duties to the Fund. In the normal course of business, the Fund may also enter into contracts that provide general indemnifications. The Fund's maximum exposure under these arrangements is unknown as this would be dependent on future claims that may be made against the Fund. The risk of material loss from such claims is considered remote.
Shareholder Expense Example
As a shareholder of the Fund, you incur two types of costs: (1) transaction costs, and (2) ongoing costs, including management fees and other Fund expenses. This Example is intended to help you understand your ongoing costs (in dollars) of investing in the Fund and to compare these costs with the ongoing costs of investing in other mutual funds.
The Example is based on an investment of $1,000 invested at the beginning of the period and held for the entire period (August 1, 2018 to January 31, 2019).
Actual Expenses
The first line of the accompanying table for each class of the Fund provides information about actual account values and actual expenses. You may use the information in this line, together with the amount you invested, to estimate the expenses that you paid over the period. Simply divide your account value by $1,000.00 (for example, an $8,600 account value divided by $1,000.00 = 8.6), then multiply the result by the number in the first line for a class of the Fund under the heading entitled "Expenses Paid During Period" to estimate the expenses you paid on your account during this period. In addition, the Fund, as a shareholder in the underlying Fidelity Central Funds, will indirectly bear its pro-rata share of the fees and expenses incurred by the underlying Fidelity Central Funds. These fees and expenses are not included in the Fund's annualized expense ratio used to calculate the expense estimate in the table below.
Hypothetical Example for Comparison Purposes
The second line of the accompanying table for each class of the Fund provides information about hypothetical account values and hypothetical expenses based on a Class' actual expense ratio and an assumed rate of return of 5% per year before expenses, which is not the Class' actual return. The hypothetical account values and expenses may not be used to estimate the actual ending account balance or expenses you paid for the period. You may use this information to compare the ongoing costs of investing in the Fund and other funds. To do so, compare this 5% hypothetical example with the 5% hypothetical examples that appear in the shareholder reports of the other funds. In addition, the Fund, as a shareholder in the underlying Fidelity Central Funds, will indirectly bear its pro-rata share of the fees and expenses incurred by the underlying Fidelity Central Funds. These fees and expenses are not included in the Fund's annualized expense ratio used to calculate the expense estimate in the table below.
Please note that the expenses shown in the table are meant to highlight your ongoing costs only and do not reflect any transaction costs. Therefore, the second line of the table is useful in comparing ongoing costs only, and will not help you determine the relative total costs of owning different funds.
| | Annualized Expense Ratio-A | Beginning
Account Value
August 1, 2018 | Ending
Account Value
January 31, 2019 | Expenses Paid
During Period-B
August 1, 2018
to January 31, 2019 |
| OTC | .87% | | | |
| Actual | | $1,000.00 | $933.50 | $4.24 |
| Hypothetical-C | | $1,000.00 | $1,020.82 | $4.43 |
| Class K | .77% | | | |
| Actual | | $1,000.00 | $933.60 | $3.75 |
| Hypothetical-C | | $1,000.00 | $1,021.32 | $3.92 |
A Annualized expense ratio reflects expenses net of applicable fee waivers.
B Expenses are equal to each Class' annualized expense ratio, multiplied by the average account value over the period, multiplied by 184/365 (to reflect the one-half year period).
C 5% return per year before expenses
Board Approval of Investment Advisory Contracts and Management Fees
Fidelity OTC Portfolio
Each year, the Board of Trustees, including the Independent Trustees (together, the Board), votes on the renewal of the management contract with Fidelity Management & Research Company (FMR) and the sub-advisory agreements (together, the Advisory Contracts) for the fund. FMR and the sub-advisers are referred to herein as the Investment Advisers. The Board, assisted by the advice of fund counsel and Independent Trustees' counsel, requests and considers a broad range of information relevant to the renewal of the Advisory Contracts throughout the year.
The Board meets regularly and, at each of its meetings, covers an extensive agenda of topics and materials and considers factors that are relevant to its annual consideration of the renewal of the fund's Advisory Contracts, including the services and support provided to the fund and its shareholders. The Board has established various standing committees (Committees), each composed of and chaired by Independent Trustees with varying backgrounds, to which the Board has assigned specific subject matter responsibilities in order to enhance effective decision-making by the Board. The Board, acting directly and through its Committees, requests and receives information concerning the annual consideration of the renewal of the fund's Advisory Contracts. The Board also meets as needed to review matters specifically related to the Board's annual consideration of the renewal of the Advisory Contracts. Members of the Board may also meet with trustees of other Fidelity funds through joint ad hoc committees to discuss certain matters relevant to all of the Fidelity funds.
At its January 2019 meeting, the Board unanimously determined to renew the fund's Advisory Contracts. In reaching its determination, the Board considered all factors it believed relevant, including (i) the nature, extent, and quality of the services to be provided to the fund and its shareholders (including the investment performance of the fund); (ii) the competitiveness of the fund's management fee and total expense ratio relative to peer funds; (iii) the total costs of the services to be provided by and the profits to be realized by Fidelity from its relationships with the fund; and (iv) the extent to which, if any, economies of scale exist and would be realized as the fund grows, and whether any economies of scale are appropriately shared with fund shareholders.
In considering whether to renew the Advisory Contracts for the fund, the Board reached a determination, with the assistance of fund counsel and Independent Trustees' counsel and through the exercise of its business judgment, that the renewal of the Advisory Contracts was in the best interests of the fund and its shareholders and that the compensation payable under the Advisory Contracts was fair and reasonable. The Board's decision to renew the Advisory Contracts was not based on any single factor, but rather was based on a comprehensive consideration of all the information provided to the Board at its meetings throughout the year. The Board, in reaching its determination to renew the Advisory Contracts, was aware that shareholders of the fund have a broad range of investment choices available to them, including a wide choice among funds offered by Fidelity's competitors, and that the fund's shareholders, who have the opportunity to review and weigh the disclosure provided by the fund in its prospectus and other public disclosures, have chosen to invest in this fund, which is part of the Fidelity family of funds.
Nature, Extent, and Quality of Services Provided. The Board considered Fidelity's staffing as it relates to the fund, including the backgrounds of investment personnel of Fidelity, and also considered the fund's investment objective, strategies, and related investment philosophy. The Independent Trustees also had discussions with senior management of Fidelity's investment operations and investment groups. The Board considered the structure of the investment personnel compensation program and whether this structure provides appropriate incentives to act in the best interests of the fund. Additionally, the Board considered the portfolio managers' investments, if any, in the funds that they manage.
Resources Dedicated to Investment Management and Support Services. The Board and the Fund Oversight and Research Committees reviewed the general qualifications and capabilities of Fidelity's investment staff, including its size, education, experience, and resources, as well as Fidelity's approach to recruiting, training, managing, and compensating investment personnel. The Board noted that Fidelity has continued to increase the resources devoted to non-U.S. offices, including expansion of Fidelity's global investment organization. The Board also noted that Fidelity's analysts have extensive resources, tools and capabilities that allow them to conduct sophisticated quantitative and fundamental analysis, as well as credit analysis of issuers, counterparties and guarantors. Further, the Board considered that Fidelity's investment professionals have sufficient access to global information and data so as to provide competitive investment results over time, and that those professionals also have access to sophisticated tools that permit them to assess portfolio construction and risk and performance attribution characteristics continuously, as well as to transmit new information and research conclusions rapidly around the world. Additionally, in its deliberations, the Board considered Fidelity's trading, risk management, compliance, and technology and operations capabilities and resources, which are integral parts of the investment management process.
Shareholder and Administrative Services. The Board considered (i) the nature, extent, quality, and cost of advisory, administrative, and shareholder services performed by the Investment Advisers and their affiliates under the Advisory Contracts and under separate agreements covering transfer agency, pricing and bookkeeping, and securities lending services for the fund; (ii) the nature and extent of the supervision of third party service providers, principally custodians, subcustodians, and pricing vendors; and (iii) the resources devoted to, and the record of compliance with, the fund's compliance policies and procedures. The Board also reviewed the allocation of fund brokerage, including allocations to brokers affiliated with the Investment Advisers, the use of brokerage commissions to pay fund expenses, and the use of "soft" commission dollars to pay for research services.
The Board noted that the growth of fund assets over time across the complex allows Fidelity to reinvest in the development of services designed to enhance the value and convenience of the Fidelity funds as investment vehicles. These services include 24-hour access to account information and market information through telephone representatives and over the Internet, investor education materials and asset allocation tools, and the expanded availability of Fidelity Investor Centers.
The Board noted that it and the boards of certain other Fidelity funds had formed an ad hoc Committee on Transfer Agency Fees to review the variety of transfer agency fee structures throughout the industry and Fidelity's competitive positioning with respect to industry participants.
Investment in a Large Fund Family. The Board considered the benefits to shareholders of investing in a Fidelity fund, including the benefits of investing in a fund that is part of a large family of funds offering a variety of investment disciplines and providing a large variety of mutual fund investor services. The Board noted that Fidelity had taken, or had made recommendations that resulted in the Fidelity funds taking, a number of actions over the previous year that benefited particular funds, including: (i) continuing to dedicate additional resources to Fidelity's investment research process, which includes meetings with management of issuers of securities in which the funds invest, and to the support of the senior management team that oversees asset management; (ii) continuing efforts to enhance Fidelity's global research capabilities; (iii) launching new funds and making other enhancements to meet client needs; (iv) launching new share classes of existing funds; (v) eliminating purchase minimums and broadening eligibility requirements for certain funds and share classes; (vi) reducing management fees and total expenses for certain growth equity funds and index funds; (vii) lowering expense caps for certain existing funds and classes, and converting certain voluntary expense caps to contractual caps, to reduce expenses borne by shareholders; (viii) eliminating short-term redemption fees for funds that had such fees; (ix) rationalizing product lines and gaining increased efficiencies from fund mergers and share class consolidations; (x) continuing to develop, acquire and implement systems and technology to improve services to the funds and shareholders, strengthen information security, and increase efficiency; and (xi) continuing to implement enhancements to further strengthen Fidelity's product line to increase investors' probability of success in achieving their investment goals, including retirement income goals.
Investment Performance. The Board considered whether the fund has operated in accordance with its investment objective, as well as its record of compliance with its investment restrictions and its performance history. The fund had a portfolio manager changes in September 2017. The Board will continue to monitor closely the fund's performance, taking into account the portfolio manager change.
The Board took into account discussions that occur at Board meetings throughout the year with representatives of the Investment Advisers about fund investment performance. In this regard the Board noted that as part of regularly scheduled fund reviews and other reports to the Board on fund performance, the Board considers annualized return information for the fund for different time periods, measured against an appropriate securities market index ("benchmark index") and a peer group of funds with similar objectives ("peer group"), if any. In its evaluation of fund investment performance, the Board gave particular attention to information indicating changes in performance of certain Fidelity funds for specific time periods and discussed with the Investment Advisers the reasons for any overperformance or underperformance.
In addition to reviewing absolute and relative fund performance, the Independent Trustees periodically consider the appropriateness of fund performance metrics in evaluating the results achieved. In general, the Independent Trustees believe that fund performance should be evaluated based on net performance (after fees and expenses) of both the highest performing and lowest performing fund share classes, where applicable, compared to appropriate benchmark indices, over appropriate time periods that may include full market cycles, and compared to peer groups, as applicable, over the same periods, taking into account relevant factors including the following: general market conditions; issuer-specific information; and fund cash flows and other factors.
The Independent Trustees recognize that shareholders evaluate performance on a net basis over their own holding periods, for which one-, three-, and five-year periods are often used as a proxy. For this reason, the performance information reviewed by the Board also included net cumulative total return information for the fund and an appropriate benchmark index and peer group for the most recent one-, three-, and five-year periods ended June 30, 2018, as shown below. Returns are shown compared to the 25th percentile (top of box, 75% beaten) and 75th percentile (bottom of box, 25% beaten) of the peer universe.
Fidelity OTC Portfolio

The Board also considered that the fund's management fee is subject to upward or downward adjustment depending upon whether, and to what extent, the fund's investment performance for the performance period (a rolling 36-month period) exceeds, or is exceeded by, a securities index, thus leading to a performance adjustment for the same period. The Board noted that the performance adjustment provides FMR with a strong economic incentive to seek to achieve superior long-term performance for the fund's shareholders and helps to more closely align the interests of FMR and the shareholders of the fund.
Based on its review, the Board concluded that the nature, extent, and quality of services provided to the fund under the Advisory Contracts should continue to benefit the shareholders of the fund.
Competitiveness of Management Fee and Total Expense Ratio. The Board considered the fund's management fee and total expense ratio compared to "mapped groups" of competitive funds and classes created for the purpose of facilitating the Trustees' competitive analysis of management fees and total expenses. Fidelity creates "mapped groups" by combining similar Lipper investment objective categories that have comparable investment mandates. Combining Lipper investment objective categories aids the Board's management fee and total expense ratio comparisons by broadening the competitive group used for comparison.
Management Fee. The Board considered two proprietary management fee comparisons for the 12-month periods (ended June 30 for 2018 and December 31 for prior periods) shown in basis points (BP) in the chart below. The group of Lipper funds used by the Board for management fee comparisons is referred to below as the "Total Mapped Group." The Total Mapped Group comparison focuses on a fund's standing in terms of gross management fees before expense reimbursements or caps, and without giving effect to the fund's performance adjustment, relative to the total universe of funds with comparable investment mandates, regardless of whether their management fee structures also are comparable. Funds with comparable investment mandates offer exposure to similar types of securities. Funds with comparable management fee structures have similar management fee contractual arrangements (
e.g., flat rate charged for advisory services, all-inclusive fee rate,
etc.). "TMG %" represents the percentage of funds in the Total Mapped Group that had management fees that were lower than the fund's. For example, a hypothetical TMG % of 20% would mean that 80% of the funds in the Total Mapped Group had higher, and 20% had lower, management fees than the fund. The fund's actual TMG %s and the number of funds in the Total Mapped Group are in the chart below. The "Asset-Size Peer Group" (ASPG) comparison focuses on a fund's standing relative to a subset of non-Fidelity funds within the Total Mapped Group that are similar in size and management fee structure without taking into account performance adjustments, if any. For example, if a fund is in the first quartile of the ASPG, the fund's management fee ranks in the least expensive or lowest 25% of funds in the ASPG. The ASPG represents at least 15% of the funds in the Total Mapped Group with comparable asset size and management fee structures, subject to a minimum of 50 funds (or all funds in the Total Mapped Group if fewer than 50). Additional information, such as the ASPG quartile in which the fund's management fee rate ranked and the impact of the fund's performance adjustment, is also included in the chart and was considered by the Board.
Fidelity OTC Portfolio

The Board noted that the fund's management fee rate ranked below the median of its Total Mapped Group and below the median of its ASPG for the 12-month period ended June 30, 2018. The Board also noted the effect of the fund's performance adjustment, if any, on the fund's management fee ranking.
The Board noted that it and the boards of other Fidelity funds formed an ad hoc Committee on Group Fee, which meets periodically, to conduct an in-depth review of the "group fee" component of the management fee of funds with such management fee structures. The Committee's focus included the mechanics of the group fee, the competitive landscape of group fee structures, Fidelity funds with no group fee component and investment products not included in group fee assets. The Board also considered that, for funds subject to the group fee, FMR agreed to voluntarily waive fees over a specified period of time in amounts designed to account for assets converted from certain funds to certain collective investment trusts.
The Board also noted that, in 2013, the ad hoc Committee on Management Fees was formed to conduct an in-depth review of the management fee rates of Fidelity's active equity mutual funds. The Committee focused on the following areas: (i) standard fee structures; (ii) research consumption and trading evolution; (iii) management fee competitiveness/profitability by category; and (iv) factors that drive institutional pricing.
Based on its review, the Board concluded that the fund's management fee is fair and reasonable in light of the services that the fund receives and the other factors considered.
Total Expense Ratio. In its review of each class's total expense ratio, the Board considered the fund's management fee rate as well as other fund or class expenses, as applicable, such as transfer agent fees, pricing and bookkeeping fees, and custodial, legal, and audit fees. The Board noted the impact of the fund's performance adjustment. The Board also noted that Fidelity may agree to waive fees and expenses from time to time, and the extent to which, if any, it has done so for the fund. As part of its review, the Board also considered the current and historical total expense ratios of each class of the fund compared to competitive fund median expenses. Each class of the fund is compared to those funds and classes in the Total Mapped Group (used by the Board for management fee comparisons) that have a similar sales load structure.
The Board noted that the total expense ratio of each class ranked below the competitive median for the 12-month period ended June 30, 2018.
Fees Charged to Other Fidelity Clients. The Board also considered Fidelity fee structures and other information with respect to clients of Fidelity, such as other funds advised or subadvised by Fidelity, pension plan clients, and other institutional clients with similar mandates. The Board noted that a joint ad hoc committee created by it and the boards of other Fidelity funds periodically reviews and compares Fidelity's institutional investment advisory business with its business of providing services to the Fidelity funds and also noted the most recent findings of the committee. The Board noted that the committee's review included a consideration of the differences in services provided, fees charged, and costs incurred, as well as competition in the markets serving the different categories of clients.
Based on its review of total expense ratios and fees charged to other Fidelity clients, the Board concluded that the total expense ratio of each class of the fund was reasonable in light of the services that the fund and its shareholders receive and the other factors considered.
Costs of the Services and Profitability. The Board considered the revenues earned and the expenses incurred by Fidelity in conducting the business of developing, marketing, distributing, managing, administering and servicing the fund and servicing the fund's shareholders. The Board also considered the level of Fidelity's profits in respect of all the Fidelity funds.
On an annual basis, Fidelity presents to the Board information about the profitability of its relationships with the fund. Fidelity calculates profitability information for each fund, as well as aggregate profitability information for groups of Fidelity funds and all Fidelity funds, using a series of detailed revenue and cost allocation methodologies which originate with the books and records of Fidelity on which Fidelity's audited financial statements are based. The Audit Committee of the Board reviews any significant changes from the prior year's methodologies.
PricewaterhouseCoopers LLP (PwC), auditor to Fidelity and certain Fidelity funds, has been engaged annually by the Board as part of the Board's assessment of Fidelity's profitability analysis. PwC's engagement includes the review and assessment of the methodologies used by Fidelity in determining the revenues and expenses attributable to Fidelity's mutual fund business, and completion of agreed-upon procedures in respect of the mathematical accuracy of the fund profitability information and its conformity to established allocation methodologies. After considering PwC's reports issued under the engagement and information provided by Fidelity, the Board concluded that while other allocation methods may also be reasonable, Fidelity's profitability methodologies are reasonable in all material respects.
The Board also reviewed Fidelity's non-fund businesses and potential indirect benefits such businesses may have received as a result of their association with Fidelity's mutual fund business (i.e., fall-out benefits) as well as cases where Fidelity's affiliates may benefit from the fund's business. The Board noted that changes to fall-out benefits year-over-year reflect business developments at Fidelity's various businesses.
The Board considered the costs of the services provided by and the profits realized by Fidelity in connection with the operation of the fund and was satisfied that the profitability was not excessive.
Economies of Scale. The Board considered whether there have been economies of scale in respect of the management of the Fidelity funds, whether the Fidelity funds (including the fund) have appropriately benefited from any such economies of scale, and whether there is potential for realization of any further economies of scale. The Board considered the extent to which the fund will benefit from economies of scale as assets grow through increased services to the fund, through waivers or reimbursements, or through fee or expense ratio reductions. The Board also noted that a committee (the Economies of Scale Committee) created by it and the boards of other Fidelity funds periodically analyzes whether Fidelity attains economies of scale in respect of the management and servicing of the Fidelity funds, whether the Fidelity funds have appropriately benefited from such economies of scale, and whether there is potential for realization of any further economies of scale.
The Board recognized that the fund's management contract incorporates a "group fee" structure, which provides for lower group fee rates as total group assets increase, and for higher group fee rates as total group assets decrease (with "group assets" defined to include fund assets under FMR's management plus the assets of sector funds previously under FMR's management). FMR calculates the group fee rates based on a tiered asset "breakpoint" schedule that varies based on asset class. The Board considered that the group fee is designed to deliver the benefits of economies of scale to fund shareholders when total Fidelity fund assets increase, even if assets of any particular fund are unchanged or have declined, because some portion of Fidelity's costs are attributable to services provided to all Fidelity funds, and all funds benefit if those costs can be allocated among more assets. The Board concluded that, given the group fee structure, fund shareholders will benefit from lower management fees as group assets increase at the fund complex level, regardless of whether Fidelity achieves any such economies of scale.
The Board concluded, taking into account the analysis of the Economies of Scale Committee, that economies of scale, if any, are being appropriately shared between fund shareholders and Fidelity.
Additional Information Requested by the Board. In order to develop fully the factual basis for consideration of the Fidelity funds' advisory contracts, the Board requested and received additional information on certain topics, including: (i) fund performance trends, in particular the underperformance of certain funds, and Fidelity's long-term strategies for certain funds; (ii) Fidelity's fund profitability methodology, profitability trends for certain funds, and the impact of certain factors on fund profitability results; (iii) metrics for evaluating index fund and ETF performance and information about ETF trading characteristics; (iv) the methodology with respect to the evaluation of competitive fund data and peer group classifications and fee comparisons; (v) the expense structures for different funds and classes; (vi) information regarding other accounts managed by Fidelity, including collective investment trusts; and (vii) Fidelity's philosophies and strategies for evaluating funds and classes with lower or declining asset levels.
Based on its evaluation of all of the conclusions noted above, and after considering all factors it believed relevant, the Board concluded that the advisory fee arrangements are fair and reasonable, and that the fund's Advisory Contracts should be renewed.
OTC-SANN-0319
1.700332.121
Fidelity® Real Estate Income Fund
Semi-Annual Report January 31, 2019 Includes Fidelity and Fidelity Advisor share classes |
|
Beginning on January 1, 2021, as permitted by regulations adopted by the Securities and Exchange Commission, paper copies of a fund’s shareholder reports will no longer be sent by mail, unless you specifically request paper copies of the reports from the fund or from your financial intermediary, such as a financial advisor, broker-dealer or bank. Instead, the reports will be made available on a website, and you will be notified by mail each time a report is posted and provided with a website link to access the report.
If you already elected to receive shareholder reports electronically, you will not be affected by this change and you need not take any action. You may elect to receive shareholder reports and other communications from a fund electronically, by contacting your financial intermediary. For Fidelity customers, visit Fidelity's web site or call Fidelity using the contact information listed below.
You may elect to receive all future reports in paper free of charge. If you wish to continue receiving paper copies of your shareholder reports, you may contact your financial intermediary or, if you are a Fidelity customer, visit Fidelity’s website, or call Fidelity at the applicable toll-free number listed below. Your election to receive reports in paper will apply to all funds held with the fund complex/your financial intermediary.
| Account Type | Website | Phone Number |
| Brokerage, Mutual Fund, or Annuity Contracts: | fidelity.com/mailpreferences | 1-800-343-3548 |
| Employer Provided Retirement Accounts: | netbenefits.fidelity.com/preferences (choose 'no' under Required Disclosures to continue to print) | 1-800-343-0860 |
| Advisor Sold Accounts Serviced Through Your Financial Intermediary: | Contact Your Financial Intermediary | Your Financial Intermediary's phone number |
| Advisor Sold Accounts Serviced by Fidelity: | institutional.fidelity.com | 1-877-208-0098 |
Contents
To view a fund's proxy voting guidelines and proxy voting record for the 12-month period ended June 30, visit http://www.fidelity.com/proxyvotingresults or visit the Securities and Exchange Commission's (SEC) web site at http://www.sec.gov.
You may also call 1-800-544-8544 if you’re an individual investing directly with Fidelity, call 1-800-835-5092 if you’re a plan sponsor or participant with Fidelity as your recordkeeper or call 1-877-208-0098 on institutional accounts or if you’re an advisor or invest through one to request a free copy of the proxy voting guidelines.
Standard & Poor's, S&P and S&P 500 are registered service marks of The McGraw-Hill Companies, Inc. and have been licensed for use by Fidelity Distributors Corporation.
Other third-party marks appearing herein are the property of their respective owners.
All other marks appearing herein are registered or unregistered trademarks or service marks of FMR LLC or an affiliated company. © 2019 FMR LLC. All rights reserved.
This report and the financial statements contained herein are submitted for the general information of the shareholders of the Fund. This report is not authorized for distribution to prospective investors in the Fund unless preceded or accompanied by an effective prospectus.
A fund files its complete schedule of portfolio holdings with the SEC for the first and third quarters of each fiscal year on Form N-Q. Forms N-Q are available on the SEC’s web site at http://www.sec.gov. A fund's Forms N-Q may be reviewed and copied at the SEC’s Public Reference Room in Washington, DC. Information regarding the operation of the SEC's Public Reference Room may be obtained by calling 1-800-SEC-0330.
For a complete list of a fund's portfolio holdings, view the most recent holdings listing, semiannual report, or annual report on Fidelity's web site at http://www.fidelity.com, http://www.institutional.fidelity.com, or http://www.401k.com, as applicable.
NOT FDIC INSURED •MAY LOSE VALUE •NO BANK GUARANTEE
Neither the Fund nor Fidelity Distributors Corporation is a bank.
Investment Summary (Unaudited)
Top Five Stocks as of January 31, 2019
| | % of fund's net assets |
| Equity Lifestyle Properties, Inc. | 2.9 |
| Apartment Investment & Management Co. Class A | 2.7 |
| Ventas, Inc. | 2.5 |
| American Tower Corp. | 2.4 |
| Acadia Realty Trust (SBI) | 2.1 |
| | 12.6 |
Top 5 Bonds as of January 31, 2019
| | % of fund's net assets |
| Kennedy-Wilson, Inc. 5.875% 4/1/24 | 0.8 |
| Senior Housing Properties Trust 4.75% 5/1/24 | 0.8 |
| RWT Holdings, Inc. 5.625% 11/15/19 | 0.7 |
| PennyMac Corp. 5.375% 5/1/20 | 0.7 |
| GS Mortgage Securities Trust Series 2016-REMZ Class MZB, 7.727% 2/10/21 | 0.6 |
| | 3.6 |
Top Five REIT Sectors as of January 31, 2019
| | % of fund's net assets |
| REITs - Mortgage | 16.8 |
| REITs - Health Care | 8.0 |
| REITs - Diversified | 7.3 |
| REITs - Apartments | 7.3 |
| REITs - Management/Investment | 3.9 |
Asset Allocation (% of fund's net assets)
| As of January 31, 2019* |
| | Common Stocks | 31.2% |
| | Bonds | 34.0% |
| | Convertible Securities | 5.9% |
| | Other Investments | 4.7% |
| | Short-Term Investments and Net Other Assets (Liabilities) | 7.1% |
* Foreign investments - 2.1%
Schedule of Investments January 31, 2019 (Unaudited)
Showing Percentage of Net Assets
| Common Stocks - 31.2% | | | |
| | | Shares | Value |
| CONSUMER DISCRETIONARY - 0.4% | | | |
| Hotels, Restaurants & Leisure - 0.4% | | | |
| Wyndham Destinations, Inc. | | 271,200 | $11,428,368 |
| Wyndham Hotels & Resorts, Inc. | | 172,200 | 8,453,298 |
| | | | 19,881,666 |
| FINANCIALS - 5.2% | | | |
| Capital Markets - 1.1% | | | |
| Brookfield Asset Management, Inc. Class A | | 699,500 | 30,099,874 |
| Ellington Financial LLC (a) | | 1,635,484 | 27,050,905 |
| | | | 57,150,779 |
| Insurance - 0.2% | | | |
| FNF Group | | 348,900 | 12,616,224 |
| Mortgage Real Estate Investment Trusts - 3.9% | | | |
| Anworth Mortgage Asset Corp. | | 371,436 | 1,660,319 |
| Chimera Investment Corp. | | 1,264,200 | 24,057,726 |
| Dynex Capital, Inc. | | 2,492,312 | 15,003,718 |
| Ellington Residential Mortgage REIT (b) | | 483,900 | 5,642,274 |
| Great Ajax Corp. (a) | | 1,577,762 | 20,368,907 |
| Hunt Companies Finance Trust, Inc. (b) | | 547,901 | 1,862,863 |
| Invesco Mortgage Capital, Inc. | | 1,037,849 | 16,709,369 |
| MFA Financial, Inc. | | 13,958,911 | 102,318,818 |
| New Residential Investment Corp. | | 154,000 | 2,614,920 |
| Redwood Trust, Inc. | | 1,145,252 | 18,472,915 |
| Two Harbors Investment Corp. | | 312,270 | 4,556,019 |
| | | | 213,267,848 |
|
| TOTAL FINANCIALS | | | 283,034,851 |
|
| REAL ESTATE - 25.6% | | | |
| Equity Real Estate Investment Trusts (REITs) - 25.1% | | | |
| Acadia Realty Trust (SBI) | | 3,989,304 | 114,612,704 |
| American Homes 4 Rent Class A | | 191,822 | 4,241,184 |
| American Tower Corp. | | 759,100 | 131,202,844 |
| Apartment Investment & Management Co. Class A | | 2,952,296 | 146,197,698 |
| AvalonBay Communities, Inc. | | 209,700 | 40,455,324 |
| Boardwalk (REIT) (b) | | 296,100 | 9,043,337 |
| Brixmor Property Group, Inc. | | 441,300 | 7,559,469 |
| Cedar Realty Trust, Inc. | | 299,963 | 1,046,871 |
| Colony Capital, Inc. | | 8,369,748 | 50,804,370 |
| Crown Castle International Corp. | | 418,510 | 48,990,781 |
| DDR Corp. | | 1,853,874 | 24,230,133 |
| Equinix, Inc. | | 181,700 | 71,589,800 |
| Equity Lifestyle Properties, Inc. | | 1,494,947 | 158,284,983 |
| Equity Residential (SBI) | | 674,603 | 48,949,194 |
| Extra Space Storage, Inc. | | 37,500 | 3,697,875 |
| Healthcare Realty Trust, Inc. | | 431,300 | 13,926,677 |
| Healthcare Trust of America, Inc. | | 1,158,860 | 32,934,801 |
| Lexington Corporate Properties Trust | | 3,914,874 | 37,621,939 |
| Mid-America Apartment Communities, Inc. | | 837,506 | 84,822,608 |
| Monmouth Real Estate Investment Corp. Class A | | 80,641 | 1,108,007 |
| Omega Healthcare Investors, Inc. | | 355,023 | 14,268,374 |
| Outfront Media, Inc. | | 815,663 | 16,925,007 |
| Public Storage | | 45,291 | 9,625,243 |
| Sabra Health Care REIT, Inc. | | 2,676,275 | 54,970,689 |
| Safety Income and Growth, Inc. | | 433,370 | 7,644,647 |
| Senior Housing Properties Trust (SBI) | | 2,202,000 | 30,321,540 |
| Spirit MTA REIT | | 120,120 | 939,338 |
| Store Capital Corp. | | 837,600 | 27,071,232 |
| Terreno Realty Corp. | | 448,628 | 18,097,654 |
| UMH Properties, Inc. | | 257,800 | 3,616,934 |
| Ventas, Inc. | | 2,068,886 | 133,422,458 |
| VEREIT, Inc. | | 1,811,634 | 14,638,003 |
| | | | 1,362,861,718 |
| Real Estate Management & Development - 0.5% | | | |
| Colony NorthStar Credit Real Estate, Inc. (b) | | 1,254,071 | 20,955,526 |
| Retail Value, Inc. | | 208,655 | 6,345,199 |
| | | | 27,300,725 |
|
| TOTAL REAL ESTATE | | | 1,390,162,443 |
|
| TOTAL COMMON STOCKS | | | |
| (Cost $1,397,156,673) | | | 1,693,078,960 |
|
| Preferred Stocks - 18.5% | | | |
| Convertible Preferred Stocks - 1.4% | | | |
| FINANCIALS - 0.4% | | | |
| Mortgage Real Estate Investment Trusts - 0.4% | | | |
| Great Ajax Corp. 7.25% (a) | | 362,000 | 8,782,120 |
| ZAIS Financial Corp. 7.00% | | 404,700 | 10,376,508 |
| | | | 19,158,628 |
| REAL ESTATE - 1.0% | | | |
| Equity Real Estate Investment Trusts (REITs) - 0.9% | | | |
| Alexandria Real Estate Equities, Inc. Series D, 7.00% | | 136,759 | 4,818,416 |
| Braemar Hotels & Resorts, Inc. 5.50% | | 99,191 | 1,869,750 |
| Equity Commonwealth 6.50% | | 31,237 | 825,257 |
| iStar Financial, Inc. Series J, 4.50% | | 213,773 | 9,356,759 |
| Lexington Corporate Properties Trust Series C, 6.50% | | 468,142 | 22,938,958 |
| QTS Realty Trust, Inc. 6.50% | | 42,000 | 4,346,093 |
| RLJ Lodging Trust Series A, 1.95% | | 31,935 | 814,981 |
| Wheeler REIT, Inc. 8.75% | | 516,748 | 6,197,514 |
| | | | 51,167,728 |
| Real Estate Management & Development - 0.1% | | | |
| Landmark Infrastructure Partners LP 7.012% | | 191,800 | 4,742,006 |
| TOTAL REAL ESTATE | | | 55,909,734 |
|
| TOTAL CONVERTIBLE PREFERRED STOCKS | | | 75,068,362 |
|
| Nonconvertible Preferred Stocks - 17.1% | | | |
| ENERGY - 0.1% | | | |
| Oil, Gas & Consumable Fuels - 0.1% | | | |
| Global Partners LP 9.75% | | 150,000 | 3,732,750 |
| FINANCIALS - 8.6% | | | |
| Capital Markets - 0.1% | | | |
| Arlington Asset Investment Corp. 6.625% | | 182,517 | 4,324,412 |
| Mortgage Real Estate Investment Trusts - 8.3% | | | |
| AG Mortgage Investment Trust, Inc.: | | | |
| 8.00% | | 618,287 | 15,840,513 |
| 8.25% | | 38,935 | 988,949 |
| AGNC Investment Corp.: | | | |
| Series B, 7.75% | | 427,100 | 10,741,565 |
| Series C, 7.00% | | 361,900 | 9,174,165 |
| Annaly Capital Management, Inc.: | | | |
| Series C, 7.625% | | 190,417 | 4,853,729 |
| Series D, 7.50% | | 606,176 | 15,427,179 |
| Series F, 6.95% | | 1,250,552 | 31,588,944 |
| Series G, 6.50% | | 720,300 | 17,171,952 |
| Series H, 8.125% | | 248,636 | 6,367,071 |
| Anworth Mortgage Asset Corp. Series A, 8.625% | | 238,275 | 6,144,802 |
| Apollo Commercial Real Estate Finance, Inc. Series C, 8.00% | | 485,559 | 12,313,776 |
| Arbor Realty Trust, Inc.: | | | |
| Series A, 8.25% | | 189,089 | 4,860,646 |
| Series B, 7.75% | | 240,000 | 6,105,960 |
| Series C, 8.50% | | 100,000 | 2,561,830 |
| Armour Residential REIT, Inc. Series B, 7.875% | | 153,654 | 3,798,327 |
| Capstead Mortgage Corp. Series E, 7.50% | | 202,984 | 5,115,197 |
| Cherry Hill Mortgage Investment Corp. Series A, 8.20% | | 246,500 | 6,151,506 |
| Chimera Investment Corp.: | | | |
| 8.00% (c) | | 570,000 | 14,478,000 |
| Series A, 8.00% | | 204,800 | 5,261,312 |
| Series B, 8.00% | | 1,259,804 | 32,452,551 |
| Series C, 7.75% | | 965,893 | 24,012,100 |
| Dynex Capital, Inc.: | | | |
| Series A, 8.50% | | 362,932 | 9,243,842 |
| Series B, 7.625% | | 252,120 | 5,986,589 |
| Exantas Capital Corp. 8.625% | | 168,316 | 4,207,900 |
| Hunt Companies Finance Trust, Inc. Series A, 8.75% | | 86,727 | 2,172,511 |
| Invesco Mortgage Capital, Inc.: | | | |
| 7.50% | | 1,344,215 | 32,395,582 |
| Series A, 7.75% | | 123,342 | 3,077,383 |
| Series B, 7.75% | | 856,479 | 21,908,733 |
| MFA Financial, Inc.: | | | |
| 8.00% | | 538,930 | 13,785,829 |
| Series B, 7.50% | | 616,232 | 15,492,072 |
| New York Mortgage Trust, Inc.: | | | |
| Series B, 7.75% | | 284,267 | 6,523,928 |
| Series C, 7.875% | | 280,725 | 6,526,856 |
| Series D, 8.00% | | 313,300 | 7,111,910 |
| PennyMac Mortgage Investment Trust: | | | |
| 8.125% | | 401,029 | 10,125,982 |
| Series B, 8.00% | | 627,849 | 15,708,782 |
| Two Harbors Investment Corp.: | | | |
| 7.50% | | 496,667 | 11,905,108 |
| 7.75% | | 118,428 | 2,922,329 |
| Series A, 8.125% | | 450,000 | 11,830,275 |
| Series B, 7.625% | | 716,619 | 17,800,816 |
| Series C, 7.25% | | 601,187 | 14,464,559 |
| Wells Fargo Real Estate Investment Corp. Series A, 6.375% | | 137,600 | 3,577,600 |
| | | | 452,178,660 |
| Real Estate Management & Development - 0.2% | | | |
| Brookfield Properties Corp. Series EE, 5.10% | | 494,100 | 8,348,126 |
| TOTAL FINANCIALS | | | 464,851,198 |
| REAL ESTATE - 8.4% | | | |
| Equity Real Estate Investment Trusts (REITs) - 8.4% | | | |
| American Homes 4 Rent: | | | |
| 6.25% | | 100,030 | 2,464,739 |
| Series D, 6.50% | | 280,000 | 6,731,200 |
| Series E, 6.35% | | 245,614 | 5,676,140 |
| Series F, 5.875% | | 250,809 | 5,763,591 |
| Series G, 5.875% | | 202,000 | 4,456,120 |
| Ashford Hospitality Trust, Inc.: | | | |
| Series D, 8.45% | | 11,770 | 285,187 |
| Series F, 7.375% | | 273,100 | 5,655,901 |
| Series G, 7.375% | | 147,018 | 3,155,006 |
| Series H, 7.50% | | 193,740 | 4,175,097 |
| Series I, 7.50% | | 230,865 | 4,813,535 |
| Bluerock Residential Growth (REIT), Inc.: | | | |
| Series A, 8.25% | | 486,775 | 12,427,366 |
| Series C, 7.625% | | 146,969 | 3,703,619 |
| Series D, 7.125% | | 170,000 | 3,954,200 |
| Braemar Hotels & Resorts, Inc. Series D, 8.25% | | 173,480 | 4,232,895 |
| Brookfield Property REIT, Inc. 6.375% | | 190,963 | 4,468,534 |
| Cedar Realty Trust, Inc.: | | | |
| Series B, 7.25% | | 97,922 | 2,329,564 |
| Series C, 6.50% | | 294,900 | 5,896,526 |
| City Office REIT, Inc. Series A, 6.625% | | 180,500 | 3,875,335 |
| Colony Capital, Inc.: | | | |
| Series B, 8.25% | | 207,961 | 5,251,015 |
| Series E, 8.75% | | 505,002 | 12,953,301 |
| Series G, 7.50% | | 221,282 | 4,916,067 |
| Series H, 7.125% | | 732,865 | 15,316,879 |
| Series I, 7.15% | | 834,142 | 17,642,103 |
| Series J, 7.15% | | 960,643 | 20,192,716 |
| DDR Corp.: | | | |
| Series J, 6.50% | | 340,721 | 8,466,917 |
| Series K, 6.25% | | 228,888 | 5,543,667 |
| Digital Realty Trust, Inc.: | | | |
| Series C, 6.625% | | 84,000 | 2,175,600 |
| Series G, 5.875% | | 40,444 | 1,021,211 |
| Series H, 7.375% | | 50,000 | 1,260,500 |
| Farmland Partners, Inc. Series B, 6.00% | | 630,200 | 14,992,458 |
| Gladstone Commercial Corp. Series D, 7.00% | | 538,800 | 13,588,536 |
| Gladstone Land Corp. Series A, 6.375% | | 64,000 | 1,640,326 |
| Global Medical REIT, Inc. Series A, 7.50% | | 135,100 | 3,350,480 |
| Global Net Lease, Inc. Series A, 7.25% | | 528,520 | 12,557,635 |
| Government Properties Income Trust 5.875% | | 202,500 | 4,766,850 |
| Hersha Hospitality Trust: | | | |
| Series C, 6.875% | | 50,000 | 1,145,000 |
| Series D, 6.50% | | 200,000 | 4,326,000 |
| Investors Real Estate Trust Series C, 6.625% | | 320,900 | 7,733,690 |
| iStar Financial, Inc.: | | | |
| Series D, 8.00% | | 210,570 | 5,335,844 |
| Series G, 7.65% | | 239,548 | 5,557,514 |
| Series I, 7.50% | | 161,269 | 3,828,526 |
| Jernigan Capital, Inc. Series B, 7.00% | | 140,225 | 3,309,310 |
| Monmouth Real Estate Investment Corp. Series C, 6.125% | | 225,900 | 5,313,168 |
| National Retail Properties, Inc. Series E, 5.70% | | 301,404 | 7,580,311 |
| National Storage Affiliates Trust Series A, 6.00% | | 67,600 | 1,654,172 |
| Pebblebrook Hotel Trust: | | | |
| 6.30% | | 240,000 | 6,112,800 |
| 6.375% | | 354,698 | 9,222,148 |
| Series C, 6.50% | | 204,321 | 5,210,186 |
| Series D, 6.375% | | 350,000 | 8,953,000 |
| Pennsylvania (REIT): | | | |
| Series B, 7.375% | | 100,510 | 2,041,358 |
| Series C, 7.20% | | 51,000 | 977,665 |
| Series D, 6.875% | | 151,800 | 2,890,272 |
| Plymouth Industrial REIT, Inc. Series A, 7.50% | | 169,400 | 4,107,950 |
| Prologis, Inc. Series Q, 8.54% (d) | | 94,446 | 5,679,038 |
| Public Storage: | | | |
| Series F, 5.15% | | 173,400 | 3,991,668 |
| Series Y, 6.375% | | 102,224 | 2,597,512 |
| QTS Realty Trust, Inc. Series A, 7.125% | | 30,000 | 765,000 |
| RAIT Financial Trust 7.625% | | 224,590 | 4,044,866 |
| Rexford Industrial Realty, Inc.: | | | |
| Series A, 5.875% | | 135,000 | 3,122,550 |
| Series B, 5.875% | | 79,500 | 1,866,660 |
| Saul Centers, Inc.: | | | |
| Series C, 6.875% | | 183,479 | 4,711,741 |
| Series D, 6.125% | | 83,700 | 1,918,404 |
| Sotherly Hotels, Inc.: | | | |
| Series B, 8.00% | | 68,000 | 1,631,320 |
| Series C, 7.875% | | 108,200 | 2,548,781 |
| Spirit Realty Capital, Inc. Series A, 6.00% | | 95,200 | 2,163,896 |
| Stag Industrial, Inc. Series C, 6.875% | | 83,000 | 2,141,400 |
| Summit Hotel Properties, Inc.: | | | |
| Series D, 6.45% | | 210,000 | 4,991,700 |
| Series E, 6.25% | | 190,000 | 3,990,000 |
| Sunstone Hotel Investors, Inc.: | | | |
| Series E, 6.95% | | 42,000 | 1,098,300 |
| Series F, 6.45% | | 84,000 | 2,010,960 |
| Taubman Centers, Inc. Series K, 6.25% | | 157,322 | 3,917,931 |
| UMH Properties, Inc.: | | | |
| Series B, 8.00% | | 319,604 | 8,344,860 |
| Series C, 6.75% | | 341,140 | 8,374,987 |
| Series D, 6.375% | | 93,800 | 2,180,850 |
| Urstadt Biddle Properties, Inc.: | | | |
| Series G, 6.75% | | 160,000 | 4,016,000 |
| Series H, 6.25% | | 284,500 | 6,845,070 |
| VEREIT, Inc. Series F, 6.70% | | 1,959,376 | 49,317,494 |
| Washington Prime Group, Inc.: | | | |
| Series H, 7.50% | | 198,527 | 3,226,064 |
| Series I, 6.875% | | 298,115 | 4,702,108 |
| | | | 455,198,890 |
| Real Estate Management & Development - 0.0% | | | |
| Landmark Infrastructure Partners LP Series B, 7.90% | | 117,700 | 2,797,729 |
| TOTAL REAL ESTATE | | | 457,996,619 |
| UTILITIES - 0.0% | | | |
| Multi-Utilities - 0.0% | | | |
| Brookfield Infrastructure Partners LP Series 5, 5.35% | | 169,300 | 3,160,645 |
|
| TOTAL NONCONVERTIBLE PREFERRED STOCKS | | | 929,741,212 |
|
| TOTAL PREFERRED STOCKS | | | |
| (Cost $1,023,113,930) | | | 1,004,809,574 |
| | | Principal Amount | Value |
|
| Corporate Bonds - 19.3% | | | |
| Convertible Bonds - 4.5% | | | |
| FINANCIALS - 4.5% | | | |
| Diversified Financial Services - 0.2% | | | |
| Granite Point Mortgage Trust, Inc.: | | | |
| 5.625% 12/1/22 (e) | | 6,770,000 | 6,852,391 |
| 6.375% 10/1/23 | | 6,800,000 | 6,888,339 |
| | | | 13,740,730 |
| Mortgage Real Estate Investment Trusts - 4.3% | | | |
| Apollo Commercial Real Estate Finance, Inc. 5.375% 10/15/23 | | 1,700,000 | 1,653,250 |
| Arbor Realty Trust, Inc. 5.25% 7/1/21 (e) | | 6,710,000 | 6,726,775 |
| Blackstone Mortgage Trust, Inc.: | | | |
| 4.375% 5/5/22 | | 16,780,000 | 16,653,462 |
| 4.75% 3/15/23 | | 3,900,000 | 3,858,504 |
| Colony Financial, Inc.: | | | |
| 3.875% 1/15/21 | | 19,280,000 | 18,248,520 |
| 5% 4/15/23 | | 26,083,000 | 24,004,472 |
| Exantas Capital Corp. 8% 1/15/20 | | 13,890,000 | 14,306,700 |
| KKR Real Estate Finance Trust, Inc. 6.125% 5/15/23 (e) | | 8,100,000 | 8,044,766 |
| PennyMac Corp. 5.375% 5/1/20 | | 35,606,000 | 35,209,136 |
| Redwood Trust, Inc.: | | | |
| 4.75% 8/15/23 | | 5,550,000 | 5,196,665 |
| 5.625% 7/15/24 | | 21,070,000 | 20,742,909 |
| RWT Holdings, Inc. 5.625% 11/15/19 | | 36,880,000 | 36,996,983 |
| Starwood Property Trust, Inc. 4.375% 4/1/23 | | 11,080,000 | 10,977,122 |
| Two Harbors Investment Corp. 6.25% 1/15/22 | | 4,380,000 | 4,395,475 |
| Western Asset Mortgage Capital Corp. 6.75% 10/1/22 | | 25,381,000 | 24,096,747 |
| | | | 231,111,486 |
| TOTAL FINANCIALS | | | 244,852,216 |
| Nonconvertible Bonds - 14.8% | | | |
| COMMUNICATION SERVICES - 0.0% | | | |
| Media - 0.0% | | | |
| CBS Outdoor Americas Capital LLC/CBS Outdoor Americas Capital Corp. 5.625% 2/15/24 | | 1,300,000 | 1,314,625 |
| CONSUMER DISCRETIONARY - 3.8% | | | |
| Hotels, Restaurants & Leisure - 0.4% | | | |
| ESH Hospitality, Inc. 5.25% 5/1/25 (e) | | 11,040,000 | 10,914,144 |
| FelCor Lodging LP 6% 6/1/25 | | 2,025,000 | 2,080,688 |
| Marriott Ownership Resorts, Inc. 6.5% 9/15/26 (e) | | 4,000,000 | 4,050,000 |
| Times Square Hotel Trust 8.528% 8/1/26 (e) | | 6,198,574 | 7,130,415 |
| | | | 24,175,247 |
| Household Durables - 3.4% | | | |
| Ashton Woods U.S.A. LLC/Ashton Woods Finance Co.: | | | |
| 6.75% 8/1/25 (e) | | 19,042,000 | 16,994,985 |
| 6.875% 2/15/21 (e) | | 15,709,000 | 15,277,003 |
| Beazer Homes U.S.A., Inc.: | | | |
| 5.875% 10/15/27 | | 10,165,000 | 8,640,250 |
| 6.75% 3/15/25 | | 5,850,000 | 5,235,750 |
| 8.75% 3/15/22 | | 5,840,000 | 6,105,720 |
| Brookfield Residential Properties, Inc./Brookfield Residential U.S. Corp. 6.125% 7/1/22 (e) | | 5,495,000 | 5,385,100 |
| Brookfield Residential Properties, Inc.: | | | |
| 6.375% 5/15/25 (e) | | 5,580,000 | 5,231,250 |
| 6.5% 12/15/20 (e) | | 12,085,000 | 12,145,425 |
| KB Home 8% 3/15/20 | | 8,465,000 | 8,814,181 |
| LGI Homes, Inc. 6.875% 7/15/26 (e) | | 16,190,000 | 15,582,875 |
| M/I Homes, Inc.: | | | |
| 5.625% 8/1/25 | | 7,965,000 | 7,287,975 |
| 6.75% 1/15/21 | | 3,803,000 | 3,841,030 |
| Meritage Homes Corp.: | | | |
| 5.125% 6/6/27 | | 5,035,000 | 4,517,301 |
| 6% 6/1/25 | | 4,000,000 | 3,960,000 |
| 7% 4/1/22 | | 7,525,000 | 7,910,656 |
| 7.15% 4/15/20 | | 7,060,000 | 7,307,100 |
| New Home Co. LLC 7.25% 4/1/22 | | 14,325,000 | 13,143,188 |
| Taylor Morrison Communities, Inc./Monarch Communities, Inc. 5.875% 4/15/23 (e) | | 4,100,000 | 4,059,000 |
| TRI Pointe Homes, Inc.: | | | |
| 5.25% 6/1/27 | | 7,615,000 | 6,586,975 |
| 5.875% 6/15/24 | | 12,620,000 | 12,162,525 |
| William Lyon Homes, Inc.: | | | |
| 5.875% 1/31/25 | | 6,135,000 | 5,398,800 |
| 7% 8/15/22 | | 8,180,000 | 8,159,550 |
| | | | 183,746,639 |
| TOTAL CONSUMER DISCRETIONARY | | | 207,921,886 |
| CONSUMER STAPLES - 0.8% | | | |
| Food & Staples Retailing - 0.8% | | | |
| Ahold Lease U.S.A., Inc. 7.82% 1/2/20 | | 2,222 | 2,235 |
| Albertsons Companies LLC/Safeway, Inc./New Albertson's, Inc./Albertson's LLC: | | | |
| 5.75% 3/15/25 | | 17,225,000 | 16,126,906 |
| 6.625% 6/15/24 | | 8,225,000 | 8,101,625 |
| C&S Group Enterprises LLC 5.375% 7/15/22 (e) | | 9,705,000 | 9,559,425 |
| Cumberland Farms, Inc. 6.75% 5/1/25 (e) | | 2,075,000 | 2,106,125 |
| New Albertsons, Inc. 8.7% 5/1/30 | | 5,080,000 | 4,705,960 |
| | | | 40,602,276 |
| FINANCIALS - 0.8% | | | |
| Capital Markets - 0.1% | | | |
| CyrusOne LP/CyrusOne Finance Corp. 5% 3/15/24 | | 3,610,000 | 3,637,075 |
| Diversified Financial Services - 0.6% | | | |
| Brixmor Operating Partnership LP: | | | |
| 3.65% 6/15/24 | | 6,000,000 | 5,849,510 |
| 3.85% 2/1/25 | | 8,384,000 | 8,152,824 |
| Five Point Operation Co. LP 7.875% 11/15/25 (e) | | 15,762,000 | 15,131,520 |
| Icahn Enterprises LP/Icahn Enterprises Finance Corp.: | | | |
| 5.875% 2/1/22 | | 3,680,000 | 3,708,005 |
| 6.25% 2/1/22 | | 1,695,000 | 1,739,494 |
| | | | 34,581,353 |
| Mortgage Real Estate Investment Trusts - 0.1% | | | |
| Starwood Property Trust, Inc. 4.75% 3/15/25 | | 4,235,000 | 4,033,838 |
| TOTAL FINANCIALS | | | 42,252,266 |
| HEALTH CARE - 0.3% | | | |
| Health Care Providers & Services - 0.3% | | | |
| Sabra Health Care LP/Sabra Capital Corp.: | | | |
| 5.375% 6/1/23 | | 5,675,000 | 5,646,625 |
| 5.5% 2/1/21 | | 12,305,000 | 12,428,050 |
| | | | 18,074,675 |
| INDUSTRIALS - 0.2% | | | |
| Building Products - 0.2% | | | |
| Shea Homes Ltd. Partnership/Corp. 6.125% 4/1/25 (e) | | 10,610,000 | 9,840,775 |
| REAL ESTATE - 8.9% | | | |
| Equity Real Estate Investment Trusts (REITs) - 6.2% | | | |
| American Homes 4 Rent 4.9% 2/15/29 | | 1,000,000 | 1,001,497 |
| ARC Properties Operating Partnership LP 4.6% 2/6/24 | | 10,480,000 | 10,618,497 |
| Care Capital Properties LP 5.125% 8/15/26 | | 20,493,000 | 19,254,370 |
| CBL & Associates LP: | | | |
| 4.6% 10/15/24 | | 26,758,000 | 20,603,660 |
| 5.25% 12/1/23 | | 11,500,000 | 9,660,000 |
| 5.95% 12/15/26 | | 10,434,000 | 8,295,030 |
| CTR Partnership LP/CareTrust Capital Corp. 5.25% 6/1/25 | | 7,577,000 | 7,387,575 |
| DDR Corp.: | | | |
| 3.625% 2/1/25 | | 5,551,000 | 5,358,566 |
| 4.625% 7/15/22 | | 658,000 | 677,066 |
| Equinix, Inc. 5.375% 5/15/27 | | 6,620,000 | 6,636,550 |
| HCP, Inc.: | | | |
| 4% 6/1/25 | | 1,000,000 | 993,757 |
| 4.25% 11/15/23 | | 1,707,000 | 1,732,764 |
| Healthcare Realty Trust, Inc. 3.75% 4/15/23 | | 966,000 | 955,488 |
| Healthcare Trust of America Holdings LP 3.75% 7/1/27 | | 8,395,000 | 8,075,215 |
| Hospitality Properties Trust 5% 8/15/22 | | 3,177,000 | 3,240,406 |
| iStar Financial, Inc.: | | | |
| 4.625% 9/15/20 | | 6,755,000 | 6,721,225 |
| 5% 7/1/19 | | 11,811,000 | 11,825,764 |
| 5.25% 9/15/22 | | 4,220,000 | 4,154,590 |
| 6% 4/1/22 | | 8,375,000 | 8,354,063 |
| Lexington Corporate Properties Trust 4.4% 6/15/24 | | 2,180,000 | 2,176,289 |
| MPT Operating Partnership LP/MPT Finance Corp.: | | | |
| 5% 10/15/27 | | 9,555,000 | 9,301,793 |
| 5.25% 8/1/26 | | 7,700,000 | 7,738,500 |
| 6.375% 3/1/24 | | 4,000,000 | 4,180,000 |
| Omega Healthcare Investors, Inc.: | | | |
| 4.375% 8/1/23 | | 3,303,000 | 3,313,910 |
| 4.5% 4/1/27 | | 2,462,000 | 2,400,651 |
| 4.75% 1/15/28 | | 12,204,000 | 12,104,749 |
| 4.95% 4/1/24 | | 2,898,000 | 2,962,925 |
| Regency Centers LP 3.6% 2/1/27 | | 2,558,000 | 2,460,163 |
| SBA Communications Corp. 4% 10/1/22 | | 5,535,000 | 5,465,813 |
| Select Income REIT: | | | |
| 4.15% 2/1/22 | | 11,170,000 | 11,035,166 |
| 4.25% 5/15/24 | | 5,030,000 | 4,761,908 |
| 4.5% 2/1/25 | | 21,294,000 | 20,123,391 |
| Senior Housing Properties Trust: | | | |
| 3.25% 5/1/19 | | 7,382,000 | 7,357,124 |
| 4.75% 5/1/24 | | 44,895,000 | 43,546,748 |
| 4.75% 2/15/28 | | 1,000,000 | 896,973 |
| 6.75% 4/15/20 | | 13,624,000 | 13,822,442 |
| 6.75% 12/15/21 | | 8,000,000 | 8,377,035 |
| VEREIT Operating Partnership LP 4.875% 6/1/26 | | 10,945,000 | 11,127,652 |
| WP Carey, Inc.: | | | |
| 4% 2/1/25 | | 6,985,000 | 6,882,757 |
| 4.25% 10/1/26 | | 7,242,000 | 7,143,305 |
| 4.6% 4/1/24 | | 11,323,000 | 11,584,438 |
| | | | 334,309,815 |
| Real Estate Management & Development - 2.7% | | | |
| Greystar Real Estate Partners 5.75% 12/1/25 (e) | | 9,625,000 | 9,588,906 |
| Howard Hughes Corp. 5.375% 3/15/25 (e) | | 29,482,000 | 29,324,271 |
| Kennedy-Wilson, Inc. 5.875% 4/1/24 | | 45,515,000 | 44,504,567 |
| Mattamy Group Corp.: | | | |
| 6.5% 10/1/25 (e) | | 16,715,000 | 15,503,163 |
| 6.875% 12/15/23 (e) | | 7,990,000 | 7,769,476 |
| Mid-America Apartments LP: | | | |
| 3.75% 6/15/24 | | 1,663,000 | 1,653,075 |
| 4.3% 10/15/23 | | 2,203,000 | 2,253,989 |
| Taylor Morrison Communities, Inc./Monarch Communities, Inc.: | | | |
| 5.25% 4/15/21 (e) | | 2,803,000 | 2,806,504 |
| 5.625% 3/1/24 (e) | | 9,935,000 | 9,661,788 |
| Washington Prime Group LP 5.95% 8/15/24 | | 27,489,000 | 24,925,099 |
| | | | 147,990,838 |
| TOTAL REAL ESTATE | | | 482,300,653 |
|
| TOTAL NONCONVERTIBLE BONDS | | | 802,307,156 |
|
| TOTAL CORPORATE BONDS | | | |
| (Cost $1,068,869,638) | | | 1,047,159,372 |
|
| Asset-Backed Securities - 2.3% | | | |
| American Homes 4 Rent: | | | |
| Series 2014-SFR2 Class E, 6.231% 10/17/36 (e) | | 3,000,000 | 3,272,267 |
| Series 2014-SFR3 Class E, 6.418% 12/17/36 (e) | | 9,025,000 | 9,962,968 |
| Series 2015-SFR1: | | | |
| Class E, 5.639% 4/17/52 (e) | | 1,999,310 | 2,133,993 |
| Class F, 5.885% 4/17/52 (e) | | 2,000,000 | 2,097,464 |
| Series 2015-SFR2: | | | |
| Class E, 6.07% 10/17/45 (e) | | 8,259,000 | 8,990,027 |
| Class XS, 0% 10/17/45 (d)(e)(f)(g) | | 4,725,776 | 47 |
| Capital Trust RE CDO Ltd. Series 2005-1A Class D, 1 month U.S. LIBOR + 1.500% 4.006% 3/20/50 (d)(e)(f)(h) | | 2,250,000 | 225 |
| Colony Starwood Homes Series 2016-2A Class F, 1 month U.S. LIBOR + 4.150% 6.6589% 12/17/33 (e)(f)(h) | | 935,865 | 935,857 |
| Conseco Finance Securitizations Corp. Series 2002-2 Class M2, 9.163% 3/1/33 | | 435,498 | 401,831 |
| Deutsche Financial Capital Securitization LLC Series 1997-I Class M, 7.275% 9/15/27 | | 1,526,402 | 1,547,096 |
| Green Tree Financial Corp.: | | | |
| Series 1996-4 Class M1, 7.75% 6/15/27 (f) | | 849,841 | 857,883 |
| Series 1997-3 Class M1, 7.53% 3/15/28 | | 5,688,843 | 5,677,185 |
| Home Partners of America Credit Trust Series 2017-1 Class F, 1 month U.S. LIBOR + 3.539% 6.0465% 7/17/34 (e)(f)(h) | | 6,318,500 | 6,322,243 |
| Home Partners of America Trust: | | | |
| Series 2016-2 Class F, 1 month U.S. LIBOR + 4.700% 7.2075% 10/17/33 (e)(f)(h) | | 3,393,000 | 3,392,969 |
| Series 2018-1 Class F, 1 month U.S. LIBOR + 2.350% 4.8575% 7/17/37 (e)(f)(h) | | 3,896,000 | 3,841,918 |
| Invitation Homes Trust: | | | |
| Series 2017-SFR2 Class F, 1 month U.S. LIBOR + 3.000% 5.5075% 12/17/36 (e)(f)(h) | | 8,442,000 | 8,463,373 |
| Series 2018-SFR2 Class F, 1 month U.S. LIBOR + 2.250% 4.7589% 6/17/37 (e)(f)(h) | | 3,000,000 | 2,958,673 |
| Lehman ABS Manufactured Housing Contract Trust Series 2001-B Class M2, 7.17% 4/15/40 | | 741,651 | 518,391 |
| Merit Securities Corp. Series 13 Class M1, 7.9465% 12/28/33 (f) | | 1,701,302 | 1,766,414 |
| Progress Residential Trust: | | | |
| Series 2015-SFR3 Class F, 6.643% 11/12/32 (e) | | 2,940,000 | 3,013,345 |
| Series 2017-SFR1 Class F, 5.35% 8/17/34 (e) | | 3,073,000 | 3,107,006 |
| Series 2017-SFR2 Class F, 1 month U.S. LIBOR + 2.750% 4.836% 12/17/34 (e)(h) | | 2,568,000 | 2,547,093 |
| Series 2018-SFR2 Class F, 4.953% 8/17/35 (e) | | 3,402,000 | 3,384,598 |
| Series 2018-SFR3 Class F, 5.368% 10/17/35 (e) | | 3,412,000 | 3,445,755 |
| Starwood Waypoint Homes Trust Series 2017-1: | | | |
| Class E, 1 month U.S. LIBOR + 2.600% 5.1089% 1/17/35 (e)(f)(h) | | 5,906,000 | 5,873,974 |
| Class F, 1 month U.S. LIBOR + 3.400% 5.9089% 1/17/35 (e)(f)(h) | | 12,671,000 | 12,761,643 |
| Taberna Preferred Funding III Ltd. Series 2005-3A Class D, 3 month U.S. LIBOR + 2.650% 5.2315% 2/5/36 (d)(e)(f)(h) | | 4,468,631 | 335 |
| Tricon American Homes: | | | |
| Series 2017-SFR1 Class F, 5.151% 9/17/34 (e) | | 8,442,000 | 8,486,221 |
| Series 2017-SFR2 Class F, 5.104% 1/17/36 (e) | | 3,785,000 | 3,801,817 |
| Series 2018-SFR1 Class F, 4.96% 5/17/37 (e) | | 1,000,000 | 990,232 |
| Tricon American Homes Trust Series 2016-SFR1 Class F, 5.769% 11/17/33 (e) | | 2,544,000 | 2,588,336 |
| VB-S1 Issuer LLC: | | | |
| Series 2016-1A Class F, 6.901% 6/15/46 (e) | | 7,797,000 | 8,034,052 |
| Series 2018-1A Class F, 5.25% 2/15/48 (e) | | 1,354,000 | 1,308,307 |
| Wrightwood Capital Real Estate CDO Ltd. Series 2005-1A Class F, 3 month U.S. LIBOR + 1.950% 4.5958% 11/21/40 (d)(e)(f)(h) | | 250,000 | 248,915 |
| TOTAL ASSET-BACKED SECURITIES | | | |
| (Cost $125,000,866) | | | 122,732,453 |
|
| Collateralized Mortgage Obligations - 0.2% | | | |
| Private Sponsor - 0.2% | | | |
| FREMF Mortgage Trust: | | | |
| Series 2010-K6 Class B, 5.3639% 12/25/46 (e)(f) | | 4,500,000 | 4,582,585 |
| Series 2010-K7 Class B, 5.5005% 4/25/20 (e)(f) | | 3,200,000 | 3,278,915 |
| RESI Finance LP/RESI Finance DE Corp. floater Series 2003-B Class B9, 1 month U.S. LIBOR + 11.950% 14.4655% 6/10/35 (e)(f)(h) | | 44,315 | 19,447 |
|
| TOTAL PRIVATE SPONSOR | | | 7,880,947 |
|
| U.S. Government Agency - 0.0% | | | |
| Fannie Mae REMIC Trust: | | | |
| Series 2002-W1 subordinate REMIC pass thru certificates, Class 3B3, 4.0555% 2/25/42 (e)(f) | | 48,047 | 16,665 |
| Series 2003-W10 subordinate REMIC pass thru certificates, Class 2B3, 3.9885% 6/25/43 (e)(f) | | 82,688 | 33,697 |
|
| TOTAL U.S. GOVERNMENT AGENCY | | | 50,362 |
|
| TOTAL COLLATERALIZED MORTGAGE OBLIGATIONS | | | |
| (Cost $7,781,475) | | | 7,931,309 |
|
| Commercial Mortgage Securities - 16.7% | | | |
| Americold LLC Trust Series 2010-ARTA Class D, 7.443% 1/14/29 (e) | | 2,000,000 | 2,123,859 |
| BANK: | | | |
| Series 2017-BNK4 Class D, 3.357% 5/15/50 (e) | | 3,349,000 | 2,804,455 |
| Series 2018-BN12 Class D, 3% 5/15/61 (e) | | 1,701,000 | 1,376,760 |
| Barclays Commercial Mortgage Securities LLC Series 2015-STP: | | | |
| Class E, 4.2844% 9/10/28 (e)(f) | | 8,413,000 | 8,112,647 |
| Class F, 4.2844% 9/10/28 (e)(f) | | 4,074,000 | 3,801,660 |
| BX Trust: | | | |
| floater Series 2018-IND: | | | |
| Class G, 1 month U.S. LIBOR + 2.050% 4.5589% 11/15/35 (e)(f)(h) | | 1,685,485 | 1,670,690 |
| Class H, 1 month U.S. LIBOR + 3.000% 5.5089% 11/15/35 (e)(f)(h) | | 8,953,640 | 8,858,245 |
| Series 2017-IMC Class F, 1 month U.S. LIBOR + 4.250% 6.7589% 10/15/32 (e)(f)(h) | | 12,691,000 | 12,639,925 |
| CAMB Commercial Mortgage Trust floater Series 2019-LIFE Class G, 1 month U.S. LIBOR + 3.250% 5.75% 12/15/37 (e)(f)(h) | | 5,979,000 | 5,979,000 |
| CCRESG Commercial Mortgage Trust Series 2016-HEAT: | | | |
| Class E, 5.4883% 4/10/29 (e)(f) | | 4,536,000 | 4,559,459 |
| Class F, 5.4883% 4/10/29 (e)(f) | | 9,710,000 | 9,471,920 |
| CD Mortgage Trust Series 2017-CD3 Class D, 3.25% 2/10/50 (e) | | 3,391,000 | 2,843,039 |
| CGMS Commercial Mortgage Trust Series 2017-MDRB: | | | |
| Class D, 1 month U.S. LIBOR + 3.250% 5.7589% 7/15/30 (e)(f)(h) | | 6,200,000 | 6,190,164 |
| Class E, 1 month U.S. LIBOR + 3.872% 6.3804% 7/15/30 (e)(f)(h) | | 6,741,000 | 6,703,404 |
| Citigroup Commercial Mortgage Trust: | | | |
| Series 2013-GC15 Class D, 5.2167% 9/10/46 (e)(f) | | 5,254,000 | 5,241,722 |
| Series 2015-SHP2 Class E, 1 month U.S. LIBOR + 4.350% 6.8589% 7/15/27 (e)(f)(h) | | 2,933,000 | 2,929,676 |
| Series 2016-C3 Class D, 3% 11/15/49 (e) | | 7,089,000 | 5,657,850 |
| COMM Mortgage Trust: | | | |
| floater Series 2018-HCLV: | | | |
| Class F, 1 month U.S. LIBOR + 3.050% 5.5589% 9/15/33 (e)(f)(h) | | 4,265,000 | 4,227,077 |
| Class G, 1 month U.S. LIBOR + 5.056% 7.5652% 9/15/33 (e)(f)(h) | | 4,265,000 | 4,018,682 |
| sequential payer Series 2013-LC6 Class E, 3.5% 1/10/46 (e) | | 7,300,000 | 5,864,948 |
| Series 2012-CR1: | | | |
| Class C, 5.3207% 5/15/45 (f) | | 1,000,000 | 1,028,379 |
| Class D, 5.3207% 5/15/45 (e)(f) | | 5,550,000 | 5,553,977 |
| Class G, 2.462% 5/15/45 (e) | | 6,346,000 | 4,802,923 |
| Series 2012-CR5 Class D, 4.3202% 12/10/45 (e)(f) | | 2,000,000 | 1,978,976 |
| Series 2012-LC4: | | | |
| Class C, 5.5388% 12/10/44 (f) | | 2,000,000 | 2,068,879 |
| Class D, 5.5388% 12/10/44 (e)(f) | | 11,675,000 | 10,700,216 |
| Series 2013-CCRE6 Class E, 4.0838% 3/10/46 (e)(f) | | 882,000 | 758,973 |
| Series 2013-CR10 Class D, 4.7925% 8/10/46 (e)(f) | | 4,544,000 | 4,387,892 |
| Series 2013-CR12 Class D, 5.0858% 10/10/46 (e)(f) | | 4,500,000 | 3,987,365 |
| Series 2013-CR6 Class F, 4.0838% 3/10/46 (e)(f) | | 8,038,000 | 5,768,933 |
| Series 2013-LC6 Class D, 4.2632% 1/10/46 (e)(f) | | 8,301,000 | 8,118,229 |
| Series 2014-CR17 Class E, 4.8017% 5/10/47 (e)(f) | | 3,098,000 | 2,805,942 |
| Series 2014-UBS2 Class D, 5.002% 3/10/47 (e)(f) | | 3,713,000 | 3,338,022 |
| Series 2016-CD1 Class D, 2.7691% 8/10/49 (e)(f) | | 9,452,000 | 7,773,798 |
| Series 2017-CD4 Class D, 3.3% 5/10/50 (e) | | 2,800,000 | 2,344,346 |
| COMM Trust Series 2017-COR2 Class D, 3% 9/10/50 (e) | | 2,800,000 | 2,403,934 |
| Commercial Mortgage Trust pass-thru certificates Series 2012-CR2: | | | |
| Class D, 4.8315% 8/15/45 (e)(f) | | 4,500,000 | 4,441,137 |
| Class E, 4.8315% 8/15/45 (e)(f) | | 8,000,000 | 7,705,461 |
| Core Industrial Trust: | | | |
| Series 2015-TEXW Class F, 3.8487% 2/10/34 (e)(f) | | 13,083,000 | 12,829,378 |
| Series 2015-WEST Class F, 4.2268% 2/10/37 (e)(f) | | 12,745,000 | 12,234,206 |
| CSAIL Commercial Mortgage Trust: | | | |
| Series 2017-C8 Class D, 4.47% 6/15/50 (e) | | 4,346,000 | 3,876,696 |
| Series 2017-CX10 Class UESD, 4.2366% 10/15/32 (e)(f) | | 7,210,000 | 6,990,086 |
| Series 2017-CX9 Class D, 4.1572% 9/15/50 (e)(f) | | 2,568,000 | 2,297,367 |
| CSMC Trust Series 2016-MFF Class F, 1 month U.S. LIBOR + 7.250% 9.7589% 11/15/33 (e)(f)(h) | | 6,300,000 | 6,281,854 |
| DBCCRE Mortgage Trust Series 2014-ARCP: | | | |
| Class D, 4.9345% 1/10/34 (e)(f) | | 1,000,000 | 971,507 |
| Class E, 4.9345% 1/10/34 (e)(f) | | 10,853,000 | 10,204,211 |
| DBUBS Mortgage Trust: | | | |
| Series 2011-LC1A: | | | |
| Class E, 5.6982% 11/10/46 (e)(f) | | 14,031,000 | 14,417,160 |
| Class G, 4.652% 11/10/46 (e) | | 12,360,000 | 11,327,536 |
| Series 2011-LC3A Class D, 5.3379% 8/10/44 (e)(f) | | 3,945,000 | 4,070,229 |
| Freddie Mac: | | | |
| pass-thru certificates: | | | |
| Series K011 Class X3, 2.5726% 12/25/43 (f)(g) | | 12,206,096 | 555,729 |
| Series K012 Class X3, 2.2521% 1/25/41 (f)(g) | | 20,724,835 | 864,070 |
| Series K013 Class X3, 2.8142% 1/25/43 (f)(g) | | 14,360,000 | 759,110 |
| Series KAIV Class X2, 3.6147% 6/25/41 (f)(g) | | 7,430,000 | 566,725 |
| GAHR Commercial Mortgage Trust Series 2015-NRF: | | | |
| Class EFX, 3.3822% 12/15/34 (e)(f) | | 4,364,000 | 4,297,841 |
| Class FFX, 3.3822% 12/15/34 (e)(f) | | 14,402,000 | 14,092,201 |
| Class GFX, 3.3822% 12/15/34 (e)(f) | | 24,194,000 | 23,640,052 |
| GPMT Ltd. floater Series 2018-FL1 Class D, 1 month U.S. LIBOR + 2.950% 5.453% 11/21/35 (e)(f)(h) | | 2,500,000 | 2,479,760 |
| GS Mortgage Securities Trust: | | | |
| floater Series 2018-RIVR Class G, 1 month U.S. LIBOR + 2.600% 5.1089% 7/15/35 (e)(f)(h) | | 3,808,000 | 3,679,292 |
| Series 2010-C2 Class D, 5.1812% 12/10/43 (e)(f) | | 3,000,000 | 3,081,004 |
| Series 2011-GC5: | | | |
| Class C, 5.3909% 8/10/44 (e)(f) | | 9,000,000 | 9,116,233 |
| Class D, 5.3909% 8/10/44 (e)(f) | | 9,559,000 | 9,406,523 |
| Class E, 5.3909% 8/10/44 (e)(f) | | 8,230,000 | 7,162,302 |
| Class F, 4.5% 8/10/44 (e) | | 7,986,000 | 4,743,884 |
| Series 2012-GC6: | | | |
| Class C, 5.6517% 1/10/45 (e)(f) | | 3,600,000 | 3,739,019 |
| Class D, 5.6517% 1/10/45 (e)(f) | | 6,665,000 | 6,647,056 |
| Class E, 5% 1/10/45 (e)(f) | | 4,516,000 | 4,004,271 |
| Series 2012-GCJ7: | | | |
| Class C, 5.7033% 5/10/45 (f) | | 6,500,000 | 6,729,063 |
| Class D, 5.7033% 5/10/45 (e)(f) | | 10,192,000 | 9,681,407 |
| Class E, 5% 5/10/45 (e) | | 3,837,320 | 2,615,122 |
| Series 2012-GCJ9: | | | |
| Class D, 4.7465% 11/10/45 (e)(f) | | 5,565,000 | 5,530,233 |
| Class E, 4.7465% 11/10/45 (e)(f) | | 1,930,000 | 1,764,360 |
| Series 2013-GC14 Class D, 4.7498% 8/10/46 (e)(f) | | 1,680,000 | 1,615,724 |
| Series 2013-GC16: | | | |
| Class D, 5.3106% 11/10/46 (e)(f) | | 3,750,000 | 3,808,354 |
| Class F, 3.5% 11/10/46 (e) | | 7,303,000 | 5,450,113 |
| Series 2016-GS3 Class D, 2.62% 10/10/49 (e) | | 3,398,000 | 2,657,716 |
| Series 2016-REMZ Class MZB, 7.727% 2/10/21 (e) | | 29,826,000 | 29,852,429 |
| Series 2016-RENT: | | | |
| Class E, 4.0667% 2/10/29 (e)(f) | | 4,340,000 | 4,270,961 |
| Class F, 4.0667% 2/10/29 (e)(f) | | 15,890,000 | 15,354,871 |
| Hilton U.S.A. Trust: | | | |
| Series 2016-HHV Class F, 4.1935% 11/5/38 (e)(f) | | 8,440,000 | 7,719,459 |
| Series 2016-SFP Class F, 6.1552% 11/5/35 (e) | | 8,707,000 | 8,905,116 |
| IMT Trust Series 2017-APTS: | | | |
| Class EFX, 3.4966% 6/15/34 (e)(f) | | 9,317,000 | 8,716,807 |
| Class FFL, 1 month U.S. LIBOR + 2.850% 5.3589% 6/15/34 (e)(f)(h) | | 3,909,000 | 3,860,578 |
| Independence Plaza Trust Series 2018-INDP Class E, 4.996% 7/10/35 (e) | | 2,896,000 | 2,898,544 |
| Invitation Homes Trust floater: | | | |
| Series 2018-SFR3 Class F, 1 month U.S. LIBOR + 2.250% 4.7575% 7/17/37 (e)(f)(h) | | 8,405,000 | 8,287,494 |
| Series 2018-SFR4 Class F, 1 month U.S. LIBOR + 2.200% 4.7075% 1/17/38 (e)(f)(h) | | 3,410,000 | 3,339,337 |
| JP Morgan Chase Commercial Mortgage Securities Trust floater Series 2018-LAQ Class E, 1 month U.S. LIBOR + 3.000% 5.5089% 6/15/35 (e)(f)(h) | | 1,680,000 | 1,665,576 |
| JPMBB Commercial Mortgage Securities Trust: | | | |
| Series 2014-C23 Class UH5, 4.7094% 9/15/47 (e) | | 8,738,000 | 7,312,282 |
| Series 2014-C26 Class D, 3.9215% 1/15/48 (e)(f) | | 3,398,000 | 3,065,309 |
| JPMCC Commercial Mortgage Securities Trust Series 2016-JP4 Class D, 3.4424% 12/15/49 (e)(f) | | 10,241,000 | 8,614,399 |
| JPMDB Commercial Mortgage Securities Trust: | | | |
| Series 2016-C4 Class D, 3.0933% 12/15/49 (e)(f) | | 7,388,000 | 6,019,621 |
| Series 2018-C8 Class D, 3.2455% 6/15/51 (e)(f) | | 1,698,000 | 1,406,752 |
| JPMorgan Chase Commercial Mortgage Securities Corp. Series 2012-CBX: | | | |
| Class C, 5.1909% 6/15/45 (f) | | 4,530,000 | 4,618,976 |
| Class E, 5.1909% 6/15/45 (e)(f) | | 5,640,000 | 5,259,593 |
| Class F, 4% 6/15/45 (e) | | 8,192,000 | 6,542,147 |
| Class G 4% 6/15/45 (e) | | 4,044,000 | 2,196,170 |
| JPMorgan Chase Commercial Mortgage Securities Trust: | | | |
| Series 2011-C3: | | | |
| Class E, 5.6604% 2/15/46 (e)(f) | | 13,930,000 | 13,745,943 |
| Class G, 4.409% 2/15/46 (e)(f) | | 4,671,000 | 3,961,803 |
| Class H, 4.409% 2/15/46 (e)(f) | | 7,077,000 | 5,472,120 |
| Series 2011-C4 Class F, 3.873% 7/15/46 (e) | | 1,400,000 | 1,379,744 |
| Series 2013-LC11: | | | |
| Class C, 3.9582% 4/15/46 (f) | | 848,000 | 839,103 |
| Class D, 4.1687% 4/15/46 (f) | | 7,672,000 | 6,617,885 |
| Class E, 3.25% 4/15/46 (e)(f) | | 472,000 | 346,047 |
| Class F, 3.25% 4/15/46 (e)(f) | | 2,518,000 | 1,566,445 |
| Series 2014-DSTY Class E, 3.8046% 6/10/27 (e)(f) | | 8,161,000 | 2,528,024 |
| Series 2015-UES Class F, 3.621% 9/5/32 (e)(f) | | 6,896,000 | 6,700,138 |
| Series 2018-AON Class F, 4.6132% 7/5/31 (e) | | 5,096,000 | 4,907,662 |
| JPMorgan Commercial Mortgage Finance Corp. Series 1999-C8 Class H, 6% 7/15/31 (e) | | 60,862 | 59,883 |
| Kref Ltd. floater Series 2018-FL1 Class D, 1 month U.S. LIBOR + 2.550% 5.0589% 6/15/36 (e)(f)(h) | | 2,560,000 | 2,525,737 |
| LSTAR Commercial Mortgage Trust Series 2014-2: | | | |
| Class D, 5.5939% 1/20/41 (e)(f) | | 3,000,000 | 2,985,332 |
| Class E, 5.5939% 1/20/41 (e)(f) | | 4,800,000 | 4,501,920 |
| Merrill Lynch Mortgage Trust Series 2006-C1 Class AJ, 5.6763% 5/12/39 (f) | | 2,010,358 | 2,019,798 |
| Morgan Stanley BAML Trust: | | | |
| Series 2012-C5 Class E, 4.6854% 8/15/45 (e)(f) | | 3,889,000 | 3,889,533 |
| Series 2012-C6 Class D, 4.6103% 11/15/45 (e)(f) | | 2,000,000 | 2,023,467 |
| Series 2013-C12 Class D, 4.766% 10/15/46 (e)(f) | | 7,164,000 | 6,982,334 |
| Series 2013-C13: | | | |
| Class D, 4.9091% 11/15/46 (e)(f) | | 5,277,000 | 5,306,882 |
| Class E, 4.9091% 11/15/46 (e)(f) | | 3,379,000 | 2,943,215 |
| Series 2013-C7: | | | |
| Class D, 4.2233% 2/15/46 (e)(f) | | 5,650,000 | 5,180,893 |
| Class E, 4.2233% 2/15/46 (e)(f) | | 1,000,000 | 804,985 |
| Series 2013-C9: | | | |
| Class C, 4.0379% 5/15/46 (f) | | 3,339,000 | 3,310,727 |
| Class D, 4.1259% 5/15/46 (e)(f) | | 5,137,000 | 4,851,464 |
| Series 2016-C30 Class D, 3% 9/15/49 (e) | | 5,408,000 | 4,450,255 |
| Series 2016-C31 Class D, 3% 11/15/49 (e)(f) | | 1,500,000 | 1,183,445 |
| Series 2016-C32 Class D, 3.396% 12/15/49 (e) | | 5,929,000 | 4,927,566 |
| Morgan Stanley Capital I Trust: | | | |
| Series 1998-CF1 Class G, 7.35% 7/15/32 (e) | | 389,832 | 337,612 |
| Series 2011-C2: | | | |
| Class D, 5.4847% 6/15/44 (e)(f) | | 5,387,000 | 5,411,099 |
| Class E, 5.4847% 6/15/44 (e)(f) | | 12,150,000 | 11,757,777 |
| Class F, 5.4847% 6/15/44 (e)(f) | | 4,440,000 | 3,841,655 |
| Class XB, 0.5352% 6/15/44 (e)(f)(g) | | 63,708,222 | 742,774 |
| Series 2011-C3: | | | |
| Class D, 5.1539% 7/15/49 (e)(f) | | 7,400,000 | 7,616,831 |
| Class E, 5.1539% 7/15/49 (e)(f) | | 3,495,000 | 3,479,430 |
| Class F, 5.1539% 7/15/49 (e)(f) | | 5,688,050 | 5,587,323 |
| Class G, 5.1539% 7/15/49 (e)(f) | | 4,985,000 | 4,449,397 |
| Series 2012-C4 Class D, 5.4199% 3/15/45 (e)(f) | | 6,310,000 | 6,078,145 |
| Series 2015-MS1 Class D, 4.0306% 5/15/48 (e)(f) | | 10,956,000 | 9,992,701 |
| Series 2015-UBS8 Class D, 3.18% 12/15/48 (e) | | 5,013,000 | 4,188,747 |
| Series 2016-BNK2 Class C, 3% 11/15/49 (e) | | 3,000,000 | 2,491,828 |
| Motel 6 Trust floater: | | | |
| Series 2017-M6MZ, Class M, 1 month U.S. LIBOR + 6.927% 9.4354% 8/15/19 (e)(f)(h) | | 7,510,773 | 7,582,074 |
| Series 2017-MTL6, Class F, 1 month U.S. LIBOR + 4.250% 6.7589% 8/15/34 (e)(f)(h) | | 12,868,114 | 12,851,882 |
| MSCCG Trust floater Series 2018-SELF Class E, 1 month U.S. LIBOR + 2.150% 4.6589% 10/15/37 (e)(f)(h) | | 5,118,000 | 5,047,455 |
| MSCG Trust Series 2016-SNR: | | | |
| Class D, 6.55% 11/15/34 (e) | | 10,105,650 | 10,135,082 |
| Class E, 6.8087% 11/15/34 (e) | | 9,659,400 | 9,266,683 |
| MSJP Commercial Securities Mortgage Trust Series 2015-HAUL Class E, 4.851% 9/5/47 (e)(f) | | 1,500,000 | 1,413,156 |
| Natixis Commercial Mortgage Securities Trust floater Series 2018-FL1: | | | |
| Class WAN1, 1 month U.S. LIBOR + 2.750% 5.206% 6/15/35 (e)(f)(h) | | 1,743,000 | 1,739,730 |
| Class WAN2, 1 month U.S. LIBOR + 3.750% 6.206% 6/15/35 (e)(f)(h) | | 651,000 | 644,240 |
| Providence Place Group Ltd. Partnership Series 2000-C1 Class A2, 7.75% 7/20/28 (e) | | 4,042,488 | 4,720,294 |
| TIAA Seasoned Commercial Mortgage Trust sequential payer Series 2007-C4 Class AJ, 5.4816% 8/15/39 (f) | | 104,488 | 104,642 |
| UBS Commercial Mortgage Trust Series 2012-C1: | | | |
| Class D, 5.5437% 5/10/45 (e)(f) | | 3,235,000 | 3,209,267 |
| Class E, 5% 5/10/45 (e)(f) | | 6,339,000 | 5,641,179 |
| Class F, 5% 5/10/45 (e)(f) | | 2,221,350 | 1,642,667 |
| UBS-Citigroup Commercial Mortgage Trust Series 2011-C1 Class B, 6.0506% 1/10/45 (e)(f) | | 3,000,000 | 3,195,351 |
| Wells Fargo Commercial Mortgage Trust: | | | |
| Series 2012-LC5: | | | |
| Class D, 4.7627% 10/15/45 (e)(f) | | 12,964,000 | 12,826,758 |
| Class E, 4.7627% 10/15/45 (e)(f) | | 8,441,000 | 8,265,989 |
| Series 2016-BNK1 Class D, 3% 8/15/49 (e) | | 6,979,000 | 5,776,278 |
| Series 2016-C35 Class D, 3.142% 7/15/48 (e) | | 18,542,000 | 15,193,953 |
| Series 2016-NXS6 Class D, 3.059% 11/15/49 (e) | | 5,094,000 | 4,193,245 |
| Series 2017-C38 Class D, 3% 7/15/50 (e)(f) | | 4,373,000 | 3,504,500 |
| WF-RBS Commercial Mortgage Trust: | | | |
| sequential payer Series 2011-C4I Class G, 5% 6/15/44 | | 4,000,000 | 2,491,760 |
| Series 2011-C3: | | | |
| Class C, 5.335% 3/15/44 (e) | | 4,900,000 | 5,005,867 |
| Class D, 5.6828% 3/15/44 (e)(f) | | 1,000,000 | 892,631 |
| Class E, 5% 3/15/44 (e) | | 3,000,000 | 1,597,139 |
| Series 2011-C5: | | | |
| Class E, 5.6723% 11/15/44 (e)(f) | | 3,807,000 | 3,830,772 |
| Class F, 5.25% 11/15/44 (e)(f) | | 3,000,000 | 2,699,978 |
| Class G, 5.25% 11/15/44 (e)(f) | | 2,000,000 | 1,695,464 |
| Series 2012-C7: | | | |
| Class D, 4.821% 6/15/45 (e)(f) | | 2,380,000 | 2,196,068 |
| Class F, 4.5% 6/15/45 (e) | | 2,000,000 | 1,309,320 |
| Series 2012-C8 Class E, 4.8925% 8/15/45 (e)(f) | | 2,922,500 | 2,855,693 |
| Series 2013-C11: | | | |
| Class D, 4.2653% 3/15/45 (e)(f) | | 5,830,000 | 5,628,223 |
| Class E, 4.2653% 3/15/45 (e)(f) | | 4,780,000 | 4,250,421 |
| Series 2013-C13 Class D, 4.1327% 5/15/45 (e)(f) | | 4,000,000 | 3,820,581 |
| Series 2013-C16 Class D, 5.0374% 9/15/46 (e)(f) | | 3,728,000 | 3,516,512 |
| Series 2013-UBS1 Class D, 4.742% 3/15/46 (e)(f) | | 4,589,000 | 4,479,067 |
| WFCG Commercial Mortgage Trust floater Series 2015-BXRP: | | | |
| Class F, 1 month U.S. LIBOR + 3.720% 6.2292% 11/15/29 (e)(f)(h) | | 5,152,378 | 5,121,169 |
| Class G, 1 month U.S. LIBOR + 3.020% 5.5289% 11/15/29 (e)(f)(h) | | 8,859,793 | 8,737,456 |
| WP Glimcher Mall Trust Series 2015-WPG: | | | |
| Class PR1, 3.516% 6/5/35 (e)(f) | | 6,725,000 | 5,446,514 |
| Class PR2, 3.516% 6/5/35 (e)(f) | | 2,541,000 | 1,907,381 |
| TOTAL COMMERCIAL MORTGAGE SECURITIES | | | |
| (Cost $882,191,325) | | | 905,560,489 |
|
| Bank Loan Obligations - 4.7% | | | |
| COMMUNICATION SERVICES - 0.2% | | | |
| Wireless Telecommunication Services - 0.2% | | | |
| SBA Senior Finance II, LLC Tranche B, term loan 3 month U.S. LIBOR + 2.000% 4.5% 4/11/25 (f)(h) | | 13,600,927 | 13,340,197 |
| CONSUMER DISCRETIONARY - 0.9% | | | |
| Hotels, Restaurants & Leisure - 0.7% | | | |
| Caesars Resort Collection LLC Tranche B 1LN, term loan 3 month U.S. LIBOR + 2.750% 5.2489% 12/22/24 (f)(h) | | 5,051,893 | 4,976,771 |
| ESH Hospitality, Inc. Tranche B, term loan 3 month U.S. LIBOR + 2.000% 4.4989% 8/30/23 (f)(h) | | 13,434,720 | 13,176,102 |
| LTF Merger Sub, Inc. Tranche B, term loan 3 month U.S. LIBOR + 2.750% 5.4566% 6/10/22 (f)(h) | | 4,240,779 | 4,173,393 |
| Marriott Ownership Resorts, Inc. Tranche B, term loan 3 month U.S. LIBOR + 2.250% 4.7489% 8/31/25 (f)(h) | | 4,055,000 | 4,022,073 |
| Playa Resorts Holding BV Tranche B, term loan 3 month U.S. LIBOR + 2.750% 5.25% 4/27/24 (f)(h) | | 6,268,988 | 6,041,737 |
| Wyndham Destinations, Inc. Tranche B, term loan 3 month U.S. LIBOR + 2.250% 4.7489% 5/31/25 (f)(h) | | 6,310,210 | 6,223,444 |
| Wyndham Hotels & Resorts, Inc. Tranche B, term loan 3 month U.S. LIBOR + 1.750% 4.2489% 5/30/25 (f)(h) | | 997,500 | 979,864 |
| | | | 39,593,384 |
| Multiline Retail - 0.2% | | | |
| JC Penney Corp., Inc. Tranche B, term loan 3 month U.S. LIBOR + 4.250% 6.956% 6/23/23 (f)(h) | | 12,197,961 | 10,535,989 |
|
| TOTAL CONSUMER DISCRETIONARY | | | 50,129,373 |
|
| CONSUMER STAPLES - 0.5% | | | |
| Food & Staples Retailing - 0.5% | | | |
| Albertson's LLC Tranche B, term loan: | | | |
| 3 month U.S. LIBOR + 3.000% 5.6912% 6/22/23 (f)(h) | | 17,062,641 | 16,785,373 |
| 3 month U.S. LIBOR + 3.000% 5.8216% 12/21/22 (f)(h) | | 11,441,528 | 11,272,765 |
| | | | 28,058,138 |
| ENERGY - 0.6% | | | |
| Energy Equipment & Services - 0.1% | | | |
| Kestrel Acquisition LLC Tranche B, term loan 3 month U.S. LIBOR + 4.250% 6.75% 6/1/25 (f)(h) | | 5,973,741 | 5,914,003 |
| Oil, Gas & Consumable Fuels - 0.5% | | | |
| Moxie Patriot LLC Tranche B, term loan 3 month U.S. LIBOR + 5.750% 8.553% 12/19/20 (f)(h) | | 21,852,376 | 21,324,204 |
| TPF II Power LLC Tranche B, term loan 3 month U.S. LIBOR + 3.750% 6.2489% 10/2/23 (f)(h) | | 5,254,768 | 5,118,459 |
| | | | 26,442,663 |
|
| TOTAL ENERGY | | | 32,356,666 |
|
| FINANCIALS - 0.3% | | | |
| Diversified Financial Services - 0.2% | | | |
| Veritas-B Junior Mezz C LLC 10.48% 2/6/21 (d)(f) | | 9,171,000 | 9,548,845 |
| Real Estate Management & Development - 0.0% | | | |
| MGM Growth Properties Operating Partner LP Tranche B, term loan 3 month U.S. LIBOR + 2.000% 4.4139% 3/23/25 (f)(h) | | 2,560,000 | 2,517,197 |
| Thrifts & Mortgage Finance - 0.1% | | | |
| Ocwen Loan Servicing LLC Tranche B, term loan 3 month U.S. LIBOR + 5.000% 7.519% 12/5/20 (f)(h) | | 3,180,932 | 3,133,218 |
|
| TOTAL FINANCIALS | | | 15,199,260 |
|
| HEALTH CARE - 0.1% | | | |
| Health Care Providers & Services - 0.1% | | | |
| Community Health Systems, Inc. Tranche H, term loan 3 month U.S. LIBOR + 3.250% 5.9566% 1/27/21 (f)(h) | | 6,701,760 | 6,583,072 |
| INDUSTRIALS - 0.1% | | | |
| Commercial Services & Supplies - 0.1% | | | |
| Lineage Logistics Holdings, LLC. Tranche B, term loan 3 month U.S. LIBOR + 3.000% 5.4989% 2/27/25 (f)(h) | | 4,530,856 | 4,406,258 |
| INFORMATION TECHNOLOGY - 0.1% | | | |
| Electronic Equipment & Components - 0.1% | | | |
| Compass Power Generation LLC Tranche B 1LN, term loan 3 month U.S. LIBOR + 3.500% 5.9989% 12/20/24 (f)(h) | | 3,276,330 | 3,262,668 |
| REAL ESTATE - 1.3% | | | |
| Equity Real Estate Investment Trusts (REITs) - 0.6% | | | |
| Invitation Homes Operating Par Tranche B, term loan 3 month U.S. LIBOR + 1.700% 4.219% 2/6/22 (d)(f)(h) | | 15,000,000 | 14,550,000 |
| iStar Financial, Inc. Tranche B 1LN, term loan 3 month U.S. LIBOR + 2.750% 5.2579% 6/28/23 (f)(h) | | 12,541,975 | 12,400,878 |
| The GEO Group, Inc. Tranche B 1LN, term loan 3 month U.S. LIBOR + 2.000% 4.5% 3/23/24 (f)(h) | | 2,977,273 | 2,892,599 |
| | | | 29,843,477 |
| Real Estate Management & Development - 0.7% | | | |
| Capital Automotive LP Tranche B 1LN, term loan 3 month U.S. LIBOR + 2.500% 5% 3/24/24 (f)(h) | | 3,080,736 | 2,992,164 |
| DTZ U.S. Borrower LLC Tranche B, term loan 3 month U.S. LIBOR + 3.250% 5.7489% 8/21/25 (f)(h) | | 25,425,550 | 24,910,683 |
| Realogy Group LLC Tranche B, term loan 3 month U.S. LIBOR + 2.250% 4.7575% 2/8/25 (f)(h) | | 3,979,900 | 3,870,452 |
| VICI Properties, LLC Tranche B 1LN, term loan 3 month U.S. LIBOR + 2.000% 4.503% 12/22/24 (f)(h) | | 8,515,000 | 8,352,704 |
| | | | 40,126,003 |
|
| TOTAL REAL ESTATE | | | 69,969,480 |
|
| UTILITIES - 0.6% | | | |
| Electric Utilities - 0.2% | | | |
| Lightstone Holdco LLC: | | | |
| Tranche B 1LN, term loan 3 month U.S. LIBOR + 3.750% 6.2489% 1/30/24 (f)(h) | | 10,605,449 | 10,185,686 |
| Tranche C 1LN, term loan 3 month U.S. LIBOR + 3.750% 6.2489% 1/30/24 (f)(h) | | 584,685 | 561,543 |
| Southeast Powergen LLC Tranche B, term loan 3 month U.S. LIBOR + 3.500% 6% 12/2/21 (f)(h) | | 1,288,564 | 1,232,730 |
| | | | 11,979,959 |
| Independent Power and Renewable Electricity Producers - 0.4% | | | |
| APLP Holdings LP Tranche B, term loan 3 month U.S. LIBOR + 2.750% 5.2489% 4/13/23 (f)(h) | | 7,637,426 | 7,580,145 |
| MRP Generation Holdings LLC Tranche B, term loan 3 month U.S. LIBOR + 7.000% 9.803% 10/18/22 (f)(h) | | 14,409,844 | 13,797,426 |
| | | | 21,377,571 |
|
| TOTAL UTILITIES | | | 33,357,530 |
|
| TOTAL BANK LOAN OBLIGATIONS | | | |
| (Cost $261,064,410) | | | 256,662,642 |
|
| Preferred Securities - 0.0% | | | |
| FINANCIALS - 0.0% | | | |
| Diversified Financial Services - 0.0% | | | |
| Crest Dartmouth Street 2003-1 Ltd. Series 2003-1A Class PS, (d)(e) | | 1,220,000 | 122 |
| Thrifts & Mortgage Finance - 0.0% | | | |
| Crest Clarendon Street 2002-1 Ltd. Series 2002-1A Class PS, 12/28/35 (d)(e) | | 500,000 | 27,989 |
| TOTAL PREFERRED SECURITIES | | | |
| (Cost $1,297,768) | | | 28,111 |
| | | Shares | Value |
|
| Money Market Funds - 7.1% | | | |
| Fidelity Cash Central Fund, 2.43% (i) | | 373,119,969 | 373,194,593 |
| Fidelity Securities Lending Cash Central Fund 2.43% (i)(j) | | 11,172,776 | 11,173,894 |
| TOTAL MONEY MARKET FUNDS | | | |
| (Cost $384,311,769) | | | 384,368,487 |
| TOTAL INVESTMENT IN SECURITIES - 100.0% | | | |
| (Cost $5,150,787,854) | | | 5,422,331,397 |
| NET OTHER ASSETS (LIABILITIES) - 0.0% | | | 1,157,375 |
| NET ASSETS - 100% | | | $5,423,488,772 |
Legend
(a) Affiliated company
(b) Security or a portion of the security is on loan at period end.
(c) Non-income producing
(d) Level 3 security
(e) Security exempt from registration under Rule 144A of the Securities Act of 1933. These securities may be resold in transactions exempt from registration, normally to qualified institutional buyers. At the end of the period, the value of these securities amounted to $1,222,594,798 or 22.5% of net assets.
(f) Coupon rates for floating and adjustable rate securities reflect the rates in effect at period end.
(g) Security represents right to receive monthly interest payments on an underlying pool of mortgages or assets. Principal shown is the outstanding par amount of the pool as of the end of the period.
(h) Coupon is indexed to a floating interest rate which may be multiplied by a specified factor and/or subject to caps or floors.
(i) Affiliated fund that is generally available only to investment companies and other accounts managed by Fidelity Investments. The rate quoted is the annualized seven-day yield of the fund at period end. A complete unaudited listing of the fund's holdings as of its most recent quarter end is available upon request. In addition, each Fidelity Central Fund's financial statements are available on the SEC's website or upon request.
(j) Investment made with cash collateral received from securities on loan.
Affiliated Central Funds
Information regarding fiscal year to date income earned by the Fund from investments in Fidelity Central Funds is as follows:
| Fund | Income earned |
| Fidelity Cash Central Fund | $3,757,554 |
| Fidelity Securities Lending Cash Central Fund | 63,890 |
| Total | $3,821,444 |
Amounts in the income column in the above table include any capital gain distributions from underlying funds, which are presented in the corresponding line-item in the Statement of Operations, if applicable.
Other Affiliated Issuers
An affiliated company is a company in which the Fund has ownership of at least 5% of the voting securities. Fiscal year to date transactions with companies which are or were affiliates are as follows:
| Affiliate | Value, beginning of period | Purchases | Sales Proceeds | Dividend Income | Realized Gain (loss) | Change in Unrealized appreciation (depreciation) | Value, end of period |
| Acadia Realty Trust (SBI) | $118,210,943 | $-- | $10,619,522 | $2,307,308 | $(1,547,593) | $8,568,876 | $-- |
| Ellington Financial LLC | 26,952,776 | -- | -- | 1,341,097 | -- | 98,129 | 27,050,905 |
| Great Ajax Corp. | 21,094,678 | -- | -- | 926,081 | -- | (594,751) | 20,368,907 |
| Great Ajax Corp. 7.25% | 6,982,400 | 1,999,890 | -- | 291,359 | -- | (200,170) | 8,782,120 |
| Total | $173,240,797 | $1,999,890 | $10,619,522 | $4,865,845 | $(1,547,593) | $7,872,084 | $56,201,932 |
Investment Valuation
The following is a summary of the inputs used, as of January 31, 2019, involving the Fund's assets and liabilities carried at fair value. The inputs or methodology used for valuing securities may not be an indication of the risk associated with investing in those securities. For more information on valuation inputs, and their aggregation into the levels used below, please refer to the Investment Valuation section in the accompanying Notes to Financial Statements.
| | Valuation Inputs at Reporting Date: |
| Description | Total | Level 1 | Level 2 | Level 3 |
| Investments in Securities: | | | | |
| Equities: | | | | |
| Consumer Discretionary | $19,881,666 | $19,881,666 | $-- | $-- |
| Energy | 3,732,750 | 3,732,750 | -- | -- |
| Financials | 767,044,677 | 747,886,049 | 19,158,628 | -- |
| Real Estate | 1,904,068,796 | 1,842,480,024 | 55,909,734 | 5,679,038 |
| Utilities | 3,160,645 | 3,160,645 | -- | -- |
| Corporate Bonds | 1,047,159,372 | -- | 1,047,159,372 | -- |
| Asset-Backed Securities | 122,732,453 | -- | 122,482,931 | 249,522 |
| Collateralized Mortgage Obligations | 7,931,309 | -- | 7,931,309 | -- |
| Commercial Mortgage Securities | 905,560,489 | -- | 905,560,489 | -- |
| Bank Loan Obligations | 256,662,642 | -- | 232,563,797 | 24,098,845 |
| Preferred Securities | 28,111 | -- | -- | 28,111 |
| Money Market Funds | 384,368,487 | 384,368,487 | -- | -- |
| Total Investments in Securities: | $5,422,331,397 | $3,001,509,621 | $2,390,766,260 | $30,055,516 |
Other Information
The composition of credit quality ratings as a percentage of Total Net Assets is as follows (Unaudited):
| U.S. Government and U.S. Government Agency Obligations | 0.1% |
| AAA,AA,A | 1.1% |
| BBB | 8.7% |
| BB | 10.5% |
| B | 10.3% |
| CCC,CC,C | 0.9% |
| Not Rated | 11.6% |
| Equities | 49.7% |
| Short-Term Investments and Net Other Assets | 7.1% |
| | 100.0% |
We have used ratings from Moody's Investors Service, Inc. Where Moody's® ratings are not available, we have used S&P® ratings. All ratings are as of the date indicated and do not reflect subsequent changes.
See accompanying notes which are an integral part of the financial statements.
Financial Statements
Statement of Assets and Liabilities
| | | January 31, 2019 (Unaudited) |
| Assets | | |
Investment in securities, at value (including securities loaned of $10,760,027) — See accompanying schedule:
Unaffiliated issuers (cost $4,700,980,451) | $4,981,760,978 | |
| Fidelity Central Funds (cost $384,311,769) | 384,368,487 | |
| Other affiliated issuers (cost $65,495,633) | 56,201,932 | |
| Total Investment in Securities (cost $5,150,787,853) | | $5,422,331,397 |
| Cash | | 507,575 |
| Receivable for investments sold | | 13,593,004 |
| Receivable for fund shares sold | | 15,537,409 |
| Dividends receivable | | 2,401,727 |
| Interest receivable | | 22,287,237 |
| Distributions receivable from Fidelity Central Funds | | 664,541 |
| Prepaid expenses | | 6,058 |
| Other receivables | | 21,884 |
| Total assets | | 5,477,350,832 |
| Liabilities | | |
| Payable for investments purchased | $28,223,285 | |
| Payable for fund shares redeemed | 10,917,090 | |
| Accrued management fee | 2,354,886 | |
| Distribution and service plan fees payable | 245,372 | |
| Other affiliated payables | 883,901 | |
| Other payables and accrued expenses | 67,189 | |
| Collateral on securities loaned | 11,170,337 | |
| Total liabilities | | 53,862,060 |
| Net Assets | | $5,423,488,772 |
| Net Assets consist of: | | |
| Paid in capital | | $5,137,793,219 |
| Total distributable earnings (loss) | | 285,695,553 |
| Net Assets | | $5,423,488,772 |
| Net Asset Value and Maximum Offering Price | | |
| Class A: | | |
| Net Asset Value and redemption price per share ($282,962,007 ÷ 24,028,989 shares) | | $11.78 |
| Maximum offering price per share (100/96.00 of $11.78) | | $12.27 |
| Class M: | | |
| Net Asset Value and redemption price per share ($55,324,153 ÷ 4,696,471 shares) | | $11.78 |
| Maximum offering price per share (100/96.00 of $11.78) | | $12.27 |
| Class C: | | |
| Net Asset Value and offering price per share ($218,099,977 ÷ 18,723,491 shares)(a) | | $11.65 |
| Real Estate Income: | | |
| Net Asset Value, offering price and redemption price per share ($2,586,400,952 ÷ 218,489,237 shares) | | $11.84 |
| Class I: | | |
| Net Asset Value, offering price and redemption price per share ($2,128,658,845 ÷ 180,475,208 shares) | | $11.79 |
| Class Z: | | |
| Net Asset Value, offering price and redemption price per share ($152,042,838 ÷ 12,892,617 shares) | | $11.79 |
(a) Redemption price per share is equal to net asset value less any applicable contingent deferred sales charge.
See accompanying notes which are an integral part of the financial statements.
Statement of Operations
| | | Six months ended January 31, 2019 (Unaudited) |
| Investment Income | | |
| Dividends (including $4,865,845 earned from other affiliated issuers) | | $63,428,296 |
| Interest | | 67,382,663 |
| Income from Fidelity Central Funds | | 3,821,444 |
| Total income | | 134,632,403 |
| Expenses | | |
| Management fee | $14,200,961 | |
| Transfer agent fees | 4,691,869 | |
| Distribution and service plan fees | 1,523,682 | |
| Accounting and security lending fees | 689,941 | |
| Custodian fees and expenses | 30,498 | |
| Independent trustees' fees and expenses | 16,728 | |
| Registration fees | 102,450 | |
| Audit | 51,974 | |
| Legal | 12,319 | |
| Miscellaneous | 14,634 | |
| Total expenses before reductions | 21,335,056 | |
| Expense reductions | (64,361) | |
| Total expenses after reductions | | 21,270,695 |
| Net investment income (loss) | | 113,361,708 |
| Realized and Unrealized Gain (Loss) | | |
| Net realized gain (loss) on: | | |
| Investment securities: | | |
| Unaffiliated issuers | 33,961,448 | |
| Fidelity Central Funds | 357 | |
| Other affiliated issuers | (1,547,593) | |
| Foreign currency transactions | (2,548) | |
| Total net realized gain (loss) | | 32,411,664 |
| Change in net unrealized appreciation (depreciation) on: | | |
| Investment securities: | | |
| Unaffiliated issuers | 9,831,611 | |
| Fidelity Central Funds | 1,049 | |
| Other affiliated issuers | 7,872,084 | |
| Assets and liabilities in foreign currencies | (129) | |
| Total change in net unrealized appreciation (depreciation) | | 17,704,615 |
| Net gain (loss) | | 50,116,279 |
| Net increase (decrease) in net assets resulting from operations | | $163,477,987 |
See accompanying notes which are an integral part of the financial statements.
Statement of Changes in Net Assets
| | Six months ended January 31, 2019 (Unaudited) | Year ended July 31, 2018 |
| Increase (Decrease) in Net Assets | | |
| Operations | | |
| Net investment income (loss) | $113,361,708 | $218,764,196 |
| Net realized gain (loss) | 32,411,664 | 114,217,439 |
| Change in net unrealized appreciation (depreciation) | 17,704,615 | (223,088,895) |
| Net increase (decrease) in net assets resulting from operations | 163,477,987 | 109,892,740 |
| Distributions to shareholders | (257,146,017) | – |
| Distributions to shareholders from net investment income | – | (209,651,623) |
| Distributions to shareholders from net realized gain | – | (58,110,159) |
| Total distributions | (257,146,017) | (267,761,782) |
| Share transactions - net increase (decrease) | 263,145,081 | 122,424,204 |
| Redemption fees | – | 106,734 |
| Total increase (decrease) in net assets | 169,477,051 | (35,338,104) |
| Net Assets | | |
| Beginning of period | 5,254,011,721 | 5,289,349,825 |
| End of period | $5,423,488,772 | $5,254,011,721 |
| Other Information | | |
| Undistributed net investment income end of period | | $38,805,646 |
See accompanying notes which are an integral part of the financial statements.
Financial Highlights
Fidelity Real Estate Income Fund Class A
| | Six months ended (Unaudited) January 31, | Years endedJuly 31, | | | | |
| | 2019 | 2018 | 2017 | 2016 | 2015 | 2014 |
| Selected Per–Share Data | | | | | | |
| Net asset value, beginning of period | $11.99 | $12.32 | $12.25 | $11.66 | $11.86 | $11.67 |
| Income from Investment Operations | | | | | | |
| Net investment income (loss)A | .24 | .47 | .49 | .49 | .52 | .49 |
| Net realized and unrealized gain (loss) | .11 | (.22) | .14 | .73 | .02 | .44 |
| Total from investment operations | .35 | .25 | .63 | 1.22 | .54 | .93 |
| Distributions from net investment income | (.36) | (.45) | (.48) | (.48) | (.52) | (.50) |
| Distributions from net realized gain | (.21) | (.13) | (.08) | (.14) | (.21) | (.24) |
| Total distributions | (.56)B | (.58) | (.56) | (.63)C | (.74)D | (.74) |
| Redemption fees added to paid in capitalA | – | –E | –E | –E | –E | –E |
| Net asset value, end of period | $11.78 | $11.99 | $12.32 | $12.25 | $11.66 | $11.86 |
| Total ReturnF,G,H | 3.06% | 2.13% | 5.37% | 11.01% | 4.65% | 8.49% |
| Ratios to Average Net AssetsI,J | | | | | | |
| Expenses before reductions | 1.02%K | 1.02% | 1.03% | 1.03% | 1.04% | 1.06% |
| Expenses net of fee waivers, if any | 1.02%K | 1.02% | 1.03% | 1.03% | 1.03% | 1.05% |
| Expenses net of all reductions | 1.01%K | 1.01% | 1.02% | 1.03% | 1.03% | 1.05% |
| Net investment income (loss) | 4.10%K | 3.98% | 4.08% | 4.29% | 4.40% | 4.28% |
| Supplemental Data | | | | | | |
| Net assets, end of period (000 omitted) | $282,962 | $297,722 | $355,400 | $548,649 | $495,462 | $442,271 |
| Portfolio turnover rateL | 13%K | 27% | 22% | 26% | 19% | 29% |
A Calculated based on average shares outstanding during the period.
B Total distributions of $.56 per share is comprised of distributions from net investment income of $.355 and distributions from net realized gain of $.208 per share.
C Total distributions of $.63 per share is comprised of distributions from net investment income of $.483 and distributions from net realized gain of $.142 per share.
D Total distributions of $.74 per share is comprised of distributions from net investment income of $.523 and distributions from net realized gain of $.212 per share.
E Amount represents less than $.005 per share.
F Total returns for periods of less than one year are not annualized.
G Total returns would have been lower if certain expenses had not been reduced during the applicable periods shown.
H Total returns do not include the effect of the sales charges.
I Fees and expenses of any underlying Fidelity Central Funds are not included in the Fund's expense ratio. The Fund indirectly bears its proportionate share of the expenses of any underlying Fidelity Central Funds.
J Expense ratios reflect operating expenses of the class. Expenses before reductions do not reflect amounts reimbursed by the investment adviser or reductions from brokerage service arrangements or reductions from other expense offset arrangements and do not represent the amount paid by the class during periods when reimbursements or reductions occur. Expenses net of fee waivers reflect expenses after reimbursement by the investment adviser but prior to reductions from brokerage service arrangements or other expense offset arrangements. Expenses net of all reductions represent the net expenses paid by the class.
K Annualized
L Amount does not include the portfolio activity of any underlying Fidelity Central Funds.
See accompanying notes which are an integral part of the financial statements.
Fidelity Real Estate Income Fund Class M
| | Six months ended (Unaudited) January 31, | Years endedJuly 31, | | | | |
| | 2019 | 2018 | 2017 | 2016 | 2015 | 2014 |
| Selected Per–Share Data | | | | | | |
| Net asset value, beginning of period | $11.99 | $12.32 | $12.26 | $11.66 | $11.86 | $11.67 |
| Income from Investment Operations | | | | | | |
| Net investment income (loss)A | .24 | .47 | .49 | .49 | .51 | .49 |
| Net realized and unrealized gain (loss) | .11 | (.22) | .13 | .73 | .02 | .43 |
| Total from investment operations | .35 | .25 | .62 | 1.22 | .53 | .92 |
| Distributions from net investment income | (.35) | (.45) | (.48) | (.48) | (.52) | (.50) |
| Distributions from net realized gain | (.21) | (.13) | (.08) | (.14) | (.21) | (.24) |
| Total distributions | (.56) | (.58) | (.56) | (.62) | (.73) | (.73)B |
| Redemption fees added to paid in capitalA | – | –C | –C | –C | –C | –C |
| Net asset value, end of period | $11.78 | $11.99 | $12.32 | $12.26 | $11.66 | $11.86 |
| Total ReturnD,E,F | 3.05% | 2.10% | 5.26% | 11.06% | 4.62% | 8.44% |
| Ratios to Average Net AssetsG,H | | | | | | |
| Expenses before reductions | 1.04%I | 1.04% | 1.06% | 1.07% | 1.06% | 1.08% |
| Expenses net of fee waivers, if any | 1.04%I | 1.04% | 1.06% | 1.07% | 1.06% | 1.08% |
| Expenses net of all reductions | 1.04%I | 1.04% | 1.05% | 1.06% | 1.06% | 1.07% |
| Net investment income (loss) | 4.07%I | 3.95% | 4.05% | 4.26% | 4.37% | 4.26% |
| Supplemental Data | | | | | | |
| Net assets, end of period (000 omitted) | $55,324 | $55,175 | $64,158 | $59,788 | $55,424 | $48,164 |
| Portfolio turnover rateJ | 13%I | 27% | 22% | 26% | 19% | 29% |
A Calculated based on average shares outstanding during the period.
B Total distributions of $.73 per share is comprised of distributions from net investment income of $.496 and distributions from net realized gain of $.236 per share.
C Amount represents less than $.005 per share.
D Total returns for periods of less than one year are not annualized.
E Total returns would have been lower if certain expenses had not been reduced during the applicable periods shown.
F Total returns do not include the effect of the sales charges.
G Fees and expenses of any underlying Fidelity Central Funds are not included in the Fund's expense ratio. The Fund indirectly bears its proportionate share of the expenses of any underlying Fidelity Central Funds.
H Expense ratios reflect operating expenses of the class. Expenses before reductions do not reflect amounts reimbursed by the investment adviser or reductions from brokerage service arrangements or reductions from other expense offset arrangements and do not represent the amount paid by the class during periods when reimbursements or reductions occur. Expenses net of fee waivers reflect expenses after reimbursement by the investment adviser but prior to reductions from brokerage service arrangements or other expense offset arrangements. Expenses net of all reductions represent the net expenses paid by the class.
I Annualized
J Amount does not include the portfolio activity of any underlying Fidelity Central Funds.
See accompanying notes which are an integral part of the financial statements.
Fidelity Real Estate Income Fund Class C
| | Six months ended (Unaudited) January 31, | Years endedJuly 31, | | | | |
| | 2019 | 2018 | 2017 | 2016 | 2015 | 2014 |
| Selected Per–Share Data | | | | | | |
| Net asset value, beginning of period | $11.85 | $12.20 | $12.14 | $11.55 | $11.77 | $11.59 |
| Income from Investment Operations | | | | | | |
| Net investment income (loss)A | .19 | .38 | .40 | .40 | .43 | .40 |
| Net realized and unrealized gain (loss) | .12 | (.22) | .13 | .73 | .01 | .43 |
| Total from investment operations | .31 | .16 | .53 | 1.13 | .44 | .83 |
| Distributions from net investment income | (.30) | (.37) | (.39) | (.40) | (.45) | (.42) |
| Distributions from net realized gain | (.21) | (.13) | (.08) | (.14) | (.21) | (.24) |
| Total distributions | (.51) | (.51)B | (.47) | (.54) | (.66) | (.65)C |
| Redemption fees added to paid in capitalA | – | –D | –D | –D | –D | –D |
| Net asset value, end of period | $11.65 | $11.85 | $12.20 | $12.14 | $11.55 | $11.77 |
| Total ReturnE,F,G | 2.71% | 1.31% | 4.54% | 10.29% | 3.82% | 7.66% |
| Ratios to Average Net AssetsH,I | | | | | | |
| Expenses before reductions | 1.76%J | 1.76% | 1.78% | 1.79% | 1.79% | 1.79% |
| Expenses net of fee waivers, if any | 1.76%J | 1.76% | 1.78% | 1.78% | 1.78% | 1.79% |
| Expenses net of all reductions | 1.76%J | 1.76% | 1.78% | 1.78% | 1.78% | 1.79% |
| Net investment income (loss) | 3.35%J | 3.23% | 3.32% | 3.54% | 3.65% | 3.54% |
| Supplemental Data | | | | | | |
| Net assets, end of period (000 omitted) | $218,100 | $227,458 | $287,598 | $289,430 | $291,387 | $246,306 |
| Portfolio turnover rateK | 13%J | 27% | 22% | 26% | 19% | 29% |
A Calculated based on average shares outstanding during the period.
B Total distributions of $.51 per share is comprised of distributions from net investment income of $.373 and distributions from net realized gain of $.132 per share.
C Total distributions of $.65 per share is comprised of distributions from net investment income of $.417 and distributions from net realized gain of $.236 per share.
D Amount represents less than $.005 per share.
E Total returns for periods of less than one year are not annualized.
F Total returns would have been lower if certain expenses had not been reduced during the applicable periods shown.
G Total returns do not include the effect of the contingent deferred sales charge.
H Fees and expenses of any underlying Fidelity Central Funds are not included in the Fund's expense ratio. The Fund indirectly bears its proportionate share of the expenses of any underlying Fidelity Central Funds.
I Expense ratios reflect operating expenses of the class. Expenses before reductions do not reflect amounts reimbursed by the investment adviser or reductions from brokerage service arrangements or reductions from other expense offset arrangements and do not represent the amount paid by the class during periods when reimbursements or reductions occur. Expenses net of fee waivers reflect expenses after reimbursement by the investment adviser but prior to reductions from brokerage service arrangements or other expense offset arrangements. Expenses net of all reductions represent the net expenses paid by the class.
J Annualized
K Amount does not include the portfolio activity of any underlying Fidelity Central Funds.
See accompanying notes which are an integral part of the financial statements.
Fidelity Real Estate Income Fund
| | Six months ended (Unaudited) January 31, | Years endedJuly 31, | | | | |
| | 2019 | 2018 | 2017 | 2016 | 2015 | 2014 |
| Selected Per–Share Data | | | | | | |
| Net asset value, beginning of period | $12.05 | $12.38 | $12.31 | $11.71 | $11.91 | $11.71 |
| Income from Investment Operations | | | | | | |
| Net investment income (loss)A | .26 | .51 | .52 | .52 | .54 | .52 |
| Net realized and unrealized gain (loss) | .11 | (.22) | .14 | .73 | .02 | .44 |
| Total from investment operations | .37 | .29 | .66 | 1.25 | .56 | .96 |
| Distributions from net investment income | (.37) | (.48) | (.51) | (.51) | (.55) | (.53) |
| Distributions from net realized gain | (.21) | (.13) | (.08) | (.14) | (.21) | (.24) |
| Total distributions | (.58) | (.62)B | (.59) | (.65) | (.76) | (.76)C |
| Redemption fees added to paid in capitalA | – | –D | –D | –D | –D | –D |
| Net asset value, end of period | $11.84 | $12.05 | $12.38 | $12.31 | $11.71 | $11.91 |
| Total ReturnE,F | 3.20% | 2.40% | 5.60% | 11.29% | 4.84% | 8.78% |
| Ratios to Average Net AssetsG,H | | | | | | |
| Expenses before reductions | .75%I | .75% | .78% | .82% | .83% | .83% |
| Expenses net of fee waivers, if any | .75%I | .75% | .78% | .81% | .82% | .83% |
| Expenses net of all reductions | .75%I | .75% | .77% | .81% | .82% | .83% |
| Net investment income (loss) | 4.36%I | 4.24% | 4.33% | 4.51% | 4.61% | 4.50% |
| Supplemental Data | | | | | | |
| Net assets, end of period (000 omitted) | $2,586,401 | $2,531,397 | $2,630,901 | $2,719,387 | $2,561,268 | $2,627,382 |
| Portfolio turnover rateJ | 13%I | 27% | 22% | 26% | 19% | 29% |
A Calculated based on average shares outstanding during the period.
B Total distributions of $.62 per share is comprised of distributions from net investment income of $.484 and distributions from net realized gain of $.132 per share.
C Total distributions of $.76 per share is comprised of distributions from net investment income of $.525 and distributions from net realized gain of $.236 per share.
D Amount represents less than $.005 per share.
E Total returns for periods of less than one year are not annualized.
F Total returns would have been lower if certain expenses had not been reduced during the applicable periods shown.
G Fees and expenses of any underlying Fidelity Central Funds are not included in the Fund's expense ratio. The Fund indirectly bears its proportionate share of the expenses of any underlying Fidelity Central Funds.
H Expense ratios reflect operating expenses of the class. Expenses before reductions do not reflect amounts reimbursed by the investment adviser or reductions from brokerage service arrangements or reductions from other expense offset arrangements and do not represent the amount paid by the class during periods when reimbursements or reductions occur. Expenses net of fee waivers reflect expenses after reimbursement by the investment adviser but prior to reductions from brokerage service arrangements or other expense offset arrangements. Expenses net of all reductions represent the net expenses paid by the class.
I Annualized
J Amount does not include the portfolio activity of any underlying Fidelity Central Funds.
See accompanying notes which are an integral part of the financial statements.
Fidelity Real Estate Income Fund Class I
| | Six months ended (Unaudited) January 31, | Years endedJuly 31, | | | | |
| | 2019 | 2018 | 2017 | 2016 | 2015 | 2014 |
| Selected Per–Share Data | | | | | | |
| Net asset value, beginning of period | $12.01 | $12.34 | $12.27 | $11.68 | $11.88 | $11.69 |
| Income from Investment Operations | | | | | | |
| Net investment income (loss)A | .26 | .51 | .52 | .52 | .55 | .52 |
| Net realized and unrealized gain (loss) | .10 | (.22) | .14 | .73 | .02 | .44 |
| Total from investment operations | .36 | .29 | .66 | 1.25 | .57 | .96 |
| Distributions from net investment income | (.38) | (.49) | (.51) | (.52) | (.55) | (.53) |
| Distributions from net realized gain | (.21) | (.13) | (.08) | (.14) | (.21) | (.24) |
| Total distributions | (.58)B | (.62) | (.59) | (.66) | (.77)C | (.77) |
| Redemption fees added to paid in capitalA | – | –D | ���D | –D | –D | –D |
| Net asset value, end of period | $11.79 | $12.01 | $12.34 | $12.27 | $11.68 | $11.88 |
| Total ReturnE,F | 3.14% | 2.41% | 5.66% | 11.30% | 4.92% | 8.76% |
| Ratios to Average Net AssetsG,H | | | | | | |
| Expenses before reductions | .75%I | .75% | .76% | .77% | .77% | .78% |
| Expenses net of fee waivers, if any | .75%I | .75% | .76% | .77% | .77% | .78% |
| Expenses net of all reductions | .75%I | .75% | .76% | .76% | .77% | .78% |
| Net investment income (loss) | 4.36%I | 4.25% | 4.34% | 4.56% | 4.66% | 4.55% |
| Supplemental Data | | | | | | |
| Net assets, end of period (000 omitted) | $2,128,659 | $2,142,260 | $1,951,293 | $1,239,950 | $913,475 | $809,854 |
| Portfolio turnover rateJ | 13%I | 27% | 22% | 26% | 19% | 29% |
A Calculated based on average shares outstanding during the period.
B Total distributions of $.58 per share is comprised of distributions from net investment income of $.375 and distributions from net realized gain of $.208 per share.
C Total distributions of $.77 per share is comprised of distributions from net investment income of $.554 and distributions from net realized gain of $.212 per share.
D Amount represents less than $.005 per share.
E Total returns for periods of less than one year are not annualized.
F Total returns would have been lower if certain expenses had not been reduced during the applicable periods shown.
G Fees and expenses of any underlying Fidelity Central Funds are not included in the Fund's expense ratio. The Fund indirectly bears its proportionate share of the expenses of any underlying Fidelity Central Funds.
H Expense ratios reflect operating expenses of the class. Expenses before reductions do not reflect amounts reimbursed by the investment adviser or reductions from brokerage service arrangements or reductions from other expense offset arrangements and do not represent the amount paid by the class during periods when reimbursements or reductions occur. Expenses net of fee waivers reflect expenses after reimbursement by the investment adviser but prior to reductions from brokerage service arrangements or other expense offset arrangements. Expenses net of all reductions represent the net expenses paid by the class.
I Annualized
J Amount does not include the portfolio activity of any underlying Fidelity Central Funds.
See accompanying notes which are an integral part of the financial statements.
Fidelity Real Estate Income Fund Class Z
| | Six months ended (Unaudited) January 31, |
| | 2019 A |
| Selected Per–Share Data | |
| Net asset value, beginning of period | $11.74 |
| Income from Investment Operations | |
| Net investment income (loss)B | .18 |
| Net realized and unrealized gain (loss) | .13 |
| Total from investment operations | .31 |
| Distributions from net investment income | (.24) |
| Distributions from net realized gain | (.02) |
| Total distributions | (.26) |
| Redemption fees added to paid in capitalB | – |
| Net asset value, end of period | $11.79 |
| Total ReturnC,D | 2.69% |
| Ratios to Average Net AssetsE,F | |
| Expenses before reductions | .62%G |
| Expenses net of fee waivers, if any | .62%G |
| Expenses net of all reductions | .62%G |
| Net investment income (loss) | 4.90%G |
| Supplemental Data | |
| Net assets, end of period (000 omitted) | $152,043 |
| Portfolio turnover rateH | 13%G |
A For the period October 2, 2018 (commencement of sale of shares) to January 31, 2019.
B Calculated based on average shares outstanding during the period.
C Total returns for periods of less than one year are not annualized.
D Total returns would have been lower if certain expenses had not been reduced during the applicable periods shown.
E Fees and expenses of any underlying Fidelity Central Funds are not included in the Fund's expense ratio. The Fund indirectly bears its proportionate share of the expenses of any underlying Fidelity Central Funds.
F Expense ratios reflect operating expenses of the class. Expenses before reductions do not reflect amounts reimbursed by the investment adviser or reductions from brokerage service arrangements or reductions from other expense offset arrangements and do not represent the amount paid by the class during periods when reimbursements or reductions occur. Expense ratios before reductions for start-up periods may not be representative of longer-term operating periods. Expenses net of fee waivers reflect expenses after reimbursement by the investment adviser but prior to reductions from brokerage service arrangements or other expense offset arrangements. Expenses net of all reductions represent the net expenses paid by the class.
G Annualized
H Amount does not include the portfolio activity of any underlying Fidelity Central Funds.
See accompanying notes which are an integral part of the financial statements.
Notes to Financial Statements (Unaudited)
For the period ended January 31, 2019
1. Organization.
Fidelity Real Estate Income Fund (the Fund) is a fund of Fidelity Securities Fund (the Trust) and is authorized to issue an unlimited number of shares. The Trust is registered under the Investment Company Act of 1940, as amended (the 1940 Act), as an open-end management investment company organized as a Massachusetts business trust. The Fund commenced sale of Class Z shares on October 2, 2018. The Fund offers Class A, Class M, Class C, Real Estate Income, Class I and Class Z shares, each of which has equal rights as to assets and voting privileges. Each class has exclusive voting rights with respect to matters that affect that class.
Effective March 1, 2019, Class C shares will automatically convert to Class A shares after a holding period of ten years from the initial date of purchase, with certain exceptions.
2. Investments in Fidelity Central Funds.
The Fund invests in Fidelity Central Funds, which are open-end investment companies generally available only to other investment companies and accounts managed by the investment adviser and its affiliates. The Fund's Schedule of Investments lists each of the Fidelity Central Funds held as of period end, if any, as an investment of the Fund, but does not include the underlying holdings of each Fidelity Central Fund. As an Investing Fund, the Fund indirectly bears its proportionate share of the expenses of the underlying Fidelity Central Funds.
The Money Market Central Funds seek preservation of capital and current income and are managed by Fidelity Investments Money Management, Inc. (FIMM), an affiliate of the investment adviser. Annualized expenses of the Money Market Central Funds as of their most recent shareholder report date are less than .005%.
A complete unaudited list of holdings for each Fidelity Central Fund is available upon request or at the Securities and Exchange Commission (the SEC) website at www.sec.gov. In addition, the financial statements of the Fidelity Central Funds are available on the SEC website or upon request.
3. Significant Accounting Policies.
The Fund is an investment company and applies the accounting and reporting guidance of the Financial Accounting Standards Board (FASB) Accounting Standards Codification Topic 946 Financial Services – Investments Companies. The financial statements have been prepared in conformity with accounting principles generally accepted in the United States of America (GAAP), which require management to make certain estimates and assumptions at the date of the financial statements. Actual results could differ from those estimates. Subsequent events, if any, through the date that the financial statements were issued have been evaluated in the preparation of the financial statements. The following summarizes the significant accounting policies of the Fund:
Investment Valuation. Investments are valued as of 4:00 p.m. Eastern time on the last calendar day of the period. The Board of Trustees (the Board) has delegated the day to day responsibility for the valuation of the Fund's investments to the Fair Value Committee (the Committee) established by the Fund's investment adviser. In accordance with valuation policies and procedures approved by the Board, the Fund attempts to obtain prices from one or more third party pricing vendors or brokers to value its investments. When current market prices, quotations or currency exchange rates are not readily available or reliable, investments will be fair valued in good faith by the Committee, in accordance with procedures adopted by the Board. Factors used in determining fair value vary by investment type and may include market or investment specific events, changes in interest rates and credit quality. The frequency with which these procedures are used cannot be predicted and they may be utilized to a significant extent. The Committee oversees the Fund's valuation policies and procedures and reports to the Board on the Committee's activities and fair value determinations. The Board monitors the appropriateness of the procedures used in valuing the Fund's investments and ratifies the fair value determinations of the Committee.
The Fund categorizes the inputs to valuation techniques used to value its investments into a disclosure hierarchy consisting of three levels as shown below:
- Level 1 – quoted prices in active markets for identical investments
- Level 2 – other significant observable inputs (including quoted prices for similar investments, interest rates, prepayment speeds, etc.)
- Level 3 – unobservable inputs (including the Fund's own assumptions based on the best information available)
Valuation techniques used to value the Fund's investments by major category are as follows:
Equity securities, including restricted securities, for which market quotations are readily available, are valued at the last reported sale price or official closing price as reported by a third party pricing vendor on the primary market or exchange on which they are traded and are categorized as Level 1 in the hierarchy. In the event there were no sales during the day or closing prices are not available, securities are valued at the last quoted bid price or may be valued using the last available price and are generally categorized as Level 2 in the hierarchy. For foreign equity securities, when market or security specific events arise, comparisons to the valuation of American Depositary Receipts (ADRs), futures contracts, Exchange-Traded Funds (ETFs) and certain indexes as well as quoted prices for similar securities may be used and would be categorized as Level 2 in the hierarchy. For equity securities, including restricted securities, where observable inputs are limited, assumptions about market activity and risk are used and these securities may be categorized as Level 3 in the hierarchy.
Debt securities, including restricted securities, are valued based on evaluated prices received from third party pricing vendors or from brokers who make markets in such securities. Corporate bonds, bank loan obligations and preferred securities are valued by pricing vendors who utilize matrix pricing which considers yield or price of bonds of comparable quality, coupon, maturity and type or by broker-supplied prices. Asset backed securities, collateralized mortgage obligations and commercial mortgage securities are valued by pricing vendors who utilize matrix pricing which considers prepayment speed assumptions, attributes of the collateral, yield or price of bonds of comparable quality, coupon, maturity and type or by broker-supplied prices. When independent prices are unavailable or unreliable, debt securities may be valued utilizing pricing methodologies which consider similar factors that would be used by third party pricing vendors. Debt securities are generally categorized as Level 2 in the hierarchy but may be Level 3 depending on the circumstances.
Investments in open-end mutual funds, including the Fidelity Central Funds, are valued at their closing net asset value (NAV) each business day and are categorized as Level 1 in the hierarchy.
Changes in valuation techniques may result in transfers in or out of an assigned level within the disclosure hierarchy. The aggregate value of investments by input level as of January 31, 2019, is included at the end of the Fund's Schedule of Investments.
Foreign Currency. The Fund may use foreign currency contracts to facilitate transactions in foreign-denominated securities. Gains and losses from these transactions may arise from changes in the value of the foreign currency or if the counterparties do not perform under the contracts' terms.
Foreign-denominated assets, including investment securities, and liabilities are translated into U.S. dollars at the exchange rates at period end. Purchases and sales of investment securities, income and dividends received and expenses denominated in foreign currencies are translated into U.S. dollars at the exchange rate in effect on the transaction date.
The effects of exchange rate fluctuations on investments are included with the net realized and unrealized gain (loss) on investment securities. Other foreign currency transactions resulting in realized and unrealized gain (loss) are disclosed separately.
Investment Transactions and Income. For financial reporting purposes, the Fund's investment holdings and NAV include trades executed through the end of the last business day of the period. The NAV per share for processing shareholder transactions is calculated as of the close of business of the New York Stock Exchange (NYSE), normally 4:00 p.m. Eastern time and includes trades executed through the end of the prior business day. Gains and losses on securities sold are determined on the basis of identified cost and include proceeds received from litigation. Dividend income is recorded on the ex-dividend date, except for certain dividends from foreign securities where the ex-dividend date may have passed, which are recorded as soon as the Fund is informed of the ex-dividend date. Non-cash dividends included in dividend income, if any, are recorded at the fair market value of the securities received. Income and capital gain distributions from Fidelity Central Funds, if any, are recorded on the ex-dividend date. Certain distributions received by the Fund represent a return of capital or capital gain. The Fund determines the components of these distributions subsequent to the ex-dividend date, based upon receipt of tax filings or other correspondence relating to the underlying investment. These distributions are recorded as a reduction of cost of investments and/or as a realized gain. Interest income is accrued as earned and includes coupon interest and amortization of premium and accretion of discount on debt securities as applicable. For certain lower credit quality securitized assets that have contractual cash flows (for example, asset backed securities, collateralized mortgage obligations and commercial mortgage-backed securities), changes in estimated cash flows are periodically evaluated and the estimated yield is adjusted on a prospective basis, resulting in increases or decreases to Interest Income in the accompanying Statement of Operations. Investment income is recorded net of foreign taxes withheld where recovery of such taxes is uncertain. Debt obligations may be placed on non-accrual status and related interest income may be reduced by ceasing current accruals and writing off interest receivables when the collection of all or a portion of interest has become doubtful based on consistently applied procedures. A debt obligation is removed from non-accrual status when the issuer resumes interest payments or when collectability of interest is reasonably assured.
Class Allocations and Expenses. Investment income, realized and unrealized capital gains and losses, common expenses of the Fund, and certain fund-level expense reductions, if any, are allocated daily on a pro-rata basis to each class based on the relative net assets of each class to the total net assets of the Fund. Each class differs with respect to transfer agent and distribution and service plan fees incurred. Certain expense reductions may also differ by class. For the reporting period, the allocated portion of income and expenses to each class as a percent of its average net assets may vary due to the timing of recording these transactions in relation to fluctuating net assets of the classes. Expenses directly attributable to a fund are charged to that fund. Expenses attributable to more than one fund are allocated among the respective funds on the basis of relative net assets or other appropriate methods. Expense estimates are accrued in the period to which they relate and adjustments are made when actual amounts are known.
Income Tax Information and Distributions to Shareholders. Each year, the Fund intends to qualify as a regulated investment company under Subchapter M of the Internal Revenue Code, including distributing substantially all of its taxable income and realized gains. As a result, no provision for U.S. Federal income taxes is required. The Fund files a U.S. federal tax return, in addition to state and local tax returns as required. The Fund's federal income tax returns are subject to examination by the Internal Revenue Service (IRS) for a period of three fiscal years after they are filed. State and local tax returns may be subject to examination for an additional fiscal year depending on the jurisdiction. Foreign taxes are provided for based on the Fund's understanding of the tax rules and rates that exist in the foreign markets in which it invests.
Distributions are declared and recorded on the ex-dividend date. Income and capital gain distributions are declared separately for each class. Income and capital gain distributions are determined in accordance with income tax regulations, which may differ from GAAP.
Capital accounts within the financial statements are adjusted for permanent book-tax differences. These adjustments have no impact on net assets or the results of operations. Capital accounts are not adjusted for temporary book-tax differences which will reverse in a subsequent period.
Book-tax differences are primarily due to the short-term gain distributions from the Underlying Funds, foreign currency transactions, passive foreign investment companies (PFIC), market discount, equity-debt classifications, certain conversion ratio adjustments, partnerships and losses deferred due to wash sales.
As of period end, the cost and unrealized appreciation (depreciation) in securities, and derivatives if applicable, for federal income tax purposes were as follows:
| Gross unrealized appreciation | $461,153,388 |
| Gross unrealized depreciation | (192,101,449) |
| Net unrealized appreciation (depreciation) | $269,051,939 |
| Tax cost | $5,153,279,458 |
Restricted Securities. The Fund may invest in securities that are subject to legal or contractual restrictions on resale. These securities generally may be resold in transactions exempt from registration or to the public if the securities are registered. Disposal of these securities may involve time-consuming negotiations and expense, and prompt sale at an acceptable price may be difficult. Information regarding restricted securities is included at the end of the Fund's Schedule of Investments.
Loans and Other Direct Debt Instruments. The Fund invests in direct debt instruments which are interests in amounts owed to lenders by corporate or other borrowers. These instruments may be in the form of loans, trade claims or other receivables and may include standby financing commitments such as revolving credit facilities that obligate the Fund to supply additional cash to the borrower on demand. Loans may be acquired through assignment or participation. The Fund did not have any unfunded loan commitments, which are contractual obligations for future funding, at period end.
New Rule Issuance. During August 2018, the U.S. Securities and Exchange Commission issued Final Rule Release No. 33-10532, Disclosure Update and Simplification. This Final Rule includes amendments specific to registered investment companies that are intended to eliminate overlap in disclosure requirements between Regulation S-X and GAAP. In accordance with these amendments, certain line-items in the Fund's financial statements have been combined or removed for the current period as outlined in the table below.
| Financial Statement | Current Line-Item Presentation (As Applicable) | Prior Line-Item Presentation (As Applicable) |
| Statement of Assets and Liabilities | Total distributable earnings (loss) | Undistributed/Distributions in excess of/Accumulated net investment income (loss)
Accumulated/Undistributed net realized gain (loss)
Net unrealized appreciation (depreciation) |
| Statement of Changes in Net Assets | N/A - removed | Undistributed/Distributions in excess of/Accumulated net investment income (loss) end of period |
| Statement of Changes in Net Assets | Distributions to shareholders | Distributions to shareholders from net investment income
Distributions to shareholders from net realized gain |
| Distributions to Shareholders Note to Financial Statements | Distributions to shareholders | Distributions to shareholders from net investment income
Distributions to shareholders from net realized gain |
4. Purchases and Sales of Investments.
Purchases and sales of securities, other than short-term securities and U.S. government securities, aggregated $455,689,850 and $331,877,705, respectively.
5. Fees and Other Transactions with Affiliates.
Management Fee. Fidelity Management & Research Company and its affiliates provide the Fund with investment management related services for which the Fund pays a monthly management fee. The management fee is the sum of an individual fund fee rate that is based on an annual rate of .30% of the Fund's average net assets and an annualized group fee rate that averaged .24% during the period. The group fee rate is based upon the average net assets of all the mutual funds advised by the investment adviser, including any mutual funds previously advised by the investment adviser that are currently advised by Fidelity SelectCo, LLC, an affiliate of the investment adviser. The group fee rate decreases as assets under management increase and increases as assets under management decrease. For the reporting period, the total annualized management fee rate was .54% of the Fund's average net assets.
Distribution and Service Plan Fees. In accordance with Rule 12b-1 of the 1940 Act, the Fund has adopted separate Distribution and Service Plans for each class of shares. Certain classes pay Fidelity Distributors Corporation (FDC), an affiliate of the investment adviser, separate Distribution and Service Fees, each of which is based on an annual percentage of each class' average net assets. In addition, FDC may pay financial intermediaries for selling shares of the Fund and providing shareholder support services. For the period, the Distribution and Service Fee rates, total fees and amounts retained by FDC were as follows:
| | Distribution Fee | Service Fee | Total Fees | Retained by FDC |
| Class A | -% | .25% | $358,682 | $10,133 |
| Class M | -% | .25% | 67,783 | – |
| Class C | .75% | .25% | 1,097,217 | 75,431 |
| | | | $1,523,682 | $85,564 |
Sales Load. FDC may receive a front-end sales charge of up to 4.00% for selling Class A shares and Class M shares, some of which is paid to financial intermediaries for selling shares of the Fund. Depending on the holding period, FDC may receive contingent deferred sales charges levied on Class A, Class M and Class C redemptions. The deferred sales charges are 1.00% for Class C shares, 1.00% for certain purchases of Class A shares and .25% for certain purchases of Class M shares.
For the period, sales charge amounts retained by FDC were as follows:
| | Retained by FDC |
| Class A | $3,087 |
| Class M | 4,194 |
| Class C(a) | 9,254 |
| | $16,535 |
(a) When Class C shares are initially sold, FDC pays commissions from its own resources to financial intermediaries through which the sales are made.
Transfer Agent Fees. Fidelity Investments Institutional Operations Company, Inc., (FIIOC), an affiliate of the investment adviser, is the transfer, dividend disbursing and shareholder servicing agent for each class of the Fund. FIIOC receives account fees and asset-based fees that vary according to the account size and type of account of the shareholders of the respective classes of the Fund, except for Class Z. FIIOC receives an asset-based fee of Class Z's average net assets. FIIOC pays for typesetting, printing and mailing of shareholder reports, except proxy statements.
For the period, transfer agent fees for each class were as follows:
| | Amount | % of Class-Level Average Net Assets(a) |
| Class A | $276,283 | .19 |
| Class M | 59,309 | .22 |
| Class C | 206,193 | .19 |
| Real Estate Income | 2,310,197 | .18 |
| Class I | 1,829,103 | .17 |
| Class Z | 10,784 | .05 |
| | $4,691,869 | |
(a) Annualized
Accounting and Security Lending Fees. Fidelity Service Company, Inc. (FSC), an affiliate of the investment adviser, maintains the Fund's accounting records. The accounting fee is based on the level of average net assets for each month. Under a separate contract, FSC administers the security lending program. The security lending fee is based on the number and duration of lending transactions. For the period, the fees were equivalent to an annualized rate of .03%.
Brokerage Commissions. The Fund placed a portion of its portfolio transactions with brokerage firms which are affiliates of the investment adviser. Brokerage commissions are included in net realized gain (loss) and change in net unrealized appreciation (depreciation) in the Statement of Operations. The commissions paid to these affiliated firms were $6,829 for the period.
Interfund Trades. The Fund may purchase from or sell securities to other Fidelity Funds under procedures adopted by the Board. The procedures have been designed to ensure these interfund trades are executed in accordance with Rule 17a-7 of the 1940 Act. Interfund trades are included within the respective purchases and sales amounts shown in the Purchases and Sales of Investments note.
6. Committed Line of Credit.
The Fund participates with other funds managed by the investment adviser or an affiliate in a $4.25 billion credit facility (the "line of credit") to be utilized for temporary or emergency purposes to fund shareholder redemptions or for other short-term liquidity purposes. The Fund has agreed to pay commitment fees on its pro-rata portion of the line of credit, which amounted to $6,985 and is reflected in Miscellaneous expenses on the Statement of Operations. During the period, the Fund did not borrow on this line of credit.
7. Security Lending.
The Fund lends portfolio securities through a lending agent from time to time in order to earn additional income. For equity securities, a lending agent is used and may loan securities to certain qualified borrowers, including Fidelity Capital Markets (FCM), a broker-dealer affiliated with the Fund. On the settlement date of the loan, the Fund receives collateral (in the form of U.S. Treasury obligations, letters of credit and/or cash) against the loaned securities and maintains collateral in an amount not less than 100% of the market value of the loaned securities during the period of the loan. The market value of the loaned securities is determined at the close of business of the Fund and any additional required collateral is delivered to the Fund on the next business day. The Fund or borrower may terminate the loan at any time, and if the borrower defaults on its obligation to return the securities loaned because of insolvency or other reasons, the Fund may apply collateral received from the borrower against the obligation. The Fund may experience delays and costs in recovering the securities loaned. Any cash collateral received is invested in the Fidelity Securities Lending Cash Central Fund. The value of loaned securities and cash collateral at period end are disclosed on the Fund's Statement of Assets and Liabilities. The value of securities loaned to FCM at period end was $969,622. Security lending income represents the income earned on investing cash collateral, less rebates paid to borrowers and any lending agent fees associated with the loan, plus any premium payments received for lending certain types of securities. Security lending income is presented in the Statement of Operations as a component of income from Fidelity Central Funds. Total security lending income during the period amounted to $63,890, including $10,285 from securities loaned to FCM.
8. Expense Reductions.
Commissions paid to certain brokers with whom the investment adviser, or its affiliates, places trades on behalf of the Fund include an amount in addition to trade execution, which may be rebated back to the Fund to offset certain expenses. This amount totaled $31,238 for the period. Through arrangements with the Fund's custodian, credits realized as a result of certain uninvested cash balances were used to reduce the Fund's expenses. During the period, these credits reduced the Fund's custody by $12,289.
In addition, during the period the investment adviser reimbursed and/or waived a portion of fund-level operating expenses in the amount of $20,834.
9. Distributions to Shareholders.
Distributions to shareholders of each class were as follows:
| | Six months ended
January 31, 2019(a) | Year ended
July 31, 2018 |
| Distributions to shareholders | | |
| Class A | $13,781,799 | $– |
| Class M | 2,586,371 | – |
| Class C | 9,637,993 | – |
| Real Estate Income | 125,938,782 | – |
| Class I | 103,219,390 | – |
| Class Z | 1,981,682 | – |
| Total | $257,146,017 | $– |
| From net investment income | | |
| Class A | $– | $12,349,133 |
| Class M | – | 2,255,950 |
| Class C | – | 8,342,624 |
| Real Estate Income | – | 103,116,422 |
| Class I | – | 83,587,494 |
| Total | $– | $209,651,623 |
| From net realized gain | | |
| Class A | $– | $3,718,313 |
| Class M | – | 680,353 |
| Class C | – | 3,070,508 |
| Real Estate Income | – | 28,258,214 |
| Class I | – | 22,382,771 |
| Total | $– | $58,110,159 |
(a) Distributions for Class Z are for the period October 2, 2018 (commencement of sale of shares) to January 31, 2019.
10. Share Transactions.
Share transactions for each class were as follows and may contain automatic conversions between classes or exchanges between affiliated funds:
| | Shares | Shares | Dollars | Dollars |
| | Six months ended January 31, 2019(a) | Year ended July 31, 2018 | Six months ended January 31, 2019(a) | Year ended July 31, 2018 |
| Class A | | | | |
| Shares sold | 2,496,509 | 6,036,517 | $29,153,077 | $71,765,863 |
| Reinvestment of distributions | 1,155,882 | 1,301,260 | 13,458,588 | 15,605,254 |
| Shares redeemed | (4,463,268) | (11,347,678) | (51,732,698) | (134,310,067) |
| Net increase (decrease) | (810,877) | (4,009,901) | $(9,121,033) | $(46,938,950) |
| Class M | | | | |
| Shares sold | 456,818 | 733,876 | $5,316,621 | $8,765,829 |
| Reinvestment of distributions | 218,607 | 238,619 | 2,546,317 | 2,863,295 |
| Shares redeemed | (580,485) | (1,576,898) | (6,761,214) | (18,688,302) |
| Net increase (decrease) | 94,940 | (604,403) | $1,101,724 | $(7,059,178) |
| Class C | | | | |
| Shares sold | 1,515,550 | 2,391,083 | $17,512,821 | $28,308,215 |
| Reinvestment of distributions | 779,456 | 897,945 | 8,988,428 | 10,683,017 |
| Shares redeemed | (2,762,311) | (7,673,573) | (31,879,419) | (89,721,727) |
| Net increase (decrease) | (467,305) | (4,384,545) | $(5,378,170) | $(50,730,495) |
| Real Estate Income | | | | |
| Shares sold | 34,178,313 | 43,494,857 | $401,537,255 | $518,900,815 |
| Reinvestment of distributions | 9,564,326 | 9,523,043 | 111,888,003 | 114,640,546 |
| Shares redeemed | (35,341,385) | (55,394,813) | (410,275,809) | (656,921,503) |
| Net increase (decrease) | 8,401,254 | (2,376,913) | $103,149,449 | $(23,380,142) |
| Class I | | | | |
| Shares sold | 35,590,951 | 81,604,369 | $414,458,309 | $971,878,458 |
| Reinvestment of distributions | 7,483,867 | 7,132,431 | 87,235,279 | 85,529,395 |
| Shares redeemed | (40,998,500) | (68,424,382) | (477,699,209) | (806,874,884) |
| Net increase (decrease) | 2,076,318 | 20,312,418 | $23,994,379 | $250,532,969 |
| Class Z | | | | |
| Shares sold | 13,485,496 | – | $156,102,323 | $– |
| Reinvestment of distributions | 94,631 | – | 1,084,469 | – |
| Shares redeemed | (687,510) | – | (7,788,060) | – |
| Net increase (decrease) | 12,892,617 | – | $149,398,732 | $– |
(a) Share transactions for Class Z are for the period October 2, 2018 (commencement of sale of shares) to January 31, 2019.
11. Other.
The Fund's organizational documents provide former and current trustees and officers with a limited indemnification against liabilities arising in connection with the performance of their duties to the Fund. In the normal course of business, the Fund may also enter into contracts that provide general indemnifications. The Fund's maximum exposure under these arrangements is unknown as this would be dependent on future claims that may be made against the Fund. The risk of material loss from such claims is considered remote.
Shareholder Expense Example
As a shareholder of the Fund, you incur two types of costs: (1) transaction costs, including sales charges (loads) on purchase payments or redemption proceeds, and (2) ongoing costs, including management fees, distribution and/or service (12b-1) fees and other Fund expenses. This Example is intended to help you understand your ongoing costs (in dollars) of investing in the Fund and to compare these costs with the ongoing costs of investing in other mutual funds.
The actual expense Example is based on an investment of $1,000 invested at the beginning of the period and held for the entire period (August 1, 2018 to January 31, 2018) for Class A, Class M, Class C, Real Estate Income and Class I and for the period (October 2, 2018 to January 31, 2019) for Class Z. The hypothetical expense Example is based on an investment of $1,000 invested for the one-half year period (August 1, 2018 to January 31, 2019).
Actual Expenses
The first line of the accompanying table for each class of the Fund provides information about actual account values and actual expenses. You may use the information in this line, together with the amount you invested, to estimate the expenses that you paid over the period. Simply divide your account value by $1,000.00 (for example, an $8,600 account value divided by $1,000.00 = 8.6), then multiply the result by the number in the first line for a class of the Fund under the heading entitled "Expenses Paid During Period" to estimate the expenses you paid on your account during this period. In addition, the Fund, as a shareholder in the underlying Fidelity Central Funds, will indirectly bear its pro-rata share of the fees and expenses incurred by the underlying Fidelity Central Funds. These fees and expenses are not included in the Fund's annualized expense ratio used to calculate the expense estimate in the table below.
Hypothetical Example for Comparison Purposes
The second line of the accompanying table for each class of the Fund provides information about hypothetical account values and hypothetical expenses based on a Class' actual expense ratio and an assumed rate of return of 5% per year before expenses, which is not the Class' actual return. The hypothetical account values and expenses may not be used to estimate the actual ending account balance or expenses you paid for the period. You may use this information to compare the ongoing costs of investing in the Fund and other funds. To do so, compare this 5% hypothetical example with the 5% hypothetical examples that appear in the shareholder reports of the other funds. In addition, the Fund, as a shareholder in the underlying Fidelity Central Funds, will indirectly bear its pro-rata share of the fees and expenses incurred by the underlying Fidelity Central Funds. These fees and expenses are not included in the Fund's annualized expense ratio used to calculate the expense estimate in the table below.
Please note that the expenses shown in the table are meant to highlight your ongoing costs only and do not reflect any transaction costs. Therefore, the second line of the table is useful in comparing ongoing costs only, and will not help you determine the relative total costs of owning different funds. In addition, if these transactional costs were included, your costs would have been higher.
| | Annualized Expense Ratio-A | Beginning
Account Value
| Ending
Account Value
January 31, 2019 | Expenses Paid
During Period
|
| Class A | 1.02% | | | |
| Actual | | $1,000.00 | $1,030.60 | $5.22-B |
| Hypothetical-C | | $1,000.00 | $1,020.06 | $5.19-D |
| Class M | 1.04% | | | |
| Actual | | $1,000.00 | $1,030.50 | $5.32-B |
| Hypothetical-C | | $1,000.00 | $1,019.96 | $5.30-D |
| Class C | 1.76% | | | |
| Actual | | $1,000.00 | $1,027.10 | $8.99-B |
| Hypothetical-C | | $1,000.00 | $1,016.33 | $8.94-D |
| Real Estate Income | .75% | | | |
| Actual | | $1,000.00 | $1,032.00 | $3.84-B |
| Hypothetical-C | | $1,000.00 | $1,021.42 | $3.82-D |
| Class I | .75% | | | |
| Actual | | $1,000.00 | $1,031.40 | $3.84-B |
| Hypothetical-C | | $1,000.00 | $1,021.42 | $3.82-D |
| Class Z | .62% | | | |
| Actual | | $1,000.00 | $1,026.90 | $2.10-B |
| Hypothetical-C | | $1,000.00 | $1,022.08 | $3.16-D |
A Annualized expense ratio reflects expenses net of applicable fee waivers.
B Actual expenses are equal to each Class' annualized expense ratio, multiplied by the average account value over the period, multiplied by 184/365 (to reflect the one-half year period) for Class A, Class M, Class C, Real Estate Income and Class I and multiplied by 122/365 (to reflect the period October 2, 2018 to January 31, 2019) for Class Z.
C 5% return per year before expenses
D Hypothetical expenses are equal to each Class' annualized expense ratio, multiplied by the average account value over the period, multiplied by 184/365 (to reflect the one-half year period).
Board Approval of Investment Advisory Contracts and Management Fees
Fidelity Real Estate Income Fund
Each year, the Board of Trustees, including the Independent Trustees (together, the Board), votes on the renewal of the management contract with Fidelity Management & Research Company (FMR) and the sub-advisory agreements (together, the Advisory Contracts) for the fund. FMR and the sub-advisers are referred to herein as the Investment Advisers. The Board, assisted by the advice of fund counsel and Independent Trustees' counsel, requests and considers a broad range of information relevant to the renewal of the Advisory Contracts throughout the year.
The Board meets regularly and, at each of its meetings, covers an extensive agenda of topics and materials and considers factors that are relevant to its annual consideration of the renewal of the fund's Advisory Contracts, including the services and support provided to the fund and its shareholders. The Board has established various standing committees (Committees), each composed of and chaired by Independent Trustees with varying backgrounds, to which the Board has assigned specific subject matter responsibilities in order to enhance effective decision-making by the Board. The Board, acting directly and through its Committees, requests and receives information concerning the annual consideration of the renewal of the fund's Advisory Contracts. The Board also meets as needed to review matters specifically related to the Board's annual consideration of the renewal of the Advisory Contracts. Members of the Board may also meet with trustees of other Fidelity funds through joint ad hoc committees to discuss certain matters relevant to all of the Fidelity funds.
At its January 2019 meeting, the Board unanimously determined to renew the fund's Advisory Contracts. In reaching its determination, the Board considered all factors it believed relevant, including (i) the nature, extent, and quality of the services to be provided to the fund and its shareholders (including the investment performance of the fund); (ii) the competitiveness of the fund's management fee and total expense ratio relative to peer funds; (iii) the total costs of the services to be provided by and the profits to be realized by Fidelity from its relationships with the fund; and (iv) the extent to which, if any, economies of scale exist and would be realized as the fund grows, and whether any economies of scale are appropriately shared with fund shareholders.
In considering whether to renew the Advisory Contracts for the fund, the Board reached a determination, with the assistance of fund counsel and Independent Trustees' counsel and through the exercise of its business judgment, that the renewal of the Advisory Contracts was in the best interests of the fund and its shareholders and that the compensation payable under the Advisory Contracts was fair and reasonable. The Board's decision to renew the Advisory Contracts was not based on any single factor, but rather was based on a comprehensive consideration of all the information provided to the Board at its meetings throughout the year. The Board, in reaching its determination to renew the Advisory Contracts, was aware that shareholders of the fund have a broad range of investment choices available to them, including a wide choice among funds offered by Fidelity's competitors, and that the fund's shareholders, who have the opportunity to review and weigh the disclosure provided by the fund in its prospectus and other public disclosures, have chosen to invest in this fund, which is part of the Fidelity family of funds.
Nature, Extent, and Quality of Services Provided. The Board considered Fidelity's staffing as it relates to the fund, including the backgrounds of investment personnel of Fidelity, and also considered the fund's investment objective, strategies, and related investment philosophy. The Independent Trustees also had discussions with senior management of Fidelity's investment operations and investment groups. The Board considered the structure of the investment personnel compensation program and whether this structure provides appropriate incentives to act in the best interests of the fund. Additionally, the Board considered the portfolio managers' investments, if any, in the funds that they manage.
Resources Dedicated to Investment Management and Support Services. The Board and the Fund Oversight and Research Committees reviewed the general qualifications and capabilities of Fidelity's investment staff, including its size, education, experience, and resources, as well as Fidelity's approach to recruiting, training, managing, and compensating investment personnel. The Board noted that Fidelity has continued to increase the resources devoted to non-U.S. offices, including expansion of Fidelity's global investment organization. The Board also noted that Fidelity's analysts have extensive resources, tools and capabilities that allow them to conduct sophisticated quantitative and fundamental analysis, as well as credit analysis of issuers, counterparties and guarantors. Further, the Board considered that Fidelity's investment professionals have sufficient access to global information and data so as to provide competitive investment results over time, and that those professionals also have access to sophisticated tools that permit them to assess portfolio construction and risk and performance attribution characteristics continuously, as well as to transmit new information and research conclusions rapidly around the world. Additionally, in its deliberations, the Board considered Fidelity's trading, risk management, compliance, and technology and operations capabilities and resources, which are integral parts of the investment management process.
Shareholder and Administrative Services. The Board considered (i) the nature, extent, quality, and cost of advisory, administrative, and shareholder services performed by the Investment Advisers and their affiliates under the Advisory Contracts and under separate agreements covering transfer agency, pricing and bookkeeping, and securities lending services for the fund; (ii) the nature and extent of the supervision of third party service providers, principally custodians, subcustodians, and pricing vendors; and (iii) the resources devoted to, and the record of compliance with, the fund's compliance policies and procedures. The Board also reviewed the allocation of fund brokerage, including allocations to brokers affiliated with the Investment Advisers, the use of brokerage commissions to pay fund expenses, and the use of "soft" commission dollars to pay for research services.
The Board noted that the growth of fund assets over time across the complex allows Fidelity to reinvest in the development of services designed to enhance the value and convenience of the Fidelity funds as investment vehicles. These services include 24-hour access to account information and market information through telephone representatives and over the Internet, investor education materials and asset allocation tools, and the expanded availability of Fidelity Investor Centers.
The Board noted that it and the boards of certain other Fidelity funds had formed an ad hoc Committee on Transfer Agency Fees to review the variety of transfer agency fee structures throughout the industry and Fidelity's competitive positioning with respect to industry participants.
Investment in a Large Fund Family. The Board considered the benefits to shareholders of investing in a Fidelity fund, including the benefits of investing in a fund that is part of a large family of funds offering a variety of investment disciplines and providing a large variety of mutual fund investor services. The Board noted that Fidelity had taken, or had made recommendations that resulted in the Fidelity funds taking, a number of actions over the previous year that benefited particular funds, including: (i) continuing to dedicate additional resources to Fidelity's investment research process, which includes meetings with management of issuers of securities in which the funds invest, and to the support of the senior management team that oversees asset management; (ii) continuing efforts to enhance Fidelity's global research capabilities; (iii) launching new funds and making other enhancements to meet client needs; (iv) launching new share classes of existing funds; (v) eliminating purchase minimums and broadening eligibility requirements for certain funds and share classes; (vi) reducing management fees and total expenses for certain growth equity funds and index funds; (vii) lowering expense caps for certain existing funds and classes, and converting certain voluntary expense caps to contractual caps, to reduce expenses borne by shareholders; (viii) eliminating short-term redemption fees for funds that had such fees; (ix) rationalizing product lines and gaining increased efficiencies from fund mergers and share class consolidations; (x) continuing to develop, acquire and implement systems and technology to improve services to the funds and shareholders, strengthen information security, and increase efficiency; and (xi) continuing to implement enhancements to further strengthen Fidelity's product line to increase investors' probability of success in achieving their investment goals, including retirement income goals.
Investment Performance. The Board considered whether the fund has operated in accordance with its investment objective, as well as its record of compliance with its investment restrictions and its performance history.
The Board took into account discussions that occur at Board meetings throughout the year with representatives of the Investment Advisers about fund investment performance. In this regard the Board noted that as part of regularly scheduled fund reviews and other reports to the Board on fund performance, the Board considers annualized return information for the fund for different time periods, measured against an appropriate securities market index ("benchmark index") and a peer group of funds with similar objectives ("peer group"), if any. In its evaluation of fund investment performance, the Board gave particular attention to information indicating changes in performance of certain Fidelity funds for specific time periods and discussed with the Investment Advisers the reasons for any overperformance or underperformance.
In addition to reviewing absolute and relative fund performance, the Independent Trustees periodically consider the appropriateness of fund performance metrics in evaluating the results achieved. In general, the Independent Trustees believe that fund performance should be evaluated based on net performance (after fees and expenses) of both the highest performing and lowest performing fund share classes, where applicable, compared to appropriate benchmark indices, over appropriate time periods that may include full market cycles, and compared to peer groups, as applicable, over the same periods, taking into account relevant factors including the following: general market conditions; issuer-specific information; and fund cash flows and other factors.
The Independent Trustees recognize that shareholders evaluate performance on a net basis over their own holding periods, for which one-, three-, and five-year periods are often used as a proxy. For this reason, the performance information reviewed by the Board also included net cumulative total return information for the fund and an appropriate benchmark index and peer group for the most recent one-, three-, and five-year periods ended June 30, 2018, as shown below. Returns are shown compared to the 25th percentile (top of box, 75% beaten) and 75th percentile (bottom of box, 25% beaten) of the peer universe.
Fidelity Real Estate Income Fund

Based on its review, the Board concluded that the nature, extent, and quality of services provided to the fund under the Advisory Contracts should continue to benefit the shareholders of the fund.
Competitiveness of Management Fee and Total Expense Ratio. The Board considered the fund's management fee and total expense ratio compared to "mapped groups" of competitive funds and classes created for the purpose of facilitating the Trustees' competitive analysis of management fees and total expenses. Fidelity creates "mapped groups" by combining similar Lipper investment objective categories that have comparable investment mandates. For this purpose, all sector focused equity funds are grouped in the same mapped group. Combining Lipper investment objective categories aids the Board's management fee and total expense ratio comparisons by broadening the competitive group used for comparison.
Management Fee. The Board considered two proprietary management fee comparisons for the 12-month periods (ended June 30 for 2018 and December 31 for prior periods) shown in basis points (BP) in the chart below. The group of Lipper funds used by the Board for management fee comparisons is referred to below as the "Total Mapped Group." The Total Mapped Group is broader than the Lipper peer group used by the Board for performance comparisons because the Total Mapped Group combines several Lipper investment objective categories while the Lipper peer group does not. The Total Mapped Group comparison focuses on a fund's standing in terms of gross management fees before expense reimbursements or caps relative to the total universe of funds with comparable investment mandates (i.e., sector equities), regardless of whether their management fee structures also are comparable. Funds with comparable management fee structures have similar management fee contractual arrangements (
e.g., flat rate charged for advisory services, all-inclusive fee rate,
etc.). "TMG %" represents the percentage of funds in the Total Mapped Group that had management fees that were lower than the fund's. For example, a hypothetical TMG % of 20% would mean that 80% of the funds in the Total Mapped Group had higher, and 20% had lower, management fees than the fund. The fund's actual TMG %s and the number of funds in the Total Mapped Group are in the chart below. The "Asset-Size Peer Group" (ASPG) comparison focuses on a fund's standing relative to a subset of non-Fidelity funds within the Total Mapped Group that are similar in size and management fee structure. For example, if a fund is in the first quartile of the ASPG, the fund's management fee ranks in the least expensive or lowest 25% of funds in the ASPG. The ASPG represents at least 15% of the funds in the Total Mapped Group with comparable asset size and management fee structures, subject to a minimum of 50 funds (or all funds in the Total Mapped Group if fewer than 50). Additional information, such as the ASPG quartile in which the fund's management fee rate ranked, is also included in the chart and was considered by the Board.
Fidelity Real Estate Income Fund

The Board noted that the fund's management fee rate ranked below the median of its Total Mapped Group and below the median of its ASPG for the 12-month period ended June 30, 2018.
The Board noted that it and the boards of other Fidelity funds formed an ad hoc Committee on Group Fee, which meets periodically, to conduct an in-depth review of the "group fee" component of the management fee of funds with such management fee structures. The Committee's focus included the mechanics of the group fee, the competitive landscape of group fee structures, Fidelity funds with no group fee component and investment products not included in group fee assets. The Board also considered that, for funds subject to the group fee, FMR agreed to voluntarily waive fees over a specified period of time in amounts designed to account for assets converted from certain funds to certain collective investment trusts.
The Board also noted that, in 2013, the ad hoc Committee on Management Fees was formed to conduct an in-depth review of the management fee rates of Fidelity's active equity mutual funds. The Committee focused on the following areas: (i) standard fee structures; (ii) research consumption and trading evolution; (iii) management fee competitiveness/profitability by category; and (iv) factors that drive institutional pricing.
Based on its review, the Board concluded that the fund's management fee is fair and reasonable in light of the services that the fund receives and the other factors considered.
Total Expense Ratio. In its review of each class's total expense ratio, the Board considered the fund's management fee rate as well as other fund or class expenses, as applicable, such as transfer agent fees, pricing and bookkeeping fees, fund-paid 12b-1 fees, and custodial, legal, and audit fees. The Board also noted that Fidelity may agree to waive fees and expenses from time to time, and the extent to which, if any, it has done so for the fund. As part of its review, the Board also considered the current and historical total expense ratios of each class of the fund compared to competitive fund median expenses. Each class of the fund is compared to those funds and classes in the Total Mapped Group (used by the Board for management fee comparisons) that have a similar sales load structure.
The Board noted that the total expense ratio of each class ranked below the competitive median for the 12-month period ended June 30, 2018.
Fees Charged to Other Fidelity Clients. The Board also considered Fidelity fee structures and other information with respect to clients of Fidelity, such as other funds advised or subadvised by Fidelity, pension plan clients, and other institutional clients with similar mandates. The Board noted that a joint ad hoc committee created by it and the boards of other Fidelity funds periodically reviews and compares Fidelity's institutional investment advisory business with its business of providing services to the Fidelity funds and also noted the most recent findings of the committee. The Board noted that the committee's review included a consideration of the differences in services provided, fees charged, and costs incurred, as well as competition in the markets serving the different categories of clients.
Based on its review of total expense ratios and fees charged to other Fidelity clients, the Board concluded that the total expense ratio of each class of the fund was reasonable in light of the services that the fund and its shareholders receive and the other factors considered.
Costs of the Services and Profitability. The Board considered the revenues earned and the expenses incurred by Fidelity in conducting the business of developing, marketing, distributing, managing, administering and servicing the fund and servicing the fund's shareholders. The Board also considered the level of Fidelity's profits in respect of all the Fidelity funds.
On an annual basis, Fidelity presents to the Board information about the profitability of its relationships with the fund. Fidelity calculates profitability information for each fund, as well as aggregate profitability information for groups of Fidelity funds and all Fidelity funds, using a series of detailed revenue and cost allocation methodologies which originate with the books and records of Fidelity on which Fidelity's audited financial statements are based. The Audit Committee of the Board reviews any significant changes from the prior year's methodologies.
PricewaterhouseCoopers LLP (PwC), auditor to Fidelity and certain Fidelity funds, has been engaged annually by the Board as part of the Board's assessment of Fidelity's profitability analysis. PwC's engagement includes the review and assessment of the methodologies used by Fidelity in determining the revenues and expenses attributable to Fidelity's mutual fund business, and completion of agreed-upon procedures in respect of the mathematical accuracy of the fund profitability information and its conformity to established allocation methodologies. After considering PwC's reports issued under the engagement and information provided by Fidelity, the Board concluded that while other allocation methods may also be reasonable, Fidelity's profitability methodologies are reasonable in all material respects.
The Board also reviewed Fidelity's non-fund businesses and potential indirect benefits such businesses may have received as a result of their association with Fidelity's mutual fund business (i.e., fall-out benefits) as well as cases where Fidelity's affiliates may benefit from the fund's business. The Board noted that changes to fall-out benefits year-over-year reflect business developments at Fidelity's various businesses.
The Board considered the costs of the services provided by and the profits realized by Fidelity in connection with the operation of the fund and was satisfied that the profitability was not excessive.
Economies of Scale. The Board considered whether there have been economies of scale in respect of the management of the Fidelity funds, whether the Fidelity funds (including the fund) have appropriately benefited from any such economies of scale, and whether there is potential for realization of any further economies of scale. The Board considered the extent to which the fund will benefit from economies of scale as assets grow through increased services to the fund, through waivers or reimbursements, or through fee or expense ratio reductions. The Board also noted that a committee (the Economies of Scale Committee) created by it and the boards of other Fidelity funds periodically analyzes whether Fidelity attains economies of scale in respect of the management and servicing of the Fidelity funds, whether the Fidelity funds have appropriately benefited from such economies of scale, and whether there is potential for realization of any further economies of scale.
The Board recognized that the fund's management contract incorporates a "group fee" structure, which provides for lower group fee rates as total group assets increase, and for higher group fee rates as total group assets decrease (with "group assets" defined to include fund assets under FMR's management plus the assets of sector funds previously under FMR's management). FMR calculates the group fee rates based on a tiered asset "breakpoint" schedule that varies based on asset class. The Board considered that the group fee is designed to deliver the benefits of economies of scale to fund shareholders when total Fidelity fund assets increase, even if assets of any particular fund are unchanged or have declined, because some portion of Fidelity's costs are attributable to services provided to all Fidelity funds, and all funds benefit if those costs can be allocated among more assets. The Board concluded that, given the group fee structure, fund shareholders will benefit from lower management fees as group assets increase at the fund complex level, regardless of whether Fidelity achieves any such economies of scale.
The Board concluded, taking into account the analysis of the Economies of Scale Committee, that economies of scale, if any, are being appropriately shared between fund shareholders and Fidelity.
Additional Information Requested by the Board. In order to develop fully the factual basis for consideration of the Fidelity funds' advisory contracts, the Board requested and received additional information on certain topics, including: (i) fund performance trends, in particular the underperformance of certain funds, and Fidelity's long-term strategies for certain funds; (ii) Fidelity's fund profitability methodology, profitability trends for certain funds, and the impact of certain factors on fund profitability results; (iii) metrics for evaluating index fund and ETF performance and information about ETF trading characteristics; (iv) the methodology with respect to the evaluation of competitive fund data and peer group classifications and fee comparisons; (v) the expense structures for different funds and classes; (vi) information regarding other accounts managed by Fidelity, including collective investment trusts; and (vii) Fidelity's philosophies and strategies for evaluating funds and classes with lower or declining asset levels.
Based on its evaluation of all of the conclusions noted above, and after considering all factors it believed relevant, the Board concluded that the advisory fee arrangements are fair and reasonable, and that the fund's Advisory Contracts should be renewed.
REI-SANN-0319
1.789716.115
Fidelity® Series Blue Chip Growth Fund
Semi-Annual Report January 31, 2019 |
|
Beginning on January 1, 2021, as permitted by regulations adopted by the Securities and Exchange Commission, paper copies of a fund’s shareholder reports will no longer be sent by mail, unless you specifically request paper copies of the reports from the fund or from your financial intermediary, such as a financial advisor, broker-dealer or bank. Instead, the reports will be made available on a website, and you will be notified by mail each time a report is posted and provided with a website link to access the report.
If you already elected to receive shareholder reports electronically, you will not be affected by this change and you need not take any action. You may elect to receive shareholder reports and other communications from a fund electronically, by contacting your financial intermediary. For Fidelity customers, visit Fidelity's web site or call Fidelity using the contact information listed below.
You may elect to receive all future reports in paper free of charge. If you wish to continue receiving paper copies of your shareholder reports, you may contact your financial intermediary or, if you are a Fidelity customer, visit Fidelity’s website, or call Fidelity at the applicable toll-free number listed below. Your election to receive reports in paper will apply to all funds held with the fund complex/your financial intermediary.
| Account Type | Website | Phone Number |
| Brokerage, Mutual Fund, or Annuity Contracts: | fidelity.com/mailpreferences | 1-800-343-3548 |
| Employer Provided Retirement Accounts: | netbenefits.fidelity.com/preferences (choose 'no' under Required Disclosures to continue to print) | 1-800-343-0860 |
| Advisor Sold Accounts Serviced Through Your Financial Intermediary: | Contact Your Financial Intermediary | Your Financial Intermediary's phone number |
| Advisor Sold Accounts Serviced by Fidelity: | institutional.fidelity.com | 1-877-208-0098 |
Contents
To view a fund's proxy voting guidelines and proxy voting record for the 12-month period ended June 30, visit http://www.fidelity.com/proxyvotingresults or visit the Securities and Exchange Commission's (SEC) web site at http://www.sec.gov.
You may also call 1-800-544-8544 to request a free copy of the proxy voting guidelines.
Standard & Poor's, S&P and S&P 500 are registered service marks of The McGraw-Hill Companies, Inc. and have been licensed for use by Fidelity Distributors Corporation.
Other third-party marks appearing herein are the property of their respective owners.
All other marks appearing herein are registered or unregistered trademarks or service marks of FMR LLC or an affiliated company. © 2019 FMR LLC. All rights reserved.
This report and the financial statements contained herein are submitted for the general information of the shareholders of the Fund. This report is not authorized for distribution to prospective investors in the Fund unless preceded or accompanied by an effective prospectus.
A fund files its complete schedule of portfolio holdings with the SEC for the first and third quarters of each fiscal year on Form N-Q. Forms N-Q are available on the SEC’s web site at http://www.sec.gov. A fund's Forms N-Q may be reviewed and copied at the SEC’s Public Reference Room in Washington, DC. Information regarding the operation of the SEC's Public Reference Room may be obtained by calling 1-800-SEC-0330.
For a complete list of a fund's portfolio holdings, view the most recent holdings listing, semiannual report, or annual report on Fidelity's web site at http://www.fidelity.com, http://www.institutional.fidelity.com, or http://www.401k.com, as applicable.
NOT FDIC INSURED •MAY LOSE VALUE •NO BANK GUARANTEE
Neither the Fund nor Fidelity Distributors Corporation is a bank.
Investment Summary (Unaudited)
Top Ten Stocks as of January 31, 2019
| | % of fund's net assets |
| Alphabet, Inc. Class A | 8.2 |
| Amazon.com, Inc. | 7.4 |
| Apple, Inc. | 5.7 |
| Microsoft Corp. | 4.5 |
| JUUL Labs, Inc. Series C | 4.1 |
| Facebook, Inc. Class A | 3.5 |
| Salesforce.com, Inc. | 2.6 |
| Uber Technologies, Inc. Series D, 8.00% | 2.1 |
| Broadcom, Inc. | 2.1 |
| Tesla, Inc. | 2.1 |
| | 42.3 |
Top Five Market Sectors as of January 31, 2019
| | % of fund's net assets |
| Information Technology | 31.1 |
| Consumer Discretionary | 23.9 |
| Communication Services | 16.7 |
| Health Care | 13.2 |
| Consumer Staples | 6.8 |
Asset Allocation (% of fund's net assets)
| As of January 31, 2019 * |
| | Stocks | 91.8% |
| | Convertible Securities | 8.0% |
| | Short-Term Investments and Net Other Assets (Liabilities) | 0.2% |

* Foreign investments - 7.1%
Schedule of Investments January 31, 2019 (Unaudited)
Showing Percentage of Net Assets
| Common Stocks - 91.7% | | | |
| | | Shares | Value |
| COMMUNICATION SERVICES - 16.7% | | | |
| Entertainment - 4.2% | | | |
| Activision Blizzard, Inc. | | 1,159,028 | $54,752,483 |
| Electronic Arts, Inc. (a) | | 55,400 | 5,110,096 |
| Lions Gate Entertainment Corp. Class A (b) | | 32,990 | 606,026 |
| NetEase, Inc. ADR | | 11,400 | 2,872,002 |
| Netflix, Inc. (a) | | 300,846 | 102,137,217 |
| Nintendo Co. Ltd. | | 11,500 | 3,487,813 |
| Nintendo Co. Ltd. ADR | | 45,900 | 1,709,316 |
| Take-Two Interactive Software, Inc. (a) | | 79,800 | 8,422,890 |
| The Walt Disney Co. | | 517,600 | 57,722,752 |
| WME Entertainment Parent, LLC Class A (a)(c)(d)(e) | | 3,058,566 | 8,716,913 |
| | | | 245,537,508 |
| Interactive Media & Services - 12.4% | | | |
| Alphabet, Inc. Class A (a) | | 426,313 | 479,981,539 |
| ANGI Homeservices, Inc. Class A (a) | | 359,000 | 6,103,000 |
| CarGurus, Inc. Class A (a) | | 122,688 | 5,247,366 |
| Facebook, Inc. Class A (a) | | 1,239,555 | 206,621,423 |
| Momo, Inc. ADR (a) | | 89,500 | 2,723,485 |
| Tencent Holdings Ltd. | | 486,700 | 21,665,264 |
| Twitter, Inc. (a) | | 143,500 | 4,815,860 |
| | | | 727,157,937 |
| Media - 0.0% | | | |
| Charter Communications, Inc. Class A (a) | | 1,700 | 562,785 |
| Wireless Telecommunication Services - 0.1% | | | |
| T-Mobile U.S., Inc. (a) | | 74,600 | 5,193,652 |
|
| TOTAL COMMUNICATION SERVICES | | | 978,451,882 |
|
| CONSUMER DISCRETIONARY - 23.5% | | | |
| Auto Components - 0.0% | | | |
| Aptiv PLC | | 8,000 | 633,040 |
| Automobiles - 2.1% | | | |
| Tesla, Inc. (a)(b) | | 403,537 | 123,893,930 |
| Hotels, Restaurants & Leisure - 1.8% | | | |
| Boyd Gaming Corp. | | 181,000 | 4,944,920 |
| Caesars Entertainment Corp. (a)(b) | | 387,000 | 3,537,180 |
| Chipotle Mexican Grill, Inc. (a) | | 2,200 | 1,165,142 |
| Eldorado Resorts, Inc. (a) | | 211,400 | 9,855,468 |
| Gaming VC Holdings SA | | 141,700 | 1,248,937 |
| Haidilao International Holding Ltd. (f) | | 598,000 | 1,405,601 |
| Hilton Grand Vacations, Inc. (a) | | 58,300 | 1,768,822 |
| Hilton Worldwide Holdings, Inc. | | 52,300 | 3,895,304 |
| Hyatt Hotels Corp. Class A | | 15,500 | 1,083,605 |
| Kambi Group PLC (a) | | 113,170 | 2,563,987 |
| Marriott International, Inc. Class A | | 140,800 | 16,125,824 |
| McDonald's Corp. | | 14,500 | 2,592,310 |
| MGM Mirage, Inc. | | 146,800 | 4,321,792 |
| Penn National Gaming, Inc. (a) | | 150,900 | 3,657,816 |
| Planet Fitness, Inc. (a) | | 205,400 | 11,896,768 |
| PlayAGS, Inc. (a) | | 96,231 | 2,411,549 |
| Restaurant Brands International, Inc. | | 91,400 | 5,729,064 |
| Royal Caribbean Cruises Ltd. | | 97,900 | 11,752,895 |
| Sea Ltd. ADR (a)(b) | | 132,600 | 1,857,726 |
| Shake Shack, Inc. Class A (a) | | 79,500 | 3,796,920 |
| Starbucks Corp. | | 34,800 | 2,371,272 |
| Wynn Resorts Ltd. | | 55,500 | 6,827,055 |
| | | | 104,809,957 |
| Household Durables - 0.3% | | | |
| D.R. Horton, Inc. | | 131,200 | 5,044,640 |
| iRobot Corp. (a) | | 15,500 | 1,391,745 |
| Lennar Corp. Class A | | 114,400 | 5,424,848 |
| Mohawk Industries, Inc. (a) | | 8,900 | 1,146,231 |
| Roku, Inc. Class A (a) | | 106,200 | 4,773,690 |
| | | | 17,781,154 |
| Internet & Direct Marketing Retail - 9.7% | | | |
| Alibaba Group Holding Ltd. sponsored ADR (a) | | 271,900 | 45,812,431 |
| Amazon.com, Inc. (a) | | 253,780 | 436,179,299 |
| eBay, Inc. | | 119,500 | 4,021,175 |
| Etsy, Inc. (a) | | 93,100 | 5,087,915 |
| GrubHub, Inc. (a) | | 37,000 | 2,974,800 |
| JD.com, Inc. sponsored ADR (a) | | 337,900 | 8,396,815 |
| Meituan Dianping Class B | | 1,581,852 | 10,207,155 |
| The Booking Holdings, Inc. (a) | | 22,100 | 40,505,101 |
| The Honest Co., Inc. (a)(d)(e) | | 71,609 | 706,065 |
| Wayfair LLC Class A (a) | | 130,700 | 14,306,422 |
| | | | 568,197,178 |
| Multiline Retail - 1.1% | | | |
| Avenue Supermarts Ltd. (a)(f) | | 34,373 | 665,977 |
| Dollar General Corp. | | 32,900 | 3,797,647 |
| Dollar Tree, Inc. (a) | | 537,800 | 52,075,174 |
| Ollie's Bargain Outlet Holdings, Inc. (a) | | 32,100 | 2,509,257 |
| Target Corp. | | 76,300 | 5,569,900 |
| | | | 64,617,955 |
| Specialty Retail - 5.0% | | | |
| American Eagle Outfitters, Inc. | | 339,300 | 7,166,016 |
| At Home Group, Inc. (a) | | 496,800 | 10,949,472 |
| Best Buy Co., Inc. | | 136,000 | 8,056,640 |
| Burlington Stores, Inc. (a) | | 84,900 | 14,578,179 |
| Carvana Co. Class A (a)(b) | | 92,600 | 3,440,090 |
| Five Below, Inc. (a) | | 85,500 | 10,578,915 |
| Floor & Decor Holdings, Inc. Class A (a) | | 185,100 | 6,347,079 |
| Home Depot, Inc. | | 440,200 | 80,789,906 |
| Lowe's Companies, Inc. | | 560,400 | 53,888,064 |
| RH (a)(b) | | 320,418 | 43,535,194 |
| Ross Stores, Inc. | | 108,500 | 9,995,020 |
| TCNS Clothing Co. Ltd. (a)(f) | | 74,182 | 759,017 |
| The Children's Place Retail Stores, Inc. | | 18,000 | 1,741,680 |
| Tiffany & Co., Inc. | | 83,000 | 7,364,590 |
| TJX Companies, Inc. | | 371,900 | 18,494,587 |
| Ulta Beauty, Inc. (a) | | 49,500 | 14,450,040 |
| | | | 292,134,489 |
| Textiles, Apparel & Luxury Goods - 3.5% | | | |
| adidas AG | | 86,135 | 20,477,168 |
| Allbirds, Inc. (d)(e) | | 8,081 | 443,128 |
| Canada Goose Holdings, Inc. (a) | | 45,900 | 2,361,110 |
| lululemon athletica, Inc. (a) | | 526,168 | 77,772,892 |
| Moncler SpA | | 162,500 | 6,119,318 |
| NIKE, Inc. Class B | | 521,800 | 42,724,984 |
| Pinduoduo, Inc. ADR (b) | | 442,000 | 12,910,820 |
| PVH Corp. | | 168,100 | 18,341,391 |
| Skechers U.S.A., Inc. Class A (sub. vtg.) (a) | | 348,300 | 9,463,311 |
| Tory Burch LLC (c)(d)(e) | | 106,817 | 5,948,639 |
| Under Armour, Inc. Class C (non-vtg.) (a) | | 477,600 | 9,045,744 |
| | | | 205,608,505 |
|
| TOTAL CONSUMER DISCRETIONARY | | | 1,377,676,208 |
|
| CONSUMER STAPLES - 2.5% | | | |
| Beverages - 0.4% | | | |
| Fever-Tree Drinks PLC | | 298,903 | 10,079,379 |
| Keurig Dr. Pepper, Inc. | | 452,500 | 12,317,050 |
| Monster Beverage Corp. (a) | | 9,943 | 569,137 |
| Pernod Ricard SA | | 3,500 | 580,885 |
| | | | 23,546,451 |
| Food & Staples Retailing - 0.9% | | | |
| BJ's Wholesale Club Holdings, Inc. | | 605,400 | 15,928,074 |
| Costco Wholesale Corp. | | 155,300 | 33,332,039 |
| Kroger Co. | | 131,800 | 3,733,894 |
| | | | 52,994,007 |
| Food Products - 0.1% | | | |
| Blue Bottle Coffee, Inc. Class C (Escrow) (a)(d)(e) | | 234,006 | 343,989 |
| Darling International, Inc. (a) | | 132,700 | 2,822,529 |
| Lamb Weston Holdings, Inc. | | 10,400 | 751,920 |
| Nestle SA (Reg. S) | | 7,070 | 616,390 |
| The a2 Milk Co. Ltd. (a) | | 156,000 | 1,364,014 |
| | | | 5,898,842 |
| Household Products - 0.0% | | | |
| Procter & Gamble Co. | | 17,900 | 1,726,813 |
| Personal Products - 0.3% | | | |
| Coty, Inc. Class A | | 1,041,400 | 8,081,264 |
| Estee Lauder Companies, Inc. Class A | | 86,800 | 11,841,256 |
| | | | 19,922,520 |
| Tobacco - 0.8% | | | |
| Altria Group, Inc. | | 901,000 | 44,464,350 |
| JUUL Labs, Inc. (a)(d)(e) | | 2,450 | 611,398 |
| | | | 45,075,748 |
|
| TOTAL CONSUMER STAPLES | | | 149,164,381 |
|
| ENERGY - 1.0% | | | |
| Oil, Gas & Consumable Fuels - 1.0% | | | |
| Anadarko Petroleum Corp. | | 104,578 | 4,949,677 |
| Berry Petroleum Corp. | | 179,400 | 2,115,126 |
| Continental Resources, Inc. (a) | | 178,764 | 8,253,534 |
| Diamondback Energy, Inc. | | 30,300 | 3,124,536 |
| EOG Resources, Inc. | | 26,426 | 2,621,459 |
| Hess Corp. | | 27,400 | 1,479,600 |
| Pioneer Natural Resources Co. | | 26,100 | 3,714,552 |
| Reliance Industries Ltd. | | 1,038,721 | 17,963,169 |
| Whiting Petroleum Corp. (a) | | 477,100 | 13,659,373 |
| | | | 57,881,026 |
| FINANCIALS - 2.2% | | | |
| Banks - 0.8% | | | |
| Bank of America Corp. | | 1,100,600 | 31,334,082 |
| Coastal Financial Corp. of Washington (a) | | 9,700 | 144,239 |
| ICICI Bank Ltd. sponsored ADR | | 115,200 | 1,176,192 |
| IndusInd Bank Ltd. | | 44,055 | 934,710 |
| JPMorgan Chase & Co. | | 76,972 | 7,966,602 |
| Kotak Mahindra Bank Ltd. | | 138,376 | 2,448,783 |
| | | | 44,004,608 |
| Capital Markets - 0.5% | | | |
| Charles Schwab Corp. | | 297,600 | 13,918,752 |
| Edelweiss Financial Services Ltd. | | 287,620 | 624,406 |
| HDFC Asset Management Co. Ltd. (a)(f) | | 403 | 7,739 |
| Morgan Stanley | | 26,600 | 1,125,180 |
| TD Ameritrade Holding Corp. | | 258,700 | 14,474,265 |
| | | | 30,150,342 |
| Diversified Financial Services - 0.7% | | | |
| Berkshire Hathaway, Inc. Class B (a) | | 190,600 | 39,175,924 |
| GDS Holdings Ltd. ADR (a)(b) | | 93,900 | 2,666,760 |
| | | | 41,842,684 |
| Insurance - 0.1% | | | |
| eHealth, Inc. (a) | | 76,900 | 4,703,204 |
| Thrifts & Mortgage Finance - 0.1% | | | |
| LendingTree, Inc. (a)(b) | | 17,800 | 5,274,852 |
|
| TOTAL FINANCIALS | | | 125,975,690 |
|
| HEALTH CARE - 12.9% | | | |
| Biotechnology - 5.9% | | | |
| ACADIA Pharmaceuticals, Inc. (a) | | 87,700 | 1,997,806 |
| Acceleron Pharma, Inc. (a) | | 45,100 | 1,912,240 |
| Agios Pharmaceuticals, Inc. (a) | | 134,323 | 7,199,713 |
| Aimmune Therapeutics, Inc. (a) | | 115,000 | 2,704,800 |
| Alexion Pharmaceuticals, Inc. (a) | | 417,704 | 51,360,884 |
| Alkermes PLC (a) | | 28,400 | 933,508 |
| Allakos, Inc. (a) | | 35,800 | 1,430,210 |
| Allogene Therapeutics, Inc. | | 25,600 | 776,448 |
| Alnylam Pharmaceuticals, Inc. (a) | | 347,200 | 29,001,616 |
| Amgen, Inc. | | 51,600 | 9,654,876 |
| AnaptysBio, Inc. (a) | | 44,900 | 2,977,768 |
| Arena Pharmaceuticals, Inc. (a) | | 84,000 | 3,861,480 |
| Argenx SE ADR (a) | | 10,800 | 1,145,988 |
| Array BioPharma, Inc. (a) | | 109,900 | 2,051,833 |
| Ascendis Pharma A/S sponsored ADR (a) | | 122,000 | 8,718,120 |
| BeiGene Ltd. | | 140,400 | 1,390,950 |
| BeiGene Ltd. ADR (a) | | 37,100 | 4,803,708 |
| bluebird bio, Inc. (a) | | 128,200 | 17,105,726 |
| Blueprint Medicines Corp. (a) | | 14,200 | 1,023,678 |
| Cellectis SA sponsored ADR (a) | | 42,400 | 749,208 |
| Cibus Global Ltd. Series C (c)(d)(e) | | 726,554 | 791,944 |
| Coherus BioSciences, Inc. (a) | | 185,500 | 2,496,830 |
| Crinetics Pharmaceuticals, Inc. (a) | | 28,600 | 751,608 |
| CytomX Therapeutics, Inc. (a) | | 53,200 | 903,336 |
| CytomX Therapeutics, Inc. (a)(f) | | 137,854 | 2,340,761 |
| Deciphera Pharmaceuticals, Inc. (a) | | 15,900 | 427,233 |
| Denali Therapeutics, Inc. (a)(b) | | 178,800 | 3,407,928 |
| Editas Medicine, Inc. (a) | | 108,989 | 2,368,331 |
| Epizyme, Inc. (a) | | 77,100 | 787,962 |
| Esperion Therapeutics, Inc. (a)(b) | | 51,800 | 2,406,110 |
| Exact Sciences Corp. (a) | | 41,300 | 3,720,304 |
| FibroGen, Inc. (a) | | 63,500 | 3,603,625 |
| Global Blood Therapeutics, Inc. (a) | | 149,900 | 7,181,709 |
| Heron Therapeutics, Inc. (a) | | 57,900 | 1,557,510 |
| Immunomedics, Inc. (a) | | 83,100 | 1,229,049 |
| Intellia Therapeutics, Inc. (a)(b) | | 117,657 | 1,663,670 |
| Intercept Pharmaceuticals, Inc. (a) | | 94,000 | 11,343,920 |
| Ionis Pharmaceuticals, Inc. (a) | | 62,200 | 3,607,600 |
| Ironwood Pharmaceuticals, Inc. Class A (a) | | 325,316 | 4,443,817 |
| Mirati Therapeutics, Inc. (a) | | 20,800 | 1,374,464 |
| Moderna, Inc. (b) | | 49,600 | 823,360 |
| Momenta Pharmaceuticals, Inc. (a) | | 35,300 | 418,658 |
| Natera, Inc. (a) | | 184,800 | 2,511,432 |
| Neurocrine Biosciences, Inc. (a) | | 202,200 | 17,838,084 |
| Portola Pharmaceuticals, Inc. (a)(b) | | 72,100 | 1,953,910 |
| Principia Biopharma, Inc. | | 23,100 | 700,161 |
| Regeneron Pharmaceuticals, Inc. (a) | | 117,780 | 50,559,421 |
| Rubius Therapeutics, Inc. | | 30,200 | 413,438 |
| Sage Therapeutics, Inc. (a) | | 136,286 | 19,433,021 |
| Sarepta Therapeutics, Inc. (a) | | 101,100 | 14,124,681 |
| Scholar Rock Holding Corp. | | 33,194 | 501,561 |
| Synthorx, Inc. | | 51,900 | 731,271 |
| Ultragenyx Pharmaceutical, Inc. (a) | | 33,600 | 1,657,152 |
| Vertex Pharmaceuticals, Inc. (a) | | 121,300 | 23,157,383 |
| Viking Therapeutics, Inc. (a)(b) | | 58,400 | 476,544 |
| Xencor, Inc. (a) | | 109,200 | 3,942,120 |
| Zai Lab Ltd. ADR (a) | | 74,400 | 2,008,056 |
| | | | 348,458,524 |
| Health Care Equipment & Supplies - 3.0% | | | |
| Abiomed, Inc. (a) | | 4,300 | 1,509,601 |
| Align Technology, Inc. (a) | | 30,200 | 7,518,290 |
| Atricure, Inc. (a) | | 40,200 | 1,244,190 |
| Axonics Modulation Technologies, Inc. (a) | | 69,400 | 1,013,240 |
| Becton, Dickinson & Co. | | 43,400 | 10,826,564 |
| Boston Scientific Corp. (a) | | 1,514,000 | 57,759,100 |
| Danaher Corp. | | 82,200 | 9,117,624 |
| DexCom, Inc. (a) | | 35,400 | 4,992,462 |
| Edwards Lifesciences Corp. (a) | | 8,600 | 1,465,612 |
| Establishment Labs Holdings, Inc. (a) | | 128,200 | 3,398,582 |
| Insulet Corp. (a) | | 62,200 | 5,050,018 |
| Intuitive Surgical, Inc. (a) | | 97,400 | 51,002,536 |
| iRhythm Technologies, Inc. (a) | | 89,200 | 7,582,000 |
| Masimo Corp. (a) | | 4,900 | 609,511 |
| Novocure Ltd. (a) | | 45,200 | 2,214,800 |
| Penumbra, Inc. (a) | | 8,700 | 1,265,937 |
| Quanterix Corp. (a) | | 38,600 | 812,916 |
| Stryker Corp. | | 24,700 | 4,385,979 |
| Tandem Diabetes Care, Inc. (a) | | 75,700 | 3,291,436 |
| ViewRay, Inc. (a) | | 124,600 | 895,874 |
| Wright Medical Group NV (a) | | 69,900 | 2,085,816 |
| | | | 178,042,088 |
| Health Care Providers & Services - 2.9% | | | |
| Anthem, Inc. | | 20,700 | 6,272,100 |
| Centene Corp. (a) | | 20,900 | 2,728,913 |
| Guardant Health, Inc. (b) | | 69,400 | 2,799,596 |
| HCA Holdings, Inc. | | 135,100 | 18,836,993 |
| Humana, Inc. | | 148,000 | 45,730,520 |
| National Vision Holdings, Inc. (a) | | 31,900 | 1,013,144 |
| Notre Dame Intermedica Participacoes SA | | 221,900 | 2,043,047 |
| OptiNose, Inc. (a)(b) | | 197,024 | 1,268,835 |
| UnitedHealth Group, Inc. | | 294,300 | 79,519,860 |
| Wellcare Health Plans, Inc. (a) | | 26,300 | 7,271,424 |
| | | | 167,484,432 |
| Health Care Technology - 0.1% | | | |
| Evolent Health, Inc. (a) | | 85,900 | 1,518,712 |
| Teladoc Health, Inc. (a)(b) | | 71,700 | 4,603,140 |
| | | | 6,121,852 |
| Life Sciences Tools & Services - 0.0% | | | |
| Thermo Fisher Scientific, Inc. | | 4,700 | 1,154,649 |
| Pharmaceuticals - 1.0% | | | |
| Akcea Therapeutics, Inc. (a) | | 207,800 | 5,523,324 |
| Allergan PLC | | 14,900 | 2,145,302 |
| Assembly Biosciences, Inc. (a) | | 22,700 | 517,106 |
| AstraZeneca PLC sponsored ADR | | 254,000 | 9,291,320 |
| Bristol-Myers Squibb Co. | | 286,600 | 14,149,442 |
| Chiasma, Inc. warrants 12/16/24 (a) | | 23,784 | 19,827 |
| Dova Pharmaceuticals, Inc. (a)(b) | | 54,700 | 420,096 |
| Jazz Pharmaceuticals PLC (a) | | 59,900 | 7,540,811 |
| MyoKardia, Inc. (a) | | 24,300 | 1,005,534 |
| Nektar Therapeutics (a) | | 199,000 | 8,425,660 |
| The Medicines Company (a) | | 170,200 | 3,933,322 |
| TherapeuticsMD, Inc. (a)(b) | | 219,300 | 1,151,325 |
| Theravance Biopharma, Inc. (a) | | 17,300 | 450,665 |
| Zogenix, Inc. (a) | | 30,000 | 1,312,500 |
| | | | 55,886,234 |
|
| TOTAL HEALTH CARE | | | 757,147,779 |
|
| INDUSTRIALS - 3.5% | | | |
| Aerospace & Defense - 1.1% | | | |
| Elbit Systems Ltd. | | 12,800 | 1,574,784 |
| Northrop Grumman Corp. | | 52,100 | 14,356,155 |
| Space Exploration Technologies Corp.: | | | |
| Class A (a)(d)(e) | | 22,703 | 4,222,758 |
| Class C (a)(d)(e) | | 686 | 127,596 |
| The Boeing Co. | | 102,100 | 39,371,802 |
| United Technologies Corp. | | 38,100 | 4,498,467 |
| | | | 64,151,562 |
| Airlines - 0.9% | | | |
| American Airlines Group, Inc. | | 220,400 | 7,883,708 |
| Delta Air Lines, Inc. | | 221,900 | 10,968,517 |
| JetBlue Airways Corp. (a) | | 31,700 | 570,283 |
| Spirit Airlines, Inc. (a) | | 349,100 | 20,534,062 |
| United Continental Holdings, Inc. (a) | | 129,100 | 11,266,557 |
| | | | 51,223,127 |
| Building Products - 0.1% | | �� | |
| Fortune Brands Home & Security, Inc. | | 143,800 | 6,514,140 |
| Commercial Services & Supplies - 0.1% | | | |
| HomeServe PLC | | 238,600 | 2,952,662 |
| Tomra Systems ASA | | 140,500 | 3,639,961 |
| | | | 6,592,623 |
| Construction & Engineering - 0.1% | | | |
| MasTec, Inc. (a) | | 87,400 | 3,878,812 |
| Electrical Equipment - 0.1% | | | |
| Fortive Corp. | | 79,150 | 5,935,459 |
| Industrial Conglomerates - 0.3% | | | |
| General Electric Co. | | 757,300 | 7,694,168 |
| Honeywell International, Inc. | | 81,200 | 11,662,756 |
| | | | 19,356,924 |
| Machinery - 0.5% | | | |
| Aumann AG (b)(f) | | 8,938 | 368,807 |
| Deere & Co. | | 127,700 | 20,942,800 |
| Rational AG | | 3,100 | 1,940,898 |
| Xylem, Inc. | | 81,200 | 5,786,312 |
| | | | 29,038,817 |
| Road & Rail - 0.3% | | | |
| Knight-Swift Transportation Holdings, Inc. Class A | | 452,500 | 14,366,875 |
| Union Pacific Corp. | | 11,100 | 1,765,677 |
| | | | 16,132,552 |
| Trading Companies & Distributors - 0.0% | | | |
| Ferguson PLC | | 9,402 | 628,175 |
|
| TOTAL INDUSTRIALS | | | 203,452,191 |
|
| INFORMATION TECHNOLOGY - 28.3% | | | |
| Communications Equipment - 0.2% | | | |
| Arista Networks, Inc. (a) | | 30,500 | 6,550,790 |
| Telefonaktiebolaget LM Ericsson (B Shares) sponsored ADR | | 350,100 | 3,119,391 |
| | | | 9,670,181 |
| Electronic Equipment & Components - 0.1% | | | |
| Corning, Inc. | | 245,200 | 8,155,352 |
| IT Services - 5.0% | | | |
| Adyen BV (f) | | 5,651 | 4,189,411 |
| Akamai Technologies, Inc. (a) | | 193,300 | 12,583,830 |
| Endava PLC ADR (a) | | 21,000 | 493,500 |
| GoDaddy, Inc. (a) | | 91,800 | 6,300,234 |
| Keywords Studios PLC | | 26,000 | 406,491 |
| MasterCard, Inc. Class A | | 356,600 | 75,288,958 |
| Netcompany Group A/S (f) | | 23,300 | 785,907 |
| Okta, Inc. (a) | | 17,400 | 1,434,282 |
| PayPal Holdings, Inc. (a) | | 516,100 | 45,809,036 |
| Shopify, Inc. Class A (a) | | 80,100 | 13,483,403 |
| Square, Inc. (a) | | 63,900 | 4,559,265 |
| Total System Services, Inc. | | 14,300 | 1,281,423 |
| Twilio, Inc. Class A (a) | | 12,200 | 1,358,104 |
| Visa, Inc. Class A | | 858,048 | 115,845,060 |
| Wix.com Ltd. (a) | | 81,200 | 8,879,220 |
| | | | 292,698,124 |
| Semiconductors & Semiconductor Equipment - 7.5% | | | |
| Acacia Communications, Inc. (a) | | 37,800 | 1,644,678 |
| Advanced Micro Devices, Inc. (a) | | 471,100 | 11,499,551 |
| Analog Devices, Inc. | | 75,100 | 7,424,386 |
| ASML Holding NV | | 15,000 | 2,625,450 |
| Broadcom, Inc. | | 462,000 | 123,931,500 |
| Inphi Corp. (a) | | 159,800 | 6,302,512 |
| Lam Research Corp. | | 110,400 | 18,721,632 |
| Marvell Technology Group Ltd. | | 5,400,200 | 100,065,706 |
| Micron Technology, Inc. (a) | | 238,100 | 9,100,182 |
| Monolithic Power Systems, Inc. | | 88,156 | 11,157,023 |
| NVIDIA Corp. | | 674,820 | 97,005,375 |
| NXP Semiconductors NV | | 254,500 | 22,149,135 |
| ON Semiconductor Corp. (a) | | 123,300 | 2,470,932 |
| Qualcomm, Inc. | | 280,600 | 13,895,312 |
| Semtech Corp. (a) | | 25,525 | 1,239,494 |
| Xilinx, Inc. | | 89,000 | 9,962,660 |
| | | | 439,195,528 |
| Software - 9.8% | | | |
| Adobe, Inc. (a) | | 219,820 | 54,475,792 |
| Altair Engineering, Inc. Class A (a) | | 24,100 | 780,358 |
| Atom Tickets LLC (a)(c)(d)(e) | | 344,068 | 1,018,441 |
| Bilibili, Inc. ADR (a) | | 108,500 | 1,997,485 |
| CyberArk Software Ltd. (a) | | 7,500 | 658,200 |
| DocuSign, Inc. | | 122,300 | 6,047,735 |
| Dropbox, Inc. Class A (a) | | 97,000 | 2,396,870 |
| HubSpot, Inc. (a) | | 33,800 | 5,350,878 |
| Intuit, Inc. | | 46,600 | 10,057,212 |
| Microsoft Corp. | | 2,516,300 | 262,777,209 |
| Nutanix, Inc. Class A (a) | | 127,544 | 6,534,079 |
| Paycom Software, Inc. (a) | | 77,300 | 11,458,952 |
| RingCentral, Inc. (a) | | 110,800 | 10,242,352 |
| SailPoint Technologies Holding, Inc. (a) | | 75,700 | 2,161,235 |
| Salesforce.com, Inc. (a) | | 984,767 | 149,655,041 |
| ServiceNow, Inc. (a) | | 5,900 | 1,298,118 |
| Splunk, Inc. (a) | | 22,700 | 2,833,868 |
| StoneCo Ltd. Class A (a)(b) | | 22,700 | 502,124 |
| Tanium, Inc. Class B (a)(d)(e) | | 151,000 | 1,312,734 |
| The Trade Desk, Inc. (a) | | 90,900 | 12,969,612 |
| Ultimate Software Group, Inc. (a) | | 2,200 | 600,754 |
| Workday, Inc. Class A (a) | | 99,800 | 18,116,694 |
| Zendesk, Inc. (a) | | 88,300 | 5,962,899 |
| Zuora, Inc. | | 162,400 | 3,514,336 |
| | | | 572,722,978 |
| Technology Hardware, Storage & Peripherals - 5.7% | | | |
| Apple, Inc. | | 2,027,634 | 337,479,403 |
|
| TOTAL INFORMATION TECHNOLOGY | | | 1,659,921,566 |
|
| MATERIALS - 1.0% | | | |
| Chemicals - 1.0% | | | |
| CF Industries Holdings, Inc. | | 365,700 | 15,962,805 |
| DowDuPont, Inc. | | 102,093 | 5,493,624 |
| FMC Corp. | | 28,436 | 2,269,193 |
| LG Chemical Ltd. | | 5,701 | 1,885,933 |
| Nutrien Ltd. | | 147,800 | 7,656,871 |
| Sherwin-Williams Co. | | 1,400 | 590,128 |
| The Chemours Co. LLC | | 494,000 | 17,660,500 |
| The Mosaic Co. | | 226,500 | 7,311,420 |
| Westlake Chemical Corp. | | 29,600 | 2,187,440 |
| | | | 61,017,914 |
| REAL ESTATE - 0.1% | | | |
| Equity Real Estate Investment Trusts (REITs) - 0.1% | | | |
| Ant International Co. Ltd. Class C (d)(e) | | 1,065,661 | 5,978,358 |
| TOTAL COMMON STOCKS | | | |
| (Cost $3,312,179,282) | | | 5,376,666,995 |
|
| Preferred Stocks - 8.1% | | | |
| Convertible Preferred Stocks - 8.0% | | | |
| CONSUMER DISCRETIONARY - 0.4% | | | |
| Hotels, Restaurants & Leisure - 0.1% | | | |
| MOD Super Fast Pizza Holdings LLC Series 3 Preferred (a)(c)(d)(e) | | 24,573 | 3,639,507 |
| Neutron Holdings, Inc. Series C (d)(e) | | 12,405,800 | 3,008,407 |
| Topgolf International, Inc. Series F (a)(d)(e) | | 106,191 | 1,263,673 |
| | | | 7,911,587 |
| Internet & Direct Marketing Retail - 0.2% | | | |
| The Honest Co., Inc.: | | | |
| Series C (a)(d)(e) | | 167,087 | 6,457,913 |
| Series D (a)(d)(e) | | 27,712 | 1,268,101 |
| Series E (a)(d)(e) | | 143,059 | 2,803,956 |
| | | | 10,529,970 |
| Leisure Products - 0.1% | | | |
| Peloton Interactive, Inc. Series E (a)(d)(e) | | 377,252 | 5,447,587 |
| Textiles, Apparel & Luxury Goods - 0.0% | | | |
| Allbirds, Inc.: | | | |
| Series A (d)(e) | | 3,189 | 174,871 |
| Series B (d)(e) | | 560 | 30,708 |
| Series C (d)(e) | | 5,355 | 293,646 |
| | | | 499,225 |
| TOTAL CONSUMER DISCRETIONARY | | | 24,388,369 |
| CONSUMER STAPLES - 4.3% | | | |
| Food & Staples Retailing - 0.2% | | | |
| Sweetgreen, Inc. Series H (d)(e) | | 725,140 | 9,455,826 |
| Food Products - 0.0% | | | |
| Agbiome LLC Series C (d)(e) | | 266,499 | 1,687,925 |
| Tobacco - 4.1% | | | |
| JUUL Labs, Inc.: | | | |
| Series C (a)(d)(e) | | 966,268 | 241,132,179 |
| Series D (d)(e) | | 5,110 | 1,275,201 |
| | | | 242,407,380 |
| TOTAL CONSUMER STAPLES | | | 253,551,131 |
| FINANCIALS - 0.1% | | | |
| Consumer Finance - 0.1% | | | |
| Oportun Finance Corp. Series H (a)(d)(e) | | 1,527,120 | 3,405,478 |
| HEALTH CARE - 0.2% | | | |
| Biotechnology - 0.1% | | | |
| 23andMe, Inc. Series F (a)(d)(e) | | 195,114 | 3,385,228 |
| Axcella Health, Inc. Series C (a)(d)(e) | | 248,015 | 2,770,328 |
| Generation Bio Series B (d)(e) | | 110,000 | 770,000 |
| Immunocore Ltd. Series A (a)(d)(e) | | 4,035 | 396,976 |
| | | | 7,322,532 |
| Health Care Providers & Services - 0.1% | | | |
| Mulberry Health, Inc. Series A8 (a)(d)(e) | | 813,618 | 5,813,935 |
| Pharmaceuticals - 0.0% | | | |
| Castle Creek Pharmaceutical Holdings, Inc. Series B (d)(e) | | 1,069 | 346,506 |
| TOTAL HEALTH CARE | | | 13,482,973 |
| INDUSTRIALS - 0.2% | | | |
| Aerospace & Defense - 0.2% | | | |
| Space Exploration Technologies Corp.: | | | |
| Series G (a)(d)(e) | | 42,650 | 7,932,900 |
| Series H (a)(d)(e) | | 6,348 | 1,180,728 |
| | | | 9,113,628 |
| Professional Services - 0.0% | | | |
| YourPeople, Inc. Series C (a)(d)(e) | | 253,888 | 982,547 |
| TOTAL INDUSTRIALS | | | 10,096,175 |
| INFORMATION TECHNOLOGY - 2.8% | | | |
| Internet Software & Services - 0.2% | | | |
| ContextLogic, Inc. Series G (a)(d)(e) | | 34,750 | 5,013,383 |
| Reddit, Inc. Series B (a)(d)(e) | | 129,280 | 2,803,605 |
| Starry, Inc. Series C (a)(d)(e) | | 1,477,502 | 1,362,257 |
| | | | 9,179,245 |
| IT Services - 0.0% | | | |
| AppNexus, Inc. Series E (Escrow) (a)(d)(e) | | 307,049 | 296,302 |
| Jet.Com, Inc. Series B1 (Escrow) (a)(d)(e) | | 922,232 | 41,869 |
| | | | 338,171 |
| Software - 2.6% | | | |
| Cloudflare, Inc. Series D, 8.00% (a)(d)(e) | | 428,680 | 4,715,480 |
| Compass, Inc. Series E (a)(d)(e) | | 13,605 | 1,613,145 |
| Dataminr, Inc. Series D (a)(d)(e) | | 115,901 | 2,357,426 |
| Delphix Corp. Series D (a)(d)(e) | | 242,876 | 1,578,694 |
| Lyft, Inc. Series I (d)(e) | | 137,264 | 6,441,800 |
| Malwarebytes Corp. Series B (a)(d)(e) | | 329,349 | 4,953,409 |
| Taboola.Com Ltd. Series E (a)(d)(e) | | 289,958 | 5,549,796 |
| Uber Technologies, Inc.: | | | |
| Series D, 8.00% (a)(d)(e) | | 2,553,952 | 124,556,239 |
| Series E, 8.00% (a)(d)(e) | | 46,973 | 2,290,873 |
| | | | 154,056,862 |
| TOTAL INFORMATION TECHNOLOGY | | | 163,574,278 |
|
| TOTAL CONVERTIBLE PREFERRED STOCKS | | | 468,498,404 |
|
| Nonconvertible Preferred Stocks - 0.1% | | | |
| CONSUMER DISCRETIONARY - 0.0% | | | |
| Textiles, Apparel & Luxury Goods - 0.0% | | | |
| Allbirds, Inc. (d)(e) | | 1,715 | 94,043 |
| HEALTH CARE - 0.1% | | | |
| Pharmaceuticals - 0.1% | | | |
| Castle Creek Pharmaceutical Holdings, Inc. Series A4 (d)(e) | | 9,636 | 3,123,413 |
|
| TOTAL NONCONVERTIBLE PREFERRED STOCKS | | | 3,217,456 |
|
| TOTAL PREFERRED STOCKS | | | |
| (Cost $128,181,070) | | | 471,715,860 |
|
| Money Market Funds - 1.4% | | | |
| Fidelity Cash Central Fund, 2.43% (g) | | 9,040,766 | 9,042,574 |
| Fidelity Securities Lending Cash Central Fund 2.43% (g)(h) | | 71,822,967 | 71,830,149 |
| TOTAL MONEY MARKET FUNDS | | | |
| (Cost $80,872,723) | | | 80,872,723 |
| TOTAL INVESTMENT IN SECURITIES - 101.2% | | | |
| (Cost $3,521,233,075) | | | 5,929,255,578 |
| NET OTHER ASSETS (LIABILITIES) - (1.2)% | | | (67,661,612) |
| NET ASSETS - 100% | | | $5,861,593,966 |
Legend
(a) Non-income producing
(b) Security or a portion of the security is on loan at period end.
(c) Investment is owned by a wholly-owned subsidiary (Subsidiary) that is treated as a corporation for U.S. tax purposes.
(d) Restricted securities - Investment in securities not registered under the Securities Act of 1933 (excluding 144A issues). At the end of the period, the value of restricted securities (excluding 144A issues) amounted to $501,937,819 or 8.6% of net assets.
(e) Level 3 security
(f) Security exempt from registration under Rule 144A of the Securities Act of 1933. These securities may be resold in transactions exempt from registration, normally to qualified institutional buyers. At the end of the period, the value of these securities amounted to $10,523,220 or 0.2% of net assets.
(g) Affiliated fund that is generally available only to investment companies and other accounts managed by Fidelity Investments. The rate quoted is the annualized seven-day yield of the fund at period end. A complete unaudited listing of the fund's holdings as of its most recent quarter end is available upon request. In addition, each Fidelity Central Fund's financial statements are available on the SEC's website or upon request.
(h) Investment made with cash collateral received from securities on loan.
Additional information on each restricted holding is as follows:
| Security | Acquisition Date | Acquisition Cost |
| 23andMe, Inc. Series F | 8/31/17 | $2,709,002 |
| Agbiome LLC Series C | 6/29/18 | $1,687,925 |
| Allbirds, Inc. | 10/9/18 | $443,128 |
| Allbirds, Inc. | 10/9/18 | $94,043 |
| Allbirds, Inc. Series A | 10/9/18 | $174,871 |
| Allbirds, Inc. Series B | 10/9/18 | $30,708 |
| Allbirds, Inc. Series C | 10/9/18 | $293,646 |
| Ant International Co. Ltd. Class C | 5/16/18 | $5,978,358 |
| AppNexus, Inc. Series E (Escrow) | 8/1/14 | $553,578 |
| Atom Tickets LLC | 8/15/17 | $1,999,998 |
| Axcella Health, Inc. Series C | 1/30/15 | $2,499,991 |
| Blue Bottle Coffee, Inc. Class C (Escrow) | 10/30/17 | $142,254 |
| Castle Creek Pharmaceutical Holdings, Inc. Series A4 | 9/29/16 | $3,185,523 |
| Castle Creek Pharmaceutical Holdings, Inc. Series B | 10/9/18 | $440,268 |
| Cibus Global Ltd. Series C | 2/16/18 | $1,525,763 |
| Cloudflare, Inc. Series D, 8.00% | 11/5/14 - 9/10/18 | $3,171,632 |
| Compass, Inc. Series E | 11/3/17 | $918,041 |
| ContextLogic, Inc. Series G | 10/24/17 | $4,675,022 |
| Dataminr, Inc. Series D | 3/6/15 | $1,477,738 |
| Delphix Corp. Series D | 7/10/15 | $2,185,884 |
| Generation Bio Series B | 2/21/18 | $1,006,027 |
| Immunocore Ltd. Series A | 7/27/15 | $759,303 |
| Jet.Com, Inc. Series B1 (Escrow) | 3/19/18 | $0 |
| JUUL Labs, Inc. | 11/21/17 | $0 |
| JUUL Labs, Inc. Series C | 5/22/15 - 7/6/18 | $0 |
| JUUL Labs, Inc. Series D | 6/25/18 - 7/6/18 | $0 |
| Lyft, Inc. Series I | 6/27/18 | $6,499,986 |
| Malwarebytes Corp. Series B | 12/21/15 | $3,416,996 |
| MOD Super Fast Pizza Holdings LLC Series 3 Preferred | 11/3/16 - 12/14/17 | $3,372,522 |
| Mulberry Health, Inc. Series A8 | 1/20/16 | $5,495,786 |
| Neutron Holdings, Inc. Series C | 7/3/18 | $2,268,276 |
| Oportun Finance Corp. Series H | 2/6/15 | $4,348,169 |
| Peloton Interactive, Inc. Series E | 3/31/17 | $2,042,989 |
| Reddit, Inc. Series B | 7/26/17 | $1,835,324 |
| Space Exploration Technologies Corp. Class A | 4/6/17 - 9/11/17 | $2,534,625 |
| Space Exploration Technologies Corp. Class C | 9/11/17 | $92,610 |
| Space Exploration Technologies Corp. Series G | 1/20/15 | $3,303,669 |
| Space Exploration Technologies Corp. Series H | 8/4/17 | $856,980 |
| Starry, Inc. Series C | 12/8/17 | $1,362,257 |
| Sweetgreen, Inc. Series H 0.00 | 11/9/18 | $9,455,826 |
| Taboola.Com Ltd. Series E | 12/22/14 | $3,022,928 |
| Tanium, Inc. Class B | 4/21/17 | $749,609 |
| The Honest Co., Inc. | 8/21/14 | $1,937,546 |
| The Honest Co., Inc. Series C | 8/21/14 | $4,520,923 |
| The Honest Co., Inc. Series D | 8/3/15 | $1,267,963 |
| The Honest Co., Inc. Series E | 9/28/17 | $2,804,643 |
| Topgolf International, Inc. Series F | 11/10/17 | $1,468,993 |
| Tory Burch LLC | 5/14/15 | $7,600,030 |
| Uber Technologies, Inc. Series D, 8.00% | 6/6/14 | $39,619,585 |
| Uber Technologies, Inc. Series E, 8.00% | 12/5/14 | $1,565,026 |
| WME Entertainment Parent, LLC Class A | 4/13/16 - 8/16/16 | $5,974,752 |
| YourPeople, Inc. Series C | 5/1/15 | $3,783,205 |
Affiliated Central Funds
Information regarding fiscal year to date income earned by the Fund from investments in Fidelity Central Funds is as follows:
| Fund | Income earned |
| Fidelity Cash Central Fund | $237,924 |
| Fidelity Securities Lending Cash Central Fund | 631,262 |
| Total | $869,186 |
Amounts in the income column in the above table include any capital gain distributions from underlying funds, which are presented in the corresponding line-item in the Statement of Operations, if applicable.
Investment Valuation
The following is a summary of the inputs used, as of January 31, 2019, involving the Fund's assets and liabilities carried at fair value. The inputs or methodology used for valuing securities may not be an indication of the risk associated with investing in those securities. For more information on valuation inputs, and their aggregation into the levels used below, please refer to the Investment Valuation section in the accompanying Notes to Financial Statements.
| | Valuation Inputs at Reporting Date: |
| Description | Total | Level 1 | Level 2 | Level 3 |
| Investments in Securities: | | | | |
| Equities: | | | | |
| Communication Services | $978,451,882 | $944,581,892 | $25,153,077 | $8,716,913 |
| Consumer Discretionary | 1,402,158,620 | 1,358,965,620 | 11,612,756 | 31,580,244 |
| Consumer Staples | 402,715,512 | 147,592,604 | 616,390 | 254,506,518 |
| Energy | 57,881,026 | 57,881,026 | -- | -- |
| Financials | 129,381,168 | 125,975,690 | -- | 3,405,478 |
| Health Care | 773,754,165 | 754,945,058 | 1,410,777 | 17,398,330 |
| Industrials | 213,548,366 | 199,101,837 | -- | 14,446,529 |
| Information Technology | 1,823,495,844 | 1,657,590,391 | -- | 165,905,453 |
| Materials | 61,017,914 | 61,017,914 | -- | -- |
| Real Estate | 5,978,358 | -- | -- | 5,978,358 |
| Money Market Funds | 80,872,723 | 80,872,723 | -- | -- |
| Total Investments in Securities: | $5,929,255,578 | $5,388,524,755 | $38,793,000 | $501,937,823 |
The following is a reconciliation of Investments in Securities and Derivative Instruments for which Level 3 inputs were used in determining value:
| Investments in Securities: | |
| Equities - Consumer Staples | |
| Beginning Balance | $166,746,619 |
| Net Realized Gain (Loss) on Investment Securities | 139,938,868 |
| Net Unrealized Gain (Loss) on Investment Securities | 85,713,488 |
| Cost of Purchases | 9,455,826 |
| Proceeds of Sales | (147,348,283) |
| Amortization/Accretion | -- |
| Transfers into Level 3 | -- |
| Transfers out of Level 3 | -- |
| Ending Balance | $254,506,518 |
| The change in unrealized gain (loss) for the period attributable to Level 3 securities held at January 31, 2019 | $86,384,508 |
| Equities - Information Technology | |
| Beginning Balance | $149,759,371 |
| Net Realized Gain (Loss) on Investment Securities | (18,269) |
| Net Unrealized Gain (Loss) on Investment Securities | 20,581,660 |
| Cost of Purchases | 1,715,349 |
| Proceeds of Sales | (6,132,658) |
| Amortization/Accretion | -- |
| Transfers into Level 3 | -- |
| Transfers out of Level 3 | -- |
| Ending Balance | $165,905,453 |
| The change in unrealized gain (loss) for the period attributable to Level 3 securities held at January 31, 2019 | $20,581,660 |
| Other Investments in Securities | |
| Beginning Balance | $87,387,046 |
| Net Realized Gain (Loss) on Investment Securities | 53,940 |
| Net Unrealized Gain (Loss) on Investment Securities | (2,446,696) |
| Cost of Purchases | 4,717,082 |
| Proceeds of Sales | (8,185,520) |
| Amortization/Accretion | -- |
| Transfers into Level 3 | -- |
| Transfers out of Level 3 | -- |
| Ending Balance | $81,525,852 |
| The change in unrealized gain (loss) for the period attributable to Level 3 securities held at January 31, 2019 | $462,565 |
The information used in the above reconciliations represents fiscal year to date activity for any Investments in Securities identified as using Level 3 inputs at either the beginning or the end of the current fiscal period. Transfers in or out of Level 3 represent the beginning value of any Security or Instrument where a change in the pricing level occurred from the beginning to the end of the period. The cost of purchases and the proceeds of sales may include securities received or delivered through corporate actions or exchanges. Realized and unrealized gains (losses) disclosed in the reconciliations are included in Net Gain (Loss) on the Fund's Statement of Operations.
See accompanying notes which are an integral part of the financial statements.
Financial Statements
Statement of Assets and Liabilities
| | | January 31, 2019 (Unaudited) |
| Assets | | |
Investment in securities, at value (including securities loaned of $70,903,527) — See accompanying schedule:
Unaffiliated issuers (cost $3,440,360,352) | $5,848,382,855 | |
| Fidelity Central Funds (cost $80,872,723) | 80,872,723 | |
| Total Investment in Securities (cost $3,521,233,075) | | $5,929,255,578 |
| Cash | | 174,763 |
| Restricted cash | | 266,126 |
| Foreign currency held at value (cost $662,210) | | 662,216 |
| Receivable for investments sold | | 33,930,154 |
| Receivable for fund shares sold | | 2,797,722 |
| Dividends receivable | | 745,017 |
| Distributions receivable from Fidelity Central Funds | | 77,268 |
| Other receivables | | 4,227 |
| Total assets | | 5,967,913,071 |
| Liabilities | | |
| Payable for investments purchased | $33,512,068 | |
| Payable for fund shares redeemed | 935,760 | |
| Other payables and accrued expenses | 56,338 | |
| Collateral on securities loaned | 71,814,939 | |
| Total liabilities | | 106,319,105 |
| Net Assets | | $5,861,593,966 |
| Net Assets consist of: | | |
| Paid in capital | | $3,330,737,326 |
| Total distributable earnings (loss) | | 2,530,856,640 |
| Net Assets | | $5,861,593,966 |
| Net Asset Value and Maximum Offering Price | | |
| Series Blue Chip Growth: | | |
| Net Asset Value, offering price and redemption price per share ($5,861,593,966 ÷ 421,468,885 shares) | | $13.91 |
See accompanying notes which are an integral part of the financial statements.
Statement of Operations
| | | Six months ended January 31, 2019 (Unaudited) |
| Investment Income | | |
| Dividends | | $18,328,387 |
| Income from Fidelity Central Funds | | 869,186 |
| Total income | | 19,197,573 |
| Expenses | | |
| Custodian fees and expenses | $111,758 | |
| Independent trustees' fees and expenses | 18,906 | |
| Legal | 541 | |
| Interest | 8,265 | |
| Commitment fees | 7,828 | |
| Total expenses | | 147,298 |
| Net investment income (loss) | | 19,050,275 |
| Realized and Unrealized Gain (Loss) | | |
| Net realized gain (loss) on: | | |
| Investment securities: | | |
| Unaffiliated issuers | 299,904,741 | |
| Fidelity Central Funds | 4,296 | |
| Foreign currency transactions | (45,787) | |
| Total net realized gain (loss) | | 299,863,250 |
| Change in net unrealized appreciation (depreciation) on: | | |
| Investment securities: | | |
| Unaffiliated issuers (net of decrease in deferred foreign taxes of $930,518) | (323,800,227) | |
| Assets and liabilities in foreign currencies | (17,880) | |
| Total change in net unrealized appreciation (depreciation) | | (323,818,107) |
| Net gain (loss) | | (23,954,857) |
| Net increase (decrease) in net assets resulting from operations | | $(4,904,582) |
See accompanying notes which are an integral part of the financial statements.
Statement of Changes in Net Assets
| | Six months ended January 31, 2019 (Unaudited) | Year ended July 31, 2018 |
| Increase (Decrease) in Net Assets | | |
| Operations | | |
| Net investment income (loss) | $19,050,275 | $47,936,796 |
| Net realized gain (loss) | 299,863,250 | 672,796,190 |
| Change in net unrealized appreciation (depreciation) | (323,818,107) | 683,617,133 |
| Net increase (decrease) in net assets resulting from operations | (4,904,582) | 1,404,350,119 |
| Distributions to shareholders | (763,496,173) | – |
| Distributions to shareholders from net investment income | – | (30,301,164) |
| Distributions to shareholders from net realized gain | – | (594,846,797) |
| Total distributions | (763,496,173) | (625,147,961) |
| Share transactions - net increase (decrease) | 624,014,565 | (294,231,172) |
| Total increase (decrease) in net assets | (144,386,190) | 484,970,986 |
| Net Assets | | |
| Beginning of period | 6,005,980,156 | 5,521,009,170 |
| End of period | $5,861,593,966 | $6,005,980,156 |
| Other Information | | |
| Undistributed net investment income end of period | | $27,489,767 |
See accompanying notes which are an integral part of the financial statements.
Financial Highlights
Fidelity Series Blue Chip Growth Fund
| | Six months ended (Unaudited) January 31, | Years endedJuly 31, | | | | |
| | 2019 | 2018 | 2017 | 2016 | 2015 | 2014 A |
| Selected Per–Share Data | | | | | | |
| Net asset value, beginning of period | $15.90 | $14.07 | $11.47 | $13.36 | $11.18 | $10.00 |
| Income from Investment Operations | | | | | | |
| Net investment income (loss)B | .05 | .12C | .03 | .02 | .03 | .02 |
| Net realized and unrealized gain (loss) | (.03) | 3.28 | 2.74 | (.42) | 2.27 | 1.17 |
| Total from investment operations | .02 | 3.40 | 2.77 | (.40) | 2.30 | 1.19 |
| Distributions from net investment income | (.12) | (.07) | (.03) | (.02) | (.02) | (.01) |
| Distributions from net realized gain | (1.89) | (1.50) | (.14) | (1.48) | (.10) | – |
| Total distributions | (2.01) | (1.57) | (.17) | (1.49)D | (.12) | (.01) |
| Net asset value, end of period | $13.91 | $15.90 | $14.07 | $11.47 | $13.36 | $11.18 |
| Total ReturnE,F | (.07)% | 26.54% | 24.50% | (2.63)% | 20.74% | 11.90% |
| Ratios to Average Net AssetsG,H | | | | | | |
| Expenses before reductions | .01%I | - %J | .59% | .73% | .79% | .74%I |
| Expenses net of fee waivers, if any | .01%I | - %J | .59% | .73% | .78% | .74%I |
| Expenses net of all reductions | .01%I | - %J | .59% | .73% | .78% | .74%I |
| Net investment income (loss) | .66%I | .81%C | .26% | .17% | .20% | .26%I |
| Supplemental Data | | | | | | |
| Net assets, end of period (000 omitted) | $5,861,594 | $6,005,980 | $2,208,451 | $2,417,952 | $2,831,293 | $3,288,708 |
| Portfolio turnover rateK | 48%I | 41% | 47% | 55% | 57% | 67%I,L |
A For the period November 7, 2013 (commencement of operations) to July 31, 2014.
B Calculated based on average shares outstanding during the period.
C Net investment income per share reflects a large, non-recurring dividend which amounted to $.01 per share. Excluding this non-recurring dividend, the ratio of net investment income (loss) to average net assets would have been .71%.
D Total distributions of $1.49 per share is comprised of distributions from net investment income of $.015 and distributions from net realized gain of $1.477 per share.
E Total returns for periods of less than one year are not annualized.
F Total returns would have been lower if certain expenses had not been reduced during the applicable periods shown.
G Fees and expenses of any underlying Fidelity Central Funds are not included in the Fund's expense ratio. The Fund indirectly bears its proportionate share of the expenses of any underlying Fidelity Central Funds.
H Expense ratios reflect operating expenses of the Fund. Expenses before reductions do not reflect amounts reimbursed by the investment adviser or reductions from brokerage service arrangements or reductions from other expense offset arrangements and do not represent the amount paid by the Fund during periods when reimbursements or reductions occur. Expense ratios before reductions for start-up periods may not be representative of longer-term operating periods. Expenses net of fee waivers reflect expenses after reimbursement by the investment adviser but prior to reductions from brokerage service arrangements or other expense offset arrangements. Expenses net of all reductions represent the net expenses paid by the Fund.
I Annualized
J Amount represents less than .005%.
K Amount does not include the portfolio activity of any underlying Fidelity Central Funds.
L Portfolio turnover rate excludes securities received or delivered in-kind.
See accompanying notes which are an integral part of the financial statements.
Notes to Financial Statements (Unaudited)
For the period ended January 31, 2019
1. Organization.
Fidelity Series Blue Chip Growth Fund (the Fund) is a fund of Fidelity Securities Fund (the Trust) and is authorized to issue an unlimited number of shares. Shares of the Fund are only available for purchase by mutual funds for which Fidelity Management & Research Company (FMR) or an affiliate serves as an investment manager. The Trust is registered under the Investment Company Act of 1940, as amended (the 1940 Act), as an open-end management investment company organized as a Massachusetts business trust.
Effective August 28, 2017, the Fund no longer offered Class F, and all outstanding shares of Class F were exchanged for shares of Series Blue Chip Growth.
2. Investments in Fidelity Central Funds.
The Fund invests in Fidelity Central Funds, which are open-end investment companies generally available only to other investment companies and accounts managed by the investment adviser and its affiliates. The Fund's Schedule of Investments lists each of the Fidelity Central Funds held as of period end, if any, as an investment of the Fund, but does not include the underlying holdings of each Fidelity Central Fund. As an Investing Fund, the Fund indirectly bears its proportionate share of the expenses of the underlying Fidelity Central Funds.
The Money Market Central Funds seek preservation of capital and current income and are managed by Fidelity Investments Money Management, Inc. (FIMM), an affiliate of the investment adviser. Annualized expenses of the Money Market Central Funds as of their most recent shareholder report date are less than .005%.
A complete unaudited list of holdings for each Fidelity Central Fund is available upon request or at the Securities and Exchange Commission (the SEC) website at www.sec.gov. In addition, the financial statements of the Fidelity Central Funds are available on the SEC website or upon request.
3. Significant Accounting Policies.
The Fund is an investment company and applies the accounting and reporting guidance of the Financial Accounting Standards Board (FASB) Accounting Standards Codification Topic 946 Financial Services – Investments Companies. The financial statements have been prepared in conformity with accounting principles generally accepted in the United States of America (GAAP), which require management to make certain estimates and assumptions at the date of the financial statements. Actual results could differ from those estimates. Subsequent events, if any, through the date that the financial statements were issued have been evaluated in the preparation of the financial statements. The following summarizes the significant accounting policies of the Fund:
Investment Valuation. Investments are valued as of 4:00 p.m. Eastern time on the last calendar day of the period. The Board of Trustees (the Board) has delegated the day to day responsibility for the valuation of the Fund's investments to the Fair Value Committee (the Committee) established by the Fund's investment adviser. In accordance with valuation policies and procedures approved by the Board, the Fund attempts to obtain prices from one or more third party pricing vendors or brokers to value its investments. When current market prices, quotations or currency exchange rates are not readily available or reliable, investments will be fair valued in good faith by the Committee, in accordance with procedures adopted by the Board. Factors used in determining fair value vary by investment type and may include market or investment specific events. The frequency with which these procedures are used cannot be predicted and they may be utilized to a significant extent. The Committee oversees the Fund's valuation policies and procedures and reports to the Board on the Committee's activities and fair value determinations. The Board monitors the appropriateness of the procedures used in valuing the Fund's investments and ratifies the fair value determinations of the Committee.
The Fund categorizes the inputs to valuation techniques used to value its investments into a disclosure hierarchy consisting of three levels as shown below:
- Level 1 – quoted prices in active markets for identical investments
- Level 2 – other significant observable inputs (including quoted prices for similar investments, interest rates, prepayment speeds, etc.)
- Level 3 – unobservable inputs (including the Fund's own assumptions based on the best information available)
Valuation techniques used to value the Fund's investments by major category are as follows:
Equity securities, including restricted securities, for which market quotations are readily available, are valued at the last reported sale price or official closing price as reported by a third party pricing vendor on the primary market or exchange on which they are traded and are categorized as Level 1 in the hierarchy. In the event there were no sales during the day or closing prices are not available, securities are valued at the last quoted bid price or may be valued using the last available price and are generally categorized as Level 2 in the hierarchy. For foreign equity securities, when market or security specific events arise, comparisons to the valuation of American Depositary Receipts (ADRs), futures contracts, Exchange-Traded Funds (ETFs) and certain indexes as well as quoted prices for similar securities may be used and would be categorized as Level 2 in the hierarchy. For equity securities, including restricted securities, where observable inputs are limited, assumptions about market activity and risk are used and these securities may be categorized as Level 3 in the hierarchy. Equity securities, including restricted securities, for which observable inputs are not available are valued using alternate valuation approaches, including the market approach and the income approach and are categorized as Level 3 in the hierarchy. The market approach generally consists of using comparable market transactions while the income approach generally consists of using the net present value of estimated future cash flows, adjusted as appropriate for liquidity, credit, market and/or other risk factors.
Investments in open-end mutual funds, including the Fidelity Central Funds, are valued at their closing net asset value (NAV) each business day and are categorized as Level 1 in the hierarchy.
The following provides information on Level 3 securities held by the Fund that were valued at period end based on unobservable inputs. These amounts exclude valuations provided by a broker.
| Asset Type | Fair Value | Valuation Technique (s) | Unobservable Input | Amount or Range / Weighted Average | Impact to Valuation from an Increase in Input(a) |
| Equities | $ 501,937,823 | Market approach | Transaction price | $0.24 - $277.28 / $176.53 | Increase |
| | | | Discount rate | 10.0% | Decrease |
| | | Recovery value | Recovery value | 0.0% - 1.5% / 1.2% | Increase |
| | | Market comparable | Transaction price | $9.15 - $411.85 / $204.78 | Increase |
| | | | Enterprise value/Sales multiple (EV/S) | 1.1 - 10.2 / 3.3 | Increase |
| | | | Discount rate | 7.5% - 69.0% / 30.5% | Decrease |
| | | | Price/Earnings multiple (P/E) | 11.0 | Increase |
| | | | Discount for lack of marketability | 10.0% - 25.0% / 11.9% | Decrease |
| | | | Conversion ratio | 3.0 | Increase |
| | | | Proxy discount | 21.3% - 26.0% / 22.1% | Decrease |
| | | | Premium rate | 6.0% - 9.0% / 8.0% | Increase |
| | | | Proxy premium | 10.8% | Increase |
| | | | Liquidity preference | $14.90 - $45.76 / $32.77 | Increase |
| | | Discount cash flow | Discount rate | 24.1% - 25.0% / 24.6% | Decrease |
| | | | Growth rate | 3.0% | Increase |
(a) Represents the directional change in the fair value of the Level 3 investments that could have resulted from an increase in the corresponding input as of period end. A decrease to the unobservable input would have had the opposite effect. Significant changes in these inputs may have resulted in a significantly higher or lower fair value measurement at period end.
Changes in valuation techniques may result in transfers in or out of an assigned level within the disclosure hierarchy. The aggregate value of investments by input level as of January 31, 2019, as well as a roll forward of Level 3 investments, is included at the end of the Fund's Schedule of Investments.
Foreign Currency. The Fund may use foreign currency contracts to facilitate transactions in foreign-denominated securities. Gains and losses from these transactions may arise from changes in the value of the foreign currency or if the counterparties do not perform under the contracts' terms.
Foreign-denominated assets, including investment securities, and liabilities are translated into U.S. dollars at the exchange rates at period end. Purchases and sales of investment securities, income and dividends received and expenses denominated in foreign currencies are translated into U.S. dollars at the exchange rate in effect on the transaction date.
The effects of exchange rate fluctuations on investments are included with the net realized and unrealized gain (loss) on investment securities. Other foreign currency transactions resulting in realized and unrealized gain (loss) are disclosed separately.
Investment Transactions and Income. For financial reporting purposes, the Fund's investment holdings and NAV include trades executed through the end of the last business day of the period. The NAV per share for processing shareholder transactions is calculated as of the close of business of the New York Stock Exchange (NYSE), normally 4:00 p.m. Eastern time and includes trades executed through the end of the prior business day. Gains and losses on securities sold are determined on the basis of identified cost and include proceeds received from litigation. Dividend income is recorded on the ex-dividend date, except for certain dividends from foreign securities where the ex-dividend date may have passed, which are recorded as soon as the Fund is informed of the ex-dividend date. Non-cash dividends included in dividend income, if any, are recorded at the fair market value of the securities received. Income and capital gain distributions from Fidelity Central Funds, if any, are recorded on the ex-dividend date. Certain distributions received by the Fund represent a return of capital or capital gain. The Fund determines the components of these distributions subsequent to the ex-dividend date, based upon receipt of tax filings or other correspondence relating to the underlying investment. These distributions are recorded as a reduction of cost of investments and/or as a realized gain. Investment income is recorded net of foreign taxes withheld where recovery of such taxes is uncertain.
Expenses. Expenses directly attributable to a fund are charged to that fund. Expenses attributable to more than one fund are allocated among the respective funds on the basis of relative net assets or other appropriate methods. Expense estimates are accrued in the period to which they relate and adjustments are made when actual amounts are known.
Income Tax Information and Distributions to Shareholders. Each year, the Fund intends to qualify as a regulated investment company under Subchapter M of the Internal Revenue Code, including distributing substantially all of its taxable income and realized gains. As a result, no provision for U.S. Federal income taxes is required. The Fund files a U.S. federal tax return, in addition to state and local tax returns as required. The Fund's federal income tax returns are subject to examination by the Internal Revenue Service (IRS) for a period of three fiscal years after they are filed. State and local tax returns may be subject to examination for an additional fiscal year depending on the jurisdiction. Foreign taxes are provided for based on the Fund's understanding of the tax rules and rates that exist in the foreign markets in which it invests. The Fund is subject to a tax imposed on capital gains by certain countries in which it invests.
Distributions are declared and recorded on the ex-dividend date. Income and capital gain distributions are determined in accordance with income tax regulations, which may differ from GAAP.
Capital accounts within the financial statements are adjusted for permanent book-tax differences. These adjustments have no impact on net assets or the results of operations. Capital accounts are not adjusted for temporary book-tax differences which will reverse in a subsequent period.
Book-tax differences are primarily due to foreign currency transactions, certain foreign taxes, passive foreign investment companies (PFIC), partnerships, and losses deferred due to wash sales.
As of period end, the cost and unrealized appreciation (depreciation) in securities, and derivatives if applicable, for federal income tax purposes were as follows:
| Gross unrealized appreciation | $2,527,046,265 |
| Gross unrealized depreciation | (133,727,760) |
| Net unrealized appreciation (depreciation) | $2,393,318,505 |
| Tax cost | $3,535,937,073 |
Restricted Securities. The Fund may invest in securities that are subject to legal or contractual restrictions on resale. These securities generally may be resold in transactions exempt from registration or to the public if the securities are registered. Disposal of these securities may involve time-consuming negotiations and expense, and prompt sale at an acceptable price may be difficult. Information regarding restricted securities is included at the end of the Fund's Schedule of Investments.
Consolidated Subsidiary. The Fund invests in certain investments through a wholly-owned subsidiary ("Subsidiary"), which may be subject to federal and state taxes upon disposition.
As of period end, the Fund held an investment of $20,381,570 in these Subsidiaries, representing .35% of the Fund's net assets. The financial statements have been consolidated and include accounts of the Fund and each Subsidiary. Accordingly, all inter-company transactions and balances have been eliminated.
Any cash held by the Subsidiaries is restricted as to its use and is presented as Restricted cash in the Statement of Assets and Liabilities.
New Rule Issuance. During August 2018, the U.S. Securities and Exchange Commission issued Final Rule Release No. 33-10532, Disclosure Update and Simplification. This Final Rule includes amendments specific to registered investment companies that are intended to eliminate overlap in disclosure requirements between Regulation S-X and GAAP. In accordance with these amendments, certain line-items in the Fund's financial statements have been combined or removed for the current period as outlined in the table below.
| Financial Statement | Current Line-Item Presentation (As Applicable) | Prior Line-Item Presentation (As Applicable) |
| Statement of Assets and Liabilities | Total distributable earnings (loss) | Undistributed/Distributions in excess of/Accumulated net investment income (loss)
Accumulated/Undistributed net realized gain (loss)
Net unrealized appreciation (depreciation) |
| Statement of Changes in Net Assets | N/A - removed | Undistributed/Distributions in excess of/Accumulated net investment income (loss) end of period |
| Statement of Changes in Net Assets | Distributions to shareholders | Distributions to shareholders from net investment income
Distributions to shareholders from net realized gain |
| Distributions to Shareholders Note to Financial Statements | Distributions to shareholders | Distributions to shareholders from net investment income
Distributions to shareholders from net realized gain |
4. Purchases and Sales of Investments.
Purchases and sales of securities, other than short-term securities, aggregated $1,430,934,194 and $1,409,462,799, respectively.
5. Fees and Other Transactions with Affiliates.
Management Fee. Fidelity Management & Research Company (the investment adviser) and its affiliates provide the Fund with investment management related services for which the Fund does not pay a management fee. Under the management contract, the investment adviser or an affiliate pays all ordinary operating expenses of the Fund, except custody fees, fees and expenses of the independent Trustees, and certain miscellaneous expenses such as proxy and shareholder meeting expenses.
Brokerage Commissions. The Fund placed a portion of its portfolio transactions with brokerage firms which are affiliates of the investment adviser. Brokerage commissions are included in net realized gain (loss) and change in net unrealized appreciation (depreciation) in the Statement of Operations. The commissions paid to these affiliated firms were $30,026 for the period.
Interfund Lending Program. Pursuant to an Exemptive Order issued by the SEC, the Fund, along with other registered investment companies having management contracts with Fidelity Management & Research Company (FMR) or other affiliated entities of FMR, may participate in an interfund lending program. This program provides an alternative credit facility allowing the funds to borrow from, or lend money to, other participating affiliated funds. At period end, there were no interfund loans outstanding. The Fund's activity in this program during the period for which loans were outstanding was as follows:
| Borrower or Lender | Average Loan Balance | Weighted Average Interest Rate | Interest Expense |
| Borrower | $22,716,167 | 2.18% | $8,265 |
Interfund Trades. The Fund may purchase from or sell securities to other Fidelity Funds under procedures adopted by the Board. The procedures have been designed to ensure these interfund trades are executed in accordance with Rule 17a-7 of the 1940 Act. Interfund trades are included within the respective purchases and sales amounts shown in the Purchases and Sales of Investments note.
Other. During the period, the investment adviser reimbursed the Fund for certain losses in the amount of $14,619.
6. Committed Line of Credit.
The Fund participates with other funds managed by the investment adviser or an affiliate in a $4.25 billion credit facility (the "line of credit") to be utilized for temporary or emergency purposes to fund shareholder redemptions or for other short-term liquidity purposes. The Fund has agreed to pay commitment fees on its pro-rata portion of the line of credit, which amounted to $7,828 and is reflected in Commitment fees on the Statement of Operations. During the period, the Fund did not borrow on this line of credit.
7. Security Lending.
The Fund lends portfolio securities through a lending agent from time to time in order to earn additional income. For equity securities, a lending agent is used and may loan securities to certain qualified borrowers, including Fidelity Capital Markets (FCM), a broker-dealer affiliated with the Fund. On the settlement date of the loan, the Fund receives collateral (in the form of U.S. Treasury obligations, letters of credit and/or cash) against the loaned securities and maintains collateral in an amount not less than 100% of the market value of the loaned securities during the period of the loan. The market value of the loaned securities is determined at the close of business of the Fund and any additional required collateral is delivered to the Fund on the next business day. The Fund or borrower may terminate the loan at any time, and if the borrower defaults on its obligation to return the securities loaned because of insolvency or other reasons, the Fund may apply collateral received from the borrower against the obligation. The Fund may experience delays and costs in recovering the securities loaned. Any cash collateral received is invested in the Fidelity Securities Lending Cash Central Fund. The value of loaned securities and cash collateral at period end are disclosed on the Fund's Statement of Assets and Liabilities. The value of securities loaned to FCM at period end was $2,262,822. Security lending income represents the income earned on investing cash collateral, less rebates paid to borrowers and any lending agent fees associated with the loan, plus any premium payments received for lending certain types of securities. Security lending income is presented in the Statement of Operations as a component of income from Fidelity Central Funds. Total security lending income during the period amounted to $631,262, including $65,210 from securities loaned to FCM.
8. Distributions to Shareholders.
Distributions to shareholders of each class were as follows:
| | Six months ended
January 31, 2019 | Year ended
July 31, 2018 |
| Distributions to shareholders | | |
| Series Blue Chip Growth | $763,496,173 | $– |
| Total | $763,496,173 | $– |
| From net investment income | | |
| Series Blue Chip Growth | $– | $30,301,164 |
| Total | $– | $30,301,164 |
| From net realized gain | | |
| Series Blue Chip Growth | $– | $594,846,797 |
| Total | $– | $594,846,797 |
9. Share Transactions.
Transactions for each class of shares were as follows:
| | Shares | Shares | Dollars | Dollars |
| | Six months ended January 31, 2019 | Year ended July 31, 2018 | Six months ended January 31, 2019 | Year ended July 31, 2018 |
| Series Blue Chip Growth | | | | |
| Shares sold | 13,400,758 | 269,791,046 | $187,566,550 | $3,797,539,895 |
| Reinvestment of distributions | 52,744,114 | 46,816,082 | 763,496,173 | 625,147,961 |
| Shares redeemed | (22,292,046) | (95,983,048) | (327,048,158) | (1,414,376,373) |
| Net increase (decrease) | 43,852,826 | 220,624,080 | $624,014,565 | $3,008,311,483 |
| Class F | | | | |
| Shares sold | – | 1,143,506 | $– | $16,094,327 |
| Shares redeemed | – | (236,497,813) | – | (3,318,636,982) |
| Net increase (decrease) | – | (235,354,307) | $– | $(3,302,542,655) |
10. Other.
The Fund's organizational documents provide former and current trustees and officers with a limited indemnification against liabilities arising in connection with the performance of their duties to the Fund. In the normal course of business, the Fund may also enter into contracts that provide general indemnifications. The Fund's maximum exposure under these arrangements is unknown as this would be dependent on future claims that may be made against the Fund. The risk of material loss from such claims is considered remote.
At the end of the period, mutual funds managed by the investment adviser or its affiliates were the owners of record of all of the outstanding shares of the Fund.
Shareholder Expense Example
As a shareholder of the Fund, you incur two types of costs: (1) transaction costs and (2) ongoing costs, including other Fund expenses. This Example is intended to help you understand your ongoing costs (in dollars) of investing in the Fund and to compare these costs with the ongoing costs of investing in other mutual funds.
The Example is based on an investment of $1,000 invested at the beginning of the period and held for the entire period (August 1, 2018 to January 31, 2019).
Actual Expenses
The first line of the accompanying table provides information about actual account values and actual expenses. You may use the information in this line, together with the amount you invested, to estimate the expenses that you paid over the period. Simply divide your account value by $1,000.00 (for example, an $8,600 account value divided by $1,000.00 = 8.6), then multiply the result by the number in the first line under the heading entitled "Expenses Paid During Period" to estimate the expenses you paid on your account during this period. In addition, the Fund, as a shareholder in the underlying Fidelity Central Funds, will indirectly bear its pro-rata share of the fees and expenses incurred by the underlying Fidelity Central Funds. These fees and expenses are not included in the Fund's annualized expense ratio used to calculate the expense estimate in the table below.
Hypothetical Example for Comparison Purposes
The second line of the accompanying table provides information about hypothetical account values and hypothetical expenses based on the Fund's actual expense ratio and an assumed rate of return of 5% per year before expenses, which is not the Fund's actual return. The hypothetical account values and expenses may not be used to estimate the actual ending account balance or expenses you paid for the period. You may use this information to compare the ongoing costs of investing in the Fund and other funds. To do so, compare this 5% hypothetical example with the 5% hypothetical examples that appear in the shareholder reports of the other funds. In addition, the Fund, as a shareholder in the underlying Fidelity Central Funds, will indirectly bear its pro-rata share of the fees and expenses incurred by the underlying Fidelity Central Funds. These fees and expenses are not included in the Fund's annualized expense ratio used to calculate the expense estimate in the table below.
Please note that the expenses shown in the table are meant to highlight your ongoing costs only and do not reflect any transaction costs. Therefore, the second line of the table is useful in comparing ongoing costs only, and will not help you determine the relative total costs of owning different funds.
| | Annualized Expense Ratio-A | Beginning
Account Value
August 1, 2018 | Ending
Account Value
January 31, 2019 | Expenses Paid
During Period-B
August 1, 2018
to January 31, 2019 |
| Series Blue Chip Growth | .01% | | | |
| Actual | | $1,000.00 | $999.30 | $.05 |
| Hypothetical-C | | $1,000.00 | $1,025.16 | $.05 |
A Annualized expense ratio reflects expenses net of applicable fee waivers.
B Expenses are equal to the Fund's annualized expense ratio, multiplied by the average account value over the period, multiplied by 184/365 (to reflect the one-half year period).
C 5% return per year before expenses
Board Approval of Investment Advisory Contracts and Management Fees
Fidelity Series Blue Chip Growth Fund
Each year, the Board of Trustees, including the Independent Trustees (together, the Board), votes on the renewal of the management contract with Fidelity Management & Research Company (FMR) and the sub-advisory agreements (together, the Advisory Contracts) for the fund. FMR and the sub-advisers are referred to herein as the Investment Advisers. The Board, assisted by the advice of fund counsel and Independent Trustees' counsel, requests and considers a broad range of information relevant to the renewal of the Advisory Contracts throughout the year.
The Board meets regularly and, at each of its meetings, covers an extensive agenda of topics and materials and considers factors that are relevant to its annual consideration of the renewal of the fund's Advisory Contracts, including the services and support provided to the fund and its shareholders. The Board has established various standing committees (Committees), each composed of and chaired by Independent Trustees with varying backgrounds, to which the Board has assigned specific subject matter responsibilities in order to enhance effective decision-making by the Board. The Board, acting directly and through its Committees, requests and receives information concerning the annual consideration of the renewal of the fund's Advisory Contracts. The Board also meets as needed to review matters specifically related to the Board's annual consideration of the renewal of the Advisory Contracts. Members of the Board may also meet with trustees of other Fidelity funds through joint ad hoc committees to discuss certain matters relevant to all of the Fidelity funds.
At its January 2019 meeting, the Board unanimously determined to renew the fund's Advisory Contracts. In considering whether to renew the Advisory Contracts for the fund, the Board considered all factors it believed relevant and reached a determination, with the assistance of fund counsel and Independent Trustees' counsel and through the exercise of its business judgment, that the renewal of the Advisory Contracts was in the best interests of the fund and its shareholders and the fact that no fee is payable under the management contract was fair and reasonable.
Nature, Extent, and Quality of Services Provided. The Board considered Fidelity's staffing as it relates to the fund, including the backgrounds of investment personnel of Fidelity, and also considered the fund's investment objective, strategies, and related investment philosophy. The Independent Trustees also had discussions with senior management of Fidelity's investment operations and investment groups. The Board considered the structure of the investment personnel compensation program and whether this structure provides appropriate incentives to act in the best interests of the fund.
Resources Dedicated to Investment Management and Support Services. The Board and the Fund Oversight and Research Committees reviewed the general qualifications and capabilities of Fidelity's investment staff, including its size, education, experience, and resources, as well as Fidelity's approach to recruiting, training, managing, and compensating investment personnel. The Board noted that Fidelity has continued to increase the resources devoted to non-U.S. offices, including expansion of Fidelity's global investment organization. The Board also noted that Fidelity's analysts have extensive resources, tools and capabilities that allow them to conduct sophisticated quantitative and fundamental analysis, as well as credit analysis of issuers, counterparties and guarantors. Further, the Board considered that Fidelity's investment professionals have sufficient access to global information and data so as to provide competitive investment results over time, and that those professionals also have access to sophisticated tools that permit them to assess portfolio construction and risk and performance attribution characteristics continuously, as well as to transmit new information and research conclusions rapidly around the world. Additionally, in its deliberations, the Board considered Fidelity's trading, risk management, compliance, and technology and operations capabilities and resources, which are integral parts of the investment management process.
Administrative Services. The Board considered (i) the nature, extent, quality, and cost of advisory and administrative services performed by the Investment Advisers and their affiliates under the Advisory Contracts and under separate agreements covering transfer agency, pricing and bookkeeping, and securities lending services for the fund; (ii) the nature and extent of the supervision of third party service providers, principally custodians, subcustodians, and pricing vendors; and (iii) the resources devoted to, and the record of compliance with, the fund's compliance policies and procedures. The Board also reviewed the allocation of fund brokerage, including allocations to brokers affiliated with the Investment Advisers, the use of brokerage commissions to pay fund expenses, and the use of "soft" commission dollars to pay for research services.
Investment Performance. The Board considered whether the fund has operated in accordance with its investment objective, as well as its record of compliance with its investment restrictions. The Board reviewed the fund's absolute investment performance, as well as the fund's relative investment performance, but did not consider performance to be a material factor in its decision to renew the fund's Advisory Contracts, as the fund is not publicly offered as a stand-alone investment product. In this regard, the Board noted that the fund is designed to offer an investment option for other investment companies managed by Fidelity and ultimately to enhance the performance of those investment companies.
Based on its review, the Board concluded that the nature, extent, and quality of services provided to the fund under the Advisory Contracts should continue to benefit the shareholders of the fund.
Competitiveness of Management Fee and Total Expense Ratio. The Board considered that the fund does not pay FMR a management fee for investment advisory services. The Board also noted that FMR or an affiliate undertakes to pay all operating expenses of the fund with certain exceptions.
In connection with the renewal of the Advisory Contracts, the Board also approved amendments to the management contract for the fund to clarify that the fund pays its non-operating expenses, including brokerage commissions and fees and expenses associated with the fund's securities lending program. The Board considered that the amendments would not change the services provided to the fund or the party responsible for making such payments under the current management contract.
The Board further considered that FMR has contractually agreed to reimburse the fund to the extent that total operating expenses, with certain exceptions, as a percentage of its average net assets, exceed 0.014% through September 30, 2020.
Based on its review, the Board considered that the fund does not pay a management fee and concluded that the total expense ratio of each class of the fund was reasonable in light of the services that the fund and its shareholders receive and the other factors considered.
Costs of the Services and Profitability. The Board considered the level of Fidelity's profits in respect of all the Fidelity funds.
PricewaterhouseCoopers LLP (PwC), auditor to Fidelity and certain Fidelity funds, has been engaged annually by the Board as part of the Board's assessment of Fidelity's profitability analysis. PwC's engagement includes the review and assessment of the methodologies used by Fidelity in determining the revenues and expenses attributable to Fidelity's mutual fund business, and completion of agreed-upon procedures in respect of the mathematical accuracy of the fund profitability information and its conformity to established allocation methodologies. After considering PwC's reports issued under the engagement and information provided by Fidelity, the Board concluded that while other allocation methods may also be reasonable, Fidelity's profitability methodologies are reasonable in all material respects.
The Board also reviewed Fidelity's non-fund businesses and potential indirect benefits such businesses may have received as a result of their association with Fidelity's mutual fund business (i.e., fall-out benefits) as well as cases where Fidelity's affiliates may benefit from the fund's business. The Board noted that changes to fall-out benefits year-over-year reflect business developments at Fidelity's various businesses.
The Board concluded that the costs of the services provided by and the profits realized by Fidelity in connection with the operation of the fund were not relevant to the renewal of the Advisory Contracts because the fund pays no advisory fees and FMR or an affiliate bears all expenses of the fund with certain exceptions.
Economies of Scale. The Board concluded that because the fund pays no advisory fees and FMR or an affiliate bears all expenses of the fund with certain exceptions, the realization of economies of scale was not a material factor in the Board's decision to renew the fund's Advisory Contracts.
Additional Information Requested by the Board. In order to develop fully the factual basis for consideration of the Fidelity funds' advisory contracts, the Board requested and received additional information on certain topics, including: (i) fund performance trends, in particular the underperformance of certain funds, and Fidelity's long-term strategies for certain funds; (ii) Fidelity's fund profitability methodology, profitability trends for certain funds, and the impact of certain factors on fund profitability results; (iii) metrics for evaluating index fund and ETF performance and information about ETF trading characteristics; (iv) the methodology with respect to the evaluation of competitive fund data and peer group classifications and fee comparisons; (v) the expense structures for different funds and classes; (vi) information regarding other accounts managed by Fidelity, including collective investment trusts; and (vii) Fidelity's philosophies and strategies for evaluating funds and classes with lower or declining asset levels.
Based on its evaluation of all of the conclusions noted above, and after considering all factors it believed relevant, the Board concluded that the advisory fee arrangements are fair and reasonable, and that the fund's Advisory Contracts should be renewed.
XS1-SANN-0319
1.967988.105
Fidelity® Series Real Estate Income Fund
Semi-Annual Report January 31, 2019 |
|
Beginning on January 1, 2021, as permitted by regulations adopted by the Securities and Exchange Commission, paper copies of a fund’s shareholder reports will no longer be sent by mail, unless you specifically request paper copies of the reports from the fund or from your financial intermediary, such as a financial advisor, broker-dealer or bank. Instead, the reports will be made available on a website, and you will be notified by mail each time a report is posted and provided with a website link to access the report.
If you already elected to receive shareholder reports electronically, you will not be affected by this change and you need not take any action. You may elect to receive shareholder reports and other communications from a fund electronically, by contacting your financial intermediary. For Fidelity customers, visit Fidelity's web site or call Fidelity using the contact information listed below.
You may elect to receive all future reports in paper free of charge. If you wish to continue receiving paper copies of your shareholder reports, you may contact your financial intermediary or, if you are a Fidelity customer, visit Fidelity’s website, or call Fidelity at the applicable toll-free number listed below. Your election to receive reports in paper will apply to all funds held with the fund complex/your financial intermediary.
| Account Type | Website | Phone Number |
| Brokerage, Mutual Fund, or Annuity Contracts: | fidelity.com/mailpreferences | 1-800-343-3548 |
| Employer Provided Retirement Accounts: | netbenefits.fidelity.com/preferences (choose 'no' under Required Disclosures to continue to print) | 1-800-343-0860 |
| Advisor Sold Accounts Serviced Through Your Financial Intermediary: | Contact Your Financial Intermediary | Your Financial Intermediary's phone number |
| Advisor Sold Accounts Serviced by Fidelity: | institutional.fidelity.com | 1-877-208-0098 |
Contents
To view a fund's proxy voting guidelines and proxy voting record for the 12-month period ended June 30, visit http://www.fidelity.com/proxyvotingresults or visit the Securities and Exchange Commission's (SEC) web site at http://www.sec.gov.
You may also call 1-800-544-8544 to request a free copy of the proxy voting guidelines.
Standard & Poor's, S&P and S&P 500 are registered service marks of The McGraw-Hill Companies, Inc. and have been licensed for use by Fidelity Distributors Corporation.
Other third-party marks appearing herein are the property of their respective owners.
All other marks appearing herein are registered or unregistered trademarks or service marks of FMR LLC or an affiliated company. © 2019 FMR LLC. All rights reserved.
This report and the financial statements contained herein are submitted for the general information of the shareholders of the Fund. This report is not authorized for distribution to prospective investors in the Fund unless preceded or accompanied by an effective prospectus.
A fund files its complete schedule of portfolio holdings with the SEC for the first and third quarters of each fiscal year on Form N-Q. Forms N-Q are available on the SEC’s web site at http://www.sec.gov. A fund's Forms N-Q may be reviewed and copied at the SEC’s Public Reference Room in Washington, DC. Information regarding the operation of the SEC's Public Reference Room may be obtained by calling 1-800-SEC-0330.
For a complete list of a fund's portfolio holdings, view the most recent holdings listing, semiannual report, or annual report on Fidelity's web site at http://www.fidelity.com, http://www.institutional.fidelity.com, or http://www.401k.com, as applicable.
NOT FDIC INSURED •MAY LOSE VALUE •NO BANK GUARANTEE
Neither the Fund nor Fidelity Distributors Corporation is a bank.
Investment Summary (Unaudited)
Top Five Stocks as of January 31, 2019
| | % of fund's net assets |
| Equity Lifestyle Properties, Inc. | 1.5 |
| Apartment Investment & Management Co. Class A | 1.4 |
| Ventas, Inc. | 1.3 |
| American Tower Corp. | 1.2 |
| Acadia Realty Trust (SBI) | 1.1 |
| | 6.5 |
Top 5 Bonds as of January 31, 2019
| | % of fund's net assets |
| Senior Housing Properties Trust 4.75% 5/1/24 | 1.3 |
| RWT Holdings, Inc. 5.625% 11/15/19 | 1.2 |
| Kennedy-Wilson, Inc. 5.875% 4/1/24 | 1.1 |
| Howard Hughes Corp. 5.375% 3/15/25 | 0.8 |
| PennyMac Corp. 5.375% 5/1/20 | 0.8 |
| | 5.2 |
Top Five REIT Sectors as of January 31, 2019
| | % of fund's net assets |
| REITs - Mortgage | 18.7 |
| REITs - Health Care | 7.1 |
| REITs - Diversified | 6.6 |
| REITs - Apartments | 4.8 |
| REITs - Shopping Centers | 2.6 |
Asset Allocation (% of fund's net assets)
| As of January 31, 2019* |
| | Stocks | 36.5% |
| | Bonds | 46.4% |
| | Convertible Securities | 8.2% |
| | Other Investments | 5.2% |
| | Short-Term Investments and Net Other Assets (Liabilities) | 3.7% |

* Foreign investments - 1.6%
Schedule of Investments January 31, 2019 (Unaudited)
Showing Percentage of Net Assets
| Common Stocks - 15.3% | | | |
| | | Shares | Value |
| CONSUMER DISCRETIONARY - 0.2% | | | |
| Hotels, Restaurants & Leisure - 0.2% | | | |
| Wyndham Destinations, Inc. | | 22,700 | $956,578 |
| Wyndham Hotels & Resorts, Inc. | | 15,000 | 736,350 |
| | | | 1,692,928 |
| FINANCIALS - 2.4% | | | |
| Capital Markets - 0.2% | | | |
| Ellington Financial LLC | | 124,800 | 2,064,192 |
| Insurance - 0.1% | | | |
| FNF Group | | 28,900 | 1,045,024 |
| Mortgage Real Estate Investment Trusts - 2.1% | | | |
| Anworth Mortgage Asset Corp. | | 35,512 | 158,739 |
| Chimera Investment Corp. | | 108,200 | 2,059,046 |
| Dynex Capital, Inc. | | 228,800 | 1,377,376 |
| Ellington Residential Mortgage REIT | | 39,900 | 465,234 |
| Great Ajax Corp. | | 199,926 | 2,581,045 |
| Hunt Companies Finance Trust, Inc. | | 17,008 | 57,827 |
| Invesco Mortgage Capital, Inc. | | 92,100 | 1,482,810 |
| MFA Financial, Inc. | | 1,215,000 | 8,905,950 |
| New Residential Investment Corp. | | 12,200 | 207,156 |
| Redwood Trust, Inc. | | 99,400 | 1,603,322 |
| Two Harbors Investment Corp. | | 26,600 | 388,094 |
| | | | 19,286,599 |
|
| TOTAL FINANCIALS | | | 22,395,815 |
|
| REAL ESTATE - 12.7% | | | |
| Equity Real Estate Investment Trusts (REITs) - 12.5% | | | |
| Acadia Realty Trust (SBI) | | 335,400 | 9,636,042 |
| American Homes 4 Rent Class A | | 18,667 | 412,727 |
| American Tower Corp. | | 64,300 | 11,113,612 |
| Apartment Investment & Management Co. Class A | | 254,701 | 12,612,794 |
| AvalonBay Communities, Inc. | | 17,600 | 3,395,392 |
| Brixmor Property Group, Inc. | | 11,500 | 196,995 |
| Cedar Realty Trust, Inc. | | 32,200 | 112,378 |
| Colony Capital, Inc. | | 698,199 | 4,238,068 |
| Crown Castle International Corp. | | 33,000 | 3,862,980 |
| DDR Corp. | | 154,200 | 2,015,394 |
| Equinix, Inc. | | 15,300 | 6,028,200 |
| Equity Lifestyle Properties, Inc. | | 125,800 | 13,319,700 |
| Equity Residential (SBI) | | 57,200 | 4,150,432 |
| Extra Space Storage, Inc. | | 3,100 | 305,691 |
| Healthcare Realty Trust, Inc. | | 47,500 | 1,533,775 |
| Healthcare Trust of America, Inc. | | 98,950 | 2,812,159 |
| Lexington Corporate Properties Trust | | 334,422 | 3,213,795 |
| Mid-America Apartment Communities, Inc. | | 70,814 | 7,172,042 |
| Monmouth Real Estate Investment Corp. Class A | | 14,600 | 200,604 |
| Omega Healthcare Investors, Inc. | | 28,800 | 1,157,472 |
| Outfront Media, Inc. | | 36,700 | 761,525 |
| Public Storage | | 4,000 | 850,080 |
| Sabra Health Care REIT, Inc. | | 226,600 | 4,654,364 |
| Safety Income and Growth, Inc. | | 46,000 | 811,440 |
| Senior Housing Properties Trust (SBI) | | 185,800 | 2,558,466 |
| Spirit MTA REIT | | 9,630 | 75,307 |
| Store Capital Corp. | | 68,900 | 2,226,848 |
| Terreno Realty Corp. | | 39,680 | 1,600,691 |
| UMH Properties, Inc. | | 20,000 | 280,600 |
| Ventas, Inc. | | 177,728 | 11,461,679 |
| VEREIT, Inc. | | 146,800 | 1,186,144 |
| | | | 113,957,396 |
| Real Estate Management & Development - 0.2% | | | |
| Colony NorthStar Credit Real Estate, Inc. | | 90,100 | 1,505,571 |
| Retail Value, Inc. | | 18,694 | 568,485 |
| | | | 2,074,056 |
|
| TOTAL REAL ESTATE | | | 116,031,452 |
|
| TOTAL COMMON STOCKS | | | |
| (Cost $111,057,720) | | | 140,120,195 |
|
| Preferred Stocks - 23.5% | | | |
| Convertible Preferred Stocks - 2.3% | | | |
| FINANCIALS - 1.0% | | | |
| Mortgage Real Estate Investment Trusts - 1.0% | | | |
| Great Ajax Corp. 7.25% | | 306,500 | 7,435,690 |
| ZAIS Financial Corp. 7.00% | | 68,900 | 1,766,596 |
| | | | 9,202,286 |
| REAL ESTATE - 1.3% | | | |
| Equity Real Estate Investment Trusts (REITs) - 1.1% | | | |
| Alexandria Real Estate Equities, Inc. Series D, 7.00% | | 8,241 | 290,354 |
| Braemar Hotels & Resorts, Inc. 5.50% | | 17,783 | 335,210 |
| iStar Financial, Inc. Series J, 4.50% | | 44,700 | 1,956,501 |
| Lexington Corporate Properties Trust Series C, 6.50% | | 70,019 | 3,430,931 |
| QTS Realty Trust, Inc. 6.50% | | 8,000 | 827,827 |
| RLJ Lodging Trust Series A, 1.95% | | 38,600 | 985,072 |
| Wheeler REIT, Inc. 8.75% | | 208,000 | 2,494,606 |
| | | | 10,320,501 |
| Real Estate Management & Development - 0.2% | | | |
| Landmark Infrastructure Partners LP 7.012% | | 55,500 | 1,372,165 |
| TOTAL REAL ESTATE | | | 11,692,666 |
|
| TOTAL CONVERTIBLE PREFERRED STOCKS | | | 20,894,952 |
|
| Nonconvertible Preferred Stocks - 21.2% | | | |
| FINANCIALS - 10.7% | | | |
| Capital Markets - 0.1% | | | |
| Arlington Asset Investment Corp. 6.625% | | 31,528 | 746,999 |
| Mortgage Real Estate Investment Trusts - 10.6% | | | |
| AG Mortgage Investment Trust, Inc.: | | | |
| 8.00% | | 137,584 | 3,524,902 |
| 8.25% | | 1,300 | 33,020 |
| AGNC Investment Corp.: | | | |
| Series B, 7.75% | | 29,100 | 731,865 |
| Series C, 7.00% | | 61,500 | 1,559,025 |
| Annaly Capital Management, Inc.: | | | |
| Series C, 7.625% | | 14,664 | 373,785 |
| Series D, 7.50% | | 81,400 | 2,071,630 |
| Series F, 6.95% | | 206,600 | 5,218,716 |
| Series G, 6.50% | | 118,900 | 2,834,576 |
| Series H, 8.125% | | 33,100 | 847,625 |
| Anworth Mortgage Asset Corp. Series A, 8.625% | | 108,738 | 2,804,212 |
| Apollo Commercial Real Estate Finance, Inc. Series C, 8.00% | | 89,058 | 2,258,511 |
| Arbor Realty Trust, Inc.: | | | |
| Series A, 8.25% | | 41,922 | 1,077,630 |
| Series B, 7.75% | | 40,000 | 1,017,660 |
| Series C, 8.50% | | 15,000 | 384,275 |
| Armour Residential REIT, Inc. Series B, 7.875% | | 25,701 | 635,329 |
| Capstead Mortgage Corp. Series E, 7.50% | | 37,016 | 932,803 |
| Cherry Hill Mortgage Investment Corp. Series A, 8.20% | | 61,500 | 1,534,757 |
| Chimera Investment Corp.: | | | |
| 8.00% (a) | | 97,110 | 2,466,594 |
| Series A, 8.00% | | 36,200 | 929,978 |
| Series B, 8.00% | | 328,858 | 8,471,382 |
| Series C, 7.75% | | 166,514 | 4,139,538 |
| Dynex Capital, Inc.: | | | |
| Series A, 8.50% | | 96,313 | 2,453,082 |
| Series B, 7.625% | | 47,335 | 1,123,970 |
| Exantas Capital Corp. 8.625% | | 2,011 | 50,275 |
| Hunt Companies Finance Trust, Inc. Series A, 8.75% | | 28,863 | 723,018 |
| Invesco Mortgage Capital, Inc.: | | | |
| 7.50% | | 381,256 | 9,188,270 |
| Series A, 7.75% | | 30,151 | 752,267 |
| Series B, 7.75% | | 226,916 | 5,804,511 |
| MFA Financial, Inc.: | | | |
| 8.00% | | 108,747 | 2,781,748 |
| Series B, 7.50% | | 188,749 | 4,745,150 |
| New York Mortgage Trust, Inc.: | | | |
| Series B, 7.75% | | 78,802 | 1,808,506 |
| Series C, 7.875% | | 117,633 | 2,734,967 |
| Series D, 8.00% | | 74,400 | 1,688,880 |
| PennyMac Mortgage Investment Trust: | | | |
| 8.125% | | 70,600 | 1,782,650 |
| Series B, 8.00% | | 108,600 | 2,717,172 |
| Two Harbors Investment Corp.: | | | |
| 7.50% | | 113,333 | 2,716,592 |
| 7.75% | | 10,314 | 254,508 |
| Series A, 8.125% | | 104,500 | 2,747,253 |
| Series B, 7.625% | | 220,055 | 5,466,166 |
| Series C, 7.25% | | 123,545 | 2,972,493 |
| Wells Fargo Real Estate Investment Corp. Series A, 6.375% | | 23,000 | 598,000 |
| | | | 96,957,291 |
| TOTAL FINANCIALS | | | 97,704,290 |
| REAL ESTATE - 10.4% | | | |
| Equity Real Estate Investment Trusts (REITs) - 10.4% | | | |
| American Homes 4 Rent: | | | |
| 6.25% | | 17,800 | 438,592 |
| Series D, 6.50% | | 40,000 | 961,600 |
| Series E, 6.35% | | 46,100 | 1,065,371 |
| Series F, 5.875% | | 44,883 | 1,031,411 |
| Series G, 5.875% | | 34,800 | 767,688 |
| Ashford Hospitality Trust, Inc.: | | | |
| Series D, 8.45% | | 12,945 | 313,657 |
| Series F, 7.375% | | 53,100 | 1,099,701 |
| Series G, 7.375% | | 25,579 | 548,925 |
| Series H, 7.50% | | 33,400 | 719,770 |
| Series I, 7.50% | | 55,811 | 1,163,659 |
| Bluerock Residential Growth (REIT), Inc.: | | | |
| Series A, 8.25% | | 102,400 | 2,614,272 |
| Series C, 7.625% | | 27,200 | 685,440 |
| Series D, 7.125% | | 30,000 | 697,800 |
| Braemar Hotels & Resorts, Inc. Series D, 8.25% | | 33,200 | 810,077 |
| Brookfield Property REIT, Inc. 6.375% | | 38,990 | 912,366 |
| Cedar Realty Trust, Inc.: | | | |
| Series B, 7.25% | | 24,806 | 590,135 |
| Series C, 6.50% | | 50,200 | 1,003,749 |
| City Office REIT, Inc. Series A, 6.625% | | 25,500 | 547,485 |
| Colony Capital, Inc.: | | | |
| Series B, 8.25% | | 42,790 | 1,080,448 |
| Series E, 8.75% | | 95,816 | 2,457,680 |
| Series G, 7.50% | | 72,608 | 1,613,081 |
| Series H, 7.125% | | 178,912 | 3,739,261 |
| Series I, 7.15% | | 196,135 | 4,148,255 |
| Series J, 7.15% | | 263,637 | 5,541,650 |
| DDR Corp.: | | | |
| Series J, 6.50% | | 70,181 | 1,743,998 |
| Series K, 6.25% | | 25,489 | 617,344 |
| Digital Realty Trust, Inc.: | | | |
| Series C, 6.625% | | 16,000 | 414,400 |
| Series G, 5.875% | | 28,270 | 713,818 |
| Series H, 7.375% | | 10,000 | 252,100 |
| Farmland Partners, Inc. Series B, 6.00% | | 110,000 | 2,616,900 |
| Gladstone Commercial Corp. Series D, 7.00% | | 101,200 | 2,552,264 |
| Gladstone Land Corp. Series A, 6.375% | | 11,000 | 281,931 |
| Global Medical REIT, Inc. Series A, 7.50% | | 22,800 | 565,440 |
| Global Net Lease, Inc. Series A, 7.25% | | 123,600 | 2,936,736 |
| Government Properties Income Trust 5.875% | | 37,500 | 882,750 |
| Hersha Hospitality Trust Series D, 6.50% | | 40,000 | 865,200 |
| Investors Real Estate Trust Series C, 6.625% | | 54,100 | 1,303,810 |
| iStar Financial, Inc.: | | | |
| Series D, 8.00% | | 62,442 | 1,582,280 |
| Series G, 7.65% | | 97,500 | 2,262,000 |
| Series I, 7.50% | | 26,900 | 638,606 |
| Jernigan Capital, Inc. Series B, 7.00% | | 26,800 | 632,480 |
| Kimco Realty Corp. Series M, 5.25% | | 22,400 | 493,472 |
| Monmouth Real Estate Investment Corp. Series C, 6.125% | | 40,400 | 950,208 |
| National Retail Properties, Inc. Series E, 5.70% | | 46,124 | 1,160,019 |
| National Storage Affiliates Trust Series A, 6.00% | | 11,300 | 276,511 |
| Pebblebrook Hotel Trust: | | | |
| 6.30% | | 40,000 | 1,018,800 |
| 6.375% | | 47,339 | 1,230,814 |
| Series C, 6.50% | | 71,130 | 1,813,815 |
| Series D, 6.375% | | 50,000 | 1,279,000 |
| Pennsylvania (REIT): | | | |
| Series B, 7.375% | | 55,408 | 1,125,336 |
| Series C, 7.20% | | 9,000 | 172,529 |
| Series D, 6.875% | | 25,700 | 489,328 |
| Plymouth Industrial REIT, Inc. Series A, 7.50% | | 28,100 | 681,425 |
| Prologis, Inc. Series Q, 8.54% (b) | | 15,800 | 950,054 |
| PS Business Parks, Inc. Series U, 5.75% | | 102,483 | 2,398,102 |
| Public Storage: | | | |
| Series F, 5.15% | | 28,000 | 644,560 |
| Series Y, 6.375% | | 19,826 | 503,779 |
| QTS Realty Trust, Inc. Series A, 7.125% | | 32,500 | 828,750 |
| RAIT Financial Trust 7.625% | | 46,080 | 829,901 |
| Rexford Industrial Realty, Inc.: | | | |
| Series A, 5.875% | | 25,000 | 578,250 |
| Series B, 5.875% | | 49,100 | 1,152,868 |
| Saul Centers, Inc.: | | | |
| Series C, 6.875% | | 40,477 | 1,039,449 |
| Series D, 6.125% | | 15,000 | 343,800 |
| Sotherly Hotels, Inc.: | | | |
| Series B, 8.00% | | 12,000 | 287,880 |
| Series C, 7.875% | | 18,100 | 426,367 |
| Spirit Realty Capital, Inc. Series A, 6.00% | | 15,500 | 352,315 |
| Stag Industrial, Inc. Series C, 6.875% | | 17,000 | 438,600 |
| Summit Hotel Properties, Inc.: | | | |
| Series D, 6.45% | | 40,000 | 950,800 |
| Series E, 6.25% | | 32,000 | 672,000 |
| Sunstone Hotel Investors, Inc.: | | | |
| Series E, 6.95% | | 8,000 | 209,200 |
| Series F, 6.45% | | 16,000 | 383,040 |
| Taubman Centers, Inc. Series K, 6.25% | | 19,561 | 487,145 |
| UMH Properties, Inc.: | | | |
| Series B, 8.00% | | 150,700 | 3,934,777 |
| Series C, 6.75% | | 58,520 | 1,436,666 |
| Series D, 6.375% | | 19,700 | 458,025 |
| Urstadt Biddle Properties, Inc.: | | | |
| Series G, 6.75% | | 33,500 | 840,850 |
| Series H, 6.25% | | 48,000 | 1,154,880 |
| VEREIT, Inc. Series F, 6.70% | | 254,483 | 6,405,337 |
| Washington Prime Group, Inc.: | | | |
| Series H, 7.50% | | 53,575 | 870,594 |
| Series I, 6.875% | | 10,483 | 165,346 |
| | | | 94,848,722 |
| Real Estate Management & Development - 0.0% | | | |
| Landmark Infrastructure Partners LP Series B, 7.90% | | 20,800 | 494,416 |
| TOTAL REAL ESTATE | | | 95,343,138 |
| UTILITIES - 0.1% | | | |
| Multi-Utilities - 0.1% | | | |
| Brookfield Infrastructure Partners LP Series 5, 5.35% | | 30,700 | 573,135 |
|
| TOTAL NONCONVERTIBLE PREFERRED STOCKS | | | 193,620,563 |
|
| TOTAL PREFERRED STOCKS | | | |
| (Cost $219,154,238) | | | 214,515,515 |
| | | Principal Amount | Value |
|
| Corporate Bonds - 24.9% | | | |
| Convertible Bonds - 5.9% | | | |
| FINANCIALS - 5.6% | | | |
| Diversified Financial Services - 0.4% | | | |
| Granite Point Mortgage Trust, Inc.: | | | |
| 5.625% 12/1/22 (c) | | 2,620,000 | 2,651,885 |
| 6.375% 10/1/23 | | 1,200,000 | 1,215,589 |
| | | | 3,867,474 |
| Mortgage Real Estate Investment Trusts - 5.2% | | | |
| Apollo Commercial Real Estate Finance, Inc. 5.375% 10/15/23 | | 300,000 | 291,750 |
| Arbor Realty Trust, Inc. 5.25% 7/1/21 (c) | | 1,200,000 | 1,203,000 |
| Blackstone Mortgage Trust, Inc.: | | | |
| 4.375% 5/5/22 | | 2,940,000 | 2,917,829 |
| 4.75% 3/15/23 | | 1,600,000 | 1,582,976 |
| Colony Financial, Inc.: | | | |
| 3.875% 1/15/21 | | 5,220,000 | 4,940,730 |
| 5% 4/15/23 | | 3,395,000 | 3,124,456 |
| Exantas Capital Corp. 8% 1/15/20 | | 1,810,000 | 1,864,300 |
| KKR Real Estate Finance Trust, Inc. 6.125% 5/15/23 (c) | | 1,400,000 | 1,390,453 |
| PennyMac Corp. 5.375% 5/1/20 | | 6,884,000 | 6,807,271 |
| Redwood Trust, Inc.: | | | |
| 4.75% 8/15/23 | | 950,000 | 889,519 |
| 5.625% 7/15/24 | | 3,709,000 | 3,651,421 |
| RWT Holdings, Inc. 5.625% 11/15/19 | | 11,250,000 | 11,285,685 |
| Starwood Property Trust, Inc. 4.375% 4/1/23 | | 2,680,000 | 2,655,116 |
| Two Harbors Investment Corp. 6.25% 1/15/22 | | 780,000 | 782,756 |
| Western Asset Mortgage Capital Corp. 6.75% 10/1/22 | | 4,289,000 | 4,071,981 |
| | | | 47,459,243 |
| TOTAL FINANCIALS | | | 51,326,717 |
| REAL ESTATE - 0.3% | | | |
| Equity Real Estate Investment Trusts (REITs) - 0.3% | | | |
| American Realty Capital Properties, Inc. 3.75% 12/15/20 | | 2,660,000 | 2,627,083 |
|
| TOTAL CONVERTIBLE BONDS | | | 53,953,800 |
|
| Nonconvertible Bonds - 19.0% | | | |
| COMMUNICATION SERVICES - 0.0% | | | |
| Media - 0.0% | | | |
| CBS Outdoor Americas Capital LLC/CBS Outdoor Americas Capital Corp. 5.625% 2/15/24 | | 240,000 | 242,700 |
| CONSUMER DISCRETIONARY - 5.0% | | | |
| Hotels, Restaurants & Leisure - 0.9% | | | |
| ESH Hospitality, Inc. 5.25% 5/1/25 (c) | | 3,460,000 | 3,420,556 |
| FelCor Lodging LP 6% 6/1/25 | | 1,380,000 | 1,417,950 |
| Hilton Grand Vacations Borrower LLC/Hilton Grand Vacations Borrower, Inc. 6.125% 12/1/24 | | 460,000 | 465,750 |
| Times Square Hotel Trust 8.528% 8/1/26 (c) | | 1,926,949 | 2,216,630 |
| | | | 7,520,886 |
| Household Durables - 4.1% | | | |
| Ashton Woods U.S.A. LLC/Ashton Woods Finance Co.: | | | |
| 6.75% 8/1/25 (c) | | 3,070,000 | 2,739,975 |
| 6.875% 2/15/21 (c) | | 2,669,000 | 2,595,603 |
| Beazer Homes U.S.A., Inc.: | | | |
| 5.875% 10/15/27 | | 1,720,000 | 1,462,000 |
| 6.75% 3/15/25 | | 1,535,000 | 1,373,825 |
| 8.75% 3/15/22 | | 1,030,000 | 1,076,865 |
| Brookfield Residential Properties, Inc./Brookfield Residential U.S. Corp. 6.125% 7/1/22 (c) | | 1,060,000 | 1,038,800 |
| Brookfield Residential Properties, Inc.: | | | |
| 6.375% 5/15/25 (c) | | 2,000,000 | 1,875,000 |
| 6.5% 12/15/20 (c) | | 2,425,000 | 2,437,125 |
| KB Home 8% 3/15/20 | | 2,395,000 | 2,493,794 |
| LGI Homes, Inc. 6.875% 7/15/26 (c) | | 2,810,000 | 2,704,625 |
| M/I Homes, Inc.: | | | |
| 5.625% 8/1/25 | | 1,395,000 | 1,276,425 |
| 6.75% 1/15/21 | | 735,000 | 742,350 |
| Meritage Homes Corp.: | | | |
| 5.125% 6/6/27 | | 885,000 | 794,004 |
| 6% 6/1/25 | | 3,085,000 | 3,054,150 |
| 7% 4/1/22 | | 2,005,000 | 2,107,756 |
| 7.15% 4/15/20 | | 1,940,000 | 2,007,900 |
| New Home Co. LLC 7.25% 4/1/22 | | 2,515,000 | 2,307,513 |
| Taylor Morrison Communities, Inc./Monarch Communities, Inc. 5.875% 4/15/23 (c) | | 760,000 | 752,400 |
| TRI Pointe Homes, Inc.: | | | |
| 5.25% 6/1/27 | | 1,305,000 | 1,128,825 |
| 5.875% 6/15/24 | | 805,000 | 775,819 |
| William Lyon Homes, Inc.: | | | |
| 5.875% 1/31/25 | | 1,915,000 | 1,685,200 |
| 7% 8/15/22 | | 1,245,000 | 1,241,888 |
| | | | 37,671,842 |
| TOTAL CONSUMER DISCRETIONARY | | | 45,192,728 |
| CONSUMER STAPLES - 0.8% | | | |
| Food & Staples Retailing - 0.8% | | | |
| Albertsons Companies LLC/Safeway, Inc./New Albertson's, Inc./Albertson's LLC: | | | |
| 5.75% 3/15/25 | | 2,670,000 | 2,499,788 |
| 6.625% 6/15/24 | | 1,455,000 | 1,433,175 |
| C&S Group Enterprises LLC 5.375% 7/15/22 (c) | | 2,280,000 | 2,245,800 |
| Cumberland Farms, Inc. 6.75% 5/1/25 (c) | | 365,000 | 370,475 |
| New Albertsons, Inc. 8.7% 5/1/30 | | 845,000 | 782,783 |
| | | | 7,332,021 |
| FINANCIALS - 0.7% | | | |
| Capital Markets - 0.0% | | | |
| CyrusOne LP/CyrusOne Finance Corp. 5% 3/15/24 | | 615,000 | 619,613 |
| Diversified Financial Services - 0.6% | | | |
| Brixmor Operating Partnership LP 3.85% 2/1/25 | | 1,659,000 | 1,613,256 |
| Five Point Operation Co. LP 7.875% 11/15/25 (c) | | 2,685,000 | 2,577,600 |
| Icahn Enterprises LP/Icahn Enterprises Finance Corp.: | | | |
| 5.875% 2/1/22 | | 820,000 | 826,240 |
| 6.25% 2/1/22 | | 280,000 | 287,350 |
| | | | 5,304,446 |
| Mortgage Real Estate Investment Trusts - 0.1% | | | |
| Starwood Property Trust, Inc. 4.75% 3/15/25 | | 700,000 | 666,750 |
| TOTAL FINANCIALS | | | 6,590,809 |
| HEALTH CARE - 0.9% | | | |
| Health Care Providers & Services - 0.9% | | | |
| Sabra Health Care LP/Sabra Capital Corp.: | | | |
| 5.375% 6/1/23 | | 4,040,000 | 4,019,800 |
| 5.5% 2/1/21 | | 4,450,000 | 4,494,500 |
| | | | 8,514,300 |
| INDUSTRIALS - 0.1% | | | |
| Building Products - 0.1% | | | |
| Shea Homes Ltd. Partnership/Corp. 6.125% 4/1/25 (c) | | 1,390,000 | 1,289,225 |
| REAL ESTATE - 11.5% | | | |
| Equity Real Estate Investment Trusts (REITs) - 8.2% | | | |
| American Homes 4 Rent: | | | |
| 4.25% 2/15/28 | | 2,000,000 | 1,926,825 |
| 4.9% 2/15/29 | | 500,000 | 500,749 |
| ARC Properties Operating Partnership LP 4.6% 2/6/24 | | 1,640,000 | 1,661,673 |
| Care Capital Properties LP 5.125% 8/15/26 | | 6,386,000 | 6,000,020 |
| CBL & Associates LP: | | | |
| 4.6% 10/15/24 | | 5,401,000 | 4,158,770 |
| 5.25% 12/1/23 | | 3,500,000 | 2,940,000 |
| 5.95% 12/15/26 | | 2,434,000 | 1,935,030 |
| CTR Partnership LP/CareTrust Capital Corp. 5.25% 6/1/25 | | 1,343,000 | 1,309,425 |
| DDR Corp.: | | | |
| 3.625% 2/1/25 | | 128,000 | 123,563 |
| 4.625% 7/15/22 | | 117,000 | 120,390 |
| Equinix, Inc. 5.375% 5/15/27 | | 1,175,000 | 1,177,938 |
| HCP, Inc.: | | | |
| 4% 6/1/25 | | 2,000,000 | 1,987,515 |
| 4.25% 11/15/23 | | 1,185,000 | 1,202,885 |
| Healthcare Realty Trust, Inc. 3.75% 4/15/23 | | 967,000 | 956,477 |
| Hospitality Properties Trust 5% 8/15/22 | | 823,000 | 839,425 |
| iStar Financial, Inc.: | | | |
| 4.625% 9/15/20 | | 1,140,000 | 1,134,300 |
| 5% 7/1/19 | | 2,063,000 | 2,065,579 |
| 5.25% 9/15/22 | | 715,000 | 703,918 |
| 6% 4/1/22 | | 1,490,000 | 1,486,275 |
| Lexington Corporate Properties Trust: | | | |
| 4.25% 6/15/23 | | 2,500,000 | 2,469,306 |
| 4.4% 6/15/24 | | 385,000 | 384,345 |
| MPT Operating Partnership LP/MPT Finance Corp.: | | | |
| 5% 10/15/27 | | 4,130,000 | 4,020,555 |
| 5.25% 8/1/26 | | 1,380,000 | 1,386,900 |
| 6.375% 3/1/24 | | 790,000 | 825,550 |
| Omega Healthcare Investors, Inc.: | | | |
| 4.375% 8/1/23 | | 579,000 | 580,912 |
| 4.5% 4/1/27 | | 455,000 | 443,662 |
| 4.75% 1/15/28 | | 1,479,000 | 1,466,972 |
| 4.95% 4/1/24 | | 627,000 | 641,047 |
| Regency Centers LP 3.6% 2/1/27 | | 442,000 | 425,095 |
| SBA Communications Corp. 4% 10/1/22 | | 425,000 | 419,688 |
| Select Income REIT: | | | |
| 4.15% 2/1/22 | | 1,992,000 | 1,967,954 |
| 4.25% 5/15/24 | | 890,000 | 842,564 |
| 4.5% 2/1/25 | | 3,457,000 | 3,266,956 |
| Senior Housing Properties Trust: | | | |
| 3.25% 5/1/19 | | 500,000 | 498,315 |
| 4.75% 5/1/24 | | 11,978,000 | 11,618,286 |
| 4.75% 2/15/28 | | 4,000,000 | 3,587,891 |
| 6.75% 4/15/20 | | 576,000 | 584,390 |
| 6.75% 12/15/21 | | 2,000,000 | 2,094,259 |
| VEREIT Operating Partnership LP 4.875% 6/1/26 | | 2,055,000 | 2,089,294 |
| WP Carey, Inc.: | | | |
| 4% 2/1/25 | | 344,000 | 338,965 |
| 4.25% 10/1/26 | | 905,000 | 892,667 |
| 4.6% 4/1/24 | | 1,968,000 | 2,013,439 |
| | | | 75,089,769 |
| Real Estate Management & Development - 3.3% | | | |
| Greystar Real Estate Partners 5.75% 12/1/25 (c) | | 1,285,000 | 1,280,181 |
| Howard Hughes Corp. 5.375% 3/15/25 (c) | | 6,965,000 | 6,927,737 |
| Kennedy-Wilson, Inc. 5.875% 4/1/24 | | 9,905,000 | 9,685,109 |
| Mattamy Group Corp.: | | | |
| 6.5% 10/1/25 (c) | | 2,885,000 | 2,675,838 |
| 6.875% 12/15/23 (c) | | 2,420,000 | 2,353,208 |
| Mid-America Apartments LP: | | | |
| 3.75% 6/15/24 | | 337,000 | 334,989 |
| 4.3% 10/15/23 | | 740,000 | 757,128 |
| Taylor Morrison Communities, Inc./Monarch Communities, Inc. 5.625% 3/1/24 (c) | | 1,345,000 | 1,308,013 |
| Washington Prime Group LP 5.95% 8/15/24 | | 5,008,000 | 4,540,903 |
| | | | 29,863,106 |
| TOTAL REAL ESTATE | | | 104,952,875 |
|
| TOTAL NONCONVERTIBLE BONDS | | | 174,114,658 |
|
| TOTAL CORPORATE BONDS | | | |
| (Cost $232,403,178) | | | 228,068,458 |
|
| Asset-Backed Securities - 3.5% | | | |
| American Homes 4 Rent: | | | |
| Series 2014-SFR3 Class E, 6.418% 12/17/36 (c) | | 1,740,000 | 1,920,838 |
| Series 2015-SFR1 Class E, 5.639% 4/17/52 (c) | | 1,354,586 | 1,445,837 |
| Series 2015-SFR2: | | | |
| Class E, 6.07% 10/17/45 (c) | | 1,624,000 | 1,767,745 |
| Class XS, 0% 10/17/45 (b)(c)(d)(e) | | 934,131 | 9 |
| Colony Starwood Homes Series 2016-2A Class F, 1 month U.S. LIBOR + 4.150% 6.6589% 12/17/33 (c)(d)(f) | | 935,865 | 935,857 |
| Conseco Finance Securitizations Corp.: | | | |
| Series 2002-1 Class M2, 9.546% 12/1/33 | | 1,216,000 | 1,278,731 |
| Series 2002-2 Class M2, 9.163% 3/1/33 | | 1,764,640 | 1,628,219 |
| Deutsche Financial Capital Securitization LLC Series 1997-I Class M, 7.275% 9/15/27 | | 261,416 | 264,961 |
| Home Partners of America Credit Trust Series 2017-1 Class F, 1 month U.S. LIBOR + 3.539% 6.0465% 7/17/34 (c)(d)(f) | | 1,099,000 | 1,099,651 |
| Home Partners of America Trust: | | | |
| Series 2016-2 Class F, 1 month U.S. LIBOR + 4.700% 7.2075% 10/17/33 (c)(d)(f) | | 607,000 | 606,994 |
| Series 2018-1 Class F, 1 month U.S. LIBOR + 2.350% 4.8575% 7/17/37 (c)(d)(f) | | 604,000 | 595,616 |
| Invitation Homes Trust: | | | |
| Series 2017-SFR2 Class F, 1 month U.S. LIBOR + 3.000% 5.5075% 12/17/36 (c)(d)(f) | | 1,407,000 | 1,410,562 |
| Series 2018-SFR1 Class F, 1 month U.S. LIBOR + 2.500% 5.0075% 3/17/37 (c)(d)(f) | | 2,058,000 | 2,037,291 |
| Series 2018-SFR2 Class F, 1 month U.S. LIBOR + 2.250% 4.7589% 6/17/37 (c)(d)(f) | | 1,000,000 | 986,224 |
| Lehman ABS Manufactured Housing Contract Trust Series 2001-B Class M2, 7.17% 4/15/40 | | 2,494,916 | 1,743,866 |
| Progress Residential Trust: | | | |
| Series 2015-SFR3 Class F, 6.643% 11/12/32 (c) | | 588,000 | 602,669 |
| Series 2017-SFR1 Class F, 5.35% 8/17/34 (c) | | 526,000 | 531,821 |
| Series 2017-SFR2 Class F, 1 month U.S. LIBOR + 2.750% 4.836% 12/17/34 (c)(f) | | 783,000 | 776,625 |
| Series 2018-SFR2 Class F, 4.953% 8/17/35 (c) | | 598,000 | 594,941 |
| Series 2018-SFR3 Class F, 5.368% 10/17/35 (c) | | 588,000 | 593,817 |
| Residential Asset Securities Corp. Series 2003-KS10 Class MI3, 5.5854% 12/25/33 | | 206,704 | 128,042 |
| Starwood Waypoint Homes Trust Series 2017-1: | | | |
| Class E, 1 month U.S. LIBOR + 2.600% 5.1089% 1/17/35 (c)(d)(f) | | 994,000 | 988,610 |
| Class F, 1 month U.S. LIBOR + 3.400% 5.9089% 1/17/35 (c)(d)(f) | | 2,132,000 | 2,147,251 |
| Tricon American Homes: | | | |
| Series 2017-SFR1 Class F, 5.151% 9/17/34 (c) | | 1,432,000 | 1,439,501 |
| Series 2017-SFR2 Class F, 5.104% 1/17/36 (c) | | 628,000 | 630,790 |
| Series 2018-SFR1 Class F, 4.96% 5/17/37 (c) | | 1,386,000 | 1,372,462 |
| Tricon American Homes Trust Series 2016-SFR1 Class F, 5.769% 11/17/33 (c) | | 1,310,000 | 1,332,830 |
| VB-S1 Issuer LLC: | | | |
| Series 2016-1A Class F, 6.901% 6/15/46 (c) | | 1,453,000 | 1,497,176 |
| Series 2018-1A Class F, 5.25% 2/15/48 (c) | | 2,044,000 | 1,975,022 |
| TOTAL ASSET-BACKED SECURITIES | | | |
| (Cost $31,993,147) | | | 32,333,958 |
|
| Collateralized Mortgage Obligations - 0.4% | | | |
| Private Sponsor - 0.4% | | | |
| FREMF Mortgage Trust: | | | |
| Series 2010-K6 Class B, 5.3639% 12/25/46 (c)(d) | | 811,000 | 825,884 |
| Series 2010-K7 Class B, 5.5005% 4/25/20 (c)(d) | | 2,605,000 | 2,669,242 |
| Collateralized Mortgage Obligations | | | |
| (Cost $3,376,493) | | | 3,495,126 |
|
| Commercial Mortgage Securities - 23.5% | | | |
| BANK: | | | |
| Series 2017-BNK4 Class D, 3.357% 5/15/50 (c) | | 588,000 | 492,392 |
| Series 2018-BN12 Class D, 3% 5/15/61 (c) | | 299,000 | 242,005 |
| Barclays Commercial Mortgage Securities LLC Series 2015-STP: | | | |
| Class E, 4.2844% 9/10/28 (c)(d) | | 1,626,000 | 1,567,950 |
| Class F, 4.2844% 9/10/28 (c)(d) | | 800,000 | 746,521 |
| BX Commercial Mortgage Trust floater Series 2018-BIOA Class F, 1 month U.S. LIBOR + 2.471% 4.98% 3/15/37 (c)(d)(f) | | 2,000,000 | 1,977,432 |
| BX Trust: | | | |
| floater Series 2018-IND: | | | |
| Class G, 1 month U.S. LIBOR + 2.050% 4.5589% 11/15/35 (c)(d)(f) | | 1,698,466 | 1,683,557 |
| Class H, 1 month U.S. LIBOR + 3.000% 5.5089% 11/15/35 (c)(d)(f) | | 1,551,685 | 1,535,153 |
| Series 2017-IMC Class F, 1 month U.S. LIBOR + 4.250% 6.7589% 10/15/32 (c)(d)(f) | | 2,119,000 | 2,110,472 |
| CAMB Commercial Mortgage Trust floater Series 2019-LIFE Class G, 1 month U.S. LIBOR + 3.250% 5.75% 12/15/37 (c)(d)(f)(g) | | 1,021,000 | 1,021,000 |
| CCRESG Commercial Mortgage Trust Series 2016-HEAT: | | | |
| Class E, 5.4883% 4/10/29 (c)(d) | | 806,000 | 810,168 |
| Class F, 5.4883% 4/10/29 (c)(d) | | 1,890,000 | 1,843,659 |
| CD Mortgage Trust Series 2017-CD3 Class D, 3.25% 2/10/50 (c) | | 2,188,000 | 1,834,435 |
| CGBAM Commercial Mortgage Trust Series 2015-SMRT Class E, 3.7859% 4/10/28 (c)(d) | | 561,000 | 565,211 |
| CGMS Commercial Mortgage Trust Series 2017-MDRB Class E, 1 month U.S. LIBOR + 3.872% 6.3804% 7/15/30 (c)(d)(f) | | 1,154,000 | 1,147,564 |
| Citigroup Commercial Mortgage Trust: | | | |
| Series 2013-GC15 Class D, 5.2167% 9/10/46 (c)(d) | | 2,496,000 | 2,490,167 |
| Series 2015-SHP2 Class E, 1 month U.S. LIBOR + 4.350% 6.8589% 7/15/27 (c)(d)(f) | | 567,000 | 566,357 |
| Series 2016-C3 Class D, 3% 11/15/49 (c) | | 2,911,000 | 2,323,318 |
| COMM Mortgage Trust: | | | |
| floater Series 2018-HCLV: | | | |
| Class F, 1 month U.S. LIBOR + 3.050% 5.5589% 9/15/33 (c)(d)(f) | | 735,000 | 728,465 |
| Class G, 1 month U.S. LIBOR + 5.056% 7.5652% 9/15/33 (c)(d)(f) | | 735,000 | 692,551 |
| sequential payer Series 2013-LC6 Class E, 3.5% 1/10/46 (c) | | 2,000,000 | 1,606,835 |
| Series 2012-CR1: | | | |
| Class C, 5.3207% 5/15/45 (d) | | 3,000,000 | 3,085,138 |
| Class D, 5.3207% 5/15/45 (c)(d) | | 1,917,000 | 1,918,374 |
| Class G, 2.462% 5/15/45 (c) | | 1,133,000 | 857,503 |
| Series 2012-LC4: | | | |
| Class C, 5.5388% 12/10/44 (d) | | 780,000 | 806,863 |
| Class D, 5.5388% 12/10/44 (c)(d) | | 3,532,000 | 3,237,102 |
| Series 2013-CCRE6 Class E, 4.0838% 3/10/46 (c)(d) | | 147,000 | 126,496 |
| Series 2013-CR10 Class D, 4.7925% 8/10/46 (c)(d) | | 1,756,000 | 1,695,673 |
| Series 2013-CR12 Class D, 5.0858% 10/10/46 (c)(d) | | 2,900,000 | 2,569,635 |
| Series 2013-CR6 Class F, 4.0838% 3/10/46 (c)(d) | | 1,459,000 | 1,047,135 |
| Series 2013-LC6 Class D, 4.2632% 1/10/46 (c)(d) | | 2,732,000 | 2,671,847 |
| Series 2014-UBS2 Class D, 5.002% 3/10/47 (c)(d) | | 537,000 | 482,768 |
| Series 2016-CD1 Class D, 2.7691% 8/10/49 (c)(d) | | 2,104,000 | 1,730,435 |
| Series 2017-CD4 Class D, 3.3% 5/10/50 (c) | | 1,161,000 | 972,066 |
| COMM Mortgage Trust pass-thru certificates Series 2005-LP5 Class F, 4.5361% 5/10/43 (c)(d) | | 1,160,979 | 1,151,410 |
| Commercial Mortgage Trust pass-thru certificates Series 2012-CR2 Class D, 4.8315% 8/15/45 (c)(d) | | 836,000 | 825,065 |
| Core Industrial Trust: | | | |
| Series 2015-TEXW Class F, 3.8487% 2/10/34 (c)(d) | | 2,429,000 | 2,381,912 |
| Series 2015-WEST Class F, 4.2268% 2/10/37 (c)(d) | | 2,496,000 | 2,395,965 |
| CSAIL Commercial Mortgage Trust: | | | |
| Series 2017-C8 Class D, 4.47% 6/15/50 (c) | | 1,717,000 | 1,531,589 |
| Series 2017-CX10 Class UESD, 4.2366% 10/15/32 (c)(d) | | 1,206,000 | 1,169,215 |
| Series 2017-CX9 Class D, 4.1572% 9/15/50 (c)(d) | | 432,000 | 386,473 |
| CSMC Trust Series 2016-MFF Class F, 1 month U.S. LIBOR + 7.250% 9.7589% 11/15/33 (c)(d)(f) | | 2,700,000 | 2,692,223 |
| DBCCRE Mortgage Trust Series 2014-ARCP: | | | |
| Class D, 4.9345% 1/10/34 (c)(d) | | 1,000,000 | 971,507 |
| Class E, 4.9345% 1/10/34 (c)(d) | | 2,047,000 | 1,924,631 |
| DBUBS Mortgage Trust: | | | |
| Series 2011-LC1A: | | | |
| Class E, 5.6982% 11/10/46 (c)(d) | | 2,745,000 | 2,820,548 |
| Class G, 4.652% 11/10/46 (c) | | 2,640,000 | 2,419,474 |
| Series 2011-LC3A Class D, 5.3379% 8/10/44 (c)(d) | | 728,000 | 751,109 |
| Freddie Mac pass-thru certificates: | | | |
| Series K011 Class X3, 2.5726% 12/25/43 (d)(e) | | 4,947,000 | 225,231 |
| Series K012 Class X3, 2.2521% 1/25/41 (d)(e) | | 2,799,977 | 116,738 |
| Series K013 Class X3, 2.8142% 1/25/43 (d)(e) | | 4,806,000 | 254,059 |
| GAHR Commercial Mortgage Trust Series 2015-NRF: | | | |
| Class DFX, 3.3822% 12/15/34 (c)(d) | | 300,000 | 296,731 |
| Class EFX, 3.3822% 12/15/34 (c)(d) | | 2,947,000 | 2,902,323 |
| Class FFX, 3.3822% 12/15/34 (c)(d) | | 3,708,000 | 3,628,238 |
| Class GFX, 3.3822% 12/15/34 (c)(d) | | 3,333,000 | 3,256,687 |
| GPMT Ltd. floater Series 2018-FL1 Class D, 1 month U.S. LIBOR + 2.950% 5.453% 11/21/35 (c)(d)(f) | | 1,500,000 | 1,487,856 |
| GS Mortgage Securities Trust: | | | |
| floater Series 2018-RIVR Class G, 1 month U.S. LIBOR + 2.600% 5.1089% 7/15/35 (c)(d)(f) | | 669,000 | 646,388 |
| Series 2010-C2 Class D, 5.1812% 12/10/43 (c)(d) | | 2,000,000 | 2,054,002 |
| Series 2011-GC5: | | | |
| Class D, 5.3909% 8/10/44 (c)(d) | | 2,516,000 | 2,475,867 |
| Class E, 5.3909% 8/10/44 (c)(d) | | 756,000 | 657,922 |
| Class F, 4.5% 8/10/44 (c) | | 588,000 | 349,287 |
| Series 2012-GC6: | | | |
| Class C, 5.6517% 1/10/45 (c)(d) | | 2,400,000 | 2,492,679 |
| Class D, 5.6517% 1/10/45 (c)(d) | | 1,816,000 | 1,811,111 |
| Class E, 5% 1/10/45 (c)(d) | | 831,000 | 736,835 |
| Series 2012-GCJ7: | | | |
| Class C, 5.7033% 5/10/45 (d) | | 3,500,000 | 3,623,341 |
| Class D, 5.7033% 5/10/45 (c)(d) | | 3,425,000 | 3,253,416 |
| Class E, 5% 5/10/45 (c) | | 975,966 | 665,118 |
| Series 2012-GCJ9: | | | |
| Class D, 4.7465% 11/10/45 (c)(d) | | 1,507,000 | 1,497,585 |
| Class E, 4.7465% 11/10/45 (c)(d) | | 333,000 | 304,421 |
| Series 2013-GC14 Class D, 4.7498% 8/10/46 (c)(d) | | 320,000 | 307,757 |
| Series 2013-GC16: | | | |
| Class D, 5.3106% 11/10/46 (c)(d) | | 3,250,000 | 3,300,574 |
| Class F, 3.5% 11/10/46 (c) | | 1,428,000 | 1,065,694 |
| Series 2016-GS2 Class D, 2.753% 5/10/49 (c) | | 1,964,000 | 1,598,003 |
| Series 2016-GS3 Class D, 2.62% 10/10/49 (c) | | 602,000 | 470,849 |
| Series 2016-REMZ Class MZB, 7.727% 2/10/21 (c) | | 5,523,000 | 5,527,894 |
| Series 2016-RENT: | | | |
| Class E, 4.0667% 2/10/29 (c)(d) | | 2,614,000 | 2,572,418 |
| Class F, 4.0667% 2/10/29 (c)(d) | | 3,110,000 | 3,005,264 |
| Hilton U.S.A. Trust: | | | |
| Series 2016-HHV Class F, 4.1935% 11/5/38 (c)(d) | | 1,460,000 | 1,335,357 |
| Series 2016-SFP Class F, 6.1552% 11/5/35 (c) | | 4,443,000 | 4,544,094 |
| IMT Trust Series 2017-APTS: | | | |
| Class EFX, 3.4966% 6/15/34 (c)(d) | | 1,589,000 | 1,486,638 |
| Class FFL, 1 month U.S. LIBOR + 2.850% 5.3589% 6/15/34 (c)(d)(f) | | 664,000 | 655,775 |
| Independence Plaza Trust Series 2018-INDP Class E, 4.996% 7/10/35 (c) | | 504,000 | 504,443 |
| Invitation Homes Trust floater: | | | |
| Series 2018-SFR3 Class F, 1 month U.S. LIBOR + 2.250% 4.7575% 7/17/37 (c)(d)(f) | | 1,491,000 | 1,470,155 |
| Series 2018-SFR4 Class F, 1 month U.S. LIBOR + 2.200% 4.7075% 1/17/38 (c)(d)(f) | | 590,000 | 577,774 |
| JPMBB Commercial Mortgage Securities Trust: | | | |
| Series 2014-C23 Class UH5, 4.7094% 9/15/47 (c) | | 1,526,000 | 1,277,013 |
| Series 2014-C26 Class D, 3.9215% 1/15/48 (c)(d) | | 602,000 | 543,060 |
| JPMCC Commercial Mortgage Securities Trust Series 2016-JP4 Class D, 3.4424% 12/15/49 (c)(d) | | 1,809,000 | 1,521,673 |
| JPMDB Commercial Mortgage Securities Trust: | | | |
| Series 2016-C4 Class D, 3.0933% 12/15/49 (c)(d) | | 1,308,000 | 1,065,737 |
| Series 2018-C8 Class D, 3.2455% 6/15/51 (c)(d) | | 302,000 | 250,200 |
| JPMorgan Chase Commercial Mortgage Securities Corp. Series 2012-CBX: | | | |
| Class C, 5.1909% 6/15/45 (d) | | 1,240,000 | 1,264,356 |
| Class E, 5.1909% 6/15/45 (c)(d) | | 1,037,000 | 967,056 |
| Class G 4% 6/15/45 (c) | | 805,000 | 437,170 |
| JPMorgan Chase Commercial Mortgage Securities Trust: | | | |
| Series 2011-C3: | | | |
| Class E, 5.6604% 2/15/46 (c)(d) | | 3,311,000 | 3,267,252 |
| Class G, 4.409% 2/15/46 (c)(d) | | 1,680,000 | 1,424,926 |
| Class H, 4.409% 2/15/46 (c)(d) | | 1,320,000 | 1,020,658 |
| Series 2011-C4 Class E, 5.5356% 7/15/46 (c)(d) | | 1,390,000 | 1,438,931 |
| Series 2013-LC11: | | | |
| Class D, 4.1687% 4/15/46 (d) | | 1,207,000 | 1,041,161 |
| Class F, 3.25% 4/15/46 (c)(d) | | 482,000 | 299,852 |
| Series 2014-DSTY Class E, 3.8046% 6/10/27 (c)(d) | | 924,000 | 286,226 |
| Series 2015-UES Class F, 3.621% 9/5/32 (c)(d) | | 1,843,000 | 1,790,655 |
| Series 2018-AON Class F, 4.6132% 7/5/31 (c) | | 904,000 | 870,590 |
| Kref Ltd. floater Series 2018-FL1 Class D, 1 month U.S. LIBOR + 2.550% 5.0589% 6/15/36 (c)(d)(f) | | 440,000 | 434,111 |
| Merrill Lynch Mortgage Trust Series 2006-C1 Class AJ, 5.6763% 5/12/39 (d) | | 376,387 | 378,154 |
| Morgan Stanley BAML Trust: | | | |
| Series 2012-C5 Class E, 4.6854% 8/15/45 (c)(d) | | 670,000 | 670,092 |
| Series 2012-C6 Class D, 4.6103% 11/15/45 (c)(d) | | 2,000,000 | 2,023,467 |
| Series 2013-C12 Class D, 4.766% 10/15/46 (c)(d) | | 1,500,000 | 1,461,963 |
| Series 2013-C13: | | | |
| Class D, 4.9091% 11/15/46 (c)(d) | | 2,935,000 | 2,951,620 |
| Class E, 4.9091% 11/15/46 (c)(d) | | 621,000 | 540,910 |
| Series 2013-C7: | | | |
| Class D, 4.2233% 2/15/46 (c)(d) | | 998,000 | 915,138 |
| Class E, 4.2233% 2/15/46 (c)(d) | | 1,490,000 | 1,199,428 |
| Series 2013-C9 Class C, 4.0379% 5/15/46 (d) | | 588,000 | 583,021 |
| Series 2016-C30 Class D, 3% 9/15/49 (c) | | 963,000 | 792,455 |
| Series 2016-C31 Class D, 3% 11/15/49 (c)(d) | | 1,500,000 | 1,183,445 |
| Series 2016-C32 Class D, 3.396% 12/15/49 (c) | | 1,071,000 | 890,103 |
| Morgan Stanley Capital I Trust: | | | |
| Series 1998-CF1 Class G, 7.35% 7/15/32 (c) | | 265,711 | 230,117 |
| Series 2011-C2: | | | |
| Class D, 5.4847% 6/15/44 (c)(d) | | 2,382,000 | 2,392,656 |
| Class E, 5.4847% 6/15/44 (c)(d) | | 2,396,000 | 2,318,653 |
| Class F, 5.4847% 6/15/44 (c)(d) | | 1,467,000 | 1,269,303 |
| Class XB, 0.5352% 6/15/44 (c)(d)(e) | | 51,641,000 | 602,082 |
| Series 2011-C3: | | | |
| Class E, 5.1539% 7/15/49 (c)(d) | | 613,000 | 610,269 |
| Class F, 5.1539% 7/15/49 (c)(d) | | 572,000 | 561,871 |
| Class G, 5.1539% 7/15/49 (c)(d) | | 904,000 | 806,872 |
| Series 2012-C4 Class D, 5.4199% 3/15/45 (c)(d) | | 1,640,000 | 1,579,740 |
| Series 2015-MS1 Class D, 4.0306% 5/15/48 (c)(d) | | 1,922,000 | 1,753,010 |
| Series 2015-UBS8 Class D, 3.18% 12/15/48 (c) | | 987,000 | 824,714 |
| Series 2016-BNK2 Class C, 3% 11/15/49 (c) | | 2,312,000 | 1,920,369 |
| Motel 6 Trust floater: | | | |
| Series 2017-M6MZ, Class M, 1 month U.S. LIBOR + 6.927% 9.4354% 8/15/19 (c)(d)(f) | | 1,280,565 | 1,292,722 |
| Series 2017-MTL6, Class F, 1 month U.S. LIBOR + 4.250% 6.7589% 8/15/34 (c)(d)(f) | | 2,183,629 | 2,180,874 |
| MSCCG Trust floater Series 2018-SELF Class E, 1 month U.S. LIBOR + 2.150% 4.6589% 10/15/37 (c)(d)(f) | | 882,000 | 869,843 |
| MSCG Trust Series 2016-SNR: | | | |
| Class D, 6.55% 11/15/34 (c) | | 2,828,800 | 2,837,039 |
| Class E, 6.8087% 11/15/34 (c) | | 1,746,750 | 1,675,733 |
| MSJP Commercial Securities Mortgage Trust Series 2015-HAUL Class E, 4.851% 9/5/47 (c)(d) | | 1,000,000 | 942,104 |
| Natixis Commercial Mortgage Securities Trust floater Series 2018-FL1: | | | |
| Class WAN1, 1 month U.S. LIBOR + 2.750% 5.206% 6/15/35 (c)(d)(f) | | 315,000 | 314,409 |
| Class WAN2, 1 month U.S. LIBOR + 3.750% 6.206% 6/15/35 (c)(d)(f) | | 113,725 | 112,544 |
| Providence Place Group Ltd. Partnership Series 2000-C1 Class A2, 7.75% 7/20/28 (c) | | 1,110,337 | 1,296,508 |
| RETL floater Series 2018-RVP Class E, 1 month U.S. LIBOR + 4.500% 7.0089% 3/15/33 (c)(d)(f) | | 1,260,000 | 1,253,651 |
| UBS Commercial Mortgage Trust Series 2012-C1: | | | |
| Class D, 5.5437% 5/10/45 (c)(d) | | 645,000 | 639,869 |
| Class E, 5% 5/10/45 (c)(d) | | 1,165,000 | 1,036,752 |
| Class F, 5% 5/10/45 (c)(d) | | 399,000 | 295,057 |
| UBS-BAMLL Trust Series 12-WRM Class D, 4.238% 6/10/30 (c)(d) | | 1,460,000 | 1,380,387 |
| Wells Fargo Commercial Mortgage Trust: | | | |
| Series 2012-LC5: | | | |
| Class D, 4.7627% 10/15/45 (c)(d) | | 492,000 | 486,791 |
| Class E, 4.7627% 10/15/45 (c)(d) | | 1,445,000 | 1,415,040 |
| Series 2016-BNK1 Class D, 3% 8/15/49 (c) | | 1,260,000 | 1,042,859 |
| Series 2016-C35 Class D, 3.142% 7/15/48 (c) | | 3,317,000 | 2,718,064 |
| Series 2016-NXS6 Class D, 3.059% 11/15/49 (c) | | 906,000 | 745,795 |
| Series 2017-C38 Class D, 3% 7/15/50 (c)(d) | | 757,000 | 606,656 |
| WF-RBS Commercial Mortgage Trust: | | | |
| Series 2011-C3: | | | |
| Class C, 5.335% 3/15/44 (c) | | 2,100,000 | 2,145,372 |
| Class D, 5.6828% 3/15/44 (c)(d) | | 1,000,000 | 892,631 |
| Series 2011-C5: | | | |
| Class C, 5.6723% 11/15/44 (c)(d) | | 1,250,000 | 1,304,328 |
| Class E, 5.6723% 11/15/44 (c)(d) | | 693,000 | 697,327 |
| Class F, 5.25% 11/15/44 (c)(d) | | 2,000,000 | 1,799,986 |
| Class G, 5.25% 11/15/44 (c)(d) | | 1,000,000 | 847,732 |
| Series 2012-C7 Class D, 4.821% 6/15/45 (c)(d) | | 620,000 | 572,085 |
| Series 2012-C8 Class E, 4.8925% 8/15/45 (c)(d) | | 524,000 | 512,022 |
| Series 2013-C16 Class D, 5.0374% 9/15/46 (c)(d) | | 673,000 | 634,821 |
| Series 2013-UBS1 Class D, 4.742% 3/15/46 (c)(d) | | 859,000 | 838,422 |
| WFCG Commercial Mortgage Trust floater Series 2015-BXRP: | | | |
| Class F, 1 month U.S. LIBOR + 3.720% 6.2292% 11/15/29 (c)(d)(f) | | 952,061 | 946,294 |
| Class G, 1 month U.S. LIBOR + 3.020% 5.5289% 11/15/29 (c)(d)(f) | | 1,614,085 | 1,591,798 |
| WP Glimcher Mall Trust Series 2015-WPG: | | | |
| Class PR1, 3.516% 6/5/35 (c)(d) | | 1,168,000 | 945,952 |
| Class PR2, 3.516% 6/5/35 (c)(d) | | 459,000 | 344,545 |
| TOTAL COMMERCIAL MORTGAGE SECURITIES | | | |
| (Cost $206,361,980) | | | 214,641,983 |
|
| Bank Loan Obligations - 5.2% | | | |
| COMMUNICATION SERVICES - 0.4% | | | |
| Wireless Telecommunication Services - 0.4% | | | |
| SBA Senior Finance II, LLC Tranche B, term loan 3 month U.S. LIBOR + 2.000% 4.5% 4/11/25 (d)(f) | | 3,383,736 | 3,318,869 |
| CONSUMER DISCRETIONARY - 0.7% | | | |
| Hotels, Restaurants & Leisure - 0.6% | | | |
| Caesars Resort Collection LLC Tranche B 1LN, term loan 3 month U.S. LIBOR + 2.750% 5.2489% 12/22/24 (d)(f) | | 853,570 | 840,877 |
| ESH Hospitality, Inc. Tranche B, term loan 3 month U.S. LIBOR + 2.000% 4.4989% 8/30/23 (d)(f) | | 2,372,809 | 2,327,133 |
| LTF Merger Sub, Inc. Tranche B, term loan 3 month U.S. LIBOR + 2.750% 5.4566% 6/10/22 (d)(f) | | 736,608 | 724,903 |
| Playa Resorts Holding BV Tranche B, term loan 3 month U.S. LIBOR + 2.750% 5.25% 4/27/24 (d)(f) | | 739,453 | 712,648 |
| Wyndham Destinations, Inc. Tranche B, term loan 3 month U.S. LIBOR + 2.250% 4.7489% 5/31/25 (d)(f) | | 453,863 | 447,622 |
| Wyndham Hotels & Resorts, Inc. Tranche B, term loan 3 month U.S. LIBOR + 1.750% 4.2489% 5/30/25 (d)(f) | | 239,400 | 235,167 |
| | | | 5,288,350 |
| Multiline Retail - 0.1% | | | |
| JC Penney Corp., Inc. Tranche B, term loan 3 month U.S. LIBOR + 4.250% 6.956% 6/23/23 (d)(f) | | 1,852,969 | 1,600,502 |
|
| TOTAL CONSUMER DISCRETIONARY | | | 6,888,852 |
|
| CONSUMER STAPLES - 0.7% | | | |
| Food & Staples Retailing - 0.7% | | | |
| Albertson's LLC Tranche B, term loan: | | | |
| 3 month U.S. LIBOR + 3.000% 5.6912% 6/22/23 (d)(f) | | 3,098,520 | 3,048,169 |
| 3 month U.S. LIBOR + 3.000% 5.8216% 12/21/22 (d)(f) | | 3,076,177 | 3,030,803 |
| | | | 6,078,972 |
| ENERGY - 0.7% | | | |
| Energy Equipment & Services - 0.1% | | | |
| Kestrel Acquisition LLC Tranche B, term loan 3 month U.S. LIBOR + 4.250% 6.75% 6/1/25 (d)(f) | | 1,492,500 | 1,477,575 |
| Oil, Gas & Consumable Fuels - 0.6% | | | |
| Moxie Patriot LLC Tranche B, term loan 3 month U.S. LIBOR + 5.750% 8.553% 12/19/20 (d)(f) | | 4,384,534 | 4,278,559 |
| TPF II Power LLC Tranche B, term loan 3 month U.S. LIBOR + 3.750% 6.2489% 10/2/23 (d)(f) | | 979,955 | 954,535 |
| | | | 5,233,094 |
|
| TOTAL ENERGY | | | 6,710,669 |
|
| FINANCIALS - 0.3% | | | |
| Diversified Financial Services - 0.2% | | | |
| Veritas-B Junior Mezz C LLC 10.48% 2/6/21 (b)(d) | | 1,629,000 | 1,696,115 |
| Real Estate Management & Development - 0.0% | | | |
| MGM Growth Properties Operating Partner LP Tranche B, term loan 3 month U.S. LIBOR + 2.000% 4.4139% 3/23/25 (d)(f) | | 440,000 | 432,643 |
| Thrifts & Mortgage Finance - 0.1% | | | |
| Ocwen Loan Servicing LLC Tranche B, term loan 3 month U.S. LIBOR + 5.000% 7.519% 12/5/20 (d)(f) | | 544,862 | 536,689 |
|
| TOTAL FINANCIALS | | | 2,665,447 |
|
| HEALTH CARE - 0.1% | | | |
| Health Care Providers & Services - 0.1% | | | |
| Community Health Systems, Inc. Tranche H, term loan 3 month U.S. LIBOR + 3.250% 5.9566% 1/27/21 (d)(f) | | 1,311,271 | 1,288,049 |
| INDUSTRIALS - 0.2% | | | |
| Commercial Services & Supplies - 0.2% | | | |
| Lineage Logistics Holdings, LLC. Tranche B, term loan 3 month U.S. LIBOR + 3.000% 5.4989% 2/27/25 (d)(f) | | 1,846,050 | 1,795,284 |
| INFORMATION TECHNOLOGY - 0.1% | | | |
| Electronic Equipment & Components - 0.1% | | | |
| Compass Power Generation LLC Tranche B 1LN, term loan 3 month U.S. LIBOR + 3.500% 5.9989% 12/20/24 (d)(f) | | 541,223 | 538,966 |
| REAL ESTATE - 1.4% | | | |
| Equity Real Estate Investment Trusts (REITs) - 0.8% | | | |
| Invitation Homes Operating Par Tranche B, term loan 3 month U.S. LIBOR + 1.700% 4.219% 2/6/22 (b)(d)(f) | | 5,000,000 | 4,850,000 |
| iStar Financial, Inc. Tranche B 1LN, term loan 3 month U.S. LIBOR + 2.750% 5.2579% 6/28/23 (d)(f) | | 2,228,800 | 2,203,726 |
| | | | 7,053,726 |
| Real Estate Management & Development - 0.6% | | | |
| Capital Automotive LP Tranche B 1LN, term loan 3 month U.S. LIBOR + 2.500% 5% 3/24/24 (d)(f) | | 550,476 | 534,650 |
| DTZ U.S. Borrower LLC Tranche B, term loan 3 month U.S. LIBOR + 3.250% 5.7489% 8/21/25 (d)(f) | | 3,506,950 | 3,435,934 |
| VICI Properties, LLC Tranche B 1LN, term loan 3 month U.S. LIBOR + 2.000% 4.503% 12/22/24 (d)(f) | | 1,485,000 | 1,456,696 |
| | | | 5,427,280 |
|
| TOTAL REAL ESTATE | | | 12,481,006 |
|
| UTILITIES - 0.6% | | | |
| Electric Utilities - 0.2% | | | |
| Lightstone Holdco LLC: | | | |
| Tranche B 1LN, term loan 3 month U.S. LIBOR + 3.750% 6.2489% 1/30/24 (d)(f) | | 1,762,305 | 1,692,553 |
| Tranche C 1LN, term loan 3 month U.S. LIBOR + 3.750% 6.2489% 1/30/24 (d)(f) | | 97,157 | 93,311 |
| Southeast Powergen LLC Tranche B, term loan 3 month U.S. LIBOR + 3.500% 6% 12/2/21 (d)(f) | | 248,874 | 238,091 |
| | | | 2,023,955 |
| Independent Power and Renewable Electricity Producers - 0.4% | | | |
| APLP Holdings LP Tranche B, term loan 3 month U.S. LIBOR + 2.750% 5.2489% 4/13/23 (d)(f) | | 1,396,697 | 1,386,222 |
| MRP Generation Holdings LLC Tranche B, term loan 3 month U.S. LIBOR + 7.000% 9.803% 10/18/22 (d)(f) | | 2,565,337 | 2,456,310 |
| | | | 3,842,532 |
|
| TOTAL UTILITIES | | | 5,866,487 |
|
| TOTAL BANK LOAN OBLIGATIONS | | | |
| (Cost $48,418,447) | | | 47,632,601 |
| | | Shares | Value |
|
| Money Market Funds - 3.4% | | | |
| Fidelity Cash Central Fund, 2.43% (h) | | | |
| (Cost $31,190,598) | | 31,187,986 | 31,194,224 |
| TOTAL INVESTMENT IN SECURITIES - 99.7% | | | |
| (Cost $883,955,801) | | | 912,002,060 |
| NET OTHER ASSETS (LIABILITIES) - 0.3% | | | 2,526,957 |
| NET ASSETS - 100% | | | $914,529,017 |
Legend
(a) Non-income producing
(b) Level 3 security
(c) Security exempt from registration under Rule 144A of the Securities Act of 1933. These securities may be resold in transactions exempt from registration, normally to qualified institutional buyers. At the end of the period, the value of these securities amounted to $280,103,315 or 30.6% of net assets.
(d) Coupon rates for floating and adjustable rate securities reflect the rates in effect at period end.
(e) Security represents right to receive monthly interest payments on an underlying pool of mortgages or assets. Principal shown is the outstanding par amount of the pool as of the end of the period.
(f) Coupon is indexed to a floating interest rate which may be multiplied by a specified factor and/or subject to caps or floors.
(g) Security or a portion of the security purchased on a delayed delivery or when-issued basis.
(h) Affiliated fund that is generally available only to investment companies and other accounts managed by Fidelity Investments. The rate quoted is the annualized seven-day yield of the fund at period end. A complete unaudited listing of the fund's holdings as of its most recent quarter end is available upon request. In addition, each Fidelity Central Fund's financial statements are available on the SEC's website or upon request.
Affiliated Central Funds
Information regarding fiscal year to date income earned by the Fund from investments in Fidelity Central Funds is as follows:
| Fund | Income earned |
| Fidelity Cash Central Fund | $312,311 |
Amounts in the income column in the above table include any capital gain distributions from underlying funds, which are presented in the corresponding line-item in the Statement of Operations, if applicable.
Investment Valuation
The following is a summary of the inputs used, as of January 31, 2019, involving the Fund's assets and liabilities carried at fair value. The inputs or methodology used for valuing securities may not be an indication of the risk associated with investing in those securities. For more information on valuation inputs, and their aggregation into the levels used below, please refer to the Investment Valuation section in the accompanying Notes to Financial Statements.
| | Valuation Inputs at Reporting Date: |
| Description | Total | Level 1 | Level 2 | Level 3 |
| Investments in Securities: | | | | |
| Equities: | | | | |
| Consumer Discretionary | $1,692,928 | $1,692,928 | $-- | $-- |
| Financials | 129,302,391 | 120,100,105 | 9,202,286 | -- |
| Real Estate | 223,067,256 | 210,424,536 | 11,692,666 | 950,054 |
| Utilities | 573,135 | 573,135 | -- | -- |
| Corporate Bonds | 228,068,458 | -- | 228,068,458 | -- |
| Asset-Backed Securities | 32,333,958 | -- | 32,333,949 | 9 |
| Collateralized Mortgage Obligations | 3,495,126 | -- | 3,495,126 | -- |
| Commercial Mortgage Securities | 214,641,983 | -- | 214,641,983 | -- |
| Bank Loan Obligations | 47,632,601 | -- | 41,086,486 | 6,546,115 |
| Money Market Funds | 31,194,224 | 31,194,224 | -- | -- |
| Total Investments in Securities: | $912,002,060 | $363,984,928 | $540,520,954 | $7,496,178 |
The following is a reconciliation of Investments in Securities Instruments for which Level 3 inputs were used in determining value:
| Investments in Securities: | |
| Bank Loan Obligations | |
| Beginning Balance | $9,629,302 |
| Net Realized Gain (Loss) on Investment Securities | 1,842 |
| Net Unrealized Gain (Loss) on Investment Securities | (63,892) |
| Cost of Purchases | -- |
| Proceeds of Sales | (3,026,000) |
| Amortization/Accretion | 4,863 |
| Transfers into Level 3 | -- |
| Transfers out of Level 3 | -- |
| Ending Balance | $6,546,115 |
| The change in unrealized gain (loss) for the period attributable to Level 3 securities held at January 31, 2019 | $(50,499) |
| Other Investments in Securities | |
| Beginning Balance | $-- |
| Net Realized Gain (Loss) on Investment Securities | -- |
| Net Unrealized Gain (Loss) on Investment Securities | (63,516) |
| Cost of Purchases | -- |
| Proceeds of Sales | -- |
| Amortization/Accretion | -- |
| Transfers into Level 3 | 1,013,579 |
| Transfers out of Level 3 | -- |
| Ending Balance | $950,063 |
| The change in unrealized gain (loss) for the period attributable to Level 3 securities held at January 31, 2019 | $(63,516) |
The information used in the above reconciliations represents fiscal year to date activity for any Investments in Securities identified as using Level 3 inputs at either the beginning or the end of the current fiscal period. Transfers in or out of Level 3 represent the beginning value of any Security or Instrument where a change in the pricing level occurred from the beginning to the end of the period. The cost of purchases and the proceeds of sales may include securities received or delivered through corporate actions or exchanges. Realized and unrealized gains (losses) disclosed in the reconciliations are included in Net Gain (Loss) on the Fund's Statement of Operations.
Other Information
The composition of credit quality ratings as a percentage of Total Net Assets is as follows (Unaudited):
| U.S. Government and U.S. Government Agency Obligations | 0.3% |
| AAA,AA,A | 2.1% |
| BBB | 11.9% |
| BB | 13.8% |
| B | 12.4% |
| CCC,CC,C | 1.3% |
| Not Rated | 15.7% |
| Equities | 38.8% |
| Short-Term Investments and Net Other Assets | 3.7% |
| | 100.0% |
We have used ratings from Moody's Investors Service, Inc. Where Moody's® ratings are not available, we have used S&P® ratings. All ratings are as of the date indicated and do not reflect subsequent changes.
See accompanying notes which are an integral part of the financial statements.
Financial Statements
Statement of Assets and Liabilities
| | | January 31, 2019 (Unaudited) |
| Assets | | |
Investment in securities, at value — See accompanying schedule:
Unaffiliated issuers (cost $852,765,203) | $880,807,836 | |
| Fidelity Central Funds (cost $31,190,598) | 31,194,224 | |
| Total Investment in Securities (cost $883,955,801) | | $912,002,060 |
| Cash | | 95,105 |
| Receivable for investments sold | | 1,399,663 |
| Receivable for fund shares sold | | 373,122 |
| Dividends receivable | | 268,823 |
| Interest receivable | | 4,843,057 |
| Distributions receivable from Fidelity Central Funds | | 58,934 |
| Other receivables | | 68 |
| Total assets | | 919,040,832 |
| Liabilities | | |
| Payable for investments purchased | | |
| Regular delivery | $3,031,369 | |
| Delayed delivery | 1,021,000 | |
| Payable for fund shares redeemed | 455,757 | |
| Other payables and accrued expenses | 3,689 | |
| Total liabilities | | 4,511,815 |
| Net Assets | | $914,529,017 |
| Net Assets consist of: | | |
| Paid in capital | | $885,294,488 |
| Total distributable earnings (loss) | | 29,234,529 |
| Net Assets | | $914,529,017 |
| Net Asset Value and Maximum Offering Price | | |
| | | |
| Net Asset Value, offering price and redemption price per share ($914,529,017 ÷ 85,734,533 shares) | | $10.67 |
See accompanying notes which are an integral part of the financial statements.
Statement of Operations
| | | Six months ended January 31, 2019 (Unaudited) |
| Investment Income | | |
| Dividends | | $9,196,424 |
| Interest | | 15,458,582 |
| Income from Fidelity Central Funds | | 312,311 |
| Total income | | 24,967,317 |
| Expenses | | |
| Custodian fees and expenses | $6,831 | |
| Independent trustees' fees and expenses | 2,900 | |
| Commitment fees | 1,206 | |
| Miscellaneous | 287 | |
| Total expenses before reductions | 11,224 | |
| Expense reductions | (6,077) | |
| Total expenses after reductions | | 5,147 |
| Net investment income (loss) | | 24,962,170 |
| Realized and Unrealized Gain (Loss) | | |
| Net realized gain (loss) on: | | |
| Investment securities: | | |
| Unaffiliated issuers | 5,132,721 | |
| Fidelity Central Funds | 38 | |
| Foreign currency transactions | (142) | |
| Total net realized gain (loss) | | 5,132,617 |
| Change in net unrealized appreciation (depreciation) on: | | |
| Investment securities: | | |
| Unaffiliated issuers | (7,247,079) | |
| Fidelity Central Funds | (91) | |
| Total change in net unrealized appreciation (depreciation) | | (7,247,170) |
| Net gain (loss) | | (2,114,553) |
| Net increase (decrease) in net assets resulting from operations | | $22,847,617 |
See accompanying notes which are an integral part of the financial statements.
Statement of Changes in Net Assets
| | Six months ended January 31, 2019 (Unaudited) | Year ended July 31, 2018 |
| Increase (Decrease) in Net Assets | | |
| Operations | | |
| Net investment income (loss) | $24,962,170 | $48,424,597 |
| Net realized gain (loss) | 5,132,617 | 16,351,331 |
| Change in net unrealized appreciation (depreciation) | (7,247,170) | (32,584,399) |
| Net increase (decrease) in net assets resulting from operations | 22,847,617 | 32,191,529 |
| Distributions to shareholders | (47,600,566) | – |
| Distributions to shareholders from net investment income | – | (49,000,695) |
| Distributions to shareholders from net realized gain | – | (12,651,932) |
| Total distributions | (47,600,566) | (61,652,627) |
| Share transactions - net increase (decrease) | 31,894,131 | 36,122,209 |
| Total increase (decrease) in net assets | 7,141,182 | 6,661,111 |
| Net Assets | | |
| Beginning of period | 907,387,835 | 900,726,724 |
| End of period | $914,529,017 | $907,387,835 |
| Other Information | | |
| Undistributed net investment income end of period | | $6,659,140 |
See accompanying notes which are an integral part of the financial statements.
Financial Highlights
Fidelity Series Real Estate Income Fund
| | Six months ended (Unaudited) January 31, | Years endedJuly 31, | | | | |
| | 2019 | 2018 | 2017 | 2016 | 2015 | 2014 |
| Selected Per–Share Data | | | | | | |
| Net asset value, beginning of period | $10.97 | $11.34 | $11.43 | $11.13 | $11.47 | $11.41 |
| Income from Investment Operations | | | | | | |
| Net investment income (loss)A | .30 | .59 | .55 | .52 | .56 | .58 |
| Net realized and unrealized gain (loss) | (.03) | (.20) | .06 | .42 | (.01) | .31 |
| Total from investment operations | .27 | .39 | .61 | .94 | .55 | .89 |
| Distributions from net investment income | (.40) | (.60) | (.52) | (.53) | (.61) | (.59) |
| Distributions from net realized gain | (.17) | (.16) | (.18) | (.11) | (.29) | (.24) |
| Total distributions | (.57) | (.76) | (.70) | (.64) | (.89)B | (.83) |
| Net asset value, end of period | $10.67 | $10.97 | $11.34 | $11.43 | $11.13 | $11.47 |
| Total ReturnC,D | 2.59% | 3.61% | 5.65% | 8.93% | 5.05% | 8.33% |
| Ratios to Average Net AssetsE,F | | | | | | |
| Expenses before reductions | - %G,H | - %H | .63% | .77% | .77% | .77% |
| Expenses net of fee waivers, if any | - %G,H | - %H | .63% | .77% | .77% | .77% |
| Expenses net of all reductions | - %G,H | - %H | .63% | .77% | .77% | .77% |
| Net investment income (loss) | 5.52%G | 5.36% | 4.89% | 4.81% | 5.03% | 5.15% |
| Supplemental Data | | | | | | |
| Net assets, end of period (000 omitted) | $914,529 | $907,388 | $423,538 | $411,102 | $401,861 | $409,084 |
| Portfolio turnover rateI | 12%G | 27% | 24% | 24% | 19% | 33% |
A Calculated based on average shares outstanding during the period.
B Total distributions of $.89 per share is comprised of distributions from net investment income of $.606 and distributions from net realized gain of $.288 per share.
C Total returns for periods of less than one year are not annualized.
D Total returns would have been lower if certain expenses had not been reduced during the applicable periods shown.
E Fees and expenses of any underlying Fidelity Central Funds are not included in the Fund's expense ratio. The Fund indirectly bears its proportionate share of the expenses of any underlying Fidelity Central Funds.
F Expense ratios reflect operating expenses of the Fund. Expenses before reductions do not reflect amounts reimbursed by the investment adviser or reductions from brokerage service arrangements or reductions from other expense offset arrangements and do not represent the amount paid by the Fund during periods when reimbursements or reductions occur. Expenses net of fee waivers reflect expenses after reimbursement by the investment adviser but prior to reductions from brokerage service arrangements or other expense offset arrangements. Expenses net of all reductions represent the net expenses paid by the Fund.
G Annualized
H Amount represents less than .005%.
I Amount does not include the portfolio activity of any underlying Fidelity Central Funds.
See accompanying notes which are an integral part of the financial statements.
Notes to Financial Statements (Unaudited)
For the period ended January 31, 2019
1. Organization.
Fidelity Series Real Estate Income Fund (the Fund) is a fund of Fidelity Securities Fund (the Trust) and is authorized to issue an unlimited number of shares. Shares of the Fund are only available for purchase by mutual funds for which Fidelity Management & Research Company (FMR) or an affiliate serves as an investment manager. The Trust is registered under the Investment Company Act of 1940, as amended (the 1940 Act), as an open-end management investment company organized as a Massachusetts business trust. Effective August 28, 2017, the Fund no longer offered Class F, and all outstanding shares of Class F were exchanged for shares of Series Real Estate Income.
2. Investments in Fidelity Central Funds.
The Fund invests in Fidelity Central Funds, which are open-end investment companies generally available only to other investment companies and accounts managed by the investment adviser and its affiliates. The Fund's Schedule of Investments lists each of the Fidelity Central Funds held as of period end, if any, as an investment of the Fund, but does not include the underlying holdings of each Fidelity Central Fund. As an Investing Fund, the Fund indirectly bears its proportionate share of the expenses of the underlying Fidelity Central Funds.
The Money Market Central Funds seek preservation of capital and current income and are managed by Fidelity Investments Money Management, Inc. (FIMM), an affiliate of the investment adviser. Annualized expenses of the Money Market Central Funds as of their most recent shareholder report date are less than .005%.
A complete unaudited list of holdings for each Fidelity Central Fund is available upon request or at the Securities and Exchange Commission (the SEC) website at www.sec.gov. In addition, the financial statements of the Fidelity Central Funds are available on the SEC website or upon request.
3. Significant Accounting Policies.
The Fund is an investment company and applies the accounting and reporting guidance of the Financial Accounting Standards Board (FASB) Accounting Standards Codification Topic 946 Financial Services – Investments Companies. The financial statements have been prepared in conformity with accounting principles generally accepted in the United States of America (GAAP), which require management to make certain estimates and assumptions at the date of the financial statements. Actual results could differ from those estimates. Subsequent events, if any, through the date that the financial statements were issued have been evaluated in the preparation of the financial statements. The following summarizes the significant accounting policies of the Fund:
Investment Valuation. Investments are valued as of 4:00 p.m. Eastern time on the last calendar day of the period. The Board of Trustees (the Board) has delegated the day to day responsibility for the valuation of the Fund's investments to the Fair Value Committee (the Committee) established by the Fund's investment adviser. In accordance with valuation policies and procedures approved by the Board, the Fund attempts to obtain prices from one or more third party pricing vendors or brokers to value its investments. When current market prices, quotations or currency exchange rates are not readily available or reliable, investments will be fair valued in good faith by the Committee, in accordance with procedures adopted by the Board. Factors used in determining fair value vary by investment type and may include market or investment specific events, changes in interest rates and credit quality. The frequency with which these procedures are used cannot be predicted and they may be utilized to a significant extent. The Committee oversees the Fund's valuation policies and procedures and reports to the Board on the Committee's activities and fair value determinations. The Board monitors the appropriateness of the procedures used in valuing the Fund's investments and ratifies the fair value determinations of the Committee.
The Fund categorizes the inputs to valuation techniques used to value its investments into a disclosure hierarchy consisting of three levels as shown below:
- Level 1 – quoted prices in active markets for identical investments
- Level 2 – other significant observable inputs (including quoted prices for similar investments, interest rates, prepayment speeds, etc.)
- Level 3 – unobservable inputs (including the Fund's own assumptions based on the best information available)
Valuation techniques used to value the Fund's investments by major category are as follows:
Equity securities, including restricted securities, for which market quotations are readily available, are valued at the last reported sale price or official closing price as reported by a third party pricing vendor on the primary market or exchange on which they are traded and are categorized as Level 1 in the hierarchy. In the event there were no sales during the day or closing prices are not available, securities are valued at the last quoted bid price or may be valued using the last available price and are generally categorized as Level 2 in the hierarchy. For foreign equity securities, when market or security specific events arise, comparisons to the valuation of American Depositary Receipts (ADRs), futures contracts, Exchange-Traded Funds (ETFs) and certain indexes as well as quoted prices for similar securities may be used and would be categorized as Level 2 in the hierarchy. For equity securities, including restricted securities, where observable inputs are limited, assumptions about market activity and risk are used and these securities may be categorized as Level 3 in the hierarchy.
Debt securities, including restricted securities, are valued based on evaluated prices received from third party pricing vendors or from brokers who make markets in such securities. Corporate bonds and bank loan obligations are valued by pricing vendors who utilize matrix pricing which considers yield or price of bonds of comparable quality, coupon, maturity and type or by broker-supplied prices. Asset backed securities, collateralized mortgage obligations and commercial mortgage securities are valued by pricing vendors who utilize matrix pricing which considers prepayment speed assumptions, attributes of the collateral, yield or price of bonds of comparable quality, coupon, maturity and type or by broker-supplied prices. When independent prices are unavailable or unreliable, debt securities may be valued utilizing pricing methodologies which consider similar factors that would be used by third party pricing vendors. Debt securities are generally categorized as Level 2 in the hierarchy but may be Level 3 depending on the circumstances. The Fund invests a significant portion of its assets in below investment grade securities. The value of these securities can be more volatile due to changes in the credit quality of the issuer and is sensitive to changes in economic, market and regulatory conditions.
Investments in open-end mutual funds, including the Fidelity Central Funds, are valued at their closing net asset value (NAV) each business day and are categorized as Level 1 in the hierarchy.
Changes in valuation techniques may result in transfers in or out of an assigned level within the disclosure hierarchy. The aggregate value of investments by input level as of January 31, 2019, as well as a roll forward of Level 3 investments, is included at the end of the Fund's Schedule of Investments.
Foreign Currency. The Fund may use foreign currency contracts to facilitate transactions in foreign-denominated securities. Gains and losses from these transactions may arise from changes in the value of the foreign currency or if the counterparties do not perform under the contracts' terms.
Foreign-denominated assets, including investment securities, and liabilities are translated into U.S. dollars at the exchange rates at period end. Purchases and sales of investment securities, income and dividends received and expenses denominated in foreign currencies are translated into U.S. dollars at the exchange rate in effect on the transaction date.
The effects of exchange rate fluctuations on investments are included with the net realized and unrealized gain (loss) on investment securities. Other foreign currency transactions resulting in realized and unrealized gain (loss) are disclosed separately.
Investment Transactions and Income. For financial reporting purposes, the Fund's investment holdings and NAV include trades executed through the end of the last business day of the period. The NAV per share for processing shareholder transactions is calculated as of the close of business of the New York Stock Exchange (NYSE), normally 4:00 p.m. Eastern time and includes trades executed through the end of the prior business day. Gains and losses on securities sold are determined on the basis of identified cost. Dividend income is recorded on the ex-dividend date, except for certain dividends from foreign securities where the ex-dividend date may have passed, which are recorded as soon as the Fund is informed of the ex-dividend date. Non-cash dividends included in dividend income, if any, are recorded at the fair market value of the securities received. Income and capital gain distributions from Fidelity Central Funds, if any, are recorded on the ex-dividend date. Certain distributions received by the Fund represent a return of capital or capital gain. The Fund determines the components of these distributions subsequent to the ex-dividend date, based upon receipt of tax filings or other correspondence relating to the underlying investment. These distributions are recorded as a reduction of cost of investments and/or as a realized gain. Interest income is accrued as earned and includes coupon interest and amortization of premium and accretion of discount on debt securities as applicable. Investment income is recorded net of foreign taxes withheld where recovery of such taxes is uncertain. Debt obligations may be placed on non-accrual status and related interest income may be reduced by ceasing current accruals and writing off interest receivables when the collection of all or a portion of interest has become doubtful based on consistently applied procedures. A debt obligation is removed from non-accrual status when the issuer resumes interest payments or when collectability of interest is reasonably assured.
Expenses. Expenses directly attributable to a fund are charged to that fund. Expenses attributable to more than one fund are allocated among the respective funds on the basis of relative net assets or other appropriate methods. Expense estimates are accrued in the period to which they relate and adjustments are made when actual amounts are known.
Income Tax Information and Distributions to Shareholders. Each year, the Fund intends to qualify as a regulated investment company under Subchapter M of the Internal Revenue Code, including distributing substantially all of its taxable income and realized gains. As a result, no provision for U.S. Federal income taxes is required. The Fund files a U.S. federal tax return, in addition to state and local tax returns as required. The Fund's federal income tax returns are subject to examination by the Internal Revenue Service (IRS) for a period of three fiscal years after they are filed. State and local tax returns may be subject to examination for an additional fiscal year depending on the jurisdiction. Foreign taxes are provided for based on the Fund's understanding of the tax rules and rates that exist in the foreign markets in which it invests.
Distributions are declared and recorded on the ex-dividend date. Income and capital gain distributions are determined in accordance with income tax regulations, which may differ from GAAP.
Capital accounts within the financial statements are adjusted for permanent book-tax differences. These adjustments have no impact on net assets or the results of operations. Capital accounts are not adjusted for temporary book-tax differences which will reverse in a subsequent period.
Book-tax differences are primarily due to short-term capital gains, foreign currency transactions, equity-debt classifications, certain conversion ratio adjustments, partnerships and losses deferred due to wash sales.
As of period end, the cost and unrealized appreciation (depreciation) in securities, and derivatives if applicable, for federal income tax purposes were as follows:
| Gross unrealized appreciation | $52,499,059 |
| Gross unrealized depreciation | (24,494,681) |
| Net unrealized appreciation (depreciation) | $28,004,378 |
| Tax cost | $883,997,682 |
Delayed Delivery Transactions and When-Issued Securities. During the period, the Fund transacted in securities on a delayed delivery or when-issued basis. Payment and delivery may take place after the customary settlement period for that security. The price of the underlying securities and the date when the securities will be delivered and paid for are fixed at the time the transaction is negotiated. The securities purchased on a delayed delivery or when-issued basis are identified as such in the Fund's Schedule of Investments. Losses may arise due to changes in the value of the underlying securities or if the counterparty does not perform under the contract's terms, or if the issuer does not issue the securities due to political, economic, or other factors.
Restricted Securities. The Fund may invest in securities that are subject to legal or contractual restrictions on resale. These securities generally may be resold in transactions exempt from registration or to the public if the securities are registered. Disposal of these securities may involve time-consuming negotiations and expense, and prompt sale at an acceptable price may be difficult. Information regarding restricted securities is included at the end of the Fund's Schedule of Investments.
Loans and Other Direct Debt Instruments. The Fund invests in direct debt instruments which are interests in amounts owed to lenders by corporate or other borrowers. These instruments may be in the form of loans, trade claims or other receivables and may include standby financing commitments such as revolving credit facilities that obligate the Fund to supply additional cash to the borrower on demand. Loans may be acquired through assignment or participation. The Fund did not have any unfunded loan commitments, which are contractual obligations for future funding, at period end.
New Rule Issuance. During August 2018, the U.S. Securities and Exchange Commission issued Final Rule Release No. 33-10532, Disclosure Update and Simplification. This Final Rule includes amendments specific to registered investment companies that are intended to eliminate overlap in disclosure requirements between Regulation S-X and GAAP. In accordance with these amendments, certain line-items in the Fund's financial statements have been combined or removed for the current period as outlined in the table below.
| Financial Statement | Current Line-Item Presentation (As Applicable) | Prior Line-Item Presentation (As Applicable) |
| Statement of Assets and Liabilities | Total distributable earnings (loss) | Undistributed/Distributions in excess of/Accumulated net investment income (loss)
Accumulated/Undistributed net realized gain (loss)
Net unrealized appreciation (depreciation) |
| Statement of Changes in Net Assets | N/A - removed | Undistributed/Distributions in excess of/Accumulated net investment income (loss) end of period |
| Statement of Changes in Net Assets | Distributions to shareholders | Distributions to shareholders from net investment income
Distributions to shareholders from net realized gain |
| Distributions to Shareholders Note to Financial Statements | Distributions to shareholders | Distributions to shareholders from net investment income
Distributions to shareholders from net realized gain |
4. Purchases and Sales of Investments.
Purchases and sales of securities, other than short-term securities, aggregated $54,586,393 and $55,224,281, respectively.
5. Fees and Other Transactions with Affiliates.
Management Fee. Fidelity Management & Research Company (the investment adviser) and its affiliates provide the Fund with investment management related services for which the Fund does not pay a management fee. Under the management contract, the investment adviser or an affiliate pays all ordinary operating expenses of the Fund, except custody fees, fees and expenses of the independent Trustees, and certain miscellaneous expenses such as proxy and shareholder meeting expenses.
Brokerage Commissions. The Fund placed a portion of its portfolio transactions with brokerage firms which are affiliates of the investment adviser. Brokerage commissions are included in net realized gain (loss) and change in net unrealized appreciation (depreciation) in the Statement of Operations. The commissions paid to these affiliated firms were $604 for the period.
Interfund Trades. The Fund may purchase from or sell securities to other Fidelity Funds under procedures adopted by the Board. The procedures have been designed to ensure these interfund trades are executed in accordance with Rule 17a-7 of the 1940 Act. Interfund trades are included within the respective purchases and sales amounts shown in the Purchases and Sales of Investments note.
6. Committed Line of Credit.
The Fund participates with other funds managed by the investment adviser or an affiliate in a $4.25 billion credit facility (the "line of credit") to be utilized for temporary or emergency purposes to fund shareholder redemptions or for other short-term liquidity purposes. The Fund has agreed to pay commitment fees on its pro-rata portion of the line of credit, which amounted to $1,206 and is reflected in Miscellaneous expenses on the Statement of Operations. During the period, the Fund did not borrow on this line of credit.
7. Expense Reductions.
Through arrangements with the Fund's custodian, credits realized as a result of certain uninvested cash balances were used to reduce the Fund's expenses. During the period, these credits reduced the Fund's custody expenses by $6,077.
8. Distributions to Shareholders.
Distributions to shareholders of each class were as follows:
| | Six months ended
January 31, 2019 | Year ended
July 31, 2018 |
| Distributions to shareholders | | |
| | $47,600,566 | $– |
| From net investment income | | |
| | $– | $49,000,695 |
| From net realized gain | | |
| | $– | $12,651,932 |
9. Share Transactions.
Transactions for each class of shares were as follows:
| | Shares | Shares | Dollars | Dollars |
| | Six months ended January 31, 2019 | Year ended July 31, 2018 | Six months ended January 31, 2019 | Year ended July 31, 2018 |
| Series Real Estate Income | | | | |
| Shares sold | 2,216,772 | 48,557,771 | $23,659,928 | $549,896,778 |
| Reinvestment of distributions | 4,492,311 | 5,626,052 | 47,600,566 | 61,652,627 |
| Shares redeemed | (3,701,966) | (8,801,423) | (39,366,363) | (97,080,019) |
| Net increase (decrease) | 3,007,117 | 45,382,400 | $31,894,131 | $514,469,386 |
| Class F | | | | |
| Shares sold | – | 191,320 | $– | $2,169,843 |
| Shares redeemed | – | (42,260,435) | – | (480,517,020) |
| Net increase (decrease) | – | (42,069,115) | $– | $(478,347,177) |
10. Other.
The Fund's organizational documents provide former and current trustees and officers with a limited indemnification against liabilities arising in connection with the performance of their duties to the Fund. In the normal course of business, the Fund may also enter into contracts that provide general indemnifications. The Fund's maximum exposure under these arrangements is unknown as this would be dependent on future claims that may be made against the Fund. The risk of material loss from such claims is considered remote.
At the end of the period, mutual funds managed by the investment adviser or its affiliates were the owners of record of all of the outstanding shares of the Fund.
Shareholder Expense Example
As a shareholder of the Fund, you incur two types of costs: (1) transaction costs, and (2) ongoing costs, including other Fund expenses. This Example is intended to help you understand your ongoing costs (in dollars) of investing in the Fund and to compare these costs with the ongoing costs of investing in other mutual funds.
The Example is based on an investment of $1,000 invested at the beginning of the period and held for the entire period (August 1, 2018 to January 31, 2019).
Actual Expenses
The first line of the accompanying table provides information about actual account values and actual expenses. You may use the information in this line, together with the amount you invested, to estimate the expenses that you paid over the period. Simply divide your account value by $1,000.00 (for example, an $8,600 account value divided by $1,000.00 = 8.6), then multiply the result by the number in the first line under the heading entitled "Expenses Paid During Period" to estimate the expenses you paid on your account during this period. In addition, the Fund, as a shareholder in the underlying Fidelity Central Funds, will indirectly bear its pro-rata share of the fees and expenses incurred by the underlying Fidelity Central Funds. These fees and expenses are not included in the Fund's annualized expense ratio used to calculate the expense estimate in the table below.
Hypothetical Example for Comparison Purposes
The second line of the accompanying table provides information about hypothetical account values and hypothetical expenses based on the Fund's actual expense ratio and an assumed rate of return of 5% per year before expenses, which is not the Fund's actual return. The hypothetical account values and expenses may not be used to estimate the actual ending account balance or expenses you paid for the period. You may use this information to compare the ongoing costs of investing in the Fund and other funds. To do so, compare this 5% hypothetical example with the 5% hypothetical examples that appear in the shareholder reports of the other funds. In addition, the Fund, as a shareholder in the underlying Fidelity Central Funds, will indirectly bear its pro-rata share of the fees and expenses incurred by the underlying Fidelity Central Funds. These fees and expenses are not included in the Fund's annualized expense ratio used to calculate the expense estimate in the table below.
Please note that the expenses shown in the table are meant to highlight your ongoing costs only and do not reflect any transaction costs. Therefore, the second line of the table is useful in comparing ongoing costs only, and will not help you determine the relative total costs of owning different funds.
| | Annualized Expense RatioA,B | Beginning
Account Value
August 1, 2018 | Ending
Account Value
January 31, 2019 | Expenses Paid
During Period
August 1, 2018
to January 31, 2019C,D |
| Series Real Estate Income | - % | | | |
| Actual | | $1,000.00 | $1,025.90 | $- |
| Hypothetical-E | | $1,000.00 | $1,025.21 | $- |
A Annualized expense ratio reflects expenses net of applicable fee waivers.
B Amount represents less than .005%.
C Expenses are equal to the Fund's annualized expense ratio, multiplied by the average account value over the period, multiplied by 184/365 (to reflect the one-half year period).
D Amount represents less than $.005.
E 5% return per year before expenses
Board Approval of Investment Advisory Contracts and Management Fees
Fidelity Series Real Estate Income Fund
Each year, the Board of Trustees, including the Independent Trustees (together, the Board), votes on the renewal of the management contract with Fidelity Management & Research Company (FMR) and the sub-advisory agreements (together, the Advisory Contracts) for the fund. FMR and the sub-advisers are referred to herein as the Investment Advisers. The Board, assisted by the advice of fund counsel and Independent Trustees' counsel, requests and considers a broad range of information relevant to the renewal of the Advisory Contracts throughout the year.
The Board meets regularly and, at each of its meetings, covers an extensive agenda of topics and materials and considers factors that are relevant to its annual consideration of the renewal of the fund's Advisory Contracts, including the services and support provided to the fund and its shareholders. The Board has established various standing committees (Committees), each composed of and chaired by Independent Trustees with varying backgrounds, to which the Board has assigned specific subject matter responsibilities in order to enhance effective decision-making by the Board. The Board, acting directly and through its Committees, requests and receives information concerning the annual consideration of the renewal of the fund's Advisory Contracts. The Board also meets as needed to review matters specifically related to the Board's annual consideration of the renewal of the Advisory Contracts. Members of the Board may also meet with trustees of other Fidelity funds through joint ad hoc committees to discuss certain matters relevant to all of the Fidelity funds.
At its January 2019 meeting, the Board unanimously determined to renew the fund's Advisory Contracts. In considering whether to renew the Advisory Contracts for the fund, the Board considered all factors it believed relevant and reached a determination, with the assistance of fund counsel and Independent Trustees' counsel and through the exercise of its business judgment, that the renewal of the Advisory Contracts was in the best interests of the fund and its shareholders and the fact that no fee is payable under the management contract was fair and reasonable.
Nature, Extent, and Quality of Services Provided. The Board considered Fidelity's staffing as it relates to the fund, including the backgrounds of investment personnel of Fidelity, and also considered the fund's investment objective, strategies, and related investment philosophy. The Independent Trustees also had discussions with senior management of Fidelity's investment operations and investment groups. The Board considered the structure of the investment personnel compensation program and whether this structure provides appropriate incentives to act in the best interests of the fund.
Resources Dedicated to Investment Management and Support Services. The Board and the Fund Oversight and Research Committees reviewed the general qualifications and capabilities of Fidelity's investment staff, including its size, education, experience, and resources, as well as Fidelity's approach to recruiting, training, managing, and compensating investment personnel. The Board noted that Fidelity has continued to increase the resources devoted to non-U.S. offices, including expansion of Fidelity's global investment organization. The Board also noted that Fidelity's analysts have extensive resources, tools and capabilities that allow them to conduct sophisticated quantitative and fundamental analysis, as well as credit analysis of issuers, counterparties and guarantors. Further, the Board considered that Fidelity's investment professionals have sufficient access to global information and data so as to provide competitive investment results over time, and that those professionals also have access to sophisticated tools that permit them to assess portfolio construction and risk and performance attribution characteristics continuously, as well as to transmit new information and research conclusions rapidly around the world. Additionally, in its deliberations, the Board considered Fidelity's trading, risk management, compliance, and technology and operations capabilities and resources, which are integral parts of the investment management process.
Administrative Services. The Board considered (i) the nature, extent, quality, and cost of advisory and administrative services performed by the Investment Advisers and their affiliates under the Advisory Contracts and under separate agreements covering transfer agency, pricing and bookkeeping, and securities lending services for the fund; (ii) the nature and extent of the supervision of third party service providers, principally custodians, subcustodians, and pricing vendors; and (iii) the resources devoted to, and the record of compliance with, the fund's compliance policies and procedures. The Board also reviewed the allocation of fund brokerage, including allocations to brokers affiliated with the Investment Advisers, the use of brokerage commissions to pay fund expenses, and the use of "soft" commission dollars to pay for research services.
Investment Performance. The Board considered whether the fund has operated in accordance with its investment objective, as well as its record of compliance with its investment restrictions. The Board reviewed the fund's absolute investment performance, as well as the fund's relative investment performance, but did not consider performance to be a material factor in its decision to renew the fund's Advisory Contracts, as the fund is not publicly offered as a stand-alone investment product. In this regard, the Board noted that the fund is designed to offer an investment option for other investment companies managed by Fidelity and ultimately to enhance the performance of those investment companies.
Based on its review, the Board concluded that the nature, extent, and quality of services provided to the fund under the Advisory Contracts should continue to benefit the shareholders of the fund.
Competitiveness of Management Fee and Total Expense Ratio. The Board considered that the fund does not pay FMR a management fee for investment advisory services. The Board also noted that FMR or an affiliate undertakes to pay all operating expenses of the fund with certain exceptions.
In connection with the renewal of the Advisory Contracts, the Board also approved amendments to the management contract for the fund to clarify that the fund pays its non-operating expenses, including brokerage commissions and fees and expenses associated with the fund's securities lending program. The Board considered that the amendments would not change the services provided to the fund or the party responsible for making such payments under the current management contract.
The Board further considered that FMR has contractually agreed to reimburse the fund to the extent that total operating expenses, with certain exceptions, as a percentage of its average net assets, exceed 0.014% through September 30, 2020.
Based on its review, the Board considered that the fund does not pay a management fee and concluded that the total expense ratio of each class of the fund was reasonable in light of the services that the fund and its shareholders receive and the other factors considered.
Costs of the Services and Profitability. The Board considered the level of Fidelity's profits in respect of all the Fidelity funds.
PricewaterhouseCoopers LLP (PwC), auditor to Fidelity and certain Fidelity funds, has been engaged annually by the Board as part of the Board's assessment of Fidelity's profitability analysis. PwC's engagement includes the review and assessment of the methodologies used by Fidelity in determining the revenues and expenses attributable to Fidelity's mutual fund business, and completion of agreed-upon procedures in respect of the mathematical accuracy of the fund profitability information and its conformity to established allocation methodologies. After considering PwC's reports issued under the engagement and information provided by Fidelity, the Board concluded that while other allocation methods may also be reasonable, Fidelity's profitability methodologies are reasonable in all material respects.
The Board also reviewed Fidelity's non-fund businesses and potential indirect benefits such businesses may have received as a result of their association with Fidelity's mutual fund business (i.e., fall-out benefits) as well as cases where Fidelity's affiliates may benefit from the fund's business. The Board noted that changes to fall-out benefits year-over-year reflect business developments at Fidelity's various businesses.
The Board concluded that the costs of the services provided by and the profits realized by Fidelity in connection with the operation of the fund were not relevant to the renewal of the Advisory Contracts because the fund pays no advisory fees and FMR or an affiliate bears all expenses of the fund with certain exceptions.
Economies of Scale. The Board concluded that because the fund pays no advisory fees and FMR or an affiliate bears all expenses of the fund with certain exceptions, the realization of economies of scale was not a material factor in the Board's decision to renew the fund's Advisory Contracts.
Additional Information Requested by the Board. In order to develop fully the factual basis for consideration of the Fidelity funds' advisory contracts, the Board requested and received additional information on certain topics, including: (i) fund performance trends, in particular the underperformance of certain funds, and Fidelity's long-term strategies for certain funds; (ii) Fidelity's fund profitability methodology, profitability trends for certain funds, and the impact of certain factors on fund profitability results; (iii) metrics for evaluating index fund and ETF performance and information about ETF trading characteristics; (iv) the methodology with respect to the evaluation of competitive fund data and peer group classifications and fee comparisons; (v) the expense structures for different funds and classes; (vi) information regarding other accounts managed by Fidelity, including collective investment trusts; and (vii) Fidelity's philosophies and strategies for evaluating funds and classes with lower or declining asset levels.
Based on its evaluation of all of the conclusions noted above, and after considering all factors it believed relevant, the Board concluded that the advisory fee arrangements are fair and reasonable, and that the fund's Advisory Contracts should be renewed.
SRE-SANN-0319
1.924313.107
Fidelity® Series Small Cap Opportunities Fund
Semi-Annual Report January 31, 2019 |
|
Beginning on January 1, 2021, as permitted by regulations adopted by the Securities and Exchange Commission, paper copies of a fund’s shareholder reports will no longer be sent by mail, unless you specifically request paper copies of the reports from the fund or from your financial intermediary, such as a financial advisor, broker-dealer or bank. Instead, the reports will be made available on a website, and you will be notified by mail each time a report is posted and provided with a website link to access the report.
If you already elected to receive shareholder reports electronically, you will not be affected by this change and you need not take any action. You may elect to receive shareholder reports and other communications from a fund electronically, by contacting your financial intermediary. For Fidelity customers, visit Fidelity's web site or call Fidelity using the contact information listed below.
You may elect to receive all future reports in paper free of charge. If you wish to continue receiving paper copies of your shareholder reports, you may contact your financial intermediary or, if you are a Fidelity customer, visit Fidelity’s website, or call Fidelity at the applicable toll-free number listed below. Your election to receive reports in paper will apply to all funds held with the fund complex/your financial intermediary.
| Account Type | Website | Phone Number |
| Brokerage, Mutual Fund, or Annuity Contracts: | fidelity.com/mailpreferences | 1-800-343-3548 |
| Employer Provided Retirement Accounts: | netbenefits.fidelity.com/preferences (choose 'no' under Required Disclosures to continue to print) | 1-800-343-0860 |
| Advisor Sold Accounts Serviced Through Your Financial Intermediary: | Contact Your Financial Intermediary | Your Financial Intermediary's phone number |
| Advisor Sold Accounts Serviced by Fidelity: | institutional.fidelity.com | 1-877-208-0098 |
Contents
To view a fund's proxy voting guidelines and proxy voting record for the 12-month period ended June 30, visit http://www.fidelity.com/proxyvotingresults or visit the Securities and Exchange Commission's (SEC) web site at http://www.sec.gov.
You may also call 1-800-544-8544 to request a free copy of the proxy voting guidelines.
Standard & Poor's, S&P and S&P 500 are registered service marks of The McGraw-Hill Companies, Inc. and have been licensed for use by Fidelity Distributors Corporation.
Other third-party marks appearing herein are the property of their respective owners.
All other marks appearing herein are registered or unregistered trademarks or service marks of FMR LLC or an affiliated company. © 2019 FMR LLC. All rights reserved.
This report and the financial statements contained herein are submitted for the general information of the shareholders of the Fund. This report is not authorized for distribution to prospective investors in the Fund unless preceded or accompanied by an effective prospectus.
A fund files its complete schedule of portfolio holdings with the SEC for the first and third quarters of each fiscal year on Form N-Q. Forms N-Q are available on the SEC’s web site at http://www.sec.gov. A fund's Forms N-Q may be reviewed and copied at the SEC’s Public Reference Room in Washington, DC. Information regarding the operation of the SEC's Public Reference Room may be obtained by calling 1-800-SEC-0330.
For a complete list of a fund's portfolio holdings, view the most recent holdings listing, semiannual report, or annual report on Fidelity's web site at http://www.fidelity.com, http://www.institutional.fidelity.com, or http://www.401k.com, as applicable.
NOT FDIC INSURED •MAY LOSE VALUE •NO BANK GUARANTEE
Neither the Fund nor Fidelity Distributors Corporation is a bank.
Investment Summary (Unaudited)
Top Ten Stocks as of January 31, 2019
| | % of fund's net assets |
| Four Corners Property Trust, Inc. | 1.1 |
| Americold Realty Trust | 1.0 |
| Moog, Inc. Class A | 0.9 |
| Store Capital Corp. | 0.9 |
| Simpson Manufacturing Co. Ltd. | 0.9 |
| EMCOR Group, Inc. | 0.9 |
| Terreno Realty Corp. | 0.9 |
| Primerica, Inc. | 0.9 |
| Agree Realty Corp. | 0.8 |
| ITT, Inc. | 0.8 |
| | 9.1 |
Top Five Market Sectors as of January 31, 2019
| | % of fund's net assets |
| Financials | 17.1 |
| Health Care | 15.0 |
| Information Technology | 15.0 |
| Industrials | 13.8 |
| Consumer Discretionary | 11.7 |
Asset Allocation (% of fund's net assets)
| As of January 31, 2019* |
| | Stocks and Equity Futures | 97.7% |
| | Short-Term Investments and Net Other Assets (Liabilities) | 2.3% |

* Foreign investments - 9.7%
Schedule of Investments January 31, 2019 (Unaudited)
Showing Percentage of Net Assets
| Common Stocks - 96.7% | | | |
| | | Shares | Value |
| COMMUNICATION SERVICES - 2.6% | | | |
| Diversified Telecommunication Services - 0.3% | | | |
| Iridium Communications, Inc. (a) | | 880,300 | $17,060,214 |
| Entertainment - 0.3% | | | |
| Cinemark Holdings, Inc. | | 457,400 | 18,716,808 |
| Interactive Media & Services - 0.5% | | | |
| CarGurus, Inc. Class A (a) | | 566,900 | 24,246,313 |
| Media - 1.1% | | | |
| Nexstar Broadcasting Group, Inc. Class A | | 388,000 | 32,386,360 |
| The New York Times Co. Class A | | 1,084,100 | 27,872,211 |
| | | | 60,258,571 |
| Wireless Telecommunication Services - 0.4% | | | |
| Boingo Wireless, Inc. (a) | | 888,000 | 21,418,560 |
|
| TOTAL COMMUNICATION SERVICES | | | 141,700,466 |
|
| CONSUMER DISCRETIONARY - 11.7% | | | |
| Auto Components - 0.7% | | | |
| Fox Factory Holding Corp. (a) | | 322,000 | 19,104,260 |
| Standard Motor Products, Inc. | | 403,534 | 19,837,731 |
| | | | 38,941,991 |
| Diversified Consumer Services - 0.3% | | | |
| Laureate Education, Inc. Class A (a) | | 1,098,600 | 17,577,600 |
| Weight Watchers International, Inc. (a) | | 7 | 224 |
| | | | 17,577,824 |
| Hotels, Restaurants & Leisure - 3.6% | | | |
| BJ's Restaurants, Inc. | | 419,100 | 20,883,753 |
| Bluegreen Vacations Corp. | | 1,128,570 | 15,122,838 |
| Churchill Downs, Inc. | | 355,500 | 32,698,890 |
| Eldorado Resorts, Inc. (a) | | 178,000 | 8,298,360 |
| Planet Fitness, Inc. (a) | | 726,300 | 42,067,296 |
| PlayAGS, Inc. (a) | | 830,583 | 20,814,410 |
| Texas Roadhouse, Inc. Class A | | 569,500 | 34,648,380 |
| YETI Holdings, Inc. (b) | | 1,142,700 | 19,437,327 |
| | | | 193,971,254 |
| Household Durables - 2.1% | | | |
| Cavco Industries, Inc. (a) | | 115,019 | 19,126,510 |
| Helen of Troy Ltd. (a) | | 240,279 | 27,881,975 |
| Taylor Morrison Home Corp. (a) | | 1,376,700 | 26,019,630 |
| TopBuild Corp. (a) | | 426,189 | 22,507,041 |
| TRI Pointe Homes, Inc. (a) | | 1,543,333 | 20,757,829 |
| | | | 116,292,985 |
| Leisure Products - 0.4% | | | |
| Brunswick Corp. | | 229,000 | 11,523,280 |
| Johnson Outdoors, Inc. Class A | | 188,293 | 11,796,556 |
| | | | 23,319,836 |
| Multiline Retail - 0.6% | | | |
| Ollie's Bargain Outlet Holdings, Inc. (a) | | 397,600 | 31,080,392 |
| Specialty Retail - 2.1% | | | |
| Burlington Stores, Inc. (a) | | 138,100 | 23,713,151 |
| Monro, Inc. | | 359,481 | 25,760,408 |
| Murphy U.S.A., Inc. (a) | | 343,500 | 25,264,425 |
| The Children's Place Retail Stores, Inc. | | 241,500 | 23,367,540 |
| Williams-Sonoma, Inc. (b) | | 323,400 | 17,602,662 |
| | | | 115,708,186 |
| Textiles, Apparel & Luxury Goods - 1.9% | | | |
| Deckers Outdoor Corp. (a) | | 309,500 | 39,755,275 |
| Steven Madden Ltd. | | 1,069,347 | 34,914,180 |
| Wolverine World Wide, Inc. | | 787,652 | 27,024,340 |
| | | | 101,693,795 |
|
| TOTAL CONSUMER DISCRETIONARY | | | 638,586,263 |
|
| CONSUMER STAPLES - 3.1% | | | |
| Beverages - 0.3% | | | |
| Cott Corp. | | 947,400 | 14,381,532 |
| Food & Staples Retailing - 1.4% | | | |
| BJ's Wholesale Club Holdings, Inc. | | 1,140,390 | 30,003,661 |
| Casey's General Stores, Inc. | | 133,400 | 17,165,912 |
| Performance Food Group Co. (a) | | 779,425 | 26,625,158 |
| | | | 73,794,731 |
| Food Products - 0.8% | | | |
| Ingredion, Inc. | | 145,500 | 14,404,500 |
| Nomad Foods Ltd. (a) | | 948,200 | 17,380,506 |
| Post Holdings, Inc. (a) | | 119,500 | 11,091,990 |
| | | | 42,876,996 |
| Household Products - 0.3% | | | |
| Central Garden & Pet Co. (a) | | 482,300 | 18,910,983 |
| Personal Products - 0.3% | | | |
| Inter Parfums, Inc. | | 273,100 | 18,150,226 |
|
| TOTAL CONSUMER STAPLES | | | 168,114,468 |
|
| ENERGY - 3.6% | | | |
| Energy Equipment & Services - 1.1% | | | |
| Liberty Oilfield Services, Inc. Class A (b) | | 654,823 | 9,959,858 |
| Nabors Industries Ltd. | | 4,572,800 | 13,535,488 |
| Rowan Companies PLC (a) | | 1,927,410 | 23,495,128 |
| Total Energy Services, Inc. | | 1,486,477 | 10,973,650 |
| | | | 57,964,124 |
| Oil, Gas & Consumable Fuels - 2.5% | | | |
| Delek U.S. Holdings, Inc. | | 1,201,100 | 39,047,761 |
| Diamondback Energy, Inc. | | 130,793 | 13,487,374 |
| PDC Energy, Inc. (a) | | 784,277 | 25,543,902 |
| Viper Energy Partners LP | | 786,685 | 24,945,781 |
| WPX Energy, Inc. (a) | | 2,627,310 | 32,210,821 |
| | | | 135,235,639 |
|
| TOTAL ENERGY | | | 193,199,763 |
|
| FINANCIALS - 17.1% | | | |
| Banks - 9.5% | | | |
| Associated Banc-Corp. | | 1,631,612 | 35,324,400 |
| BancFirst Corp. | | 663,786 | 35,632,032 |
| Banner Corp. | | 704,826 | 38,441,210 |
| City Holding Co. | | 487,800 | 34,965,504 |
| Cullen/Frost Bankers, Inc. | | 344,100 | 33,474,048 |
| First Bancorp, Puerto Rico | | 2,490,000 | 26,518,500 |
| First Citizens Bancshares, Inc. | | 75,000 | 30,564,750 |
| First Hawaiian, Inc. | | 1,397,900 | 35,967,967 |
| First Interstate Bancsystem, Inc. | | 737,900 | 28,719,068 |
| First Merchants Corp. | | 842,770 | 30,870,665 |
| Heartland Financial U.S.A., Inc. | | 612,878 | 27,800,146 |
| Independent Bank Corp., Massachusetts | | 429,779 | 34,287,769 |
| Preferred Bank, Los Angeles | | 21,399 | 996,337 |
| Trico Bancshares | | 984,669 | 37,141,715 |
| Trustmark Corp. | | 845,952 | 26,672,867 |
| WesBanco, Inc. | | 834,600 | 33,893,106 |
| Wintrust Financial Corp. | | 382,000 | 27,175,480 |
| | | | 518,445,564 |
| Capital Markets - 2.0% | | | |
| Hamilton Lane, Inc. Class A | | 652,900 | 23,680,683 |
| Houlihan Lokey | | 570,700 | 25,247,768 |
| Morningstar, Inc. | | 290,238 | 36,033,048 |
| PJT Partners, Inc. | | 603,566 | 26,243,050 |
| | | | 111,204,549 |
| Consumer Finance - 0.8% | | | |
| First Cash Financial Services, Inc. | | 508,900 | 41,948,627 |
| Insurance - 2.8% | | | |
| Amerisafe, Inc. | | 465,000 | 27,625,650 |
| Employers Holdings, Inc. | | 954,170 | 40,428,183 |
| First American Financial Corp. | | 763,500 | 38,236,080 |
| Primerica, Inc. | | 413,130 | 46,423,418 |
| | | | 152,713,331 |
| Mortgage Real Estate Investment Trusts - 0.5% | | | |
| Redwood Trust, Inc. | | 1,619,100 | 26,116,083 |
| Thrifts & Mortgage Finance - 1.5% | | | |
| Essent Group Ltd. (a) | | 757,700 | 30,118,575 |
| NMI Holdings, Inc. (a) | | 626,275 | 13,778,050 |
| WSFS Financial Corp. | | 867,105 | 36,565,818 |
| | | | 80,462,443 |
|
| TOTAL FINANCIALS | | | 930,890,597 |
|
| HEALTH CARE - 15.0% | | | |
| Biotechnology - 8.3% | | | |
| Abeona Therapeutics, Inc. (a) | | 1,125,015 | 7,638,852 |
| ACADIA Pharmaceuticals, Inc. (a)(b) | | 1,190,906 | 27,128,839 |
| Acorda Therapeutics, Inc. (a) | | 860,971 | 14,317,948 |
| Agios Pharmaceuticals, Inc. (a) | | 249,145 | 13,354,172 |
| Allakos, Inc. (a)(b) | | 320,988 | 12,823,471 |
| AnaptysBio, Inc. (a) | | 221,900 | 14,716,408 |
| Argenx SE ADR (a) | | 186,200 | 19,757,682 |
| Array BioPharma, Inc. (a) | | 1,075,000 | 20,070,250 |
| Ascendis Pharma A/S sponsored ADR (a) | | 293,548 | 20,976,940 |
| Atara Biotherapeutics, Inc. (a) | | 481,897 | 18,312,086 |
| Audentes Therapeutics, Inc. (a) | | 489,080 | 12,129,184 |
| bluebird bio, Inc. (a) | | 116,656 | 15,565,410 |
| Cellectis SA sponsored ADR (a) | | 502,444 | 8,878,185 |
| Crinetics Pharmaceuticals, Inc. (a) | | 559,218 | 14,696,249 |
| CytomX Therapeutics, Inc. (a) | | 294,000 | 4,992,120 |
| CytomX Therapeutics, Inc. (a)(c) | | 105,499 | 1,791,373 |
| FibroGen, Inc. (a) | | 585,100 | 33,204,425 |
| Heron Therapeutics, Inc. (a) | | 632,800 | 17,022,320 |
| Insmed, Inc. (a) | | 874,182 | 21,251,364 |
| Intercept Pharmaceuticals, Inc. (a) | | 194,798 | 23,508,223 |
| Ionis Pharmaceuticals, Inc. (a) | | 280,172 | 16,249,976 |
| Kezar Life Sciences, Inc. (b) | | 729,500 | 13,065,345 |
| La Jolla Pharmaceutical Co. (a)(b) | | 668,700 | 4,038,948 |
| Mirati Therapeutics, Inc. (a) | | 333,200 | 22,017,856 |
| Neurocrine Biosciences, Inc. (a) | | 246,982 | 21,788,752 |
| Principia Biopharma, Inc. | | 271,985 | 8,243,865 |
| Protagonist Therapeutics, Inc. (a) | | 925,504 | 7,542,858 |
| Sage Therapeutics, Inc. (a) | | 121,975 | 17,392,415 |
| Sarepta Therapeutics, Inc. (a) | | 137,500 | 19,210,125 |
| | | | 451,685,641 |
| Health Care Equipment & Supplies - 2.4% | | | |
| Glaukos Corp. (a) | | 230,900 | 14,729,111 |
| Integra LifeSciences Holdings Corp. (a) | | 192,936 | 9,137,449 |
| iRhythm Technologies, Inc. (a) | | 352,100 | 29,928,500 |
| Masimo Corp. (a) | | 321,900 | 40,041,141 |
| Merit Medical Systems, Inc. (a) | | 312,400 | 17,659,972 |
| Steris PLC | | 177,500 | 20,245,650 |
| | | | 131,741,823 |
| Health Care Providers & Services - 1.4% | | | |
| AMN Healthcare Services, Inc. (a) | | 229,800 | 14,888,742 |
| G1 Therapeutics, Inc. (a) | | 543,645 | 11,628,567 |
| Molina Healthcare, Inc. (a) | | 243,500 | 32,380,630 |
| Wellcare Health Plans, Inc. (a) | | 74,100 | 20,487,168 |
| | | | 79,385,107 |
| Health Care Technology - 0.8% | | | |
| Inovalon Holdings, Inc. Class A (a) | | 907,900 | 12,973,891 |
| Veeva Systems, Inc. Class A (a) | | 182,100 | 19,859,826 |
| Vocera Communications, Inc. (a) | | 208,530 | 8,512,195 |
| | | | 41,345,912 |
| Life Sciences Tools & Services - 0.7% | | | |
| ICON PLC (a) | | 267,900 | 37,473,852 |
| Pharmaceuticals - 1.4% | | | |
| MyoKardia, Inc. (a) | | 215,430 | 8,914,493 |
| Nektar Therapeutics (a) | | 424,000 | 17,952,160 |
| Theravance Biopharma, Inc. (a) | | 663,172 | 17,275,631 |
| Xeris Pharmaceuticals, Inc. | | 659,400 | 9,152,472 |
| Zogenix, Inc. (a) | | 499,400 | 21,848,750 |
| | | | 75,143,506 |
|
| TOTAL HEALTH CARE | | | 816,775,841 |
|
| INDUSTRIALS - 13.8% | | | |
| Aerospace & Defense - 1.6% | | | |
| Moog, Inc. Class A | | 551,260 | 49,321,232 |
| Teledyne Technologies, Inc. (a) | | 174,540 | 39,135,359 |
| | | | 88,456,591 |
| Air Freight & Logistics - 0.6% | | | |
| Air Transport Services Group, Inc. (a) | | 1,355,030 | 32,181,963 |
| Building Products - 1.7% | | | |
| Allegion PLC | | 322,390 | 27,680,405 |
| Armstrong World Industries, Inc. | | 243,300 | 16,554,132 |
| Simpson Manufacturing Co. Ltd. | | 767,980 | 47,138,612 |
| | | | 91,373,149 |
| Commercial Services & Supplies - 1.5% | | | |
| ADS Waste Holdings, Inc. (a) | | 1,095,800 | 27,614,160 |
| Interface, Inc. | | 1,678,920 | 27,551,077 |
| Tomra Systems ASA | | 994,998 | 25,777,609 |
| | | | 80,942,846 |
| Construction & Engineering - 2.6% | | | |
| Comfort Systems U.S.A., Inc. | | 845,060 | 40,537,528 |
| EMCOR Group, Inc. | | 713,420 | 46,536,387 |
| Jacobs Engineering Group, Inc. | | 459,380 | 29,767,824 |
| Valmont Industries, Inc. | | 200,240 | 25,830,960 |
| | | | 142,672,699 |
| Industrial Conglomerates - 0.8% | | | |
| ITT, Inc. | | 846,960 | 44,516,218 |
| Machinery - 1.8% | | | |
| AGCO Corp. | | 314,040 | 20,161,368 |
| Allison Transmission Holdings, Inc. | | 496,100 | 24,145,187 |
| SPX Flow, Inc. (a) | | 814,709 | 26,698,014 |
| Standex International Corp. | | 372,830 | 27,805,661 |
| | | | 98,810,230 |
| Professional Services - 0.6% | | | |
| CBIZ, Inc. (a) | | 1,547,043 | 30,322,043 |
| Road & Rail - 0.5% | | | |
| Landstar System, Inc. | | 251,350 | 25,532,133 |
| Trading Companies & Distributors - 2.1% | | | |
| Kaman Corp. | | 712,330 | 42,112,950 |
| MRC Global, Inc. (a) | | 1,898,620 | 29,656,444 |
| Univar, Inc. (a) | | 1,091,779 | 22,741,757 |
| Watsco, Inc. | | 148,330 | 21,875,708 |
| | | | 116,386,859 |
|
| TOTAL INDUSTRIALS | | | 751,194,731 |
|
| INFORMATION TECHNOLOGY - 15.0% | | | |
| Communications Equipment - 0.5% | | | |
| InterDigital, Inc. | | 409,167 | 29,791,449 |
| Electronic Equipment & Components - 2.1% | | | |
| CTS Corp. | | 514,076 | 14,584,336 |
| ePlus, Inc. (a) | | 341,132 | 27,024,477 |
| Fabrinet | | 522,200 | 29,681,848 |
| Plexus Corp. (a) | | 408,796 | 22,941,632 |
| TTM Technologies, Inc. (a) | | 1,915,485 | 21,989,768 |
| | | | 116,222,061 |
| IT Services - 4.6% | | | |
| Amdocs Ltd. | | 384,400 | 21,480,272 |
| CACI International, Inc. Class A (a) | | 139,500 | 23,321,610 |
| Carbonite, Inc. (a) | | 853,914 | 24,456,097 |
| EPAM Systems, Inc. (a) | | 220,048 | 31,132,391 |
| ExlService Holdings, Inc. (a) | | 410,101 | 23,580,808 |
| Maximus, Inc. | | 405,901 | 28,465,837 |
| Presidio, Inc. | | 1,217,200 | 19,389,996 |
| Science Applications International Corp. | | 363,199 | 24,385,181 |
| Wix.com Ltd. (a) | | 236,268 | 25,835,906 |
| WNS Holdings Ltd. sponsored ADR (a) | | 573,584 | 27,985,163 |
| | | | 250,033,261 |
| Semiconductors & Semiconductor Equipment - 2.3% | | | |
| Brooks Automation, Inc. | | 114,065 | 3,550,843 |
| Cabot Microelectronics Corp. | | 231,900 | 23,628,291 |
| Entegris, Inc. | | 1,322,291 | 43,701,718 |
| Nanometrics, Inc. (a) | | 654,435 | 20,019,167 |
| Semtech Corp. (a) | | 675,200 | 32,787,712 |
| | | | 123,687,731 |
| Software - 5.5% | | | |
| BlackLine, Inc. (a) | | 409,638 | 19,490,576 |
| CommVault Systems, Inc. (a) | | 411,500 | 27,187,805 |
| Everbridge, Inc. (a) | | 435,100 | 26,915,286 |
| Five9, Inc. (a) | | 720,800 | 36,854,504 |
| LivePerson, Inc. (a) | | 1,203,778 | 28,252,670 |
| MINDBODY, Inc. (a) | | 372,500 | 13,581,350 |
| New Relic, Inc. (a) | | 333,400 | 33,890,110 |
| Paycom Software, Inc. (a) | | 136,293 | 20,204,074 |
| Q2 Holdings, Inc. (a) | | 247,900 | 14,732,697 |
| RealPage, Inc. (a) | | 323,991 | 18,068,978 |
| RingCentral, Inc. (a) | | 325,551 | 30,093,934 |
| SPS Commerce, Inc. (a) | | 305,600 | 27,094,496 |
| | | | 296,366,480 |
|
| TOTAL INFORMATION TECHNOLOGY | | | 816,100,982 |
|
| MATERIALS - 4.3% | | | |
| Chemicals - 2.2% | | | |
| Chase Corp. | | 261,294 | 26,343,661 |
| Ingevity Corp. (a) | | 320,604 | 30,159,218 |
| Innospec, Inc. | | 474,500 | 33,343,115 |
| Olin Corp. | | 673,400 | 15,898,974 |
| Trinseo SA | | 213,200 | 10,457,460 |
| Tronox Ltd. Class A | | 557,500 | 4,883,700 |
| | | | 121,086,128 |
| Construction Materials - 0.7% | | | |
| Eagle Materials, Inc. | | 155,400 | 11,033,400 |
| nVent Electric PLC | | 965,600 | 24,159,312 |
| | | | 35,192,712 |
| Containers & Packaging - 0.6% | | | |
| Owens-Illinois, Inc. | | 911,300 | 18,289,791 |
| Sonoco Products Co. | | 287,900 | 16,577,282 |
| | | | 34,867,073 |
| Metals & Mining - 0.8% | | | |
| Alcoa Corp. (a) | | 260,700 | 7,737,576 |
| B2Gold Corp. (a) | | 4,774,200 | 15,115,242 |
| Steel Dynamics, Inc. | | 566,818 | 20,739,871 |
| | | | 43,592,689 |
|
| TOTAL MATERIALS | | | 234,738,602 |
|
| REAL ESTATE - 7.3% | | | |
| Equity Real Estate Investment Trusts (REITs) - 7.3% | | | |
| Agree Realty Corp. | | 698,500 | 46,121,955 |
| Americold Realty Trust (b) | | 1,766,000 | 51,779,120 |
| CoreSite Realty Corp. | | 411,926 | 40,694,170 |
| CubeSmart | | 471,875 | 14,604,531 |
| Equity Lifestyle Properties, Inc. | | 415,879 | 44,033,269 |
| Four Corners Property Trust, Inc. | | 2,141,354 | 60,471,833 |
| Rexford Industrial Realty, Inc. | | 1,285,089 | 43,178,990 |
| Store Capital Corp. | | 1,517,603 | 49,048,929 |
| Terreno Realty Corp. | | 1,152,000 | 46,471,680 |
| | | | 396,404,477 |
| UTILITIES - 3.2% | | | |
| Electric Utilities - 2.0% | | | |
| Allete, Inc. | | 212,700 | 16,365,138 |
| El Paso Electric Co. | | 521,780 | 27,403,886 |
| Hawaiian Electric Industries, Inc. | | 285,800 | 10,628,902 |
| IDACORP, Inc. | | 328,100 | 31,989,750 |
| Vistra Energy Corp. (a) | | 988,400 | 24,818,724 |
| | | | 111,206,400 |
| Gas Utilities - 1.2% | | | |
| Atmos Energy Corp. | | 156,586 | 15,287,491 |
| China Resource Gas Group Ltd. | | 2,430,300 | 9,563,492 |
| Southwest Gas Holdings, Inc. | | 252,500 | 19,775,800 |
| Spire, Inc. | | 234,108 | 18,581,152 |
| | | | 63,207,935 |
|
| TOTAL UTILITIES | | | 174,414,335 |
|
| TOTAL COMMON STOCKS | | | |
| (Cost $4,494,906,240) | | | 5,262,120,525 |
| | | Principal Amount | Value |
|
| U.S. Treasury Obligations - 0.1% | | | |
| U.S. Treasury Bills, yield at date of purchase 2.32% to 2.37% 2/14/19 to 5/2/19 (d) | | | |
| (Cost $2,467,151) | | 2,480,000 | 2,467,161 |
| | | Shares | Value |
|
| Money Market Funds - 4.7% | | | |
| Fidelity Cash Central Fund, 2.43% (e) | | 174,950,807 | $174,985,798 |
| Fidelity Securities Lending Cash Central Fund 2.43%(e)(f) | | 82,997,712 | 83,006,012 |
| TOTAL MONEY MARKET FUNDS | | | |
| (Cost $257,990,189) | | | 257,991,810 |
| TOTAL INVESTMENT IN SECURITIES - 101.5% | | | |
| (Cost $4,755,363,580) | | | 5,522,579,496 |
| NET OTHER ASSETS (LIABILITIES) - (1.5)% | | | (83,173,209) |
| NET ASSETS - 100% | | | $5,439,406,287 |
| Futures Contracts | | | | | |
| | Number of contracts | Expiration Date | Notional Amount | Value | Unrealized Appreciation/(Depreciation) |
| Purchased | | | | | |
| Equity Index Contracts | | | | | |
| CME E-mini Russell 2000 Index Contracts (United States) | 710 | March 2019 | $53,257,100 | $3,108,733 | $3,108,733 |
The notional amount of futures purchased as a percentage of Net Assets is 1.0%
Legend
(a) Non-income producing
(b) Security or a portion of the security is on loan at period end.
(c) Security exempt from registration under Rule 144A of the Securities Act of 1933. These securities may be resold in transactions exempt from registration, normally to qualified institutional buyers. At the end of the period, the value of these securities amounted to $1,791,373 or 0.0% of net assets.
(d) Security or a portion of the security was pledged to cover margin requirements for futures contracts. At period end, the value of securities pledged amounted to $2,467,161.
(e) Affiliated fund that is generally available only to investment companies and other accounts managed by Fidelity Investments. The rate quoted is the annualized seven-day yield of the fund at period end. A complete unaudited listing of the fund's holdings as of its most recent quarter end is available upon request. In addition, each Fidelity Central Fund's financial statements are available on the SEC's website or upon request.
(f) Investment made with cash collateral received from securities on loan.
Affiliated Central Funds
Information regarding fiscal year to date income earned by the Fund from investments in Fidelity Central Funds is as follows:
| Fund | Income earned |
| Fidelity Cash Central Fund | $1,364,705 |
| Fidelity Securities Lending Cash Central Fund | 274,726 |
| Total | $1,639,431 |
Amounts in the income column in the above table include any capital gain distributions from underlying funds, which are presented in the corresponding line-item in the Statement of Operations, if applicable.
Other Affiliated Issuers
An affiliated company is a company in which the Fund has ownership of at least 5% of the voting securities. Fiscal year to date transactions with companies which are or were affiliates are as follows:
| Affiliate | Value, beginning of period | Purchases | Sales Proceeds | Dividend Income | Realized Gain (loss) | Change in Unrealized appreciation (depreciation) | Value, end of period |
| Kezar Life Sciences, Inc. | $17,029,271 | $-- | $7,339,234 | $-- | $1,664,460 | $1,710,848 | $-- |
| Total | $17,029,271 | $-- | $7,339,234 | $-- | $1,664,460 | $1,710,848 | $-- |
Investment Valuation
The following is a summary of the inputs used, as of January 31, 2019, involving the Fund's assets and liabilities carried at fair value. The inputs or methodology used for valuing securities may not be an indication of the risk associated with investing in those securities. For more information on valuation inputs, and their aggregation into the levels used below, please refer to the Investment Valuation section in the accompanying Notes to Financial Statements.
| | Valuation Inputs at Reporting Date: |
| Description | Total | Level 1 | Level 2 | Level 3 |
| Investments in Securities: | | | | |
| Equities: | | | | |
| Communication Services | $141,700,466 | $141,700,466 | $-- | $-- |
| Consumer Discretionary | 638,586,263 | 638,586,263 | -- | -- |
| Consumer Staples | 168,114,468 | 168,114,468 | -- | -- |
| Energy | 193,199,763 | 193,199,763 | -- | -- |
| Financials | 930,890,597 | 930,890,597 | -- | -- |
| Health Care | 816,775,841 | 816,775,841 | -- | -- |
| Industrials | 751,194,731 | 751,194,731 | -- | -- |
| Information Technology | 816,100,982 | 816,100,982 | -- | -- |
| Materials | 234,738,602 | 234,738,602 | -- | -- |
| Real Estate | 396,404,477 | 396,404,477 | -- | -- |
| Utilities | 174,414,335 | 164,850,843 | 9,563,492 | -- |
| U.S. Government and Government Agency Obligations | 2,467,161 | -- | 2,467,161 | -- |
| Money Market Funds | 257,991,810 | 257,991,810 | -- | -- |
| Total Investments in Securities: | $5,522,579,496 | $5,510,548,843 | $12,030,653 | $-- |
| Derivative Instruments: | | | | |
| Assets | | | | |
| Futures Contracts | $3,108,733 | $3,108,733 | $-- | $-- |
| Total Assets | $3,108,733 | $3,108,733 | $-- | $-- |
| Total Derivative Instruments: | $3,108,733 | $3,108,733 | $-- | $-- |
Value of Derivative Instruments
The following table is a summary of the Fund's value of derivative instruments by primary risk exposure as of January 31, 2019. For additional information on derivative instruments, please refer to the Derivative Instruments section in the accompanying Notes to Financial Statements.
| Primary Risk Exposure / Derivative Type | Value |
| | Asset | Liability |
| Equity Risk | | |
| Futures Contracts(a) | $3,108,733 | $0 |
| Total Equity Risk | 3,108,733 | 0 |
| Total Value of Derivatives | $3,108,733 | $0 |
(a) Reflects gross cumulative appreciation (depreciation) on futures contracts as presented in the Schedule of Investments. In the Statement of Assets and Liabilities, the period end daily variation margin is included in receivable or payable for daily variation margin on futures contracts, and the net cumulative appreciation (depreciation) is included in net unrealized appreciation (depreciation).
See accompanying notes which are an integral part of the financial statements.
Financial Statements
Statement of Assets and Liabilities
| | | January 31, 2019 (Unaudited) |
| Assets | | |
Investment in securities, at value (including securities loaned of $82,477,514) — See accompanying schedule:
Unaffiliated issuers (cost $4,497,373,391) | $5,264,587,686 | |
| Fidelity Central Funds (cost $257,990,189) | 257,991,810 | |
| Total Investment in Securities (cost $4,755,363,580) | | $5,522,579,496 |
| Cash | | 1,651,099 |
| Receivable for investments sold | | 41,584,861 |
| Receivable for fund shares sold | | 2,843,867 |
| Dividends receivable | | 1,691,314 |
| Distributions receivable from Fidelity Central Funds | | 22,786 |
| Receivable for daily variation margin on futures contracts | | 382,294 |
| Other receivables | | 29,131 |
| Total assets | | 5,570,784,848 |
| Liabilities | | |
| Payable for investments purchased | $45,444,935 | |
| Payable for fund shares redeemed | 2,909,274 | |
| Other payables and accrued expenses | 25,426 | |
| Collateral on securities loaned | 82,998,926 | |
| Total liabilities | | 131,378,561 |
| Net Assets | | $5,439,406,287 |
| Net Assets consist of: | | |
| Paid in capital | | $4,749,592,930 |
| Total distributable earnings (loss) | | 689,813,357 |
| Net Assets | | $5,439,406,287 |
| Net Asset Value and Maximum Offering Price | | |
| Net Asset Value, offering price and redemption price per share ($5,439,406,287 ÷ 426,443,386 shares) | | $12.76 |
See accompanying notes which are an integral part of the financial statements.
Statement of Operations
| | | Six months ended January 31, 2019 (Unaudited) |
| Investment Income | | |
| Dividends | | $31,367,208 |
| Interest | | 29,566 |
| Income from Fidelity Central Funds | | 1,639,431 |
| Total income | | 33,036,205 |
| Expenses | | |
| Custodian fees and expenses | $50,578 | |
| Independent trustees' fees and expenses | 18,535 | |
| Commitment fees | 7,664 | |
| Total expenses | | 76,777 |
| Net investment income (loss) | | 32,959,428 |
| Realized and Unrealized Gain (Loss) | | |
| Net realized gain (loss) on: | | |
| Investment securities: | | |
| Unaffiliated issuers | 85,494,293 | |
| Fidelity Central Funds | (4,019) | |
| Other affiliated issuers | 1,664,460 | |
| Foreign currency transactions | (38,151) | |
| Futures contracts | (5,084,785) | |
| Total net realized gain (loss) | | 82,031,798 |
| Change in net unrealized appreciation (depreciation) on: | | |
| Investment securities: | | |
| Unaffiliated issuers | (554,502,339) | |
| Fidelity Central Funds | 1,419 | |
| Other affiliated issuers | 1,710,848 | |
| Assets and liabilities in foreign currencies | (12,541) | |
| Futures contracts | 3,108,733 | |
| Total change in net unrealized appreciation (depreciation) | | (549,693,880) |
| Net gain (loss) | | (467,662,082) |
| Net increase (decrease) in net assets resulting from operations | | $(434,702,654) |
See accompanying notes which are an integral part of the financial statements.
Statement of Changes in Net Assets
| | Six months ended January 31, 2019 (Unaudited) | Year ended July 31, 2018 |
| Increase (Decrease) in Net Assets | | |
| Operations | | |
| Net investment income (loss) | $32,959,428 | $63,762,201 |
| Net realized gain (loss) | 82,031,798 | 604,793,879 |
| Change in net unrealized appreciation (depreciation) | (549,693,880) | 384,663,967 |
| Net increase (decrease) in net assets resulting from operations | (434,702,654) | 1,053,220,047 |
| Distributions to shareholders | (659,882,676) | – |
| Distributions to shareholders from net investment income | – | (45,798,335) |
| Distributions to shareholders from net realized gain | – | (554,772,271) |
| Total distributions | (659,882,676) | (600,570,606) |
| Share transactions - net increase (decrease) | 536,661,148 | 86,531,896 |
| Total increase (decrease) in net assets | (557,924,182) | 539,181,337 |
| Net Assets | | |
| Beginning of period | 5,997,330,469 | 5,458,149,132 |
| End of period | $5,439,406,287 | $5,997,330,469 |
| Other Information | | |
| Undistributed net investment income end of period | | $27,232,215 |
See accompanying notes which are an integral part of the financial statements.
Financial Highlights
Fidelity Series Small Cap Opportunities Fund
| | Six months ended (Unaudited) January 31, | Years endedJuly 31, | | | | |
| | 2019 | 2018 | 2017 | 2016 | 2015 | 2014 |
| Selected Per–Share Data | | | | | | |
| Net asset value, beginning of period | $15.46 | $14.42 | $12.94 | $13.83 | $12.96 | $13.55 |
| Income from Investment Operations | | | | | | |
| Net investment income (loss)A | .08 | .16 | .06 | .06 | .05 | .02 |
| Net realized and unrealized gain (loss) | (1.09) | 2.44 | 1.52 | (.22) | 1.53 | .77 |
| Total from investment operations | (1.01) | 2.60 | 1.58 | (.16) | 1.58 | .79 |
| Distributions from net investment income | (.14) | (.12) | (.07) | (.05) | (.04) | –B |
| Distributions from net realized gain | (1.55) | (1.45) | (.03) | (.68) | (.66) | (1.38) |
| Total distributions | (1.69) | (1.56)C | (.10) | (.73) | (.71)D | (1.38) |
| Net asset value, end of period | $12.76 | $15.46 | $14.42 | $12.94 | $13.83 | $12.96 |
| Total ReturnE,F | (7.32)% | 19.84% | 12.22% | (.94)% | 12.66% | 6.29% |
| Ratios to Average Net AssetsG,H | | | | | | |
| Expenses before reductions | - %I,J | - %J | .66% | .85% | .77% | .82% |
| Expenses net of fee waivers, if any | - %I,J | - %J | .66% | .85% | .76% | .82% |
| Expenses net of all reductions | - %I,J | - %J | .65% | .84% | .76% | .82% |
| Net investment income (loss) | 1.17%I | 1.10% | .42% | .46% | .41% | .19% |
| Supplemental Data | | | | | | |
| Net assets, end of period (000 omitted) | $5,439,406 | $5,997,330 | $2,509,347 | $2,433,489 | $2,647,013 | $2,425,973 |
| Portfolio turnover rateK | 56%I | 68% | 58% | 58% | 59% | 90%L |
A Calculated based on average shares outstanding during the period.
B Amount represents less than $.005 per share.
C Total distributions of $1.56 per share is comprised of distributions from net investment income of $.117 and distributions from net realized gain of $1.447 per share.
D Total distributions of $.71 per share is comprised of distributions from net investment income of $.042 and distributions from net realized gain of $.664 per share.
E Total returns for periods of less than one year are not annualized.
F Total returns would have been lower if certain expenses had not been reduced during the applicable periods shown.
G Fees and expenses of any underlying Fidelity Central Funds are not included in the Fund's expense ratio. The Fund indirectly bears its proportionate share of the expenses of any underlying Fidelity Central Funds.
H Expense ratios reflect operating expenses of the Fund. Expenses before reductions do not reflect amounts reimbursed by the investment adviser or reductions from brokerage service arrangements or reductions from other expense offset arrangements and do not represent the amount paid by the Fund during periods when reimbursements or reductions occur. Expenses net of fee waivers reflect expenses after reimbursement by the investment adviser but prior to reductions from brokerage service arrangements or other expense offset arrangements. Expenses net of all reductions represent the net expenses paid by the Fund.
I Annualized
J Amount represents less than .005%.
K Amount does not include the portfolio activity of any underlying Fidelity Central Funds.
L Portfolio turnover rate excludes securities received or delivered in-kind.
See accompanying notes which are an integral part of the financial statements.
Notes to Financial Statements (Unaudited)
For the period ended January 31, 2019
1. Organization.
Fidelity Series Small Cap Opportunities Fund (the Fund) is a fund of Fidelity Securities Fund (the Trust) and is authorized to issue an unlimited number of shares. Shares of the Fund are only available for purchase by mutual funds for which Fidelity Management & Research Company (FMR) or an affiliate serves as an investment manager and FMR investment professionals. The Trust is registered under the Investment Company Act of 1940, as amended (the 1940 Act), as an open-end management investment company organized as a Massachusetts business trust.
Effective August 28, 2017, the Fund no longer offered Class F, and all outstanding shares of Class F were exchanged for shares of Series Small Cap Opportunities.
2. Investments in Fidelity Central Funds.
The Fund invests in Fidelity Central Funds, which are open-end investment companies generally available only to other investment companies and accounts managed by the investment adviser and its affiliates. The Fund's Schedule of Investments lists each of the Fidelity Central Funds held as of period end, if any, as an investment of the Fund, but does not include the underlying holdings of each Fidelity Central Fund. As an Investing Fund, the Fund indirectly bears its proportionate share of the expenses of the underlying Fidelity Central Funds.
The Money Market Central Funds seek preservation of capital and current income and are managed by Fidelity Investments Money Management, Inc. (FIMM), an affiliate of the investment adviser. Annualized expenses of the Money Market Central Funds as of their most recent shareholder report date are less than .005%.
A complete unaudited list of holdings for each Fidelity Central Fund is available upon request or at the Securities and Exchange Commission (the SEC) website at www.sec.gov. In addition, the financial statements of the Fidelity Central Funds are available on the SEC website or upon request.
3. Significant Accounting Policies.
The Fund is an investment company and applies the accounting and reporting guidance of the Financial Accounting Standards Board (FASB) Accounting Standards Codification Topic 946 Financial Services – Investments Companies. The financial statements have been prepared in conformity with accounting principles generally accepted in the United States of America (GAAP), which require management to make certain estimates and assumptions at the date of the financial statements. Actual results could differ from those estimates. Subsequent events, if any, through the date that the financial statements were issued have been evaluated in the preparation of the financial statements. The following summarizes the significant accounting policies of the Fund:
Investment Valuation. Investments are valued as of 4:00 p.m. Eastern time on the last calendar day of the period. The Board of Trustees (the Board) has delegated the day to day responsibility for the valuation of the Fund's investments to the Fair Value Committee (the Committee) established by the Fund's investment adviser. In accordance with valuation policies and procedures approved by the Board, the Fund attempts to obtain prices from one or more third party pricing vendors or brokers to value its investments. When current market prices, quotations or currency exchange rates are not readily available or reliable, investments will be fair valued in good faith by the Committee, in accordance with procedures adopted by the Board. Factors used in determining fair value vary by investment type and may include market or investment specific events, changes in interest rates and credit quality. The frequency with which these procedures are used cannot be predicted and they may be utilized to a significant extent. The Committee oversees the Fund's valuation policies and procedures and reports to the Board on the Committee's activities and fair value determinations. The Board monitors the appropriateness of the procedures used in valuing the Fund's investments and ratifies the fair value determinations of the Committee.
The Fund categorizes the inputs to valuation techniques used to value its investments into a disclosure hierarchy consisting of three levels as shown below:
- Level 1 – quoted prices in active markets for identical investments
- Level 2 – other significant observable inputs (including quoted prices for similar investments, interest rates, prepayment speeds, etc.)
- Level 3 – unobservable inputs (including the Fund's own assumptions based on the best information available)
Valuation techniques used to value the Fund's investments by major category are as follows:
Equity securities, including restricted securities, for which market quotations are readily available, are valued at the last reported sale price or official closing price as reported by a third party pricing vendor on the primary market or exchange on which they are traded and are categorized as Level 1 in the hierarchy. In the event there were no sales during the day or closing prices are not available, securities are valued at the last quoted bid price or may be valued using the last available price and are generally categorized as Level 2 in the hierarchy. For foreign equity securities, when market or security specific events arise, comparisons to the valuation of American Depositary Receipts (ADRs), futures contracts, Exchange-Traded Funds (ETFs)and certain indexes as well as quoted prices for similar securities may be used and would be categorized as Level 2 in the hierarchy. For equity securities, including restricted securities, where observable inputs are limited, assumptions about market activity and risk are used and these securities may be categorized as Level 3 in the hierarchy.
Debt securities, including restricted securities, are valued based on evaluated prices received from third party pricing vendors or from brokers who make markets in such securities. U.S. government and government agency obligations are valued by pricing vendors who utilize matrix pricing which considers yield or price of bonds of comparable quality, coupon, maturity and type or by broker-supplied prices. When independent prices are unavailable or unreliable, debt securities may be valued utilizing pricing methodologies which consider similar factors that would be used by third party pricing vendors. Debt securities are generally categorized as Level 2 in the hierarchy but may be Level 3 depending on the circumstances.
Futures contracts are valued at the settlement price established each day by the board of trade or exchange on which they are traded and are categorized as Level 1 in the hierarchy. Investments in open-end mutual funds, including the Fidelity Central Funds, are valued at their closing net asset value (NAV) each business day and are categorized as Level 1 in the hierarchy.
Changes in valuation techniques may result in transfers in or out of an assigned level within the disclosure hierarchy. The aggregate value of investments by input level as of January 31, 2019 is included at the end of the Fund's Schedule of Investments.
Foreign Currency. The Fund may use foreign currency contracts to facilitate transactions in foreign-denominated securities. Gains and losses from these transactions may arise from changes in the value of the foreign currency or if the counterparties do not perform under the contracts' terms.
Foreign-denominated assets, including investment securities, and liabilities are translated into U.S. dollars at the exchange rates at period end. Purchases and sales of investment securities, income and dividends received and expenses denominated in foreign currencies are translated into U.S. dollars at the exchange rate in effect on the transaction date.
The effects of exchange rate fluctuations on investments are included with the net realized and unrealized gain (loss) on investment securities. Other foreign currency transactions resulting in realized and unrealized gain (loss) are disclosed separately.
Investment Transactions and Income. For financial reporting purposes, the Fund's investment holdings and NAV include trades executed through the end of the last business day of the period. The NAV per share for processing shareholder transactions is calculated as of the close of business of the New York Stock Exchange (NYSE), normally 4:00 p.m. Eastern time and includes trades executed through the end of the prior business day. Gains and losses on securities sold are determined on the basis of identified cost and include proceeds received from litigation. Dividend income is recorded on the ex-dividend date, except for certain dividends from foreign securities where the ex-dividend date may have passed, which are recorded as soon as the Fund is informed of the ex-dividend date. Non-cash dividends included in dividend income, if any, are recorded at the fair market value of the securities received. Income and capital gain distributions from Fidelity Central Funds, if any, are recorded on the ex-dividend date. Certain distributions received by the Fund represent a return of capital or capital gain. The Fund determines the components of these distributions subsequent to the ex-dividend date, based upon receipt of tax filings or other correspondence relating to the underlying investment. These distributions are recorded as a reduction of cost of investments and/or as a realized gain. Interest income is accrued as earned and includes coupon interest and amortization of premium and accretion of discount on debt securities as applicable. Investment income is recorded net of foreign taxes withheld where recovery of such taxes is uncertain.
Expenses. Expenses directly attributable to a fund are charged to that fund. Expenses attributable to more than one fund are allocated among the respective funds on the basis of relative net assets or other appropriate methods. Expense estimates are accrued in the period to which they relate and adjustments are made when actual amounts are known.
Income Tax Information and Distributions to Shareholders. Each year, the Fund intends to qualify as a regulated investment company under Subchapter M of the Internal Revenue Code, including distributing substantially all of its taxable income and realized gains. As a result, no provision for U.S. Federal income taxes is required. The Fund files a U.S. federal tax return, in addition to state and local tax returns as required. The Fund's federal income tax returns are subject to examination by the Internal Revenue Service (IRS) for a period of three fiscal years after they are filed. State and local tax returns may be subject to examination for an additional fiscal year depending on the jurisdiction. Foreign taxes are provided for based on the Fund's understanding of the tax rules and rates that exist in the foreign markets in which it invests.
Distributions are declared and recorded on the ex-dividend date. Income and capital gain distributions are determined in accordance with income tax regulations, which may differ from GAAP.
Capital accounts within the financial statements are adjusted for permanent book-tax differences. These adjustments have no impact on net assets or the results of operations. Capital accounts are not adjusted for temporary book-tax differences which will reverse in a subsequent period.
Book-tax differences are primarily due to futures contracts, foreign currency transactions, market discount, partnerships and losses deferred due to wash sales and excise tax regulations.
As of period end, the cost and unrealized appreciation (depreciation) in securities, and derivatives if applicable, for federal income tax purposes were as follows:
| Gross unrealized appreciation | $1,048,934,455 |
| Gross unrealized depreciation | (285,958,907) |
| Net unrealized appreciation (depreciation) | $762,975,548 |
| Tax cost | $4,762,712,681 |
Restricted Securities. The Fund may invest in securities that are subject to legal or contractual restrictions on resale. These securities generally may be resold in transactions exempt from registration or to the public if the securities are registered. Disposal of these securities may involve time-consuming negotiations and expense, and prompt sale at an acceptable price may be difficult. Information regarding restricted securities is included at the end of the Fund's Schedule of Investments.
New Rule Issuance. During August 2018, the U.S. Securities and Exchange Commission issued Final Rule Release No. 33-10532, Disclosure Update and Simplification. This Final Rule includes amendments specific to registered investment companies that are intended to eliminate overlap in disclosure requirements between Regulation S-X and GAAP. In accordance with these amendments, certain line-items in the Fund's financial statements have been combined or removed for the current period as outlined in the table below.
| Financial Statement | Current Line-Item Presentation (As Applicable) | Prior Line-Item Presentation (As Applicable) |
| Statement of Assets and Liabilities | Total distributable earnings (loss) | Undistributed/Distributions in excess of/Accumulated net investment income (loss)
Accumulated/Undistributed net realized gain (loss)
Net unrealized appreciation (depreciation) |
| Statement of Changes in Net Assets | N/A - removed | Undistributed/Distributions in excess of/Accumulated net investment income (loss) end of period |
| Statement of Changes in Net Assets | Distributions to shareholders | Distributions to shareholders from net investment income
Distributions to shareholders from net realized gain |
| Distributions to Shareholders Note to Financial Statements | Distributions to shareholders | Distributions to shareholders from net investment income
Distributions to shareholders from net realized gain |
4. Derivative Instruments.
Risk Exposures and the Use of Derivative Instruments. The Fund's investment objective allows the Fund to enter into various types of derivative contracts, including futures contracts. Derivatives are investments whose value is primarily derived from underlying assets, indices or reference rates and may be transacted on an exchange or over-the-counter (OTC). Derivatives may involve a future commitment to buy or sell a specified asset based on specified terms, to exchange future cash flows at periodic intervals based on a notional principal amount, or for one party to make one or more payments upon the occurrence of specified events in exchange for periodic payments from the other party.
The Fund used derivatives to increase returns and to manage exposure to certain risks as defined below. The success of any strategy involving derivatives depends on analysis of numerous economic factors, and if the strategies for investment do not work as intended, the Fund may not achieve its objectives.
The Fund's use of derivatives increased or decreased its exposure to the following risk:
| Equity Risk | Equity risk relates to the fluctuations in the value of financial instruments as a result of changes in market prices (other than those arising from interest rate risk or foreign exchange risk), whether caused by factors specific to an individual investment, its issuer, or all factors affecting all instruments traded in a market or market segment.
|
The Fund is also exposed to additional risks from investing in derivatives, such as liquidity risk and counterparty credit risk. Liquidity risk is the risk that the Fund will be unable to close out the derivative in the open market in a timely manner. Counterparty credit risk is the risk that the counterparty will not be able to fulfill its obligation to the Fund. Counterparty credit risk related to exchange-traded futures contracts may be mitigated by the protection provided by the exchange on which they trade.
Investing in derivatives may involve greater risks than investing in the underlying assets directly and, to varying degrees, may involve risk of loss in excess of any initial investment and collateral received and amounts recognized in the Statement of Assets and Liabilities. In addition, there may be the risk that the change in value of the derivative contract does not correspond to the change in value of the underlying instrument.
Futures Contracts. A futures contract is an agreement between two parties to buy or sell a specified underlying instrument for a fixed price at a specified future date. The Fund used futures contracts to manage its exposure to the stock market.
Upon entering into a futures contract, a fund is required to deposit either cash or securities (initial margin) with a clearing broker in an amount equal to a certain percentage of the face value of the contract. Futures contracts are marked-to-market daily and subsequent daily payments (variation margin) are made or received by a fund depending on the daily fluctuations in the value of the futures contracts and are recorded as unrealized appreciation or (depreciation). This receivable and/or payable, if any, is included in daily variation margin on futures contracts in the Statement of Assets and Liabilities. Realized gain or (loss) is recorded upon the expiration or closing of a futures contract. The net realized gain (loss) and change in net unrealized appreciation (depreciation) on futures contracts during the period is presented in the Statement of Operations.
Any open futures contracts at period end are presented in the Schedule of Investments under the caption "Futures Contracts". The notional amount at value reflects each contract's exposure to the underlying instrument or index at period end and is representative of volume of activity during the period. Securities deposited to meet initial margin requirements are identified in the Schedule of Investments.
5. Purchases and Sales of Investments.
Purchases and sales of securities, other than short-term securities, aggregated $1,541,024,518 and $1,759,210,513, respectively.
6. Fees and Other Transactions with Affiliates.
Management Fee. Fidelity Management & Research Company (the investment adviser) and its affiliates provide the Fund with investment management related services for which the Fund does not pay a management fee. Under the management contract, the investment adviser or an affiliate pays all ordinary operating expenses of the Fund, except custody fees, fees and expenses of the independent Trustees, and certain miscellaneous expenses such as proxy and shareholder meeting expenses.
Brokerage Commissions. The Fund placed a portion of its portfolio transactions with brokerage firms which are affiliates of the investment adviser. Brokerage commissions are included in net realized gain (loss) and change in net unrealized appreciation (depreciation) in the Statement of Operations. The commissions paid to these affiliated firms were $86,497 for the period.
Interfund Trades. The Fund may purchase from or sell securities to other Fidelity Funds under procedures adopted by the Board. The procedures have been designed to ensure these interfund trades are executed in accordance with Rule 17a-7 of the 1940 Act. Interfund trades are included within the respective purchases and sales amounts shown in the Purchases and Sales of Investments note.
Other. During the period, the investment adviser reimbursed the Fund for certain losses in the amount of $6,639.
7. Committed Line of Credit.
The Fund participates with other funds managed by the investment adviser or an affiliate in a $4.25 billion credit facility (the "line of credit") to be utilized for temporary or emergency purposes to fund shareholder redemptions or for other short-term liquidity purposes. The Fund has agreed to pay commitment fees on its pro-rata portion of the line of credit, which amounted to $7,664 and is reflected in Commitment fees on the Statement of Operations. During the period, the Fund did not borrow on this line of credit.
8. Security Lending.
The Fund lends portfolio securities through a lending agent from time to time in order to earn additional income. For equity securities, a lending agent is used and may loan securities to certain qualified borrowers, including Fidelity Capital Markets (FCM), a broker-dealer affiliated with the Fund. On the settlement date of the loan, the Fund receives collateral (in the form of U.S. Treasury obligations, letters of credit and/or cash) against the loaned securities and maintains collateral in an amount not less than 100% of the market value of the loaned securities during the period of the loan. The market value of the loaned securities is determined at the close of business of the Fund and any additional required collateral is delivered to the Fund on the next business day. The Fund or borrower may terminate the loan at any time, and if the borrower defaults on its obligation to return the securities loaned because of insolvency or other reasons, the Fund may apply collateral received from the borrower against the obligation. The Fund may experience delays and costs in recovering the securities loaned. Any cash collateral received is invested in the Fidelity Securities Lending Cash Central Fund. The value of loaned securities and cash collateral at period end are disclosed on the Fund's Statement of Assets and Liabilities. The value of securities loaned to FCM at period end was $3,164,291. Security lending income represents the income earned on investing cash collateral, less rebates paid to borrowers and any lending agent fees associated with the loan, plus any premium payments received for lending certain types of securities. Security lending income is presented in the Statement of Operations as a component of income from Fidelity Central Funds. Total security lending income during the period amounted to $274,726, including $7,995 from securities loaned to FCM.
9. Distributions to Shareholders.
Distributions to shareholders of each class were as follows:
| | Six months ended
January 31, 2019 | Year ended
July 31, 2018 |
| Distributions to shareholders | | |
| Series Small Cap Opportunities | $659,882,676 | $– |
| From net investment income | | |
| Series Small Cap Opportunities | $– | $45,798,335 |
| From net realized gain | | |
| Series Small Cap Opportunities | $– | $554,772,271 |
10. Share Transactions.
Transactions for each class of shares were as follows:
| | Shares | Shares | Dollars | Dollars |
| | Six months ended January 31, 2019 | Year ended July 31, 2018 | Six months ended January 31, 2019 | Year ended July 31, 2018 |
| Series Small Cap Opportunities | | | | |
| Shares sold | 13,859,015 | 239,100,798 | $184,829,038 | $3,373,951,145 |
| Reinvestment of distributions | 47,034,659 | 44,122,337 | 659,882,676 | 600,570,606 |
| Shares redeemed | (22,381,418) | (69,346,858) | (308,050,566) | (1,011,412,547) |
| Net increase (decrease) | 38,512,256 | 213,876,277 | $536,661,148 | $2,963,109,204 |
| Class F | | | | |
| Shares sold | – | 1,009,181 | $– | $14,321,228 |
| Shares redeemed | – | (204,251,733) | – | (2,890,898,536) |
| Net increase (decrease) | – | (203,242,552) | $– | $(2,876,577,308) |
11. Other.
The Fund's organizational documents provide former and current trustees and officers with a limited indemnification against liabilities arising in connection with the performance of their duties to the Fund. In the normal course of business, the Fund may also enter into contracts that provide general indemnifications. The Fund's maximum exposure under these arrangements is unknown as this would be dependent on future claims that may be made against the Fund. The risk of material loss from such claims is considered remote.
At the end of the period, mutual funds managed by the investment adviser or its affiliates were the owners of record of all of the outstanding shares of the Fund.
Shareholder Expense Example
As a shareholder of the Fund, you incur two types of costs: (1) transaction costs, and (2) ongoing costs, including other Fund expenses. This Example is intended to help you understand your ongoing costs (in dollars) of investing in the Fund and to compare these costs with the ongoing costs of investing in other mutual funds.
The Example is based on an investment of $1,000 invested at the beginning of the period and held for the entire period (August 1, 2018 to January 31, 2019).
Actual Expenses
The first line of the accompanying table provides information about actual account values and actual expenses. You may use the information in this line, together with the amount you invested, to estimate the expenses that you paid over the period. Simply divide your account value by $1,000.00 (for example, an $8,600 account value divided by $1,000.00 = 8.6), then multiply the result by the number in the first line under the heading entitled "Expenses Paid During Period" to estimate the expenses you paid on your account during this period. In addition, the Fund, as a shareholder in the underlying Fidelity Central Funds, will indirectly bear its pro-rata share of the fees and expenses incurred by the underlying Fidelity Central Funds. These fees and expenses are not included in the Fund's annualized expense ratio used to calculate the expense estimate in the table below.
Hypothetical Example for Comparison Purposes
The second line of the accompanying table provides information about hypothetical account values and hypothetical expenses based on the Fund's actual expense ratio and an assumed rate of return of 5% per year before expenses, which is not the Fund's actual return. The hypothetical account values and expenses may not be used to estimate the actual ending account balance or expenses you paid for the period. You may use this information to compare the ongoing costs of investing in the Fund and other funds. To do so, compare this 5% hypothetical example with the 5% hypothetical examples that appear in the shareholder reports of the other funds. In addition, the Fund, as a shareholder in the underlying Fidelity Central Funds, will indirectly bear its pro-rata share of the fees and expenses incurred by the underlying Fidelity Central Funds. These fees and expenses are not included in the Fund's annualized expense ratio used to calculate the expense estimate in the table below.
Please note that the expenses shown in the table are meant to highlight your ongoing costs only and do not reflect any transaction costs. Therefore, the second line of the table is useful in comparing ongoing costs only, and will not help you determine the relative total costs of owning different funds.
| | Annualized Expense Ratio-A | Beginning
Account Value
August 1, 2018 | Ending
Account Value
January 31, 2019 | Expenses Paid
During Period-B
August 1, 2018
to January 31, 2019 |
| Series Small Cap Opportunities | - %-C | | | |
| Actual | | $1,000.00 | $926.80 | $--D |
| Hypothetical-E | | $1,000.00 | $1,025.21 | $--D |
A Annualized expense ratio reflects expenses net of applicable fee waivers.
B Expenses are equal to the Fund's annualized expense ratio, multiplied by the average account value over the period, multiplied by 184/365 (to reflect the one-half year period).
C Amount represents less than .005%.
D Amount represents less than $.005.
E 5% return per year before expenses
Board Approval of Investment Advisory Contracts and Management Fees
Fidelity Series Small Cap Opportunities Fund
Each year, the Board of Trustees, including the Independent Trustees (together, the Board), votes on the renewal of the management contract with Fidelity Management & Research Company (FMR) and the sub-advisory agreements (together, the Advisory Contracts) for the fund. FMR and the sub-advisers are referred to herein as the Investment Advisers. The Board, assisted by the advice of fund counsel and Independent Trustees' counsel, requests and considers a broad range of information relevant to the renewal of the Advisory Contracts throughout the year.
The Board meets regularly and, at each of its meetings, covers an extensive agenda of topics and materials and considers factors that are relevant to its annual consideration of the renewal of the fund's Advisory Contracts, including the services and support provided to the fund and its shareholders. The Board has established various standing committees (Committees), each composed of and chaired by Independent Trustees with varying backgrounds, to which the Board has assigned specific subject matter responsibilities in order to enhance effective decision-making by the Board. The Board, acting directly and through its Committees, requests and receives information concerning the annual consideration of the renewal of the fund's Advisory Contracts. The Board also meets as needed to review matters specifically related to the Board's annual consideration of the renewal of the Advisory Contracts. Members of the Board may also meet with trustees of other Fidelity funds through joint ad hoc committees to discuss certain matters relevant to all of the Fidelity funds.
At its January 2019 meeting, the Board unanimously determined to renew the fund's Advisory Contracts. In considering whether to renew the Advisory Contracts for the fund, the Board considered all factors it believed relevant and reached a determination, with the assistance of fund counsel and Independent Trustees' counsel and through the exercise of its business judgment, that the renewal of the Advisory Contracts was in the best interests of the fund and its shareholders and the fact that no fee is payable under the management contract was fair and reasonable.
Nature, Extent, and Quality of Services Provided. The Board considered Fidelity's staffing as it relates to the fund, including the backgrounds of investment personnel of Fidelity, and also considered the fund's investment objective, strategies, and related investment philosophy. The Independent Trustees also had discussions with senior management of Fidelity's investment operations and investment groups. The Board considered the structure of the investment personnel compensation program and whether this structure provides appropriate incentives to act in the best interests of the fund.
Resources Dedicated to Investment Management and Support Services. The Board and the Fund Oversight and Research Committees reviewed the general qualifications and capabilities of Fidelity's investment staff, including its size, education, experience, and resources, as well as Fidelity's approach to recruiting, training, managing, and compensating investment personnel. The Board noted that Fidelity has continued to increase the resources devoted to non-U.S. offices, including expansion of Fidelity's global investment organization. The Board also noted that Fidelity's analysts have extensive resources, tools and capabilities that allow them to conduct sophisticated quantitative and fundamental analysis, as well as credit analysis of issuers, counterparties and guarantors. Further, the Board considered that Fidelity's investment professionals have sufficient access to global information and data so as to provide competitive investment results over time, and that those professionals also have access to sophisticated tools that permit them to assess portfolio construction and risk and performance attribution characteristics continuously, as well as to transmit new information and research conclusions rapidly around the world. Additionally, in its deliberations, the Board considered Fidelity's trading, risk management, compliance, and technology and operations capabilities and resources, which are integral parts of the investment management process.
Administrative Services. The Board considered (i) the nature, extent, quality, and cost of advisory and administrative services performed by the Investment Advisers and their affiliates under the Advisory Contracts and under separate agreements covering transfer agency, pricing and bookkeeping, and securities lending services for the fund; (ii) the nature and extent of the supervision of third party service providers, principally custodians, subcustodians, and pricing vendors; and (iii) the resources devoted to, and the record of compliance with, the fund's compliance policies and procedures. The Board also reviewed the allocation of fund brokerage, including allocations to brokers affiliated with the Investment Advisers, the use of brokerage commissions to pay fund expenses, and the use of "soft" commission dollars to pay for research services.
Investment Performance. The Board considered whether the fund has operated in accordance with its investment objective, as well as its record of compliance with its investment restrictions. The Board reviewed the fund's absolute investment performance, as well as the fund's relative investment performance, but did not consider performance to be a material factor in its decision to renew the fund's Advisory Contracts, as the fund is not publicly offered as a stand-alone investment product. In this regard, the Board noted that the fund is designed to offer an investment option for other investment companies managed by Fidelity and ultimately to enhance the performance of those investment companies.
Based on its review, the Board concluded that the nature, extent, and quality of services provided to the fund under the Advisory Contracts should continue to benefit the shareholders of the fund.
Competitiveness of Management Fee and Total Expense Ratio. The Board considered that the fund does not pay FMR a management fee for investment advisory services. The Board also noted that FMR or an affiliate undertakes to pay all operating expenses of the fund with certain exceptions.
In connection with the renewal of the Advisory Contracts, the Board also approved amendments to the management contract for the fund to clarify that the fund pays its non-operating expenses, including brokerage commissions and fees and expenses associated with the fund's securities lending program. The Board considered that the amendments would not change the services provided to the fund or the party responsible for making such payments under the current management contract.
The Board further considered that FMR has contractually agreed to reimburse the fund to the extent that total operating expenses, with certain exceptions, as a percentage of its average net assets, exceed 0.014% through September 30, 2020.
Based on its review, the Board considered that the fund does not pay a management fee and concluded that the total expense ratio of each class of the fund was reasonable in light of the services that the fund and its shareholders receive and the other factors considered.
Costs of the Services and Profitability. The Board considered the level of Fidelity's profits in respect of all the Fidelity funds.
PricewaterhouseCoopers LLP (PwC), auditor to Fidelity and certain Fidelity funds, has been engaged annually by the Board as part of the Board's assessment of Fidelity's profitability analysis. PwC's engagement includes the review and assessment of the methodologies used by Fidelity in determining the revenues and expenses attributable to Fidelity's mutual fund business, and completion of agreed-upon procedures in respect of the mathematical accuracy of the fund profitability information and its conformity to established allocation methodologies. After considering PwC's reports issued under the engagement and information provided by Fidelity, the Board concluded that while other allocation methods may also be reasonable, Fidelity's profitability methodologies are reasonable in all material respects.
The Board also reviewed Fidelity's non-fund businesses and potential indirect benefits such businesses may have received as a result of their association with Fidelity's mutual fund business (i.e., fall-out benefits) as well as cases where Fidelity's affiliates may benefit from the fund's business. The Board noted that changes to fall-out benefits year-over-year reflect business developments at Fidelity's various businesses.
The Board concluded that the costs of the services provided by and the profits realized by Fidelity in connection with the operation of the fund were not relevant to the renewal of the Advisory Contracts because the fund pays no advisory fees and FMR or an affiliate bears all expenses of the fund with certain exceptions.
Economies of Scale. The Board concluded that because the fund pays no advisory fees and FMR or an affiliate bears all expenses of the fund with certain exceptions, the realization of economies of scale was not a material factor in the Board's decision to renew the fund's Advisory Contracts.
Additional Information Requested by the Board. In order to develop fully the factual basis for consideration of the Fidelity funds' advisory contracts, the Board requested and received additional information on certain topics, including: (i) fund performance trends, in particular the underperformance of certain funds, and Fidelity's long-term strategies for certain funds; (ii) Fidelity's fund profitability methodology, profitability trends for certain funds, and the impact of certain factors on fund profitability results; (iii) metrics for evaluating index fund and ETF performance and information about ETF trading characteristics; (iv) the methodology with respect to the evaluation of competitive fund data and peer group classifications and fee comparisons; (v) the expense structures for different funds and classes; (vi) information regarding other accounts managed by Fidelity, including collective investment trusts; and (vii) Fidelity's philosophies and strategies for evaluating funds and classes with lower or declining asset levels.
Based on its evaluation of all of the conclusions noted above, and after considering all factors it believed relevant, the Board concluded that the advisory fee arrangements are fair and reasonable, and that the fund's Advisory Contracts should be renewed.
SMO-SANN-0319
1.839810.111
Fidelity® Small Cap Growth Fund
Semi-Annual Report January 31, 2019 Includes Fidelity and Fidelity Advisor share classes |
|
Beginning on January 1, 2021, as permitted by regulations adopted by the Securities and Exchange Commission, paper copies of a fund’s shareholder reports will no longer be sent by mail, unless you specifically request paper copies of the reports from the fund or from your financial intermediary, such as a financial advisor, broker-dealer or bank. Instead, the reports will be made available on a website, and you will be notified by mail each time a report is posted and provided with a website link to access the report.
If you already elected to receive shareholder reports electronically, you will not be affected by this change and you need not take any action. You may elect to receive shareholder reports and other communications from a fund electronically, by contacting your financial intermediary. For Fidelity customers, visit Fidelity's web site or call Fidelity using the contact information listed below.
You may elect to receive all future reports in paper free of charge. If you wish to continue receiving paper copies of your shareholder reports, you may contact your financial intermediary or, if you are a Fidelity customer, visit Fidelity’s website, or call Fidelity at the applicable toll-free number listed below. Your election to receive reports in paper will apply to all funds held with the fund complex/your financial intermediary.
| Account Type | Website | Phone Number |
| Brokerage, Mutual Fund, or Annuity Contracts: | fidelity.com/mailpreferences | 1-800-343-3548 |
| Employer Provided Retirement Accounts: | netbenefits.fidelity.com/preferences (choose 'no' under Required Disclosures to continue to print) | 1-800-343-0860 |
| Advisor Sold Accounts Serviced Through Your Financial Intermediary: | Contact Your Financial Intermediary | Your Financial Intermediary's phone number |
| Advisor Sold Accounts Serviced by Fidelity: | institutional.fidelity.com | 1-877-208-0098 |
Contents
To view a fund's proxy voting guidelines and proxy voting record for the 12-month period ended June 30, visit http://www.fidelity.com/proxyvotingresults or visit the Securities and Exchange Commission's (SEC) web site at http://www.sec.gov.
You may also call 1-800-544-8544 if you’re an individual investing directly with Fidelity, call 1-800-835-5092 if you’re a plan sponsor or participant with Fidelity as your recordkeeper or call 1-877-208-0098 on institutional accounts or if you’re an advisor or invest through one to request a free copy of the proxy voting guidelines.
Standard & Poor's, S&P and S&P 500 are registered service marks of The McGraw-Hill Companies, Inc. and have been licensed for use by Fidelity Distributors Corporation.
Other third-party marks appearing herein are the property of their respective owners.
All other marks appearing herein are registered or unregistered trademarks or service marks of FMR LLC or an affiliated company. © 2019 FMR LLC. All rights reserved.
This report and the financial statements contained herein are submitted for the general information of the shareholders of the Fund. This report is not authorized for distribution to prospective investors in the Fund unless preceded or accompanied by an effective prospectus.
A fund files its complete schedule of portfolio holdings with the SEC for the first and third quarters of each fiscal year on Form N-Q. Forms N-Q are available on the SEC’s web site at http://www.sec.gov. A fund's Forms N-Q may be reviewed and copied at the SEC’s Public Reference Room in Washington, DC. Information regarding the operation of the SEC's Public Reference Room may be obtained by calling 1-800-SEC-0330.
For a complete list of a fund's portfolio holdings, view the most recent holdings listing, semiannual report, or annual report on Fidelity's web site at http://www.fidelity.com, http://www.institutional.fidelity.com, or http://www.401k.com, as applicable.
NOT FDIC INSURED •MAY LOSE VALUE •NO BANK GUARANTEE
Neither the Fund nor Fidelity Distributors Corporation is a bank.
Investment Summary (Unaudited)
Top Ten Stocks as of January 31, 2019
| | % of fund's net assets |
| Gores Holdings II, Inc. | 1.8 |
| CarGurus, Inc. Class A | 1.8 |
| Masimo Corp. | 1.5 |
| Planet Fitness, Inc. | 1.3 |
| Molina Healthcare, Inc. | 1.3 |
| Insulet Corp. | 1.2 |
| HubSpot, Inc. | 1.2 |
| Loxo Oncology, Inc. | 1.2 |
| Compass, Inc. Series E | 1.1 |
| The Children's Place Retail Stores, Inc. | 1.1 |
| | 13.5 |
Top Five Market Sectors as of January 31, 2019
| | % of fund's net assets |
| Health Care | 27.3 |
| Information Technology | 19.6 |
| Industrials | 13.3 |
| Consumer Discretionary | 13.0 |
| Financials | 10.0 |
Asset Allocation (% of fund's net assets)
| As of January 31, 2019* |
| | Stocks | 97.9% |
| | Convertible Securities | 1.1% |
| | Short-Term Investments and Net Other Assets (Liabilities) | 1.0% |

* Foreign investments - 9.6%
Schedule of Investments January 31, 2019 (Unaudited)
Showing Percentage of Net Assets
| Common Stocks - 97.9% | | | |
| | | Shares | Value |
| COMMUNICATION SERVICES - 6.9% | | | |
| Diversified Telecommunication Services - 0.5% | | | |
| Iridium Communications, Inc. (a) | | 1,009,887 | $19,571,610 |
| Entertainment - 0.7% | | | |
| World Wrestling Entertainment, Inc. Class A | | 304,300 | 25,056,062 |
| Interactive Media & Services - 2.3% | | | |
| ANGI Homeservices, Inc. Class A (a) | | 1,221,884 | 20,772,028 |
| CarGurus, Inc. Class A (a) | | 1,559,267 | 66,689,850 |
| | | | 87,461,878 |
| Media - 2.2% | | | |
| Gray Television, Inc. (a) | | 1,417,799 | 23,691,421 |
| Nexstar Broadcasting Group, Inc. Class A | | 421,438 | 35,177,430 |
| The New York Times Co. Class A | | 1,001,818 | 25,756,741 |
| | | | 84,625,592 |
| Wireless Telecommunication Services - 1.2% | | | |
| Boingo Wireless, Inc. (a) | | 585,682 | 14,126,650 |
| Shenandoah Telecommunications Co. | | 660,137 | 31,442,325 |
| | | | 45,568,975 |
|
| TOTAL COMMUNICATION SERVICES | | | 262,284,117 |
|
| CONSUMER DISCRETIONARY - 13.0% | | | |
| Diversified Consumer Services - 3.1% | | | |
| Arco Platform Ltd. Class A | | 885,952 | 22,396,867 |
| Bright Horizons Family Solutions, Inc. (a) | | 167,110 | 19,349,667 |
| Grand Canyon Education, Inc. (a) | | 396,938 | 36,891,418 |
| Laureate Education, Inc. Class A (a) | | 1,840,974 | 29,455,584 |
| ServiceMaster Global Holdings, Inc. (a) | | 236,600 | 9,225,034 |
| | | | 117,318,570 |
| Hotels, Restaurants & Leisure - 2.9% | | | |
| Dunkin' Brands Group, Inc. | | 320,807 | 21,939,991 |
| Eldorado Resorts, Inc. (a) | | 343,839 | 16,029,774 |
| Hilton Grand Vacations, Inc. (a) | | 704,028 | 21,360,210 |
| Planet Fitness, Inc. (a) | | 861,808 | 49,915,919 |
| | | | 109,245,894 |
| Household Durables - 2.4% | | | |
| Cavco Industries, Inc. (a) | | 228,165 | 37,941,558 |
| Helen of Troy Ltd. (a) | | 198,840 | 23,073,394 |
| Skyline Champion Corp. | | 1,325,190 | 23,932,931 |
| Turtle Beach Corp. (a)(b) | | 561,300 | 8,357,757 |
| | | | 93,305,640 |
| Internet & Direct Marketing Retail - 2.1% | | | |
| Etsy, Inc. (a) | | 570,210 | 31,161,977 |
| Gaia, Inc. Class A (a)(b) | | 1,057,798 | 12,439,704 |
| Stamps.com, Inc. (a) | | 193,249 | 35,959,774 |
| | | | 79,561,455 |
| Multiline Retail - 0.3% | | | |
| Ollie's Bargain Outlet Holdings, Inc. (a) | | 167,212 | 13,070,962 |
| Specialty Retail - 1.9% | | | |
| Five Below, Inc. (a) | | 262,706 | 32,504,613 |
| The Children's Place Retail Stores, Inc. | | 431,138 | 41,716,913 |
| | | | 74,221,526 |
| Textiles, Apparel & Luxury Goods - 0.3% | | | |
| Columbia Sportswear Co. | | 130,665 | 11,654,011 |
|
| TOTAL CONSUMER DISCRETIONARY | | | 498,378,058 |
|
| CONSUMER STAPLES - 4.2% | | | |
| Food & Staples Retailing - 1.8% | | | |
| BJ's Wholesale Club Holdings, Inc. | | 1,470,089 | 38,678,042 |
| Performance Food Group Co. (a) | | 949,666 | 32,440,591 |
| | | | 71,118,633 |
| Food Products - 1.6% | | | |
| Darling International, Inc. (a) | | 534,731 | 11,373,728 |
| Nomad Foods Ltd. (a) | | 1,170,928 | 21,463,110 |
| Post Holdings, Inc. (a) | | 294,061 | 27,294,742 |
| | | | 60,131,580 |
| Household Products - 0.8% | | | |
| Central Garden & Pet Co. (a)(b) | | 412,636 | 16,179,458 |
| Central Garden & Pet Co. Class A (non-vtg.) (a) | | 401,658 | 14,307,058 |
| | | | 30,486,516 |
|
| TOTAL CONSUMER STAPLES | | | 161,736,729 |
|
| ENERGY - 0.8% | | | |
| Oil, Gas & Consumable Fuels - 0.8% | | | |
| PDC Energy, Inc. (a) | | 290,194 | 9,451,619 |
| Renewable Energy Group, Inc. (a)(b) | | 500,890 | 14,475,721 |
| Whiting Petroleum Corp. (a) | | 275,901 | 7,899,046 |
| | | | 31,826,386 |
| FINANCIALS - 10.0% | | | |
| Banks - 1.4% | | | |
| First Citizens Bancshares, Inc. | | 80,877 | 32,959,804 |
| Popular, Inc. | | 341,127 | 18,628,945 |
| | | | 51,588,749 |
| Capital Markets - 2.6% | | | |
| Apollo Global Management LLC Class A | | 564,630 | 16,532,366 |
| Cboe Global Markets, Inc. | | 158,000 | 14,736,660 |
| Hamilton Lane, Inc. Class A | | 103,323 | 3,747,525 |
| LPL Financial | | 266,174 | 18,730,664 |
| Morningstar, Inc. | | 247,212 | 30,691,370 |
| Oaktree Capital Group LLC Class A | | 368,100 | 15,025,842 |
| | | | 99,464,427 |
| Consumer Finance - 1.2% | | | |
| First Cash Financial Services, Inc. | | 244,300 | 20,137,649 |
| Green Dot Corp. Class A (a) | | 352,301 | 26,077,320 |
| | | | 46,214,969 |
| Diversified Financial Services - 1.8% | | | |
| Gores Holdings II, Inc. (a) | | 6,555,147 | 68,566,836 |
| Insurance - 1.4% | | | |
| eHealth, Inc. (a) | | 116,772 | 7,141,776 |
| Enstar Group Ltd. (a) | | 86,310 | 15,363,180 |
| Primerica, Inc. | | 290,351 | 32,626,742 |
| | | | 55,131,698 |
| Thrifts & Mortgage Finance - 1.6% | | | |
| Essent Group Ltd. (a) | | 690,207 | 27,435,728 |
| LendingTree, Inc. (a)(b) | | 108,644 | 32,195,563 |
| | | | 59,631,291 |
|
| TOTAL FINANCIALS | | | 380,597,970 |
|
| HEALTH CARE - 27.3% | | | |
| Biotechnology - 10.9% | | | |
| Abeona Therapeutics, Inc. (a) | | 686,902 | 4,664,065 |
| Acceleron Pharma, Inc. (a) | | 454,744 | 19,281,146 |
| Acorda Therapeutics, Inc. (a) | | 331,675 | 5,515,755 |
| Aduro Biotech, Inc. (a) | | 711,237 | 2,119,486 |
| Alder Biopharmaceuticals, Inc. (a)(b) | | 1,027,620 | 14,468,890 |
| Allakos, Inc. (a)(b) | | 196,500 | 7,850,175 |
| AnaptysBio, Inc. (a) | | 259,724 | 17,224,896 |
| Arena Pharmaceuticals, Inc. (a) | | 266,280 | 12,240,892 |
| Argenx SE ADR (a) | | 226,160 | 23,997,838 |
| Array BioPharma, Inc. (a) | | 1,582,191 | 29,539,506 |
| Ascendis Pharma A/S sponsored ADR (a) | | 389,531 | 27,835,885 |
| Atara Biotherapeutics, Inc. (a) | | 409,353 | 15,555,414 |
| Audentes Therapeutics, Inc. (a) | | 343,014 | 8,506,747 |
| Blueprint Medicines Corp. (a) | | 320,218 | 23,084,516 |
| Crinetics Pharmaceuticals, Inc. (a) | | 141,024 | 3,706,111 |
| Dynavax Technologies Corp. (a)(b) | | 544,667 | 6,002,230 |
| FibroGen, Inc. (a) | | 516,400 | 29,305,700 |
| Five Prime Therapeutics, Inc. (a) | | 257,410 | 2,895,863 |
| Global Blood Therapeutics, Inc. (a) | | 484,500 | 23,212,395 |
| Gritstone Oncology, Inc. | | 377,916 | 4,837,325 |
| Heron Therapeutics, Inc. (a) | | 583,871 | 15,706,130 |
| Immunomedics, Inc. (a)(b) | | 741,477 | 10,966,445 |
| Kezar Life Sciences, Inc. | | 276,017 | 4,943,464 |
| Loxo Oncology, Inc. (a) | | 192,667 | 45,199,678 |
| Mirati Therapeutics, Inc. (a)(b) | | 252,370 | 16,676,610 |
| Sarepta Therapeutics, Inc. (a) | | 217,950 | 30,449,795 |
| Savara, Inc. (a) | | 315,207 | 2,392,421 |
| Spark Therapeutics, Inc. (a) | | 176,920 | 8,460,314 |
| | | | 416,639,692 |
| Health Care Equipment & Supplies - 7.9% | | | |
| Axonics Modulation Technologies, Inc. (a) | | 754,285 | 11,012,561 |
| Cerus Corp. (a) | | 549,513 | 3,275,097 |
| CONMED Corp. | | 246,688 | 17,354,501 |
| Glaukos Corp. (a) | | 309,532 | 19,745,046 |
| Hill-Rom Holdings, Inc. | | 202,150 | 20,219,043 |
| Insulet Corp. (a) | | 583,905 | 47,407,247 |
| Integer Holdings Corp. (a) | | 257,067 | 20,819,856 |
| Integra LifeSciences Holdings Corp. (a) | | 223,333 | 10,577,051 |
| iRhythm Technologies, Inc. (a) | | 288,963 | 24,561,855 |
| Masimo Corp. (a) | | 447,554 | 55,671,242 |
| Merit Medical Systems, Inc. (a) | | 405,116 | 22,901,207 |
| Novocure Ltd. (a) | | 629,601 | 30,850,449 |
| Quanterix Corp. (a)(b) | | 740,398 | 15,592,782 |
| | | | 299,987,937 |
| Health Care Providers & Services - 2.9% | | | |
| Chemed Corp. | | 69,384 | 20,672,269 |
| G1 Therapeutics, Inc. (a) | | 506,131 | 10,826,142 |
| LHC Group, Inc. (a) | | 271,245 | 28,678,734 |
| Molina Healthcare, Inc. (a) | | 370,454 | 49,262,973 |
| R1 RCM, Inc. (a) | | 183,567 | 1,490,564 |
| | | | 110,930,682 |
| Health Care Technology - 2.4% | | | |
| HMS Holdings Corp. (a) | | 1,114,594 | 33,426,674 |
| HTG Molecular Diagnostics (a) | | 546,798 | 1,148,276 |
| Inovalon Holdings, Inc. Class A (a)(b) | | 1,845,240 | 26,368,480 |
| Teladoc Health, Inc. (a)(b) | | 464,069 | 29,793,230 |
| | | | 90,736,660 |
| Life Sciences Tools & Services - 1.3% | | | |
| ICON PLC (a) | | 261,755 | 36,614,289 |
| Morphosys AG (a) | | 112,372 | 12,128,959 |
| | | | 48,743,248 |
| Pharmaceuticals - 1.9% | | | |
| Aclaris Therapeutics, Inc. (a) | | 543,468 | 3,787,972 |
| Aerie Pharmaceuticals, Inc. (a) | | 239,158 | 11,245,209 |
| Akcea Therapeutics, Inc. (a) | | 269,264 | 7,157,037 |
| InflaRx NV (a)(b) | | 214,700 | 7,040,013 |
| Nektar Therapeutics (a) | | 256,058 | 10,841,496 |
| SCYNEXIS, Inc. warrants 6/21/21 (a) | | 168,750 | 9,225 |
| The Medicines Company (a) | | 329,647 | 7,618,142 |
| Theravance Biopharma, Inc. (a) | | 386,183 | 10,060,067 |
| Xeris Pharmaceuticals, Inc. | | 383,716 | 5,325,978 |
| Zogenix, Inc. (a) | | 256,140 | 11,206,125 |
| | | | 74,291,264 |
|
| TOTAL HEALTH CARE | | | 1,041,329,483 |
|
| INDUSTRIALS - 13.3% | | | |
| Aerospace & Defense - 2.4% | | | |
| BWX Technologies, Inc. | | 360,486 | 16,733,760 |
| HEICO Corp. Class A | | 367,302 | 25,722,159 |
| Moog, Inc. Class A | | 272,500 | 24,380,575 |
| Teledyne Technologies, Inc. (a) | | 109,581 | 24,570,252 |
| | | | 91,406,746 |
| Air Freight & Logistics - 0.4% | | | |
| Forward Air Corp. | | 234,871 | 13,747,000 |
| Airlines - 0.3% | | | |
| SkyWest, Inc. | | 225,455 | 11,486,932 |
| Commercial Services & Supplies - 0.7% | | | |
| Copart, Inc. (a) | | 543,424 | 27,513,557 |
| Construction & Engineering - 1.8% | | | |
| Argan, Inc. | | 429,236 | 18,122,344 |
| Jacobs Engineering Group, Inc. | | 424,943 | 27,536,306 |
| MasTec, Inc. (a)(b) | | 537,800 | 23,867,564 |
| | | | 69,526,214 |
| Electrical Equipment - 0.8% | | | |
| Generac Holdings, Inc. (a) | | 606,045 | 32,077,962 |
| Industrial Conglomerates - 0.8% | | | |
| ITT, Inc. | | 596,312 | 31,342,159 |
| Machinery - 2.5% | | | |
| AGCO Corp. | | 386,255 | 24,797,571 |
| Allison Transmission Holdings, Inc. | | 579,428 | 28,200,761 |
| Luxfer Holdings PLC sponsored | | 785,052 | 15,630,385 |
| Toro Co. | | 311,500 | 18,534,250 |
| Woodward, Inc. | | 72,188 | 6,558,280 |
| | | | 93,721,247 |
| Professional Services - 3.0% | | | |
| Asgn, Inc. (a) | | 448,552 | 28,254,290 |
| CBIZ, Inc. (a) | | 352,720 | 6,913,312 |
| Exponent, Inc. | | 559,290 | 27,942,128 |
| FTI Consulting, Inc. (a) | | 185,016 | 12,640,293 |
| Insperity, Inc. | | 366,288 | 39,075,604 |
| | | | 114,825,627 |
| Road & Rail - 0.6% | | | |
| Genesee & Wyoming, Inc. Class A (a) | | 308,700 | 24,239,124 |
|
| TOTAL INDUSTRIALS | | | 509,886,568 |
|
| INFORMATION TECHNOLOGY - 18.5% | | | |
| Electronic Equipment & Components - 2.2% | | | |
| Fabrinet | | 678,000 | 38,537,520 |
| SYNNEX Corp. | | 162,300 | 15,704,148 |
| Zebra Technologies Corp. Class A (a) | | 165,003 | 28,644,521 |
| | | | 82,886,189 |
| IT Services - 4.0% | | | |
| Booz Allen Hamilton Holding Corp. Class A | | 236,400 | 11,614,332 |
| Elastic NV (b) | | 141,594 | 12,035,490 |
| EPAM Systems, Inc. (a) | | 140,715 | 19,908,358 |
| Euronet Worldwide, Inc. (a) | | 180,221 | 20,727,217 |
| EVO Payments, Inc. Class A | | 421,911 | 10,611,062 |
| GoDaddy, Inc. (a) | | 380,591 | 26,119,960 |
| Interxion Holding N.V. (a) | | 192,185 | 11,538,787 |
| Okta, Inc. (a) | | 170,857 | 14,083,743 |
| WEX, Inc. (a) | | 176,218 | 28,429,250 |
| | | | 155,068,199 |
| Semiconductors & Semiconductor Equipment - 1.1% | | | |
| Entegris, Inc. | | 1,234,680 | 40,806,174 |
| Software - 11.2% | | | |
| 2U, Inc. (a)(b) | | 664,726 | 37,789,673 |
| Alarm.com Holdings, Inc. (a) | | 249,200 | 15,682,156 |
| Black Knight, Inc. (a) | | 421,107 | 20,714,253 |
| Cardlytics, Inc. (a)(b)(c) | | 1,930,138 | 33,758,114 |
| Cornerstone OnDemand, Inc. (a) | | 372,300 | 21,347,682 |
| CyberArk Software Ltd. (a) | | 160,200 | 14,059,152 |
| DocuSign, Inc. | | 116,100 | 5,741,145 |
| Everbridge, Inc. (a) | | 227,000 | 14,042,220 |
| Five9, Inc. (a) | | 728,912 | 37,269,271 |
| HubSpot, Inc. (a) | | 292,838 | 46,359,184 |
| New Relic, Inc. (a) | | 104,262 | 10,598,232 |
| Parametric Technology Corp. (a) | | 214,300 | 18,170,497 |
| Pluralsight, Inc. (b) | | 1,333,390 | 39,975,032 |
| PROS Holdings, Inc. (a) | | 399,228 | 13,813,289 |
| Rapid7, Inc. (a) | | 99,605 | 4,002,129 |
| RingCentral, Inc. (a) | | 293,789 | 27,157,855 |
| ShotSpotter, Inc. (a)(b) | | 369,845 | 17,811,735 |
| The Trade Desk, Inc. (a)(b) | | 238,785 | 34,069,844 |
| Zuora, Inc. (b) | | 666,443 | 14,421,827 |
| | | | 426,783,290 |
|
| TOTAL INFORMATION TECHNOLOGY | | | 705,543,852 |
|
| MATERIALS - 2.9% | | | |
| Chemicals - 2.0% | | | |
| Olin Corp. | | 971,741 | 22,942,805 |
| Orion Engineered Carbons SA | | 1,084,509 | 29,921,603 |
| The Chemours Co. LLC | | 617,311 | 22,068,868 |
| | | | 74,933,276 |
| Containers & Packaging - 0.6% | | | |
| Aptargroup, Inc. | | 145,002 | 14,372,598 |
| Avery Dennison Corp. | | 88,931 | 9,288,843 |
| | | | 23,661,441 |
| Paper & Forest Products - 0.3% | | | |
| Neenah, Inc. | | 178,732 | 12,452,258 |
| Quintis Ltd. (a)(b)(d) | | 10,830,535 | 79 |
| | | | 12,452,337 |
|
| TOTAL MATERIALS | | | 111,047,054 |
|
| REAL ESTATE - 1.0% | | | |
| Equity Real Estate Investment Trusts (REITs) - 1.0% | | | |
| Store Capital Corp. | | 568,121 | 18,361,671 |
| Terreno Realty Corp. | | 476,699 | 19,230,038 |
| | | | 37,591,709 |
| TOTAL COMMON STOCKS | | | |
| (Cost $3,197,377,680) | | | 3,740,221,926 |
|
| Convertible Preferred Stocks - 1.1% | | | |
| INFORMATION TECHNOLOGY - 1.1% | | | |
| Software - 1.1% | | | |
| Compass, Inc. Series E (a)(d)(e) | | | |
| (Cost $23,873,990) | | 353,803 | 41,950,422 |
|
| Money Market Funds - 5.1% | | | |
| Fidelity Cash Central Fund, 2.43% (f) | | 26,670,060 | 26,675,394 |
| Fidelity Securities Lending Cash Central Fund 2.43% (f)(g) | | 168,563,199 | 168,580,055 |
| TOTAL MONEY MARKET FUNDS | | | |
| (Cost $195,255,449) | | | 195,255,449 |
| TOTAL INVESTMENT IN SECURITIES - 104.1% | | | |
| (Cost $3,416,507,119) | | | 3,977,427,797 |
| NET OTHER ASSETS (LIABILITIES) - (4.1)% | | | (155,666,778) |
| NET ASSETS - 100% | | | $3,821,761,019 |
Legend
(a) Non-income producing
(b) Security or a portion of the security is on loan at period end.
(c) Affiliated company
(d) Level 3 security
(e) Restricted securities - Investment in securities not registered under the Securities Act of 1933 (excluding 144A issues). At the end of the period, the value of restricted securities (excluding 144A issues) amounted to $41,950,422 or 1.1% of net assets.
(f) Affiliated fund that is generally available only to investment companies and other accounts managed by Fidelity Investments. The rate quoted is the annualized seven-day yield of the fund at period end. A complete unaudited listing of the fund's holdings as of its most recent quarter end is available upon request. In addition, each Fidelity Central Fund's financial statements are available on the SEC's website or upon request.
(g) Investment made with cash collateral received from securities on loan.
Additional information on each restricted holding is as follows:
| Security | Acquisition Date | Acquisition Cost |
| Compass, Inc. Series E | 11/3/17 | $23,873,990 |
Affiliated Central Funds
Information regarding fiscal year to date income earned by the Fund from investments in Fidelity Central Funds is as follows:
| Fund | Income earned |
| Fidelity Cash Central Fund | $664,737 |
| Fidelity Securities Lending Cash Central Fund | 608,112 |
| Total | $1,272,849 |
Amounts in the income column in the above table include any capital gain distributions from underlying funds, which are presented in the corresponding line-item in the Statement of Operations, if applicable.
Other Affiliated Issuers
An affiliated company is a company in which the Fund has ownership of at least 5% of the voting securities. Fiscal year to date transactions with companies which are or were affiliates are as follows:
| Affiliate | Value, beginning of period | Purchases | Sales Proceeds(a) | Dividend Income | Realized Gain (loss) | Change in Unrealized appreciation (depreciation) | Value, end of period |
| Cardlytics, Inc. | $31,989,182 | $6,123,289 | $1,903,090 | $-- | $964,165 | $(3,415,432) | $33,758,114 |
| Total | $31,989,182 | $6,123,289 | $1,903,090 | $-- | $964,165 | $(3,415,432) | $33,758,114 |
(a) Includes the value of securities delivered through in-kind transactions, if applicable.
Investment Valuation
The following is a summary of the inputs used, as of January 31, 2019, involving the Fund's assets and liabilities carried at fair value. The inputs or methodology used for valuing securities may not be an indication of the risk associated with investing in those securities. For more information on valuation inputs, and their aggregation into the levels used below, please refer to the Investment Valuation section in the accompanying Notes to Financial Statements.
| | Valuation Inputs at Reporting Date: |
| Description | Total | Level 1 | Level 2 | Level 3 |
| Investments in Securities: | | | | |
| Equities: | | | | |
| Communication Services | $262,284,117 | $262,284,117 | $-- | $-- |
| Consumer Discretionary | 498,378,058 | 498,378,058 | -- | -- |
| Consumer Staples | 161,736,729 | 161,736,729 | -- | -- |
| Energy | 31,826,386 | 31,826,386 | -- | -- |
| Financials | 380,597,970 | 380,597,970 | -- | -- |
| Health Care | 1,041,329,483 | 1,041,320,258 | 9,225 | -- |
| Industrials | 509,886,568 | 509,886,568 | -- | -- |
| Information Technology | 747,494,274 | 705,543,852 | -- | 41,950,422 |
| Materials | 111,047,054 | 111,046,975 | -- | 79 |
| Real Estate | 37,591,709 | 37,591,709 | -- | -- |
| Money Market Funds | 195,255,449 | 195,255,449 | -- | -- |
| Total Investments in Securities: | $3,977,427,797 | $3,935,468,071 | $9,225 | $41,950,501 |
The following is a reconciliation of Investments in Securities for which Level 3 inputs were used in determining value:
| Investments in Securities: | |
| Equities - Information Technology | |
| Beginning Balance | $23,873,990 |
| Net Realized Gain (Loss) on Investment Securities | -- |
| Net Unrealized Gain (Loss) on Investment Securities | 18,076,432 |
| Cost of Purchases | -- |
| Proceeds of Sales | -- |
| Amortization/Accretion | -- |
| Transfers into Level 3 | -- |
| Transfers out of Level 3 | -- |
| Ending Balance | $41,950,422 |
| The change in unrealized gain (loss) for the period attributable to Level 3 securities held at January 31, 2019 | $18,076,432 |
| Other Investments in Securities | |
| Beginning Balance | $1,361,915 |
| Net Realized Gain (Loss) on Investment Securities | 336,700 |
| Net Unrealized Gain (Loss) on Investment Securities | (176,933) |
| Cost of Purchases | -- |
| Proceeds of Sales | (1,521,603) |
| Amortization/Accretion | -- |
| Transfers into Level 3 | -- |
| Transfers out of Level 3 | -- |
| Ending Balance | $79 |
| The change in unrealized gain (loss) for the period attributable to Level 3 securities held at January 31, 2019 | $302,371 |
The information used in the above reconciliation represents fiscal year to date activity for any Investments in Securities identified as using Level 3 inputs at either the beginning or the end of the current fiscal period, and proceeds of sales includes securities delivered through in-kind transactions. Transfers in or out of Level 3 represent the beginning value of any Security or Instrument where a change in the pricing level occurred from the beginning to the end of the period. The cost of purchases and the proceeds of sales may include securities received or delivered through corporate actions or exchanges. Realized and unrealized gains (losses) disclosed in the reconciliation are included in Net Gain (Loss) on the Fund's Statement of Operations.
See accompanying notes which are an integral part of the financial statements.
Financial Statements
Statement of Assets and Liabilities
| | | January 31, 2019 (Unaudited) |
| Assets | | |
Investment in securities, at value (including securities loaned of $167,189,433) — See accompanying schedule:
Unaffiliated issuers (cost $3,191,316,589) | $3,748,414,234 | |
| Fidelity Central Funds (cost $195,255,449) | 195,255,449 | |
| Other affiliated issuers (cost $29,935,081) | 33,758,114 | |
| Total Investment in Securities (cost $3,416,507,119) | | $3,977,427,797 |
| Cash | | 820,876 |
| Receivable for investments sold | | 39,820,637 |
| Receivable for fund shares sold | | 3,886,129 |
| Dividends receivable | | 234,522 |
| Distributions receivable from Fidelity Central Funds | | 303,177 |
| Prepaid expenses | | 5,368 |
| Other receivables | | 43,505 |
| Total assets | | 4,022,542,011 |
| Liabilities | | |
| Payable for investments purchased | $24,210,363 | |
| Payable for fund shares redeemed | 4,519,073 | |
| Accrued management fee | 2,624,769 | |
| Distribution and service plan fees payable | 171,143 | |
| Other affiliated payables | 631,091 | |
| Other payables and accrued expenses | 52,086 | |
| Collateral on securities loaned | 168,572,467 | |
| Total liabilities | | 200,780,992 |
| Net Assets | | $3,821,761,019 |
| Net Assets consist of: | | |
| Paid in capital | | $3,305,359,631 |
| Total distributable earnings (loss) | | 516,401,388 |
| Net Assets | | $3,821,761,019 |
| Net Asset Value and Maximum Offering Price | | |
| Class A: | | |
| Net Asset Value and redemption price per share ($268,037,937 ÷ 11,774,506 shares) | | $22.76 |
| Maximum offering price per share (100/94.25 of $22.76) | | $24.15 |
| Class M: | | |
| Net Asset Value and redemption price per share ($69,836,155 ÷ 3,178,651 shares) | | $21.97 |
| Maximum offering price per share (100/96.50 of $21.97) | | $22.77 |
| Class C: | | |
| Net Asset Value and offering price per share ($113,612,823 ÷ 5,652,306 shares)(a) | | $20.10 |
| Small Cap Growth: | | |
| Net Asset Value, offering price and redemption price per share ($2,662,816,831 ÷ 111,798,318 shares) | | $23.82 |
| Class I: | | |
| Net Asset Value, offering price and redemption price per share ($565,533,577 ÷ 23,674,278 shares) | | $23.89 |
| Class Z: | | |
| Net Asset Value, offering price and redemption price per share ($141,923,696 ÷ 5,931,262 shares) | | $23.93 |
(a) Redemption price per share is equal to net asset value less any applicable contingent deferred sales charge.
See accompanying notes which are an integral part of the financial statements.
Statement of Operations
| | | Six months ended January 31, 2019 (Unaudited) |
| Investment Income | | |
| Dividends | | $8,851,807 |
| Income from Fidelity Central Funds (including $608,112 from security lending) | | 1,272,849 |
| Total income | | 10,124,656 |
| Expenses | | |
| Management fee | | |
| Basic fee | $14,511,128 | |
| Performance adjustment | 3,054,824 | |
| Transfer agent fees | 3,658,602 | |
| Distribution and service plan fees | 1,183,011 | |
| Accounting and security lending fees | 539,280 | |
| Custodian fees and expenses | 36,382 | |
| Independent trustees' fees and expenses | 13,945 | |
| Registration fees | 136,060 | |
| Audit | 46,169 | |
| Legal | 8,395 | |
| Interest | 10,317 | |
| Miscellaneous | 12,744 | |
| Total expenses before reductions | 23,210,857 | |
| Expense reductions | (90,615) | |
| Total expenses after reductions | | 23,120,242 |
| Net investment income (loss) | | (12,995,586) |
| Realized and Unrealized Gain (Loss) | | |
| Net realized gain (loss) on: | | |
| Investment securities: | | |
| Unaffiliated issuers | 48,192,269 | |
| Fidelity Central Funds | 4,981 | |
| Other affiliated issuers | 964,165 | |
| Foreign currency transactions | 1,064 | |
| Total net realized gain (loss) | | 49,162,479 |
| Change in net unrealized appreciation (depreciation) on: | | |
| Investment securities: | | |
| Unaffiliated issuers | (363,481,112) | |
| Affiliated issuers | (3,415,432) | |
| Assets and liabilities in foreign currencies | (14) | |
| Total change in net unrealized appreciation (depreciation) | | (366,896,558) |
| Net gain (loss) | | (317,734,079) |
| Net increase (decrease) in net assets resulting from operations | | $(330,729,665) |
See accompanying notes which are an integral part of the financial statements.
Statement of Changes in Net Assets
| | Six months ended January 31, 2019 (Unaudited) | Year ended July 31, 2018 |
| Increase (Decrease) in Net Assets | | |
| Operations | | |
| Net investment income (loss) | $(12,995,586) | $(20,419,513) |
| Net realized gain (loss) | 49,162,479 | 566,206,488 |
| Change in net unrealized appreciation (depreciation) | (366,896,558) | 432,963,295 |
| Net increase (decrease) in net assets resulting from operations | (330,729,665) | 978,750,270 |
| Distributions to shareholders | (497,059,351) | – |
| Distributions to shareholders from net realized gain | – | (236,662,615) |
| Total distributions | (497,059,351) | (236,662,615) |
| Share transactions - net increase (decrease) | 30,661,863 | 745,727,718 |
| Redemption fees | – | 224,642 |
| Total increase (decrease) in net assets | (797,127,153) | 1,488,040,015 |
| Net Assets | | |
| Beginning of period | 4,618,888,172 | 3,130,848,157 |
| End of period | $3,821,761,019 | $4,618,888,172 |
| Other Information | | |
| Accumulated net investment loss end of period | | $(3,938,472) |
See accompanying notes which are an integral part of the financial statements.
Financial Highlights
Fidelity Small Cap Growth Fund Class A
| | Six months ended (Unaudited) January 31, | Years endedJuly 31, | | | | |
| | 2019 | 2018 | 2017 | 2016 | 2015 | 2014 |
| Selected Per–Share Data | | | | | | |
| Net asset value, beginning of period | $27.45 | $22.99 | $19.17 | $20.55 | $17.99 | $19.66 |
| Income from Investment Operations | | | | | | |
| Net investment income (loss)A | (.10) | (.18) | (.14) | (.10) | (.13) | (.12) |
| Net realized and unrealized gain (loss) | (1.59) | 6.32 | 4.12 | (.51) | 4.23 | 1.69 |
| Total from investment operations | (1.69) | 6.14 | 3.98 | (.61) | 4.10 | 1.57 |
| Distributions from net realized gain | (3.00) | (1.68) | (.16) | (.78) | (1.54) | (3.24) |
| Total distributions | (3.00) | (1.68) | (.16) | (.78) | (1.54) | (3.24) |
| Redemption fees added to paid in capitalA | – | –B | –B | .01 | –B | –B |
| Net asset value, end of period | $22.76 | $27.45 | $22.99 | $19.17 | $20.55 | $17.99 |
| Total ReturnC,D,E | (7.42)% | 28.47% | 20.90% | (2.85)% | 24.46% | 8.58% |
| Ratios to Average Net AssetsF,G | | | | | | |
| Expenses before reductions | 1.32%H | 1.31% | 1.35% | 1.37% | 1.21% | 1.22% |
| Expenses net of fee waivers, if any | 1.32%H | 1.31% | 1.35% | 1.37% | 1.21% | 1.22% |
| Expenses net of all reductions | 1.32%H | 1.30% | 1.34% | 1.36% | 1.20% | 1.22% |
| Net investment income (loss) | (.84)%H | (.74)% | (.66)% | (.58)% | (.67)% | (.62)% |
| Supplemental Data | | | | | | |
| Net assets, end of period (000 omitted) | $268,038 | $315,894 | $218,905 | $176,988 | $123,370 | $88,822 |
| Portfolio turnover rateI | 108%H,J | 106%J | 140%J | 143% | 156% | 148%J |
A Calculated based on average shares outstanding during the period.
B Amount represents less than $.005 per share.
C Total returns for periods of less than one year are not annualized.
D Total returns would have been lower if certain expenses had not been reduced during the applicable periods shown.
E Total returns do not include the effect of the sales charges.
F Fees and expenses of any underlying Fidelity Central Funds are not included in the Fund's expense ratio. The Fund indirectly bears its proportionate share of the expenses of any underlying Fidelity Central Funds.
G Expense ratios reflect operating expenses of the class. Expenses before reductions do not reflect amounts reimbursed by the investment adviser or reductions from brokerage service arrangements or reductions from other expense offset arrangements and do not represent the amount paid by the class during periods when reimbursements or reductions occur. Expenses net of fee waivers reflect expenses after reimbursement by the investment adviser but prior to reductions from brokerage service arrangements or other expense offset arrangements. Expenses net of all reductions represent the net expenses paid by the class.
H Annualized
I Amount does not include the portfolio activity of any underlying Fidelity Central Funds.
J Portfolio turnover rate excludes securities received or delivered in-kind.
See accompanying notes which are an integral part of the financial statements.
Fidelity Small Cap Growth Fund Class M
| | Six months ended (Unaudited) January 31, | Years endedJuly 31, | | | | |
| | 2019 | 2018 | 2017 | 2016 | 2015 | 2014 |
| Selected Per–Share Data | | | | | | |
| Net asset value, beginning of period | $26.59 | $22.35 | $18.69 | $20.08 | $17.66 | $19.38 |
| Income from Investment Operations | | | | | | |
| Net investment income (loss)A | (.13) | (.24) | (.19) | (.15) | (.17) | (.16) |
| Net realized and unrealized gain (loss) | (1.53) | 6.13 | 4.01 | (.50) | 4.13 | 1.66 |
| Total from investment operations | (1.66) | 5.89 | 3.82 | (.65) | 3.96 | 1.50 |
| Distributions from net realized gain | (2.96) | (1.65) | (.16) | (.75) | (1.54) | (3.22) |
| Total distributions | (2.96) | (1.65) | (.16) | (.75) | (1.54) | (3.22) |
| Redemption fees added to paid in capitalA | – | –B | –B | .01 | –B | –B |
| Net asset value, end of period | $21.97 | $26.59 | $22.35 | $18.69 | $20.08 | $17.66 |
| Total ReturnC,D,E | (7.53)% | 28.15% | 20.57% | (3.14)% | 24.10% | 8.30% |
| Ratios to Average Net AssetsF,G | | | | | | |
| Expenses before reductions | 1.59%H | 1.58% | 1.62% | 1.66% | 1.49% | 1.50% |
| Expenses net of fee waivers, if any | 1.59%H | 1.58% | 1.62% | 1.66% | 1.48% | 1.50% |
| Expenses net of all reductions | 1.59%H | 1.57% | 1.61% | 1.64% | 1.47% | 1.49% |
| Net investment income (loss) | (1.11)%H | (1.01)% | (.94)% | (.87)% | (.95)% | (.90)% |
| Supplemental Data | | | | | | |
| Net assets, end of period (000 omitted) | $69,836 | $82,567 | $64,034 | $53,447 | $52,667 | $42,586 |
| Portfolio turnover rateI | 108%H,J | 106%J | 140%J | 143% | 156% | 148%J |
A Calculated based on average shares outstanding during the period.
B Amount represents less than $.005 per share.
C Total returns for periods of less than one year are not annualized.
D Total returns would have been lower if certain expenses had not been reduced during the applicable periods shown.
E Total returns do not include the effect of the sales charges.
F Fees and expenses of any underlying Fidelity Central Funds are not included in the Fund's expense ratio. The Fund indirectly bears its proportionate share of the expenses of any underlying Fidelity Central Funds.
G Expense ratios reflect operating expenses of the class. Expenses before reductions do not reflect amounts reimbursed by the investment adviser or reductions from brokerage service arrangements or reductions from other expense offset arrangements and do not represent the amount paid by the class during periods when reimbursements or reductions occur. Expenses net of fee waivers reflect expenses after reimbursement by the investment adviser but prior to reductions from brokerage service arrangements or other expense offset arrangements. Expenses net of all reductions represent the net expenses paid by the class.
H Annualized
I Amount does not include the portfolio activity of any underlying Fidelity Central Funds.
J Portfolio turnover rate excludes securities received or delivered in-kind.
See accompanying notes which are an integral part of the financial statements.
Fidelity Small Cap Growth Fund Class C
| | Six months ended (Unaudited) January 31, | Years endedJuly 31, | | | | |
| | 2019 | 2018 | 2017 | 2016 | 2015 | 2014 |
| Selected Per–Share Data | | | | | | |
| Net asset value, beginning of period | $24.56 | $20.83 | $17.52 | $18.90 | $16.78 | $18.62 |
| Income from Investment Operations | | | | | | |
| Net investment income (loss)A | (.17) | (.34) | (.27) | (.22) | (.25) | (.25) |
| Net realized and unrealized gain (loss) | (1.39) | 5.69 | 3.74 | (.48) | 3.91 | 1.59 |
| Total from investment operations | (1.56) | 5.35 | 3.47 | (.70) | 3.66 | 1.34 |
| Distributions from net realized gain | (2.90) | (1.62) | (.16) | (.69) | (1.54) | (3.18) |
| Total distributions | (2.90) | (1.62) | (.16) | (.69) | (1.54) | (3.18) |
| Redemption fees added to paid in capitalA | – | –B | –B | .01 | –B | –B |
| Net asset value, end of period | $20.10 | $24.56 | $20.83 | $17.52 | $18.90 | $16.78 |
| Total ReturnC,D,E | (7.74)% | 27.51% | 19.95% | (3.64)% | 23.53% | 7.70% |
| Ratios to Average Net AssetsF,G | | | | | | |
| Expenses before reductions | 2.08%H | 2.07% | 2.11% | 2.16% | 2.00% | 2.01% |
| Expenses net of fee waivers, if any | 2.08%H | 2.07% | 2.11% | 2.16% | 2.00% | 2.00% |
| Expenses net of all reductions | 2.07%H | 2.06% | 2.10% | 2.14% | 1.99% | 2.00% |
| Net investment income (loss) | (1.59)%H | (1.50)% | (1.43)% | (1.37)% | (1.46)% | (1.41)% |
| Supplemental Data | | | | | | |
| Net assets, end of period (000 omitted) | $113,613 | $139,375 | $102,669 | $73,731 | $55,671 | $42,215 |
| Portfolio turnover rateI | 108%H,J | 106%J | 140%J | 143% | 156% | 148%J |
A Calculated based on average shares outstanding during the period.
B Amount represents less than $.005 per share.
C Total returns for periods of less than one year are not annualized.
D Total returns would have been lower if certain expenses had not been reduced during the applicable periods shown.
E Total returns do not include the effect of the contingent deferred sales charge.
F Fees and expenses of any underlying Fidelity Central Funds are not included in the Fund's expense ratio. The Fund indirectly bears its proportionate share of the expenses of any underlying Fidelity Central Funds.
G Expense ratios reflect operating expenses of the class. Expenses before reductions do not reflect amounts reimbursed by the investment adviser or reductions from brokerage service arrangements or reductions from other expense offset arrangements and do not represent the amount paid by the class during periods when reimbursements or reductions occur. Expenses net of fee waivers reflect expenses after reimbursement by the investment adviser but prior to reductions from brokerage service arrangements or other expense offset arrangements. Expenses net of all reductions represent the net expenses paid by the class.
H Annualized
I Amount does not include the portfolio activity of any underlying Fidelity Central Funds.
J Portfolio turnover rate excludes securities received or delivered in-kind.
See accompanying notes which are an integral part of the financial statements.
Fidelity Small Cap Growth Fund
| | Six months ended (Unaudited) January 31, | Years endedJuly 31, | | | | |
| | 2019 | 2018 | 2017 | 2016 | 2015 | 2014 |
| Selected Per–Share Data | | | | | | |
| Net asset value, beginning of period | $28.59 | $23.84 | $19.82 | $21.20 | $18.45 | $20.07 |
| Income from Investment Operations | | | | | | |
| Net investment income (loss)A | (.07) | (.12) | (.09) | (.06) | (.07) | (.06) |
| Net realized and unrealized gain (loss) | (1.66) | 6.57 | 4.27 | (.52) | 4.36 | 1.71 |
| Total from investment operations | (1.73) | 6.45 | 4.18 | (.58) | 4.29 | 1.65 |
| Distributions from net realized gain | (3.04) | (1.70) | (.16) | (.81) | (1.54) | (3.27) |
| Total distributions | (3.04) | (1.70) | (.16) | (.81) | (1.54) | (3.27) |
| Redemption fees added to paid in capitalA | – | –B | –B | .01 | –B | –B |
| Net asset value, end of period | $23.82 | $28.59 | $23.84 | $19.82 | $21.20 | $18.45 |
| Total ReturnC,D | (7.26)% | 28.81% | 21.22% | (2.63)% | 24.91% | 8.87% |
| Ratios to Average Net AssetsE,F | | | | | | |
| Expenses before reductions | 1.04%G | 1.02% | 1.08% | 1.12% | .91% | .91% |
| Expenses net of fee waivers, if any | 1.04%G | 1.02% | 1.08% | 1.12% | .91% | .90% |
| Expenses net of all reductions | 1.04%G | 1.01% | 1.07% | 1.11% | .90% | .90% |
| Net investment income (loss) | (.56)%G | (.45)% | (.40)% | (.33)% | (.37)% | (.31)% |
| Supplemental Data | | | | | | |
| Net assets, end of period (000 omitted) | $2,662,817 | $3,269,548 | $2,336,762 | $1,580,264 | $1,345,684 | $1,069,105 |
| Portfolio turnover rateH | 108%G,I | 106%I | 140%I | 143% | 156% | 148%I |
A Calculated based on average shares outstanding during the period.
B Amount represents less than $.005 per share.
C Total returns for periods of less than one year are not annualized.
D Total returns would have been lower if certain expenses had not been reduced during the applicable periods shown.
E Fees and expenses of any underlying Fidelity Central Funds are not included in the Fund's expense ratio. The Fund indirectly bears its proportionate share of the expenses of any underlying Fidelity Central Funds.
F Expense ratios reflect operating expenses of the class. Expenses before reductions do not reflect amounts reimbursed by the investment adviser or reductions from brokerage service arrangements or reductions from other expense offset arrangements and do not represent the amount paid by the class during periods when reimbursements or reductions occur. Expenses net of fee waivers reflect expenses after reimbursement by the investment adviser but prior to reductions from brokerage service arrangements or other expense offset arrangements. Expenses net of all reductions represent the net expenses paid by the class.
G Annualized
H Amount does not include the portfolio activity of any underlying Fidelity Central Funds.
I Portfolio turnover rate excludes securities received or delivered in-kind.
See accompanying notes which are an integral part of the financial statements.
Fidelity Small Cap Growth Fund Class I
| | Six months ended (Unaudited) January 31, | Years endedJuly 31, | | | | |
| | 2019 | 2018 | 2017 | 2016 | 2015 | 2014 |
| Selected Per–Share Data | | | | | | |
| Net asset value, beginning of period | $28.66 | $23.90 | $19.86 | $21.24 | $18.49 | $20.10 |
| Income from Investment Operations | | | | | | |
| Net investment income (loss)A | (.07) | (.12) | (.08) | (.05) | (.07) | (.06) |
| Net realized and unrealized gain (loss) | (1.66) | 6.58 | 4.28 | (.53) | 4.36 | 1.72 |
| Total from investment operations | (1.73) | 6.46 | 4.20 | (.58) | 4.29 | 1.66 |
| Distributions from net realized gain | (3.04) | (1.70) | (.16) | (.81) | (1.54) | (3.27) |
| Total distributions | (3.04) | (1.70) | (.16) | (.81) | (1.54) | (3.27) |
| Redemption fees added to paid in capitalA | – | –B | –B | .01 | –B | –B |
| Net asset value, end of period | $23.89 | $28.66 | $23.90 | $19.86 | $21.24 | $18.49 |
| Total ReturnC,D | (7.26)% | 28.78% | 21.28% | (2.62)% | 24.85% | 8.89% |
| Ratios to Average Net AssetsE,F | | | | | | |
| Expenses before reductions | 1.06%G | 1.03% | 1.06% | 1.09% | .93% | .92% |
| Expenses net of fee waivers, if any | 1.05%G | 1.03% | 1.06% | 1.09% | .93% | .92% |
| Expenses net of all reductions | 1.05%G | 1.02% | 1.05% | 1.07% | .91% | .92% |
| Net investment income (loss) | (.57)%G | (.46)% | (.38)% | (.30)% | (.39)% | (.32)% |
| Supplemental Data | | | | | | |
| Net assets, end of period (000 omitted) | $565,534 | $678,576 | $390,032 | $163,696 | $97,897 | $51,607 |
| Portfolio turnover rateH | 108%G,I | 106%I | 140%I | 143% | 156% | 148%I |
A Calculated based on average shares outstanding during the period.
B Amount represents less than $.005 per share.
C Total returns for periods of less than one year are not annualized.
D Total returns would have been lower if certain expenses had not been reduced during the applicable periods shown.
E Fees and expenses of any underlying Fidelity Central Funds are not included in the Fund's expense ratio. The Fund indirectly bears its proportionate share of the expenses of any underlying Fidelity Central Funds.
F Expense ratios reflect operating expenses of the class. Expenses before reductions do not reflect amounts reimbursed by the investment adviser or reductions from brokerage service arrangements or reductions from other expense offset arrangements and do not represent the amount paid by the class during periods when reimbursements or reductions occur. Expenses net of fee waivers reflect expenses after reimbursement by the investment adviser but prior to reductions from brokerage service arrangements or other expense offset arrangements. Expenses net of all reductions represent the net expenses paid by the class.
G Annualized
H Amount does not include the portfolio activity of any underlying Fidelity Central Funds.
I Portfolio turnover rate excludes securities received or delivered in-kind.
See accompanying notes which are an integral part of the financial statements.
Fidelity Small Cap Growth Fund Class Z
| | Six months ended (Unaudited) January 31, | Years endedJuly 31, | |
| | 2019 | 2018 | 2017 A |
| Selected Per–Share Data | | | |
| Net asset value, beginning of period | $28.71 | $23.91 | $21.39 |
| Income from Investment Operations | | | |
| Net investment income (loss)B | (.05) | (.09) | (.05) |
| Net realized and unrealized gain (loss) | (1.67) | 6.61 | 2.57 |
| Total from investment operations | (1.72) | 6.52 | 2.52 |
| Distributions from net realized gain | (3.06) | (1.72) | – |
| Total distributions | (3.06) | (1.72) | – |
| Redemption fees added to paid in capitalB | – | –C | –C |
| Net asset value, end of period | $23.93 | $28.71 | $23.91 |
| Total ReturnD,E | (7.20)% | 29.02% | 11.78% |
| Ratios to Average Net AssetsF,G | | | |
| Expenses before reductions | .92%H | .89% | .90%H |
| Expenses net of fee waivers, if any | .92%H | .89% | .90%H |
| Expenses net of all reductions | .91%H | .88% | .89%H |
| Net investment income (loss) | (.43)%H | (.32)% | (.44)%H |
| Supplemental Data | | | |
| Net assets, end of period (000 omitted) | $141,924 | $132,928 | $18,447 |
| Portfolio turnover rateI | 108%H,J | 106%J | 140%J |
A For the period February 1, 2017 (commencement of sale of shares) to July 31, 2017.
B Calculated based on average shares outstanding during the period.
C Amount represents less than $.005 per share.
D Total returns for periods of less than one year are not annualized.
E Total returns would have been lower if certain expenses had not been reduced during the applicable periods shown.
F Fees and expenses of any underlying Fidelity Central Funds are not included in the Fund's expense ratio. The Fund indirectly bears its proportionate share of the expenses of any underlying Fidelity Central Funds.
G Expense ratios reflect operating expenses of the class. Expenses before reductions do not reflect amounts reimbursed by the investment adviser or reductions from brokerage service arrangements or reductions from other expense offset arrangements and do not represent the amount paid by the class during periods when reimbursements or reductions occur. Expense ratios before reductions for start-up periods may not be representative of longer-term operating periods. Expenses net of fee waivers reflect expenses after reimbursement by the investment adviser but prior to reductions from brokerage service arrangements or other expense offset arrangements. Expenses net of all reductions represent the net expenses paid by the class.
H Annualized
I Amount does not include the portfolio activity of any underlying Fidelity Central Funds.
J Portfolio turnover rate excludes securities received or delivered in-kind.
See accompanying notes which are an integral part of the financial statements.
Notes to Financial Statements (Unaudited)
For the period ended January 31, 2019
1. Organization.
Fidelity Small Cap Growth Fund (the Fund) is a fund of Fidelity Securities Fund (the Trust) and is authorized to issue an unlimited number of shares. The Trust is registered under the Investment Company Act of 1940, as amended (the 1940 Act), as an open-end management investment company organized as a Massachusetts business trust. The Fund offers Class A, Class M, Class C, Fidelity Small Cap Growth, Class I and Class Z shares, each of which has equal rights as to assets and voting privileges. Effective the close of business on February 2, 2018, the Fund was closed to new accounts with certain exceptions. Each class has exclusive voting rights with respect to matters that affect that class.
Effective March 1, 2019, Class C shares will automatically convert Class A shares after a holding period of ten years from the initial date of purchase, with certain exceptions.
2. Investments in Fidelity Central Funds.
The Fund invests in Fidelity Central Funds, which are open-end investment companies generally available only to other investment companies and accounts managed by the investment adviser and its affiliates. The Fund's Schedule of Investments lists each of the Fidelity Central Funds held as of period end, if any, as an investment of the Fund, but does not include the underlying holdings of each Fidelity Central Fund. As an Investing Fund, the Fund indirectly bears its proportionate share of the expenses of the underlying Fidelity Central Funds.
The Money Market Central Funds seek preservation of capital and current income and are managed by Fidelity Investments Money Management, Inc. (FIMM), an affiliate of the investment adviser. Annualized expenses of the Money Market Central Funds as of their most recent shareholder report date are less than .005%.
A complete unaudited list of holdings for each Fidelity Central Fund is available upon request or at the Securities and Exchange Commission (the SEC) website at www.sec.gov. In addition, the financial statements of the Fidelity Central Funds are available on the SEC website or upon request.
3. Significant Accounting Policies.
The Fund is an investment company and applies the accounting and reporting guidance of the Financial Accounting Standards Board (FASB) Accounting Standards Codification Topic 946 Financial Services – Investments Companies. The financial statements have been prepared in conformity with accounting principles generally accepted in the United States of America (GAAP), which require management to make certain estimates and assumptions at the date of the financial statements. Actual results could differ from those estimates. Subsequent events, if any, through the date that the financial statements were issued have been evaluated in the preparation of the financial statements. The following summarizes the significant accounting policies of the Fund:
Investment Valuation. Investments are valued as of 4:00 p.m. Eastern time on the last calendar day of the period. The Board of Trustees (the Board) has delegated the day to day responsibility for the valuation of the Fund's investments to the Fair Value Committee (the Committee) established by the Fund's investment adviser. In accordance with valuation policies and procedures approved by the Board, the Fund attempts to obtain prices from one or more third party pricing vendors or brokers to value its investments. When current market prices, quotations or currency exchange rates are not readily available or reliable, investments will be fair valued in good faith by the Committee, in accordance with procedures adopted by the Board. Factors used in determining fair value vary by investment type and may include market or investment specific events. The frequency with which these procedures are used cannot be predicted and they may be utilized to a significant extent. The Committee oversees the Fund's valuation policies and procedures and reports to the Board on the Committee's activities and fair value determinations. The Board monitors the appropriateness of the procedures used in valuing the Fund's investments and ratifies the fair value determinations of the Committee.
The Fund categorizes the inputs to valuation techniques used to value its investments into a disclosure hierarchy consisting of three levels as shown below:
- Level 1 – quoted prices in active markets for identical investments
- Level 2 – other significant observable inputs (including quoted prices for similar investments, interest rates, prepayment speeds, etc.)
- Level 3 – unobservable inputs (including the Fund's own assumptions based on the best information available)
Valuation techniques used to value the Fund's investments by major category are as follows:
Equity securities, including restricted securities, for which market quotations are readily available, are valued at the last reported sale price or official closing price as reported by a third party pricing vendor on the primary market or exchange on which they are traded and are categorized as Level 1 in the hierarchy. In the event there were no sales during the day or closing prices are not available, securities are valued at the last quoted bid price or may be valued using the last available price and are generally categorized as Level 2 in the hierarchy. For foreign equity securities, when market or security specific events arise, comparisons to the valuation of American Depositary Receipts (ADRs), futures contracts, Exchange-Traded Funds (ETFs) and certain indexes as well as quoted prices for similar securities may be used and would be categorized as Level 2 in the hierarchy. For equity securities, including restricted securities, where observable inputs are limited, assumptions about market activity and risk are used and these securities may be categorized as Level 3 in the hierarchy.
Investments in open-end mutual funds, including the Fidelity Central Funds, are valued at their closing net asset value (NAV) each business day and are categorized as Level 1 in the hierarchy.
The following provides information on Level 3 securities held by the Fund that were valued at period end based on unobservable inputs. These amounts exclude valuations provided by a broker.
| Asset Type | Fair Value | Valuation Technique(s) | Unobservable Input | Amount or Range/Weighted Average | Impact to Valuation from an Increase in Input(a) |
| Equities | $ 41,950,501 | Market approach | Transaction price | $118.57 | Increase |
| | | Recovery Value | Recovery Value | 0.0% | Increase |
(a) Represents the directional change in the fair value of the Level 3 investments that could have resulted from an increase in the corresponding input as of period end. A decrease to the unobservable input would have had the opposite effect. Significant changes in these inputs may have resulted in a significantly higher or lower fair value measurement at period end.
Changes in valuation techniques may result in transfers in or out of an assigned level within the disclosure hierarchy. The aggregate value of investments by input level as of January 31, 2019, as well as a roll forward of Level 3 investments, is included at the end of the Fund's Schedule of Investments.
Foreign Currency. The Fund may use foreign currency contracts to facilitate transactions in foreign-denominated securities. Gains and losses from these transactions may arise from changes in the value of the foreign currency or if the counterparties do not perform under the contracts' terms.
Foreign-denominated assets, including investment securities, and liabilities are translated into U.S. dollars at the exchange rates at period end. Purchases and sales of investment securities, income and dividends received and expenses denominated in foreign currencies are translated into U.S. dollars at the exchange rate in effect on the transaction date.
The effects of exchange rate fluctuations on investments are included with the net realized and unrealized gain (loss) on investment securities. Other foreign currency transactions resulting in realized and unrealized gain (loss) are disclosed separately.
Investment Transactions and Income. For financial reporting purposes, the Fund's investment holdings and NAV include trades executed through the end of the last business day of the period. The NAV per share for processing shareholder transactions is calculated as of the close of business of the New York Stock Exchange (NYSE), normally 4:00 p.m. Eastern time and includes trades executed through the end of the prior business day. Gains and losses on securities sold are determined on the basis of identified cost and include proceeds received from litigation. Dividend income is recorded on the ex-dividend date, except for certain dividends from foreign securities where the ex-dividend date may have passed, which are recorded as soon as the Fund is informed of the ex-dividend date. Non-cash dividends included in dividend income, if any, are recorded at the fair market value of the securities received. Income and capital gain distributions from Fidelity Central Funds, if any, are recorded on the ex-dividend date. Certain distributions received by the Fund represent a return of capital or capital gain. The Fund determines the components of these distributions subsequent to the ex-dividend date, based upon receipt of tax filings or other correspondence relating to the underlying investment. These distributions are recorded as a reduction of cost of investments and/or as a realized gain. Investment income is recorded net of foreign taxes withheld where recovery of such taxes is uncertain.
Class Allocations and Expenses. Investment income, realized and unrealized capital gains and losses, common expenses of the Fund, and certain fund-level expense reductions, if any, are allocated daily on a pro-rata basis to each class based on the relative net assets of each class to the total net assets of the Fund. Each class differs with respect to transfer agent and distribution and service plan fees incurred. Certain expense reductions may also differ by class. For the reporting period, the allocated portion of income and expenses to each class as a percent of its average net assets may vary due to the timing of recording these transactions in relation to fluctuating net assets of the classes. Expenses directly attributable to a fund are charged to that fund. Expenses attributable to more than one fund are allocated among the respective funds on the basis of relative net assets or other appropriate methods. Expense estimates are accrued in the period to which they relate and adjustments are made when actual amounts are known.
Income Tax Information and Distributions to Shareholders. Each year, the Fund intends to qualify as a regulated investment company under Subchapter M of the Internal Revenue Code, including distributing substantially all of its taxable income and realized gains. As a result, no provision for U.S. Federal income taxes is required. The Fund files a U.S. federal tax return, in addition to state and local tax returns as required. The Fund's federal income tax returns are subject to examination by the Internal Revenue Service (IRS) for a period of three fiscal years after they are filed. State and local tax returns may be subject to examination for an additional fiscal year depending on the jurisdiction. Foreign taxes are provided for based on the Fund's understanding of the tax rules and rates that exist in the foreign markets in which it invests.
Distributions are declared and recorded on the ex-dividend date. Income and capital gain distributions are declared separately for each class. Income and capital gain distributions are determined in accordance with income tax regulations, which may differ from GAAP.
Capital accounts within the financial statements are adjusted for permanent book-tax differences. These adjustments have no impact on net assets or the results of operations. Capital accounts are not adjusted for temporary book-tax differences which will reverse in a subsequent period.
Book-tax differences are primarily due to foreign currency transactions, redemptions in-kind, partnerships, net operating losses and losses deferred due to wash sales.
As of period end, the cost and unrealized appreciation (depreciation) in securities, and derivatives if applicable, for federal income tax purposes were as follows:
| Gross unrealized appreciation | $726,184,845 |
| Gross unrealized depreciation | (174,099,409) |
| Net unrealized appreciation (depreciation) | $552,085,436 |
| Tax cost | $3,425,342,361 |
Restricted Securities. The Fund may invest in securities that are subject to legal or contractual restrictions on resale. These securities generally may be resold in transactions exempt from registration or to the public if the securities are registered. Disposal of these securities may involve time-consuming negotiations and expense, and prompt sale at an acceptable price may be difficult. Information regarding restricted securities is included at the end of the Fund's Schedule of Investments.
New Rule Issuance. During August 2018, the U.S. Securities and Exchange Commission issued Final Rule Release No. 33-10532, Disclosure Update and Simplification. This Final Rule includes amendments specific to registered investment companies that are intended to eliminate overlap in disclosure requirements between Regulation S-X and GAAP. In accordance with these amendments, certain line-items in the Fund's financial statements have been combined or removed for the current period as outlined in the table below.
| Financial Statement | Current Line-Item Presentation (As Applicable) | Prior Line-Item Presentation (As Applicable) |
| Statement of Assets and Liabilities | Total distributable earnings (loss) | Undistributed/Distributions in excess of/Accumulated net investment income (loss)
Accumulated/Undistributed net realized gain (loss)
Net unrealized appreciation (depreciation) |
| Statement of Changes in Net Assets | N/A - removed | Undistributed/Distributions in excess of/Accumulated net investment income (loss) end of period |
| Statement of Changes in Net Assets | Distributions to shareholders | Distributions to shareholders from net investment income
Distributions to shareholders from net realized gain |
| Distributions to Shareholders Note to Financial Statements | Distributions to shareholders | Distributions to shareholders from net investment income
Distributions to shareholders from net realized gain |
4. Purchases and Sales of Investments.
Purchases and sales of securities, other than short-term securities and in-kind transactions, aggregated $2,261,654,818 and $2,494,895,693, respectively.
Unaffiliated Redemptions In-Kind. During the period, 6,803,919 shares of the Fund were redeemed in-kind for investments and cash with a value of $189,610,448. The net realized gain of $55,644,617 on investments delivered through in-kind redemptions is included in the accompanying Statement of Operations. The amount of the in-kind redemptions is included in share transactions in the accompanying Statement of Changes in Net Assets, as well as the Notes to Financial Statements. The Fund recognized no gain or loss for federal income tax purposes.
Prior Fiscal Year Redemptions In-Kind. During the prior period, 3,806,167 shares of the Fund held by unaffiliated entities were redeemed in kind for investments and cash with a value of $99,242,171. The Fund had a net realized gain of $30,767,545 on investments delivered through in-kind redemptions. The amount of in-kind redemptions is included in share transactions in the accompanying Statement of Changes in Net Assets as well as the Notes to Financial Statements. The Fund recognized no gain or loss for federal income tax purposes.
5. Fees and Other Transactions with Affiliates.
Management Fee. Fidelity Management & Research Company (the investment adviser) and its affiliates provide the Fund with investment management related services for which the Fund pays a monthly management fee. The management fee is the sum of an individual fund fee rate that is based on an annual rate of .45% of the Fund's average net assets and an annualized group fee rate that averaged .24% during the period. The group fee rate is based upon the average net assets of all the mutual funds advised by the investment adviser, including any mutual funds previously advised by the investment adviser that are currently advised by Fidelity SelectCo, LLC, an affiliate of the investment adviser. The group fee rate decreases as assets under management increase and increases as assets under management decrease. In addition, the management fee is subject to a performance adjustment (up to a maximum of +/- .20% of the Fund's average net assets over a 36 month performance period). The upward or downward adjustment to the management fee is based on the relative investment performance of Small Cap Growth as compared to its benchmark index, the Russell 2000 Growth Index, over the same 36 month performance period. For the reporting period, the total annualized management fee rate, including the performance adjustment, was .83% of the Fund's average net assets. The performance adjustment included in the management fee rate may be higher or lower than the maximum performance adjustment rate due to the difference between the average net assets for the reporting and performance periods.
Distribution and Service Plan Fees. In accordance with Rule 12b-1 of the 1940 Act, the Fund has adopted separate Distribution and Service Plans for each class of shares. Certain classes pay Fidelity Distributors Corporation (FDC), an affiliate of the investment adviser, separate Distribution and Service Fees, each of which is based on an annual percentage of each class' average net assets. In addition, FDC may pay financial intermediaries for selling shares of the Fund and providing shareholder support services. For the period, the Distribution and Service Fee rates, total fees and amounts retained by FDC were as follows:
| | Distribution Fee | Service Fee | Total Fees | Retained by FDC |
| Class A | -% | .25% | $365,894 | $6,413 |
| Class M | .25% | .25% | 190,454 | – |
| Class C | .75% | .25% | 626,663 | 51,114 |
| | | | $1,183,011 | $57,527 |
Sales Load. FDC may receive a front-end sales charge of up to 5.75% for selling Class A shares and 3.50% for selling Class M shares, some of which is paid to financial intermediaries for selling shares of the Fund. Depending on the holding period, FDC may receive contingent deferred sales charges levied on Class A, Class M and Class C redemptions. The deferred sales charges are 1.00% for Class C shares, 1.00% for certain purchases of Class A shares and .25% for certain purchases of Class M shares.
For the period, sales charge amounts retained by FDC were as follows:
| | Retained by FDC |
| Class A | $18,202 |
| Class M | 2,803 |
| Class C(a) | 4,149 |
| | $25,154 |
(a) When Class C shares are initially sold, FDC pays commissions from its own resources to financial intermediaries through which the sales are made.
Transfer Agent Fees. Fidelity Investments Institutional Operations Company, Inc., (FIIOC), an affiliate of the investment adviser, is the transfer, dividend disbursing and shareholder servicing agent for each class of the Fund. FIIOC receives account fees and asset-based fees that vary according to the account size and type of account of the shareholders of the respective classes of Class Z. FIIOC receives an asset-based fee of Class Z's average net assets. FIIOC pays for typesetting, printing and mailing of shareholder reports, except proxy statements.
For the period, transfer agent fees for each class were as follows:
| | Amount | % of Class-Level Average Net Assets(a) |
| Class A | $297,310 | .20 |
| Class M | 84,542 | .22 |
| Class C | 131,048 | .21 |
| Small Cap Growth | 2,537,765 | .17 |
| Class I | 577,449 | .18 |
| Class Z | 30,488 | .05 |
| | $3,658,602 | |
(a) Annualized
Accounting and Security Lending Fees. Fidelity Service Company, Inc. (FSC), an affiliate of the investment adviser, maintains the Fund's accounting records. The accounting fee is based on the level of average net assets for each month. Under a separate contract, FSC administers the security lending program. The security lending fee is based on the number and duration of lending transactions. For the period, the fees were equivalent to an annualized rate of .03%.
Brokerage Commissions. The Fund placed a portion of its portfolio transactions with brokerage firms which are affiliates of the investment adviser. Brokerage commissions are included in net realized gain (loss) and change in net unrealized appreciation (depreciation) in the Statement of Operations. The commissions paid to these affiliated firms were $109,460 for the period.
Interfund Lending Program. Pursuant to an Exemptive Order issued by the SEC, the Fund, along with other registered investment companies having management contracts with Fidelity Management & Research Company (FMR) or other affiliated entities of FMR, may participate in an interfund lending program. This program provides an alternative credit facility allowing the funds to borrow from, or lend money to, other participating affiliated funds. At period end, there were no interfund loans outstanding. The Fund's activity in this program during the period for which loans were outstanding was as follows:
| Borrower or Lender | Average Loan Balance | Weighted Average Interest Rate | Interest Expense |
| Borrower | $22,528,286 | 2.36% | $10,317 |
Interfund Trades. The Fund may purchase from or sell securities to other Fidelity Funds under procedures adopted by the Board. The procedures have been designed to ensure these interfund trades are executed in accordance with Rule 17a-7 of the 1940 Act. Interfund trades are included within the respective purchases and sales amounts shown in the Purchases and Sales of Investments note.
6. Committed Line of Credit.
The Fund participates with other funds managed by the investment adviser or an affiliate in a $4.25 billion credit facility (the "line of credit") to be utilized for temporary or emergency purposes to fund shareholder redemptions or for other short-term liquidity purposes. The Fund has agreed to pay commitment fees on its pro-rata portion of the line of credit, which amounted to $5,775 and is reflected in Miscellaneous expenses on the Statement of Operations. During the period, the Fund did not borrow on this line of credit.
7. Security Lending.
The Fund lends portfolio securities through a lending agent from time to time in order to earn additional income. For equity securities, a lending agent is used and may loan securities to certain qualified borrowers, including Fidelity Capital Markets (FCM), a broker-dealer affiliated with the Fund. On the settlement date of the loan, the Fund receives collateral (in the form of U.S. Treasury obligations, letters of credit and/or cash) against the loaned securities and maintains collateral in an amount not less than 100% of the market value of the loaned securities during the period of the loan. The market value of the loaned securities is determined at the close of business of the Fund and any additional required collateral is delivered to the Fund on the next business day. The Fund or borrower may terminate the loan at any time, and if the borrower defaults on its obligation to return the securities loaned because of insolvency or other reasons, the Fund may apply collateral received from the borrower against the obligation. The Fund may experience delays and costs in recovering the securities loaned. Any cash collateral received is invested in the Fidelity Securities Lending Cash Central Fund. The value of loaned securities and cash collateral at period end are disclosed on the Fund's Statement of Assets and Liabilities. The value of securities loaned to FCM at period end was $483,654. Security lending income represents the income earned on investing cash collateral, less rebates paid to borrowers and any lending agent fees associated with the loan, plus any premium payments received for lending certain types of securities. Security lending income is presented in the Statement of Operations as a component of income from Fidelity Central Funds, and includes $81,724 from securities loaned to FCM.
8. Expense Reductions.
Commissions paid to certain brokers with whom the investment adviser, or its affiliates, places trades on behalf of the Fund include an amount in addition to trade execution, which may be rebated back to the Fund to offset certain expenses. This amount totaled $73,911 for the period. In addition, through arrangements with the Fund's custodian, credits realized as a result of certain uninvested cash balances were used to reduce the Fund's expenses. During the period, these credits reduced the Fund's custody expenses by $2,253.
In addition, during the period the investment adviser reimbursed and/or waived a portion of fund-level operating expenses in the amount of $14,451.
9. Distributions to Shareholders.
Distributions to shareholders of each class were as follows:
| | Six months ended
January 31, 2019 | Year ended
July 31, 2018 |
| Distributions to shareholders | | |
| Class A | $34,685,069 | $– |
| Class M | 9,164,113 | – |
| Class C | 16,135,660 | – |
| Small Cap Growth | 350,367,749 | – |
| Class I | 71,811,488 | – |
| Class Z | 14,895,272 | – |
| Total | $497,059,351 | $– |
| From net realized gain | | |
| Class A | $– | $16,634,776 |
| Class M | – | 4,795,381 |
| Class C | – | 8,085,052 |
| Small Cap Growth | – | 173,515,943 |
| Class I | – | 31,458,120 |
| Class Z | – | 2,173,343 |
| Total | $– | $236,662,615 |
10. Share Transactions.
Share transactions for each class were as follows and may contain automatic conversions between classes or exchanges between affiliated funds:
| | Shares | Shares | Dollars | Dollars |
| | Six months ended January 31, 2019 | Year ended July 31, 2018(a) | Six months ended January 31, 2019 | Year ended July 31, 2018(a) |
| Class A | | | | |
| Shares sold | 991,767 | 3,599,713 | $23,907,273 | $88,330,995 |
| Reinvestment of distributions | 1,321,081 | 737,094 | 34,480,374 | 16,518,361 |
| Shares redeemed | (2,047,033) | (2,350,141) | (47,311,769) | (58,390,054) |
| Net increase (decrease) | 265,815 | 1,986,666 | $11,075,878 | $46,459,302 |
| Class M | | | | |
| Shares sold | 209,312 | 577,387 | $4,876,068 | $13,785,910 |
| Reinvestment of distributions | 361,925 | 219,933 | 9,120,185 | 4,778,389 |
| Shares redeemed | (498,081) | (556,511) | (10,973,851) | (13,344,376) |
| Net increase (decrease) | 73,156 | 240,809 | $3,022,402 | $5,219,923 |
| Class C | | | | |
| Shares sold | 233,988 | 1,485,229 | $4,882,549 | $32,475,020 |
| Reinvestment of distributions | 689,073 | 394,045 | 15,944,303 | 7,927,935 |
| Shares redeemed | (945,390) | (1,132,670) | (19,882,446) | (25,169,389) |
| Net increase (decrease) | (22,329) | 746,604 | $944,406 | $15,233,566 |
| Small Cap Growth | | | | |
| Shares sold | 10,671,857 | 40,826,489 | $278,884,221 | $1,050,416,894 |
| Reinvestment of distributions | 12,256,590 | 7,124,344 | 334,955,420 | 166,042,374 |
| Shares redeemed | (25,496,950)(b) | (31,622,132)(c) | (639,506,637)(b) | (815,066,882)(c) |
| Net increase (decrease) | (2,568,503) | 16,328,701 | $(25,666,996) | $401,392,386 |
| Class I | | | | |
| Shares sold | 2,854,531 | 14,717,864 | $74,688,398 | $373,830,212 |
| Reinvestment of distributions | 2,543,850 | 1,279,506 | 69,666,847 | 29,928,913 |
| Shares redeemed | (5,398,367) | (8,645,418) | (135,748,210) | (225,106,522) |
| Net increase (decrease) | 14 | 7,351,952 | $8,607,035 | $178,652,603 |
| Class Z | | | | |
| Shares sold | 1,860,564 | 4,877,377 | $45,532,142 | $125,972,662 |
| Reinvestment of distributions | 395,743 | 72,161 | 10,820,866 | 1,697,869 |
| Shares redeemed | (955,250) | (1,090,733) | (23,673,870) | (28,900,593) |
| Net increase (decrease) | 1,301,057 | 3,858,805 | $32,679,138 | $98,769,938 |
(a) Share transactions for Class Z are for the period February 1, 2017 (commencement of sale of shares) to July 31, 2018.
(b) Amount includes in-kind redemptions (see the Unaffiliated Redemptions In-Kind note for additional details).
(c) Amount includes in-kind redemptions (see the Prior Fiscal Year Redemptions In-Kind note for additional details).
11. Other.
The Fund's organizational documents provide former and current trustees and officers with a limited indemnification against liabilities arising in connection with the performance of their duties to the Fund. In the normal course of business, the Fund may also enter into contracts that provide general indemnifications. The Fund's maximum exposure under these arrangements is unknown as this would be dependent on future claims that may be made against the Fund. The risk of material loss from such claims is considered remote.
Shareholder Expense Example
As a shareholder of the Fund, you incur two types of costs: (1) transaction costs, including sales charges (loads) on purchase payments or redemption proceeds, and (2) ongoing costs, including management fees, distribution and/or service (12b-1) fees and other Fund expenses. This Example is intended to help you understand your ongoing costs (in dollars) of investing in the Fund and to compare these costs with the ongoing costs of investing in other mutual funds.
The Example is based on an investment of $1,000 invested at the beginning of the period and held for the entire period (August 1, 2018 to January 31, 2019).
Actual Expenses
The first line of the accompanying table for each class of the Fund provides information about actual account values and actual expenses. You may use the information in this line, together with the amount you invested, to estimate the expenses that you paid over the period. Simply divide your account value by $1,000.00 (for example, an $8,600 account value divided by $1,000.00 = 8.6), then multiply the result by the number in the first line for a class of the Fund under the heading entitled "Expenses Paid During Period" to estimate the expenses you paid on your account during this period. In addition, the Fund, as a shareholder in the underlying Fidelity Central Funds, will indirectly bear its pro-rata share of the fees and expenses incurred by the underlying Fidelity Central Funds. These fees and expenses are not included in the Fund's annualized expense ratio used to calculate the expense estimate in the table below.
Hypothetical Example for Comparison Purposes
The second line of the accompanying table for each class of the Fund provides information about hypothetical account values and hypothetical expenses based on a Class' actual expense ratio and an assumed rate of return of 5% per year before expenses, which is not the Class' actual return. The hypothetical account values and expenses may not be used to estimate the actual ending account balance or expenses you paid for the period. You may use this information to compare the ongoing costs of investing in the Fund and other funds. To do so, compare this 5% hypothetical example with the 5% hypothetical examples that appear in the shareholder reports of the other funds. In addition, the Fund, as a shareholder in the underlying Fidelity Central Funds, will indirectly bear its pro-rata share of the fees and expenses incurred by the underlying Fidelity Central Funds. These fees and expenses are not included in the Fund's annualized expense ratio used to calculate the expense estimate in the table below.
Please note that the expenses shown in the table are meant to highlight your ongoing costs only and do not reflect any transaction costs. Therefore, the second line of the table is useful in comparing ongoing costs only, and will not help you determine the relative total costs of owning different funds. In addition, if these transactional costs were included, your costs would have been higher.
| | Annualized Expense Ratio-A | Beginning
Account Value
August 1, 2018 | Ending
Account Value
January 31, 2019 | Expenses Paid
During Period-B
August 1, 2018
to January 31, 2019 |
| Class A | 1.32% | | | |
| Actual | | $1,000.00 | $925.80 | $6.41 |
| Hypothetical-C | | $1,000.00 | $1,018.55 | $6.72 |
| Class M | 1.59% | | | |
| Actual | | $1,000.00 | $924.70 | $7.71 |
| Hypothetical-C | | $1,000.00 | $1,017.19 | $8.08 |
| Class C | 2.08% | | | |
| Actual | | $1,000.00 | $922.60 | $10.08 |
| Hypothetical-C | | $1,000.00 | $1,014.72 | $10.56 |
| Small Cap Growth | 1.04% | | | |
| Actual | | $1,000.00 | $927.40 | $5.05 |
| Hypothetical-C | | $1,000.00 | $1,019.96 | $5.30 |
| Class I | 1.05% | | | |
| Actual | | $1,000.00 | $927.40 | $5.10 |
| Hypothetical-C | | $1,000.00 | $1,019.91 | $5.35 |
| Class Z | .92% | | | |
| Actual | | $1,000.00 | $928.00 | $4.47 |
| Hypothetical-C | | $1,000.00 | $1,020.57 | $4.69 |
A Annualized expense ratio reflects expenses net of applicable fee waivers.
B Expenses are equal to each Class' annualized expense ratio, multiplied by the average account value over the period, multiplied by 184/365 (to reflect the one-half year period).
C 5% return per year before expenses
Board Approval of Investment Advisory Contracts and Management Fees
Fidelity Small Cap Growth Fund
Each year, the Board of Trustees, including the Independent Trustees (together, the Board), votes on the renewal of the management contract with Fidelity Management & Research Company (FMR) and the sub-advisory agreements (together, the Advisory Contracts) for the fund. FMR and the sub-advisers are referred to herein as the Investment Advisers. The Board, assisted by the advice of fund counsel and Independent Trustees' counsel, requests and considers a broad range of information relevant to the renewal of the Advisory Contracts throughout the year.
The Board meets regularly and, at each of its meetings, covers an extensive agenda of topics and materials and considers factors that are relevant to its annual consideration of the renewal of the fund's Advisory Contracts, including the services and support provided to the fund and its shareholders. The Board has established various standing committees (Committees), each composed of and chaired by Independent Trustees with varying backgrounds, to which the Board has assigned specific subject matter responsibilities in order to enhance effective decision-making by the Board. The Board, acting directly and through its Committees, requests and receives information concerning the annual consideration of the renewal of the fund's Advisory Contracts. The Board also meets as needed to review matters specifically related to the Board's annual consideration of the renewal of the Advisory Contracts. Members of the Board may also meet with trustees of other Fidelity funds through joint ad hoc committees to discuss certain matters relevant to all of the Fidelity funds.
At its January 2019 meeting, the Board unanimously determined to renew the fund's Advisory Contracts. In reaching its determination, the Board considered all factors it believed relevant, including (i) the nature, extent, and quality of the services to be provided to the fund and its shareholders (including the investment performance of the fund); (ii) the competitiveness of the fund's management fee and total expense ratio relative to peer funds; (iii) the total costs of the services to be provided by and the profits to be realized by Fidelity from its relationships with the fund; and (iv) the extent to which, if any, economies of scale exist and would be realized as the fund grows, and whether any economies of scale are appropriately shared with fund shareholders.
In considering whether to renew the Advisory Contracts for the fund, the Board reached a determination, with the assistance of fund counsel and Independent Trustees' counsel and through the exercise of its business judgment, that the renewal of the Advisory Contracts was in the best interests of the fund and its shareholders and that the compensation payable under the Advisory Contracts was fair and reasonable. The Board's decision to renew the Advisory Contracts was not based on any single factor, but rather was based on a comprehensive consideration of all the information provided to the Board at its meetings throughout the year. The Board, in reaching its determination to renew the Advisory Contracts, was aware that shareholders of the fund have a broad range of investment choices available to them, including a wide choice among funds offered by Fidelity's competitors, and that the fund's shareholders, who have the opportunity to review and weigh the disclosure provided by the fund in its prospectus and other public disclosures, have chosen to invest in this fund, which is part of the Fidelity family of funds.
Nature, Extent, and Quality of Services Provided. The Board considered Fidelity's staffing as it relates to the fund, including the backgrounds of investment personnel of Fidelity, and also considered the fund's investment objective, strategies, and related investment philosophy. The Independent Trustees also had discussions with senior management of Fidelity's investment operations and investment groups. The Board considered the structure of the investment personnel compensation program and whether this structure provides appropriate incentives to act in the best interests of the fund. Additionally, the Board considered the portfolio managers' investments, if any, in the funds that they manage.
Resources Dedicated to Investment Management and Support Services. The Board and the Fund Oversight and Research Committees reviewed the general qualifications and capabilities of Fidelity's investment staff, including its size, education, experience, and resources, as well as Fidelity's approach to recruiting, training, managing, and compensating investment personnel. The Board noted that Fidelity has continued to increase the resources devoted to non-U.S. offices, including expansion of Fidelity's global investment organization. The Board also noted that Fidelity's analysts have extensive resources, tools and capabilities that allow them to conduct sophisticated quantitative and fundamental analysis, as well as credit analysis of issuers, counterparties and guarantors. Further, the Board considered that Fidelity's investment professionals have sufficient access to global information and data so as to provide competitive investment results over time, and that those professionals also have access to sophisticated tools that permit them to assess portfolio construction and risk and performance attribution characteristics continuously, as well as to transmit new information and research conclusions rapidly around the world. Additionally, in its deliberations, the Board considered Fidelity's trading, risk management, compliance, and technology and operations capabilities and resources, which are integral parts of the investment management process.
Shareholder and Administrative Services. The Board considered (i) the nature, extent, quality, and cost of advisory, administrative, and shareholder services performed by the Investment Advisers and their affiliates under the Advisory Contracts and under separate agreements covering transfer agency, pricing and bookkeeping, and securities lending services for the fund; (ii) the nature and extent of the supervision of third party service providers, principally custodians, subcustodians, and pricing vendors; and (iii) the resources devoted to, and the record of compliance with, the fund's compliance policies and procedures. The Board also reviewed the allocation of fund brokerage, including allocations to brokers affiliated with the Investment Advisers, the use of brokerage commissions to pay fund expenses, and the use of "soft" commission dollars to pay for research services.
The Board noted that the growth of fund assets over time across the complex allows Fidelity to reinvest in the development of services designed to enhance the value and convenience of the Fidelity funds as investment vehicles. These services include 24-hour access to account information and market information through telephone representatives and over the Internet, investor education materials and asset allocation tools, and the expanded availability of Fidelity Investor Centers.
The Board noted that it and the boards of certain other Fidelity funds had formed an ad hoc Committee on Transfer Agency Fees to review the variety of transfer agency fee structures throughout the industry and Fidelity's competitive positioning with respect to industry participants.
Investment in a Large Fund Family. The Board considered the benefits to shareholders of investing in a Fidelity fund, including the benefits of investing in a fund that is part of a large family of funds offering a variety of investment disciplines and providing a large variety of mutual fund investor services. The Board noted that Fidelity had taken, or had made recommendations that resulted in the Fidelity funds taking, a number of actions over the previous year that benefited particular funds, including: (i) continuing to dedicate additional resources to Fidelity's investment research process, which includes meetings with management of issuers of securities in which the funds invest, and to the support of the senior management team that oversees asset management; (ii) continuing efforts to enhance Fidelity's global research capabilities; (iii) launching new funds and making other enhancements to meet client needs; (iv) launching new share classes of existing funds; (v) eliminating purchase minimums and broadening eligibility requirements for certain funds and share classes; (vi) reducing management fees and total expenses for certain growth equity funds and index funds; (vii) lowering expense caps for certain existing funds and classes, and converting certain voluntary expense caps to contractual caps, to reduce expenses borne by shareholders; (viii) eliminating short-term redemption fees for funds that had such fees; (ix) rationalizing product lines and gaining increased efficiencies from fund mergers and share class consolidations; (x) continuing to develop, acquire and implement systems and technology to improve services to the funds and shareholders, strengthen information security, and increase efficiency; and (xi) continuing to implement enhancements to further strengthen Fidelity's product line to increase investors' probability of success in achieving their investment goals, including retirement income goals.
Investment Performance. The Board considered whether the fund has operated in accordance with its investment objective, as well as its record of compliance with its investment restrictions and its performance history. The fund had portfolio manager changes in February 2018 and September 2018. The Board will continue to monitor closely the fund's performance, taking into account the portfolio manager changes.
The Board took into account discussions that occur at Board meetings throughout the year with representatives of the Investment Advisers about fund investment performance. In this regard the Board noted that as part of regularly scheduled fund reviews and other reports to the Board on fund performance, the Board considers annualized return information for the fund for different time periods, measured against an appropriate securities market index ("benchmark index") and a peer group of funds with similar objectives ("peer group"), if any. In its evaluation of fund investment performance, the Board gave particular attention to information indicating changes in performance of certain Fidelity funds for specific time periods and discussed with the Investment Advisers the reasons for any overperformance or underperformance.
In addition to reviewing absolute and relative fund performance, the Independent Trustees periodically consider the appropriateness of fund performance metrics in evaluating the results achieved. In general, the Independent Trustees believe that fund performance should be evaluated based on net performance (after fees and expenses) of both the highest performing and lowest performing fund share classes, where applicable, compared to appropriate benchmark indices, over appropriate time periods that may include full market cycles, and compared to peer groups, as applicable, over the same periods, taking into account relevant factors including the following: general market conditions; issuer-specific information; and fund cash flows and other factors.
The Independent Trustees recognize that shareholders evaluate performance on a net basis over their own holding periods, for which one-, three-, and five-year periods are often used as a proxy. For this reason, the performance information reviewed by the Board also included net cumulative total return information for the fund and an appropriate benchmark index and peer group for the most recent one-, three-, and five-year periods ended June 30, 2018, as shown below. Returns are shown compared to the 25th percentile (top of box, 75% beaten) and 75th percentile (bottom of box, 25% beaten) of the peer universe.
Fidelity Small Cap Growth Fund
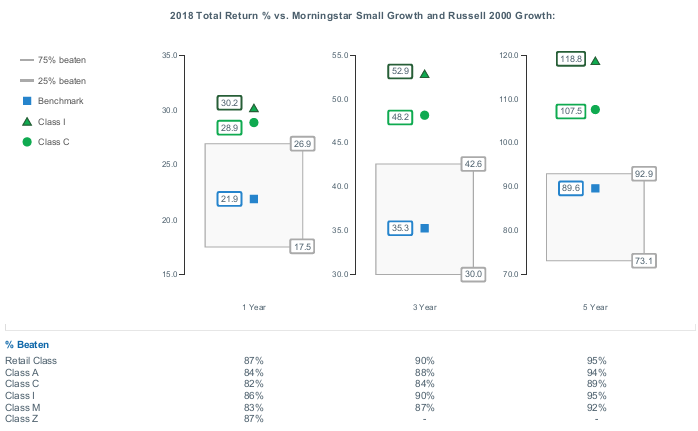
The Board also considered that the fund's management fee is subject to upward or downward adjustment depending upon whether, and to what extent, the fund's investment performance for the performance period (a rolling 36-month period) exceeds, or is exceeded by, a securities index, thus leading to a performance adjustment for the same period. The Board noted that the performance adjustment provides FMR with a strong economic incentive to seek to achieve superior long-term performance for the fund's shareholders and helps to more closely align the interests of FMR and the shareholders of the fund.
Based on its review, the Board concluded that the nature, extent, and quality of services provided to the fund under the Advisory Contracts should continue to benefit the shareholders of the fund.
Competitiveness of Management Fee and Total Expense Ratio. The Board considered the fund's management fee and total expense ratio compared to "mapped groups" of competitive funds and classes created for the purpose of facilitating the Trustees' competitive analysis of management fees and total expenses. Fidelity creates "mapped groups" by combining similar Lipper investment objective categories that have comparable investment mandates. Combining Lipper investment objective categories aids the Board's management fee and total expense ratio comparisons by broadening the competitive group used for comparison.
Management Fee. The Board considered two proprietary management fee comparisons for the 12-month periods (ended June 30 for 2018 and December 31 for prior periods) shown in basis points (BP) in the chart below. The group of Lipper funds used by the Board for management fee comparisons is referred to below as the "Total Mapped Group." The Total Mapped Group comparison focuses on a fund's standing in terms of gross management fees before expense reimbursements or caps, and without giving effect to the fund's performance adjustment, relative to the total universe of funds with comparable investment mandates, regardless of whether their management fee structures also are comparable. Funds with comparable investment mandates offer exposure to similar types of securities. Funds with comparable management fee structures have similar management fee contractual arrangements (
e.g., flat rate charged for advisory services, all-inclusive fee rate,
etc.). "TMG %" represents the percentage of funds in the Total Mapped Group that had management fees that were lower than the fund's. For example, a hypothetical TMG % of 20% would mean that 80% of the funds in the Total Mapped Group had higher, and 20% had lower, management fees than the fund. The fund's actual TMG %s and the number of funds in the Total Mapped Group are in the chart below. The "Asset-Size Peer Group" (ASPG) comparison focuses on a fund's standing relative to a subset of non-Fidelity funds within the Total Mapped Group that are similar in size and management fee structure without taking into account performance adjustments, if any. For example, if a fund is in the first quartile of the ASPG, the fund's management fee ranks in the least expensive or lowest 25% of funds in the ASPG. The ASPG represents at least 15% of the funds in the Total Mapped Group with comparable asset size and management fee structures, subject to a minimum of 50 funds (or all funds in the Total Mapped Group if fewer than 50). Additional information, such as the ASPG quartile in which the fund's management fee rate ranked and the impact of the fund's performance adjustment, is also included in the chart and was considered by the Board.
Fidelity Small Cap Growth Fund
The Board noted that the comparisons for 2015 and later reflect a revised Total Mapped Group that no longer includes funds with micro-cap objectives and that FMR believes this Total Mapped Group is a more appropriate comparison because the fund does not have a micro-cap objective.
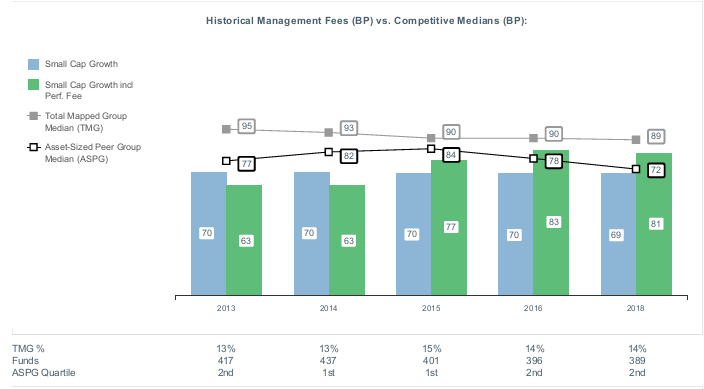
The Board noted that the fund's management fee rate ranked below the median of its Total Mapped Group and below the median of its ASPG for the 12-month period ended June 30, 2018. The Board also noted the effect of the fund's performance adjustment, if any, on the fund's management fee ranking.
The Board noted that it and the boards of other Fidelity funds formed an ad hoc Committee on Group Fee, which meets periodically, to conduct an in-depth review of the "group fee" component of the management fee of funds with such management fee structures. The Committee's focus included the mechanics of the group fee, the competitive landscape of group fee structures, Fidelity funds with no group fee component and investment products not included in group fee assets. The Board also considered that, for funds subject to the group fee, FMR agreed to voluntarily waive fees over a specified period of time in amounts designed to account for assets converted from certain funds to certain collective investment trusts.
The Board also noted that, in 2013, the ad hoc Committee on Management Fees was formed to conduct an in-depth review of the management fee rates of Fidelity's active equity mutual funds. The Committee focused on the following areas: (i) standard fee structures; (ii) research consumption and trading evolution; (iii) management fee competitiveness/profitability by category; and (iv) factors that drive institutional pricing.
Based on its review, the Board concluded that the fund's management fee is fair and reasonable in light of the services that the fund receives and the other factors considered.
Total Expense Ratio. In its review of each class's total expense ratio, the Board considered the fund's management fee rate as well as other fund or class expenses, as applicable, such as transfer agent fees, pricing and bookkeeping fees, fund-paid 12b-1 fees, and custodial, legal, and audit fees. The Board noted the impact of the fund's performance adjustment. The Board also noted that Fidelity may agree to waive fees and expenses from time to time, and the extent to which, if any, it has done so for the fund. As part of its review, the Board also considered the current and historical total expense ratios of each class of the fund compared to competitive fund median expenses. Each class of the fund is compared to those funds and classes in the Total Mapped Group (used by the Board for management fee comparisons) that have a similar sales load structure.
The Board noted that the total expense ratio of each of Class Z and the retail class ranked below the competitive median for the 12-month period ended June 30, 2018, and the total expense ratio of each of Class A, Class M, Class C, and Class I ranked above the competitive median for the 12-month period ended June 30, 2018. The Board considered that, in general, various factors can affect total expense ratios. The Board noted that the total expense ratio of Class A was above the competitive median because of positive performance fees. Excluding performance fees, the total expense ratio of Class A ranked below the median. The Board noted that the total expense ratio of Class M was above the competitive median primarily because of higher 12b-1 fees on Class M as compared to most competitor funds. Class M has a higher 12b-1 fee, but a lower front-end sales charge, than traditionally priced front-end sales charge classes. The Board considered that Class M is primarily sold load-waived to retirement plans and intermediary wrap programs where its 0.50% 12b-1 fee is comparable to competing no-load, higher 12b-1 fee classes designed specifically for retirement plans and wrap programs. The Board noted that the total expense ratio of Class C was above the competitive median primarily because of its 1.00% 12b-1 fee. The Board noted that, although Class I is categorized by Lipper as an institutional class, Class I has a significantly lower investment minimum than most other funds and classes categorized as institutional. As a result, FMR believes Class I is generally more comparable to retail funds and classes. The Board noted that the fund offers multiple classes, each of which has a different sales load and 12b-1 fee structure, and that the multiple structures are intended to offer a range of pricing options for the intermediary market. The Board also noted that the total expense ratios of the classes vary primarily by the level of their 12b-1 fees, although differences in transfer agent fees may also cause expenses to vary from class to class.
Fees Charged to Other Fidelity Clients. The Board also considered Fidelity fee structures and other information with respect to clients of Fidelity, such as other funds advised or subadvised by Fidelity, pension plan clients, and other institutional clients with similar mandates. The Board noted that a joint ad hoc committee created by it and the boards of other Fidelity funds periodically reviews and compares Fidelity's institutional investment advisory business with its business of providing services to the Fidelity funds and also noted the most recent findings of the committee. The Board noted that the committee's review included a consideration of the differences in services provided, fees charged, and costs incurred, as well as competition in the markets serving the different categories of clients.
Based on its review of total expense ratios and fees charged to other Fidelity clients, the Board concluded that the total expense ratio of each class of the fund was reasonable in light of the services that the fund and its shareholders receive and the other factors considered.
Costs of the Services and Profitability. The Board considered the revenues earned and the expenses incurred by Fidelity in conducting the business of developing, marketing, distributing, managing, administering and servicing the fund and servicing the fund's shareholders. The Board also considered the level of Fidelity's profits in respect of all the Fidelity funds.
On an annual basis, Fidelity presents to the Board information about the profitability of its relationships with the fund. Fidelity calculates profitability information for each fund, as well as aggregate profitability information for groups of Fidelity funds and all Fidelity funds, using a series of detailed revenue and cost allocation methodologies which originate with the books and records of Fidelity on which Fidelity's audited financial statements are based. The Audit Committee of the Board reviews any significant changes from the prior year's methodologies.
PricewaterhouseCoopers LLP (PwC), auditor to Fidelity and certain Fidelity funds, has been engaged annually by the Board as part of the Board's assessment of Fidelity's profitability analysis. PwC's engagement includes the review and assessment of the methodologies used by Fidelity in determining the revenues and expenses attributable to Fidelity's mutual fund business, and completion of agreed-upon procedures in respect of the mathematical accuracy of the fund profitability information and its conformity to established allocation methodologies. After considering PwC's reports issued under the engagement and information provided by Fidelity, the Board concluded that while other allocation methods may also be reasonable, Fidelity's profitability methodologies are reasonable in all material respects.
The Board also reviewed Fidelity's non-fund businesses and potential indirect benefits such businesses may have received as a result of their association with Fidelity's mutual fund business (i.e., fall-out benefits) as well as cases where Fidelity's affiliates may benefit from the fund's business. The Board noted that changes to fall-out benefits year-over-year reflect business developments at Fidelity's various businesses.
The Board considered the costs of the services provided by and the profits realized by Fidelity in connection with the operation of the fund and was satisfied that the profitability was not excessive.
Economies of Scale. The Board considered whether there have been economies of scale in respect of the management of the Fidelity funds, whether the Fidelity funds (including the fund) have appropriately benefited from any such economies of scale, and whether there is potential for realization of any further economies of scale. The Board considered the extent to which the fund will benefit from economies of scale as assets grow through increased services to the fund, through waivers or reimbursements, or through fee or expense ratio reductions. The Board also noted that a committee (the Economies of Scale Committee) created by it and the boards of other Fidelity funds periodically analyzes whether Fidelity attains economies of scale in respect of the management and servicing of the Fidelity funds, whether the Fidelity funds have appropriately benefited from such economies of scale, and whether there is potential for realization of any further economies of scale.
The Board recognized that the fund's management contract incorporates a "group fee" structure, which provides for lower group fee rates as total group assets increase, and for higher group fee rates as total group assets decrease (with "group assets" defined to include fund assets under FMR's management plus the assets of sector funds previously under FMR's management). FMR calculates the group fee rates based on a tiered asset "breakpoint" schedule that varies based on asset class. The Board considered that the group fee is designed to deliver the benefits of economies of scale to fund shareholders when total Fidelity fund assets increase, even if assets of any particular fund are unchanged or have declined, because some portion of Fidelity's costs are attributable to services provided to all Fidelity funds, and all funds benefit if those costs can be allocated among more assets. The Board concluded that, given the group fee structure, fund shareholders will benefit from lower management fees as group assets increase at the fund complex level, regardless of whether Fidelity achieves any such economies of scale.
The Board concluded, taking into account the analysis of the Economies of Scale Committee, that economies of scale, if any, are being appropriately shared between fund shareholders and Fidelity.
Additional Information Requested by the Board. In order to develop fully the factual basis for consideration of the Fidelity funds' advisory contracts, the Board requested and received additional information on certain topics, including: (i) fund performance trends, in particular the underperformance of certain funds, and Fidelity's long-term strategies for certain funds; (ii) Fidelity's fund profitability methodology, profitability trends for certain funds, and the impact of certain factors on fund profitability results; (iii) metrics for evaluating index fund and ETF performance and information about ETF trading characteristics; (iv) the methodology with respect to the evaluation of competitive fund data and peer group classifications and fee comparisons; (v) the expense structures for different funds and classes; (vi) information regarding other accounts managed by Fidelity, including collective investment trusts; and (vii) Fidelity's philosophies and strategies for evaluating funds and classes with lower or declining asset levels.
Based on its evaluation of all of the conclusions noted above, and after considering all factors it believed relevant, the Board concluded that the advisory fee arrangements are fair and reasonable, and that the fund's Advisory Contracts should be renewed.
SCP-SANN-0319
1.803700.114
Fidelity® Small Cap Growth K6 Fund
Semi-Annual Report January 31, 2019 |
|
Beginning on January 1, 2021, as permitted by regulations adopted by the Securities and Exchange Commission, paper copies of a fund’s shareholder reports will no longer be sent by mail, unless you specifically request paper copies of the reports from the fund or from your financial intermediary, such as a financial advisor, broker-dealer or bank. Instead, the reports will be made available on a website, and you will be notified by mail each time a report is posted and provided with a website link to access the report.
If you already elected to receive shareholder reports electronically, you will not be affected by this change and you need not take any action. You may elect to receive shareholder reports and other communications from a fund electronically, by contacting your financial intermediary. For Fidelity customers, visit Fidelity's web site or call Fidelity using the contact information listed below.
You may elect to receive all future reports in paper free of charge. If you wish to continue receiving paper copies of your shareholder reports, you may contact your financial intermediary or, if you are a Fidelity customer, visit Fidelity’s website, or call Fidelity at the applicable toll-free number listed below. Your election to receive reports in paper will apply to all funds held with the fund complex/your financial intermediary.
| Account Type | Website | Phone Number |
| Brokerage, Mutual Fund, or Annuity Contracts: | fidelity.com/mailpreferences | 1-800-343-3548 |
| Employer Provided Retirement Accounts: | netbenefits.fidelity.com/preferences (choose 'no' under Required Disclosures to continue to print) | 1-800-343-0860 |
| Advisor Sold Accounts Serviced Through Your Financial Intermediary: | Contact Your Financial Intermediary | Your Financial Intermediary's phone number |
| Advisor Sold Accounts Serviced by Fidelity: | institutional.fidelity.com | 1-877-208-0098 |
Contents
To view a fund's proxy voting guidelines and proxy voting record for the 12-month period ended June 30, visit http://www.fidelity.com/proxyvotingresults or visit the Securities and Exchange Commission's (SEC) web site at http://www.sec.gov.
You may also call 1-800-835-5092 to request a free copy of the proxy voting guidelines.
Standard & Poor's, S&P and S&P 500 are registered service marks of The McGraw-Hill Companies, Inc. and have been licensed for use by Fidelity Distributors Corporation.
Other third-party marks appearing herein are the property of their respective owners.
All other marks appearing herein are registered or unregistered trademarks or service marks of FMR LLC or an affiliated company. © 2019 FMR LLC. All rights reserved.
This report and the financial statements contained herein are submitted for the general information of the shareholders of the Fund. This report is not authorized for distribution to prospective investors in the Fund unless preceded or accompanied by an effective prospectus.
A fund files its complete schedule of portfolio holdings with the SEC for the first and third quarters of each fiscal year on Form N-Q. Forms N-Q are available on the SEC’s web site at http://www.sec.gov. A fund's Forms N-Q may be reviewed and copied at the SEC’s Public Reference Room in Washington, DC. Information regarding the operation of the SEC's Public Reference Room may be obtained by calling 1-800-SEC-0330.
For a complete list of a fund's portfolio holdings, view the most recent holdings listing, semiannual report, or annual report on Fidelity's web site at http://www.fidelity.com, http://www.institutional.fidelity.com, or http://www.401k.com, as applicable.
NOT FDIC INSURED •MAY LOSE VALUE •NO BANK GUARANTEE
Neither the Fund nor Fidelity Distributors Corporation is a bank.
Investment Summary (Unaudited)
Top Ten Stocks as of January 31, 2019
| | % of fund's net assets |
| Gores Holdings II, Inc. | 1.8 |
| CarGurus, Inc. Class A | 1.8 |
| Masimo Corp. | 1.5 |
| Planet Fitness, Inc. | 1.3 |
| Molina Healthcare, Inc. | 1.3 |
| HubSpot, Inc. | 1.2 |
| Loxo Oncology, Inc. | 1.2 |
| Insulet Corp. | 1.2 |
| The Children's Place Retail Stores, Inc. | 1.1 |
| Entegris, Inc. | 1.1 |
| | 13.5 |
Top Five Market Sectors as of January 31, 2019
| | % of fund's net assets |
| Health Care | 26.7 |
| Information Technology | 19.3 |
| Industrials | 13.5 |
| Consumer Discretionary | 13.2 |
| Financials | 10.0 |
Asset Allocation (% of fund's net assets)
| As of January 31, 2019* |
| | Stocks | 97.9% |
| | Convertible Securities | 0.7% |
| | Short-Term Investments and Net Other Assets (Liabilities) | 1.4% |

* Foreign investments - 9.5%
Schedule of Investments January 31, 2019 (Unaudited)
Showing Percentage of Net Assets
| Common Stocks - 97.9% | | | |
| | | Shares | Value |
| COMMUNICATION SERVICES - 6.9% | | | |
| Diversified Telecommunication Services - 0.5% | | | |
| Iridium Communications, Inc. (a) | | 183,113 | $3,548,730 |
| Entertainment - 0.7% | | | |
| World Wrestling Entertainment, Inc. Class A | | 57,300 | 4,718,082 |
| Interactive Media & Services - 2.3% | | | |
| ANGI Homeservices, Inc. Class A (a) | | 221,598 | 3,767,166 |
| CarGurus, Inc. Class A (a) | | 287,287 | 12,287,265 |
| | | | 16,054,431 |
| Media - 2.2% | | | |
| Gray Television, Inc. (a) | | 266,951 | 4,460,751 |
| Nexstar Broadcasting Group, Inc. Class A | | 79,309 | 6,619,922 |
| The New York Times Co. Class A | | 184,882 | 4,753,316 |
| | | | 15,833,989 |
| Wireless Telecommunication Services - 1.2% | | | |
| Boingo Wireless, Inc. (a) | | 107,118 | 2,583,686 |
| Shenandoah Telecommunications Co. | | 124,263 | 5,918,647 |
| | | | 8,502,333 |
|
| TOTAL COMMUNICATION SERVICES | | | 48,657,565 |
|
| CONSUMER DISCRETIONARY - 13.2% | | | |
| Diversified Consumer Services - 3.1% | | | |
| Arco Platform Ltd. Class A | | 166,759 | 4,215,668 |
| Bright Horizons Family Solutions, Inc. (a) | | 31,501 | 3,647,501 |
| Grand Canyon Education, Inc. (a) | | 74,692 | 6,941,874 |
| Laureate Education, Inc. Class A (a) | | 346,626 | 5,546,016 |
| ServiceMaster Global Holdings, Inc. (a) | | 43,600 | 1,699,964 |
| | | | 22,051,023 |
| Hotels, Restaurants & Leisure - 2.9% | | | |
| Dunkin' Brands Group, Inc. | | 59,293 | 4,055,048 |
| Eldorado Resorts, Inc. (a) | | 60,261 | 2,809,368 |
| Hilton Grand Vacations, Inc. (a) | | 132,561 | 4,021,901 |
| Planet Fitness, Inc. (a) | | 162,192 | 9,394,161 |
| | | | 20,280,478 |
| Household Durables - 2.4% | | | |
| Cavco Industries, Inc. (a) | | 41,673 | 6,929,803 |
| Helen of Troy Ltd. (a) | | 37,460 | 4,346,858 |
| Skyline Champion Corp. | | 244,610 | 4,417,657 |
| Turtle Beach Corp. (a)(b) | | 99,100 | 1,475,599 |
| | | | 17,169,917 |
| Internet & Direct Marketing Retail - 2.1% | | | |
| Etsy, Inc. (a) | | 107,390 | 5,868,864 |
| Gaia, Inc. Class A (a) | | 198,923 | 2,339,334 |
| Stamps.com, Inc. (a) | | 36,375 | 6,768,660 |
| | | | 14,976,858 |
| Multiline Retail - 0.4% | | | |
| Ollie's Bargain Outlet Holdings, Inc. (a) | | 31,507 | 2,462,902 |
| Specialty Retail - 2.0% | | | |
| Five Below, Inc. (a) | | 49,494 | 6,123,893 |
| The Children's Place Retail Stores, Inc. | | 81,165 | 7,853,525 |
| | | | 13,977,418 |
| Textiles, Apparel & Luxury Goods - 0.3% | | | |
| Columbia Sportswear Co. | | 23,120 | 2,062,073 |
|
| TOTAL CONSUMER DISCRETIONARY | | | 92,980,669 |
|
| CONSUMER STAPLES - 4.3% | | | |
| Food & Staples Retailing - 1.9% | | | |
| BJ's Wholesale Club Holdings, Inc. | | 261,163 | 6,871,199 |
| Performance Food Group Co. (a) | | 178,763 | 6,106,544 |
| | | | 12,977,743 |
| Food Products - 1.6% | | | |
| Darling International, Inc. (a) | | 97,169 | 2,066,785 |
| Nomad Foods Ltd. (a) | | 220,472 | 4,041,252 |
| Post Holdings, Inc. (a) | | 55,344 | 5,137,030 |
| | | | 11,245,067 |
| Household Products - 0.8% | | | |
| Central Garden & Pet Co. (a)(b) | | 77,683 | 3,045,950 |
| Central Garden & Pet Co. Class A (non-vtg.) (a) | | 75,652 | 2,694,724 |
| | | | 5,740,674 |
|
| TOTAL CONSUMER STAPLES | | | 29,963,484 |
|
| ENERGY - 0.8% | | | |
| Oil, Gas & Consumable Fuels - 0.8% | | | |
| PDC Energy, Inc. (a) | | 50,606 | 1,648,237 |
| Renewable Energy Group, Inc. (a) | | 92,451 | 2,671,834 |
| Whiting Petroleum Corp. (a) | | 45,999 | 1,316,951 |
| | | | 5,637,022 |
| FINANCIALS - 10.0% | | | |
| Banks - 1.4% | | | |
| First Citizens Bancshares, Inc. | | 14,884 | 6,065,677 |
| Popular, Inc. | | 62,873 | 3,433,495 |
| | | | 9,499,172 |
| Capital Markets - 2.6% | | | |
| Apollo Global Management LLC Class A | | 106,294 | 3,112,288 |
| Cboe Global Markets, Inc. | | 29,100 | 2,714,157 |
| Hamilton Lane, Inc. Class A | | 18,105 | 656,668 |
| LPL Financial | | 50,115 | 3,526,593 |
| Morningstar, Inc. | | 46,588 | 5,783,900 |
| Oaktree Capital Group LLC Class A | | 69,300 | 2,828,826 |
| | | | 18,622,432 |
| Consumer Finance - 1.2% | | | |
| First Cash Financial Services, Inc. | | 44,800 | 3,692,864 |
| Green Dot Corp. Class A (a) | | 66,299 | 4,907,452 |
| | | | 8,600,316 |
| Diversified Financial Services - 1.8% | | | |
| Gores Holdings II, Inc. (a) | | 1,234,007 | 12,907,715 |
| Insurance - 1.5% | | | |
| eHealth, Inc. (a) | | 21,607 | 1,321,484 |
| Enstar Group Ltd. (a) | | 15,475 | 2,754,550 |
| Primerica, Inc. | | 54,649 | 6,140,908 |
| | | | 10,216,942 |
| Thrifts & Mortgage Finance - 1.5% | | | |
| Essent Group Ltd. (a) | | 122,993 | 4,888,972 |
| LendingTree, Inc. (a) | | 20,056 | 5,943,395 |
| | | | 10,832,367 |
|
| TOTAL FINANCIALS | | | 70,678,944 |
|
| HEALTH CARE - 26.7% | | | |
| Biotechnology - 10.4% | | | |
| Abeona Therapeutics, Inc. (a) | | 111,998 | 760,466 |
| Acceleron Pharma, Inc. (a) | | 84,056 | 3,563,974 |
| Acorda Therapeutics, Inc. (a) | | 56,402 | 937,965 |
| Aduro Biotech, Inc. (a) | | 122,382 | 364,698 |
| Alder Biopharmaceuticals, Inc. (a) | | 189,345 | 2,665,978 |
| Allakos, Inc. (a)(b) | | 36,300 | 1,450,185 |
| AnaptysBio, Inc. (a) | | 34,642 | 2,297,457 |
| Arena Pharmaceuticals, Inc. (a) | | 48,277 | 2,219,294 |
| Argenx SE ADR (a) | | 40,968 | 4,347,114 |
| Array BioPharma, Inc. (a) | | 282,009 | 5,265,108 |
| Ascendis Pharma A/S sponsored ADR (a) | | 65,716 | 4,696,065 |
| Atara Biotherapeutics, Inc. (a) | | 75,636 | 2,874,168 |
| Audentes Therapeutics, Inc. (a) | | 59,733 | 1,481,378 |
| Blueprint Medicines Corp. (a) | | 47,038 | 3,390,969 |
| Crinetics Pharmaceuticals, Inc. (a) | | 23,490 | 617,317 |
| Dynavax Technologies Corp. (a)(b) | | 98,937 | 1,090,286 |
| FibroGen, Inc. (a) | | 97,186 | 5,515,306 |
| Five Prime Therapeutics, Inc. (a) | | 40,690 | 457,763 |
| Global Blood Therapeutics, Inc. (a) | | 79,926 | 3,829,255 |
| Gritstone Oncology, Inc. | | 67,772 | 867,482 |
| Heron Therapeutics, Inc. (a) | | 106,266 | 2,858,555 |
| Immunomedics, Inc. (a) | | 133,385 | 1,972,764 |
| Kezar Life Sciences, Inc. | | 46,725 | 836,845 |
| Loxo Oncology, Inc. (a) | | 36,249 | 8,504,015 |
| Mirati Therapeutics, Inc. (a) | | 46,630 | 3,081,310 |
| Sarepta Therapeutics, Inc. (a) | | 37,350 | 5,218,169 |
| Savara, Inc. (a) | | 58,112 | 441,070 |
| Spark Therapeutics, Inc. (a) | | 33,280 | 1,591,450 |
| | | | 73,196,406 |
| Health Care Equipment & Supplies - 7.9% | | | |
| Axonics Modulation Technologies, Inc. (a)(b) | | 137,025 | 2,000,565 |
| Cerus Corp. (a) | | 96,499 | 575,134 |
| CONMED Corp. | | 46,412 | 3,265,084 |
| Glaukos Corp. (a) | | 57,068 | 3,640,368 |
| Hill-Rom Holdings, Inc. | | 36,750 | 3,675,735 |
| Insulet Corp. (a) | | 104,181 | 8,458,455 |
| Integer Holdings Corp. (a) | | 46,633 | 3,776,807 |
| Integra LifeSciences Holdings Corp. (a) | | 39,793 | 1,884,596 |
| iRhythm Technologies, Inc. (a) | | 54,393 | 4,623,405 |
| Masimo Corp. (a) | | 84,246 | 10,479,360 |
| Merit Medical Systems, Inc. (a) | | 76,284 | 4,312,335 |
| Novocure Ltd. (a) | | 118,537 | 5,808,313 |
| Quanterix Corp. (a) | | 139,343 | 2,934,564 |
| | | | 55,434,721 |
| Health Care Providers & Services - 2.9% | | | |
| Chemed Corp. | | 12,616 | 3,758,811 |
| G1 Therapeutics, Inc. (a) | | 90,204 | 1,929,464 |
| LHC Group, Inc. (a) | | 51,055 | 5,398,045 |
| Molina Healthcare, Inc. (a) | | 69,746 | 9,274,823 |
| R1 RCM, Inc. (a) | | 33,286 | 270,282 |
| | | | 20,631,425 |
| Health Care Technology - 2.4% | | | |
| HMS Holdings Corp. (a) | | 209,806 | 6,292,082 |
| HTG Molecular Diagnostics (a) | | 87,582 | 183,922 |
| Inovalon Holdings, Inc. Class A (a)(b) | | 338,560 | 4,838,022 |
| Teladoc Health, Inc. (a)(b) | | 87,331 | 5,606,650 |
| | | | 16,920,676 |
| Life Sciences Tools & Services - 1.3% | | | |
| ICON PLC (a) | | 49,279 | 6,893,147 |
| Morphosys AG (a) | | 21,185 | 2,286,619 |
| | | | 9,179,766 |
| Pharmaceuticals - 1.8% | | | |
| Aclaris Therapeutics, Inc. (a) | | 92,023 | 641,400 |
| Aerie Pharmaceuticals, Inc. (a) | | 42,438 | 1,995,435 |
| Akcea Therapeutics, Inc. (a)(b) | | 52,533 | 1,396,327 |
| InflaRx NV (a)(b) | | 39,400 | 1,291,926 |
| Nektar Therapeutics (a) | | 47,211 | 1,998,914 |
| The Medicines Company (a) | | 54,806 | 1,266,567 |
| Theravance Biopharma, Inc. (a) | | 39,574 | 1,030,903 |
| Xeris Pharmaceuticals, Inc. | | 67,556 | 937,677 |
| Zogenix, Inc. (a) | | 48,260 | 2,111,375 |
| | | | 12,670,524 |
|
| TOTAL HEALTH CARE | | | 188,033,518 |
|
| INDUSTRIALS - 13.5% | | | |
| Aerospace & Defense - 2.4% | | | |
| BWX Technologies, Inc. | | 66,595 | 3,091,340 |
| HEICO Corp. Class A | | 69,111 | 4,839,843 |
| Moog, Inc. Class A | | 51,167 | 4,577,911 |
| Teledyne Technologies, Inc. (a) | | 20,658 | 4,631,937 |
| | | | 17,141,031 |
| Air Freight & Logistics - 0.4% | | | |
| Forward Air Corp. | | 44,229 | 2,588,723 |
| Airlines - 0.3% | | | |
| SkyWest, Inc. | | 41,577 | 2,118,348 |
| Commercial Services & Supplies - 0.7% | | | |
| Copart, Inc. (a) | | 102,339 | 5,181,424 |
| Construction & Engineering - 1.8% | | | |
| Argan, Inc. | | 80,762 | 3,409,772 |
| Jacobs Engineering Group, Inc. | | 79,957 | 5,181,214 |
| MasTec, Inc. (a) | | 98,600 | 4,375,868 |
| | | | 12,966,854 |
| Electrical Equipment - 0.9% | | | |
| Generac Holdings, Inc. (a) | | 114,100 | 6,039,313 |
| Industrial Conglomerates - 0.8% | | | |
| ITT, Inc. | | 112,295 | 5,902,225 |
| Machinery - 2.5% | | | |
| AGCO Corp. | | 72,706 | 4,667,725 |
| Allison Transmission Holdings, Inc. | | 109,078 | 5,308,826 |
| Luxfer Holdings PLC sponsored | | 147,297 | 2,932,683 |
| Toro Co. | | 57,500 | 3,421,250 |
| Woodward, Inc. | | 13,352 | 1,213,029 |
| | | | 17,543,513 |
| Professional Services - 3.0% | | | |
| Asgn, Inc. (a) | | 82,599 | 5,202,911 |
| CBIZ, Inc. (a) | | 62,080 | 1,216,768 |
| Exponent, Inc. | | 105,308 | 5,261,188 |
| FTI Consulting, Inc. (a) | | 34,842 | 2,380,405 |
| Insperity, Inc. | | 68,912 | 7,351,532 |
| | | | 21,412,804 |
| Road & Rail - 0.7% | | | |
| Genesee & Wyoming, Inc. Class A (a) | | 58,100 | 4,562,012 |
|
| TOTAL INDUSTRIALS | | | 95,456,247 |
|
| INFORMATION TECHNOLOGY - 18.6% | | | |
| Electronic Equipment & Components - 2.2% | | | |
| Fabrinet | | 125,200 | 7,116,368 |
| SYNNEX Corp. | | 29,800 | 2,883,448 |
| Zebra Technologies Corp. Class A (a) | | 31,082 | 5,395,835 |
| | | | 15,395,651 |
| IT Services - 4.1% | | | |
| Booz Allen Hamilton Holding Corp. Class A | | 43,500 | 2,137,155 |
| Elastic NV (b) | | 26,100 | 2,218,500 |
| EPAM Systems, Inc. (a) | | 26,510 | 3,750,635 |
| Euronet Worldwide, Inc. (a) | | 33,179 | 3,815,917 |
| EVO Payments, Inc. Class A | | 79,389 | 1,996,633 |
| GoDaddy, Inc. (a) | | 68,554 | 4,704,861 |
| Interxion Holding N.V. (a) | | 34,315 | 2,060,273 |
| Okta, Inc. (a) | | 30,448 | 2,509,829 |
| WEX, Inc. (a) | | 33,167 | 5,350,832 |
| | | | 28,544,635 |
| Semiconductors & Semiconductor Equipment - 1.1% | | | |
| Entegris, Inc. | | 232,445 | 7,682,307 |
| Software - 11.2% | | | |
| 2U, Inc. (a)(b) | | 125,108 | 7,112,390 |
| Alarm.com Holdings, Inc. (a) | | 46,000 | 2,894,780 |
| Black Knight, Inc. (a) | | 79,293 | 3,900,423 |
| Cardlytics, Inc. (a) | | 322,081 | 5,633,197 |
| Cornerstone OnDemand, Inc. (a) | | 68,600 | 3,933,524 |
| CyberArk Software Ltd. (a) | | 29,500 | 2,588,920 |
| DocuSign, Inc. | | 21,400 | 1,058,230 |
| Everbridge, Inc. (a) | | 41,900 | 2,591,934 |
| Five9, Inc. (a) | | 137,177 | 7,013,860 |
| HubSpot, Inc. (a) | | 55,169 | 8,733,804 |
| New Relic, Inc. (a) | | 18,938 | 1,925,048 |
| Parametric Technology Corp. (a) | | 40,300 | 3,417,037 |
| Pluralsight, Inc. (b) | | 251,033 | 7,525,969 |
| PROS Holdings, Inc. (a) | | 72,559 | 2,510,541 |
| Rapid7, Inc. (a) | | 18,387 | 738,790 |
| RingCentral, Inc. (a) | | 55,311 | 5,112,949 |
| ShotSpotter, Inc. (a) | | 69,675 | 3,355,548 |
| The Trade Desk, Inc. (a) | | 44,915 | 6,408,472 |
| Zuora, Inc. | | 125,457 | 2,714,889 |
| | | | 79,170,305 |
|
| TOTAL INFORMATION TECHNOLOGY | | | 130,792,898 |
|
| MATERIALS - 2.9% | | | |
| Chemicals - 2.0% | | | |
| Olin Corp. | | 179,000 | 4,226,190 |
| Orion Engineered Carbons SA | | 204,139 | 5,632,195 |
| The Chemours Co. LLC | | 108,009 | 3,861,322 |
| | | | 13,719,707 |
| Containers & Packaging - 0.6% | | | |
| Aptargroup, Inc. | | 26,598 | 2,636,394 |
| Avery Dennison Corp. | | 16,748 | 1,749,329 |
| | | | 4,385,723 |
| Paper & Forest Products - 0.3% | | | |
| Neenah, Inc. | | 31,829 | 2,217,526 |
| Quintis Ltd. (a)(c) | | 928,453 | 7 |
| | | | 2,217,533 |
|
| TOTAL MATERIALS | | | 20,322,963 |
|
| REAL ESTATE - 1.0% | | | |
| Equity Real Estate Investment Trusts (REITs) - 1.0% | | | |
| Store Capital Corp. | | 106,904 | 3,455,137 |
| Terreno Realty Corp. | | 89,714 | 3,619,063 |
| | | | 7,074,200 |
| TOTAL COMMON STOCKS | | | |
| (Cost $648,356,592) | | | 689,597,510 |
|
| Convertible Preferred Stocks - 0.7% | | | |
| INFORMATION TECHNOLOGY - 0.7% | | | |
| Software - 0.7% | | | |
| Compass, Inc.: | | | |
| Series E (a)(c)(d) | | 16,661 | 1,975,495 |
| Series F (c)(d) | | 27,147 | 3,218,820 |
| TOTAL CONVERTIBLE PREFERRED STOCKS | | | |
| (Cost $4,343,074) | | | 5,194,315 |
|
| Money Market Funds - 6.7% | | | |
| Fidelity Cash Central Fund, 2.43% (e) | | 28,097,105 | 28,102,725 |
| Fidelity Securities Lending Cash Central Fund 2.43% (e)(f) | | 18,917,543 | 18,919,435 |
| TOTAL MONEY MARKET FUNDS | | | |
| (Cost $47,021,773) | | | 47,022,160 |
| TOTAL INVESTMENT IN SECURITIES - 105.3% | | | |
| (Cost $699,721,439) | | | 741,813,985 |
| NET OTHER ASSETS (LIABILITIES) - (5.3)% | | | (37,187,703) |
| NET ASSETS - 100% | | | $704,626,282 |
Legend
(a) Non-income producing
(b) Security or a portion of the security is on loan at period end.
(c) Level 3 security
(d) Restricted securities - Investment in securities not registered under the Securities Act of 1933 (excluding 144A issues). At the end of the period, the value of restricted securities (excluding 144A issues) amounted to $5,194,315 or 0.7% of net assets.
(e) Affiliated fund that is generally available only to investment companies and other accounts managed by Fidelity Investments. The rate quoted is the annualized seven-day yield of the fund at period end. A complete unaudited listing of the fund's holdings as of its most recent quarter end is available upon request. In addition, each Fidelity Central Fund's financial statements are available on the SEC's website or upon request.
(f) Investment made with cash collateral received from securities on loan.
Additional information on each restricted holding is as follows:
| Security | Acquisition Date | Acquisition Cost |
| Compass, Inc. Series E | 11/3/17 | $1,124,254 |
| Compass, Inc. Series F | 10/22/18 | $3,218,820 |
Affiliated Central Funds
Information regarding fiscal year to date income earned by the Fund from investments in Fidelity Central Funds is as follows:
| Fund | Income earned |
| Fidelity Cash Central Fund | $255,283 |
| Fidelity Securities Lending Cash Central Fund | 91,131 |
| Total | $346,414 |
Amounts in the income column in the above table include any capital gain distributions from underlying funds, which are presented in the corresponding line-item in the Statement of Operations, if applicable.
Investment Valuation
The following is a summary of the inputs used, as of January 31, 2019, involving the Fund's assets and liabilities carried at fair value. The inputs or methodology used for valuing securities may not be an indication of the risk associated with investing in those securities. For more information on valuation inputs, and their aggregation into the levels used below, please refer to the Investment Valuation section in the accompanying Notes to Financial Statements.
| | Valuation Inputs at Reporting Date: |
| Description | Total | Level 1 | Level 2 | Level 3 |
| Investments in Securities: | | | | |
| Equities: | | | | |
| Communication Services | $48,657,565 | $48,657,565 | $-- | $-- |
| Consumer Discretionary | 92,980,669 | 92,980,669 | -- | -- |
| Consumer Staples | 29,963,484 | 29,963,484 | -- | -- |
| Energy | 5,637,022 | 5,637,022 | -- | -- |
| Financials | 70,678,944 | 70,678,944 | -- | -- |
| Health Care | 188,033,518 | 188,033,518 | -- | -- |
| Industrials | 95,456,247 | 95,456,247 | -- | -- |
| Information Technology | 135,987,213 | 130,792,898 | -- | 5,194,315 |
| Materials | 20,322,963 | 20,322,956 | -- | 7 |
| Real Estate | 7,074,200 | 7,074,200 | -- | -- |
| Money Market Funds | 47,022,160 | 47,022,160 | -- | -- |
| Total Investments in Securities: | $741,813,985 | $736,619,663 | $-- | $5,194,322 |
See accompanying notes which are an integral part of the financial statements.
Financial Statements
Statement of Assets and Liabilities
| | | January 31, 2019 (Unaudited) |
| Assets | | |
Investment in securities, at value (including securities loaned of $18,786,135) — See accompanying schedule:
Unaffiliated issuers (cost $652,699,666) | $694,791,825 | |
| Fidelity Central Funds (cost $47,021,773) | 47,022,160 | |
| Total Investment in Securities (cost $699,721,439) | | $741,813,985 |
| Receivable for investments sold | | 7,259,833 |
| Receivable for fund shares sold | | 579,065 |
| Dividends receivable | | 42,356 |
| Distributions receivable from Fidelity Central Funds | | 101,527 |
| Other receivables | | 5,872 |
| Total assets | | 749,802,638 |
| Liabilities | | |
| Payable for investments purchased | $25,378,063 | |
| Payable for fund shares redeemed | 545,626 | |
| Accrued management fee | 334,598 | |
| Collateral on securities loaned | 18,918,069 | |
| Total liabilities | | 45,176,356 |
| Net Assets | | $704,626,282 |
| Net Assets consist of: | | |
| Paid in capital | | $715,288,714 |
| Total distributable earnings (loss) | | (10,662,432) |
| Net Assets, for 57,857,073 shares outstanding | | $704,626,282 |
| Net Asset Value, offering price and redemption price per share ($704,626,282 ÷ 57,857,073 shares) | | $12.18 |
See accompanying notes which are an integral part of the financial statements.
Statement of Operations
| | | Six months ended January 31, 2019 (Unaudited) |
| Investment Income | | |
| Dividends | | $1,327,725 |
| Income from Fidelity Central Funds (including $91,131 from security lending) | | 346,414 |
| Total income | | 1,674,139 |
| Expenses | | |
| Management fee | $1,972,972 | |
| Independent trustees' fees and expenses | 1,969 | |
| Commitment fees | 844 | |
| Total expenses before reductions | 1,975,785 | |
| Expense reductions | (11,834) | |
| Total expenses after reductions | | 1,963,951 |
| Net investment income (loss) | | (289,812) |
| Realized and Unrealized Gain (Loss) | | |
| Net realized gain (loss) on: | | |
| Investment securities: | | |
| Unaffiliated issuers | (50,604,920) | |
| Fidelity Central Funds | (1,233) | |
| Foreign currency transactions | 106 | |
| Total net realized gain (loss) | | (50,606,047) |
| Change in net unrealized appreciation (depreciation) on: | | |
| Investment securities: | | |
| Unaffiliated issuers | (17,671,366) | |
| Fidelity Central Funds | 387 | |
| Assets and liabilities in foreign currencies | 63 | |
| Total change in net unrealized appreciation (depreciation) | | (17,670,916) |
| Net gain (loss) | | (68,276,963) |
| Net increase (decrease) in net assets resulting from operations | | $(68,566,775) |
See accompanying notes which are an integral part of the financial statements.
Statement of Changes in Net Assets
| | Six months ended January 31, 2019 (Unaudited) | Year ended July 31, 2018 |
| Increase (Decrease) in Net Assets | | |
| Operations | | |
| Net investment income (loss) | $(289,812) | $(176,063) |
| Net realized gain (loss) | (50,606,047) | 10,326,106 |
| Change in net unrealized appreciation (depreciation) | (17,670,916) | 59,820,458 |
| Net increase (decrease) in net assets resulting from operations | (68,566,775) | 69,970,501 |
| Distributions to shareholders | (11,807,695) | – |
| Distributions to shareholders from net investment income | – | (36,508) |
| Distributions to shareholders from net realized gain | – | (164,284) |
| Total distributions | (11,807,695) | (200,792) |
| Share transactions | | |
| Proceeds from sales of shares | 312,254,348 | 498,597,078 |
| Reinvestment of distributions | 11,807,695 | 200,792 |
| Cost of shares redeemed | (101,878,571) | (80,571,061) |
| Net increase (decrease) in net assets resulting from share transactions | 222,183,472 | 418,226,809 |
| Total increase (decrease) in net assets | 141,809,002 | 487,996,518 |
| Net Assets | | |
| Beginning of period | 562,817,280 | 74,820,762 |
| End of period | $704,626,282 | $562,817,280 |
| Other Information | | |
| Shares | | |
| Sold | 23,321,206 | 41,337,823 |
| Issued in reinvestment of distributions | 829,775 | 17,629 |
| Redeemed | (8,287,247) | (6,543,326) |
| Net increase (decrease) | 15,863,734 | 34,812,126 |
See accompanying notes which are an integral part of the financial statements.
Financial Highlights
Fidelity Small Cap Growth K6 Fund
| | Six months ended (Unaudited) January 31, | Years endedJuly 31, | |
| | 2019 | 2018 | 2017 A |
| Selected Per–Share Data | | | |
| Net asset value, beginning of period | $13.40 | $10.42 | $10.00 |
| Income from Investment Operations | | | |
| Net investment income (loss)B | (.01) | (.01) | (.01) |
| Net realized and unrealized gain (loss) | (.94) | 3.00 | .43 |
| Total from investment operations | (.95) | 2.99 | .42 |
| Distributions from net investment income | – | –C | – |
| Distributions from net realized gain | (.27) | (.01) | – |
| Total distributions | (.27) | (.01) | – |
| Net asset value, end of period | $12.18 | $13.40 | $10.42 |
| Total ReturnD,E | (7.39)% | 28.72% | 4.20% |
| Ratios to Average Net AssetsF,G | | | |
| Expenses before reductions | .60%H | .60% | .60%H |
| Expenses net of fee waivers, if any | .60%H | .60% | .60%H |
| Expenses net of all reductions | .60%H | .59% | .60%H |
| Net investment income (loss) | (.09)%H | (.06)% | (.45)%H |
| Supplemental Data | | | |
| Net assets, end of period (000 omitted) | $704,626 | $562,817 | $74,821 |
| Portfolio turnover rateI,J | 128%H | 114% | 79%K |
A For the period May 25, 2017 (commencement of operations) to July 31, 2017.
B Calculated based on average shares outstanding during the period.
C Amount represents less than $.005 per share.
D Total returns for periods of less than one year are not annualized.
E Total returns would have been lower if certain expenses had not been reduced during the applicable periods shown.
F Fees and expenses of any underlying Fidelity Central Funds are not included in the Fund's expense ratio. The Fund indirectly bears its proportionate share of the expenses of any underlying Fidelity Central Funds.
G Expense ratios reflect operating expenses of the Fund. Expenses before reductions do not reflect amounts reimbursed by the investment adviser or reductions from brokerage service arrangements or reductions from other expense offset arrangements and do not represent the amount paid by the Fund during periods when reimbursements or reductions occur. Expense ratios before reductions for start-up periods may not be representative of longer term operating periods. Expenses net of fee waivers reflect expenses after reimbursement by the investment adviser but prior to reductions from brokerage service arrangements or other expense offset arrangements. Expenses net of all reductions represent the net expenses paid by the Fund.
H Annualized
I Amount does not include the portfolio activity of any underlying Fidelity Central Funds.
J Portfolio turnover rate excludes securities received or delivered in-kind.
K Amount not annualized.
See accompanying notes which are an integral part of the financial statements.
Notes to Financial Statements (Unaudited)
For the period ended January 31, 2019
1. Organization.
Fidelity Small Cap Growth K6 Fund (the Fund) is a fund of Fidelity Securities Fund (the Trust) and is authorized to issue an unlimited number of shares. Share transactions on the Statement of Changes in Net Assets may contain exchanges between affiliated funds. The Trust is registered under the Investment Company Act of 1940, as amended (the 1940 Act), as an open-end management investment company organized as a Massachusetts business trust. Shares generally are available only to employer-sponsored retirement plans that are recordkept by Fidelity, or to certain employer-sponsored retirement plans that are not recordkept by Fidelity. Effective the close of business on February 2, 2018, the Fund was closed to new accounts with certain exceptions.
2. Investments in Fidelity Central Funds.
The Fund invests in Fidelity Central Funds, which are open-end investment companies generally available only to other investment companies and accounts managed by the investment adviser and its affiliates. The Fund's Schedule of Investments lists each of the Fidelity Central Funds held as of period end, if any, as an investment of the Fund, but does not include the underlying holdings of each Fidelity Central Fund. As an Investing Fund, the Fund indirectly bears its proportionate share of the expenses of the underlying Fidelity Central Funds.
The Money Market Central Funds seek preservation of capital and current income and are managed by Fidelity Investments Money Management, Inc. (FIMM), an affiliate of the investment adviser. Annualized expenses of the Money Market Central Funds as of their most recent shareholder report date are less than .005%.
A complete unaudited list of holdings for each Fidelity Central Fund is available upon request or at the Securities and Exchange Commission (the SEC) website at www.sec.gov. In addition, the financial statements of the Fidelity Central Funds are available on the SEC website or upon request.
3. Significant Accounting Policies.
The Fund is an investment company and applies the accounting and reporting guidance of the Financial Accounting Standards Board (FASB) Accounting Standards Codification Topic 946 Financial Services – Investments Companies. The financial statements have been prepared in conformity with accounting principles generally accepted in the United States of America (GAAP), which require management to make certain estimates and assumptions at the date of the financial statements. Actual results could differ from those estimates. Subsequent events, if any, through the date that the financial statements were issued have been evaluated in the preparation of the financial statements. The following summarizes the significant accounting policies of the Fund:
Investment Valuation. Investments are valued as of 4:00 p.m. Eastern time on the last calendar day of the period. The Board of Trustees (the Board) has delegated the day to day responsibility for the valuation of the Fund's investments to the Fair Value Committee (the Committee) established by the Fund's investment adviser. In accordance with valuation policies and procedures approved by the Board, the Fund attempts to obtain prices from one or more third party pricing vendors or brokers to value its investments. When current market prices, quotations or currency exchange rates are not readily available or reliable, investments will be fair valued in good faith by the Committee, in accordance with procedures adopted by the Board. Factors used in determining fair value vary by investment type and may include market or investment specific events. The frequency with which these procedures are used cannot be predicted and they may be utilized to a significant extent. The Committee oversees the Fund's valuation policies and procedures and reports to the Board on the Committee's activities and fair value determinations. The Board monitors the appropriateness of the procedures used in valuing the Fund's investments and ratifies the fair value determinations of the Committee.
The Fund categorizes the inputs to valuation techniques used to value its investments into a disclosure hierarchy consisting of three levels as shown below:
- Level 1 – quoted prices in active markets for identical investments
- Level 2 – other significant observable inputs (including quoted prices for similar investments, interest rates, prepayment speeds, etc.)
- Level 3 – unobservable inputs (including the Fund's own assumptions based on the best information available)
Valuation techniques used to value the Fund's investments by major category are as follows:
Equity securities, including restricted securities, for which market quotations are readily available, are valued at the last reported sale price or official closing price as reported by a third party pricing vendor on the primary market or exchange on which they are traded and are categorized as Level 1 in the hierarchy. In the event there were no sales during the day or closing prices are not available, securities are valued at the last quoted bid price or may be valued using the last available price and are generally categorized as Level 2 in the hierarchy. For foreign equity securities, when market or security specific events arise, comparisons to the valuation of American Depositary Receipts (ADRs), futures contracts, Exchange-Traded Funds (ETFs) and certain indexes as well as quoted prices for similar securities may be used and would be categorized as Level 2 in the hierarchy. For equity securities, including restricted securities, where observable inputs are limited, assumptions about market activity and risk are used and these securities may be categorized as Level 3 in the hierarchy.
Investments in open-end mutual funds, including the Fidelity Central Funds, are valued at their closing net asset value (NAV) each business day and are categorized as Level 1 in the hierarchy.
Changes in valuation techniques may result in transfers in or out of an assigned level within the disclosure hierarchy. The aggregate value of investments by input level as of January 31, 2019 is included at the end of the Fund's Schedule of Investments.
Foreign Currency. The Fund may use foreign currency contracts to facilitate transactions in foreign-denominated securities. Gains and losses from these transactions may arise from changes in the value of the foreign currency or if the counterparties do not perform under the contracts' terms.
Foreign-denominated assets, including investment securities, and liabilities are translated into U.S. dollars at the exchange rates at period end. Purchases and sales of investment securities, income and dividends received and expenses denominated in foreign currencies are translated into U.S. dollars at the exchange rate in effect on the transaction date.
The effects of exchange rate fluctuations on investments are included with the net realized and unrealized gain (loss) on investment securities. Other foreign currency transactions resulting in realized and unrealized gain (loss) are disclosed separately.
Investment Transactions and Income. For financial reporting purposes, the Fund's investment holdings and NAV include trades executed through the end of the last business day of the period. The NAV per share for processing shareholder transactions is calculated as of the close of business of the New York Stock Exchange (NYSE), normally 4:00 p.m. Eastern time and includes trades executed through the end of the prior business day. Gains and losses on securities sold are determined on the basis of identified cost. Dividend income is recorded on the ex-dividend date, except for certain dividends from foreign securities where the ex-dividend date may have passed, which are recorded as soon as the Fund is informed of the ex-dividend date. Non-cash dividends included in dividend income, if any, are recorded at the fair market value of the securities received. Income and capital gain distributions from Fidelity Central Funds, if any, are recorded on the ex-dividend date. Certain distributions received by the Fund represent a return of capital or capital gain. The Fund determines the components of these distributions subsequent to the ex-dividend date, based upon receipt of tax filings or other correspondence relating to the underlying investment. These distributions are recorded as a reduction of cost of investments and/or as a realized gain. Investment income is recorded net of foreign taxes withheld where recovery of such taxes is uncertain.
Expenses. Expenses directly attributable to a fund are charged to that fund. Expenses attributable to more than one fund are allocated among the respective funds on the basis of relative net assets or other appropriate methods. Expense estimates are accrued in the period to which they relate and adjustments are made when actual amounts are known.
Income Tax Information and Distributions to Shareholders. Each year, the Fund intends to qualify as a regulated investment company under Subchapter M of the Internal Revenue Code, including distributing substantially all of its taxable income and realized gains. As a result, no provision for U.S. Federal income taxes is required. The Fund files a U.S. federal tax return, in addition to state and local tax returns as required. The Fund's federal income tax returns are subject to examination by the Internal Revenue Service (IRS) for a period of three fiscal years after they are filed. State and local tax returns may be subject to examination for an additional fiscal year depending on the jurisdiction. Foreign taxes are provided for based on the Fund's understanding of the tax rules and rates that exist in the foreign markets in which it invests.
Distributions are declared and recorded on the ex-dividend date. Income and capital gain distributions are determined in accordance with income tax regulations, which may differ from GAAP.
Capital accounts within the financial statements are adjusted for permanent book-tax differences. These adjustments have no impact on net assets or the results of operations. Capital accounts are not adjusted for temporary book-tax differences which will reverse in a subsequent period.
Book-tax differences are primarily due to foreign currency transactions, partnerships, net operating losses, passive foreign investment companies (PFIC), and losses deferred due to wash sales.
As of period end, the cost and unrealized appreciation (depreciation) in securities, and derivatives if applicable, for federal income tax purposes were as follows:
| Gross unrealized appreciation | $76,655,188 |
| Gross unrealized depreciation | (37,622,108) |
| Net unrealized appreciation (depreciation) | $39,033,080 |
| Tax cost | $702,780,905 |
Restricted Securities. The Fund may invest in securities that are subject to legal or contractual restrictions on resale. These securities generally may be resold in transactions exempt from registration or to the public if the securities are registered. Disposal of these securities may involve time-consuming negotiations and expense, and prompt sale at an acceptable price may be difficult. Information regarding restricted securities is included at the end of the Fund's Schedule of Investments.
New Rule Issuance. During August 2018, the U.S. Securities and Exchange Commission issued Final Rule Release No. 33-10532, Disclosure Update and Simplification. This Final Rule includes amendments specific to registered investment companies that are intended to eliminate overlap in disclosure requirements between Regulation S-X and GAAP. In accordance with these amendments, certain line-items in the Fund's financial statements have been combined or removed for the current period as outlined in the table below.
| Financial Statement | Current Line-Item Presentation (As Applicable) | Prior Line-Item Presentation (As Applicable) |
| Statement of Assets and Liabilities | Total distributable earnings (loss) | Undistributed/Distributions in excess of/Accumulated net investment income (loss)
Accumulated/Undistributed net realized gain (loss)
Net unrealized appreciation (depreciation) |
| Statement of Changes in Net Assets | N/A - removed | Undistributed/Distributions in excess of/Accumulated net investment income (loss) end of period |
| Statement of Changes in Net Assets | Distributions to shareholders | Distributions to shareholders from net investment income
Distributions to shareholders from net realized gain |
4. Purchases and Sales of Investments.
Purchases and sales of securities, other than short-term securities and in-kind transactions, aggregated $430,863,576 and $404,573,021, respectively.
Unaffiliated Exchanges In-Kind. During the period, the Fund received investments and cash valued at $189,610,448 in exchange for 13,631,205 shares of the Fund. The amount of in-kind exchanges is included in share transactions in the accompanying Statement of Changes in Net Assets.
Prior Fiscal Year Exchanges In-Kind. During the prior period, unaffiliated entities completed an exchange in-kind with the Fund. The unaffiliated entities delivered investments and cash, valued at $99,242,172 in exchange for 8,140,978 shares of the Fund. The amount of in-kind exchanges is included in share transactions in the accompanying Statement of Changes in Net Assets. The Fund recognized no gain or loss for federal income tax purposes.
5. Fees and Other Transactions with Affiliates.
Management Fee. Fidelity Management & Research Company (the investment adviser) and its affiliates provide the Fund with investment management related services for which the Fund pays a monthly management fee that is based on an annual rate of .60% of average net assets. Under the management contract, the investment adviser or an affiliate pays all other expenses of the Fund, excluding fees and expenses of the independent Trustees, and certain miscellaneous expenses such as proxy and shareholder meeting expenses.
Brokerage Commissions. The Fund placed a portion of its portfolio transactions with brokerage firms which are affiliates of the investment adviser. Brokerage commissions are included in net realized gain (loss) and change in net unrealized appreciation (depreciation) in the Statement of Operations. The commissions paid to these affiliated firms were $18,713 for the period.
Interfund Trades. The Fund may purchase from or sell securities to other Fidelity Funds under procedures adopted by the Board. The procedures have been designed to ensure these interfund trades are executed in accordance with Rule 17a-7 of the 1940 Act. Interfund trades are included within the respective purchases and sales amounts shown in the Purchases and Sales of Investments note.
6. Committed Line of Credit.
The Fund participates with other funds managed by the investment adviser or an affiliate in a $4.25 billion credit facility (the "line of credit") to be utilized for temporary or emergency purposes to fund shareholder redemptions or for other short-term liquidity purposes. The Fund has agreed to pay commitment fees on its pro-rata portion of the line of credit, which amounted to $844 and is reflected in Commitment fees on the Statement of Operations. During the period, the Fund did not borrow on this line of credit.
7. Security Lending.
The Fund lends portfolio securities through a lending agent from time to time in order to earn additional income. For equity securities, a lending agent is used and may loan securities to certain qualified borrowers, including Fidelity Capital Markets (FCM), a broker-dealer affiliated with the Fund. On the settlement date of the loan, the Fund receives collateral (in the form of U.S. Treasury obligations, letters of credit and/or cash) against the loaned securities and maintains collateral in an amount not less than 100% of the market value of the loaned securities during the period of the loan. The market value of the loaned securities is determined at the close of business of the Fund and any additional required collateral is delivered to the Fund on the next business day. The Fund or borrower may terminate the loan at any time, and if the borrower defaults on its obligation to return the securities loaned because of insolvency or other reasons, the Fund may apply collateral received from the borrower against the obligation. The Fund may experience delays and costs in recovering the securities loaned. Any cash collateral received is invested in the Fidelity Securities Lending Cash Central Fund. The value of loaned securities and cash collateral at period end are disclosed on the Fund's Statement of Assets and Liabilities. The value of securities loaned to FCM at period end was $398,700. Security lending income represents the income earned on investing cash collateral, less rebates paid to borrowers and any lending agent fees associated with the loan, plus any premium payments received for lending certain types of securities. Security lending income is presented in the Statement of Operations as a component of income from Fidelity Central Funds, and includes $30,307 from securities loaned to FCM.
8. Expense Reductions.
Commissions paid to certain brokers with whom the investment adviser, or its affiliates, places trades on behalf of the Fund include an amount in addition to trade execution, which may be rebated back to the Fund to offset certain expenses. This amount totaled $10,956 for the period. In addition, through arrangements with the Fund's custodian, credits realized as a result of certain uninvested cash balances were used to reduce the Fund's expenses. During the period, these credits reduced the Fund's expenses by $878.
9. Other.
The Fund's organizational documents provide former and current trustees and officers with a limited indemnification against liabilities arising in connection with the performance of their duties to the Fund. In the normal course of business, the Fund may also enter into contracts that provide general indemnifications. The Fund's maximum exposure under these arrangements is unknown as this would be dependent on future claims that may be made against the Fund. The risk of material loss from such claims is considered remote.
Shareholder Expense Example
As a shareholder of the Fund, you incur two types of costs: (1) transaction costs and (2) ongoing costs, including management fees and other Fund expenses. This Example is intended to help you understand your ongoing costs (in dollars) of investing in the Fund and to compare these costs with the ongoing costs of investing in other mutual funds.
The Example is based on an investment of $1,000 invested at the beginning of the period and held for the entire period (August 1, 2018 to January 31, 2019).
Actual Expenses
The first line of the accompanying table provides information about actual account values and actual expenses. You may use the information in this line, together with the amount you invested, to estimate the expenses that you paid over the period. Simply divide your account value by $1,000.00 (for example, an $8,600 account value divided by $1,000.00 = 8.6), then multiply the result by the number in the first line under the heading entitled "Expenses Paid During Period" to estimate the expenses you paid on your account during this period. In addition, the Fund, as a shareholder in the underlying Fidelity Central Funds, will indirectly bear its pro-rata share of the fees and expenses incurred by the underlying Fidelity Central Funds. These fees and expenses are not included in the Fund's annualized expense ratio used to calculate the expense estimate in the table below.
Hypothetical Example for Comparison Purposes
The second line of the accompanying table provides information about hypothetical account values and hypothetical expenses based on the Fund's actual expense ratio and an assumed rate of return of 5% per year before expenses, which is not the Fund's actual return. The hypothetical account values and expenses may not be used to estimate the actual ending account balance or expenses you paid for the period. You may use this information to compare the ongoing costs of investing in the Fund and other funds. To do so, compare this 5% hypothetical example with the 5% hypothetical examples that appear in the shareholder reports of the other funds. In addition, the Fund, as a shareholder in the underlying Fidelity Central Funds, will indirectly bear its pro-rata share of the fees and expenses incurred by the underlying Fidelity Central Funds. These fees and expenses are not included in the Fund's annualized expense ratio used to calculate the expense estimate in the table below.
Please note that the expenses shown in the table are meant to highlight your ongoing costs only and do not reflect any transaction costs. Therefore, the second line of the table is useful in comparing ongoing costs only, and will not help you determine the relative total costs of owning different funds.
| | Annualized Expense Ratio-A | Beginning
Account Value
August 1, 2018 | Ending
Account Value
January 31, 2019 | Expenses Paid
During Period-B
August 1, 2018
to January 31, 2019 |
| Actual | .60% | $1,000.00 | $926.10 | $2.91 |
| Hypothetical-C | | $1,000.00 | $1,022.18 | $3.06 |
A Annualized expense ratio reflects expenses net of applicable fee waivers.
B Expenses are equal to the Fund's annualized expense ratio, multiplied by the average account value over the period, multiplied by 184/365 (to reflect the one-half year period).
C 5% return per year before expenses
Board Approval of Investment Advisory Contracts and Management Fees
Fidelity Small Cap Growth K6 Fund
Each year, the Board of Trustees, including the Independent Trustees (together, the Board), votes on the renewal of the management contract with Fidelity Management & Research Company (FMR) and the sub-advisory agreements (together, the Advisory Contracts) for the fund. FMR and the sub-advisers are referred to herein as the Investment Advisers. The Board, assisted by the advice of fund counsel and Independent Trustees' counsel, requests and considers a broad range of information relevant to the renewal of the Advisory Contracts throughout the year.
The Board meets regularly and, at each of its meetings, covers an extensive agenda of topics and materials and considers factors that are relevant to its annual consideration of the renewal of the fund's Advisory Contracts, including the services and support provided to the fund and its shareholders. The Board has established various standing committees (Committees), each composed of and chaired by Independent Trustees with varying backgrounds, to which the Board has assigned specific subject matter responsibilities in order to enhance effective decision-making by the Board. The Board, acting directly and through its Committees, requests and receives information concerning the annual consideration of the renewal of the fund's Advisory Contracts. The Board also meets as needed to review matters specifically related to the Board's annual consideration of the renewal of the Advisory Contracts. Members of the Board may also meet with trustees of other Fidelity funds through joint ad hoc committees to discuss certain matters relevant to all of the Fidelity funds.
At its January 2019 meeting, the Board unanimously determined to renew the fund's Advisory Contracts. In reaching its determination, the Board considered all factors it believed relevant, including (i) the nature, extent, and quality of the services to be provided to the fund and its shareholders (including the investment performance of the fund); (ii) the competitiveness of the fund's management fee and total expense ratio relative to peer funds; (iii) the total costs of the services to be provided by and the profits to be realized by Fidelity from its relationships with the fund; and (iv) the extent to which, if any, economies of scale exist and would be realized as the fund grows, and whether any economies of scale are appropriately shared with fund shareholders.
In considering whether to renew the Advisory Contracts for the fund, the Board reached a determination, with the assistance of fund counsel and Independent Trustees' counsel and through the exercise of its business judgment, that the renewal of the Advisory Contracts was in the best interests of the fund and its shareholders and that the compensation payable under the Advisory Contracts was fair and reasonable. The Board's decision to renew the Advisory Contracts was not based on any single factor, but rather was based on a comprehensive consideration of all the information provided to the Board at its meetings throughout the year. The Board, in reaching its determination to renew the Advisory Contracts, was aware that shareholders of the fund have a broad range of investment choices available to them, including a wide choice among funds offered by Fidelity's competitors, and that the fund's shareholders, who have the opportunity to review and weigh the disclosure provided by the fund in its prospectus and other public disclosures, have chosen to invest in this fund, which is part of the Fidelity family of funds.
Nature, Extent, and Quality of Services Provided. The Board considered Fidelity's staffing as it relates to the fund, including the backgrounds of investment personnel of Fidelity, and also considered the fund's investment objective, strategies, and related investment philosophy. The Independent Trustees also had discussions with senior management of Fidelity's investment operations and investment groups. The Board considered the structure of the investment personnel compensation program and whether this structure provides appropriate incentives to act in the best interests of the fund. Additionally, the Board considered the portfolio managers' investments, if any, in the funds that they manage.
Resources Dedicated to Investment Management and Support Services. The Board and the Fund Oversight and Research Committees reviewed the general qualifications and capabilities of Fidelity's investment staff, including its size, education, experience, and resources, as well as Fidelity's approach to recruiting, training, managing, and compensating investment personnel. The Board noted that Fidelity has continued to increase the resources devoted to non-U.S. offices, including expansion of Fidelity's global investment organization. The Board also noted that Fidelity's analysts have extensive resources, tools and capabilities that allow them to conduct sophisticated quantitative and fundamental analysis, as well as credit analysis of issuers, counterparties and guarantors. Further, the Board considered that Fidelity's investment professionals have sufficient access to global information and data so as to provide competitive investment results over time, and that those professionals also have access to sophisticated tools that permit them to assess portfolio construction and risk and performance attribution characteristics continuously, as well as to transmit new information and research conclusions rapidly around the world. Additionally, in its deliberations, the Board considered Fidelity's trading, risk management, compliance, and technology and operations capabilities and resources, which are integral parts of the investment management process.
Shareholder and Administrative Services. The Board considered (i) the nature, extent, quality, and cost of advisory, administrative, and shareholder services performed by the Investment Advisers and their affiliates under the Advisory Contracts and under separate agreements covering transfer agency, pricing and bookkeeping, and securities lending services for the fund; (ii) the nature and extent of the supervision of third party service providers, principally custodians, subcustodians, and pricing vendors; and (iii) the resources devoted to, and the record of compliance with, the fund's compliance policies and procedures. The Board also reviewed the allocation of fund brokerage, including allocations to brokers affiliated with the Investment Advisers, the use of brokerage commissions to pay fund expenses, and the use of "soft" commission dollars to pay for research services.
The Board noted that the growth of fund assets over time across the complex allows Fidelity to reinvest in the development of services designed to enhance the value and convenience of the Fidelity funds as investment vehicles. These services include 24-hour access to account information and market information through telephone representatives and over the Internet, investor education materials and asset allocation tools, and the expanded availability of Fidelity Investor Centers.
The Board noted that it and the boards of certain other Fidelity funds had formed an ad hoc Committee on Transfer Agency Fees to review the variety of transfer agency fee structures throughout the industry and Fidelity's competitive positioning with respect to industry participants.
Investment in a Large Fund Family. The Board considered the benefits to shareholders of investing in a Fidelity fund, including the benefits of investing in a fund that is part of a large family of funds offering a variety of investment disciplines and providing a large variety of mutual fund investor services. The Board noted that Fidelity had taken, or had made recommendations that resulted in the Fidelity funds taking, a number of actions over the previous year that benefited particular funds, including: (i) continuing to dedicate additional resources to Fidelity's investment research process, which includes meetings with management of issuers of securities in which the funds invest, and to the support of the senior management team that oversees asset management; (ii) continuing efforts to enhance Fidelity's global research capabilities; (iii) launching new funds and making other enhancements to meet client needs; (iv) launching new share classes of existing funds; (v) eliminating purchase minimums and broadening eligibility requirements for certain funds and share classes; (vi) reducing management fees and total expenses for certain growth equity funds and index funds; (vii) lowering expense caps for certain existing funds and classes, and converting certain voluntary expense caps to contractual caps, to reduce expenses borne by shareholders; (viii) eliminating short-term redemption fees for funds that had such fees; (ix) rationalizing product lines and gaining increased efficiencies from fund mergers and share class consolidations; (x) continuing to develop, acquire and implement systems and technology to improve services to the funds and shareholders, strengthen information security, and increase efficiency; and (xi) continuing to implement enhancements to further strengthen Fidelity's product line to increase investors' probability of success in achieving their investment goals, including retirement income goals.
Investment Performance. The Board considered whether the fund has operated in accordance with its investment objective, as well as its record of compliance with its investment restrictions and its performance history.
The Board took into account discussions that occur at Board meetings throughout the year with representatives of the Investment Advisers about fund investment performance. In this regard the Board noted that as part of regularly scheduled fund reviews and other reports to the Board on fund performance, the Board considers annualized return information for the fund for different time periods, measured against an appropriate securities market index ("benchmark index") and a peer group of funds with similar objectives ("peer group"), if any. In its evaluation of fund investment performance, the Board gave particular attention to information indicating changes in performance of certain Fidelity funds for specific time periods and discussed with the Investment Advisers the reasons for any overperformance or underperformance.
In addition to reviewing absolute and relative fund performance, the Independent Trustees periodically consider the appropriateness of fund performance metrics in evaluating the results achieved. In general, the Independent Trustees believe that fund performance should be evaluated based on net performance (after fees and expenses) of both the highest performing and lowest performing fund share classes, where applicable, compared to appropriate benchmark indices, over appropriate time periods that may include full market cycles, and compared to peer groups, as applicable, over the same periods, taking into account relevant factors including the following: general market conditions; issuer-specific information; and fund cash flows and other factors.
The Independent Trustees recognize that shareholders evaluate performance on a net basis over their own holding periods, for which one-, three-, and five-year periods are often used as a proxy. For this reason, the performance information reviewed by the Board also included net total return information for the fund and an appropriate benchmark index and peer group for the most recent one-year period ended June 30, 2018, as shown below. Returns are shown compared to the 25th percentile (top of box, 75% beaten) and 75th percentile (bottom of box, 25% beaten) of the peer universe.
Fidelity Small Cap Growth K6 Fund

Based on its review, the Board concluded that the nature, extent, and quality of services provided to the fund under the Advisory Contracts should continue to benefit the shareholders of the fund.
Competitiveness of Management Fee and Total Expense Ratio. The Board considered the fund's management fee and total expense ratio compared to "mapped groups" of competitive funds and classes created for the purpose of facilitating the Trustees' competitive analysis of management fees and total expenses. Fidelity creates "mapped groups" by combining similar Lipper investment objective categories that have comparable investment mandates. Combining Lipper investment objective categories aids the Board's management fee and total expense ratio comparisons by broadening the competitive group used for comparison.
Management Fee. The Board considered two proprietary management fee comparisons for the 12-month period ended June 30 shown in basis points (BP) in the chart below. The group of Lipper funds used by the Board for management fee comparisons is referred to below as the "Total Mapped Group." The Total Mapped Group comparison focuses on a fund's standing in terms of gross management fees before expense reimbursements or caps relative to the total universe of funds with comparable investment mandates, regardless of whether their management fee structures also are comparable. Funds with comparable investment mandates offer exposure to similar types of securities. Funds with comparable management fee structures have similar management fee contractual arrangements (e.g., flat rate charged for advisory services, all-inclusive fee rate, etc.). "TMG %" represents the percentage of funds in the Total Mapped Group that had management fees that were lower than the fund's. For example, a hypothetical TMG % of 20% would mean that 80% of the funds in the Total Mapped Group had higher, and 20% had lower, management fees than the fund. The fund's actual TMG % and the number of funds in the Total Mapped Group are in the chart below. The "Asset-Size Peer Group" (ASPG) comparison focuses on a fund's standing relative to a subset of non-Fidelity funds within the Total Mapped Group that are similar in size and management fee structure. For example, if a fund is in the first quartile of the ASPG, the fund's management fee ranks in the least expensive or lowest 25% of funds in the ASPG. The ASPG represents at least 15% of the funds in the Total Mapped Group with comparable asset size and management fee structures, subject to a minimum of 50 funds (or all funds in the Total Mapped Group if fewer than 50). Additional information, such as the ASPG quartile in which the fund's management fee rate ranked is also included in the chart and was considered by the Board.
Fidelity Small Cap Growth K6 Fund
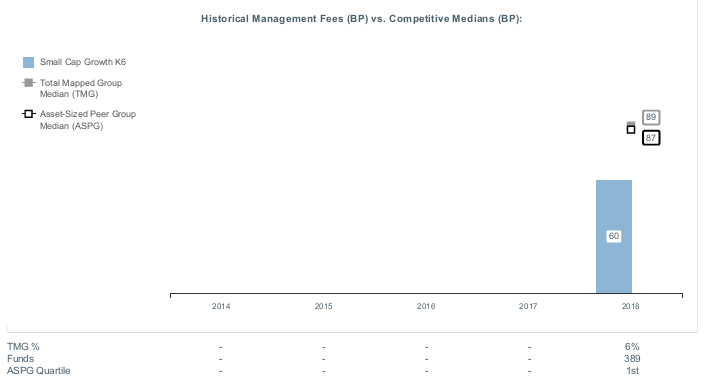
The Board noted that the fund's management fee rate ranked below the median of its Total Mapped Group and below the median of its ASPG for the 12-month period ended June 30, 2018.
The Board noted that it and the boards of other Fidelity funds formed an ad hoc Committee on Group Fee, which meets periodically, to conduct an in-depth review of the "group fee" component of the management fee of funds with such management fee structures. The Committee's focus included the mechanics of the group fee, the competitive landscape of group fee structures, Fidelity funds with no group fee component (such as the fund) and investment products not included in group fee assets. The Board also considered that, for funds subject to the group fee, FMR agreed to voluntarily waive fees over a specified period of time in amounts designed to account for assets converted from certain funds to certain collective investment trusts.
The Board also noted that, in 2013, the ad hoc Committee on Management Fees was formed to conduct an in-depth review of the management fee rates of Fidelity's active equity mutual funds. The Committee focused on the following areas: (i) standard fee structures; (ii) research consumption and trading evolution; (iii) management fee competitiveness/profitability by category; and (iv) factors that drive institutional pricing.
Based on its review, the Board concluded that the fund's management fee is fair and reasonable in light of the services that the fund receives and the other factors considered.
Total Expense Ratio. In its review of the fund's total expense ratio, the Board considered the fund's unitary fee rate as well as other fund expenses paid by FMR under the fund's management contract, such as transfer agent fees, pricing and bookkeeping fees, and custodial, legal, and audit fees. The Board also noted that Fidelity may agree to waive fees and expenses from time to time, and the extent to which, if any, it has done so for the fund. As part of its review, the Board also considered the current total expense ratio of the fund compared to competitive fund median expenses. The fund is compared to those funds in the Total Mapped Group (used by the Board for management fee comparisons) that have a similar sales load structure.
In connection with the renewal of the Advisory Contracts, the Board also approved amendments to the management contract for the fund to clarify that the fund pays its non-operating expenses, including brokerage commissions and fees and expenses associated with the fund's securities lending program. The Board considered that the amendments would not change the services provided to the fund or the party responsible for making such payments under the current management contract.
The Board noted that the fund's total expense ratio ranked below the competitive median for the 12-month period ended June 30, 2018.
Fees Charged to Other Fidelity Clients. The Board also considered Fidelity fee structures and other information with respect to clients of Fidelity, such as other funds advised or subadvised by Fidelity, pension plan clients, and other institutional clients with similar mandates. The Board noted that a joint ad hoc committee created by it and the boards of other Fidelity funds periodically reviews and compares Fidelity's institutional investment advisory business with its business of providing services to the Fidelity funds and also noted the most recent findings of the committee. The Board noted that the committee's review included a consideration of the differences in services provided, fees charged, and costs incurred, as well as competition in the markets serving the different categories of clients.
Based on its review of total expense ratios and fees charged to other Fidelity clients, the Board concluded that the fund's total expense ratio was reasonable in light of the services that the fund and its shareholders receive and the other factors considered.
Costs of the Services and Profitability. The Board considered the revenues earned and the expenses incurred by Fidelity in conducting the business of developing, marketing, distributing, managing, administering and servicing the fund and servicing the fund's shareholders. The Board also considered the level of Fidelity's profits in respect of all the Fidelity funds.
On an annual basis, Fidelity presents to the Board information about the profitability of its relationships with the fund. Fidelity calculates profitability information for each fund, as well as aggregate profitability information for groups of Fidelity funds and all Fidelity funds, using a series of detailed revenue and cost allocation methodologies which originate with the books and records of Fidelity on which Fidelity's audited financial statements are based. The Audit Committee of the Board reviews any significant changes from the prior year's methodologies.
PricewaterhouseCoopers LLP (PwC), auditor to Fidelity and certain Fidelity funds, has been engaged annually by the Board as part of the Board's assessment of Fidelity's profitability analysis. PwC's engagement includes the review and assessment of the methodologies used by Fidelity in determining the revenues and expenses attributable to Fidelity's mutual fund business, and completion of agreed-upon procedures in respect of the mathematical accuracy of the fund profitability information and its conformity to established allocation methodologies. After considering PwC's reports issued under the engagement and information provided by Fidelity, the Board concluded that while other allocation methods may also be reasonable, Fidelity's profitability methodologies are reasonable in all material respects.
The Board also reviewed Fidelity's non-fund businesses and potential indirect benefits such businesses may have received as a result of their association with Fidelity's mutual fund business (i.e., fall-out benefits) as well as cases where Fidelity's affiliates may benefit from the fund's business. The Board noted that changes to fall-out benefits year-over-year reflect business developments at Fidelity's various businesses.
The Board considered the costs of the services provided by and the profits realized by Fidelity in connection with the operation of the fund and was satisfied that the profitability was not excessive.
Economies of Scale. The Board considered whether there have been economies of scale in respect of the management of the Fidelity funds, whether the Fidelity funds (including the fund) have appropriately benefited from any such economies of scale, and whether there is potential for realization of any further economies of scale. The Board considered the extent to which the fund will benefit from economies of scale as assets grow through increased services to the fund, through waivers or reimbursements, or through fee or expense ratio reductions. The Board recognized that, due to the fund's current contractual arrangements, its expense ratio will not decline if the fund's operating costs decrease as assets grow, or rise as assets decrease. The Board also noted that a committee (the Economies of Scale Committee) created by it and the boards of other Fidelity funds periodically analyzes whether Fidelity attains economies of scale in respect of the management and servicing of the Fidelity funds, whether the Fidelity funds have appropriately benefited from such economies of scale, and whether there is potential for realization of any further economies of scale.
The Board concluded, taking into account the analysis of the Economies of Scale Committee, that economies of scale, if any, are being appropriately shared between fund shareholders and Fidelity.
Additional Information Requested by the Board. In order to develop fully the factual basis for consideration of the Fidelity funds' advisory contracts, the Board requested and received additional information on certain topics, including: (i) fund performance trends, in particular the underperformance of certain funds, and Fidelity's long-term strategies for certain funds; (ii) Fidelity's fund profitability methodology, profitability trends for certain funds, and the impact of certain factors on fund profitability results; (iii) metrics for evaluating index fund and ETF performance and information about ETF trading characteristics; (iv) the methodology with respect to the evaluation of competitive fund data and peer group classifications and fee comparisons; (v) the expense structures for different funds and classes; (vi) information regarding other accounts managed by Fidelity, including collective investment trusts; and (vii) Fidelity's philosophies and strategies for evaluating funds and classes with lower or declining asset levels.
Based on its evaluation of all of the conclusions noted above, and after considering all factors it believed relevant, the Board concluded that the advisory fee arrangements are fair and reasonable, and that the fund's Advisory Contracts should be renewed.
SCPK6-SANN-0319
1.9884010.101
Fidelity® Small Cap Value Fund
Semi-Annual Report January 31, 2019 Includes Fidelity and Fidelity Advisor share classes |
|
Beginning on January 1, 2021, as permitted by regulations adopted by the Securities and Exchange Commission, paper copies of a fund’s shareholder reports will no longer be sent by mail, unless you specifically request paper copies of the reports from the fund or from your financial intermediary, such as a financial advisor, broker-dealer or bank. Instead, the reports will be made available on a website, and you will be notified by mail each time a report is posted and provided with a website link to access the report.
If you already elected to receive shareholder reports electronically, you will not be affected by this change and you need not take any action. You may elect to receive shareholder reports and other communications from a fund electronically, by contacting your financial intermediary. For Fidelity customers, visit Fidelity's web site or call Fidelity using the contact information listed below.
You may elect to receive all future reports in paper free of charge. If you wish to continue receiving paper copies of your shareholder reports, you may contact your financial intermediary or, if you are a Fidelity customer, visit Fidelity’s website, or call Fidelity at the applicable toll-free number listed below. Your election to receive reports in paper will apply to all funds held with the fund complex/your financial intermediary.
| Account Type | Website | Phone Number |
| Brokerage, Mutual Fund, or Annuity Contracts: | fidelity.com/mailpreferences | 1-800-343-3548 |
| Employer Provided Retirement Accounts: | netbenefits.fidelity.com/preferences (choose 'no' under Required Disclosures to continue to print) | 1-800-343-0860 |
| Advisor Sold Accounts Serviced Through Your Financial Intermediary: | Contact Your Financial Intermediary | Your Financial Intermediary's phone number |
| Advisor Sold Accounts Serviced by Fidelity: | institutional.fidelity.com | 1-877-208-0098 |
Contents
To view a fund's proxy voting guidelines and proxy voting record for the 12-month period ended June 30, visit http://www.fidelity.com/proxyvotingresults or visit the Securities and Exchange Commission's (SEC) web site at http://www.sec.gov.
You may also call 1-800-544-8544 if you’re an individual investing directly with Fidelity, call 1-800-835-5092 if you’re a plan sponsor or participant with Fidelity as your recordkeeper or call 1-877-208-0098 on institutional accounts or if you’re an advisor or invest through one to request a free copy of the proxy voting guidelines.
Standard & Poor's, S&P and S&P 500 are registered service marks of The McGraw-Hill Companies, Inc. and have been licensed for use by Fidelity Distributors Corporation.
Other third-party marks appearing herein are the property of their respective owners.
All other marks appearing herein are registered or unregistered trademarks or service marks of FMR LLC or an affiliated company. © 2019 FMR LLC. All rights reserved.
This report and the financial statements contained herein are submitted for the general information of the shareholders of the Fund. This report is not authorized for distribution to prospective investors in the Fund unless preceded or accompanied by an effective prospectus.
A fund files its complete schedule of portfolio holdings with the SEC for the first and third quarters of each fiscal year on Form N-Q. Forms N-Q are available on the SEC’s web site at http://www.sec.gov. A fund's Forms N-Q may be reviewed and copied at the SEC’s Public Reference Room in Washington, DC. Information regarding the operation of the SEC's Public Reference Room may be obtained by calling 1-800-SEC-0330.
For a complete list of a fund's portfolio holdings, view the most recent holdings listing, semiannual report, or annual report on Fidelity's web site at http://www.fidelity.com, http://www.institutional.fidelity.com, or http://www.401k.com, as applicable.
NOT FDIC INSURED •MAY LOSE VALUE •NO BANK GUARANTEE
Neither the Fund nor Fidelity Distributors Corporation is a bank.
Investment Summary (Unaudited)
Top Ten Stocks as of January 31, 2019
| | % of fund's net assets |
| Gray Television, Inc. | 2.6 |
| Moog, Inc. Class A | 2.4 |
| ShawCor Ltd. Class A | 2.3 |
| BJ's Wholesale Club Holdings, Inc. | 2.3 |
| CBIZ, Inc. | 2.3 |
| Taylor Morrison Home Corp. | 2.3 |
| Standard Motor Products, Inc. | 2.3 |
| Regal Beloit Corp. | 2.2 |
| Store Capital Corp. | 2.2 |
| Rexford Industrial Realty, Inc. | 2.1 |
| | 23.0 |
Top Five Market Sectors as of January 31, 2019
| | % of fund's net assets |
| Financials | 25.8 |
| Industrials | 14.0 |
| Real Estate | 10.6 |
| Information Technology | 10.3 |
| Consumer Discretionary | 9.6 |
Asset Allocation (% of fund's net assets)
| As of January 31, 2019* |
| | Stocks | 95.6% |
| | Bonds | 0.5% |
| | Short-Term Investments and Net Other Assets (Liabilities) | 3.9% |

* Foreign investments - 14.7%
Schedule of Investments January 31, 2019 (Unaudited)
Showing Percentage of Net Assets
| Common Stocks - 95.6% | | | |
| | | Shares | Value |
| COMMUNICATION SERVICES - 2.6% | | | |
| Media - 2.6% | | | |
| Gray Television, Inc. (a) | | 3,227,600 | $53,933,193 |
| CONSUMER DISCRETIONARY - 9.6% | | | |
| Auto Components - 2.3% | | | |
| Standard Motor Products, Inc. | | 962,772 | 47,329,872 |
| Hotels, Restaurants & Leisure - 1.4% | | | |
| Bluegreen Vacations Corp. (b) | | 1,460,368 | 19,568,931 |
| Wyndham Destinations, Inc. | | 217,841 | 9,179,820 |
| | | | 28,748,751 |
| Household Durables - 2.3% | | | |
| Taylor Morrison Home Corp. (a) | | 2,505,200 | 47,348,280 |
| Specialty Retail - 3.1% | | | |
| Aaron's, Inc. Class A | | 810,500 | 40,573,630 |
| Sally Beauty Holdings, Inc. (a) | | 1,473,100 | 25,366,782 |
| | | | 65,940,412 |
| Textiles, Apparel & Luxury Goods - 0.5% | | | |
| G-III Apparel Group Ltd. (a) | | 323,400 | 11,276,958 |
|
| TOTAL CONSUMER DISCRETIONARY | | | 200,644,273 |
|
| CONSUMER STAPLES - 5.1% | | | |
| Food & Staples Retailing - 2.3% | | | |
| BJ's Wholesale Club Holdings, Inc. | | 1,822,200 | 47,942,082 |
| Food Products - 2.1% | | | |
| Nomad Foods Ltd. (a) | | 2,437,300 | 44,675,709 |
| Tobacco - 0.7% | | | |
| Universal Corp. | | 244,800 | 14,124,960 |
|
| TOTAL CONSUMER STAPLES | | | 106,742,751 |
|
| ENERGY - 6.0% | | | |
| Energy Equipment & Services - 3.3% | | | |
| Oil States International, Inc. (a) | | 1,187,700 | 20,452,194 |
| ShawCor Ltd. Class A | | 3,200,400 | 49,371,824 |
| | | | 69,824,018 |
| Oil, Gas & Consumable Fuels - 2.7% | | | |
| Berry Petroleum Corp. | | 994,703 | 11,727,548 |
| Gulfport Energy Corp. (a) | | 1,137,400 | 9,542,786 |
| Southwestern Energy Co. (a) | | 4,850,200 | 21,195,374 |
| Whiting Petroleum Corp. (a) | | 493,300 | 14,123,179 |
| | | | 56,588,887 |
|
| TOTAL ENERGY | | | 126,412,905 |
|
| FINANCIALS - 25.8% | | | |
| Banks - 14.0% | | | |
| Associated Banc-Corp. | | 255,400 | 5,529,410 |
| BOK Financial Corp. | | 66,900 | 5,560,059 |
| Cadence Bancorp Class A | | 1,705,200 | 31,972,500 |
| Cullen/Frost Bankers, Inc. | | 104,700 | 10,185,216 |
| CVB Financial Corp. | | 1,044,600 | 22,887,186 |
| Equity Bancshares, Inc. (a) | | 582,752 | 18,502,376 |
| First Citizens Bancshares, Inc. | | 104,724 | 42,678,172 |
| Heartland Financial U.S.A., Inc. | | 717,000 | 32,523,120 |
| Hilltop Holdings, Inc. | | 1,547,700 | 28,493,157 |
| Popular, Inc. | | 740,200 | 40,422,322 |
| Trico Bancshares | | 650,251 | 24,527,468 |
| Umpqua Holdings Corp. | | 1,311,892 | 23,194,251 |
| United Community Bank, Inc. | | 251,948 | 6,480,103 |
| | | | 292,955,340 |
| Capital Markets - 2.1% | | | |
| Morningstar, Inc. | | 161,600 | 20,062,640 |
| OM Asset Management Ltd. | | 1,928,201 | 23,851,846 |
| | | | 43,914,486 |
| Consumer Finance - 0.2% | | | |
| Green Dot Corp. Class A (a) | | 71,800 | 5,314,636 |
| Diversified Financial Services - 1.2% | | | |
| Donnelley Financial Solutions, Inc. (a) | | 1,673,078 | 24,493,862 |
| Insurance - 6.8% | | | |
| Argo Group International Holdings, Ltd. | | 338,297 | 22,577,942 |
| Axis Capital Holdings Ltd. | | 204,600 | 10,956,330 |
| Enstar Group Ltd. (a) | | 245,200 | 43,645,600 |
| First American Financial Corp. | | 742,875 | 37,203,180 |
| Primerica, Inc. | | 250,800 | 28,182,396 |
| | | | 142,565,448 |
| Thrifts & Mortgage Finance - 1.5% | | | |
| Beneficial Bancorp, Inc. | | 2,071,828 | 32,299,799 |
|
| TOTAL FINANCIALS | | | 541,543,571 |
|
| HEALTH CARE - 2.7% | | | |
| Health Care Equipment & Supplies - 0.2% | | | |
| LivaNova PLC (a) | | 44,351 | 4,094,484 |
| Health Care Technology - 0.9% | | | |
| Cegedim SA (a) | | 701,397 | 19,990,193 |
| Pharmaceuticals - 1.6% | | | |
| Prestige Brands Holdings, Inc. (a) | | 1,185,200 | 33,090,784 |
|
| TOTAL HEALTH CARE | | | 57,175,461 |
|
| INDUSTRIALS - 13.5% | | | |
| Aerospace & Defense - 2.4% | | | |
| Moog, Inc. Class A | | 569,700 | 50,971,059 |
| Air Freight & Logistics - 0.1% | | | |
| Echo Global Logistics, Inc. (a) | | 86,813 | 2,062,677 |
| Building Products - 0.8% | | | |
| GMS, Inc. (a) | | 850,700 | 16,103,751 |
| Commercial Services & Supplies - 1.4% | | | |
| Deluxe Corp. | | 348,800 | 16,383,136 |
| Knoll, Inc. | | 701,391 | 14,140,043 |
| | | | 30,523,179 |
| Electrical Equipment - 2.2% | | | |
| Regal Beloit Corp. | | 605,968 | 46,514,104 |
| Machinery - 1.5% | | | |
| Apergy Corp. (a) | | 632,200 | 21,254,564 |
| Luxfer Holdings PLC sponsored | | 237,945 | 4,737,485 |
| Mueller Industries, Inc. | | 236,300 | 6,122,533 |
| | | | 32,114,582 |
| Professional Services - 2.3% | | | |
| CBIZ, Inc. (a) | | 2,427,363 | 47,576,315 |
| Road & Rail - 1.2% | | | |
| Genesee & Wyoming, Inc. Class A (a) | | 313,400 | 24,608,168 |
| Trading Companies & Distributors - 1.6% | | | |
| Applied Industrial Technologies, Inc. | | 324,800 | 19,166,448 |
| Titan Machinery, Inc. (a) | | 736,100 | 13,794,514 |
| | | | 32,960,962 |
|
| TOTAL INDUSTRIALS | | | 283,434,797 |
|
| INFORMATION TECHNOLOGY - 10.3% | | | |
| Electronic Equipment & Components - 4.6% | | | |
| SYNNEX Corp. | | 301,060 | 29,130,566 |
| Tech Data Corp. (a) | | 385,500 | 36,865,365 |
| TTM Technologies, Inc. (a) | | 2,635,800 | 30,258,984 |
| | | | 96,254,915 |
| IT Services - 5.2% | | | |
| Computer Services, Inc. | | 590,644 | 33,076,064 |
| EVERTEC, Inc. | | 870,300 | 24,081,201 |
| Hackett Group, Inc. (c) | | 1,726,491 | 31,059,573 |
| Presidio, Inc. | | 1,320,078 | 21,028,843 |
| | | | 109,245,681 |
| Software - 0.5% | | | |
| j2 Global, Inc. | | 143,300 | 10,770,428 |
|
| TOTAL INFORMATION TECHNOLOGY | | | 216,271,024 |
|
| MATERIALS - 4.7% | | | |
| Chemicals - 2.6% | | | |
| Olin Corp. | | 1,214,200 | 28,667,262 |
| Orion Engineered Carbons SA | | 932,100 | 25,716,639 |
| | | | 54,383,901 |
| Containers & Packaging - 2.1% | | | |
| Silgan Holdings, Inc. | | 1,605,300 | 44,338,386 |
|
| TOTAL MATERIALS | | | 98,722,287 |
|
| REAL ESTATE - 10.6% | | | |
| Equity Real Estate Investment Trusts (REITs) - 10.6% | | | |
| CareTrust (REIT), Inc. | | 1,716,800 | 37,735,264 |
| Clipper Realty, Inc. | | 604,151 | 7,823,755 |
| Corporate Office Properties Trust (SBI) | | 1,379,332 | 34,055,707 |
| Equity Commonwealth | | 759,200 | 24,567,712 |
| Four Corners Property Trust, Inc. | | 963,200 | 27,200,768 |
| Rexford Industrial Realty, Inc. | | 1,347,900 | 45,289,440 |
| Store Capital Corp. | | 1,404,200 | 45,383,744 |
| | | | 222,056,390 |
| UTILITIES - 4.7% | | | |
| Electric Utilities - 4.3% | | | |
| El Paso Electric Co. | | 517,100 | 27,158,092 |
| IDACORP, Inc. | | 443,500 | 43,241,250 |
| Portland General Electric Co. | | 416,100 | 20,105,952 |
| | | | 90,505,294 |
| Independent Power and Renewable Electricity Producers - 0.4% | | | |
| NRG Yield, Inc. Class C | | 504,811 | 7,617,598 |
|
| TOTAL UTILITIES | | | 98,122,892 |
|
| TOTAL COMMON STOCKS | | | |
| (Cost $1,923,671,372) | | | 2,005,059,544 |
| | | Principal Amount | Value |
|
| Nonconvertible Bonds - 0.5% | | | |
| INDUSTRIALS - 0.5% | | | |
| Machinery - 0.5% | | | |
Mueller Industries, Inc. 6% 3/1/27
(Cost $10,499,000) | | 10,499,000 | 9,790,318 |
| | | Shares | Value |
|
| Money Market Funds - 3.9% | | | |
| Fidelity Cash Central Fund, 2.43% (d) | | 81,036,938 | 81,053,145 |
| Fidelity Securities Lending Cash Central Fund 2.43% (d)(e) | | 884,295 | 884,383 |
| TOTAL MONEY MARKET FUNDS | | | |
| (Cost $81,937,528) | | | 81,937,528 |
| TOTAL INVESTMENT IN SECURITIES - 100.0% | | | |
| (Cost $2,016,107,900) | | | 2,096,787,390 |
| NET OTHER ASSETS (LIABILITIES) - 0.0% | | | (374,041) |
| NET ASSETS - 100% | | | $2,096,413,349 |
Legend
(a) Non-income producing
(b) Security or a portion of the security is on loan at period end.
(c) Affiliated company
(d) Affiliated fund that is generally available only to investment companies and other accounts managed by Fidelity Investments. The rate quoted is the annualized seven-day yield of the fund at period end. A complete unaudited listing of the fund's holdings as of its most recent quarter end is available upon request. In addition, each Fidelity Central Fund's financial statements are available on the SEC's website or upon request.
(e) Investment made with cash collateral received from securities on loan.
Affiliated Central Funds
Information regarding fiscal year to date income earned by the Fund from investments in Fidelity Central Funds is as follows:
| Fund | Income earned |
| Fidelity Cash Central Fund | $424,462 |
| Fidelity Securities Lending Cash Central Fund | 49,867 |
| Total | $474,329 |
Amounts in the income column in the above table include any capital gain distributions from underlying funds, which are presented in the corresponding line-item in the Statement of Operations, if applicable.
Other Affiliated Issuers
An affiliated company is a company in which the Fund has ownership of at least 5% of the voting securities. Fiscal year to date transactions with companies which are or were affiliates are as follows:
| Affiliate | Value, beginning of period | Purchases | Sales Proceeds | Dividend Income | Realized Gain (loss) | Change in Unrealized appreciation (depreciation) | Value, end of period |
| Beneficial Bancorp, Inc. | $70,619,250 | $-- | $37,016,799 | $184,525 | $(813,029) | $(489,623) | $-- |
| Hackett Group, Inc. | 4,463,471 | 29,001,878 | -- | 292,910 | -- | (2,405,776) | 31,059,573 |
| Standard Motor Products, Inc. | 61,899,800 | 2,703,509 | 14,805,771 | 509,166 | (531,518) | (1,936,148) | -- |
| Total | $136,982,521 | $31,705,387 | $51,822,570 | $986,601 | $(1,344,547) | $(4,831,547) | $31,059,573 |
Investment Valuation
The following is a summary of the inputs used, as of January 31, 2019, involving the Fund's assets and liabilities carried at fair value. The inputs or methodology used for valuing securities may not be an indication of the risk associated with investing in those securities. For more information on valuation inputs, and their aggregation into the levels used below, please refer to the Investment Valuation section in the accompanying Notes to Financial Statements.
| | Valuation Inputs at Reporting Date: |
| Description | Total | Level 1 | Level 2 | Level 3 |
| Investments in Securities: | | | | |
| Equities: | | | | |
| Communication Services | $53,933,193 | $53,933,193 | $-- | $-- |
| Consumer Discretionary | 200,644,273 | 200,644,273 | -- | -- |
| Consumer Staples | 106,742,751 | 106,742,751 | -- | -- |
| Energy | 126,412,905 | 126,412,905 | -- | -- |
| Financials | 541,543,571 | 541,543,571 | -- | -- |
| Health Care | 57,175,461 | 57,175,461 | -- | -- |
| Industrials | 283,434,797 | 283,434,797 | -- | -- |
| Information Technology | 216,271,024 | 216,271,024 | -- | -- |
| Materials | 98,722,287 | 98,722,287 | -- | -- |
| Real Estate | 222,056,390 | 222,056,390 | -- | -- |
| Utilities | 98,122,892 | 98,122,892 | -- | -- |
| Corporate Bonds | 9,790,318 | -- | 9,790,318 | -- |
| Money Market Funds | 81,937,528 | 81,937,528 | -- | -- |
| Total Investments in Securities: | $2,096,787,390 | $2,086,997,072 | $9,790,318 | $-- |
Other Information
Distribution of investments by country or territory of incorporation, as a percentage of Total Net Assets, is as follows (Unaudited):
| United States of America | 85.3% |
| Bermuda | 3.7% |
| Puerto Rico | 3.0% |
| Canada | 2.3% |
| British Virgin Islands | 2.1% |
| United Kingdom | 1.5% |
| Luxembourg | 1.2% |
| Others (Individually Less Than 1%) | 0.9% |
| | 100.0% |
See accompanying notes which are an integral part of the financial statements.
Financial Statements
Statement of Assets and Liabilities
| | | January 31, 2019 (Unaudited) |
| Assets | | |
Investment in securities, at value (including securities loaned of $876,360) — See accompanying schedule:
Unaffiliated issuers (cost $1,900,973,514) | $1,983,790,289 | |
| Fidelity Central Funds (cost $81,937,528) | 81,937,528 | |
| Other affiliated issuers (cost $33,196,858) | 31,059,573 | |
| Total Investment in Securities (cost $2,016,107,900) | | $2,096,787,390 |
| Cash | | 532,937 |
| Receivable for investments sold | | 34,206,081 |
| Receivable for fund shares sold | | 2,919,587 |
| Dividends receivable | | 544,017 |
| Interest receivable | | 262,475 |
| Distributions receivable from Fidelity Central Funds | | 149,428 |
| Prepaid expenses | | 3,494 |
| Other receivables | | 74,319 |
| Total assets | | 2,135,479,728 |
| Liabilities | | |
| Payable for investments purchased | $29,327,446 | |
| Payable for fund shares redeemed | 7,730,372 | |
| Accrued management fee | 654,272 | |
| Distribution and service plan fees payable | 73,842 | |
| Other affiliated payables | 375,874 | |
| Other payables and accrued expenses | 38,023 | |
| Collateral on securities loaned | 866,550 | |
| Total liabilities | | 39,066,379 |
| Net Assets | | $2,096,413,349 |
| Net Assets consist of: | | |
| Paid in capital | | $2,012,539,693 |
| Total distributable earnings (loss) | | 83,873,656 |
| Net Assets | | $2,096,413,349 |
| Net Asset Value and Maximum Offering Price | | |
| Class A: | | |
| Net Asset Value and redemption price per share ($122,184,394 ÷ 8,749,400 shares) | | $13.96 |
| Maximum offering price per share (100/94.25 of $13.96) | | $14.81 |
| Class M: | | |
| Net Asset Value and redemption price per share ($56,754,135 ÷ 4,190,049 shares) | | $13.54 |
| Maximum offering price per share (100/96.50 of $13.54) | | $14.03 |
| Class C: | | |
| Net Asset Value and offering price per share ($32,360,656 ÷ 2,623,509 shares)(a) | | $12.33 |
| Small Cap Value: | | |
| Net Asset Value, offering price and redemption price per share ($1,601,881,273 ÷ 112,081,127 shares) | | $14.29 |
| Class I: | | |
| Net Asset Value, offering price and redemption price per share ($269,386,140 ÷ 18,843,698 shares) | | $14.30 |
| Class Z: | | |
| Net Asset Value, offering price and redemption price per share ($13,846,751 ÷ 969,111 shares) | | $14.29 |
(a) Redemption price per share is equal to net asset value less any applicable contingent deferred sales charge.
See accompanying notes which are an integral part of the financial statements.
Statement of Operations
| | | Six months ended January 31, 2019 (Unaudited) |
| Investment Income | | |
| Dividends (including $986,601 earned from other affiliated issuers) | | $22,272,457 |
| Interest | | 314,970 |
| Income from Fidelity Central Funds | | 474,329 |
| Total income | | 23,061,756 |
| Expenses | | |
| Management fee | | |
| Basic fee | $8,142,150 | |
| Performance adjustment | (3,050,737) | |
| Transfer agent fees | 2,155,728 | |
| Distribution and service plan fees | 525,655 | |
| Accounting and security lending fees | 355,782 | |
| Custodian fees and expenses | 29,989 | |
| Independent trustees' fees and expenses | 8,317 | |
| Registration fees | 91,005 | |
| Audit | 33,698 | |
| Legal | 4,627 | |
| Interest | 12,289 | |
| Miscellaneous | 7,730 | |
| Total expenses before reductions | 8,316,233 | |
| Expense reductions | (204,817) | |
| Total expenses after reductions | | 8,111,416 |
| Net investment income (loss) | | 14,950,340 |
| Realized and Unrealized Gain (Loss) | | |
| Net realized gain (loss) on: | | |
| Investment securities: | | |
| Unaffiliated issuers | 147,338,609 | |
| Fidelity Central Funds | (226) | |
| Other affiliated issuers | (1,344,547) | |
| Foreign currency transactions | (4,824) | |
| Total net realized gain (loss) | | 145,989,012 |
| Change in net unrealized appreciation (depreciation) on: | | |
| Investment securities: | | |
| Unaffiliated issuers | (395,097,718) | |
| Fidelity Central Funds | 112 | |
| Other affiliated issuers | (4,831,547) | |
| Total change in net unrealized appreciation (depreciation) | | (399,929,153) |
| Net gain (loss) | | (253,940,141) |
| Net increase (decrease) in net assets resulting from operations | | $(238,989,801) |
See accompanying notes which are an integral part of the financial statements.
Statement of Changes in Net Assets
| | Six months ended January 31, 2019 (Unaudited) | Year ended July 31, 2018 |
| Increase (Decrease) in Net Assets | | |
| Operations | | |
| Net investment income (loss) | $14,950,340 | $23,855,932 |
| Net realized gain (loss) | 145,989,012 | 580,477,489 |
| Change in net unrealized appreciation (depreciation) | (399,929,153) | (255,980,673) |
| Net increase (decrease) in net assets resulting from operations | (238,989,801) | 348,352,748 |
| Distributions to shareholders | (631,100,391) | – |
| Distributions to shareholders from net investment income | – | (37,440,500) |
| Distributions to shareholders from net realized gain | – | (91,159,109) |
| Total distributions | (631,100,391) | (128,599,609) |
| Share transactions - net increase (decrease) | 178,159,897 | (851,457,506) |
| Redemption fees | – | 89,036 |
| Total increase (decrease) in net assets | (691,930,295) | (631,615,331) |
| Net Assets | | |
| Beginning of period | 2,788,343,644 | 3,419,958,975 |
| End of period | $2,096,413,349 | $2,788,343,644 |
| Other Information | | |
| Undistributed net investment income end of period | | $4,125,965 |
See accompanying notes which are an integral part of the financial statements.
Financial Highlights
Fidelity Small Cap Value Fund Class A
| | Six months ended (Unaudited) January 31, | Years endedJuly 31, | | | | |
| | 2019 | 2018 | 2017 | 2016 | 2015 | 2014 |
| Selected Per–Share Data | | | | | | |
| Net asset value, beginning of period | $20.33 | $19.05 | $17.92 | $19.14 | $19.29 | $19.96 |
| Income from Investment Operations | | | | | | |
| Net investment income (loss)A | .08 | .10B | .20C | .07 | .10D | .03 |
| Net realized and unrealized gain (loss) | (1.64) | 1.87 | 2.23 | .56 | 2.01 | 1.24 |
| Total from investment operations | (1.56) | 1.97 | 2.43 | .63 | 2.11 | 1.27 |
| Distributions from net investment income | (.10) | (.17) | (.10) | (.11) | (.02) | (.01) |
| Distributions from net realized gain | (4.71) | (.52) | (1.20) | (1.75) | (2.25) | (1.93) |
| Total distributions | (4.81) | (.69) | (1.30) | (1.85)E | (2.26)F | (1.94) |
| Redemption fees added to paid in capitalA | – | –G | –G | –G | –G | –G |
| Net asset value, end of period | $13.96 | $20.33 | $19.05 | $17.92 | $19.14 | $19.29 |
| Total ReturnH,I,J | (9.52)% | 10.65% | 14.61% | 4.07% | 11.86% | 6.83% |
| Ratios to Average Net AssetsK,L | | | | | | |
| Expenses before reductions | .92%M | 1.18% | 1.24% | 1.41% | 1.42% | 1.36% |
| Expenses net of fee waivers, if any | .92%M | 1.17% | 1.24% | 1.41% | 1.39% | 1.35% |
| Expenses net of all reductions | .91%M | 1.17% | 1.24% | 1.41% | 1.39% | 1.34% |
| Net investment income (loss) | 1.04%M | .49%B | 1.10%C | .43% | .52%D | .13% |
| Supplemental Data | | | | | | |
| Net assets, end of period (000 omitted) | $122,184 | $162,572 | $184,306 | $218,364 | $235,844 | $258,183 |
| Portfolio turnover rateN | 72%M | 55% | 26% | 33% | 34% | 26%O |
A Calculated based on average shares outstanding during the period.
B Net investment income per share reflects a large, non-recurring dividend which amounted to $.04 per share. Excluding this non-recurring dividend, the ratio of net investment income (loss) to average net assets would have been .29%.
C Net investment income per share reflects a large, non-recurring dividend which amounted to $.09 per share. Excluding this non-recurring dividend, the ratio of net investment income (loss) to average net assets would have been .61%.
D Net investment income per share reflects a large, non-recurring dividend which amounted to $.05 per share. Excluding this non-recurring dividend, the ratio of net investment income (loss) to average net assets would have been .26%.
E Total distributions of $1.85 per share is comprised of distributions from net investment income of $.105 and distributions from net realized gain of $1.747 per share.
F Total distributions of $2.26 per share is comprised of distributions from net investment income of $.016 and distributions from net realized gain of $2.248 per share.
G Amount represents less than $.005 per share.
H Total returns for periods of less than one year are not annualized.
I Total returns would have been lower if certain expenses had not been reduced during the applicable periods shown.
J Total returns do not include the effect of the sales charges.
K Fees and expenses of any underlying Fidelity Central Funds are not included in the Fund's expense ratio. The Fund indirectly bears its proportionate share of the expenses of any underlying Fidelity Central Funds.
L Expense ratios reflect operating expenses of the class. Expenses before reductions do not reflect amounts reimbursed by the investment adviser or reductions from brokerage service arrangements or reductions from other expense offset arrangements and do not represent the amount paid by the class during periods when reimbursements or reductions occur. Expenses net of fee waivers reflect expenses after reimbursement by the investment adviser but prior to reductions from brokerage service arrangements or other expense offset arrangements. Expenses net of all reductions represent the net expenses paid by the class.
M Annualized
N Amount does not include the portfolio activity of any underlying Fidelity Central Funds.
O Portfolio turnover rate excludes securities received or delivered in-kind.
See accompanying notes which are an integral part of the financial statements.
Fidelity Small Cap Value Fund Class M
| | Six months ended (Unaudited) January 31, | Years endedJuly 31, | | | | |
| | 2019 | 2018 | 2017 | 2016 | 2015 | 2014 |
| Selected Per–Share Data | | | | | | |
| Net asset value, beginning of period | $19.84 | $18.61 | $17.54 | $18.78 | $18.98 | $19.70 |
| Income from Investment Operations | | | | | | |
| Net investment income (loss)A | .06 | .05B | .15C | .03 | .05D | (.02) |
| Net realized and unrealized gain (loss) | (1.60) | 1.82 | 2.18 | .54 | 1.98 | 1.23 |
| Total from investment operations | (1.54) | 1.87 | 2.33 | .57 | 2.03 | 1.21 |
| Distributions from net investment income | (.05) | (.13) | (.07) | (.06) | – | – |
| Distributions from net realized gain | (4.71) | (.52) | (1.20) | (1.75) | (2.23) | (1.93) |
| Total distributions | (4.76) | (.64)E | (1.26)F | (1.81) | (2.23) | (1.93) |
| Redemption fees added to paid in capitalA | – | –G | –G | –G | –G | –G |
| Net asset value, end of period | $13.54 | $19.84 | $18.61 | $17.54 | $18.78 | $18.98 |
| Total ReturnH,I,J | (9.62)% | 10.39% | 14.35% | 3.76% | 11.58% | 6.58% |
| Ratios to Average Net AssetsK,L | | | | | | |
| Expenses before reductions | 1.17%M | 1.42% | 1.49% | 1.66% | 1.67% | 1.61% |
| Expenses net of fee waivers, if any | 1.17%M | 1.42% | 1.49% | 1.66% | 1.64% | 1.59% |
| Expenses net of all reductions | 1.15%M | 1.41% | 1.49% | 1.65% | 1.63% | 1.59% |
| Net investment income (loss) | .80%M | .25%B | .86%C | .19% | .27%D | (.11)% |
| Supplemental Data | | | | | | |
| Net assets, end of period (000 omitted) | $56,754 | $69,380 | $78,852 | $82,337 | $91,716 | $100,975 |
| Portfolio turnover rateN | 72%M | 55% | 26% | 33% | 34% | 26%O |
A Calculated based on average shares outstanding during the period.
B Net investment income per share reflects a large, non-recurring dividend which amounted to $.04 per share. Excluding this non-recurring dividend, the ratio of net investment income (loss) to average net assets would have been .04%.
C Net investment income per share reflects a large, non-recurring dividend which amounted to $.09 per share. Excluding this non-recurring dividend, the ratio of net investment income (loss) to average net assets would have been .36%.
D Net investment income per share reflects a large, non-recurring dividend which amounted to $.05 per share. Excluding this non-recurring dividend, the ratio of net investment income (loss) to average net assets would have been .01%.
E Total distributions of $.64 per share is comprised of distributions from net investment income of $.125 and distributions from net realized gain of $.519 per share.
F Total distributions of $1.26 per share is comprised of distributions from net investment income of $.067 and distributions from net realized gain of $1.195 per share.
G Amount represents less than $.005 per share.
H Total returns for periods of less than one year are not annualized.
I Total returns would have been lower if certain expenses had not been reduced during the applicable periods shown.
J Total returns do not include the effect of the sales charges.
K Fees and expenses of any underlying Fidelity Central Funds are not included in the Fund's expense ratio. The Fund indirectly bears its proportionate share of the expenses of any underlying Fidelity Central Funds.
L Expense ratios reflect operating expenses of the class. Expenses before reductions do not reflect amounts reimbursed by the investment adviser or reductions from brokerage service arrangements or reductions from other expense offset arrangements and do not represent the amount paid by the class during periods when reimbursements or reductions occur. Expenses net of fee waivers reflect expenses after reimbursement by the investment adviser but prior to reductions from brokerage service arrangements or other expense offset arrangements. Expenses net of all reductions represent the net expenses paid by the class.
M Annualized
N Amount does not include the portfolio activity of any underlying Fidelity Central Funds.
O Portfolio turnover rate excludes securities received or delivered in-kind.
See accompanying notes which are an integral part of the financial statements.
Fidelity Small Cap Value Fund Class C
| | Six months ended (Unaudited) January 31, | Years endedJuly 31, | | | | |
| | 2019 | 2018 | 2017 | 2016 | 2015 | 2014 |
| Selected Per–Share Data | | | | | | |
| Net asset value, beginning of period | $18.50 | $17.39 | $16.52 | $17.82 | $18.19 | $19.06 |
| Income from Investment Operations | | | | | | |
| Net investment income (loss)A | .02 | (.05)B | .06C | (.05) | (.04)D | (.12) |
| Net realized and unrealized gain (loss) | (1.47) | 1.71 | 2.04 | .50 | 1.90 | 1.18 |
| Total from investment operations | (1.45) | 1.66 | 2.10 | .45 | 1.86 | 1.06 |
| Distributions from net investment income | (.02) | (.03) | (.04) | – | – | – |
| Distributions from net realized gain | (4.71) | (.52) | (1.20) | (1.75) | (2.23) | (1.93) |
| Total distributions | (4.72)E | (.55) | (1.23)F | (1.75) | (2.23) | (1.93) |
| Redemption fees added to paid in capitalA | – | –G | –G | –G | –G | –G |
| Net asset value, end of period | $12.33 | $18.50 | $17.39 | $16.52 | $17.82 | $18.19 |
| Total ReturnH,I,J | (9.87)% | 9.84% | 13.79% | 3.20% | 11.05% | 5.97% |
| Ratios to Average Net AssetsK,L | | | | | | |
| Expenses before reductions | 1.68%M | 1.93% | 2.00% | 2.18% | 2.19% | 2.12% |
| Expenses net of fee waivers, if any | 1.68%M | 1.93% | 2.00% | 2.17% | 2.16% | 2.11% |
| Expenses net of all reductions | 1.66%M | 1.92% | 2.00% | 2.17% | 2.15% | 2.10% |
| Net investment income (loss) | .28%M | (.26)%B | .35%C | (.33)% | (.25)%D | (.63)% |
| Supplemental Data | | | | | | |
| Net assets, end of period (000 omitted) | $32,361 | $44,396 | $52,227 | $57,231 | $64,928 | $70,541 |
| Portfolio turnover rateN | 72%M | 55% | 26% | 33% | 34% | 26%O |
A Calculated based on average shares outstanding during the period.
B Net investment income per share reflects a large, non-recurring dividend which amounted to $.04 per share. Excluding this non-recurring dividend, the ratio of net investment income (loss) to average net assets would have been (.47) %.
C Net investment income per share reflects a large, non-recurring dividend which amounted to $.08 per share. Excluding this non-recurring dividend, the ratio of net investment income (loss) to average net assets would have been (.15) %.
D Net investment income per share reflects a large, non-recurring dividend which amounted to $.05 per share. Excluding this non-recurring dividend, the ratio of net investment income (loss) to average net assets would have been (.51) %.
E Total distributions of $4.72 per share is comprised of distributions from net investment income of $.016 and distributions from net realized gain of $4.707 per share.
F Total distributions of $1.23 per share is comprised of distributions from net investment income of $.036 and distributions from net realized gain of $1.195 per share.
G Amount represents less than $.005 per share.
H Total returns for periods of less than one year are not annualized.
I Total returns would have been lower if certain expenses had not been reduced during the applicable periods shown.
J Total returns do not include the effect of the contingent deferred sales charge.
K Fees and expenses of any underlying Fidelity Central Funds are not included in the Fund's expense ratio. The Fund indirectly bears its proportionate share of the expenses of any underlying Fidelity Central Funds.
L Expense ratios reflect operating expenses of the class. Expenses before reductions do not reflect amounts reimbursed by the investment adviser or reductions from brokerage service arrangements or reductions from other expense offset arrangements and do not represent the amount paid by the class during periods when reimbursements or reductions occur. Expenses net of fee waivers reflect expenses after reimbursement by the investment adviser but prior to reductions from brokerage service arrangements or other expense offset arrangements. Expenses net of all reductions represent the net expenses paid by the class.
M Annualized
N Amount does not include the portfolio activity of any underlying Fidelity Central Funds.
O Portfolio turnover rate excludes securities received or delivered in-kind.
See accompanying notes which are an integral part of the financial statements.
Fidelity Small Cap Value Fund
| | Six months ended (Unaudited) January 31, | Years endedJuly 31, | | | | |
| | 2019 | 2018 | 2017 | 2016 | 2015 | 2014 |
| Selected Per–Share Data | | | | | | |
| Net asset value, beginning of period | $20.71 | $19.41 | $18.22 | $19.45 | $19.57 | $20.22 |
| Income from Investment Operations | | | | | | |
| Net investment income (loss)A | .11 | .15B | .25C | .12 | .15D | .08 |
| Net realized and unrealized gain (loss) | (1.68) | 1.89 | 2.28 | .55 | 2.05 | 1.26 |
| Total from investment operations | (1.57) | 2.04 | 2.53 | .67 | 2.20 | 1.34 |
| Distributions from net investment income | (.15) | (.22) | (.15) | (.15) | (.07) | (.06) |
| Distributions from net realized gain | (4.71) | (.52) | (1.20) | (1.75) | (2.25) | (1.93) |
| Total distributions | (4.85)E | (.74) | (1.34)F | (1.90) | (2.32) | (1.99) |
| Redemption fees added to paid in capitalA | – | –G | –G | –G | –G | –G |
| Net asset value, end of period | $14.29 | $20.71 | $19.41 | $18.22 | $19.45 | $19.57 |
| Total ReturnH,I | (9.34)% | 10.88% | 14.99% | 4.23% | 12.18% | 7.12% |
| Ratios to Average Net AssetsJ,K | | | | | | |
| Expenses before reductions | .65%L | .91% | .99% | 1.18% | 1.15% | 1.08% |
| Expenses net of fee waivers, if any | .65%L | .91% | .99% | 1.18% | 1.12% | 1.06% |
| Expenses net of all reductions | .64%L | .91% | .99% | 1.17% | 1.12% | 1.06% |
| Net investment income (loss) | 1.31%L | .76%B | 1.36%C | .67% | .78%D | .41% |
| Supplemental Data | | | | | | |
| Net assets, end of period (000 omitted) | $1,601,881 | $2,052,664 | $2,637,843 | $2,460,714 | $2,036,157 | $2,060,546 |
| Portfolio turnover rateM | 72%L | 55% | 26% | 33% | 34% | 26%N |
A Calculated based on average shares outstanding during the period.
B Net investment income per share reflects a large, non-recurring dividend which amounted to $.04 per share. Excluding this non-recurring dividend, the ratio of net investment income (loss) to average net assets would have been .55%.
C Net investment income per share reflects a large, non-recurring dividend which amounted to $.09 per share. Excluding this non-recurring dividend, the ratio of net investment income (loss) to average net assets would have been .86%.
D Net investment income per share reflects a large, non-recurring dividend which amounted to $.05 per share. Excluding this non-recurring dividend, the ratio of net investment income (loss) to average net assets would have been .53%.
E Total distributions of $4.85 per share is comprised of distributions from net investment income of $.145 and distributions from net realized gain of $4.707 per share.
F Total distributions of $1.34 per share is comprised of distributions from net investment income of $.145 and distributions from net realized gain of $1.195 per share.
G Amount represents less than $.005 per share.
H Total returns for periods of less than one year are not annualized.
I Total returns would have been lower if certain expenses had not been reduced during the applicable periods shown.
J Fees and expenses of any underlying Fidelity Central Funds are not included in the Fund's expense ratio. The Fund indirectly bears its proportionate share of the expenses of any underlying Fidelity Central Funds.
K Expense ratios reflect operating expenses of the class. Expenses before reductions do not reflect amounts reimbursed by the investment adviser or reductions from brokerage service arrangements or reductions from other expense offset arrangements and do not represent the amount paid by the class during periods when reimbursements or reductions occur. Expenses net of fee waivers reflect expenses after reimbursement by the investment adviser but prior to reductions from brokerage service arrangements or other expense offset arrangements. Expenses net of all reductions represent the net expenses paid by the class.
L Annualized
M Amount does not include the portfolio activity of any underlying Fidelity Central Funds.
N Portfolio turnover rate excludes securities received or delivered in-kind.
See accompanying notes which are an integral part of the financial statements.
Fidelity Small Cap Value Fund Class I
| | Six months ended (Unaudited) January 31, | Years endedJuly 31, | | | | |
| | 2019 | 2018 | 2017 | 2016 | 2015 | 2014 |
| Selected Per–Share Data | | | | | | |
| Net asset value, beginning of period | $20.72 | $19.41 | $18.23 | $19.45 | $19.57 | $20.23 |
| Income from Investment Operations | | | | | | |
| Net investment income (loss)A | .11 | .15B | .25C | .12 | .15D | .08 |
| Net realized and unrealized gain (loss) | (1.68) | 1.90 | 2.28 | .56 | 2.05 | 1.25 |
| Total from investment operations | (1.57) | 2.05 | 2.53 | .68 | 2.20 | 1.33 |
| Distributions from net investment income | (.15) | (.22) | (.15) | (.16) | (.07) | (.06) |
| Distributions from net realized gain | (4.71) | (.52) | (1.20) | (1.75) | (2.25) | (1.93) |
| Total distributions | (4.85)E | (.74) | (1.35) | (1.90)F | (2.32) | (1.99) |
| Redemption fees added to paid in capitalA | – | –G | –G | –G | –G | –G |
| Net asset value, end of period | $14.30 | $20.72 | $19.41 | $18.23 | $19.45 | $19.57 |
| Total ReturnH,I | (9.32)% | 10.93% | 14.96% | 4.31% | 12.17% | 7.08% |
| Ratios to Average Net AssetsJ,K | | | | | | |
| Expenses before reductions | .66%L | .91% | .98% | 1.14% | 1.15% | 1.09% |
| Expenses net of fee waivers, if any | .66%L | .91% | .97% | 1.14% | 1.12% | 1.07% |
| Expenses net of all reductions | .64%L | .90% | .97% | 1.14% | 1.12% | 1.07% |
| Net investment income (loss) | 1.30%L | .76%B | 1.37%C | .70% | .79%D | .40% |
| Supplemental Data | | | | | | |
| Net assets, end of period (000 omitted) | $269,386 | $459,332 | $466,730 | $389,928 | $376,817 | $342,500 |
| Portfolio turnover rateM | 72%L | 55% | 26% | 33% | 34% | 26%N |
A Calculated based on average shares outstanding during the period.
B Net investment income per share reflects a large, non-recurring dividend which amounted to $.04 per share. Excluding this non-recurring dividend, the ratio of net investment income (loss) to average net assets would have been .55%.
C Net investment income per share reflects a large, non-recurring dividend which amounted to $.09 per share. Excluding this non-recurring dividend, the ratio of net investment income (loss) to average net assets would have been .88%.
D Net investment income per share reflects a large, non-recurring dividend which amounted to $.05 per share. Excluding this non-recurring dividend, the ratio of net investment income (loss) to average net assets would have been .53%.
E Total distributions of $4.85 per share is comprised of distributions from net investment income of $.146 and distributions from net realized gain of $4.707 per share.
F Total distributions of $1.90 per share is comprised of distributions from net investment income of $.157 and distributions from net realized gain of $1.747 per share.
G Amount represents less than $.005 per share.
H Total returns for periods of less than one year are not annualized.
I Total returns would have been lower if certain expenses had not been reduced during the applicable periods shown.
J Fees and expenses of any underlying Fidelity Central Funds are not included in the Fund's expense ratio. The Fund indirectly bears its proportionate share of the expenses of any underlying Fidelity Central Funds.
K Expense ratios reflect operating expenses of the class. Expenses before reductions do not reflect amounts reimbursed by the investment adviser or reductions from brokerage service arrangements or reductions from other expense offset arrangements and do not represent the amount paid by the class during periods when reimbursements or reductions occur. Expenses net of fee waivers reflect expenses after reimbursement by the investment adviser but prior to reductions from brokerage service arrangements or other expense offset arrangements. Expenses net of all reductions represent the net expenses paid by the class.
L Annualized
M Amount does not include the portfolio activity of any underlying Fidelity Central Funds.
N Portfolio turnover rate excludes securities received or delivered in-kind.
See accompanying notes which are an integral part of the financial statements.
Fidelity Small Cap Value Fund Class Z
| | Six months ended (Unaudited) January 31, |
| | 2019 A |
| Selected Per–Share Data | |
| Net asset value, beginning of period | $16.90 |
| Income from Investment Operations | |
| Net investment income (loss)B | .05 |
| Net realized and unrealized gain (loss) | (1.55) |
| Total from investment operations | (1.50) |
| Distributions from net investment income | (.09) |
| Distributions from net realized gain | (1.02) |
| Total distributions | (1.11) |
| Net asset value, end of period | $14.29 |
| Total ReturnC,D | (8.61)% |
| Ratios to Average Net AssetsE,F | |
| Expenses before reductions | .52%G |
| Expenses net of fee waivers, if any | .52%G |
| Expenses net of all reductions | .50%G |
| Net investment income (loss) | 1.07%G |
| Supplemental Data | |
| Net assets, end of period (000 omitted) | $13,847 |
| Portfolio turnover rateH | 72%G |
A For the period October 2, 2018 (commencement of sale of shares) to January 31, 2019.
B Calculated based on average shares outstanding during the period.
C Total returns for periods of less than one year are not annualized.
D Total returns would have been lower if certain expenses had not been reduced during the applicable periods shown.
E Fees and expenses of any underlying Fidelity Central Funds are not included in the Fund's expense ratio. The Fund indirectly bears its proportionate share of the expenses of any underlying Fidelity Central Funds.
F Expense ratios reflect operating expenses of the class. Expenses before reductions do not reflect amounts reimbursed by the investment adviser or reductions from brokerage service arrangements or reductions from other expense offset arrangements and do not represent the amount paid by the class during periods when reimbursements or reductions occur. Expense ratios before reductions for start-up periods may not be representative of longer-term operating periods. Expenses net of fee waivers reflect expenses after reimbursement by the investment adviser but prior to reductions from brokerage service arrangements or other expense offset arrangements. Expenses net of all reductions represent the net expenses paid by the class.
G Annualized
H Amount does not include the portfolio activity of any underlying Fidelity Central Funds.
See accompanying notes which are an integral part of the financial statements.
Notes to Financial Statements (Unaudited)
For the period ended January 31, 2019
1. Organization.
Fidelity Small Cap Value Fund (the Fund) is a fund of Fidelity Securities Fund (the Trust) and is authorized to issue an unlimited number of shares. The Trust is registered under the Investment Company Act of 1940, as amended (the 1940 Act), as an open-end management investment company organized as a Massachusetts business trust. The Fund commenced sale of Class Z shares on October 2, 2018. The Fund offers Class A, Class M, Class C, Small Cap Value, Class I and Class Z shares, each of which has equal rights as to assets and voting privileges. The Fund is closed to new accounts with certain exceptions. Each class has exclusive voting rights with respect to matters that affect that class.
Effective after the close of business on January 31, 2019, all classes of the Fund reopened to new investors.
Effective March 1, 2019, Class C shares will automatically convert to Class A shares after a holding period of ten years from the initial date of purchase, with certain exceptions.
2. Investments in Fidelity Central Funds.
The Fund invests in Fidelity Central Funds, which are open-end investment companies generally available only to other investment companies and accounts managed by the investment adviser and its affiliates. The Fund's Schedule of Investments lists each of the Fidelity Central Funds held as of period end, if any, as an investment of the Fund, but does not include the underlying holdings of each Fidelity Central Fund. As an Investing Fund, the Fund indirectly bears its proportionate share of the expenses of the underlying Fidelity Central Funds.
The Money Market Central Funds seek preservation of capital and current income and are managed by Fidelity Investments Money Management, Inc. (FIMM), an affiliate of the investment adviser. Annualized expenses of the Money Market Central Funds as of their most recent shareholder report date are less than .005%.
A complete unaudited list of holdings for each Fidelity Central Fund is available upon request or at the Securities and Exchange Commission (the SEC) website at www.sec.gov. In addition, the financial statements of the Fidelity Central Funds are available on the SEC website or upon request.
3. Significant Accounting Policies.
The Fund is an investment company and applies the accounting and reporting guidance of the Financial Accounting Standards Board (FASB) Accounting Standards Codification Topic 946 Financial Services – Investments Companies. The financial statements have been prepared in conformity with accounting principles generally accepted in the United States of America (GAAP), which require management to make certain estimates and assumptions at the date of the financial statements. Actual results could differ from those estimates. Subsequent events, if any, through the date that the financial statements were issued have been evaluated in the preparation of the financial statements. The following summarizes the significant accounting policies of the Fund:
Investment Valuation. Investments are valued as of 4:00 p.m. Eastern time on the last calendar day of the period. The Board of Trustees (the Board) has delegated the day to day responsibility for the valuation of the Fund's investments to the Fair Value Committee (the Committee) established by the Fund's investment adviser. In accordance with valuation policies and procedures approved by the Board, the Fund attempts to obtain prices from one or more third party pricing vendors or brokers to value its investments. When current market prices, quotations or currency exchange rates are not readily available or reliable, investments will be fair valued in good faith by the Committee, in accordance with procedures adopted by the Board. Factors used in determining fair value vary by investment type and may include market or investment specific events, changes in interest rates and credit quality. The frequency with which these procedures are used cannot be predicted and they may be utilized to a significant extent. The Committee oversees the Fund's valuation policies and procedures and reports to the Board on the Committee's activities and fair value determinations. The Board monitors the appropriateness of the procedures used in valuing the Fund's investments and ratifies the fair value determinations of the Committee.
The Fund categorizes the inputs to valuation techniques used to value its investments into a disclosure hierarchy consisting of three levels as shown below:
- Level 1 – quoted prices in active markets for identical investments
- Level 2 – other significant observable inputs (including quoted prices for similar investments, interest rates, prepayment speeds, etc.)
- Level 3 – unobservable inputs (including the Fund's own assumptions based on the best information available)
Valuation techniques used to value the Fund's investments by major category are as follows:
Equity securities, including restricted securities, for which market quotations are readily available, are valued at the last reported sale price or official closing price as reported by a third party pricing vendor on the primary market or exchange on which they are traded and are categorized as Level 1 in the hierarchy. In the event there were no sales during the day or closing prices are not available, securities are valued at the last quoted bid price or may be valued using the last available price and are generally categorized as Level 2 in the hierarchy. For foreign equity securities, when market or security specific events arise, comparisons to the valuation of American Depositary Receipts (ADRs), futures contracts, Exchange-Traded Funds (ETFs) and certain indexes as well as quoted prices for similar securities may be used and would be categorized as Level 2 in the hierarchy. For equity securities, including restricted securities, where observable inputs are limited, assumptions about market activity and risk are used and these securities may be categorized as Level 3 in the hierarchy.
Debt securities, including restricted securities, are valued based on evaluated prices received from third party pricing vendors or from brokers who make markets in such securities. Corporate bonds are valued by pricing vendors who utilize matrix pricing which considers yield or price of bonds of comparable quality, coupon, maturity and type or by broker-supplied prices. When independent prices are unavailable or unreliable, debt securities may be valued utilizing pricing methodologies which consider similar factors that would be used by third party pricing vendors. Debt securities are generally categorized as Level 2 in the hierarchy but may be Level 3 depending on the circumstances.
Investments in open-end mutual funds, including the Fidelity Central Funds, are valued at their closing net asset value (NAV) each business day and are categorized as Level 1 in the hierarchy.
Changes in valuation techniques may result in transfers in or out of an assigned level within the disclosure hierarchy. The aggregate value of investments by input level as of January 31, 2019 is included at the end of the Fund's Schedule of Investments.
Foreign Currency. The Fund may use foreign currency contracts to facilitate transactions in foreign-denominated securities. Gains and losses from these transactions may arise from changes in the value of the foreign currency or if the counterparties do not perform under the contracts' terms.
Foreign-denominated assets, including investment securities, and liabilities are translated into U.S. dollars at the exchange rates at period end. Purchases and sales of investment securities, income and dividends received and expenses denominated in foreign currencies are translated into U.S. dollars at the exchange rate in effect on the transaction date.
The effects of exchange rate fluctuations on investments are included with the net realized and unrealized gain (loss) on investment securities. Other foreign currency transactions resulting in realized and unrealized gain (loss) are disclosed separately.
Investment Transactions and Income. For financial reporting purposes, the Fund's investment holdings and NAV include trades executed through the end of the last business day of the period. The NAV per share for processing shareholder transactions is calculated as of the close of business of the New York Stock Exchange (NYSE), normally 4:00 p.m. Eastern time and includes trades executed through the end of the prior business day. Gains and losses on securities sold are determined on the basis of identified cost and include proceeds received from litigation. Dividend income is recorded on the ex-dividend date, except for certain dividends from foreign securities where the ex-dividend date may have passed, which are recorded as soon as the Fund is informed of the ex-dividend date. Non-cash dividends included in dividend income, if any, are recorded at the fair market value of the securities received. Income and capital gain distributions from Fidelity Central Funds, if any, are recorded on the ex-dividend date. Certain distributions received by the Fund represent a return of capital or capital gain. The Fund determines the components of these distributions subsequent to the ex-dividend date, based upon receipt of tax filings or other correspondence relating to the underlying investment. These distributions are recorded as a reduction of cost of investments and/or as a realized gain. Interest income is accrued as earned and includes coupon interest and amortization of premium and accretion of discount on debt securities as applicable. Investment income is recorded net of foreign taxes withheld where recovery of such taxes is uncertain.
Class Allocations and Expenses. Investment income, realized and unrealized capital gains and losses, common expenses of the Fund, and certain fund-level expense reductions, if any, are allocated daily on a pro-rata basis to each class based on the relative net assets of each class to the total net assets of the Fund. Each class differs with respect to transfer agent and distribution and service plan fees incurred. Certain expense reductions may also differ by class. For the reporting period, the allocated portion of income and expenses to each class as a percent of its average net assets may vary due to the timing of recording these transactions in relation to fluctuating net assets of the classes. Expenses directly attributable to a fund are charged to that fund. Expenses attributable to more than one fund are allocated among the respective funds on the basis of relative net assets or other appropriate methods. Expense estimates are accrued in the period to which they relate and adjustments are made when actual amounts are known.
Income Tax Information and Distributions to Shareholders. Each year, the Fund intends to qualify as a regulated investment company under Subchapter M of the Internal Revenue Code, including distributing substantially all of its taxable income and realized gains. As a result, no provision for U.S. Federal income taxes is required. The Fund files a U.S. federal tax return, in addition to state and local tax returns as required. The Fund's federal income tax returns are subject to examination by the Internal Revenue Service (IRS) for a period of three fiscal years after they are filed. State and local tax returns may be subject to examination for an additional fiscal year depending on the jurisdiction. Foreign taxes are provided for based on the Fund's understanding of the tax rules and rates that exist in the foreign markets in which it invests.
Distributions are declared and recorded on the ex-dividend date. Income and capital gain distributions are declared separately for each class. Income and capital gain distributions are determined in accordance with income tax regulations, which may differ from GAAP.
Capital accounts within the financial statements are adjusted for permanent book-tax differences. These adjustments have no impact on net assets or the results of operations. Capital accounts are not adjusted for temporary book-tax differences which will reverse in a subsequent period.
Book-tax differences are primarily due to foreign currency transactions, passive foreign investment companies (PFIC), partnerships and losses deferred due to wash sales.
As of period end, the cost and unrealized appreciation (depreciation) in securities, and derivatives if applicable, for federal income tax purposes were as follows:
| Gross unrealized appreciation | $282,511,665 |
| Gross unrealized depreciation | (204,181,046) |
| Net unrealized appreciation (depreciation) | $78,330,619 |
| Tax cost | $2,018,456,771 |
New Rule Issuance. During August 2018, the U.S. Securities and Exchange Commission issued Final Rule Release No. 33-10532, Disclosure Update and Simplification. This Final Rule includes amendments specific to registered investment companies that are intended to eliminate overlap in disclosure requirements between Regulation S-X and GAAP. In accordance with these amendments, certain line-items in the Fund's financial statements have been combined or removed for the current period as outlined in the table below.
| Financial Statement | Current Line-Item Presentation (As Applicable) | Prior Line-Item Presentation (As Applicable) |
| Statement of Assets and Liabilities | Total distributable earnings (loss) | Undistributed/Distributions in excess of/Accumulated net investment income (loss)
Accumulated/Undistributed net realized gain (loss)
Net unrealized appreciation (depreciation) |
| Statement of Changes in Net Assets | N/A - removed | Undistributed/Distributions in excess of/Accumulated net investment income (loss) end of period |
| Statement of Changes in Net Assets | Distributions to shareholders | Distributions to shareholders from net investment income
Distributions to shareholders from net realized gain |
| Distributions to Shareholders Note to Financial Statements | Distributions to shareholders | Distributions to shareholders from net investment income
Distributions to shareholders from net realized gain |
4. Purchases and Sales of Investments.
Purchases and sales of securities, other than short-term securities, aggregated $846,202,038 and $1,281,005,972, respectively.
5. Fees and Other Transactions with Affiliates.
Management Fee. Fidelity Management & Research Company (the investment adviser) and its affiliates provide the Fund with investment management related services for which the Fund pays a monthly management fee. The management fee is the sum of an individual fund fee rate that is based on an annual rate of .45% of the Fund's average net assets and an annualized group fee rate that averaged .24% during the period. The group fee rate is based upon the average net assets of all the mutual funds advised by the investment adviser, including any mutual funds previously advised by the investment adviser that are currently advised by Fidelity SelectCo, LLC, an affiliate of the investment adviser. The group fee rate decreases as assets under management increase and increases as assets under management decrease. In addition, the management fee is subject to a performance adjustment (up to a maximum of +/- .20% of the Fund's average net assets over a 36 month performance period). The upward or downward adjustment to the management fee is based on the relative investment performance of Small Cap Value as compared to its benchmark index, the Russell 2000 Value Index, over the same 36 month performance period. For the reporting period, the total annualized management fee rate, including the performance adjustment, was .43% of the Fund's average net assets. The performance adjustment included in the management fee rate may be higher or lower than the maximum performance adjustment rate due to the difference between the average net assets for the reporting and performance periods.
Distribution and Service Plan Fees. In accordance with Rule 12b-1 of the 1940 Act, the Fund has adopted separate Distribution and Service Plans for each class of shares. Certain classes pay Fidelity Distributors Corporation (FDC), an affiliate of the investment adviser, separate Distribution and Service Fees, each of which is based on an annual percentage of each class' average net assets. In addition, FDC may pay financial intermediaries for selling shares of the Fund and providing shareholder support services. For the period, the Distribution and Service Fee rates, total fees and amounts retained by FDC were as follows:
| | Distribution Fee | Service Fee | Total Fees | Retained by FDC |
| Class A | -% | .25% | $178,994 | $– |
| Class M | .25% | .25% | 155,424 | – |
| Class C | .75% | .25% | 191,237 | 4,369 |
| | | | $525,655 | $4,369 |
Sales Load. FDC may receive a front-end sales charge of up to 5.75% for selling Class A shares and 3.50% for selling Class M shares, some of which is paid to financial intermediaries for selling shares of the Fund. Depending on the holding period, FDC may receive contingent deferred sales charges levied on Class A, Class M and Class C redemptions. The deferred sales charges are 1.00% for Class C shares, 1.00% for certain purchases of Class A shares and .25% for certain purchases of Class M shares.
For the period, sales charge amounts retained by FDC were as follows:
| | Retained by FDC |
| Class A | $1,560 |
| Class M | 678 |
| Class C(a) | 1,377 |
| | $3,615 |
(a) When Class C shares are initially sold, FDC pays commissions from its own resources to financial intermediaries through which the sales are made.
Transfer Agent Fees. Fidelity Investments Institutional Operations Company, Inc., (FIIOC), an affiliate of the investment adviser, is the transfer, dividend disbursing and shareholder servicing agent for each class of the Fund. FIIOC receives account fees and asset-based fees that vary according to the account size and type of account of the shareholders of the respective classes of the Fund, except for Class Z. FIIOC receives an asset-based fee of Class Z's average net assets. FIIOC pays for typesetting, printing and mailing of shareholder reports, except proxy statements.
For the period, transfer agent fees for each class were as follows:
| | Amount | % of Class-Level Average Net Assets(a) |
| Class A | $142,025 | .20 |
| Class M | 60,601 | .19 |
| Class C | 40,021 | .21 |
| Small Cap Value | 1,589,648 | .18 |
| Class I | 322,031 | .19 |
| Class Z | 1,402 | .05 |
| | $2,155,728 | |
(a) Annualized
Accounting and Security Lending Fees. Fidelity Service Company, Inc. (FSC), an affiliate of the investment adviser, maintains the Fund's accounting records. The accounting fee is based on the level of average net assets for each month. Under a separate contract, FSC administers the security lending program. The security lending fee is based on the number and duration of lending transactions. For the period, the fees were equivalent to an annualized rate of .03%.
Brokerage Commissions. The Fund placed a portion of its portfolio transactions with brokerage firms which are affiliates of the investment adviser. Brokerage commissions are included in net realized gain (loss) and change in net unrealized appreciation (depreciation) in the Statement of Operations. The commissions paid to these affiliated firms were $59,946 for the period.
Interfund Lending Program. Pursuant to an Exemptive Order issued by the SEC, the Fund, along with other registered investment companies having management contracts with Fidelity Management & Research Company (FMR) or other affiliated entities of FMR, may participate in an interfund lending program. This program provides an alternative credit facility allowing the funds to borrow from, or lend money to, other participating affiliated funds. At period end, there were no interfund loans outstanding. The Fund's activity in this program during the period for which loans were outstanding was as follows:
| Borrower or Lender | Average Loan Balance | Weighted Average Interest Rate | Interest Expense |
| Borrower | $25,370,625 | 2.18% | $12,289 |
Interfund Trades. The Fund may purchase from or sell securities to other Fidelity Funds under procedures adopted by the Board. The procedures have been designed to ensure these interfund trades are executed in accordance with Rule 17a-7 of the 1940 Act. Interfund trades are included within the respective purchases and sales amounts shown in the Purchases and Sales of Investments note.
6. Committed Line of Credit.
The Fund participates with other funds managed by the investment adviser or an affiliate in a $4.25 billion credit facility (the "line of credit") to be utilized for temporary or emergency purposes to fund shareholder redemptions or for other short-term liquidity purposes. The Fund has agreed to pay commitment fees on its pro-rata portion of the line of credit, which amounted to $3,351 and is reflected in Miscellaneous expenses on the Statement of Operations. During the period, the Fund did not borrow on this line of credit.
7. Security Lending.
The Fund lends portfolio securities through a lending agent from time to time in order to earn additional income. For equity securities, a lending agent is used and may loan securities to certain qualified borrowers, including Fidelity Capital Markets (FCM), a broker-dealer affiliated with the Fund. On the settlement date of the loan, the Fund receives collateral (in the form of U.S. Treasury obligations, letters of credit and/or cash) against the loaned securities and maintains collateral in an amount not less than 100% of the market value of the loaned securities during the period of the loan. The market value of the loaned securities is determined at the close of business of the Fund and any additional required collateral is delivered to the Fund on the next business day. The Fund or borrower may terminate the loan at any time, and if the borrower defaults on its obligation to return the securities loaned because of insolvency or other reasons, the Fund may apply collateral received from the borrower against the obligation. The Fund may experience delays and costs in recovering the securities loaned. Any cash collateral received is invested in the Fidelity Securities Lending Cash Central Fund. The value of loaned securities and cash collateral at period end are disclosed on the Fund's Statement of Assets and Liabilities. The value of securities loaned to FCM at period end was $124,620. Security lending income represents the income earned on investing cash collateral, less rebates paid to borrowers and any lending agent fees associated with the loan, plus any premium payments received for lending certain types of securities. Security lending income is presented in the Statement of Operations as a component of income from Fidelity Central Funds. Total security lending income during the period amounted to $49,867, including $159 from securities loaned to FCM.
8. Expense Reductions.
Commissions paid to certain brokers with whom the investment adviser, or its affiliates, places trades on behalf of the Fund include an amount in addition to trade execution, which may be rebated back to the Fund to offset certain expenses. This amount totaled $196,517 for the period. During the period, credits reduced each class' transfer agent expense as noted in the table below.
| | Transfer Agent expense reduction |
| Small Cap Value | $6 |
In addition, during the period the investment adviser reimbursed and/or waived a portion of fund-level operating expenses in the amount of $8,294.
9. Distributions to Shareholders.
Distributions to shareholders of each class were as follows:
| | Six months ended
January 31, 2019(a) | Year ended
July 31, 2018 |
| Distributions to shareholders | | |
| Class A | $38,710,048 | $– |
| Class M | 17,014,124 | – |
| Class C | 11,414,739 | – |
| Small Cap Value | 469,819,892 | – |
| Class I | 93,391,322 | – |
| Class Z | 750,266 | – |
| Total | $631,100,391 | $– |
| From net investment income | | |
| Class A | $– | $1,524,304 |
| Class M | – | 515,970 |
| Class C | – | 97,347 |
| Small Cap Value | – | 30,080,300 |
| Class I | – | 5,222,579 |
| Total | $– | $37,440,500 |
| From net realized gain | | |
| Class A | $– | $4,758,907 |
| Class M | – | 2,138,544 |
| Class C | – | 1,473,571 |
| Small Cap Value | – | 70,617,875 |
| Class I | – | 12,170,212 |
| Total | $– | $91,159,109 |
(a) Distributions for Class Z are for the period October 2, 2018 (commencement of sale of shares) to January 31, 2019.
10. Share Transactions.
Share transactions for each class were as follows and may contain automatic conversions between classes or exchanges between affiliated funds:
| | Shares | Shares | Dollars | Dollars |
| | Six months ended January 31, 2019(a) | Year ended July 31, 2018 | Six months ended January 31, 2019(a) | Year ended July 31, 2018 |
| Class A | | | | |
| Shares sold | 449,132 | 787,560 | $7,113,077 | $15,530,971 |
| Reinvestment of distributions | 2,371,085 | 330,015 | 37,759,513 | 6,184,396 |
| Shares redeemed | (2,068,351) | (2,794,205) | (31,275,389) | (54,717,368) |
| Net increase (decrease) | 751,866 | (1,676,630) | $13,597,201 | $(33,002,001) |
| Class M | | | | |
| Shares sold | 231,006 | 258,708 | $3,395,387 | $4,991,221 |
| Reinvestment of distributions | 1,095,649 | 144,050 | 16,926,149 | 2,638,888 |
| Shares redeemed | (633,882) | (1,141,985) | (9,469,802) | (22,088,950) |
| Net increase (decrease) | 692,773 | (739,227) | $10,851,734 | $(14,458,841) |
| Class C | | | | |
| Shares sold | 59,894 | 65,629 | $870,517 | $1,177,591 |
| Reinvestment of distributions | 777,498 | 85,987 | 11,029,853 | 1,473,685 |
| Shares redeemed | (614,098) | (754,141) | (8,271,806) | (13,467,588) |
| Net increase (decrease) | 223,294 | (602,525) | $3,628,564 | $(10,816,312) |
| Small Cap Value | | | | |
| Shares sold | 5,951,081 | 33,774,572 | $95,048,622 | $673,371,571 |
| Reinvestment of distributions | 27,312,687 | 4,774,555 | 443,826,642 | 90,647,491 |
| Shares redeemed | (20,274,961) | (75,386,466) | (342,880,104) | (1,518,420,951) |
| Net increase (decrease) | 12,988,807 | (36,837,339) | $195,995,160 | $(754,401,889) |
| Class I | | | | |
| Shares sold | 1,845,325 | 4,588,604 | $29,947,486 | $91,876,636 |
| Reinvestment of distributions | 4,767,058 | 785,425 | 77,894,990 | 14,952,991 |
| Shares redeemed | (9,937,468) | (7,249,457) | (168,542,945) | (145,608,090) |
| Net increase (decrease) | (3,325,085) | (1,875,428) | $(60,700,469) | $(38,778,463) |
| Class Z | | | | |
| Shares sold | 1,040,168 | – | $15,836,543 | $– |
| Reinvestment of distributions | 54,128 | – | 741,553 | – |
| Shares redeemed | (125,185) | – | (1,790,389) | – |
| Net increase (decrease) | 969,111 | – | $14,787,707 | $– |
(a) Share transactions for Class Z are for the period October 2, 2018 (commencement of sale of shares) to January 31, 2019.
11. Other.
The Fund's organizational documents provide former and current trustees and officers with a limited indemnification against liabilities arising in connection with the performance of their duties to the Fund. In the normal course of business, the Fund may also enter into contracts that provide general indemnifications. The Fund's maximum exposure under these arrangements is unknown as this would be dependent on future claims that may be made against the Fund. The risk of material loss from such claims is considered remote.
Shareholder Expense Example
As a shareholder of the Fund, you incur two types of costs: (1) transaction costs, including sales charges (loads) on purchase payments or redemption proceeds, and (2) ongoing costs, including management fees, distribution and/or service (12b-1) fees and other Fund expenses. This Example is intended to help you understand your ongoing costs (in dollars) of investing in the Fund and to compare these costs with the ongoing costs of investing in other mutual funds.
The actual expense Example is based on an investment of $1,000 invested at the beginning of the period and held for the entire period (August 1, 2018 to January 31, 2019) for Class A, Class M, Class C, Small Cap Value and Class I and for the period (October 2, 2018 to January 31, 2019) for Class Z. The hypothetical expense Example is based on an investment of $1,000 invested for the one-half year period (August 1, 2018 to January 31, 2019).
Actual Expenses
The first line of the accompanying table for each class of the Fund provides information about actual account values and actual expenses. You may use the information in this line, together with the amount you invested, to estimate the expenses that you paid over the period. Simply divide your account value by $1,000.00 (for example, an $8,600 account value divided by $1,000.00 = 8.6), then multiply the result by the number in the first line for a class of the Fund under the heading entitled "Expenses Paid During Period" to estimate the expenses you paid on your account during this period. In addition, the Fund, as a shareholder in the underlying Fidelity Central Funds, will indirectly bear its pro-rata share of the fees and expenses incurred by the underlying Fidelity Central Funds. These fees and expenses are not included in the Fund's annualized expense ratio used to calculate the expense estimate in the table below.
Hypothetical Example for Comparison Purposes
The second line of the accompanying table for each class of the Fund provides information about hypothetical account values and hypothetical expenses based on a Class' actual expense ratio and an assumed rate of return of 5% per year before expenses, which is not the Class' actual return. The hypothetical account values and expenses may not be used to estimate the actual ending account balance or expenses you paid for the period. You may use this information to compare the ongoing costs of investing in the Fund and other funds. To do so, compare this 5% hypothetical example with the 5% hypothetical examples that appear in the shareholder reports of the other funds. In addition, the Fund, as a shareholder in the underlying Fidelity Central Funds, will indirectly bear its pro-rata share of the fees and expenses incurred by the underlying Fidelity Central Funds. These fees and expenses are not included in the Fund's annualized expense ratio used to calculate the expense estimate in the table below.
Please note that the expenses shown in the table are meant to highlight your ongoing costs only and do not reflect any transaction costs. Therefore, the second line of the table is useful in comparing ongoing costs only, and will not help you determine the relative total costs of owning different funds. In addition, if these transactional costs were included, your costs would have been higher.
| | Annualized Expense Ratio-A | Beginning
Account Value
| Ending
Account Value
January 31, 2019 | Expenses Paid
During Period
|
| Class A | .92% | | | |
| Actual | | $1,000.00 | $904.80 | $4.42-B |
| Hypothetical-C | | $1,000.00 | $1,020.57 | $4.69-D |
| Class M | 1.17% | | | |
| Actual | | $1,000.00 | $903.80 | $5.61-B |
| Hypothetical-C | | $1,000.00 | $1,019.31 | $5.96-D |
| Class C | 1.68% | | | |
| Actual | | $1,000.00 | $901.30 | $8.05-B |
| Hypothetical-C | | $1,000.00 | $1,016.74 | $8.54-D |
| Small Cap Value | .65% | | | |
| Actual | | $1,000.00 | $906.60 | $3.12-B |
| Hypothetical-C | | $1,000.00 | $1,021.93 | $3.31-D |
| Class I | .66% | | | |
| Actual | | $1,000.00 | $906.80 | $3.17-B |
| Hypothetical-C | | $1,000.00 | $1,021.88 | $3.36-D |
| Class Z | .52% | | | |
| Actual | | $1,000.00 | $913.90 | $1.66-B |
| Hypothetical-C | | $1,000.00 | $1,022.58 | $2.65-D |
A Annualized expense ratio reflects expenses net of applicable fee waivers.
B Actual expenses are equal to each Class' annualized expense ratio, multiplied by the average account value over the period, multiplied by 184/365 (to reflect the one-half year period) for Class A, Class M, Class C, Small Cap Value and Class I and multiplied by 122/365 (to reflect the period October 2, 2018 to January 31, 2019) for Class Z.
C 5% return per year before expenses
D Hypothetical expenses are equal to each Class' annualized expense ratio, multiplied by the average account value over the period, multiplied by 184/365 (to reflect the one-half year period).
Board Approval of Investment Advisory Contracts and Management Fees
Fidelity Small Cap Value Fund
Each year, the Board of Trustees, including the Independent Trustees (together, the Board), votes on the renewal of the management contract with Fidelity Management & Research Company (FMR) and the sub-advisory agreements (together, the Advisory Contracts) for the fund. FMR and the sub-advisers are referred to herein as the Investment Advisers. The Board, assisted by the advice of fund counsel and Independent Trustees' counsel, requests and considers a broad range of information relevant to the renewal of the Advisory Contracts throughout the year.
The Board meets regularly and, at each of its meetings, covers an extensive agenda of topics and materials and considers factors that are relevant to its annual consideration of the renewal of the fund's Advisory Contracts, including the services and support provided to the fund and its shareholders. The Board has established various standing committees (Committees), each composed of and chaired by Independent Trustees with varying backgrounds, to which the Board has assigned specific subject matter responsibilities in order to enhance effective decision-making by the Board. The Board, acting directly and through its Committees, requests and receives information concerning the annual consideration of the renewal of the fund's Advisory Contracts. The Board also meets as needed to review matters specifically related to the Board's annual consideration of the renewal of the Advisory Contracts. Members of the Board may also meet with trustees of other Fidelity funds through joint ad hoc committees to discuss certain matters relevant to all of the Fidelity funds.
At its January 2019 meeting, the Board unanimously determined to renew the fund's Advisory Contracts. In reaching its determination, the Board considered all factors it believed relevant, including (i) the nature, extent, and quality of the services to be provided to the fund and its shareholders (including the investment performance of the fund); (ii) the competitiveness of the fund's management fee and total expense ratio relative to peer funds; (iii) the total costs of the services to be provided by and the profits to be realized by Fidelity from its relationships with the fund; and (iv) the extent to which, if any, economies of scale exist and would be realized as the fund grows, and whether any economies of scale are appropriately shared with fund shareholders.
In considering whether to renew the Advisory Contracts for the fund, the Board reached a determination, with the assistance of fund counsel and Independent Trustees' counsel and through the exercise of its business judgment, that the renewal of the Advisory Contracts was in the best interests of the fund and its shareholders and that the compensation payable under the Advisory Contracts was fair and reasonable. The Board's decision to renew the Advisory Contracts was not based on any single factor, but rather was based on a comprehensive consideration of all the information provided to the Board at its meetings throughout the year. The Board, in reaching its determination to renew the Advisory Contracts, was aware that shareholders of the fund have a broad range of investment choices available to them, including a wide choice among funds offered by Fidelity's competitors, and that the fund's shareholders, who have the opportunity to review and weigh the disclosure provided by the fund in its prospectus and other public disclosures, have chosen to invest in this fund, which is part of the Fidelity family of funds.
Nature, Extent, and Quality of Services Provided. The Board considered Fidelity's staffing as it relates to the fund, including the backgrounds of investment personnel of Fidelity, and also considered the fund's investment objective, strategies, and related investment philosophy. The Independent Trustees also had discussions with senior management of Fidelity's investment operations and investment groups. The Board considered the structure of the investment personnel compensation program and whether this structure provides appropriate incentives to act in the best interests of the fund. Additionally, the Board considered the portfolio managers' investments, if any, in the funds that they manage.
Resources Dedicated to Investment Management and Support Services. The Board and the Fund Oversight and Research Committees reviewed the general qualifications and capabilities of Fidelity's investment staff, including its size, education, experience, and resources, as well as Fidelity's approach to recruiting, training, managing, and compensating investment personnel. The Board noted that Fidelity has continued to increase the resources devoted to non-U.S. offices, including expansion of Fidelity's global investment organization. The Board also noted that Fidelity's analysts have extensive resources, tools and capabilities that allow them to conduct sophisticated quantitative and fundamental analysis, as well as credit analysis of issuers, counterparties and guarantors. Further, the Board considered that Fidelity's investment professionals have sufficient access to global information and data so as to provide competitive investment results over time, and that those professionals also have access to sophisticated tools that permit them to assess portfolio construction and risk and performance attribution characteristics continuously, as well as to transmit new information and research conclusions rapidly around the world. Additionally, in its deliberations, the Board considered Fidelity's trading, risk management, compliance, and technology and operations capabilities and resources, which are integral parts of the investment management process.
Shareholder and Administrative Services. The Board considered (i) the nature, extent, quality, and cost of advisory, administrative, and shareholder services performed by the Investment Advisers and their affiliates under the Advisory Contracts and under separate agreements covering transfer agency, pricing and bookkeeping, and securities lending services for the fund; (ii) the nature and extent of the supervision of third party service providers, principally custodians, subcustodians, and pricing vendors; and (iii) the resources devoted to, and the record of compliance with, the fund's compliance policies and procedures. The Board also reviewed the allocation of fund brokerage, including allocations to brokers affiliated with the Investment Advisers, the use of brokerage commissions to pay fund expenses, and the use of "soft" commission dollars to pay for research services.
The Board noted that the growth of fund assets over time across the complex allows Fidelity to reinvest in the development of services designed to enhance the value and convenience of the Fidelity funds as investment vehicles. These services include 24-hour access to account information and market information through telephone representatives and over the Internet, investor education materials and asset allocation tools, and the expanded availability of Fidelity Investor Centers.
The Board noted that it and the boards of certain other Fidelity funds had formed an ad hoc Committee on Transfer Agency Fees to review the variety of transfer agency fee structures throughout the industry and Fidelity's competitive positioning with respect to industry participants.
Investment in a Large Fund Family. The Board considered the benefits to shareholders of investing in a Fidelity fund, including the benefits of investing in a fund that is part of a large family of funds offering a variety of investment disciplines and providing a large variety of mutual fund investor services. The Board noted that Fidelity had taken, or had made recommendations that resulted in the Fidelity funds taking, a number of actions over the previous year that benefited particular funds, including: (i) continuing to dedicate additional resources to Fidelity's investment research process, which includes meetings with management of issuers of securities in which the funds invest, and to the support of the senior management team that oversees asset management; (ii) continuing efforts to enhance Fidelity's global research capabilities; (iii) launching new funds and making other enhancements to meet client needs; (iv) launching new share classes of existing funds; (v) eliminating purchase minimums and broadening eligibility requirements for certain funds and share classes; (vi) reducing management fees and total expenses for certain growth equity funds and index funds; (vii) lowering expense caps for certain existing funds and classes, and converting certain voluntary expense caps to contractual caps, to reduce expenses borne by shareholders; (viii) eliminating short-term redemption fees for funds that had such fees; (ix) rationalizing product lines and gaining increased efficiencies from fund mergers and share class consolidations; (x) continuing to develop, acquire and implement systems and technology to improve services to the funds and shareholders, strengthen information security, and increase efficiency; and (xi) continuing to implement enhancements to further strengthen Fidelity's product line to increase investors' probability of success in achieving their investment goals, including retirement income goals.
Investment Performance. The Board considered whether the fund has operated in accordance with its investment objective, as well as its record of compliance with its investment restrictions and its performance history. The Board noted that there were portfolio management changes for the fund in January 2016 and January 2017. The Board will continue to monitor closely the fund's performance, taking into account the portfolio manager changes.
The Board took into account discussions that occur at Board meetings throughout the year with representatives of the Investment Advisers about fund investment performance. In this regard the Board noted that as part of regularly scheduled fund reviews and other reports to the Board on fund performance, the Board considers annualized return information for the fund for different time periods, measured against an appropriate securities market index ("benchmark index") and a peer group of funds with similar objectives ("peer group"), if any. In its evaluation of fund investment performance, the Board gave particular attention to information indicating changes in performance of certain Fidelity funds for specific time periods and discussed with the Investment Advisers the reasons for any overperformance or underperformance.
In addition to reviewing absolute and relative fund performance, the Independent Trustees periodically consider the appropriateness of fund performance metrics in evaluating the results achieved. In general, the Independent Trustees believe that fund performance should be evaluated based on net performance (after fees and expenses) of both the highest performing and lowest performing fund share classes, where applicable, compared to appropriate benchmark indices, over appropriate time periods that may include full market cycles, and compared to peer groups, as applicable, over the same periods, taking into account relevant factors including the following: general market conditions; issuer-specific information; and fund cash flows and other factors.
The Independent Trustees recognize that shareholders evaluate performance on a net basis over their own holding periods, for which one-, three-, and five-year periods are often used as a proxy. For this reason, the performance information reviewed by the Board also included net cumulative total return information for the fund and an appropriate benchmark index and peer group for the most recent one-, three-, and five-year periods ended June 30, 2018, as shown below. Returns are shown compared to the 25th percentile (top of box, 75% beaten) and 75th percentile (bottom of box, 25% beaten) of the peer universe.
Fidelity Small Cap Value Fund

The Board also considered that the fund's management fee is subject to upward or downward adjustment depending upon whether, and to what extent, the fund's investment performance for the performance period (a rolling 36-month period) exceeds, or is exceeded by, a securities index, thus leading to a performance adjustment for the same period. The Board noted that the performance adjustment provides FMR with a strong economic incentive to seek to achieve superior long-term performance for the fund's shareholders and helps to more closely align the interests of FMR and the shareholders of the fund.
Based on its review, the Board concluded that the nature, extent, and quality of services provided to the fund under the Advisory Contracts should continue to benefit the shareholders of the fund.
Competitiveness of Management Fee and Total Expense Ratio. The Board considered the fund's management fee and total expense ratio compared to "mapped groups" of competitive funds and classes created for the purpose of facilitating the Trustees' competitive analysis of management fees and total expenses. Fidelity creates "mapped groups" by combining similar Lipper investment objective categories that have comparable investment mandates. Combining Lipper investment objective categories aids the Board's management fee and total expense ratio comparisons by broadening the competitive group used for comparison.
Management Fee. The Board considered two proprietary management fee comparisons for the 12-month periods (ended June 30 for 2018 and December 31 for prior periods) shown in basis points (BP) in the chart below. The group of Lipper funds used by the Board for management fee comparisons is referred to below as the "Total Mapped Group." The Total Mapped Group comparison focuses on a fund's standing in terms of gross management fees before expense reimbursements or caps, and without giving effect to the fund's performance adjustment, relative to the total universe of funds with comparable investment mandates, regardless of whether their management fee structures also are comparable. Funds with comparable investment mandates offer exposure to similar types of securities. Funds with comparable management fee structures have similar management fee contractual arrangements (
e.g., flat rate charged for advisory services, all-inclusive fee rate,
etc.). "TMG %" represents the percentage of funds in the Total Mapped Group that had management fees that were lower than the fund's. For example, a hypothetical TMG % of 20% would mean that 80% of the funds in the Total Mapped Group had higher, and 20% had lower, management fees than the fund. The fund's actual TMG %s and the number of funds in the Total Mapped Group are in the chart below. The "Asset-Size Peer Group" (ASPG) comparison focuses on a fund's standing relative to a subset of non-Fidelity funds within the Total Mapped Group that are similar in size and management fee structure without taking into account performance adjustments, if any. For example, if a fund is in the first quartile of the ASPG, the fund's management fee ranks in the least expensive or lowest 25% of funds in the ASPG. The ASPG represents at least 15% of the funds in the Total Mapped Group with comparable asset size and management fee structures, subject to a minimum of 50 funds (or all funds in the Total Mapped Group if fewer than 50). Additional information, such as the ASPG quartile in which the fund's management fee rate ranked and the impact of the fund's performance adjustment, is also included in the chart and was considered by the Board.
Fidelity Small Cap Value Fund
The Board noted that the comparisons for 2015 and later reflect a revised Total Mapped Group that no longer includes funds with micro-cap objectives and that FMR believes this Total Mapped Group is a more appropriate comparison because the fund does not have a micro-cap objective.

The Board noted that the fund's management fee rate ranked below the median of its Total Mapped Group and below the median of its ASPG for the 12-month period ended June 30, 2018. The Board also noted the effect of the fund's performance adjustment, if any, on the fund's management fee ranking.
The Board noted that it and the boards of other Fidelity funds formed an ad hoc Committee on Group Fee, which meets periodically, to conduct an in-depth review of the "group fee" component of the management fee of funds with such management fee structures. The Committee's focus included the mechanics of the group fee, the competitive landscape of group fee structures, Fidelity funds with no group fee component and investment products not included in group fee assets. The Board also considered that, for funds subject to the group fee, FMR agreed to voluntarily waive fees over a specified period of time in amounts designed to account for assets converted from certain funds to certain collective investment trusts.
The Board also noted that, in 2013, the ad hoc Committee on Management Fees was formed to conduct an in-depth review of the management fee rates of Fidelity's active equity mutual funds. The Committee focused on the following areas: (i) standard fee structures; (ii) research consumption and trading evolution; (iii) management fee competitiveness/profitability by category; and (iv) factors that drive institutional pricing.
Based on its review, the Board concluded that the fund's management fee is fair and reasonable in light of the services that the fund receives and the other factors considered.
Total Expense Ratio. In its review of each class's total expense ratio, the Board considered the fund's management fee rate as well as other fund or class expenses, as applicable, such as transfer agent fees, pricing and bookkeeping fees, fund-paid 12b-1 fees, and custodial, legal, and audit fees. The Board noted the impact of the fund's performance adjustment. The Board also noted that Fidelity may agree to waive fees and expenses from time to time, and the extent to which, if any, it has done so for the fund. As part of its review, the Board also considered the current and historical total expense ratios of each class of the fund compared to competitive fund median expenses. Each class of the fund is compared to those funds and classes in the Total Mapped Group (used by the Board for management fee comparisons) that have a similar sales load structure.
The Board noted that the total expense ratio of each of Class A, Class C, Class I, and the retail class ranked below the competitive median for the 12-month period ended June 30, 2018, and the total expense ratio of Class M ranked above the competitive median for the 12-month period ended June 30, 2018. The Board considered that, in general, various factors can affect total expense ratios. The Board noted that the total expense ratio of Class M was above the competitive median primarily because of higher 12b-1 fees on Class M as compared to most competitor funds. Class M has a higher 12b-1 fee, but a lower front-end sales charge, than traditionally priced front-end sales charge classes. The Board considered that Class M is primarily sold load-waived to retirement plans and intermediary wrap programs where its 0.50% 12b-1 fee is comparable to competing no-load, higher 12b-1 fee classes designed specifically for retirement plans and wrap programs. The Board noted that, when compared with competitor funds that charge a 0.50% 12b-1 fee, the total expense ratio of Class M is below median. The Board noted that the fund offers multiple classes, each of which has a different sales load and 12b-1 fee structure, and that the multiple structures are intended to offer a range of pricing options for the intermediary market. The Board also noted that the total expense ratios of the classes vary primarily by the level of their 12b-1 fees, although differences in transfer agent fees may also cause expenses to vary from class to class.
Fees Charged to Other Fidelity Clients. The Board also considered Fidelity fee structures and other information with respect to clients of Fidelity, such as other funds advised or subadvised by Fidelity, pension plan clients, and other institutional clients with similar mandates. The Board noted that a joint ad hoc committee created by it and the boards of other Fidelity funds periodically reviews and compares Fidelity's institutional investment advisory business with its business of providing services to the Fidelity funds and also noted the most recent findings of the committee. The Board noted that the committee's review included a consideration of the differences in services provided, fees charged, and costs incurred, as well as competition in the markets serving the different categories of clients.
Based on its review of total expense ratios and fees charged to other Fidelity clients, the Board concluded that the total expense ratio of each class of the fund was reasonable in light of the services that the fund and its shareholders receive and the other factors considered.
Costs of the Services and Profitability. The Board considered the revenues earned and the expenses incurred by Fidelity in conducting the business of developing, marketing, distributing, managing, administering and servicing the fund and servicing the fund's shareholders. The Board also considered the level of Fidelity's profits in respect of all the Fidelity funds.
On an annual basis, Fidelity presents to the Board information about the profitability of its relationships with the fund. Fidelity calculates profitability information for each fund, as well as aggregate profitability information for groups of Fidelity funds and all Fidelity funds, using a series of detailed revenue and cost allocation methodologies which originate with the books and records of Fidelity on which Fidelity's audited financial statements are based. The Audit Committee of the Board reviews any significant changes from the prior year's methodologies.
PricewaterhouseCoopers LLP (PwC), auditor to Fidelity and certain Fidelity funds, has been engaged annually by the Board as part of the Board's assessment of Fidelity's profitability analysis. PwC's engagement includes the review and assessment of the methodologies used by Fidelity in determining the revenues and expenses attributable to Fidelity's mutual fund business, and completion of agreed-upon procedures in respect of the mathematical accuracy of the fund profitability information and its conformity to established allocation methodologies. After considering PwC's reports issued under the engagement and information provided by Fidelity, the Board concluded that while other allocation methods may also be reasonable, Fidelity's profitability methodologies are reasonable in all material respects.
The Board also reviewed Fidelity's non-fund businesses and potential indirect benefits such businesses may have received as a result of their association with Fidelity's mutual fund business (i.e., fall-out benefits) as well as cases where Fidelity's affiliates may benefit from the fund's business. The Board noted that changes to fall-out benefits year-over-year reflect business developments at Fidelity's various businesses.
The Board considered the costs of the services provided by and the profits realized by Fidelity in connection with the operation of the fund and was satisfied that the profitability was not excessive.
Economies of Scale. The Board considered whether there have been economies of scale in respect of the management of the Fidelity funds, whether the Fidelity funds (including the fund) have appropriately benefited from any such economies of scale, and whether there is potential for realization of any further economies of scale. The Board considered the extent to which the fund will benefit from economies of scale as assets grow through increased services to the fund, through waivers or reimbursements, or through fee or expense ratio reductions. The Board also noted that a committee (the Economies of Scale Committee) created by it and the boards of other Fidelity funds periodically analyzes whether Fidelity attains economies of scale in respect of the management and servicing of the Fidelity funds, whether the Fidelity funds have appropriately benefited from such economies of scale, and whether there is potential for realization of any further economies of scale.
The Board recognized that the fund's management contract incorporates a "group fee" structure, which provides for lower group fee rates as total group assets increase, and for higher group fee rates as total group assets decrease (with "group assets" defined to include fund assets under FMR's management plus the assets of sector funds previously under FMR's management). FMR calculates the group fee rates based on a tiered asset "breakpoint" schedule that varies based on asset class. The Board considered that the group fee is designed to deliver the benefits of economies of scale to fund shareholders when total Fidelity fund assets increase, even if assets of any particular fund are unchanged or have declined, because some portion of Fidelity's costs are attributable to services provided to all Fidelity funds, and all funds benefit if those costs can be allocated among more assets. The Board also considered that although the fund is partially closed to new investors, it continues to incur investment management expenses, and marketing and distribution expenses related to the retention of existing shareholders and assets. The Board further noted that the fund may continue to realize benefits from the group fee structure, even though assets may not be expected to grow significantly at the fund level. The Board concluded that, given the group fee structure, fund shareholders will benefit from lower management fees as group assets increase at the fund complex level, regardless of whether Fidelity achieves any such economies of scale.
The Board concluded, taking into account the analysis of the Economies of Scale Committee, that economies of scale, if any, are being appropriately shared between fund shareholders and Fidelity.
Additional Information Requested by the Board. In order to develop fully the factual basis for consideration of the Fidelity funds' advisory contracts, the Board requested and received additional information on certain topics, including: (i) fund performance trends, in particular the underperformance of certain funds, and Fidelity's long-term strategies for certain funds; (ii) Fidelity's fund profitability methodology, profitability trends for certain funds, and the impact of certain factors on fund profitability results; (iii) metrics for evaluating index fund and ETF performance and information about ETF trading characteristics; (iv) the methodology with respect to the evaluation of competitive fund data and peer group classifications and fee comparisons; (v) the expense structures for different funds and classes; (vi) information regarding other accounts managed by Fidelity, including collective investment trusts; and (vii) Fidelity's philosophies and strategies for evaluating funds and classes with lower or declining asset levels.
Based on its evaluation of all of the conclusions noted above, and after considering all factors it believed relevant, the Board concluded that the advisory fee arrangements are fair and reasonable, and that the fund's Advisory Contracts should be renewed.
SCV-SANN-0319
1.803709.114
Item 2.
Code of Ethics
Not applicable.
Item 3.
Audit Committee Financial Expert
Not applicable.
Item 4.
Principal Accountant Fees and Services
Not applicable.
Item 5.
Audit Committee of Listed Registrants
Not applicable.
Item 6.
Investments
(a)
Not applicable.
(b)
Not applicable
Item 7.
Disclosure of Proxy Voting Policies and Procedures for Closed-End Management Investment Companies
Not applicable.
Item 8.
Portfolio Managers of Closed-End Management Investment Companies
Not applicable.
Item 9.
Purchase of Equity Securities by Closed-End Management Investment Company and Affiliated Purchasers
Not applicable.
Item 10.
Submission of Matters to a Vote of Security Holders
There were no material changes to the procedures by which shareholders may recommend nominees to the Fidelity Securities Fund’s Board of Trustees.
Item 11.
Controls and Procedures
(a)(i) The President and Treasurer and the Chief Financial Officer have concluded that the Fidelity Securities Fund’s (the “Trust”) disclosure controls and procedures (as defined in Rule 30a-3(c) under the Investment Company Act) provide reasonable assurances that
material information relating to the Trust is made known to them by the appropriate persons, based on their evaluation of these controls and procedures as of a date within 90 days of the filing date of this report.
(a)(ii) There was no change in the Trust’s internal control over financial reporting (as defined in Rule 30a-3(d) under the Investment Company Act) that occurred during the period covered by this report that has materially affected, or is reasonably likely to materially affect, the Trust’s internal control over financial reporting.
Item 12.
Disclosure of Securities Lending Activities for Closed-End Management
Investment Companies
Not applicable.
Item 13.
Exhibits
| | |
(a) | (1) | Not applicable. |
(a) | (2) | Certification pursuant to Rule 30a-2(a) under the Investment Company Act of 1940 (17 CFR 270.30a-2(a)) is filed and attached hereto as Exhibit 99.CERT. |
(a) | (3) | Not applicable. |
(b) |
| Certification pursuant to Rule 30a-2(b) under the Investment Company Act of 1940 (17 CFR 270.30a-2(b)) is furnished and attached hereto as Exhibit 99.906CERT. |
SIGNATURES
Pursuant to the requirements of the Securities Exchange Act of 1934 and the Investment Company Act of 1940, the registrant has duly caused this report to be signed on its behalf by the undersigned, thereunto duly authorized.
Fidelity Securities Fund
| |
By: | /s/Stacie M. Smith |
| Stacie M. Smith |
| President and Treasurer |
|
|
Date: | March 26, 2019 |
Pursuant to the requirements of the Securities Exchange Act of 1934 and the Investment Company Act of 1940, this report has been signed below by the following persons on behalf of the registrant and in the capacities and on the dates indicated.
| |
By: | /s/Stacie M. Smith |
| Stacie M. Smith |
| President and Treasurer |
|
|
Date: | March 26, 2019 |
| |
By: | /s/John J. Burke III |
| John J. Burke III |
| Chief Financial Officer |
|
|
Date: | March 26, 2019 |