| UNITED STATES |
| SECURITIES AND EXCHANGE COMMISSION |
| Washington, D.C. 20549 |
| |
FORM N-CSR |
| |
CERTIFIED SHAREHOLDER REPORT OF REGISTERED |
MANAGEMENT INVESTMENT COMPANIES |
| |
| |
| |
| Investment Company Act File Number: 811-4163 |
|
| |
| T. Rowe Price Tax-Free High Yield Fund, Inc. |
|
| (Exact name of registrant as specified in charter) |
| |
| 100 East Pratt Street, Baltimore, MD 21202 |
|
| (Address of principal executive offices) |
| |
| David Oestreicher |
| 100 East Pratt Street, Baltimore, MD 21202 |
|
| (Name and address of agent for service) |
| |
| |
| Registrant’s telephone number, including area code: (410) 345-2000 |
| |
| |
| Date of fiscal year end: February 28 |
| |
| |
| Date of reporting period: August 31, 2009 |
Item 1: Report to Shareholders| Tax-Free High Yield Fund | August 31, 2009 |

The views and opinions in this report were current as of August 31, 2009. They are not guarantees of performance or investment results and should not be taken as investment advice. Investment decisions reflect a variety of factors, and the managers reserve the right to change their views about individual stocks, sectors, and the markets at any time. As a result, the views expressed should not be relied upon as a forecast of the fund’s future investment intent. The report is certified under the Sarbanes-Oxley Act, which requires mutual funds and other public companies to affirm that, to the best of their knowledge, the information in their financial reports is fairly and accurately stated in all material respects.
REPORTS ON THE WEB
Sign up for our E-mail Program, and you can begin to receive updated fund reports and prospectuses online rather than through the mail. Log in to your account at troweprice.com for more information.
Manager’s Letter
Fellow Shareholders
Tax-free municipal bonds produced good returns in the six-month period ended August 31, 2009. Longer-term and lower-quality securities fared better than shorter-term and higher-quality municipals, respectively, as reduced risk aversion, low money market yields, steadying credit markets, and hopes for an economic recovery prompted investors to seek higher-yielding alternatives. The return for the T. Rowe Price Tax-Exempt Money Fund was marginally positive, but the other funds posted strong absolute returns. The funds’ long-term relative performance remains quite favorable.
MARKET ENVIRONMENT
Although a return to robust economic growth in the near future is unlikely, the longest and deepest U.S. recession since the Great Depression may recently have ended. The economy, which shrank at an annualized rate of more than 5% in the fourth quarter of 2008 and in the first quarter of 2009, contracted by only 0.7% in the second quarter. While national unemployment has increased to 9.7% and consumer spending has been restrained, job losses in recent months have been significantly lower than they were at the beginning of 2009. In addition, there are signs of stabilizing residential real estate markets in some cities, and equities have rebounded sharply from their early March lows in anticipation of stronger economic growth in the months ahead.
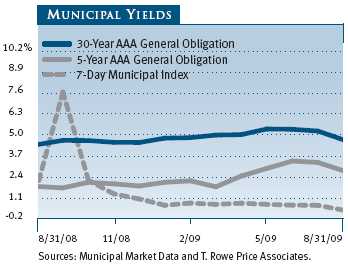
In the last six months, intermediate- and long-term U.S. Treasury yields rose as new issuance increased significantly and steadying financial markets prompted investors to assume greater investment risks and seek higher returns, particularly from assets that performed worst in 2008. In contrast, municipal interest rates declined in the face of strong demand, as investors were attracted by discounted valuations and tax-free income offered by municipal securities.
Despite their strong rebound this year, tax-free securities remain an attractive alternative to taxable bonds, particularly for investors in the highest tax brackets. As of August 31, 2009, the 2.95% yield offered by a AAA 10-year tax-free municipal bond was about 87% of the 3.40% pretax yield offered by a 10-year Treasury. In comparison, high-quality 10-year municipal bonds have provided an average of about 81% of the yield offered by 10-year Treasuries since the mid-1980s. Thirty-year AAA municipal bonds are even more attractive on a relative basis, with a 4.41% yield that is about 105% of the 4.18% pretax yield offered by 30-year Treasuries. An investor in the 28% federal tax bracket would need to invest in a taxable bond yielding 6.125% in order to receive the same after-tax income from a 30-year AAA municipal bond yielding 4.41%. (To calculate a municipal bond’s taxable-equivalent yield, divide the municipal bond’s yield by 1.00 minus your federal tax bracket expressed as a decimal—in this case, 1.00 – 0.28, or 0.72.)
MUNICIPAL MARKET NEWS
Nationally, new municipal supply through the end of August totaled about $256 billion, according to The Bond Buyer. Tax-exempt supply has been a bit lower than expected, due in part to the Build America Bonds program, which has shifted some municipal issuance to the taxable bond market and helped alleviate the supply/demand imbalance that stressed the tax-free market last year. With the national economy still very weak and a significant federal fiscal stimulus package providing some temporary relief to the states, we expect aggregate new issuance in 2009 will be lower than in 2008.
Demand from retail investors for municipal securities has been very strong, and year-to-date investor cash flows into municipal bond funds have already surpassed the annual record level reached in 1993. In the aftermath of last year’s financial market turbulence, investors seeking more exposure to fixed income securities have embraced municipals because of attractive after-tax yields and valuations relative to Treasuries. Concerns about higher federal, state, and local taxes have also fueled interest in tax-free securities.
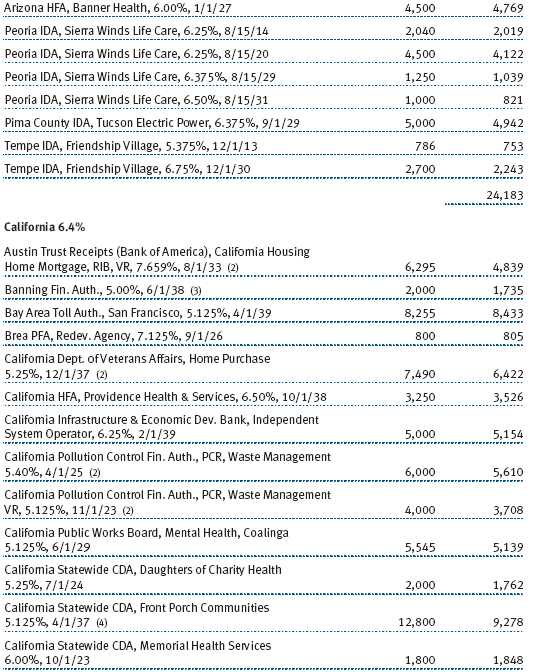
Many states are facing fiscal difficulties and have been forced to take drastic actions to close budget deficits. California’s challenges show no signs of abating. Although state officials reached a budget agreement in late July that includes spending cuts and borrowing from local governments, there needs to be more willingness to adjust taxes, fees, and spending to match the difficult economic realities facing the state. Considering that the state’s recovery will probably lag a national economic recovery, we continue to underweight California securities in our broad municipal portfolios.
In terms of sector performance, the segments of the municipal market that fared worst last year—long-term and lower-quality securities—have been this year’s leaders. Tobacco bonds outpaced other segments in the last six months, though longer-term trends do not appear to be especially positive. Corporate-related municipal securities, such as industrial revenue and pollution control revenue bonds, airline bonds, and health care-related issues, also did well as credit markets stabilized. In contrast, the sectors that held up best last year, such as prerefunded bonds and escrowed-to-maturity bonds, lagged with only mild gains this year.
PORTFOLIO STRATEGY
TAX-EXEMPT MONEY FUND
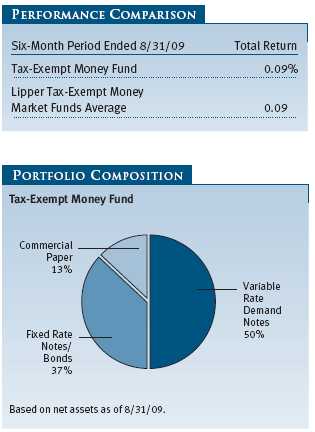
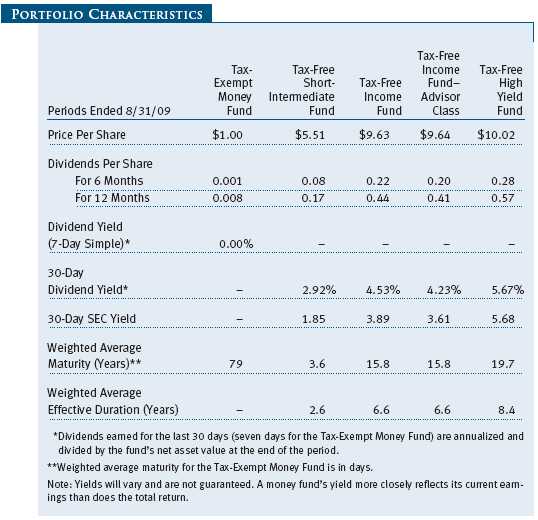
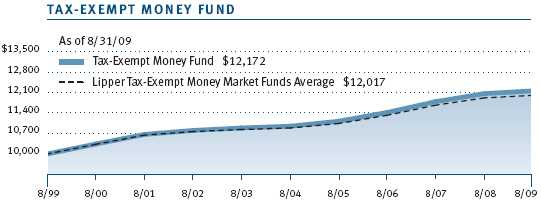
The fund matched the average performance of competitor funds during the six months ended August 31, 2009, with a return of 0.09%. The portfolio’s seven-day simple dividend yield was 0.00% at the end of the reporting period, down from 0.41% six months ago*. A money fund’s yield more closely reflects its current earnings than does the total return. Unfortunately for money fund shareholders, Fed policy has driven rates below the level necessary for most money funds to meet their ongoing expenses. T. Rowe Price, like many of its peers, is waiving a portion of its management fee until such time as the level of income generated by the fund is sufficient to meet fund expenses.
*In an effort to maintain a positive net yield for the fund, T. Rowe Price has voluntarily waived all or a portion of the management fee it is entitled to receive from the fund. This voluntary waiver is in addition to any contractual expense ratio limitation in effect for the fund and may be amended or terminated at any time without prior notice. A fee waiver has the effect of increasing the fund’s net yield; without it, the fund’s 7-day yield would have been lower. Please see the prospectus for more details.
Since our last shareholder report at the end of February, the money markets have improved substantially, boosting the outlook for the large money center banks, which are critical to municipal money market financing. As a result, many of the temporary supports with which the Federal Reserve and Treasury surrounded the market in late 2008 are now being withdrawn as confidence returns. The Treasury’s decision not to extend the money fund guarantee program, in which this fund participated, is one such example. (The program ended as scheduled on September 18, 2009.)
The Federal Reserve has had a 0% interest rate policy in place since December 2008, though the transmission of that policy had not been fully felt in the market until recently because of ongoing credit worries focused on large financial institutions. But now, with the outlook for credit improving, the Fed’s unprecedented action is gaining traction, and money market rates are falling toward the 0% target. For example, rates on 90-day Libor, an important market benchmark, fell during the six-month period from 1.27% to 0.33%. Municipal rates moved in similar fashion; seven-day variable rates declined from 0.78% to 0.34%, while rates on one-year municipal notes declined from 0.65% to 0.46%. Since the end of the six-month period, rates have continued to push lower.
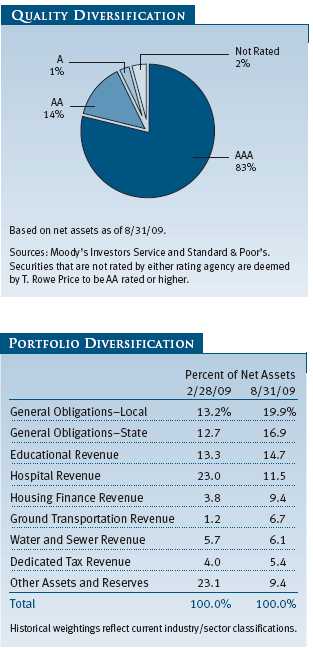
While credit markets have improved, municipal issuers continue to feel the ongoing effects of the financial crisis. Many state and local governments are facing increasingly difficult budget problems; these issuers are finding money market funding very expensive or virtually impossible until their financial situations improve. Thus, very large seasonal borrowers such as California, Illinois, and Michigan are missing from our portfolio as we focus instead on those issuers we feel will be most insulated from the economic slowdown. With rates dropping, we have shifted half of the portfolio to fixed rate securities to sustain higher yields for as long as possible.
The current record-low rates benefit borrowers who are able to access the money markets for funding. On the other hand, lenders to the money market, such as our fund, have seen their income drop significantly. Short-term rates haven’t much room to fall. The restorative effects of near-zero funding to borrower balance sheets will be felt over time, and we expect the Fed to maintain a 0% interest rate policy until a sustained economic recovery is clearly under way. Until then, we shall continue to manage the fund with a focus on stability of principal and liquidity.
TAX-FREE SHORT-INTERMEDIATE FUND
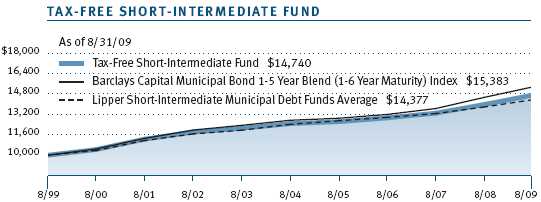
The fund returned 3.18% over the six months ended August 31, 2009, compared with 3.36% for the Lipper Short-Intermediate Municipal Debt Funds Average, which measures the performance of competing funds. The fund’s net asset value per share was $5.51 at the end of August, up from $5.42 at the end of February. Dividends per share contributed $0.08 to the fund’s total return during the reporting period.
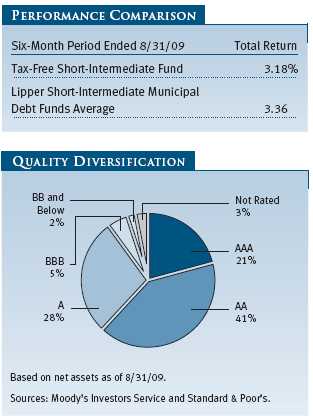
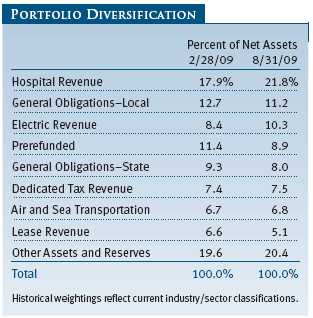
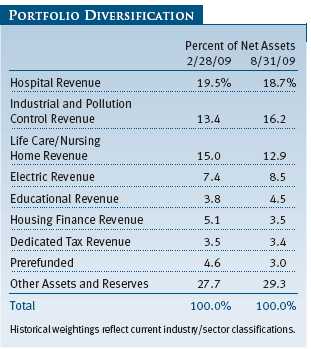
During the past six months, we continued to favor revenue bonds over general obligation and prerefunded bonds. Credit yield spreads widened significantly in 2008, pushing yields higher in many revenue sectors and for some state general obligation bonds that are suffering from budget problems. We focused our purchases on revenue bonds that our analysts believed could withstand a prolonged economic downturn—specifically electric revenue, dedicated tax bonds, and hospital credits. At the end of the period, the fund remained heavily overweight in a variety of revenue sectors, which have helped relative returns this year. The fund’s performance has not kept pace with funds that have large exposure to lower-rated bonds or concentrations in sectors such as tobacco that have done very well this year. In many cases, these bonds have bounced back from very distressed prices and are benefiting from a new appetite for credit risk in the bond markets. While that segment of the market did well in recent months, we did not want to include securities in the portfolio that we did not like on a fundamental basis.
The fund’s duration, which is a measure of a bond fund’s sensitivity to changes in interest rates, was 2.6 years at the end of August, a bit shorter than that of our benchmark. With short-term interest rates falling during the past two years, we strategically shortened the fund’s duration and most likely will keep it there until short-term rates move higher. One aspect of this strategy is to hold more cash or near-cash investments in the portfolio. Currently, about 40% of fund assets will mature within the next two years, compared with 33% six months ago and 16% in August 2007 when short-term rates were significantly higher. At this point in the economic cycle, we do not want to reach for higher yield by increasing the fund’s interest rate risk.
We believe the front end of the municipal yield curve (a graphic depiction of yields among securities with different maturities) will remain relatively low until such time as the Federal Open Market Committee begins to tighten its monetary policy. The Fed’s loose policy has driven short-term rates to historically low levels. We think the Fed could start raising rates toward the middle of 2010, but such predictions are dangerous considering that unforeseen events could derail them. What matters most is that we ascertain the value in our area of the fixed income market and invest accordingly. Our goal is to provide a safe, conservative investment for our shareholders who are looking for a return higher than that provided by money market funds without taking on significant interest rate risk.
TAX-FREE INCOME FUND
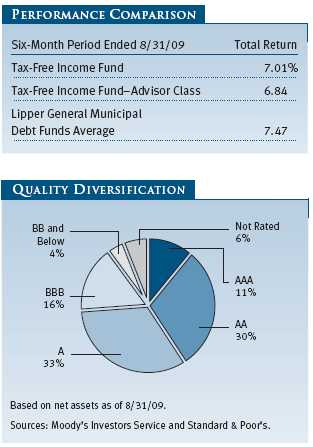
Your fund returned 7.01% during the past six months, behind the 7.47% return for the Lipper General Municipal Debt Funds Average, a benchmark measuring the performance of similar funds. Your fund nevertheless finished in the top half of its peer group. (Performance for the Advisor Class was slightly lower, reflecting its different fee structure.) The fund’s net asset value per share was $9.63 at the end of August, up from $9.21 six months ago. Dividends per share contributed $0.22 to the fund’s total return during the reporting period.
Trading was fairly active during the period as fund assets expanded, a result of both higher valuations and, even more importantly, from fund subscriptions. Investors favored longer maturities as the steep yield curve (which shows the differences in yields among bonds with various maturities) rendered long-term rates more appealing. We overweighted bonds with 20-year or longer maturities and underweighted securities in the three- to 15-year range. While the fund’s duration (a measure of its sensitivity to changes in interest rates) was longer than the benchmark’s, we kept it within a comfortable range by investing in premium-structured coupons trading to their call dates. This strategy benefited returns as long-term bonds outperformed both short- and intermediate-term securities.
There were slight shifts in the fund’s quality diversification, as our exposure to AAA and AA bonds declined by 5%. We added A and BBB securities to the portfolio, as their yield advantages remained especially wide in historical terms. Those spreads tightened from the beginning of the reporting period, which caused lower-rated credits to outperform their higher-quality counterparts. For the six-month period, the BBB sector returned 13.25% compared with 3.65% for AAA bonds, according to Barclays. Even though we increased our exposure to lower-rated bonds, the fund’s overall level of higher-quality bonds, which resulted in good relative performance last year, detracted slightly during the six months ended August 31.
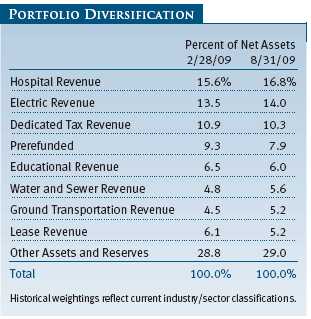
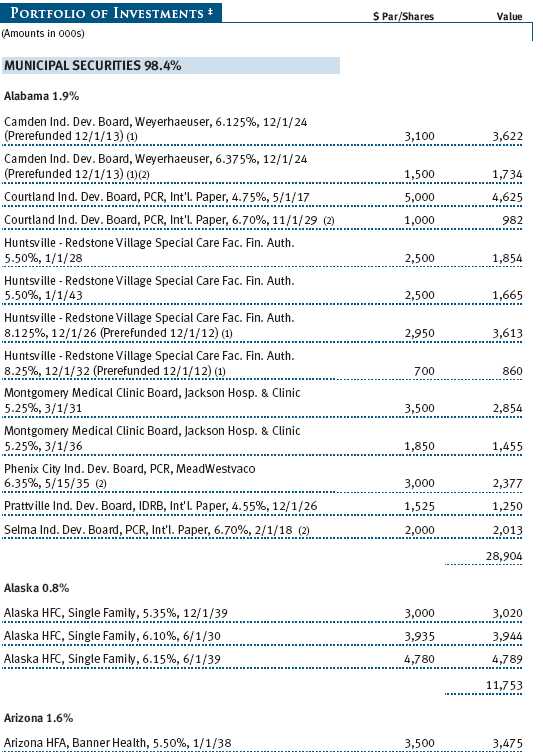
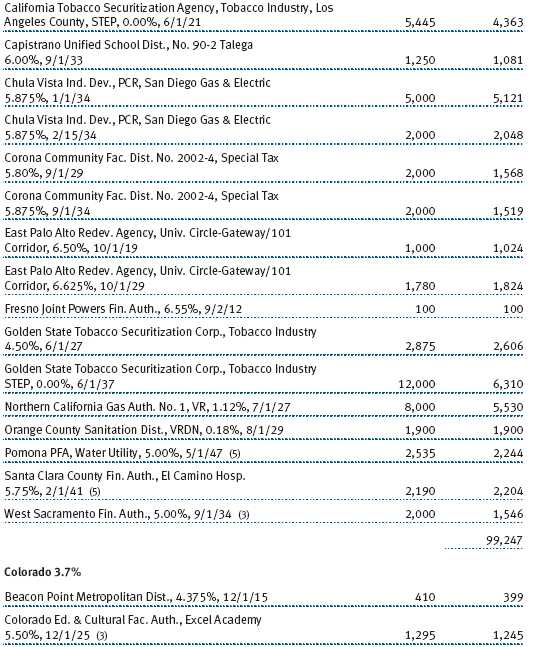
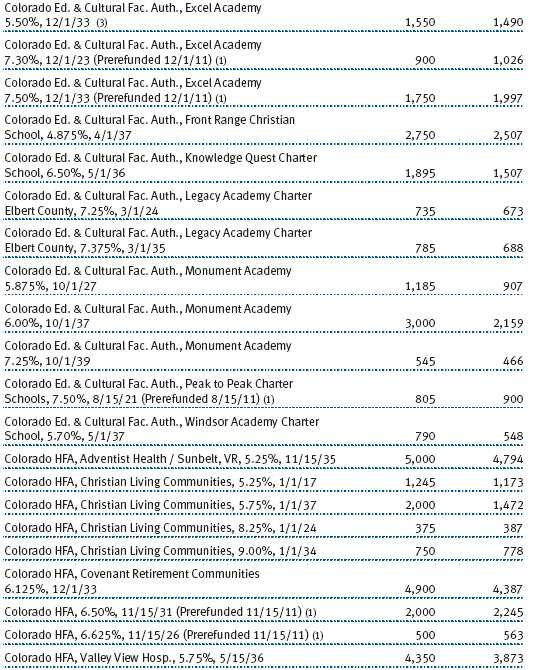
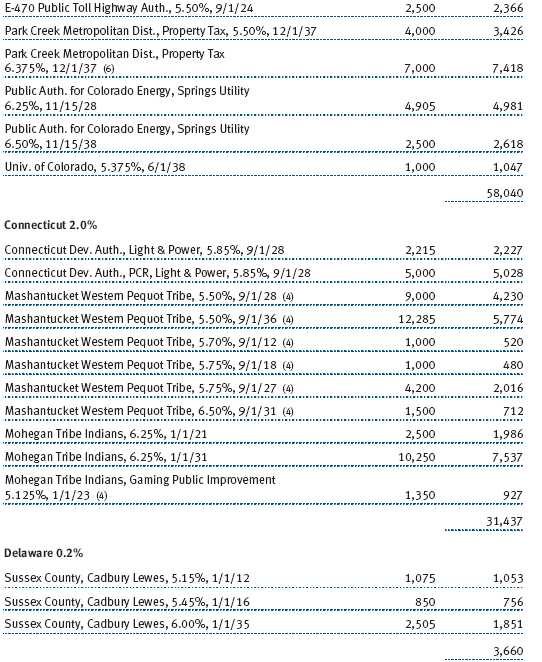
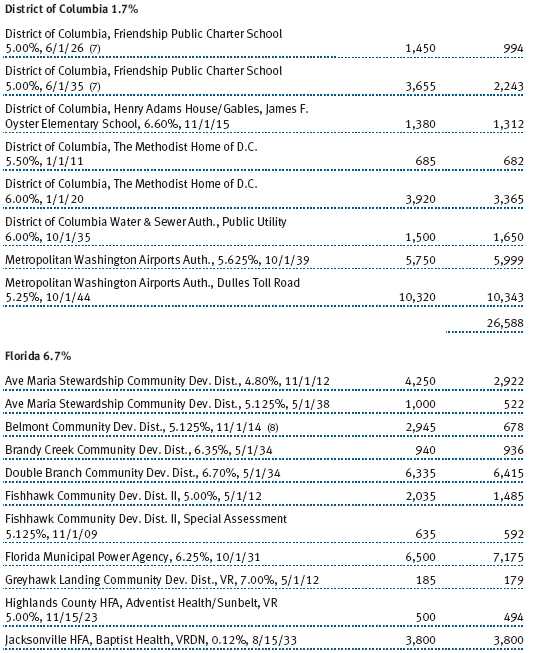
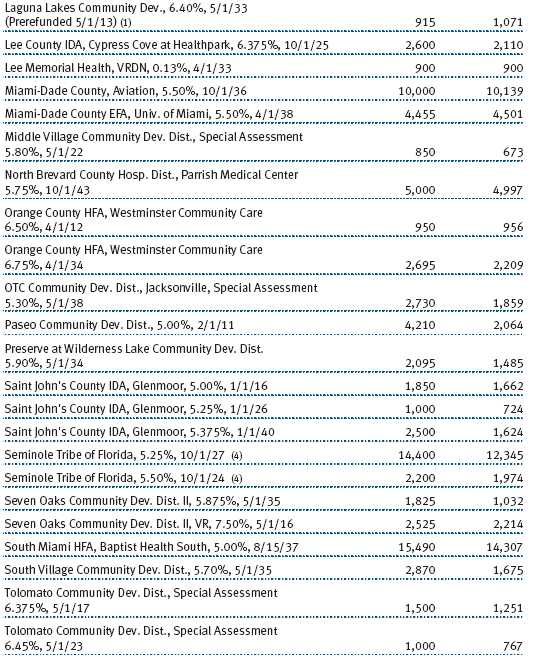
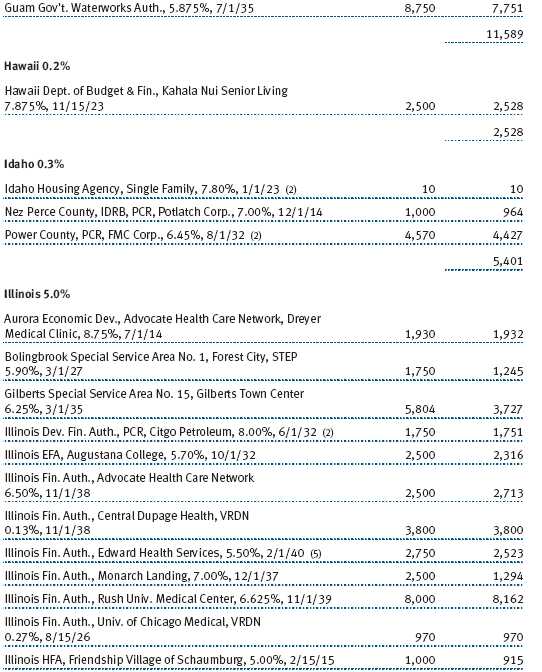
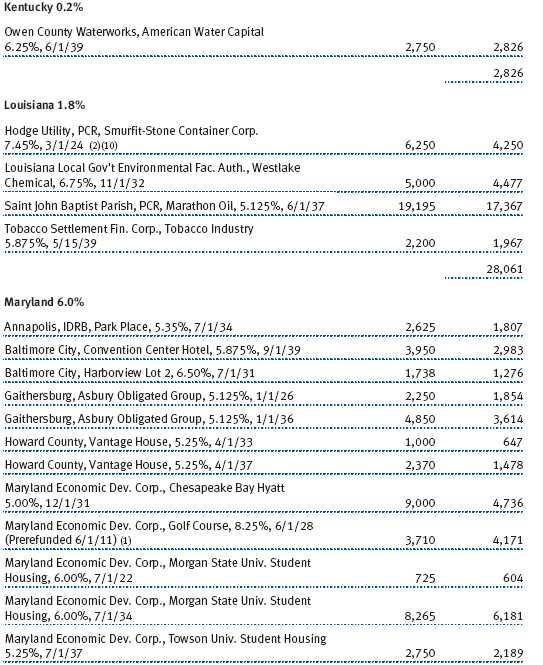
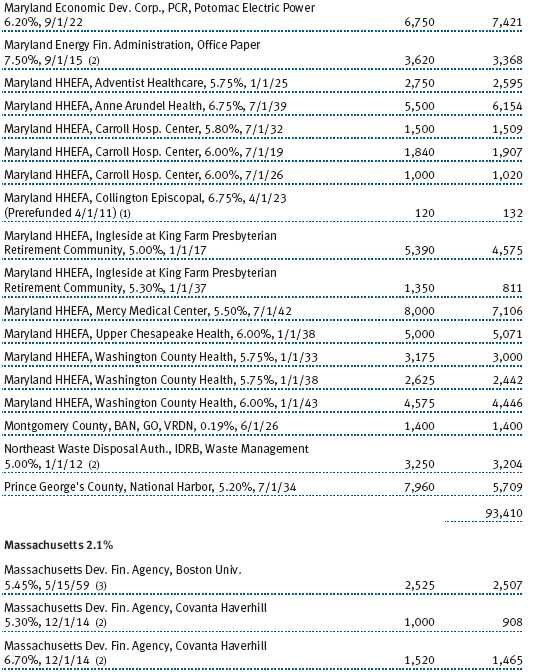
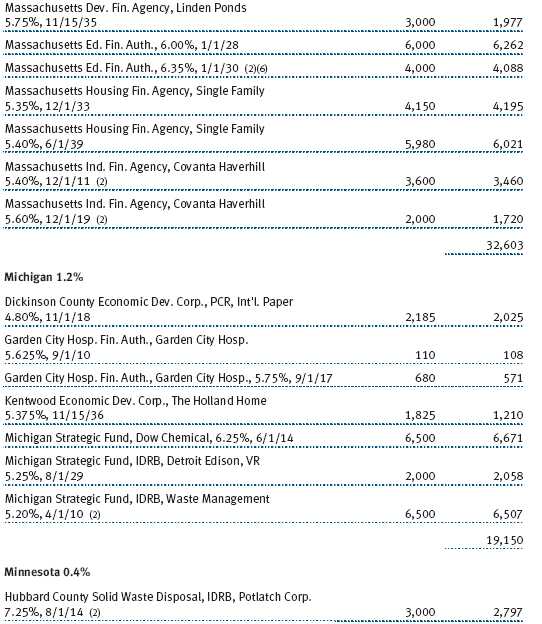
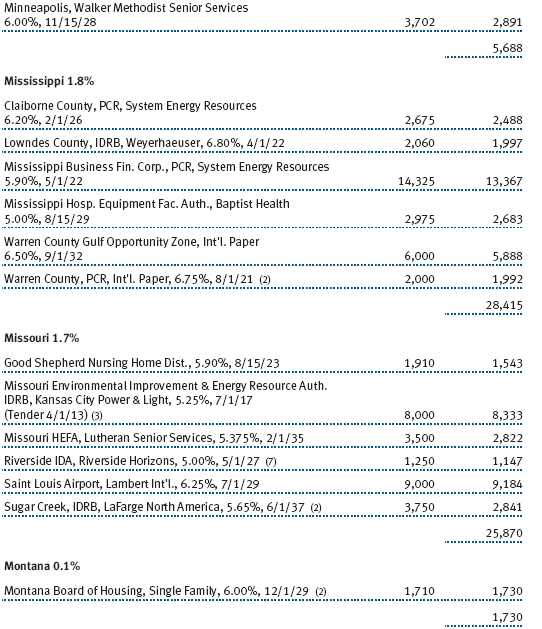
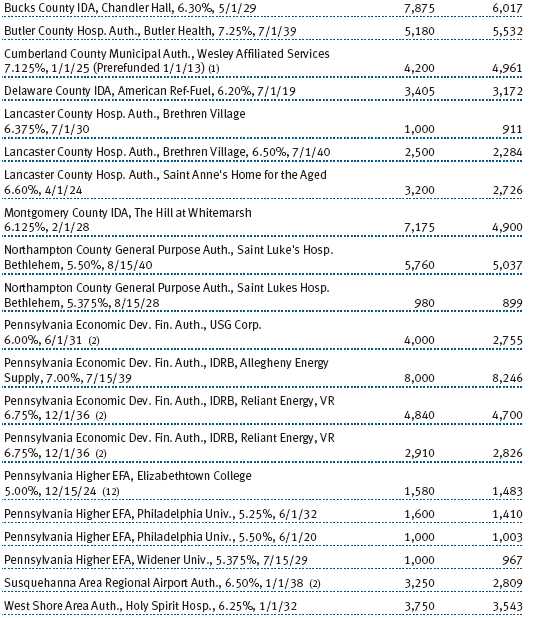
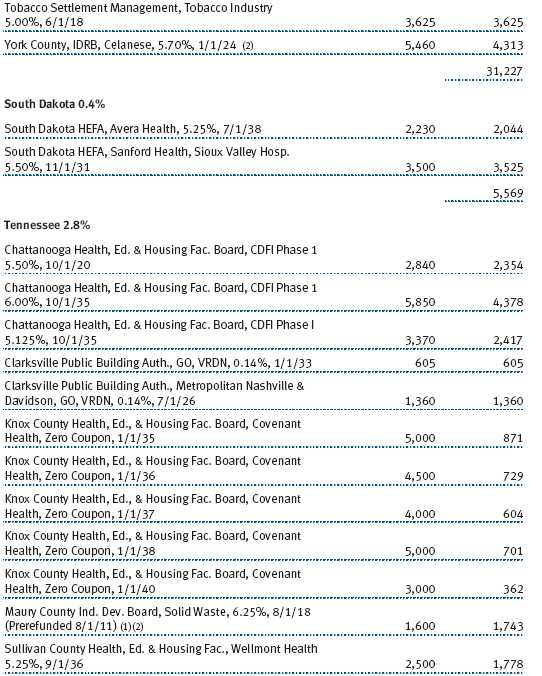
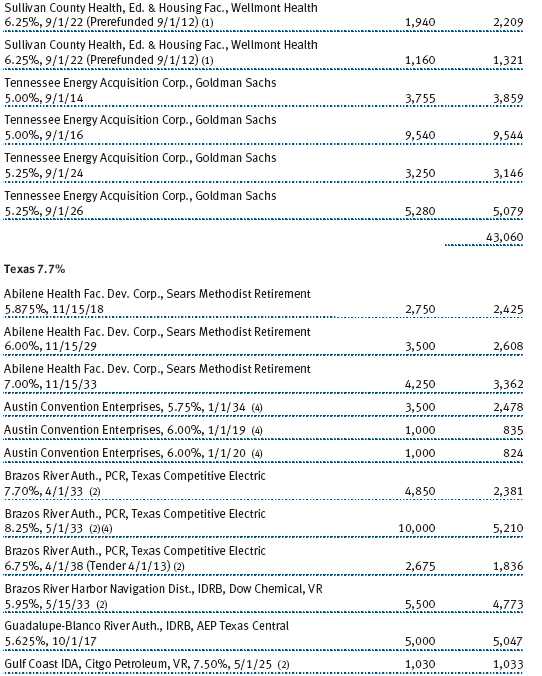
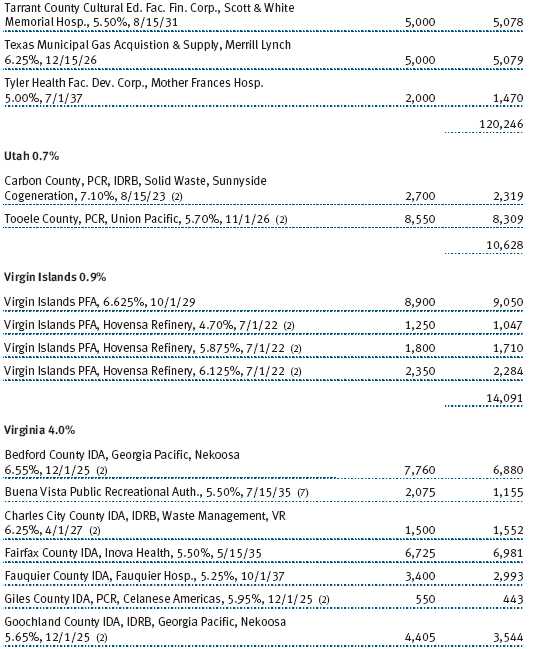
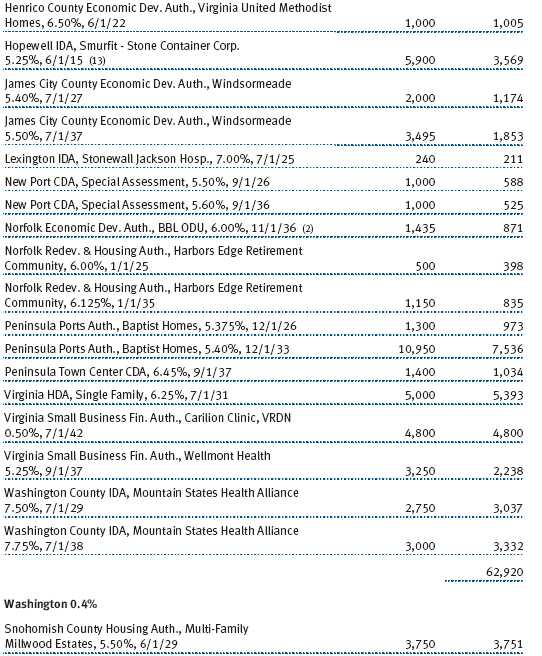
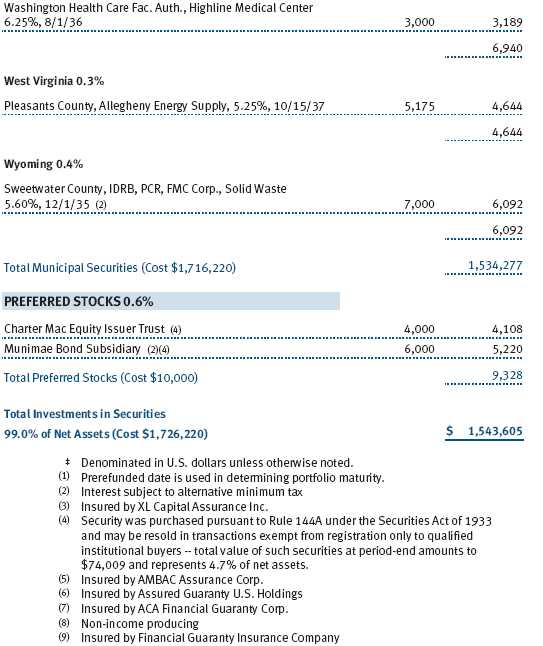
Shifts in portfolio composition were minimal. We continued to underweight the general obligation sector in favor of revenue bonds, since states and localities remain under fiscal pressure. Our preference for essential service revenue bonds is reflected in greater exposure to both electric and water and sewer revenue bonds. Bonds issued by the Phoenix Water System in Arizona and King County Sewer System in Washington state are two examples of recent purchases that performed well. We selectively added to the fund’s overweight in hospital revenue bonds as the rates available within the sector were significantly higher than those of comparable securities in other sectors. Our exposure to prerefunded bonds declined slightly; prerefunded bonds underperformed due to their shorter maturities and higher ratings. (Please refer to the fund’s portfolio of investments for a complete listing of our holdings and the amount each represents in the portfolio.)
In our last report, we mentioned that holdings that underperformed the general market were primarily lower-rated credits. Many of these holdings were this period’s top performers, including hospital and life care, tribal gaming, and tobacco bonds backed by the Master Settlement Agreement. Prepaid gas bonds were also top performers as the investment banks backing these securities stabilized thanks to federal aid and a rebound in the equity and credit markets. Among our laggards was our long-held position in the Southern Connector Toll Road in South Carolina, which declined because of its deteriorating credit profile in the weak economy.
We intend to maintain our positions in securities that lost value during the credit and liquidity crunch but still have the confidence of our internal research staff. We believe these bonds represent excellent long-term value and could not be easily replaced in today’s market environment.
TAX-FREE HIGH YIELD FUND
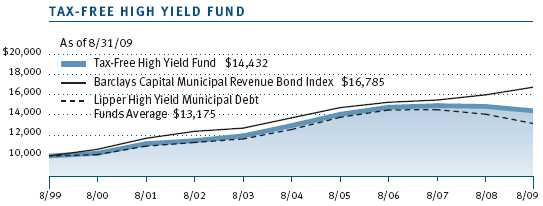
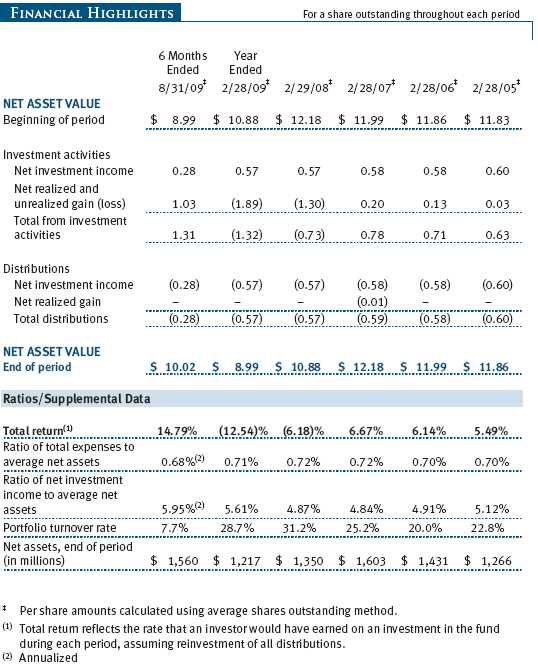
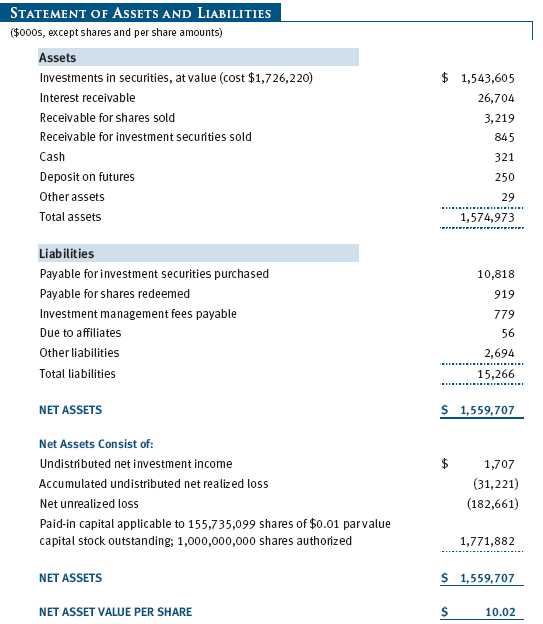
Lower-quality municipals delivered excellent returns during the past six months. As a result, the Tax-Free High Yield Fund returned 14.79% during the period compared with 13.48% for the Lipper High Yield Municipal Debt Funds Average, which measures the performance of similar funds. The fund’s net asset per share was $10.02 at the end of August, up substantially from $8.99 at the end of February. Dividends per share contributed $0.28 to the fund’s total return during the reporting period.

The environment for medium- and lower-quality municipals improved markedly during the six-month period. Prices of high yield municipal bonds rebounded, as preliminary evidence of economic stability unfolded throughout the spring and summer months. Valuations in this arena had been at historically low levels following the market turmoil of late 2008, and they bounced sharply as liquidity and market stability took hold.
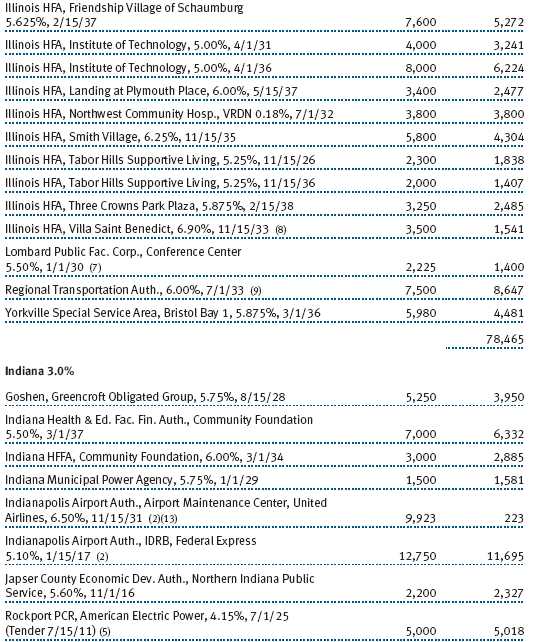
We increased the portfolio’s exposure to corporate-backed industrial revenue and pollution control bonds, particularly in the investor-owner utilities sector. These additions include First Energy, Potomac Electric, Detroit Edison, and Allegheny Energy. We continue to favor issuers that provide essential services with limited competition. We also added to bonds backed by out-of-favor chemical companies (Dow, FMC, and Celanese) at beaten-down prices, which performed well as signs of economic recovery emerged. In addition, we added to our prepaid natural gas bonds backed by large investment banks such as Goldman Sachs, Bank of America/Merrill Lynch, and Morgan Stanley because of strong government support to the banks and improved earnings prospects.
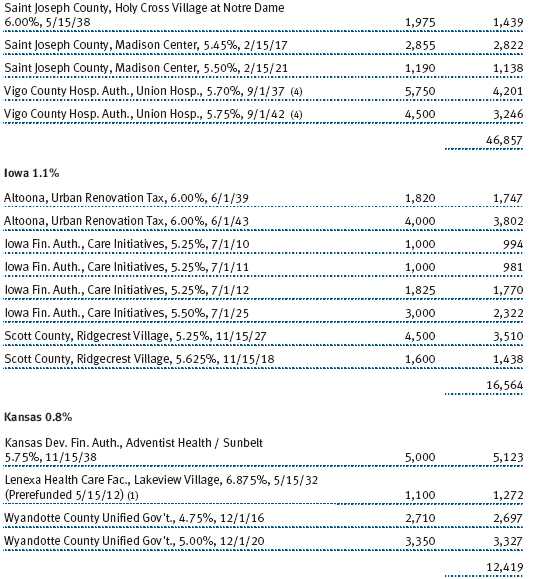
Our allotment of hospital holdings increased moderately during the period. Hospital system finances face considerable headwinds in today’s economic climate, including constrained reimbursement from state providers, a higher percentage of uninsured patients, and losses in their investment portfolios. However, we believe the vital services hospitals provide, the noncyclical nature of their businesses, and some help from federal funding will enable most hospitals to cover their debt obligations even in this stressful period. Risk premiums in the hospital sector offer investors compelling compensation from a long-term perspective.
We continued to reduce our exposure to highly rated prerefunded bonds. High-quality intermediate-maturity bonds have rallied to historically low yield levels and offer little incremental return. We used the proceeds from the sales of these assets to buy securities in higher-yielding segments of the market.
We are encouraged by the early signs of economic improvement and by the renewed stability in fixed income markets, including municipals. We remain excited by the historically attractive valuations currently offered by medium- and lower-quality municipals. However, many challenges remain in this fragile recovery period, and strong research capabilities are essential to navigate this marketplace. We will continue to rely on our proven, research-driven investment process to take advantage of opportunities within the higher-yielding tax-exempt market.
OUTLOOK
The credit environment for the municipal market could remain challenging for some time. The recession has reduced the tax revenues collected by state and local municipalities—a trend that could worsen next year—and municipal bond defaults, which historically have been rare, could increase moderately over the next year. Maintaining balanced budgets requires careful and dedicated work by state and local officials, and many issuers are trying to make difficult but necessary fiscal decisions as they adjust to the economic downturn.
We believe the municipal market is still a high-quality market and many municipal securities offer good long-term value, especially considering that tax rates are likely to rise in the next few years. Longer-term and lower-quality municipal bond valuations, though they have rebounded significantly, remain attractive and could improve further. In contrast, short-term securities appear to be fairly valued and could be vulnerable if short-term interest rates increase, though that does not appear likely as long as the national unemployment rate remains high. While there could be additional periods of volatility stemming from occasional supply/demand imbalances or possible credit rating downgrades, the deleveraging activity that plagued the municipal market in 2008 seems to be largely behind us.
We believe T. Rowe Price’s strong credit research capabilities have been and will remain an asset for our investors. We continue to conduct our own thorough research and assign our independent credit ratings before making investment decisions. As we emerge from the recent credit cycle, we continue to hold positions in bonds whose prices remain somewhat depressed but that our analysts believe have good long-term prospects. We think these actions will position our portfolios to generate excellent long-term relative returns for our clients.
Thank you for investing with T. Rowe Price.
Respectfully submitted,

Joseph K. Lynagh
Chairman of the Investment Advisory Committee
Tax-Exempt Money Fund

Charles B. Hill
Chairman of the Investment Advisory Committee
Tax-Free Short-Intermediate Fund

Konstantine B. Mallas and Mary J. Miller
Co-chairs of the Investment Advisory Committee
Tax-Free Income Fund

James M. Murphy
Chairman of the Investment Advisory Committee
Tax-Free High Yield Fund
September 21, 2009
The committee chairmen have day-to-day responsibility for managing the portfolios and work with committee members in developing and executing the funds’ investment programs.
Effective October 1, 2009, Konstantine B. Mallas will become sole lead portfolio manager and chairman of the T. Rowe Price Tax-Free Income Fund’s Investment Advisory Committee. Mr. Mallas currently co-manages this fund with Mary J. Miller, the director of T. Rowe Price’s Fixed Income Division. Ms. Miller will remain an important contributor to this fund and will continue to serve as a member of its Investment Advisory Committee.
Mr. Mallas has 17 years of investment experience, all of which have been at T. Rowe Price. He currently manages the New York, New Jersey, and California Tax-Free Bond Funds and the Summit Municipal Income Fund, and he has co-managed the Tax-Free Income Fund with Ms. Miller since 2007. Mr. Mallas joined the firm in 1987 and transferred to the Municipal Department in 1991. He began as a fixed income specialist, transitioned into trading intermediate- and long-term securities for state and national municipal bond portfolios, and in 1999 assumed portfolio management responsibilities. Mr. Mallas earned a B.S. from American University and an M.B.A. from Loyola College in Baltimore, Maryland.
RISKS OF FIXED INCOME INVESTING
Since money market funds are managed to maintain a constant $1.00 share price, there should be little risk of principal loss. However, there is no assurance the fund will avoid principal losses if fund holdings default or are downgraded or if interest rates rise sharply in an unusually short period. In addition, the fund’s yield will vary; it is not fixed for a specific period like the yield on a bank certificate of deposit. An investment in the fund is not insured or guaranteed by the Federal Deposit Insurance Corporation (FDIC) or any other government agency. Although a money market fund seeks to preserve the value of your investment at $1.00 per share, it is possible to lose money by investing in it.
Bonds are subject to interest rate risk (the decline in bond prices that usually accompanies a rise in interest rates) and credit risk (the chance that any fund holding could have its credit rating downgraded or that a bond issuer will default by failing to make timely payments of interest or principal), potentially reducing the fund’s income level and share price. High yield bonds could have greater price declines than funds that invest primarily in high-quality bonds. Municipalities issuing high yield bonds are not as strong financially as those with higher credit ratings, so the bonds are usually considered speculative investments. Some income may be subject to state and local taxes and the federal alternative minimum tax.
GLOSSARY
Average maturity: For a bond fund, the average of the stated maturity dates of the portfolio’s securities. In general, the longer the average maturity, the greater the fund’s sensitivity to interest rate changes, which means greater price fluctuation. A shorter average maturity usually means a less sensitive and, consequently, less volatile portfolio.
Barclays Capital Municipal Bond Index: An unmanaged index that tracks municipal debt instruments.
Barclays Capital Municipal Revenue Bond Index: An unmanaged index that tracks municipal revenue bonds.
Barclays Capital Municipal Bond 1-5 Year Blend (1-6 Year Maturity) Index: A sub-index of the Lehman Brothers Municipal Bond Index. It is a rules-based, market value-weighted index of short-term bonds engineered for the tax-exempt bond market.
Basis points: One hundred basis points equal one percentage point.
Duration: A measure of a bond fund’s sensitivity to changes in interest rates. For example, a fund with a duration of six years would fall about 6% in price in response to a one-percentage-point rise in interest rates, and vice versa.
Fed funds target rate: An overnight lending rate set by the Federal Reserve and used by banks to meet reserve requirements. Banks also use the fed funds rate as a benchmark for their prime lending rates.
Libor rate: The London Interbank Offered Rate, which is a benchmark for short-term taxable rates.
Lipper averages: The averages of available mutual fund performance returns for specified time periods in defined categories as tracked by Lipper Inc.
Prerefunded bond: A bond that originally may have been issued as a general obligation or revenue bond but that is now secured by an escrow fund consisting entirely of direct U.S. government obligations that are sufficient for paying the bondholders.
30-day SEC yield: A method of calculating a fund’s yield that assumes all portfolio securities are held until maturity. The Securities and Exchange Commission (SEC) requires all bond funds to calculate this yield. Yield will vary and is not guaranteed.
Yield curve: A graphic depiction of the relationship among the yields for similar bonds with different maturities. A yield curve is positive when short-term yields are lower than long-term yields and negative when short-term yields are higher than long-term yields.
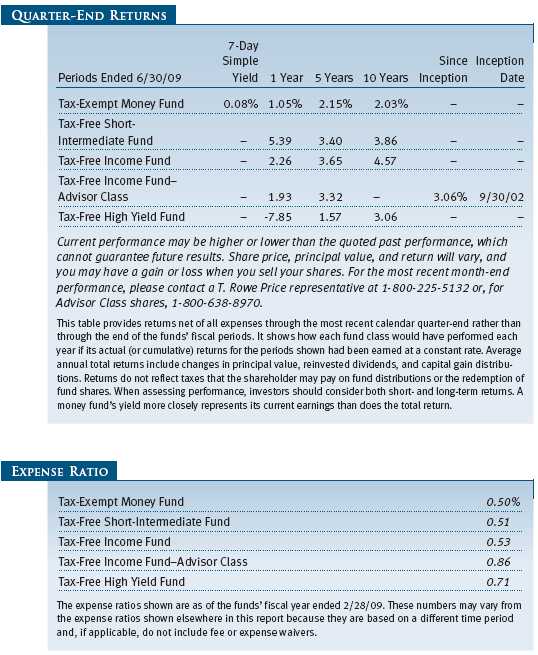
Performance and Expenses
This chart shows the value of a hypothetical $10,000 investment in the fund over the past 10 fiscal year periods or since inception (for funds lacking 10-year records). The result is compared with benchmarks, which may include a broad-based market index and a peer group average or index. Market indexes do not include expenses, which are deducted from fund returns as well as mutual fund averages and indexes.
This chart shows the value of a hypothetical $10,000 investment in the fund over the past 10 fiscal year periods or since inception (for funds lacking 10-year records). The result is compared with benchmarks, which may include a broad-based market index and a peer group average or index. Market indexes do not include expenses, which are deducted from fund returns as well as mutual fund averages and indexes.

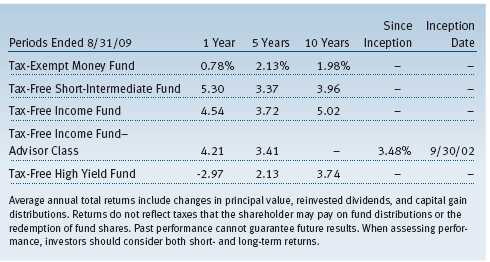
| AVERAGE ANNUAL COMPOUND TOTAL RETURN |
This table shows how the funds would have performed each year if their actual (or cumulative) returns for the periods shown had been earned at a constant rate.
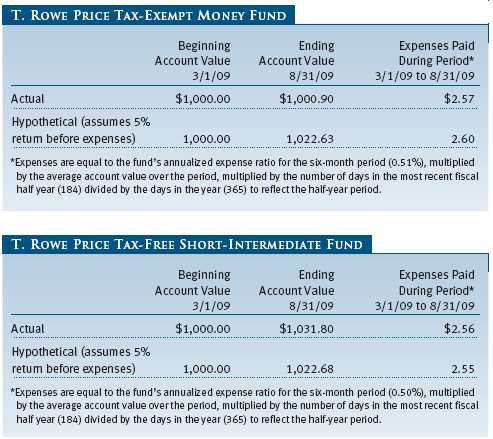
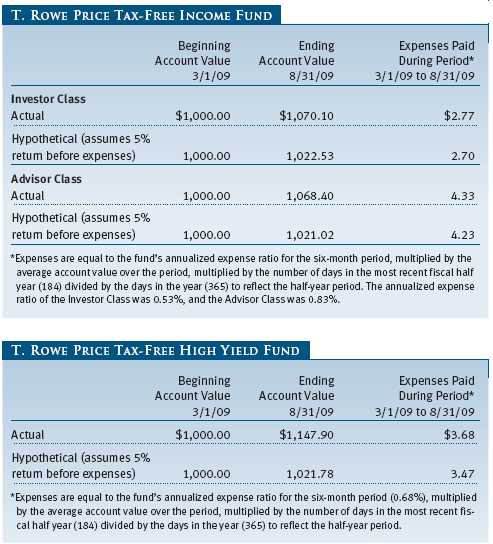
As a mutual fund shareholder, you may incur two types of costs: (1) transaction costs, such as redemption fees or sales loads, and (2) ongoing costs, including management fees, distribution and service (12b-1) fees, and other fund expenses. The following example is intended to help you understand your ongoing costs (in dollars) of investing in the fund and to compare these costs with the ongoing costs of investing in other mutual funds. The example is based on an investment of $1,000 invested at the beginning of the most recent six-month period and held for the entire period.
Actual Expenses
The first line of the following table (“Actual”) provides information about actual account values and actual expenses. You may use the information in this line, together with your account balance, to estimate the expenses that you paid over the period. Simply divide your account value by $1,000 (for example, an $8,600 account value divided by $1,000 = 8.6), then multiply the result by the number in the first line under the heading “Expenses Paid During Period” to estimate the expenses you paid on your account during this period.
Please note that the Tax-Free Income Fund has two share classes: The original share class (“investor class”) charges no distribution and service (12b-1) fee, and the Advisor Class shares are offered only through unaffiliated brokers and other financial intermediaries and charge a 0.25% 12b-1 fee. Each share class is presented separately in the table.
Hypothetical Example for Comparison Purposes
The information on the second line of the table (“Hypothetical”) is based on hypothetical account values and expenses derived from the fund’s actual expense ratio and an assumed 5% per year rate of return before expenses (not the fund’s actual return). You may compare the ongoing costs of investing in the fund with other funds by contrasting this 5% hypothetical example and the 5% hypothetical examples that appear in the shareholder reports of the other funds. The hypothetical account values and expenses may not be used to estimate the actual ending account balance or expenses you paid for the period.
Note: T. Rowe Price charges an annual small-account maintenance fee of $10, generally for accounts with less than $2,000 ($500 for UGMA/UTMA). The fee is waived for any investor whose T. Rowe Price mutual fund accounts total $25,000 or more, accounts employing automatic investing, and IRAs and other retirement plan accounts that utilize a prototype plan sponsored by T. Rowe Price (although a separate custodial or administrative fee may apply to such accounts). This fee is not included in the accompanying table. If you are subject to the fee, keep it in mind when you are estimating the ongoing expenses of investing in the fund and when comparing the expenses of this fund with other funds.
You should also be aware that the expenses shown in the table highlight only your ongoing costs and do not reflect any transaction costs, such as redemption fees or sales loads. Therefore, the second line of the table is useful in comparing ongoing costs only and will not help you determine the relative total costs of owning different funds. To the extent a fund charges transaction costs, however, the total cost of owning that fund is higher.
Unaudited
The accompanying notes are an integral part of these financial statements.
Unaudited


The accompanying notes are an integral part of these financial statements.
Unaudited
The accompanying notes are an integral part of these financial statements.
Unaudited
The accompanying notes are an integral part of these financial statements.
Unaudited
The accompanying notes are an integral part of these financial statements.
Unaudited
| NOTES TO FINANCIAL STATEMENTS |
T. Rowe Price Tax-Free High Yield Fund (the fund), is registered under the Investment Company Act of 1940 (the 1940 Act) as a diversified, open-end management investment company. The fund commenced operations on March 1, 1985. The fund seeks to provide a high level of income exempt from federal income taxes by investing primarily in long-term low- to upper-medium-grade municipal securities.
NOTE 1 - SIGNIFICANT ACCOUNTING POLICIES
Basis of Preparation The accompanying financial statements were prepared in accordance with accounting principles generally accepted in the United States of America (GAAP), which require the use of estimates made by fund management. Fund management believes that estimates and security valuations are appropriate; however, actual results may differ from those estimates, and the security valuations reflected in the financial statements may differ from the value the fund ultimately realizes on the securities. Further, fund management believes no events have occurred between August 31, 2009 and October 16, 2009, the date of issuance of the financial statements, that require adjustment of, or disclosure in, the accompanying financial statements.
Investment Transactions, Investment Income, and Distributions Income and expenses are recorded on the accrual basis. Premiums and discounts on debt securities are amortized for financial reporting purposes. Dividend income and capital gain distributions are recorded on the ex-dividend date. Income tax-related interest and penalties, if incurred, would be recorded as income tax expense. Investment transactions are accounted for on the trade date. Realized gains and losses are reported on the identified cost basis. Distributions to shareholders are recorded on the ex-dividend date. Income distributions are declared on a daily basis and paid monthly. Capital gain distributions, if any, are declared and paid by the fund, typically on an annual basis.
Credits The fund earns credits on temporarily uninvested cash balances held at the custodian which reduce the fund’s custody charges. Custody expense in the accompanying financial statements is presented before reduction for credits.
New Accounting Pronouncement On March 1, 2009, the fund adopted new accounting guidance that requires enhanced disclosures about derivative and hedging activities, including how such activities are accounted for and their effect on financial position, performance and cash flows. Adoption of this guidance had no impact on the fund’s net assets or results of operations.
NOTE 2 - VALUATION
The fund’s investments are reported at fair value as defined under GAAP. The fund values its investments and computes its net asset value per share at the close of the New York Stock Exchange (NYSE), normally 4 p.m. ET, each day that the NYSE is open for business.
Valuation Methods Debt securities are generally traded in the over-the-counter (OTC) market. Securities with remaining maturities of one year or more at the time of acquisition are valued at prices furnished by dealers who make markets in such securities or by an independent pricing service, which considers the yield or price of bonds of comparable quality, coupon, maturity, and type, as well as prices quoted by dealers who make markets in such securities. Securities with remaining maturities of less than one year at the time of acquisition generally use amortized cost in local currency to approximate fair value. However, if amortized cost is deemed not to reflect fair value or the fund holds a significant amount of such securities with remaining maturities of more than 60 days, the securities are valued at prices furnished by dealers who make markets in such securities or by an independent pricing service.
Equity securities listed or regularly traded on a securities exchange or in the OTC market are valued at the last quoted sale price or, for certain markets, the official closing price at the time the valuations are made, except for OTC Bulletin Board securities, which are valued at the mean of the latest bid and asked prices. A security that is listed or traded on more than one exchange is valued at the quotation on the exchange determined to be the primary market for such security. Listed securities not traded on a particular day are valued at the mean of the latest bid and asked prices for domestic securities and the last quoted sale price for international securities.
Financial futures contracts are valued at closing settlement prices.
Other investments, including restricted securities, and those for which the above valuation procedures are inappropriate or are deemed not to reflect fair value are stated at fair value as determined in good faith by the T. Rowe Price Valuation Committee, established by the fund’s Board of Directors.
Valuation Inputs Various inputs are used to determine the value of the fund’s investments. These inputs are summarized in the three broad levels listed below:
Level 1 – quoted prices in active markets for identical securities
Level 2 – observable inputs other than Level 1 quoted prices (including, but not limited to, quoted prices for similar securities, interest rates, prepayment speeds, credit risk)
Level 3 – unobservable inputs
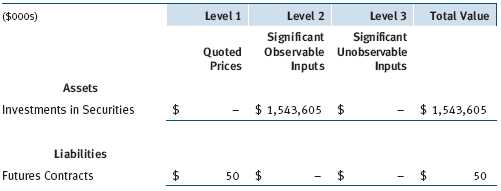
Observable inputs are those based on market data obtained from sources independent of the fund, and unobservable inputs reflect the fund’s own assumptions based on the best information available. The input levels are not necessarily an indication of the risk or liquidity associated with investments at that level. The following table summarizes the fund’s investments, based on the inputs used to determine their values on August 31, 2009:
NOTE 3 - DERIVATIVE INSTRUMENTS
During the six months ended August 31, 2009, the fund invested in derivative instruments. As defined by GAAP, a derivative is a financial instrument whose value is derived from an underlying security price, foreign exchange rate, interest rate, index of prices or rates, or other variable; it requires little or no initial investment and permits or requires net settlement. The fund invests in derivatives only if the expected risks and rewards are consistent with its investment objectives, policies, and overall risk profile, as described in its prospectus and Statement of Additional Information. The fund may use derivatives for a variety of purposes, such as seeking to hedge against declines in principal value, increase yield, invest in an asset with greater efficiency and at a lower cost than is possible through direct investment, or to adjust portfolio duration and credit exposure. The risks associated with the use of derivatives are different from, and potentially much greater than, the risks associated with investing directly in the instruments on which the derivatives are based. Investments in derivatives can magnify returns positively or negatively; however, the fund at all times maintains sufficient cash reserves, liquid assets, or other SEC-permitted asset types to cover the settlement obligations under its open derivative contracts. During the six months ended August 31, 2009, the fund’s exposure to derivatives, based on underlying notional amounts, was generally between 0% and 1% of net assets.
The fund values its derivatives at fair value, as described below and in Note 2, and recognizes changes in fair value currently in its results of operations. Accordingly, the fund does not follow hedge accounting even for derivatives employed as economic hedges.
As of August 31, 2009, the fund held interest rate futures with cumulative unrealized loss of $46,000; the value reflected in Other Liabilities on the accompanying Statement of Assets and Liabilities is the related unsettled variation margin payable of $50,000.
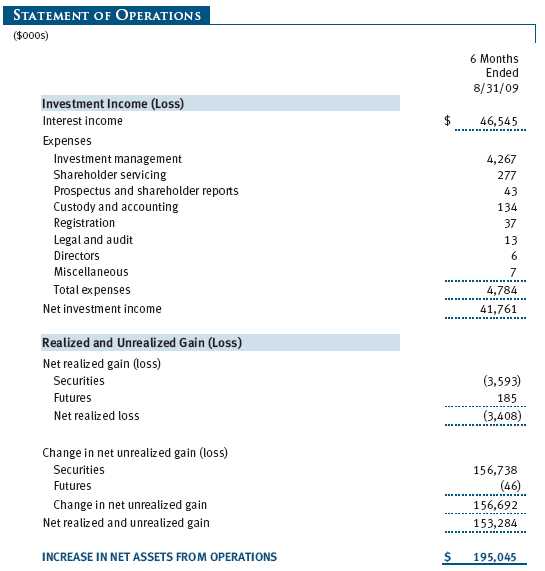
Additionally, during the six months ended August 31, 2009, the fund recognized $185,000 of realized gain on Futures and a $46,000 change in unrealized loss on Futures related to its investments in interest rate derivatives; such amounts are included in the accompanying Statement of Operations.
Counterparty risk related to exchange-traded derivatives, including futures and options contracts, is minimal because the exchange’s clearinghouse provides protection against defaults. Additionally, for exchange-traded derivatives, each broker in its sole discretion may change margin requirements applicable to the fund.
Futures Contracts The fund is subject to interest rate risk in the normal course of pursuing its investment objectives and uses futures contracts to help manage such risk. The fund may enter into futures contracts to manage exposure to interest rate and yield curve movements, security prices, foreign currencies, credit quality, and mortgage prepayments; as an efficient means of adjusting exposure to all or part of a target market; to enhance income; as a cash management tool; and/or to adjust portfolio duration and credit exposure. A futures contract provides for the future sale by one party and purchase by another of a specified amount of a particular underlying financial instrument at an agreed upon price, date, time, and place. The fund currently invests only in exchange-traded futures, which generally are standardized as to maturity date, underlying financial instrument, and other contract terms. Upon entering into a futures contract, the fund is required to deposit with the broker cash or securities in an amount equal to a certain percentage of the contract value (initial margin deposit); the margin deposit must then be maintained at the established level over the life of the contract. Subsequent payments are made or received by the fund each day to settle daily fluctuations in the value of the contract (variation margin), which reflect changes in the value of the underlying financial instrument. Variation margin is recorded as unrealized gain or loss until the contract is closed. For a futures contract, the value included in net assets is the amount of unsettled variation margin; variation margin receivable is included in Other Assets and variation margin payable is included in Other Liabilities. Risks related to the use of futures contracts include possible illiquidity of the futures markets, contract prices that can be highly volatile and imperfectly correlated to movements in hedged security values and/or interest rates, and potential losses in excess of the fund’s initial investment.
NOTE 4 - OTHER INVESTMENT TRANSACTIONS
Consistent with its investment objective, the fund engages in the following practices to manage exposure to certain risks or to enhance performance. The investment objective, policies, program, and risk factors of the fund are described more fully in the fund’s prospectus and Statement of Additional Information.
Noninvestment-Grade Debt Securities At August 31, 2009, approximately 35% of the fund’s net assets were invested, directly or through its investment in T. Rowe Price institutional funds, in noninvestment-grade debt securities, commonly referred to as “high-yield” or “junk” bonds. A real or perceived economic downturn or higher interest rates could adversely affect the liquidity or value, or both, of such securities because such events could lessen the ability of issuers to make principal and interest payments.
Restricted Securities The fund may invest in securities that are subject to legal or contractual restrictions on resale. Prompt sale of such securities at an acceptable price may be difficult and may involve substantial delays and additional costs.
Residual-Interest Bonds During the six months ended August 31, 2009, the fund held residual-interest bonds (RIBs) purchased from third-party special purpose trusts, which securitize an underlying bond into RIBs and short-term floating-rate bonds. RIBs generally are entitled to the cash flows of the underlying bond that remain after payment of amounts due to the floating-rate bondholders and trust-related fees; they also generally have the right to acquire the underlying bond from the trust. RIBs can only be traded in accordance with Rule 144A of the Securities Act of 1933 and cannot be offered for public resale. Risks arise from changes in interest rates and the value of the underlying bond, and the sale of the RIBs may involve delay or additional costs.
Other Purchases and sales of portfolio securities other than short-term securities aggregated $317,664,000 and $102,581,000, respectively, for the six months ended August 31, 2009.
NOTE 5 - FEDERAL INCOME TAXES
No provision for federal income taxes is required since the fund intends to continue to qualify as a regulated investment company under Subchapter M of the Internal Revenue Code and distribute to shareholders all of its income and gains. Distributions are determined in accordance with Federal income tax regulations, which differ from generally accepted accounting principles, and, therefore, may differ in amount or character from net investment income and realized gains for financial reporting purposes. Financial reporting records are adjusted for permanent book/tax differences to reflect tax character but are not adjusted for temporary differences. The amount and character of tax-basis distributions and composition of net assets are finalized at fiscal year-end; accordingly, tax-basis balances have not been determined as of August 31, 2009.
In accordance with federal tax regulations, the fund deferred recognition of certain capital loss amounts previously recognized in the prior fiscal year for financial reporting purposes until the current fiscal period for tax purposes. Such deferrals amounted to $10,781,000 and related to net capital losses realized between November 1 and the fund’s fiscal year-end date. Further, the fund intends to retain realized gains to the extent of available capital loss carryforwards. As of February 28, 2009, the fund had $17,027,000 of unused capital loss carryforwards, of which $1,699,000 expire in fiscal 2010, $8,610,000 expire in fiscal 2011, $61,000 expire in fiscal 2014, and $6,657,000 in fiscal 2017.
At August 31, 2009, the cost of investments for federal income tax purposes was $1,723,941,000. Net unrealized gain loss aggregated $180,382,000 at period-end, of which $42,671,000 related to appreciated investments and $223,053,000 related to depreciated investments.
NOTE 6 - RELATED PARTY TRANSACTIONS
The fund is managed by T. Rowe Price Associates, Inc. (the manager or Price Associates), a wholly owned subsidiary of T. Rowe Price Group, Inc. The investment management agreement between the fund and the manager provides for an annual investment management fee, which is computed daily and paid monthly. The fee consists of an individual fund fee, equal to 0.30% of the fund’s average daily net assets, and a group fee. The group fee rate is calculated based on the combined net assets of certain mutual funds sponsored by Price Associates (the group) applied to a graduated fee schedule, with rates ranging from 0.48% for the first $1 billion of assets to 0.285% for assets in excess of $220 billion. The fund’s group fee is determined by applying the group fee rate to the fund’s average daily net assets. At August 31, 2009, the effective annual group fee rate was 0.31%.
In addition, the fund has entered into service agreements with Price Associates and a wholly owned subsidiary of Price Associates (collectively, Price). Price Associates computes the daily share price and provides certain other administrative services to the fund. T. Rowe Price Services, Inc., provides shareholder and administrative services in its capacity as the fund’s transfer and dividend disbursing agent. For the six months ended August 31, 2009, expenses incurred pursuant to these service agreements were $66,000 for Price Associates and $174,000 for T. Rowe Price Services, Inc. The total amount payable at period-end pursuant to these service agreements is reflected as Due to Affiliates in the accompanying financial statements.
| INFORMATION ON PROXY VOTING POLICIES, PROCEDURES, AND RECORDS |
A description of the policies and procedures used by T. Rowe Price funds and portfolios to determine how to vote proxies relating to portfolio securities is available in each fund’s Statement of Additional Information, which you may request by calling 1-800-225-5132 or by accessing the SEC’s Web site, www.sec.gov. The description of our proxy voting policies and procedures is also available on our Web site, www.troweprice.com. To access it, click on the words “Our Company” at the top of our corporate homepage. Then, when the next page appears, click on the words “Proxy Voting Policies” on the left side of the page.
Each fund’s most recent annual proxy voting record is available on our Web site and through the SEC’s Web site. To access it through our Web site, follow the directions above, then click on the words “Proxy Voting Records” on the right side of the Proxy Voting Policies page.
| HOW TO OBTAIN QUARTERLY PORTFOLIO HOLDINGS |
The fund files a complete schedule of portfolio holdings with the Securities and Exchange Commission for the first and third quarters of each fiscal year on Form N-Q. The fund’s Form N-Q is available electronically on the SEC’s Web site (www.sec.gov); hard copies may be reviewed and copied at the SEC’s Public Reference Room, 450 Fifth St. N.W., Washington, DC 20549. For more information on the Public Reference Room, call 1-800-SEC-0330.
| APPROVAL OF INVESTMENT MANAGEMENT AGREEMENT |
On March 10, 2009, the fund’s Board of Directors (Board) unanimously approved the investment advisory contract (Contract) between the fund and its investment manager, T. Rowe Price Associates, Inc. (Manager). The Board considered a variety of factors in connection with its review of the Contract, also taking into account information provided by the Manager during the course of the year, as discussed below:
Services Provided by the Manager
The Board considered the nature, quality, and extent of the services provided to the fund by the Manager. These services included, but were not limited to, management of the fund’s portfolio and a variety of related activities, as well as financial and administrative services, reporting, and communications. The Board also reviewed the background and experience of the Manager’s senior management team and investment personnel involved in the management of the fund. The Board concluded that it was satisfied with the nature, quality, and extent of the services provided by the Manager.
Investment Performance of the Fund
The Board reviewed the fund’s average annual total returns over the 1-, 3-, 5-, and 10-year periods as well as the fund’s year-by-year returns and compared these returns with previously agreed upon comparable performance measures and market data, including those supplied by Lipper and Morningstar, which are independent providers of mutual fund data. On the basis of this evaluation and the Board’s ongoing review of investment results, and factoring in the severity of the market turmoil in 2008, the Board concluded that the fund’s performance was satisfactory.
Costs, Benefits, Profits, and Economies of Scale
The Board reviewed detailed information regarding the revenues received by the Manager under the Contract and other benefits that the Manager (and its affiliates) may have realized from its relationship with the fund, including research received under “soft dollar” agreements. The Board noted that soft dollars were not used to pay for third-party, non-broker research during 2008. The Board also received information on the estimated costs incurred and profits realized by the Manager and its affiliates from advising T. Rowe Price mutual funds, as well as estimates of the gross profits realized from managing the fund in particular. The Board concluded that the Manager’s profits were reasonable in light of the services provided to the fund. The Board also considered whether the fund or other funds benefit under the fee levels set forth in the Contract from any economies of scale realized by the Manager. Under the Contract, the fund pays a fee to the Manager composed of two components—a group fee rate based on the aggregate assets of certain T. Rowe Price mutual funds (including the fund) that declines at certain asset levels and an individual fund fee rate that is assessed on the assets of the fund. The Board concluded that the advisory fee structure for the fund continued to provide for a reasonable sharing of benefits from economies of scale with the fund’s investors.
Fees
The Board reviewed the fund’s management fee rate, operating expenses, and total expense ratio and compared them with fees and expenses of other comparable funds based on information and data supplied by Lipper. The information provided to the Board indicated that the fund’s management fee rate was at or above the median for comparable funds. The information also indicated that the fund’s expense ratio was at or below the median for comparable funds. The Board also reviewed the fee schedules for comparable privately managed accounts of the Manager and its affiliates. Management informed the Board that the Manager’s responsibilities for privately managed accounts are more limited than its responsibilities for the fund and other T. Rowe Price mutual funds that it or its affiliates advise. On the basis of the information provided, the Board concluded that the fees paid by the fund under the Contract were reasonable.
Approval of the Contract
As noted, the Board approved the continuation of the Contract. No single factor was considered in isolation or to be determinative to the decision. Rather, the Board concluded, in light of a weighting and balancing of all factors considered, that it was in the best interests of the fund to approve the continuation of the Contract, including the fees to be charged for services thereunder.
Item 2. Code of Ethics.
A code of ethics, as defined in Item 2 of Form N-CSR, applicable to its principal executive officer, principal financial officer, principal accounting officer or controller, or persons performing similar functions is filed as an exhibit to the registrant’s annual Form N-CSR. No substantive amendments were approved or waivers were granted to this code of ethics during the registrant’s most recent fiscal half-year.
Item 3. Audit Committee Financial Expert.
Disclosure required in registrant’s annual Form N-CSR.
Item 4. Principal Accountant Fees and Services.
Disclosure required in registrant’s annual Form N-CSR.
Item 5. Audit Committee of Listed Registrants.
Not applicable.
Item 6. Investments.
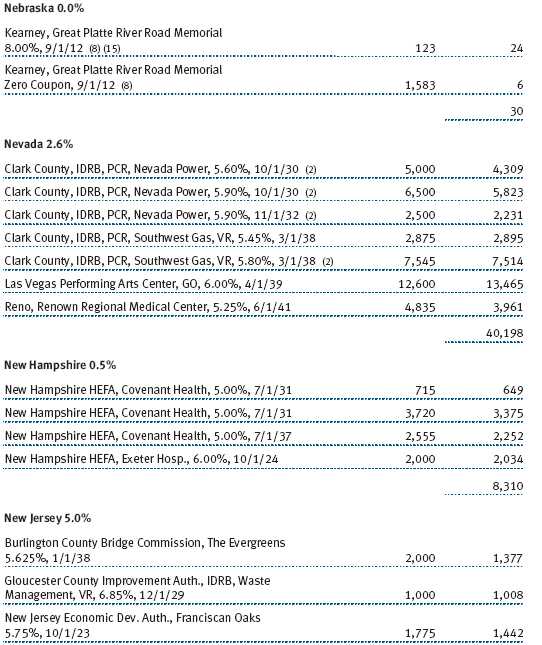
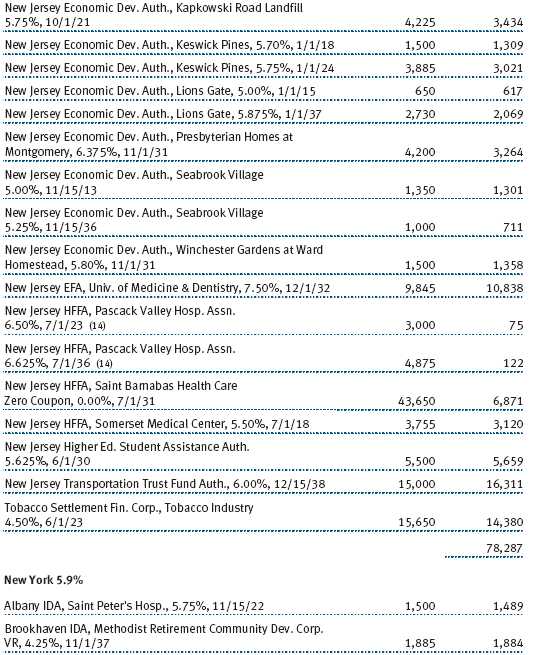
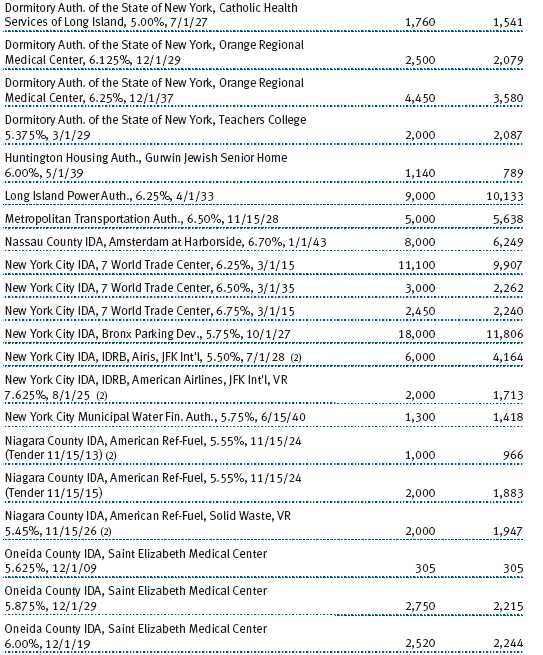
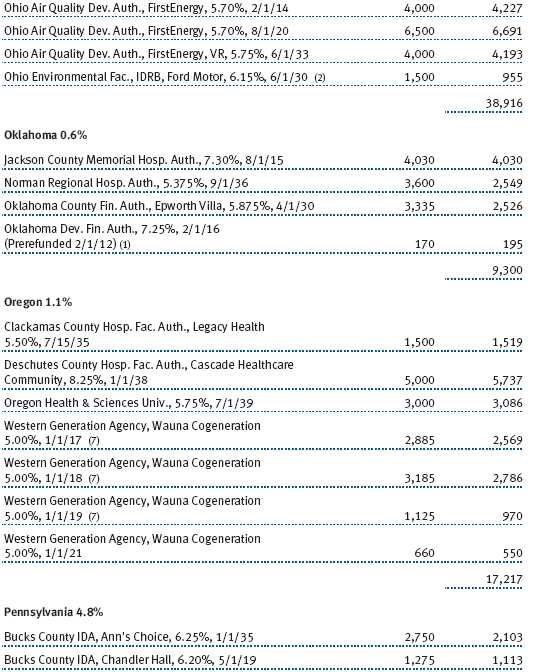
(a) Not applicable. The complete schedule of investments is included in Item 1 of this Form N-CSR.
(b) Not applicable.
Item 7. Disclosure of Proxy Voting Policies and Procedures for Closed-End Management Investment Companies.
Not applicable.
Item 8. Portfolio Managers of Closed-End Management Investment Companies.
Not applicable.
Item 9. Purchases of Equity Securities by Closed-End Management Investment Company and Affiliated Purchasers.
Not applicable.
Item 10. Submission of Matters to a Vote of Security Holders.
Not applicable.
Item 11. Controls and Procedures.
(a) The registrant’s principal executive officer and principal financial officer have evaluated the registrant’s disclosure controls and procedures within 90 days of this filing and have concluded that the registrant’s disclosure controls and procedures were effective, as of that date, in ensuring that information required to be disclosed by the registrant in this Form N-CSR was recorded, processed, summarized, and reported timely.
(b) The registrant’s principal executive officer and principal financial officer are aware of no change in the registrant’s internal control over financial reporting that occurred during the registrant’s second fiscal quarter covered by this report that has materially affected, or is reasonably likely to materially affect, the registrant’s internal control over financial reporting.
Item 12. Exhibits.
(a)(1) The registrant’s code of ethics pursuant to Item 2 of Form N-CSR is filed with the registrant’s annual Form N-CSR.
(2) Separate certifications by the registrant's principal executive officer and principal financial officer, pursuant to Section 302 of the Sarbanes-Oxley Act of 2002 and required by Rule 30a-2(a) under the Investment Company Act of 1940, are attached.
(3) Written solicitation to repurchase securities issued by closed-end companies: not applicable.
(b) A certification by the registrant's principal executive officer and principal financial officer, pursuant to Section 906 of the Sarbanes-Oxley Act of 2002 and required by Rule 30a-2(b) under the Investment Company Act of 1940, is attached.
| | |
SIGNATURES |
| |
| | Pursuant to the requirements of the Securities Exchange Act of 1934 and the Investment |
| Company Act of 1940, the registrant has duly caused this report to be signed on its behalf by the |
| undersigned, thereunto duly authorized. |
| |
| T. Rowe Price Tax-Free High Yield Fund, Inc. |
| |
| |
| |
| By | /s/ Edward C. Bernard |
| | Edward C. Bernard |
| | Principal Executive Officer |
| |
| Date | October 16, 2009 |
| |
| |
| |
| | Pursuant to the requirements of the Securities Exchange Act of 1934 and the Investment |
| Company Act of 1940, this report has been signed below by the following persons on behalf of |
| the registrant and in the capacities and on the dates indicated. |
| |
| |
| By | /s/ Edward C. Bernard |
| | Edward C. Bernard |
| | Principal Executive Officer |
| |
| Date | October 16, 2009 |
| |
| |
| |
| By | /s/ Gregory K. Hinkle |
| | Gregory K. Hinkle |
| | Principal Financial Officer |
| |
| Date | October 16, 2009 |