UNITED STATES
SECURITIES AND EXCHANGE COMMISSION
Washington, D.C. 20549
FORM N-CSR
CERTIFIED SHAREHOLDER REPORT OF REGISTERED
MANAGEMENT INVESTMENT COMPANIES
Investment Company Act File Number: 811-4163
| T. Rowe Price Tax-Free High Yield Fund, Inc. |
|
| (Exact name of registrant as specified in charter) |
| |
| 100 East Pratt Street, Baltimore, MD 21202 |
|
| (Address of principal executive offices) |
| |
| David Oestreicher |
| 100 East Pratt Street, Baltimore, MD 21202 |
|
| (Name and address of agent for service) |
Registrant’s telephone number, including area code: (410) 345-2000
Date of fiscal year end: February 29
Date of reporting period: August 31, 2012
Item 1. Report to Shareholders
| Tax-Free High Yield Fund | August 31, 2012 |
The views and opinions in this report were current as of August 31, 2012. They are not guarantees of performance or investment results and should not be taken as investment advice. Investment decisions reflect a variety of factors, and the managers reserve the right to change their views about individual stocks, sectors, and the markets at any time. As a result, the views expressed should not be relied upon as a forecast of the fund’s future investment intent. The report is certified under the Sarbanes-Oxley Act, which requires mutual funds and other public companies to affirm that, to the best of their knowledge, the information in their financial reports is fairly and accurately stated in all material respects.
REPORTS ON THE WEB
Sign up for our E-mail Program, and you can begin to receive updated fund reports and prospectuses online rather than through the mail. Log in to your account at troweprice.com for more information.
Manager’s Letter
Fellow Shareholders
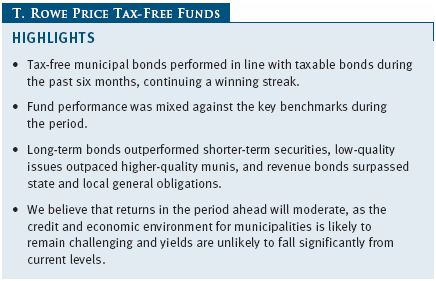
Tax-free municipal bonds produced good returns in the last six months, performing in line with taxable bonds and continuing a tremendous performance streak. Longer-term munis rose with Treasuries, but to a lesser extent, as the European sovereign debt crisis continued to simmer, U.S. job growth moderated, and emerging markets economies cooled. Munis were also supported by strong demand as state and local governments continue to balance budgets in challenging economic times. T. Rowe Price’s Tax-Free Funds’ performance was mixed versus their benchmarks in the last six months, but their longer-term relative performance remained favorable.
MARKET ENVIRONMENT
The U.S. economy has been expanding at a modest pace in 2012 compared with what is typically seen in the years following a deep recession. Although job growth moderated in the second quarter after a strong start to the year, the economy has shown resilience in the face of a nascent recession and ongoing sovereign debt crisis in Europe, a slowdown in Chinese growth, and bouts of global market volatility. We believe growth will continue at a modest to moderate pace in the months ahead, but uncertainty about the “fiscal cliff” of federal tax increases and spending cuts scheduled to take place at the end of 2012 could restrain economic activity.
To help keep long-term interest rates low, the Federal Reserve announced that it would continue its maturity extension program, which had been set to expire at the end of June, for six more months. Through this program, the Fed sold $400 billion of its short-term Treasuries and purchased an equal amount of long-term Treasuries from autumn 2011 through mid-2012. By the end of 2012, the central bank plans to exchange an additional $267 billion in short-term Treasuries for long-term government bonds. More recently, the Fed announced further easing to stimulate the U.S. economy and reduce unemployment, including plans to purchase $40 billion of mortgage-backed securities each month.
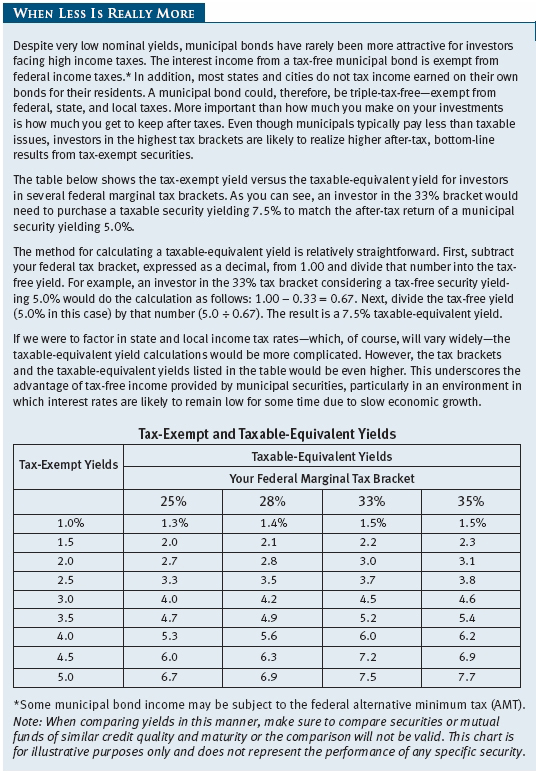
In the last six months, shorter-term municipal yields remained very low and were little changed, but longer-term muni yields declined with Treasury yields, albeit to a lesser extent. With municipal yields higher than Treasury yields across the board, tax-free securities are a very attractive alternative for fixed income investors. For example, as of August 31, 2012, the 2.89% yield offered by a 30-year tax-free municipal bond rated AAA was 108% of the 2.67% pretax yield offered by a 30-year Treasury. An investor in the 28% federal tax bracket would need to invest in a taxable bond yielding about 4.01% in order to receive the same after-tax income. For more information about calculating taxable-equivalent yields, please see the sidebar on page 3.
MUNICIPAL MARKET NEWS
Municipal issuance totaled about $253 billion in the first eight months of 2012, according to The Bond Buyer. However, much of the year-to-date issuance reflects municipalities refinancing their debt to take advantage of low long-term interest rates rather than net new issuance. Supply is expected to increase in September and October, and full-year issuance is likely to approach $400 billion. One positive factor for munis is that austerity-minded state and local government leaders have been conservative about adding to indebtedness, despite prevailing low yields. Another favorable factor supporting the market is brisk demand, particularly for long-term issues.

Many states continue to face fiscal difficulties and have been forced to raise taxes and fees and cut spending to close budget deficits. We believe many states deserve high credit ratings, and we do not see a near-term threat to their ability to continue servicing their outstanding debts. However, we have longer-term concerns about the states’ willingness and ability to address sizable pension obligations and other retirement benefits.
Municipal bond performance in the last six months was driven, once again, by investors’ search for higher yields in a low interest rate environment. Long-term bonds outperformed shorter-term securities, low-quality issues outpaced higher-quality munis, and revenue bonds surpassed state and local general obligations (GOs). We generally favor bonds backed by a dedicated revenue stream over GOs. Among revenue bonds, the performance of most sectors varied little. The main exceptions were industrial revenue and health care, which were leading segments, while power and special tax revenue bonds trailed with milder gains. We are becoming more selective among hospital revenue bonds, as new issue supply and some credit concerns are weighing on the sector. Prerefunded bonds, which are backed by U.S. Treasuries, continued to produce modest gains due to their high-quality and short-term characteristics.
PORTFOLIO STRATEGY
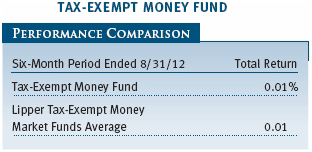
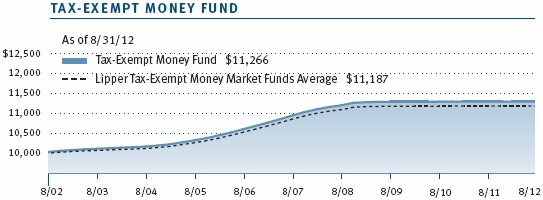
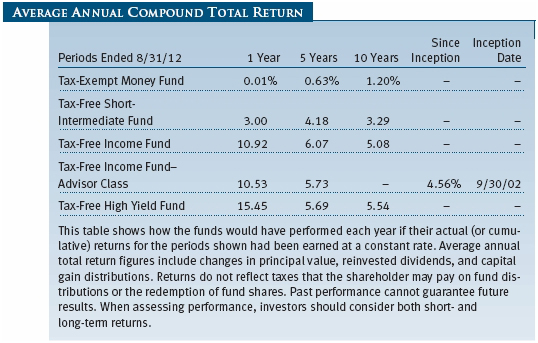
The fund returned 0.01% during the six-month period ended August 31, 2012, which was in line with the performance of the Lipper Tax-Exempt Money Market Funds Average. All money market rates continue to be closely tied to the Federal Reserve’s fed funds target rate of 0.00% to 0.25%.
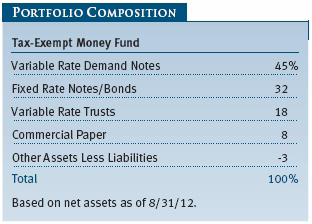
Tax-exempt money market rates seem to have found some measure of equilibrium in the past six months. As the prospects for 0% interest rates into 2015 remain very likely, and with supply and demand seemingly in balance for now, the money market yield curve has stabilized somewhat. This curve ranges from about 15 basis points (0.15%) on overnight investments to around 22 basis points on one-year maturities. In the past six months, the curve has flattened as 1- to 90-day yields moved higher while 6- to 12-month yields were relatively unchanged. Barring a change in Fed policy, a major credit event in Europe, or a shift in supply, we expect rate movement to remain benign in the near term. For investors, money market returns will remain minimal. Given this outlook, we are comfortable maintaining a target weighted average maturity at the long end of our permissible range and continue to operate with a target of 50 to 55 days.
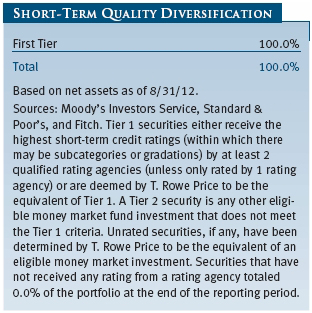
Credit quality remains a key focus in the management of the fund. We still have significant exposure to high-quality state and local general obligations, hospitals, and university securities. Bank liquidity providers figure prominently in the financing of many short-term municipal borrowings, and we are mindful of their impact on this segment of the market.
In August, the Securities and Exchange Commission (SEC) concluded that further changes to the rules governing money market funds would not be addressed at this time. The significant risk-limiting measures implemented by the SEC in 2010, which mandated higher liquidity requirements and reduced credit risk, have resulted in more resilient money fund products throughout the industry—although we have consistently strived to avoid inappropriate risks. Liquidity and principal stability remain fundamental needs for shareholders, and we are focused on managing the fund with those needs in mind.
TAX-FREE SHORT-INTERMEDIATE FUND
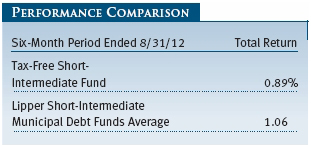
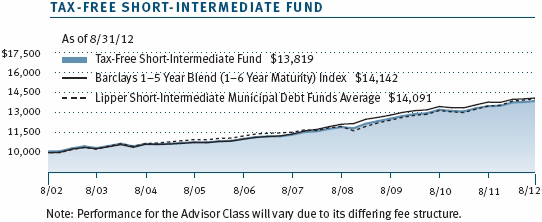
The fund returned 0.89% during the six months ended August 31, 2012, compared with 1.06% for the Lipper Short-Intermediate Municipal Debt Funds Average, which measures the performance of competing funds. (Performance was 0.09% for the Advisor Class since its inception on August 8, 2012). The fund’s net asset value per share was $5.71 at the end of August, the same as six months earlier. Dividends per share contributed $0.05 to the fund’s total return during the six-month period.
At the beginning of the reporting period, we expected short-term interest rates to remain low for the foreseeable future. Accordingly, we focused on generating attractive returns from longer-term bonds with higher yields whose maturities were getting closer, overweighting sectors of the market that offered greater yield while remaining wary of taking on too much risk with specific security selection—particularly in the current challenging environment for many municipal bond issuers.

At the same time, we managed the fund’s duration so that it ranged from neutral to slightly longer than that of our benchmark. (The longer a fund’s duration, the greater its sensitivity to interest rate changes.) Early in the period, we attempted to reduce our cash level and keep it at a minimum. Most of our new purchases have been of bonds with three- to six-year maturities. We were overweight in so-called spread sectors—those offering relatively high yields compared with high-quality bonds—and added to transportation, hospitals, electric revenue, and similar sectors opportunistically throughout the period. In an effort to put cash to work most effectively, we invested new funds into longer-term, higher-quality state general obligation bonds when spread sector securities were unavailable.
Toward the end of the period, we reversed course a bit and elected to allow our cash reserves to start building back up. New issue activity in August was limited, and trading volumes were low. As such, we slowed the pace of our reinvestment in the face of prospectively higher new issue volume in the fall.

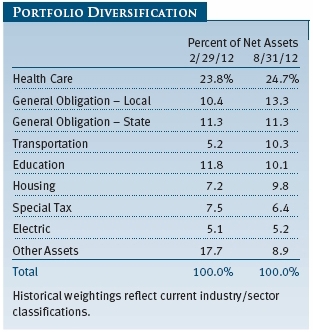
At the end of the period, transportation bonds accounted for 18.0% of the portfolio, up from 15.8% last February. Health care was roughly the same at 13.8%, state and local GOs combined had risen from 19.9% to 22.5%, and the portfolio’s allocation to electric utility bonds had slipped from 11.7% to 10.2%. AA and A bonds composed the lion’s share, with a total of 82% of net assets, while AAA and BBB fleshed out the remainder of the portfolio. Many of our transportation and health care bonds, particularly those rated A and lower, have been among the best performers for the portfolio.
TAX-FREE INCOME FUND
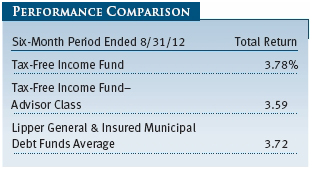
Your fund returned 3.78% during the past six months, slightly ahead of the 3.72% return for the Lipper General & Insured Municipal Debt Funds Average. (Performance for the Advisor Class was somewhat lower, reflecting its different fee structure.) The fund’s net asset value per share was $10.55 at the end of August compared with $10.37 at the end of February. Dividends per share contributed $0.21 to the fund’s total return during the past six months.
We continued to emphasize longer-term bonds in the portfolio. The municipal yield curve remained steep, and shorter maturities offered little in the way of yields, accounting for our underweight position in the 3- to 15-year maturity range. We increased our overweighting in bonds with maturities of 20 years and longer where interest rates are more compelling. We reduced the fund’s cash position and holdings inside of two years, whose performance lagged the overall market. Our strategy is to redeploy assets into longer maturities as opportunities arise. The fund’s duration was relatively unchanged at 5.3 years—longer relative to the benchmark. Our weighted average maturity lengthened a full year, which benefited performance.
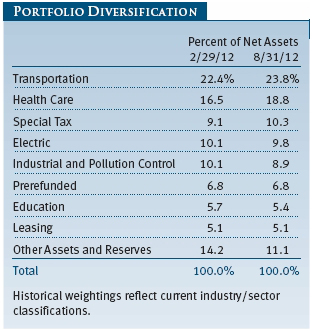
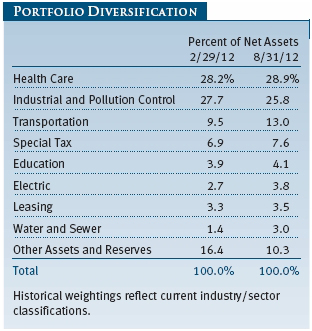
We were underweight GO debt and overweight revenue bonds relative to the benchmark. Our outlook for states has stabilized, but we believe that many municipalities at the local level still face fiscal challenges—a view reflected in the fund’s five largest sectors. Transportation is the largest at just below 24%. Health care is next at 18.8%, up from 16.5% at the end of February. Both sectors offer attractive yields relative to comparable securities in other areas. During the six-month period, revenue bonds outperformed GOs, with health care and industrial and pollution control bonds generating exceptionally strong returns.
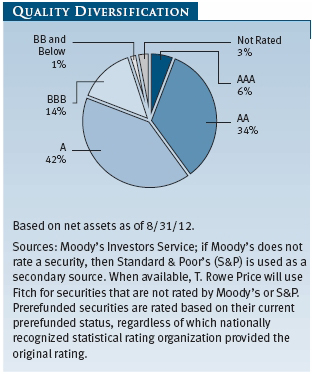
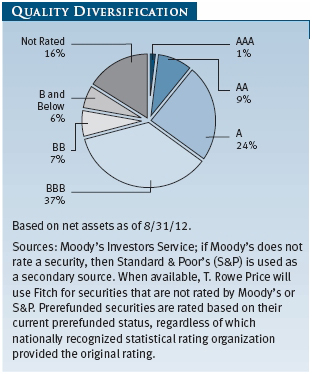
We made slight shifts in the fund’s quality diversification. Exposure to AAA bonds declined to 6% of assets. AA holdings fell slightly to 34%. We were underweight in both categories and overweight in A and BBB securities after increasing our exposure during the period—another boost to fund results. Holdings that underperformed were the same as during the last reporting period: high-quality bonds with short durations.
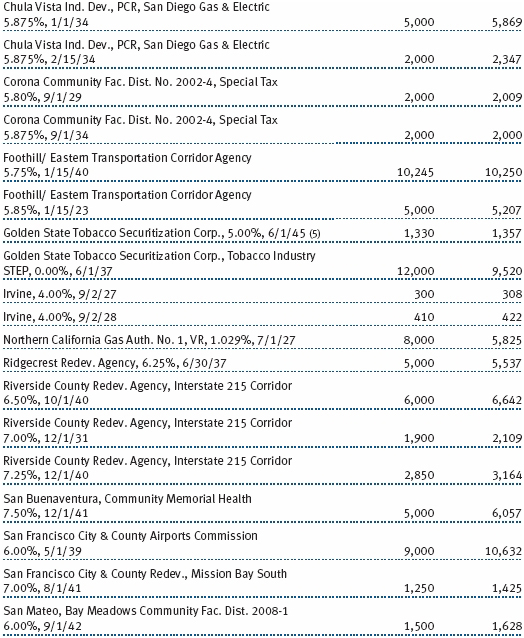
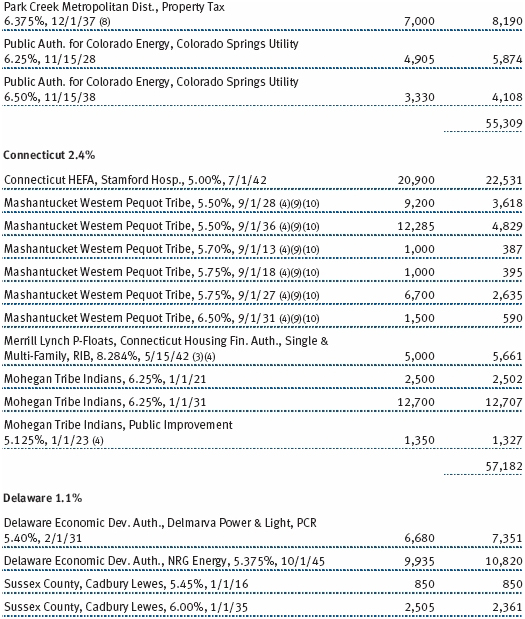
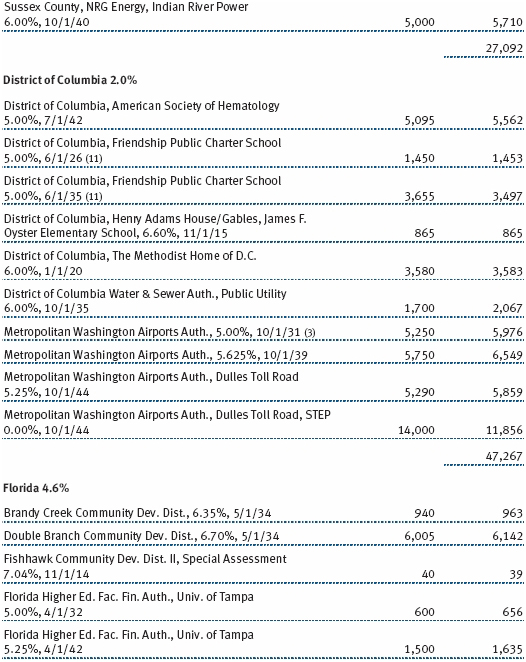
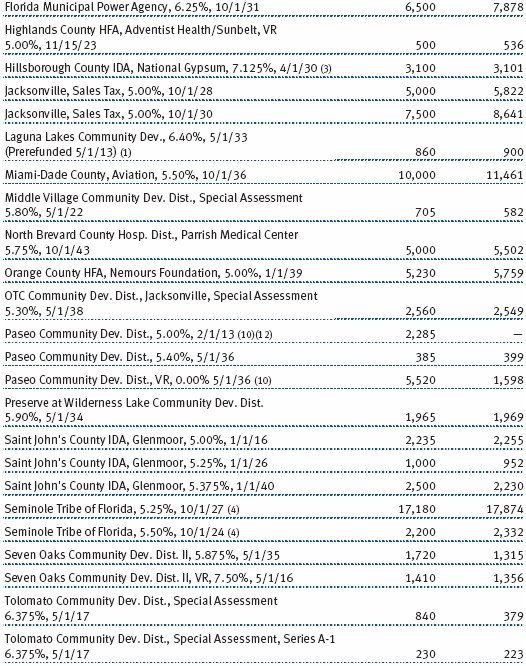
We were active buyers of bonds during the period, increasing our exposure to the North Texas Thruway Authority, currently one of our largest guarantors. In the hospital sector, we purchased two new names—California Health Facilities for Stanford Health and Connecticut Health and Ed for Stamford Hospital. In our view, the extra yield from these and other transportation and health care holdings should contribute to relative performance versus the benchmark going forward. (Please refer to the fund’s portfolio of investments for a complete list of holdings and the amount each represents in the portfolio.)
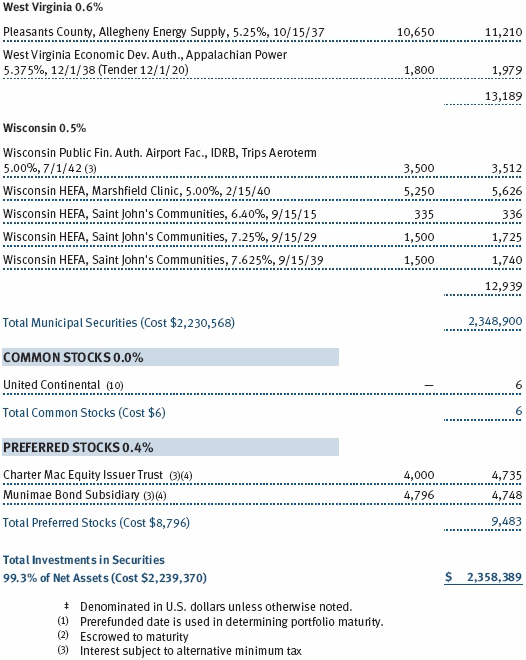
TAX-FREE HIGH YIELD FUND
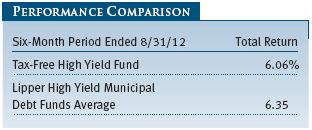
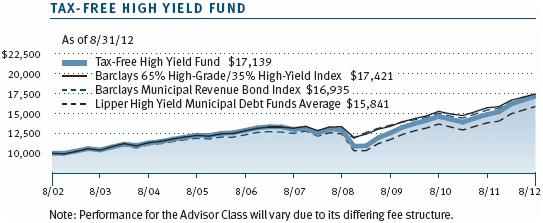
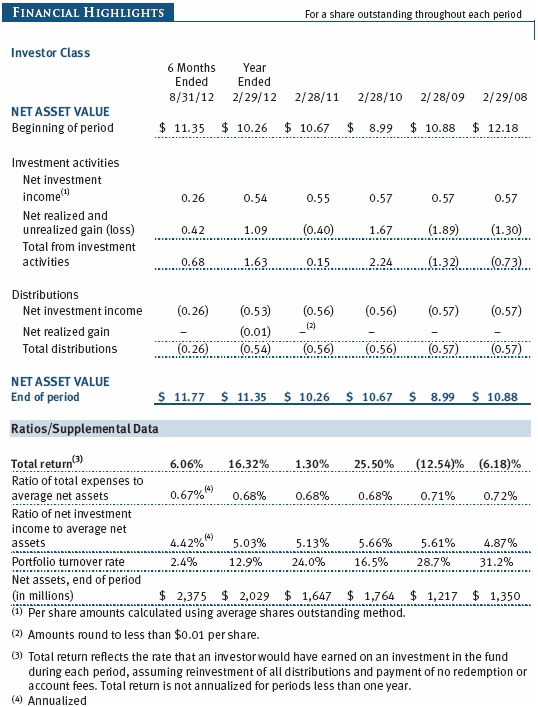
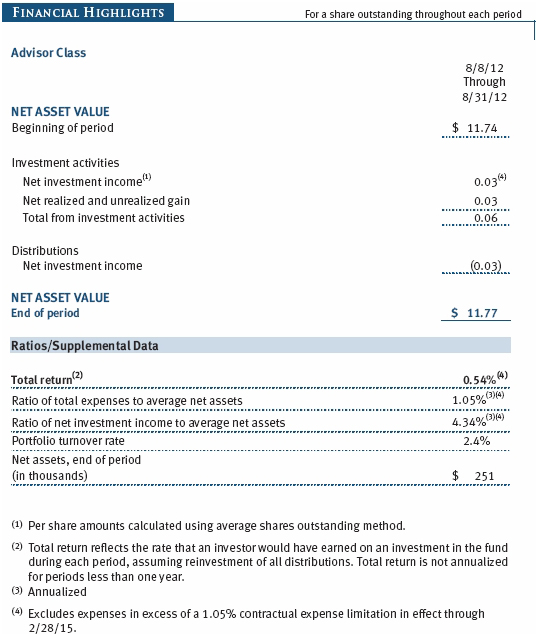
The Tax-Free High Yield Fund returned 6.06% during the past six months compared with 6.35% for the Lipper High Yield Municipal Debt Funds Average, which measures the performance of similar funds. (Performance was 0.54% for the Advisor Class since its inception on August 8, 2012). The fund’s net asset value per share was $11.77 at the end of August, up from $11.35 at the end of February, and dividends per share contributed $0.26 to the fund’s total return during the past six months. Please note that the Barclays 65% High-Grade/35% High-Yield Index has been added to the Growth of $10,000 chart on page 20. We believe this index better reflects the fund’s investment program than the Barclays Municipal Revenue Bond Index, and it will now serve as the fund’s primary benchmark as of August 31, 2012.
Medium- and lower-quality municipal bonds continued to post stellar returns during the six-month period. Restrained new issue supply, reasonably attractive risk premiums, a slow but growing economic climate, and significant investor demand for tax-exempt income in a low interest rate environment drove bond prices higher throughout the period.
We continued to favor tax-exempt bonds issued by corporate borrowers. Since the beginning of the financial crisis, many corporations have focused on efficiency in their core businesses and on improving the health of their balance sheets, favoring bondholders. Valuations in corporate industrial and pollution control revenue bonds improved during the period but still offer attractive value from a long-term perspective. We added to our Southwest Airlines holdings and maintained significant exposure to Dow Chemical and Marathon Oil.
We added to our positions in essential service revenue bonds, most notably airports and toll roads. Large, capital-intensive infrastructure projects generate significant revenue streams for debt payment and often benefit from little or no direct competition. The fund increased its holdings in Dallas/Fort Worth International Airport and initiated holdings in two new Virginia road and tunnel projects.
We benefited from significant stakes in health care-related debt. Returns for hospital revenue bonds and life care facilities were among the highest for the period. Hospital bonds shrugged off previous concerns regarding national health care reform and potential reimbursement changes. Many life care bonds posted stable operations and improved occupancy statistics as the real estate market stabilized. New issue supply in this sector has been limited. Our Barnabas Health (NJ) bonds performed well, as operations continued to improve following the challenges faced several years ago.
Our conservative positioning in tobacco securitization bonds was a drag on returns for the period. These highly structured bonds rely on continued cigarette consumption, which has been declining, to provide revenues for future bond payments. To date, the decline in smoking has far outpaced projections, significantly hurting the likelihood of full and timely payment on most tobacco bonds. In the past few years, ratings on the bonds suffered significantly (most were lowered to B). More recently, strong investor demand for high nominal yields and less onerous consumption declines drove a bounce in the bonds.
Higher-yielding municipals have had a strong run in recent years. Significant investor demand for income and greater comfort in the credit landscape for municipals have reduced risk premiums. From a longer-term perspective, we remain constructive on medium- and lower-quality bonds, and we believe the market is fairly compensating investors for assuming credit risk.
OUTLOOK
While we are pleased with the tremendous performance of municipal bonds over the last 18 months, we believe that returns in the period ahead will moderate, as the credit and economic environment for municipalities is likely to remain challenging and yields are unlikely to fall significantly from current levels. Modest economic growth and improving income and sales tax revenues are providing some support for state and local governments. However, cutbacks in state support for municipalities and persisting downward pressure on property tax revenues could keep local municipal issuers vulnerable. If the economy slides back into a recession—which we are not currently predicting—municipalities will face even tougher challenges.
State and local government liabilities such as pension benefits and health care costs are growing long-term concerns. Maintaining balanced budgets and addressing these long-term concerns require careful and dedicated work by state and local officials. These efforts will need to continue—with or without additional federal government assistance.
We continue to believe that the municipal bond market is a high-quality market, with good opportunities for long-term investors. In this low-rate environment, we believe long-term bonds and A rated sectors represent good value. While we are comforted somewhat by Federal Reserve assurances that interest rate hikes are not imminent and by the demonstrated ability of states to balance their budgets in tough times, we are mindful that municipal yields are at or near historic lows and that there is the potential for losses if rates rise in response to stronger economic growth or inflation. With rates at such low levels, we are guarded in our interest rate outlook and careful with any investment shift that might increase our portfolios’ interest rate sensitivity.
We believe T. Rowe Price’s strong credit research capabilities will remain an asset for our investors. We continue to conduct thorough research and assign our own independent credit ratings before making investment decisions. As always, we are on the lookout for attractively valued bonds issued by municipalities with good fundamentals—an investment strategy that has served our investors well in the past.
Thank you for investing with T. Rowe Price.
Respectfully submitted,

Joseph K. Lynagh
Chairman of the Investment Advisory Committee
Tax-Exempt Money Fund

Charles B. Hill
Chairman of the Investment Advisory Committee
Tax-Free Short-Intermediate Fund

Konstantine B. Mallas
Chairman of the Investment Advisory Committee
Tax-Free Income Fund

James M. Murphy
Chairman of the Investment Advisory Committee
Tax-Free High Yield Fund
September 20, 2012
The committee chairmen have day-to-day responsibility for managing the portfolios and work with committee members in developing and executing the funds’ investment programs.
RISKS OF FIXED INCOME INVESTING
Since money market funds are managed to maintain a constant $1.00 share price, there should be little risk of principal loss. However, there is no assurance the fund will avoid principal losses if fund holdings default or are downgraded or if interest rates rise sharply in an unusually short period. In addition, the fund’s yield will vary; it is not fixed for a specific period like the yield on a bank certificate of deposit. An investment in the fund is not insured or guaranteed by the Federal Deposit Insurance Corporation (FDIC) or any other government agency. Although a money market fund seeks to preserve the value of your investment at $1.00 per share, it is possible to lose money by investing in it.
Bonds are subject to interest rate risk (the decline in bond prices that usually accompanies a rise in interest rates) and credit risk (the chance that any fund holding could have its credit rating downgraded or that a bond issuer will default by failing to make timely payments of interest or principal), potentially reducing the fund’s income level and share price. High yield bonds could have greater price declines than funds that invest primarily in high-quality bonds. Municipalities issuing high yield bonds are not as strong financially as those with higher credit ratings, so the bonds are usually considered speculative investments. Some income may be subject to state and local taxes and the federal alternative minimum tax.
GLOSSARY
Barclays 65% High Grade/35% High-Yield Index: An index that tracks Barclays indexes of both investment-grade and below investment-grade municipal debt instruments.
Barclays Municipal Bond Index: An unmanaged index that tracks municipal debt instruments.
Barclays Municipal Revenue Bond Index: An unmanaged index that tracks municipal revenue bonds.
Barclays 1–5 Year Blend (1–6 Year Maturity) Index: A subindex of the Barclays Municipal Bond Index. It is a rules-based, market value-weighted index of short-term bonds engineered for the tax-exempt bond market.
Basis point: One one-hundredth of one percentage point, or 0.01%.
Duration: A measure of a bond fund’s sensitivity to changes in interest rates. For example, a fund with a duration of five years would fall about 5% in price in response to a one-percentage-point rise in interest rates, and vice versa.
Escrowed-to-maturity bond: A bond that has the funds necessary for repayment at maturity, or a call date, set aside in a separate or “escrow” account.
Federal funds rate: The interest rate charged on overnight loans of reserves by one financial institution to another in the United States. The Federal Reserve sets a target federal funds rate to affect the direction of interest rates.
General obligation debt: A government’s strongest pledge that obligates its full faith and credit, including, if necessary, its ability to raise taxes.
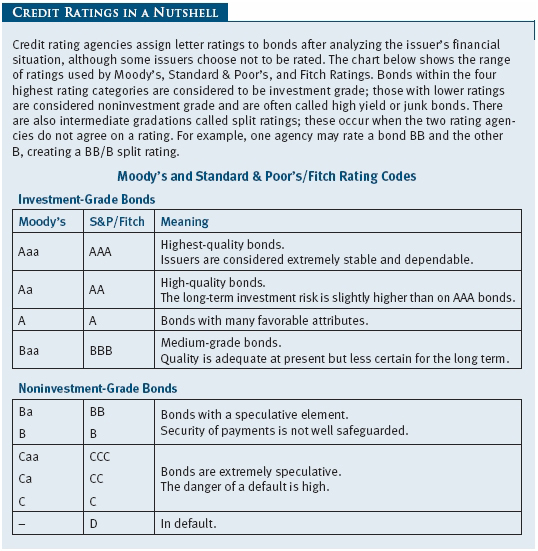
Investment grade: High-quality bonds as measured by one of the major credit rating agencies. For example, Standard & Poor’s designates the bonds in its top four categories (AAA to BBB) as investment grade.
LIBOR: The London Interbank Offered Rate, which is a benchmark for short-term taxable rates.
Lipper averages: The averages of available mutual fund performance returns for specified time periods in categories defined by Lipper.
Prerefunded bond: A bond that originally may have been issued as a general obligation or revenue bond but that is now secured by an escrow fund consisting entirely of direct U.S. government obligations that are sufficient for paying the bondholders.
SEC yield (7-day simple): A method of calculating a money fund’s yield by annualizing the fund’s net investment income for the last seven days of each period divided by the fund’s net asset value at the end of the period. Yield will vary and is not guaranteed.
SEC yield (30-day): A method of calculating a fund’s yield that assumes all portfolio securities are held until maturity. Yield will vary and is not guaranteed.
Weighted average life: A measure of a fund’s credit quality risk. In general, the longer the average life, the greater the fund’s credit quality risk. The average life is the dollar-weighted average maturity of a portfolio’s individual securities without taking into account interest rate readjustment dates. Money funds must maintain a weighted average life of less than 120 days.
Weighted average maturity: A measure of a fund’s interest rate sensitivity. In general, the longer the average maturity, the greater the fund’s sensitivity to interest rate changes. The weighted average maturity may take into account the interest rate readjustment dates for certain securities. Money funds must maintain a weighted average maturity of less than 60 days.
Yield curve: A graphic depiction of the relationship between yields and maturity dates for a set of similar securities such as Treasuries or municipal securities. Securities with longer maturities usually have a higher yield. If short-term securities offer a higher yield, then the curve is said to be “inverted.” If short-and long-term bonds are offering equivalent yields, then the curve is said to be “flat.”
Performance and Expenses
This chart shows the value of a hypothetical $10,000 investment in the fund over the past 10 fiscal year periods or since inception (for funds lacking 10-year records). The result is compared with benchmarks, which may include a broad-based market index and a peer group average or index. Market indexes do not include expenses, which are deducted from fund returns as well as mutual fund averages and indexes.
This chart shows the value of a hypothetical $10,000 investment in the fund over the past 10 fiscal year periods or since inception (for funds lacking 10-year records). The result is compared with benchmarks, which may include a broad-based market index and a peer group average or index. Market indexes do not include expenses, which are deducted from fund returns as well as mutual fund averages and indexes.

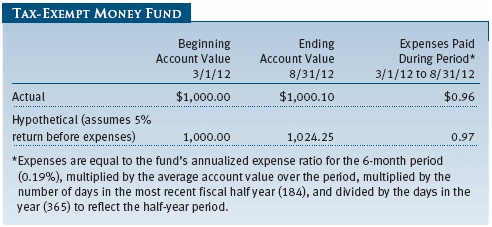
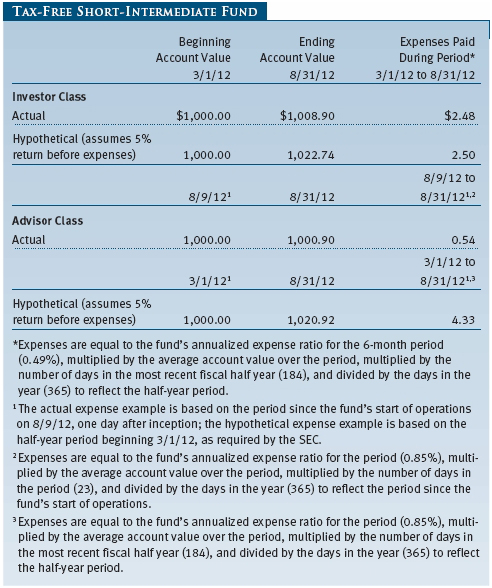
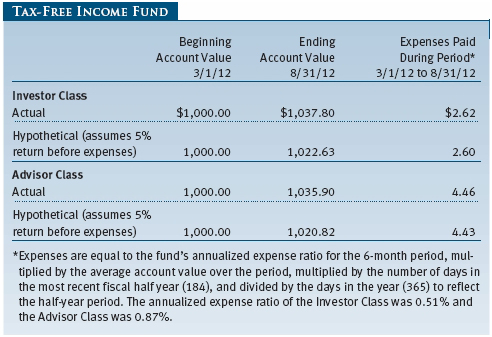
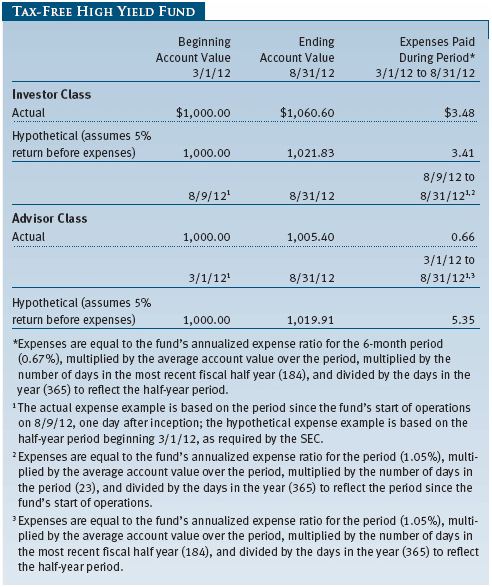
As a mutual fund shareholder, you may incur two types of costs: (1) transaction costs, such as redemption fees or sales loads, and (2) ongoing costs, including management fees, distribution and service (12b-1) fees, and other fund expenses. The following example is intended to help you understand your ongoing costs (in dollars) of investing in the fund and to compare these costs with the ongoing costs of investing in other mutual funds. The example is based on an investment of $1,000 invested at the beginning of the most recent six-month period and held for the entire period.
Actual Expenses
The first line of the following table (Actual) provides information about actual account values and actual expenses. You may use the information on this line, together with your account balance, to estimate the expenses that you paid over the period. Simply divide your account value by $1,000 (for example, an $8,600 account value divided by $1,000 = 8.6), then multiply the result by the number on the first line under the heading “Expenses Paid During Period” to estimate the expenses you paid on your account during this period.
Please note that the Tax-Free Short-Intermediate Fund, Tax-Free Income Fund, and Tax-Free High Yield Fund have two share classes: The original share class (Investor Class) charges no distribution and service (12b-1) fee, and the Advisor Class shares are offered only through unaffiliated brokers and other financial intermediaries and charge a 0.25% 12b-1 fee. Each share class is presented separately in the table.
Hypothetical Example for Comparison Purposes
The information on the second line of the table (Hypothetical) is based on hypothetical account values and expenses derived from the fund’s actual expense ratio and an assumed 5% per year rate of return before expenses (not the fund’s actual return). You may compare the ongoing costs of investing in the fund with other funds by contrasting this 5% hypothetical example and the 5% hypothetical examples that appear in the shareholder reports of the other funds. The hypothetical account values and expenses may not be used to estimate the actual ending account balance or expenses you paid for the period.
Note: T. Rowe Price charges an annual account service fee of $20, generally for accounts with less than $10,000. The fee is waived for any investor whose T. Rowe Price mutual fund accounts total $50,000 or more; accounts electing to receive electronic delivery of account statements, transaction confirmations, prospectuses, and shareholder reports; or accounts of an investor who is a T. Rowe Price Preferred Services, Personal Services, or Enhanced Personal Services client (enrollment in these programs generally requires T. Rowe Price assets of at least $100,000). This fee is not included in the accompanying table. If you are subject to the fee, keep it in mind when you are estimating the ongoing expenses of investing in the fund and when comparing the expenses of this fund with other funds.
You should also be aware that the expenses shown in the table highlight only your ongoing costs and do not reflect any transaction costs, such as redemption fees or sales loads. Therefore, the second line of the table is useful in comparing ongoing costs only and will not help you determine the relative total costs of owning different funds. To the extent a fund charges transaction costs, however, the total cost of owning that fund is higher.

Unaudited
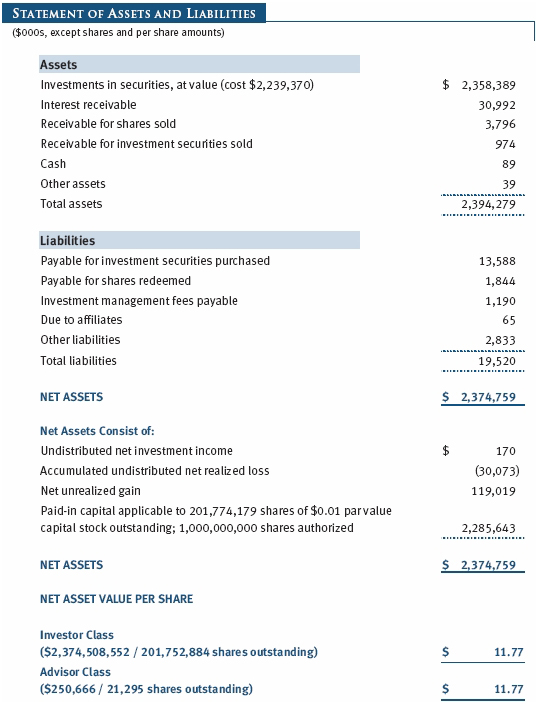
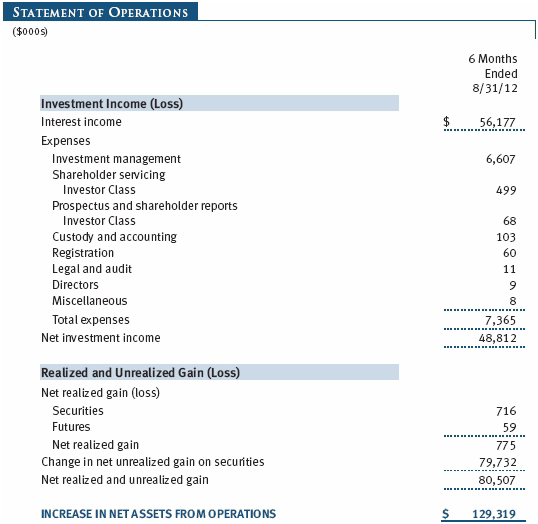
The accompanying notes are an integral part of these financial statements.
Unaudited
The accompanying notes are an integral part of these financial statements.
Unaudited


The accompanying notes are an integral part of these financial statements.
Unaudited
The accompanying notes are an integral part of these financial statements.
Unaudited
The accompanying notes are an integral part of these financial statements.
Unaudited

The accompanying notes are an integral part of these financial statements.
Unaudited
| Notes to Financial Statements |
T. Rowe Price Tax-Free High Yield Fund, Inc. (the fund), is registered under the Investment Company Act of 1940 (the 1940 Act) as a diversified, open-end management investment company. The fund seeks to provide a high level of income exempt from federal income taxes by investing primarily in long-term low- to upper-medium-grade municipal securities. The fund has two classes of shares: the Tax-Free High Yield Fund original share class, referred to in this report as the Investor Class, offered since March 1, 1985, and the Tax-Free High Yield Fund–Advisor Class (Advisor Class), offered since August 8, 2012. Advisor Class shares are sold only through unaffiliated brokers and other unaffiliated financial intermediaries that are compensated by the class for distribution, shareholder servicing, and/or certain administrative services under a Board-approved Rule 12b-1 plan. Each class has exclusive voting rights on matters related solely to that class; separate voting rights on matters that relate to both classes; and, in all other respects, the same rights and obligations as the other class.
NOTE 1 - SIGNIFICANT ACCOUNTING POLICIES
Basis of Preparation The accompanying financial statements were prepared in accordance with accounting principles generally accepted in the United States of America (GAAP), which require the use of estimates made by management. Management believes that estimates and valuations are appropriate; however, actual results may differ from those estimates, and the valuations reflected in the accompanying financial statements may differ from the value ultimately realized upon sale or maturity.
Investment Transactions, Investment Income, and Distributions Income and expenses are recorded on the accrual basis. Premiums and discounts on debt securities are amortized for financial reporting purposes. Dividend income and capital gain distributions are recorded on the ex-dividend date. Income tax-related interest and penalties, if incurred, would be recorded as income tax expense. Investment transactions are accounted for on the trade date. Realized gains and losses are reported on the identified cost basis. Distributions to shareholders are recorded on the ex-dividend date. Income distributions are declared by each class daily and paid monthly. Capital gain distributions, if any, are generally declared and paid by the fund annually.
Class Accounting The Advisor Class pays distribution, shareholder servicing, and/or certain administrative expenses in the form of Rule 12b-1 fees, in an amount not exceeding 0.25% of the class’s average daily net assets. Shareholder servicing, prospectus, and shareholder report expenses incurred by each class are charged directly to the class to which they relate. Expenses common to both classes and investment income are allocated to the classes based upon the relative daily net assets of each class’s settled shares; realized and unrealized gains and losses are allocated based upon the relative daily net assets of each class’s outstanding shares.
Credits The fund earns credits on temporarily uninvested cash balances held at the custodian, which reduce the fund’s custody charges. Custody expense in the accompanying financial statements is presented before reduction for credits.
Redemption Fees A 2% fee is assessed on redemptions of fund shares held for 90 days to deter short-term trading and to protect the interests of long-term shareholders. Redemption fees are withheld from proceeds that shareholders receive from the sale or exchange of fund shares. The fees are paid to the fund and are recorded as an increase to paid-in capital. The fees may cause the redemption price per share to differ from the net asset value per share.
New Accounting Pronouncements In May 2011, the Financial Accounting Standards Board (FASB) issued amended guidance to align fair value measurement and disclosure requirements in U.S. GAAP with International Financial Reporting Standards. The guidance is effective for fiscal years and interim periods beginning on or after December 15, 2011. Adoption had no effect on net assets or results of operations.
In December 2011, the FASB issued amended guidance to enhance disclosure for offsetting assets and liabilities. The guidance is effective for fiscal years and interim periods beginning on or after January 1, 2013. Adoption will have no effect on the fund’s net assets or results of operations.
NOTE 2 - VALUATION
The fund’s financial instruments are reported at fair value as defined by GAAP. The fund determines the values of its assets and liabilities and computes each class’s net asset value per share at the close of the New York Stock Exchange (NYSE), normally 4 p.m. ET, each day that the NYSE is open for business.
Valuation Methods Debt securities are generally traded in the over-the-counter (OTC) market. Securities with remaining maturities of one year or more at the time of acquisition are valued at prices furnished by dealers who make markets in such securities or by an independent pricing service, which considers the yield or price of bonds of comparable quality, coupon, maturity, and type, as well as prices quoted by dealers who make markets in such securities. Securities with remaining maturities of less than one year at the time of acquisition generally use amortized cost in local currency to approximate fair value. However, if amortized cost is deemed not to reflect fair value or the fund holds a significant amount of such securities with remaining maturities of more than 60 days, the securities are valued at prices furnished by dealers who make markets in such securities or by an independent pricing service.
Equity securities listed or regularly traded on a securities exchange or in the OTC market are valued at the last quoted sale price or, for certain markets, the official closing price at the time the valuations are made, except for OTC Bulletin Board securities, which are valued at the mean of the latest bid and asked prices. A security that is listed or traded on more than one exchange is valued at the quotation on the exchange determined to be the primary market for such security. Listed securities not traded on a particular day are valued at the mean of the latest bid and asked prices for domestic securities and the last quoted sale price for international securities.
Other investments, including restricted securities and private placements, and those financial instruments for which the above valuation procedures are inappropriate or are deemed not to reflect fair value, are stated at fair value as determined in good faith by the T. Rowe Price Valuation Committee, established by the fund’s Board of Directors (the Board). Subject to oversight by the Board, the Valuation Committee develops pricing-related policies and procedures and approves all fair-value determinations. The Valuation Committee regularly makes good faith judgments, using a wide variety of sources and information, to establish and adjust valuations of certain securities as events occur and circumstances warrant. For instance, in determining the fair value of private-equity instruments, the Valuation Committee considers a variety of factors, including the company’s business prospects, its financial performance, strategic events impacting the company, relevant valuations of similar companies, new rounds of financing, and any negotiated transactions of significant size between other investors in the company. Because any fair-value determination involves a significant amount of judgment, there is a degree of subjectivity inherent in such pricing decisions.
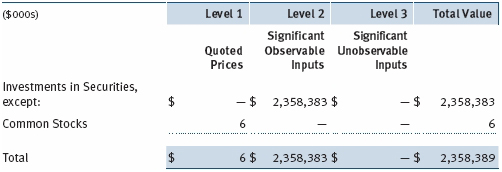
Valuation Inputs Various inputs are used to determine the value of the fund’s financial instruments. These inputs are summarized in the three broad levels listed below:
Level 1 – quoted prices in active markets for identical financial instruments
Level 2 – observable inputs other than Level 1 quoted prices (including, but not limited to, quoted prices for similar financial instruments, interest rates, prepayment speeds, and credit risk)
Level 3 – unobservable inputs
Observable inputs are those based on market data obtained from sources independent of the fund, and unobservable inputs reflect the fund’s own assumptions based on the best information available. The input levels are not necessarily an indication of the risk or liquidity associated with financial instruments at that level. The following table summarizes the fund’s financial instruments, based on the inputs used to determine their values on August 31, 2012:
NOTE 3 - DERIVATIVE INSTRUMENTS
During the six months ended August 31, 2012, the fund invested in derivative instruments. As defined by GAAP, a derivative is a financial instrument whose value is derived from an underlying security price, foreign exchange rate, interest rate, index of prices or rates, or other variable; it requires little or no initial investment and permits or requires net settlement. The fund invests in derivatives only if the expected risks and rewards are consistent with its investment objectives, policies, and overall risk profile, as described in its prospectus and Statement of Additional Information. The fund may use derivatives for a variety of purposes, such as seeking to hedge against declines in principal value, increase yield, invest in an asset with greater efficiency and at a lower cost than is possible through direct investment, or to adjust portfolio duration and credit exposure. The risks associated with the use of derivatives are different from, and potentially much greater than, the risks associated with investing directly in the instruments on which the derivatives are based. Investments in derivatives can magnify returns positively or negatively; however, the fund at all times maintains sufficient cash reserves, liquid assets, or other SEC-permitted asset types to cover the settlement obligations under its open derivative contracts.
The fund values its derivatives at fair value, as described below and in Note 2, and recognizes changes in fair value currently in its results of operations. Accordingly, the fund does not follow hedge accounting, even for derivatives employed as economic hedges. The fund does not offset the fair value of derivative instruments against the right to reclaim or obligation to return collateral. As of August 31, 2012, the fund held no derivative instruments.
Additionally, during the six months ended August 31, 2012, the fund recognized $59,000 of gain on interest rate derivatives, included in realized gain (loss) on Futures on the accompanying Statement of Operations.
Futures Contracts The fund is subject to interest rate risk in the normal course of pursuing its investment objectives and uses futures contracts to help manage such risk. The fund may enter into futures contracts to manage exposure to interest rate and yield curve movements, security prices, foreign currencies, credit quality, and mortgage prepayments; as an efficient means of adjusting exposure to all or part of a target market; to enhance income; as a cash management tool; and/or to adjust portfolio duration and credit exposure. A futures contract provides for the future sale by one party and purchase by another of a specified amount of a particular underlying financial instrument at an agreed-upon price, date, time, and place. The fund currently invests only in exchange-traded futures, which generally are standardized as to maturity date, underlying financial instrument, and other contract terms. Upon entering into a futures contract, the fund is required to deposit collateral with the broker in the form of cash or securities in an amount equal to a certain percentage of the contract value (margin requirement); the margin requirement must then be maintained at the established level over the life of the contract. Subsequent payments are made or received by the fund each day to settle daily fluctuations in the value of the contract (variation margin), which reflect changes in the value of the underlying financial instrument. Variation margin is recorded as unrealized gain or loss until the contract is closed. The value of a futures contract included in net assets is the amount of unsettled variation margin; net variation margin receivable is reflected as an asset, and net variation margin payable is reflected as a liability on the accompanying Statement of Assets and Liabilities. Risks related to the use of futures contracts include possible illiquidity of the futures markets, contract prices that can be highly volatile and imperfectly correlated to movements in hedged security values and/or interest rates, and potential losses in excess of the fund’s initial investment. During the six months ended August 31, 2012, the fund’s exposure to futures, based on underlying notional amounts, was generally less than 1% of net assets.
NOTE 4 - OTHER INVESTMENT TRANSACTIONS
Consistent with its investment objective, the fund engages in the following practices to manage exposure to certain risks and/or to enhance performance. The investment objective, policies, program, and risk factors of the fund are described more fully in the fund’s prospectus and Statement of Additional Information.
Noninvestment-Grade Debt Securities At August 31, 2012, approximately 36% of the fund’s net assets were invested, either directly or through its investment in T. Rowe Price institutional funds, in noninvestment-grade debt securities, commonly referred to as “high yield” or “junk” bonds. The noninvestment-grade bond market may experience sudden and sharp price swings due to a variety of factors, including changes in economic forecasts, stock market activity, large sustained sales by major investors, a high-profile default, or a change in the market’s psychology. These events may decrease the ability of issuers to make principal and interest payments and adversely affect the liquidity or value, or both, of such securities.
Restricted Securities The fund may invest in securities that are subject to legal or contractual restrictions on resale. Prompt sale of such securities at an acceptable price may be difficult and may involve substantial delays and additional costs.
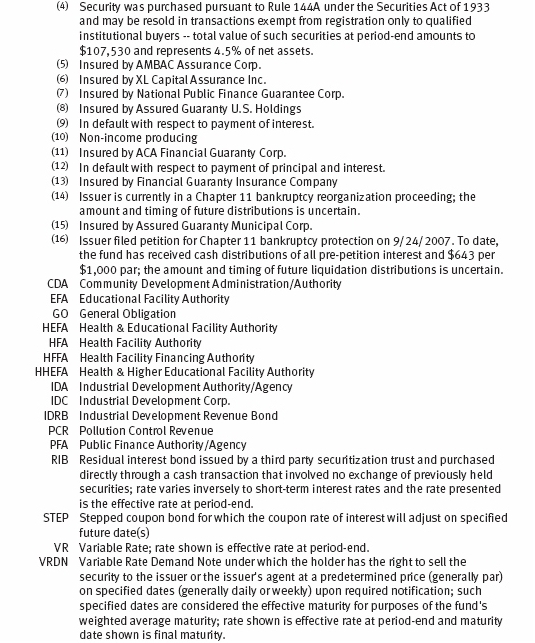
Residual-Interest Bonds During the six months ended August 31, 2012, the fund held residual-interest bonds (RIBs) purchased from third-party special purpose trusts, which securitize an underlying bond into RIBs and short-term floating rate bonds. RIBs generally are entitled to the cash flows of the underlying bond that remain after payment of amounts due to the floating rate bondholders and trust-related fees; they also generally have the right to acquire the underlying bond from the trust. RIBs can only be traded in accordance with Rule 144A of the Securities Act of 1933 and cannot be offered for public resale. Risks arise from changes in interest rates and the value of the underlying bond, and the sale of the RIBs may involve delay or additional costs.
Counterparty Risk and Collateral Counterparty risk related to exchange-traded futures and options contracts is minimal because the exchange’s clearinghouse provides protection against counterparty defaults. Generally, for exchange-traded derivatives such as futures and options, each broker, in its sole discretion, may change margin requirements applicable to the fund. Cash posted by the fund to meet margin requirements is reflected as restricted cash in the accompanying financial statements and securities posted by the fund are so noted in the accompanying Portfolio of Investments; both remain in the fund��s assets. As of August 31, 2012, no margin had been posted by the fund to the broker for exchange-traded derivatives.
Other Purchases and sales of portfolio securities other than short-term securities aggregated $433,491,000 and $51,788,000, respectively, for the six months ended August 31, 2012.
NOTE 5 - FEDERAL INCOME TAXES
No provision for federal income taxes is required since the fund intends to continue to qualify as a regulated investment company under Subchapter M of the Internal Revenue Code and distribute to shareholders all of its income and gains. Distributions determined in accordance with federal income tax regulations may differ in amount or character from net investment income and realized gains for financial reporting purposes. Financial reporting records are adjusted for permanent book/tax differences to reflect tax character but are not adjusted for temporary differences. The amount and character of tax-basis distributions and composition of net assets are finalized at fiscal year-end; accordingly, tax-basis balances have not been determined as of the date of this report.
The fund intends to retain realized gains to the extent of available capital loss carryforwards. As a result of the Regulated Investment Company Modernization Act of 2010, net capital losses realized on or after March 1, 2011 (effective date) may be carried forward indefinitely to offset future realized capital gains; however, post-effective losses must be used before pre-effective capital loss carryforwards with expiration dates. Accordingly, it is possible that all or a portion of the fund’s pre-effective capital loss carryforwards could expire unused. As of February 29, 2012, the fund had $30,372,000 of available capital loss carryforwards, which expire as follows: $60,000 in fiscal 2014, $6,657,000 in fiscal 2017, $12,492,000 in fiscal 2018, and $3,652,000 in fiscal 2019; $7,511,000 have no expiration.
At August 31, 2012, the cost of investments for federal income tax purposes was $2,236,196,000. Net unrealized gain aggregated $122,193,000 at period-end, of which $184,974,000 related to appreciated investments and $62,781 related to depreciated investments.
NOTE 6 - RELATED PARTY TRANSACTIONS
The fund is managed by T. Rowe Price Associates, Inc. (Price Associates), a wholly owned subsidiary of T. Rowe Price Group, Inc. (Price Group). The investment management agreement between the fund and Price Associates provides for an annual investment management fee, which is computed daily and paid monthly. The fee consists of an individual fund fee, equal to 0.30% of the fund’s average daily net assets, and a group fee. The group fee rate is calculated based on the combined net assets of certain mutual funds sponsored by Price Associates (the group) applied to a graduated fee schedule, with rates ranging from 0.48% for the first $1 billion of assets to 0.28% for assets in excess of $300 billion. The fund’s group fee is determined by applying the group fee rate to the fund’s average daily net assets. At August 31, 2012, the effective annual group fee rate was 0.30%.
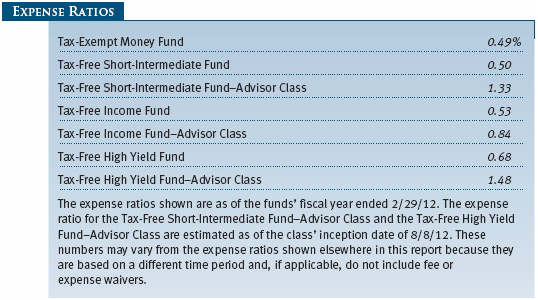
The Advisor Class is also subject to a contractual expense limitation through February 28, 2015. During the limitation period, Price Associates is required to waive its management fee and/or reimburse expenses, excluding interest, taxes, brokerage commissions, and extraordinary expenses that would otherwise cause the class’s ratio of annualized total expenses to average net assets (expense ratio) to exceed its expense limitation of 1.05%. For a period of three years after the date of any reimbursement or waiver, each class is required to repay Price Associates for expenses previously reimbursed and management fees waived to the extent the class’s net assets have grown or expenses have declined sufficiently to allow repayment without causing the class’s expense ratio to exceed its expense limitation.
In addition, the fund has entered into service agreements with Price Associates and a wholly owned subsidiary of Price Associates (collectively, Price). Price Associates computes the daily share prices and provides certain other administrative services to the fund. T. Rowe Price Services, Inc., provides shareholder and administrative services in its capacity as the fund’s transfer and dividend disbursing agent. For the six months ended August 31, 2012, expenses incurred pursuant to these service agreements were $77,000 for Price Associates and $196,000 for T. Rowe Price Services, Inc. The total amount payable at period-end pursuant to these service agreements is reflected as Due to Affiliates in the accompanying financial statements.
| Information on Proxy Voting Policies, Procedures, and Records |
A description of the policies and procedures used by T. Rowe Price funds and portfolios to determine how to vote proxies relating to portfolio securities is available in each fund’s Statement of Additional Information, which you may request by calling 1-800-225-5132 or by accessing the SEC’s website, sec.gov. The description of our proxy voting policies and procedures is also available on our website, troweprice.com. To access it, click on the words “Our Company” at the top of our corporate homepage. Then, when the next page appears, click on the words “Proxy Voting Policies” on the left side of the page.
Each fund’s most recent annual proxy voting record is available on our website and through the SEC’s website. To access it through our website, follow the directions above, then click on the words “Proxy Voting Records” on the right side of the Proxy Voting Policies page.
| How to Obtain Quarterly Portfolio Holdings |
The fund files a complete schedule of portfolio holdings with the Securities and Exchange Commission for the first and third quarters of each fiscal year on Form N-Q. The fund’s Form N-Q is available electronically on the SEC’s website (sec.gov); hard copies may be reviewed and copied at the SEC’s Public Reference Room, 100 F St. N.E., Washington, DC 20549. For more information on the Public Reference Room, call 1-800-SEC-0330.
| Approval of Investment Management Agreement |
On March 6, 2012, the fund’s Board of Directors (Board), including a majority of the fund’s independent directors, approved the continuation of the investment management agreement (Advisory Contract) between the fund and its investment advisor, T. Rowe Price Associates, Inc. (Advisor). In connection with its deliberations, the Board requested, and the Advisor provided, such information as the Board (with advice from independent legal counsel) deemed reasonably necessary. The Board considered a variety of factors in connection with its review of the Advisory Contract, also taking into account information provided by the Advisor during the course of the year, as discussed below:
Services Provided by the Advisor
The Board considered the nature, quality, and extent of the services provided to the fund by the Advisor. These services included, but were not limited to, directing the fund’s investments in accordance with its investment program and the overall management of the fund’s portfolio, as well as a variety of related activities such as financial, investment operations, and administrative services; compliance; maintaining the fund’s records and registrations; and shareholder communications. The Board also reviewed the background and experience of the Advisor’s senior management team and investment personnel involved in the management of the fund, as well as the Advisor’s compliance record. The Board concluded that it was satisfied with the nature, quality, and extent of the services provided by the Advisor.
Investment Performance of the Fund
The Board reviewed the fund’s average annual total returns over the three-month and 1-, 3-, 5-, and 10-year periods, as well as the fund’s year-by-year returns, and compared these returns with a wide variety of previously agreed upon comparable performance measures and market data, including those supplied by Lipper and Morningstar, which are independent providers of mutual fund data.
On the basis of this evaluation and the Board’s ongoing review of investment results, and factoring in the relative market conditions during certain of the performance periods, the Board concluded that the fund’s performance was satisfactory.
Costs, Benefits, Profits, and Economies of Scale
The Board reviewed detailed information regarding the revenues received by the Advisor under the Advisory Contract and other benefits that the Advisor (and its affiliates) may have realized from its relationship with the fund, including any research received under “soft dollar” agreements and commission-sharing arrangements with broker-dealers. The Board considered that the Advisor may receive some benefit from soft-dollar arrangements pursuant to which research is received from broker-dealers that execute the applicable fund’s portfolio transactions. The Board received information on the estimated costs incurred and profits realized by the Advisor from managing T. Rowe Price mutual funds. The Board also reviewed estimates of the profits realized from managing the fund in particular, and the Board concluded that the Advisor’s profits were reasonable in light of the services provided to the fund.
The Board also considered whether the fund benefits under the fee levels set forth in the Advisory Contract from any economies of scale realized by the Advisor. Under the Advisory Contract, the fund pays a fee to the Advisor for investment management services composed of two components—a group fee rate based on the combined average net assets of most of the T. Rowe Price mutual funds (including the fund) that declines at certain asset levels and an individual fund fee rate based on the fund’s average daily net assets—and the fund pays its own expenses of operations. The Board concluded that the advisory fee structure for the fund continued to provide for a reasonable sharing of benefits from any economies of scale with the fund’s investors.
Fees
The Board was provided with information regarding industry trends in management fees and expenses, and the Board reviewed the fund’s management fee rate, operating expenses, and total expense ratio in comparison with fees and expenses of other comparable funds based on information and data supplied by Lipper. (The Board did not compare the fees and expenses for the fund’s Advisor Class shares because they did not begin operations until August 8, 2012.) The information provided to the Board indicated that the fund’s management fee rate was above the median for certain groups of comparable funds and at the median for other groups of comparable funds. The information also indicated that the fund’s total expense ratio was at or below the median for comparable funds.
The Board also reviewed the fee schedules for institutional accounts and private accounts with similar mandates that are advised or subadvised by the Advisor and its affiliates. Management provided the Board with information about the Advisor’s responsibilities and services provided to institutional account clients, including information about how the requirements and economics of the institutional business are fundamentally different from those of the mutual fund business. The Board considered information showing that the mutual fund business is generally more complex from a business and compliance perspective than the institutional business and that the Advisor generally performs significant additional services and assumes greater risk in managing the fund and other T. Rowe Price mutual funds than it does for institutional account clients.
On the basis of the information provided and the factors considered, the Board concluded that the fees paid by the fund under the Advisory Contract are reasonable.
Approval of the Advisory Contract
As noted, the Board approved the continuation of the Advisory Contract. No single factor was considered in isolation or to be determinative to the decision. Rather, the Board concluded, in light of a weighting and balancing of all factors considered, that it was in the best interests of the fund and its shareholders for the Board to approve the continuation of the Advisory Contract (including the fees to be charged for services thereunder). The independent directors were advised throughout the process by independent legal counsel.
Item 2. Code of Ethics.
A code of ethics, as defined in Item 2 of Form N-CSR, applicable to its principal executive officer, principal financial officer, principal accounting officer or controller, or persons performing similar functions is filed as an exhibit to the registrant’s annual Form N-CSR. No substantive amendments were approved or waivers were granted to this code of ethics during the registrant’s most recent fiscal half-year.
Item 3. Audit Committee Financial Expert.
Disclosure required in registrant’s annual Form N-CSR.
Item 4. Principal Accountant Fees and Services.
Disclosure required in registrant’s annual Form N-CSR.
Item 5. Audit Committee of Listed Registrants.
Not applicable.
Item 6. Investments.
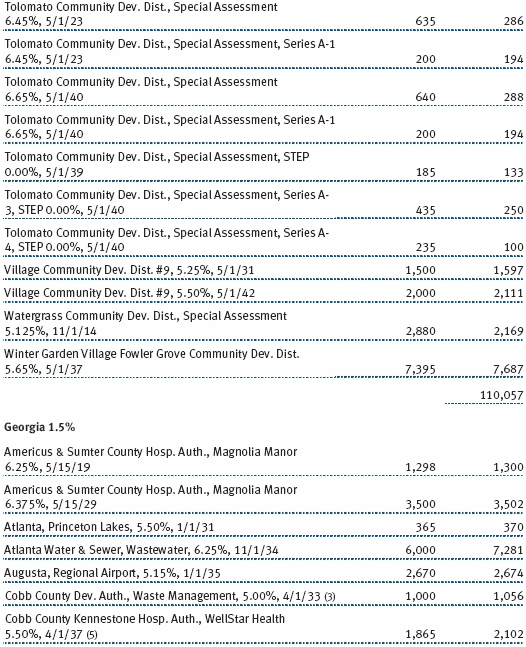
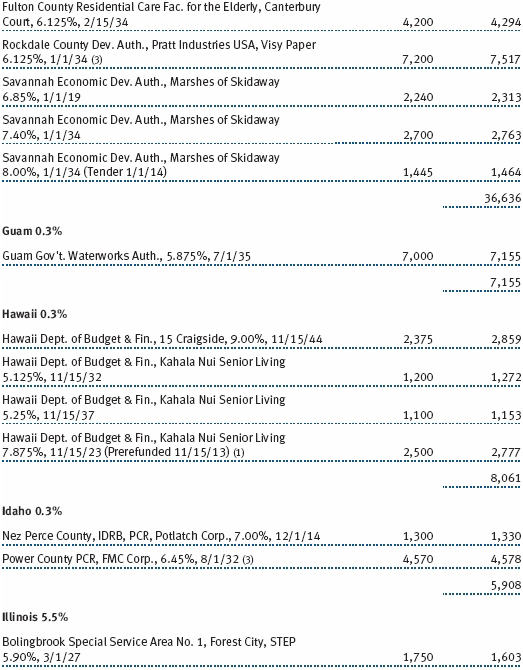
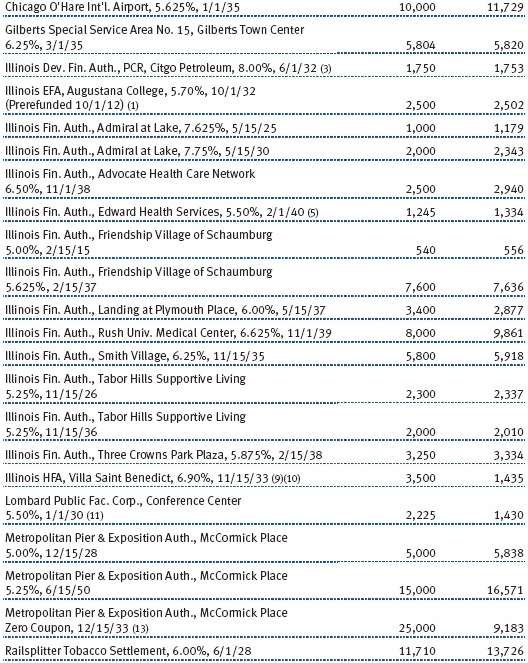
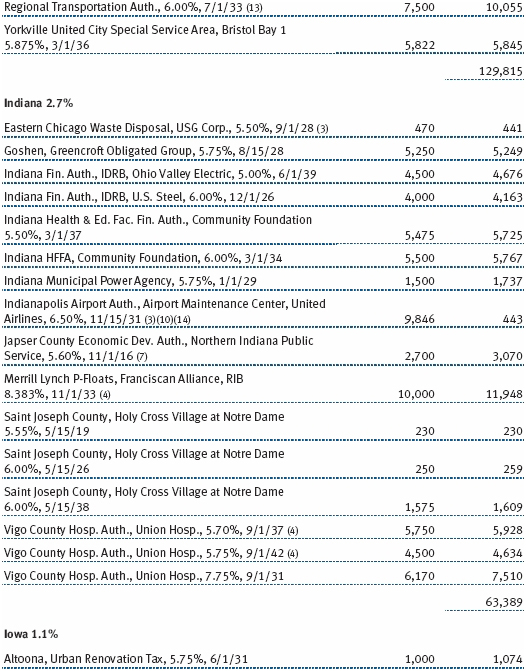
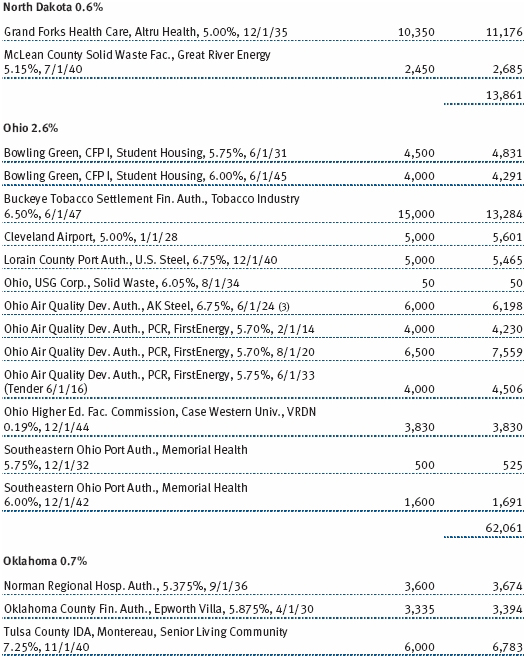
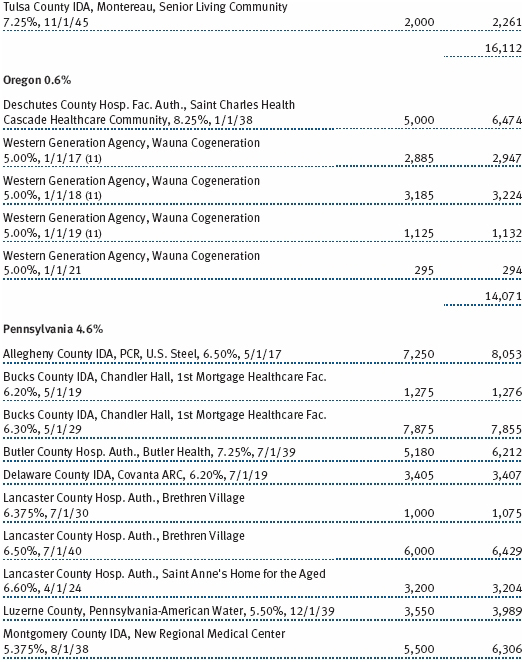
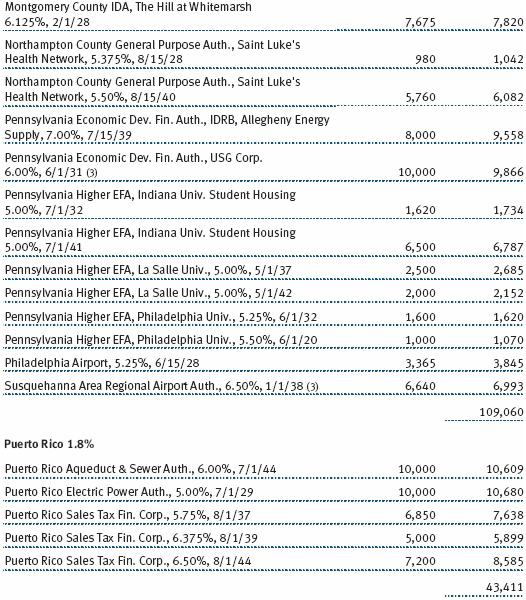
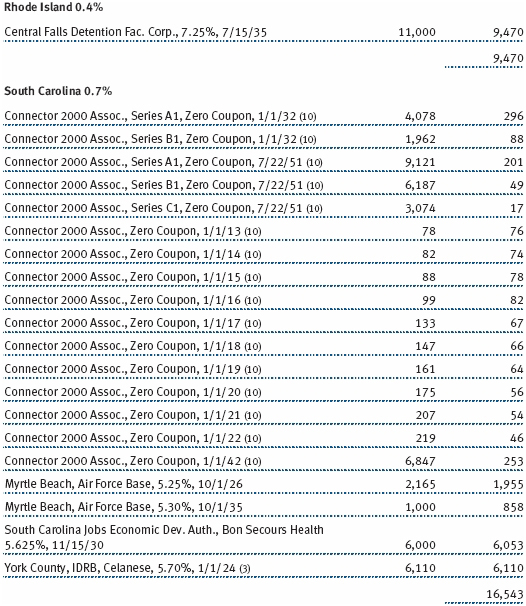
(a) Not applicable. The complete schedule of investments is included in Item 1 of this Form N-CSR.
(b) Not applicable.
Item 7. Disclosure of Proxy Voting Policies and Procedures for Closed-End Management Investment Companies.
Not applicable.
Item 8. Portfolio Managers of Closed-End Management Investment Companies.
Not applicable.
Item 9. Purchases of Equity Securities by Closed-End Management Investment Company and Affiliated Purchasers.
Not applicable.
Item 10. Submission of Matters to a Vote of Security Holders.
Not applicable.
Item 11. Controls and Procedures.
(a) The registrant’s principal executive officer and principal financial officer have evaluated the registrant’s disclosure controls and procedures within 90 days of this filing and have concluded that the registrant’s disclosure controls and procedures were effective, as of that date, in ensuring that information required to be disclosed by the registrant in this Form N-CSR was recorded, processed, summarized, and reported timely.
(b) The registrant’s principal executive officer and principal financial officer are aware of no change in the registrant’s internal control over financial reporting that occurred during the registrant’s second fiscal quarter covered by this report that has materially affected, or is reasonably likely to materially affect, the registrant’s internal control over financial reporting.
Item 12. Exhibits.
(a)(1) The registrant’s code of ethics pursuant to Item 2 of Form N-CSR is filed with the registrant’s annual Form N-CSR.
(2) Separate certifications by the registrant's principal executive officer and principal financial officer, pursuant to Section 302 of the Sarbanes-Oxley Act of 2002 and required by Rule 30a-2(a) under the Investment Company Act of 1940, are attached.
(3) Written solicitation to repurchase securities issued by closed-end companies: not applicable.
(b) A certification by the registrant's principal executive officer and principal financial officer, pursuant to Section 906 of the Sarbanes-Oxley Act of 2002 and required by Rule 30a-2(b) under the Investment Company Act of 1940, is attached.
SIGNATURES
Pursuant to the requirements of the Securities Exchange Act of 1934 and the Investment Company Act of 1940, the registrant has duly caused this report to be signed on its behalf by the undersigned, thereunto duly authorized.
T. Rowe Price Tax-Free High Yield Fund, Inc.
| | By | /s/ Edward C. Bernard |
| | Edward C. Bernard |
| | Principal Executive Officer |
| |
| Date October 16, 2012 | | |
Pursuant to the requirements of the Securities Exchange Act of 1934 and the Investment Company Act of 1940, this report has been signed below by the following persons on behalf of the registrant and in the capacities and on the dates indicated.
| | By | /s/ Edward C. Bernard |
| | Edward C. Bernard |
| | Principal Executive Officer |
| |
| Date October 16, 2012 | | |
| |
| |
| By | /s/ Gregory K. Hinkle |
| | Gregory K. Hinkle |
| | Principal Financial Officer |
| |
| Date October 16, 2012 | | |