UNITED STATES
SECURITIES AND EXCHANGE COMMISSION
Washington, D.C. 20549
FORM N-CSR
CERTIFIED SHAREHOLDER REPORT OF REGISTERED
MANAGEMENT INVESTMENT COMPANIES
Investment Company Act File Number: 811-04163
| T. Rowe Price Tax-Free High Yield Fund, Inc. |
|
| (Exact name of registrant as specified in charter) |
| |
| 100 East Pratt Street, Baltimore, MD 21202 |
|
| (Address of principal executive offices) |
| |
| David Oestreicher |
| 100 East Pratt Street, Baltimore, MD 21202 |
|
| (Name and address of agent for service) |
Registrant’s telephone number, including area code: (410) 345-2000
Date of fiscal year end: February 28
Date of reporting period: August 31, 2013
Item 1. Report to Shareholders
| Tax-Free High Yield Fund | August 31, 2013 |
The views and opinions in this report were current as of August 31, 2013. They are not guarantees of performance or investment results and should not be taken as investment advice. Investment decisions reflect a variety of factors, and the managers reserve the right to change their views about individual stocks, sectors, and the markets at any time. As a result, the views expressed should not be relied upon as a forecast of the fund’s future investment intent. The report is certified under the Sarbanes-Oxley Act, which requires mutual funds and other public companies to affirm that, to the best of their knowledge, the information in their financial reports is fairly and accurately stated in all material respects.
REPORTS ON THE WEB
Sign up for our E-mail Program, and you can begin to receive updated fund reports and prospectuses online rather than through the mail. Log in to your account at troweprice.com for more information.
Manager’s Letter
Fellow Shareholders
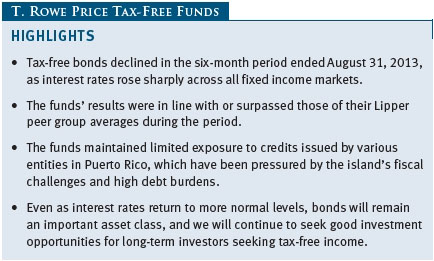
Tax-free municipal bond prices declined in the six-month period ended August 31, 2013, as interest rates rose across all fixed income markets. Intermediate- and long-term municipal and Treasury bond prices fell as Federal Reserve officials clarified their intention to moderate the Fed’s asset purchases later this year—if the economy evolves in line with the central bank’s projections. Shorter-term securities held up somewhat better but still struggled as cash flowed out of the municipal bond market. Lower-quality municipals fared worse than higher-quality issues in both the investment-grade and high yield markets. Although their absolute returns were disappointing, the T. Rowe Price Tax-Free Funds performed in line with or better than their peers in the first half of our fiscal year. The funds’ longer-term relative performance records remained favorable.
MARKET ENVIRONMENT
The U.S. economy grew at a moderate 2.5% pace in the second quarter of 2013, overcoming the headwinds stemming from the higher tax rates and federal spending reductions that took effect in the first quarter. The housing recovery continues, inflation has been low amid a pullback in commodity prices, and employment growth has been moderate. However, the national unemployment rate—measured at 7.3% in August—remains elevated. We believe economic growth in the months ahead will remain moderate.
To support the recovery, the Federal Reserve has kept short-term interest rates very low and has been buying $45 billion in Treasuries and $40 billion in agency mortgage-backed securities every month to suppress longer-term rates. After our reporting period ended, the central bank announced that it would keep the program in place a while longer.
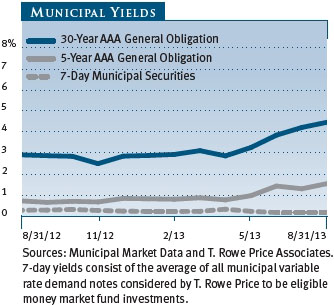
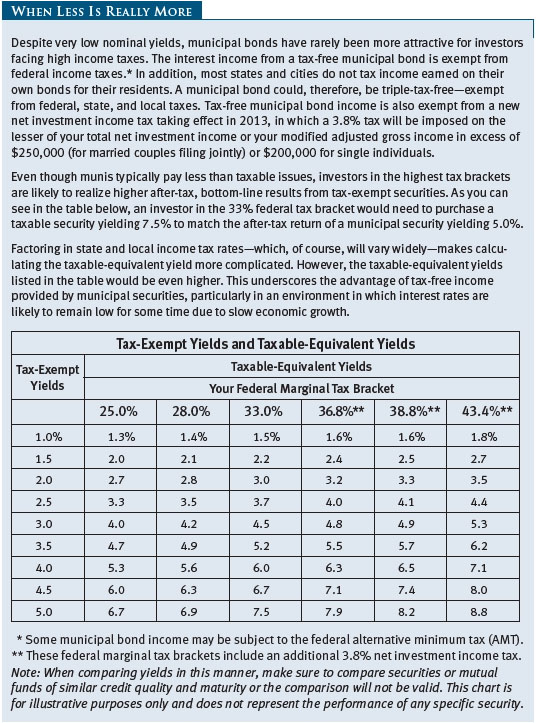
Bond yields rose across both the Treasury and high-quality municipal yield curves in anticipation of reduced stimulus from the Fed, but long-term municipal yields rose more than long-term Treasury yields, which is unusual. In fact, the municipal yield curve is historically steep: High-quality 30-year municipal yields are at least 400 basis points (four percentage points) greater than high-quality munis maturing in two years or less. On a relative basis, this has increased the attractiveness of long-term tax-free bonds as an alternative for fixed income investors. As of August 31, the 4.45% yield offered by a 30-year tax-free bond rated AAA was about 120% of the 3.70% pretax yield offered by a 30-year Treasury bond. An investor in the 28% federal tax bracket would need to invest in a taxable bond yielding about 6.18% to receive the same after-tax income. (To calculate a municipal bond’s taxable-equivalent yield, divide the municipal bond’s yield by the quantity of 1.00 minus your federal tax bracket expressed as a decimal—in this case, 1.00 – 0.28, or 0.72.)
MUNICIPAL MARKET NEWS
Year-to-date municipal issuance totaled about $228 billion, according to The Bond Buyer. Issuance had been picking up in early 2013, but the sharp increase in bond yields since late April reduced new issuance moderately. Formerly brisk demand for municipal securities evaporated in the last few months as rising rates, bond losses, and credit concerns in certain parts of the muni market prompted investors to lock in gains after more than two years of solid performance. While austerity-minded state and local government leaders remain conservative about adding to indebtedness—which we consider to be supportive and will likely keep 2013 issuance below last year’s level—additional cash flows out of municipal bond portfolios could continue to weigh on the market.
Since the 2007–2009 recession, most states have acted responsibly by cutting spending and raising taxes and fees to close budget deficits. While state tax revenues are growing again, the pattern has been slower and more uneven than historically, and expense pressures continue. We believe that many states deserve high credit ratings and that state governments will be able to continue servicing their outstanding debts. However, we have longer-term concerns about some states’ willingness and ability to address sizable pension obligations and other retirement benefits.
In mid-July, Detroit filed for Chapter 9 bankruptcy protection in federal court, but we do not believe that this is evidence of a systemic breakdown in municipal credit fundamentals. On the other hand, the deteriorating fiscal situation in the Commonwealth of Puerto Rico, as highlighted in the media, could pose greater risk to the broader muni market. Puerto Rico’s liabilities are large relative to the size of Puerto Rico’s economy, with close to $50 billion of municipal debt outstanding and more than $70 billion of general indebtedness for the territory and its various government agencies. While we are significantly underweight in exposure to Puerto Rico debt—holding only sales tax-backed and public power bonds and no general obligations (GOs) or appropriations-backed debt—we are following the situation closely.
Municipal bond performance in the last six months reflected a sharp increase in interest rates and a reduction in market liquidity amid broad selling. In terms of sectors, GOs held up slightly better than revenue bonds. We prefer bonds backed by a dedicated revenue stream over GOs, with a bias toward transportation and utility bonds issued by these essential service providers. Among revenue bonds, special tax and industrial revenue were two of the weakest sectors. Health care-related issues also fared poorly, and we are becoming increasingly selective among hospital revenue bonds, as new issue supply and some credit concerns are weighing on the sector. Housing revenue bonds were helped by the residential real estate recovery but still declined moderately.
PORTFOLIO STRATEGY
TAX-EXEMPT MONEY FUND
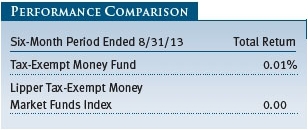
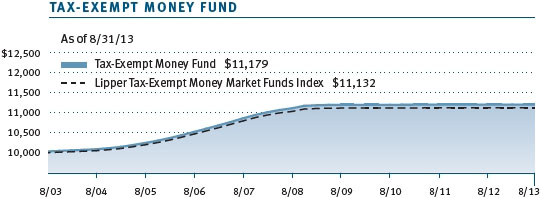
The fund returned 0.01% during the six-month period ended August 31, 2013, compared with 0.00% for the Lipper Tax-Exempt Money Market Funds Index. Over the last six months, yields in all sectors of the money market have continued their slow drift lower, pulled inexorably toward the federal funds rate, which currently averages under 0.10%. Supply in most sectors of the money market is down, helping, in part, to explain ever-decreasing yields. In taxable markets, corporations are awash with cash and banks have plenty of deposits—reducing their need to access the money markets. Municipal issuers, like their taxable counterparts, have until recently found financing in the longer-term bond market more attractive due to the overall low level of rates. At the same time, assets in money funds remain fairly stable.
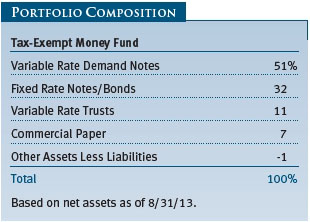
All money market sector yields declined. For example, three-month Treasury bill yields tightened 10 basis points (100 basis points equal one percentage point) during the past six months to end at 0.02%. In the municipal money market, rates range from around five basis points for overnight maturities to around 19 basis points for notes maturing in one year. For the period, the municipal money market yield curve steepened a few basis points as yields on maturities of less than 90 days moved lower while yields on one-year maturities were relatively unchanged. The decline on the front end is due in part to continued crossover buying from taxable money market funds, which find the structure and yield of municipal variable rate demand notes attractive. Although yields in the long-term municipal market have risen significantly, the one-year space has remained firmly anchored.
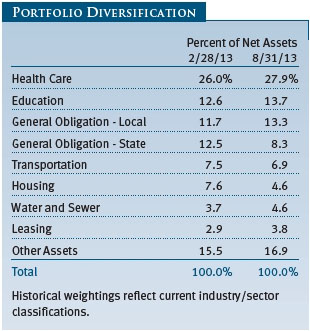
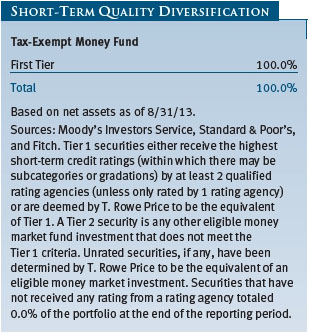
As always, our investment selection focuses on the highest credit quality. Thus, we favor and maintain an overweight to highly rated hospitals, higher education, and local and state GOs. Some issuers in these sectors include Adventist Health System, Cornell University, Washington State, and Baltimore County. Bank liquidity providers always play a big part in the financing of short-term municipal debt. The banking sector’s health has improved considerably over the past five years, and regulatory requirements have helped strengthen the banks’ credit profiles. Still, the supply of bank liquidity in the municipal money market remains limited. Our largest bank liquidity exposures continue to be JPMorgan Chase, Wells Fargo, U.S. Bancorp and the Federal Home Loan Bank. (Please refer to the fund’s portfolio of investments for a complete list of holdings and the amount each represents in the portfolio.)
In June 2013, the Securities and Exchange Commission (SEC) proposed further changes to the regulations governing money market funds. Comments on these proposals were accepted by the SEC until September 17, 2013. We do not expect new regulations to become final until late 2014, and we anticipate the SEC will grant a substantial amount of time for advisors to implement any changes.
While the longer-term market will continue to react to the prospects for Fed tapering, the money markets will remain anchored by the fed funds target rate, which we don’t expect to change until sometime in 2015. Therefore, we expect yields to remain range-bound for the foreseeable future. Given this outlook, we continue to operate in the longer range of our targeted weighted average maturity of 50 to 55 days. As always, we are committed to managing a high-quality, diversified portfolio, with a focus on liquidity and stability of principal.
TAX-FREE SHORT-INTERMEDIATE FUND
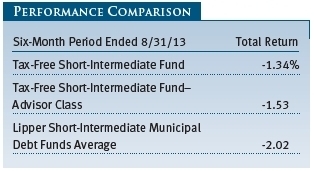
The fund returned -1.34% during the six-month period ended August 31, 2013, outperforming the -2.02% return for the Lipper Short-Intermediate Municipal Debt Funds Average, which measures the performance of competing funds. (Performance is also shown in the table for the Advisor Class, which has a different fee structure.) The fund’s net asset value per share was $5.60 at the end of August, down from $5.72 six months earlier. Dividends per share contributed $0.04 to the fund’s total return during the six-month period.
During the past six months, yields on five-year high-quality municipal bonds increased about 75 basis points, causing prices to decline, and the average yield on the portfolio rose roughly 50 basis points, or one-half of one percentage point. Our investment strategy was unchanged; we managed the portfolio’s duration close to that of the benchmark and focused on sectors of the market that offered some incremental yield, which allowed us to outperform during the period. Our aversion to the more volatile sectors of the market, such as tobacco bonds, aided our relative returns as tobacco bonds underperformed in the most recent period.
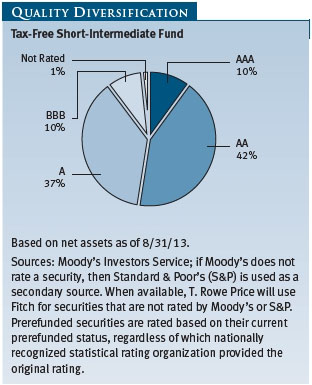
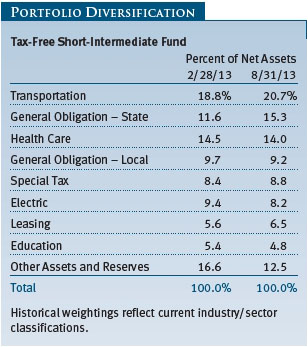
For most of the period, yield spreads continued to tighten among shorter- and intermediate-term securities, and, therefore, we found it more challenging to find bonds offering attractive yields. As a result, we increased our investment in higher-quality state GOs. While transportation bonds remained the fund’s major allocation at 20.7% of net assets, our allotment of state GOs increased by four percentage points to 15.3% of the portfolio. Exposure to health care was steady at 14.0%.
One GO we are negative on is Puerto Rico. Puerto Rico’s fiscal issues have recently occupied the headlines and have led to wider spreads and underperformance of Puerto Rico bonds. At the beginning of the reporting period, we held only two lines of Puerto Rico Electric Power Authority bonds amounting to $8 million in par value, a small fraction of the overall portfolio. We sold those bonds in early March and thus eliminated all exposure to the island’s debt prior to a significant yield widening at the end of the period.
At the end of the period, overall credit spreads had widened to a point where we believe they provide some opportunities to move out of our GOs into more appealing segments of the revenue bond sectors. Shorter- and intermediate-term yields have not risen as much as longer-term yields, anchored as they are by the Fed’s zero rate fed funds policy. The central bank has stated that it intends to keep short-term rates extremely low for a while to come. However, there is a risk that the market will begin to anticipate a change in the Fed’s outlook, pushing short-term rates higher sooner than expected. We do believe, however, that slow economic growth and benign inflation will keep the Fed from moving too precipitously.
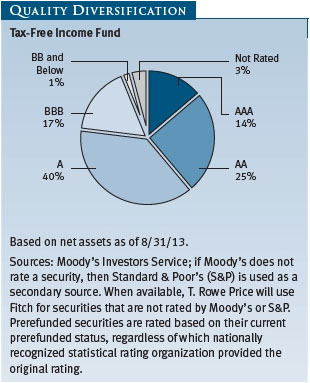
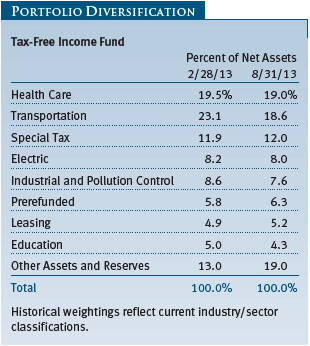
TAX-FREE INCOME FUND
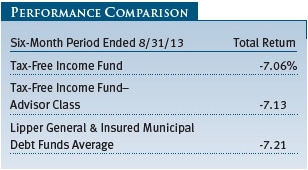
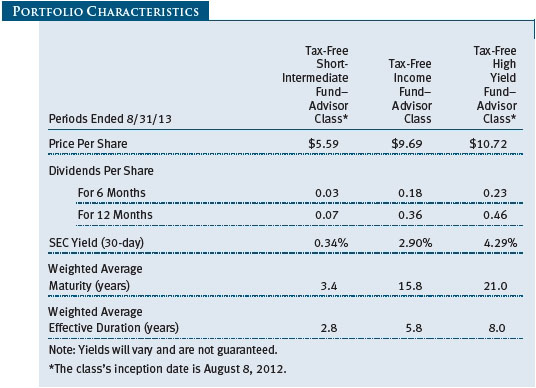
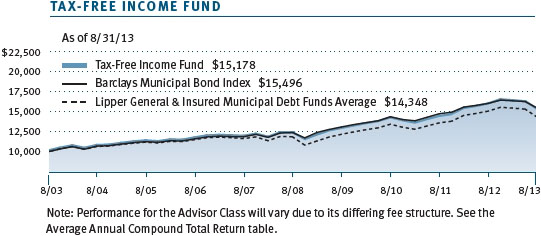
The fund returned -7.06% during the six-month period ended August 31, 2013, compared with -7.21% for the Lipper peer group average, which measures the performance of competing funds. (Results for the Advisor Class were somewhat lower, reflecting its different fee structure.) The fund’s net asset value per share was $9.68 at the end of August, down from $10.62 six months earlier. Dividends per share contributed $0.20 to the fund’s total return during the six-month period.
Our positioning along the yield curve has been fairly consistent as we overweighted long-term and underweighted shorter maturities. We have been overweight in maturities 20 years and longer and underweight securities with maturities in the 3- to 10-year range for the past year or more. This trimmed the fund’s performance, as longer-term bond prices declined most as rates rose. While we remain overweight in long bonds, we have substantially decreased the portfolio’s exposure in light of the current interest rate environment. Our duration risk, however, was somewhat mitigated by our holdings in defensively structured bonds, namely callable premium coupon structures, that offered some cushion against higher interest rates.
As rates rose, our duration inched higher from 5.2 to 5.8 years, but we managed the fund to avoid an even greater increase. The fund’s weighted average maturity fell by a full two years to 15.8 years since our last report as we sold bonds with longer maturities. Based on fundamental credit research, the fund continues to be overweight revenue bonds and underweight both state and local GOs relative to the benchmark. Our outlook assumes persistent fiscal challenges for many state and local governments, particularly those heavily burdened with long-term pension liabilities.
We made minimal shifts in the fund’s sector allocations. Health care and transportation remain the fund’s two largest sectors and the largest overweights relative to the Barclays Municipal Bond Index. Our exposure to transportation, however, declined as we sold credits with long maturities. Our health care holdings underperformed as most positions held in this sector have longer maturities. Lower credit quality holdings also fared poorly as credit spreads widened, resulting in greater price declines relative to higher-quality securities. Six months ago, the opposite was true. It is worth noting that tobacco bonds backed by the Master Settlement Agreement performed poorly relative to the general market, and we have been significantly underweight in the sector because of our longer-term credit concerns.
Bonds issued by various entities for the Commonwealth of Puerto Rico, which are triple-tax-exempt in all 50 states, drastically declined in valuation as concerns mounted about the island’s long-running fiscal challenges and high debt burdens. We have been decreasing our Puerto Rico holdings over the past two years, and our direct exposure is roughly 0.5% of assets, a significant underweight versus the benchmark and some of our peers, which benefited performance during the reporting period. In addition, we made some shifts in the fund’s quality diversification; AAA holdings doubled to 14% by the end of the period, mostly due to elevated cash levels.
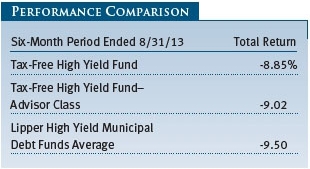
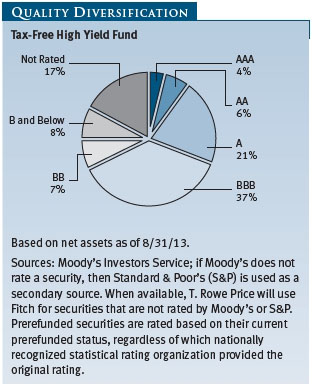
TAX-FREE HIGH YIELD FUND
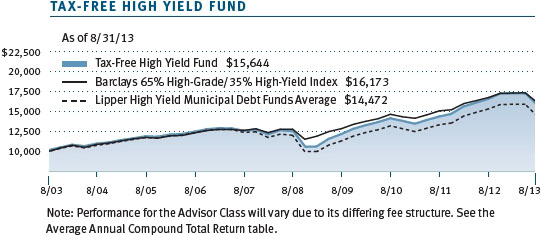
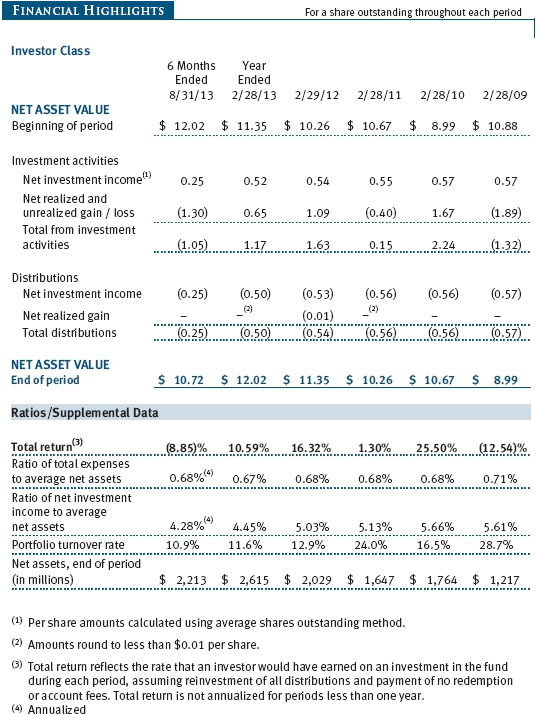
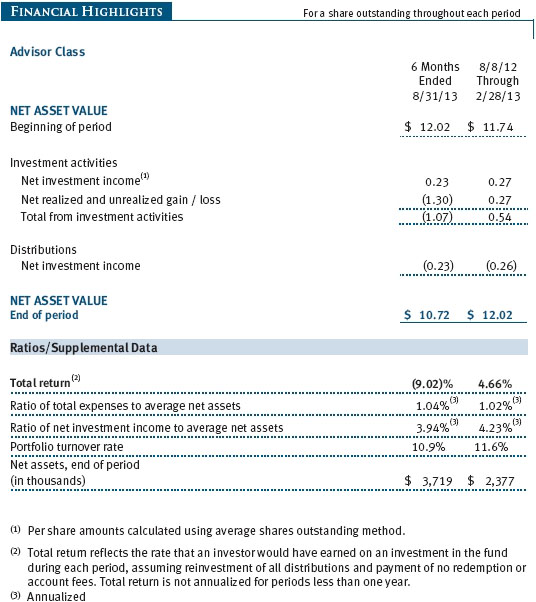
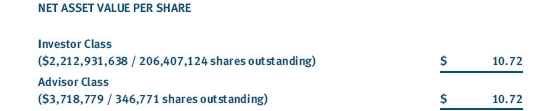
The Tax-Free High Yield Fund returned -8.85% for the six-month period ended August 31, 2013, outperforming the -9.50% posted by our Lipper peer group. (The result for the Advisor Class, which has a different fee structure, is also shown in the table.) The fund’s net asset value per share was $10.72 at the end of August, off from $12.02 at the end of February, and dividends per share contributed $0.25 to the fund’s total return during the past six months.
In a challenging six-month environment, investor demand for municipal bonds reversed sharply as expectations for the Fed’s tapering of its quantitative easing program drove interest rates up significantly. Our sector strategy, our security selection, and our low exposure to troubled sectors aided our relative returns.
Our conservative weighting in tobacco securitization bonds contributed significantly to good relative returns. Prices for these asset-backed securities were hit hard during the period, as a decline in consumption exceeded original projections. Negative investor sentiment and consistent selling pressure drove the yield spreads for tobacco bonds wider. The fund also benefited from our low exposure to Puerto Rico-domiciled borrowers. The commonwealth has repeatedly disappointed municipal investors on the fiscal management front, and market participants are now demanding significant yield premiums to hold those credits. Our minimal exposure reflects our credit research informing us of the commonwealth’s increasing long-term credit risks stemming from protracted economic weakness, chronic budget deficits, mounting debts, and underfunded pension plans.
We maintained our considerable holdings in corporate-backed industrial development/pollution control revenue bonds. Following the financial crisis of 2008, fundamentals in the corporate bond market improved markedly and remain solid today. Additionally, yields for many corporate issuers in the tax-exempt market currently meet or exceed those in the corporate bond market. These stretched relationships typically represent great value for taxable investors. One of our largest holdings, Marathon Oil, was upgraded during the period.
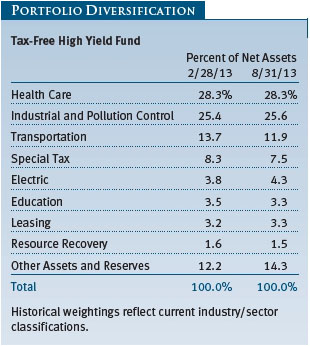
We continue to hold significant stakes in the health care sector, specifically in hospital revenue bonds and retirement communities. These borrowers provide essential services to their constituents and healthy yield premiums to investors. In recent years, hospital management teams have increased operating efficiency and bolstered balance sheets in preparation for changes in reimbursement from the federal government. We believe our holdings are well positioned to respond to uncertainties arising from new health care policies.
Our exposure to the toll road sector detracted from performance over the past six months. Many of these projects issued debt at extremely low interest rates last spring. As interest rates rose sharply in the summer months, investors actively shed many of these investments to reinvest at higher yields available in the marketplace. From a longer-term perspective, we continue to like the credit metrics of this sector and have selectively added to our holdings amid the sell-off.
While recent market activity has been tumultuous, we believe that higher interest rates are ultimately healthy for patient, long-term municipal investors. Moreover, the upward adjustment in risk premiums offers investors in medium- and lower-quality securities greater compensation for taking credit risk, another positive development. We believe that heightened investor sensitivity to credit risk favors our focused, research-driven approach. We will continue to rely on this proven process to uncover strong fundamental investment opportunities in the municipal market.
OUTLOOK
The decline in municipal bond prices has rattled some investors, but it does not represent a fundamental change in the nature, quality, or risk characteristics of the market. We continue to believe that it is a high-quality market, offering good investment opportunities for those with a long-term focus seeking attractive tax-free income—particularly for those in the highest tax brackets—in what is still a very low interest rate environment. The recent underperformance of long-term munis makes their nominal and taxable-equivalent yields even more attractive, as noted earlier, but if rates continue rising unabated and market outflows persist, further price declines are likely.
We have been concerned about the potential for rising rates for some time. Our interest rate strategy and economics teams regularly make forward-looking projections of rates and yield curves, and these assessments are incorporated in our investment strategies. Given the potential for rates to rise further, we will remain careful with any investment shift that might materially increase our portfolios’ interest rate sensitivity. However, we believe further rate increases will be more modest than those we have seen in the last few months.
Irrespective of interest rate movements, the credit and economic environment for municipalities is likely to remain challenging. Modest economic growth and improving income and sales tax revenues are providing some support for state and local governments. However, cutbacks in state support for municipalities and persistent downward pressure on property tax revenues could keep local municipal issuers vulnerable. If the economy weakens, municipalities would face even tougher challenges.
State and local government liabilities, such as pension benefits and health care costs, are a growing long-term concern. While most municipal governments are maintaining balanced budgets, fewer municipalities have addressed these longer-term liabilities meaningfully. States will need to continue these efforts on their own, as a federal bailout of state and local governments without some losses to bondholders seems unlikely. As for Detroit, we will be monitoring the bankruptcy proceedings closely because there is the potential for adverse legal precedents to arise out of the case.
We believe T. Rowe Price’s strong credit research capabilities have been and will remain an asset for our investors. Even as interest rates return to more normal levels, bonds will remain an important asset class, and we will continue to search for good investment opportunities for long-term, income-seeking investors. We continue to conduct thorough research and assign our own independent credit ratings before making investment decisions. As always, we are on the lookout for attractively valued bonds issued by municipalities with good long-term fundamentals—an investment strategy that we believe will continue to serve our long-term investors well.
Thank you for investing with T. Rowe Price.
Respectfully submitted,

Joseph K. Lynagh
Chairman of the Investment Advisory Committee
Tax-Exempt Money Fund

Charles B. Hill
Chairman of the Investment Advisory Committee
Tax-Free Short-Intermediate Fund

Konstantine B. Mallas
Chairman of the Investment Advisory Committee
Tax-Free Income Fund

James M. Murphy
Chairman of the Investment Advisory Committee
Tax-Free High Yield Fund
September 18, 2013
The committee chairmen have day-to-day responsibility for managing the portfolios and work with committee members in developing and executing the funds’ investment programs.
RISKS OF FIXED INCOME INVESTING
Since money market funds are managed to maintain a constant $1.00 share price, there should be little risk of principal loss. However, there is no assurance the fund will avoid principal losses if fund holdings default or are downgraded or if interest rates rise sharply in an unusually short period. In addition, the fund’s yield will vary; it is not fixed for a specific period like the yield on a bank certificate of deposit. An investment in the fund is not insured or guaranteed by the Federal Deposit Insurance Corporation (FDIC) or any other government agency. Although a money market fund seeks to preserve the value of your investment at $1.00 per share, it is possible to lose money by investing in it.
Bonds are subject to interest rate risk (the decline in bond prices that usually accompanies a rise in interest rates) and credit risk (the chance that any fund holding could have its credit rating downgraded or that a bond issuer will default by failing to make timely payments of interest or principal), potentially reducing the fund’s income level and share price. High yield bonds could have greater price declines than funds that invest primarily in high-quality bonds. Municipalities issuing high yield bonds are not as strong financially as those with higher credit ratings, so the bonds are usually considered speculative investments. Some income may be subject to state and local taxes and the federal alternative minimum tax.
GLOSSARY
Barclays 1–5 Year Blend (1–6 Year Maturity) Index: A subindex of the Barclays Municipal Bond Index. It is a rules-based, market value-weighted index of short-term bonds engineered for the tax-exempt bond market.
Barclays 65% High-Grade/35% High-Yield Index: An index that tracks Barclays indexes of both investment-grade and below investment-grade municipal debt instruments.
Barclays Municipal Bond Index: An unmanaged index that tracks municipal debt instruments.
Basis point: One one-hundredth of one percentage point, or 0.01%.
Duration: A measure of a bond fund’s sensitivity to changes in interest rates. For example, a fund with a duration of five years would fall about 5% in price in response to a one-percentage-point rise in interest rates, and vice versa.
Escrowed-to-maturity bond: A bond that has the funds necessary for repayment at maturity, or a call date, set aside in a separate or “escrow” account.
Federal funds rate: The interest rate charged on overnight loans of reserves by one financial institution to another in the United States. The Federal Reserve sets a target federal funds rate to affect the direction of interest rates.
General obligation debt: A government’s strongest pledge that obligates its full faith and credit, including, if necessary, its ability to raise taxes.
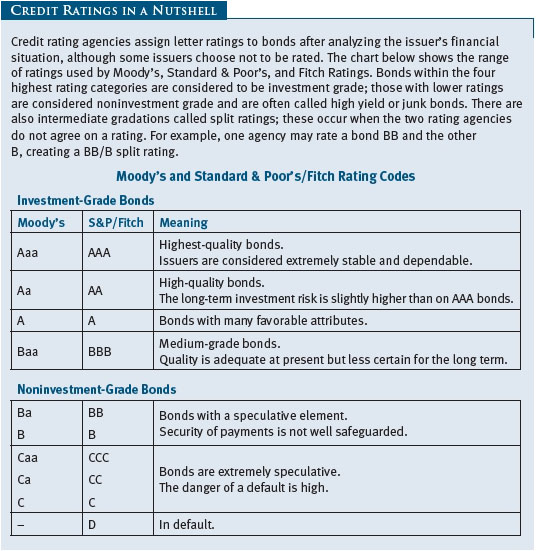
Investment grade: High-quality bonds as measured by one of the major credit rating agencies. For example, Standard & Poor’s designates the bonds in its top four categories (AAA to BBB) as investment grade.
LIBOR: The London Interbank Offered Rate, which is a benchmark for short-term taxable rates.
Lipper averages: The averages of available mutual fund performance returns for specified time periods in categories defined by Lipper Inc.
Lipper indexes: Fund benchmarks that consist of a small number (10 to 30) of the largest mutual funds in a particular category as tracked by Lipper Inc.
Prerefunded bond: A bond that originally may have been issued as a general obligation or revenue bond but that is now secured by an escrow fund consisting entirely of direct U.S. government obligations that are sufficient for paying the bondholders.
SEC yield (7-day simple): A method of calculating a money fund’s yield by annualizing the fund’s net investment income for the last seven days of each period divided by the fund’s net asset value at the end of the period. Yield will vary and is not guaranteed.
SEC yield (30-day): A method of calculating a fund’s yield that assumes all portfolio securities are held until maturity. Yield will vary and is not guaranteed.
Weighted average life: A measure of a fund’s credit quality risk. In general, the longer the average life, the greater the fund’s credit quality risk. The average life is the dollar-weighted average maturity of a portfolio’s individual securities without taking into account interest rate readjustment dates. Money funds must maintain a weighted average life of less than 120 days.
Weighted average maturity: A measure of a fund’s interest rate sensitivity. In general, the longer the average maturity, the greater the fund’s sensitivity to interest rate changes. The weighted average maturity may take into account the interest rate readjustment dates for certain securities. Money funds must maintain a weighted average maturity of less than 60 days.
Yield curve: A graphic depiction of the relationship between yields and maturity dates for a set of similar securities, such as Treasuries or municipal securities. Securities with longer maturities usually a have higher yield. If short-term securities offer a higher yield, then the curve is said to be “inverted.” If short- and long-term bonds are offering equivalent yields, then the curve is said to be “flat.”

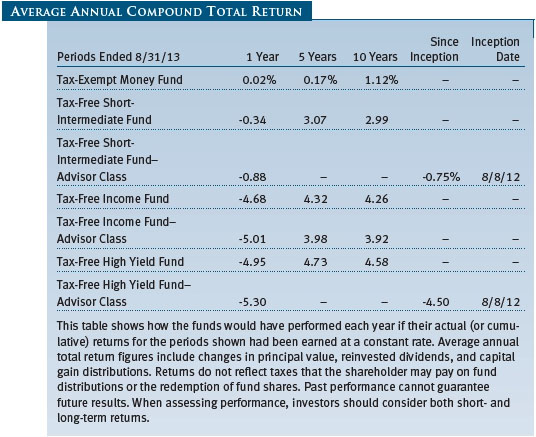
Performance and Expenses
This chart shows the value of a hypothetical $10,000 investment in the fund over the past 10 fiscal year periods or since inception (for funds lacking 10-year records). The result is compared with benchmarks, which may include a broad-based market index and a peer group average or index. Market indexes do not include expenses, which are deducted from fund returns as well as mutual fund averages and indexes.

This chart shows the value of a hypothetical $10,000 investment in the fund over the past 10 fiscal year periods or since inception (for funds lacking 10-year records). The result is compared with benchmarks, which may include a broad-based market index and a peer group average or index. Market indexes do not include expenses, which are deducted from fund returns as well as mutual fund averages and indexes.
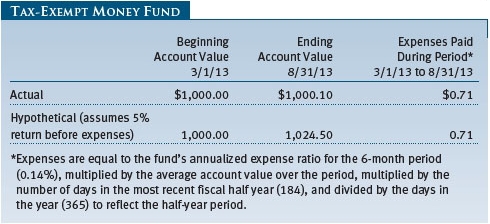
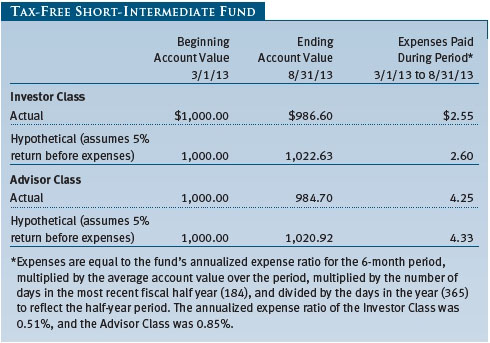
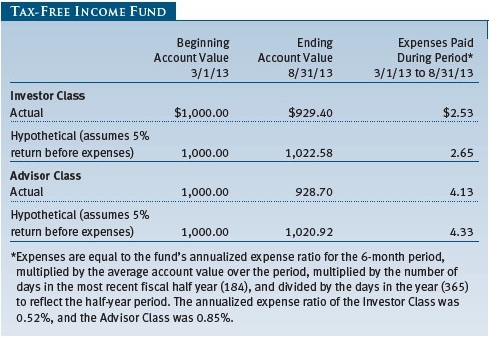
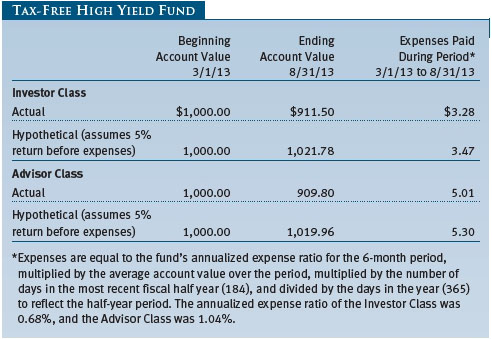
As a mutual fund shareholder, you may incur two types of costs: (1) transaction costs, such as redemption fees or sales loads, and (2) ongoing costs, including management fees, distribution and service (12b-1) fees, and other fund expenses. The following example is intended to help you understand your ongoing costs (in dollars) of investing in the fund and to compare these costs with the ongoing costs of investing in other mutual funds. The example is based on an investment of $1,000 invested at the beginning of the most recent six-month period and held for the entire period.
Actual Expenses
The first line of the following table (Actual) provides information about actual account values and actual expenses. You may use the information on this line, together with your account balance, to estimate the expenses that you paid over the period. Simply divide your account value by $1,000 (for example, an $8,600 account value divided by $1,000 = 8.6), then multiply the result by the number on the first line under the heading “Expenses Paid During Period” to estimate the expenses you paid on your account during this period.
Please note that the Tax-Free Short-Intermediate Fund, Tax-Free Income Fund, and Tax-Free High Yield Fund have two share classes: The original share class (Investor Class) charges no distribution and service (12b-1) fee, and the Advisor Class shares are offered only through unaffiliated brokers and other financial intermediaries and charge a 0.25% 12b-1 fee. Each share class is presented separately in the table.
Hypothetical Example for Comparison Purposes
The information on the second line of the table (Hypothetical) is based on hypothetical account values and expenses derived from the fund’s actual expense ratio and an assumed 5% per year rate of return before expenses (not the fund’s actual return). You may compare the ongoing costs of investing in the fund with other funds by contrasting this 5% hypothetical example and the 5% hypothetical examples that appear in the shareholder reports of the other funds. The hypothetical account values and expenses may not be used to estimate the actual ending account balance or expenses you paid for the period.
Note: T. Rowe Price charges an annual account service fee of $20, generally for accounts with less than $10,000. The fee is waived for any investor whose T. Rowe Price mutual fund accounts total $50,000 or more; accounts electing to receive electronic delivery of account statements, transaction confirmations, prospectuses, and shareholder reports; or accounts of an investor who is a T. Rowe Price Preferred Services, Personal Services, or Enhanced Personal Services client (enrollment in these programs generally requires T. Rowe Price assets of at least $100,000). This fee is not included in the accompanying table. If you are subject to the fee, keep it in mind when you are estimating the ongoing expenses of investing in the fund and when comparing the expenses of this fund with other funds.
You should also be aware that the expenses shown in the table highlight only your ongoing costs and do not reflect any transaction costs, such as redemption fees or sales loads. Therefore, the second line of the table is useful in comparing ongoing costs only and will not help you determine the relative total costs of owning different funds. To the extent a fund charges transaction costs, however, the total cost of owning that fund is higher.
Unaudited
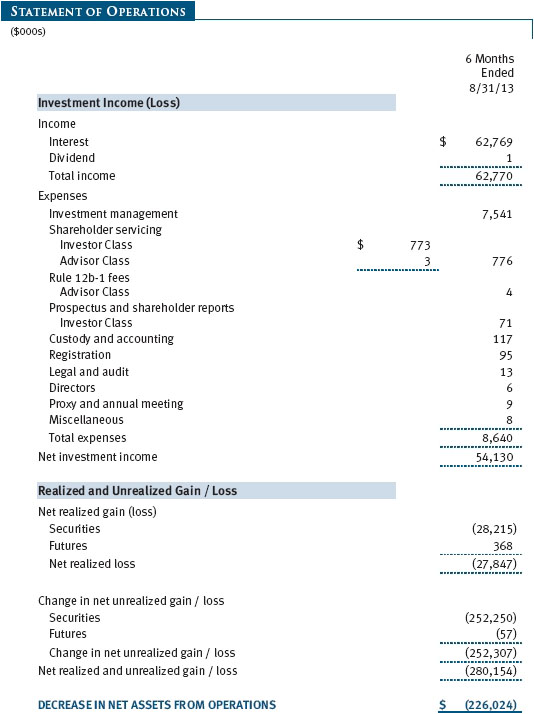
The accompanying notes are an integral part of these financial statements.
Unaudited
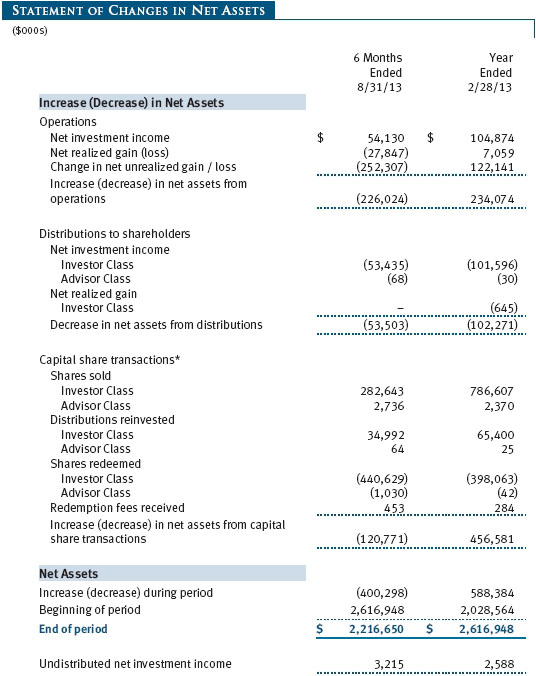
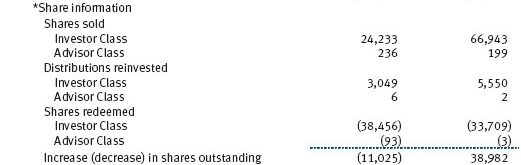
The accompanying notes are an integral part of these financial statements.
Unaudited

The accompanying notes are an integral part of these financial statements.
Unaudited
The accompanying notes are an integral part of these financial statements.
Unaudited
The accompanying notes are an integral part of these financial statements.
Unaudited
The accompanying notes are an integral part of these financial statements.
Unaudited
| Notes to Financial Statements |
T. Rowe Price Tax-Free High Yield Fund, Inc. (the fund), is registered under the Investment Company Act of 1940 (the 1940 Act) as a diversified, open-end management investment company. The fund seeks to provide a high level of income exempt from federal income taxes by investing primarily in long-term low- to upper-medium-grade municipal securities. The fund has two classes of shares: the Tax-Free High Yield Fund original share class, referred to in this report as the Investor Class, offered since March 1, 1985, and the Tax-Free High Yield Fund–Advisor Class (Advisor Class), offered since August 8, 2012. Advisor Class shares are sold only through unaffiliated brokers and other unaffiliated financial intermediaries that are compensated by the class for distribution, shareholder servicing, and/or certain administrative services under a Board-approved Rule 12b-1 plan. Each class has exclusive voting rights on matters related solely to that class; separate voting rights on matters that relate to both classes; and, in all other respects, the same rights and obligations as the other class.
NOTE 1 - SIGNIFICANT ACCOUNTING POLICIES
Basis of Preparation The accompanying financial statements were prepared in accordance with accounting principles generally accepted in the United States of America (GAAP), which require the use of estimates made by management. Management believes that estimates and valuations are appropriate; however, actual results may differ from those estimates, and the valuations reflected in the accompanying financial statements may differ from the value ultimately realized upon sale or maturity.
Investment Transactions, Investment Income, and Distributions Income and expenses are recorded on the accrual basis. Premiums and discounts on debt securities are amortized for financial reporting purposes. Dividend income is recorded on the ex-dividend date. Income tax-related interest and penalties, if incurred, would be recorded as income tax expense. Investment transactions are accounted for on the trade date. Realized gains and losses are reported on the identified cost basis. Distributions to shareholders are recorded on the ex-dividend date. Income distributions are declared by each class daily and paid monthly. Capital gain distributions, if any, are generally declared and paid by the fund annually.
Class Accounting The Advisor Class pays distribution, shareholder servicing, and/or certain administrative expenses in the form of Rule 12b-1 fees, in an amount not exceeding 0.25% of the class’s average daily net assets. Shareholder servicing, prospectus, and shareholder report expenses incurred by each class are charged directly to the class to which they relate. Expenses common to both classes and investment income are allocated to the classes based upon the relative daily net assets of each class’s settled shares; realized and unrealized gains and losses are allocated based upon the relative daily net assets of each class’s outstanding shares.
Credits The fund earns credits on temporarily uninvested cash balances held at the custodian, which reduce the fund’s custody charges. Custody expense in the accompanying financial statements is presented before reduction for credits.
Redemption Fees A 2% fee is assessed on redemptions of fund shares held for 90 days or less to deter short-term trading and to protect the interests of long-term shareholders. Redemption fees are withheld from proceeds that shareholders receive from the sale or exchange of fund shares. The fees are paid to the fund and are recorded as an increase to paid-in capital. The fees may cause the redemption price per share to differ from the net asset value per share.
New Accounting Guidance On March 1, 2013, the fund adopted new accounting guidance, issued by the Financial Accounting Standards Board, that requires an entity to disclose information about offsetting and related arrangements to enable users of its financial statements to understand the effect of those arrangements on its financial position. Adoption had no effect on the fund’s net assets or results of operations.
NOTE 2 - VALUATION
The fund’s financial instruments are valued and each class’s net asset value (NAV) per share is computed at the close of the New York Stock Exchange (NYSE), normally 4 p.m. ET, each day the NYSE is open for business.
Fair Value The fund’s financial instruments are reported at fair value, which GAAP defines as the price that would be received to sell an asset or paid to transfer a liability in an orderly transaction between market participants at the measurement date. The T. Rowe Price Valuation Committee (the Valuation Committee) has been established by the fund’s Board of Directors (the Board) to ensure that financial instruments are appropriately priced at fair value in accordance with GAAP and the 1940 Act. Subject to oversight by the Board, the Valuation Committee develops and oversees pricing-related policies and procedures and approves all fair value determinations. Specifically, the Valuation Committee establishes procedures to value securities; determines pricing techniques, sources, and persons eligible to effect fair value pricing actions; oversees the selection, services, and performance of pricing vendors; oversees valuation-related business continuity practices; and provides guidance on internal controls and valuation-related matters. The Valuation Committee reports to the fund’s Board; is chaired by the fund’s treasurer; and has representation from legal, portfolio management and trading, operations, and risk management.
Various valuation techniques and inputs are used to determine the fair value of financial instruments. GAAP establishes the following fair value hierarchy that categorizes the inputs used to measure fair value:
Level 1 – quoted prices (unadjusted) in active markets for identical financial instruments that the fund can access at the reporting date
Level 2 – inputs other than Level 1 quoted prices that are observable, either directly or indirectly (including, but not limited to, quoted prices for similar financial instruments in active markets, quoted prices for identical or similar financial instruments in inactive markets, interest rates and yield curves, implied volatilities, and credit spreads)
Level 3 – unobservable inputs
Observable inputs are developed using market data, such as publicly available information about actual events or transactions, and reflect the assumptions that market participants would use to price the financial instrument. Unobservable inputs are those for which market data are not available and are developed using the best information available about the assumptions that market participants would use to price the financial instrument. GAAP requires valuation techniques to maximize the use of relevant observable inputs and minimize the use of unobservable inputs. When multiple inputs are used to derive fair value, the financial instrument is assigned to the level within the fair value hierarchy based on the lowest-level input that is significant to the fair value of the financial instrument. Input levels are not necessarily an indication of the risk or liquidity associated with financial instruments at that level but rather the degree of judgment used in determining those values.
Valuation Techniques Debt securities generally are traded in the over-the-counter (OTC) market. Securities with remaining maturities of one year or more at the time of acquisition are valued at prices furnished by dealers who make markets in such securities or by an independent pricing service, which considers the yield or price of bonds of comparable quality, coupon, maturity, and type, as well as prices quoted by dealers who make markets in such securities. Securities with remaining maturities of less than one year at the time of acquisition generally use amortized cost in local currency to approximate fair value. However, if amortized cost is deemed not to reflect fair value or the fund holds a significant amount of such securities with remaining maturities of more than 60 days, the securities are valued at prices furnished by dealers who make markets in such securities or by an independent pricing service. Generally, debt securities are categorized in Level 2 of the fair value hierarchy; however, to the extent the valuations include significant unobservable inputs, the securities would be categorized in Level 3.
Equity securities listed or regularly traded on a securities exchange or in the over-the-counter (OTC) market are valued at the last quoted sale price or, for certain markets, the official closing price at the time the valuations are made. OTC Bulletin Board securities are valued at the mean of the closing bid and asked prices. A security that is listed or traded on more than one exchange is valued at the quotation on the exchange determined to be the primary market for such security. Listed securities not traded on a particular day are valued at the mean of the closing bid and asked prices. Actively traded domestic equity securities generally are categorized in Level 1 of the fair value hierarchy. OTC Bulletin Board securities and equity securities traded in inactive markets generally are categorized in Level 2 of the fair value hierarchy.
Financial futures contracts are valued at closing settlement prices and are categorized in Level 1 of the fair value hierarchy. Assets and liabilities other than financial instruments, including short-term receivables and payables, are carried at cost, or estimated realizable value, if less, which approximates fair value.
Thinly traded financial instruments and those for which the above valuation procedures are inappropriate or are deemed not to reflect fair value are stated at fair value as determined in good faith by the Valuation Committee. The objective of any fair value pricing determination is to arrive at a price that could reasonably be expected from a current sale. Financial instruments fair valued by the Valuation Committee are primarily private placements, restricted securities, warrants, rights, and other securities that are not publicly traded.
Subject to oversight by the Board, the Valuation Committee regularly makes good faith judgments to establish and adjust the fair valuations of certain securities as events occur and circumstances warrant. For instance, in determining the fair value of troubled or thinly traded debt instruments, the Valuation Committee considers a variety of factors, which may include, but are not limited to, the issuer’s business prospects, its financial standing and performance, recent investment transactions in the issuer, strategic events affecting the company, market liquidity for the issuer, and general economic conditions and events. In consultation with the investment and pricing teams, the Valuation Committee will determine an appropriate valuation technique based on available information, which may include both observable and unobservable inputs. The Valuation Committee typically will afford greatest weight to actual prices in arm’s length transactions, to the extent they represent orderly transactions between market participants; transaction information can be reliably obtained; and prices are deemed representative of fair value. However, the Valuation Committee may also consider other valuation methods such as a discount or premium from market value of a similar, freely traded security of the same issuer; discounted cash flows; yield to maturity; or some combination. Fair value determinations are reviewed on a regular basis and updated as information becomes available, including actual purchase and sale transactions of the issue. Because any fair value determination involves a significant amount of judgment, there is a degree of subjectivity inherent in such pricing decisions and fair value prices determined by the Valuation Committee could differ from those of other market participants. Depending on the relative significance of unobservable inputs, including the valuation technique(s) used, fair valued securities may be categorized in Level 2 or 3 of the fair value hierarchy.
Valuation Inputs The following table summarizes the fund’s financial instruments, based on the inputs used to determine their fair values on August 31, 2013:
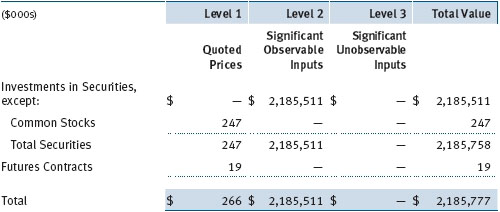
There were no material transfers between Levels 1 and 2 during the period.
NOTE 3 - DERIVATIVE INSTRUMENTS
During the six months ended August 31, 2013, the fund invested in derivative instruments. As defined by GAAP, a derivative is a financial instrument whose value is derived from an underlying security price, foreign exchange rate, interest rate, index of prices or rates, or other variable; it requires little or no initial investment and permits or requires net settlement. The fund invests in derivatives only if the expected risks and rewards are consistent with its investment objectives, policies, and overall risk profile, as described in its prospectus and Statement of Additional Information. The fund may use derivatives for a variety of purposes, such as seeking to hedge against declines in principal value, increase yield, invest in an asset with greater efficiency and at a lower cost than is possible through direct investment, or to adjust portfolio duration and credit exposure. The risks associated with the use of derivatives are different from, and potentially much greater than, the risks associated with investing directly in the instruments on which the derivatives are based. The fund at all times maintains sufficient cash reserves, liquid assets, or other SEC-permitted asset types to cover its settlement obligations under open derivative contracts.
The fund values its derivatives at fair value, as described in Note 2, and recognizes changes in fair value currently in its results of operations. Accordingly, the fund does not follow hedge accounting, even for derivatives employed as economic hedges. Generally, the fund accounts for its derivatives on a gross basis. It does not offset the fair value of derivative liabilities against the fair value of derivative assets on its financial statements, nor does it offset the fair value of derivative instruments against the right to reclaim or obligation to return collateral.
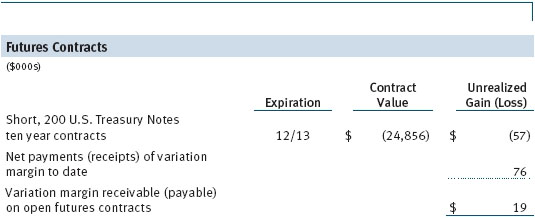
As of August 31, 2013, the fund held interest rate futures with cumulative unrealized loss of $57,000; the value reflected on the accompanying Statement of Assets and Liabilities is the related unsettled variation margin.
Additionally, during the six months ended August 31, 2013, the fund recognized $368,000 of realized gain on Futures and a $(57,000) change in unrealized gain/loss on Futures related to its investments in interest rate derivatives; such amounts are included on the accompanying Statement of Operations.
Counterparty Risk and Collateral The fund invests in exchange-traded or centrally cleared derivative contracts. Counterparty risk on such derivatives, such as futures, exchange-traded options and centrally cleared swaps, is minimal because the exchange’s clearinghouse provides protection against counterparty defaults. The clearinghouse typically imposes margin requirements to ensure performance by the parties to the contract. Each clearing broker, in its sole discretion, may adjust the margin requirements applicable to the fund.
Collateral may be in the form of cash or debt securities issued by the U.S. government or related agencies. Required margin posted by the fund is held by the clearing broker. Cash posted by the fund as collateral or required margin is reflected as restricted cash in the accompanying financial statements, and securities posted by the fund are so noted in the accompanying Portfolio of Investments; both remain in the fund’s assets. As of August 31, 2013, cash of $295,000 had been posted by the fund for exchange-traded derivatives.
Futures Contracts The fund is subject to interest rate risk in the normal course of pursuing its investment objectives and uses futures contracts to help manage such risk. The fund may enter into futures contracts to manage exposure to interest rate and yield curve movements, security prices, foreign currencies, credit quality, and mortgage prepayments; as an efficient means of adjusting exposure to all or part of a target market; to enhance income; as a cash management tool; and/or to adjust portfolio duration and credit exposure. A futures contract provides for the future sale by one party and purchase by another of a specified amount of a particular underlying financial instrument at an agreed-upon price, date, time, and place. The fund currently invests only in exchange-traded futures, which generally are standardized as to maturity date, underlying financial instrument, and other contract terms. Upon entering into a futures contract, the fund is required to deposit collateral with the broker in the form of cash or securities in an amount equal to a certain percentage of the contract value (margin requirement); the margin requirement must then be maintained at the established level over the life of the contract. Subsequent payments are made or received by the fund each day to settle daily fluctuations in the value of the contract (variation margin), which reflect changes in the value of the underlying financial instrument. Variation margin is recorded as unrealized gain or loss until the contract is closed. The value of a futures contract included in net assets is the amount of unsettled variation margin; net variation margin receivable is reflected as an asset, and net variation margin payable is reflected as a liability on the accompanying Statement of Assets and Liabilities. Risks related to the use of futures contracts include possible illiquidity of the futures markets, contract prices that can be highly volatile and imperfectly correlated to movements in hedged security values and/or interest rates, and potential losses in excess of the fund’s initial investment. During the six months ended August 31, 2013, the fund’s exposure to futures, based on underlying notional amounts, was generally less than 1% of net assets.
NOTE 4 - OTHER INVESTMENT TRANSACTIONS
Consistent with its investment objective, the fund engages in the following practices to manage exposure to certain risks and/or to enhance performance. The investment objective, policies, program, and risk factors of the fund are described more fully in the fund’s prospectus and Statement of Additional Information.
Noninvestment-Grade Debt Securities At August 31, 2013, approximately 39% of the fund’s net assets were invested, either directly or through its investment in T. Rowe Price institutional funds, in noninvestment-grade debt securities, commonly referred to as “high yield” or “junk” bonds. The noninvestment-grade bond market may experience sudden and sharp price swings due to a variety of factors, including changes in economic forecasts, stock market activity, large sustained sales by major investors, a high-profile default, or a change in market psychology. These events may decrease the ability of issuers to make principal and interest payments and adversely affect the liquidity or value, or both, of such securities.
Restricted Securities The fund may invest in securities that are subject to legal or contractual restrictions on resale. Prompt sale of such securities at an acceptable price may be difficult and may involve substantial delays and additional costs.
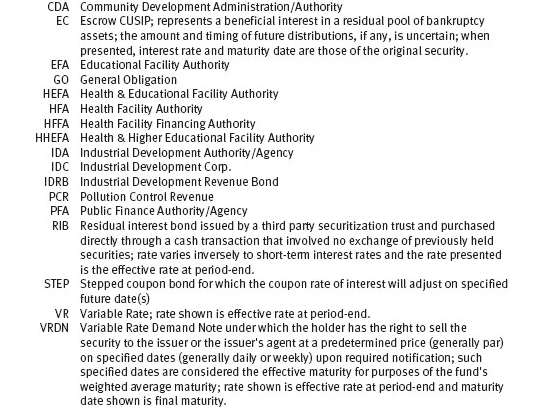
Residual-Interest Bonds During the six months ended August 31, 2013, the fund held residual-interest bonds (RIBs) purchased from third-party special purpose trusts, which securitize an underlying bond into RIBs and short-term floating rate bonds. RIBs generally are entitled to the cash flows of the underlying bond that remain after payment of amounts due to the floating rate bondholders and trust-related fees; they also generally have the right to acquire the underlying bond from the trust. RIBs can only be traded in accordance with Rule 144A of the Securities Act of 1933 and cannot be offered for public resale. Risks arise from changes in interest rates and the value of the underlying bond, and the sale of the RIBs may involve delay or additional costs.
When-Issued Securities The fund may enter into when-issued purchases or sales commitments, pursuant to which it agrees to purchase or sell, respectively, the underlying security for a fixed unit price, with payment and delivery at a scheduled future date generally beyond the customary settlement period for such securities. When-issued refers to securities that have not yet been issued but will be issued in the future and may include new securities or securities obtained through a corporate action on a current holding. The fund normally purchases when-issued securities with the intention of taking possession but may enter into a separate agreement to sell the securities before the settlement date. Until settlement, the fund maintains cash reserves and liquid assets sufficient to settle its when-issued commitments. Amounts realized on when-issued transactions are included with realized gain/loss on securities in the accompanying financial statements.
Other Purchases and sales of portfolio securities other than short-term securities aggregated $263,117,000 and $404,206,000, respectively, for the six months ended August 31, 2013.
NOTE 5 - FEDERAL INCOME TAXES
No provision for federal income taxes is required since the fund intends to continue to qualify as a regulated investment company under Subchapter M of the Internal Revenue Code and distribute to shareholders all of its income and gains. Distributions determined in accordance with federal income tax regulations may differ in amount or character from net investment income and realized gains for financial reporting purposes. Financial reporting records are adjusted for permanent book/tax differences to reflect tax character but are not adjusted for temporary differences. The amount and character of tax-basis distributions and composition of net assets are finalized at fiscal year-end; accordingly, tax-basis balances have not been determined as of the date of this report.
The fund intends to retain realized gains to the extent of available capital loss carryforwards. As a result of the Regulated Investment Company Modernization Act of 2010, net capital losses realized on or after March 1, 2011 (effective date) may be carried forward indefinitely to offset future realized capital gains; however, post-effective losses must be used before pre-effective capital loss carryforwards with expiration dates. Accordingly, it is possible that all or a portion of the fund’s pre-effective capital loss carryforwards could expire unused. As of February 28, 2013, the fund had $23,114,000 of available capital loss carryforwards, which expire as follows: $60,000 in fiscal 2014, $6,657,000 in fiscal 2017, $12,492,000 in fiscal 2018, and $3,652,000 in fiscal 2019; $253,000 have no expiration.
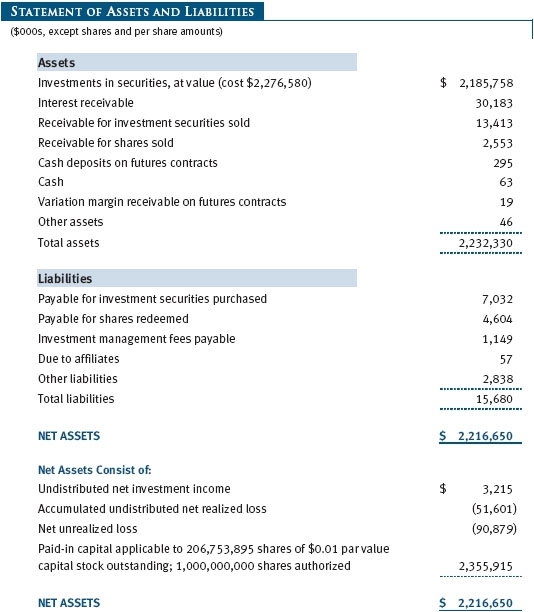
At August 31, 2013, the cost of investments for federal income tax purposes was $2,273,318,000. Net unrealized loss aggregated $87,617,000 at period-end, of which $72,764,000 related to appreciated investments and $160,381,000 related to depreciated investments.
NOTE 6 - RELATED PARTY TRANSACTIONS
The fund is managed by T. Rowe Price Associates, Inc. (Price Associates), a wholly owned subsidiary of T. Rowe Price Group, Inc. (Price Group). The investment management agreement between the fund and Price Associates provides for an annual investment management fee, which is computed daily and paid monthly. The fee consists of an individual fund fee, equal to 0.30% of the fund’s average daily net assets, and a group fee. The group fee rate is calculated based on the combined net assets of certain mutual funds sponsored by Price Associates (the group) applied to a graduated fee schedule, with rates ranging from 0.48% for the first $1 billion of assets to 0.275% for assets in excess of $400 billion. The fund’s group fee is determined by applying the group fee rate to the fund’s average daily net assets. At August 31, 2013, the effective annual group fee rate was 0.30%.
The Advisor Class is also subject to a contractual expense limitation through June 30, 2015. During the limitation period, Price Associates is required to waive its management fee and/or reimburse expenses, excluding interest, taxes, brokerage commissions, and extraordinary expenses that would otherwise cause the class’s ratio of annualized total expenses to average net assets (expense ratio) to exceed its expense limitation of 1.05%. For a period of three years after the date of any reimbursement or waiver, each class is required to repay Price Associates for expenses previously reimbursed and management fees waived to the extent the class’s net assets have grown or expenses have declined sufficiently to allow repayment without causing the class’s expense ratio to exceed its expense limitation. For the six months ended August 31, 2013, the Advisor Class operated below its expense limitation.
In addition, the fund has entered into service agreements with Price Associates and a wholly owned subsidiary of Price Associates (collectively, Price). Price Associates computes the daily share prices and provides certain other administrative services to the fund. T. Rowe Price Services, Inc., provides shareholder and administrative services in its capacity as the fund’s transfer and dividend disbursing agent. For the six months ended August 31, 2013, expenses incurred pursuant to these service agreements were $85,000 for Price Associates and $233,000 for T. Rowe Price Services, Inc. The total amount payable at period-end pursuant to these service agreements is reflected as Due to Affiliates in the accompanying financial statements.
As of August 31, 2013, T. Rowe Price Group, Inc., and/or its wholly owned subsidiaries owned 21,295 shares of the Advisor Class, representing less than 1% of the fund’s net assets.
| Information on Proxy Voting Policies, Procedures, and Records |
A description of the policies and procedures used by T. Rowe Price funds and portfolios to determine how to vote proxies relating to portfolio securities is available in each fund’s Statement of Additional Information. You may request this document by calling 1-800-225-5132 or by accessing the SEC’s website, sec.gov.
The description of our proxy voting policies and procedures is also available on our website, troweprice.com. To access it, click on the words “Social Responsibility” at the top of our corporate homepage. Next, click on the words “Conducting Business Responsibly” on the left side of the page that appears. Finally, click on the words “Proxy Voting Policies” on the left side of the page that appears.
Each fund’s most recent annual proxy voting record is available on our website and through the SEC’s website. To access it through our website, follow the above directions to reach the “Conducting Business Responsibly” page. Click on the words “Proxy Voting Records” on the left side of that page, and then click on the “View Proxy Voting Records” link at the bottom of the page that appears.
| How to Obtain Quarterly Portfolio Holdings |
The fund files a complete schedule of portfolio holdings with the Securities and Exchange Commission for the first and third quarters of each fiscal year on Form N-Q. The fund’s Form N-Q is available electronically on the SEC’s website (sec.gov); hard copies may be reviewed and copied at the SEC’s Public Reference Room, 100 F St. N.E., Washington, DC 20549. For more information on the Public Reference Room, call 1-800-SEC-0330.
| Approval of Investment Management Agreement |
On March 5, 2013, the fund’s Board of Directors (Board), including a majority of the fund’s independent directors, approved the continuation of the investment management agreement (Advisory Contract) between the fund and its investment advisor, T. Rowe Price Associates, Inc. (Advisor). In connection with its deliberations, the Board requested, and the Advisor provided, such information as the Board (with advice from independent legal counsel) deemed reasonably necessary. The Board considered a variety of factors in connection with its review of the Advisory Contract, also taking into account information provided by the Advisor during the course of the year, as discussed below:
Services Provided by the Advisor
The Board considered the nature, quality, and extent of the services provided to the fund by the Advisor. These services included, but were not limited to, directing the fund’s investments in accordance with its investment program and the overall management of the fund’s portfolio, as well as a variety of related activities such as financial, investment operations, and administrative services; compliance; maintaining the fund’s records and registrations; and shareholder communications. The Board also reviewed the background and experience of the Advisor’s senior management team and investment personnel involved in the management of the fund, as well as the Advisor’s compliance record. The Board concluded that it was satisfied with the nature, quality, and extent of the services provided by the Advisor.
Investment Performance of the Fund
The Board reviewed the fund’s three-month, one-year, and year-by-year returns, as well as the fund’s average annualized total returns over the 3-, 5-, and 10-year periods, and compared these returns with a wide variety of previously agreed upon comparable performance measures and market data, including those supplied by Lipper and Morningstar, which are independent providers of mutual fund data.
On the basis of this evaluation and the Board’s ongoing review of investment results, and factoring in the relative market conditions during certain of the performance periods, the Board concluded that the fund’s performance was satisfactory.
Costs, Benefits, Profits, and Economies of Scale
The Board reviewed detailed information regarding the revenues received by the Advisor under the Advisory Contract and other benefits that the Advisor (and its affiliates) may have realized from its relationship with the fund, including any research received under “soft dollar” agreements and commission-sharing arrangements with broker-dealers. The Board considered that the Advisor may receive some benefit from soft-dollar arrangements pursuant to which research is received from broker-dealers that execute the applicable fund’s portfolio transactions. The Board received information on the estimated costs incurred and profits realized by the Advisor from managing T. Rowe Price mutual funds. The Board also reviewed estimates of the profits realized from managing the fund in particular, and the Board concluded that the Advisor’s profits were reasonable in light of the services provided to the fund.
The Board also considered whether the fund benefits under the fee levels set forth in the Advisory Contract from any economies of scale realized by the Advisor. Under the Advisory Contract, the fund pays a fee to the Advisor for investment management services composed of two components—a group fee rate based on the combined average net assets of most of the T. Rowe Price mutual funds (including the fund) that declines at certain asset levels and an individual fund fee rate based on the fund’s average daily net assets—and the fund pays its own expenses of operations (subject to an expense limitation agreed to by the Advisor with respect to the Advisor Class). The Board concluded that the advisory fee structure for the fund continued to provide for a reasonable sharing of benefits from any economies of scale with the fund’s investors.
Fees
The Board was provided with information regarding industry trends in management fees and expenses, and the Board reviewed the fund’s management fee rate, operating expenses, and total expense ratio for the Investor Class and Advisor Class in comparison with fees and expenses of other comparable funds based on information and data supplied by Lipper. The information provided to the Board indicated that the fund’s management fee rate (after including reductions of the management fee that resulted from fee waivers for the Advisor Class) was at or above the median for comparable funds. The information also indicated that the total expense ratio for both classes was at or below the median for comparable funds.
The Board also reviewed the fee schedules for institutional accounts and private accounts with similar mandates that are advised or subadvised by the Advisor and its affiliates. Management provided the Board with information about the Advisor’s responsibilities and services provided to institutional account clients, including information about how the requirements and economics of the institutional business are fundamentally different from those of the mutual fund business. The Board considered information showing that the mutual fund business is generally more complex from a business and compliance perspective than the institutional business and that the Advisor generally performs significant additional services and assumes greater risk in managing the fund and other T. Rowe Price mutual funds than it does for institutional account clients.
On the basis of the information provided and the factors considered, the Board concluded that the fees paid by the fund under the Advisory Contract are reasonable.
Approval of the Advisory Contract
As noted, the Board approved the continuation of the Advisory Contract. No single factor was considered in isolation or to be determinative to the decision. Rather, the Board concluded, in light of a weighting and balancing of all factors considered, that it was in the best interests of the fund and its shareholders for the Board to approve the continuation of the Advisory Contract (including the fees to be charged for services thereunder). The independent directors were advised throughout the process by independent legal counsel.
Item 2. Code of Ethics.
A code of ethics, as defined in Item 2 of Form N-CSR, applicable to its principal executive officer, principal financial officer, principal accounting officer or controller, or persons performing similar functions is filed as an exhibit to the registrant’s annual Form N-CSR. No substantive amendments were approved or waivers were granted to this code of ethics during the registrant’s most recent fiscal half-year.
Item 3. Audit Committee Financial Expert.
Disclosure required in registrant’s annual Form N-CSR.
Item 4. Principal Accountant Fees and Services.
Disclosure required in registrant’s annual Form N-CSR.
Item 5. Audit Committee of Listed Registrants.
Not applicable.
Item 6. Investments.
(a) Not applicable. The complete schedule of investments is included in Item 1 of this Form N-CSR.
(b) Not applicable.
Item 7. Disclosure of Proxy Voting Policies and Procedures for Closed-End Management Investment Companies.
Not applicable.
Item 8. Portfolio Managers of Closed-End Management Investment Companies.
Not applicable.
Item 9. Purchases of Equity Securities by Closed-End Management Investment Company and Affiliated Purchasers.
Not applicable.
Item 10. Submission of Matters to a Vote of Security Holders.
Not applicable.
Item 11. Controls and Procedures.
(a) The registrant’s principal executive officer and principal financial officer have evaluated the registrant’s disclosure controls and procedures within 90 days of this filing and have concluded that the registrant’s disclosure controls and procedures were effective, as of that date, in ensuring that information required to be disclosed by the registrant in this Form N-CSR was recorded, processed, summarized, and reported timely.
(b) The registrant’s principal executive officer and principal financial officer are aware of no change in the registrant’s internal control over financial reporting that occurred during the registrant’s second fiscal quarter covered by this report that has materially affected, or is reasonably likely to materially affect, the registrant’s internal control over financial reporting.
Item 12. Exhibits.
(a)(1) The registrant’s code of ethics pursuant to Item 2 of Form N-CSR is filed with the registrant’s annual Form N-CSR.
(2) Separate certifications by the registrant's principal executive officer and principal financial officer, pursuant to Section 302 of the Sarbanes-Oxley Act of 2002 and required by Rule 30a-2(a) under the Investment Company Act of 1940, are attached.
(3) Written solicitation to repurchase securities issued by closed-end companies: not applicable.
(b) A certification by the registrant's principal executive officer and principal financial officer, pursuant to Section 906 of the Sarbanes-Oxley Act of 2002 and required by Rule 30a-2(b) under the Investment Company Act of 1940, is attached.
SIGNATURES
Pursuant to the requirements of the Securities Exchange Act of 1934 and the Investment Company Act of 1940, the registrant has duly caused this report to be signed on its behalf by the undersigned, thereunto duly authorized.
T. Rowe Price Tax-Free High Yield Fund, Inc.
| | By | /s/ Edward C. Bernard |
| | Edward C. Bernard |
| | Principal Executive Officer |
| |
| Date October 16, 2013 | | |
Pursuant to the requirements of the Securities Exchange Act of 1934 and the Investment Company Act of 1940, this report has been signed below by the following persons on behalf of the registrant and in the capacities and on the dates indicated.
| | By | /s/ Edward C. Bernard |
| | Edward C. Bernard |
| | Principal Executive Officer |
| |
| Date October 16, 2013 | | |
| |
| |
| By | /s/ Gregory K. Hinkle |
| | Gregory K. Hinkle |
| | Principal Financial Officer |
| |
| Date October 16, 2013 | | |