| UNITED STATES |
| SECURITIES AND EXCHANGE COMMISSION |
| Washington, D.C. 20549 |
| |
FORM N-CSR |
| |
CERTIFIED SHAREHOLDER REPORT OF REGISTERED |
MANAGEMENT INVESTMENT COMPANIES |
| |
| |
| |
| Investment Company Act File Number: 811-4163 |
|
| |
| T. Rowe Price Tax-Free High Yield Fund, Inc. |
|
| (Exact name of registrant as specified in charter) |
| |
| 100 East Pratt Street, Baltimore, MD 21202 |
|
| (Address of principal executive offices) |
| |
| David Oestreicher |
| 100 East Pratt Street, Baltimore, MD 21202 |
|
| (Name and address of agent for service) |
| |
| |
| Registrant’s telephone number, including area code: (410) 345-2000 |
| |
| |
| Date of fiscal year end: February 28 |
| |
| |
| Date of reporting period: August 31, 2010 |
Item 1: Report to Shareholders| Tax-Free High Yield Fund | August 31, 2010 |

The views and opinions in this report were current as of August 31, 2010. They are not guarantees of performance or investment results and should not be taken as investment advice. Investment decisions reflect a variety of factors, and the managers reserve the right to change their views about individual stocks, sectors, and the markets at any time. As a result, the views expressed should not be relied upon as a forecast of the fund’s future investment intent. The report is certified under the Sarbanes-Oxley Act, which requires mutual funds and other public companies to affirm that, to the best of their knowledge, the information in their financial reports is fairly and accurately stated in all material respects.
REPORTS ON THE WEB
Sign up for our E-mail Program, and you can begin to receive updated fund reports and prospectuses online rather than through the mail. Log in to your account at troweprice.com for more information.
Manager’s Letter
Fellow Shareholders
Tax-free municipal bonds produced strong returns in the six-month period ended August 31, 2010, mostly keeping up with taxable bonds and faring much better than equities in a challenging economic environment. Continuing recent trends, longer-term and lower-quality securities performed much better than shorter-term and higher-quality munis as investors sought attractive yields from assets perceived to be relatively safe. Investor demand for municipal securities remained strong as investors braced for higher federal and possibly higher state and local income tax rates in 2011.
MARKET ENVIRONMENT
The U.S. economic recovery, which started in the third quarter of 2009, has decelerated in recent months, and some fear that the economy is at risk of slipping into a new recession. According to the most recent estimates, gross domestic product grew at a meager pace of 1.6% in the second quarter of 2010. While national unemployment remains stubbornly above 9% and the housing recovery is far from robust, we currently believe the economy is likely to grow at a sluggish pace in the months ahead and not relapse into recession. Encouraging signs include continued growth in industrial production, modest expansion of payrolls, and rising capital goods shipments.
In the last six months, Fed officials consistently reassured investors that an increase in the fed funds target rate, which remained in the 0.00% to 0.25% range established in late 2008, was not imminent. Most recently, with economic growth weakening, the central bank acted to avoid a passive tightening of policy stemming from activities related to its balance sheet. On August 10, the Fed adopted a policy of reinvesting principal payments from other maturing securities into Treasury securities. As a result, longer-term Treasury yields tumbled to levels not seen since the depth of the financial crisis in late 2008. Intermediate- and longer-term municipal yields also declined but not as much as Treasury yields.
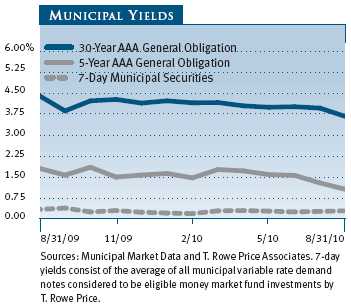
With municipal yields at reasonable levels relative to Treasury yields, tax-free securities are an attractive alternative to taxable bonds, particularly for investors in the highest tax brackets. For example, as of August 31, the 3.67% yield offered by a 30-year tax-free municipal bond rated AAA was 104% of the 3.52% pretax yield offered by a 30-year Treasury. An investor in the 28% federal tax bracket would need to invest in a taxable bond yielding about 5.10% to receive the same after-tax income from a 30-year AAA muni bond yielding 3.67%. Nonetheless, as in all other fixed income markets, municipal yields are at or near historic lows across the curve. (To calculate a municipal bond’s taxable-equivalent yield, divide the municipal bond’s yield by the quantity of 1.00 minus your federal tax bracket expressed as a decimal—in this case, 1.00 – 0.28, or 0.72.)
MUNICIPAL MARKET NEWS
Municipal bond supply for the year through the end of August totaled about $262 billion, according to The Bond Buyer. New supply this year reflects a steady pace of municipal borrowings for ongoing capital needs. Investor demand has remained strong, bolstered by concerns about higher federal, state, and local taxes. About one-fourth of this year’s new supply represented taxable municipal issuance under the Build America Bond (BAB) program, which constricts supply of new tax-exempt securities. While we expect this year’s overall issuance to be in line with that of recent years, the expansion of the BAB program could make aggregate new tax-exempt issuance in 2010 somewhat lower than it was in 2009.
Many states continue to face fiscal difficulties and have been forced to take drastic actions, including tax and fee increases and spending cuts, to close budget deficits. Despite the increasing negative press regarding the fiscal health of municipal issuers, we do not see a near-term threat to the states’ ability to continue servicing their outstanding debts, though we have longer-term concerns about potentially onerous future pension and other postretirement obligations. In any event, the fiscal woes of state governments do not necessarily limit our tax-free investment opportunities. The municipal market is made up of thousands of unique issuers in a variety of sectors, many of which continue to maintain good credit profiles.
Most municipal sectors produced good returns in the last six months, with life-care and hospital revenue bonds among the top-performing segments. We remain cautious about the health care sector, in part because the reform legislation passed earlier this year will lead to tighter reimbursements, and state budget cuts could impact Medicaid payments to providers. However, we believe the sector offers selective attractive investment opportunities with reasonable credit risks. Industrial revenue and pollution control revenue bonds also did well. In contrast, prerefunded and escrowed-to-maturity bonds, which are backed by U.S. Treasuries, produced mild gains. Tobacco bonds also lagged. We are underweighting this sector because fundamentals are poor, and longer-term consumption trends do not appear to be especially positive for tobacco bonds.
PORTFOLIO STRATEGY
TAX-EXEMPT MONEY FUND
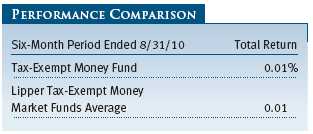
The fund returned 0.01% during the six-month period ended August 31, 2010, in line with results for the Lipper Tax-Exempt Money Market Funds Average.
An unchanged Federal Reserve policy, which has targeted a fed funds rate of 0.00% to 0.25% since late 2008, continues to compress all money market rates. All money market asset classes, including Treasury, agency, corporate, and municipal, now trade in a tight range around that target. The result has been a continuation of meager yields for all money fund investors.
The municipal money market curve spent most of the past six months moving in a very narrow range. The yield curve has averaged around 0.18% for overnight investments, 0.28% for seven days, 0.33% for 90 days, and 0.36% for one-year investments. Thus, any investment anywhere along the municipal money market yield curve continues to generate income insufficient to meet fund expenses. Interestingly, municipal rates have stayed low despite the fact that total money fund assets across the industry continue to fall—a technical situation that normally would push rates higher. A number of factors help explain these persistently low yields: a significant drop in short variable rate debt issuance; short-term bond funds dipping into the one-year area of the money fund curve; and the presence of crossover taxable money funds, which have become the marginal buyers of short-dated municipals. With the Fed expected to remain on hold through most of 2011, we expect little change in our yield curve for some time to come.
We are finding money market-eligible municipal supply down sharply from years past for several reasons. As mentioned, short-dated variable rate demand note issuance is off year-to-date as issuers are opportunistically locking in low rates through longer-dated borrowings in the bond market. Credit quality concerns have also removed a number of names from our approved list. The slow economy and budget pressures have forced us to avoid traditional borrowers such as Michigan, Illinois, Rhode Island, and New Jersey. The problems facing the state of California percolate down to its cities, counties, and school districts, making us cautious about investing in the debt of any of these issuers.
Despite low yields and the credit concerns permeating the municipal market, we remain focused on the fund’s primary mandate, namely stability of principal and liquidity. The money fund’s role within an investor’s portfolio is unchanged, and we remain true to consistent investment practices to fulfill that role. Interest rate cycles are just that—cycles—and we look forward to a time when investors in the fund can feel more rewarded.
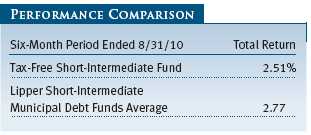
TAX-FREE SHORT-INTERMEDIATE FUND
The fund returned 2.51% over the six months ended August 31, 2010, compared with 2.77% for the Lipper Short-Intermediate Municipal Debt Funds Average, which measures the performance of competing funds. The fund’s net asset value per share was $5.66 at the end of August, up from $5.59 six months earlier. Dividends per share contributed $0.07 to the fund’s total return during the six-month period.
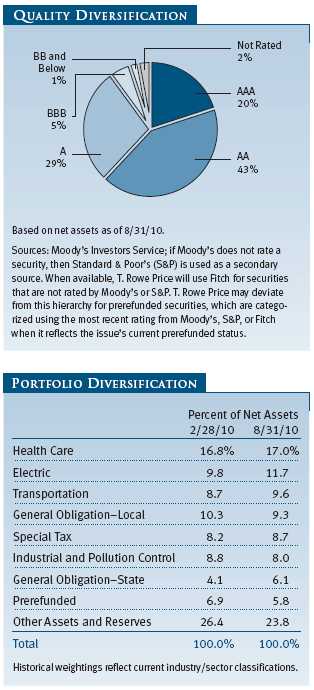
Our strategy during the past six months was much the same as it was over the previous six-month period. We continued to invest in various revenue sectors, including airport, dedicated tax, hospital, and public power revenue bonds. These sectors had the most new issuance and were available in an otherwise supply-constrained market. The revenue sector offered considerably more yield than general obligation bonds. As a result, our exposure to revenue bonds overall rose from 68% of net assets at the end of February to 71% at the end of August. We considerably underweighted state general obligation and prerefunded bonds relative to the Barclays Capital Municipal Bond 1–5 Year Blend (1–6 Year Maturity) Index.
We favored revenue bonds of issuers with strong management teams and predictable income streams, while we remain leery of many general obligation credits because of ongoing budget deficits, which are likely to continue for the rest of the year and possibly beyond. In the past, we typically have increased our exposure to state general obligation securities as the economy emerged from a recession. This time, however, we are uncertain about the ability of an improving economy to lift states out of their financial predicaments. This situation could change as the economy strengthens, but at the moment we prefer to take a more cautious approach about our exposure to the sector.
We maintained the “barbell” structure adopted earlier in the year, with heavy exposure to securities in the 7- to 10-year maturity range, countered by an overweight in one- and two-year securities. We also had been overweight in cash, but as the period wore on it became apparent to us that the Federal Reserve was not likely to raise short-term rates anytime soon. Consequently, we began to invest our cash more aggressively in bonds a bit further out on the yield curve. Since absolute yields remain generally low, we saw no point in managing the portfolio’s duration (a measure of a bond fund’s sensitivity to changes in interest rates) too closely. Our duration closed the period at 2.8 years, a bit short of that of the benchmark, where it has remained for much of the year.
We have maintained the barbell strategy primarily because heavy cash flows into intermediate-term bonds have driven their yields significantly lower. The yields on longer-term securities were quite a bit higher, making them far more attractive. Therefore, the combination of short- and longer-term bonds produces a better yield for the portfolio, and we believe it will provide some downside protection when interest rates eventually begin to go up.
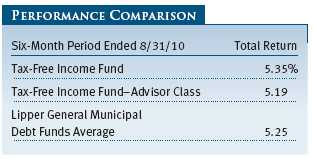
TAX-FREE INCOME FUND
Your fund returned 5.35% during the past six months, slightly ahead of the 5.25% return for the Lipper General Municipal Debt Funds Average, a benchmark measuring the performance of similar funds. (Performance for the Advisor Class was somewhat lower, reflecting its different fee structure.) The fund’s net asset value per share was $10.17 at the end of August, up from $9.86 at the end of February. Dividends per share contributed $0.21 to the fund’s total return during the past six months.
Cash flows into the fund were high during the period. Our investment strategy hasn’t changed since our February report. We maintained a bias toward longer maturities, since the steep yield curve continued to make those rates much more compelling. Consequently, we focused our purchases in 20- to 30-year bonds and were overweight 22-year or longer-term securities and underweight those maturing in three to 15 years, relative to the Barclays Capital Municipal Bond Index. Fortunately, our long-term bonds outperformed, benefiting fund results. The portfolio’s underweight in shorter bonds also made a positive contribution to performance. We extended the fund’s average weighted maturity almost a full year to 17.6 years. However, the fund’s duration declined from 6.5 to 5.9 years as interest rates moved lower and more holdings were priced to their call dates.
The fund’s quality diversification shifted during the period, partly due to Moody’s recalibration of municipal bond ratings to bring them in line with the global scale rating system. This change resulted in a credit upgrade for many issuers. While most new purchases fell into the A rated category, our net exposure to this area ended relatively unchanged since a number of fund holdings advanced into the AA group. BBB exposure also declined, mostly due to ratings recalibration.
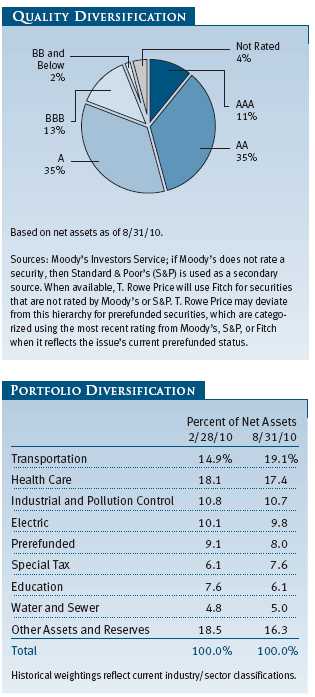
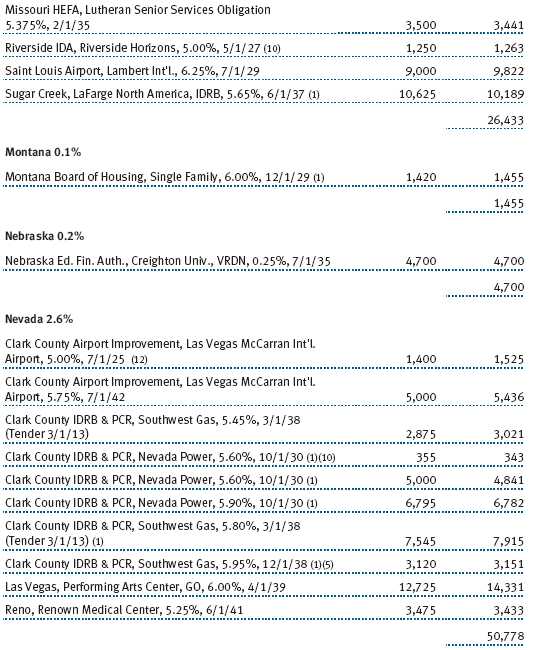
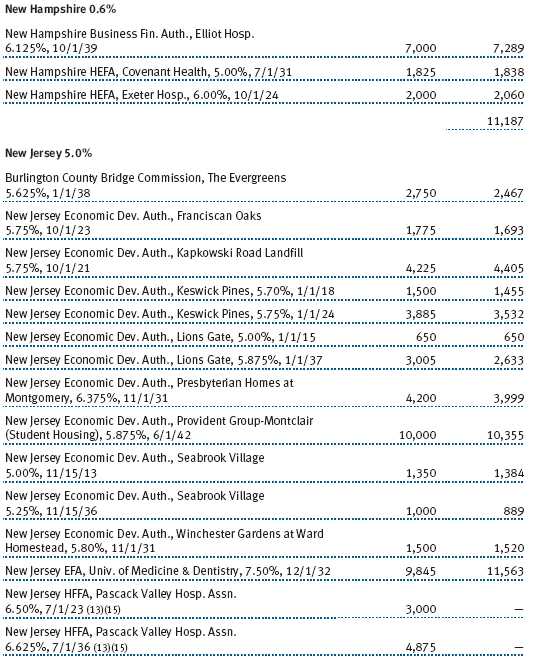
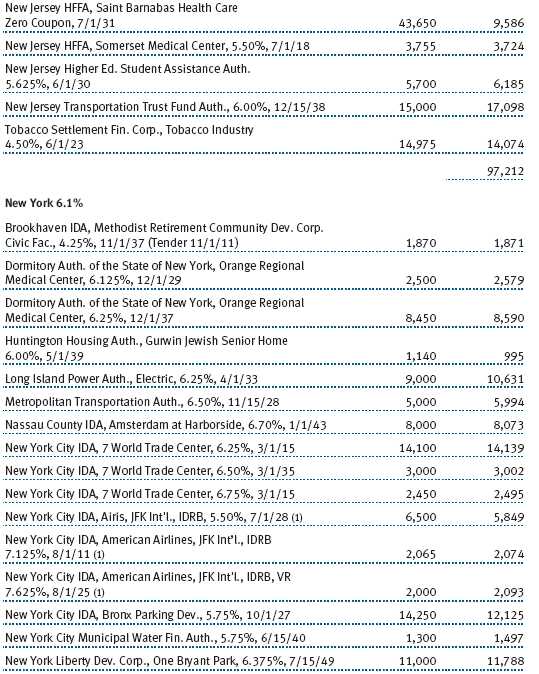
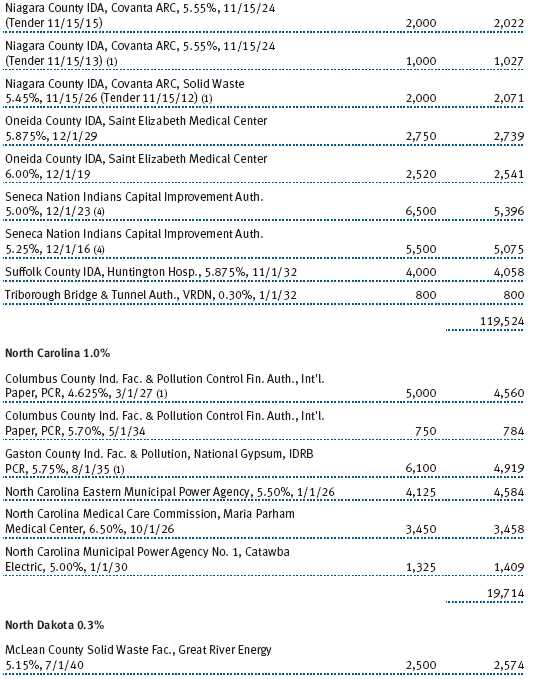
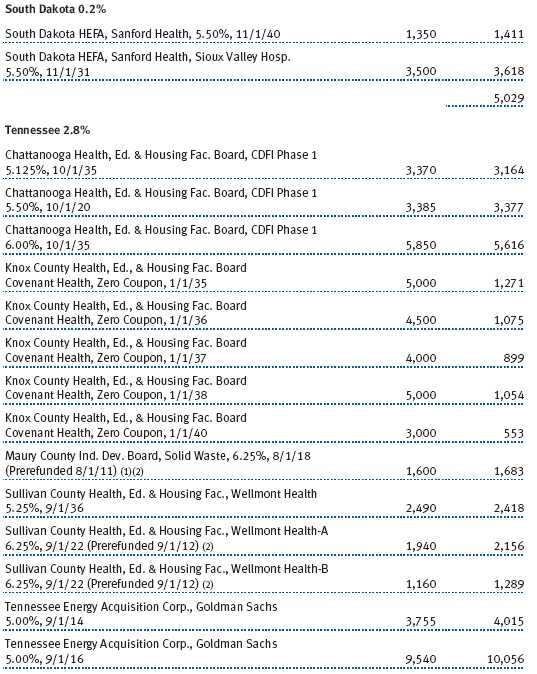
There was a shift in portfolio diversification as well. Our trading activity was elevated as we sought to lower the fund’s cash reserves, which had grown because of cash inflows. The fund’s portfolio composition reflects our bias toward revenue bonds while we continue to underweight general obligation securities. Many states and localities are still under duress because of budget deficits, and we believe these pressures will persist for some time. The largest change has been in the transportation sector, which currently represents the fund’s largest exposure. Ground transportation and air and sea transportation bonds provided relatively attractive yields. New issuance in these sectors was robust, and most of the airport issuance was not subject to the alternative minimum tax (AMT), which the fund avoids. New additions include Massachusetts Department of Transportation Highway System and Miami-Dade County Expressway Authority securities, among others. (Please refer to the fund’s portfolio of investments for a complete listing of our holdings and the amount each represents in the portfolio.)
Our high-quality bonds with shorter maturities, mostly prerefunded, underperformed while lower-quality, longer-duration bonds fared exceptionally well. The fund’s top performers were heavily weighted in A to BBB rated securities, as well as in nonrated holdings. The strongest sectors included hospital, life-care, and electric utilities bonds.
TAX-FREE HIGH YIELD FUND
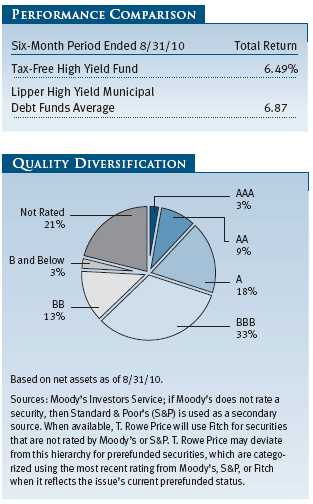
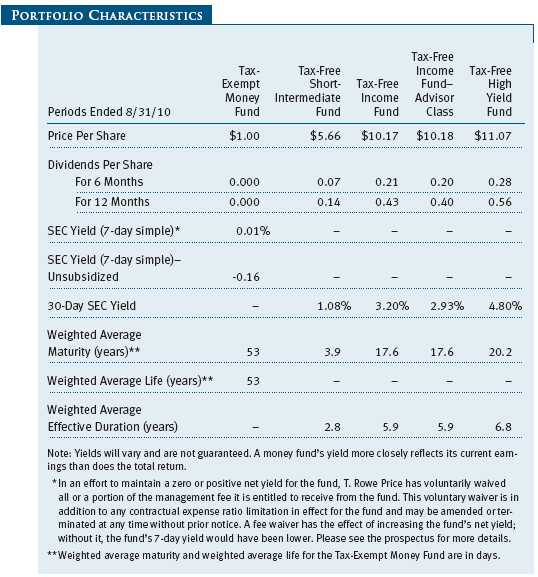
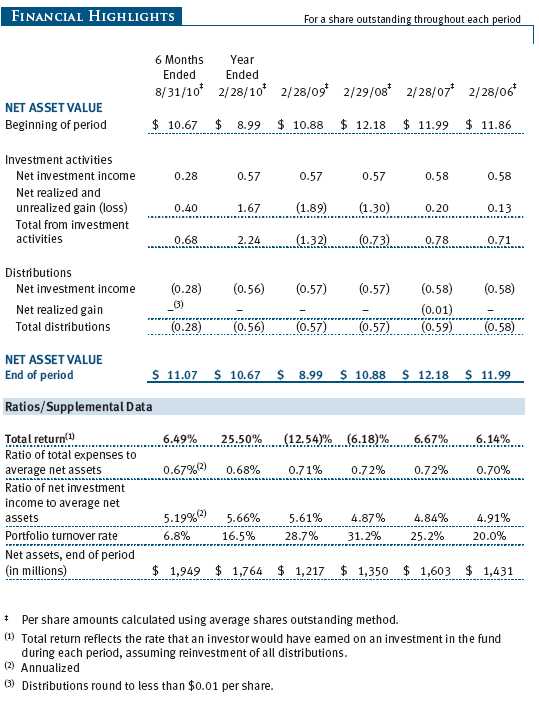
Lower-quality municipals generated good results over the past six months. The Tax-Free High Yield Fund returned 6.49% during the period compared with 6.87% for the Lipper High Yield Municipal Debt Funds Average, which measures the performance of similar funds. The fund’s net asset value per share was $11.07 at the end of August, up from $10.67 six months earlier. Dividends per share contributed $0.28 to the fund’s total return.
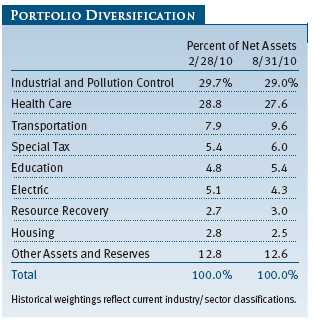
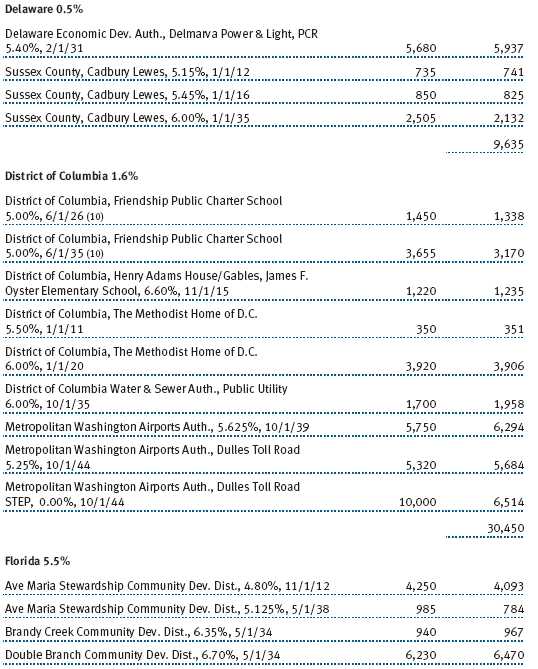
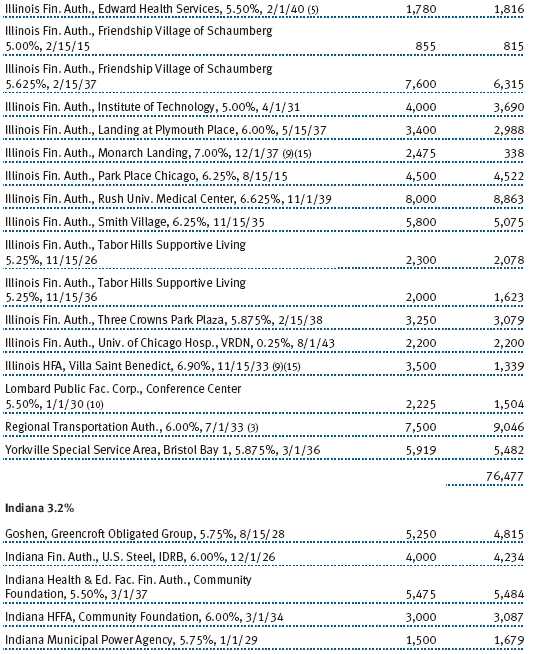
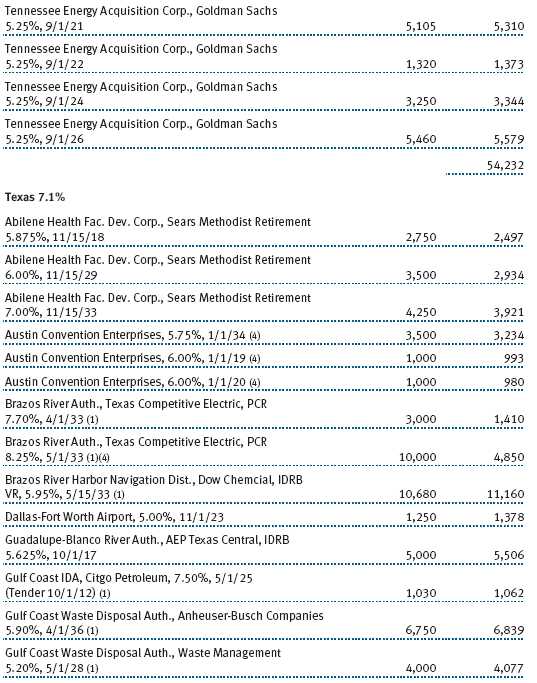
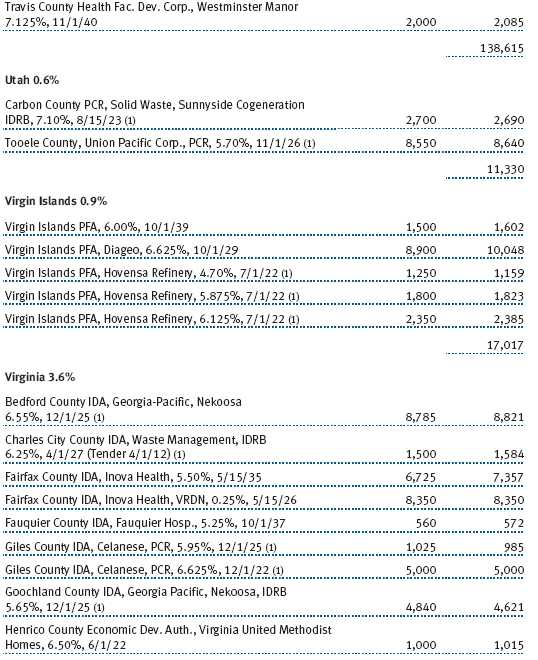
We maintained considerable exposure to corporate-backed revenue bonds issued for industrial development or pollution control projects. U.S. corporations are healthier and better capitalized than they were at the time of the financial crisis, and valuations for these bonds have remained attractive throughout the period. We continued to favor companies that provide critical products or services to the public, such as utilities, and we added holdings in Delmarva Power, U.S. Steel, and Westlake Chemical Company to the portfolio. (Please refer to the fund’s portfolio of investments for a complete listing of our holdings and the amount each represents in the portfolio.)
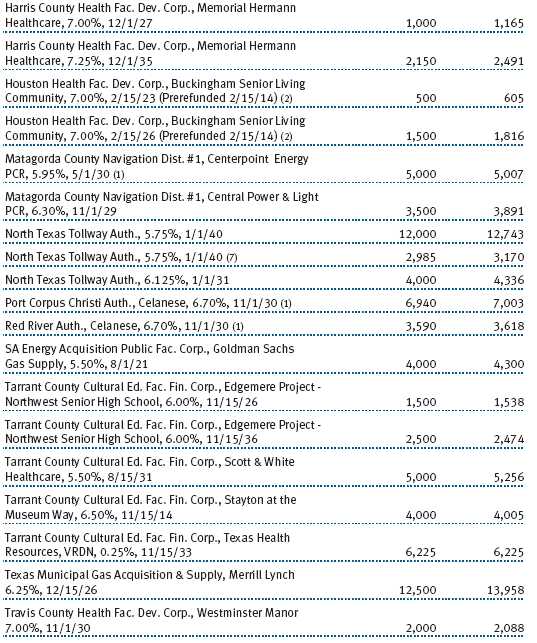
We also added to essential service revenue bonds that financed large infrastructure projects, including toll roads and airport bonds. These monopoly-like, capital-intensive projects provide steady revenue streams for the payment of bond debt, with limited economic sensitivity. In addition, they are insulated from the pension problems that beset state and local governments. We increased exposure to North Texas Toll Authority, Miami-Dade Airport Authority, and Los Angeles International Airport.
The fund maintained significant exposure to health care-related bonds, such as hospitals and continuing care retirement communities, which have performed well lately. The risk premiums in these sectors narrowed as new issue supply declined sharply through the summer. We continue to focus our health care holdings on systems with market share strength, favorable reimbursement streams, and strong management teams, given the uncertainties surrounding health care reform.
The fund benefited from its low exposure to tobacco securitization bonds—asset-backed bonds that underperformed the general municipal market as a large drop in tobacco consumption impaired the structured retirement of these bonds. In addition, we were significantly underweight in real estate-backed debt in Florida since we expect continued distress in that sector.
We are quite impressed with the strength and duration of the recovery in medium- and lower-quality municipals since the end of 2008. While risk premiums remain attractive from a historical perspective, the borrowing costs of issuers are quite low given the extremely low rates on AAA rated munis. In this environment, extensive credit research capability and a long-term perspective are important. We will continue to rely on our careful, research-driven process to capitalize on investment opportunities in this marketplace.
OUTLOOK
The municipal credit environment could remain challenging for some time. Ongoing economic sluggishness, the housing market downturn, and high unemployment have reduced the tax revenues collected by state and local municipalities—a trend that could get worse over the next 12 months—and municipal bond defaults, which historically have been rare, could increase moderately. Maintaining balanced budgets requires careful and dedicated work by state and local officials. Many issuers are trying to make the difficult but necessary fiscal decisions as they adjust to high unemployment, slow economic growth, lower tax revenues, and other tough conditions.
We continue to believe that the municipal market is still a high-quality market and that many longer-term municipal securities offer good value, especially considering that tax rates are expected to rise in the next few years. Longer-term and lower-rated investment-grade municipal bond valuations, though they have rebounded significantly from the lows of 2008, remain attractive and could improve further. In contrast, short- and intermediate-term securities appear to be fully valued and could be vulnerable if shorter-term interest rates increase, though that does not appear likely as long as inflation remains very low and the economy remains weak. We believe increased demand for munis due to higher anticipated tax rates and other factors, along with reduced tax-exempt issuance, will help cushion the effect of any rise in Treasury rates on the municipal market.
T. Rowe Price’s strong credit research capabilities have been and will remain an asset for our investors, in our view. We continue to conduct our own thorough research and assign independent credit ratings before making investment decisions. As always, we are on the lookout for attractively valued bonds issued by municipalities with good fundamentals. We think such investments will continue to help us generate excellent long-term relative returns for our clients.
Thank you for investing with T. Rowe Price.
Respectfully submitted,

Joseph K. Lynagh
Chairman of the Investment Advisory Committee
Tax-Exempt Money Fund

Charles B. Hill
Chairman of the Investment Advisory Committee
Tax-Free Short-Intermediate Fund

Konstantine B. Mallas
Chairman of the Investment Advisory Committee
Tax-Free Income Fund

James M. Murphy
Chairman of the Investment Advisory Committee
Tax-Free High Yield Fund
September 17, 2010
The committee chairmen have day-to-day responsibility for managing the portfolios and work with committee members in developing and executing the funds’ investment programs.
RISKS OF FIXED INCOME INVESTING
Since money market funds are managed to maintain a constant $1.00 share price, there should be little risk of principal loss. However, there is no assurance the fund will avoid principal losses if fund holdings default or are downgraded or if interest rates rise sharply in an unusually short period. In addition, the fund’s yield will vary; it is not fixed for a specific period like the yield on a bank certificate of deposit. An investment in the fund is not insured or guaranteed by the Federal Deposit Insurance Corporation (FDIC) or any other government agency. Although a money market fund seeks to preserve the value of your investment at $1.00 per share, it is possible to lose money by investing in it.
Bonds are subject to interest rate risk (the decline in bond prices that usually accompanies a rise in interest rates) and credit risk (the chance that any fund holding could have its credit rating downgraded or that a bond issuer will default by failing to make timely payments of interest or principal), potentially reducing the fund’s income level and share price. High yield bonds could have greater price declines than funds that invest primarily in high-quality bonds. Municipalities issuing high yield bonds are not as strong financially as those with higher credit ratings, so the bonds are usually considered speculative investments. Some income may be subject to state and local taxes and the federal AMT.
GLOSSARY
30-day SEC yield: A method of calculating a fund’s yield that assumes all portfolio securities are held until maturity. Yield will vary and is not guaranteed.
Barclays Capital Municipal Bond Index: An unmanaged index that tracks municipal debt instruments.
Barclays Capital Municipal Revenue Bond Index: An unmanaged index that tracks municipal revenue bonds.
Barclays Capital Municipal Bond 1–5 Year Blend (1–6 Year Maturity) Index: A subindex of the Barclays Capital Municipal Bond Index. It is a rules-based, market value-weighted index of short-term bonds engineered for the tax-exempt bond market.
Basis points: One hundred basis points equal one percentage point.
Duration: A measure of a bond fund’s sensitivity to changes in interest rates. For example, a fund with a duration of six years would fall about 6% in price in response to a one-percentage-point rise in interest rates, and vice versa.
Escrowed-to-maturity bond: A bond that has the funds necessary for repayment at maturity, or a call date, set aside in a separate or “escrow” account.
Fed funds rate: The interest rate charged on overnight loans of reserves by one financial institution to another in the United States. The Federal Reserve sets a target federal funds rate to affect the direction of interest rates.
General obligation debt: A government’s strongest pledge that obligates its full faith and credit, including, if necessary, its ability to raise taxes.
Investment grade: High-quality bonds as measured by one of the major credit rating agencies. For example, Standard & Poor’s designates the bonds in its top four categories (AAA to BBB) as investment grade.
Lipper averages: The averages of available mutual fund performance returns for specified time periods in defined categories as tracked by Lipper Inc.
Prerefunded bond: A bond that originally may have been issued as a general obligation or revenue bond but that is now secured by an escrow fund consisting entirely of direct U.S. government obligations that are sufficient for paying the bondholders.
SEC yield (7-day simple): A method of calculating a money fund’s yield by annualizing the fund’s net investment income for the last seven days of each period divided by the fund’s net asset value at the end of the period. Yield will vary and is not guaranteed.
Weighted average life: The dollar-weighted average maturity of a portfolio’s securities without taking into account interest rate reset dates for certain adjustable rate securities. It is a measure that reflects how a fund may react in periods when credit spreads are widening or liquidity conditions are tightening. In general, the longer the fund’s average life, the greater its exposure to interest rate fluctuations. Money funds must maintain a weighted average life of less than 120 days.
Weighted average maturity: In general, the longer the average maturity, the greater the fund’s sensitivity to interest rate changes. The weighted average maturity may take into account the interest rate readjustment dates for certain securities. Money funds must maintain a weighted average maturity of less than 60 days.
Yield curve: A graphic depiction of the relationship among the yields for similar bonds with different maturities. A yield curve is positive when short-term yields are lower than long-term yields and negative when short-term yields are higher than long-term yields.
Performance and Expenses
This chart shows the value of a hypothetical $10,000 investment in the fund over the past 10 fiscal year periods or since inception (for funds lacking 10-year records). The result is compared with benchmarks, which may include a broad-based market index and a peer group average or index. Market indexes do not include expenses, which are deducted from fund returns as well as mutual fund averages and indexes.


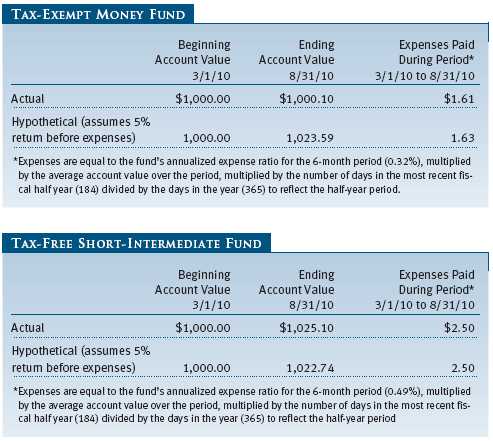
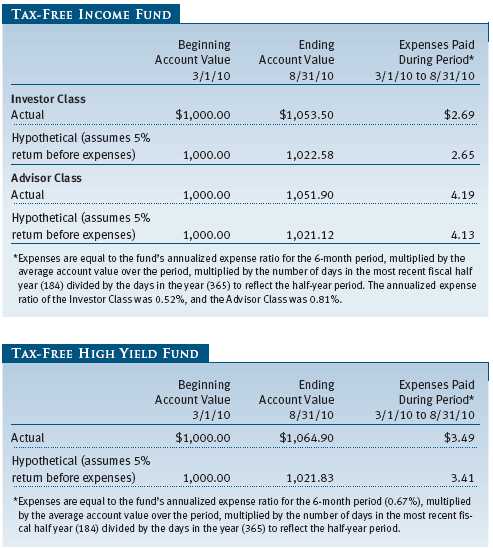
As a mutual fund shareholder, you may incur two types of costs: (1) transaction costs, such as redemption fees or sales loads, and (2) ongoing costs, including management fees, distribution and service (12b-1) fees, and other fund expenses. The following example is intended to help you understand your ongoing costs (in dollars) of investing in the fund and to compare these costs with the ongoing costs of investing in other mutual funds. The example is based on an investment of $1,000 invested at the beginning of the most recent six-month period and held for the entire period.
Actual Expenses
The first line of the following table (“Actual”) provides information about actual account values and actual expenses. You may use the information in this line, together with your account balance, to estimate the expenses that you paid over the period. Simply divide your account value by $1,000 (for example, an $8,600 account value divided by $1,000 = 8.6), then multiply the result by the number in the first line under the heading “Expenses Paid During Period” to estimate the expenses you paid on your account during this period.
Please note that the Tax-Free Income Fund has two share classes: The original share class (“investor class”) charges no distribution and service (12b-1) fee, and the Advisor Class shares are offered only through unaffiliated brokers and other financial intermediaries and charge a 0.25% 12b-1 fee. Each share class is presented separately in the table.
Hypothetical Example for Comparison Purposes
The information on the second line of the table (“Hypothetical”) is based on hypothetical account values and expenses derived from the fund’s actual expense ratio and an assumed 5% per year rate of return before expenses (not the fund’s actual return). You may compare the ongoing costs of investing in the fund with other funds by contrasting this 5% hypothetical example and the 5% hypothetical examples that appear in the shareholder reports of the other funds. The hypothetical account values and expenses may not be used to estimate the actual ending account balance or expenses you paid for the period.
Note: T. Rowe Price charges an annual small-account maintenance fee of $10, generally for accounts with less than $2,000 ($500 for UGMA/UTMA). The fee is waived for any investor whose T. Rowe Price mutual fund accounts total $25,000 or more, accounts employing automatic investing, and IRAs and other retirement plan accounts that utilize a prototype plan sponsored by T. Rowe Price (although a separate custodial or administrative fee may apply to such accounts). This fee is not included in the accompanying table. If you are subject to the fee, keep it in mind when you are estimating the ongoing expenses of investing in the fund and when comparing the expenses of this fund with other funds.
You should also be aware that the expenses shown in the table highlight only your ongoing costs and do not reflect any transaction costs, such as redemption fees or sales loads. Therefore, the second line of the table is useful in comparing ongoing costs only and will not help you determine the relative total costs of owning different funds. To the extent a fund charges transaction costs, however, the total cost of owning that fund is higher.

Unaudited
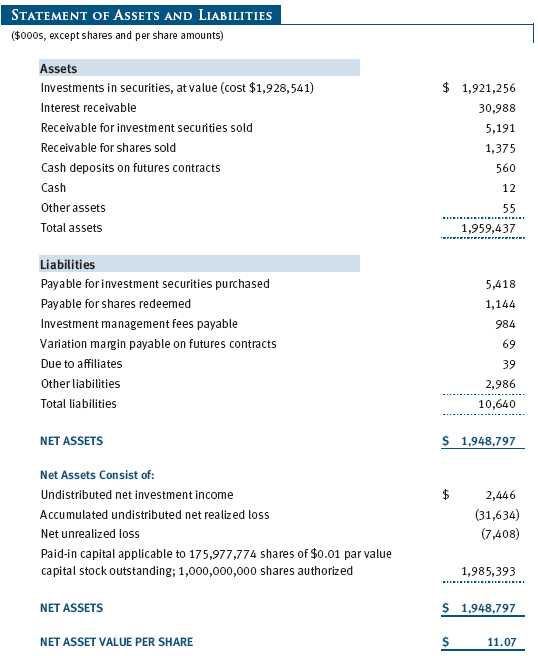
The accompanying notes are an integral part of these financial statements.
Unaudited


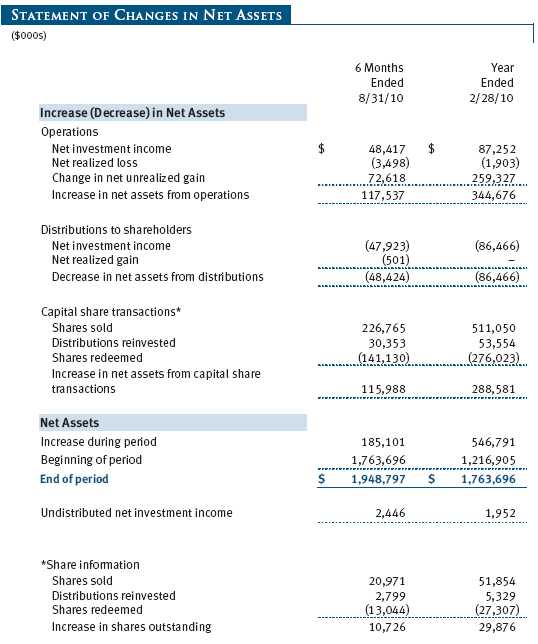
The accompanying notes are an integral part of these financial statements.
Unaudited
The accompanying notes are an integral part of these financial statements.
Unaudited

The accompanying notes are an integral part of these financial statements.
Unaudited
The accompanying notes are an integral part of these financial statements.
Unaudited
| NOTES TO FINANCIAL STATEMENTS |
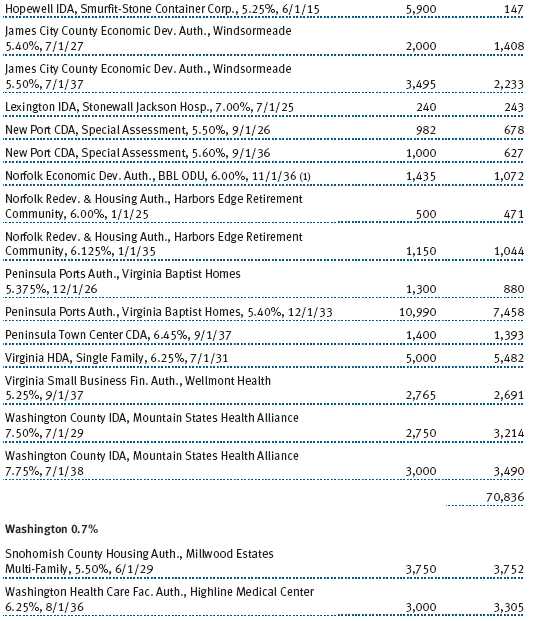
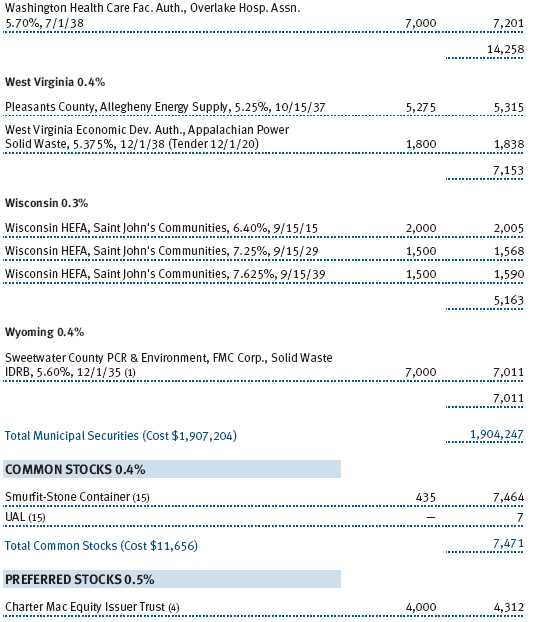
T. Rowe Price Tax-Free High Yield Fund, Inc. (the fund), is registered under the Investment Company Act of 1940 (the 1940 Act) as a diversified, open-end management investment company. The fund commenced operations on March 1, 1985. The fund seeks to provide a high level of income exempt from federal income taxes by investing primarily in long-term low- to upper-medium-grade municipal securities.
NOTE 1 - SIGNIFICANT ACCOUNTING POLICIES
Basis of Preparation The accompanying financial statements were prepared in accordance with accounting principles generally accepted in the United States of America (GAAP), which require the use of estimates made by fund management. Fund management believes that estimates and valuations are appropriate; however, actual results may differ from those estimates, and the valuations reflected in the accompanying financial statements may differ from the value ultimately realized upon sale of securities.
Investment Transactions, Investment Income, and Distributions Income and expenses are recorded on the accrual basis. Premiums and discounts on debt securities are amortized for financial reporting purposes. Dividend income is recorded on the ex-dividend date. Income tax-related interest and penalties, if incurred, would be recorded as income tax expense. Investment transactions are accounted for on the trade date. Realized gains and losses are reported on the identified cost basis. Distributions to shareholders are recorded on the ex-dividend date. Income distributions are declared daily and paid monthly. Capital gain distributions, if any, are generally declared and paid by the fund annually.
Credits The fund earns credits on temporarily uninvested cash balances held at the custodian, which reduce the fund’s custody charges. Custody expense in the accompanying financial statements is presented before reduction for credits.
New Accounting Pronouncement On March 1, 2010, the fund adopted new accounting guidance that requires enhanced disclosures about fair value measurements in the financial statements. Adoption of this guidance had no impact on the fund’s net assets or results of operations.
NOTE 2 - VALUATION
The fund’s investments are reported at fair value as defined by GAAP. The fund determines the values of its assets and liabilities and computes its net asset value per share at the close of the New York Stock Exchange (NYSE), normally 4 p.m. ET, each day that the NYSE is open for business.
Valuation Methods Debt securities are generally traded in the over-the-counter (OTC) market. Securities with remaining maturities of one year or more at the time of acquisition are valued at prices furnished by dealers who make markets in such securities or by an independent pricing service, which considers the yield or price of bonds of comparable quality, coupon, maturity, and type, as well as prices quoted by dealers who make markets in such securities. Securities with remaining maturities of less than one year at the time of acquisition generally use amortized cost in local currency to approximate fair value. However, if amortized cost is deemed not to reflect fair value or the fund holds a significant amount of such securities with remaining maturities of more than 60 days, the securities are valued at prices furnished by dealers who make markets in such securities or by an independent pricing service.
Equity securities listed or regularly traded on a securities exchange or in the OTC market are valued at the last quoted sale price or, for certain markets, the official closing price at the time the valuations are made, except for OTC Bulletin Board securities, which are valued at the mean of the latest bid and asked prices. A security that is listed or traded on more than one exchange is valued at the quotation on the exchange determined to be the primary market for such security. Listed securities not traded on a particular day are valued at the mean of the latest bid and asked prices for domestic securities and the last quoted sale price for international securities.
Financial futures contracts are valued at closing settlement prices.
Other investments, including restricted securities, and those financial instruments for which the above valuation procedures are inappropriate or are deemed not to reflect fair value are stated at fair value as determined in good faith by the T. Rowe Price Valuation Committee, established by the fund’s Board of Directors.
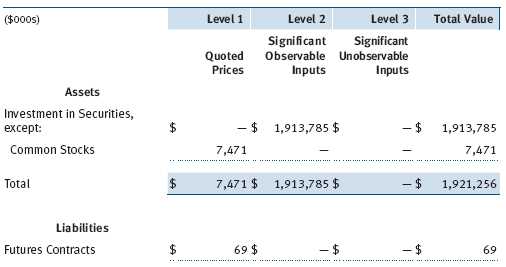
Valuation Inputs Various inputs are used to determine the value of the fund’s financial instruments. These inputs are summarized in the three broad levels listed below:
Level 1 – quoted prices in active markets for identical financial instruments
Level 2 – observable inputs other than Level 1 quoted prices (including, but not limited to, quoted prices for similar financial instruments, interest rates, prepayment speeds, and credit risk)
Level 3 – unobservable inputs
Observable inputs are those based on market data obtained from sources independent of the fund, and unobservable inputs reflect the fund’s own assumptions based on the best information available. The input levels are not necessarily an indication of the risk or liquidity associated with financial instruments at that level. The following table summarizes the fund’s financial instruments, based on the inputs used to determine their values on August 31, 2010:
NOTE 3 - DERIVATIVE INSTRUMENTS
During the six months ended August 31, 2010, the fund invested in derivative instruments. As defined by GAAP, a derivative is a financial instrument whose value is derived from an underlying security price, foreign exchange rate, interest rate, index of prices or rates, or other variable; it requires little or no initial investment and permits or requires net settlement. The fund invests in derivatives only if the expected risks and rewards are consistent with its investment objectives, policies, and overall risk profile, as described in its prospectus and Statement of Additional Information. The fund may use derivatives for a variety of purposes, such as seeking to hedge against declines in principal value, increase yield, invest in an asset with greater efficiency and at a lower cost than is possible through direct investment, or to adjust portfolio duration and credit exposure. The risks associated with the use of derivatives are different from, and potentially much greater than, the risks associated with investing directly in the instruments on which the derivatives are based. Investments in derivatives can magnify returns positively or negatively; however, the fund at all times maintains sufficient cash reserves, liquid assets, or other SEC-permitted asset types to cover the settlement obligations under its open derivative contracts.
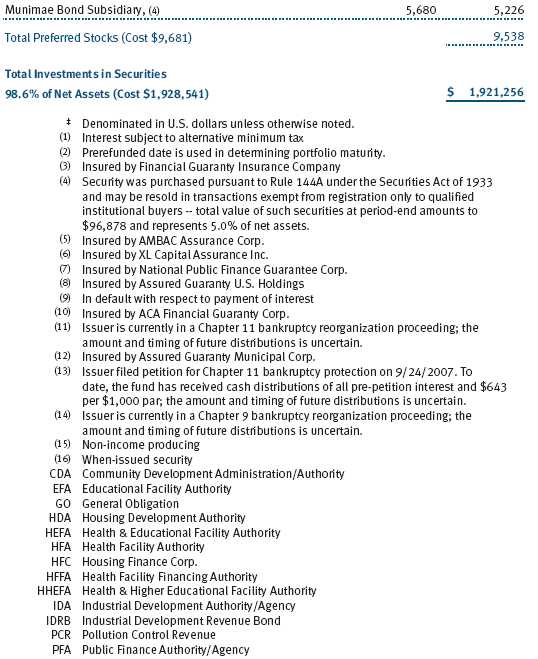
The fund values its derivatives at fair value, as described below and in Note 2, and recognizes changes in fair value currently in its results of operations. Accordingly, the fund does not follow hedge accounting, even for derivatives employed as economic hedges. The fund does not offset the fair value of derivative instruments against the right to reclaim or obligation to return collateral. As of August 31, 2010, the fund held interest rate futures with cumulative unrealized loss of $123,000; the value reflected on the accompanying Statement of Assets and Liabilities is the related unsettled variation margin.
Additionally, during the six months ended August 31, 2010, the fund recognized $2,051,000 of realized loss on Futures and a $75,000 change in unrealized gain on Futures related to its investments in interest rate derivatives; such amounts are included on the accompanying Statement of Operations.
Counterparty risk related to exchange-traded derivatives, including futures and options contracts, is minimal because the exchange’s clearinghouse provides protection against defaults. Additionally, for exchange-traded derivatives, each broker, in its sole discretion, may change margin requirements applicable to the fund.
Futures Contracts The fund is subject to interest rate risk in the normal course of pursuing its investment objectives and uses futures contracts to help manage such risk. The fund may enter into futures contracts to manage exposure to interest rate and yield curve movements, security prices, foreign currencies, credit quality, and mortgage prepayments; as an efficient means of adjusting exposure to all or part of a target market; to enhance income; as a cash management tool; and/or to adjust portfolio duration and credit exposure. A futures contract provides for the future sale by one party and purchase by another of a specified amount of a particular underlying financial instrument at an agreed-upon price, date, time, and place. The fund currently invests only in exchange-traded futures, which generally are standardized as to maturity date, underlying financial instrument, and other contract terms. Upon entering into a futures contract, the fund is required to deposit with the broker cash or securities in an amount equal to a certain percentage of the contract value (initial margin deposit); the margin deposit must then be maintained at the established level over the life of the contract. Subsequent payments are made or received by the fund each day to settle daily fluctuations in the value of the contract (variation margin), which reflect changes in the value of the underlying financial instrument. Variation margin is recorded as unrealized gain or loss until the contract is closed. The value of a futures contract included in net assets is the amount of unsettled variation margin; net variation margin receivable is reflected as an asset, and net variation margin payable is reflected as a liability on the accompanying Statement of Assets and Liabilities. Risks related to the use of futures contracts include possible illiquidity of the futures markets, contract prices that can be highly volatile and imperfectly correlated to movements in hedged security values and/or interest rates, and potential losses in excess of the fund’s initial investment. During the six months ended August 31, 2010, the fund’s exposure to futures, based on underlying notional amounts, was generally between 1% and 2% of net assets.
NOTE 4 - OTHER INVESTMENT TRANSACTIONS
Consistent with its investment objective, the fund engages in the following practices to manage exposure to certain risks and/or to enhance performance. The investment objective, policies, program, and risk factors of the fund are described more fully in the fund’s prospectus and Statement of Additional Information.
Noninvestment-Grade Debt Securities At August 31, 2010, approximately 41% of the fund’s net assets were invested, either directly or through its investment in T. Rowe Price institutional funds, in noninvestment-grade debt securities, commonly referred to as “high yield” or “junk” bonds. The noninvestment-grade bond market may experience sudden and sharp price swings due to a variety of factors, including changes in economic forecasts, stock market activity, large sustained sales by major investors, a high-profile default, or a change in the market’s psychology. These events may decrease the ability of issuers to make principal and interest payments and adversely affect the liquidity or value, or both, of such securities.
Restricted Securities The fund may invest in securities that are subject to legal or contractual restrictions on resale. Prompt sale of such securities at an acceptable price may be difficult and may involve substantial delays and additional costs.
Residual-Interest Bonds During the six months ended August 31, 2010, the fund held residual-interest bonds (RIBs) purchased from third-party special purpose trusts, which securitize an underlying bond into RIBs and short-term floating rate bonds. RIBs generally are entitled to the cash flows of the underlying bond that remain after payment of amounts due to the floating rate bondholders and trust-related fees; they also generally have the right to acquire the underlying bond from the trust. RIBs can only be traded in accordance with Rule 144A of the Securities Act of 1933 and cannot be offered for public resale. Risks arise from changes in interest rates and the value of the underlying bond, and the sale of the RIBs may involve delay or additional costs.
Other Purchases and sales of portfolio securities other than short-term securities aggregated $215,941,000 and $122,311,000, respectively, for the six months ended August 31, 2010.
NOTE 5 - FEDERAL INCOME TAXES
No provision for federal income taxes is required since the fund intends to continue to qualify as a regulated investment company under Subchapter M of the Internal Revenue Code and distribute to shareholders all of its income and gains. Distributions determined in accordance with federal income tax regulations may differ in amount or character from net investment income and realized gains for financial reporting purposes. Financial reporting records are adjusted for permanent book/tax differences to reflect tax character but are not adjusted for temporary differences. The amount and character of tax-basis distributions and composition of net assets are finalized at fiscal year-end; accordingly, tax-basis balances have not been determined as of the date of this report.
In accordance with federal tax regulations, the fund recognized capital losses in the current period for tax purposes that had been recognized in the prior fiscal year for financial reporting purposes. Such deferrals relate to net capital losses realized between November 1, 2009 and February 28, 2010, and totaled $227,000. The fund intends to retain realized gains to the extent of available capital loss carryforwards. As of February 28, 2010, the fund had $27,819,000 of unused capital loss carryforwards, which expire: $8,610,000 in fiscal 2011, $61,000 in fiscal 2014, $6,657,000 in fiscal 2017, and $12,491,000 in fiscal 2018.
At August 31, 2010, the cost of investments for federal income tax purposes was $1,925,606,000. Net unrealized loss aggregated $4,473,000 at period-end, of which $105,112,000 related to appreciated investments and $109,585,000 related to depreciated investments.
NOTE 6 - RELATED PARTY TRANSACTIONS
The fund is managed by T. Rowe Price Associates, Inc. (the manager of Price Associates), a wholly owned subsidiary of T. Rowe Price Group, Inc. The investment management agreement between the fund and the manager provides for an annual investment management fee, which is computed daily and paid monthly. The fee consists of an individual fund fee, equal to 0.30% of the fund’s average daily net assets, and a group fee. The group fee rate is calculated based on the combined net assets of certain mutual funds sponsored by Price Associates (the group) applied to a graduated fee schedule, with rates ranging from 0.48% for the first $1 billion of assets to 0.285% for assets in excess of $220 billion. The fund’s group fee is determined by applying the group fee rate to the fund’s average daily net assets. At August 31, 2010, the effective annual group fee rate was 0.30%.
In addition, the fund has entered into service agreements with Price Associates and a wholly owned subsidiary of Price Associates (collectively, Price). Price Associates computes the daily share price and provides certain other administrative services to the fund. T. Rowe Price Services, Inc., provides shareholder and administrative services in its capacity as the fund’s transfer and dividend disbursing agent. For the six months ended August 31, 2010, expenses incurred pursuant to these service agreements were $75,000 for Price Associates and $203,000 for T. Rowe Price Services, Inc. The total amount payable at period-end pursuant to these service agreements is reflected as Due to Affiliates in the accompanying financial statements.
| INFORMATION ON PROXY VOTING POLICIES, PROCEDURES, AND RECORDS |
A description of the policies and procedures used by T. Rowe Price funds and portfolios to determine how to vote proxies relating to portfolio securities is available in each fund’s Statement of Additional Information, which you may request by calling 1-800-225-5132 or by accessing the SEC’s website, www.sec.gov. The description of our proxy voting policies and procedures is also available on our website, www.troweprice.com. To access it, click on the words “Our Company” at the top of our corporate homepage. Then, when the next page appears, click on the words “Proxy Voting Policies” on the left side of the page.
Each fund’s most recent annual proxy voting record is available on our website and through the SEC’s website. To access it through our website, follow the directions above, then click on the words “Proxy Voting Records” on the right side of the Proxy Voting Policies page.
| HOW TO OBTAIN QUARTERLY PORTFOLIO HOLDINGS |
The fund files a complete schedule of portfolio holdings with the Securities and Exchange Commission for the first and third quarters of each fiscal year on Form N-Q. The fund’s Form N-Q is available electronically on the SEC’s website (www.sec.gov); hard copies may be reviewed and copied at the SEC’s Public Reference Room, 450 Fifth St. N.W., Washington, DC 20549. For more information on the Public Reference Room, call 1-800-SEC-0330.
| APPROVAL OF INVESTMENT MANAGEMENT AGREEMENT |
On March 9, 2010, the fund’s Board of Directors (Board) unanimously approved the continuation of the investment advisory contract (Contract) between the fund and its investment manager, T. Rowe Price Associates, Inc. (Adviser). The Board considered a variety of factors in connection with its review of the Contract, also taking into account information provided by the Adviser during the course of the year, as discussed below:
Services Provided by the Adviser
The Board considered the nature, quality, and extent of the services provided to the fund by the Adviser. These services included, but were not limited to, management of the fund’s portfolio and a variety of related activities, as well as financial and administrative services, reporting, and communications. The Board also reviewed the background and experience of the Adviser’s senior management team and investment personnel involved in the management of the fund. The Board concluded that it was satisfied with the nature, quality, and extent of the services provided by the Adviser.
Investment Performance of the Fund
The Board reviewed the fund’s average annual total returns over the 1-, 3-, 5-, and 10-year periods, as well as the fund’s year-by-year returns, and compared these returns with a wide variety of previously agreed upon comparable performance measures and market data, including those supplied by Lipper and Morningstar, which are independent providers of mutual fund data. On the basis of this evaluation and the Board’s ongoing review of investment results, and factoring in the severity of the market turmoil during 2008 and 2009, the Board concluded that the fund’s performance was satisfactory.
Costs, Benefits, Profits, and Economies of Scale
The Board reviewed detailed information regarding the revenues received by the Adviser under the Contract and other benefits that the Adviser (and its affiliates) may have realized from its relationship with the fund, including research received under “soft dollar” agreements and commission-sharing arrangements with broker-dealers. The Board considered that the Adviser may receive some benefit from its soft-dollar arrangements pursuant to which it receives research from broker-dealers that execute the applicable fund’s portfolio transactions. The Board also received information on the estimated costs incurred and profits realized by the Adviser and its affiliates from advising T. Rowe Price mutual funds, as well as estimates of the gross profits realized from managing the fund in particular. The Board concluded that the Adviser’s profits were reasonable in light of the services provided to the fund. The Board also considered whether the fund or other funds benefit under the fee levels set forth in the Contract from any economies of scale realized by the Adviser. Under the Contract, the fund pays a fee to the Adviser composed of two components—a group fee rate based on the aggregate assets of certain T. Rowe Price mutual funds (including the fund) that declines at certain asset levels and an individual fund fee rate that is assessed on the assets of the fund. The Board concluded that the advisory fee structure for the fund continued to provide for a reasonable sharing of benefits from any economies of scale with the fund’s investors.
Fees
The Board reviewed the fund’s management fee rate, operating expenses, and total expense ratio and compared them with fees and expenses of other comparable funds based on information and data supplied by Lipper. The information provided to the Board indicated that the fund’s management fee rate was at or above the median for comparable funds and the fund’s total expense ratio was at or below the median for comparable funds. The Board also reviewed the fee schedules for institutional accounts of the Adviser and its affiliates with smaller mandates. Management informed the Board that the Adviser’s responsibilities for institutional accounts are more limited than its responsibilities for the fund and other T. Rowe Price mutual funds that it or its affiliates advise and that the Adviser performs significant additional services and assumes greater risk for the fund and other T. Rowe Price mutual funds that it advises than it does for institutional accounts. On the basis of the information provided, the Board concluded that the fees paid by the fund under the Contract were reasonable.
Approval of the Contract
As noted, the Board approved the continuation of the Contract. No single factor was considered in isolation or to be determinative to the decision. Rather, the Board was assisted by the advice of independent legal counsel and concluded, in light of a weighting and balancing of all factors considered, that it was in the best interests of the fund to approve the continuation of the Contract, including the fees to be charged for services thereunder.
Item 2. Code of Ethics.
A code of ethics, as defined in Item 2 of Form N-CSR, applicable to its principal executive officer, principal financial officer, principal accounting officer or controller, or persons performing similar functions is filed as an exhibit to the registrant’s annual Form N-CSR. No substantive amendments were approved or waivers were granted to this code of ethics during the registrant’s most recent fiscal half-year.
Item 3. Audit Committee Financial Expert.
Disclosure required in registrant’s annual Form N-CSR.
Item 4. Principal Accountant Fees and Services.
Disclosure required in registrant’s annual Form N-CSR.
Item 5. Audit Committee of Listed Registrants.
Not applicable.
Item 6. Investments.
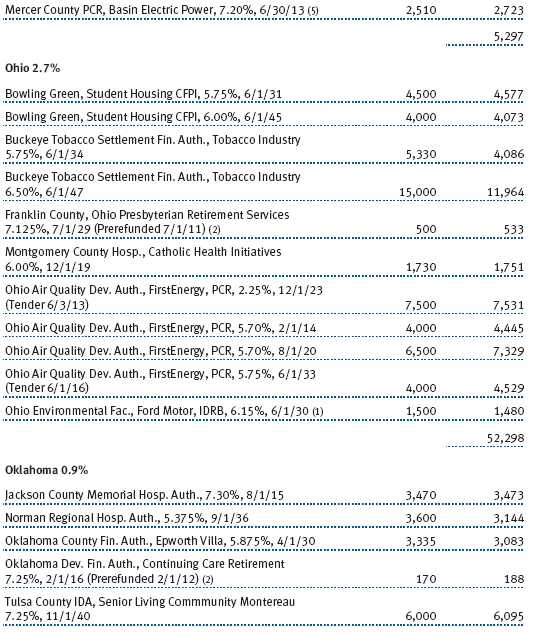
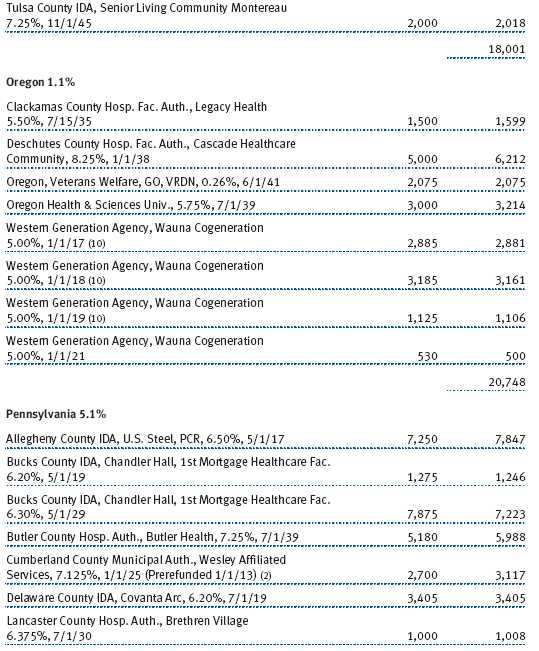
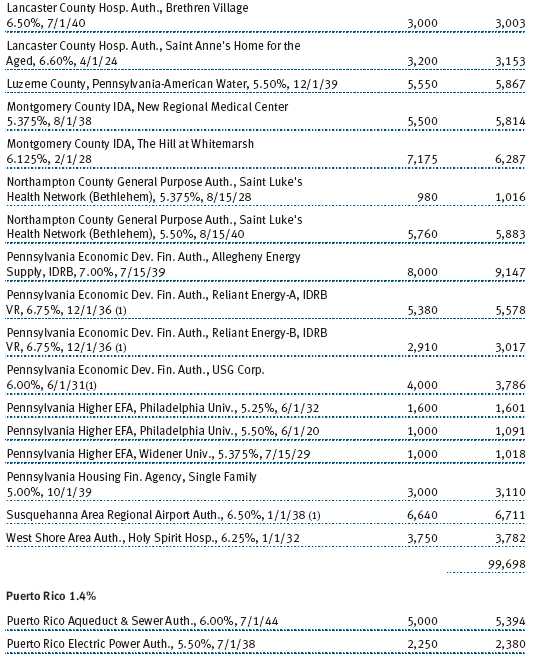
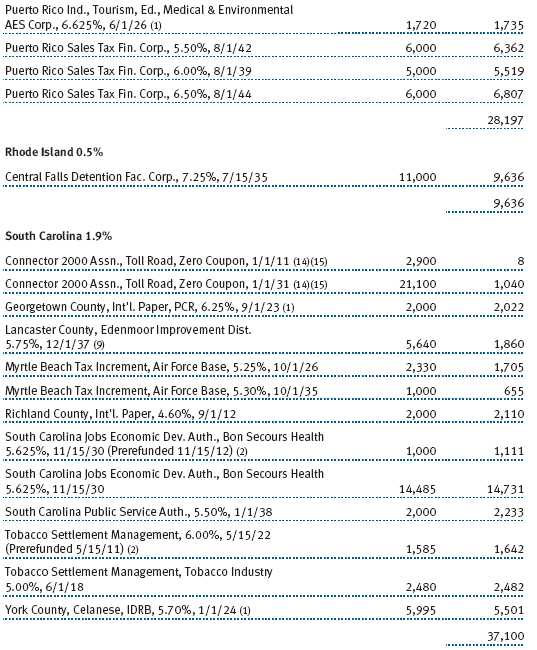
(a) Not applicable. The complete schedule of investments is included in Item 1 of this Form N-CSR.
(b) Not applicable.
Item 7. Disclosure of Proxy Voting Policies and Procedures for Closed-End Management Investment Companies.
Not applicable.
Item 8. Portfolio Managers of Closed-End Management Investment Companies.
Not applicable.
Item 9. Purchases of Equity Securities by Closed-End Management Investment Company and Affiliated Purchasers.
Not applicable.
Item 10. Submission of Matters to a Vote of Security Holders.
Not applicable.
Item 11. Controls and Procedures.
(a) The registrant’s principal executive officer and principal financial officer have evaluated the registrant’s disclosure controls and procedures within 90 days of this filing and have concluded that the registrant’s disclosure controls and procedures were effective, as of that date, in ensuring that information required to be disclosed by the registrant in this Form N-CSR was recorded, processed, summarized, and reported timely.
(b) The registrant’s principal executive officer and principal financial officer are aware of no change in the registrant’s internal control over financial reporting that occurred during the registrant’s second fiscal quarter covered by this report that has materially affected, or is reasonably likely to materially affect, the registrant’s internal control over financial reporting.
Item 12. Exhibits.
(a)(1) The registrant’s code of ethics pursuant to Item 2 of Form N-CSR is filed with the registrant’s annual Form N-CSR.
(2) Separate certifications by the registrant's principal executive officer and principal financial officer, pursuant to Section 302 of the Sarbanes-Oxley Act of 2002 and required by Rule 30a-2(a) under the Investment Company Act of 1940, are attached.
(3) Written solicitation to repurchase securities issued by closed-end companies: not applicable.
(b) A certification by the registrant's principal executive officer and principal financial officer, pursuant to Section 906 of the Sarbanes-Oxley Act of 2002 and required by Rule 30a-2(b) under the Investment Company Act of 1940, is attached.
| | |
SIGNATURES |
| |
| | Pursuant to the requirements of the Securities Exchange Act of 1934 and the Investment |
| Company Act of 1940, the registrant has duly caused this report to be signed on its behalf by the |
| undersigned, thereunto duly authorized. |
| |
| T. Rowe Price Tax-Free High Yield Fund, Inc. |
| |
| |
| |
| By | /s/ Edward C. Bernard |
| | Edward C. Bernard |
| | Principal Executive Officer |
| |
| Date | October 18, 2010 |
| |
| |
| |
| | Pursuant to the requirements of the Securities Exchange Act of 1934 and the Investment |
| Company Act of 1940, this report has been signed below by the following persons on behalf of |
| the registrant and in the capacities and on the dates indicated. |
| |
| |
| By | /s/ Edward C. Bernard |
| | Edward C. Bernard |
| | Principal Executive Officer |
| |
| Date | October 18, 2010 |
| |
| |
| |
| By | /s/ Gregory K. Hinkle |
| | Gregory K. Hinkle |
| | Principal Financial Officer |
| |
| Date | October 18, 2010 |