| UNITED STATES |
| SECURITIES AND EXCHANGE COMMISSION |
| Washington, D.C. 20549 |
| |
FORM N-CSR |
| |
CERTIFIED SHAREHOLDER REPORT OF REGISTERED |
MANAGEMENT INVESTMENT COMPANIES |
| |
| |
| |
| Investment Company Act File Number: 811-4163 |
|
| |
| T. Rowe Price Tax-Free High Yield Fund, Inc. |
|
| (Exact name of registrant as specified in charter) |
| |
| 100 East Pratt Street, Baltimore, MD 21202 |
|
| (Address of principal executive offices) |
| |
| David Oestreicher |
| 100 East Pratt Street, Baltimore, MD 21202 |
|
| (Name and address of agent for service) |
| |
| |
| Registrant’s telephone number, including area code: (410) 345-2000 |
| |
| |
| Date of fiscal year end: February 28 |
| |
| |
| Date of reporting period: August 31, 2011 |
Item 1: Report to Shareholders| Tax-Free High Yield Fund | August 31, 2011 |
The views and opinions in this report were current as of August 31, 2011. They are not guarantees of performance or investment results and should not be taken as investment advice. Investment decisions reflect a variety of factors, and the managers reserve the right to change their views about individual stocks, sectors, and the markets at any time. As a result, the views expressed should not be relied upon as a forecast of the fund’s future investment intent. The report is certified under the Sarbanes-Oxley Act, which requires mutual funds and other public companies to affirm that, to the best of their knowledge, the information in their financial reports is fairly and accurately stated in all material respects.
REPORTS ON THE WEB
Sign up for our E-mail Program, and you can begin to receive updated fund reports and prospectuses online rather than through the mail. Log in to your account at troweprice.com for more information.
Manager’s Letter
Fellow Shareholders
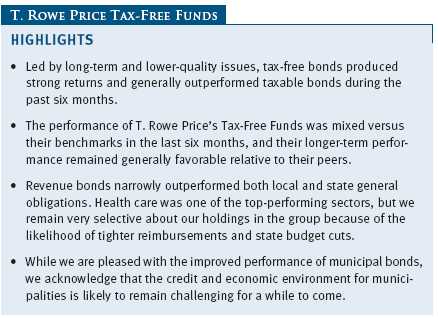
Led by long-term and lower-quality issues, tax-free municipal bonds produced strong returns and generally outperformed taxable bonds in the six-month period ended August 31, 2011. Several factors drove performance, including a significant year-over-year decline in municipal issuance, tumbling Treasury yields tied to sluggish economic growth, and the Federal Reserve’s intention to keep short-term interest rates very low for two more years. In addition, investor confidence in munis increased as dire predictions about massive municipal defaults in 2011 proved to be alarmist. The performance of T. Rowe Price’s Tax-Free Funds was mixed versus their benchmarks in the last six months, and their longer-term relative performance remained favorable.
MARKET ENVIRONMENT
Economic growth thus far in 2011 has been disappointing. After a strong start to the year, job growth faltered in the spring and the national unemployment rate remains stubbornly high around 9%. Also, the housing market continues to languish at depressed levels. With commodity prices somewhat elevated—though generally lower than they were in the spring—and economic prospects in the U.S. and Europe uncertain, consumers have been reluctant to increase their spending, and many businesses have restrained their expansion plans.
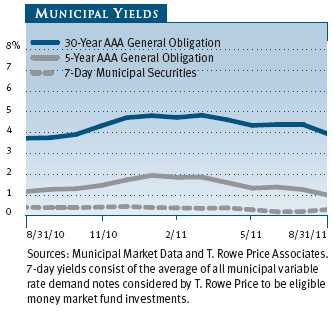
Despite the end of the Federal Reserve’s second round of quantitative easing and S&P’s recent downgrade of the U.S. government’s long-term sovereign credit rating, intermediate- and long-term Treasury interest rates fell sharply over the last six months, approaching historic lows amid renewed fears of a double-dip recession. Municipal yields also declined, but to a lesser extent. The Fed acknowledged the fragility of the economy and indicated that it would likely keep the fed funds target rate in the 0.00% to 0.25% range—which has been in place since December 2008—until at least mid-2013. As our reporting period closed, Fed Chairman Ben Bernanke indicated that the central bank would contemplate the possible deployment of additional tools to stimulate the economy.
With long-term municipal yields higher than comparable Treasury yields, long-term tax-free securities are a very attractive alternative, particularly for investors in the highest tax brackets. For example, as of August 31, 2011, the 3.89% yield offered by a 30-year tax-free municipal bond rated AAA was about 108% of the 3.60% pretax yield offered by a 30-year Treasury. An investor in the 28% federal tax bracket would need to invest in a taxable bond yielding about 5.40% in order to receive the same after-tax income. (To calculate a municipal bond’s taxable-equivalent yield, divide the municipal bond’s yield by the quantity of 1.00 minus your federal tax bracket expressed as a decimal—in this case, 1.00 – 0.28, or 0.72.)
MUNICIPAL MARKET NEWS
Municipal issuance thus far in 2011 totaled only about $163 billion, according to The Bond Buyer, well below the brisk pace of the last few years. Contributing factors include the absence of the Build America Bond program, which led to increased issuance in 2009–2010 but expired last December, and a pervasive sentiment toward fiscal austerity. Demand for municipal securities has been weak for much of the last six months but has been improving due to increased interest from individual investors and some nontraditional investors purchasing munis directly. Cash flows into municipal bond funds were mostly negative throughout our reporting period, reflecting the weakening economic outlook and some concerns about prevailing low yields.
Many states continue to face fiscal difficulties and have been forced to raise taxes and fees and cut spending to close budget deficits. We believe many states deserve the high ratings they have been given by the major credit rating agencies, and we do not see a near-term threat to their ability to service their outstanding debts. However, we do have longer-term concerns about potentially onerous future pension obligations and other retirement benefits. In any event, the fiscal woes of state governments do not necessarily limit our tax-free investment opportunities. There are thousands of unique municipal issuers in a variety of sectors, many of which also have good credit profiles.
Finally, the municipal market continues to show remarkable resilience in the face of a steady drumbeat of negative publicity, negative cash flow, and political challenges to tax exemption. In the last six months, every major municipal bond sector produced strong gains, led by long-term and lower-quality issues—a remarkable recovery from their poor performance at the end of 2010. Revenue bonds narrowly outperformed both local and state general obligations (GOs). Among revenue bonds, health care was one of the top-performing sectors, as hospitals are adjusting to new fiscal realities and last year’s health care reform legislation. We remain cautious and very selective on health care because of the likelihood of tighter reimbursements and state budget cuts that could affect Medicaid payments to providers. Medicaid and Medicare could also be targets for federal spending cuts. Tobacco bonds did very well due to rumors of a possible legal settlement that may result in a significant lump-sum payment from tobacco companies to the states. We continue to underweight this sector because of declining long-term tobacco consumption trends. Solid waste bonds lagged modestly but still produced good returns in absolute terms.
PORTFOLIO STRATEGY
TAX-EXEMPT MONEY FUND
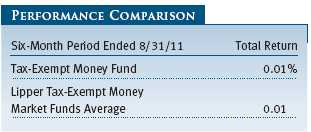
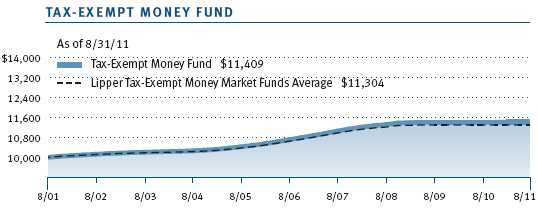
The fund returned 0.01% during the six-month period ended August 31, 2011, which was in line with the performance of the Lipper Tax-Exempt Money Market Funds Average. All money market rates continue to be closely tied to the Federal Reserve’s fed funds target rate of 0.00% to 0.25%.
With volatile financial markets, the European debt crisis, uncertainty over U.S. debt obligations, and a sputtering economy all serving as backdrop, investors showed a preference for the safety and quality that money funds provide. The result has been a continuing push to lower rates in money markets.
A quick survey of the broader money market demonstrates the rate environment in which money funds operate today. Despite concerns over the debt ceiling extension in August, the Treasury bill market continues to exhibit demand for quality and liquidity; six-month bills now yield 0.03%, while one-year bills yield 0.09%. The benchmark 90-day LIBOR rate moved as low as 0.25% before recovering somewhat to 0.33% as the six-month period ended.
Municipal money market rates continue to follow the pattern of the broader money markets. Rates across the municipal curve are lower by about 10 basis points (100 basis points equal one percentage point) compared with six months ago. Overnight rates averaged 0.12% in the most recent six-month period, while seven-day rates averaged 0.17% during the same period. Ninety-day commercial paper rates averaged 0.22%, while one-year note yields averaged 0.29%.
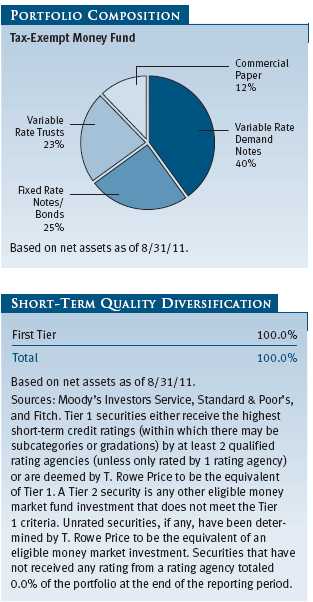
Credit quality remains a primary focus in the portfolio—in terms of both the municipal issuers themselves and the various bank guarantors that provide liquidity support to municipal debt. The fiscal issues facing many states, such as California and Illinois, continue to keep such issuers out of our portfolio. Our investments continue to focus on higher-quality hospital systems, GOs, and the education sector. Since much of the short-term municipal market requires some form of bank support, we look to only the highest-quality banks for such backing; the ongoing problems facing some bank guarantors, such as French bank Dexia, have caused us to eliminate positions where that bank serves as liquidity provider.
The Federal Reserve has communicated to the market that it intends to maintain the current fed funds target rate well into 2013. For money fund investors, the prospect for higher income continues to be deferred. Still, investors clearly rely on their fund investments as a source of stability in uncertain markets and a ready source of liquidity. Our focus on such goals remains unchanged throughout this challenging period.
TAX-FREE SHORT-INTERMEDIATE FUND
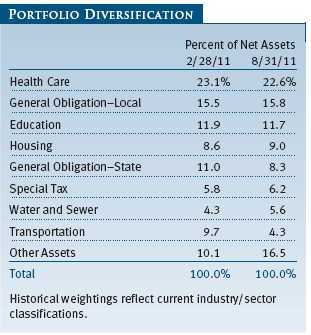
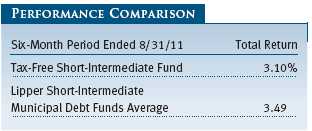
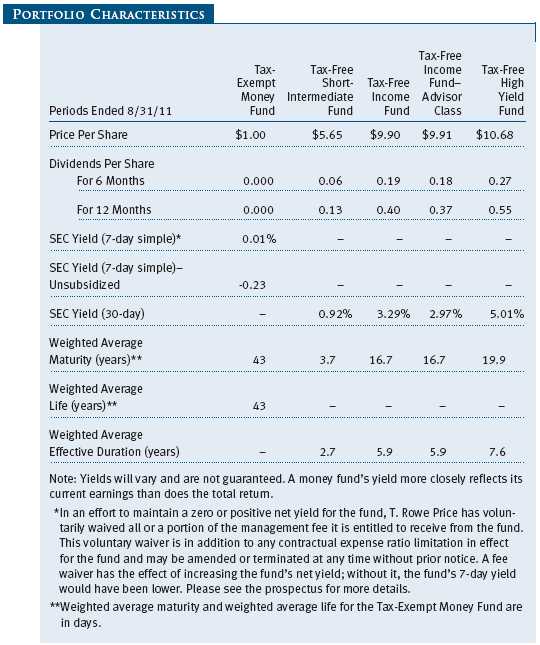
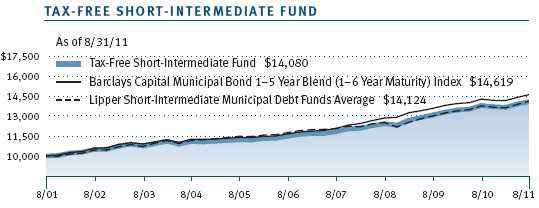
The fund returned 3.10% during the six months ended August 31, 2011, compared with 3.49% for the Lipper Short-Intermediate Municipal Debt Funds Average, which measures the performance of competing funds. The fund’s net asset value per share was $5.65 at the end of August, up from $5.54 at the end of February. Dividends per share contributed $0.06 to the fund’s total return.
During the past six months, we were overweight in cash and short-term bonds that mature within a year; we also maintained underweight positions in securities maturing in the three- to five-year range, while overweighting 7- to 10-year bonds. Regarding sector positioning, we had an overweight exposure to revenue bonds relative to our benchmark, and we remained underweight in GO and high-quality prere-funded bonds.

Our positioning along the yield curve (see the Glossary for a definition) and our sector allocations benefited the fund’s relative return, but our security selection within the broad revenue and GO sectors was detrimental. Specifically, within the GO universe, we avoided Illinois and were underweight in California securities as both had performed poorly in 2010. During the past six months, however, they rebounded sharply. In addition, our revenue bond holdings, including hospital and industrial development bonds, did not perform as well as others in the group.
During the months preceding the reporting period, the market experienced significant turmoil due to abundant issuance and concerns over municipal credit quality, which resulted in wider yield spreads between higher- and lower-quality bonds. The past six months have been quite different. New issuance so far has been running about 35% less than last year, and many states have balanced their short-term budget shortfalls. To the extent we did not add to the securities with the widest yield spreads, our returns during the past six months lagged as buyers entered the market and drove those yields lower. Some of the tightening was warranted by real progress on balancing budgets and addressing long-term structural issues. In other cases, we believe the yield spread tightening was technical, driven by the lack of municipal supply. We will remain diligent in our selection of credits that we believe can sustain economic volatility and will not get caught up investing in credits that appear to have fundamental problems simply because they are undervalued in the market.
TAX-FREE INCOME FUND
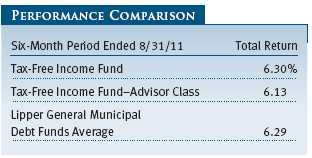
Your fund returned 6.30% during the past six months, in line with the 6.29% return for the Lipper General Municipal Debt Funds Average. (Performance for the Advisor Class was somewhat lower, reflecting its different fee structure.) The fund’s net asset value per share was $9.90 at the end of August compared with $9.50 six months earlier. Dividends per share contributed $0.19 to the fund’s total return during the past six months.
The fund’s yield curve positioning did not materially change since our last report. An overweight in both the long and short end reflected a barbell structure relative to the Barclays Capital Municipal Bond Index. Our overweight in bonds with maturities of greater than 20 years enhanced performance during the reporting period. The fund’s return likely would have been higher with greater exposure to intermediate-term bonds instead of the short end of the spectrum, as the steep yield curve offered a greater opportunity. Our strategy was based on our outlook that intermediates could be vulnerable to rising rates, which did not come to pass. We kept the fund’s duration (see the Glossary for a definition) slightly longer than that of the benchmark. Nevertheless, the overall duration declined as market rates moved lower and many holdings priced to their call dates rather than to their maturities. The portfolio’s weighted average maturity, however, lengthened by almost a year to 16.7 years.
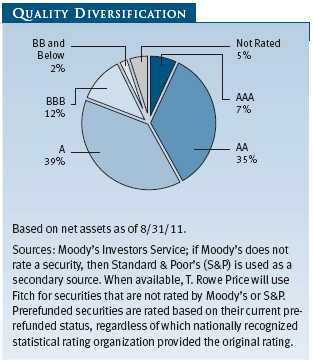
There was a slight shift in the fund’s overall quality diversification. AAA rated securities declined by 7% since our last report, due primarily to two factors. One was S&P’s downgrade of U.S. Treasuries, which also triggered downgrades on prerefunded bonds to AA+. Additionally, we decreased the fund’s holdings in money market instruments that carry AAA ratings. Hence, the fund’s composition in both AA and A rated securities increased. More than 80% of the portfolio remains A rated and higher.
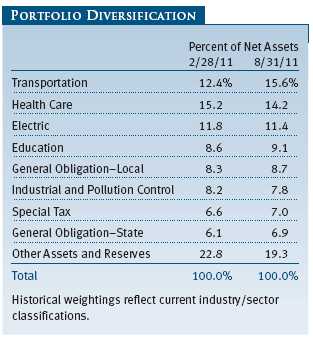
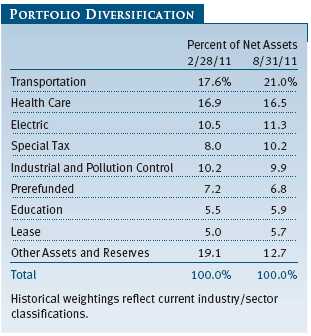
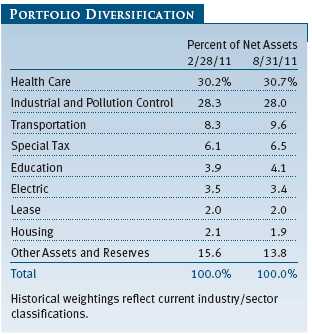
There were no material shifts in the fund’s sector composition, with the transportation sector remaining the largest at 21% of the portfolio. Airports and toll roads compose a large portion of this sector. The health care and electric sectors round out the top three. We have maintained an underweight bias in local and state GO debt, as budget challenges are likely to continue and our outlook calls for new issuance to rise.
Fund holdings that performed best were dominated by longer maturities that offered higher yields. A rated and BBB rated securities in particular, including hospital and transportation sectors, produced strong returns as they bounced back from weak demand and attractive valuations earlier in the year. Laggards consisted mainly of short maturities inside of three years and proved to be a drag on results.
TAX-FREE HIGH YIELD FUND
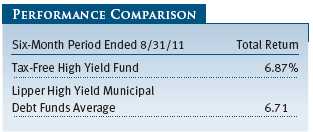
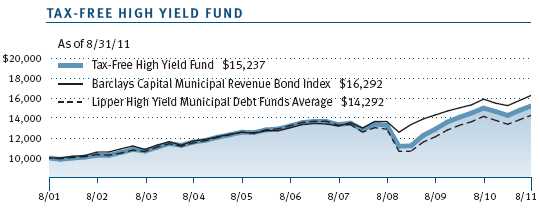
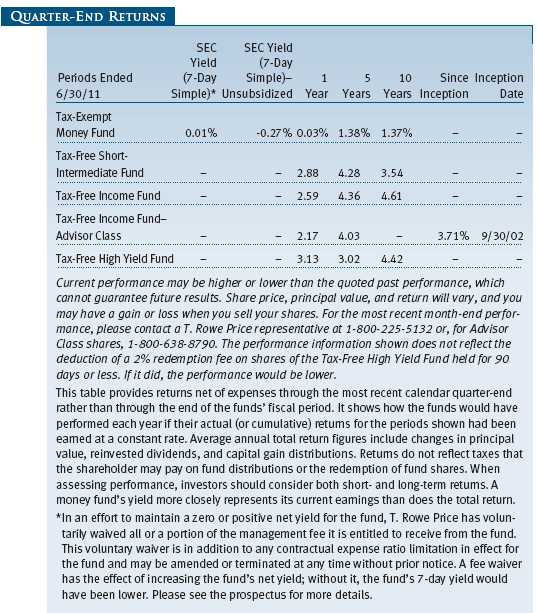
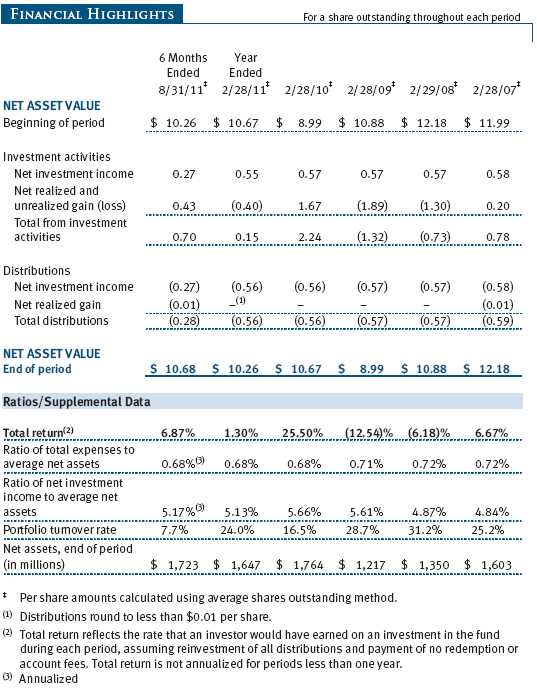
The Tax-Free High Yield Fund returned 6.87% during the period compared with 6.71% for the Lipper High Yield Municipal Debt Funds Average, which measures the performance of similar funds. The fund’s net asset value per share was $10.68 at the end of August, compared with $10.26 at the end of February, and dividends per share contributed $0.27 to the fund’s total return.
The environment for medium- and lower-quality municipals improved sharply during the period, as scarcity of new issue supply and improved investor demand buoyed prices. Investor confidence returned to the market, as concerns over widespread municipal defaults proved overblown.
We maintained significant exposure to bonds backed by corporations (industrial development/pollution control bonds). Following the recession, many corporations have maintained conservative credit profiles and solid balance sheets, thus enhancing creditworthiness for bondholders. Additionally, yields for many corporate borrowers in the tax-exempt market have exceeded those in the taxable market—for the same borrower. This valuation anomaly has offered an unusual opportunity for individual investors, especially those in high tax brackets.
We also had considerable holdings in health care-related bonds. Concerns about state reimbursement and federal health care reform have pushed risk premiums of hospital bonds to historically high levels. However, many hospitals—especially large, diversified systems—maintain strong balance sheets and solid operations. We remain focused on hospital systems with high market share and a payer mix tilted toward private insurance companies to help mitigate expected reimbursement cuts. Credit metrics for many of our life care revenue bonds improved during the period, as management teams adjusted their offerings to meet a changing retirement marketplace.
We added to our airport revenue holdings during the period. These facilities provide an essential public service and often benefit from limited geographic competition. Airports actively issued bonds in 2009 and 2010. In many cases, interest on bonds of this vintage is not subject to the alternative minimum tax, enhancing the value of these issues. We took advantage of this spate of supply, and we are comfortable with airport credits in this economic environment.
The fund remained conservatively positioned in tobacco securitization and real estate bonds during the period. In July, tobacco bonds rallied on speculation about a long-term settlement between the states and tobacco companies regarding market share loss to cigarette manufacturers not bound by the Master Settlement Agreement. More recently, however, these structured bonds were downgraded by rating agencies, as tobacco consumption has declined at a faster rate than originally contemplated. Real estate-backed debt continued to languish, especially in Florida and Nevada, due to challenging housing fundamentals.
Medium- and lower-quality munis enjoyed a period of recovery over the past six months as investors shook off lingering default fears and returned to the traditionally safe tax-exempt market. While economic and pension/benefit concerns persist in the muni market, state and local governments have acted to address many issues. Moreover, while more adjustments are needed, default rates in municipals remain among the lowest in the fixed income markets. Given this backdrop, we will rely on our proven, research-intensive process to uncover viable, long-term investment opportunities in our area of the market.
OUTLOOK
While we are pleased with the improved performance of and sentiment toward municipal bonds, we acknowledge that the credit and economic environment for municipalities is likely to remain challenging. The slow economic recovery, the housing market downturn, and high unemployment have reduced the tax revenues collected by state and local governments from their peaks. Municipal bond defaults, which historically have been rare, could increase moderately. Defaults thus far have been mostly limited to the smallest issuers in the riskiest of sectors, such as land-backed, multifamily housing, or hospitals. Income and sales tax revenues have begun to increase, providing some support for state governments. On the other hand, cutbacks in state support and persisting declines in property tax revenues will keep local municipal issuers vulnerable. If the economy slides back into a recession—which we are not currently predicting—municipalities will face even tougher challenges.
State and local government liabilities, such as pension benefits and health care costs, are a growing long-term concern. Maintaining balanced budgets and addressing these long-term issues require careful and dedicated work by state and local officials. Many issuers are trying to make the difficult but necessary fiscal decisions as they adjust to high unemployment, slow economic growth, lower tax revenues, and other tough conditions. These efforts need to continue, with or without additional federal government assistance.
While it is true that S&P downgraded several thousand municipal issues directly linked to U.S. Treasuries (such as prerefunded bonds) shortly after downgrading the U.S. government’s long-term credit rating, we believe the municipal bond market is a high-quality market, with good opportunities for long-term investors. Shorter-term securities have unattractive absolute yields and could be vulnerable if the economy picks up unexpectedly, but longer-term and lower-rated investment-grade bonds continue to offer a reasonable yield advantage. We expect demand for munis to increase as fears of major municipal defaults wane and investors seek attractive tax-free income in an environment of low interest rates.
We believe T. Rowe Price’s strong credit research capabilities have been and will remain an asset for our investors. We continue to conduct our own thorough research and assign our independent credit ratings before making investment decisions. As always, we are on the lookout for attractively valued bonds issued by municipalities with good fundamentals—an investment strategy that has served our investors well in the past.
Thank you for investing with T. Rowe Price.
Respectfully submitted,

Joseph K. Lynagh
Chairman of the Investment Advisory Committee
Tax-Exempt Money Fund

Charles B. Hill
Chairman of the Investment Advisory Committee
Tax-Free Short-Intermediate Fund

Konstantine B. Mallas
Chairman of the Investment Advisory Committee
Tax-Free Income Fund

James M. Murphy
Chairman of the Investment Advisory Committee
Tax-Free High Yield Fund
September 16, 2011
The committee chairmen have day-to-day responsibility for managing the portfolios and work with committee members in developing and executing the funds’ investment programs.
RISKS OF FIXED INCOME INVESTING
Since money market funds are managed to maintain a constant $1.00 share price, there should be little risk of principal loss. However, there is no assurance the fund will avoid principal losses if fund holdings default or are downgraded or if interest rates rise sharply in an unusually short period. In addition, the fund’s yield will vary; it is not fixed for a specific period like the yield on a bank certificate of deposit. An investment in the fund is not insured or guaranteed by the Federal Deposit Insurance Corporation (FDIC) or any other government agency. Although a money market fund seeks to preserve the value of your investment at $1.00 per share, it is possible to lose money by investing in it.
Bonds are subject to interest rate risk (the decline in bond prices that usually accompanies a rise in interest rates) and credit risk (the chance that any fund holding could have its credit rating downgraded or that a bond issuer will default by failing to make timely payments of interest or principal), potentially reducing the fund’s income level and share price. High yield bonds could have greater price declines than funds that invest primarily in high-quality bonds. Municipalities issuing high yield bonds are not as strong financially as those with higher credit ratings, so the bonds are usually considered speculative investments. Some income may be subject to state and local taxes and the federal alternative minimum tax.
GLOSSARY
Barclays Capital Municipal Bond Index: An unmanaged index that tracks municipal debt instruments.
Barclays Capital Municipal Bond 1–5 Year Blend (1–6 Year Maturity) Index: A sub-index of the Barclays Capital Municipal Bond Index. It is a rules-based, market value-weighted index of short-term bonds engineered for the tax-exempt bond market.
Barclays Capital Municipal Revenue Bond Index: An unmanaged index that tracks municipal revenue bonds.
Basis point: One one-hundredth of one percentage point, or 0.01%.
Duration: A measure of a bond fund’s sensitivity to changes in interest rates. For example, a fund with a duration of five years would fall about 5% in price in response to a one-percentage-point rise in interest rates, and vice versa.
Federal funds rate: The interest rate charged on overnight loans of reserves by one financial institution to another in the United States. The Federal Reserve sets a target federal funds rate to affect the direction of interest rates.
General obligation debt: A government’s strongest pledge that obligates its full faith and credit, including, if necessary, its ability to raise taxes.
Investment grade: High-quality bonds as measured by one of the major credit rating agencies. For example, Standard & Poor’s designates the bonds in its top four categories (AAA to BBB) as investment grade.
LIBOR rate: The London Interbank Offered Rate, which is a benchmark for short-term taxable rates.
Lipper averages: The averages of available mutual fund performance returns for specified time periods in categories defined by Lipper.
Prerefunded bond: A bond that originally may have been issued as a general obligation or revenue bond but that is now secured by an escrow fund consisting entirely of direct U.S. government obligations that are sufficient for paying the bondholders.
SEC yield (7-day unsubsidized simple): A method of calculating a money fund’s yield by annualizing the fund’s net investment income for the last seven days of each period divided by the fund’s net asset value at the end of the period. Yield will vary and is not guaranteed.
SEC yield (30-day): A method of calculating a fund’s yield that assumes all portfolio securities are held until maturity. Yield will vary and is not guaranteed.
Weighted average life: A measure of a fund’s credit quality risk. In general, the longer the average life, the greater the fund’s credit quality risk. The average life is the dollar-weighted average maturity of a portfolio’s individual securities without taking into account interest rate readjustment dates. Money funds must maintain a weighted average life of less than 120 days.
Weighted average maturity: A measure of a fund’s interest rate sensitivity. In general, the longer the average maturity, the greater the fund’s sensitivity to interest rate changes. The weighted average maturity may take into account the interest rate readjustment dates for certain securities. Money funds must maintain a weighted average maturity of less than 60 days.
Yield curve: A graphic depiction of the relationship between yields and maturity dates for a set of similar securities such as Treasuries or municipal securities. Securities with longer maturities usually a have higher yield. If short-term securities offer a higher yield, then the curve is said to be “inverted.” If short- and long-term bonds are offering equivalent yields, then the curve is said to be “flat.”
Performance and Expenses
This chart shows the value of a hypothetical $10,000 investment in the fund over the past 10 fiscal year periods or since inception (for funds lacking 10-year records). The result is compared with benchmarks, which may include a broad-based market index and a peer group average or index. Market indexes do not include expenses, which are deducted from fund returns as well as mutual fund averages and indexes.
This chart shows the value of a hypothetical $10,000 investment in the fund over the past 10 fiscal year periods or since inception (for funds lacking 10-year records). The result is compared with benchmarks, which may include a broad-based market index and a peer group average or index. Market indexes do not include expenses, which are deducted from fund returns as well as mutual fund averages and indexes.

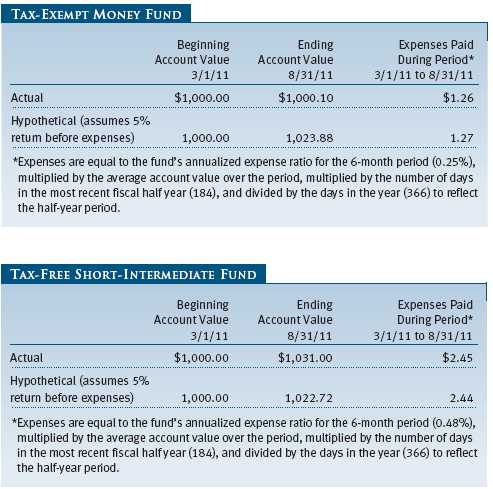
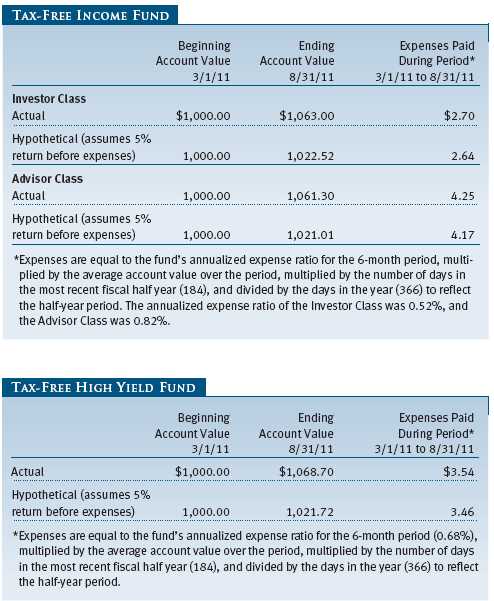
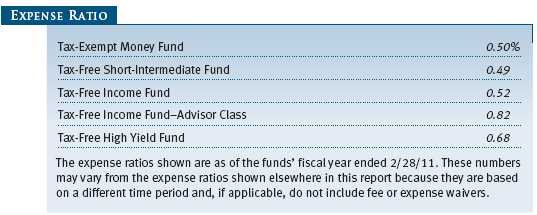
As a mutual fund shareholder, you may incur two types of costs: (1) transaction costs, such as redemption fees or sales loads, and (2) ongoing costs, including management fees, distribution and service (12b-1) fees, and other fund expenses. The following example is intended to help you understand your ongoing costs (in dollars) of investing in the fund and to compare these costs with the ongoing costs of investing in other mutual funds. The example is based on an investment of $1,000 invested at the beginning of the most recent six-month period and held for the entire period.
Actual Expenses
The first line of the following table (“Actual”) provides information about actual account values and actual expenses. You may use the information on this line, together with your account balance, to estimate the expenses that you paid over the period. Simply divide your account value by $1,000 (for example, an $8,600 account value divided by $1,000 = 8.6), then multiply the result by the number on the first line under the heading “Expenses Paid During Period” to estimate the expenses you paid on your account during this period.
Please note that the Tax-Free Income Fund has two share classes: The original share class (“investor class”) charges no distribution and service (12b-1) fee, and the Advisor Class shares are offered only through unaffiliated brokers and other financial intermediaries and charge a 0.25% 12b-1 fee. Each share class is presented separately in the table.
Hypothetical Example for Comparison Purposes
The information on the second line of the table (“Hypothetical”) is based on hypothetical account values and expenses derived from the fund’s actual expense ratio and an assumed 5% per year rate of return before expenses (not the fund’s actual return). You may compare the ongoing costs of investing in the fund with other funds by contrasting this 5% hypothetical example and the 5% hypothetical examples that appear in the shareholder reports of the other funds. The hypothetical account values and expenses may not be used to estimate the actual ending account balance or expenses you paid for the period.
Note: T. Rowe Price charges an annual account service fee of $20, generally for accounts with less than $10,000 ($1,000 for UGMA/UTMA). The fee is waived for any investor whose T. Rowe Price mutual fund accounts total $50,000 or more; accounts employing automatic investing; accounts electing to receive electronic delivery of account statements, transaction confirmations, and prospectuses and shareholder reports; accounts of an investor who is a T. Rowe Price Preferred Services, Personal Services, or Enhanced Personal Services client (enrollment in these programs generally requires T. Rowe Price assets of at least $100,000); and IRAs and other retirement plan accounts that utilize a prototype plan sponsored by T. Rowe Price (although a separate custodial or administrative fee may apply to such accounts). This fee is not included in the accompanying table. If you are subject to the fee, keep it in mind when you are estimating the ongoing expenses of investing in the fund and when comparing the expenses of this fund with other funds.
You should also be aware that the expenses shown in the table highlight only your ongoing costs and do not reflect any transaction costs, such as redemption fees or sales loads. Therefore, the second line of the table is useful in comparing ongoing costs only and will not help you determine the relative total costs of owning different funds. To the extent a fund charges transaction costs, however, the total cost of owning that fund is higher.
Unaudited
The accompanying notes are an integral part of these financial statements.
Unaudited


The accompanying notes are an integral part of these financial statements.
Unaudited

The accompanying notes are an integral part of these financial statements.
Unaudited
The accompanying notes are an integral part of these financial statements.
Unaudited

The accompanying notes are an integral part of these financial statements.
Unaudited
| NOTES TO FINANCIAL STATEMENTS |
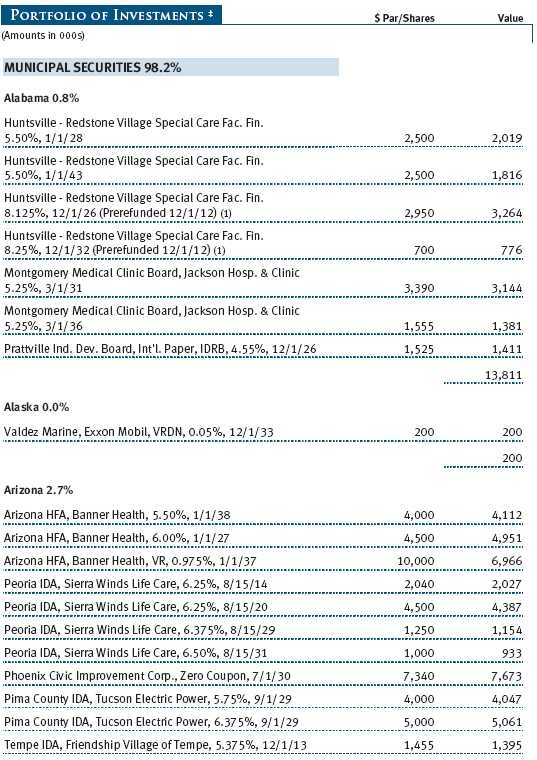
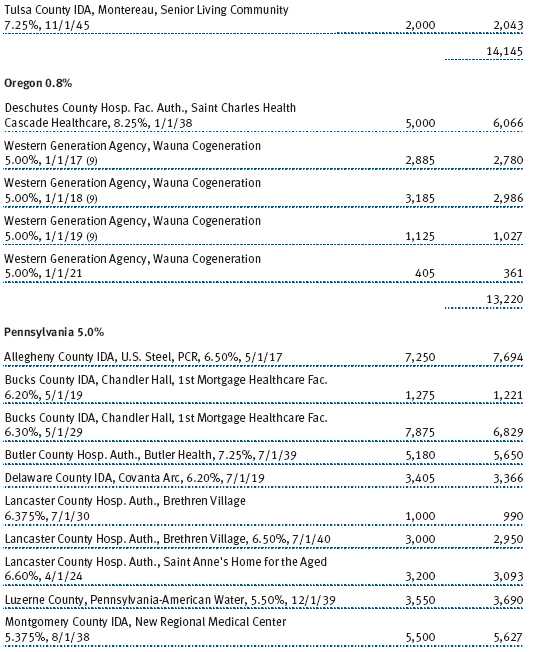
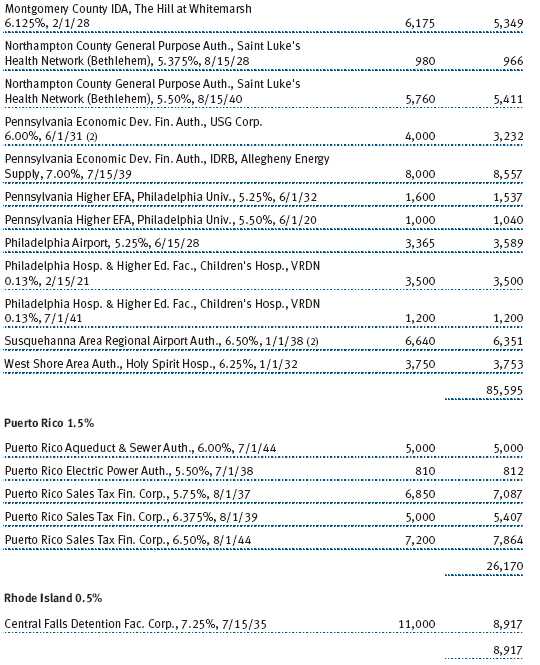
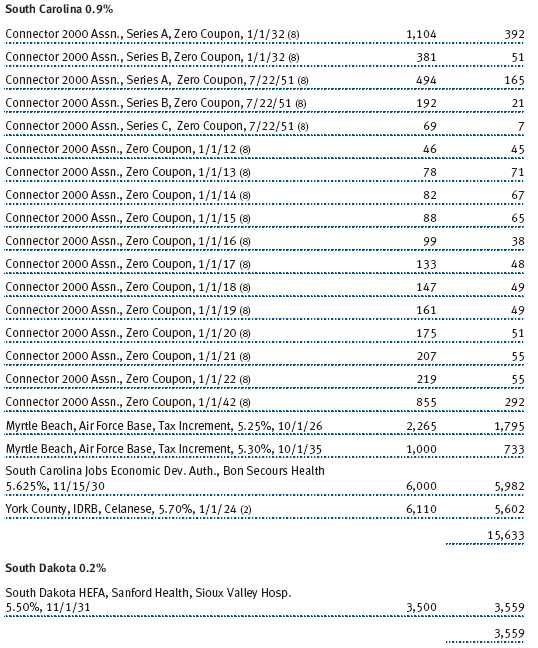
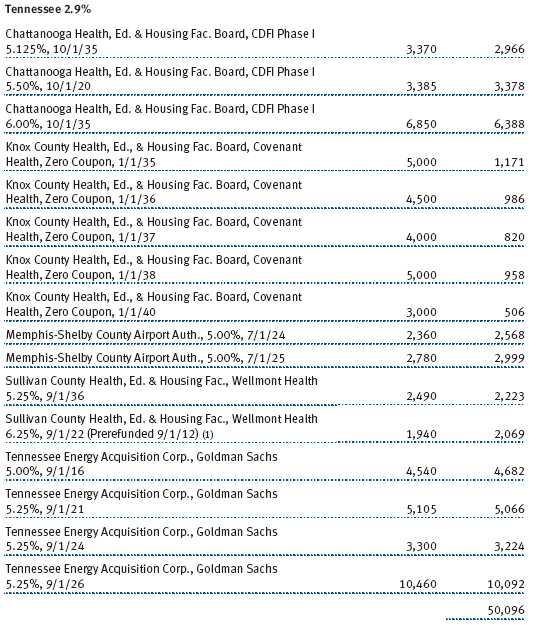
T. Rowe Price Tax-Free High Yield Fund, Inc. (the Fund), is registered under the Investment Company Act of 1940 (the 1940 Act) as a diversified, open-end management investment company. The fund commenced operations on March 1, 1985. The fund seeks to provide a high level of income exempt from federal income taxes by investing primarily in long-term low- to upper-medium-grade municipal securities.
NOTE 1 - SIGNIFICANT ACCOUNTING POLICIES
Basis of Preparation The accompanying financial statements were prepared in accordance with accounting principles generally accepted in the United States of America (GAAP), which require the use of estimates made by management. Management believes that estimates and valuations are appropriate; however, actual results may differ from those estimates, and the valuations reflected in the accompanying financial statements may differ from the value ultimately realized upon sale or maturity.
Investment Transactions, Investment Income, and Distributions Income and expenses are recorded on the accrual basis. Premiums and discounts on debt securities are amortized for financial reporting purposes. Dividend income is recorded on the ex-dividend date. Income tax-related interest and penalties, if incurred, would be recorded as income tax expense. Investment transactions are accounted for on the trade date. Realized gains and losses are reported on the identified cost basis. Distributions to shareholders are recorded on the ex-dividend date. Income distributions are declared daily and paid monthly. Capital gain distributions, if any, are generally declared and paid by the fund annually.
Credits The fund earns credits on temporarily uninvested cash balances held at the custodian, which reduce the fund’s custody charges. Custody expense in the accompanying financial statements is presented before reduction for credits.
Redemption Fees Effective August 15, 2011, the fund began to assess a 2% fee on redemptions of fund shares held for 90 days or less to deter short-term trading and to protect the interests of long-term shareholders. Redemption fees are withheld from proceeds that shareholders receive from the sale or exchange of fund shares. The fees are paid to the fund and are recorded as an increase to paid-in capital. The fees may cause the redemption price per share to differ from the net asset value per share.
NOTE 2 - VALUATION
The fund’s financial instruments are reported at fair value as defined by GAAP. The fund determines the values of its assets and liabilities and computes its net asset value per share at the close of the New York Stock Exchange (NYSE), normally 4 p.m. ET, each day that the NYSE is open for business.
Valuation Methods Debt securities are generally traded in the over-the-counter (OTC) market. Securities with remaining maturities of one year or more at the time of acquisition are valued at prices furnished by dealers who make markets in such securities or by an independent pricing service, which considers the yield or price of bonds of comparable quality, coupon, maturity, and type, as well as prices quoted by dealers who make markets in such securities. Securities with remaining maturities of less than one year at the time of acquisition generally use amortized cost in local currency to approximate fair value. However, if amortized cost is deemed not to reflect fair value or the fund holds a significant amount of such securities with remaining maturities of more than 60 days, the securities are valued at prices furnished by dealers who make markets in such securities or by an independent pricing service.
Equity securities listed or regularly traded on a securities exchange or in the OTC market are valued at the last quoted sale price or, for certain markets, the official closing price at the time the valuations are made, except for OTC Bulletin Board securities, which are valued at the mean of the latest bid and asked prices. A security that is listed or traded on more than one exchange is valued at the quotation on the exchange determined to be the primary market for such security. Listed securities not traded on a particular day are valued at the mean of the latest bid and asked prices for domestic securities and the last quoted sale price for international securities.
Financial futures contracts are valued at closing settlement prices.
Other investments, including restricted securities, private placements, and those financial instruments for which the above valuation procedures are inappropriate or are deemed not to reflect fair value are stated at fair value as determined in good faith by the T. Rowe Price Valuation Committee, established by the fund’s Board of Directors. Subject to oversight by the fund’s Board of Directors, the Valuation Committee develops pricing-related policies and procedures and approves all fair valuation determinations. The Valuation Committee regularly makes good faith judgments, using a wide variety of sources and information, to establish and adjust valuations of certain securities as events occur and circumstances warrant. For instance, in determining the fair value of private equity instruments, the Valuation Committee considers a variety of factors including the company’s business prospects, its financial performance, strategic events impacting the company, relevant valuations of similar companies, new rounds of financing, and any negotiated transactions of significant size between other investors in the company. Because any fair value determinations made for portfolio holdings involve a significant amount of judgment, there is a degree of subjectivity inherent in such pricing decisions.
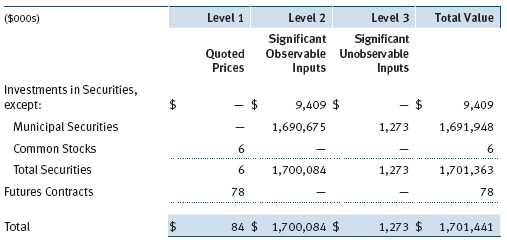
Valuation Inputs Various inputs are used to determine the value of the fund’s financial instruments. These inputs are summarized in the three broad levels listed below:
Level 1 – quoted prices in active markets for identical financial instruments
Level 2 – observable inputs other than Level 1 quoted prices (including, but not limited to, quoted prices for similar financial instruments, interest rates, prepayment speeds, and credit risk)
Level 3 – unobservable inputs
Observable inputs are those based on market data obtained from sources independent of the fund, and unobservable inputs reflect the fund’s own assumptions based on the best information available. The input levels are not necessarily an indication of the risk or liquidity associated with financial instruments at that level. The following table summarizes the fund’s financial instruments, based on the inputs used to determine their values on August 31, 2011:
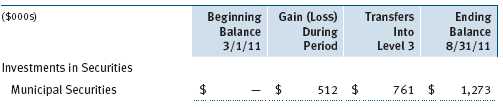
Following is a reconciliation of the fund’s Level 3 holdings for the six months ended August 31, 2011. Transfers into and out of Level 3 are reflected at the value of the financial instrument at the beginning of the period. Gain (loss) reflects both realized and change in unrealized gain (loss) on Level 3 holdings during the period, if any, and is included on the accompanying Statement of Operations. The change in unrealized gain (loss) on Level 3 instruments held at August 31, 2011, totaled $(2,962,000) for the six months ended August 31, 2011.
NOTE 3 - DERIVATIVE INSTRUMENTS
During the six months ended August 31, 2011, the fund invested in derivative instruments. As defined by GAAP, a derivative is a financial instrument whose value is derived from an underlying security price, foreign exchange rate, interest rate, index of prices or rates, or other variable; it requires little or no initial investment and permits or requires net settlement. The fund invests in derivatives only if the expected risks and rewards are consistent with its investment objectives, policies, and overall risk profile, as described in its prospectus and Statement of Additional Information. The fund may use derivatives for a variety of purposes, such as seeking to hedge against declines in principal value, increase yield, invest in an asset with greater efficiency and at a lower cost than is possible through direct investment, or to adjust portfolio duration and credit exposure. The risks associated with the use of derivatives are different from, and potentially much greater than, the risks associated with investing directly in the instruments on which the derivatives are based. Investments in derivatives can magnify returns positively or negatively; however, the fund at all times maintains sufficient cash reserves, liquid assets, or other SEC-permitted asset types to cover the settlement obligations under its open derivative contracts.
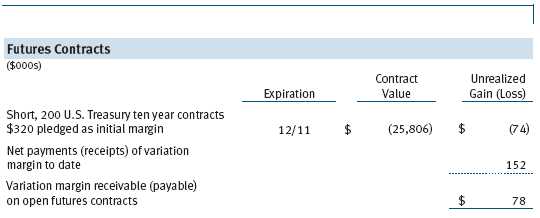
The fund values its derivatives at fair value, as described below and in Note 2, and recognizes changes in fair value currently in its results of operations. Accordingly, the fund does not follow hedge accounting, even for derivatives employed as economic hedges. The fund does not offset the fair value of derivative instruments against the right to reclaim or obligation to return collateral. As of August 31, 2011, the fund held interest rate futures with cumulative unrealized loss of $74,000; the value reflected on the accompanying Statement of Assets and Liabilities is the related unsettled variation margin.
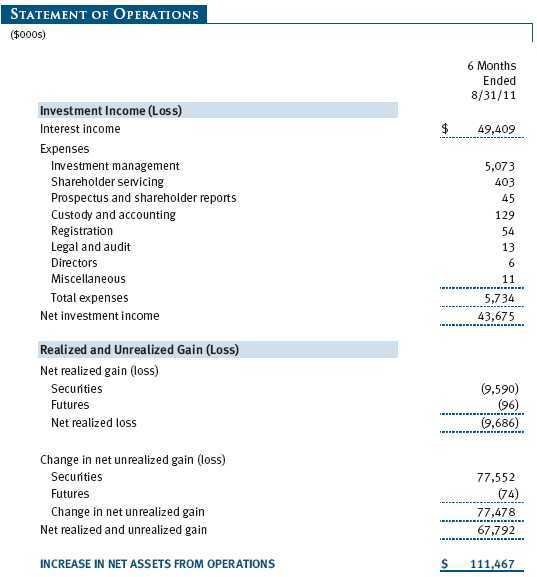
Additionally, during the six months ended August 31, 2011, the fund recognized $96,000 of realized loss on Futures and a $74,000 change in unrealized loss on Futures related to its investments in interest rate derivatives; such amounts are included on the accompanying Statement of Operations.
Counterparty risk related to exchange-traded derivatives, including futures and options contracts, is minimal because the exchange’s clearinghouse provides protection against defaults. Additionally, for exchange-traded derivatives, each broker, in its sole discretion, may change margin requirements applicable to the fund.
Futures Contracts The fund is subject to interest rate risk in the normal course of pursuing its investment objectives and uses futures contracts to help manage such risk. The fund may enter into futures contracts to manage exposure to interest rate and yield curve movements, security prices, foreign currencies, credit quality, and mortgage prepayments; as an efficient means of adjusting exposure to all or part of a target market; to enhance income; as a cash management tool; and/or to adjust portfolio duration and credit exposure. A futures contract provides for the future sale by one party and purchase by another of a specified amount of a particular underlying financial instrument at an agreed-upon price, date, time, and place. The fund currently invests only in exchange-traded futures, which generally are standardized as to maturity date, underlying financial instrument, and other contract terms. Upon entering into a futures contract, the fund is required to deposit with the broker cash or securities in an amount equal to a certain percentage of the contract value (initial margin deposit); the margin deposit must then be maintained at the established level over the life of the contract. Subsequent payments are made or received by the fund each day to settle daily fluctuations in the value of the contract (variation margin), which reflect changes in the value of the underlying financial instrument. Variation margin is recorded as unrealized gain or loss until the contract is closed. The value of a futures contract included in net assets is the amount of unsettled variation margin; net variation margin receivable is reflected as an asset, and net variation margin payable is reflected as a liability on the accompanying Statement of Assets and Liabilities. Risks related to the use of futures contracts include possible illiquidity of the futures markets, contract prices that can be highly volatile and imperfectly correlated to movements in hedged security values and/or interest rates, and potential losses in excess of the fund’s initial investment. During the six months ended August 31, 2011, the fund’s exposure to futures, based on underlying notional amounts, was generally between 0% and 2% of net assets.
NOTE 4 - OTHER INVESTMENT TRANSACTIONS
Consistent with its investment objective, the fund engages in the following practices to manage exposure to certain risks and/or to enhance performance. The investment objective, policies, program, and risk factors of the fund are described more fully in the fund’s prospectus and Statement of Additional Information.
Noninvestment-Grade Debt Securities At August 31, 2011, approximately 40% of the fund’s net assets were invested, either directly or through its investment in T. Rowe Price institutional funds, in noninvestment-grade debt securities, commonly referred to as “high yield” or “junk” bonds. The noninvestment-grade bond market may experience sudden and sharp price swings due to a variety of factors, including changes in economic forecasts, stock market activity, large sustained sales by major investors, a high-profile default, or a change in the market’s psychology. These events may decrease the ability of issuers to make principal and interest payments and adversely affect the liquidity or value, or both, of such securities.
Restricted Securities The fund may invest in securities that are subject to legal or contractual restrictions on resale. Prompt sale of such securities at an acceptable price may be difficult and may involve substantial delays and additional costs.
Residual-Interest Bonds During the six months ended August 31, 2011, the fund held residual-interest bonds (RIBs) purchased from third-party special purpose trusts, which securitize an underlying bond into RIBs and short-term floating rate bonds. RIBs generally are entitled to the cash flows of the underlying bond that remain after payment of amounts due to the floating rate bondholders and trust-related fees; they also generally have the right to acquire the underlying bond from the trust. RIBs can only be traded in accordance with Rule 144A of the Securities Act of 1933 and cannot be offered for public resale. Risks arise from changes in interest rates and the value of the underlying bond, and the sale of the RIBs may involve delay or additional costs.
Other Purchases and sales of portfolio securities other than short-term securities aggregated $127,350,000 and $122,681,000, respectively, for the six months ended August 31, 2011.
NOTE 5 - FEDERAL INCOME TAXES
No provision for federal income taxes is required since the fund intends to continue to qualify as a regulated investment company under Subchapter M of the Internal Revenue Code and distribute to shareholders all of its income and gains. Distributions determined in accordance with federal income tax regulations may differ in amount or character from net investment income and realized gains for financial reporting purposes. Financial reporting records are adjusted for permanent book/tax differences to reflect tax character but are not adjusted for temporary differences. The amount and character of tax-basis distributions and composition of net assets are finalized at fiscal year-end; accordingly, tax-basis balances have not been determined as of the date of this report.
In accordance with federal tax regulations, the fund recognized capital losses in the current period for tax purposes that had been recognized in the prior fiscal year for financial reporting purposes. Such deferrals relate to net capital losses realized between November 1, 2010 and February 28, 2011, and totaled $1,068,000. The fund intends to retain realized gains to the extent of available capital loss carryforwards. As of February 28, 2011, the fund had $22,861,000 of unused capital loss carryforwards, which expire: $60,000 in fiscal 2014, $6,657,000 in fiscal 2017, $12,492,000 in fiscal 2018 and $3,652,000 in fiscal 2019.
At August 31, 2011, the cost of investments for federal income tax purposes was $1,768,247,000. Net unrealized loss aggregated $66,958,000 at period-end, of which $52,176,000 related to appreciated investments and $119,134,000 related to depreciated investments.
NOTE 6 - RELATED PARTY TRANSACTIONS
The fund is managed by T. Rowe Price Associates, Inc. (Price Associates), a wholly owned subsidiary of T. Rowe Price Group, Inc. (Price Group). The investment management agreement between the fund and Price Associates provides for an annual investment management fee, which is computed daily and paid monthly. The fee consists of an individual fund fee, equal to 0.30% of the fund’s average daily net assets, and a group fee. The group fee rate is calculated based on the combined net assets of certain mutual funds sponsored by Price Associates (the group) applied to a graduated fee schedule, with rates ranging from 0.48% for the first $1 billion of assets to 0.28% for assets in excess of $300 billion. The fund’s group fee is determined by applying the group fee rate to the fund’s average daily net assets. At August 31, 2011, the effective annual group fee rate was 0.30%.
In addition, the fund has entered into service agreements with Price Associates and a wholly owned subsidiary of Price Associates (collectively, Price). Price Associates computes the daily share price and provides certain other administrative services to the fund. T. Rowe Price Services, Inc., provides shareholder and administrative services in its capacity as the fund’s transfer and dividend disbursing agent. For the six months ended August 31, 2011, expenses incurred pursuant to these service agreements were $76,000 for Price Associates and $224,000 for T. Rowe Price Services, Inc. The total amount payable at period-end pursuant to these service agreements is reflected as Due to Affiliates in the accompanying financial statements.
| INFORMATION ON PROXY VOTING POLICIES, PROCEDURES, AND RECORDS |
A description of the policies and procedures used by T. Rowe Price funds and portfolios to determine how to vote proxies relating to portfolio securities is available in each fund’s Statement of Additional Information, which you may request by calling 1-800-225-5132 or by accessing the SEC’s website, sec.gov. The description of our proxy voting policies and procedures is also available on our website, troweprice.com. To access it, click on the words “Our Company” at the top of our corporate homepage. Then, when the next page appears, click on the words “Proxy Voting Policies” on the left side of the page.
Each fund’s most recent annual proxy voting record is available on our website and through the SEC’s website. To access it through our website, follow the directions above, then click on the words “Proxy Voting Records” on the right side of the Proxy Voting Policies page.
| HOW TO OBTAIN QUARTERLY PORTFOLIO HOLDINGS |
The fund files a complete schedule of portfolio holdings with the Securities and Exchange Commission for the first and third quarters of each fiscal year on Form N-Q. The fund’s Form N-Q is available electronically on the SEC’s website (sec.gov); hard copies may be reviewed and copied at the SEC’s Public Reference Room, 450 Fifth St. N.W., Washington, DC 20549. For more information on the Public Reference Room, call 1-800-SEC-0330.
| APPROVAL OF INVESTMENT MANAGEMENT AGREEMENT |
On March 9, 2011, the fund’s Board of Directors (Board) unanimously approved the continuation of the investment advisory contract (Contract) between the fund and its investment advisor, T. Rowe Price Associates, Inc. (Advisor). The Board considered a variety of factors in connection with its review of the Contract, also taking into account information provided by the Advisor during the course of the year, as discussed below:
Services Provided by the Advisor
The Board considered the nature, quality, and extent of the services provided to the fund by the Advisor. These services included, but were not limited to, management of the fund’s portfolio and a variety of related activities, as well as financial and administrative services, reporting, and communications. The Board also reviewed the background and experience of the Advisor’s senior management team and investment personnel involved in the management of the fund. The Board concluded that it was satisfied with the nature, quality, and extent of the services provided by the Advisor.
Investment Performance of the Fund
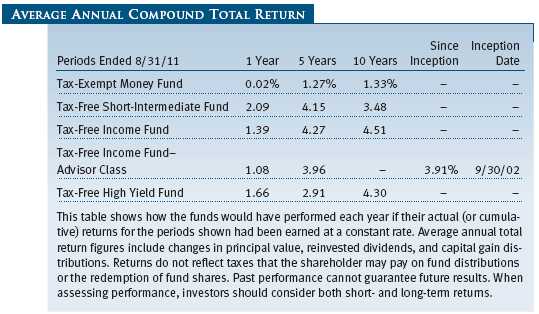
The Board reviewed the fund’s average annual total returns over the 1-, 3-, 5-, and 10-year periods, as well as the fund’s year-by-year returns, and compared these returns with a wide variety of previously agreed upon comparable performance measures and market data, including those supplied by Lipper and Morningstar, which are independent providers of mutual fund data. On the basis of this evaluation and the Board’s ongoing review of investment results, and factoring in the relative market conditions during certain of the performance periods, the Board concluded that the fund’s performance was satisfactory.
Costs, Benefits, Profits, and Economies of Scale
The Board reviewed detailed information regarding the revenues received by the Advisor under the Contract and other benefits that the Advisor (and its affiliates) may have realized from its relationship with the fund, including research received under “soft dollar” agreements and commission-sharing arrangements with broker-dealers. The Board considered that the Advisor may receive some benefit from soft-dollar arrangements pursuant to which research is received from broker-dealers that execute the applicable fund’s portfolio transactions. The Board also received information on the estimated costs incurred and profits realized by the Advisor and its affiliates from advising T. Rowe Price mutual funds, as well as estimates of the gross profits realized from managing the fund in particular. The Board concluded that the Advisor’s profits were reasonable in light of the services provided to the fund. The Board also considered whether the fund or other funds benefit under the fee levels set forth in the Contract from any economies of scale realized by the Advisor. Under the Contract, the fund pays a fee to the Advisor composed of two components—a group fee rate based on the aggregate assets of certain T. Rowe Price mutual funds (including the fund) that declines at certain asset levels and an individual fund fee rate that is assessed on the assets of the fund. The Board determined that it would be appropriate to introduce another breakpoint into the group fee rate, effective May 1, 2011, to allow fund shareholders to participate in additional economies of scale. The Board concluded that the advisory fee structure for the fund continued to provide for a reasonable sharing of benefits from any economies of scale with the fund’s investors.
Fees
The Board reviewed the fund’s management fee rate, operating expenses, and total expense ratio and compared them with fees and expenses of other comparable funds based on information and data supplied by Lipper. The information provided to the Board indicated that the fund’s management fee rate was above the median for certain groups of comparable funds but at the median for other groups of comparable funds. The information also indicated that the fund’s total expense ratio was at or below the median for comparable funds. The Board also reviewed the fee schedules for institutional accounts of the Advisor and its affiliates with similar mandates. Management provided the Board with information about the Advisor’s responsibilities and services provided to institutional account clients, which are more limited than its responsibilities for the fund and other T. Rowe Price mutual funds that it advises, and showing that the Advisor performs significant additional services and assumes greater risk for the fund and other T. Rowe Price mutual funds that it advises than it does for institutional account clients. On the basis of the information provided, the Board concluded that the fees paid by the fund under the Contract were reasonable.
Approval of the Contract
As noted, the Board approved the continuation of the Contract. No single factor was considered in isolation or to be determinative to the decision. Rather, the Board was assisted by the advice of independent legal counsel and concluded, in light of a weighting and balancing of all factors considered, that it was in the best interests of the fund to approve the continuation of the Contract (including the fees to be charged for services thereunder).
Item 2. Code of Ethics.
A code of ethics, as defined in Item 2 of Form N-CSR, applicable to its principal executive officer, principal financial officer, principal accounting officer or controller, or persons performing similar functions is filed as an exhibit to the registrant’s annual Form N-CSR. No substantive amendments were approved or waivers were granted to this code of ethics during the registrant’s most recent fiscal half-year.
Item 3. Audit Committee Financial Expert.
Disclosure required in registrant’s annual Form N-CSR.
Item 4. Principal Accountant Fees and Services.
Disclosure required in registrant’s annual Form N-CSR.
Item 5. Audit Committee of Listed Registrants.
Not applicable.
Item 6. Investments.
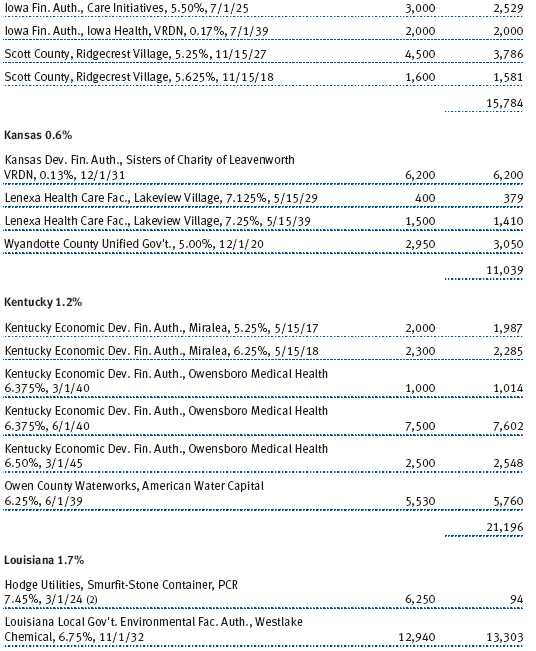
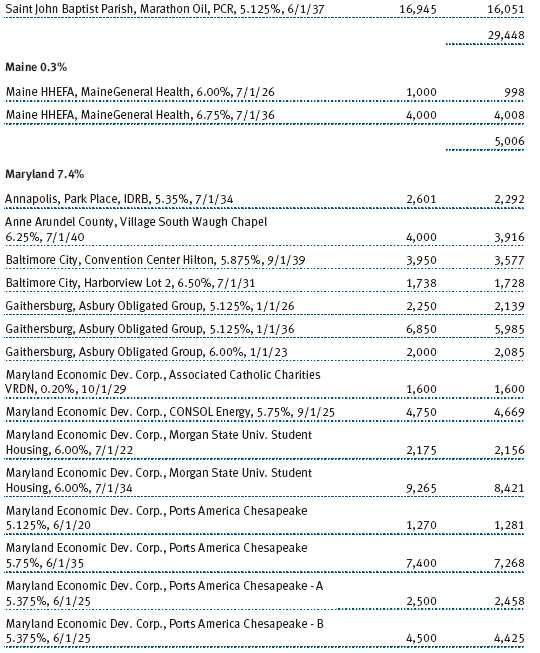
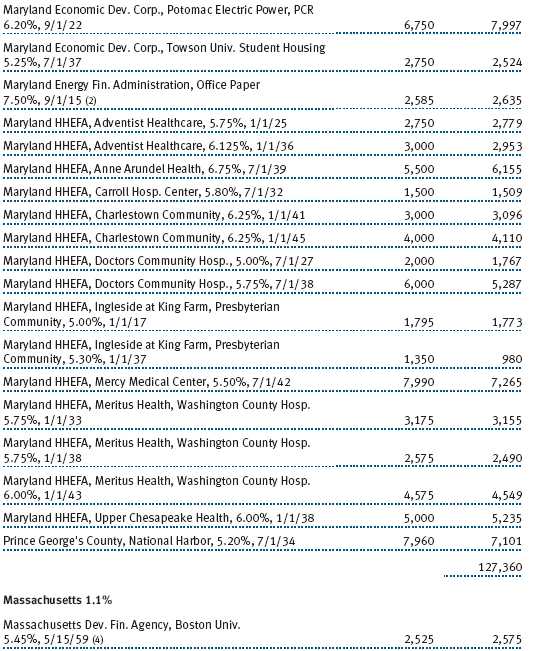
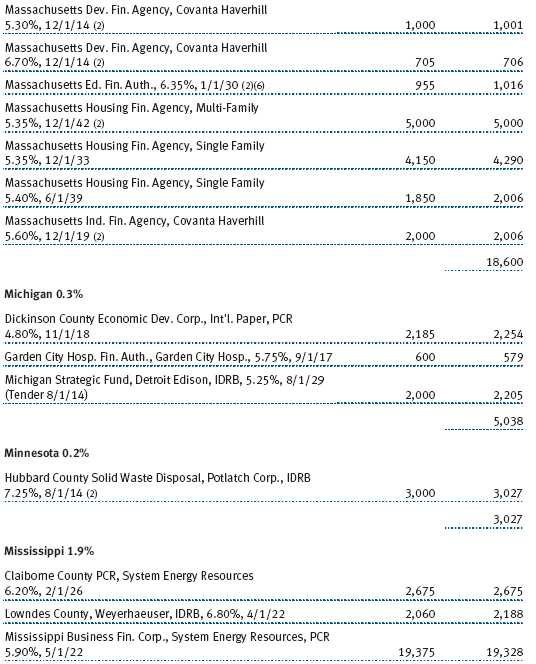
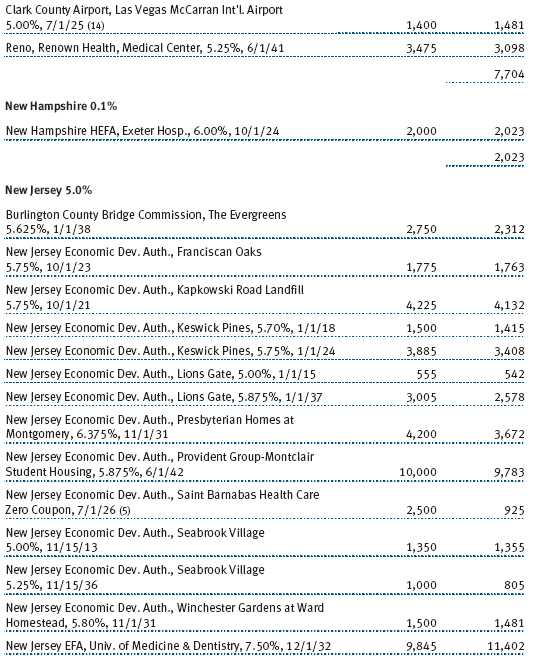
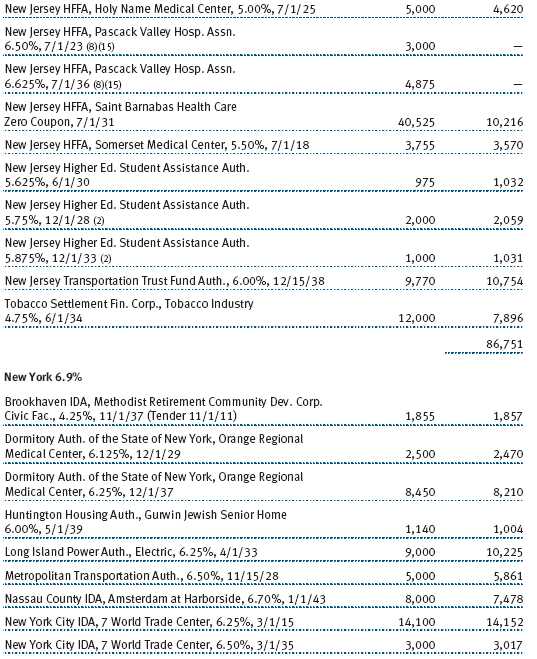
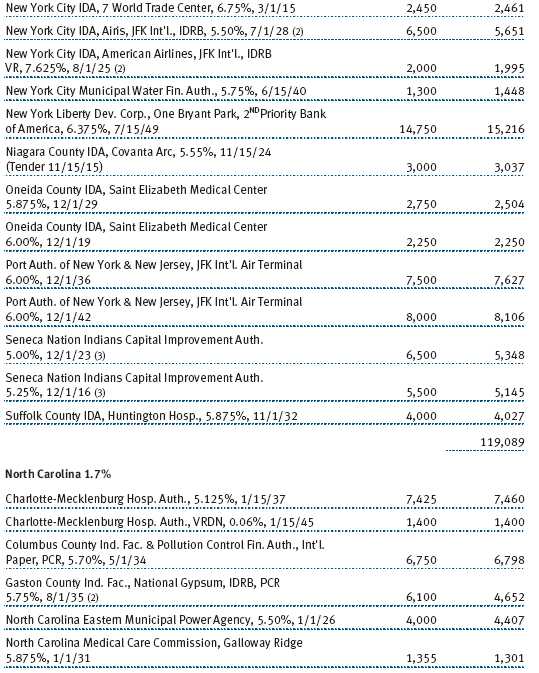
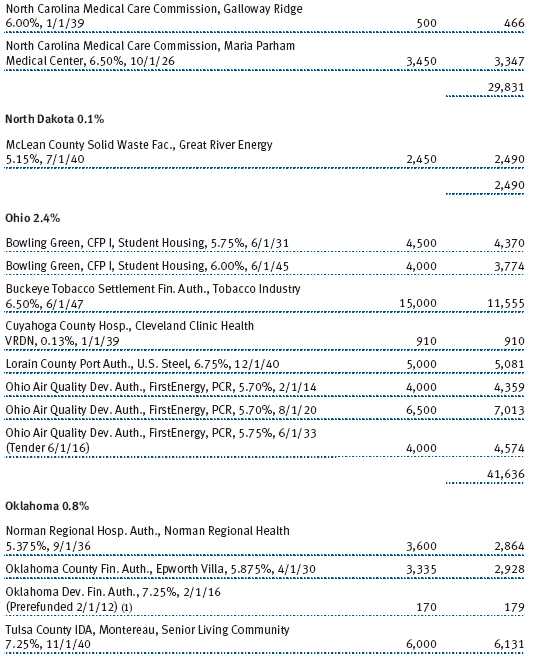
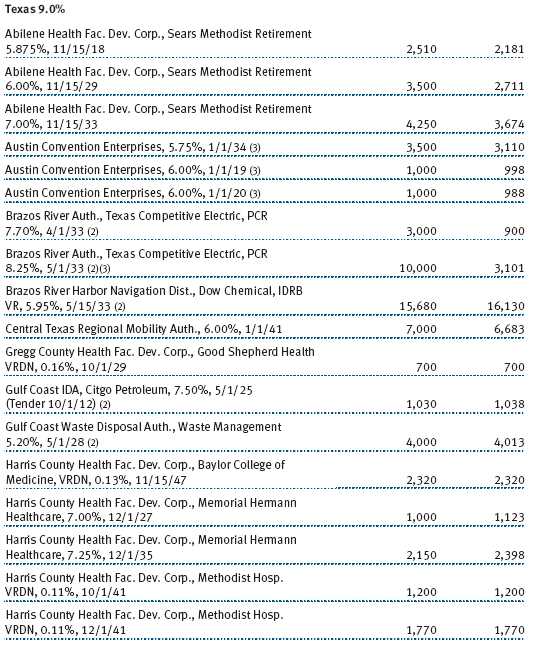
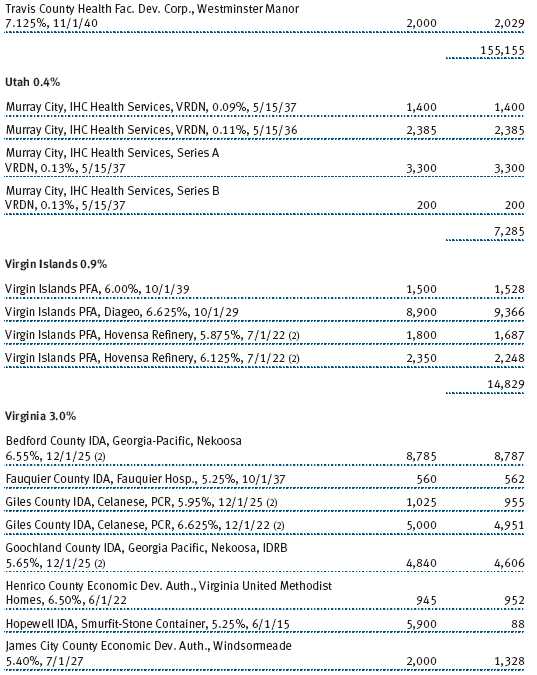
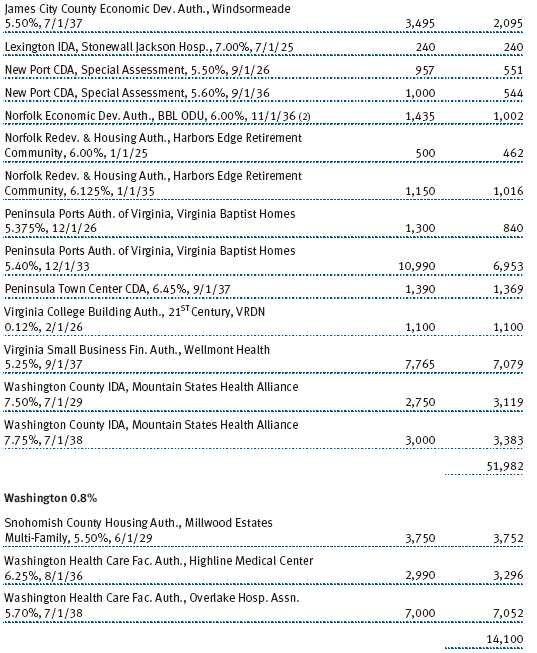
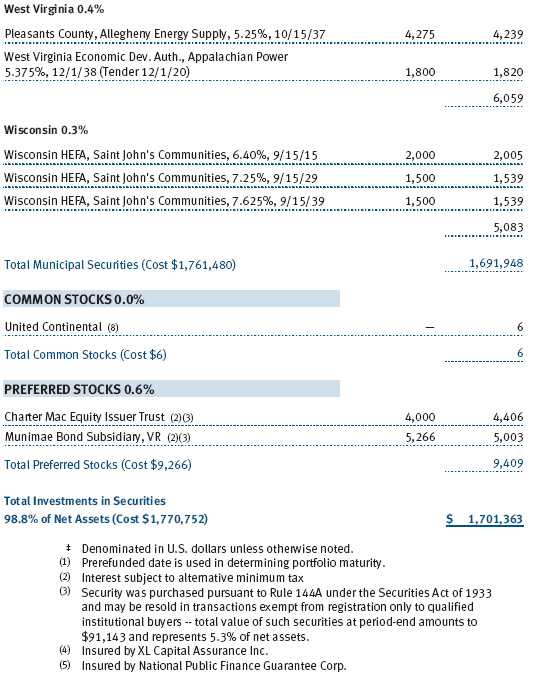
(a) Not applicable. The complete schedule of investments is included in Item 1 of this Form N-CSR.
(b) Not applicable.
Item 7. Disclosure of Proxy Voting Policies and Procedures for Closed-End Management Investment Companies.
Not applicable.
Item 8. Portfolio Managers of Closed-End Management Investment Companies.
Not applicable.
Item 9. Purchases of Equity Securities by Closed-End Management Investment Company and Affiliated Purchasers.
Not applicable.
Item 10. Submission of Matters to a Vote of Security Holders.
Not applicable.
Item 11. Controls and Procedures.
(a) The registrant’s principal executive officer and principal financial officer have evaluated the registrant’s disclosure controls and procedures within 90 days of this filing and have concluded that the registrant’s disclosure controls and procedures were effective, as of that date, in ensuring that information required to be disclosed by the registrant in this Form N-CSR was recorded, processed, summarized, and reported timely.
(b) The registrant’s principal executive officer and principal financial officer are aware of no change in the registrant’s internal control over financial reporting that occurred during the registrant’s second
fiscal quarter covered by this report that has materially affected, or is reasonably likely to materially affect, the registrant’s internal control over financial reporting.
Item 12. Exhibits.
(a)(1) The registrant’s code of ethics pursuant to Item 2 of Form N-CSR is filed with the registrant’s annual Form N-CSR.
(2) Separate certifications by the registrant's principal executive officer and principal financial officer, pursuant to Section 302 of the Sarbanes-Oxley Act of 2002 and required by Rule 30a-2(a) under the Investment Company Act of 1940, are attached.
(3) Written solicitation to repurchase securities issued by closed-end companies: not applicable.
(b) A certification by the registrant's principal executive officer and principal financial officer, pursuant to Section 906 of the Sarbanes-Oxley Act of 2002 and required by Rule 30a-2(b) under the Investment Company Act of 1940, is attached.
| | |
SIGNATURES |
| |
| | Pursuant to the requirements of the Securities Exchange Act of 1934 and the Investment |
| Company Act of 1940, the registrant has duly caused this report to be signed on its behalf by the |
| undersigned, thereunto duly authorized. |
| |
| T. Rowe Price State Tax-Free Income Trust |
| |
| |
| |
| By | /s/ Edward C. Bernard |
| | Edward C. Bernard |
| | Principal Executive Officer |
| |
| Date | October 14, 2011 |
| |
| |
| |
| | Pursuant to the requirements of the Securities Exchange Act of 1934 and the Investment |
| Company Act of 1940, this report has been signed below by the following persons on behalf of |
| the registrant and in the capacities and on the dates indicated. |
| |
| |
| By | /s/ Edward C. Bernard |
| | Edward C. Bernard |
| | Principal Executive Officer |
| |
| Date | October 14, 2011 |
| |
| |
| |
| By | /s/ Gregory K. Hinkle |
| | Gregory K. Hinkle |
| | Principal Financial Officer |
| |
| Date | October 14, 2011 |