UNITED STATES
SECURITIES AND EXCHANGE COMMISSION
WASHINGTON, D. C. 20549
FORM N-CSRS
Investment Company Act file number: 811-04257
DWS Variable Series I
(Exact Name of Registrant as Specified in Charter)
345 Park Avenue
New York, NY 10154-0004
(Address of Principal Executive Offices) (Zip Code)
Registrant’s Telephone Number, including Area Code: (212) 250-3220
Paul Schubert
60 Wall Street
New York, NY 10005
(Name and Address of Agent for Service)
| Date of fiscal year end: | 12/31 |
| | |
| Date of reporting period: | 6/30/2012 |
| ITEM 1. | REPORT TO STOCKHOLDERS |
| | |
JUNE 30, 2012
SEMIANNUAL REPORT
DWS VARIABLE SERIES I
DWS Bond VIP
Contents
6 Portfolio Management Team 14 Statement of Assets and Liabilities 15 Statement of Operations 16 Statement of Changes in Net Assets 18 Notes to Financial Statements 25 Information About Your Fund's Expenses 27 Summary of Management Fee Evaluation by Independent Fee Consultant |
This report must be preceded or accompanied by a prospectus. To obtain an additional prospectus or summary prospectus, if available, call (800) 728-3337 or your financial representative. We advise you to consider the Fund's objectives, risks, charges and expenses carefully before investing. The summary prospectus and prospectus contain this and other important information about the Fund. Please read the prospectus carefully before you invest.
Bond investments are subject to interest-rate and credit risks. When interest rates rise, bond prices generally fall. Credit risk refers to the ability of an issuer to make timely payments of principal and interest. Investments in lower-quality ("junk bonds") and non-rated securities present greater risk of loss than investments in higher-quality securities. Investing in derivatives entails special risks relating to liquidity, leverage and credit that may reduce returns and/or increase volatility. Investing in foreign securities, particularly those of emerging markets, presents certain risks, such as currency fluctuations, political and economic changes, and market risks. See the prospectus for details.
DWS Investments is part of Deutsche Bank's Asset Management division and, within the U.S., represents the retail asset management activities of Deutsche Bank AG, Deutsche Bank Trust Company Americas, Deutsche Investment Management Americas Inc. and DWS Trust Company.
NOT FDIC/NCUA INSURED NO BANK GUARANTEE MAY LOSE VALUE NOT A DEPOSIT
NOT INSURED BY ANY FEDERAL GOVERNMENT AGENCY
Performance Summary June 30, 2012 (Unaudited)
Fund performance shown is historical, assumes reinvestment of all dividend and capital gain distributions, and does not guarantee future results. Investment return and principal value fluctuate with changing market conditions so that, when redeemed, shares may be worth more or less than their original cost. Current performance may be lower or higher than the performance data quoted. Please contact your participating insurance company for the Fund's most recent month-end performance. Performance doesn't reflect charges and fees ("contract charges") associated with the separate account that invests in the Fund or any variable life insurance policy or variable annuity contract for which the Fund is an investment option. These charges and fees will reduce returns.
The gross expense ratio of the Fund, as stated in the fee table of the prospectus dated May 1, 2012 is 0.62% for Class A shares and may differ from the expense ratio disclosed in the Financial Highlights table in this report.
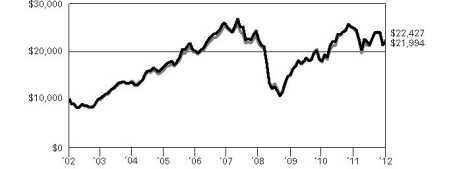
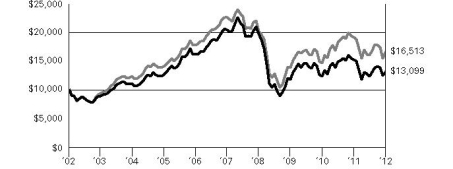
| Growth of an Assumed $10,000 Investment |
| The Barclays U.S. Aggregate Bond Index is an unmanaged index representing domestic taxable investment-grade bonds, with index components for government and corporate securities, mortgage pass-through securities, and asset-backed securities with an average maturity of one year or more. Index returns do not reflect any fees or expenses and it is not possible to invest directly into an index. |
| |
| Yearly periods ended June 30 | |
| Comparative Results | |
| DWS Bond VIP | | 6-Month‡ | | | 1-Year | | | 3-Year | | | 5-Year | | | 10-Year | |
| Class A | Growth of $10,000 | | $ | 10,375 | | | $ | 10,654 | | | $ | 12,356 | | | $ | 11,059 | | | $ | 14,015 | |
| Average annual total return | | | 3.75 | % | | | 6.54 | % | | | 7.31 | % | | | 2.03 | % | | | 3.43 | % |
| Barclays U.S. Aggregate Bond Index | Growth of $10,000 | | $ | 10,237 | | | $ | 10,747 | | | $ | 12,227 | | | $ | 13,890 | | | $ | 17,296 | |
| Average annual total return | | | 2.37 | % | | | 7.47 | % | | | 6.93 | % | | | 6.79 | % | | | 5.63 | % |
The growth of $10,000 is cumulative.
‡ Total returns shown for periods less than one year are not annualized.
Portfolio Summary (Unaudited) Asset Allocation (As a % of Total Net Assets) | 6/30/12 | 12/31/11 |
| | | |
| Government & Agency Obligations | 37% | 38% |
| Mortgage-Backed Securities Pass-Throughs | 35% | 42% |
| Corporate Bonds | 24% | 28% |
| Municipal Bonds and Notes | 7% | 7% |
| Collateralized Mortgage Obligations | 5% | 4% |
| Commercial Mortgage-Backed Securities | 4% | 7% |
| Asset-Backed | 1% | 3% |
| Cash Equivalents and other Assets and Liabilities, net | -13% | -29% |
| | 100% | 100% |
Quality (Excludes Cash Equivalents and Securities Lending Collateral) | 6/30/12 | 12/31/11 |
| | | |
| AAA | 65% | 64% |
| AA | 6% | 5% |
| A | 7% | 7% |
| BBB | 14% | 15% |
| BB or Below | 4% | 7% |
| Not Rated | 4% | 2% |
| | 100% | 100% |
| Interest Rate Sensitivity | 6/30/12 | 12/31/11 |
| | | |
| Effective Maturity | 6.7 years | 6.9 years |
| Effective Duration | 5.1 years | 4.9 years |
The quality ratings represent the higher of Moody's Investors Service, Inc. ("Moody's") or Standard & Poor's Corporation ("S&P") credit ratings. The ratings of Moody's and S&P represent their opinions as to the quality of the securities they rate. Credit quality measures a bond issuer's ability to repay interest and principal in a timely manner. Ratings are relative and subjective and are not absolute standards of quality. Credit quality does not remove market risk and is subject to change.
Effective maturity is the weighted average of the maturity date of bonds held by the Fund taking into consideration any available maturity shortening features.
Effective duration is an approximate measure of the Fund's sensitivity to interest rate changes taking into consideration any maturity shortening features.
Portfolio holdings and characteristics are subject to change.
For more complete details about the Fund's investment portfolio, see page 7.
Following the Fund's fiscal first and third quarter-end, a complete portfolio holdings listing is filed with the SEC on Form N-Q. The form will be available on the SEC's Web site at www.sec.gov, and it also may be reviewed and copied at the SEC's Public Reference Room in Washington, D.C. Information on the operation of the SEC's Public Reference Room may be obtained by calling (800) SEC-0330. The Fund's portfolio holdings are also posted on www.dws-investments.com from time to time. Please see the Fund's current prospectus for more information.
Portfolio Management Team
William Chepolis, CFA
John D. Ryan
Eric S. Meyer, CFA
Gary Russell, CFA
Ohn Choe, CFA
Portfolio Managers
Investment Portfolio June 30, 2012 (Unaudited) | | Principal Amount ($)(a) | Value ($) |
| | |
| Corporate Bonds 24.2% |
| Consumer Discretionary 5.6% |
| AMC Entertainment, Inc., 8.75%, 6/1/2019 | | 1,043,000 | 1,118,617 |
| CBS Corp., 3.375%, 3/1/2022 | | 500,000 | 498,148 |
| CCO Holdings LLC, 6.5%, 4/30/2021 | | 420,000 | 447,300 |
| DIRECTV Holdings LLC: |
| | 2.4%, 3/15/2017 | | 1,050,000 | 1,056,914 |
| | 3.125%, 2/15/2016 | | 200,000 | 208,360 |
| | 6.35%, 3/15/2040 | | 427,000 | 483,764 |
| Levi Strauss & Co., 7.625%, 5/15/2020 (b) | | 300,000 | 318,750 |
| Lowe's Companies, Inc., 1.625%, 4/15/2017 | | 750,000 | 755,560 |
| Macy's Retail Holdings, Inc., 3.875%, 1/15/2022 | | 630,000 | 662,365 |
| MGM Resorts International, 9.0%, 3/15/2020 | | 1,050,000 | 1,165,500 |
| NBCUniversal Media LLC: |
| | 5.15%, 4/30/2020 | | 500,000 | 574,035 |
| | 5.95%, 4/1/2041 | | 272,000 | 321,090 |
| Norcraft Companies LP, 10.5%, 12/15/2015 | | 100,000 | 99,000 |
| Royal Caribbean Cruises Ltd., 7.25%, 6/15/2016 | | 750,000 | 810,000 |
| Time Warner Cable, Inc.: |
| | 4.0%, 9/1/2021 | | 530,000 | 556,952 |
| | 7.3%, 7/1/2038 | | 40,000 | 51,373 |
| Time Warner, Inc., 7.625%, 4/15/2031 | | 650,000 | 839,567 |
| Yum! Brands, Inc.: |
| | 3.875%, 11/1/2020 | | 765,000 | 822,120 |
| | 5.3%, 9/15/2019 | | 100,000 | 114,919 |
| | 10,904,334 |
| Consumer Staples 1.7% |
| Anheuser-Busch InBev Worldwide, Inc., 7.75%, 1/15/2019 | | 1,150,000 | 1,518,867 |
| CVS Caremark Corp., 5.75%, 5/15/2041 | | 225,000 | 267,843 |
| JBS U.S.A. LLC, 144A, 8.25%, 2/1/2020 | | 1,100,000 | 1,069,750 |
| Kellogg Co., 4.0%, 12/15/2020 | | 200,000 | 220,148 |
| Kroger Co., 6.9%, 4/15/2038 | | 100,000 | 122,550 |
| | 3,199,158 |
| Energy 3.6% |
| Apache Corp., 3.25%, 4/15/2022 | | 550,000 | 574,317 |
| DCP Midstream LLC, 144A, 9.75%, 3/15/2019 | | 760,000 | 985,270 |
| Encana Corp., 5.15%, 11/15/2041 | | 206,000 | 196,782 |
| Enterprise Products Operating LLC: | |
| | 4.6%, 8/1/2012 | | 500,000 | 501,448 |
| | 6.125%, 10/15/2039 | | 460,000 | 521,098 |
| ONEOK Partners LP, 6.15%, 10/1/2016 | | 878,000 | 1,020,649 |
| Petroleos Mexicanos, 144A, 5.5%, 6/27/2044 | 550,000 | 562,375 |
| Phillips 66, 144A, 2.95%, 5/1/2017 | | 523,000 | 537,418 |
| | Principal Amount ($)(a) | Value ($) |
| | |
| Reliance Holdings U.S.A., Inc., 144A, 4.5%, 10/19/2020 | 650,000 | 610,860 |
| Weatherford International Ltd., 5.125%, 9/15/2020 | 1,250,000 | 1,341,936 |
| Williams Partners LP, 4.0%, 11/15/2021 | 200,000 | 207,755 |
| | 7,059,908 |
| Financials 6.2% |
| American International Group, Inc., 4.875%, 6/1/2022 | | 400,000 | 409,289 |
| Bank of America Corp.: |
| | 5.65%, 5/1/2018 | | 365,000 | 390,292 |
| | 5.75%, 12/1/2017 | | 360,000 | 384,191 |
| | 6.5%, 8/1/2016 | | 80,000 | 87,851 |
| Bank of New York Mellon Corp., 2.4%, 1/17/2017 | | 550,000 | 567,856 |
| Berkshire Hathaway, Inc., 1.9%, 1/31/2017 | | 520,000 | 530,284 |
| Bunge Ltd. Finance Corp., 4.1%, 3/15/2016 | | 248,000 | 258,603 |
| Citigroup, Inc., 4.5%, 1/14/2022 | | 432,000 | 446,193 |
| CNA Financial Corp., 5.75%, 8/15/2021 | | 1,001,000 | 1,099,909 |
| Ford Motor Credit Co., LLC: |
| | 3.0%, 6/12/2017 | | 485,000 | 482,328 |
| | 7.0%, 4/15/2015 | | 925,000 | 1,028,026 |
| General Electric Capital Corp., 2.9%, 1/9/2017 | | 1,805,000 | 1,864,397 |
| JPMorgan Chase & Co., 5.125%, 9/15/2014 | | 1,100,000 | 1,168,622 |
| Nationwide Financial Services, Inc., 144A, 5.375%, 3/25/2021 | | 410,000 | 423,362 |
| PNC Bank NA, 6.875%, 4/1/2018 | | 200,000 | 238,578 |
| PNC Funding Corp., 3.3%, 3/8/2022 | | 1,020,000 | 1,040,200 |
| Prudential Financial, Inc., 7.375%, 6/15/2019 | | 170,000 | 207,481 |
| SunTrust Banks, Inc., 3.6%, 4/15/2016 | | 335,000 | 347,855 |
| The Goldman Sachs Group, Inc., 6.0%, 6/15/2020 | | 880,000 | 939,461 |
| Toll Brothers Finance Corp., 8.91%, 10/15/2017 | | 200,000 | 245,848 |
| | 12,160,626 |
| Health Care 1.3% |
| Amgen, Inc., 5.15%, 11/15/2041 | | 520,000 | 542,836 |
| Express Scripts Holding Co.: |
| | 6.25%, 6/15/2014 | | 205,000 | 224,145 |
| | 7.25%, 6/15/2019 | | 560,000 | 704,145 |
| Gilead Sciences, Inc., 4.4%, 12/1/2021 | | 390,000 | 430,474 |
| McKesson Corp., 4.75%, 3/1/2021 | | 475,000 | 544,956 |
| | 2,446,556 |
| Industrials 1.3% |
| ADT Corp., 144A, 3.5%, 7/15/2022 | 455,000 | 456,527 |
| BAA Funding Ltd., 144A, 2.5%, 6/25/2015 | 335,000 | 336,875 |
| | Principal Amount ($)(a) | Value ($) |
| | |
| Burlington Northern Santa Fe LLC, 3.45%, 9/15/2021 | 142,000 | 148,570 |
| CSX Corp., 6.15%, 5/1/2037 | | 650,000 | 797,366 |
| Masco Corp., 6.125%, 10/3/2016 | 800,000 | 853,760 |
| | 2,593,098 |
| Information Technology 1.3% |
| Applied Materials, Inc., 5.85%, 6/15/2041 | 440,000 | 530,949 |
| Equinix, Inc., 7.0%, 7/15/2021 | 850,000 | 935,000 |
| Hewlett-Packard Co., 3.3%, 12/9/2016 | 715,000 | 747,355 |
| Xerox Corp., 2.95%, 3/15/2017 | 284,000 | 287,217 |
| | 2,500,521 |
| Materials 2.3% |
| ArcelorMittal, 6.125%, 6/1/2018 | 1,000,000 | 1,013,947 |
| Corporacion Nacional del Cobre — Codelco: | |
| | 144A, 3.75%, 11/4/2020 | | 550,000 | 573,587 |
| | REG S, 7.5%, 1/15/2019 | | 600,000 | 760,201 |
| Dow Chemical Co.: |
| | 4.125%, 11/15/2021 | | 61,000 | 65,429 |
| | 4.25%, 11/15/2020 | | 740,000 | 802,801 |
| | 5.25%, 11/15/2041 | | 100,000 | 110,544 |
| Freeport-McMoRan Copper & Gold, Inc., 3.55%, 3/1/2022 | 790,000 | 777,264 |
| Teck Resources Ltd., 3.0%, 3/1/2019 | 400,000 | 397,363 |
| | 4,501,136 |
| Telecommunication Services 0.3% |
| AT&T, Inc., 3.875%, 8/15/2021 | 215,000 | 234,191 |
| Frontier Communications Corp., 7.875%, 4/15/2015 | 332,000 | 365,200 |
| | 599,391 |
| Utilities 0.6% |
| DTE Energy Co., 7.625%, 5/15/2014 | 300,000 | 334,677 |
| Energy Future Competitive Holdings Co., 7.48%, 1/1/2017 | 24,284 | 21,339 |
| FirstEnergy Solutions Corp., 6.8%, 8/15/2039 | 659,000 | 692,048 |
| Majapahit Holding BV, REG S, 7.75%, 10/17/2016 | 100,000 | 114,250 |
| | 1,162,314 |
Total Corporate Bonds (Cost $44,404,421) | 47,127,042 |
| |
| Mortgage-Backed Securities Pass-Throughs 34.8% |
| Federal Home Loan Mortgage Corp.: |
| | 3.5%, 4/1/2042 | | 9,397,309 | 9,899,110 |
| | 4.0%, 8/1/2039 | | 1,094,431 | 1,178,780 |
| | 4.5%, 6/1/2041 | | 3,914,014 | 4,178,975 |
| | 5.484%*, 2/1/2038 | | 297,145 | 323,563 |
| | 5.5%, with various maturities from 10/1/2023 until 8/1/2024 | 231,489 | 256,362 |
| | 6.0%, with various maturities from 12/1/2034 until 3/1/2038 | 568,377 | 627,545 |
| | 6.5%, 3/1/2026 | | 513,672 | 582,390 |
| | 7.0%, 1/1/2038 | | 74,851 | 84,927 |
| | Principal Amount ($)(a) | Value ($) |
| | |
| Federal National Mortgage Association: |
| | 2.441%*, 8/1/2037 | | 252,491 | 266,257 |
| | 3.0%, 9/1/2026 (c) | | 10,862,500 | 11,380,166 |
| | 4.0%, with various maturities from 6/1/2040 until 9/1/2040 (c) | 23,222,037 | 24,745,540 |
| | 4.5%, with various maturities from 10/1/2033 until 5/1/2041 | 547,662 | 587,669 |
| | 5.0%, with various maturities from 2/1/2021 until 8/1/2040 | 2,744,830 | 2,972,806 |
| | 5.249%*, 9/1/2038 | | 167,232 | 179,356 |
| | 5.356%*, 1/1/2038 | | 277,544 | 295,147 |
| | 5.5%, with various maturities from 12/1/2032 until 4/1/2037 | 3,162,332 | 3,470,856 |
| | 6.0%, with various maturities from 4/1/2024 until 3/1/2025 | 1,004,487 | 1,120,616 |
| | 6.5%, with various maturities from 3/1/2017 until 12/1/2037 | 1,350,078 | 1,514,752 |
| | 8.0%, 9/1/2015 | | 11,515 | 12,225 |
| Government National Mortgage Association, 3.0%, 1/1/2042 (c) | 4,000,000 | 4,143,125 |
Total Mortgage-Backed Securities Pass-Throughs (Cost $66,613,494) | 67,820,167 |
| |
| Asset-Backed 0.9% |
| Credit Card Receivables |
| Citibank Omni Master Trust, "A14", Series 2009-A14A, 144A, 2.992%*, 8/15/2018 (Cost $1,842,012) | 1,750,000 | 1,837,712 |
| |
| Commercial Mortgage-Backed Securities 4.4% |
| Banc of America Large Loan, Inc., "HLTN", Series 2010-HLTN, 144A, 1.992%*, 11/15/2015 | 1,777,789 | 1,684,485 |
| Banc of America Merrill Lynch Commercial Mortgage, Inc., "A2", Series 2007-2, 5.634%*, 4/10/2049 | 119,227 | 123,478 |
| Bear Stearns Commercial Mortgage Securities, Inc., "A4", Series 2007-PW16, 5.906%*, 6/11/2040 | 240,000 | 274,416 |
| Greenwich Capital Commercial Funding Corp., "A4", Series 2007-GG9, 5.444%, 3/10/2039 | 1,750,000 | 1,941,326 |
| JPMorgan Chase Commercial Mortgage Securities Corp.: | |
| | "A4", Series 2007-C1, 5.716%, 2/15/2051 | 960,000 | 1,086,420 |
| | "F", Series 2007-LD11, 6.009%*, 6/15/2049 | 650,000 | 59,670 |
| | "G", Series 2007-LD11, 144A, 6.009%*, 6/15/2049 | 760,000 | 48,406 |
| | "H", Series 2007-LD11, 144A, 6.009%*, 6/15/2049 | 460,000 | 11,638 |
| LB-UBS Commercial Mortgage Trust: |
| | "E", Series 2005-C2, 5.498%*, 4/15/2040 | 500,000 | 200,437 |
| | "A4", Series 2007-C6, 5.858%, 7/15/2040 | 1,315,000 | 1,501,814 |
| Merrill Lynch Mortgage Trust, "ASB", Series 2007-C1, 6.041%*, 6/12/2050 | 1,490,000 | 1,590,050 |
| | Principal Amount ($)(a) | Value ($) |
| | |
| Wachovia Bank Commercial Mortgage Trust, "H", Series 2007-C32, 144A, 5.927%*, 6/15/2049 | 770,000 | 46,200 |
Total Commercial Mortgage-Backed Securities (Cost $10,708,519) | 8,568,340 |
| |
| Collateralized Mortgage Obligations 4.7% |
| Countrywide Home Loans, "A2", Series 2006-1, 6.0%, 3/25/2036 | 518,674 | 428,992 |
| CS First Boston Mortgage Securities Corp., "10A3", Series 2005-10, 6.0%, 11/25/2035 | 151,248 | 91,308 |
| Federal Home Loan Mortgage Corp.: |
| | "NI", Series 4020, Interest Only, 3.0%, 3/15/2027 | 396,172 | 45,541 |
| | "LI", Series 3838, Interest Only, 4.5%, 4/15/2022 | 1,613,942 | 141,585 |
| | "PE", Series 2898, 5.0%, 5/15/2033 | 335,000 | 348,839 |
| Federal National Mortgage Association: | |
| | ''IO", Series 2010-143, Interest Only, 5.0%, 12/25/2025 | 3,775,084 | 457,270 |
| | "QD", Series 2005-29, 5.0%, 8/25/2033 | 435,000 | 458,987 |
| | "EG", Series 2005-22, 5.0%, 11/25/2033 | 750,000 | 791,872 |
| | "TC", Series 2007-77, 5.5%, 9/25/2034 | 370,000 | 383,689 |
| Government National Mortgage Association: | |
| | "IU", Series 2010-164, Interest Only, 2.0%, 12/20/2013 | 3,905,607 | 83,585 |
| | "CI", Series 2010-145, Interest Only, 4.0%, 11/20/2035 | 537,533 | 49,295 |
| | "MI", Series 2010-85, Interest Only, 4.5%, 1/20/2036 | 2,564,405 | 259,679 |
| | "AI", Series 2011-94, Interest Only, 4.5%, 1/20/2039 | 4,420,175 | 524,783 |
| | "GI", Series 2010-89, Interest Only, 4.5%, 5/20/2039 | 2,013,360 | 309,324 |
| | "PD", Series 2011-25, 4.5%, 10/16/2039 | 1,000,000 | 1,143,579 |
| | "EI", Series 2010-134, Interest Only, 4.5%, 11/20/2039 | 2,680,602 | 421,690 |
| | "EI", Series 2011-162, Interest Only, 4.5%, 5/20/2040 | 2,358,405 | 318,003 |
| | "DI", Series 2011-40, Interest Only, 4.5%, 12/20/2040 | 4,846,440 | 616,018 |
| | "IM", Series 2010-87, Interest Only, 4.75%, 3/20/2036 | 2,674,602 | 299,736 |
| | "JI", Series 2010-67, Interest Only, 5.0%, 10/20/2033 | 1,379,655 | 103,448 |
| | "IA", Series 2010-58, Interest Only, 5.0%, 3/20/2039 | 3,857,897 | 562,702 |
| | "BI", Series 2010-168, Interest Only, 5.0%, 4/20/2040 | 2,847,087 | 718,817 |
| | "IN", Series 2009-69, Interest Only, 5.5%, 8/20/2039 | 495,734 | 72,740 |
| | "IV", Series 2009-69, Interest Only, 5.5%, 8/20/2039 | 1,012,993 | 150,216 |
| | "KI", Series 2010-130, Interest Only, 5.5%, 9/16/2040 | 327,822 | 58,360 |
| | "IJ", Series 2009-75, Interest Only, 6.0%, 8/16/2039 | 349,950 | 55,768 |
| | Principal Amount ($)(a) | Value ($) |
| | |
| MASTR Alternative Loans Trust: | |
| | "5A1", Series 2005-1, 5.5%, 1/25/2020 | 224,556 | 229,589 |
| | "8A1", Series 2004-3, 7.0%, 4/25/2034 | 10,793 | 10,890 |
Total Collateralized Mortgage Obligations (Cost $10,047,420) | 9,136,305 |
| |
| Government & Agency Obligations 36.6% |
| Sovereign Bonds 4.0% |
| Eskom Holdings SOC Ltd., REG S, 5.75%, 1/26/2021 | | 400,000 | 437,500 |
| Republic of Argentina, GDP Linked Note, 12/15/2035 (d) | | 410,000 | 31,067 |
| Republic of Belarus, 8.95%, 1/26/2018 | | 500,000 | 462,500 |
| Republic of Chile, 3.25%, 9/14/2021 | | 600,000 | 636,000 |
| Republic of Croatia, REG S, 6.75%, 11/5/2019 | | 850,000 | 853,162 |
| Republic of Egypt, 9.1%, 9/20/2012 | EGP | 230,000 | 37,732 |
| Republic of El Salvador, REG S, 8.25%, 4/10/2032 | | 40,000 | 44,600 |
| Republic of Indonesia, REG S, 4.875%, 5/5/2021 | | 800,000 | 872,000 |
| Republic of Lithuania: |
| | REG S, 5.125%, 9/14/2017 | | 200,000 | 211,000 |
| | 144A, 6.125%, 3/9/2021 | | 225,000 | 247,500 |
| Republic of Panama: |
| | 5.2%, 1/30/2020 | | 425,000 | 496,187 |
| | 7.125%, 1/29/2026 | | 220,000 | 297,000 |
| | 7.25%, 3/15/2015 | | 80,000 | 91,400 |
| Republic of Peru, 7.35%, 7/21/2025 | | 500,000 | 702,500 |
| Republic of Poland, 5.0%, 3/23/2022 | | 350,000 | 382,025 |
| Republic of Serbia: |
| | REG S, 6.75%, 11/1/2024 | | 845,834 | 812,000 |
| | REG S, 7.25%, 9/28/2021 | | 300,000 | 308,250 |
| Russian Federation, REG S, 5.0%, 4/29/2020 | | 800,000 | 870,000 |
| | 7,792,423 |
| U.S. Treasury Obligations 32.6% |
| U.S. Treasury Bill, 0.13%**, 9/6/2012 (e) | | 135,000 | 134,983 |
| U.S. Treasury Bonds: |
| | 3.75%, 8/15/2041 | | 2,500,000 | 3,014,845 |
| | 4.75%, 2/15/2037 (b) | | 5,300,000 | 7,387,702 |
| | 5.375%, 2/15/2031 | | 3,500,000 | 5,100,158 |
| | 7.125%, 2/15/2023 | | 1,900,000 | 2,905,218 |
| U.S. Treasury Notes: |
| | 0.5%, 10/15/2013 | | 6,000,000 | 6,016,404 |
| | 1.0%, 1/15/2014 | | 955,000 | 965,035 |
| | 1.0%, 8/31/2016 (b) | | 31,600,000 | 32,096,215 |
| | 1.5%, 7/31/2016 | | 4,250,000 | 4,403,068 |
| | 2.0%, 11/15/2021 | | 1,450,000 | 1,503,356 |
| | 63,526,984 |
Total Government & Agency Obligations (Cost $67,729,947) | 71,319,407 |
| | Principal Amount ($)(a) | Value ($) |
| | |
| Loan Participations and Assignments 0.2% |
| Sovereign Loans |
| Gazprom OAO, 144A, 8.125%, 7/31/2014 | 205,000 | 224,390 |
| Russian Agricultural Bank, REG S, 7.75%, 5/29/2018 | 100,000 | 113,250 |
Total Loan Participations and Assignments (Cost $303,100) | 337,640 |
| |
| Municipal Bonds and Notes 6.8% |
| California, University Revenues, Build America Bonds, 5.946%, 5/15/2045 | 600,000 | 748,368 |
| Chicago, IL, Transit Authority, Sales Tax Receipts Revenue, Build America Bonds, Series B, 6.2%, 12/1/2040 | 265,000 | 292,722 |
| Glendale, AZ, Municipal Property Corp., Excise Tax Revenue, Series B, 6.157%, 7/1/2033, INS: AGMC | 420,000 | 484,903 |
| Gwinnett County, GA, Development Authority Revenue, Gwinnett Stadium Project, 6.4%, 1/1/2028 | 655,000 | 753,263 |
| Jicarilla, NM, Sales & Special Tax Revenue, Apache Nation Revenue, 144A, 5.2%, 12/1/2013 | 630,000 | 629,502 |
| Kentucky, Asset/Liability Commission, General Fund Revenue, 3.165%, 4/1/2018 | 2,075,000 | 2,138,702 |
| Los Angeles, CA, Community Development Agency Tax Allocation Revenue, Adelante Eastside Project, Series C, 6.49%, 9/1/2037, INS: Radian | 310,000 | 311,448 |
| Louisville & Jefferson County, KY, Metropolitan Sewer District & Drain Systems, Build America Bonds, 6.25%, 5/15/2043 | 600,000 | 770,646 |
| Miami-Dade County, FL, Educational Facilities Authority, University of Miami, Series B, 6.1%, 4/1/2015 | 525,000 | 540,640 |
| Michigan, Western Michigan University Revenue, 4.41%, 11/15/2014, INS: AMBAC | 475,000 | 481,132 |
| | Principal Amount ($)(a) | Value ($) |
| | |
| Nashville & Davidson County, TN, Metropolitan Government, Convention Center Authority Revenue, Build America Bonds: | |
| | Series B, 6.731%, 7/1/2043 | 400,000 | 453,932 |
| | Series A2, 7.431%, 7/1/2043 | 250,000 | 315,760 |
| New Jersey, Economic Development Authority Revenue, Series B, 6.5%, 11/1/2013, INS: AGC | 860,000 | 914,103 |
| New Jersey, State Economic Development Authority Revenue, Series B, 6.5%, 11/1/2014, INS: AGC | 585,000 | 644,881 |
| New Jersey, State Educational Facilities Authority Revenue, NJ City University, Series F, 6.85%, 7/1/2036, INS: AGC | 395,000 | 458,263 |
| Newark, NJ, Pension Obligation, 5.853%, 4/1/2022, INS: AGMC | 865,000 | 940,635 |
| Port Authority New York & New Jersey, One Hundred Fiftieth Series, 4.75%, 9/15/2016 | 930,000 | 1,052,881 |
| Rhode Island, Convention Center Authority Revenue, Civic Center, Series A, 6.06%, 5/15/2035, INS: AGMC | 515,000 | 591,019 |
| Virgin Islands, Port Authority Marine Revenue, Series B, 5.08%, 9/1/2013, INS: AGMC | 465,000 | 469,292 |
| Washington, Central Puget Sound Regional Transit Authority, Sales & Use Tax Revenue, Series A, 5.0%, 11/1/2036 | 285,000 | 316,658 |
Total Municipal Bonds and Notes (Cost $12,117,570) | 13,308,750 |
| | | Shares | | | Value ($) | |
| | | | |
| Securities Lending Collateral 5.9% | |
| Daily Assets Fund Institutional, 0.24% (f) (g) (Cost $11,616,210) | | | 11,616,210 | | | | 11,616,210 | |
| | |
| Cash Equivalents 4.3% | |
| Central Cash Management Fund, 0.14% (f) (Cost $8,402,393) | | | 8,402,393 | | | | 8,402,393 | |
| | | % of Net Assets | | | Value ($) | |
| | | | |
Total Investment Portfolio (Cost $233,785,086)+ | | | 122.8 | | | | 239,473,966 | |
| Other Assets and Liabilities, Net | | | (22.8 | ) | | | (44,386,104 | ) |
| Net Assets | | | 100.0 | | | | 195,087,862 | |
* Floating rate securities' yields vary with a designated market index or market rate, such as the coupon-equivalent of the U.S. Treasury Bill rate. These securities are shown at their current rate as of June 30, 2012.
** Annualized yield at time of purchase; not a coupon rate.
+ The cost for federal income tax purposes was $233,785,086. At June 30, 2012, net unrealized appreciation for all securities based on tax cost was $5,688,880. This consisted of aggregate gross unrealized appreciation for all securities in which there was an excess of value over tax cost of $9,440,261 and aggregate gross unrealized depreciation for all securities in which there was an excess of tax cost over value of $3,751,381.
(a) Principal amount stated in U.S. dollars unless otherwise noted.
(b) All or a portion of these securities were on loan (see Notes to Financial Statements). The value of all securities loaned at June 30, 2012 amounted to $11,250,022, which is 5.8% of net assets.
(c) When-issued or delayed delivery security included.
(d) Security is linked to Argentine Republic Gross Domestic Product (GDP). Security does not pay principal over life of security or at expiration. Payments are based on growth of Argentina GDP, subject to certain conditions.
(e) At June 30, 2012, this security has been pledged, in whole or in part, to cover initial margin requirements for open futures contracts.
(f) Affiliated fund managed by Deutsche Investment Management Americas Inc. The rate shown is the annualized seven-day yield at period end.
(g) Represents collateral held in connection with securities lending. Income earned by the Fund is net of borrower rebates.
144A: Security exempt from registration under Rule 144A of the Securities Act of 1933. These securities may be resold in transactions exempt from registration, normally to qualified institutional buyers.
AGC: Assured Guaranty Corp.
AGMC: Assured Guaranty Municipal Corp.
AMBAC: Ambac Financial Group, Inc.
GDP: Gross Domestic Product
INS: Insured
Interest Only: Interest Only (IO) bonds represent the "interest only" portion of payments on a pool of underlying mortgages or mortgage-backed securities. IO securities are subject to prepayment risk of the pool of underlying mortgages.
Radian: Radian Asset Assurance, Inc.
REG S: Securities sold under Regulation S may not be offered, sold or delivered within the United States or to, or for the account or benefit of, U.S. persons, except pursuant to an exemption from, or in a transaction not subject to, the registration requirements of the Securities Act of 1933.
Included in the Fund are investments in mortgage- or asset-backed securities, which are interests in separate pools of mortgages or assets. Effective maturities of these investments may be shorter than stated maturities due to prepayments. Some separate investments in the Federal Home Loan Mortgage Corp. and Federal National Mortgage Association issues have similar coupon rates and have been aggregated for presentation purposes in the investment portfolio.
At June 30, 2012, open futures contracts purchased were as follows:
| Futures | Currency | Expiration Date | | Contracts | | | Notional Value ($) | | | Unrealized Appreciation ($) | |
| Federal Republic of Germany Euro-Bund | EUR | 9/6/2012 | | | 5 | | | | 891,544 | | | | 2,521 | |
At June 30, 2012, open futures contracts sold were as follows:
| Futures | Currency | Expiration Date | | Contracts | | | Notional Value ($) | | | Unrealized Appreciation ($) | |
| 10 Year U.S. Treasury Note | USD | 9/19/2012 | | | 101 | | | | 13,470,875 | | | | 1,700 | |
At June 30, 2012, open credit default swap contracts purchased were as follows:
Effective/ Expiration Date | | Notional Amount ($) | | | Fixed Cash Flows Paid | | Reference Entity | | Value ($) | | | Upfront Payments Paid/(Received) ($) | | | Unrealized Appreciation ($) | |
3/20/2012 6/20/2017 | | | 5,791,500 | 1 | | | 5.0 | % | Markit Dow Jones CDX North America High Yield Index | | | 195,036 | | | | 141,396 | | | | 53,640 | |
3/20/2012 6/20/2017 | | | 18,700,000 | 1 | | | 1.0 | % | Markit Dow Jones CDX North America Investment Grade Index | | | 106,894 | | | | (84,137 | ) | | | 191,031 | |
| Total unrealized appreciation | | | | 244,671 | |
Counterparty: 1 Citigroup, Inc. | |
As of June 30, 2012, the Fund had the following open forward foreign currency exchange contracts:
| Contracts to Deliver | | In Exchange For | | Settlement Date | | Unrealized Appreciation ($) | | Counterparty |
| RUB | | | 800,000 | | USD | | | 26,778 | | 7/19/2012 | | | 2,162 | | JPMorgan Chase Securities, Inc. |
| Contracts to Deliver | | In Exchange For | | Settlement Date | | Unrealized Depreciation ($) | | Counterparty |
| USD | | | 1,111,358 | | CNY | | | 7,000,000 | | 7/19/2012 | | | (10,881 | ) | HSBC Bank U.S.A. |
| Currency Abbreviations |
CNY Chinese Yuan EGP Egyptian Pound EUR Euro RUB Russian Ruble USD United States Dollar |
For information on the Fund's policy and additional disclosures regarding futures contracts, credit default swap contracts and forward foreign currency exchange contracts, please refer to Note B in the accompanying Notes to Financial Statements.
Fair Value Measurements
Various inputs are used in determining the value of the Fund's investments. These inputs are summarized in three broad levels. Level 1 includes quoted prices in active markets for identical securities. Level 2 includes other significant observable inputs (including quoted prices for similar securities, interest rates, prepayment speeds, and credit risk). Level 3 includes significant unobservable inputs (including the Fund's own assumptions in determining the fair value of investments). The inputs or methodology used for valuing securities are not necessarily an indication of the risk associated with investing in those securities.
The following is a summary of the inputs used as of June 30, 2012 in valuing the Fund's investments. For information on the Fund's policy regarding the valuation of investments, please refer to the Security Valuation section of Note A in the accompanying Notes to Financial Statements.
| Assets | | Level 1 | | | Level 2 | | | Level 3 | | | Total | |
| | |
| Fixed Income Investments (h) | |
| Corporate Bonds | | $ | — | | | $ | 47,127,042 | | | $ | — | | | $ | 47,127,042 | |
| Mortgage-Backed Securities Pass-Throughs | | | — | | | | 67,820,167 | | | | — | | | | 67,820,167 | |
| Asset-Backed | | | — | | | | 1,837,712 | | | | — | | | | 1,837,712 | |
| Commercial Mortgage-Backed Securities | | | — | | | | 8,568,340 | | | | — | | | | 8,568,340 | |
| Collateralized Mortgage Obligations | | | — | | | | 9,136,305 | | | | — | | | | 9,136,305 | |
| Government & Agency Obligations | | | — | | | | 71,319,407 | | | | — | | | | 71,319,407 | |
| Loan Participations and Assignments | | | — | | | | 337,640 | | | | — | | | | 337,640 | |
| Municipal Bonds and Notes | | | — | | | | 13,308,750 | | | | — | | | | 13,308,750 | |
| Short-Term Investments (h) | | | 20,018,603 | | | | — | | | | — | | | | 20,018,603 | |
| Derivatives (i) | | | 4,221 | | | | 246,833 | | | | — | | | | 251,054 | |
| Total | | $ | 20,022,824 | | | $ | 219,702,196 | | | $ | — | | | $ | 239,725,020 | |
| Liabilities | |
| Derivatives (i) | | $ | — | | | $ | (10,881 | ) | | $ | — | | | $ | (10,881 | ) |
| Total | | $ | — | | | $ | (10,881 | ) | | $ | — | | | $ | (10,881 | ) |
There have been no transfers between Level 1 and Level 2 fair value measurements during the period ended June 30, 2012.
(h) See Investment Portfolio for additional detailed categorizations.
(i) Derivatives include unrealized appreciation (depreciation) on open futures contracts, credit default swap contracts and forward foreign currency exchange contracts.
The accompanying notes are an integral part of the financial statements.
Statement of Assets and Liabilities | as of June 30, 2012 (Unaudited) | |
| Assets | |
Investments: Investments in non-affiliated securities, at value (cost $213,766,483) — including $11,250,022 of securities loaned | | $ | 219,455,363 | |
Investment in Daily Assets Fund Institutional (cost $11,616,210)* | | | 11,616,210 | |
| Investment in Central Cash Management Fund (cost $8,402,393) | | | 8,402,393 | |
| Total investments, at value (cost $233,785,086) | | | 239,473,966 | |
| Foreign currency, at value (cost $75,071) | | | 70,971 | |
| Deposit from broker for swap contracts | | | 495,000 | |
| Receivable for investments sold | | | 8,279,266 | |
| Receivable for Fund shares sold | | | 105,721 | |
| Interest receivable | | | 1,655,775 | |
| Receivable for variation margin on futures contracts | | | 67,801 | |
| Unrealized appreciation on swap contracts | | | 244,671 | |
| Unrealized appreciation on forward foreign currency exchange contracts | | | 2,162 | |
| Upfront payments paid on swap contracts | | | 141,396 | |
| Foreign taxes recoverable | | | 2,140 | |
| Other assets | | | 90 | |
| Total assets | | | 250,538,959 | |
| Liabilities | |
| Payable upon return of securities loaned | | | 11,616,210 | |
| Payable for investments purchased | | | 1,731,907 | |
| Payable for investments purchased — when-issued/delayed delivery securities | | | 41,245,373 | |
| Payable for Fund shares redeemed | | | 96,701 | |
| Payable upon return of deposit for swap contracts | | | 495,000 | |
| Unrealized depreciation on forward foreign currency exchange contracts | | | 10,881 | |
| Upfront payments received on swap contracts | | | 84,137 | |
| Accrued management fee | | | 62,381 | |
| Accrued Trustees' fees | | | 1,985 | |
| Other accrued expenses and payables | | | 106,522 | |
| Total liabilities | | | 55,451,097 | |
| Net assets, at value | | $ | 195,087,862 | |
| Net Assets Consist of | |
| Undistributed net investment income | | | 1,785,634 | |
Net unrealized appreciation (depreciation) on: Investments | | | 5,688,880 | |
| Swap contracts | | | 244,671 | |
| Futures | | | 4,221 | |
| Foreign currency | | | (12,745 | ) |
| Accumulated net realized gain (loss) | | | (35,397,542 | ) |
| Paid-in capital | | | 222,774,743 | |
| Net assets, at value | | $ | 195,087,862 | |
Class A Net Asset Value, offering and redemption price per share ($195,087,862 ÷ 34,397,873 outstanding shares of beneficial interest, $.01 par value, unlimited number of shares authorized) | | $ | 5.67 | |
* Represents collateral on securities loaned.
The accompanying notes are an integral part of the financial statements.
Statement of Operations
| for the six months ended June 30, 2012 (Unaudited) | |
| Investment Income | |
Income: Interest | | $ | 2,382,089 | |
| Income distributions — Central Cash Management Fund | | | 6,041 | |
| Securities lending income, including income from Daily Assets Fund Institutional, net of borrower rebates | | | 7,326 | |
| Total income | | | 2,395,456 | |
Expenses: Management fee | | | 265,185 | |
| Administration fee | | | 68,803 | |
| Services to shareholders | | | 1,372 | |
| Custodian fee | | | 9,282 | |
| Professional fees | | | 30,672 | |
| Reports to shareholders | | | 25,470 | |
| Trustees' fees and expenses | | | 5,964 | |
| Other | | | 15,142 | |
| Total expenses | | | 421,890 | |
| Net investment income | | | 1,973,566 | |
| Realized and Unrealized Gain (Loss) | |
Net realized gain (loss) from: Investments | | | 2,540,045 | |
| Swap contracts | | | 13,070 | |
| Futures | | | (586,599 | ) |
| Foreign currency | | | (63,945 | ) |
| | | | 1,902,571 | |
Change in net unrealized appreciation (depreciation) on: Investments | | | 745,481 | |
| Swap contracts | | | 244,671 | |
| Futures | | | 300,123 | |
| Foreign currency | | | (30,153 | ) |
| | | | 1,260,122 | |
| Net gain (loss) | | | 3,162,693 | |
| Net increase (decrease) in net assets resulting from operations | | $ | 5,136,259 | |
The accompanying notes are an integral part of the financial statements.
Statement of Changes in Net Assets | Increase (Decrease) in Net Assets | | Six Months Ended June 30, 2012 (Unaudited) | | | Year Ended December 31, 2011 | |
Operations: Net investment income (loss) | | $ | 1,973,566 | | | $ | 4,587,767 | |
| Net realized gain (loss) | | | 1,902,571 | | | | 997,538 | |
| Change in net unrealized appreciation (depreciation) | | | 1,260,122 | | | | 905,689 | |
| Net increase (decrease) in net assets resulting from operations | | | 5,136,259 | | | | 6,490,994 | |
Distributions to shareholders from: Net investment income: Class A | | | (4,882,203 | ) | | | (4,956,830 | ) |
Fund share transactions: Class A Proceeds from shares sold | | | 14,020,950 | | | | 13,875,163 | |
| Net assets acquired in tax free reorganization* | | | 78,348,206 | | | | — | |
| Reinvestment of distributions | | | 4,882,203 | | | | 4,956,830 | |
| Payments for shares redeemed | | | (14,353,372 | ) | | | (63,808,031 | ) |
| Net increase (decrease) in net assets from Class A share transactions | | | 82,897,987 | | | | (44,976,038 | ) |
| Increase (decrease) in net assets | | | 83,152,043 | | | | (43,441,874 | ) |
| Net assets at beginning of period | | | 111,935,819 | | | | 155,377,693 | |
| Net assets at end of period (including undistributed net investment income of $1,785,634 and $4,694,271, respectively) | | $ | 195,087,862 | | | $ | 111,935,819 | |
| Other Information | |
Class A Shares outstanding at beginning of period | | | 19,571,536 | | | | 27,458,970 | |
| Shares sold | | | 2,468,600 | | | | 2,449,457 | |
| Shares issued in tax free reorganization* | | | 13,990,523 | | | | — | |
| Shares issued to shareholders in reinvestment of distributions | | | 873,382 | | | | 891,516 | |
| Shares redeemed | | | (2,506,168 | ) | | | (11,228,407 | ) |
| Net increase (decrease) in Class A shares | | | 14,826,337 | | | | (7,887,434 | ) |
| Shares outstanding at end of period | | | 34,397,873 | | | | 19,571,536 | |
* On April 30, 2012, DWS Core Fixed Income VIP was acquired by the Fund through a tax-free reorganization (see Note H).
The accompanying notes are an integral part of the financial statements.
| | | | | | Years Ended December 31, | |
| Class A | | Six Months Ended 6/30/12 (Unaudited) | | | 2011 | | | 2010 | | | 2009 | | | 2008 | | | 2007 | |
| Selected Per Share Data | |
| Net asset value, beginning of period | | $ | 5.72 | | | $ | 5.66 | | | $ | 5.54 | | | $ | 5.50 | | | $ | 6.98 | | | $ | 7.03 | |
Income (loss) from investment operations: Net investment incomea | | | .08 | | | | .22 | | | | .19 | | | | .25 | | | | .37 | | | | .35 | |
| Net realized and unrealized gain (loss) | | | .13 | | | | .09 | | | | .18 | | | | .26 | | | | (1.48 | ) | | | (.06 | ) |
| Total from investment operations | | | .21 | | | | .31 | | | | .37 | | | | .51 | | | | (1.11 | ) | | | .29 | |
Less distributions from: Net investment income | | | (.26 | ) | | | (.25 | ) | | | (.25 | ) | | | (.47 | ) | | | (.37 | ) | | | (.34 | ) |
| Net asset value, end of period | | $ | 5.67 | | | $ | 5.72 | | | $ | 5.66 | | | $ | 5.54 | | | $ | 5.50 | | | $ | 6.98 | |
| Total Return (%) | | | 3.75 | ** | | | 5.68 | | | | 6.79 | | | | 10.07 | | | | (16.77 | ) | | | 4.18 | |
| Ratios to Average Net Assets and Supplemental Data | |
| Net assets, end of period ($ millions) | | | 195 | | | | 112 | | | | 155 | | | | 159 | | | | 155 | | | | 229 | |
| Ratio of expenses (%) | | | .61 | * | | | .62 | | | | .59 | | | | .59 | | | | .59 | | | | .61 | |
| Ratio of net investment income (%) | | | 2.87 | * | | | 3.86 | | | | 3.42 | | | | 4.68 | | | | 5.76 | | | | 5.03 | |
| Portfolio turnover rate (%) | | | 144 | ** | | | 219 | | | | 357 | | | | 284 | | | | 196 | | | | 185 | |
a Based on average shares outstanding during the period. * Annualized ** Not annualized | |
Notes to Financial Statements (Unaudited)
A. Organization and Significant Accounting Policies
DWS Variable Series I (the "Series") is registered under the Investment Company Act of 1940, as amended (the "1940 Act"), as an open-end, registered management investment company organized as a Massachusetts business trust. The Series consists of five diversified funds: DWS Bond VIP, DWS Core Equity VIP (formerly DWS Growth & Income VIP), DWS Capital Growth VIP, DWS Global Small Cap Growth VIP and DWS International VIP (individually or collectively hereinafter referred to as a "Fund" or the "Funds"). These financial statements report on DWS Bond VIP. The Series is intended to be the underlying investment vehicle for variable annuity contracts and variable life insurance policies to be offered by the separate accounts of certain life insurance companies ("Participating Insurance Companies").
The Fund's financial statements are prepared in accordance with accounting principles generally accepted in the United States of America, which require the use of management estimates. Actual results could differ from those estimates. The policies described below are followed consistently by the Fund in the preparation of its financial statements.
Security Valuation. Investments are stated at value determined as of the close of regular trading on the New York Stock Exchange on each day the exchange is open for trading.
Various inputs are used in determining the value of the Fund's investments. These inputs are summarized in three broad levels. Level 1 includes quoted prices in active markets for identical securities. Level 2 includes other significant observable inputs (including quoted prices for similar securities, interest rates, prepayment speeds, and credit risk). Level 3 includes significant unobservable inputs (including the Fund's own assumptions in determining the fair value of investments). The inputs or methodology used for valuing securities are not necessarily an indication of the risk associated with investing in those securities.
Debt securities and loan participations and assignments are valued at prices supplied by independent pricing services approved by the Trustees of the Series. If the pricing services are unable to provide valuations, securities are valued at the most recent bid quotation or evaluated price, as applicable, obtained from one or more broker-dealers. Such services may use various pricing techniques which take into account appropriate factors such as yield, quality, coupon rate, maturity, type of issue, trading characteristics and other data, as well as broker quotes. These securities are generally categorized as Level 2.
Money market instruments purchased with an original or remaining maturity of sixty days or less, maturing at par, are valued at amortized cost, which approximates value, and are categorized as Level 2. Investments in open-end investment companies are valued at their net asset value each business day and are categorized as Level 1.
Futures contracts are generally valued at the settlement prices established each day on the exchange on which they are traded and are categorized as Level 1.
Swap contracts are valued daily based upon prices supplied by a Board approved pricing vendor, if available, and otherwise are valued at the price provided by the broker-dealer. Swap contracts are generally categorized as Level 2.
Forward currency contracts are valued at the prevailing forward exchange rate of the underlying currencies and are categorized as Level 2.
Securities and other assets for which market quotations are not readily available or for which the above valuation procedures are deemed not to reflect fair value are valued in a manner that is intended to reflect their fair value as determined in accordance with procedures approved by the Trustees and are generally categorized as Level 3. In accordance with the Fund's valuation procedures, factors used in determining value may include, but are not limited to, the type of the security; the size of the holding; the initial cost of the security; the existence of any contractual restrictions on the security's disposition; the price and extent of public trading in similar securities of the issuer or of comparable companies; quotations or evaluated prices from broker-dealers and/or pricing services; information obtained from the issuer, analysts, and/or the appropriate stock exchange (for exchange-traded securities); an analysis of the company's or issuer's financial statements; an evaluation of the forces that influence the issuer and the market(s) in which the security is purchased and sold and with respect to debt securities; the maturity, coupon, creditworthiness, currency denomination and the movement of the market in which the security is normally traded. The value determined under these procedures may differ from published values for the same securities.
Disclosure about the classification of fair value measurements is included in a table following the Fund's Investment Portfolio.
Securities Lending. The Fund lends securities to certain financial institutions. The Fund retains beneficial ownership of the securities it has loaned and continues to receive interest and dividends paid by the issuer of securities and to participate in any changes in their market value. The Fund requires the borrowers of the securities to maintain collateral with the Fund consisting of either cash or liquid, unencumbered assets having a value at least equal to the value of the securities loaned. When the collateral falls below specified amounts, the lending agent will use its best effort to obtain additional collateral on the next business day to meet required amounts under the security lending agreement. The Fund may invest the cash collateral into a joint trading account in an affiliated money market fund pursuant to Exemptive Orders issued by the SEC. The Fund receives compensation for lending its securities either in the form of fees or by earning interest on invested cash collateral net of borrower rebates and fees paid to a lending agent. Either the Fund or the borrower may terminate the loan. There may be risks of delay and costs in recovery of securities or even loss of rights in the collateral should the borrower of the securities fail financially. The Fund is also subject to all investment risks associated with the reinvestment of any cash collateral received, including, but not limited to, interest rate, credit and liquidity risk associated with such investments.
Foreign Currency Translations. The books and records of the Fund are maintained in U.S. dollars. Investment securities and other assets and liabilities denominated in a foreign currency are translated into U.S. dollars at the prevailing exchange rates at period end. Purchases and sales of investment securities, income and expenses are translated into U.S. dollars at the prevailing exchange rates on the respective dates of the transactions.
Net realized and unrealized gains and losses on foreign currency transactions represent net gains and losses between trade and settlement dates on securities transactions, the acquisition and disposition of foreign currencies, and the difference between the amount of net investment income accrued and the U.S. dollar amount actually received. That portion of both realized and unrealized gains and losses on investments that results from fluctuations in foreign currency exchange rates is not separately disclosed but is included with net realized and unrealized gain/appreciation and loss/depreciation on investments.
Loan Participations and Assignments. Loan Participations and Assignments are portions of loans originated by banks and sold in pieces to investors. These U.S. dollar-denominated fixed and floating rate loans ("Loans") in which the Fund invests, are arranged between the borrower and one or more financial institutions ("Lenders"). These Loans may take the form of Senior Loans, which are corporate obligations often issued in connection with recapitalizations, acquisitions, leveraged buy-outs and refinancings, and Sovereign Loans, which are debt instruments between a foreign sovereign entity and one or more financial institutions. The Fund invests in such Loans in the form of participations in Loans ("Participations") or assignments of all or a portion of Loans from third parties ("Assignments"). Participations typically result in the Fund having a contractual relationship only with the Lender, not with the borrower. The Fund has the right to receive payments of principal, interest and any fees to which it is entitled from the Lender selling the Participation and only upon receipt by the Lender of the payments from the borrower. In connection with purchasing Participations, the Fund generally has no right to enforce compliance by the borrower with the terms of the loan agreement relating to the Loan, or any rights of set-off against the borrower, and the Fund will not benefit directly from any collateral supporting the Loan in which it has purchased the Participation. As a result, the Fund assumes the credit risk of both the borrower and the Lender that is selling the Participation. Assignments typically result in the Fund having a direct contractual relationship with the borrower, and the Fund may enforce compliance by the borrower with the terms of the loan agreement. Loans held by the Fund generally in the form of Assignments but the Fund may also invest in Participations. All Loan Participations and Assignments involve interest rate risk, liquidity risk and credit risk, including the potential default or insolvency of the borrower.
When-Issued/Delayed Delivery Securities. The Fund may purchase or sell securities with delivery or payment to occur at a later date beyond the normal settlement period. At the time the Fund enters into a commitment to purchase or sell a security, the transaction is recorded and the value of the transaction is reflected in the net asset value. The price of such security and the date when the security will be delivered and paid for are fixed at the time the transaction is negotiated. The value of the security may vary with market fluctuations. At the time the Fund enters into a purchase transaction it is required to segregate cash or other liquid assets at least equal to the amount of the commitment.
Certain risks may arise upon entering into when-issued or delayed delivery transactions from the potential inability of counterparties to meet the terms of their contracts or if the issuer does not issue the securities due to political, economic, or other factors. Additionally, losses may arise due to changes in the value of the underlying securities.
Federal Income Taxes. The Fund is treated as a separate taxpayer as provided for in the Internal Revenue Code, as amended. It is the Fund's policy to comply with the requirements of the Internal Revenue Code, as amended, which are applicable to regulated investment companies, and to distribute all of its taxable income to the separate accounts of the Participating Insurance Companies which hold its shares.
Under the Regulated Investment Company Modernization Act of 2010, net capital losses may be carried forward indefinitely, and their character is retained as short-term and/or long-term. Previously, net capital losses were carried forward for eight years and treated as short-term losses. As a transition rule, the Act requires that post-enactment net capital losses be used before pre-enactment net capital losses.
At December 31, 2011, the Fund had a net tax basis capital loss carryforward of approximately $36,827,000 of pre-enactment losses, which may be applied against any realized net taxable capital gains of each succeeding year until fully utilized or until December 31, 2017, the expiration date, whichever occurs first.
In addition, from November 1, 2011 through December 31, 2011, the Fund elects to defer qualified late year losses of approximately $503,000 of net long-term realized capital losses and treat them as arising in the fiscal year ending December 31, 2012.
The Fund has reviewed the tax positions for the open tax years as of December 31, 2011 and has determined that no provision for income tax is required in the Fund's financial statements. The Fund's federal tax returns for the prior three fiscal years remain open subject to examination by the Internal Revenue Service.
Distribution of Income and Gains. The Fund will declare and distribute dividends from its net investment income, if any, annually, although additional distributions may be made if necessary. Net realized gains from investment transactions, in excess of available capital loss carryforwards, would be taxable to the Fund if not distributed, and, therefore, will be distributed to shareholders at least annually.
The timing and characterization of certain income and capital gain distributions are determined annually in accordance with federal tax regulations which may differ from accounting principles generally accepted in the United States of America. These differences primarily relate to investments in foreign denominated investments, investments in forward foreign currency exchange contracts, futures contracts, swap contracts and certain securities sold at a loss. As a result, net investment income (loss) and net realized gain (loss) on investment transactions for a reporting period may differ significantly from distributions during such period. Accordingly, the Fund may periodically make reclassifications among certain of its capital accounts without impacting the net asset value of the Fund.
The tax character of current year distributions will be determined at the end of the current fiscal year.
Expenses. Expenses of the Series arising in connection with a specific Fund are allocated to that Fund. Other Series expenses which cannot be directly attributed to a Fund are apportioned among the Funds in the Series.
Contingencies. In the normal course of business, the Fund may enter into contracts with service providers that contain general indemnification clauses. The Fund's maximum exposure under these arrangements is unknown as this would involve future claims that may be made against the Fund that have not yet been made. However, based on experience, the Fund expects the risk of loss to be remote.
Other. Investment transactions are accounted for on a trade date plus one basis for daily net asset value calculations. However, for financial reporting purposes, investment transactions are reported on trade date. Interest income is recorded on the accrual basis net of foreign withholding taxes. Realized gains and losses from investment transactions are recorded on an identified cost basis and may include proceeds from litigation. All discounts and premiums are accreted/amortized for both tax and financial reporting purposes.
B. Derivative Instruments
Futures Contracts. A futures contract is an agreement between a buyer or seller and an established futures exchange or its clearinghouse in which the buyer or seller agrees to take or make a delivery of a specific amount of a financial instrument at a specified price on a specific date (settlement date). For the six months ended June 30, 2012, the Fund invested in interest rate futures to gain exposure to different parts of the yield curve while managing the overall duration. The Fund also entered into currency futures contracts for non-hedging purposes to seek to enhance potential gains.
Upon entering into a futures contract, the Fund is required to deposit with a financial intermediary cash or securities ("initial margin") in an amount equal to a certain percentage of the face value indicated in the futures contract. Subsequent payments ("variation margin") are made or received by the Fund dependent upon the daily fluctuations in the value and are recorded for financial reporting purposes as unrealized gains or losses by the Fund. Gains or losses are realized when the contract expires or is closed. Since all futures contracts are exchange traded, counterparty risk is minimized as the exchange's clearinghouse acts as the counterparty, and guarantees the futures against default.
Certain risks may arise upon entering into futures contracts, including the risk that an illiquid market will limit the Fund's ability to close out a futures contract prior to the settlement date and the risk that the futures contract is not well correlated with the security, index or currency to which it relates. Risk of loss may exceed amounts disclosed in the Statement of Assets and Liabilities.
A summary of the open futures contracts as of June 30, 2012, is included in a table following the Fund's Investment Portfolio. For the six months ended June 30, 2012, the investment in futures contracts purchased had a total notional value generally indicative of a range from approximately $892,000 to $11,890,000, and the investment in futures contracts sold had a total notional value generally indicative of a range from approximately $13,471,000 to $49,190,000.
Credit Default Swap Contracts. A credit default swap is a contract between a buyer and a seller of protection against pre-defined credit events for the reference entity. For the six months ended June 30, 2012, the Fund bought credit default swap contracts to hedge the risk of default on Fund securities. As a seller in the credit default swap contract, the Fund is required to pay the par (or other agreed-upon) value of the referenced entity to the counterparty with the occurrence of a credit event by a third party, such as a U.S. or foreign corporate issuer, on the reference entity, which would likely result in a loss to the Fund. In return, the Fund receives from the counterparty a periodic stream of payments over the term of the contract provided that no credit event has occurred. If no credit event occurs, the Fund keeps the stream of payments with no payment obligations. The Fund buys credit default swap contracts in order to hedge against the risk of a credit event on debt securities, in which case the Fund functions as the counterparty referenced above. This involves the risk that the contract may expire worthless. It also involves counterparty risk that the seller may fail to satisfy its payment obligations to the Fund with the occurrence of a credit event. When the Fund sells a credit default swap contract it will cover its commitment. This may be achieved by, among other methods, maintaining cash or liquid assets equal to the aggregate notional value of the reference entities for all outstanding credit default swap contracts sold by the Fund.
The value of the credit default swap is adjusted daily and the change in value, if any, is recorded daily as unrealized appreciation or depreciation in the Statement of Assets and Liabilities. An upfront payment, if any, made by the Fund is recorded as an asset in the Statement of Assets and Liabilities. An upfront payment, if any, received by the Fund is recorded as a liability in the Statement of Assets and Liabilities. Under the terms of the credit default swap contracts, the Fund receives or makes quarterly payments based on a specified interest rate on a fixed notional amount. These payments are recorded as a realized gain or loss in the Statement of Operations. Payments received or made as a result of a credit event or termination of the contract are recognized, net of a proportional amount of the upfront payment, as realized gains or losses in the Statement of Operations.
A summary of the open credit default swap contracts as of June 30, 2012 is included in a table following the Fund's Investment Portfolio. For the six months ended June 30, 2012, the investment in credit default swap contracts purchased had a total notional value generally indicative of a range from $0 to approximately $24,492,000.
Forward Foreign Currency Exchange Contracts. A forward foreign currency exchange contract ("forward currency contract") is a commitment to purchase or sell a foreign currency at the settlement date at a negotiated rate. The Fund is subject to foreign exchange rate risk in its securities denominated in foreign currencies. Changes in exchange rates between foreign currencies and the U.S. dollar may affect the U.S. dollar value of foreign securities or the income or gains received on these securities. To reduce the effect of currency fluctuations, the Fund may enter into forward currency contracts. For the six months ended June 30, 2012, the Fund invested in forward currency contracts to hedge its exposure to changes in foreign currency exchange rates on its foreign currency denominated securities. In addition, the Fund also engaged in forward currency contracts for non-hedging purposes to seek to enhance potential gains.
Forward currency contracts are valued at the prevailing forward exchange rate of the underlying currencies and unrealized gain (loss) is recorded daily. On the settlement date of the forward currency contract, the Fund records a realized gain or loss equal to the difference between the value of the contract at the time it was opened and the value of the contract at the time it was closed. Certain risks may arise upon entering into forward currency contracts from the potential inability of counterparties to meet the terms of their contracts. The maximum counterparty credit risk to the Fund is measured by the unrealized gain on appreciated contracts. Additionally, when utilizing forward currency contracts to hedge, the Fund gives up the opportunity to profit from favorable exchange rate movements during the term of the contract.
A summary of the open forward currency contracts as of June 30, 2012, is included in a table following the Fund's Investment Portfolio. For the six months ended June 30, 2012, the investment in forward currency contracts U.S. dollars purchased had a total contract value generally indicative of a range from approximately $26,000 to $2,242,000, and the investment in forward currency contracts U.S. dollars sold had a total contract value generally indicative of a range from approximately $1,111,000 to $2,284,000.
The following tables summarize the value of the Fund's derivative instruments held as of June 30, 2012 and the related location in the accompanying Statement of Assets and Liabilities, presented by primary underlying risk exposure:
| Asset Derivatives | | Forward Contracts | | | Swap Contracts | | | Futures Contracts | | | Total | |
| Interest Rate Contracts (a) | | $ | — | | | $ | — | | | $ | 4,221 | | | $ | 4,221 | |
| Credit Contracts (b) | | | — | | | | 244,671 | | | | — | | | | 244,671 | |
| Foreign Exchange Contracts (c) | | | 2,162 | | | | — | | | | — | | | | 2,162 | |
| | | $ | 2,162 | | | $ | 244,671 | | | $ | 4,221 | | | $ | 251,054 | |
Each of the above derivatives is located in the following Statement of Assets and Liabilities accounts:
(a) Includes cumulative appreciation of futures contracts as disclosed in the Investment Portfolio. Unsettled variation margin is disclosed separately within the Statement of Assets and Liabilities.
(b) Unrealized appreciation on swap contracts
(c) Unrealized appreciation on forward foreign currency exchange contracts
| Liability Derivative | | Forward Contracts | |
| Foreign Exchange Contracts (a) | | $ | (10,881 | ) |
The above derivative is located in the following Statement of Assets and Liabilities account:
(a) Unrealized depreciation on forward foreign currency exchange contracts
Additionally, the amount of unrealized and realized gains and losses on derivative instruments recognized in Fund earnings during the six months ended June 30, 2012 and the related location in the accompanying Statement of Operations is summarized in the following tables by primary underlying risk exposure:
| Realized Gain (Loss) | | Forward Contracts | | | Swap Contracts | | | Futures Contracts | | | Total | |
| Interest Rate Contracts (a) | | $ | — | | | $ | — | | | $ | (670,986 | ) | | $ | (670,986 | ) |
| Credit Contracts (b) | | | — | | | | 13,070 | | | | — | | | | 13,070 | |
| Foreign Exchange Contracts (c) | | | (63,733 | ) | | | — | | | | 84,387 | | | | 20,654 | |
| | | $ | (63,733 | ) | | $ | 13,070 | | | $ | (586,599 | ) | | $ | (637,262 | ) |
Each of the above derivatives is located in the following Statement of Operations accounts:
(a) Net realized gain (loss) from futures
(b) Net realized gain (loss) from swap contracts
(c) Net realized gain (loss) from foreign currency (Statement of Operations includes both forward currency contracts and foreign currency transactions)
| Change in Net Unrealized Appreciation (Depreciation) | | Forward Contracts | | | Swap Contracts | | | Futures Contracts | | | Total | |
| Interest Rate Contracts (a) | | $ | — | | | $ | — | | | $ | 321,222 | | | $ | 321,222 | |
| Credit Contracts (b) | | | — | | | | 244,671 | | | | — | | | | 244,671 | |
| Foreign Exchange Contracts (c) | | | (30,180 | ) | | | — | | | | (21,099 | ) | | | (51,279 | ) |
| | | $ | (30,180 | ) | | $ | 244,671 | | | $ | 300,123 | | | $ | 514,614 | |
Each of the above derivatives is located in the following Statement of Operations accounts:
(a) Change in net unrealized appreciation (depreciation) on futures
(b) Change in net unrealized appreciation (depreciation) on swap contracts
(c) Change in net unrealized appreciation (depreciation) on foreign currency (Statement of Operations includes both forward currency contracts and foreign currency transactions)
C. Purchases and Sales of Securities
During the six months ended June 30, 2012, purchases and sales of investment securities (excluding short-term investments and U.S. Treasury obligations) aggregated $195,990,396 and $219,395,801, respectively. Purchases and sales of U.S. Treasury obligations aggregated $47,526,048 and $17,902,453, respectively.
D. Related Parties
Management Agreement. Under the Investment Management Agreement with Deutsche Investment Management Americas Inc. ("DIMA" or the "Advisor"), an indirect, wholly owned subsidiary of Deutsche Bank AG, the Advisor directs the investments of the Fund in accordance with its investment objectives, policies and restrictions. The Advisor determines the securities, instruments and other contracts relating to investments to be purchased, sold or entered into by the Fund.
Pursuant to the Investment Management Agreement with the Advisor, the Fund pays a monthly management fee based on the Fund's average daily net assets, computed and accrued daily and payable monthly, at the following annual rates:
| First $250 million of average daily net assets | | | .390 | % |
| Next $750 million of average daily net assets | | | .365 | % |
| Over $1 billion of average daily net assets | | | .340 | % |
Accordingly, for the six months ended June 30, 2012, the fee pursuant to the Investment Management Agreement was equivalent to an annualized effective rate of 0.39% of the Fund's average daily net assets.
Administration Fee. Pursuant to an Administrative Services Agreement, DIMA provides most administrative services to the Fund. For all services provided under the Administrative Services Agreement, the Fund pays the Advisor an annual fee ("Administration Fee") of 0.10% of the Fund's average daily net assets, computed and accrued daily and payable monthly. For the six months ended June 30, 2012, the Administration Fee was $68,803, of which $15,995 is unpaid.
Service Provider Fees. DWS Investments Service Company ("DISC"), an affiliate of the Advisor, is the transfer agent, dividend-paying agent and shareholder service agent for the Fund. Pursuant to a sub-transfer agency agreement between DISC and DST Systems, Inc. ("DST"), DISC has delegated certain transfer agent, dividend-paying agent and shareholder service agent functions to DST. DISC compensates DST out of the shareholder servicing fee it receives from the Fund. For the six months ended June 30, 2012, the amounts charged to the Fund by DISC aggregated $278, of which $80 is unpaid.
Typesetting and Filing Service Fees. Under an agreement with DIMA, DIMA is compensated for providing typesetting and certain regulatory filing services to the Fund. For the six months ended June 30, 2012, the amount charged to the Fund by DIMA included in the Statement of Operations under "reports to shareholders" aggregated $12,132, of which $5,199 is unpaid.
Trustees' Fees and Expenses. The Fund paid retainer fees to each Trustee not affiliated with the Advisor, plus specified amounts to the Board Chairperson and to each committee Chairperson.
Affiliated Cash Management Vehicle. The Fund may invest uninvested cash balances in Central Cash Management Fund, which is managed by the Advisor. The Fund indirectly bears its proportionate share of the expenses of Central Cash Management Fund. Central Cash Management Fund does not pay the Advisor an investment management fee. Central Cash Management Fund seeks a high level of current income consistent with liquidity and the preservation of capital.
E. Investing in Emerging Markets
Investing in emerging markets may involve special risks and considerations not typically associated with investing in developed markets. These risks include revaluation of currencies, high rates of inflation or deflation, repatriation restrictions on income and capital, and future adverse political, social and economic developments. Moreover, securities issued in these markets may be less liquid, subject to government ownership controls or delayed settlements and may have prices more volatile or less easily assessed than those of comparable securities of issuers in developed markets.
F. Ownership of the Fund
Three participating insurance companies were owners of record of 10% or more of the total outstanding Class A shares of the Fund, owning 29%, 28% and 17%, respectively.
G. Line of Credit
The Fund and other affiliated funds (the "Participants") share in a $375 million revolving credit facility provided by a syndication of banks. The Fund may borrow for temporary or emergency purposes, including the meeting of redemption requests that otherwise might require the untimely disposition of securities. The Participants are charged an annual commitment fee which is allocated based on net assets, among each of the Participants. Interest is calculated at a rate per annum equal to the sum of the Federal Funds Rate plus 1.25 percent plus if LIBOR exceeds the Federal Funds Rate the amount of such excess. The Fund may borrow up to a maximum of 33 percent of its net assets under the agreement. The Fund had no outstanding loans at June 30, 2012.
H. Acquisition of Assets
On April 30, 2012, the Fund acquired all of the net assets of DWS Core Fixed Income VIP pursuant to a plan of reorganization approved by the Board of Trustees on November 18, 2011. The acquisition was accomplished by a tax-free exchange of 8,800,059 Class A shares of DWS Core Fixed Income VIP for 13,990,523 Class A shares of the Fund outstanding on April 30, 2012. DWS Core Fixed Income VIP's net assets at that date, $78,348,206, including $2,794,520 of net unrealized appreciation, were combined with those of the Fund. The aggregate net assets of the Fund immediately before the acquisition were $109,635,421. The combined net assets of the Fund immediately following the acquisition were $187,983,627.
The financial statements reflect the operations of the Fund for the period prior to the acquisition and the combined portfolio for the period subsequent to the fund merger. Assuming the acquisition had been completed on January 1, 2012, the Fund's pro forma results of operations for the six months ended June 30, 2012, are as follows:
| | | Total Aggregated | |
| Net investment income* | | $ | 2,681,472 | |
| Net gain (loss) on investments | | $ | 4,390,065 | |
| Net increase (decrease) in net assets resulting from operations | | $ | 7,071,537 | |
* Net investment income includes $26,856 of pro forma eliminated expenses.
Because the combined investment portfolio has been managed as a single integrated Fund since the acquisition was completed, it is not practicable to separate the amounts of revenue and earnings of DWS Core Fixed Income VIP that have been included in the Fund's Statement of Operations since April 30, 2012.
Information About Your Fund's Expenses (Unaudited)
As an investor of the Fund, you incur two types of costs: ongoing expenses and transaction costs. Ongoing expenses include management fees and other Fund expenses. Examples of transaction costs include contract charges, redemption fees and account maintenance fees, which are not shown in this section. The following tables are intended to help you understand your ongoing expenses (in dollars) of investing in the Fund and to help you compare these expenses with the ongoing expenses of investing in other mutual funds. The example in the table is based on an investment of $1,000 invested at the beginning of the six-month period and held for the entire period (January 1, 2012 to June 30, 2012).
The tables illustrate your Fund's expenses in two ways:
•Actual Fund Return. This helps you estimate the actual dollar amount of ongoing expenses (but not transaction costs) paid on a $1,000 investment in the Fund using the Fund's actual return during the period. To estimate the expenses you paid over the period, simply divide your account value by $1,000 (for example, an $8,600 account value divided by $1,000 = 8.6), then multiply the result by the number in the "Expenses Paid per $1,000" line under the share class you hold.
• Hypothetical 5% Fund Return. This helps you to compare your Fund's ongoing expenses (but not transaction costs) with those of other mutual funds using the Fund's actual expense ratio and a hypothetical rate of return of 5% per year before expenses. Examples using a 5% hypothetical Fund return may be found in the shareholder reports of other mutual funds. The hypothetical account values and expenses may not be used to estimate the actual ending account balance or expenses you paid for the period.
Please note that the expenses shown in these tables are meant to highlight your ongoing expenses only and do not reflect any transaction costs. The "Expenses Paid per $1,000" line of the tables is useful in comparing ongoing expenses only and will not help you determine the relative total expense of owning different funds. If these transaction costs had been included, your costs would have been higher.
Expenses and Value of a $1,000 Investment for the six months ended June 30, 2012 | |
| Actual Fund Return | | Class A | |
| Beginning Account Value 1/1/12 | | $ | 1,000.00 | |
| Ending Account Value 6/30/12 | | $ | 1,037.50 | |
| Expenses Paid per $1,000* | | $ | 3.09 | |
| Hypothetical 5% Fund Return | | Class A | |
| Beginning Account Value 1/1/12 | | $ | 1,000.00 | |
| Ending Account Value 6/30/12 | | $ | 1,021.83 | |
| Expenses Paid per $1,000* | | $ | 3.07 | |
* Expenses are equal to the Fund's annualized expense ratio, multiplied by the average account value over the period, multiplied by 182 (the number of days in the most recent six-month period), then divided by 366.
| Annualized Expense Ratio | Class A |
| DWS Variable Series I — DWS Bond VIP | .61% |
For more information, please refer to the Fund's prospectus.
These tables do not reflect charges and fees ("contract charges") associated with the separate account that invests in the Fund or any variable life insurance policy or variable annuity contract for which the Fund is an investment option.
The Series' policies and procedures for voting proxies for portfolio securities and information about how the Series voted proxies related to its portfolio securities during the 12-month period ended June 30 are available on our Web site — www.dws-investments.com (click on "proxy voting"at the bottom of the page) — or on the SEC's Web site — www.sec.gov. To obtain a written copy of the Series' policies and procedures without charge, upon request, call us toll free at (800) 728-3337.
Summary of Management Fee Evaluation by Independent Fee Consultant
September 26, 2011
Pursuant to an Order entered into by Deutsche Investment Management Americas and affiliates (collectively, "DeAM") with the Attorney General of New York, I, Thomas H. Mack, have been appointed the Independent Fee Consultant for the DWS Funds (formerly the DWS Scudder Funds). My duties include preparing an annual written evaluation of the management fees DeAM charges the Funds, considering among other factors the management fees charged by other mutual fund companies for like services, management fees DeAM charges other clients for like services, DeAM's costs of supplying services under the management agreements and related profit margins, possible economies of scale if a Fund grows larger, and the nature and quality of DeAM's services, including fund performance. This report summarizes my evaluation for 2011, including my qualifications, the evaluation process for each of the DWS Funds, consideration of certain complex-level factors, and my conclusions. I served in substantially the same capacity in 2007, 2008, 2009 and 2010.
Qualifications
For more than 35 years I have served in various professional capacities within the investment management business. I have held investment analysis and advisory positions, including securities analyst, portfolio strategist and director of investment policy with a large investment firm. I have also performed business management functions, including business development, financial management and marketing research and analysis.
Since 1991, I have been an independent consultant within the asset management industry. I have provided services to over 125 client organizations, including investment managers, mutual fund boards, product distributors and related organizations. Over the past ten years I have completed a number of assignments for mutual fund boards, specifically including assisting boards with management contract renewal.
I hold a Master of Business Administration degree, with highest honors, from Harvard University and Master of Science and Bachelor of Science (highest honors) degrees from the University of California at Berkeley. I am an independent director and audit committee financial expert for two closed-end mutual funds and have served in various leadership and financial oversight capacities with non-profit organizations.
Evaluation of Fees for each DWS Fund
My work focused primarily on evaluating, fund-by-fund, the fees charged to each of the 109 mutual fund portfolios in the DWS Fund family. For each Fund, I considered each of the key factors mentioned above, as well as any other relevant information. In doing so I worked closely with the Funds' Independent Directors in their annual contract renewal process, as well as in their approval of contracts for several new funds (documented separately).
In evaluating each Fund's fees, I reviewed comprehensive materials provided by or on behalf of DeAM, including expense information prepared by Lipper Analytical, comparative performance information, profitability data, manager histories, and other materials. I also accessed certain additional information from the Lipper and Morningstar databases and drew on my industry knowledge and experience.
To facilitate evaluating this considerable body of information, I prepared for each Fund a document summarizing the key data elements in each area as well as additional analytics discussed below. This made it possible to consider each key data element in the context of the others.
In the course of contract renewal, DeAM agreed to implement a number of fee and expense adjustments requested by the Independent Directors which will favorably impact future fees and expenses, and my evaluation includes the effects of these changes.
Fees and Expenses Compared with Other Funds
The competitive fee and expense evaluation for each fund focused on two primary comparisons:
The Fund's contractual management fee (the advisory fee plus the administration fee where applicable) compared with those of a group of typically 12-15 funds in the same Lipper investment category (e.g. Large Capitalization Growth) having similar distribution arrangements and being of similar size.
The Fund's total expenses compared with a broader universe of funds from the same Lipper investment category and having similar distribution arrangements.
These two comparisons provide a view of not only the level of the fee compared with funds of similar scale but also the total expense the Fund bears for all the services it receives, in comparison with the investment choices available in the Fund's investment category and distribution channel. The principal figure-of-merit used in these comparisons was the subject Fund's percentile ranking against peers.
DeAM's Fees for Similar Services to Others
DeAM provided management fee schedules for all of its US domiciled fund and non-fund investment management accounts in any of the investment categories where there is a DWS Fund. These similar products included the other DWS Funds, non-fund pooled accounts, institutional accounts and sub-advisory accounts. Using this information, I calculated for each Fund the fee that would be charged to each similar product, at the subject Fund's asset level.
Evaluating information regarding non-fund products is difficult because there are varying levels of services required for different types of accounts, with mutual funds generally requiring considerably more regulatory and administrative types of service as well as having more frequent cash flows than other types of accounts. Also, while mutual fund fees for similar fund products can be expected to be similar, there will be some differences due to different pricing conditions in different distribution channels (e.g. retail funds versus those used in variable insurance products), differences in underlying investment processes and other factors.
Costs and Profit Margins
DeAM provided a detailed profitability analysis for each Fund. After making some adjustments so that the presentation would be more comparable to the available industry figures, I reviewed profit margins from investment management alone, from investment management plus other fund services (excluding distribution) provided to the Funds by DeAM (principally shareholder services), and DeAM profits from all sources, including distribution. A later section comments on overall profitability.
Economies of Scale
Economies of scale — an expected decline in management cost per dollar of fund assets as fund assets grow — are very rarely quantified and documented because of inherent difficulties in collecting and analyzing relevant data. However, in virtually every investment category that I reviewed, larger funds tend to have lower fees and lower total expenses than smaller funds. To see how each DWS Fund compares with this industry observation, I reviewed:
The trend in Fund assets over the last five years and the accompanying trend in total expenses. This shows if the Fund has grown and, if so, whether total expense (management fees as well as other expenses) have declined as a percent of assets.
Whether the Fund has break-points in its management fee schedule, the extent of the fee reduction built into the schedule and the asset levels where the breaks take effect, and in the case of a sub-advised Fund how the Fund's break-points compare with those of the sub-advisory fee schedule.
How the Fund's contractual fee schedule compares with trends in the industry data. To accomplish this, I constructed a chart showing how actual latest-fiscal-year contractual fees of the Fund and of other similar funds relate to average fund assets, with the subject Fund's contractual fee schedule superimposed.
Quality of Service — Performance
The quality-of-service evaluation focused on investment performance, which is the principal result of the investment management service. Each Fund's performance was reviewed over the past 1, 3, 5 and 10 years, as applicable, and compared with that of other funds in the same investment category and with a suitable market index.
In addition, I calculated and reviewed risk-adjusted returns relative to an index of similar mutual funds' returns and a suitable market index. The risk-adjusted returns analysis provides a way of determining the extent to which the Fund's return comparisons are mainly the product of investment value-added (or lack thereof) or alternatively taking considerably more or less risk than is typical in its investment category.
I also received and considered the history of portfolio manager changes for each Fund, as this provided an important context for evaluating the performance results.
Complex-Level Considerations
While this evaluation was conducted mainly at the individual fund level, there are some issues relating to the reasonableness of fees that can alternatively be considered across the whole fund complex:
I reviewed DeAM's profitability analysis for all DWS Funds, with a view toward determining if the allocation procedures used were reasonable and how profit levels compared with public data for other investment managers.
I considered whether DeAM and affiliates receive any significant ancillary or "fall-out" benefits that should be considered in interpreting the direct profitability results. These would be situations where serving as the investment manager of the Funds is beneficial to another part of the Deutsche Bank organization.
I considered how aggregated DWS Fund expenses had varied over the years, by asset class and in the context of trends in asset levels.
I reviewed the structure of the DeAM organization, trends in staffing levels, and information on compensation of investment management and other professionals compared with industry data.
Findings
Based on the process and analysis discussed above, which included reviewing a wide range of information from management and external data sources and considering among other factors the fees DeAM charges other clients, the fees charged by other fund managers, DeAM's costs and profits associated with managing the Funds, economies of scale, possible fall-out benefits, and the nature and quality of services provided, in my opinion the management fees charged the DWS Funds are reasonable.
Thomas H. Mack
President, Thomas H. Mack & Co., Inc.
Notes
DWS Investments Distributors, Inc.
222 South Riverside Plaza
Chicago, IL 60606
(800) 621-1148
VS1bond-3 (R-028373-1 8/12)

JUNE 30, 2012
SEMIANNUAL REPORT
DWS VARIABLE SERIES I
DWS Capital Growth VIP
Contents
4 Portfolio Management Team 8 Statement of Assets and Liabilities 9 Statement of Operations 10 Statement of Changes in Net Assets 14 Notes to Financial Statements 18 Information About Your Fund's Expenses 20 Summary of Management Fee Evaluation by Independent Fee Consultant |
This report must be preceded or accompanied by a prospectus. To obtain an additional prospectus or summary prospectus, if available, call (800) 728-3337 or your financial representative. We advise you to consider the Fund's objectives, risks, charges and expenses carefully before investing. The summary prospectus and prospectus contain this and other important information about the Fund. Please read the prospectus carefully before you invest.
The Fund may lend securities to approved institutions. Stocks may decline in value. See the prospectus for details.
DWS Investments is part of Deutsche Bank's Asset Management division and, within the U.S., represents the retail asset management activities of Deutsche Bank AG, Deutsche Bank Trust Company Americas, Deutsche Investment Management Americas Inc. and DWS Trust Company.
NOT FDIC/NCUA INSURED NO BANK GUARANTEE MAY LOSE VALUE NOT A DEPOSIT
NOT INSURED BY ANY FEDERAL GOVERNMENT AGENCY
Performance Summary June 30, 2012 (Unaudited)
Fund performance shown is historical, assumes reinvestment of all dividend and capital gain distributions, and does not guarantee future results. Investment return and principal value fluctuate with changing market conditions so that, when redeemed, shares may be worth more or less than their original cost. Current performance may be lower or higher than the performance data quoted. Please contact your participating insurance company for the Fund's most recent month-end performance. Performance doesn't reflect charges and fees ("contract charges") associated with the separate account that invests in the Fund or any variable life insurance policy or variable annuity contract for which the Fund is an investment option. These charges and fees will reduce returns. While all share classes have the same underlying portfolio, their performance will differ.
The gross expense ratios of the Fund, as stated in the fee table of the prospectus dated May 1, 2012 are 0.50% and 0.84% for Class A and Class B shares, respectively, and may differ from the expense ratios disclosed in the Financial Highlights tables in this report.
| Growth of an Assumed $10,000 Investment |
| The Russell 1000® Growth Index is an unmanaged, capitalization-weighted index containing those securities in the Russell 1000® Index with higher price-to-book ratios and higher forecasted growth values. Index returns do not reflect any fees or expenses and it is not possible to invest directly into an index. |
| |
| Yearly periods ended June 30 | |
| Comparative Results | |
| DWS Capital Growth VIP | | 6-Month‡ | | | 1-Year | | | 3-Year | | | 5-Year | | | 10-Year | |
| Class A | Growth of $10,000 | | $ | 11,079 | | | $ | 10,210 | | | $ | 14,736 | | | $ | 11,066 | | | $ | 17,047 | |
| Average annual total return | | | 10.79 | % | | | 2.10 | % | | | 13.80 | % | | | 2.05 | % | | | 5.48 | % |
| Russell 1000 Growth Index | Growth of $10,000 | | $ | 11,008 | | | $ | 10,576 | | | $ | 16,223 | | | $ | 11,518 | | | $ | 17,953 | |
| Average annual total return | | | 10.08 | % | | | 5.76 | % | | | 17.50 | % | | | 2.87 | % | | | 6.03 | % |
| DWS Capital Growth VIP | | 6-Month‡ | | | 1-Year | | | 3-Year | | | 5-Year | | | 10-Year | |
| Class B | Growth of $10,000 | | $ | 11,056 | | | $ | 10,177 | | | $ | 14,596 | | | $ | 10,885 | | | $ | 16,480 | |
| Average annual total return | | | 10.56 | % | | | 1.77 | % | | | 13.43 | % | | | 1.71 | % | | | 5.12 | % |
| Russell 1000 Growth Index | Growth of $10,000 | | $ | 11,008 | | | $ | 10,576 | | | $ | 16,223 | | | $ | 11,518 | | | $ | 17,953 | |
| Average annual total return | | | 10.08 | % | | | 5.76 | % | | | 17.50 | % | | | 2.87 | % | | | 6.03 | % |
The growth of $10,000 is cumulative.
‡ Total returns shown for periods less than one year are not annualized.
Portfolio Summary (Unaudited) Asset Allocation (As a % of Investment Portfolio excluding Securities Lending Collateral) | 6/30/12 | 12/31/11 |
| | | |
| Common Stocks | 97% | 98% |
| Cash Equivalents | 3% | 2% |
| | 100% | 100% |
Sector Diversification (As a % of Common Stocks and Convertible Preferred Stocks) | 6/30/12 | 12/31/11 |
| | | |
| Information Technology | 33% | 31% |
| Consumer Discretionary | 15% | 13% |
| Industrials | 13% | 14% |
| Health Care | 12% | 10% |
| Consumer Staples | 11% | 10% |
| Energy | 6% | 12% |
| Financials | 5% | 5% |
| Materials | 4% | 4% |
| Utilities | 1% | 1% |
| | 100% | 100% |
Portfolio holdings and characteristics are subject to change.
For more complete details about the Fund's investment portfolio, see page 5.
Following the Fund's fiscal first and third quarter-end, a complete portfolio holdings listing is filed with the SEC on Form N-Q. The form will be available on the SEC's Web site at www.sec.gov, and it also may be reviewed and copied at the SEC's Public Reference Room in Washington, D.C. Information on the operation of the SEC's Public Reference Room may be obtained by calling (800) SEC-0330. The Fund's portfolio holdings are also posted on www.dws-investments.com from time to time. Please see the Fund's current prospectus for more information.
Portfolio Management Team
Owen Fitzpatrick, CFA
Lead Portfolio Manager
Thomas M. Hynes, Jr., CFA
Brendan O'Neill, CFA
Portfolio Managers
Investment Portfolio June 30, 2012 (Unaudited) | | | Shares | | | Value ($) | |
| | | | |
| Common Stocks 98.8% | |
| Consumer Discretionary 14.3% | |
| Auto Components 0.8% | |
| BorgWarner, Inc.* (a) | | | 86,453 | | | | 5,670,452 | |
| Hotels, Restaurants & Leisure 2.7% | |
| McDonald's Corp. | | | 85,761 | | | | 7,592,421 | |
| Starwood Hotels & Resorts Worldwide, Inc. (a) | | | 137,050 | | | | 7,269,132 | |
| Wynn Resorts Ltd. | | | 41,526 | | | | 4,307,077 | |
| | | | | | | | 19,168,630 | |
| Media 1.9% | |
| Comcast Corp. "A" | | | 172,105 | | | | 5,502,197 | |
| News Corp. "A" (a) | | | 365,075 | | | | 8,137,522 | |
| | | | | | | | 13,639,719 | |
| Multiline Retail 0.9% | |
| Dollar General Corp.* (a) | | | 124,494 | | | | 6,771,229 | |
| Specialty Retail 4.9% | |
| Bed Bath & Beyond, Inc.* (a) | | | 123,309 | | | | 7,620,496 | |
| Dick's Sporting Goods, Inc. (a) | | | 175,329 | | | | 8,415,792 | |
| GNC Holdings, Inc. "A" (a) | | | 110,260 | | | | 4,322,192 | |
| Limited Brands, Inc. (a) | | | 238,180 | | | | 10,129,795 | |
| Sally Beauty Holdings, Inc.* | | | 190,055 | | | | 4,892,016 | |
| | | | | | | | 35,380,291 | |
| Textiles, Apparel & Luxury Goods 3.1% | |
| Coach, Inc. (a) | | | 138,518 | | | | 8,100,532 | |
| NIKE, Inc. "B" (a) | | | 166,097 | | | | 14,579,995 | |
| | | | | | | | 22,680,527 | |
| Consumer Staples 11.4% | |
| Beverages 3.7% | |
| Beam, Inc. | | | 170,364 | | | | 10,646,046 | |
| PepsiCo, Inc. (a) | | | 223,700 | | | | 15,806,642 | |
| | | | | | | | 26,452,688 | |
| Food & Staples Retailing 6.1% | |
| Costco Wholesale Corp. (a) | | | 207,166 | | | | 19,680,770 | |
| Wal-Mart Stores, Inc. | | | 92,676 | | | | 6,461,371 | |
| Whole Foods Market, Inc. (a) | | | 186,194 | | | | 17,748,012 | |
| | | | | | | | 43,890,153 | |
| Food Products 1.6% | |
| Kraft Foods, Inc. "A" | | | 308,503 | | | | 11,914,386 | |
| Energy 6.1% | |
| Energy Equipment & Services 3.0% | |
| National Oilwell Varco, Inc. | | | 109,848 | | | | 7,078,605 | |
| Oil States International, Inc.* | | | 56,597 | | | | 3,746,722 | |
| Schlumberger Ltd. (a) | | | 163,976 | | | | 10,643,682 | |
| | | | | | | | 21,469,009 | |
| Oil, Gas & Consumable Fuels 3.1% | |
| Anadarko Petroleum Corp. | | | 162,958 | | | | 10,787,819 | |
| Concho Resources, Inc.* | | | 35,344 | | | | 3,008,481 | |
| EOG Resources, Inc. (a) | | | 99,660 | | | | 8,980,363 | |
| | | | | | | | 22,776,663 | |
| Financials 5.2% | |
| Capital Markets 2.3% | |
| Ameriprise Financial, Inc. (a) | | | 74,864 | | | | 3,912,393 | |
| T. Rowe Price Group, Inc. (a) | | | 198,766 | | | | 12,514,307 | |
| | | | | | | | 16,426,700 | |
| | | Shares | | | Value ($) | |
| | | | | | | | | |
| Consumer Finance 1.3% | |
| Discover Financial Services | | | 283,050 | | | | 9,787,869 | |
| Real Estate Investment Trusts 1.6% | |
| American Tower Corp. (REIT) | | | 165,037 | | | | 11,537,737 | |
| Health Care 12.3% | |
| Biotechnology 5.5% | |
| Celgene Corp.* (a) | | | 255,814 | | | | 16,413,026 | |
| Cepheid, Inc.* (a) | | | 173,232 | | | | 7,752,132 | |
| Gilead Sciences, Inc.* (a) | | | 219,828 | | | | 11,272,780 | |
| Medivation, Inc.* (a) | | | 28,248 | | | | 2,581,867 | |
| Vertex Pharmaceuticals, Inc.* (a) | | | 30,629 | | | | 1,712,774 | |
| | | | | | | | 39,732,579 | |
| Health Care Equipment & Supplies 1.9% | |
| CareFusion Corp.* | | | 257,556 | | | | 6,614,038 | |
| St. Jude Medical, Inc. (a) | | | 169,550 | | | | 6,766,741 | |
| | | | | | | | 13,380,779 | |
| Health Care Providers & Services 3.8% | |
| Express Scripts Holding Co.* (a) | | | 308,481 | | | | 17,222,494 | |
| McKesson Corp. (a) | | | 108,471 | | | | 10,169,156 | |
| | | | | | | | 27,391,650 | |
| Life Sciences Tools & Services 1.1% | |
| Thermo Fisher Scientific, Inc. | | | 152,697 | | | | 7,926,501 | |
| Industrials 12.6% | |
| Aerospace & Defense 1.2% | |
| TransDigm Group, Inc.* | | | 65,672 | | | | 8,819,750 | |
| Commercial Services & Supplies 0.8% | |
| Stericycle, Inc.* (a) | | | 63,991 | | | | 5,866,055 | |
| Electrical Equipment 3.2% | |
| AMETEK, Inc. (a) | | | 204,966 | | | | 10,229,853 | |
| Regal-Beloit Corp. (a) | | | 57,022 | | | | 3,550,190 | |
| Roper Industries, Inc. (a) | | | 91,994 | | | | 9,068,768 | |
| | | | | | | | 22,848,811 | |
| Industrial Conglomerates 2.3% | |
| General Electric Co. (a) | | | 771,818 | | | | 16,084,687 | |
| Machinery 3.7% | |
| Dover Corp. (a) | | | 128,534 | | | | 6,890,708 | |
| Navistar International Corp.* (a) | | | 125,358 | | | | 3,556,406 | |
| Parker Hannifin Corp. (a) | | | 143,142 | | | | 11,004,757 | |
| SPX Corp. (a) | | | 81,621 | | | | 5,331,484 | |
| | | | | | | | 26,783,355 | |
| Road & Rail 1.4% | |
| Norfolk Southern Corp. | | | 141,754 | | | | 10,173,685 | |
| Information Technology 32.7% | |
| Communications Equipment 3.6% | |
| QUALCOMM, Inc. (a) | | | 464,433 | | | | 25,859,629 | |
| Computers & Peripherals 13.2% | |
| Apple, Inc.* (a) | | | 128,568 | | | | 75,083,712 | |
| EMC Corp.* (a) | | | 801,112 | | | | 20,532,501 | |
| | | | | | | | 95,616,213 | |
| Internet Software & Services 2.2% | |
| Google, Inc. "A"* (a) | | | 27,288 | | | | 15,828,950 | |
| | | Shares | | | Value ($) | |
| | | | | | | | | |
| IT Services 4.4% | |
| Accenture PLC "A" (a) | | | 249,684 | | | | 15,003,512 | |
| International Business Machines Corp. | | | 68,167 | | | | 13,332,102 | |
| VeriFone Systems, Inc.* (a) | | | 108,861 | | | | 3,602,210 | |
| | | | | | | | 31,937,824 | |
| Semiconductors & Semiconductor Equipment 1.6% | |
| Skyworks Solutions, Inc.* (a) | | | 164,118 | | | | 4,491,910 | |
| Teradyne, Inc.* (a) | | | 105,110 | | | | 1,477,846 | |
| Texas Instruments, Inc. | | | 190,449 | | | | 5,463,982 | |
| | | | | �� | | | 11,433,738 | |
| Software 7.7% | |
| Check Point Software Technologies Ltd.* (a) | | | 133,023 | | | | 6,596,611 | |
| Citrix Systems, Inc.* | | | 114,249 | | | | 9,590,061 | |
| Microsoft Corp. | | | 584,446 | | | | 17,878,203 | |
| Oracle Corp. | | | 622,422 | | | | 18,485,933 | |
| Solera Holdings, Inc. | | | 67,043 | | | | 2,801,727 | |
| | | | | | | | 55,352,535 | |
| Materials 3.7% | |
| Chemicals 2.0% | |
| Ecolab, Inc. (a) | | | 148,968 | | | | 10,208,777 | |
| Monsanto Co. | | | 45,449 | | | | 3,762,268 | |
| | | | | | | | 13,971,045 | |
| Metals & Mining 1.7% | |
| Freeport-McMoRan Copper & Gold, Inc. | | | 276,681 | | | | 9,426,522 | |
| Walter Energy, Inc. | | | 64,924 | | | | 2,867,044 | |
| | | | | | | | 12,293,566 | |
| | | Shares | | | Value ($) | |
| | | | | | | | | |
| Utilities 0.5% | |
| Water Utilities | |
| American Water Works Co., Inc. | | | 106,176 | | | | 3,639,713 | |
Total Common Stocks (Cost $484,601,560) | | | | 712,507,118 | |
| | |
| Convertible Preferred Stocks 0.1% | |
| Industrials | |
| United Technologies Corp., 7.5% (Cost $427,950) | | | 8,559 | | | | 450,974 | |
| | |
| Securities Lending Collateral 27.2% | |
| Daily Assets Fund Institutional, 0.24% (b) (c) (Cost $196,623,815) | | | 196,623,815 | | | | 196,623,815 | |
| | |
| Cash Equivalents 3.3% | |
| Central Cash Management Fund, 0.14% (b) (Cost $23,513,600) | | | 23,513,600 | | | | 23,513,600 | |
| | | % of Net Assets | | | Value ($) | |
| | | | |
Total Investment Portfolio (Cost $705,166,925)+ | | | 129.4 | | | | 933,095,507 | |
| Other Assets and Liabilities, Net | | | (29.4 | ) | | | (211,744,043 | ) |
| Net Assets | | | 100.0 | | | | 721,351,464 | |
* Non-income producing security.
+ The cost for federal income tax purposes was $708,735,459. At June 30, 2012, net unrealized appreciation for all securities based on tax cost was $224,360,048. This consisted of aggregate gross unrealized appreciation for all securities in which there was an excess of value over tax cost of $248,451,543 and aggregate gross unrealized depreciation for all securities in which there was an excess of tax cost over value of $24,091,495.
(a) All or a portion of these securities were on loan (see Notes to Financial Statements). The value of all securities loaned at June 30, 2012 amounted to $197,266,103, which is 27.3% of net assets.
(b) Affiliated fund managed by Deutsche Investment Management Americas Inc. The rate shown is the annualized seven-day yield at period end.
(c) Represents collateral held in connection with securities lending. Income earned by the Fund is net of borrower rebates.
REIT: Real Estate Investment Trust
Fair Value Measurements
Various inputs are used in determining the value of the Fund's investments. These inputs are summarized in three broad levels. Level 1 includes quoted prices in active markets for identical securities. Level 2 includes other significant observable inputs (including quoted prices for similar securities, interest rates, prepayment speeds, and credit risk). Level 3 includes significant unobservable inputs (including the Fund's own assumptions in determining the fair value of investments). The inputs or methodology used for valuing securities are not necessarily an indication of the risk associated with investing in those securities.
The following is a summary of the inputs used as of June 30, 2012 in valuing the Fund's investments. For information on the Fund's policy regarding the valuation of investments, please refer to the Security Valuation section of Note A in the accompanying Notes to Financial Statements.
| Assets | | Level 1 | | | Level 2 | | | Level 3 | | | Total | |
| | |
| Common Stocks (d) | | $ | 712,507,118 | | | $ | — | | | $ | — | | | $ | 712,507,118 | |
| Convertible Preferred Stocks | | | 450,974 | | | | — | | | | — | | | | 450,974 | |
| Short-Term Investments (d) | | | 220,137,415 | | | | — | | | | — | | | | 220,137,415 | |
| Total | | $ | 933,095,507 | | | $ | — | | | $ | — | | | $ | 933,095,507 | |
There have been no transfers between Level 1 and Level 2 fair value measurements during the period ended June 30, 2012.
(d) See Investment Portfolio for additional detailed categorizations.
The accompanying notes are an integral part of the financial statements.
Statement of Assets and Liabilities | as of June 30, 2012 (Unaudited) | |
| Assets | |
Investments: Investments in non-affiliated securities, at value (cost $485,029,510) — including $197,266,103 of securities loaned | | $ | 712,958,092 | |
| Investment in Daily Assets Fund Institutional (cost $196,623,815)* | | | 196,623,815 | |
| Investment in Central Cash Management Fund (cost $23,513,600) | | | 23,513,600 | |
| Total investments in securities, at value (cost $705,166,925) | | | 933,095,507 | |
| Cash | | | 10,000 | |
| Foreign currency, at value (cost $19,087) | | | 20,717 | |
| Receivable for Fund shares sold | | | 11,060 | |
| Dividends receivable | | | 645,982 | |
| Interest receivable | | | 16,707 | |
| Foreign taxes recoverable | | | 29,722 | |
| Other assets | | | 3,685 | |
| Total assets | | | 933,833,380 | |
| Liabilities | |
| Payable upon return of securities loaned | | | 196,623,815 | |
| Payable for investments purchased | | | 14,923,913 | |
| Payable for Fund shares redeemed | | | 527,302 | |
| Accrued management fee | | | 217,168 | |
| Accrued Trustees' fees | | | 4,970 | |
| Other accrued expenses and payables | | | 184,748 | |
| Total liabilities | | | 212,481,916 | |
| Net assets, at value | | $ | 721,351,464 | |
| Net Assets Consist of | |
| Undistributed net investment income | | | 2,234,843 | |
Net unrealized appreciation (depreciation) on: Investments | | | 227,928,582 | |
| Foreign currency | | | 5,327 | |
| Accumulated net realized gain (loss) | | | (101,701,519 | ) |
| Paid-in capital | | | 592,884,231 | |
| Net assets, at value | | $ | 721,351,464 | |
Class A Net Asset Value, offering and redemption price per share ($707,911,822 ÷ 34,688,095 outstanding shares of beneficial interest, $.01 par value, unlimited number of shares authorized) | | $ | 20.41 | |
Class B Net Asset Value, offering and redemption price per share ($13,439,642 ÷ 660,180 outstanding shares of beneficial interest, $.01 par value, unlimited number of shares authorized) | | $ | 20.36 | |
* Represents collateral on securities loaned.
The accompanying notes are an integral part of the financial statements.
Statement of Operations
| for the six months ended June 30, 2012 (Unaudited) | |
| Investment Income | |
Income: Dividends | | $ | 4,098,304 | |
| Income distributions — Central Cash Management Fund | | | 6,070 | |
| Securities lending income, including income from Daily Assets Fund Institutional, net of borrower rebates | | | 150,399 | |
| Total income | | | 4,254,773 | |
Expenses: Management fee | | | 1,378,604 | |
| Administration fee | | | 369,185 | |
| Services to shareholders | | | 2,740 | |
| Distribution service fee (Class B) | | | 17,242 | |
| Record keeping fee (Class B) | | | 5,724 | |
| Custodian fee | | | 10,646 | |
| Professional fees | | | 27,232 | |
| Reports to shareholders | | | 33,100 | |
| Trustees' fees and expenses | | | 19,868 | |
| Other | | | 18,652 | |
| Total expenses | | | 1,882,993 | |
| Net investment income (loss) | | | 2,371,780 | |
| Realized and Unrealized Gain (Loss) | |
| Net realized gain (loss) from investments | | | 29,626,784 | |
Change in net unrealized appreciation (depreciation) on: Investments | | | 42,421,116 | |
| Foreign currency | | | (483 | ) |
| | | | 42,420,633 | |
| Net gain (loss) | | | 72,047,417 | |
| Net increase (decrease) in net assets resulting from operations | | $ | 74,419,197 | |
The accompanying notes are an integral part of the financial statements.
Statement of Changes in Net Assets | Increase (Decrease) in Net Assets | | Six Months Ended June 30, 2012 (Unaudited) | | | Year Ended December 31, 2011 | |
Operations: Net investment income (loss) | | $ | 2,371,780 | | | $ | 6,429,336 | |
| Net realized gain (loss) | | | 29,626,784 | | | | 28,062,634 | |
| Change in net unrealized appreciation (depreciation) | | | 42,420,633 | | | | (77,914,193 | ) |
| Net increase (decrease) in net assets resulting from operations | | | 74,419,197 | | | | (43,422,223 | ) |
Distributions to shareholders from: Net investment income: Class A | | | (6,353,433 | ) | | | (5,283,454 | ) |
| Class B | | | (73,349 | ) | | | (48,050 | ) |
| Total distributions | | | (6,426,782 | ) | | | (5,331,504 | ) |
Fund share transactions: Class A Proceeds from shares sold | | | 9,519,584 | | | | 10,917,405 | |
Net assets acquired in tax-free reorganization* | | | — | | | | 126,872,037 | |
| Reinvestment of distributions | | | 6,353,433 | | | | 5,283,454 | |
| Payments for shares redeemed | | | (52,058,474 | ) | | | (146,734,714 | ) |
| Net increase (decrease) in net assets from Class A share transactions | | | (36,185,457 | ) | | | (3,661,818 | ) |
Class B Proceeds from shares sold | | | 362,719 | | | | 822,574 | |
Net assets acquired in tax-free reorganization* | | | — | | | | 3,304,909 | |
| Reinvestment of distributions | | | 73,349 | | | | 48,050 | |
| Payments for shares redeemed | | | (1,210,000 | ) | | | (2,497,610 | ) |
| Net increase (decrease) in net assets from Class B share transactions | | | (773,932 | ) | | | 1,677,923 | |
| Increase (decrease) in net assets | | | 31,033,026 | | | | (50,737,622 | ) |
| Net assets at beginning of period | | | 690,318,438 | | | | 741,056,060 | |
| Net assets at end of period (including undistributed net investment income of $2,234,843 and $6,289,845, respectively) | | $ | 721,351,464 | | | $ | 690,318,438 | |
| Other Information | |
Class A Shares outstanding at beginning of period | | | 36,451,466 | | | | 37,210,167 | |
| Shares sold | | | 458,040 | | | | 556,745 | |
Shares issued in tax-free reorganization* | | | — | | | | 6,079,145 | |
| Shares issued to shareholders in reinvestment of distributions | | | 298,283 | | | | 254,870 | |
| Shares redeemed | | | (2,519,694 | ) | | | (7,649,461 | ) |
| Net increase (decrease) in Class A shares | | | (1,763,371 | ) | | | (758,701 | ) |
| Shares outstanding at end of period | | | 34,688,095 | | | | 36,451,466 | |
Class B Shares outstanding at beginning of period | | | 698,290 | | | | 623,731 | |
| Shares sold | | | 17,695 | | | | 43,180 | |
Shares issued in tax-free reorganization* | | | — | | | | 158,668 | |
| Shares issued to shareholders in reinvestment of distributions | | | 3,450 | | | | 2,322 | |
| Shares redeemed | | | (59,255 | ) | | | (129,611 | ) |
| Net increase (decrease) in Class B shares | | | (38,110 | ) | | | 74,559 | |
| Shares outstanding at end of period | | | 660,180 | | | | 698,290 | |
* On April 29, 2011, DWS Health Care VIP and DWS Technology VIP were acquired by the Fund through a tax-free reorganization (see Note F).
The accompanying notes are an integral part of the financial statements.
| | | | | | Years Ended December 31, | |
| Class A | | Six Months Ended 6/30/12 (Unaudited) | | | 2011 | | | 2010 | | | 2009 | | | 2008 | | | 2007 | |
| Selected Per Share Data | |
| Net asset value, beginning of period | | $ | 18.58 | | | $ | 19.59 | | | $ | 16.93 | | | $ | 13.55 | | | $ | 20.41 | | | $ | 18.24 | |
Income (loss) from investment operations: Net investment income (loss)a | | | .07 | | | | .17 | | | | .14 | c | | | .14 | | | | .16 | | | | .17 | c |
| Net realized and unrealized gain (loss) | | | 1.94 | | | | (1.03 | ) | | | 2.68 | | | | 3.43 | | | | (6.83 | ) | | | 2.12 | |
| Total from investment operations | | | 2.01 | | | | (.86 | ) | | | 2.82 | | | | 3.57 | | | | (6.67 | ) | | | 2.29 | |
Less distributions from: Net investment income | | | (.18 | ) | | | (.15 | ) | | | (.16 | ) | | | (.19 | ) | | | (.19 | ) | | | (.12 | ) |
| Net asset value, end of period | | $ | 20.41 | | | $ | 18.58 | | | $ | 19.59 | | | $ | 16.93 | | | $ | 13.55 | | | $ | 20.41 | |
| Total Return (%) | | | 10.79 | ** | | | (4.47 | ) | | | 16.71 | b | | | 26.87 | b | | | (32.98 | )b | | | 12.59 | b |
| Ratios to Average Net Assets and Supplemental Data | |
| Net assets, end of period ($ millions) | | | 708 | | | | 677 | | | | 729 | | | | 715 | | | | 594 | | | | 1,058 | |
| Ratio of expenses before expense reductions (%) | | | .50 | * | | | .50 | | | | .51 | | | | .51 | | | | .50 | | | | .53 | |
| Ratio of expenses after expense reductions (%) | | | .50 | * | | | .50 | | | | .51 | | | | .49 | | | | .49 | | | | .52 | |
| Ratio of net investment income (loss) (%) | | | .65 | * | | | .86 | | | | .78 | c | | | .98 | | | | .89 | | | | .86 | c |
| Portfolio turnover rate (%) | | | 17 | ** | | | 47 | | | | 42 | | | | 76 | | | | 21 | | | | 30 | |
a Based on average shares outstanding during the period. b Total return would have been lower had certain expenses not been reduced. c Net investment income per share and ratio of net investment income include non-recurring dividend income amounting to $0.05 and $0.03 per share and 0.28% and 0.17% of average daily net assets for the years ended December 31, 2010 and 2007, respectively. * Annualized ** Not annualized | |
| | | | | | Years Ended December 31, | |
| Class B | | Six Months Ended 6/30/12 (Unaudited) | | | 2011 | | | 2010 | | | 2009 | | | 2008 | | | 2007 | |
| Selected Per Share Data | |
| Net asset value, beginning of period | | $ | 18.51 | | | $ | 19.51 | | | $ | 16.86 | | | $ | 13.49 | | | $ | 20.31 | | | $ | 18.15 | |
Income (loss) from investment operations: Net investment income (loss)a | | | .03 | | | | .10 | | | | .08 | c | | | .09 | | | | .10 | | | | .09 | c |
| Net realized and unrealized gain (loss) | | | 1.93 | | | | (1.02 | ) | | | 2.67 | | | | 3.43 | | | | (6.81 | ) | | | 2.12 | |
| Total from investment operations | | | 1.96 | | | | (.92 | ) | | | 2.75 | | | | 3.52 | | | | (6.71 | ) | | | 2.21 | |
Less distributions from: Net investment income | | | (.11 | ) | | | (.08 | ) | | | (.10 | ) | | | (.15 | ) | | | (.11 | ) | | | (.05 | ) |
| Net asset value, end of period | | $ | 20.36 | | | $ | 18.51 | | | $ | 19.51 | | | $ | 16.86 | | | $ | 13.49 | | | $ | 20.31 | |
| Total Return (%) | | | 10.56 | ** | | | (4.76 | ) | | | 16.33 | b | | | 26.49 | b | | | (33.20 | )b | | | 12.18 | b |
| Ratios to Average Net Assets and Supplemental Data | |
| Net assets, end of period ($ millions) | | | 13 | | | | 13 | | | | 12 | | | | 12 | | | | 10 | | | | 19 | |
| Ratio of expenses before expense reductions (%) | | | .84 | * | | | .84 | | | | .85 | | | | .85 | | | | .85 | | | | .94 | |
| Ratio of expenses after expense reductions (%) | | | .84 | * | | | .84 | | | | .84 | | | | .82 | | | | .82 | | | | .90 | |
| Ratio of net investment income (loss) (%) | | | .31 | * | | | .52 | | | | .45 | c | | | .65 | | | | .56 | | | | .48 | c |
| Portfolio turnover rate (%) | | | 17 | ** | | | 47 | | | | 42 | | | | 76 | | | | 21 | | | | 30 | |
a Based on average shares outstanding during the period. b Total return would have been lower had certain expenses not been reduced. c Net investment income per share and ratio of net investment income include non-recurring dividend income amounting to $0.05 and $0.03 per share and 0.28% and 0.17% of average daily net assets for the years ended December 31, 2010 and 2007, respectively. * Annualized ** Not annualized | |
Notes to Financial Statements (Unaudited)
A. Organization and Significant Accounting Policies
DWS Variable Series I (the "Series") is registered under the Investment Company Act of 1940, as amended (the "1940 Act"), as an open-end, registered management investment company organized as a Massachusetts business trust. The Series consists of five diversified funds: DWS Bond VIP, DWS Core Equity VIP (formerly DWS Growth & Income VIP), DWS Capital Growth VIP, DWS Global Small Cap Growth VIP and DWS International VIP (individually or collectively hereinafter referred to as a "Fund" or the "Funds"). These financial statements report on DWS Capital Growth VIP. The Series is intended to be the underlying investment vehicle for variable annuity contracts and variable life insurance policies to be offered by the separate accounts of certain life insurance companies ("Participating Insurance Companies").
Multiple Classes of Shares of Beneficial Interest. The Fund offers two classes of shares (Class A shares and Class B shares). Class B shares are subject to Rule 12b-1 distribution fees under the 1940 Act and recordkeeping fees equal to an annual rate of 0.25% and up to 0.15%, respectively, of the average daily net assets of the Class B shares of the Fund. Class A shares are not subject to such fees.
Investment income, realized and unrealized gains and losses, and certain fund-level expenses and expense reductions, if any, are borne pro rata on the basis of relative net assets by the holders of all classes of shares, except that each class bears certain expenses unique to that class (including the applicable 12b-1 distribution fees and recordkeeping fees). Differences in class-level expenses may result in payment of different per share dividends by class. All shares have equal rights with respect to voting subject to class-specific arrangements.
The Fund's financial statements are prepared in accordance with accounting principles generally accepted in the United States of America, which require the use of management estimates. Actual results could differ from those estimates. The policies described below are followed consistently by the Fund in the preparation of its financial statements.
Security Valuation. Investments are stated at value determined as of the close of regular trading on the New York Stock Exchange on each day the exchange is open for trading.
Various inputs are used in determining the value of the Fund's investments. These inputs are summarized in three broad levels. Level 1 includes quoted prices in active markets for identical securities. Level 2 includes other significant observable inputs (including quoted prices for similar securities, interest rates, prepayment speeds, and credit risk). Level 3 includes significant unobservable inputs (including the Fund's own assumptions in determining the fair value of investments). The inputs or methodology used for valuing securities are not necessarily an indication of the risk associated with investing in those securities.
Equity securities are valued at the most recent sale price or official closing price reported on the exchange (U.S. or foreign) or over-the-counter market on which they trade and are categorized as Level 1 securities. Securities for which no sales are reported are valued at the calculated mean between the most recent bid and asked quotations on the relevant market or, if a mean cannot be determined, at the most recent bid quotation.
Investments in open-end investment companies are valued at their net asset value each business day and are categorized as Level 1.
Securities and other assets for which market quotations are not readily available or for which the above valuation procedures are deemed not to reflect fair value are valued in a manner that is intended to reflect their fair value as determined in accordance with procedures approved by the Trustees and are generally categorized as Level 3. In accordance with the Fund's valuation procedures, factors used in determining value may include, but are not limited to, the type of the security; the size of the holding; the initial cost of the security; the existence of any contractual restrictions on the security's disposition; the price and extent of public trading in similar securities of the issuer or of comparable companies; quotations or evaluated prices from broker-dealers and/or pricing services; information obtained from the issuer, analysts, and/or the appropriate stock exchange (for exchange-traded securities); an analysis of the company's or issuer's financial statements; an evaluation of the forces that influence the issuer and the market(s) in which the security is purchased and sold and with respect to debt securities; the maturity, coupon, creditworthiness, currency denomination and the movement of the market in which the security is normally traded. The value determined under these procedures may differ from published values for the same securities.
Disclosure about the classification of fair value measurements is included in a table following the Fund's Investment Portfolio.
Securities Lending. The Fund lends securities to certain financial institutions. The Fund retains beneficial ownership of the securities it has loaned and continues to receive interest and dividends paid by the issuer of securities and to participate in any changes in their market value. The Fund requires the borrowers of the securities to maintain collateral with the Fund consisting of either cash or liquid, unencumbered assets having a value at least equal to the value of the securities loaned. When the collateral falls below specified amounts, the lending agent will use its best effort to obtain additional collateral on the next business day to meet required amounts under the security lending agreement. The Fund may invest the cash collateral into a joint trading account in an affiliated money market fund pursuant to Exemptive Orders issued by the SEC. The Fund receives compensation for lending its securities either in the form of fees or by earning interest on invested cash collateral net of borrower rebates and fees paid to a lending agent. Either the Fund or the borrower may terminate the loan. There may be risks of delay and costs in recovery of securities or even loss of rights in the collateral should the borrower of the securities fail financially. The Fund is also subject to all investment risks associated with the reinvestment of any cash collateral received, including, but not limited to, interest rate, credit and liquidity risk associated with such investments.
Foreign Currency Translations. The books and records of the Fund are maintained in U.S. dollars. Investment securities and other assets and liabilities denominated in a foreign currency are translated into U.S. dollars at the prevailing exchange rates at period end. Purchases and sales of investment securities, income and expenses are translated into U.S. dollars at the prevailing exchange rates on the respective dates of the transactions.
Net realized and unrealized gains and losses on foreign currency transactions represent net gains and losses between trade and settlement dates on securities transactions, the acquisition and disposition of foreign currencies, and the difference between the amount of net investment income accrued and the U.S. dollar amount actually received. That portion of both realized and unrealized gains and losses on investments that results from fluctuations in foreign currency exchange rates is not separately disclosed but is included with net realized and unrealized gain/appreciation and loss/depreciation on investments.
Federal Income Taxes. The Fund is treated as a separate taxpayer as provided for in the Internal Revenue Code, as amended. It is the Fund's policy to comply with the requirements of the Internal Revenue Code, as amended, which are applicable to regulated investment companies, and to distribute all of its taxable income to the separate accounts of the Participating Insurance Companies which hold its shares.
Under the Regulated Investment Company Modernization Act of 2010, net capital losses may be carried forward indefinitely, and their character is retained as short-term and/or long-term. Previously, net capital losses were carried forward for eight years and treated as short-term. As a transition rule, the Act requires that post-enactment net capital losses be used before pre-enactment net capital losses.
At December 31, 2011, the Fund had a net tax basis capital loss carryforward of approximately $127,751,000, including $60,976,000 of pre-enactment losses of which $33,901,000 was inherited from its merger with DWS Technology VIP and $27,075,000 was inherited from its merger with other affiliated funds in previous years and may be applied against any realized net taxable capital gains of each year until fully utilized or until December 31, 2012 ($28,616,000), December 31, 2015 ($19,311,000), December 31, 2016 ($41,665,000) and December 31, 2017 ($38,159,000), the respective expiration dates, whichever occurs first, and which may be subject to certain limitations under Section 382-384 of the Internal Revenue Code.
The Fund has reviewed the tax positions for the open tax years as of December 31, 2011 and has determined that no provision for income tax is required in the Fund's financial statements. The Fund's federal tax returns for the prior three fiscal years remain open subject to examination by the Internal Revenue Service.
Distribution of Income and Gains. The Fund will declare and distribute dividends from its net investment income, if any, annually, although additional distributions may be made if necessary. Net realized gains from investment transactions, in excess of available capital loss carryforwards, would be taxable to the Fund if not distributed, and, therefore, will be distributed to shareholders at least annually.
The timing and characterization of certain income and capital gain distributions are determined annually in accordance with federal tax regulations which may differ from accounting principles generally accepted in the United States of America. These differences primarily relate to certain securities sold at a loss. As a result, net investment income (loss) and net realized gain (loss) on investment transactions for a reporting period may differ significantly from distributions during such period. Accordingly, the Fund may periodically make reclassifications among certain of its capital accounts without impacting the net asset value of the Fund.
The tax character of current year distributions will be determined at the end of the current fiscal year.
Expenses. Expenses of the Series arising in connection with a specific Fund are allocated to that Fund. Other Series expenses which cannot be directly attributed to a Fund are apportioned among the Funds in the Series.
Contingencies. In the normal course of business, the Fund may enter into contracts with service providers that contain general indemnification clauses. The Fund's maximum exposure under these arrangements is unknown as this would involve future claims that may be made against the Fund that have not yet been made. However, based on experience, the Fund expects the risk of loss to be remote.
Other. Investment transactions are accounted for on a trade date plus one basis for daily net asset value calculations. However, for financial reporting purposes, investment transactions are reported on trade date. Interest income is recorded on the accrual basis. Dividend income is recorded on the ex-dividend date net of foreign withholding taxes. Certain dividends from foreign securities may be recorded subsequent to the ex-dividend date as soon as the Fund is informed of such dividends. Realized gains and losses from investment transactions are recorded on an identified cost basis and may include proceeds from litigation.
B. Purchases and Sales of Securities
During the six months ended June 30, 2012, purchases and sales of investment securities (excluding short-term investments) aggregated $122,925,815 and $163,522,070, respectively.
C. Related Parties
Management Agreement. Under the Investment Management Agreement with Deutsche Investment Management Americas Inc. ("DIMA" or the "Advisor"), an indirect, wholly owned subsidiary of Deutsche Bank AG, the Advisor directs the investments of the Fund in accordance with its investment objectives, policies and restrictions. The Advisor determines the securities, instruments and other contracts relating to investments to be purchased, sold or entered into by the Fund.
Pursuant to the Investment Management Agreement with the Advisor, the Fund pays a monthly management fee based on the Fund's average daily net assets, computed and accrued daily and payable monthly at the following annual rates:
| First $250 million of average daily net assets | | | .390 | % |
| Next $750 million of average daily net assets | | | .365 | % |
| Over $1 billion of average daily net assets | | | .340 | % |
Accordingly, for the six months ended June 30, 2012, the fee pursuant to the Investment Management Agreement was equivalent to an annualized effective rate of 0.37% of the Fund's average daily net assets.
Administration Fee. Pursuant to an Administrative Services Agreement, DIMA provides most administrative services to the Fund. For all services provided under the Administrative Services Agreement, the Fund pays the Advisor an annual fee ("Administration Fee") of 0.10% of the Fund's average daily net assets, computed and accrued daily and payable monthly. For the six months ended June 30, 2012, the Administration Fee was $369,185, of which $58,095 is unpaid.
Service Provider Fees. DWS Investments Service Company ("DISC"), an affiliate of the Advisor, is the transfer agent, dividend-paying agent and shareholder service agent for the Fund. Pursuant to a sub-transfer agency agreement between DISC and DST Systems, Inc. ("DST"), DISC has delegated certain transfer agent, dividend-paying agent and shareholder service agent functions to DST. DISC compensates DST out of the shareholder servicing fee it receives from the Fund. For the six months ended June 30, 2012, the amounts charged to the Fund by DISC were as follows:
| Services to Shareholders | | Total Aggregated | | | Unpaid at June 30, 2012 | |
| Class A | | $ | 358 | | | $ | 112 | |
| Class B | | | 72 | | | | 20 | |
| | | $ | 430 | | | $ | 132 | |
Distribution Service Agreement. DWS Investments Distributors, Inc. ("DIDI"), also an affiliate of the Advisor, is the Series' Distributor. In accordance with the Master Distribution Plan, DIDI receives 12b-1 fees of 0.25% of average daily net assets of Class B shares. Pursuant to the Master Distribution Plan, DIDI remits these fees to the Participating Insurance Companies for various costs incurred or paid by these companies in connection with marketing and distribution of Class B shares. For the six months ended June 30, 2012, the Distribution Service Fee aggregated $17,242, of which $2,044 is unpaid.
Typesetting and Filing Service Fees. Under an agreement with DIMA, DIMA is compensated for providing typesetting and certain regulatory filing services to the Fund. For the six months ended June 30, 2012, the amount charged to the Fund by DIMA included in the Statement of Operations under "reports to shareholders" aggregated $12,586, of which $4,020 is unpaid.
Trustees' Fees and Expenses. The Fund paid retainer fees to each Trustee not affiliated with the Advisor, plus specified amounts to the Board Chairperson and to each committee Chairperson.
Affiliated Cash Management Vehicle. The Fund may invest uninvested cash balances in Central Cash Management Fund, which is managed by the Advisor. The Fund indirectly bears its proportionate share of the expenses of Central Cash Management Fund. Central Cash Management Fund does not pay the Advisor an investment management fee. Central Cash Management Fund seeks a high level of current income consistent with liquidity and the preservation of capital.
D. Ownership of the Fund
Three participating insurance companies were owners of record of 10% or more of the total outstanding Class A shares of the Fund, each owning 37%, 26% and 13%.
E. Line of Credit
The Fund and other affiliated funds (the "Participants") share in a $375 million revolving credit facility provided by a syndication of banks. The Fund may borrow for temporary or emergency purposes, including the meeting of redemption requests that otherwise might require the untimely disposition of securities. The Participants are charged an annual commitment fee which is allocated based on net assets, among each of the Participants. Interest is calculated at a rate per annum equal to the sum of the Federal Funds Rate plus 1.25 percent plus if LIBOR exceeds the Federal Funds Rate the amount of such excess. The Fund may borrow up to a maximum of 33 percent of its net assets under the agreement. The Fund had no outstanding loans at June 30, 2012.
F. Acquisition of Assets
On April 29, 2011, the Fund acquired all of the net assets of DWS Health Care VIP and DWS Technology VIP pursuant to a plan of reorganization approved by shareholders on April 11, 2011. The purpose of the transaction was to combine three funds managed by DWS with comparable investment objectives and strategies.
The acquisition was accomplished by a tax-free exchange as follows:
| | | Class A shares | | | Class B shares | |
| DWS Health Care VIP | | | 5,605,448 | | | | 377,495 | |
| DWS Technology VIP | | | 6,613,518 | | | | 10,454 | |
The above shares were exchanged for the following shares outstanding on the date acquired of the DWS Capital Growth VIP Fund:
| | | Class A shares | | | Class B shares | |
| DWS Health Care VIP | | | 2,358,210 | | | | 152,955 | |
| DWS Technology VIP | | | 3,720,935 | | | | 5,713 | |
The net assets at the acquired date were as follows:
| DWS Health Care VIP | | $ | 52,398,965 | |
| DWS Technology VIP | | $ | 77,777,981 | |
The net unrealized appreciation included in the net assets above were as follows:
| DWS Health Care VIP | | $ | 4,928,832 | |
| DWS Technology VIP | | $ | 13,786,078 | |
The aggregate net assets of DWS Capital Growth VIP immediately before the acquisition were $754,712,975. The combined net assets of DWS Capital Growth VIP immediately following the acquisition were $884,889,922.
Information About Your Fund's Expenses (Unaudited)
As an investor of the Fund, you incur two types of costs: ongoing expenses and transaction costs. Ongoing expenses include management fees, distribution and service (12b-1) fees and other Fund expenses. Examples of transaction costs include contract charges and account maintenance fees, which are not shown in this section. The following tables are intended to help you understand your ongoing expenses (in dollars) of investing in the Fund and to help you compare these expenses with the ongoing expenses of investing in other mutual funds. The example in the table is based on an investment of $1,000 invested at the beginning of the six-month period and held for the entire period (January 1, 2012 to June 30, 2012).
The tables illustrate your Fund's expenses in two ways:
•Actual Fund Return. This helps you estimate the actual dollar amount of ongoing expenses (but not transaction costs) paid on a $1,000 investment in the Fund using the Fund's actual return during the period. To estimate the expenses you paid over the period, simply divide your account value by $1,000 (for example, an $8,600 account value divided by $1,000 = 8.6), then multiply the result by the number in the "Expenses Paid per $1,000" line under the share class you hold.
• Hypothetical 5% Fund Return. This helps you to compare your Fund's ongoing expenses (but not transaction costs) with those of other mutual funds using the Fund's actual expense ratio and a hypothetical rate of return of 5% per year before expenses. Examples using a 5% hypothetical Fund return may be found in the shareholder reports of other mutual funds. The hypothetical account values and expenses may not be used to estimate the actual ending account balance or expenses you paid for the period.
Please note that the expenses shown in these tables are meant to highlight your ongoing expenses only and do not reflect any transaction costs. The "Expenses Paid per $1,000" line of the tables is useful in comparing ongoing expenses only and will not help you determine the relative total expense of owning different funds. If these transaction costs had been included, your costs would have been higher.
Expenses and Value of a $1,000 Investment for the six months ended June 30, 2012 | |
| Actual Fund Return | | Class A | | | Class B | |
| Beginning Account Value 1/1/12 | | $ | 1,000.00 | | | $ | 1,000.00 | |
| Ending Account Value 6/30/12 | | $ | 1,107.90 | | | $ | 1,105.60 | |
| Expenses Paid per $1,000* | | $ | 2.62 | | | $ | 4.40 | |
| Hypothetical 5% Fund Return | | Class A | | | Class B | |
| Beginning Account Value 1/1/12 | | $ | 1,000.00 | | | $ | 1,000.00 | |
| Ending Account Value 6/30/12 | | $ | 1,022.38 | | | $ | 1,020.69 | |
| Expenses Paid per $1,000* | | $ | 2.51 | | | $ | 4.22 | |
* Expenses are equal to the Fund's annualized expense ratio for each share class, multiplied by the average account value over the period, multiplied by 182 (the number of days in the most recent six-month period), then divided by 366.
| Annualized Expense Ratios | Class A | | Class B | |
| DWS Variable Series I — DWS Capital Growth VIP | .50% | | .84% | |
For more information, please refer to the Fund's prospectus.
These tables do not reflect charges and fees ("contract charges") associated with the separate account that invests in the Fund or any variable life insurance policy or variable annuity contract for which the Fund is an investment option.
The Series' policies and procedures for voting proxies for portfolio securities and information about how the Series voted proxies related to its portfolio securities during the 12-month period ended June 30 are available on our Web site — www.dws-investments.com (click on "proxy voting"at the bottom of the page) — or on the SEC's Web site — www.sec.gov. To obtain a written copy of the Series' policies and procedures without charge, upon request, call us toll free at (800) 728-3337.
Summary of Management Fee Evaluation by Independent Fee Consultant
September 26, 2011
Pursuant to an Order entered into by Deutsche Investment Management Americas and affiliates (collectively, "DeAM") with the Attorney General of New York, I, Thomas H. Mack, have been appointed the Independent Fee Consultant for the DWS Funds (formerly the DWS Scudder Funds). My duties include preparing an annual written evaluation of the management fees DeAM charges the Funds, considering among other factors the management fees charged by other mutual fund companies for like services, management fees DeAM charges other clients for like services, DeAM's costs of supplying services under the management agreements and related profit margins, possible economies of scale if a Fund grows larger, and the nature and quality of DeAM's services, including fund performance. This report summarizes my evaluation for 2011, including my qualifications, the evaluation process for each of the DWS Funds, consideration of certain complex-level factors, and my conclusions. I served in substantially the same capacity in 2007, 2008, 2009 and 2010.
Qualifications
For more than 35 years I have served in various professional capacities within the investment management business. I have held investment analysis and advisory positions, including securities analyst, portfolio strategist and director of investment policy with a large investment firm. I have also performed business management functions, including business development, financial management and marketing research and analysis.
Since 1991, I have been an independent consultant within the asset management industry. I have provided services to over 125 client organizations, including investment managers, mutual fund boards, product distributors and related organizations. Over the past ten years I have completed a number of assignments for mutual fund boards, specifically including assisting boards with management contract renewal.
I hold a Master of Business Administration degree, with highest honors, from Harvard University and Master of Science and Bachelor of Science (highest honors) degrees from the University of California at Berkeley. I am an independent director and audit committee financial expert for two closed-end mutual funds and have served in various leadership and financial oversight capacities with non-profit organizations.
Evaluation of Fees for each DWS Fund
My work focused primarily on evaluating, fund-by-fund, the fees charged to each of the 109 mutual fund portfolios in the DWS Fund family. For each Fund, I considered each of the key factors mentioned above, as well as any other relevant information. In doing so I worked closely with the Funds' Independent Directors in their annual contract renewal process, as well as in their approval of contracts for several new funds (documented separately).
In evaluating each Fund's fees, I reviewed comprehensive materials provided by or on behalf of DeAM, including expense information prepared by Lipper Analytical, comparative performance information, profitability data, manager histories, and other materials. I also accessed certain additional information from the Lipper and Morningstar databases and drew on my industry knowledge and experience.
To facilitate evaluating this considerable body of information, I prepared for each Fund a document summarizing the key data elements in each area as well as additional analytics discussed below. This made it possible to consider each key data element in the context of the others.
In the course of contract renewal, DeAM agreed to implement a number of fee and expense adjustments requested by the Independent Directors which will favorably impact future fees and expenses, and my evaluation includes the effects of these changes.
Fees and Expenses Compared with Other Funds
The competitive fee and expense evaluation for each fund focused on two primary comparisons:
The Fund's contractual management fee (the advisory fee plus the administration fee where applicable) compared with those of a group of typically 12-15 funds in the same Lipper investment category (e.g. Large Capitalization Growth) having similar distribution arrangements and being of similar size.
The Fund's total expenses compared with a broader universe of funds from the same Lipper investment category and having similar distribution arrangements.
These two comparisons provide a view of not only the level of the fee compared with funds of similar scale but also the total expense the Fund bears for all the services it receives, in comparison with the investment choices available in the Fund's investment category and distribution channel. The principal figure-of-merit used in these comparisons was the subject Fund's percentile ranking against peers.
DeAM's Fees for Similar Services to Others
DeAM provided management fee schedules for all of its US domiciled fund and non-fund investment management accounts in any of the investment categories where there is a DWS Fund. These similar products included the other DWS Funds, non-fund pooled accounts, institutional accounts and sub-advisory accounts. Using this information, I calculated for each Fund the fee that would be charged to each similar product, at the subject Fund's asset level.
Evaluating information regarding non-fund products is difficult because there are varying levels of services required for different types of accounts, with mutual funds generally requiring considerably more regulatory and administrative types of service as well as having more frequent cash flows than other types of accounts. Also, while mutual fund fees for similar fund products can be expected to be similar, there will be some differences due to different pricing conditions in different distribution channels (e.g. retail funds versus those used in variable insurance products), differences in underlying investment processes and other factors.
Costs and Profit Margins
DeAM provided a detailed profitability analysis for each Fund. After making some adjustments so that the presentation would be more comparable to the available industry figures, I reviewed profit margins from investment management alone, from investment management plus other fund services (excluding distribution) provided to the Funds by DeAM (principally shareholder services), and DeAM profits from all sources, including distribution. A later section comments on overall profitability.
Economies of Scale
Economies of scale — an expected decline in management cost per dollar of fund assets as fund assets grow — are very rarely quantified and documented because of inherent difficulties in collecting and analyzing relevant data. However, in virtually every investment category that I reviewed, larger funds tend to have lower fees and lower total expenses than smaller funds. To see how each DWS Fund compares with this industry observation, I reviewed:
The trend in Fund assets over the last five years and the accompanying trend in total expenses. This shows if the Fund has grown and, if so, whether total expense (management fees as well as other expenses) have declined as a percent of assets.
Whether the Fund has break-points in its management fee schedule, the extent of the fee reduction built into the schedule and the asset levels where the breaks take effect, and in the case of a sub-advised Fund how the Fund's break-points compare with those of the sub-advisory fee schedule.
How the Fund's contractual fee schedule compares with trends in the industry data. To accomplish this, I constructed a chart showing how actual latest-fiscal-year contractual fees of the Fund and of other similar funds relate to average fund assets, with the subject Fund's contractual fee schedule superimposed.
Quality of Service — Performance
The quality-of-service evaluation focused on investment performance, which is the principal result of the investment management service. Each Fund's performance was reviewed over the past 1, 3, 5 and 10 years, as applicable, and compared with that of other funds in the same investment category and with a suitable market index.
In addition, I calculated and reviewed risk-adjusted returns relative to an index of similar mutual funds' returns and a suitable market index. The risk-adjusted returns analysis provides a way of determining the extent to which the Fund's return comparisons are mainly the product of investment value-added (or lack thereof) or alternatively taking considerably more or less risk than is typical in its investment category.
I also received and considered the history of portfolio manager changes for each Fund, as this provided an important context for evaluating the performance results.
Complex-Level Considerations
While this evaluation was conducted mainly at the individual fund level, there are some issues relating to the reasonableness of fees that can alternatively be considered across the whole fund complex:
I reviewed DeAM's profitability analysis for all DWS Funds, with a view toward determining if the allocation procedures used were reasonable and how profit levels compared with public data for other investment managers.
I considered whether DeAM and affiliates receive any significant ancillary or "fall-out" benefits that should be considered in interpreting the direct profitability results. These would be situations where serving as the investment manager of the Funds is beneficial to another part of the Deutsche Bank organization.
I considered how aggregated DWS Fund expenses had varied over the years, by asset class and in the context of trends in asset levels.
I reviewed the structure of the DeAM organization, trends in staffing levels, and information on compensation of investment management and other professionals compared with industry data.
Findings
Based on the process and analysis discussed above, which included reviewing a wide range of information from management and external data sources and considering among other factors the fees DeAM charges other clients, the fees charged by other fund managers, DeAM's costs and profits associated with managing the Funds, economies of scale, possible fall-out benefits, and the nature and quality of services provided, in my opinion the management fees charged the DWS Funds are reasonable.
Thomas H. Mack
President, Thomas H. Mack & Co., Inc.
DWS Investments Distributors, Inc.
222 South Riverside Plaza
Chicago, IL 60606
(800) 621-1148
VS1capgro-3 (R-028374-1 8/12)
JUNE 30, 2012
SEMIANNUAL REPORT
DWS VARIABLE SERIES I
DWS Core Equity VIP
(formerly DWS Growth & Income VIP)
Contents
6 Portfolio Management Team 13 Statement of Assets and Liabilities 14 Statement of Operations 15 Statement of Changes in Net Assets 18 Notes to Financial Statements 23 Information About Your Fund's Expenses 25 Summary of Management Fee Evaluation by Independent Fee Consultant |
This report must be preceded or accompanied by a prospectus. To obtain an additional prospectus or summary prospectus, if available, call (800) 728-3337 or your financial representative. We advise you to consider the Fund's objectives, risks, charges and expenses carefully before investing. The summary prospectus and prospectus contain this and other important information about the Fund. Please read the prospectus carefully before you invest.
Investing in derivatives entails special risks relating to liquidity, leverage and credit that may reduce returns and/or increase volatility. The Fund may lend securities to approved institutions. Fund management could be wrong in its analysis of industries, companies, economic trends and favor a security that underperforms the market. Stocks may decline in value. See the prospectus for details.
DWS Investments is part of Deutsche Bank's Asset Management division and, within the U.S., represents the retail asset management activities of Deutsche Bank AG, Deutsche Bank Trust Company Americas, Deutsche Investment Management Americas Inc. and DWS Trust Company.
NOT FDIC/NCUA INSURED NO BANK GUARANTEE MAY LOSE VALUE NOT A DEPOSIT
NOT INSURED BY ANY FEDERAL GOVERNMENT AGENCY
Performance Summary June 30, 2012 (Unaudited)
Fund performance shown is historical, assumes reinvestment of all dividend and capital gain distributions, and does not guarantee future results. Investment return and principal value fluctuate with changing market conditions so that, when redeemed, shares may be worth more or less than their original cost. Current performance may be lower or higher than the performance data quoted. Please contact your participating insurance company for the Fund's most recent month-end performance. Performance doesn't reflect charges and fees ("contract charges") associated with the separate account that invests in the Fund or any variable life insurance policy or variable annuity contract for which the Fund is an investment option. These charges and fees will reduce returns. While all share classes have the same underlying portfolio, their performance will differ.
The gross expense ratios of the Fund, as stated in the fee table of the prospectus dated May 1, 2012 are 0.63% and 0.88% for Class A and Class B shares, respectively, and may differ from the expense ratios disclosed in the Financial Highlights tables in this report.
| Growth of an Assumed $10,000 Investment |
| The Russell 1000® Index is an unmanaged index that measures the performance of the 1,000 largest companies in the Russell 3000® Index, which represents approximately 92% of the total market capitalization of the Russell 3000® Index. Index returns do not reflect any fees or expenses and it is not possible to invest directly into an index. |
| |
| Yearly periods ended June 30 | |
| Comparative Results | |
| DWS Core Equity VIP | | 6-Month‡ | | | 1-Year | | | 3-Year | | | 5-Year | | | 10-Year | |
| Class A | Growth of $10,000 | | $ | 10,617 | | | $ | 9,754 | | | $ | 15,155 | | | $ | 9,836 | | | $ | 15,053 | |
| Average annual total return | | | 6.17 | % | | | -2.46 | % | | | 14.86 | % | | | -0.33 | % | | | 4.17 | % |
Russell 1000® Index | Growth of $10,000 | | $ | 10,938 | | | $ | 10,437 | | | $ | 15,869 | | | $ | 10,195 | | | $ | 17,434 | |
| Average annual total return | | | 9.38 | % | | | 4.37 | % | | | 16.64 | % | | | 0.39 | % | | | 5.72 | % |
| DWS Core Equity VIP | | 6-Month‡ | | | 1-Year | | | 3-Year | | | 5-Year | | | 10-Year | |
| Class B | Growth of $10,000 | | $ | 10,591 | | | $ | 9,718 | | | $ | 15,021 | | | $ | 9,712 | | | $ | 14,627 | |
| Average annual total return | | | 5.91 | % | | | -2.82 | % | | | 14.52 | % | | | -0.58 | % | | | 3.88 | % |
Russell 1000® Index | Growth of $10,000 | | $ | 10,938 | | | $ | 10,437 | | | $ | 15,869 | | | $ | 10,195 | | | $ | 17,434 | |
| Average annual total return | | | 9.38 | % | | | 4.37 | % | | | 16.64 | % | | | 0.39 | % | | | 5.72 | % |
The growth of $10,000 is cumulative.
‡ Total returns shown for periods less than one year are not annualized.
Portfolio Summary (Unaudited) Asset Allocation (As a % of Investment Portfolio excluding Securities Lending Collateral) | 6/30/12 | 12/31/11 |
| | | |
| Common Stocks | 99% | 99% |
| Cash Equivalents* | 1% | 1% |
| | 100% | 100% |
Sector Diversification (As a % of Common Stocks) | 6/30/12 | 12/31/11 |
| | | |
| Information Technology | 17% | 20% |
| Financials | 17% | 17% |
| Health Care | 15% | 14% |
| Consumer Staples | 11% | 9% |
| Industrials | 11% | 9% |
| Consumer Discretionary | 11% | 10% |
| Energy | 9% | 13% |
| Materials | 4% | 6% |
| Utilities | 3% | 1% |
| Telecommunication Services | 2% | 1% |
| | 100% | 100% |
* In order to keep cash on hand to meet shareholder redemptions or other needs while maintaining exposure to the market, the Fund invests in futures contracts.
Portfolio holdings and characteristics are subject to change.
For more complete details about the Fund's investment portfolio, see page 7.
Following the Fund's fiscal first and third quarter-end, a complete portfolio holdings listing is filed with the SEC on Form N-Q. The form will be available on the SEC's Web site at www.sec.gov, and it also may be reviewed and copied at the SEC's Public Reference Room in Washington, D.C. Information on the operation of the SEC's Public Reference Room may be obtained by calling (800) SEC-0330. The Fund's portfolio holdings are also posted on www.dws-investments.com from time to time. Please see the Fund's current prospectus for more information.
Portfolio Management Team
Robert Wang
Russell Shtern, CFA
Portfolio Managers, QS Investors, LLC, Subadvisor to the Fund
Investment Portfolio June 30, 2012 (Unaudited) | | | Shares | | | Value ($) | |
| | | | |
| Common Stocks 98.4% | |
| Consumer Discretionary 10.5% | |
| Auto Components 0.1% | |
| Lear Corp. | | | 2,200 | | | | 83,006 | |
| Diversified Consumer Services 0.3% | |
| Coinstar, Inc.* (a) | | | 7,000 | | | | 480,620 | |
| Hotels, Restaurants & Leisure 0.6% | |
| Brinker International, Inc. | | | 17,800 | | | | 567,286 | |
| MGM Resorts International* (a) | | | 26,600 | | | | 296,856 | |
| Starbucks Corp. (a) | | | 5,000 | | | | 266,600 | |
| | | | | | | | 1,130,742 | |
| Household Durables 0.8% | |
| Sony Corp. (ADR) | | | 34,200 | | | | 487,008 | |
| Whirlpool Corp. | | | 16,600 | | | | 1,015,256 | |
| | | | | | | | 1,502,264 | |
| Media 2.8% | |
| CBS Corp. "B" (a) | | | 11,200 | | | | 367,136 | |
| Charter Communications, Inc. "A"* | | | 2,400 | | | | 170,088 | |
| Comcast Corp. "A" | | | 18,700 | | | | 597,839 | |
| Comcast Corp., Special "A" | | | 20,200 | | | | 634,280 | |
| DISH Network Corp. "A" | | | 6,600 | | | | 188,430 | |
| Gannett Co., Inc. | | | 26,700 | | | | 393,291 | |
| Lions Gate Entertainment Corp.* (a) | | | 47,500 | | | | 700,150 | |
| Omnicom Group, Inc. (a) | | | 16,900 | | | | 821,340 | |
| Regal Entertainment Group "A" (a) | | | 14,900 | | | | 205,024 | |
| Time Warner Cable, Inc. (a) | | | 3,800 | | | | 311,980 | |
| Time Warner, Inc. | | | 12,400 | | | | 477,400 | |
| Viacom, Inc. "B" | | | 4,100 | | | | 192,782 | |
| | | | | | | | 5,059,740 | |
| Multiline Retail 1.8% | |
| Dillard's, Inc. "A" (a) | | | 17,615 | | | | 1,121,723 | |
| Macy's, Inc. | | | 44,600 | | | | 1,532,010 | |
| Sears Holdings Corp.* (a) | | | 9,600 | | | | 573,120 | |
| | | | | | | | 3,226,853 | |
| Specialty Retail 4.0% | |
| Aaron's, Inc. (a) | | | 20,500 | | | | 580,355 | |
| Best Buy Co., Inc. (a) | | | 96,700 | | | | 2,026,832 | |
| Home Depot, Inc. (a) | | | 25,000 | �� | | | 1,324,750 | |
| Ross Stores, Inc. | | | 7,700 | | | | 481,019 | |
| The Gap, Inc. (a) | | | 66,500 | | | | 1,819,440 | |
| TJX Companies, Inc. (a) | | | 23,200 | | | | 995,976 | |
| | | | | | | | 7,228,372 | |
| Textiles, Apparel & Luxury Goods 0.1% | |
| Carter's, Inc.* | | | 3,200 | | | | 168,320 | |
| Consumer Staples 10.7% | |
| Beverages 0.5% | |
| Monster Beverage Corp.* | | | 11,600 | | | | 825,920 | |
| Food & Staples Retailing 2.9% | |
| CVS Caremark Corp. (a) | | | 61,700 | | | | 2,883,241 | |
| Kroger Co. | | | 51,700 | | | | 1,198,923 | |
| Safeway, Inc. | | | 27,800 | | | | 504,570 | |
| Whole Foods Market, Inc. (a) | | | 6,900 | | | | 657,708 | |
| | | | | | | | 5,244,442 | |
| | | Shares | | | Value ($) | |
| | | | | | | | | |
| Food Products 2.7% | |
| Archer-Daniels-Midland Co. | | | 57,900 | | | | 1,709,208 | |
| Bunge Ltd. | | | 3,000 | | | | 188,220 | |
| Dean Foods Co.* (a) | | | 66,300 | | | | 1,129,089 | |
| Kraft Foods, Inc. "A" | | | 11,300 | | | | 436,406 | |
| The Hershey Co. (a) | | | 6,800 | | | | 489,804 | |
| Tyson Foods, Inc. "A" (a) | | | 52,700 | | | | 992,341 | |
| | | | | | | | 4,945,068 | |
| Household Products 0.9% | |
| Church & Dwight Co., Inc. | | | 2,600 | | | | 144,222 | |
| Clorox Co. | | | 2,400 | | | | 173,904 | |
| Kimberly-Clark Corp. | | | 6,600 | | | | 552,882 | |
| Procter & Gamble Co. | | | 12,000 | | | | 735,000 | |
| | | | | | | | 1,606,008 | |
| Personal Products 0.5% | |
| Herbalife Ltd. (a) | | | 10,500 | | | | 507,465 | |
| Nu Skin Enterprises, Inc. "A" (a) | | | 7,800 | | | | 365,820 | |
| | | | | | | | 873,285 | |
| Tobacco 3.2% | |
| Altria Group, Inc. | | | 38,600 | | | | 1,333,630 | |
| Lorillard, Inc. | | | 6,200 | | | | 818,090 | |
| Philip Morris International, Inc. | | | 42,400 | | | | 3,699,824 | |
| | | | | | | | 5,851,544 | |
| Energy 9.3% | |
| Energy Equipment & Services 1.2% | |
| Helix Energy Solutions Group, Inc.* | | | 31,200 | | | | 511,992 | |
| Transocean Ltd. | | | 31,700 | | | | 1,417,941 | |
| Weatherford International Ltd.* | | | 15,500 | | | | 195,765 | |
| | | | | | | | 2,125,698 | |
| Oil, Gas & Consumable Fuels 8.1% | |
| Cheniere Energy, Inc.* (a) | | | 32,800 | | | | 483,472 | |
| Chevron Corp. | | | 16,500 | | | | 1,740,750 | |
| Cobalt International Energy, Inc.* | | | 4,500 | | | | 105,750 | |
| CVR Energy, Inc.* | | | 7,400 | | | | 196,692 | |
| Energy XXI (Bermuda) Ltd. (a) | | | 5,300 | | | | 165,837 | |
| Exxon Mobil Corp. | | | 3,500 | | | | 299,495 | |
| HollyFrontier Corp. (a) | | | 35,300 | | | | 1,250,679 | |
| Marathon Oil Corp. | | | 35,400 | | | | 905,178 | |
| Marathon Petroleum Corp. (a) | | | 47,200 | | | | 2,120,224 | |
| Murphy Oil Corp. (a) | | | 11,200 | | | | 563,248 | |
| Statoil ASA (ADR) (a) | | | 43,900 | | | | 1,047,454 | |
| Sunoco, Inc. (a) | | | 10,600 | | | | 503,500 | |
| Tesoro Corp.* | | | 85,500 | | | | 2,134,080 | |
| Valero Energy Corp. | | | 69,000 | | | | 1,666,350 | |
| Western Refining, Inc. (a) | | | 65,900 | | | | 1,467,593 | |
| | | | | | | | 14,650,302 | |
| Financials 16.6% | |
| Capital Markets 0.5% | |
| State Street Corp. | | | 22,200 | | | | 991,008 | |
| Commercial Banks 3.7% | |
| KeyCorp | | | 79,600 | | | | 616,104 | |
| Regions Financial Corp. | | | 356,500 | | | | 2,406,375 | |
| SunTrust Banks, Inc. | | | 61,800 | | | | 1,497,414 | |
| Susquehanna Bancshares, Inc. | | | 10,800 | | | | 111,240 | |
| Wells Fargo & Co. (a) | | | 31,400 | | | | 1,050,016 | |
| Zions Bancorp. (a) | | | 54,100 | | | | 1,050,622 | |
| | | | | | | | 6,731,771 | |
| | | Shares | | | Value ($) | |
| | | | | | | | | |
| Consumer Finance 3.3% | |
| American Express Co. (a) | | | 23,900 | | | | 1,391,219 | |
| Capital One Financial Corp. | | | 43,400 | | | | 2,372,244 | |
| Discover Financial Services | | | 63,400 | | | | 2,192,372 | |
| | | | | | | | 5,955,835 | |
| Diversified Financial Services 1.5% | |
| Bank of America Corp. | | | 95,000 | | | | 777,100 | |
| Citigroup, Inc. (a) | | | 46,800 | | | | 1,282,788 | |
| JPMorgan Chase & Co. | | | 15,800 | | | | 564,534 | |
| Moody's Corp. (a) | | | 2,800 | | | | 102,340 | |
| | | | | | | | 2,726,762 | |
| Insurance 5.0% | |
| ACE Ltd. | | | 33,300 | | | | 2,468,529 | |
| Aflac, Inc. | | | 4,000 | | | | 170,360 | |
| Allied World Assurance Co. Holdings AG | | | 4,200 | | | | 333,774 | |
| Allstate Corp. | | | 62,200 | | | | 2,182,598 | |
| American International Group, Inc.* (a) | | | 41,900 | | | | 1,344,571 | |
| Chubb Corp. (a) | | | 15,200 | | | | 1,106,864 | |
| Fidelity National Financial, Inc. "A" | | | 5,000 | | | | 96,300 | |
| Loews Corp. (a) | | | 10,300 | | | | 421,373 | |
| MetLife, Inc. | | | 12,600 | | | | 388,710 | |
| PartnerRe Ltd. | | | 2,500 | | | | 189,175 | |
| RenaissanceRe Holdings Ltd. | | | 1,700 | | | | 129,217 | |
| XL Group PLC | | | 7,300 | | | | 153,592 | |
| | | | | | | | 8,985,063 | |
| Real Estate Investment Trusts 2.6% | |
| American Capital Agency Corp. (REIT) (a) | | | 63,500 | | | | 2,134,235 | |
| Brandywine Realty Trust (REIT) | | | 9,300 | | | | 114,762 | |
| CBL & Associates Properties, Inc. (REIT) | | | 25,500 | | | | 498,270 | |
| Hospitality Properties Trust (REIT) | | | 9,200 | | | | 227,884 | |
| Taubman Centers, Inc. (REIT) | | | 8,500 | | | | 655,860 | |
| Weyerhaeuser Co. (REIT) | | | 44,600 | | | | 997,256 | |
| | | | | | | | 4,628,267 | |
| Health Care 14.7% | |
| Biotechnology 1.4% | |
| Amgen, Inc. (a) | | | 20,500 | | | | 1,497,320 | |
| Amylin Pharmaceuticals, Inc.* (a) | | | 23,400 | | | | 660,582 | |
| Regeneron Pharmaceuticals, Inc.* | | | 3,200 | | | | 365,504 | |
| | | | | | | | 2,523,406 | |
| Health Care Providers & Services 6.6% | |
| Aetna, Inc. | | | 8,400 | | | | 325,668 | |
| AmerisourceBergen Corp. | | | 14,700 | | | | 578,445 | |
| Cardinal Health, Inc. | | | 16,100 | | | | 676,200 | |
| Community Health Systems, Inc.* | | | 6,540 | | | | 183,316 | |
| Humana, Inc. | | | 35,600 | | | | 2,756,864 | |
| McKesson Corp. | | | 4,800 | | | | 450,000 | |
| UnitedHealth Group, Inc. | | | 57,200 | | | | 3,346,200 | |
| WellCare Health Plans, Inc.* | | | 16,900 | | | | 895,700 | |
| WellPoint, Inc. (a) | | | 41,900 | | | | 2,672,801 | |
| | | | | | | | 11,885,194 | |
| Pharmaceuticals 6.7% | |
| Abbott Laboratories (a) | | | 58,500 | | | | 3,771,495 | |
| AstraZeneca PLC (ADR) (a) | | | 10,300 | | | | 460,925 | |
| Bristol-Myers Squibb Co. | | | 23,200 | | | | 834,040 | |
| Eli Lilly & Co. (a) | | | 71,700 | | | | 3,076,647 | |
| Forest Laboratories, Inc.* | | | 16,900 | | | | 591,331 | |
| Johnson & Johnson | | | 4,500 | | | | 304,020 | |
| | | Shares | | | Value ($) | |
| | | | | | | | | |
| Merck & Co., Inc. (a) | | | 44,500 | | | | 1,857,875 | |
| Par Pharmaceutical Companies, Inc.* | | | 4,200 | | | | 151,788 | |
| Pfizer, Inc. | | | 46,900 | | | | 1,078,700 | |
| | | | | | | | 12,126,821 | |
| Industrials 10.5% | |
| Aerospace & Defense 2.6% | |
| Boeing Co. | | | 4,000 | | | | 297,200 | |
| Honeywell International, Inc. (a) | | | 20,600 | | | | 1,150,304 | |
| Lockheed Martin Corp. (a) | | | 2,600 | | | | 226,408 | |
| Northrop Grumman Corp. (a) | | | 35,800 | | | | 2,283,682 | |
| Raytheon Co. | | | 14,700 | | | | 831,873 | |
| | | | | | | | 4,789,467 | |
| Airlines 2.9% | |
| Alaska Air Group, Inc.* | | | 17,900 | | | | 642,610 | |
| Delta Air Lines, Inc.* (a) | | | 125,200 | | | | 1,370,940 | |
| Southwest Airlines Co. | | | 49,200 | | | | 453,624 | |
| U.S. Airways Group, Inc.* (a) | | | 128,000 | | | | 1,706,240 | |
| United Continental Holdings, Inc.* (a) | | | 44,200 | | | | 1,075,386 | |
| | | | | | | | 5,248,800 | |
| Building Products 0.4% | |
| Masco Corp. (a) | | | 9,300 | | | | 128,991 | |
| USG Corp.* (a) | | | 33,200 | | | | 632,460 | |
| | | | | | | | 761,451 | |
| Construction & Engineering 0.6% | |
| Chicago Bridge & Iron Co. NV | | | 6,700 | | | | 254,332 | |
| Quanta Services, Inc.* | | | 8,900 | | | | 214,223 | |
| URS Corp. | | | 17,600 | | | | 613,888 | |
| | | | | | | | 1,082,443 | |
| Electrical Equipment 0.1% | |
| General Cable Corp.* | | | 3,900 | | | | 101,166 | |
| Industrial Conglomerates 1.4% | |
| General Electric Co. | | | 52,700 | | | | 1,098,268 | |
| Koninklijke Philips Electronics NV | | | 15,000 | | | | 295,050 | |
| Tyco International Ltd. | | | 20,100 | | | | 1,062,285 | |
| | | | | | | | 2,455,603 | |
| Machinery 1.5% | |
| AGCO Corp.* | | | 15,000 | | | | 685,950 | |
| Caterpillar, Inc. | | | 5,900 | | | | 500,969 | |
| Ingersoll-Rand PLC | | | 25,500 | | | | 1,075,590 | |
| ITT Corp. (a) | | | 6,800 | | | | 119,680 | |
| Oshkosh Corp.* | | | 17,100 | | | | 358,245 | |
| | | | | | | | 2,740,434 | |
| Professional Services 0.1% | |
| Robert Half International, Inc. (a) | | | 5,400 | | | | 154,278 | |
| Road & Rail 0.3% | |
| Avis Budget Group, Inc.* | | | 10,100 | | | | 153,520 | |
| Con-way, Inc. (a) | | | 11,400 | | | | 411,654 | |
| | | | | | | | 565,174 | |
| Trading Companies & Distributors 0.6% | |
| United Rentals, Inc.* | | | 31,400 | | | | 1,068,856 | |
| Information Technology 16.7% | |
| Communications Equipment 0.7% | |
| Brocade Communications Systems, Inc.* | | | 23,700 | | | | 116,841 | |
| Cisco Systems, Inc. | | | 66,700 | | | | 1,145,239 | |
| | | | | | | | 1,262,080 | |
| | | Shares | | | Value ($) | |
| | | | | | | | | |
| Computers & Peripherals 4.9% | |
| Apple, Inc.* | | | 7,700 | | | | 4,496,800 | |
| Dell, Inc.* (a) | | | 124,700 | | | | 1,561,244 | |
| Lexmark International, Inc. "A" (a) | | | 6,000 | | | | 159,480 | |
| Seagate Technology PLC | | | 24,900 | | | | 615,777 | |
| Western Digital Corp.* | | | 67,800 | | | | 2,066,544 | |
| | | | | | | | 8,899,845 | |
| Electronic Equipment, Instruments & Components 0.5% | |
| Avnet, Inc.* | | | 4,200 | | | | 129,612 | |
| Flextronics International Ltd.* | | | 23,600 | | | | 146,320 | |
| Tech Data Corp.* | | | 5,100 | | | | 245,667 | |
| Vishay Intertechnology, Inc.* (a) | | | 46,600 | | | | 439,438 | |
| | | | | | | | 961,037 | |
| Internet Software & Services 2.3% | |
| AOL, Inc.* (a) | | | 40,600 | | | | 1,140,048 | |
| Google, Inc. "A"* | | | 1,900 | | | | 1,102,133 | |
| IAC/InterActiveCorp. | | | 35,100 | | | | 1,600,560 | |
| Yahoo!, Inc.* | | | 16,800 | | | | 265,944 | |
| | | | | | | | 4,108,685 | |
| IT Services 3.4% | |
| Alliance Data Systems Corp.* | | | 3,800 | | | | 513,000 | |
| Computer Sciences Corp. | | | 7,160 | | | | 177,711 | |
| Fiserv, Inc.* | | | 7,400 | | | | 534,428 | |
| International Business Machines Corp. | | | 2,600 | | | | 508,508 | |
| Lender Processing Services, Inc. | | | 8,700 | | | | 219,936 | |
| MasterCard, Inc. "A" | | | 7,000 | | | | 3,010,770 | |
| Total System Services, Inc. | | | 6,000 | | | | 143,580 | |
| Visa, Inc. "A" (a) | | | 8,000 | | | | 989,040 | |
| | | | | | | | 6,096,973 | |
| Semiconductors & Semiconductor Equipment 2.5% | |
| Advanced Micro Devices, Inc.* (a) | | | 113,600 | | | | 650,928 | |
| First Solar, Inc.* (a) | | | 25,100 | | | | 378,006 | |
| Intel Corp. | | | 56,500 | | | | 1,505,725 | |
| KLA-Tencor Corp. | | | 14,500 | | | | 714,125 | |
| Kulicke & Soffa Industries, Inc.* | | | 26,600 | | | | 237,272 | |
| Micron Technology, Inc.* (a) | | | 133,629 | | | | 843,199 | |
| Teradyne, Inc.* (a) | | | 12,400 | | | | 174,344 | |
| | | | | | | | 4,503,599 | |
| Software 2.4% | |
| Microsoft Corp. | | | 123,700 | | | | 3,783,983 | |
| Solarwinds, Inc.* | | | 13,100 | | | | 570,636 | |
| | | | | | | | 4,354,619 | |
| Materials 3.9% | |
| Chemicals 2.3% | |
| CF Industries Holdings, Inc. | | | 12,600 | | | | 2,441,124 | |
| Georgia Gulf Corp. | | | 3,600 | | | | 92,412 | |
| PPG Industries, Inc. | | | 11,400 | | | | 1,209,768 | |
| Valspar Corp. | | | 7,200 | | | | 377,928 | |
| | | | | | | | 4,121,232 | |
| | | Shares | | | Value ($) | |
| | | | | | | | | |
| Construction Materials 0.3% | |
| Cemex SAB de CV (ADR) (a) | | | 74,668 | | | | 502,516 | |
| Metals & Mining 0.6% | |
| Kinross Gold Corp. | | | 57,900 | | | | 471,885 | |
| Ternium SA (ADR) | | | 16,300 | | | | 318,991 | |
| Yamana Gold, Inc. (a) | | | 22,700 | | | | 349,580 | |
| | | | | | | | 1,140,456 | |
| Paper & Forest Products 0.7% | |
| Domtar Corp. (a) | | | 14,900 | | | | 1,142,979 | |
| Louisiana-Pacific Corp.* (a) | | | 12,000 | | | | 130,560 | |
| | | | | | | | 1,273,539 | |
| Telecommunication Services 2.2% | |
| Diversified Telecommunication Services 1.9% | |
| Verizon Communications, Inc. (a) | | | 75,100 | | | | 3,337,444 | |
| Wireless Telecommunication Services 0.3% | |
| China Mobile Ltd. (ADR) (a) | | | 11,400 | | | | 623,238 | |
| Utilities 3.3% | |
| Electric Utilities 0.7% | |
| Edison International (a) | | | 18,200 | | | | 840,840 | |
| NV Energy, Inc. | | | 24,300 | | | | 427,194 | |
| | | | | | | | 1,268,034 | |
| Independent Power Producers & Energy Traders 1.0% | |
| Calpine Corp.* | | | 69,100 | | | | 1,140,841 | |
| NRG Energy, Inc.* | | | 34,400 | | | | 597,184 | |
| | | | | | | | 1,738,025 | |
| Multi-Utilities 1.6% | |
| Ameren Corp. | | | 21,600 | | | | 724,464 | |
| Consolidated Edison, Inc. | | | 13,200 | | | | 820,908 | |
| DTE Energy Co. | | | 4,400 | | | | 261,052 | |
| PG&E Corp. | | | 19,000 | | | | 860,130 | |
| Sempra Energy | | | 2,700 | | | | 185,976 | |
| | | | | | | | 2,852,530 | |
Total Common Stocks (Cost $160,072,713) | | | | 177,567,835 | |
| | |
| Securities Lending Collateral 33.6% | |
| Daily Assets Fund Institutional, 0.24% (b) (c) (Cost $60,616,503) | | | 60,616,503 | | | | 60,616,503 | |
| | |
| Cash Equivalents 1.4% | |
| Central Cash Management Fund, 0.14% (b) (Cost $2,523,492) | | | 2,523,492 | | | | 2,523,492 | |
| | | % of Net Assets | | | Value ($) | |
| | | | |
Total Investment Portfolio (Cost $223,212,708)+ | | | 133.4 | | | | 240,707,830 | |
| Other Assets and Liabilities, Net (a) | | | (33.4 | ) | | | (60,290,504 | ) |
| Net Assets | | | 100.0 | | | | 180,417,326 | |
* Non-income producing security.
+ The cost for federal income tax purposes was $224,213,360. At June 30, 2012, net unrealized appreciation for all securities based on tax cost was $16,494,470. This consisted of aggregate gross unrealized appreciation for all securities in which there was an excess of value over tax cost of $20,224,172 and aggregate gross unrealized depreciation for all securities in which there was an excess of tax cost over value of $3,729,702.
(a) All or a portion of these securities were on loan amounting to $56,032,699. In addition, included in other assets and liabilities, net are pending sales, amounting to $4,335,663, that are also on loan (see Notes to Financial Statements). The value of all securities loaned at June 30, 2012 amounted to $60,368,362, which is 33.5% of net assets.
(b) Affiliated fund managed by Deutsche Investment Management Americas Inc. The rate shown is the annualized seven-day yield at period end.
(c) Represents collateral held in connection with securities lending. Income earned by the Fund is net of borrower rebates.
ADR: American Depositary Receipt
REIT: Real Estate Investment Trust
At June 30, 2012, open futures contracts purchased were as follows:
| Futures | Currency | Expiration Date | | Contracts | | | Notional Value ($) | | | Unrealized Appreciation ($) | |
| S&P 500 E-Mini Index | USD | 9/21/2012 | | | 42 | | | | 2,848,440 | | | | 74,240 | |
| Currency Abbreviation |
| USD United States Dollar |
For information on the Fund's policy and additional disclosures regarding futures contracts, please refer to the Derivatives section of Note B in the accompanying Notes to Financial Statements.
Fair Value Measurements
Various inputs are used in determining the value of the Fund's investments. These inputs are summarized in three broad levels. Level 1 includes quoted prices in active markets for identical securities. Level 2 includes other significant observable inputs (including quoted prices for similar securities, interest rates, prepayment speeds, and credit risk). Level 3 includes significant unobservable inputs (including the Fund's own assumptions in determining the fair value of investments). The inputs or methodology used for valuing securities are not necessarily an indication of the risk associated with investing in those securities.
The following is a summary of the inputs used as of June 30, 2012 in valuing the Fund's investments. For information on the Fund's policy regarding the valuation of investments, please refer to the Security Valuation section of Note A in the accompanying Notes to Financial Statements.
| Assets | | Level 1 | | | Level 2 | | | Level 3 | | | Total | |
| | |
| Common Stocks (d) | | $ | 177,567,835 | | | $ | — | | | $ | — | | | $ | 177,567,835 | |
| Short-Term Investments (d) | | | 63,139,995 | | | | — | | | | — | | | | 63,139,995 | |
| Derivatives (e) | | | 74,240 | | | | — | | | | — | | | | 74,240 | |
| Total | | $ | 240,782,070 | | | $ | — | | | $ | — | | | $ | 240,782,070 | |
There have been no transfers between Level 1 and Level 2 fair value measurements during the period ended June 30, 2012.
(d) See Investment Portfolio for additional detailed categorizations.
(e) Derivatives include unrealized appreciation (depreciation) on open futures contracts.
The accompanying notes are an integral part of the financial statements.
Statement of Assets and Liabilities | as of June 30, 2012 (Unaudited) | |
| Assets | |
Investments: Investments in non-affiliated securities, at value (cost $160,072,713) — including $56,032,699 of securities loaned | | $ | 177,567,835 | |
| Investment in Daily Assets Fund Institutional (cost $60,616,503)* | | | 60,616,503 | |
| Investment in Central Cash Management Fund (cost $2,523,492) | | | 2,523,492 | |
| Total investments in securities, at value (cost $223,212,708) | | | 240,707,830 | |
| Cash | | | 4,290 | |
| Receivable for investment sold | | | 15,631,492 | |
| Deposits with broker for futures contracts | | | 211,935 | |
| Receivable for Fund shares sold | | | 62,678 | |
| Dividends receivable | | | 206,805 | |
| Interest receivable | | | 8,638 | |
| Receivable for variation margin on futures contracts | | | 74,240 | |
| Foreign taxes recoverable | | | 2,113 | |
| Other assets | | | 668 | |
| Total assets | | | 256,910,689 | |
| Liabilities | |
| Payable upon return of securities loaned | | | 60,616,503 | |
| Payable for investments purchased | | | 15,682,354 | |
| Payable for Fund shares redeemed | | | 46,611 | |
| Accrued management fee | | | 57,200 | |
| Accrued Trustees' fees | | | 524 | |
| Other accrued expenses and payables | | | 90,171 | |
| Total liabilities | | | 76,493,363 | |
| Net assets, at value | | $ | 180,417,326 | |
| Net Assets Consist of | |
| Undistributed net investment income | | | 783,794 | |
Net unrealized appreciation (depreciation) on: Investments | | | 17,495,122 | |
| Futures | | | 74,240 | |
| Accumulated net realized gain (loss) | | | (39,247,284 | ) |
| Paid-in capital | | | 201,311,454 | |
| Net assets, at value | | $ | 180,417,326 | |
Class A Net Asset Value, offering and redemption price per share ($178,809,175 ÷ 22,875,976 outstanding shares of beneficial interest, $.01 par value, unlimited number of shares authorized) | | $ | 7.82 | |
Class B Net Asset Value, offering and redemption price per share ($1,608,151 ÷ 205,787 outstanding shares of beneficial interest, $.01 par value, unlimited number of shares authorized) | | $ | 7.81 | |
* Represents collateral on securities loaned.
The accompanying notes are an integral part of the financial statements.
Statement of Operations
| for the six months ended June 30, 2012 (Unaudited) | |
| Investment Income | |
Income: Dividends (net of foreign taxes withheld of $646) | | $ | 1,162,506 | |
| Income distributions — Central Cash Management Fund | | | 573 | |
| Securities lending income, including income from Daily Assets Fund Institutional, net of borrower rebates | | | 34,223 | |
| Total income | | | 1,197,302 | |
Expenses: Management fee | | | 237,688 | |
| Administration fee | | | 60,667 | |
| Services to shareholders | | | 1,346 | |
| Distribution service fee (Class B) | | | 2,053 | |
| Custodian fee | | | 10,796 | |
| Audit fees | | | 20,980 | |
| Legal fees | | | 3,272 | |
| Reports to shareholders | | | 23,646 | |
| Trustees' fees and expenses | | | 4,473 | |
| Other | | | 3,303 | |
| Total expenses | | | 368,224 | |
| Net investment income | | | 829,078 | |
| Realized and Unrealized Gain (Loss) | |
Net realized gain (loss) from: Investments | | | 2,657,310 | |
| Futures | | | 135,892 | |
| Foreign currency | | | 68 | |
| | | | 2,793,270 | |
Change in net unrealized appreciation (depreciation) on: Investments | | | (3,027,349 | ) |
| Futures | | | 51,507 | |
| Foreign currency | | | (18 | ) |
| | | | (2,975,860 | ) |
| Net gain (loss) | | | (182,590 | ) |
| Net increase (decrease) in net assets resulting from operations | | $ | 646,488 | |
The accompanying notes are an integral part of the financial statements.
Statement of Changes in Net Assets | Increase (Decrease) in Net Assets | | Six Months Ended June 30, 2012 (Unaudited) | | | Year Ended December 31, 2011 | |
Operations: Net investment income | | $ | 829,078 | | | $ | 1,190,417 | |
| Net realized gain (loss) | | | 2,793,270 | | | | 5,787,003 | |
| Change in net unrealized appreciation (depreciation) | | | (2,975,860 | ) | | | (6,735,551 | ) |
| Net increase (decrease) in net assets resulting from operations | | | 646,488 | | | | 241,869 | |
Distributions to shareholders from: Net investment income: Class A | | | (1,157,831 | ) | | | (1,231,321 | ) |
| Class B | | | (17,067 | ) | | | (19,225 | ) |
| Total distributions | | | (1,174,898 | ) | | | (1,250,546 | ) |
Fund share transactions: Class A Proceeds from shares sold | | | 3,542,581 | | | | 6,626,996 | |
| Net assets acquired in tax free reorganization* | | | 103,303,156 | | | | — | |
| Reinvestment of distributions | | | 1,157,831 | | | | 1,231,321 | |
| Payments for shares redeemed | | | (14,066,392 | ) | | | (19,720,206 | ) |
| Net increase (decrease) in net assets from Class A share transactions | | | 93,937,176 | | | | (11,861,889 | ) |
Class B Proceeds from shares sold | | | 17,398 | | | | 79,702 | |
| Net assets acquired in tax free reorganization* | | | 34,921 | | | | — | |
| Reinvestment of distributions | | | 17,067 | | | | 19,225 | |
| Payments for shares redeemed | | | (139,304 | ) | | | (429,706 | ) |
| Net increase (decrease) in net assets from Class B share transactions | | | (69,918 | ) | | | (330,779 | ) |
| Increase (decrease) in net assets | | | 93,338,848 | | | | (13,201,345 | ) |
| Net assets at beginning of period | | | 87,078,478 | | | | 100,279,823 | |
| Net assets at end of period (including undistributed net investment income of $783,794 and $1,129,614, respectively) | | $ | 180,417,326 | | | $ | 87,078,478 | |
| Other Information | |
Class A Shares outstanding at beginning of period | | | 11,456,872 | | | | 13,004,152 | |
| Shares sold | | | 446,721 | | | | 857,669 | |
| Shares issued in tax free reorganization* | | | 12,597,547 | | | | — | |
| Shares issued to shareholders in reinvestment of distributions | | | 141,027 | | | | 148,352 | |
| Shares redeemed | | | (1,766,191 | ) | | | (2,553,301 | ) |
| Net increase (decrease) in Class A shares | | | 11,419,104 | | | | (1,547,280 | ) |
| Shares outstanding at end of period | | | 22,875,976 | | | | 11,456,872 | |
Class B Shares outstanding at beginning of period | | | 214,502 | | | | 256,466 | |
| Shares sold | | | 2,249 | | | | 10,552 | |
| Shares issued in tax free reorganization* | | | 4,259 | | | | — | |
| Shares issued to shareholders in reinvestment of distributions | | | 2,076 | | | | 2,316 | |
| Shares redeemed | | | (17,299 | ) | | | (54,832 | ) |
| Net increase (decrease) in Class B shares | | | (8,715 | ) | | | (41,964 | ) |
| Shares outstanding at end of period | | | 205,787 | | | | 214,502 | |
* On April 30, 2012, DWS Blue Chip VIP was acquired by the Fund through a tax-free reorganization (see Note G).
The accompanying notes are an integral part of the financial statements.
| | | | | | Years Ended December 31, | |
| Class A | | Six Months Ended 6/30/12 (Unaudited) | | | 2011 | | | 2010 | | | 2009 | | | 2008 | | | 2007 | |
| Selected Per Share Data | |
| Net asset value, beginning of period | | $ | 7.46 | | | $ | 7.56 | | | $ | 6.71 | | | $ | 5.12 | | | $ | 10.81 | | | $ | 10.94 | |
Income (loss) from investment operations: Net investment income (loss)a | | | .05 | | | | .10 | | | | .09 | | | | .10 | | | | .10 | | | | .13 | |
| Net realized and unrealized gain (loss) | | | .42 | c | | | (.10 | ) | | | .87 | | | | 1.61 | | | | (3.45 | ) | | | .02 | |
| Total from investment operations | | | .47 | | | | .00 | | | | .96 | | | | 1.71 | | | | (3.35 | ) | | | .15 | |
Less distributions from: Net investment income | | | (.11 | ) | | | (.10 | ) | | | (.11 | ) | | | (.12 | ) | | | (.18 | ) | | | (.13 | ) |
| Net realized gains | | | — | | | | — | | | | — | | | | — | | | | (2.16 | ) | | | (.15 | ) |
| Total distributions | | | (.11 | ) | | | (.10 | ) | | | (.11 | ) | | | (.12 | ) | | | (2.34 | ) | | | (.28 | ) |
| Net asset value, end of period | | $ | 7.82 | | | $ | 7.46 | | | $ | 7.56 | | | $ | 6.71 | | | $ | 5.12 | | | $ | 10.81 | |
| Total Return (%) | | | 6.17 | ** | | | (.14 | ) | | | 14.40 | b | | | 34.15 | b | | | (38.31 | )b | | | 1.36 | b |
| Ratios to Average Net Assets and Supplemental Data | |
| Net assets, end of period ($ millions) | | | 179 | | | | 85 | | | | 98 | | | | 101 | | | | 94 | | | | 196 | |
| Ratio of expenses before expense reductions (%) | | | .60 | * | | | .63 | | | | .63 | | | | .63 | | | | .60 | | | | .57 | |
| Ratio of expenses after expense reductions (%) | | | .60 | * | | | .63 | | | | .60 | | | | .54 | | | | .54 | | | | .56 | |
| Ratio of net investment income (loss) (%) | | | 1.37 | * | | | 1.25 | | | | 1.32 | | | | 1.74 | | | | 1.34 | | | | 1.18 | |
| Portfolio turnover rate (%) | | | 149 | ** | | | 215 | | | | 145 | | | | 82 | | | | 130 | | | | 310 | |
a Based on average shares outstanding during the period. b Total return would have been lower had certain expenses not been reduced. c Because of the timing of subscriptions and redemptions in relation to fluctuating markets at value, the amount shown may not agree with the change in aggregate gains and losses. * Annualized ** Not annualized | |
| | | | | | Years Ended December 31, | |
| Class B | | Six Months Ended 6/30/12 (Unaudited) | | | 2011 | | | 2010 | | | 2009 | | | 2008 | | | 2007 | |
| Selected Per Share Data | |
| Net asset value, beginning of period | | $ | 7.45 | | | $ | 7.55 | | | $ | 6.70 | | | $ | 5.12 | | | $ | 10.77 | | | $ | 10.90 | |
Income (loss) from investment operations: Net investment income (loss)a | | | .04 | | | | .08 | | | | .07 | | | | .08 | | | | .08 | | | | .09 | |
| Net realized and unrealized gain (loss) | | | .40 | c | | | (.10 | ) | | | .87 | | | | 1.60 | | | | (3.42 | ) | | | .02 | |
| Total from investment operations | | | .44 | | | | (.02 | ) | | | .94 | | | | 1.68 | | | | (3.34 | ) | | | .11 | |
Less distributions from: Net investment income | | | (.08 | ) | | | (.08 | ) | | | (.09 | ) | | | (.10 | ) | | | (.15 | ) | | | (.09 | ) |
| Net realized gains | | | — | | | | — | | | | — | | | | — | | | | (2.16 | ) | | | (.15 | ) |
| Total distributions | | | (.08 | ) | | | (.08 | ) | | | (.09 | ) | | | (.10 | ) | | | (2.31 | ) | | | (.24 | ) |
| Net asset value, end of period | | $ | 7.81 | | | $ | 7.45 | | | $ | 7.55 | | | $ | 6.70 | | | $ | 5.12 | | | $ | 10.77 | |
| Total Return (%) | | | 5.91 | ** | | | (.40 | ) | | | 14.12 | b | | | 33.64 | b | | | (38.29 | )b | | | 1.00 | b |
| Ratios to Average Net Assets and Supplemental Data | |
| Net assets, end of period ($ millions) | | | 2 | | | | 2 | | | | 2 | | | | 2 | | | | 2 | | | | 15 | |
| Ratio of expenses before expense reductions (%) | | | .86 | * | | | .88 | | | | .88 | | | | .89 | | | | .82 | | | | .95 | |
| Ratio of expenses after expense reductions (%) | | | .86 | * | | | .88 | | | | .85 | | | | .80 | | | | .77 | | | | .92 | |
| Ratio of net investment income (loss) (%) | | | .98 | * | | | .99 | | | | 1.07 | | | | 1.48 | | | | 1.12 | | | | .82 | |
| Portfolio turnover rate (%) | | | 149 | ** | | | 215 | | | | 145 | | | | 82 | | | | 130 | | | | 310 | |
a Based on average shares outstanding during the period. b Total return would have been lower had certain expenses not been reduced. c Because of the timing of subscriptions and redemptions in relation to fluctuating markets at value, the amount shown may not agree with the change in aggregate gains and losses. * Annualized ** Not annualized | |
Notes to Financial Statements (Unaudited)
A. Organization and Significant Accounting Policies
DWS Variable Series I (the "Series") is registered under the Investment Company Act of 1940, as amended (the "1940 Act"), as an open-end, registered management investment company organized as a Massachusetts business trust. The Series consists of five diversified funds: DWS Bond VIP, DWS Core Equity VIP (formerly DWS Growth & Income VIP),, DWS Capital Growth VIP, DWS Global Small Cap Growth VIP and DWS International VIP (individually or collectively hereinafter referred to as a "Fund" or the "Funds"). These financial statements report on DWS Core Equity VIP. The Series is intended to be the underlying investment vehicle for variable annuity contracts and variable life insurance policies to be offered by the separate accounts of certain life insurance companies ("Participating Insurance Companies"). Effective as of the close of business on May 1, 2012, the Fund changed its name to "DWS Core Equity VIP."
Multiple Classes of Shares of Beneficial Interest. The Fund offers two classes of shares (Class A shares and Class B shares). Class B shares are subject to Rule 12b-1 distribution fees under the 1940 Act and recordkeeping fees equal to an annual rate of 0.25% and up to 0.15%, respectively, of the average daily net assets of the Class B shares of the Fund. Class A shares are not subject to such fees.
Investment income, realized and unrealized gains and losses, and certain fund-level expenses and expense reductions, if any, are borne pro rata on the basis of relative net assets by the holders of all classes of shares, except that each class bears certain expenses unique to that class (including the applicable 12b-1 distribution fees and recordkeeping fees). Differences in class-level expenses may result in payment of different per share dividends by class. All shares have equal rights with respect to voting subject to class-specific arrangements.
The Fund's financial statements are prepared in accordance with accounting principles generally accepted in the United States of America, which require the use of management estimates. Actual results could differ from those estimates. The policies described below are followed consistently by the Fund in the preparation of its financial statements.
Security Valuation. Investments are stated at value determined as of the close of regular trading on the New York Stock Exchange on each day the exchange is open for trading.
Various inputs are used in determining the value of the Fund's investments. These inputs are summarized in three broad levels. Level 1 includes quoted prices in active markets for identical securities. Level 2 includes other significant observable inputs (including quoted prices for similar securities, interest rates, prepayment speeds, and credit risk). Level 3 includes significant unobservable inputs (including the Fund's own assumptions in determining the fair value of investments). The inputs or methodology used for valuing securities are not necessarily an indication of the risk associated with investing in those securities.
Equity securities are valued at the most recent sale price or official closing price reported on the exchange (U.S. or foreign) or over-the-counter market on which they trade and are categorized as Level 1 securities. Securities for which no sales are reported are valued at the calculated mean between the most recent bid and asked quotations on the relevant market or, if a mean cannot be determined, at the most recent bid quotation.
Investments in open-end investment companies are valued at their net asset value each business day and are categorized as Level 1.
Futures contracts are generally valued at the settlement prices established each day on the exchange on which they are traded and are categorized as Level 1.
Securities and other assets for which market quotations are not readily available or for which the above valuation procedures are deemed not to reflect fair value are valued in a manner that is intended to reflect their fair value as determined in accordance with procedures approved by the Trustees and are generally categorized as Level 3. In accordance with the Fund's valuation procedures, factors used in determining value may include, but are not limited to, the type of the security; the size of the holding; the initial cost of the security; the existence of any contractual restrictions on the security's disposition; the price and extent of public trading in similar securities of the issuer or of comparable companies; quotations or evaluated prices from broker-dealers and/or pricing services; information obtained from the issuer, analysts, and/or the appropriate stock exchange (for exchange-traded securities); an analysis of the company's or issuer's financial statements; an evaluation of the forces that influence the issuer and the market(s) in which the security is purchased and sold and with respect to debt securities; the maturity, coupon, creditworthiness, currency denomination and the movement of the market in which the security is normally traded. The value determined under these procedures may differ from published values for the same securities.
Disclosure about the classification of fair value measurements is included in a table following the Fund's Investment Portfolio.
Securities Lending. The Fund lends securities to certain financial institutions. The Fund retains beneficial ownership of the securities it has loaned and continues to receive interest and dividends paid by the issuer of securities and to participate in any changes in their market value. The Fund requires the borrowers of the securities to maintain collateral with the Fund consisting of either cash or liquid, unencumbered assets having a value at least equal to the value of the securities loaned. When the collateral falls below specified amounts, the lending agent will use its best effort to obtain additional collateral on the next business day to meet required amounts under the security lending agreement. The Fund may invest the cash collateral into a joint trading account in an affiliated money market fund pursuant to Exemptive Orders issued by the SEC. The Fund receives compensation for lending its securities either in the form of fees or by earning interest on invested cash collateral net of borrower rebates and fees paid to a lending agent. Either the Fund or the borrower may terminate the loan. There may be risks of delay and costs in recovery of securities or even loss of rights in the collateral should the borrower of the securities fail financially. The Fund is also subject to all investment risks associated with the reinvestment of any cash collateral received, including, but not limited to, interest rate, credit and liquidity risk associated with such investments.
Foreign Currency Translations. The books and records of the Fund are maintained in U.S. dollars. Investment securities and other assets and liabilities denominated in a foreign currency are translated into U.S. dollars at the prevailing exchange rates at period end. Purchases and sales of investment securities, income and expenses are translated into U.S. dollars at the prevailing exchange rates on the respective dates of the transactions.
Net realized and unrealized gains and losses on foreign currency transactions represent net gains and losses between trade and settlement dates on securities transactions, the acquisition and disposition of foreign currencies, and the difference between the amount of net investment income accrued and the U.S. dollar amount actually received. That portion of both realized and unrealized gains and losses on investments that results from fluctuations in foreign currency exchange rates is not separately disclosed but is included with net realized and unrealized gain/appreciation and loss/depreciation on investments.
Federal Income Taxes. The Fund is treated as a separate taxpayer as provided for in the Internal Revenue Code, as amended. It is the Fund's policy to comply with the requirements of the Internal Revenue Code, as amended, which are applicable to regulated investment companies, and to distribute all of its taxable income to the separate accounts of the Participating Insurance Companies which hold its shares.
Under the Regulated Investment Company Modernization Act of 2010, net capital losses may be carried forward indefinitely, and their character is retained as short-term and/or long-term. Previously, net capital losses were carried forward for eight years and treated as short-term losses. As a transition rule, the Act requires that post-enactment net capital losses be used before pre-enactment net capital losses.
At December 31, 2011, the Fund had a net tax basis capital loss carryforward of approximately $40,840,000 of pre-enactment losses, which may be applied against any realized net taxable capital gains of each succeeding year until fully utilized or until December 31, 2016 ($11,719,000) and December 31, 2017 ($29,121,000), the respective expiration dates, whichever occurs first.
The Fund has reviewed the tax positions for the open tax years as of December 31, 2011 and has determined that no provision for income tax is required in the Fund's financial statements. The Fund's federal tax returns for the prior three fiscal years remain open subject to examination by the Internal Revenue Service.
Distribution of Income and Gains. The Fund will declare and distribute dividends from its net investment income, if any, annually, although additional distributions may be made if necessary. Net realized gains from investment transactions, in excess of available capital loss carryforwards, would be taxable to the Fund if not distributed, and, therefore, will be distributed to shareholders at least annually.
The timing and characterization of certain income and capital gain distributions are determined annually in accordance with federal tax regulations which may differ from accounting principles generally accepted in the United States of America. These differences primarily relate to futures contracts and certain securities sold at a loss. As a result, net investment income (loss) and net realized gain (loss) on investment transactions for a reporting period may differ significantly from distributions during such period. Accordingly, the Fund may periodically make reclassifications among certain of its capital accounts without impacting the net asset value of the Fund.
The tax character of current year distributions will be determined at the end of the current fiscal year.
Expenses. Expenses of the Series arising in connection with a specific Fund are allocated to that Fund. Other Series expenses which cannot be directly attributed to a Fund are apportioned among the Funds in the Series.
Contingencies. In the normal course of business, the Fund may enter into contracts with service providers that contain general indemnification clauses. The Fund's maximum exposure under these arrangements is unknown as this would involve future claims that may be made against the Fund that have not yet been made. However, based on experience, the Fund expects the risk of loss to be remote.
Other. Investment transactions are accounted for on a trade date plus one basis for daily net asset value calculations. However, for financial reporting purposes, investment transactions are reported on trade date. Interest income is recorded on the accrual basis. Dividend income is recorded on the ex-dividend date net of foreign withholding taxes. Realized gains and losses from investment transactions are recorded on an identified cost basis and may include proceeds from litigation.
B. Derivative Instruments
Futures Contracts. A futures contract is an agreement between a buyer or seller and an established futures exchange or its clearinghouse in which the buyer or seller agrees to take or make a delivery of a specific amount of a financial instrument at a specified price on a specific date (settlement date). For the six months ended June 30, 2012, the Fund entered into futures contracts in circumstances where portfolio management believed they offered an economic means of gaining exposure to a particular asset class or to keep cash on hand to meet shareholder redemptions or other needs while maintaining exposure to the market.
Upon entering into a futures contract, the Fund is required to deposit with a financial intermediary cash or securities ("initial margin") in an amount equal to a certain percentage of the face value indicated in the futures contract. Subsequent payments ("variation margin") are made or received by the Fund dependent upon the daily fluctuations in the value and are recorded for financial reporting purposes as unrealized gains or losses by the Fund. Gains or losses are realized when the contract expires or is closed. Since all futures contracts are exchange traded, counterparty risk is minimized as the exchange's clearinghouse acts as the counterparty, and guarantees the futures against default.
Certain risks may arise upon entering into futures contracts, including the risk that an illiquid market will limit the Fund's ability to close out a futures contract prior to the settlement date and the risk that the futures contract is not well correlated with the security, index or currency to which it relates. Risk of loss may exceed amounts disclosed in the Statement of Assets and Liabilities.
A summary of the open futures contracts as of June 30, 2012, is included in a table following the Fund's Investment Portfolio. For the six months ended June 30, 2012, the investment in futures contracts purchased had a total notional value generally indicative of a range from approximately $631,000 to $2,848,000.
The following table summarizes the value of the Fund's derivative instruments held as of June 30, 2012 and the related location in the accompanying Statement of Assets and Liabilities, presented by primary underlying risk exposure:
| Asset Derivative | | Futures Contracts | |
| Equity Contracts (a) | | $ | 74,240 | |
The above derivative is located in the following Statement of Assets and Liabilities account:
(a) Includes cumulative appreciation of futures contracts as disclosed in the Investment Portfolio. Unsettled variation margin is disclosed separately within the Statement of Assets and Liabilities.
Additionally, the amount of unrealized and realized gains and losses on derivative instruments recognized in Fund earnings during the six months ended June 30, 2012 and the related location in the accompanying Statement of Operations is summarized in the following tables by primary underlying risk exposure:
| Realized Gain (Loss) | | Futures Contracts | |
| Equity Contracts (a) | | $ | 135,892 | |
The above derivative is located in the following Statement of Operations account:
(a) Net realized gain (loss) from futures
| Change in Net Unrealized Appreciation (Depreciation) | | Futures Contracts | |
| Equity Contracts (a) | | $ | 51,507 | |
The above derivative is located in the following Statement of Operations account:
(a) Change in net unrealized appreciation (depreciation) on futures
C. Purchases and Sales of Securities
During the six months ended June 30, 2012, purchases and sales of investment securities (excluding short-term investments) aggregated $192,955,817 and $203,408,219, respectively.
D. Related Parties
Management Agreement. Under the Investment Management Agreement with Deutsche Investment Management Americas Inc. ("DIMA" or the "Advisor"), an indirect, wholly owned subsidiary of Deutsche Bank AG, the Advisor directs the investments of the Fund in accordance with its investment objectives, policies and restrictions. The Advisor determines the securities, instruments and other contracts relating to investments to be purchased, sold or entered into by the Fund or delegates such responsibility to the Fund's subadvisor.
QS Investors, LLC ("QS Investors") serves as subadvisor. As a subadvisor to the Fund, QS Investors makes investment decisions and buys and sells securities for the Fund. QS Investors is paid by the Advisor for the services QS Investors provides to the Fund.
Pursuant to the Investment Management Agreement with the Advisor, the Fund pays a monthly management fee based on the Fund's average daily net assets, computed and accrued daily and payable monthly, at the following annual rates:
| First $250 million of average daily net assets | | | .390 | % |
| Next $750 million of average daily net assets | | | .365 | % |
| Over $1 billion of average daily net assets | | | .340 | % |
Accordingly, for the six months ended June 30, 2012, the fee pursuant to the Investment Management Agreement was equivalent to an annualized effective rate of 0.39% of the Fund's average daily net assets.
Administration Fee. Pursuant to an Administrative Services Agreement, DIMA provides most administrative services to the Fund. For all services provided under the Administrative Services Agreement, the Fund pays the Advisor an annual fee ("Administration Fee") of 0.10% of the Fund's average daily net assets, computed and accrued daily and payable monthly. For the six months ended June 30, 2012, the Administration Fee was $60,667, of which $14,667 is unpaid.
Service Provider Fees. DWS Investments Service Company ("DISC"), an affiliate of the Advisor, is the transfer agent, dividend-paying agent and shareholder service agent for the Fund. Pursuant to a sub-transfer agency agreement between DISC and DST Systems, Inc. ("DST"), DISC has delegated certain transfer agent, dividend-paying agent and shareholder service agent functions to DST. DISC compensates DST out of the shareholder servicing fee it receives from the Fund. For the six months ended June 30, 2012, the amounts charged to the Fund by DISC were as follows:
| Services to Shareholders | | Total Aggregated | | | Unpaid at June 30, 2012 | |
| Class A | | $ | 239 | | | $ | 73 | |
| Class B | | | 40 | | | | 13 | |
| | | $ | 279 | | | $ | 86 | |
Distribution Service Agreement. DWS Investments Distributors, Inc. ("DIDI"), also an affiliate of the Advisor, is the Series' Distributor. In accordance with the Master Distribution Plan, DIDI receives 12b-1 fees of 0.25% of average daily net assets of Class B shares. Pursuant to the Master Distribution Plan, DIDI remits these fees to the Participating Insurance Companies for various costs incurred or paid by these companies in connection with marketing and distribution of Class B shares. For the six months ended June 30, 2012, the Distribution Service Fee aggregated $2,053, of which $481 is unpaid.
Typesetting and Filing Service Fees. Under an agreement with DIMA, DIMA is compensated for providing typesetting and certain regulatory filing services to the Fund. For the six months ended June 30, 2012, the amount charged to the Fund by DIMA included in the Statement of Operations under "reports to shareholders" aggregated $10,584, of which $847 is unpaid.
Trustees' Fees and Expenses. The Fund paid retainer fees to each Trustee not affiliated with the Advisor, plus specified amounts to the Board Chairperson and to each committee Chairperson.
Affiliated Cash Management Vehicle. The Fund may invest uninvested cash balances in Central Cash Management Fund, which is managed by the Advisor. The Fund indirectly bears its proportionate share of the expenses of Central Cash Management Fund. Central Cash Management Fund does not pay the Advisor an investment management fee. Central Cash Management Fund seeks a high level of current income consistent with liquidity and the preservation of capital.
E. Ownership of the Fund
Two participating insurance companies were owners of record of 10% or more of the total outstanding Class A shares of the Fund, each owning 40% and 35%.
F. Line of Credit
The Fund and other affiliated funds (the "Participants") share in a $375 million revolving credit facility provided by a syndication of banks. The Fund may borrow for temporary or emergency purposes, including the meeting of redemption requests that otherwise might require the untimely disposition of securities. The Participants are charged an annual commitment fee which is allocated based on net assets, among each of the Participants. Interest is calculated at a rate per annum equal to the sum of the Federal Funds Rate plus 1.25 percent plus if LIBOR exceeds the Federal Funds Rate the amount of such excess. The Fund may borrow up to a maximum of 33 percent of its net assets under the agreement. The Fund had no outstanding loans at June 30, 2012.
G. Acquisition of Assets
On April 30, 2012, the Fund acquired all of the net assets of DWS Blue Chip VIP pursuant to a plan of reorganization approved by the Board of Trustees on November 18, 2011. The acquisition was accomplished by a tax-free exchange of 8,967,004 Class A shares and 3,018 Class B shares of DWS Blue Chip VIP for 12,597,547 Class A shares and 4,259 Class B shares of the Fund, respectively, outstanding on April 30, 2012. DWS Blue Chip VIP's net assets at that date, $103,338,077, including $13,470,096 of net unrealized appreciation, were combined with those of the Fund. The aggregate net assets of the Fund immediately before the acquisition were $92,542,116. The combined net assets of the Fund immediately following the acquisition were $195,880,193.
The financial statements reflect the operations of the Fund for the period prior to the acquisition and the combined portfolio for the period subsequent to the portfolio merger. Assuming the acquisition had been completed on January 1, 2012, the Fund's pro forma results of operations for the six months ended June 30, 2012, are as follows:
| | | Total Aggregated | |
| Net investment income* | | $ | 1,156,196 | |
| Net gain (loss) on investments | | $ | 10,147,493 | |
| Net increase (decrease) in net assets resulting from operations | | $ | 11,303,689 | |
* Net investment income includes $51,419 of pro forma eliminated expenses.
Because the combined investment portfolio has been managed as a single integrated Fund since the acquisition was completed, it is not practicable to separate the amounts of revenue and earnings of DWS Blue Chip VIP that have been included in the Fund's Statement of Operations since April 30, 2012.
Information About Your Fund's Expenses (Unaudited)
As an investor of the Fund, you incur two types of costs: ongoing expenses and transaction costs. Ongoing expenses include management fees, distribution and service (12b-1) fees and other Fund expenses. Examples of transaction costs include contract charges, redemption fees and account maintenance fees, which are not shown in this section. The following tables are intended to help you understand your ongoing expenses (in dollars) of investing in the Fund and to help you compare these expenses with the ongoing expenses of investing in other mutual funds. The example in the table is based on an investment of $1,000 invested at the beginning of the six-month period and held for the entire period (January 1, 2012 to June 30, 2012).
The tables illustrate your Fund's expenses in two ways:
•Actual Fund Return. This helps you estimate the actual dollar amount of ongoing expenses (but not transaction costs) paid on a $1,000 investment in the Fund using the Fund's actual return during the period. To estimate the expenses you paid over the period, simply divide your account value by $1,000 (for example, an $8,600 account value divided by $1,000 = 8.6), then multiply the result by the number in the "Expenses Paid per $1,000" line under the share class you hold.
• Hypothetical 5% Fund Return. This helps you to compare your Fund's ongoing expenses (but not transaction costs) with those of other mutual funds using the Fund's actual expense ratio and a hypothetical rate of return of 5% per year before expenses. Examples using a 5% hypothetical Fund return may be found in the shareholder reports of other mutual funds. The hypothetical account values and expenses may not be used to estimate the actual ending account balance or expenses you paid for the period.
Please note that the expenses shown in these tables are meant to highlight your ongoing expenses only and do not reflect any transaction costs. The "Expenses Paid per $1,000" line of the tables is useful in comparing ongoing expenses only and will not help you determine the relative total expense of owning different funds. If these transaction costs had been included, your costs would have been higher.
Expenses and Value of a $1,000 Investment for the six months ended June 30, 2012 | |
| Actual Fund Return | | Class A | | | Class B | |
| Beginning Account Value 1/1/12 | | $ | 1,000.00 | | | $ | 1,000.00 | |
| Ending Account Value 6/30/12 | | $ | 1,061.70 | | | $ | 1,059.10 | |
| Expenses Paid per $1,000* | | $ | 3.08 | | | $ | 4.40 | |
| Hypothetical 5% Portfolio Return | | Class A | | | Class B | |
| Beginning Account Value 1/1/12 | | $ | 1,000.00 | | | $ | 1,000.00 | |
| Ending Account Value 6/30/12 | | $ | 1,021.88 | | | $ | 1,020.59 | |
| Expenses Paid per $1,000* | | $ | 3.02 | | | $ | 4.32 | |
* Expenses are equal to the Fund's annualized expense ratio for each share class, multiplied by the average account value over the period, multiplied by 182 (the number of days in the most recent six-month period), then divided by 366.
| Annualized Expense Ratios | Class A | | Class B | |
| DWS Variable Series I — DWS Core Equity VIP | .60% | | .86% | |
For more information, please refer to the Fund's prospectus.
These tables do not reflect charges and fees ("contract charges") associated with the separate account that invests in the Fund or any variable life insurance policy or variable annuity contract for which the Fund is an investment option.
The Series' policies and procedures for voting proxies for portfolio securities and information about how the Series voted proxies related to its portfolio securities during the 12-month period ended June 30 are available on our Web site — www.dws-investments.com (click on "proxy voting"at the bottom of the page) — or on the SEC's Web site — www.sec.gov. To obtain a written copy of the Series' policies and procedures without charge, upon request, call us toll free at (800) 728-3337.
Summary of Management Fee Evaluation by Independent Fee Consultant
September 26, 2011
Pursuant to an Order entered into by Deutsche Investment Management Americas and affiliates (collectively, "DeAM") with the Attorney General of New York, I, Thomas H. Mack, have been appointed the Independent Fee Consultant for the DWS Funds (formerly the DWS Scudder Funds). My duties include preparing an annual written evaluation of the management fees DeAM charges the Funds, considering among other factors the management fees charged by other mutual fund companies for like services, management fees DeAM charges other clients for like services, DeAM's costs of supplying services under the management agreements and related profit margins, possible economies of scale if a Fund grows larger, and the nature and quality of DeAM's services, including fund performance. This report summarizes my evaluation for 2011, including my qualifications, the evaluation process for each of the DWS Funds, consideration of certain complex-level factors, and my conclusions. I served in substantially the same capacity in 2007, 2008, 2009 and 2010.
Qualifications
For more than 35 years I have served in various professional capacities within the investment management business. I have held investment analysis and advisory positions, including securities analyst, portfolio strategist and director of investment policy with a large investment firm. I have also performed business management functions, including business development, financial management and marketing research and analysis.
Since 1991, I have been an independent consultant within the asset management industry. I have provided services to over 125 client organizations, including investment managers, mutual fund boards, product distributors and related organizations. Over the past ten years I have completed a number of assignments for mutual fund boards, specifically including assisting boards with management contract renewal.
I hold a Master of Business Administration degree, with highest honors, from Harvard University and Master of Science and Bachelor of Science (highest honors) degrees from the University of California at Berkeley. I am an independent director and audit committee financial expert for two closed-end mutual funds and have served in various leadership and financial oversight capacities with non-profit organizations.
Evaluation of Fees for each DWS Fund
My work focused primarily on evaluating, fund-by-fund, the fees charged to each of the 109 mutual fund portfolios in the DWS Fund family. For each Fund, I considered each of the key factors mentioned above, as well as any other relevant information. In doing so I worked closely with the Funds' Independent Directors in their annual contract renewal process, as well as in their approval of contracts for several new funds (documented separately).
In evaluating each Fund's fees, I reviewed comprehensive materials provided by or on behalf of DeAM, including expense information prepared by Lipper Analytical, comparative performance information, profitability data, manager histories, and other materials. I also accessed certain additional information from the Lipper and Morningstar databases and drew on my industry knowledge and experience.
To facilitate evaluating this considerable body of information, I prepared for each Fund a document summarizing the key data elements in each area as well as additional analytics discussed below. This made it possible to consider each key data element in the context of the others.
In the course of contract renewal, DeAM agreed to implement a number of fee and expense adjustments requested by the Independent Directors which will favorably impact future fees and expenses, and my evaluation includes the effects of these changes.
Fees and Expenses Compared with Other Funds
The competitive fee and expense evaluation for each fund focused on two primary comparisons:
The Fund's contractual management fee (the advisory fee plus the administration fee where applicable) compared with those of a group of typically 12-15 funds in the same Lipper investment category (e.g. Large Capitalization Growth) having similar distribution arrangements and being of similar size.
The Fund's total expenses compared with a broader universe of funds from the same Lipper investment category and having similar distribution arrangements.
These two comparisons provide a view of not only the level of the fee compared with funds of similar scale but also the total expense the Fund bears for all the services it receives, in comparison with the investment choices available in the Fund's investment category and distribution channel. The principal figure-of-merit used in these comparisons was the subject Fund's percentile ranking against peers.
DeAM's Fees for Similar Services to Others
DeAM provided management fee schedules for all of its US domiciled fund and non-fund investment management accounts in any of the investment categories where there is a DWS Fund. These similar products included the other DWS Funds, non-fund pooled accounts, institutional accounts and sub-advisory accounts. Using this information, I calculated for each Fund the fee that would be charged to each similar product, at the subject Fund's asset level.
Evaluating information regarding non-fund products is difficult because there are varying levels of services required for different types of accounts, with mutual funds generally requiring considerably more regulatory and administrative types of service as well as having more frequent cash flows than other types of accounts. Also, while mutual fund fees for similar fund products can be expected to be similar, there will be some differences due to different pricing conditions in different distribution channels (e.g. retail funds versus those used in variable insurance products), differences in underlying investment processes and other factors.
Costs and Profit Margins
DeAM provided a detailed profitability analysis for each Fund. After making some adjustments so that the presentation would be more comparable to the available industry figures, I reviewed profit margins from investment management alone, from investment management plus other fund services (excluding distribution) provided to the Funds by DeAM (principally shareholder services), and DeAM profits from all sources, including distribution. A later section comments on overall profitability.
Economies of Scale
Economies of scale — an expected decline in management cost per dollar of fund assets as fund assets grow — are very rarely quantified and documented because of inherent difficulties in collecting and analyzing relevant data. However, in virtually every investment category that I reviewed, larger funds tend to have lower fees and lower total expenses than smaller funds. To see how each DWS Fund compares with this industry observation, I reviewed:
The trend in Fund assets over the last five years and the accompanying trend in total expenses. This shows if the Fund has grown and, if so, whether total expense (management fees as well as other expenses) have declined as a percent of assets.
Whether the Fund has break-points in its management fee schedule, the extent of the fee reduction built into the schedule and the asset levels where the breaks take effect, and in the case of a sub-advised Fund how the Fund's break-points compare with those of the sub-advisory fee schedule.
How the Fund's contractual fee schedule compares with trends in the industry data. To accomplish this, I constructed a chart showing how actual latest-fiscal-year contractual fees of the Fund and of other similar funds relate to average fund assets, with the subject Fund's contractual fee schedule superimposed.
Quality of Service — Performance
The quality-of-service evaluation focused on investment performance, which is the principal result of the investment management service. Each Fund's performance was reviewed over the past 1, 3, 5 and 10 years, as applicable, and compared with that of other funds in the same investment category and with a suitable market index.
In addition, I calculated and reviewed risk-adjusted returns relative to an index of similar mutual funds' returns and a suitable market index. The risk-adjusted returns analysis provides a way of determining the extent to which the Fund's return comparisons are mainly the product of investment value-added (or lack thereof) or alternatively taking considerably more or less risk than is typical in its investment category.
I also received and considered the history of portfolio manager changes for each Fund, as this provided an important context for evaluating the performance results.
Complex-Level Considerations
While this evaluation was conducted mainly at the individual fund level, there are some issues relating to the reasonableness of fees that can alternatively be considered across the whole fund complex:
I reviewed DeAM's profitability analysis for all DWS Funds, with a view toward determining if the allocation procedures used were reasonable and how profit levels compared with public data for other investment managers.
I considered whether DeAM and affiliates receive any significant ancillary or "fall-out" benefits that should be considered in interpreting the direct profitability results. These would be situations where serving as the investment manager of the Funds is beneficial to another part of the Deutsche Bank organization.
I considered how aggregated DWS Fund expenses had varied over the years, by asset class and in the context of trends in asset levels.
I reviewed the structure of the DeAM organization, trends in staffing levels, and information on compensation of investment management and other professionals compared with industry data.
Findings
Based on the process and analysis discussed above, which included reviewing a wide range of information from management and external data sources and considering among other factors the fees DeAM charges other clients, the fees charged by other fund managers, DeAM's costs and profits associated with managing the Funds, economies of scale, possible fall-out benefits, and the nature and quality of services provided, in my opinion the management fees charged the DWS Funds are reasonable.
Thomas H. Mack
President, Thomas H. Mack & Co., Inc.
Notes
DWS Investments Distributors, Inc.
222 South Riverside Plaza
Chicago, IL 60606
(800) 621-1148
VS1coreq-3 (R-028376-1 8/12)
JUNE 30, 2012
SEMIANNUAL REPORT
DWS VARIABLE SERIES I
DWS Global Small Cap Growth VIP
Contents
9 Statement of Assets and Liabilities 10 Statement of Operations 11 Statement of Changes in Net Assets 15 Notes to Financial Statements 19 Information About Your Fund's Expenses 21 Summary of Management Fee Evaluation by Independent Fee Consultant |
This report must be preceded or accompanied by a prospectus. To obtain an additional prospectus or summary prospectus, if available, call (800) 728-3337 or your financial representative. We advise you to consider the Fund's objectives, risks, charges and expenses carefully before investing. The summary prospectus and prospectus contain this and other important information about the Fund. Please read the prospectus carefully before you invest.
Investing in foreign securities, particularly those of emerging markets, presents certain risks, such as currency fluctuations, political and economic changes, and market risks. The Fund may lend securities to approved institutions. Stocks of smaller companies involve greater risk than securities of larger, more-established companies. Stocks may decline in value. See the prospectus for details.
DWS Investments is part of Deutsche Bank's Asset Management division and, within the U.S., represents the retail asset management activities of Deutsche Bank AG, Deutsche Bank Trust Company Americas, Deutsche Investment Management Americas Inc. and DWS Trust Company.
NOT FDIC/NCUA INSURED NO BANK GUARANTEE MAY LOSE VALUE NOT A DEPOSIT
NOT INSURED BY ANY FEDERAL GOVERNMENT AGENCY
Performance Summary June 30, 2012 (Unaudited)
Fund performance shown is historical, assumes reinvestment of all dividend and capital gain distributions, and does not guarantee future results. Investment return and principal value fluctuate with changing market conditions so that, when redeemed, shares may be worth more or less than their original cost. Current performance may be lower or higher than the performance data quoted. Please contact your participating insurance company for the Fund's most recent month-end performance. Performance doesn't reflect charges and fees ("contract charges") associated with the separate account that invests in the Fund or any variable life insurance policy or variable annuity contract for which the Fund is an investment option. These charges and fees will reduce returns. While all share classes have the same underlying portfolio, their performance will differ.
The gross expense ratios of the Fund, as stated in the fee table of the prospectus dated May 1, 2012 are 1.12% and 1.38% for Class A and Class B shares, respectively, and may differ from the expense ratios disclosed in the Financial Highlights tables in this report.
| Growth of an Assumed $10,000 Investment |
| The S&P® Developed SmallCap Index is an unmanaged index of small-capitalization stocks within 26 countries around the globe. Index returns do not reflect any fees or expenses and it is not possible to invest directly into an index. |
| |
| Yearly periods ended June 30 | |
| Comparative Results | |
| DWS Global Small Cap Growth VIP | | 6-Month‡ | | | 1-Year | | | 3-Year | | | 5-Year | | | 10-Year | |
| Class A | Growth of $10,000 | | $ | 10,298 | | | $ | 8,822 | | | $ | 14,537 | | | $ | 8,737 | | | $ | 21,994 | |
| Average annual total return | | | 2.98 | % | | | -11.78 | % | | | 13.28 | % | | | -2.66 | % | | | 8.20 | % |
| S&P Developed SmallCap Index | Growth of $10,000 | | $ | 10,617 | | | $ | 9,089 | | | $ | 15,013 | | | $ | 8,981 | | | $ | 22,427 | |
| Average annual total return | | | 6.17 | % | | | -9.11 | % | | | 14.50 | % | | | -2.13 | % | | | 8.41 | % |
| DWS Global Small Cap Growth VIP | | 6-Month‡ | | | 1-Year | | | 3-Year | | | 5-Year | | | 10-Year | |
| Class B | Growth of $10,000 | | $ | 10,284 | | | $ | 8,800 | | | $ | 14,443 | | | $ | 8,606 | | | $ | 21,452 | |
| Average annual total return | | | 2.84 | % | | | -12.00 | % | | | 13.04 | % | | | -2.96 | % | | | 7.93 | % |
| S&P Developed SmallCap Index | Growth of $10,000 | | $ | 10,617 | | | $ | 9,089 | | | $ | 15,013 | | | $ | 8,981 | | | $ | 22,427 | |
| Average annual total return | | | 6.17 | % | | | -9.11 | % | | | 14.50 | % | | | -2.13 | % | | | 8.41 | % |
The growth of $10,000 is cumulative.
‡ Total returns shown for periods less than one year are not annualized.
Portfolio Summary (Unaudited) Asset Allocation (As a % of Investment Portfolio excluding Securities Lending Collateral) | 6/30/12 | 12/31/11 |
| | | |
| Common Stocks | 97% | 99% |
| Cash Equivalents | 3% | 1% |
| | 100% | 100% |
Geographical Diversification (As a % of Investment Portfolio excluding Cash Equivalents and Securities Lending Collateral) | 6/30/12 | 12/31/11 |
| | | |
| United States | 45% | 45% |
| Continental Europe | 22% | 22% |
| United Kingdom | 11% | 11% |
| Asia (excluding Japan) | 10% | 10% |
| Japan | 7% | 7% |
| Canada | 2% | 1% |
| Latin America | 1% | 1% |
| Middle East | 1% | 1% |
| Australia | 0% | 1% |
| Other | 1% | 1% |
| | 100% | 100% |
Sector Diversification (As a % of Investment Portfolio excluding Cash Equivalents and Securities Lending Collateral) | 6/30/12 | 12/31/11 |
| | | |
| Industrials | 25% | 23% |
| Consumer Discretionary | 21% | 20% |
| Health Care | 19% | 20% |
| Financials | 11% | 10% |
| Information Technology | 10% | 12% |
| Energy | 7% | 8% |
| Consumer Staples | 4% | 5% |
| Materials | 3% | 2% |
| | 100% | 100% |
Portfolio holdings and characteristics are subject to change.
For more complete details about the Fund's investment portfolio, see page 5.
Following the Fund's fiscal first and third quarter-end, a complete portfolio holdings listing is filed with the SEC on Form N-Q. The form will be available on the SEC's Web site at www.sec.gov, and it also may be reviewed and copied at the SEC's Public Reference Room in Washington, D.C. Information on the operation of the SEC's Public Reference Room may be obtained by calling (800) SEC-0330. The Fund's portfolio holdings are also posted on www.dws-investments.com from time to time. Please see the Fund's current prospectus for more information.
Joseph Axtell, CFA
Portfolio Manager
Investment Portfolio June 30, 2012 (Unaudited) | | | Shares | | | Value ($) | |
| | | | |
| Common Stocks 96.6% | |
| Australia 0.4% | |
| Austal Ltd. (Cost $585,193) | | | 306,363 | | | | 508,100 | |
| Austria 1.2% | |
| Andritz AG (Cost $1,197,463) | | | 27,269 | | | | 1,403,866 | |
| Bermuda 1.1% | |
| Energy XXI (Bermuda) Ltd. | | | 19,214 | | | | 601,206 | |
| Lazard Ltd. "A" (a) | | | 26,243 | | | | 682,056 | |
| (Cost $1,243,125) | | | | 1,283,262 | |
| Brazil 1.1% | |
| Fleury SA (Cost $1,188,202) | | | 102,523 | | | | 1,301,636 | |
| Canada 1.6% | |
| Americas Petrogas, Inc.* | | | 192,584 | | | | 357,513 | |
| Fortress Paper Ltd. "A"* | | | 19,448 | | | | 347,088 | |
| SunOpta, Inc.* | | | 222,575 | | | | 1,248,645 | |
| (Cost $2,836,422) | | | | 1,953,246 | |
| Channel Islands 0.8% | |
| Randgold Resources Ltd. (ADR) (Cost $652,403) | | | 10,775 | | | | 969,858 | |
| China 1.9% | |
| Charm Communications, Inc. (ADR) | | | 108,380 | | | | 705,554 | |
| Minth Group Ltd. | | | 1,391,554 | | | | 1,510,206 | |
| (Cost $1,809,876) | | | | 2,215,760 | |
| Cyprus 0.6% | |
| ProSafe SE (Cost $603,860) | | | 95,272 | | | | 692,732 | |
| France 1.3% | |
| Flamel Technologies SA (ADR)* | �� | | 161,320 | | | | 701,742 | |
| JC Decaux SA | | | 41,153 | | | | 908,067 | |
| (Cost $3,032,187) | | | | 1,609,809 | |
| Germany 5.2% | |
| Fresenius Medical Care AG & Co. KGaA | | | 28,308 | | | | 2,003,686 | |
| Gerresheimer AG* | | | 12,927 | | | | 608,807 | |
| M.A.X. Automation AG (b) | | | 217,300 | | | | 1,072,443 | |
| Rational AG | | | 5,513 | | | | 1,314,190 | |
| United Internet AG (Registered) | | | 71,715 | | | | 1,231,106 | |
| (Cost $2,581,181) | | | | 6,230,232 | |
| Gibraltar 0.3% | |
| Bwin.Party Digital Entertainment PLC (Cost $864,797) | | | 209,531 | | | | 361,607 | |
| Hong Kong 3.1% | |
| K Wah International Holdings Ltd. | | | 3,860,033 | | | | 1,519,063 | |
| REXLot Holdings Ltd. | | | 20,422,633 | | | | 1,463,855 | |
| SOCAM Development Ltd. | | | 451,410 | | | | 437,641 | |
| Techtronic Industries Co., Ltd. | | | 240,207 | | | | 304,663 | |
| (Cost $3,240,251) | | | | 3,725,222 | |
| Ireland 4.1% | |
| C&C Group PLC (c) | | | 120,694 | | | | 515,251 | |
| C&C Group PLC (c) | | | 185,737 | | | | 796,816 | |
| Paddy Power PLC | | | 33,340 | | | | 2,176,938 | |
| Ryanair Holdings PLC* (c) | | | 2,200 | | | | 11,147 | |
| | | Shares | | | Value ($) | |
| | | | | | | | | |
| Ryanair Holdings PLC* (c) | | | 285,168 | | | | 1,451,453 | |
| (Cost $2,582,736) | | | | 4,951,605 | |
| Israel 0.6% | |
| EZchip Semiconductor Ltd.* (a) (Cost $608,995) | | | 18,342 | | | | 734,414 | |
| Italy 0.5% | |
| Prysmian SpA (Cost $776,260) | | | 43,156 | | | | 645,497 | |
| Japan 6.4% | |
| Hajime Construction Co., Ltd. | | | 38,329 | | | | 1,110,477 | |
| Kato Sangyo Co., Ltd. | | | 21,960 | | | | 442,020 | |
| Kusuri No Aoki Co., Ltd. | | | 15,265 | | | | 451,266 | |
| MISUMI Group, Inc. | | | 49,863 | | | | 1,174,369 | |
| Nippon Seiki Co., Ltd. | | | 100,890 | | | | 1,030,594 | |
| OSG Corp. | | | 57,461 | | | | 826,400 | |
| Sanrio Co., Ltd. (b) | | | 15,547 | | | | 566,653 | |
| Sumikin Bussan Corp. | | | 407,782 | | | | 1,028,724 | |
| United Arrows Ltd. | | | 39,247 | | | | 978,703 | |
| (Cost $7,619,943) | | | | 7,609,206 | |
| Korea 0.9% | |
| DGB Financial Group, Inc. (Cost $1,293,440) | | | 87,306 | | | | 1,064,123 | |
| Luxembourg 1.0% | |
| L'Occitane International SA (Cost $938,911) | | | 437,624 | | | | 1,212,091 | |
| Malaysia 0.7% | |
| Hartalega Holdings Bhd. (Cost $595,736) | | | 680,121 | | | | 863,285 | |
| Netherlands 4.2% | |
| Brunel International NV | | | 22,825 | | | | 905,738 | |
| Chicago Bridge & Iron Co. NV (d) | | | 28,229 | | | | 1,071,573 | |
| Koninklijke Vopak NV | | | 28,572 | | | | 1,832,220 | |
| SBM Offshore NV* | | | 84,575 | | | | 1,173,759 | |
| (Cost $2,491,209) | | | | 4,983,290 | |
| Philippines 0.7% | |
| Alliance Global Group, Inc. (Cost $789,009) | | | 3,054,858 | | | | 845,374 | |
| Singapore 2.3% | |
| Amtek Engineering Ltd. | | | 1,076,641 | | | | 534,583 | |
| Lian Beng Group Ltd. | | | 1,715,343 | | | | 511,319 | |
| UOB-Kay Hian Holdings Ltd. | | | 558,337 | | | | 694,130 | |
| Yongnam Holdings Ltd. | | | 5,381,892 | | | | 981,299 | |
| (Cost $3,333,594) | | | | 2,721,331 | |
| Switzerland 2.2% | |
| Dufry AG (Registered)* | | | 10,330 | | | | 1,253,119 | |
| Partners Group Holding AG | | | 7,929 | | | | 1,409,631 | |
| (Cost $1,689,711) | | | | 2,662,750 | |
| United Arab Emirates 0.3% | |
| Lamprell PLC (Cost $609,287) | | | 203,643 | | | | 322,123 | |
| United Kingdom 10.6% | |
| Aegis Group PLC | | | 246,159 | | | | 624,928 | |
| ARM Holdings PLC | | | 141,768 | | | | 1,128,956 | |
| Ashmore Group PLC | | | 290,155 | | | | 1,592,306 | |
| Babcock International Group PLC | | | 153,039 | | | | 2,047,801 | |
| | | Shares | | | Value ($) | |
| | | | | | | | | |
| Burberry Group PLC | | | 49,152 | | | | 1,025,271 | |
| Domino's Pizza Group PLC | | | 137,972 | | | | 1,115,300 | |
| Hargreaves Lansdown PLC | | | 82,882 | | | | 690,880 | |
| IG Group Holdings PLC | | | 128,107 | | | | 964,524 | |
| John Wood Group PLC | | | 87,220 | | | | 940,310 | |
| Rotork PLC | | | 44,187 | | | | 1,364,996 | |
| Serco Group PLC | | | 71,008 | | | | 597,051 | |
| The Weir Group PLC | | | 25,413 | | | | 612,931 | |
| (Cost $7,451,784) | | | | 12,705,254 | |
| United States 43.5% | |
| Accuray, Inc.* (b) | | | 100,384 | | | | 686,627 | |
| Advance Auto Parts, Inc. (b) | | | 16,295 | | | | 1,111,645 | |
| Aecom Technology Corp.* | | | 34,480 | | | | 567,196 | |
| Aeropostale, Inc.* | | | 51,413 | | | | 916,694 | |
| Affiliated Managers Group, Inc.* | | | 9,514 | | | | 1,041,307 | |
| Altra Holdings, Inc. | | | 47,738 | | | | 753,306 | |
| Ancestry.com, Inc.* (b) | | | 35,029 | | | | 964,348 | |
| Applied Industrial Technologies, Inc. | | | 16,377 | | | | 603,492 | |
| Approach Resources, Inc.* (b) | | | 24,637 | | | | 629,229 | |
| BE Aerospace, Inc.* | | | 39,951 | | | | 1,744,261 | |
| BorgWarner, Inc.* (b) | | | 15,082 | | | | 989,228 | |
| Cardtronics, Inc.* | | | 41,007 | | | | 1,238,821 | |
| Centene Corp.* (b) | | | 45,288 | | | | 1,365,886 | |
| Cognex Corp. | | | 30,625 | | | | 969,281 | |
| CONMED Corp. | | | 28,686 | | | | 793,742 | |
| Deckers Outdoor Corp.* (b) | | | 12,057 | | | | 530,629 | |
| Dresser-Rand Group, Inc.* | | | 26,444 | | | | 1,177,816 | |
| FSI International, Inc.* | | | 131,090 | | | | 470,613 | |
| Green Mountain Coffee Roasters, Inc.* (b) | | | 9,054 | | | | 197,196 | |
| Guess?, Inc. | | | 29,951 | | | | 909,612 | |
| Harris Corp. | | | 22,354 | | | | 935,515 | |
| Haynes International, Inc. | | | 10,849 | | | | 552,648 | |
| Incyte Corp., Ltd.* (b) | | | 38,359 | | | | 870,749 | |
| Jarden Corp. | | | 31,571 | | | | 1,326,613 | |
| Jefferies Group, Inc. (b) | | | 55,023 | | | | 714,749 | |
| Joy Global, Inc. | | | 8,798 | | | | 499,111 | |
| Manitowoc Co., Inc. (b) | | | 79,116 | | | | 925,657 | |
| Metropolitan Health Networks, Inc.* | | | 93,357 | | | | 893,426 | |
| MICROS Systems, Inc.* | | | 8,590 | | | | 439,808 | |
| Molina Healthcare, Inc.* | | | 39,368 | | | | 923,573 | |
| NIC, Inc. | | | 65,820 | | | | 835,914 | |
| NxStage Medical, Inc.* | | | 63,679 | | | | 1,067,260 | |
| Oil States International, Inc.* | | | 15,628 | | | | 1,034,574 | |
| Pacira Pharmaceuticals, Inc.* (b) | | | 144,940 | | | | 2,324,838 | |
| Par Pharmaceutical Companies, Inc.* | | | 27,283 | | | | 986,008 | |
| Parametric Technology Corp.* | | | 30,835 | | | | 646,302 | |
| Prosperity Bancshares, Inc. | | | 21,175 | | | | 889,985 | |
| Questcor Pharmaceuticals, Inc.* (b) | | | 19,654 | | | | 1,046,379 | |
| Rockwood Holdings, Inc. | | | 12,506 | | | | 554,641 | |
| | | Shares | | | Value ($) | |
| | | | | | | | | |
| Rosetta Resources, Inc.* | | | 13,680 | | | | 501,235 | |
| Sauer-Danfoss, Inc. | | | 18,936 | | | | 661,434 | |
| Schweitzer-Mauduit International, Inc. | | | 22,171 | | | | 1,510,732 | |
| Stericycle, Inc.* | | | 6,734 | | | | 617,306 | |
| SXC Health Solutions Corp.* (b) | | | 11,950 | | | | 1,185,560 | |
| Sycamore Networks, Inc.* | | | 41,306 | | | | 599,763 | |
| Tenneco, Inc.* | | | 21,800 | | | | 584,676 | |
| Tesla Motors, Inc.* (b) | | | 10,163 | | | | 318,000 | |
| Thoratec Corp.* | | | 54,408 | | | | 1,827,021 | |
| TiVo, Inc.* | | | 72,127 | | | | 596,490 | |
| TreeHouse Foods, Inc.* | | | 19,325 | | | | 1,203,754 | |
| United Rentals, Inc.* (b) | | | 8,777 | | | | 298,769 | |
| Urban Outfitters, Inc.* | | | 40,046 | | | | 1,104,869 | |
| VeriFone Systems, Inc.* (b) | | | 19,782 | | | | 654,586 | |
| VIVUS, Inc.* | | | 32,906 | | | | 939,137 | |
| Volcano Corp.* | | | 23,866 | | | | 683,761 | |
| WABCO Holdings, Inc.* | | | 23,677 | | | | 1,253,224 | |
| Waddell & Reed Financial, Inc. "A" | | | 25,492 | | | | 771,898 | |
| WellCare Health Plans, Inc.* | | | 15,046 | | | | 797,438 | |
| Zions Bancorp. (b) | | | 43,060 | | | | 836,225 | |
| (Cost $41,643,843) | | | | 52,074,557 | |
Total Common Stocks (Cost $92,259,418) | | | | 115,650,230 | |
| | |
| Warrants 0.0% | |
| Hong Kong 0.0% | |
| Kingboard Chemical Holdings Ltd., Expiration Date 10/31/2012* (Cost $0) | | | 39,014 | | | | 50 | |
| Malaysia 0.0% | |
| Hartalega Holdings Bhd., Expiration Date 5/29/2015* (Cost $0) | | | 68,733 | | | | 9,014 | |
Total Warrants (Cost $0) | | | | 9,064 | |
| | |
| Securities Lending Collateral 12.2% | |
| Daily Assets Fund Institutional, 0.24% (e) (f) (Cost $14,562,494) | | | 14,562,494 | | | | 14,562,494 | |
| | |
| Cash Equivalents 3.1% | |
| Central Cash Management Fund, 0.14% (e) (Cost $3,663,433) | | | 3,663,433 | | | | 3,663,433 | |
| | | % of Net Assets | | | Value ($) | |
| | | | |
Total Investment Portfolio (Cost $110,485,345)+ | | | 111.9 | | | | 133,885,221 | |
| Other Assets and Liabilities, Net | | | (11.9 | ) | | | (14,183,099 | ) |
| Net Assets | | | 100.0 | | | | 119,702,122 | |
* Non-income producing security.
+ The cost for federal income tax purposes was $111,154,196. At June 30, 2012, net unrealized appreciation for all securities based on tax cost was $22,731,025. This consisted of aggregate gross unrealized appreciation for all securities in which there was an excess of value over tax cost of $32,387,210 and aggregate gross unrealized depreciation for all securities in which there was an excess of tax cost over value of $9,656,185.
(a) Listed on the NASDAQ Stock Market, Inc.
(b) All or a portion of these securities were on loan (see Notes to Financial Statements). The value of all securities loaned at June 30, 2012 amounted to $14,480,671, which is 12.1% of net assets.
(c) Securities with the same description are the same corporate entity but trade on different stock exchanges.
(d) Listed on the New York Stock Exchange.
(e) Affiliated fund managed by Deutsche Investment Management Americas Inc. The rate shown is the annualized seven-day yield at period end.
(f) Represents collateral held in connection with securities lending. Income earned by the Fund is net of borrower rebates.
ADR: American Depositary Receipt
Fair Value Measurements
Various inputs are used in determining the value of the Fund's investments. These inputs are summarized in three broad levels. Level 1 includes quoted prices in active markets for identical securities. Level 2 includes other significant observable inputs (including quoted prices for similar securities, interest rates, prepayment speeds, and credit risk). Level 3 includes significant unobservable inputs (including the Fund's own assumptions in determining the fair value of investments). The inputs or methodology used for valuing securities are not necessarily an indication of the risk associated with investing in those securities.
The following is a summary of the inputs used as of June 30, 2012 in valuing the Fund's investments. For information on the Fund's policy regarding the valuation of investments, please refer to the Security Valuation section of Note A in the accompanying Notes to Financial Statements.
| Assets | | Level 1 | | | Level 2 | | | Level 3 | | | Total | |
| | |
| Common Stocks & Warrants (g) | |
| Australia | | $ | — | | | $ | 508,100 | | | $ | — | | | $ | 508,100 | |
| Austria | | | — | | | | 1,403,866 | | | | — | | | | 1,403,866 | |
| Bermuda | | | 1,283,262 | | | | — | | | | — | | | | 1,283,262 | |
| Brazil | | | 1,301,636 | | | | — | | | | — | | | | 1,301,636 | |
| Canada | | | 1,953,246 | | | | — | | | | — | | | | 1,953,246 | |
| Channel Islands | | | 969,858 | | | | — | | | | — | | | | 969,858 | |
| China | | | 705,554 | | | | 1,510,206 | | | | — | | | | 2,215,760 | |
| Cyprus | | | — | | | | 692,732 | | | | — | | | | 692,732 | |
| France | | | 701,742 | | | | 908,067 | | | | — | | | | 1,609,809 | |
| Germany | | | — | | | | 6,230,232 | | | | — | | | | 6,230,232 | |
| Gibraltar | | | — | | | | 361,607 | | | | — | | | | 361,607 | |
| Hong Kong | | | — | | | | 3,725,272 | | | | — | | | | 3,725,272 | |
| Ireland | | | — | | | | 4,951,605 | | | | — | | | | 4,951,605 | |
| Israel | | | 734,414 | | | | — | | | | — | | | | 734,414 | |
| Italy | | | — | | | | 645,497 | | | | — | | | | 645,497 | |
| Japan | | | — | | | | 7,609,206 | | | | — | | | | 7,609,206 | |
| Korea | | | — | | | | 1,064,123 | | | | — | | | | 1,064,123 | |
| Luxembourg | | | — | | | | 1,212,091 | | | | — | | | | 1,212,091 | |
| Malaysia | | | — | | | | 863,285 | | | | 9,014 | | | | 872,299 | |
| Netherlands | | | 1,071,573 | | | | 3,911,717 | | | | — | | | | 4,983,290 | |
| Philippines | | | — | | | | 845,374 | | | | — | | | | 845,374 | |
| Singapore | | | — | | | | 2,721,331 | | | | — | | | | 2,721,331 | |
| Switzerland | | | — | | | | 2,662,750 | | | | — | | | | 2,662,750 | |
| United Arab Emirates | | | — | | | | 322,123 | | | | — | | | | 322,123 | |
| United Kingdom | | | — | | | | 12,705,254 | | | | — | | | | 12,705,254 | |
| United States | | | 52,074,557 | | | | — | | | | — | | | | 52,074,557 | |
| Short-Term Investments (g) | | | 18,225,927 | | | | — | | | | — | | | | 18,225,927 | |
| Total | | $ | 79,021,769 | | | $ | 54,854,438 | | | $ | 9,014 | | | $ | 133,885,221 | |
There have been no transfers between Level 1 and Level 2 fair value measurements during the period ended June 30, 2012.
(g) See Investment Portfolio for additional detailed categorizations.
The accompanying notes are an integral part of the financial statements.
Statement of Assets and Liabilities | as of June 30, 2012 (Unaudited) | |
| Assets | |
Investments: Investments in non-affiliated securities, at value (cost $92,259,418) — including $14,480,671 of securities loaned | | $ | 115,659,294 | |
| Investment in Daily Assets Fund Institutional (cost $14,562,494)* | | | 14,562,494 | |
| Investment in Central Cash Management Fund (cost $3,663,433) | | | 3,663,433 | |
| Total investments in securities, at value (cost $110,485,345) | | | 133,885,221 | |
| Foreign currency, at value (cost $120,432) | | | 120,549 | |
| Receivable for investments sold | | | 697,355 | |
| Receivable for Fund shares sold | | | 2,960 | |
| Dividends receivable | | | 170,815 | |
| Interest receivable | | | 11,585 | |
| Foreign taxes recoverable | | | 43,936 | |
| Other assets | | | 263 | |
| Total assets | | | 134,932,684 | |
| Liabilities | |
| Payable upon return of securities loaned | | | 14,562,494 | |
| Payable for investments purchased | | | 418,977 | |
| Payable for Fund shares redeemed | | | 97,932 | |
| Accrued management fee | | | 69,973 | |
| Accrued Trustees' fees | | | 534 | |
| Other accrued expenses and payables | | | 80,652 | |
| Total liabilities | | | 15,230,562 | |
| Net assets, at value | | $ | 119,702,122 | |
| Net Assets Consist of | |
| Undistributed net investment income | | | 373,845 | |
Net unrealized appreciation (depreciation) on: Investments | | | 23,399,876 | |
| Foreign currency | | | (1,401 | ) |
| Accumulated net realized gain (loss) | | | 4,506,571 | |
| Paid-in capital | | | 91,423,231 | |
| Net assets, at value | | $ | 119,702,122 | |
Class A Net Asset Value, offering and redemption price per share ($117,908,661 ÷ 9,584,775 outstanding shares of beneficial interest, $.01 par value, unlimited number of shares authorized) | | $ | 12.30 | |
Class B Net Asset Value, offering and redemption price per share ($1,793,461 ÷ 148,346 outstanding shares of beneficial interest, $.01 par value, unlimited number of shares authorized) | | $ | 12.09 | |
* Represents collateral on securities loaned.
The accompanying notes are an integral part of the financial statements.
Statement of Operations
| for the six months ended June 30, 2012 (Unaudited) | |
| Investment Income | |
Income: Dividends (net of foreign taxes withheld of $69,895) | | $ | 1,016,233 | |
| Income distributions — Central Cash Management Fund | | | 762 | |
| Securities lending income, including income from Daily Assets Fund Institutional, net of borrower rebates | | | 27,085 | |
| Total income | | | 1,044,080 | |
Expenses: Management fee | | | 567,060 | |
| Administration fee | | | 63,922 | |
| Services to shareholders | | | 1,856 | |
| Distribution service fee (Class B) | | | 2,425 | |
| Custodian fee | | | 15,908 | |
| Professional fees | | | 30,198 | |
| Reports to shareholders | | | 22,336 | |
| Trustees' fees and expenses | | | 3,460 | |
| Other | | | 21,721 | |
| Total expenses before expense reductions | | | 728,886 | |
| Expense reductions | | | (93,192 | ) |
| Total expenses after expense reductions | | | 635,694 | |
| Net investment income (loss) | | | 408,386 | |
| Realized and Unrealized Gain (Loss) | |
Net realized gain (loss) from: Investments | | | 5,166,796 | |
| Foreign currency | | | (16,960 | ) |
| | | | 5,149,836 | |
Change in net unrealized appreciation (depreciation) on: Investments | | | (1,454,972 | ) |
| Foreign currency | | | 14,317 | |
| | | | (1,440,655 | ) |
| Net gain (loss) | | | 3,709,181 | |
| Net increase (decrease) in net assets resulting from operations | | $ | 4,117,567 | |
The accompanying notes are an integral part of the financial statements.
Statement of Changes in Net Assets | Increase (Decrease) in Net Assets | | Six Months Ended June 30, 2012 (Unaudited) | | | Year Ended December 31, 2011 | |
Operations: Net investment income (loss) | | $ | 408,386 | | | $ | 834,776 | |
| Net realized gain (loss) | | | 5,149,836 | | | | 18,183,138 | |
| Change in net unrealized appreciation (depreciation) | | | (1,440,655 | ) | | | (33,281,372 | ) |
| Net increase (decrease) in net assets resulting from operations | | | 4,117,567 | | | | (14,263,458 | ) |
Distributions to shareholders from: Net investment income: Class A | | | (847,848 | ) | | | (2,513,532 | ) |
| Class B | | | (8,192 | ) | | | (31,935 | ) |
Net realized gains: Class A | | | (6,623,008 | ) | | | — | |
| Class B | | | (104,904 | ) | | | — | |
| Total distributions | | | (7,583,952 | ) | | | (2,545,467 | ) |
Fund share transactions: Class A Proceeds from shares sold | | | 1,854,208 | | | | 8,812,558 | |
| Reinvestment of distributions | | | 7,470,856 | | | | 2,513,532 | |
| Payments for shares redeemed | | | (11,182,768 | ) | | | (29,308,758 | ) |
| Net increase (decrease) in net assets from Class A share transactions | | | (1,857,704 | ) | | | (17,982,668 | ) |
Class B Proceeds from shares sold | | | 37,270 | | | | 118,378 | |
| Reinvestment of distributions | | | 113,096 | | | | 31,935 | |
| Payments for redeemed | | | (172,767 | ) | | | (327,414 | ) |
| Net increase (decrease) in net assets from Class B share transactions | | | (22,401 | ) | | | (177,101 | ) |
| Increase (decrease) in net assets | | | (5,346,490 | ) | | | (34,968,694 | ) |
| Net assets at beginning of period | | | 125,048,612 | | | | 160,017,306 | |
| Net assets at end of period (including undistributed net investment income of $373,845 and $821,499, respectively) | | $ | 119,702,122 | | | $ | 125,048,612 | |
| Other Information | |
Class A Shares outstanding at beginning of period | | | 9,718,286 | | | | 11,043,518 | |
| Shares sold | | | 139,698 | | | | 635,010 | |
| Shares issued to shareholders in reinvestment of distributions | | | 561,297 | | | | 165,582 | |
| Shares redeemed | | | (834,506 | ) | | | (2,125,824 | ) |
| Net increase (decrease) in Class A shares | | | (133,511 | ) | | | (1,325,232 | ) |
| Shares outstanding at end of period | | | 9,584,775 | | | | 9,718,286 | |
Class B Shares outstanding at beginning of period | | | 150,330 | | | | 163,772 | |
| Shares sold | | | 2,912 | | | | 8,664 | |
| Shares issued to shareholders in reinvestment of distributions | | | 8,640 | | | | 2,139 | |
| Shares redeemed | | | (13,536 | ) | | | (24,245 | ) |
| Net increase (decrease) in Class B shares | | | (1,984 | ) | | | (13,442 | ) |
| Shares outstanding at end of period | | | 148,346 | | | | 150,330 | |
The accompanying notes are an integral part of the financial statements.
| | | | | | Years Ended December 31, | |
| Class A | | Six Months Ended 6/30/12 (Unaudited) | | | 2011 | | | 2010 | | | 2009 | | | 2008 | | | 2007 | |
| Selected Per Share Data | |
| Net asset value, beginning of period | | $ | 12.67 | | | $ | 14.28 | | | $ | 11.32 | | | $ | 7.79 | | | $ | 18.28 | | | $ | 18.15 | |
Income (loss) from investment operations: Net investment income (loss)a | | | .04 | | | | .08 | | | | .05 | | | | .04 | | | | .20 | c | | | .08 | c |
| Net realized and unrealized gain (loss) | | | .40 | | | | (1.45 | ) | | | 2.96 | | | | 3.64 | | | | (8.18 | ) | | | 1.61 | |
| Total from investment operations | | | .44 | | | | (1.37 | ) | | | 3.01 | | | | 3.68 | | | | (7.98 | ) | | | 1.69 | |
Less distributions from: Net investment income | | | (.09 | ) | | | (.24 | ) | | | (.05 | ) | | | (.15 | ) | | | (.04 | ) | | | (.23 | ) |
| Net realized gains | | | (.72 | ) | | | — | | | | — | | | | — | | | | (2.47 | ) | | | (1.33 | ) |
| Total distributions | | | (.81 | ) | | | (.24 | ) | | | (.05 | ) | | | (.15 | ) | | | (2.51 | ) | | | (1.56 | ) |
| Net asset value, end of period | | $ | 12.30 | | | $ | 12.67 | | | $ | 14.28 | | | $ | 11.32 | | | $ | 7.79 | | | $ | 18.28 | |
Total Return (%)b | | | 2.98 | ** | | | (9.90 | ) | | | 26.64 | | | | 48.20 | | | | (49.96 | ) | | | 9.33 | |
| Ratios to Average Net Assets and Supplemental Data | |
| Net assets, end of period ($ millions) | | | 118 | | | | 123 | | | | 158 | | | | 139 | | | | 117 | | | | 310 | |
| Ratio of expenses before expense reductions (%) | | | 1.14 | * | | | 1.12 | | | | 1.12 | | | | 1.11 | | | | 1.11 | | | | 1.14 | |
| Ratio of expenses after expense reductions (%) | | | .99 | * | | | 1.00 | | | | 1.04 | | | | .99 | | | | .99 | | | | 1.12 | |
| Ratio of net investment income (loss) (%) | | | .64 | * | | | .57 | | | | .42 | | | | .47 | | | | 1.53 | c | | | .45 | c |
| Portfolio turnover rate (%) | | | 17 | ** | | | 31 | | | | 39 | | | | 53 | | | | 21 | | | | 19 | |
a Based on average shares outstanding during the period. b Total return would have been lower had certain expenses not been reduced. c Net investment income per share and the ratio of net investment income include non-recurring dividend income amounting to $0.05 and $0.02 per share and 0.37% and 0.09% of average daily net assets for the years ended December 31, 2008 and 2007, respectively. * Annualized ** Not annualized | |
| | | | | | Years Ended December 31, | |
| Class B | | Six Months Ended 6/30/12 (Unaudited) | | | 2011 | | | 2010 | | | 2009 | | | 2008 | | | 2007 | |
| Selected Per Share Data | |
| Net asset value, beginning of period | | $ | 12.45 | | | $ | 14.03 | | | $ | 11.11 | | | $ | 7.65 | | | $ | 18.03 | | | $ | 17.93 | |
Income (loss) from investment operations: Net investment income (loss)a | | | .03 | | | | .05 | | | | .03 | | | | .02 | | | | .16 | c | | | .01 | c |
| Net realized and unrealized gain (loss) | | | .39 | | | | (1.43 | ) | | | 2.90 | | | | 3.57 | | | | (8.07 | ) | | | 1.61 | |
| Total from investment operations | | | .42 | | | | (1.38 | ) | | | 2.93 | | | | 3.59 | | | | (7.91 | ) | | | 1.62 | |
Less distributions from: Net investment income | | | (.06 | ) | | | (.20 | ) | | | (.01 | ) | | | (.13 | ) | | | — | | | | (.19 | ) |
| Net realized gains | | | (.72 | ) | | | — | | | | — | | | | — | | | | (2.47 | ) | | | (1.33 | ) |
| Total distributions | | | (.78 | ) | | | (.20 | ) | | | (.01 | ) | | | (.13 | ) | | | (2.47 | ) | | | (1.52 | ) |
| Net asset value, end of period | | $ | 12.09 | | | $ | 12.45 | | | $ | 14.03 | | | $ | 11.11 | | | $ | 7.65 | | | $ | 18.03 | |
Total Return (%)b | | | 2.84 | ** | | | (10.08 | ) | | | 26.38 | | | | 47.66 | | | | (50.16 | ) | | | 8.92 | |
| Ratios to Average Net Assets and Supplemental Data | |
| Net assets, end of period ($ millions) | | | 2 | | | | 2 | | | | 2 | | | | 7 | | | | 5 | | | | 12 | |
| Ratio of expenses before expense reductions (%) | | | 1.39 | * | | | 1.38 | | | | 1.34 | | | | 1.42 | | | | 1.42 | | | | 1.53 | |
| Ratio of expenses after expense reductions (%) | | | 1.24 | * | | | 1.25 | | | | 1.26 | | | | 1.30 | | | | 1.30 | | | | 1.50 | |
| Ratio of net investment income (loss) (%) | | | .40 | * | | | .32 | | | | .20 | | | | .16 | | | | 1.21 | c | | | .07 | c |
| Portfolio turnover rate (%) | | | 17 | ** | | | 31 | | | | 39 | | | | 53 | | | | 21 | | | | 19 | |
a Based on average shares outstanding during the period. b Total return would have been lower had certain expenses not been reduced. c Net investment income per share and the ratio of net investment income include non-recurring dividend income amounting to $0.05 and $0.02 per share and 0.37% and 0.09% of average daily net assets for the years ended December 31, 2008 and 2007, respectively. * Annualized ** Not annualized | |
Notes to Financial Statements (Unaudited)
A. Organization and Significant Accounting Policies
DWS Variable Series I (the "Series") is registered under the Investment Company Act of 1940, as amended (the "1940 Act"), as an open-end, registered management investment company organized as a Massachusetts business trust. The Series consists of five diversified funds: DWS Bond VIP, DWS Core Equity VIP (formerly DWS Growth & Income VIP), DWS Capital Growth VIP, DWS Global Small Cap Growth VIP and DWS International VIP (individually or collectively hereinafter referred to as a "Fund" or the "Funds"). These financial statements report on DWS Global Small Cap Growth VIP. The Series is intended to be the underlying investment vehicle for variable annuity contracts and variable life insurance policies to be offered by the separate accounts of certain life insurance companies ("Participating Insurance Companies").
Multiple Classes of Shares of Beneficial Interest. The Fund offers two classes of shares (Class A shares and Class B shares). Class B shares are subject to Rule 12b-1 distribution fees under the 1940 Act and recordkeeping fees equal to an annual rate of 0.25% and up to 0.15%, respectively, of the average daily net assets of the Class B shares of the Fund. Class A shares are not subject to such fees.
Investment income, realized and unrealized gains and losses, and certain fund-level expenses and expense reductions, if any, are borne pro rata on the basis of relative net assets by the holders of all classes of shares, except that each class bears certain expenses unique to that class (including the applicable 12b-1 distribution fees). Differences in class-level expenses may result in payment of different per share dividends by class. All shares have equal rights with respect to voting subject to class-specific arrangements.
The Fund's financial statements are prepared in accordance with accounting principles generally accepted in the United States of America, which require the use of management estimates. Actual results could differ from those estimates. The policies described below are followed consistently by the Fund in the preparation of its financial statements.
Security Valuation. Investments are stated at value determined as of the close of regular trading on the New York Stock Exchange on each day the exchange is open for trading.
Various inputs are used in determining the value of the Fund's investments. These inputs are summarized in three broad levels. Level 1 includes quoted prices in active markets for identical securities. Level 2 includes other significant observable inputs (including quoted prices for similar securities, interest rates, prepayment speeds, and credit risk). Level 3 includes significant unobservable inputs (including the Fund's own assumptions in determining the fair value of investments). The inputs or methodology used for valuing securities are not necessarily an indication of the risk associated with investing in those securities.
Equity securities are valued at the most recent sale price or official closing price reported on the exchange (U.S. or foreign) or over-the-counter market on which they trade and are categorized as Level 1 securities. Securities for which no sales are reported are valued at the calculated mean between the most recent bid and asked quotations on the relevant market or, if a mean cannot be determined, at the most recent bid quotation. For certain international equity securities, in order to adjust for events which may occur between the close of the foreign exchanges and the close of the New York Stock Exchange, a fair valuation model may be used. This fair valuation model takes into account comparisons to the valuation of American Depository Receipts (ADRs), exchange-traded funds, futures contracts and certain indices and these securities are categorized as Level 2.
Investments in open-end investment companies are valued at their net asset value each business day and are categorized as Level 1.
Securities and other assets for which market quotations are not readily available or for which the above valuation procedures are deemed not to reflect fair value are valued in a manner that is intended to reflect their fair value as determined in accordance with procedures approved by the Trustees and are generally categorized as Level 3. In accordance with the Fund's valuation procedures, factors used in determining value may include, but are not limited to, the type of the security; the size of the holding; the initial cost of the security; the existence of any contractual restrictions on the security's disposition; the price and extent of public trading in similar securities of the issuer or of comparable companies; quotations or evaluated prices from broker-dealers and/or pricing services; information obtained from the issuer, analysts, and/or the appropriate stock exchange (for exchange-traded securities); an analysis of the company's or issuer's financial statements; an evaluation of the forces that influence the issuer and the market(s) in which the security is purchased and sold and with respect to debt securities; the maturity, coupon, creditworthiness, currency denomination and the movement of the market in which the security is normally traded. The value determined under these procedures may differ from published values for the same securities.
Disclosure about the classification of fair value measurements is included in a table following the Fund's Investment Portfolio.
Securities Lending. The Fund lends securities to certain financial institutions. The Fund retains beneficial ownership of the securities it has loaned and continues to receive interest and dividends paid by the issuer of securities and to participate in any changes in their market value. The Fund requires the borrowers of the securities to maintain collateral with the Fund consisting of either cash or liquid, unencumbered assets having a value at least equal to the value of the securities loaned. When the collateral falls below specified amounts, the lending agent will use its best effort to obtain additional collateral on the next business day to meet required amounts under the security lending agreement. The Fund may invest the cash collateral into a joint trading account in an affiliated money market fund pursuant to Exemptive Orders issued by the SEC. The Fund receives compensation for lending its securities either in the form of fees or by earning interest on invested cash collateral net of borrower rebates and fees paid to a lending agent. Either the Fund or the borrower may terminate the loan. There may be risks of delay and costs in recovery of securities or even loss of rights in the collateral should the borrower of the securities fail financially. The Fund is also subject to all investment risks associated with the reinvestment of any cash collateral received, including, but not limited to, interest rate, credit and liquidity risk associated with such investments.
Foreign Currency Translations. The books and records of the Fund are maintained in U.S. dollars. Investment securities and other assets and liabilities denominated in a foreign currency are translated into U.S. dollars at the prevailing exchange rates at period end. Purchases and sales of investment securities, income and expenses are translated into U.S. dollars at the prevailing exchange rates on the respective dates of the transactions.
Net realized and unrealized gains and losses on foreign currency transactions represent net gains and losses between trade and settlement dates on securities transactions, the acquisition and disposition of foreign currencies, and the difference between the amount of net investment income accrued and the U.S. dollar amount actually received. That portion of both realized and unrealized gains and losses on investments that results from fluctuations in foreign currency exchange rates is not separately disclosed but is included with net realized and unrealized gain/appreciation and loss/depreciation on investments.
Taxes. The Fund is treated as a separate taxpayer as provided for in the Internal Revenue Code, as amended. It is the Fund's policy to comply with the requirements of the Internal Revenue Code, as amended, which are applicable to regulated investment companies, and to distribute all of its taxable income to the separate accounts of the Participating Insurance Companies which hold its shares.
Additionally, based on the Series' understanding of the tax rules and rates related to income, gains and transactions for the foreign jurisdictions in which the Fund invests, the Fund will provide for foreign taxes, and where appropriate, deferred foreign taxes.
Under the Regulated Investment Company Modernization Act of 2010, net capital losses may be carried forward indefinitely, and their character is retained as short-term and/or long-term. Previously, net capital losses were carried forward for eight years and treated as short-term losses. As a transition rule, the Act requires that post-enactment net capital losses be used before pre-enactment net capital losses.
The Fund has reviewed the tax positions for the open tax years as of December 31, 2011 and has determined that no provision for income tax is required in the Fund's financial statements. The Fund's federal tax returns for the prior three fiscal years remain open subject to examination by the Internal Revenue Service.
Distribution of Income and Gains. The Fund will declare and distribute dividends from its net investment income, if any, annually, although additional distributions may be made if necessary. Net realized gains from investment transactions, in excess of available capital loss carryforwards, would be taxable to the Fund if not distributed, and, therefore, will be distributed to shareholders at least annually.
The timing and characterization of certain income and capital gain distributions are determined annually in accordance with federal tax regulations which may differ from accounting principles generally accepted in the United States of America. These differences primarily relate to investments in foreign denominated investments, passive foreign investment companies and certain securities sold at a loss. As a result, net investment income (loss) and net realized gain (loss) on investment transactions for a reporting period may differ significantly from distributions during such period. Accordingly, the Fund may periodically make reclassifications among certain of its capital accounts without impacting the net asset value of the Fund.
The tax character of current year distributions will be determined at the end of the current fiscal year.
Expenses. Expenses of the Series arising in connection with a specific Fund are allocated to that Fund. Other Series expenses which cannot be directly attributed to a Fund are apportioned among the Funds in the Series.
Contingencies. In the normal course of business, the Fund may enter into contracts with service providers that contain general indemnification clauses. The Fund's maximum exposure under these arrangements is unknown as this would involve future claims that may be made against the Fund that have not yet been made. However, based on experience, the Fund expects the risk of loss to be remote.
Other. Investment transactions are accounted for on a trade date plus one basis for daily net asset value calculations. However, for financial reporting purposes, investment transactions are reported on trade date. Interest income is recorded on the accrual basis net of foreign withholding taxes. Dividend income is recorded on the ex-dividend date net of foreign withholding taxes. Certain dividends from foreign securities may be recorded subsequent to the ex-dividend date as soon as the Fund is informed of such dividends. Realized gains and losses from investment transactions are recorded on an identified cost basis and may include proceeds from litigation.
B. Purchases and Sales of Securities
During the six months ended June 30, 2012, purchases and sales of investment securities (excluding short-term investments) aggregated $22,055,863 and $34,145,599, respectively.
C. Related Parties
Management Agreement. Under the Investment Management Agreement with Deutsche Investment Management Americas Inc. ("DIMA" or the "Advisor"), an indirect, wholly owned subsidiary of Deutsche Bank AG, the Advisor directs the investments of the Fund in accordance with its investment objectives, policies and restrictions. The Advisor determines the securities, instruments and other contracts relating to investments to be purchased, sold or entered into by the Fund.
Pursuant to the Investment Management Agreement with the Advisor, the Fund pays a monthly management fee based on the Fund's average daily net assets, computed and accrued daily and payable monthly, at the following annual rates:
| First $500 million of average daily net assets | | | .890 | % |
| Next $500 million of average daily net assets | | | .875 | % |
| Next $1 billion of average daily net assets | | | .860 | % |
| Over $2 billion of average daily net assets | | | .845 | % |
For the period from January 1, 2012 through September 30, 2012 the Advisor has contractually agreed to waive all or a portion of its fees and/or reimburse certain operating expenses of the Fund to the extent necessary to maintain the operating expenses (excluding certain expenses such as extraordinary expenses, taxes, brokerage and interest) of each class as follows:
Accordingly, for the six months ended June 30, 2012, the Advisor waived a portion of its management fee pursuant to the Investment Management Agreement aggregating $92,916, and the amount charged aggregated $474,144, which was equivalent to an annualized effective rate of 0.74% of the Fund's average daily net assets.
Administration Fee. Pursuant to an Administrative Services Agreement, DIMA provides most administrative services to the Fund. For all services provided under the Administrative Services Agreement, the Fund pays the Advisor an annual fee ("Administration Fee") of 0.10% of the Fund's average daily net assets, computed and accrued daily and payable monthly. For the six months ended June 30, 2012, the Administration Fee was $63,922, of which $9,541 is unpaid.
Service Provider Fees. DWS Investments Service Company ("DISC"), an affiliate of the Advisor, is the transfer agent, dividend-paying agent and shareholder service agent for the Fund. Pursuant to a sub-transfer agency agreement between DISC and DST Systems, Inc. ("DST"), DISC has delegated certain transfer agent, dividend-paying agent and shareholder service agent functions to DST. DISC compensates DST out of the shareholder servicing fee it receives from the Fund. For the six months ended June 30, 2012, the amounts charged to the Fund by DISC were as follows:
| Services to Shareholders | | Total Aggregated | | | Waived | |
| Class A | | $ | 222 | | | $ | 222 | |
| Class B | | | 54 | | | | 54 | |
| | | $ | 276 | | | $ | 276 | |
Distribution Service Agreement. DWS Investments Distributors, Inc. ("DIDI"), also an affiliate of the Advisor, is the Series' Distributor. In accordance with the Master Distribution Plan, DIDI receives 12b-1 fees of 0.25% of average daily net assets of Class B shares. Pursuant to the Master Distribution Plan, DIDI remits these fees to the Participating Insurance Companies for various costs incurred or paid by these companies in connection with marketing and distribution of Class B shares. For the six months ended June 30, 2012, the Distribution Service Fee aggregated $2,425, of which $364 is unpaid.
Typesetting and Filing Service Fees. Under an agreement with DIMA, DIMA is compensated for providing typesetting and certain regulatory filing services to the Fund. For the six months ended June 30, 2012, the amount charged to the Fund by DIMA included in the Statement of Operations under "reports to shareholders" aggregated $13,132, of which $4,192 is unpaid.
Trustees' Fees and Expenses. The Fund paid retainer fees to each Trustee not affiliated with the Advisor, plus specified amounts to the Board Chairperson and to each committee Chairperson.
Affiliated Cash Management Vehicle. The Fund may invest uninvested cash balances in Central Cash Management Fund, which is managed by the Advisor. The Fund indirectly bears its proportionate share of the expenses of Central Cash Management Fund. Central Cash Management Fund does not pay the Advisor an investment management fee. Central Cash Management Fund seeks a high level of current income consistent with liquidity and the preservation of capital.
Securities Lending Agent Fees. Deutsche Bank AG serves as securities lending agent for the Fund. For the six months ended June 30, 2012, the Fund incurred securities lending agent fees to Deutsche Bank AG in the amount of $2,945.
D. Investing in Emerging Markets
Investing in emerging markets may involve special risks and considerations not typically associated with investing in developed markets. These risks include revaluation of currencies, high rates of inflation or deflation, repatriation restrictions on income and capital, and future adverse political, social and economic developments. Moreover, securities issued in these markets may be less liquid, subject to government ownership controls or delayed settlements and may have prices more volatile or less easily assessed than those of comparable securities of issuers in developed markets.
E. Ownership of the Fund
Three participating insurance companies were owners of record of 10% or more of the total outstanding Class A shares of the Fund, each owning 49%, 17% and 10%.
F. Line of Credit
The Fund and other affiliated funds (the "Participants") share in a $375 million revolving credit facility provided by a syndication of banks. The Fund may borrow for temporary or emergency purposes, including the meeting of redemption requests that otherwise might require the untimely disposition of securities. The Participants are charged an annual commitment fee which is allocated based on net assets, among each of the Participants. Interest is calculated at a rate per annum equal to the sum of the Federal Funds Rate plus 1.25 percent plus if LIBOR exceeds the Federal Funds Rate the amount of such excess. The Fund may borrow up to a maximum of 33 percent of its net assets under the agreement. The Fund had no outstanding loans at June 30, 2012.
Information About Your Fund's Expenses (Unaudited)
As an investor of the Fund, you incur two types of costs: ongoing expenses and transaction costs. Ongoing expenses include management fees, distribution and service (12b-1) fees and other Fund expenses. Examples of transaction costs include contract charges, redemption fees and account maintenance fees, which are not shown in this section. The following tables are intended to help you understand your ongoing expenses (in dollars) of investing in the Fund and to help you compare these expenses with the ongoing expenses of investing in other mutual funds. In the most recent six-month period, the Fund limited these expenses; had it not done so, expenses would have been higher. The example in the table is based on an investment of $1,000 invested at the beginning of the six-month period and held for the entire period (January 1, 2012 to June 30, 2012).
The tables illustrate your Fund's expenses in two ways:
•Actual Fund Return. This helps you estimate the actual dollar amount of ongoing expenses (but not transaction costs) paid on a $1,000 investment in the Fund using the Fund's actual return during the period. To estimate the expenses you paid over the period, simply divide your account value by $1,000 (for example, an $8,600 account value divided by $1,000 = 8.6), then multiply the result by the number in the "Expenses Paid per $1,000" line under the share class you hold.
• Hypothetical 5% Fund Return. This helps you to compare your Fund's ongoing expenses (but not transaction costs) with those of other mutual funds using the Fund's actual expense ratio and a hypothetical rate of return of 5% per year before expenses. Examples using a 5% hypothetical Fund return may be found in the shareholder reports of other mutual funds. The hypothetical account values and expenses may not be used to estimate the actual ending account balance or expenses you paid for the period.
Please note that the expenses shown in these tables are meant to highlight your ongoing expenses only and do not reflect any transaction costs. The "Expenses Paid per $1,000" line of the tables is useful in comparing ongoing expenses only and will not help you determine the relative total expense of owning different funds. If these transaction costs had been included, your costs would have been higher.
Expenses and Value of a $1,000 Investment for the six months ended June 30, 2012 | |
| Actual Fund Return | | Class A | | | Class B | |
| Beginning Account Value 1/1/12 | | $ | 1,000.00 | | | $ | 1,000.00 | |
| Ending Account Value 6/30/12 | | $ | 1,029.80 | | | $ | 1,028.40 | |
| Expenses Paid per $1,000* | | $ | 5.00 | | | $ | 6.25 | |
| Hypothetical 5% Fund Return | | Class A | | | Class B | |
| Beginning Account Value 1/1/12 | | $ | 1,000.00 | | | $ | 1,000.00 | |
| Ending Account Value 6/30/12 | | $ | 1,019.94 | | | $ | 1,018.70 | |
| Expenses Paid per $1,000* | | $ | 4.97 | | | $ | 6.22 | |
* Expenses are equal to the Fund's annualized expense ratio for each share class, multiplied by the average account value over the period, multiplied by 182 (the number of days in the most recent six-month period), then divided by 366.
| Annualized Expense Ratios | Class A | | Class B | |
| DWS Variable Series I — DWS Global Small Cap Growth VIP | .99% | | 1.24% | |
For more information, please refer to the Fund's prospectus.
These tables do not reflect charges and fees ("contract charges") associated with the separate account that invests in the Fund or any variable life insurance policy or variable annuity contract for which the Fund is an investment option.
The Series' policies and procedures for voting proxies for portfolio securities and information about how the Series voted proxies related to its portfolio securities during the 12-month period ended June 30 are available on our Web site — www.dws-investments.com (click on "proxy voting"at the bottom of the page) — or on the SEC's Web site — www.sec.gov. To obtain a written copy of the Series' policies and procedures without charge, upon request, call us toll free at (800) 728-3337.
Summary of Management Fee Evaluation by Independent Fee Consultant
September 26, 2011
Pursuant to an Order entered into by Deutsche Investment Management Americas and affiliates (collectively, "DeAM") with the Attorney General of New York, I, Thomas H. Mack, have been appointed the Independent Fee Consultant for the DWS Funds (formerly the DWS Scudder Funds). My duties include preparing an annual written evaluation of the management fees DeAM charges the Funds, considering among other factors the management fees charged by other mutual fund companies for like services, management fees DeAM charges other clients for like services, DeAM's costs of supplying services under the management agreements and related profit margins, possible economies of scale if a Fund grows larger, and the nature and quality of DeAM's services, including fund performance. This report summarizes my evaluation for 2011, including my qualifications, the evaluation process for each of the DWS Funds, consideration of certain complex-level factors, and my conclusions. I served in substantially the same capacity in 2007, 2008, 2009 and 2010.
Qualifications
For more than 35 years I have served in various professional capacities within the investment management business. I have held investment analysis and advisory positions, including securities analyst, portfolio strategist and director of investment policy with a large investment firm. I have also performed business management functions, including business development, financial management and marketing research and analysis.
Since 1991, I have been an independent consultant within the asset management industry. I have provided services to over 125 client organizations, including investment managers, mutual fund boards, product distributors and related organizations. Over the past ten years I have completed a number of assignments for mutual fund boards, specifically including assisting boards with management contract renewal.
I hold a Master of Business Administration degree, with highest honors, from Harvard University and Master of Science and Bachelor of Science (highest honors) degrees from the University of California at Berkeley. I am an independent director and audit committee financial expert for two closed-end mutual funds and have served in various leadership and financial oversight capacities with non-profit organizations.
Evaluation of Fees for each DWS Fund
My work focused primarily on evaluating, fund-by-fund, the fees charged to each of the 109 mutual fund portfolios in the DWS Fund family. For each Fund, I considered each of the key factors mentioned above, as well as any other relevant information. In doing so I worked closely with the Funds' Independent Directors in their annual contract renewal process, as well as in their approval of contracts for several new funds (documented separately).
In evaluating each Fund's fees, I reviewed comprehensive materials provided by or on behalf of DeAM, including expense information prepared by Lipper Analytical, comparative performance information, profitability data, manager histories, and other materials. I also accessed certain additional information from the Lipper and Morningstar databases and drew on my industry knowledge and experience.
To facilitate evaluating this considerable body of information, I prepared for each Fund a document summarizing the key data elements in each area as well as additional analytics discussed below. This made it possible to consider each key data element in the context of the others.
In the course of contract renewal, DeAM agreed to implement a number of fee and expense adjustments requested by the Independent Directors which will favorably impact future fees and expenses, and my evaluation includes the effects of these changes.
Fees and Expenses Compared with Other Funds
The competitive fee and expense evaluation for each fund focused on two primary comparisons:
The Fund's contractual management fee (the advisory fee plus the administration fee where applicable) compared with those of a group of typically 12-15 funds in the same Lipper investment category (e.g. Large Capitalization Growth) having similar distribution arrangements and being of similar size.
The Fund's total expenses compared with a broader universe of funds from the same Lipper investment category and having similar distribution arrangements.
These two comparisons provide a view of not only the level of the fee compared with funds of similar scale but also the total expense the Fund bears for all the services it receives, in comparison with the investment choices available in the Fund's investment category and distribution channel. The principal figure-of-merit used in these comparisons was the subject Fund's percentile ranking against peers.
DeAM's Fees for Similar Services to Others
DeAM provided management fee schedules for all of its US domiciled fund and non-fund investment management accounts in any of the investment categories where there is a DWS Fund. These similar products included the other DWS Funds, non-fund pooled accounts, institutional accounts and sub-advisory accounts. Using this information, I calculated for each Fund the fee that would be charged to each similar product, at the subject Fund's asset level.
Evaluating information regarding non-fund products is difficult because there are varying levels of services required for different types of accounts, with mutual funds generally requiring considerably more regulatory and administrative types of service as well as having more frequent cash flows than other types of accounts. Also, while mutual fund fees for similar fund products can be expected to be similar, there will be some differences due to different pricing conditions in different distribution channels (e.g. retail funds versus those used in variable insurance products), differences in underlying investment processes and other factors.
Costs and Profit Margins
DeAM provided a detailed profitability analysis for each Fund. After making some adjustments so that the presentation would be more comparable to the available industry figures, I reviewed profit margins from investment management alone, from investment management plus other fund services (excluding distribution) provided to the Funds by DeAM (principally shareholder services), and DeAM profits from all sources, including distribution. A later section comments on overall profitability.
Economies of Scale
Economies of scale — an expected decline in management cost per dollar of fund assets as fund assets grow — are very rarely quantified and documented because of inherent difficulties in collecting and analyzing relevant data. However, in virtually every investment category that I reviewed, larger funds tend to have lower fees and lower total expenses than smaller funds. To see how each DWS Fund compares with this industry observation, I reviewed:
The trend in Fund assets over the last five years and the accompanying trend in total expenses. This shows if the Fund has grown and, if so, whether total expense (management fees as well as other expenses) have declined as a percent of assets.
Whether the Fund has break-points in its management fee schedule, the extent of the fee reduction built into the schedule and the asset levels where the breaks take effect, and in the case of a sub-advised Fund how the Fund's break-points compare with those of the sub-advisory fee schedule.
How the Fund's contractual fee schedule compares with trends in the industry data. To accomplish this, I constructed a chart showing how actual latest-fiscal-year contractual fees of the Fund and of other similar funds relate to average fund assets, with the subject Fund's contractual fee schedule superimposed.
Quality of Service — Performance
The quality-of-service evaluation focused on investment performance, which is the principal result of the investment management service. Each Fund's performance was reviewed over the past 1, 3, 5 and 10 years, as applicable, and compared with that of other funds in the same investment category and with a suitable market index.
In addition, I calculated and reviewed risk-adjusted returns relative to an index of similar mutual funds' returns and a suitable market index. The risk-adjusted returns analysis provides a way of determining the extent to which the Fund's return comparisons are mainly the product of investment value-added (or lack thereof) or alternatively taking considerably more or less risk than is typical in its investment category.
I also received and considered the history of portfolio manager changes for each Fund, as this provided an important context for evaluating the performance results.
Complex-Level Considerations
While this evaluation was conducted mainly at the individual fund level, there are some issues relating to the reasonableness of fees that can alternatively be considered across the whole fund complex:
I reviewed DeAM's profitability analysis for all DWS Funds, with a view toward determining if the allocation procedures used were reasonable and how profit levels compared with public data for other investment managers.
I considered whether DeAM and affiliates receive any significant ancillary or "fall-out" benefits that should be considered in interpreting the direct profitability results. These would be situations where serving as the investment manager of the Funds is beneficial to another part of the Deutsche Bank organization.
I considered how aggregated DWS Fund expenses had varied over the years, by asset class and in the context of trends in asset levels.
I reviewed the structure of the DeAM organization, trends in staffing levels, and information on compensation of investment management and other professionals compared with industry data.
Findings
Based on the process and analysis discussed above, which included reviewing a wide range of information from management and external data sources and considering among other factors the fees DeAM charges other clients, the fees charged by other fund managers, DeAM's costs and profits associated with managing the Funds, economies of scale, possible fall-out benefits, and the nature and quality of services provided, in my opinion the management fees charged the DWS Funds are reasonable.
Thomas H. Mack
President, Thomas H. Mack & Co., Inc.
Notes
DWS Investments Distributors, Inc.
222 South Riverside Plaza
Chicago, IL 60606
(800) 621-1148
VS1gloscg-3 (R-028377-1 8/12)
JUNE 30, 2012
SEMIANNUAL REPORT
DWS VARIABLE SERIES I
DWS International VIP
Contents
4 Portfolio Management Team 7 Statement of Assets and Liabilities 8 Statement of Operations 9 Statement of Changes in Net Assets 13 Notes to Financial Statements 18 Information About Your Fund's Expenses 20 Summary of Management Fee Evaluation by Independent Fee Consultant |
This report must be preceded or accompanied by a prospectus. To obtain an additional prospectus or summary prospectus, if available, call (800) 728-3337 or your financial representative. We advise you to consider the Fund's objectives, risks, charges and expenses carefully before investing. The summary prospectus and prospectus contain this and other important information about the Fund. Please read the prospectus carefully before you invest.
Investing in derivatives entails special risks relating to liquidity, leverage and credit that may reduce returns and/or increase volatility. Investing in foreign securities, particularly those of emerging markets, presents certain risks, such as currency fluctuations, political and economic changes, and market risks. The Fund may lend securities to approved institutions. Stocks may decline in value. See the prospectus for details.
DWS Investments is part of Deutsche Bank's Asset Management division and, within the U.S., represents the retail asset management activities of Deutsche Bank AG, Deutsche Bank Trust Company Americas, Deutsche Investment Management Americas Inc. and DWS Trust Company.
NOT FDIC/NCUA INSURED NO BANK GUARANTEE MAY LOSE VALUE NOT A DEPOSIT
NOT INSURED BY ANY FEDERAL GOVERNMENT AGENCY
Performance Summary June 30, 2012 (Unaudited)
Fund performance shown is historical, assumes reinvestment of all dividend and capital gain distributions, and does not guarantee future results. Investment return and principal value fluctuate with changing market conditions so that, when redeemed, shares may be worth more or less than their original cost. Current performance may be lower or higher than the performance data quoted. Please contact your participating insurance company for the Fund's most recent month-end performance. Performance doesn't reflect charges and fees ("contract charges") associated with the separate account that invests in the Fund or any variable life insurance policy or variable annuity contract for which the Fund is an investment option. These charges and fees will reduce returns. While all share classes have the same underlying portfolio, their performance will differ.
The gross expense ratios of the Fund, as stated in the fee table of the prospectus dated May 1, 2012 are 1.00% and 1.28% for Class A and Class B shares, respectively, and may differ from the expense ratios disclosed in the Financial Highlights tables in this report.
| Growth of an Assumed $10,000 Investment |
| The Morgan Stanley Capital International (MSCI) Europe, Australasia and Far East (EAFE®) Index is an unmanaged index that tracks international stock performance in the 21 developed markets in Europe, Australasia and the Far East. The index is calculated using closing local market prices and translates into U.S. dollars using the London close foreign exchange rates. Index returns do not reflect any fees or expenses and it is not possible to invest directly into an index. |
| |
| Yearly periods ended June 30 | |
| Comparative Results | |
| DWS International VIP | | 6-Month‡ | | | 1-Year | | | 3-Year | | | 5-Year | | | 10-Year | |
| Class A | Growth of $10,000 | | $ | 10,534 | | | $ | 8,575 | | | $ | 11,080 | | | $ | 6,416 | | | $ | 13,099 | |
| Average annual total return | | | 5.34 | % | | | -14.25 | % | | | 3.48 | % | | | -8.49 | % | | | 2.74 | % |
MSCI EAFE® Index | Growth of $10,000 | | $ | 10,296 | | | $ | 8,617 | | | $ | 11,898 | | | $ | 7,301 | | | $ | 16,513 | |
| Average annual total return | | | 2.96 | % | | | -13.83 | % | | | 5.96 | % | | | -6.10 | % | | | 5.14 | % |
| DWS International VIP | | 6-Month‡ | | | 1-Year | | | 3-Year | | | 5-Year | | | 10-Year | |
| Class B | Growth of $10,000 | | $ | 10,504 | | | $ | 8,552 | | | $ | 10,986 | | | $ | 6,324 | | | $ | 12,724 | |
| Average annual total return | | | 5.04 | % | | | -14.48 | % | | | 3.19 | % | | | -8.76 | % | | | 2.44 | % |
MSCI EAFE® Index | Growth of $10,000 | | $ | 10,296 | | | $ | 8,617 | | | $ | 11,898 | | | $ | 7,301 | | | $ | 16,513 | |
| Average annual total return | | | 2.96 | % | | | -13.83 | % | | | 5.96 | % | | | -6.10 | % | | | 5.14 | % |
The growth of $10,000 is cumulative.
‡ Total returns shown for periods less than one year are not annualized.
Portfolio Summary (Unaudited) Asset Allocation (As a % of Investment Portfolio excluding Securities Lending Collateral) | 6/30/12 | 12/31/11 |
| | | |
| Common Stocks | 97% | 97% |
| Cash Equivalents | 3% | 2% |
| Preferred Stocks | 0% | 1% |
| | 100% | 100% |
Geographical Diversification
(As a % of Investment Portfolio excluding Cash Equivalents and Securities Lending Collateral) | 6/30/12 | 12/31/11 |
| | | |
| Continental Europe | 50% | 45% |
| Japan | 22% | 21% |
| United Kingdom | 11% | 15% |
| Australia | 9% | 9% |
| Asia (excluding Japan) | 7% | 9% |
| Other | 1% | 1% |
| | 100% | 100% |
Sector Diversification (As a % of Investment Portfolio excluding Cash Equivalents and Securities Lending Collateral) | 6/30/12 | 12/31/11 |
| | | |
| Financials | 27% | 27% |
| Industrials | 18% | 11% |
| Utilities | 12% | 6% |
| Information Technology | 10% | 11% |
| Consumer Discretionary | 10% | 8% |
| Telecommunication Services | 10% | 7% |
| Energy | 5% | 6% |
| Materials | 5% | 4% |
| Health Care | 2% | 12% |
| Consumer Staples | 1% | 8% |
| | 100% | 100% |
Portfolio holdings and characteristics are subject to change.
For more complete details about the Fund's investment portfolio, see page 5.
Following the Fund's fiscal first and third quarter-end, a complete portfolio holdings listing is filed with the SEC on Form N-Q. The form will be available on the SEC's Web site at www.sec.gov, and it also may be reviewed and copied at the SEC's Public Reference Room in Washington, D.C. Information on the operation of the SEC's Public Reference Room may be obtained by calling (800) SEC-0330. The Fund's portfolio holdings are also posted on www.dws-investments.com from time to time. Please see the Fund's current prospectus for more information.
Portfolio Management Team
Thomas Voecking
Jason E. Inzer
Portfolio Managers
Investment Portfolio June 30, 2012 (Unaudited) | | | Shares | | | Value ($) | |
| | | | |
| Common Stocks 94.8% | |
| Australia 8.8% | |
| Australia & New Zealand Banking Group Ltd. | | | 50,000 | | | | 1,135,054 | |
| BHP Billiton Ltd. | | | 138,500 | | | | 4,514,621 | |
| Lend Lease Group | | | 73,000 | | | | 541,866 | |
| National Australia Bank Ltd. | | | 311,207 | | | | 7,557,785 | |
| Newcrest Mining Ltd. | | | 117,392 | | | | 2,732,450 | |
| Wesfarmers Ltd. | | | 38,691 | | | | 1,191,132 | |
| Westpac Banking Corp. | | | 47,000 | | | | 1,022,463 | |
| (Cost $21,347,792) | | | | 18,695,371 | |
| Finland 4.1% | |
| Fortum Oyj | | | 435,000 | | | | 8,265,161 | |
| Nokia Oyj (a) | | | 151,000 | | | | 311,066 | |
| (Cost $10,443,693) | | | | 8,576,227 | |
| France 8.6% | |
| Aeroports de Paris | | | 20,400 | | | | 1,541,491 | |
| Dassault Systemes SA (a) | | | 137,100 | | | | 12,879,443 | |
| Klepierre (REIT) | | | 34,000 | | | | 1,120,381 | |
| Publicis Groupe (a) | | | 26,000 | | | | 1,189,020 | |
| Unibail-Rodamco SE (REIT) | | | 7,700 | | | | 1,420,619 | |
| (Cost $16,593,782) | | | | 18,150,954 | |
| Germany 11.2% | |
| Adidas AG | | | 111,500 | | | | 7,997,093 | |
| BASF SE | | | 10,400 | | | | 722,682 | |
| Deutsche Post AG (Registered) | | | 505,000 | | | | 8,944,111 | |
| Hannover Rueckversicherung AG (Registered) | | | 36,800 | | | | 2,185,108 | |
| Lanxess AG | | | 7,400 | | | | 466,783 | |
| SAP AG | | | 46,550 | | | | 2,748,941 | |
| Siemens AG (Registered) | | | 7,100 | | | | 596,810 | |
| (Cost $23,688,774) | | | | 23,661,528 | |
| Hong Kong 5.5% | |
| BOC Hong Kong (Holdings) Ltd. | | | 3,426,000 | | | | 10,543,717 | |
| Noble Group Ltd. | | | 1,270,000 | | | | 1,133,897 | |
| (Cost $10,881,025) | | | | 11,677,614 | |
| Israel 0.9% | |
| Bezeq Israeli Telecommunication Corp., Ltd. (Cost $3,519,135) | | | 1,789,000 | | | | 1,893,010 | |
| Italy 4.1% | |
| Snam SpA | | | 1,722,000 | | | | 7,676,683 | |
| UniCredit SpA* | | | 261,000 | | | | 988,997 | |
| (Cost $10,252,410) | | | | 8,665,680 | |
| Japan 21.2% | |
| Bridgestone Corp. (a) | | | 65,700 | | | | 1,507,010 | |
| Canon, Inc. (a) | | | 115,000 | | | | 4,604,918 | |
| Central Japan Railway Co. | | | 210 | | | | 1,659,633 | |
| Fast Retailing Co., Ltd. | | | 28,300 | | | | 5,681,150 | |
| Honda Motor Co., Ltd. | | | 95,992 | | | | 3,343,846 | |
| JGC Corp. | | | 118,000 | | | | 3,415,306 | |
| Kyushu Electric Power Co., Inc. | | | 76,000 | | | | 901,588 | |
| Marubeni Corp. | | | 69,000 | | | | 459,246 | |
| Mitsubishi Corp. | | | 24,409 | | | | 492,906 | |
| Mitsubishi Electric Corp. | | | 119,000 | | | | 991,811 | |
| | | Shares | | | Value ($) | |
| | | | | | | | | |
| Mitsubishi Estate Co., Ltd. | | | 196,000 | | | | 3,516,068 | |
| Mitsubishi Heavy Industries Ltd. | | | 106,000 | | | | 430,415 | |
| Mitsui & Co., Ltd. | | | 446,000 | | | | 6,617,186 | |
| Mizuho Financial Group, Inc. | | | 408,000 | | | | 690,676 | |
| Nabtesco Corp. | | | 117,900 | | | | 2,621,367 | |
| Nidec Corp. (a) | | | 33,500 | | | | 2,540,457 | |
| Nintendo Co., Ltd. | | | 2,600 | | | | 303,379 | |
| Nomura Holdings, Inc. | | | 110,000 | | | | 410,800 | |
| Resona Holdings, Inc. | | | 442,000 | | | | 1,824,303 | |
| Sony Corp. | | | 52,000 | | | | 739,992 | |
| Sumitomo Mitsui Financial Group, Inc. | | | 55,800 | | | | 1,840,779 | |
| Sumitomo Realty & Development Co., Ltd. | | | 9,000 | | | | 221,443 | |
| (Cost $46,830,417) | | | | 44,814,279 | |
| Netherlands 7.1% | |
| Corio NV (REIT) | | | 46,710 | | | | 2,057,400 | |
| ING Groep NV (CVA)* | | | 607,857 | | | | 4,101,106 | |
| Royal Dutch Shell PLC "B" | | | 251,600 | | | | 8,780,893 | |
| (Cost $15,640,055) | | | | 14,939,399 | |
| Norway 1.4% | |
| DnB ASA (Cost $3,994,337) | | | 298,000 | | | | 2,964,579 | |
| Portugal 0.5% | |
| Banco Comercial Portugues SA "R"* (a) (Cost $1,861,973) | | | 7,980,000 | | | | 993,387 | |
| Singapore 0.7% | |
| Capitaland Ltd. | | | 565,000 | | | | 1,219,676 | |
| Wilmar International Ltd. | | | 100,000 | | | | 287,484 | |
| (Cost $1,542,567) | | | | 1,507,160 | |
| Sweden 6.8% | |
| TeliaSonera AB (Cost $15,788,001) | | | 2,240,000 | | | | 14,330,144 | |
| Switzerland 3.3% | |
| Nestle SA (Registered) | | | 19,000 | | | | 1,133,377 | |
| Schindler Holding AG | | | 3,000 | | | | 335,490 | |
| Swiss Life Holding AG (Registered)* | | | 16,800 | | | | 1,585,326 | |
| Zurich Insurance Group AG* | | | 17,900 | | | | 4,038,592 | |
| (Cost $7,767,549) | | | | 7,092,785 | |
| United Kingdom 10.6% | |
| BHP Billiton PLC | | | 11,300 | | | | 322,688 | |
| BP PLC | | | 110,000 | | | | 737,018 | |
| Cairn Energy PLC* | | | 161,000 | | | | 668,806 | |
| Capita PLC | | | 380,000 | | | | 3,907,428 | |
| Centrica PLC | | | 1,593,000 | | | | 7,941,394 | |
| GlaxoSmithKline PLC | | | 201,600 | | | | 4,571,451 | |
| Inmarsat PLC | | | 390,000 | | | | 2,999,987 | |
| Old Mutual PLC | | | 508,285 | | | | 1,209,691 | |
| (Cost $22,539,729) | | | | 22,358,463 | |
Total Common Stocks (Cost $212,691,239) | | | | 200,320,580 | |
| | |
| Preferred Stocks 0.2% | |
| Germany | |
| Volkswagen AG (Cost $370,777) | | | 2,300 | | | | 364,659 | |
| | | Shares | | | Value ($) | |
| | | | | | | | | |
| Securities Lending Collateral 11.1% | |
Daily Assets Fund Institutional, 0.24% (b) (c) (Cost $23,586,636) | | | 23,586,636 | | | | 23,586,636 | |
| | |
| Cash Equivalents 2.6% | |
| Central Cash Management Fund, 0.14% (b) (Cost $5,416,911) | | | 5,416,911 | | | | 5,416,911 | |
| | | % of Net Assets | | | Value ($) | |
| | | | |
Total Investment Portfolio (Cost $242,065,563)+ | | | 108.7 | | | | 229,688,786 | |
| Other Assets and Liabilities, Net | | | (8.7 | ) | | | (18,311,979 | ) |
| Net Assets | | | 100.0 | | | | 211,376,807 | |
* Non-income producing security.
+ The cost for federal income tax purposes was $243,214,000. At June 30, 2012, net unrealized depreciation for all securities based on tax cost was $13,525,214. This consisted of aggregate gross unrealized appreciation for all securities in which there was an excess of value over tax cost of $5,299,201 and aggregate gross unrealized depreciation for all securities in which there was an excess of tax cost over value of $18,824,415.
(a) All or a portion of these securities were on loan (see Notes to Financial Statements). The value of all securities loaned at June 30, 2012 amounted to $22,993,750, which is 10.9% of net assets.
(b) Affiliated fund managed by Deutsche Investment Management Americas Inc. The rate shown is the annualized seven-day yield at period end.
(c) Represents collateral held in connection with securities lending. Income earned by the Fund is net of borrower rebates.
CVA: Certificaten Van Aandelen
REIT: Real Estate Investment Trust
At June 30, 2012, open futures contracts purchased were as follows:
| Futures | Currency | Expiration Date | | Contracts | | | Notional Value ($) | | | Unrealized Appreciation ($) | |
| S&P 500 E-Mini Index | USD | 9/21/2012 | | | 160 | | | | 10,851,200 | | | | 449,200 | |
| Currency Abbreviation |
| USD United States Dollar |
For information on the Fund's policy and additional disclosures regarding futures contracts, please refer to the Derivatives section of Note B in the accompanying Notes to Financial Statements.
Fair Value Measurements
Various inputs are used in determining the value of the Fund's investments. These inputs are summarized in three broad levels. Level 1 includes quoted prices in active markets for identical securities. Level 2 includes other significant observable inputs (including quoted prices for similar securities, interest rates, prepayment speeds, and credit risk). Level 3 includes significant unobservable inputs (including the Fund's own assumptions in determining the fair value of investments). The inputs or methodology used for valuing securities are not necessarily an indication of the risk associated with investing in those securities.
The following is a summary of the inputs used as of June 30, 2012 in valuing the Fund's investments. For information on the Fund's policy regarding the valuation of investments, please refer to the Security Valuation section of Note A in the accompanying Notes to Financial Statements.
| Assets | | Level 1 | | | Level 2 | | | Level 3 | | | Total | |
| | |
Common and Preferred Stocks (d) | |
| Australia | | $ | — | | | $ | 18,695,371 | | | $ | — | | | $ | 18,695,371 | |
| Finland | | | — | | | | 8,576,227 | | | | — | | | | 8,576,227 | |
| France | | | — | | | | 18,150,954 | | | | — | | | | 18,150,954 | |
| Germany | | | — | | | | 24,026,187 | | | | — | | | | 24,026,187 | |
| Hong Kong | | | — | | | | 11,677,614 | | | | — | | | | 11,677,614 | |
| Israel | | | — | | | | 1,893,010 | | | | — | | | | 1,893,010 | |
| Italy | | | — | | | | 8,665,680 | | | | — | | | | 8,665,680 | |
| Japan | | | — | | | | 44,814,279 | | | | — | | | | 44,814,279 | |
| Netherlands | | | — | | | | 14,939,399 | | | | — | | | | 14,939,399 | |
| Norway | | | — | | | | 2,964,579 | | | | — | | | | 2,964,579 | |
| Portugal | | | — | | | | 993,387 | | | | — | | | | 993,387 | |
| Singapore | | | — | | | | 1,507,160 | | | | — | | | | 1,507,160 | |
| Sweden | | | — | | | | 14,330,144 | | | | — | | | | 14,330,144 | |
| Switzerland | | | — | | | | 7,092,785 | | | | — | | | | 7,092,785 | |
| United Kingdom | | | — | | | | 22,358,463 | | | | — | | | | 22,358,463 | |
| Short-Term Investments (d) | | | 29,003,547 | | | | — | | | | — | | | | 29,003,547 | |
| Derivatives (e) | | | 449,200 | | | | — | | | | — | | | | 449,200 | |
| Total | | $ | 29,452,747 | | | $ | 200,685,239 | | | $ | — | | | $ | 230,137,986 | |
There have been no transfers between Level 1 and Level 2 fair value measurements during the period ended June 30, 2012.
(d) See Investment Portfolio for additional detailed categorizations.
(e) Derivatives include unrealized appreciation (depreciation) on futures contracts.
The accompanying notes are an integral part of the financial statements.
Statement of Assets and Liabilities | as of June 30, 2012 (Unaudited) | |
| Assets | |
Investments: Investments in non-affiliated securities, at value (cost $213,062,016) — including $22,993,750 of securities loaned | | $ | 200,685,239 | |
| Investment in Daily Assets Fund Institutional (cost $23,586,636)* | | | 23,586,636 | |
| Investment in Central Cash Management Fund (cost $5,416,911) | | | 5,416,911 | |
| Total investments, at value (cost $242,065,563) | | | 229,688,786 | |
| Foreign currency, at value (cost $3,936,847) | | | 3,826,372 | |
| Deposit with broker for futures contracts | | | 560,000 | |
| Receivable for Fund shares sold | | | 43,942 | |
| Interest receivable | | | 28,264 | |
| Dividends receivable | | | 652,648 | |
| Receivable for variation margin on futures contracts | | | 272,000 | |
| Foreign taxes recoverable | | | 197,588 | |
| Other assets | | | 126 | |
| Total assets | | | 235,269,726 | |
| Liabilities | |
| Payable for Fund shares redeemed | | | 31,843 | |
| Payable upon return of securities loaned | | | 23,586,636 | |
| Accrued Trustees' fees | | | 1,742 | |
| Accrued management fee | | | 132,014 | |
| Other accrued expenses and payables | | | 140,684 | |
| Total liabilities | | | 23,892,919 | |
| Net assets, at value | | $ | 211,376,807 | |
| Net Assets Consist of | |
| Undistributed net investment income | | | 5,139,958 | |
Net unrealized appreciation (depreciation) on: Investments | | | (12,376,777 | ) |
| Futures | | | 449,200 | |
| Foreign currency | | | (119,347 | ) |
| Accumulated net realized gain (loss) | | | (143,685,859 | ) |
| Paid-in capital | | | 361,969,632 | |
| Net assets, at value | | $ | 211,376,807 | |
Class A Net Asset Value, offering and redemption price per share ($211,122,694 ÷ 30,377,037 outstanding shares of beneficial interest, $.01 par value, unlimited number of shares authorized) | | $ | 6.95 | |
Class B Net Asset Value, offering and redemption price per share ($254,113 ÷ 36,487 outstanding shares of beneficial interest, $.01 par value, unlimited number of shares authorized) | | $ | 6.96 | |
* Represents collateral on securities loaned.
The accompanying notes are an integral part of the financial statements.
Statement of Operations
| for the six months ended June 30, 2012 (Unaudited) | |
| Investment Income | |
Income: Dividends (net of foreign taxes withheld of $477,176) | | $ | 6,059,403 | |
| Interest | | | 568 | |
| Income distributions — Central Cash Management Fund | | | 2,867 | |
| Securities lending income, including income from Daily Assets Fund Institutional, net of borrower rebates | | | 305,051 | |
| Total income | | | 6,367,889 | |
Expenses: Management fee | | | 863,914 | |
| Administration fee | | | 109,356 | |
| Services to shareholders | | | 3,639 | |
| Custodian fee | | | 27,928 | |
| Distribution service fee (Class B) | | | 319 | |
| Professional fees | | | 32,630 | |
| Reports to shareholders | | | 40,496 | |
| Trustees' fees and expenses | | | 5,916 | |
| Other | | | 21,436 | |
| Total expenses | | | 1,105,634 | |
| Net investment income (loss) | | | 5,262,255 | |
| Realized and Unrealized Gain (Loss) | |
Net realized gain (loss) from: Investments | | | (13,167,021 | ) |
| Futures | | | 676,511 | |
| Foreign currency | | | (88,512 | ) |
| | | | (12,579,022 | ) |
Change in net unrealized appreciation (depreciation) on: Investments | | | 18,457,326 | |
| Futures | | | 274,825 | |
| Foreign currency | | | 51,518 | |
| | | | 18,783,669 | |
| Net gain (loss) | | | 6,204,647 | |
| Net increase (decrease) in net assets resulting from operations | | $ | 11,466,902 | |
The accompanying notes are an integral part of the financial statements.
Statement of Changes in Net Assets | Increase (Decrease) in Net Assets | | Six Months Ended June 30, 2012 (Unaudited) | | | Year Ended December 31, 2011 | |
Operations: Net investment income (loss) | | $ | 5,262,255 | | | $ | 5,039,870 | |
Operations: Net investment income (loss) | | $ | 5,262,255 | | | $ | 5,039,870 | |
| Net realized gain (loss) | | | (12,579,022 | ) | | | 19,998,084 | |
| Change in net unrealized appreciation (depreciation) | | | 18,783,669 | | | | (67,950,795 | ) |
| Net increase (decrease) in net assets resulting from operations | | | 11,466,902 | | | | (42,912,841 | ) |
Distributions to shareholders from: Net investment income: Class A | | | (4,756,093 | ) | | | (4,647,186 | ) |
| Class B | | | (4,778 | ) | | | (4,542 | ) |
| Total distributions | | | (4,760,871 | ) | | | (4,651,728 | ) |
Fund share transactions: Class A Proceeds from shares sold | | | 3,819,629 | | | | 8,968,575 | |
| Reinvestment of distributions | | | 4,756,093 | | | | 4,647,186 | |
| Payments for shares redeemed | | | (14,966,643 | ) | | | (43,581,738 | ) |
| Net increase (decrease) in net assets from Class A share transactions | | | (6,390,921 | ) | | | (29,965,977 | ) |
Class B Proceeds from shares sold | | | 33,451 | | | | 17,120 | |
| Reinvestment of distributions | | | 4,778 | | | | 4,542 | |
| Payments for shares redeemed | | | (25,787 | ) | | | (100,644 | ) |
| Net increase (decrease) in net assets from Class B share transactions | | | 12,442 | | | | (78,982 | ) |
| Increase (decrease) in net assets | | | 327,552 | | | | (77,609,528 | ) |
| Net assets at beginning of period | | | 211,049,255 | | | | 288,658,783 | |
| Net assets at end of period (including undistributed net investment income of $5,139,958 and $4,638,574, respectively) | | $ | 211,376,807 | | | $ | 211,049,255 | |
| Other Information | |
Class A Shares outstanding at beginning of period | | | 31,267,358 | | | | 35,091,522 | |
| Shares sold | | | 536,780 | | | | 1,212,691 | |
| Shares issued to shareholders in reinvestment of distributions | | | 650,628 | | | | 539,116 | |
| Shares redeemed | | | (2,077,729 | ) | | | (5,575,971 | ) |
| Net increase (decrease) in Class A shares | | | (890,321 | ) | | | (3,824,164 | ) |
| Shares outstanding at end of period | | | 30,377,037 | | | | 31,267,358 | |
Class B Shares outstanding at beginning of period | | | 34,893 | | | | 44,527 | |
| Shares sold | | | 4,578 | | | | 2,218 | |
| Shares issued to shareholders in reinvestment of distributions | | | 652 | | | | 526 | |
| Shares redeemed | | | (3,636 | ) | | | (12,378 | ) |
| Net increase (decrease) in Class B shares | | | 1,594 | | | | (9,634 | ) |
| Shares outstanding at end of period | | | 36,487 | | | | 34,893 | |
The accompanying notes are an integral part of the financial statements.
| | | | | | Years Ended December 31, | |
| Class A | | Six Months Ended 6/30/12 (Unaudited) | | | 2011 | | | 2010 | | | 2009 | | | 2008 | | | 2007 | |
| Selected Per Share Data | |
| Net asset value, beginning of period | | $ | 6.74 | | | $ | 8.22 | | | $ | 8.26 | | | $ | 6.52 | | | $ | 15.01 | | | $ | 13.42 | |
Income (loss) from investment operations: Net investment income (loss)a | | | .17 | | | | .15 | | | | .13 | | | | .12 | | | | .29 | c | | | .21 | c |
| Net realized and unrealized gain (loss) | | | .20 | | | | (1.49 | ) | | | (.00 | )*** | | | 1.93 | | | | (6.46 | ) | | | 1.73 | |
| Total from investment operations | | | .37 | | | | (1.34 | ) | | | .13 | | | | 2.05 | | | | (6.17 | ) | | | 1.94 | |
Less distributions from: Net investment income | | | (.16 | ) | | | (.14 | ) | | | (.17 | ) | | | (.31 | ) | | | (.17 | ) | | | (.35 | ) |
| Net realized gains | | | — | | | | — | | | | — | | | | — | | | | (2.15 | ) | | | — | |
| Total distributions | | | (.16 | ) | | | (.14 | ) | | | (.17 | ) | | | (.31 | ) | | | (2.32 | ) | | | (.35 | ) |
| Net asset value, end of period | | $ | 6.95 | | | $ | 6.74 | | | $ | 8.22 | | | $ | 8.26 | | | $ | 6.52 | | | $ | 15.01 | |
| Total Return (%) | | | 5.34 | ** | | | (16.67 | ) | | | 1.62 | b | | | 33.52 | | | | (48.21 | )b,d | | | 14.59 | |
| Ratios to Average Net Assets and Supplemental Data | |
| Net assets, end of period ($ millions) | | | 211 | | | | 211 | | | | 288 | | | | 344 | | | | 297 | | | | 702 | |
| Ratio of expenses before expense reductions (%) | | | 1.01 | * | | | 1.00 | | | | .99 | | | | .94 | | | | 1.01 | | | | .98 | |
| Ratio of expenses after expense reductions (%) | | | 1.01 | * | | | 1.00 | | | | .99 | | | | .94 | | | | .97 | | | | .98 | |
| Ratio of net investment income (loss) (%) | | | 2.39 | **** | | | 1.98 | | | | 1.68 | | | | 1.69 | | | | 2.74 | c | | | 1.48 | c |
| Portfolio turnover rate (%) | | | 51 | ** | | | 174 | | | | 228 | | | | 81 | | | | 123 | | | | 108 | |
a Based on average shares outstanding during the period. b Total return would have been lower had certain expenses not been reduced. c Net investment income per share and the ratio of net investment income include non-recurring dividend income amounting to $0.09 and $0.05 per share and 0.82% and 0.33% of average daily net assets for the years ended December 31, 2008 and 2007, respectively. d Includes a reimbursement from the Advisor to reimburse the effect of losses incurred as the result of certain operation errors during the period. Excluding this reimbursement, total return would have been 0.06% lower. * Annualized ** Not annualized *** Amount is less than $.005. **** Not annualized. The ratio for the six months ended June 30, 2012 has not been annualized, since the Fund believes it would be not be appropriate because the Fund's dividend income is not earned ratably throughout the year. | |
| | | | | | Years Ended December 31, | |
| Class B | | Six Months Ended 6/30/12 (Unaudited) | | | 2011 | | | 2010 | | | 2009 | | | 2008 | | | 2007 | |
| Selected Per Share Data | |
| Net asset value, beginning of period | | $ | 6.75 | | | $ | 8.22 | | | $ | 8.26 | | | $ | 6.52 | | | $ | 14.98 | | | $ | 13.38 | |
Income (loss) from investment operations: Net investment income (loss)a | | | .17 | | | | .13 | | | | .11 | | | | .10 | | | | .23 | c | | | .16 | c |
| Net realized and unrealized gain (loss) | | | .18 | | | | (1.48 | ) | | | (.00 | )*** | | | 1.94 | | | | (6.43 | ) | | | 1.73 | |
| Total from investment operations | | | .35 | | | | (1.35 | ) | | | .11 | | | | 2.04 | | | | (6.20 | ) | | | 1.89 | |
Less distributions from: Net investment income | | | (.14 | ) | | | (.12 | ) | | | (.15 | ) | | | (.30 | ) | | | (.11 | ) | | | (.29 | ) |
| Net realized gains | | | — | | | | — | | | | — | | | | — | | | | (2.15 | ) | | | — | |
| Total distributions | | | (.14 | ) | | | (.12 | ) | | | (.15 | ) | | | (.30 | ) | | | (2.26 | ) | | | (.29 | ) |
| Net asset value, end of period | | $ | 6.96 | | | $ | 6.75 | | | $ | 8.22 | | | $ | 8.26 | | | $ | 6.52 | | | $ | 14.98 | |
| Total Return (%) | | | 5.04 | ** | | | (16.77 | ) | | | 1.33 | b | | | 32.89 | | | | (48.25 | )b,d | | | 14.25 | b |
| Ratios to Average Net Assets and Supplemental Data | |
| Net assets, end of period ($ millions) | | | .25 | | | | .24 | | | | .36 | | | | .50 | | | | .40 | | | | 12 | |
| Ratio of expenses before expense reductions (%) | | | 1.29 | * | | | 1.28 | | | | 1.26 | | | | 1.22 | | | | 1.33 | | | | 1.41 | |
| Ratio of expenses after expense reductions (%) | | | 1.29 | * | | | 1.28 | | | | 1.26 | | | | 1.22 | | | | 1.28 | | | | 1.39 | |
| Ratio of net investment income (loss) (%) | | | 2.31 | **** | | | 1.70 | | | | 1.41 | | | | 1.42 | | | | 2.42 | c | | | 1.07 | c |
| Portfolio turnover rate (%) | | | 51 | ** | | | 174 | | | | 228 | | | | 81 | | | | 123 | | | | 108 | |
a Based on average shares outstanding during the period. b Total return would have been lower had certain expenses not been reduced. c Net investment income per share and the ratio of net investment income include non-recurring dividend income amounting to $0.09 and $0.05 per share and 0.82% and 0.33% of average daily net assets for the years ended December 31, 2008 and 2007, respectively. d Includes a reimbursement from the Advisor to reimburse the effect of losses incurred as the result of certain operation errors during the period. Excluding this reimbursement, total return would have been 0.06% lower. * Annualized ** Not annualized *** Amount is less than $.005. **** Not annualized. The ratio for the six months ended June 30, 2012 has not been annualized, since the Fund believes it would be not be appropriate because the Fund's dividend income is not earned ratably throughout the year. | |
Notes to Financial Statements (Unaudited)
A. Organization and Significant Accounting Policies
DWS Variable Series I (the "Series") is registered under the Investment Company Act of 1940, as amended (the "1940 Act"), as an open-end, registered management investment company organized as a Massachusetts business trust. The Series consists of five diversified funds: DWS Bond VIP, DWS Core Equity VIP (formerly DWS Growth & Income VIP), DWS Capital Growth VIP, DWS Global Small Cap Growth VIP and DWS International VIP (individually or collectively hereinafter referred to as a "Fund" or the "Funds"). These financial statements report on DWS International VIP. The Series is intended to be the underlying investment vehicle for variable annuity contracts and variable life insurance policies to be offered by the separate accounts of certain life insurance companies ("Participating Insurance Companies").
Multiple Classes of Shares of Beneficial Interest. The Fund offers two classes of shares (Class A shares and Class B shares). Class B shares are subject to Rule 12b-1 distribution fees under the 1940 Act and recordkeeping fees equal to an annual rate of 0.25% and up to 0.15%, respectively, of the average daily net assets of the Class B shares of the Fund. Class A shares are not subject to such fees.
Investment income, realized and unrealized gains and losses, and certain fund-level expenses and expense reductions, if any, are borne pro rata on the basis of relative net assets by the holders of all classes of shares, except that each class bears certain expenses unique to that class (including the applicable 12b-1 distribution fees and recordkeeping fees). Differences in class-level expenses may result in payment of different per share dividends by class. All shares have equal rights with respect to voting subject to class-specific arrangements.
The Fund's financial statements are prepared in accordance with accounting principles generally accepted in the United States of America, which require the use of management estimates. Actual results could differ from those estimates. The policies described below are followed consistently by the Fund in the preparation of its financial statements.
Security Valuation. Investments are stated at value determined as of the close of regular trading on the New York Stock Exchange on each day the exchange is open for trading.
Various inputs are used in determining the value of the Fund's investments. These inputs are summarized in three broad levels. Level 1 includes quoted prices in active markets for identical securities. Level 2 includes other significant observable inputs (including quoted prices for similar securities, interest rates, prepayment speeds, and credit risk). Level 3 includes significant unobservable inputs (including the Fund's own assumptions in determining the fair value of investments). The inputs or methodology used for valuing securities are not necessarily an indication of the risk associated with investing in those securities.
Equity securities are valued at the most recent sale price or official closing price reported on the exchange (U.S. or foreign) or over-the-counter market on which they trade and are categorized as Level 1 securities. Securities for which no sales are reported are valued at the calculated mean between the most recent bid and asked quotations on the relevant market or, if a mean cannot be determined, at the most recent bid quotation. For certain international equity securities, in order to adjust for events which may occur between the close of the foreign exchanges and the close of the New York Stock Exchange, a fair valuation model may be used. This fair valuation model takes into account comparisons to the valuation of American Depository Receipts (ADRs), exchange-traded funds, futures contracts and certain indices and these securities are categorized as Level 2.
Investments in open-end investment companies are valued at their net asset value each business day and are categorized as Level 1.
Futures contracts are generally valued at the settlement prices established each day on the exchange on which they are traded and are categorized as Level 1.
Securities and other assets for which market quotations are not readily available or for which the above valuation procedures are deemed not to reflect fair value are valued in a manner that is intended to reflect their fair value as determined in accordance with procedures approved by the Trustees and are generally categorized as Level 3. In accordance with the Fund's valuation procedures, factors used in determining value may include, but are not limited to, the type of the security; the size of the holding; the initial cost of the security; the existence of any contractual restrictions on the security's disposition; the price and extent of public trading in similar securities of the issuer or of comparable companies; quotations or evaluated prices from broker-dealers and/or pricing services; information obtained from the issuer, analysts, and/or the appropriate stock exchange (for exchange-traded securities); an analysis of the company's or issuer's financial statements; an evaluation of the forces that influence the issuer and the market(s) in which the security is purchased and sold and with respect to debt securities; the maturity, coupon, creditworthiness, currency denomination and the movement of the market in which the security is normally traded. The value determined under these procedures may differ from published values for the same securities.
Disclosure about the classification of fair value measurements is included in a table following the Fund's Investment Portfolio.
Securities Lending. The Fund lends securities to certain financial institutions. The Fund retains beneficial ownership of the securities it has loaned and continues to receive interest and dividends paid by the issuer of securities and to participate in any changes in their market value. The Fund requires the borrowers of the securities to maintain collateral with the Fund consisting of either cash or liquid, unencumbered assets having a value at least equal to the value of the securities loaned. When the collateral falls below specified amounts, the lending agent will use its best effort to obtain additional collateral on the next business day to meet required amounts under the security lending agreement. The Fund may invest the cash collateral into a joint trading account in an affiliated money market fund pursuant to Exemptive Orders issued by the SEC. The Fund receives compensation for lending its securities either in the form of fees or by earning interest on invested cash collateral net of borrower rebates and fees paid to a lending agent. Either the Fund or the borrower may terminate the loan. There may be risks of delay and costs in recovery of securities or even loss of rights in the collateral should the borrower of the securities fail financially. The Fund is also subject to all investment risks associated with the reinvestment of any cash collateral received, including, but not limited to, interest rate, credit and liquidity risk associated with such investments.
Foreign Currency Translations. The books and records of the Fund are maintained in U.S. dollars. Investment securities and other assets and liabilities denominated in a foreign currency are translated into U.S. dollars at the prevailing exchange rates at period end. Purchases and sales of investment securities, income and expenses are translated into U.S. dollars at the prevailing exchange rates on the respective dates of the transactions.
Net realized and unrealized gains and losses on foreign currency transactions represent net gains and losses between trade and settlement dates on securities transactions, the acquisition and disposition of foreign currencies, and the difference between the amount of net investment income accrued and the U.S. dollar amount actually received. That portion of both realized and unrealized gains and losses on investments that results from fluctuations in foreign currency exchange rates is not separately disclosed but is included with net realized and unrealized gain/appreciation and loss/depreciation on investments.
Taxes. The Fund is treated as a separate taxpayer as provided for in the Internal Revenue Code, as amended. It is the Fund's policy to comply with the requirements of the Internal Revenue Code, as amended, which are applicable to regulated investment companies, and to distribute all of its taxable income to the separate accounts of the Participating Insurance Companies which hold its shares.
Additionally, based on the Series' understanding of the tax rules and rates related to income, gains and transactions for the foreign jurisdictions in which the Fund invests, the Fund will provide for foreign taxes, and where appropriate, deferred foreign taxes.
Under the Regulated Investment Company Modernization Act of 2010, net capital losses may be carried forward indefinitely, and their character is retained as short-term and/or long-term. Previously, net capital losses were carried forward for eight years and treated as short-term losses. As a transition rule, the Act requires that post-enactment net capital losses be used before pre-enactment net capital losses.
At December 31, 2011, the Fund had a net tax basis capital loss carryforward of approximately $124,587,000 of pre-enactment losses, which may be applied against any realized net taxable capital gains of each succeeding year until fully utilized or until December 31, 2016 ($51,383,000) and December 31, 2017 ($73,204,000), the respective expiration dates, whichever occurs first.
In addition, from November 1, 2011 to December 31, 2011, the Fund elects to defer qualified late year losses of approximately $5,197,000 of net long-term realized capital losses and treat them as arising in the fiscal year ending December 31, 2012.
The Fund has reviewed the tax positions for the open tax years as of December 31, 2011 and has determined that no provision for income tax is required in the Fund's financial statements. The Fund's federal tax returns for the prior three fiscal years remain open subject to examination by the Internal Revenue Service.
Distribution of Income and Gains. The Fund will declare and distribute dividends from its net investment income, if any, annually, although additional distributions may be made if necessary. Net realized gains from investment transactions, in excess of available capital loss carryforwards, would be taxable to the Fund if not distributed, and, therefore, will be distributed to shareholders at least annually.
The timing and characterization of certain income and capital gain distributions are determined annually in accordance with federal tax regulations which may differ from accounting principles generally accepted in the United States of America. These differences primarily relate to investments in foreign denominated investments, futures contracts, passive foreign investment companies and certain securities sold at a loss. As a result, net investment income (loss) and net realized gain (loss) on investment transactions for a reporting period may differ significantly from distributions during such period. Accordingly, the Fund may periodically make reclassifications among certain of its capital accounts without impacting the net asset value of the Fund.
The tax character of current year distributions will be determined at the end of the current fiscal year.
Expenses. Expenses of the Series arising in connection with a specific Fund are allocated to that Fund. Other Series expenses which cannot be directly attributed to a Fund are apportioned among the Funds in the Series.
Contingencies. In the normal course of business, the Fund may enter into contracts with service providers that contain general indemnification clauses. The Fund's maximum exposure under these arrangements is unknown as this would involve future claims that may be made against the Fund that have not yet been made. However, based on experience, the Fund expects the risk of loss to be remote.
Other. Investment transactions are accounted for on a trade date plus one basis for daily net asset value calculations. However, for financial reporting purposes, investment transactions are reported on trade date. Interest income is recorded on the accrual basis net of foreign withholding taxes. Dividend income is recorded on the ex-dividend date net of foreign withholding taxes. Certain dividends from foreign securities may be recorded subsequent to the ex-dividend date as soon as the Fund is informed of such dividends. Realized gains and losses from investment transactions are recorded on an identified cost basis and may include proceeds from litigation.
B. Derivative Instruments
Futures Contracts. A futures contract is an agreement between a buyer or seller and an established futures exchange or its clearinghouse in which the buyer or seller agrees to take or make a delivery of a specific amount of a financial instrument at a specified price on a specific date (settlement date). For the six months ended June 30, 2012, the Fund entered into futures contracts in circumstances where portfolio management believed they offered an economic means of gaining exposure to a particular asset class or to keep cash on hand to meet shareholder redemptions or other needs while maintaining exposure to the market.
Upon entering into a futures contract, the Fund is required to deposit with a financial intermediary cash or securities ("initial margin") in an amount equal to a certain percentage of the face value indicated in the futures contract. Subsequent payments ("variation margin") are made or received by the Fund dependent upon the daily fluctuations in the value and are recorded for financial reporting purposes as unrealized gains or losses by the Fund. Gains or losses are realized when the contract expires or is closed. Since all futures contracts are exchange-traded, counterparty risk is minimized as the exchange's clearinghouse acts as the counterparty, and guarantees the futures against default.
Certain risks may arise upon entering into futures contracts, including the risk that an illiquid market will limit the Fund's ability to close out a futures contract prior to the settlement date and the risk that the futures contract is not well correlated with the security, index or currency to which it relates. Risk of loss may exceed amounts disclosed in the Statement of Assets and Liabilities.
A summary of the open futures contracts as of June 30, 2012 is included in a table following the Fund's Investment Portfolio. For the six months ended June 30, 2012, the investment in futures contracts purchased had a total notional value generally indicative of a range from approximately $8,911,000 to $10,851,000.
| Asset Derivative | | Futures Contracts | |
| Equity Contracts (a) | | $ | 449,200 | |
The above derivative is located in the following Statement of Assets and Liabilities account:
(a) Includes cumulative appreciation of futures contracts as disclosed in the Investment Portfolio. Unsettled variation margin is disclosed separately within the Statement of Assets and Liabilities.
Additionally, the amount of unrealized and realized gains and losses on derivative instruments recognized in Fund earnings during the six months ended June 30, 2012 and the related location in the accompanying Statement of Operations is summarized in the following tables by primary underlying risk exposure:
| Realized Gain (Loss) | | Futures Contracts | |
| Equity Contracts (a) | | $ | 676,511 | |
The above derivative is located in the following Statement of Operations account:
(a) Net realized gain (loss) from futures
| Change in Net Unrealized Appreciation (Depreciation) | | Futures Contracts | |
| Equity Contracts (a) | | $ | 274,825 | |
The above derivative is located in the following Statement of Operations account:
(a) Change in net unrealized appreciation (depreciation) on futures
C. Purchases and Sales of Securities
During the six months ended June 30, 2012, purchases and sales of investment securities (excluding short-term investments) aggregated $106,677,052 and $113,583,586, respectively.
D. Related Parties
Management Agreement. Under the Investment Management Agreement with Deutsche Investment Management Americas Inc. ("DIMA" or the "Advisor"), an indirect, wholly owned subsidiary of Deutsche Bank AG, the Advisor directs the investments of the Fund in accordance with its investment objectives, policies and restrictions. The Advisor determines the securities, instruments and other contracts relating to investments to be purchased, sold or entered into by the Fund.
Pursuant to the Investment Management Agreement with the Advisor, the Fund pays a monthly management fee based on the Fund's average daily net assets, computed and accrued daily and payable monthly, at the following annual rates:
| First $500 million of average daily net assets | | | .790 | % |
| Over $500 million of average daily net assets | | | .640 | % |
Accordingly, for the six months ended June 30, 2012, the fee pursuant to the Investment Management Agreement was equivalent to an annualized effective rate of 0.79% of the Fund's average daily net assets.
Administration Fee. Pursuant to an Administrative Services Agreement, DIMA provides most administrative services to the Fund. For all services provided under the Administrative Services Agreement, the Fund pays the Advisor an annual fee ("Administration Fee") of 0.10% of the Fund's average daily net assets, computed and accrued daily and payable monthly. For the six months ended June 30, 2012, the Administration Fee was $109,356, of which $16,711 is unpaid.
Service Provider Fees. DWS Investments Service Company ("DISC"), an affiliate of the Advisor, is the transfer agent, dividend-paying agent and shareholder service agent for the Fund. Pursuant to a sub-transfer agency agreement between DISC and DST Systems, Inc. ("DST"), DISC has delegated certain transfer agent, dividend-paying agent and shareholder service agent functions to DST. DISC compensates DST out of the shareholder servicing fee it receives from the Fund. For the six months ended June 30, 2012, the amounts charged to the Fund by DISC were as follows:
| Services to Shareholders | | Total Aggregated | | | Unpaid at June 30, 2012 | |
| Class A | | $ | 343 | | | $ | 110 | |
| Class B | | | 40 | | | | 13 | |
| | | $ | 383 | | | $ | 123 | |
Distribution Service Agreement. DWS Investments Distributors, Inc. ("DIDI"), also an affiliate of the Advisor, is the Series' Distributor. In accordance with the Master Distribution Plan, DIDI receives 12b-1 fees of 0.25% of average daily net assets of Class B shares. Pursuant to the Master Distribution Plan, DIDI remits these fees to the Participating Insurance Companies for various costs incurred or paid by these companies in connection with marketing and distribution of Class B shares. For the six months ended June 30, 2012, the Distribution Service Fee aggregated $319, of which $50 is unpaid.
Typesetting and Filing Service Fees. Under an agreement with DIMA, DIMA is compensated for providing typesetting and certain regulatory filing services to the Fund. For the six months ended June 30, 2012, the amount charged to the Fund by DIMA included in the Statement of Operations under "reports to shareholders" aggregated $13,342, of which $4,370 is unpaid.
Trustees' Fees and Expenses. The Fund paid retainer fees to each Trustee not affiliated with the Advisor, plus specified amounts to the Board Chairperson and to each committee Chairperson.
Affiliated Cash Management Vehicle. The Fund may invest uninvested cash balances in Central Cash Management Fund, which is managed by the Advisor. The Fund indirectly bears its proportionate share of the expenses of Central Cash Management Fund. Central Cash Management Fund does not pay the Advisor an investment management fee. Central Cash Management Fund seeks a high level of current income consistent with liquidity and the preservation of capital.
Securities Lending Agent Fees. Deutsche Bank AG serves as securities lending agent for the Fund. For the six months ended June 30, 2012, the Fund incurred securities lending agent fees to Deutsche Bank AG in the amount of $32,650.
E. Ownership of the Fund
Two participating insurance companies were owners of record of 10% or more of the total outstanding Class A shares of the Fund, each owning 41% and 13%.
F. Line of Credit
The Fund and other affiliated funds (the "Participants") share in a $375 million revolving credit facility provided by a syndication of banks. The Fund may borrow for temporary or emergency purposes, including the meeting of redemption requests that otherwise might require the untimely disposition of securities. The Participants are charged an annual commitment fee which is allocated based on net assets, among each of the Participants. Interest is calculated at a rate per annum equal to the sum of the Federal Funds Rate plus 1.25 percent plus if LIBOR exceeds the Federal Funds Rate the amount of such excess. The Fund may borrow up to a maximum of 33 percent of its net assets under the agreement. The Fund had no outstanding loans at June 30, 2012.
Information About Your Fund's Expenses (Unaudited)
As an investor of the Fund, you incur two types of costs: ongoing expenses and transaction costs. Ongoing expenses include management fees, distribution and service (12b-1) fees and other Fund expenses. Examples of transaction costs include contract charges, redemption fees and account maintenance fees, which are not shown in this section. The following tables are intended to help you understand your ongoing expenses (in dollars) of investing in the Fund and to help you compare these expenses with the ongoing expenses of investing in other mutual funds. The example in the table is based on an investment of $1,000 invested at the beginning of the six-month period and held for the entire period (January 1, 2012 to June 30, 2012).
The tables illustrate your Fund's expenses in two ways:
•Actual Fund Return. This helps you estimate the actual dollar amount of ongoing expenses (but not transaction costs) paid on a $1,000 investment in the Fund using the Fund's actual return during the period. To estimate the expenses you paid over the period, simply divide your account value by $1,000 (for example, an $8,600 account value divided by $1,000 = 8.6), then multiply the result by the number in the "Expenses Paid per $1,000" line under the share class you hold.
• Hypothetical 5% Fund Return. This helps you to compare your Fund's ongoing expenses (but not transaction costs) with those of other mutual funds using the Fund's actual expense ratio and a hypothetical rate of return of 5% per year before expenses. Examples using a 5% hypothetical Fund return may be found in the shareholder reports of other mutual funds. The hypothetical account values and expenses may not be used to estimate the actual ending account balance or expenses you paid for the period.
Please note that the expenses shown in these tables are meant to highlight your ongoing expenses only and do not reflect any transaction costs. The "Expenses Paid per $1,000" line of the tables is useful in comparing ongoing expenses only and will not help you determine the relative total expense of owning different funds. If these transaction costs had been included, your costs would have been higher.
Expenses and Value of a $1,000 Investment for the six months ended June 30, 2012 | |
| Actual Fund Return | | Class A | | | | | | Class B | |
| Beginning Account Value 1/1/12 | | $ | 1,000.00 | | | | | | $ | 1,000.00 | |
| Ending Account Value 6/30/12 | | $ | 1,053.40 | | | | , | | | $ | 1,050.40 | |
| Expenses Paid per $1,000* | | $ | 5.16 | | | | | | | $ | 6.58 | |
| Hypothetical 5% Fund Return | | Class A | | | | | | | Class B | |
| Beginning Account Value 1/1/12 | | $ | 1,000.00 | | | | | | | $ | 1,000.00 | |
| Ending Account Value 6/30/12 | | $ | 1,019.84 | | | | | | | $ | 1,018.45 | |
| Expenses Paid per $1,000* | | $ | 5.07 | | | | | | | $ | 6.47 | |
* Expenses are equal to the Fund's annualized expense ratio for each share class, multiplied by the average account value over the period, multiplied by 182 (the number of days in the most recent six-month period), then divided by 366.
| Annualized Expense Ratios | Class A | | Class B | |
| DWS Variable Series I — DWS International VIP | 1.01% | | 1.29% | |
For more information, please refer to the Fund's prospectus.
These tables do not reflect charges and fees ("contract charges") associated with the separate account that invests in the Fund or any variable life insurance policy or variable annuity contract for which the Fund is an investment option.
The Series' policies and procedures for voting proxies for portfolio securities and information about how the Series voted proxies related to its portfolio securities during the 12-month period ended June 30 are available on our Web site — www.dws-investments.com (click on "proxy voting"at the bottom of the page) — or on the SEC's Web site — www.sec.gov. To obtain a written copy of the Series' policies and procedures without charge, upon request, call us toll free at (800) 728-3337.
Summary of Management Fee Evaluation by Independent Fee Consultant
September 26, 2011
Pursuant to an Order entered into by Deutsche Investment Management Americas and affiliates (collectively, "DeAM") with the Attorney General of New York, I, Thomas H. Mack, have been appointed the Independent Fee Consultant for the DWS Funds (formerly the DWS Scudder Funds). My duties include preparing an annual written evaluation of the management fees DeAM charges the Funds, considering among other factors the management fees charged by other mutual fund companies for like services, management fees DeAM charges other clients for like services, DeAM's costs of supplying services under the management agreements and related profit margins, possible economies of scale if a Fund grows larger, and the nature and quality of DeAM's services, including fund performance. This report summarizes my evaluation for 2011, including my qualifications, the evaluation process for each of the DWS Funds, consideration of certain complex-level factors, and my conclusions. I served in substantially the same capacity in 2007, 2008, 2009 and 2010.
Qualifications
For more than 35 years I have served in various professional capacities within the investment management business. I have held investment analysis and advisory positions, including securities analyst, portfolio strategist and director of investment policy with a large investment firm. I have also performed business management functions, including business development, financial management and marketing research and analysis.
Since 1991, I have been an independent consultant within the asset management industry. I have provided services to over 125 client organizations, including investment managers, mutual fund boards, product distributors and related organizations. Over the past ten years I have completed a number of assignments for mutual fund boards, specifically including assisting boards with management contract renewal.
I hold a Master of Business Administration degree, with highest honors, from Harvard University and Master of Science and Bachelor of Science (highest honors) degrees from the University of California at Berkeley. I am an independent director and audit committee financial expert for two closed-end mutual funds and have served in various leadership and financial oversight capacities with non-profit organizations.
Evaluation of Fees for each DWS Fund
My work focused primarily on evaluating, fund-by-fund, the fees charged to each of the 109 mutual fund portfolios in the DWS Fund family. For each Fund, I considered each of the key factors mentioned above, as well as any other relevant information. In doing so I worked closely with the Funds' Independent Directors in their annual contract renewal process, as well as in their approval of contracts for several new funds (documented separately).
In evaluating each Fund's fees, I reviewed comprehensive materials provided by or on behalf of DeAM, including expense information prepared by Lipper Analytical, comparative performance information, profitability data, manager histories, and other materials. I also accessed certain additional information from the Lipper and Morningstar databases and drew on my industry knowledge and experience.
To facilitate evaluating this considerable body of information, I prepared for each Fund a document summarizing the key data elements in each area as well as additional analytics discussed below. This made it possible to consider each key data element in the context of the others.
In the course of contract renewal, DeAM agreed to implement a number of fee and expense adjustments requested by the Independent Directors which will favorably impact future fees and expenses, and my evaluation includes the effects of these changes.
Fees and Expenses Compared with Other Funds
The competitive fee and expense evaluation for each fund focused on two primary comparisons:
The Fund's contractual management fee (the advisory fee plus the administration fee where applicable) compared with those of a group of typically 12-15 funds in the same Lipper investment category (e.g. Large Capitalization Growth) having similar distribution arrangements and being of similar size.
The Fund's total expenses compared with a broader universe of funds from the same Lipper investment category and having similar distribution arrangements.
These two comparisons provide a view of not only the level of the fee compared with funds of similar scale but also the total expense the Fund bears for all the services it receives, in comparison with the investment choices available in the Fund's investment category and distribution channel. The principal figure-of-merit used in these comparisons was the subject Fund's percentile ranking against peers.
DeAM's Fees for Similar Services to Others
DeAM provided management fee schedules for all of its US domiciled fund and non-fund investment management accounts in any of the investment categories where there is a DWS Fund. These similar products included the other DWS Funds, non-fund pooled accounts, institutional accounts and sub-advisory accounts. Using this information, I calculated for each Fund the fee that would be charged to each similar product, at the subject Fund's asset level.
Evaluating information regarding non-fund products is difficult because there are varying levels of services required for different types of accounts, with mutual funds generally requiring considerably more regulatory and administrative types of service as well as having more frequent cash flows than other types of accounts. Also, while mutual fund fees for similar fund products can be expected to be similar, there will be some differences due to different pricing conditions in different distribution channels (e.g. retail funds versus those used in variable insurance products), differences in underlying investment processes and other factors.
Costs and Profit Margins
DeAM provided a detailed profitability analysis for each Fund. After making some adjustments so that the presentation would be more comparable to the available industry figures, I reviewed profit margins from investment management alone, from investment management plus other fund services (excluding distribution) provided to the Funds by DeAM (principally shareholder services), and DeAM profits from all sources, including distribution. A later section comments on overall profitability.
Economies of Scale
Economies of scale — an expected decline in management cost per dollar of fund assets as fund assets grow — are very rarely quantified and documented because of inherent difficulties in collecting and analyzing relevant data. However, in virtually every investment category that I reviewed, larger funds tend to have lower fees and lower total expenses than smaller funds. To see how each DWS Fund compares with this industry observation, I reviewed:
The trend in Fund assets over the last five years and the accompanying trend in total expenses. This shows if the Fund has grown and, if so, whether total expense (management fees as well as other expenses) have declined as a percent of assets.
Whether the Fund has break-points in its management fee schedule, the extent of the fee reduction built into the schedule and the asset levels where the breaks take effect, and in the case of a sub-advised Fund how the Fund's break-points compare with those of the sub-advisory fee schedule.
How the Fund's contractual fee schedule compares with trends in the industry data. To accomplish this, I constructed a chart showing how actual latest-fiscal-year contractual fees of the Fund and of other similar funds relate to average fund assets, with the subject Fund's contractual fee schedule superimposed.
Quality of Service — Performance
The quality-of-service evaluation focused on investment performance, which is the principal result of the investment management service. Each Fund's performance was reviewed over the past 1, 3, 5 and 10 years, as applicable, and compared with that of other funds in the same investment category and with a suitable market index.
In addition, I calculated and reviewed risk-adjusted returns relative to an index of similar mutual funds' returns and a suitable market index. The risk-adjusted returns analysis provides a way of determining the extent to which the Fund's return comparisons are mainly the product of investment value-added (or lack thereof) or alternatively taking considerably more or less risk than is typical in its investment category.
I also received and considered the history of portfolio manager changes for each Fund, as this provided an important context for evaluating the performance results.
Complex-Level Considerations
While this evaluation was conducted mainly at the individual fund level, there are some issues relating to the reasonableness of fees that can alternatively be considered across the whole fund complex:
I reviewed DeAM's profitability analysis for all DWS Funds, with a view toward determining if the allocation procedures used were reasonable and how profit levels compared with public data for other investment managers.
I considered whether DeAM and affiliates receive any significant ancillary or "fall-out" benefits that should be considered in interpreting the direct profitability results. These would be situations where serving as the investment manager of the Funds is beneficial to another part of the Deutsche Bank organization.
I considered how aggregated DWS Fund expenses had varied over the years, by asset class and in the context of trends in asset levels.
I reviewed the structure of the DeAM organization, trends in staffing levels, and information on compensation of investment management and other professionals compared with industry data.
Findings
Based on the process and analysis discussed above, which included reviewing a wide range of information from management and external data sources and considering among other factors the fees DeAM charges other clients, the fees charged by other fund managers, DeAM's costs and profits associated with managing the Funds, economies of scale, possible fall-out benefits, and the nature and quality of services provided, in my opinion the management fees charged the DWS Funds are reasonable.
Thomas H. Mack
President, Thomas H. Mack & Co., Inc.
DWS Investments Distributors, Inc.
222 South Riverside Plaza
Chicago, IL 60606
(800) 621-1148
VS1int-3 (R-028378-1 8/12)
| | |
| ITEM 2. | CODE OF ETHICS |
| | |
| | Not applicable. |
| | |
| ITEM 3. | AUDIT COMMITTEE FINANCIAL EXPERT |
| | |
| | Not applicable |
| | |
| ITEM 4. | PRINCIPAL ACCOUNTANT FEES AND SERVICES |
| | |
| | Not applicable |
| | |
| ITEM 5. | AUDIT COMMITTEE OF LISTED REGISTRANTS |
| | |
| | Not applicable |
| | |
| ITEM 6. | SCHEDULE OF INVESTMENTS |
| | |
| | Not applicable |
| | |
| ITEM 7. | DISCLOSURE OF PROXY VOTING POLICIES AND PROCEDURES FOR CLOSED-END MANAGEMENT INVESTMENT COMPANIES |
| | |
| | Not applicable |
| | |
| ITEM 8. | PORTFOLIO MANAGERS OF CLOSED-END MANAGEMENT INVESTMENT COMPANIES |
| | |
| | Not applicable |
| | |
| ITEM 9. | PURCHASES OF EQUITY SECURITIES BY CLOSED-END MANAGEMENT INVESTMENT COMPANY AND AFFILIATED PURCHASERS |
| | |
| | Not applicable |
| | |
| ITEM 10. | SUBMISSION OF MATTERS TO A VOTE OF SECURITY HOLDERS |
| | |
| | There were no material changes to the procedures by which shareholders may recommend nominees to the Fund’s Board. The primary function of the Nominating and Governance Committee is to identify and recommend individuals for membership on the Board and oversee the administration of the Board Governance Guidelines. Shareholders may recommend candidates for Board positions by forwarding their correspondence by U.S. mail or courier service to Paul K. Freeman, Independent Chairman, DWS Funds, P.O. Box 101833, Denver, CO 80250-1833. |
| | |
| ITEM 11. | CONTROLS AND PROCEDURES |
| | |
| | (a) | The Chief Executive and Financial Officers concluded that the Registrant’s Disclosure Controls and Procedures are effective based on the evaluation of the Disclosure Controls and Procedures as of a date within 90 days of the filing date of this report. |
| | |
| | (b) | There have been no changes in the registrant’s internal control over financial reporting that occurred during the second fiscal quarter of the period covered by this report that has materially affected, or is reasonably likely to materially affect, the registrant’s internal controls over financial reporting. |
| | |
| ITEM 12. | EXHIBITS |
| | |
| | (a)(1) | Certification pursuant to Rule 30a-2(a) under the Investment Company Act of 1940 (17 CFR 270.30a-2(a)) is filed and attached hereto as Exhibit 99.CERT. |
| | |
| | (b) | Certification pursuant to Rule 30a-2(b) under the Investment Company Act of 1940 (17 CFR 270.30a-2(b)) is furnished and attached hereto as Exhibit 99.906CERT. |
Form N-CSRS Item F
SIGNATURES
Pursuant to the requirements of the Securities Exchange Act of 1934 and the Investment Company Act of 1940, the registrant has duly caused this report to be signed on its behalf by the undersigned, thereunto duly authorized.
| Registrant: | DWS Variable Series I |
| | |
| | |
| By: | /s/W. Douglas Beck W. Douglas Beck President |
| | |
| Date: | August 20, 2012 |
Pursuant to the requirements of the Securities Exchange Act of 1934 and the Investment Company Act of 1940, this report has been signed below by the following persons on behalf of the registrant and in the capacities and on the dates indicated.
| By: | /s/W. Douglas Beck W. Douglas Beck President |
| | |
| Date: | August 20, 2012 |
| | |
| | |
| | |
| By: | /s/Paul Schubert Paul Schubert Chief Financial Officer and Treasurer |
| | |
| Date: | August 20, 2012 |