I am very pleased to tell you that the DWS funds have been renamed Deutsche funds, aligning more closely with the Deutsche Asset & Wealth Management brand. We are proud to adopt the Deutsche name — a brand that fully represents the global access, discipline and intelligence that support all of our products and services.
Deutsche Asset & Wealth Management combines the asset management and wealth management divisions of Deutsche Bank to deliver a comprehensive suite of active, passive and alternative investment capabilities. Your investment in the Deutsche funds means you have access to the thought leadership and resources of one of the world’s largest and most influential financial institutions.
In conjunction with your fund’s name change, please note that the Deutsche funds’ Web address has changed as well. The former dws-investments.com is now deutschefunds.com.
These changes have no effect on the day-to-day management of your investment, and there is no action required on your part. You will continue to experience the benefits that come from our decades of experience, in-depth research and worldwide network of investment professionals.
Thanks for your continued support. We appreciate your trust and the opportunity to put our capabilities to work for you.
Fund performance shown is historical, assumes reinvestment of all dividend and capital gain distributions, and does not guarantee future results. Investment return and principal value fluctuate with changing market conditions so that, when redeemed, shares may be worth more or less than their original cost. Current performance may be lower or higher than the performance data quoted. Please contact your participating insurance company for the Fund's most recent month-end performance. Performance doesn't reflect charges and fees ("contract charges") associated with the separate account that invests in the Fund or any variable life insurance policy or variable annuity contract for which the Fund is an investment option. These charges and fees will reduce returns.
The gross expense ratio of the Fund, as stated in the fee table of the prospectus dated May 1, 2014 is 0.65% for Class A shares and may differ from the expense ratio disclosed in the Financial Highlights table in this report.
Effective maturity is the weighted average of the maturity date of bonds held by the Fund taking into consideration any available maturity shortening features.
Following the Fund's fiscal first and third quarter-end, a complete portfolio holdings listing is filed with the SEC on Form N-Q. The form will be available on the SEC's Web site at sec.gov, and it also may be reviewed and copied at the SEC's Public Reference Room in Washington, D.C. Information on the operation of the SEC's Public Reference Room may be obtained by calling (800) SEC-0330. The Fund's portfolio holdings are also posted on deutschefunds.com from time to time. Please see the Fund's current prospectus for more information.
John D. Ryan
Deutsche Variable Series I (formerly DWS Variable Series I) (the "Series") is registered under the Investment Company Act of 1940, as amended (the "1940 Act"), as an open-end, registered management investment company organized as a Massachusetts business trust. The Series consists of five diversified funds: Deutsche Bond VIP, Deutsche Core Equity VIP, Deutsche Capital Growth VIP, Deutsche Global Small Cap Growth VIP and Deutsche International VIP (individually or collectively hereinafter referred to as a "Fund" or the "Funds" and formerly known as DWS Bond VIP, DWS Core Equity VIP, DWS Capital Growth VIP, DWS Global Small Cap Growth VIP and DWS International VIP, respectively). These financial statements report on Deutsche Bond VIP. The Series is intended to be the underlying investment vehicle for variable annuity contracts and variable life insurance policies to be offered by the separate accounts of certain life insurance companies ("Participating Insurance Companies").
The Fund's financial statements are prepared in accordance with accounting principles generally accepted in the United States of America, which require the use of management estimates. Actual results could differ from those estimates. The policies described below are followed consistently by the Fund in the preparation of its financial statements.
Various inputs are used in determining the value of the Fund's investments. These inputs are summarized in three broad levels. Level 1 includes quoted prices in active markets for identical securities. Level 2 includes other significant observable inputs (including quoted prices for similar securities, interest rates, prepayment speeds and credit risk). Level 3 includes significant unobservable inputs (including the Fund's own assumptions in determining the fair value of investments). The level assigned to the securities valuations may not be an indication of the risk or liquidity associated with investing in those securities.
Debt securities are valued at prices supplied by independent pricing services approved by the Trustees of the Series. If the pricing services are unable to provide valuations, securities are valued at the average of the most recent reliable bid quotation or evaluated price, as applicable, obtained from broker-dealers. Such services may use various pricing techniques which take into account appropriate factors such as yield, quality, coupon rate, maturity, type of issue, trading characteristics and other data, as well as broker quotes. These securities are generally categorized as Level 2.
Money market instruments purchased with an original or remaining maturity of sixty days or less, maturing at par, are valued at amortized cost, which approximates value, and are categorized as Level 2. Investments in open-end investment companies are valued at their net asset value each business day and are categorized as Level 1.
Futures contracts are generally valued at the settlement prices established each day on the exchange on which they are traded and are categorized as Level 1.
Swap contracts are valued daily based upon prices supplied by a Board approved pricing vendor, if available, and otherwise are valued at the price provided by the broker-dealer. Swap contracts are generally categorized as Level 2.
Forward currency contracts are valued at the prevailing forward exchange rate of the underlying currencies and are categorized as Level 2.
Exchange-traded options are valued at the last sale price or, in the absence of a sale, the mean between the closing bid and asked prices or at the most recent asked price (bid for purchased options) if no bid or asked price are available. Exchange-traded options are generally categorized as Level 1. Over-the-counter written or purchased options are valued at prices supplied by a Board approved pricing vendor, if available, and otherwise are valued at the price provided by the broker-dealer with which the option was traded. Over-the-counter written or purchased options are generally categorized as Level 2.
Securities and other assets for which market quotations are not readily available or for which the above valuation procedures are deemed not to reflect fair value are valued in a manner that is intended to reflect their fair value as determined in accordance with procedures approved by the Trustees and are generally categorized as Level 3. In accordance with the Fund's valuation procedures, factors considered in determining value may include, but are not limited to, the type of the security; the size of the holding; the initial cost of the security; the existence of any contractual restrictions on the security's disposition; the price and extent of public trading in similar securities of the issuer or of comparable companies; quotations or evaluated prices from broker-dealers and/or pricing services; information obtained from the issuer, analysts, and/or the appropriate stock exchange (for exchange-traded securities); an analysis of the company's or issuer's financial statements; an evaluation of the forces that influence the issuer and the market(s) in which the security is purchased and sold; and with respect to debt securities, the maturity, coupon, creditworthiness, currency denomination and the movement of the market in which the security is normally traded. The value determined under these procedures may differ from published values for the same securities.
Disclosure about the classification of fair value measurements is included in a table following the Fund's Investment Portfolio.
As of June 30, 2014, the Fund had securities on loan. The value of the related collateral exceeded the value of the securities loaned at period end.
Net realized and unrealized gains and losses on foreign currency transactions represent net gains and losses between trade and settlement dates on securities transactions, the acquisition and disposition of foreign currencies, and the difference between the amount of net investment income accrued and the U.S. dollar amount actually received. That portion of both realized and unrealized gains and losses on investments that results from fluctuations in foreign currency exchange rates is not separately disclosed but is included with net realized and unrealized gain/appreciation and loss/depreciation on investments.
Certain risks may arise upon entering into when-issued or delayed delivery transactions from the potential inability of counterparties to meet the terms of their contracts or if the issuer does not issue the securities due to political, economic, or other factors. Additionally, losses may arise due to changes in the value of the underlying securities.
Additionally, the Fund may be subject to taxes imposed by the governments of countries in which it invests and are generally based on income and/or capital gains earned or repatriated. Estimated tax liabilities on certain foreign securities are recorded on an accrual basis and are reflected as components of interest income or net change in unrealized gain/loss on investments. Tax liabilities realized as a result of security sales are reflected as a component of net realized gain/loss on investments.
Under the Regulated Investment Company Modernization Act of 2010, net capital losses incurred post-enactment may be carried forward indefinitely, and their character is retained as short-term and/or long-term. Previously, net capital losses were carried forward for eight years and treated as short-term losses. As a transition rule, the Act requires that post-enactment net capital losses be used before pre-enactment net capital losses.
At December 31, 2013, the Fund had a net tax basis capital loss carryforward of approximately $17,424,000, including a net tax basis pre-enactment capital loss carryforward of approximately $16,421,000, which may be applied against any realized net taxable capital gains of each succeeding year until fully utilized or until December 31, 2017 (the expiration date), whichever occurs first; and approximately $1,003,000 of post-enactment short-term losses, which may be applied against any realized net taxable capital gains of each succeeding year until fully utilized. Both pre- and post-enactment losses are subject to certain limitations under Sections 381–384 of the Internal Revenue Code.
The Fund has reviewed the tax positions for the open tax years as of December 31, 2013 and has determined that no provision for income tax and/or uncertain tax provisions is required in the Fund's financial statements. The Fund's federal tax returns for the prior three fiscal years remain open subject to examination by the Internal Revenue Service.
The timing and characterization of certain income and capital gain distributions are determined annually in accordance with federal tax regulations which may differ from accounting principles generally accepted in the United States of America. These differences primarily relate to investments in foreign denominated investments, investments in forward foreign currency exchange contracts, futures contracts, swap contracts and certain securities sold at a loss. As a result, net investment income (loss) and net realized gain (loss) on investment transactions for a reporting period may differ significantly from distributions during such period. Accordingly, the Fund may periodically make reclassifications among certain of its capital accounts without impacting the net asset value of the Fund.
The tax character of current year distributions will be determined at the end of the current fiscal year.
Upon entering into a futures contract, the Fund is required to deposit with a financial intermediary cash or securities ("initial margin") in an amount equal to a certain percentage of the face value indicated in the futures contract. Subsequent payments ("variation margin") are made or received by the Fund dependent upon the daily fluctuations in the value and are recorded for financial reporting purposes as unrealized gains or losses by the Fund. Gains or losses are realized when the contract expires or is closed. Since all futures contracts are exchange traded, counterparty risk is minimized as the exchange's clearinghouse acts as the counterparty, and guarantees the futures against default.
Certain risks may arise upon entering into futures contracts, including the risk that an illiquid market will limit the Fund's ability to close out a futures contract prior to the settlement date and the risk that the futures contract is not well correlated with the security, index or currency to which it relates. Risk of loss may exceed amounts disclosed in the Statement of Assets and Liabilities.
A summary of the open futures contracts as of June 30, 2014, is included in a table following the Fund's Investment Portfolio. For the six months ended June 30, 2014, the investment in futures contracts purchased had a total notional value generally indicative of a range from approximately $9,426,000 to $18,564,000, and the investment in futures contracts sold had a total notional value generally indicative of a range from approximately $9,788,000 to $21,371,000.
If the Fund writes a covered call option, the Fund foregoes, in exchange for the premium, the opportunity to profit during the option period from an increase in the market value of the underlying security above the exercise price. If the Fund writes a put option it accepts the risk of a decline in the value of the underlying security below the exercise price. Over-the-counter options have the risk of the potential inability of counterparties to meet the terms of their contracts. The Fund's maximum exposure to purchased options is limited to the premium initially paid. In addition, certain risks may arise upon entering into option contracts including the risk that an illiquid secondary market will limit the Fund's ability to close out an option contract prior to the expiration date and that a change in the value of the option contract may not correlate exactly with changes in the value of the securities or currencies hedged.
There are no open purchased option contracts as of June 30, 2014. A summary of open written option contracts is included in the table following the Fund's Investment Portfolio. For the six months ended June 30, 2014, the investment in written options contracts had a total value generally indicative of a range from approximately $60,000 to $147,400.
The value of a swap is adjusted daily, and the change in value, if any, is recorded as unrealized appreciation or depreciation in the Statement of Assets and Liabilities. Gains or losses are realized when the swap expires or is closed. Certain risks may arise when entering into swap transactions including counterparty default; liquidity; or unfavorable changes in interest rates or the value of the underlying reference security, commodity or index. In connection with bilateral swaps, securities and/or cash may be identified as collateral in accordance with the terms of the swap agreement to provide assets of value and recourse in the event of default. The maximum counterparty credit risk is the net present value of the cash flows to be received from or paid to the counterparty over the term of the swap, to the extent that this amount is beneficial to the Fund, in addition to any related collateral posted to the counterparty by the Fund. This risk may be partially reduced by a master netting arrangement between the Fund and the counterparty. Upon entering into a centrally cleared swap, the Fund is required to deposit with a financial intermediary cash or securities ("initial margin") in an amount equal to a certain percentage of the notional amount of the swap. Subsequent payments ("variation margin") are made or received by the Fund dependent upon the daily fluctuations in the value of the swap. In a cleared swap transaction, counterparty risk is minimized as the central clearinghouse acts as the counterparty.
An upfront payment, if any, made by the Fund is recorded as an asset in the Statement of Assets and Liabilities. An upfront payment, if any, received by the Fund is recorded as a liability in the Statement of Assets and Liabilities. Payments received or made at the end of the measurement period are recorded as realized gain or loss in the Statement of Operations.
Under the terms of a credit default swap, the Fund receives or makes periodic payments based on a specified interest rate on a fixed notional amount. These payments are recorded as a realized gain or loss in the Statement of Operations. Payments received or made as a result of a credit event or termination of the swap are recognized, net of a proportional amount of the upfront payment, as realized gains or losses in the Statement of Operations.
A summary of the open credit default swap contracts as of June 30, 2014 is included in a table following the Fund's Investment Portfolio. For the six months ended June 30, 2014, the investment in credit default swap contracts sold had a total notional value of $65,000.
A summary of the open interest rate swap contracts as of June 30, 2014 is included in a table following the Fund's Investment Portfolio. For the six months ended June 30, 2014, the investment in interest rate swap contracts had a total notional amount of $26,100,000.
Forward currency contracts are valued at the prevailing forward exchange rate of the underlying currencies and unrealized gain (loss) is recorded daily. On the settlement date of the forward currency contract, the Fund records a realized gain or loss equal to the difference between the value of the contract at the time it was opened and the value of the contract at the time it was closed. Certain risks may arise upon entering into forward currency contracts from the potential inability of counterparties to meet the terms of their contracts. The maximum counterparty credit risk to the Fund is measured by the unrealized gain on appreciated contracts. Additionally, when utilizing forward currency contracts to hedge, the Fund gives up the opportunity to profit from favorable exchange rate movements during the term of the contract.
A summary of the open forward currency contracts as of June 30, 2014, is included in a table following the Fund's Investment Portfolio. For the six months ended June 30, 2014, the investment in forward currency contracts U.S. dollars purchased had a total contract value generally indicative of a range from approximately $11,724,000 to $35,842,000, and the investment in forward currency contracts U.S. dollars sold had a total contract value generally indicative of a range from approximately $4,843,000 to $34,885,000.
The investment in forward currency contracts long vs. other foreign currencies sold had a total contract value generally indicative of a range from $0 to approximately $9,696,000.
The following tables summarize the value of the Fund's derivative instruments held as of June 30, 2014 and the related location in the accompanying Statement of Assets and Liabilities, presented by primary underlying risk exposure:
Additionally, the amount of unrealized and realized gains and losses on derivative instruments recognized in Fund earnings during the six months ended June 30, 2014 and the related location in the accompanying Statement of Operations is summarized in the following tables by primary underlying risk exposure:
As of June 30, 2014, the Fund has transactions subject to enforceable master netting agreements. A reconciliation of the gross amounts on the Statement of Assets and Liabilities to the net amounts by derivative type, including any collateral exposure, is included in the following tables:
During the six months ended June 30, 2014, purchases and sales of investment securities (excluding short-term investments and U.S. Treasury obligations) aggregated $92,238,306 and $122,010,981, respectively. Purchases and sales of U.S. Treasury obligations aggregated $18,619,233 and $11,995,468, respectively.
For the six months ended June 30, 2014, transactions for written options on interest rate swap contracts were as follows:
Pursuant to the Investment Management Agreement with the Advisor, the Fund pays a monthly management fee based on the Fund's average daily net assets, computed and accrued daily and payable monthly, at the following annual rates:
Accordingly, for the six months ended June 30, 2014, the fee pursuant to the Investment Management Agreement was equivalent to an annualized effective rate (exclusive of any applicable waivers/reimbursements) of 0.39% of the Fund's average daily net assets.
For the period from January 1, 2014 through April 30, 2015, the Advisor has contractually agreed to waive its fees and/or reimburse certain operating expenses to the extent necessary to maintain the operating expenses (excluding certain expenses such as extraordinary expenses, taxes, brokerage and interest expense) of Class A at 0.61%.
For the six months ended June 30, 2014, fees waived and/or expenses reimbursed were $37,638.
Investing in emerging markets may involve special risks and considerations not typically associated with investing in developed markets. These risks include revaluation of currencies, high rates of inflation or deflation, repatriation restrictions on income and capital, and future adverse political, social and economic developments. Moreover, securities issued in these markets may be less liquid, subject to government ownership controls or delayed settlements and may have prices more volatile or less easily assessed than those of comparable securities of issuers in developed markets.
At June 30, 2014, three participating insurance companies were owners of record of 10% or more of the total outstanding Class A shares of the Fund, owning 46%, 24% and 12%, respectively.
The Fund and other affiliated funds (the "Participants") share in a $400 million revolving credit facility provided by a syndication of banks. The Fund may borrow for temporary or emergency purposes, including the meeting of redemption requests that otherwise might require the untimely disposition of securities. The Participants are charged an annual commitment fee which is allocated based on net assets, among each of the Participants. Interest is calculated at a rate per annum equal to the sum of the Federal Funds Rate plus 1.25 percent plus if LIBOR exceeds the Federal Funds Rate the amount of such excess. The Fund may borrow up to a maximum of 33 percent of its net assets under the agreement. The Fund had no outstanding loans at June 30, 2014.
As an investor of the Fund, you incur two types of costs: ongoing expenses and transaction costs. Ongoing expenses include management fees and other Fund expenses. Examples of transaction costs include contract charges, redemption fees and account maintenance fees, which are not shown in this section. The following tables are intended to help you understand your ongoing expenses (in dollars) of investing in the Fund and to help you compare these expenses with the ongoing expenses of investing in other mutual funds. In the most recent six-month period, the Fund limited these expenses; had it not done so, expenses would have been higher. The example in the table is based on an investment of $1,000 invested at the beginning of the six-month period and held for the entire period (January 1, 2014 to June 30, 2014).
Please note that the expenses shown in these tables are meant to highlight your ongoing expenses only and do not reflect any transaction costs. The "Expenses Paid per $1,000" line of the tables is useful in comparing ongoing expenses only and will not help you determine the relative total expense of owning different funds. If these transaction costs had been included, your costs would have been higher.
For more information, please refer to the Fund's prospectus.
These tables do not reflect charges and fees ("contract charges") associated with the separate account that invests in the Fund or any variable life insurance policy or variable annuity contract for which the Fund is an investment option.
For an analysis of the fees associated with an investment in the fund or similar funds, please refer to the current and hypothetical expense calculators for Variable Insurance Products which can be found at deutschefunds.com/EN/resources/calculators.jsp.
The Series' policies and procedures for voting proxies for portfolio securities and information about how the Series voted proxies related to its portfolio securities during the 12-month period ended June 30 are available on our Web site — deutschefunds.com (click on "proxy voting"at the bottom of the page) — or on the SEC's Web site — sec.gov. To obtain a written copy of the Series' policies and procedures without charge, upon request, call us toll free at (800) 728-3337.
The Board of Trustees approved the renewal of DWS Bond VIP's investment management agreement (the "Agreement") with Deutsche Investment Management Americas Inc. ("DIMA") in September 2013.
In terms of the process that the Board followed prior to approving the Agreement, shareholders should know that:
In connection with the contract review process, the Contract Committee and the Board considered the factors discussed below, among others. The Board also considered that DIMA and its predecessors have managed the Fund since its inception, and the Board believes that a long-term relationship with a capable, conscientious advisor is in the best interests of the Fund. The Board considered, generally, that shareholders chose to invest or remain invested in the Fund knowing that DIMA managed the Fund, and that the Agreement was approved by the Fund's shareholders. DIMA is part of Deutsche Bank AG, a major global banking institution that is engaged in a wide range of financial services. The Board believes that there are advantages to being part of a global asset management business that offers a wide range of investing expertise and resources, including hundreds of portfolio managers and analysts with research capabilities in many countries throughout the world.
As part of the contract review process, the Board carefully considered the fees and expenses of each DWS fund overseen by the Board in light of the fund's performance. In many cases, this led to a negotiation with DIMA of lower expense caps as part of the 2012 and 2013 contract review processes than had previously been in place. As part of these negotiations, the Board indicated that it would consider relaxing these new lower caps in future years following sustained improvements in performance, among other considerations.
In June 2012, Deutsche Bank AG ("DB"), DIMA's parent company, announced that DB would combine its Asset Management (of which DIMA was a part) and Wealth Management divisions. DB has advised the Independent Trustees that the U.S. asset management business is a critical and integral part of DB, and that it has, and will continue to, reinvest a significant portion of the substantial savings it expects to realize by combining its Asset Management and Wealth Management divisions into the new Asset and Wealth Management ("AWM") division, including ongoing enhancements to its investment capabilities. DB also has confirmed its commitment to maintaining strong legal and compliance groups within the AWM division.
While shareholders may focus primarily on fund performance and fees, the Fund's Board considers these and many other factors, including the quality and integrity of DIMA's personnel and such other issues as back-office operations, fund valuations, and compliance policies and procedures.
The information considered by the Board as part of its review of management fees included information regarding fees charged by DIMA and its affiliates to similar institutional accounts and to similar funds offered primarily to European investors ("DWS Europe funds"), in each case as applicable. The Board observed that advisory fee rates for institutional accounts generally were lower than the management fees charged by similarly managed DWS U.S. mutual funds ("DWS Funds"), but also took note of the differences in services provided to DWS Funds as compared to institutional accounts. In the case of DWS Europe funds, the Board observed that fee rates for DWS Europe funds generally were higher than for similarly managed DWS Funds, but noted that differences in the types of services provided to DWS Funds relative to DWS Europe funds made it difficult to compare such fees.
On the basis of the information provided, the Board concluded that management fees were reasonable and appropriate in light of the nature, quality and extent of services provided by DIMA.
Based on all of the information considered and the conclusions reached, the Board unanimously determined that the continuation of the Agreement is in the best interests of the Fund. In making this determination, the Board did not give particular weight to any single factor identified above. The Board considered these factors over the course of numerous meetings, certain of which were in executive session with only the Independent Trustees and their independent counsel present. It is possible that individual Trustees may have weighed these factors differently in reaching their individual decisions to approve the continuation of the Agreement.
DeAWM Distributors, Inc.
June 30, 2014
Semiannual Report
Deutsche Variable Series I
(formerly DWS Variable Series I)
Deutsche Capital Growth VIP
(formerly DWS Capital Growth VIP)
Contents
9 Statement of Assets and Liabilities 9 Statement of Operations 10 Statement of Changes in Net Assets 13 Notes to Financial Statements 17 Information About Your Fund's Expenses 19 Advisory Agreement Board Considerations and Fee Evaluation |
This report must be preceded or accompanied by a prospectus. To obtain an additional prospectus or summary prospectus, if available, call (800) 728-3337 or your financial representative. We advise you to consider the Fund's objectives, risks, charges and expenses carefully before investing. The summary prospectus and prospectus contain this and other important information about the Fund. Please read the prospectus carefully before you invest.
The Fund may lend securities to approved institutions. Stocks may decline in value. See the prospectus for details.
Deutsche Asset & Wealth Management represents the asset management and wealth management activities conducted by Deutsche Bank AG or any of its subsidiaries, including the Advisor and DeAWM Distributors, Inc.
NOT FDIC/NCUA INSURED NO BANK GUARANTEE MAY LOSE VALUE NOT A DEPOSIT
NOT INSURED BY ANY FEDERAL GOVERNMENT AGENCY
Dear Shareholder:
I am very pleased to tell you that the DWS funds have been renamed Deutsche funds, aligning more closely with the Deutsche Asset & Wealth Management brand. We are proud to adopt the Deutsche name — a brand that fully represents the global access, discipline and intelligence that support all of our products and services.
Deutsche Asset & Wealth Management combines the asset management and wealth management divisions of Deutsche Bank to deliver a comprehensive suite of active, passive and alternative investment capabilities. Your investment in the Deutsche funds means you have access to the thought leadership and resources of one of the world’s largest and most influential financial institutions.
In conjunction with your fund’s name change, please note that the Deutsche funds’ Web address has changed as well. The former dws-investments.com is now deutschefunds.com.
In addition, key service providers have been renamed as follows:
| Former Name | New name, effective August 11, 2014 |
| DWS Investments Distributors, Inc. | DeAWM Distributors, Inc. |
| DWS Trust Company | DeAWM Trust Company |
| DWS Investments Service Company | DeAWM Service Company |
These changes have no effect on the day-to-day management of your investment, and there is no action required on your part. You will continue to experience the benefits that come from our decades of experience, in-depth research and worldwide network of investment professionals.
Thanks for your continued support. We appreciate your trust and the opportunity to put our capabilities to work for you.
Best regards,
Brian Binder
President, Deutsche Funds
Performance Summary June 30, 2014 (Unaudited)
Fund performance shown is historical, assumes reinvestment of all dividend and capital gain distributions, and does not guarantee future results. Investment return and principal value fluctuate with changing market conditions so that, when redeemed, shares may be worth more or less than their original cost. Current performance may be lower or higher than the performance data quoted. Please contact your participating insurance company for the Fund's most recent month-end performance. Performance doesn't reflect charges and fees ("contract charges") associated with the separate account that invests in the Fund or any variable life insurance policy or variable annuity contract for which the Fund is an investment option. These charges and fees will reduce returns. While all share classes have the same underlying portfolio, their performance will differ.
The gross expense ratios of the Fund, as stated in the fee table of the prospectus dated May 1, 2014 are 0.50% and 0.83% for Class A and Class B shares, respectively, and may differ from the expense ratios disclosed in the Financial Highlights tables in this report.
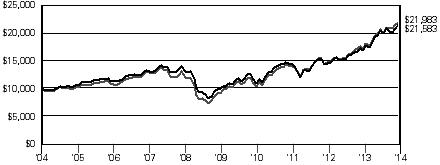
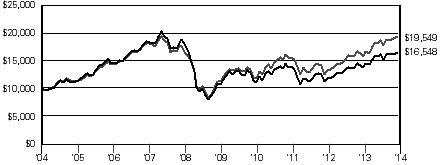
| Growth of an Assumed $10,000 Investment |
| The Russell 1000® Growth Index is an unmanaged, capitalization-weighted index containing those securities in the Russell 1000® Index with higher price-to-book ratios and higher forecasted growth values. Index returns do not reflect any fees or expenses and it is not possible to invest directly into an index. |
| |
| Yearly periods ended June 30 | |
| Comparative Results | |
| Deutsche Capital Growth VIP | | 6-Month‡ | | | 1-Year | | | 3-Year | | | 5-Year | | | 10-Year | |
| Class A | Growth of $10,000 | | $ | 10,497 | | | $ | 12,810 | | | $ | 15,117 | | | $ | 21,818 | | | $ | 21,583 | |
| Average annual total return | | | 4.97 | % | | | 28.10 | % | | | 14.77 | % | | | 16.89 | % | | | 8.00 | % |
| Russell 1000 Growth Index | Growth of $10,000 | | $ | 10,631 | | | $ | 12,692 | | | $ | 15,714 | | | $ | 24,104 | | | $ | 21,983 | |
| Average annual total return | | | 6.31 | % | | | 26.92 | % | | | 16.26 | % | | | 19.24 | % | | | 8.20 | % |
| Deutsche Capital Growth VIP | | 6-Month‡ | | | 1-Year | | | 3-Year | | | 5-Year | | | 10-Year | |
| Class B | Growth of $10,000 | | $ | 10,481 | | | $ | 12,764 | | | $ | 14,967 | | | $ | 21,467 | | | $ | 20,859 | |
| Average annual total return | | | 4.81 | % | | | 27.64 | % | | | 14.39 | % | | | 16.51 | % | | | 7.63 | % |
| Russell 1000 Growth Index | Growth of $10,000 | | $ | 10,631 | | | $ | 12,692 | | | $ | 15,714 | | | $ | 24,104 | | | $ | 21,983 | |
| Average annual total return | | | 6.31 | % | | | 26.92 | % | | | 16.26 | % | | | 19.24 | % | | | 8.20 | % |
The growth of $10,000 is cumulative.
‡ Total returns shown for periods less than one year are not annualized.
Portfolio Summary (Unaudited) Asset Allocation (As a % of Investment Portfolio excluding Securities Lending Collateral) | 6/30/14 | 12/31/13 |
| | | |
| Common Stocks | 98% | 100% |
| Cash Equivalents | 1% | 0% |
| Convertible Bond | 1% | — |
| | 100% | 100% |
Sector Diversification (As a % of Common Stocks and Convertible Bond) | 6/30/14 | 12/31/13 |
| | | |
| Information Technology | 28% | 26% |
| Consumer Discretionary | 19% | 21% |
| Health Care | 15% | 15% |
| Industrials | 12% | 13% |
| Consumer Staples | 10% | 10% |
| Financials | 6% | 5% |
| Energy | 5% | 4% |
| Materials | 5% | 5% |
| Utilities | 0% | 0% |
| Telecommunication Services | — | 1% |
| | 100% | 100% |
Portfolio holdings and characteristics are subject to change.
For more complete details about the Fund's investment portfolio, see page 6.
Following the Fund's fiscal first and third quarter-end, a complete portfolio holdings listing is filed with the SEC on Form N-Q. The form will be available on the SEC's Web site at sec.gov, and it also may be reviewed and copied at the SEC's Public Reference Room in Washington, D.C. Information on the operation of the SEC's Public Reference Room may be obtained by calling (800) SEC-0330. The Fund's portfolio holdings are also posted on deutschefunds.com from time to time. Please see the Fund's current prospectus for more information.
Owen Fitzpatrick, CFA
Lead Portfolio Manager
Thomas M. Hynes, Jr., CFA
Brendan O'Neill, CFA
Portfolio Managers
Investment Portfolio June 30, 2014 (Unaudited) | | | Shares | | | Value ($) | |
| | | | |
| Common Stocks 99.0% | |
| Consumer Discretionary 18.8% | |
| Auto Components 0.9% | |
| BorgWarner, Inc. (a) | | | 120,174 | | | | 7,834,143 | |
| Hotels, Restaurants & Leisure 3.6% | |
| Brinker International, Inc. (a) | | | 170,625 | | | | 8,300,906 | |
| Las Vegas Sands Corp. | | | 131,097 | | | | 9,992,214 | |
| Norwegian Cruise Line Holdings Ltd.* (a) | | | 70,620 | | | | 2,238,654 | |
| Starwood Hotels & Resorts Worldwide, Inc. | | | 124,593 | | | | 10,069,606 | |
| | | | | | | | 30,601,380 | |
| Internet & Catalog Retail 2.3% | |
| Amazon.com, Inc.* | | | 46,381 | | | | 15,063,621 | |
| Expedia, Inc. (a) | | | 54,254 | | | | 4,273,045 | |
| | | | | | | | 19,336,666 | |
| Media 3.2% | |
| Twenty-First Century Fox, Inc. "A" (a) | | | 409,221 | | | | 14,384,118 | |
| Walt Disney Co. (a) | | | 149,905 | | | | 12,852,855 | |
| | | | | | | | 27,236,973 | |
| Specialty Retail 4.8% | |
| Dick's Sporting Goods, Inc. | | | 171,893 | | | | 8,003,338 | |
| GNC Holdings, Inc. "A" | | | 87,993 | | | | 3,000,561 | |
| Home Depot, Inc. (a) | | | 232,652 | | | | 18,835,506 | |
| L Brands, Inc. | | | 190,059 | | | | 11,148,861 | |
| | | | | | | | 40,988,266 | |
| Textiles, Apparel & Luxury Goods 4.0% | |
| NIKE, Inc. "B" | | | 258,561 | | | | 20,051,406 | |
| VF Corp. | | | 213,978 | | | | 13,480,614 | |
| | | | | | | | 33,532,020 | |
| Consumer Staples 10.2% | |
| Beverages 2.2% | |
| PepsiCo, Inc. | | | 211,282 | | | | 18,875,934 | |
| Food & Staples Retailing 2.7% | |
| Costco Wholesale Corp. | | | 118,621 | | | | 13,660,394 | |
| Whole Foods Market, Inc. (a) | | | 231,276 | | | | 8,934,192 | |
| | | | | | | | 22,594,586 | |
| Food Products 4.0% | |
| Hillshire Brands Co. | | | 130,385 | | | | 8,122,986 | |
| Mead Johnson Nutrition Co. | | | 132,467 | | | | 12,341,950 | |
| Mondelez International, Inc. "A" | | | 364,700 | | | | 13,716,367 | |
| | | | | | | | 34,181,303 | |
| Personal Products 1.3% | |
| Estee Lauder Companies, Inc. "A" | | | 150,566 | | | | 11,181,031 | |
| Energy 5.1% | |
| Energy Equipment & Services 2.3% | |
| Halliburton Co. | | | 276,149 | | | | 19,609,341 | |
| Oil, Gas & Consumable Fuels 2.8% | |
| EOG Resources, Inc. | | | 69,683 | | | | 8,143,155 | |
| Noble Energy, Inc. | | | 95,512 | | | | 7,398,360 | |
| Pioneer Natural Resources Co. | | | 36,389 | | | | 8,362,556 | |
| | | | | | | | 23,904,071 | |
| | | Shares | | | Value ($) | |
| | | | | | | | | |
| Financials 5.8% | |
| Capital Markets 2.8% | |
| Affiliated Managers Group, Inc.* | | | 52,419 | | | | 10,766,863 | |
| Ameriprise Financial, Inc. | | | 59,749 | | | | 7,169,880 | |
| The Charles Schwab Corp. | | | 217,792 | | | | 5,865,138 | |
| | | | | | | | 23,801,881 | |
| Consumer Finance 1.4% | |
| Discover Financial Services | | | 185,368 | | | | 11,489,109 | |
| Diversified Financial Services 0.8% | |
| IntercontinentalExchange Group, Inc. | | | 37,489 | | | | 7,081,672 | |
| Real Estate Investment Trusts 0.8% | |
| Crown Castle International Corp. (REIT) | | | 94,735 | | | | 7,035,021 | |
| Health Care 15.1% | |
| Biotechnology 7.1% | |
| Celgene Corp.* (a) | | | 221,392 | | | | 19,013,145 | |
| Cepheid, Inc.* (a) | | | 140,015 | | | | 6,712,319 | |
| Gilead Sciences, Inc.* (a) | | | 190,380 | | | | 15,784,406 | |
| Medivation, Inc.* (a) | | | 111,797 | | | | 8,617,313 | |
| NPS Pharmaceuticals, Inc.* (a) | | | 307,514 | | | | 10,163,337 | |
| | | | | | | | 60,290,520 | |
| Health Care Equipment & Supplies 2.2% | |
| CareFusion Corp.* | | | 234,622 | | | | 10,405,486 | |
| St. Jude Medical, Inc. | | | 117,647 | | | | 8,147,055 | |
| | | | | | | | 18,552,541 | |
| Health Care Providers & Services 3.0% | |
| Express Scripts Holding Co.* (a) | | | 204,242 | | | | 14,160,098 | |
| McKesson Corp. | | | 52,963 | | | | 9,862,240 | |
| Premier, Inc. "A"* | | | 61,736 | | | | 1,790,344 | |
| | | | | | | | 25,812,682 | |
| Life Sciences Tools & Services 1.5% | |
| Thermo Fisher Scientific, Inc. | | | 104,611 | | | | 12,344,098 | |
| Pharmaceuticals 1.3% | |
| Allergan, Inc. | | | 33,039 | | | | 5,590,859 | |
| Bristol-Myers Squibb Co. | | | 118,778 | | | | 5,761,921 | |
| | | | | | | | 11,352,780 | |
| Industrials 11.9% | |
| Aerospace & Defense 2.3% | |
| Boeing Co. | | | 100,977 | | | | 12,847,303 | |
| TransDigm Group, Inc. (a) | | | 40,230 | | | | 6,728,870 | |
| | | | | | | | 19,576,173 | |
| Commercial Services & Supplies 0.7% | |
| Stericycle, Inc.* (a) | | | 51,075 | | | | 6,048,301 | |
| Electrical Equipment 1.9% | |
| AMETEK, Inc. | | | 245,924 | | | | 12,856,907 | |
| Regal-Beloit Corp. | | | 45,514 | | | | 3,575,580 | |
| | | | | | | | 16,432,487 | |
| Industrial Conglomerates 1.8% | |
| General Electric Co. | | | 186,675 | | | | 4,905,819 | |
| Roper Industries, Inc. (a) | | | 73,420 | | | | 10,720,054 | |
| | | | | | | | 15,625,873 | |
| Machinery 3.8% | |
| Dover Corp. (a) | | | 102,575 | | | | 9,329,196 | |
| Parker Hannifin Corp. (a) | | | 124,466 | | | | 15,649,110 | |
| SPX Corp. | | | 65,141 | | | | 7,048,908 | |
| | | | | | | | 32,027,214 | |
| | | Shares | | | Value ($) | |
| | | | | | | | | |
| Road & Rail 1.4% | |
| Norfolk Southern Corp. (a) | | | 113,121 | | | | 11,654,857 | |
| Information Technology 26.8% | |
| Communications Equipment 1.3% | |
| Ciena Corp.* (a) | | | 85,158 | | | | 1,844,522 | |
| Palo Alto Networks, Inc.* | | | 108,667 | | | | 9,111,728 | |
| | | | | | | | 10,956,250 | |
| Internet Software & Services 6.4% | |
| Facebook, Inc. "A"* | | | 200,255 | | | | 13,475,159 | |
| Google, Inc. "A"* | | | 30,937 | | | | 18,087,936 | |
| Google, Inc. "C"* | | | 31,091 | | | | 17,886,030 | |
| LinkedIn Corp. "A"* | | | 27,425 | | | | 4,702,565 | |
| | | | | | | | 54,151,690 | |
| IT Services 3.5% | |
| Accenture PLC "A" (a) | | | 60,256 | | | | 4,871,095 | |
| Cognizant Technology Solutions Corp. "A"* | | | 95,652 | | | | 4,678,339 | |
| Sabre Corp.* | | | 79,061 | | | | 1,585,173 | |
| Visa, Inc. "A" (a) | | | 90,194 | | | | 19,004,778 | |
| | | | | | | | 30,139,385 | |
| Semiconductors & Semiconductor Equipment 1.6% | |
| Avago Technologies Ltd. | | | 78,985 | | | | 5,692,449 | |
| NXP Semiconductor NV* | | | 58,052 | | | | 3,841,881 | |
| Xilinx, Inc. | | | 79,341 | | | | 3,753,623 | |
| | | | | | | | 13,287,953 | |
| Software 7.8% | |
| Intuit, Inc. | | | 79,207 | | | | 6,378,540 | |
| Microsoft Corp. | | | 457,007 | | | | 19,057,191 | |
| Oracle Corp. | | | 384,429 | | | | 15,580,907 | |
| Salesforce.com, Inc.* (a) | | | 67,644 | | | | 3,928,764 | |
| Solera Holdings, Inc. | | | 72,150 | | | | 4,844,872 | |
| Splunk, Inc.* (a) | | | 79,851 | | | | 4,418,156 | |
| VMware, Inc. "A"* (a) | | | 124,965 | | | | 12,097,862 | |
| | | | | | | | 66,306,292 | |
| Technology Hardware, Storage & Peripherals 6.2% | |
| Apple, Inc. | | | 484,353 | | | | 45,010,924 | |
| Western Digital Corp. | | | 86,591 | | | | 7,992,350 | |
| | | | | | | | 53,003,274 | |
| | | Shares | | | Value ($) | |
| | | | | | | | | |
| Materials 5.0% | |
| Chemicals 4.2% | |
| Ecolab, Inc. | | | 118,876 | | | | 13,235,654 | |
| LyondellBasell Industries NV "A" | | | 124,766 | | | | 12,183,400 | |
| Monsanto Co. | | | 81,754 | | | | 10,197,994 | |
| | | | | | | | 35,617,048 | |
| Containers & Packaging 0.8% | |
| Ball Corp. | | | 112,984 | | | | 7,081,837 | |
| Utilities 0.3% | |
| Water Utilities | |
| American Water Works Co., Inc. | | | 54,096 | | | | 2,675,047 | |
Total Common Stocks (Cost $527,775,879) | | | | 842,219,699 | |
| | | Principal Amount ($) | | | Value ($) | |
| | | | |
| Convertible Bond 0.5% | |
| Information Technology | |
| Workday, Inc., 1.5%, 7/15/2020 (Cost $4,031,861) | | | 3,382,000 | | | | 4,449,444 | |
| | | Shares | | | Value ($) | |
| | | | |
| Securities Lending Collateral 22.4% | |
| Daily Assets Fund Institutional, 0.08% (b) (c) (Cost $190,256,686) | | | 190,256,686 | | | | 190,256,686 | |
| | |
| Cash Equivalents 0.9% | |
| Central Cash Management Fund, 0.06% (b) (Cost $7,960,143) | | | 7,960,143 | | | | 7,960,143 | |
| | | % of Net Assets | | | Value ($) | |
| | | | |
Total Investment Portfolio (Cost $730,024,569)† | | | 122.8 | | | | 1,044,885,972 | |
| Other Assets and Liabilities, Net | | | (22.8 | ) | | | (193,997,184 | ) |
| Net Assets | | | 100.0 | | | | 850,888,788 | |
* Non-income producing security.
† The cost for federal income tax purposes was $730,908,662. At June 30, 2014, net unrealized appreciation for all securities based on tax cost was $313,977,310. This consisted of aggregate gross unrealized appreciation for all securities in which there was an excess of value over tax cost of $319,575,611 and aggregate gross unrealized depreciation for all securities in which there was an excess of tax cost over value of $5,598,301.
(a) All or a portion of these securities were on loan. In addition, "Other Assets and Liabilities, Net" may include pending sales that are also on loan. The value of securities loaned at June 30, 2014 amounted to $177,044,585, which is 20.8% of net assets.
(b) Affiliated fund managed by Deutsche Investment Management Americas Inc. The rate shown is the annualized seven-day yield at period end.
(c) Represents collateral held in connection with securities lending. Income earned by the Fund is net of borrower rebates.
REIT: Real Estate Investment Trust
Fair Value Measurements
Various inputs are used in determining the value of the Fund's investments. These inputs are summarized in three broad levels. Level 1 includes quoted prices in active markets for identical securities. Level 2 includes other significant observable inputs (including quoted prices for similar securities, interest rates, prepayment speeds and credit risk). Level 3 includes significant unobservable inputs (including the Fund's own assumptions in determining the fair value of investments). The level assigned to the securities valuations may not be an indication of the risk or liquidity associated with investing in those securities.
The following is a summary of the inputs used as of June 30, 2014 in valuing the Fund's investments. For information on the Fund's policy regarding the valuation of investments, please refer to the Security Valuation section of Note A in the accompanying Notes to Financial Statements.
| Assets | | Level 1 | | | Level 2 | | | Level 3 | | | Total | |
| | |
| Common Stocks (d) | | $ | 842,219,699 | | | $ | — | | | $ | — | | | $ | 842,219,699 | |
| Convertible Bond | | | — | | | | 4,449,444 | | | | — | | | | 4,449,444 | |
| Short-Term Investments (d) | | | 198,216,829 | | | | — | | | | — | | | | 198,216,829 | |
| Total | | $ | 1,040,436,528 | | | $ | 4,449,444 | | | $ | — | | | $ | 1,044,885,972 | |
There have been no transfers between fair value measurement levels during the period ended June 30, 2014.
(d) See Investment Portfolio for additional detailed categorizations.
The accompanying notes are an integral part of the financial statements.
Statement of Assets and Liabilities | as of June 30, 2014 (Unaudited) | |
| Assets | |
Investments: Investments in non-affiliated securities, at value (cost $531,807,740) — including $177,044,585 of securities loaned | | $ | 846,669,143 | |
| Investment in Daily Assets Fund Institutional (cost $190,256,686)* | | | 190,256,686 | |
| Investment in Central Cash Management Fund (cost $7,960,143) | | | 7,960,143 | |
| Total investments in securities, at value (cost $730,024,569) | | | 1,044,885,972 | |
| Cash | | | 9,479 | |
| Receivable for investments sold | | | 9,107,014 | |
| Receivable for Fund shares sold | | | 329,032 | |
| Dividends receivable | | | 426,547 | |
| Interest receivable | | | 28,843 | |
| Other assets | | | 5,074 | |
| Total assets | | | 1,054,791,961 | |
| Liabilities | |
| Payable upon return of securities loaned | | | 190,256,686 | |
| Payable for investments purchased | | | 12,482,431 | |
| Payable for Fund shares redeemed | | | 731,046 | |
| Accrued management fee | | | 258,371 | |
| Accrued Trustees' fees | | | 1,059 | |
| Other accrued expenses and payables | | | 173,580 | |
| Total liabilities | | | 203,903,173 | |
| Net assets, at value | | $ | 850,888,788 | |
| Net Assets Consist of | |
| Undistributed net investment income | | | 4,813,782 | |
Net unrealized appreciation (depreciation) on Investments | | | 314,861,403 | |
| Accumulated net realized gain (loss) | | | 52,612,491 | |
| Paid-in capital | | | 478,601,112 | |
| Net assets, at value | | $ | 850,888,788 | |
Class A Net Asset Value, offering and redemption price per share ($847,643,993 ÷ 30,458,731 outstanding shares of beneficial interest, $.01 par value, unlimited number of shares authorized) | | $ | 27.83 | |
Class B Net Asset Value, offering and redemption price per share ($3,244,795 ÷ 116,876 outstanding shares of beneficial interest, $.01 par value, unlimited number of shares authorized) | | $ | 27.76 | |
* Represents collateral on securities loaned.
The accompanying notes are an integral part of the financial statements.
Statement of Operations
| for the six months ended June 30, 2014 (Unaudited) | |
| Investment Income | |
Income: Dividends (net of foreign taxes withheld of $14,055) | | $ | 5,951,198 | |
| Income distributions — Central Cash Management Fund | | | 950 | |
| Interest | | | 12,367 | |
| Securities lending income, including income from Daily Assets Fund Institutional, net of borrower rebates | | | 27,663 | |
| Total income | | | 5,992,178 | |
Expenses: Management fee | | | 1,545,878 | |
| Administration fee | | | 415,037 | |
| Services to shareholders | | | 2,265 | |
| Record keeping fee (Class B) | | | 3,406 | |
| Distribution and service fees (Class B) | | | 12,098 | |
| Custodian fee | | | 11,251 | |
| Professional fees | | | 42,455 | |
| Reports to shareholders | | | 32,503 | |
| Trustees' fees and expenses | | | 16,567 | |
| Other | | | 13,946 | |
| Total expenses | | | 2,095,406 | |
| Net investment income (loss) | | | 3,896,772 | |
| Realized and Unrealized Gain (Loss) | |
Net realized gain (loss) from Investments | | | 78,176,841 | |
Change in net unrealized appreciation (depreciation) on: Investments | | | (42,126,125 | ) |
| Foreign currency | | | (4,925 | ) |
| | | | (42,131,050 | ) |
| Net gain (loss) | | | 36,045,791 | |
| Net increase (decrease) in net assets resulting from operations | | $ | 39,942,563 | |
The accompanying notes are an integral part of the financial statements.
Statement of Changes in Net Assets | Increase (Decrease) in Net Assets | | Six Months Ended June 30, 2014 (Unaudited) | | | Year Ended December 31, 2013 | |
Operations: Net investment income (loss) | | $ | 3,896,772 | | | $ | 6,538,509 | |
Operations: Net investment income (loss) | | $ | 3,896,772 | | | $ | 6,538,509 | |
| Net realized gain (loss) | | | 78,176,841 | | | | 111,903,826 | |
| Change in net unrealized appreciation (depreciation) | | | (42,131,050 | ) | | | 112,661,284 | |
| Net increase (decrease) in net assets resulting from operations | | | 39,942,563 | | | | 231,103,619 | |
Distributions to shareholders from: Net investment income: Class A | | | (5,280,971 | ) | | | (9,616,234 | ) |
| Class B | | | (41,098 | ) | | | (131,767 | ) |
Net realized gains: Class A | | | (48,279,027 | ) | | | — | |
| Class B | | | (767,015 | ) | | | — | |
| Total distributions | | | (54,368,111 | ) | | | (9,748,001 | ) |
Fund share transactions: Class A Proceeds from shares sold | | | 25,604,845 | | | | 14,066,914 | |
| Reinvestment of distributions | | | 53,559,998 | | | | 9,616,234 | |
| Payments for shares redeemed | | | (55,318,004 | ) | | | (105,034,979 | ) |
| Net increase (decrease) in net assets from Class A share transactions | | | 23,846,839 | | | | (81,351,831 | ) |
Class B Proceeds from shares sold | | | 805,057 | | | | 760,162 | |
| Reinvestment of distributions | | | 808,113 | | | | 131,767 | |
| Payments for shares redeemed | | | (11,132,378 | ) | | | (3,806,721 | ) |
| Net increase (decrease) in net assets from Class B share transactions | | | (9,519,208 | ) | | | (2,914,792 | ) |
| Increase (decrease) in net assets | | | (97,917 | ) | | | 137,088,995 | |
| Net assets at beginning of period | | | 850,986,705 | | | | 713,897,710 | |
| Net assets at end of period (including undistributed net investment income of $4,813,782 and $6,239,079, respectively) | | $ | 850,888,788 | | | $ | 850,986,705 | |
| Other Information | |
Class A Shares outstanding at beginning of period | | | 29,474,327 | | | | 32,798,165 | |
| Shares sold | | | 907,616 | | | | 570,579 | |
| Shares issued to shareholders in reinvestment of distributions | | | 2,074,361 | | | | 419,923 | |
| Shares redeemed | | | (1,997,573 | ) | | | (4,314,340 | ) |
| Net increase (decrease) in Class A shares | | | 984,404 | | | | (3,323,838 | ) |
| Shares outstanding at end of period | | | 30,458,731 | | | | 29,474,327 | |
Class B Shares outstanding at beginning of period | | | 484,326 | | | | 600,771 | |
| Shares sold | | | 28,660 | | | | 31,195 | |
| Shares issued to shareholders in reinvestment of distributions | | | 31,359 | | | | 5,764 | |
| Shares redeemed | | | (427,469 | ) | | | (153,404 | ) |
| Net increase (decrease) in Class B shares | | | (367,450 | ) | | | (116,445 | ) |
| Shares outstanding at end of period | | | 116,876 | | | | 484,326 | |
The accompanying notes are an integral part of the financial statements.
| | | | | | Years Ended December 31, | |
| Class A | | Six Months Ended 6/30/14 (Unaudited) | | | 2013 | | | 2012 | | | 2011 | | | 2010 | | | 2009 | |
| Selected Per Share Data | |
| Net asset value, beginning of period | | $ | 28.41 | | | $ | 21.38 | | | $ | 18.58 | | | $ | 19.59 | | | $ | 16.93 | | | $ | 13.55 | |
Income (loss) from investment operations: Net investment income (loss)a | | | .13 | | | | .21 | | | | .28 | | | | .17 | | | | .14 | c | | | .14 | |
| Net realized and unrealized gain (loss) | | | 1.14 | | | | 7.12 | | | | 2.70 | | | | (1.03 | ) | | | 2.68 | | | | 3.43 | |
| Total from investment operations | | | 1.27 | | | | 7.33 | | | | 2.98 | | | | (.86 | ) | | | 2.82 | | | | 3.57 | |
Less distributions from: Net investment income | | | (.18 | ) | | | (.30 | ) | | | (.18 | ) | | | (.15 | ) | | | (.16 | ) | | | (.19 | ) |
| Net realized gains | | | (1.67 | ) | | | — | | | | — | | | | — | | | | — | | | | — | |
| Total distributions | | | (1.85 | ) | | | (.30 | ) | | | (.18 | ) | | | (.15 | ) | | | (.16 | ) | | | (.19 | ) |
| Net asset value, end of period | | $ | 27.83 | | | $ | 28.41 | | | $ | 21.38 | | | $ | 18.58 | | | $ | 19.59 | | | $ | 16.93 | |
| Total Return (%) | | | 4.97 | ** | | | 34.65 | | | | 16.05 | | | | (4.47 | ) | | | 16.71 | b | | | 26.87 | b |
| Ratios to Average Net Assets and Supplemental Data | |
| Net assets, end of period ($ millions) | | | 848 | | | | 837 | | | | 701 | | | | 677 | | | | 729 | | | | 715 | |
| Ratio of expenses before expense reductions (%) | | | .50 | * | | | .50 | | | | .50 | | | | .50 | | | | .51 | | | | .51 | |
| Ratio of expenses after expense reductions (%) | | | .50 | * | | | .50 | | | | .50 | | | | .50 | | | | .51 | | | | .49 | |
| Ratio of net investment income (loss) (%) | | | .95 | * | | | .85 | | | | 1.32 | | | | .86 | | | | .78 | c | | | .98 | |
| Portfolio turnover rate (%) | | | 24 | ** | | | 37 | | | | 25 | | | | 47 | | | | 42 | | | | 76 | |
a Based on average shares outstanding during the period. b Total return would have been lower had certain expenses not been reduced. c Net investment income per share and ratio of net investment income include non-recurring dividend income amounting to $0.05 per share and 0.28% of average daily net assets for the year ended December 31, 2010. * Annualized ** Not annualized | |
| | | | | | Years Ended December 31, | |
| Class B | | Six Months Ended 6/30/14 (Unaudited) | | | 2013 | | | 2012 | | | 2011 | | | 2010 | | | 2009 | |
| Selected Per Share Data | |
| Net asset value, beginning of period | | $ | 28.29 | | | $ | 21.29 | | | $ | 18.51 | | | $ | 19.51 | | | $ | 16.86 | | | $ | 13.49 | |
Income (loss) from investment operations: Net investment income (loss)a | | | .05 | | | | .13 | | | | .20 | | | | .10 | | | | .08 | c | | | .09 | |
| Net realized and unrealized gain (loss) | | | 1.18 | | | | 7.10 | | | | 2.69 | | | | (1.02 | ) | | | 2.67 | | | | 3.43 | |
| Total from investment operations | | | 1.23 | | | | 7.23 | | | | 2.89 | | | | (.92 | ) | | | 2.75 | | | | 3.52 | |
Less distributions from: Net investment income | | | (.09 | ) | | | (.23 | ) | | | (.11 | ) | | | (.08 | ) | | | (.10 | ) | | | (.15 | ) |
| Net realized gains | | | (1.67 | ) | | | — | | | | — | | | | — | | | | — | | | | — | |
| Total distributions | | | (1.76 | ) | | | (.23 | ) | | | (.11 | ) | | | (.08 | ) | | | (.10 | ) | | | (.15 | ) |
| Net asset value, end of period | | $ | 27.76 | | | $ | 28.29 | | | $ | 21.29 | | | $ | 18.51 | | | $ | 19.51 | | | $ | 16.86 | |
| Total Return (%) | | | 4.81 | ** | | | 34.19 | | | | 15.61 | | | | (4.76 | ) | | | 16.33 | b | | | 26.49 | b |
| Ratios to Average Net Assets and Supplemental Data | |
| Net assets, end of period ($ millions) | | | 3 | | | | 14 | | | | 13 | | | | 13 | | | | 12 | | | | 12 | |
| Ratio of expenses before expense reductions (%) | | | .82 | * | | | .83 | | | | .83 | | | | .84 | | | | .85 | | | | .85 | |
| Ratio of expenses after expense reductions (%) | | | .82 | * | | | .83 | | | | .83 | | | | .84 | | | | .84 | | | | .82 | |
| Ratio of net investment income (loss) (%) | | | .36 | * | | | .52 | | | | .97 | | | | .52 | | | | .45 | c | | | .65 | |
| Portfolio turnover rate (%) | | | 24 | ** | | | 37 | | | | 25 | | | | 47 | | | | 42 | | | | 76 | |
a Based on average shares outstanding during the period. b Total return would have been lower had certain expenses not been reduced. c Net investment income per share and ratio of net investment income include non-recurring dividend income amounting to $0.05 per share and 0.28% of average daily net assets for the year ended December 31, 2010. * Annualized ** Not annualized | |
Notes to Financial Statements (Unaudited)
A. Organization and Significant Accounting Policies
Deutsche Variable Series I (formerly DWS Variable Series I) (the "Series") is registered under the Investment Company Act of 1940, as amended (the "1940 Act"), as an open-end, registered management investment company organized as a Massachusetts business trust. The Series consists of five diversified funds: Deutsche Bond VIP, Deutsche Core Equity VIP, Deutsche Capital Growth VIP, Deutsche Global Small Cap VIP and Deutsche International VIP (individually or collectively hereinafter referred to as a "Fund" or the "Funds" and formerly known as DWS Bond VIP, DWS Core Equity VIP, DWS Capital Growth VIP, DWS Global Small Cap Growth VIP and DWS International VIP, respectively). These financial statements report on Deutsche Capital Growth VIP. The Series is intended to be the underlying investment vehicle for variable annuity contracts and variable life insurance policies to be offered by the separate accounts of certain life insurance companies ("Participating Insurance Companies").
Multiple Classes of Shares of Beneficial Interest. The Fund offers two classes of shares (Class A shares and Class B shares). Class B shares are subject to Rule 12b-1 distribution fees under the 1940 Act and record keeping fees equal to an annual rate of 0.25% and up to 0.15%, respectively, of the average daily net assets of the Class B shares of the Fund. Class A shares are not subject to such fees.
Investment income, realized and unrealized gains and losses, and certain fund-level expenses and expense reductions, if any, are borne pro rata on the basis of relative net assets by the holders of all classes of shares, except that each class bears certain expenses unique to that class (including the applicable 12b-1 distribution fees and recordkeeping fees). Differences in class-level expenses may result in payment of different per share dividends by class. All shares have equal rights with respect to voting subject to class-specific arrangements.
The Fund's financial statements are prepared in accordance with accounting principles generally accepted in the United States of America, which require the use of management estimates. Actual results could differ from those estimates. The policies described below are followed consistently by the Fund in the preparation of its financial statements.
Security Valuation. Investments are stated at value determined as of the close of regular trading on the New York Stock Exchange on each day the exchange is open for trading.
Various inputs are used in determining the value of the Fund's investments. These inputs are summarized in three broad levels. Level 1 includes quoted prices in active markets for identical securities. Level 2 includes other significant observable inputs (including quoted prices for similar securities, interest rates, prepayment speeds and credit risk). Level 3 includes significant unobservable inputs (including the Fund's own assumptions in determining the fair value of investments). The level assigned to the securities valuations may not be an indication of the risk or liquidity associated with investing in those securities.
Equity securities are valued at the most recent sale price or official closing price reported on the exchange (U.S. or foreign) or over-the-counter market on which they trade. Securities for which no sales are reported are valued at the calculated mean between the most recent bid and asked quotations on the relevant market or, if a mean cannot be determined, at the most recent bid quotation. Equity securities are generally categorized as Level 1.
Investments in open-end investment companies are valued at their net asset value each business day and are categorized as Level 1.
Debt securities are valued at prices supplied by independent pricing services approved by the Fund's Board. Such services may use various pricing techniques which take into account appropriate factors such as yield, quality, coupon rate, maturity, type of issue, trading characteristics, prepayment speeds and other data, as well as broker quotes. If the pricing services are unable to provide valuations, debt securities are valued at the average of the most recent reliable bid quotations or evaluated prices, as applicable, obtained from broker-dealers. These securities are generally categorized as Level 2.
Securities and other assets for which market quotations are not readily available or for which the above valuation procedures are deemed not to reflect fair value are valued in a manner that is intended to reflect their fair value as determined in accordance with procedures approved by the Trustees and are generally categorized as Level 3. In accordance with the Fund's valuation procedures, factors considered in determining value may include, but are not limited to, the type of the security; the size of the holding; the initial cost of the security; the existence of any contractual restrictions on the security's disposition; the price and extent of public trading in similar securities of the issuer or of comparable companies; quotations or evaluated prices from broker-dealers and/or pricing services; information obtained from the issuer, analysts, and/or the appropriate stock exchange (for exchange-traded securities); an analysis of the company's or issuer's financial statements; an evaluation of the forces that influence the issuer and the market(s) in which the security is purchased and sold; and with respect to debt securities, the maturity, coupon, creditworthiness, currency denomination and the movement of the market in which the security is normally traded. The value determined under these procedures may differ from published values for the same securities.
Disclosure about the classification of fair value measurements is included in a table following the Fund's Investment Portfolio.
Securities Lending. Brown Brothers Harriman & Co., as lending agent, lends securities of the Fund to certain financial institutions under the terms of the Security Lending Agreement. The Fund retains the benefits of owning the securities it has loaned and continues to receive interest and dividends generated by the securities and to participate in any changes in their market value. The Fund requires the borrowers of the securities to maintain collateral with the Fund consisting of either cash or liquid, unencumbered assets having a value at least equal to the value of the securities loaned. When the collateral falls below specified amounts, the lending agent will use its best effort to obtain additional collateral on the next business day to meet required amounts under the security lending agreement. The Fund may invest the cash collateral into a joint trading account in an affiliated money market fund pursuant to Exemptive Orders issued by the SEC. The Fund receives compensation for lending its securities either in the form of fees or by earning interest on invested cash collateral net of borrower rebates and fees paid to a lending agent. Either the Fund or the borrower may terminate the loan. There may be risks of delay and costs in recovery of securities or even loss of rights in the collateral should the borrower of the securities fail financially. If the Fund is not able to recover securities lent, the Fund may sell the collateral and purchase a replacement investment in the market, incurring the risk that the value of the replacement security is greater than the value of the collateral. The Fund is also subject to all investment risks associated with the reinvestment of any cash collateral received, including, but not limited to, interest rate, credit and liquidity risk associated with such investments.
As of June 30, 2014, the Fund had securities on loan. The value of the related collateral exceeded the value of the securities loaned at period end.
Foreign Currency Translations. The books and records of the Fund are maintained in U.S. dollars. Investment securities and other assets and liabilities denominated in a foreign currency are translated into U.S. dollars at the prevailing exchange rates at period end. Purchases and sales of investment securities, income and expenses are translated into U.S. dollars at the prevailing exchange rates on the respective dates of the transactions.
Net realized and unrealized gains and losses on foreign currency transactions represent net gains and losses between trade and settlement dates on securities transactions, the acquisition and disposition of foreign currencies, and the difference between the amount of net investment income accrued and the U.S. dollar amount actually received. That portion of both realized and unrealized gains and losses on investments that results from fluctuations in foreign currency exchange rates is not separately disclosed but is included with net realized and unrealized gain/appreciation and loss/depreciation on investments.
Federal Income Taxes. The Fund is treated as a separate taxpayer as provided for in the Internal Revenue Code, as amended. It is the Fund's policy to comply with the requirements of the Internal Revenue Code, as amended, which are applicable to regulated investment companies, and to distribute all of its taxable income to the separate accounts of the Participating Insurance Companies which hold its shares.
Under the Regulated Investment Company Modernization Act of 2010, net capital losses incurred post-enactment may be carried forward indefinitely, and their character is retained as short-term and/or long-term. Previously, net capital losses were carried forward for eight years and treated as short-term. As a transition rule, the Act requires that post-enactment net capital losses be used before pre-enactment net capital losses.
At December 31, 2013, the Fund had a net tax basis capital loss carryforward of approximately $24,343,000 of pre-enactment losses, all of which was inherited from its merger with other affiliated funds in previous years, which may be applied against any realized net taxable capital gains of each succeeding year until fully utilized or until December 31, 2016, the expiration date, whichever occurs first, and which may be subject to certain limitations under Section 382–384 of the Internal Revenue Code.
The Fund has reviewed the tax positions for the open tax years as of December 31, 2013 and has determined that no provision for income tax and/or uncertain tax provisions is required in the Fund's financial statements. The Fund's federal tax returns for the prior three fiscal years remain open subject to examination by the Internal Revenue Service.
Distribution of Income and Gains. Distributions from net investment income of the Fund, if any, are declared and distributed to shareholders annually. Net realized gains from investment transactions, in excess of available capital loss carryforwards, would be taxable to the Fund if not distributed, and, therefore, will be distributed to shareholders at least annually. The Fund may also make additional distributions for tax purposes if necessary.
The timing and characterization of certain income and capital gain distributions are determined annually in accordance with federal tax regulations which may differ from accounting principles generally accepted in the United States of America. These differences primarily relate to certain securities sold at a loss. As a result, net investment income (loss) and net realized gain (loss) on investment transactions for a reporting period may differ significantly from distributions during such period. Accordingly, the Fund may periodically make reclassifications among certain of its capital accounts without impacting the net asset value of the Fund.
The tax character of current year distributions will be determined at the end of the current fiscal year.
Expenses. Expenses of the Series arising in connection with a specific Fund are allocated to that Fund. Other Series expenses which cannot be directly attributed to a Fund are apportioned among the Funds in the Series based upon the relative net assets or other appropriate measures.
Contingencies. In the normal course of business, the Fund may enter into contracts with service providers that contain general indemnification clauses. The Fund's maximum exposure under these arrangements is unknown as this would involve future claims that may be made against the Fund that have not yet been made. However, based on experience, the Fund expects the risk of loss to be remote.
Other. Investment transactions are accounted for on a trade date plus one basis for daily net asset value calculations. However, for financial reporting purposes, investment transactions are reported on trade date. Interest income is recorded on the accrual basis. Dividend income is recorded on the ex-dividend date net of foreign withholding taxes. Realized gains and losses from investment transactions are recorded on an identified cost basis. Proceeds from litigation payments, if any, are included in net realized gain (loss) from investments.
B. Purchases and Sales of Securities
During the six months ended June 30, 2014, purchases and sales of investment securities (excluding short-term investments) aggregated $200,414,878 and $238,297,667, respectively.
C. Related Parties
Management Agreement. Under the Investment Management Agreement with Deutsche Investment Management Americas Inc. ("DIMA" or the "Advisor"), an indirect, wholly owned subsidiary of Deutsche Bank AG, the Advisor directs the investments of the Fund in accordance with its investment objectives, policies and restrictions. The Advisor determines the securities, instruments and other contracts relating to investments to be purchased, sold or entered into by the Fund.
Pursuant to the Investment Management Agreement with the Advisor, the Fund pays a monthly management fee based on the Fund's average daily net assets, computed and accrued daily and payable monthly at the following annual rates:
| First $250 million of average daily net assets | | | .390 | % |
| Next $750 million of average daily net assets | | | .365 | % |
| Over $1 billion of average daily net assets | | | .340 | % |
Accordingly, for the six months ended June 30, 2014, the fee pursuant to the Investment Management Agreement was equivalent to an annualized effective rate (exclusive of any applicable waivers/reimbursements) of 0.37% of the Fund's average daily net assets.
For the period from January 1, 2014 through September 30, 2014, the Advisor has contractually agreed to waive all or a portion of its fees and/or reimburse certain operating expenses to the extent necessary to maintain the operating expenses (excluding certain expenses such as extraordinary expenses, taxes, brokerage and interest expense) of each class as follows:
Administration Fee. Pursuant to an Administrative Services Agreement, DIMA provides most administrative services to the Fund. For all services provided under the Administrative Services Agreement, the Fund pays the Advisor an annual fee ("Administration Fee") of 0.10% of the Fund's average daily net assets, computed and accrued daily and payable monthly. For the six months ended June 30, 2014, the Administration Fee was $415,037, of which $69,379 is unpaid.
Service Provider Fees. DeAWM Service Company ("DSC"), an affiliate of the Advisor, is the transfer agent, dividend-paying agent and shareholder service agent for the Fund. Pursuant to a sub-transfer agency agreement between DSC and DST Systems, Inc. ("DST"), DSC has delegated certain transfer agent, dividend-paying agent and shareholder service agent functions to DST. DSC compensates DST out of the shareholder servicing fee it receives from the Fund. For the six months ended June 30, 2014, the amounts charged to the Fund by DSC were as follows:
| Services to Shareholders | | Total Aggregated | | | Unpaid at June 30, 2014 | |
| Class A | | $ | 373 | | | $ | 185 | |
| Class B | | | 96 | | | | 52 | |
| | | $ | 469 | | | $ | 237 | |
Distribution Service Agreement. DeAWM Distributors, Inc. ("DDI"), also an affiliate of the Advisor, is the Series' Distributor. In accordance with the Master Distribution Plan, DDI receives 12b-1 fees of 0.25% of average daily net assets of Class B shares. Pursuant to the Master Distribution Plan, DDI remits these fees to the Participating Insurance Companies for various costs incurred or paid by these companies in connection with marketing and distribution of Class B shares. For the six months ended June 30, 2014, the Distribution Service Fee aggregated $12,098, of which $655 is unpaid.
Typesetting and Filing Service Fees. Under an agreement with DIMA, DIMA is compensated for providing typesetting and certain regulatory filing services to the Fund. For the six months ended June 30, 2014, the amount charged to the Fund by DIMA included in the Statement of Operations under "reports to shareholders" aggregated $6,849, of which $548 is unpaid.
Trustees' Fees and Expenses. The Fund paid retainer fees to each Trustee not affiliated with the Advisor, plus specified amounts to the Board Chairperson and Vice Chairperson and to each committee Chairperson.
Affiliated Cash Management Vehicles. The Fund may invest uninvested cash balances in Central Cash Management Fund and Deutsche Variable NAV Money Fund, affiliated money market funds which are managed by the Advisor. Each affiliated money market fund seeks to provide a high level of current income consistent with liquidity and the preservation of capital. Each affiliated money market fund is managed in accordance with Rule 2a-7 under the Investment Company Act of 1940, which governs the quality, maturity, diversity and liquidity of instruments in which a money market fund may invest. Central Cash Management Fund seeks to maintain a stable net asset value, and Deutsche Variable NAV Money Fund maintains a floating net asset value. The Fund indirectly bears its proportionate share of the expenses of each affiliated money market fund in which it invests. Central Cash Management Fund does not pay the Advisor an investment management fee. To the extent that Deutsche Variable NAV Money Fund pays an investment management fee to the Advisor, the Advisor will waive an amount of the investment management fee payable to the Advisor by the Fund equal to the amount of the investment management fee payable on the Fund's assets invested in Deutsche Variable NAV Money Fund.
D. Ownership of the Fund
At June 30, 2014, three participating insurance companies were owners of record of 10% or more of the total outstanding Class A shares of the Fund, each owning 30%, 26% and 12%, respectively. Two participating insurance companies were the owners of record of 10% or more of the total outstanding Class B shares of the Fund, each owning 80% and 11%, respectively.
E. Line of Credit
The Fund and other affiliated funds (the "Participants") share in a $400 million revolving credit facility provided by a syndication of banks. The Fund may borrow for temporary or emergency purposes, including the meeting of redemption requests that otherwise might require the untimely disposition of securities. The Participants are charged an annual commitment fee which is allocated based on net assets, among each of the Participants. Interest is calculated at a rate per annum equal to the sum of the Federal Funds Rate plus 1.25 percent plus if LIBOR exceeds the Federal Funds Rate the amount of such excess. The Fund may borrow up to a maximum of 33 percent of its net assets under the agreement. The Fund had no outstanding loans at June 30, 2014.
F. Fund Name Change
Effective August 11, 2014, the "DWS Funds" were rebranded "Deutsche Funds."
Information About Your Fund's Expenses (Unaudited)
As an investor of the Fund, you incur two types of costs: ongoing expenses and transaction costs. Ongoing expenses include management fees, distribution and service (12b-1) fees and other Fund expenses. Examples of transaction costs include contract charges and account maintenance fees, which are not shown in this section. The following tables are intended to help you understand your ongoing expenses (in dollars) of investing in the Fund and to help you compare these expenses with the ongoing expenses of investing in other mutual funds. The example in the table is based on an investment of $1,000 invested at the beginning of the six-month period and held for the entire period (January 1, 2014 to June 30, 2014).
The tables illustrate your Fund's expenses in two ways:
—Actual Fund Return. This helps you estimate the actual dollar amount of ongoing expenses (but not transaction costs) paid on a $1,000 investment in the Fund using the Fund's actual return during the period. To estimate the expenses you paid over the period, simply divide your account value by $1,000 (for example, an $8,600 account value divided by $1,000 = 8.6), then multiply the result by the number in the "Expenses Paid per $1,000" line under the share class you hold.
—Hypothetical 5% Fund Return. This helps you to compare your Fund's ongoing expenses (but not transaction costs) with those of other mutual funds using the Fund's actual expense ratio and a hypothetical rate of return of 5% per year before expenses. Examples using a 5% hypothetical Fund return may be found in the shareholder reports of other mutual funds. The hypothetical account values and expenses may not be used to estimate the actual ending account balance or expenses you paid for the period.
Please note that the expenses shown in these tables are meant to highlight your ongoing expenses only and do not reflect any transaction costs. The "Expenses Paid per $1,000" line of the tables is useful in comparing ongoing expenses only and will not help you determine the relative total expense of owning different funds. If these transaction costs had been included, your costs would have been higher.
Expenses and Value of a $1,000 Investment for the six months ended June 30, 2014 | |
| Actual Fund Return | | Class A | | | Class B | |
| Beginning Account Value 1/1/14 | | $ | 1,000.00 | | | $ | 1,000.00 | |
| Ending Account Value 6/30/14 | | $ | 1,049.70 | | | $ | 1,048.10 | |
| Expenses Paid per $1,000* | | $ | 2.54 | | | $ | 4.16 | |
| Hypothetical 5% Fund Return | | Class A | | | Class B | |
| Beginning Account Value 1/1/14 | | $ | 1,000.00 | | | $ | 1,000.00 | |
| Ending Account Value 6/30/14 | | $ | 1,022.32 | | | $ | 1,020.73 | |
| Expenses Paid per $1,000* | | $ | 2.51 | | | $ | 4.11 | |
* Expenses are equal to the Fund's annualized expense ratio for each share class, multiplied by the average account value over the period, multiplied by 181 (the number of days in the most recent six-month period), then divided by 365.
| Annualized Expense Ratios | Class A | | Class B | |
| Deutsche Variable Series I — Deutsche Capital Growth VIP | .50% | | .82% | |
For more information, please refer to the Fund's prospectus.
These tables do not reflect charges and fees ("contract charges") associated with the separate account that invests in the Fund or any variable life insurance policy or variable annuity contract for which the Fund is an investment option.
For an analysis of the fees associated with an investment in the fund or similar funds, please refer to the current and hypothetical expense calculators for Variable Insurance Products which can be found at deutschefunds.com/EN/resources/calculators.jsp.
The Series' policies and procedures for voting proxies for portfolio securities and information about how the Series voted proxies related to its portfolio securities during the 12-month period ended June 30 are available on our Web site — deutschefunds.com (click on "proxy voting"at the bottom of the page) — or on the SEC's Web site — sec.gov. To obtain a written copy of the Series' policies and procedures without charge, upon request, call us toll free at (800) 728-3337.
Advisory Agreement Board Considerations and Fee Evaluation
The Board of Trustees approved the renewal of DWS Capital Growth VIP's investment management agreement (the "Agreement") with Deutsche Investment Management Americas Inc. ("DIMA") in September 2013.
In terms of the process that the Board followed prior to approving the Agreement, shareholders should know that:
— In September 2013, all of the Fund's Trustees were independent of DIMA and its affiliates.
— The Trustees met frequently during the past year to discuss fund matters and dedicated a substantial amount of time to contract review matters. Over the course of several months, the Board's Contract Committee, in coordination with the Board's Equity Oversight Committee, reviewed comprehensive materials received from DIMA, independent third parties and independent counsel. These materials included an analysis of the Fund's performance, fees and expenses, and profitability compiled by a fee consultant retained by the Fund's Independent Trustees (the "Fee Consultant"). The Board also received extensive information throughout the year regarding performance of the Fund.
— The Independent Trustees regularly meet privately with their independent counsel to discuss contract review and other matters. In addition, the Independent Trustees were also advised by the Fee Consultant in the course of their review of the Fund's contractual arrangements and considered a comprehensive report prepared by the Fee Consultant in connection with their deliberations.
— In connection with reviewing the Agreement, the Board also reviewed the terms of the Fund's Rule 12b-1 plan, distribution agreement, administrative services agreement, transfer agency agreement and other material service agreements.
— Based on its evaluation of the information provided, the Contract Committee presented its findings and recommendations to the Board. The Board then reviewed the Contract Committee's findings and recommendations.
In connection with the contract review process, the Contract Committee and the Board considered the factors discussed below, among others. The Board also considered that DIMA and its predecessors have managed the Fund since its inception, and the Board believes that a long-term relationship with a capable, conscientious advisor is in the best interests of the Fund. The Board considered, generally, that shareholders chose to invest or remain invested in the Fund knowing that DIMA managed the Fund, and that the Agreement was approved by the Fund's shareholders. DIMA is part of Deutsche Bank AG, a major global banking institution that is engaged in a wide range of financial services. The Board believes that there are advantages to being part of a global asset management business that offers a wide range of investing expertise and resources, including hundreds of portfolio managers and analysts with research capabilities in many countries throughout the world.
As part of the contract review process, the Board carefully considered the fees and expenses of each DWS fund overseen by the Board in light of the fund's performance. In many cases, this led to a negotiation with DIMA of lower expense caps as part of the 2012 and 2013 contract review processes than had previously been in place. As part of these negotiations, the Board indicated that it would consider relaxing these new lower caps in future years following sustained improvements in performance, among other considerations.
In June 2012, Deutsche Bank AG ("DB"), DIMA's parent company, announced that DB would combine its Asset Management (of which DIMA was a part) and Wealth Management divisions. DB has advised the Independent Trustees that the U.S. asset management business is a critical and integral part of DB, and that it has, and will continue to, reinvest a significant portion of the substantial savings it expects to realize by combining its Asset Management and Wealth Management divisions into the new Asset and Wealth Management ("AWM") division, including ongoing enhancements to its investment capabilities. DB also has confirmed its commitment to maintaining strong legal and compliance groups within the AWM division.
While shareholders may focus primarily on fund performance and fees, the Fund's Board considers these and many other factors, including the quality and integrity of DIMA's personnel and such other issues as back-office operations, fund valuations, and compliance policies and procedures.
Nature, Quality and Extent of Services. The Board considered the terms of the Agreement, including the scope of advisory services provided under the Agreement. The Board noted that, under the Agreement, DIMA provides portfolio management services to the Fund and that, pursuant to a separate administrative services agreement, DIMA provides administrative services to the Fund. The Board considered the experience and skills of senior management and investment personnel, the resources made available to such personnel, the ability of DIMA to attract and retain high-quality personnel, and the organizational depth and stability of DIMA. The Board reviewed the Fund's performance over short-term and long-term periods and compared those returns to various agreed-upon performance measures, including market indices and a peer universe compiled by the Fee Consultant using information supplied by Morningstar Direct ("Morningstar"), an independent fund data service. The Board also noted that it has put into place a process of identifying "Focus Funds" (e.g., funds performing poorly relative to their benchmark or a peer universe compiled by an independent fund data service), and receives more frequent reporting and information from DIMA regarding such funds, along with DIMA's remedial plans to address underperformance. The Board believes this process is an effective manner of identifying and addressing underperforming funds. Based on the information provided, the Board noted that for the one-, three- and five-year periods ended December 31, 2012, the Fund's performance (Class A shares) was in the 2nd quartile, 3rd quartile and 2nd quartile, respectively, of the applicable Morningstar universe (the 1st quartile being the best performers and the 4th quartile being the worst performers). The Board also observed that the Fund has outperformed its benchmark in the one-year period and has underperformed its benchmark in the three- and five-year periods ended December 31, 2012.
Fees and Expenses. The Board considered the Fund's investment management fee schedule, operating expenses and total expense ratios, and comparative information provided by Lipper Inc. ("Lipper") and the Fee Consultant regarding investment management fee rates paid to other investment advisors by similar funds (1st quartile being the most favorable and 4th quartile being the least favorable). With respect to management fees paid to other investment advisors by similar funds, the Board noted that the contractual fee rates paid by the Fund, which include a 0.10% fee paid to DIMA under the Fund's administrative services agreement, were lower than the median (1st quartile) of the applicable Lipper peer group (based on Lipper data provided as of December 31, 2012). The Board noted that the Fund's Class A shares total (net) operating expenses were expected to be lower than the median (1st quartile) of the applicable Lipper expense universe (based on Lipper data provided as of December 31, 2012) ("Lipper Universe Expenses"). The Board also reviewed data comparing each share class's total (net) operating expenses to the applicable Lipper Universe Expenses. The Board considered the Fund's management fee rate as compared to fees charged by DIMA to comparable funds and considered differences between the Fund and the comparable funds. The Board also considered how the Fund's total (net) operating expenses compared to the total (net) operating expenses of a more customized peer group selected by Lipper (based on such factors as asset size).
The information considered by the Board as part of its review of management fees included information regarding fees charged by DIMA and its affiliates to similar institutional accounts and to similar funds offered primarily to European investors ("DWS Europe funds"), in each case as applicable. The Board observed that advisory fee rates for institutional accounts generally were lower than the management fees charged by similarly managed DWS U.S. mutual funds ("DWS Funds"), but also took note of the differences in services provided to DWS Funds as compared to institutional accounts. In the case of DWS Europe funds, the Board observed that fee rates for DWS Europe funds generally were higher than for similarly managed DWS Funds, but noted that differences in the types of services provided to DWS Funds relative to DWS Europe funds made it difficult to compare such fees.
On the basis of the information provided, the Board concluded that management fees were reasonable and appropriate in light of the nature, quality and extent of services provided by DIMA.
Profitability. The Board reviewed detailed information regarding revenues received by DIMA under the Agreement. The Board considered the estimated costs and pre-tax profits realized by DIMA from advising the DWS Funds, as well as estimates of the pre-tax profits attributable to managing the Fund in particular. The Board also received information regarding the estimated enterprise-wide profitability of DWS and its affiliates with respect to all fund services in totality and by fund. The Board and the Fee Consultant reviewed DIMA's methodology in allocating its costs to the management of the Fund. Based on the information provided, the Board concluded that the pre-tax profits realized by DIMA in connection with the management of the Fund were not unreasonable. The Board also reviewed information regarding the profitability of certain similar investment management firms. The Board noted that while information regarding the profitability of such firms is limited (and in some cases is not necessarily prepared on a comparable basis), DIMA and its affiliates' overall profitability with respect to the DWS fund complex (after taking into account distribution and other services provided to the funds by DIMA and its affiliates) was lower than the overall profitability levels of many comparable firms for which such data was available.
Economies of Scale. The Board considered whether there are economies of scale with respect to the management of the Fund and whether the Fund benefits from any economies of scale. The Board noted that the Fund's management fee schedule includes fee breakpoints. The Board concluded that the Fund's fee schedule represents an appropriate sharing between the Fund and DIMA of such economies of scale as may exist in the management of the Fund at current asset levels.
Other Benefits to DIMA and Its Affiliates. The Board also considered the character and amount of other incidental benefits received by DIMA and its affiliates, including any fees received by DIMA for administrative services provided to the Fund and any fees received by an affiliate of DIMA for distribution services. The Board also considered benefits to DIMA related to brokerage and soft-dollar allocations, including allocating brokerage to pay for research generated by parties other than the executing broker dealers, which pertain primarily to funds investing in equity securities, along with the incidental public relations benefits to DIMA related to DWS Funds advertising and cross-selling opportunities among DIMA products and services. The Board concluded that management fees were reasonable in light of these fallout benefits.
Compliance. The Board considered the significant attention and resources dedicated by DIMA to documenting and enhancing its compliance processes in recent years. The Board noted in particular (i) the experience and seniority of both DIMA's chief compliance officer and the Fund's chief compliance officer; (ii) the large number of DIMA compliance personnel; and (iii) the substantial commitment of resources by DIMA and its affiliates to compliance matters.
Based on all of the information considered and the conclusions reached, the Board unanimously determined that the continuation of the Agreement is in the best interests of the Fund. In making this determination, the Board did not give particular weight to any single factor identified above. The Board considered these factors over the course of numerous meetings, certain of which were in executive session with only the Independent Trustees and their independent counsel present. It is possible that individual Trustees may have weighed these factors differently in reaching their individual decisions to approve the continuation of the Agreement.
Notes
DeAWM Distributors, Inc.
222 South Riverside Plaza
Chicago, IL 60606
(800) 621-1148
VS1capgro-3 (R-028374-3 8/14)
June 30, 2014
Semiannual Report
Deutsche Variable Series I
(formerly DWS Variable Series I)
Deutsche Core Equity VIP
(formerly DWS Core Equity VIP)
Contents
8 Statement of Assets and Liabilities 9 Statement of Operations 10 Statement of Changes in Net Assets 13 Notes to Financial Statements 17 Information About Your Fund's Expenses 19 Advisory Agreement Board Considerations and Fee Evaluation |
This report must be preceded or accompanied by a prospectus. To obtain an additional prospectus or summary prospectus, if available, call (800) 728-3337 or your financial representative. We advise you to consider the Fund's objectives, risks, charges and expenses carefully before investing. The summary prospectus and prospectus contain this and other important information about the Fund. Please read the prospectus carefully before you invest.
Investing in derivatives entails special risks relating to liquidity, leverage and credit that may reduce returns and/or increase volatility. The Fund may lend securities to approved institutions. Fund management could be wrong in its analysis of industries, companies, economic trends and favor a security that underperforms the market. Stocks may decline in value. See the prospectus for details.
Deutsche Asset & Wealth Management represents the asset management and wealth management activities conducted by Deutsche Bank AG or any of its subsidiaries, including the Advisor and DeAWM Distributors, Inc.
NOT FDIC/NCUA INSURED NO BANK GUARANTEE MAY LOSE VALUE NOT A DEPOSIT
NOT INSURED BY ANY FEDERAL GOVERNMENT AGENCY
Dear Shareholder:
I am very pleased to tell you that the DWS funds have been renamed Deutsche funds, aligning more closely with the Deutsche Asset & Wealth Management brand. We are proud to adopt the Deutsche name — a brand that fully represents the global access, discipline and intelligence that support all of our products and services.
Deutsche Asset & Wealth Management combines the asset management and wealth management divisions of Deutsche Bank to deliver a comprehensive suite of active, passive and alternative investment capabilities. Your investment in the Deutsche funds means you have access to the thought leadership and resources of one of the world’s largest and most influential financial institutions.
In conjunction with your fund’s name change, please note that the Deutsche funds’ Web address has changed as well. The former dws-investments.com is now deutschefunds.com.
In addition, key service providers have been renamed as follows:
| Former Name | New name, effective August 11, 2014 |
| DWS Investments Distributors, Inc. | DeAWM Distributors, Inc. |
| DWS Trust Company | DeAWM Trust Company |
| DWS Investments Service Company | DeAWM Service Company |
These changes have no effect on the day-to-day management of your investment, and there is no action required on your part. You will continue to experience the benefits that come from our decades of experience, in-depth research and worldwide network of investment professionals.
Thanks for your continued support. We appreciate your trust and the opportunity to put our capabilities to work for you.
Best regards,
Brian Binder
President, Deutsche Funds
Performance Summary June 30, 2014 (Unaudited)
Fund performance shown is historical, assumes reinvestment of all dividend and capital gain distributions, and does not guarantee future results. Investment return and principal value fluctuate with changing market conditions so that, when redeemed, shares may be worth more or less than their original cost. Current performance may be lower or higher than the performance data quoted. Please contact your participating insurance company for the Fund's most recent month-end performance. Performance doesn't reflect charges and fees ("contract charges") associated with the separate account that invests in the Fund or any variable life insurance policy or variable annuity contract for which the Fund is an investment option. These charges and fees will reduce returns. While all share classes have the same underlying portfolio, their performance will differ.
The gross expense ratios of the Fund, as stated in the fee table of the prospectus dated May 1, 2014 are 0.56% and 0.76% for Class A and Class B shares, respectively, and may differ from the expense ratios disclosed in the Financial Highlights tables in this report.
| Growth of an Assumed $10,000 Investment |
| The Russell 1000® Index is an unmanaged index that measures the performance of the 1,000 largest companies in the Russell 3000® Index, which represents approximately 92% of the total market capitalization of the Russell 3000 Index. Index returns do not reflect any fees or expenses and it is not possible to invest directly into an index. |
| |
| Yearly periods ended June 30 | |
| Comparative Results | |
| Deutsche Core Equity VIP | | 6-Month‡ | | | 1-Year | | | 3-Year | | | 5-Year | | | 10-Year | |
| Class A | Growth of $10,000 | | $ | 10,560 | | | $ | 12,668 | | | $ | 15,430 | | | $ | 23,973 | | | $ | 20,710 | |
| Average annual total return | | | 5.60 | % | | | 26.68 | % | | | 15.56 | % | | | 19.11 | % | | | 7.55 | % |
Russell 1000® Index | Growth of $10,000 | | $ | 10,727 | | | $ | 12,535 | | | $ | 15,863 | | | $ | 24,117 | | | $ | 21,967 | |
| Average annual total return | | | 7.27 | % | | | 25.35 | % | | | 16.63 | % | | | 19.25 | % | | | 8.19 | % |
| Deutsche Core Equity VIP | | 6-Month‡ | | | 1-Year | | | 3-Year | | | 5-Year | | | 10-Year | |
| Class B | Growth of $10,000 | | $ | 10,548 | | | $ | 12,642 | | | $ | 15,312 | | | $ | 23,668 | | | $ | 20,168 | |
| Average annual total return | | | 5.48 | % | | | 26.42 | % | | | 15.26 | % | | | 18.80 | % | | | 7.27 | % |
Russell 1000® Index | Growth of $10,000 | | $ | 10,727 | | | $ | 12,535 | | | $ | 15,863 | | | $ | 24,117 | | | $ | 21,967 | |
| Average annual total return | | | 7.27 | % | | | 25.35 | % | | | 16.63 | % | | | 19.25 | % | | | 8.19 | % |
The growth of $10,000 is cumulative.
‡ Total returns shown for periods less than one year are not annualized.
Portfolio Summary (Unaudited) Asset Allocation (As a % of Investment Portfolio excluding Securities Lending Collateral) | 6/30/14 | 12/31/13 |
| | | |
| Common Stocks | 99% | 100% |
| Cash Equivalents | 1% | 0% |
| | 100% | 100% |
Sector Diversification (As a % of Common Stocks) | 6/30/14 | 12/31/13 |
| | | |
| Information Technology | 19% | 18% |
| Financials | 16% | 17% |
| Health Care | 15% | 16% |
| Consumer Discretionary | 13% | 14% |
| Industrials | 11% | 12% |
| Energy | 11% | 10% |
| Consumer Staples | 8% | 8% |
| Materials | 4% | 3% |
| Utilities | 2% | 1% |
| Telecommunication Services | 1% | 1% |
| | 100% | 100% |
Portfolio holdings and characteristics are subject to change.
For more complete details about the Fund's investment portfolio, see page 6.
Following the Fund's fiscal first and third quarter-end, a complete portfolio holdings listing is filed with the SEC on Form N-Q. The form will be available on the SEC's Web site at sec.gov, and it also may be reviewed and copied at the SEC's Public Reference Room in Washington, D.C. Information on the operation of the SEC's Public Reference Room may be obtained by calling (800) SEC-0330. The Fund's portfolio holdings are also posted on deutschefunds.com from time to time. Please see the Fund's current prospectus for more information.
Owen Fitzpatrick, CFA
Thomas M. Hynes, Jr., CFA
Brendan O'Neill, CFA
Pankaj Bhatnagar, PhD
Portfolio Managers
Investment Portfolio June 30, 2014 (Unaudited) | | | Shares | | | Value ($) | |
| | | | |
| Common Stocks 99.2% | |
| Consumer Discretionary 13.0% | |
| Auto Components 1.2% | |
| BorgWarner, Inc. (a) | | | 42,193 | | | | 2,750,562 | |
| Hotels, Restaurants & Leisure 1.6% | |
| Las Vegas Sands Corp. | | | 18,048 | | | | 1,375,619 | |
| Starwood Hotels & Resorts Worldwide, Inc. | | | 26,575 | | | | 2,147,791 | |
| | | | | | | | 3,523,410 | |
| Internet & Catalog Retail 1.6% | |
| Amazon.com, Inc.* | | | 7,303 | | | | 2,371,869 | |
| Expedia, Inc. (a) | | | 14,320 | | | | 1,127,843 | |
| | | | | | | | 3,499,712 | |
| Media 1.7% | |
| Twenty-First Century Fox, Inc. "A" | | | 54,343 | | | | 1,910,156 | |
| Walt Disney Co. (a) | | | 21,635 | | | | 1,854,985 | |
| | | | | | | | 3,765,141 | |
| Multiline Retail 0.7% | |
| Macy's, Inc. | | | 28,118 | | | | 1,631,406 | |
| Specialty Retail 3.5% | |
| Dick's Sporting Goods, Inc. | | | 38,993 | | | | 1,815,514 | |
| Home Depot, Inc. | | | 40,944 | | | | 3,314,827 | |
| L Brands, Inc. | | | 46,929 | | | | 2,752,855 | |
| | | | | | | | 7,883,196 | |
| Textiles, Apparel & Luxury Goods 2.7% | |
| NIKE, Inc. "B" | | | 53,735 | | | | 4,167,149 | |
| VF Corp. | | | 28,980 | | | | 1,825,740 | |
| | | | | | | | 5,992,889 | |
| Consumer Staples 8.5% | |
| Beverages 1.6% | |
| PepsiCo, Inc. | | | 40,343 | | | | 3,604,244 | |
| Food & Staples Retailing 2.3% | |
| Costco Wholesale Corp. | | | 21,048 | | | | 2,423,888 | |
| Kroger Co. | | | 22,995 | | | | 1,136,643 | |
| Whole Foods Market, Inc. (a) | | | 38,937 | | | | 1,504,136 | |
| | | | | | | | 5,064,667 | |
| Food Products 2.6% | |
| Hillshire Brands Co. | | | 24,577 | | | | 1,531,147 | |
| Kraft Foods Group, Inc. | | | 26,790 | | | | 1,606,060 | |
| Mead Johnson Nutrition Co. | | | 28,634 | | | | 2,667,830 | |
| | | | | | | | 5,805,037 | |
| Household Products 0.9% | |
| Procter & Gamble Co. | | | 25,519 | | | | 2,005,538 | |
| Personal Products 1.1% | |
| Estee Lauder Companies, Inc. "A" | | | 33,440 | | | | 2,483,254 | |
| Energy 11.0% | |
| Energy Equipment & Services 2.9% | |
| Halliburton Co. | | | 64,743 | | | | 4,597,400 | |
| Schlumberger Ltd. (a) | | | 16,485 | | | | 1,944,406 | |
| | | | | | | | 6,541,806 | |
| Oil, Gas & Consumable Fuels 8.1% | |
| Anadarko Petroleum Corp. | | | 39,777 | | | | 4,354,388 | |
| Antero Resources Corp.* (a) | | | 19,919 | | | | 1,307,284 | |
| Chevron Corp. | | | 42,639 | | | | 5,566,522 | |
| EOG Resources, Inc. | | | 27,756 | | | | 3,243,566 | |
| Pioneer Natural Resources Co. | | | 7,868 | | | | 1,808,145 | |
| | | Shares | | | Value ($) | |
| | | | | | | | | |
| Valero Energy Corp. | | | 34,350 | | | | 1,720,935 | |
| | | | | | | | 18,000,840 | |
| Financials 16.0% | |
| Banks 5.6% | |
| Citigroup, Inc. | | | 118,766 | | | | 5,593,878 | |
| JPMorgan Chase & Co. | | | 75,622 | | | | 4,357,340 | |
| Regions Financial Corp. | | | 231,156 | | | | 2,454,877 | |
| | | | | | | | 12,406,095 | |
| Capital Markets 4.6% | |
| Affiliated Managers Group, Inc.* | | | 19,384 | | | | 3,981,474 | |
| Ameriprise Financial, Inc. | | | 33,972 | | | | 4,076,640 | |
| The Charles Schwab Corp. (a) | | | 82,606 | | | | 2,224,579 | |
| | | | | | | | 10,282,693 | |
| Consumer Finance 2.1% | |
| Discover Financial Services | | | 75,303 | | | | 4,667,280 | |
| Diversified Financial Services 0.6% | |
| Intercontinental Exchange, Inc. | | | 7,278 | | | | 1,374,814 | |
| Insurance 1.9% | |
| Prudential Financial, Inc. | | | 48,837 | | | | 4,335,261 | |
| Real Estate Investment Trusts 1.2% | |
| Extra Space Storage, Inc. (REIT) | | | 51,413 | | | | 2,737,742 | |
| Health Care 14.9% | |
| Biotechnology 5.0% | |
| Celgene Corp.* (a) | | | 49,770 | | | | 4,274,248 | |
| Gilead Sciences, Inc.* | | | 34,321 | | | | 2,845,554 | |
| Medivation, Inc.* (a) | | | 22,711 | | | | 1,750,564 | |
| NPS Pharmaceuticals, Inc.* (a) | | | 67,530 | | | | 2,231,866 | |
| | | | | | | | 11,102,232 | |
| Health Care Equipment & Supplies 0.7% | |
| CareFusion Corp.* | | | 37,225 | | | | 1,650,929 | |
| Health Care Providers & Services 2.6% | |
| Express Scripts Holding Co.* | | | 51,432 | | | | 3,565,780 | |
| McKesson Corp. | | | 11,099 | | | | 2,066,745 | |
| Premier, Inc. "A"* | | | 7,123 | | | | 206,567 | |
| | | | | | | | 5,839,092 | |
| Life Sciences Tools & Services 1.9% | |
| Thermo Fisher Scientific, Inc. | | | 35,492 | | | | 4,188,056 | |
| Pharmaceuticals 4.7% | |
| Allergan, Inc. | | | 14,879 | | | | 2,517,824 | |
| Bristol-Myers Squibb Co. | | | 20,553 | | | | 997,026 | |
| Merck & Co., Inc. | | | 68,949 | | | | 3,988,700 | |
| Pfizer, Inc. | | | 101,641 | | | | 3,016,705 | |
| | | | | | | | 10,520,255 | |
| Industrials 11.2% | |
| Aerospace & Defense 2.2% | |
| Boeing Co. | | | 24,847 | | | | 3,161,284 | |
| TransDigm Group, Inc. | | | 10,671 | | | | 1,784,831 | |
| | | | | | | | 4,946,115 | |
| Electrical Equipment 2.1% | |
| AMETEK, Inc. | | | 63,741 | | | | 3,332,380 | |
| Regal-Beloit Corp. | | | 16,134 | | | | 1,267,487 | |
| | | | | | | | 4,599,867 | |
| | | Shares | | | Value ($) | |
| | | | | | | | | |
| Industrial Conglomerates 3.1% | |
| General Electric Co. | | | 147,795 | | | | 3,884,052 | |
| Roper Industries, Inc. | | | 21,179 | | | | 3,092,346 | |
| | | | | | | | 6,976,398 | |
| Machinery 2.3% | |
| Parker Hannifin Corp. | | | 21,031 | | | | 2,644,228 | |
| SPX Corp. | | | 23,100 | | | | 2,499,651 | |
| | | | | | | | 5,143,879 | |
| Road & Rail 1.5% | |
| Norfolk Southern Corp. | | | 31,374 | | | | 3,232,463 | |
| Information Technology 18.6% | |
| Communications Equipment 1.7% | |
| Alcatel-Lucent (ADR) | | | 299,173 | | | | 1,065,056 | |
| Ciena Corp.* | | | 22,041 | | | | 477,408 | |
| CommScope Holding Co., Inc.* | | | 54,177 | | | | 1,253,114 | |
| Palo Alto Networks, Inc.* | | | 11,191 | | | | 938,365 | |
| | | | | | | | 3,733,943 | |
| Internet Software & Services 4.3% | |
| Facebook, Inc. "A"* | | | 37,252 | | | | 2,506,687 | |
| Google, Inc. "A"* | | | 5,270 | | | | 3,081,211 | |
| Google, Inc. "C"* | | | 5,291 | | | | 3,043,807 | |
| Rackspace Hosting, Inc.* | | | 29,443 | | | | 991,051 | |
| | | | | | | | 9,622,756 | |
| IT Services 2.2% | |
| Cognizant Technology Solutions Corp. "A"* (a) | | | 24,716 | | | | 1,208,859 | |
| Sabre Corp.* | | | 20,455 | | | | 410,123 | |
| Visa, Inc. "A" (a) | | | 15,829 | | | | 3,335,329 | |
| | | | | | | | 4,954,311 | |
| Semiconductors & Semiconductor Equipment 0.8% | |
| Avago Technologies Ltd. | | | 15,526 | | | | 1,118,959 | |
| Xilinx, Inc. | | | 16,402 | | | | 775,978 | |
| | | | | | | | 1,894,937 | |
| Software 5.7% | |
| Intuit, Inc. | | | 18,066 | | | | 1,454,855 | |
| Microsoft Corp. | | | 74,350 | | | | 3,100,395 | |
| Oracle Corp. | | | 72,056 | | | | 2,920,430 | |
| Salesforce.com, Inc.* (a) | | | 17,663 | | | | 1,025,867 | |
| Solera Holdings, Inc. | | | 22,469 | | | | 1,508,793 | |
| VMware, Inc. "A"* (a) | | | 27,939 | | | | 2,704,775 | |
| | | | | | | | 12,715,115 | |
| | | Shares | | | Value ($) | |
| | | | | | | | | |
| Technology Hardware, Storage & Peripherals 3.9% | |
| Apple, Inc. | | | 73,995 | | | | 6,876,356 | |
| Western Digital Corp. | | | 19,427 | | | | 1,793,112 | |
| | | | | | | | 8,669,468 | |
| Materials 3.9% | |
| Chemicals 3.2% | |
| Ecolab, Inc. | | | 31,331 | | | | 3,488,394 | |
| LyondellBasell Industries NV "A" | | | 20,126 | | | | 1,965,304 | |
| Monsanto Co. | | | 13,187 | | | | 1,644,946 | |
| | | | | | | | 7,098,644 | |
| Containers & Packaging 0.7% | |
| Sealed Air Corp. | | | 48,023 | | | | 1,640,946 | |
| Telecommunication Services 0.5% | |
| Wireless Telecommunication Services | |
| T-Mobile U.S., Inc.* | | | 33,378 | | | | 1,122,168 | |
| Utilities 1.6% | |
| Electric Utilities 0.6% | |
| NextEra Energy, Inc. | | | 12,008 | | | | 1,230,580 | |
| Water Utilities 1.0% | |
| American Water Works Co., Inc. | | | 45,370 | | | | 2,243,546 | |
Total Common Stocks (Cost $185,131,362) | | | | 221,481,287 | |
| | | Principal Amount ($) | | | Value ($) | |
| | | | |
| Convertible Bond 0.1% | |
| Health Care | |
| Cepheid, Inc., 144A, 1.25%, 2/1/2021 (Cost $184,000) | | | 184,000 | | | | 189,980 | |
| | | Shares | | | Value ($) | |
| | | | |
| Securities Lending Collateral 9.4% | |
| Daily Assets Fund Institutional, 0.08% (b) (c) (Cost $20,880,703) | | | 20,880,703 | | | | 20,880,703 | |
| | |
| Cash Equivalents 0.6% | |
| Central Cash Management Fund, 0.06% (b) (Cost $1,296,746) | | | 1,296,746 | | | | 1,296,746 | |
| | | % of Net Assets | | | Value ($) | |
| | | | |
Total Investment Portfolio (Cost $207,492,811)† | | | 109.3 | | | | 243,848,716 | |
| Other Assets and Liabilities, Net | | | (9.3 | ) | | | (20,660,412 | ) |
| Net Assets | | | 100.0 | | | | 223,188,304 | |
* Non-income producing security.
† The cost for federal income tax purposes was $207,672,598. At June 30, 2014, net unrealized appreciation for all securities based on tax cost was $36,176,118. This consisted of aggregate gross unrealized appreciation for all securities in which there was an excess of value over tax cost of $38,464,178 and aggregate gross unrealized depreciation for all securities in which there was an excess of tax cost over value of $2,288,060.
(a) All or a portion of these securities were on loan. In addition, "Other Assets and Liabilities, Net" may include pending sales that are also on loan. The value of securities loaned at June 30, 2014 amounted to $18,328,303, which is 8.2% of net assets.
(b) Affiliated fund managed by Deutsche Investment Management Americas Inc. The rate shown is the annualized seven-day yield at period end.
(c) Represents collateral held in connection with securities lending. Income earned by the Fund is net of borrower rebates.
144A: Security exempt from registration under Rule 144A of the Securities Act of 1933. These securities may be resold in transactions exempt from registration, normally to qualified institutional buyers.
ADR: American Depositary Receipt
REIT: Real Estate Investment Trust
Fair Value Measurements
Various inputs are used in determining the value of the Fund's investments. These inputs are summarized in three broad levels. Level 1 includes quoted prices in active markets for identical securities. Level 2 includes other significant observable inputs (including quoted prices for similar securities, interest rates, prepayment speeds and credit risk). Level 3 includes significant unobservable inputs (including the Fund's own assumptions in determining the fair value of investments). The level assigned to the securities valuations may not be an indication of the risk or liquidity associated with investing in those securities.
The following is a summary of the inputs used as of June 30, 2014 in valuing the Fund's investments. For information on the Fund's policy regarding the valuation of investments, please refer to the Security Valuation section of Note A in the accompanying Notes to Financial Statements.
| Assets | | Level 1 | | | Level 2 | | | Level 3 | | | Total | |
| | |
| Common Stocks (d) | | $ | 221,481,287 | | | $ | — | | | $ | — | | | $ | 221,481,287 | |
| Convertible Bond | | | — | | | | 189,980 | | | | — | | | | 189,980 | |
| Short-Term Investments (d) | | | 22,177,449 | | | | — | | | | — | | | | 22,177,449 | |
| Total | | $ | 243,658,736 | | | $ | 189,980 | | | $ | — | | | $ | 243,848,716 | |
There have been no transfers between fair value measurement levels during the period ended June 30, 2014.
(d) See Investment Portfolio for additional detailed categorizations.
The accompanying notes are an integral part of the financial statements.
Statement of Assets and Liabilities | as of June 30, 2014 (Unaudited) | |
| Assets | |
Investments: Investments in non-affiliated securities, at value (cost $185,315,362) — including $18,328,303 of securities loaned | | $ | 221,671,267 | |
| Investment in Daily Assets Fund Institutional (cost $20,880,703)* | | | 20,880,703 | |
| Investment in Central Cash Management Fund (cost $1,296,746) | | | 1,296,746 | |
| Total investments in securities, at value (cost $207,492,811) | | | 243,848,716 | |
| Cash | | | 276,775 | |
| Receivable for investments sold | | | 714,905 | |
| Receivable for Fund shares sold | | | 45,893 | |
| Dividends receivable | | | 152,240 | |
| Interest receivable | | | 1,555 | |
| Other assets | | | 1,886 | |
| Total assets | | | 245,041,970 | |
| Liabilities | |
| Payable upon return of securities loaned | | | 20,880,703 | |
| Payable for investments purchased | | | 690,507 | |
| Payable for Fund shares redeemed | | | 123,938 | |
| Accrued management fee | | | 71,233 | |
| Accrued Trustees' fees | | | 77 | |
| Other accrued expenses and payables | | | 87,208 | |
| Total liabilities | | | 21,853,666 | |
| Net assets, at value | | $ | 223,188,304 | |
| Net Assets Consist of | |
| Undistributed net investment income | | | 1,085,923 | |
| Net unrealized appreciation (depreciation) on investments | | | 36,355,905 | |
| Accumulated net realized gain (loss) | | | (9,944,335 | ) |
| Paid-in capital | | | 195,690,811 | |
| Net assets, at value | | $ | 223,188,304 | |
Class A Net Asset Value, offering and redemption price per share ($221,357,123 ÷ 18,365,965 outstanding shares of beneficial interest, $.01 par value, unlimited number of shares authorized) | | $ | 12.05 | |
Class B Net Asset Value, offering and redemption price per share ($1,831,181 ÷ 151,958 outstanding shares of beneficial interest, $.01 par value, unlimited number of shares authorized) | | $ | 12.05 | |
* Represents collateral on securities loaned.
The accompanying notes are an integral part of the financial statements.
Statement of Operations
| for the six months ended June 30, 2014 (Unaudited) | |
| Investment Income | |
Income: Dividends (net of foreign taxes withheld of $1,475) | | $ | 1,798,493 | |
| Interest | | | 901 | |
| Income distributions — Central Cash Management Fund | | | 171 | |
| Securities lending income, including income from Daily Assets Fund Institutional, net of borrower rebates | | | 3,422 | |
| Total income | | | 1,802,987 | |
Expenses: Management fee | | | 423,677 | |
| Administration fee | | | 108,635 | |
| Services to shareholders | | | 1,764 | |
| Distribution service fee (Class B) | | | 2,234 | |
| Custodian fee | | | 15,299 | |
| Professional fees | | | 37,014 | |
| Reports to shareholders | | | 23,385 | |
| Trustees' fees and expenses | | | 5,634 | |
| Other | | | 5,412 | |
| Total expenses | | | 623,054 | |
| Net investment income | | | 1,179,933 | |
| Realized and Unrealized Gain (Loss) | |
| Net realized gain (loss) from investments | | | 7,304,512 | |
| Change in net unrealized appreciation (depreciation) on investments | | | 3,464,963 | |
| Net gain (loss) | | | 10,769,475 | |
| Net increase (decrease) in net assets resulting from operations | | $ | 11,949,408 | |
The accompanying notes are an integral part of the financial statements.
Statement of Changes in Net Assets | Increase (Decrease) in Net Assets | | Six Months Ended June 30, 2014 (Unaudited) | | | Year Ended December 31, 2013 | |
Operations: Net investment income | | $ | 1,179,933 | | | $ | 2,438,537 | |
Operations: Net investment income | | $ | 1,179,933 | | | $ | 2,438,537 | |
| Net realized gain (loss) | | | 7,304,512 | | | | 48,316,584 | |
| Change in net unrealized appreciation (depreciation) | | | 3,464,963 | | | | 13,479,342 | |
| Net increase (decrease) in net assets resulting from operations | | | 11,949,408 | | | | 64,234,463 | |
Distributions to shareholders from: Net investment income: Class A | | | (2,373,232 | ) | | | (2,931,105 | ) |
| Class B | | | (16,034 | ) | | | (20,449 | ) |
| Total distributions | | | (2,389,266 | ) | | | (2,951,554 | ) |
Fund share transactions: Class A Proceeds from shares sold | | | 3,604,157 | | | | 12,066,669 | |
| Reinvestment of distributions | | | 2,373,232 | | | | 2,931,105 | |
| Payments for shares redeemed | | | (17,306,150 | ) | | | (32,588,778 | ) |
| Net increase (decrease) in net assets from Class A share transactions | | | (11,328,761 | ) | | | (17,591,004 | ) |
Class B Proceeds from shares sold | | | 9,705 | | | | 61,298 | |
| Reinvestment of distributions | | | 16,034 | | | | 20,449 | |
| Payments for shares redeemed | | | (141,350 | ) | | | (347,419 | ) |
| Net increase (decrease) in net assets from Class B share transactions | | | (115,611 | ) | | | (265,672 | ) |
| Increase (decrease) in net assets | | | (1,884,230 | ) | | | 43,426,233 | |
| Net assets at beginning of period | | | 225,072,534 | | | | 181,646,301 | |
| Net assets at end of period (including undistributed net investment income of $1,085,923 and $2,295,256, respectively) | | $ | 223,188,304 | | | $ | 225,072,534 | |
| Other Information | |
Class A Shares outstanding at beginning of period | | | 19,342,719 | | | | 21,101,010 | |
| Shares sold | | | 313,245 | | | | 1,197,826 | |
| Shares issued to shareholders in reinvestment of distributions | | | 210,580 | | | | 308,213 | |
| Shares redeemed | | | (1,500,579 | ) | | | (3,264,330 | ) |
| Net increase (decrease) in Class A shares | | | (976,754 | ) | | | (1,758,291 | ) |
| Shares outstanding at end of period | | | 18,365,965 | | | | 19,342,719 | |
Class B Shares outstanding at beginning of period | | | 161,956 | | | | 188,843 | |
| Shares sold | | | 837 | | | | 5,908 | |
| Shares issued to shareholders in reinvestment of distributions | | | 1,423 | | | | 2,148 | |
| Shares redeemed | | | (12,258 | ) | | | (34,943 | ) |
| Net increase (decrease) in Class B shares | | | (9,998 | ) | | | (26,887 | ) |
| Shares outstanding at end of period | | | 151,958 | | | | 161,956 | |
The accompanying notes are an integral part of the financial statements.
| | | | | | Years Ended December 31, | |
| Class A | | Six Months Ended 6/30/14 (Unaudited) | | | 2013 | | | 2012 | | | 2011 | | | 2010 | | | 2009 | |
| Selected Per Share Data | |
| Net asset value, beginning of period | | $ | 11.54 | | | $ | 8.53 | | | $ | 7.46 | | | $ | 7.56 | | | $ | 6.71 | | | $ | 5.12 | |
Income (loss) from investment operations: Net investment incomea | | | .06 | | | | .12 | | | | .15 | | | | .10 | | | | .09 | | | | .10 | |
| Net realized and unrealized gain (loss) | | | .58 | | | | 3.03 | | | | 1.03 | | | | (.10 | ) | | | .87 | | | | 1.61 | |
| Total from investment operations | | | .64 | | | | 3.15 | | | | 1.18 | | | | .00 | | | | .96 | | | | 1.71 | |
Less distributions from: Net investment income | | | (.13 | ) | | | (.14 | ) | | | (.11 | ) | | | (.10 | ) | | | (.11 | ) | | | (.12 | ) |
| Net asset value, end of period | | $ | 12.05 | | | $ | 11.54 | | | $ | 8.53 | | | $ | 7.46 | | | $ | 7.56 | | | $ | 6.71 | |
| Total Return (%) | | | 5.60 | ** | | | 37.33 | | | | 15.81 | | | | (.14 | ) | | | 14.40 | b | | | 34.15 | b |
| Ratios to Average Net Assets and Supplemental Data | |
| Net assets, end of period ($ millions) | | | 221 | | | | 223 | | | | 180 | | | | 85 | | | | 98 | | | | 101 | |
| Ratio of expenses before expense reductions (%) | | | .57 | * | | | .56 | | | | .59 | | | | .63 | | | | .63 | | | | .63 | |
| Ratio of expenses after expense reductions (%) | | | .57 | * | | | .56 | | | | .59 | | | | .63 | | | | .60 | | | | .54 | |
| Ratio of net investment income (%) | | | 1.09 | * | | | 1.20 | | | | 1.90 | | | | 1.25 | | | | 1.32 | | | | 1.74 | |
| Portfolio turnover rate (%) | | | 26 | ** | | | 238 | | | | 307 | | | | 215 | | | | 145 | | | | 82 | |
a Based on average shares outstanding during the period. b Total return would have been lower had certain expenses not been reduced. * Annualized ** Not annualized | |
| | | | | | Years Ended December 31, | |
| Class B | | Six Months Ended 6/30/14 (Unaudited) | | | 2013 | | | 2012 | | | 2011 | | | 2010 | | | 2009 | |
| Selected Per Share Data | |
| Net asset value, beginning of period | | $ | 11.53 | | | $ | 8.51 | | | $ | 7.45 | | | $ | 7.55 | | | $ | 6.70 | | | $ | 5.12 | |
Income (loss) from investment operations: Net investment incomea | | | .05 | | | | .10 | | | | .11 | | | | .08 | | | | .07 | | | | .08 | |
| Net realized and unrealized gain (loss) | | | .57 | | | | 3.03 | | | | 1.03 | | | | (.10 | ) | | | .87 | | | | 1.60 | |
| Total from investment operations | | | .62 | | | | 3.13 | | | | 1.14 | | | | (.02 | ) | | | .94 | | | | 1.68 | |
Less distributions from: Net investment income | | | (.10 | ) | | | (.11 | ) | | | (.08 | ) | | | (.08 | ) | | | (.09 | ) | | | (.10 | ) |
| Net asset value, end of period | | $ | 12.05 | | | $ | 11.53 | | | $ | 8.51 | | | $ | 7.45 | | | $ | 7.55 | | | $ | 6.70 | |
| Total Return (%) | | | 5.48 | ** | | | 37.10 | | | | 15.41 | | | | (.40 | ) | | | 14.12 | b | | | 33.64 | b |
| Ratios to Average Net Assets and Supplemental Data | |
| Net assets, end of period ($ millions) | | | 2 | | | | 2 | | | | 2 | | | | 2 | | | | 2 | | | | 2 | |
| Ratio of expenses before expense reductions (%) | | | .83 | * | | | .76 | | | | .90 | | | | .88 | | | | .88 | | | | .89 | |
| Ratio of expenses after expense reductions (%) | | | .83 | * | | | .76 | | | | .90 | | | | .88 | | | | .85 | | | | .80 | |
| Ratio of net investment income (%) | | | .83 | * | | | 1.00 | | | | 1.41 | | | | .99 | | | | 1.07 | | | | 1.48 | |
| Portfolio turnover rate (%) | | | 26 | ** | | | 238 | | | | 307 | | | | 215 | | | | 145 | | | | 82 | |
a Based on average shares outstanding during the period. b Total return would have been lower had certain expenses not been reduced. * Annualized ** Not annualized | |
Notes to Financial Statements (Unaudited)
A. Organization and Significant Accounting Policies
Deutsche Variable Series I (formerly DWS Variable Series I) (the "Series") is registered under the Investment Company Act of 1940, as amended (the "1940 Act"), as an open-end, registered management investment company organized as a Massachusetts business trust. The Series consists of five diversified funds: Deutsche Bond VIP, Deutsche Core Equity VIP, Deutsche Capital Growth VIP, Deutsche Global Small Cap VIP and Deutsche International VIP (individually or collectively hereinafter referred to as a "Fund" or the "Funds" and formerly known as DWS Bond VIP, DWS Core Equity VIP, DWS Capital Growth VIP, DWS Global Small Cap Growth VIP and DWS International VIP, respectively). These financial statements report on Deutsche Core Equity VIP. The Series is intended to be the underlying investment vehicle for variable annuity contracts and variable life insurance policies to be offered by the separate accounts of certain life insurance companies ("Participating Insurance Companies").
Multiple Classes of Shares of Beneficial Interest. The Fund offers two classes of shares (Class A shares and Class B shares). Class B shares are subject to Rule 12b-1 distribution fees under the 1940 Act and recordkeeping fees equal to an annual rate of 0.25% and up to 0.15%, respectively, of the average daily net assets of the Class B shares of the Fund. Class A shares are not subject to such fees.
Investment income, realized and unrealized gains and losses, and certain fund-level expenses and expense reductions, if any, are borne pro rata on the basis of relative net assets by the holders of all classes of shares, except that each class bears certain expenses unique to that class (including the applicable 12b-1 distribution fees and recordkeeping fees). Differences in class-level expenses may result in payment of different per share dividends by class. All shares have equal rights with respect to voting subject to class-specific arrangements.
The Fund's financial statements are prepared in accordance with accounting principles generally accepted in the United States of America, which require the use of management estimates. Actual results could differ from those estimates. The policies described below are followed consistently by the Fund in the preparation of its financial statements.
Security Valuation. Investments are stated at value determined as of the close of regular trading on the New York Stock Exchange on each day the exchange is open for trading.
Various inputs are used in determining the value of the Fund's investments. These inputs are summarized in three broad levels. Level 1 includes quoted prices in active markets for identical securities. Level 2 includes other significant observable inputs (including quoted prices for similar securities, interest rates, prepayment speeds and credit risk). Level 3 includes significant unobservable inputs (including the Fund's own assumptions in determining the fair value of investments). The level assigned to the securities valuations may not be an indication of the risk or liquidity associated with investing in those securities.
Equity securities are valued at the most recent sale price or official closing price reported on the exchange (U.S. or foreign) or over-the-counter market on which they trade. Securities for which no sales are reported are valued at the calculated mean between the most recent bid and asked quotations on the relevant market or, if a mean cannot be determined, at the most recent bid quotation. Equity securities are generally categorized as Level 1.
Investments in open-end investment companies are valued at their net asset value each business day and are categorized as Level 1.
Debt securities are valued at prices supplied by independent pricing services approved by the Fund's Board. Such services may use various pricing techniques which take into account appropriate factors such as yield, quality, coupon rate, maturity, type of issue, trading characteristics, prepayment speeds and other data, as well as broker quotes. If the pricing services are unable to provide valuations, debt securities are valued at the average of the most recent reliable bid quotations or evaluated prices, as applicable, obtained from broker-dealers are valued at the mean of the most recent bid and ask quotations or evaluated prices, as applicable, obtained from broker-dealers. These securities are generally categorized as Level 2.
Securities and other assets for which market quotations are not readily available or for which the above valuation procedures are deemed not to reflect fair value are valued in a manner that is intended to reflect their fair value as determined in accordance with procedures approved by the Trustees and are generally categorized as Level 3. In accordance with the Fund's valuation procedures, factors used in determining value may include, but are not limited to, the type of the security; the size of the holding; the initial cost of the security; the existence of any contractual restrictions on the security's disposition; the price and extent of public trading in similar securities of the issuer or of comparable companies; quotations or evaluated prices from broker-dealers and/or pricing services; information obtained from the issuer, analysts, and/or the appropriate stock exchange (for exchange-traded securities); an analysis of the company's or issuer's financial statements; an evaluation of the forces that influence the issuer and the market(s) in which the security is purchased and sold; and with respect to debt securities, the maturity, coupon, creditworthiness, currency denomination and the movement of the market in which the security is normally traded. The value determined under these procedures may differ from published values for the same securities.
Disclosure about the classification of fair value measurements is included in a table following the Fund's Investment Portfolio.
Securities Lending. Brown Brothers Harriman & Co., as lending agent, lends securities of the Fund to certain financial institutions under the terms of the Security Lending Agreement. The Fund retains the benefits of owning the securities it has loaned and continues to receive interest and dividends generated by the securities and to participate in any changes in their market value. The Fund requires the borrowers of the securities to maintain collateral with the Fund consisting of either cash or liquid, unencumbered assets having a value at least equal to the value of the securities loaned. When the collateral falls below specified amounts, the lending agent will use its best effort to obtain additional collateral on the next business day to meet required amounts under the security lending agreement. The Fund may invest the cash collateral into a joint trading account in an affiliated money market fund pursuant to Exemptive Orders issued by the SEC. The Fund receives compensation for lending its securities either in the form of fees or by earning interest on invested cash collateral net of borrower rebates and fees paid to a lending agent. Either the Fund or the borrower may terminate the loan. There may be risks of delay and costs in recovery of securities or even loss of rights in the collateral should the borrower of the securities fail financially. If the Fund is not able to recover securities lent, the Fund may sell the collateral and purchase a replacement investment in the market, incurring the risk that the value of the replacement security is greater than the value of the collateral. The Fund is also subject to all investment risks associated with the reinvestment of any cash collateral received, including, but not limited to, interest rate, credit and liquidity risk associated with such investments.
As of June 30, 2014, the Fund had securities on loan. The value of the related collateral exceeded the value of the securities loaned at period end.
Foreign Currency Translations. The books and records of the Fund are maintained in U.S. dollars. Investment securities and other assets and liabilities denominated in a foreign currency are translated into U.S. dollars at the prevailing exchange rates at period end. Purchases and sales of investment securities, income and expenses are translated into U.S. dollars at the prevailing exchange rates on the respective dates of the transactions.
Net realized and unrealized gains and losses on foreign currency transactions represent net gains and losses between trade and settlement dates on securities transactions, the acquisition and disposition of foreign currencies, and the difference between the amount of net investment income accrued and the U.S. dollar amount actually received. That portion of both realized and unrealized gains and losses on investments that results from fluctuations in foreign currency exchange rates is not separately disclosed but is included with net realized and unrealized gain/appreciation and loss/depreciation on investments.
Federal Income Taxes. The Fund is treated as a separate taxpayer as provided for in the Internal Revenue Code, as amended. It is the Fund's policy to comply with the requirements of the Internal Revenue Code, as amended, which are applicable to regulated investment companies, and to distribute all of its taxable income to the separate accounts of the Participating Insurance Companies which hold its shares.
Under the Regulated Investment Company Modernization Act of 2010, net capital losses incurred post-enactment may be carried forward indefinitely, and their character is retained as short-term and/or long-term. Previously, net capital losses were carried forward for eight years and treated as short-term losses. As a transition rule, the Act requires that post-enactment net capital losses be used before pre-enactment net capital losses.
At December 31, 2013, the Fund had a net tax basis capital loss carryforward of approximately $17,069,000 of pre-enactment losses, which may be applied against any realized net taxable capital gains of each succeeding year until fully utilized or until December 31, 2017, the expiration date, whichever occurs first, and which may be subject to certain limitations under Sections 381–84 of the Internal Revenue Code.
The Fund has reviewed the tax positions for the open tax years as of December 31, 2013 and has determined that no provision for income tax and/or uncertain tax provisions is required in the Fund's financial statements. The Fund's federal tax returns for the prior three fiscal years remain open subject to examination by the Internal Revenue Service.
Distribution of Income and Gains. Distributions from net investment income of the Fund, if any, are declared and distributed to shareholders annually. Net realized gains from investment transactions, in excess of available capital loss carryforwards, would be taxable to the Fund if not distributed, and, therefore, will be distributed to shareholders at least annually. The Fund may also make additional distributions for tax purposes if necessary.
The timing and characterization of certain income and capital gain distributions are determined annually in accordance with federal tax regulations which may differ from accounting principles generally accepted in the United States of America. These differences primarily relate to certain securities sold at a loss. As a result, net investment income (loss) and net realized gain (loss) on investment transactions for a reporting period may differ significantly from distributions during such period. Accordingly, the Fund may periodically make reclassifications among certain of its capital accounts without impacting the net asset value of the Fund.
The tax character of current year distributions will be determined at the end of the current fiscal year.
Expenses. Expenses of the Series arising in connection with a specific Fund are allocated to that Fund. Other Series expenses which cannot be directly attributed to a Fund are apportioned among the Funds in the Series based upon the relative net assets or other appropriate measures.
Contingencies. In the normal course of business, the Fund may enter into contracts with service providers that contain general indemnification clauses. The Fund's maximum exposure under these arrangements is unknown as this would involve future claims that may be made against the Fund that have not yet been made. However, based on experience, the Fund expects the risk of loss to be remote.
Other. Investment transactions are accounted for on a trade date plus one basis for daily net asset value calculations. However, for financial reporting purposes, investment transactions are reported on trade date. Interest income is recorded on the accrual basis. Dividend income is recorded on the ex-dividend date net of foreign withholding taxes. Realized gains and losses from investment transactions are recorded on an identified cost basis. Proceeds from litigation payments, if any, are included in net realized gain (loss) from investments.
B. Purchases and Sales of Securities
During the six months ended June 30, 2014, purchases and sales of investment securities (excluding short-term investments) aggregated $56,005,744 and $69,630,817, respectively.
C. Related Parties
Management Agreement. Under the Investment Management Agreement with Deutsche Investment Management Americas Inc. ("DIMA" or the "Advisor"), an indirect, wholly owned subsidiary of Deutsche Bank AG, the Advisor directs the investments of the Fund in accordance with its investment objectives, policies and restrictions. The Advisor determines the securities, instruments and other contracts relating to investments to be purchased, sold or entered into by the Fund.
Pursuant to the Investment Management Agreement with the Advisor, the Fund pays a monthly management fee based on the Fund's average daily net assets, computed and accrued daily and payable monthly, at the following annual rates:
| First $250 million of average daily net assets | | | .390 | % |
| Next $750 million of average daily net assets | | | .365 | % |
| Over $1 billion of average daily net assets | | | .340 | % |
Accordingly, for the six months ended June 30, 2014, the fee pursuant to the Investment Management Agreement was equivalent to an annualized effective rate (exclusive of any applicable waivers/reimbursements) of 0.39% of the Fund's average daily net assets.
For the period from January 1, 2014 through September 30, 2014, the Advisor has contractually agreed to waive its fee and/or reimburse certain operating expenses of the Fund to the extent necessary to maintain the operating expenses (excluding certain expenses such as extraordinary expenses, taxes, brokerage and interest expense) of each class as follows:
Administration Fee. Pursuant to an Administrative Services Agreement, DIMA provides most administrative services to the Fund. For all services provided under the Administrative Services Agreement, the Fund pays the Advisor an annual fee ("Administration Fee") of 0.10% of the Fund's average daily net assets, computed and accrued daily and payable monthly. For the six months ended June 30, 2014, the Administration Fee was $108,635, of which $18,265 is unpaid.
Service Provider Fees. DeAWM Service Company ("DSC"), an affiliate of the Advisor, is the transfer agent, dividend-paying agent and shareholder service agent for the Fund. Pursuant to a sub-transfer agency agreement between DSC and DST Systems, Inc. ("DST"), DSC has delegated certain transfer agent, dividend-paying agent and shareholder service agent functions to DST. DSC compensates DST out of the shareholder servicing fee it receives from the Fund. For the six months ended June 30, 2014, the amounts charged to the Fund by DSC were as follows:
| Services to Shareholders | | Total Aggregated | | | Unpaid at June 30, 2014 | |
| Class A | | $ | 276 | | | $ | 133 | |
| Class B | | | 40 | | | | 20 | |
| | | $ | 316 | | | $ | 153 | |
Distribution Service Agreement. DeAWM Distributors, Inc. ("DDI"), also an affiliate of the Advisor, is the Series' Distributor. In accordance with the Master Distribution Plan, DDI receives 12b-1 fees of 0.25% of average daily net assets of Class B shares. Pursuant to the Master Distribution Plan, DDI remits these fees to the Participating Insurance Companies for various costs incurred or paid by these companies in connection with marketing and distribution of Class B shares. For the six months ended June 30, 2014, the Distribution Service Fee aggregated $2,234, of which $375 is unpaid.
Typesetting and Filing Service Fees. Under an agreement with DIMA, DIMA is compensated for providing typesetting and certain regulatory filing services to the Fund. For the six months ended June 30, 2014, the amount charged to the Fund by DIMA included in the Statement of Operations under "reports to shareholders" aggregated $10,141, of which $3,911 is unpaid.
Trustees' Fees and Expenses. The Fund paid retainer fees to each Trustee not affiliated with the Advisor, plus specified amounts to the Board Chairperson and Vice Chairperson and to each committee Chairperson.
Affiliated Cash Management Vehicles. The Fund may invest uninvested cash balances in Central Cash Management Fund and Deutsche Variable NAV Money Fund, affiliated money market funds which are managed by the Advisor. Each affiliated money market fund seeks to provide a high level of current income consistent with liquidity and the preservation of capital. Each affiliated money market fund is managed in accordance with Rule 2a-7 under the Investment Company Act of 1940, which governs the quality, maturity, diversity and liquidity of instruments in which a money market fund may invest. Central Cash Management Fund seeks to maintain a stable net asset value, and Deutsche Variable NAV Money Fund maintains a floating net asset value. The Fund indirectly bears its proportionate share of the expenses of each affiliated money market fund in which it invests. Central Cash Management Fund does not pay the Advisor an investment management fee. To the extent that Deutsche Variable NAV Money Fund pays an investment management fee to the Advisor, the Advisor will waive an amount of the investment management fee payable to the Advisor by the Fund equal to the amount of the investment management fee payable on the Fund's assets invested in Deutsche Variable NAV Money Fund.
D. Ownership of the Fund
At June 30, 2014, two participating insurance companies were owners of record of 10% or more of the total outstanding Class A shares of the Fund, each owning 43% and 32%, respectively. Two participating insurance companies were owners of record of 10% or more of the total outstanding Class B shares of the Fund, each owning 82% and 15%, respectively.
E. Line of Credit
The Fund and other affiliated funds (the "Participants") share in a $400 million revolving credit facility provided by a syndication of banks. The Fund may borrow for temporary or emergency purposes, including the meeting of redemption requests that otherwise might require the untimely disposition of securities. The Participants are charged an annual commitment fee which is allocated based on net assets, among each of the Participants. Interest is calculated at a rate per annum equal to the sum of the Federal Funds Rate plus 1.25 percent plus if LIBOR exceeds the Federal Funds Rate the amount of such excess. The Fund may borrow up to a maximum of 33 percent of its net assets under the agreement. The Fund had no outstanding loans at June 30, 2014.
F. Fund Name Change
Effective August 11, 2014, the "DWS Funds" were rebranded "Deutsche Funds."
Information About Your Fund's Expenses (Unaudited)
As an investor of the Fund, you incur two types of costs: ongoing expenses and transaction costs. Ongoing expenses include management fees, distribution and service (12b-1) fees and other Fund expenses. Examples of transaction costs include contract charges, redemption fees and account maintenance fees, which are not shown in this section. The following tables are intended to help you understand your ongoing expenses (in dollars) of investing in the Fund and to help you compare these expenses with the ongoing expenses of investing in other mutual funds. The example in the table is based on an investment of $1,000 invested at the beginning of the six-month period and held for the entire period (January 1, 2014 to June 30, 2014).
The tables illustrate your Fund's expenses in two ways:
—Actual Fund Return. This helps you estimate the actual dollar amount of ongoing expenses (but not transaction costs) paid on a $1,000 investment in the Fund using the Fund's actual return during the period. To estimate the expenses you paid over the period, simply divide your account value by $1,000 (for example, an $8,600 account value divided by $1,000 = 8.6), then multiply the result by the number in the "Expenses Paid per $1,000" line under the share class you hold.
—Hypothetical 5% Fund Return. This helps you to compare your Fund's ongoing expenses (but not transaction costs) with those of other mutual funds using the Fund's actual expense ratio and a hypothetical rate of return of 5% per year before expenses. Examples using a 5% hypothetical Fund return may be found in the shareholder reports of other mutual funds. The hypothetical account values and expenses may not be used to estimate the actual ending account balance or expenses you paid for the period.
Please note that the expenses shown in these tables are meant to highlight your ongoing expenses only and do not reflect any transaction costs. The "Expenses Paid per $1,000" line of the tables is useful in comparing ongoing expenses only and will not help you determine the relative total expense of owning different funds. If these transaction costs had been included, your costs would have been higher.
Expenses and Value of a $1,000 Investment for the six months ended June 30, 2014 | |
| Actual Fund Return | | Class A | | | Class B | |
| Beginning Account Value 1/1/14 | | $ | 1,000.00 | | | $ | 1,000.00 | |
| Ending Account Value 6/30/14 | | $ | 1,056.00 | | | $ | 1,054.80 | |
| Expenses Paid per $1,000* | | $ | 2.91 | | | $ | 4.23 | |
| Hypothetical 5% Portfolio Return | | Class A | | | Class B | |
| Beginning Account Value 1/1/14 | | $ | 1,000.00 | | | $ | 1,000.00 | |
| Ending Account Value 6/30/14 | | $ | 1,021.97 | | | $ | 1,020.68 | |
| Expenses Paid per $1,000* | | $ | 2.86 | | | $ | 4.16 | |
* Expenses are equal to the Fund's annualized expense ratio for each share class, multiplied by the average account value over the period, multiplied by 181 (the number of days in the most recent six-month period), then divided by 365.
| Annualized Expense Ratios | Class A | | Class B | |
| Deutsche Variable Series I — Deutsche Core Equity VIP | .57% | | .83% | |
For more information, please refer to the Fund's prospectus.
These tables do not reflect charges and fees ("contract charges") associated with the separate account that invests in the Fund or any variable life insurance policy or variable annuity contract for which the Fund is an investment option.
For an analysis of the fees associated with an investment in the fund or similar funds, please refer to the current and hypothetical expense calculators for Variable Insurance Products which can be found at deutschefunds.com/EN/resources/calculators.jsp.
The Series' policies and procedures for voting proxies for portfolio securities and information about how the Series voted proxies related to its portfolio securities during the 12-month period ended June 30 are available on our Web site — deutschefunds.com (click on "proxy voting"at the bottom of the page) — or on the SEC's Web site — sec.gov. To obtain a written copy of the Series' policies and procedures without charge, upon request, call us toll free at (800) 728-3337.
Advisory Agreement Board Considerations and Fee Evaluation
The Board of Trustees approved the renewal of DWS Core Equity VIP's investment management agreement (the "Agreement") with Deutsche Investment Management Americas Inc. ("DIMA") in September 2013.
In terms of the process that the Board followed prior to approving the Agreement, shareholders should know that:
— In September 2013, all of the Fund's Trustees were independent of DIMA and its affiliates.
— The Trustees met frequently during the past year to discuss fund matters and dedicated a substantial amount of time to contract review matters. Over the course of several months, the Board's Contract Committee, in coordination with the Board's Fixed Income and Asset Allocation Oversight Committee, reviewed comprehensive materials received from DIMA, independent third parties and independent counsel. These materials included an analysis of the Fund's performance, fees and expenses, and profitability compiled by a fee consultant retained by the Fund's Independent Trustees (the "Fee Consultant"). The Board also received extensive information throughout the year regarding performance of the Fund.
— The Independent Trustees regularly meet privately with their independent counsel to discuss contract review and other matters. In addition, the Independent Trustees were also advised by the Fee Consultant in the course of their review of the Fund's contractual arrangements and considered a comprehensive report prepared by the Fee Consultant in connection with their deliberations.
— In connection with reviewing the Agreement, the Board also reviewed the terms of the Fund's Rule 12b-1 plan, distribution agreement, administrative services agreement, transfer agency agreement and other material service agreements.
— Based on its evaluation of the information provided, the Contract Committee presented its findings and recommendations to the Board. The Board then reviewed the Contract Committee's findings and recommendations.
In connection with the contract review process, the Contract Committee and the Board considered the factors discussed below, among others. The Board also considered that DIMA and its predecessors have managed the Fund since its inception, and the Board believes that a long-term relationship with a capable, conscientious advisor is in the best interests of the Fund. The Board considered, generally, that shareholders chose to invest or remain invested in the Fund knowing that DIMA managed the Fund, and that the Agreement was approved by the Fund's shareholders. DIMA is part of Deutsche Bank AG, a major global banking institution that is engaged in a wide range of financial services. The Board believes that there are advantages to being part of a global asset management business that offers a wide range of investing expertise and resources, including hundreds of portfolio managers and analysts with research capabilities in many countries throughout the world.
As part of the contract review process, the Board carefully considered the fees and expenses of each DWS fund overseen by the Board in light of the fund's performance. In many cases, this led to a negotiation with DIMA of lower expense caps as part of the 2012 and 2013 contract review processes than had previously been in place. As part of these negotiations, the Board indicated that it would consider relaxing these new lower caps in future years following sustained improvements in performance, among other considerations.
In June 2012, Deutsche Bank AG ("DB"), DIMA's parent company, announced that DB would combine its Asset Management (of which DIMA was a part) and Wealth Management divisions. DB has advised the Independent Trustees that the U.S. asset management business is a critical and integral part of DB, and that it has, and will continue to, reinvest a significant portion of the substantial savings it expects to realize by combining its Asset Management and Wealth Management divisions into the new Asset and Wealth Management ("AWM") division, including ongoing enhancements to its investment capabilities. DB also has confirmed its commitment to maintaining strong legal and compliance groups within the AWM division.
While shareholders may focus primarily on fund performance and fees, the Fund's Board considers these and many other factors, including the quality and integrity of DIMA's personnel and such other issues as back-office operations, fund valuations, and compliance policies and procedures.
Nature, Quality and Extent of Services. The Board considered the terms of the Agreement, including the scope of advisory services provided under the Agreement. The Board noted that, under the Agreement, DIMA provides portfolio management services to the Fund and that, pursuant to a separate administrative services agreement, DIMA provides administrative services to the Fund. The Board considered the experience and skills of senior management and investment personnel, the resources made available to such personnel, the ability of DIMA to attract and retain high-quality personnel, and the organizational depth and stability of DIMA. The Board reviewed the Fund's performance over short-term and long-term periods and compared those returns to various agreed-upon performance measures, including market indices and a peer universe compiled by the Fee Consultant using information supplied by Morningstar Direct ("Morningstar"), an independent fund data service. The Board also noted that it has put into place a process of identifying "Focus Funds" (e.g., funds performing poorly relative to their benchmark or a peer universe compiled by an independent fund data service), and receives more frequent reporting and information from DIMA regarding such funds, along with DIMA's remedial plans to address underperformance. The Board believes this process is an effective manner of identifying and addressing underperforming funds. Based on the information provided, the Board noted that for the one-, three- and five-year periods ended December 31, 2012, the Fund's performance (Class A shares) was in the 2nd quartile, 2nd quartile and 1st quartile, respectively, of the applicable Morningstar universe (the 1st quartile being the best performers and the 4th quartile being the worst performers). The Board also observed that the Fund has underperformed its benchmark in each of the one-, three- and five-year periods ended December 31, 2012.
Fees and Expenses. The Board considered the Fund's investment management fee schedule, operating expenses and total expense ratios, and comparative information provided by Lipper Inc. ("Lipper") and the Fee Consultant regarding investment management fee rates paid to other investment advisors by similar funds (1st quartile being the most favorable and 4th quartile being the least favorable). With respect to management fees paid to other investment advisors by similar funds, the Board noted that the contractual fee rates paid by the Fund, which include a 0.10% fee paid to DIMA under the Fund's administrative services agreement, were lower than the median (1st quartile) of the applicable Lipper peer group (based on Lipper data provided as of December 31, 2012). The Board noted that the Fund's Class A shares total (net) operating expenses were expected to be lower than the median (1st quartile) of the applicable Lipper expense universe (based on Lipper data provided as of December 31, 2012) ("Lipper Universe Expenses"). The Board also reviewed data comparing each share class's total (net) operating expenses to the applicable Lipper Universe Expenses. The Board considered the Fund's management fee rate as compared to fees charged by DIMA to comparable funds and considered differences between the Fund and the comparable funds. The Board also considered how the Fund's total (net) operating expenses compared to the total (net) operating expenses of a more customized peer group selected by Lipper (based on such factors as asset size).
The information considered by the Board as part of its review of management fees included information regarding fees charged by DIMA and its affiliates to similar institutional accounts and to similar funds offered primarily to European investors ("DWS Europe funds"), in each case as applicable. The Board observed that advisory fee rates for institutional accounts generally were lower than the management fees charged by similarly managed DWS U.S. mutual funds ("DWS Funds"), but also took note of the differences in services provided to DWS Funds as compared to institutional accounts. In the case of DWS Europe funds, the Board observed that fee rates for DWS Europe funds generally were higher than for similarly managed DWS Funds, but noted that differences in the types of services provided to DWS Funds relative to DWS Europe funds made it difficult to compare such fees.
On the basis of the information provided, the Board concluded that management fees were reasonable and appropriate in light of the nature, quality and extent of services provided by DIMA.
Profitability. The Board reviewed detailed information regarding revenues received by DIMA under the Agreement. The Board considered the estimated costs and pre-tax profits realized by DIMA from advising the DWS Funds, as well as estimates of the pre-tax profits attributable to managing the Fund in particular. The Board also received information regarding the estimated enterprise-wide profitability of DWS and its affiliates with respect to all fund services in totality and by fund. The Board and the Fee Consultant reviewed DIMA's methodology in allocating its costs to the management of the Fund. Based on the information provided, the Board concluded that the pre-tax profits realized by DIMA in connection with the management of the Fund were not unreasonable. The Board also reviewed information regarding the profitability of certain similar investment management firms. The Board noted that while information regarding the profitability of such firms is limited (and in some cases is not necessarily prepared on a comparable basis), DIMA and its affiliates' overall profitability with respect to the DWS fund complex (after taking into account distribution and other services provided to the funds by DIMA and its affiliates) was lower than the overall profitability levels of many comparable firms for which such data was available.
Economies of Scale. The Board considered whether there are economies of scale with respect to the management of the Fund and whether the Fund benefits from any economies of scale. The Board noted that the Fund's management fee schedule includes fee breakpoints. The Board concluded that the Fund's fee schedule represents an appropriate sharing between the Fund and DIMA of such economies of scale as may exist in the management of the Fund at current asset levels.
Other Benefits to DIMA and Its Affiliates. The Board also considered the character and amount of other incidental benefits received by DIMA and its affiliates, including any fees received by DIMA for administrative services provided to the Fund and any fees received by an affiliate of DIMA for distribution services. The Board also considered benefits to DIMA related to brokerage and soft-dollar allocations, including allocating brokerage to pay for research generated by parties other than the executing broker dealers, which pertain primarily to funds investing in equity securities, along with the incidental public relations benefits to DIMA related to DWS Funds advertising and cross-selling opportunities among DIMA products and services. The Board concluded that management fees were reasonable in light of these fallout benefits.
Compliance. The Board considered the significant attention and resources dedicated by DIMA to documenting and enhancing its compliance processes in recent years. The Board noted in particular (i) the experience and seniority of both DIMA's chief compliance officer and the Fund's chief compliance officer; (ii) the large number of DIMA compliance personnel; and (iii) the substantial commitment of resources by DIMA and its affiliates to compliance matters.
Based on all of the information considered and the conclusions reached, the Board unanimously determined that the continuation of the Agreement is in the best interests of the Fund. In making this determination, the Board did not give particular weight to any single factor identified above. The Board considered these factors over the course of numerous meetings, certain of which were in executive session with only the Independent Trustees and their independent counsel present. It is possible that individual Trustees may have weighed these factors differently in reaching their individual decisions to approve the continuation of the Agreement.
Notes
DeAWM Distributors, Inc.
222 South Riverside Plaza
Chicago, IL 60606
(800) 621-1148
VS1coreq-3 (R-028376-3 8/14)
June 30, 2014
Semiannual Report
Deutsche Variable Series I
(formerly DWS Variable Series I)
Deutsche Global Small Cap VIP
(formerly DWS Global Small Cap Growth VIP)
Contents
8 Statement of Assets and Liabilities 9 Statement of Operations 10 Statement of Changes in Net Assets 13 Notes to Financial Statements 18 Information About Your Fund's Expenses 20 Advisory Agreement Board Considerations and Fee Evaluation |
This report must be preceded or accompanied by a prospectus. To obtain an additional prospectus or summary prospectus, if available, call (800) 728-3337 or your financial representative. We advise you to consider the Fund's objectives, risks, charges and expenses carefully before investing. The summary prospectus and prospectus contain this and other important information about the Fund. Please read the prospectus carefully before you invest.
Investing in foreign securities, particularly those of emerging markets, presents certain risks, such as currency fluctuations, political and economic changes, and market risks. The Fund may lend securities to approved institutions. Smaller company stocks tend to be more volatile than medium-sized or large company stocks. Stocks may decline in value. See the prospectus for details.
Deutsche Asset & Wealth Management represents the asset management and wealth management activities conducted by Deutsche Bank AG or any of its subsidiaries, including the Advisor and DeAWM Distributors, Inc.
NOT FDIC/NCUA INSURED NO BANK GUARANTEE MAY LOSE VALUE NOT A DEPOSIT
NOT INSURED BY ANY FEDERAL GOVERNMENT AGENCY
Dear Shareholder:
I am very pleased to tell you that the DWS funds have been renamed Deutsche funds, aligning more closely with the Deutsche Asset & Wealth Management brand. We are proud to adopt the Deutsche name — a brand that fully represents the global access, discipline and intelligence that support all of our products and services.
Deutsche Asset & Wealth Management combines the asset management and wealth management divisions of Deutsche Bank to deliver a comprehensive suite of active, passive and alternative investment capabilities. Your investment in the Deutsche funds means you have access to the thought leadership and resources of one of the world’s largest and most influential financial institutions.
In conjunction with your fund’s name change, please note that the Deutsche funds’ Web address has changed as well. The former dws-investments.com is now deutschefunds.com.
In addition, key service providers have been renamed as follows:
| Former Name | New name, effective August 11, 2014 |
| DWS Investments Distributors, Inc. | DeAWM Distributors, Inc. |
| DWS Trust Company | DeAWM Trust Company |
| DWS Investments Service Company | DeAWM Service Company |
These changes have no effect on the day-to-day management of your investment, and there is no action required on your part. You will continue to experience the benefits that come from our decades of experience, in-depth research and worldwide network of investment professionals.
Thanks for your continued support. We appreciate your trust and the opportunity to put our capabilities to work for you.
Best regards,
Brian Binder
President, Deutsche Funds
Performance Summary June 30, 2014 (Unaudited)
Fund performance shown is historical, assumes reinvestment of all dividend and capital gain distributions, and does not guarantee future results. Investment return and principal value fluctuate with changing market conditions so that, when redeemed, shares may be worth more or less than their original cost. Current performance may be lower or higher than the performance data quoted. Please contact your participating insurance company for the Fund's most recent month-end performance. Performance doesn't reflect charges and fees ("contract charges") associated with the separate account that invests in the Fund or any variable life insurance policy or variable annuity contract for which the Fund is an investment option. These charges and fees will reduce returns. While all share classes have the same underlying portfolio, their performance will differ.
The gross expense ratios of the Fund, as stated in the fee table of the prospectus dated May 1, 2014 are 1.14% and 1.34% for Class A and Class B shares, respectively, and may differ from the expense ratios disclosed in the Financial Highlights tables in this report.
| Growth of an Assumed $10,000 Investment |
| The S&P® Developed SmallCap comprises the stocks representing the lowest 15% of float-adjusted market cap in each developed country. It Is a subset of the S&P® Global BMI, a comprehensive, rules-based index measuring global stock market performance. Index returns do not reflect any fees or expenses and it is not possible to invest directly into an index. |
| |
| Yearly periods ended June 30 | |
| Comparative Results | |
| Deutsche Global Small Cap VIP | | 6-Month‡ | | | 1-Year | | | 3-Year | | | 5-Year | | | 10-Year | |
| Class A | Growth of $10,000 | | $ | 10,289 | | | $ | 12,490 | | | $ | 13,824 | | | $ | 22,780 | | | $ | 25,257 | |
| Average annual total return | | | 2.89 | % | | | 24.90 | % | | | 11.40 | % | | | 17.90 | % | | | 9.71 | % |
| S&P Developed Small Cap Index | Growth of $10,000 | | $ | 10,648 | | | $ | 12,798 | | | $ | 14,267 | | | $ | 23,566 | | | $ | 25,415 | |
| Average annual total return | | | 6.48 | % | | | 27.98 | % | | | 12.58 | % | | | 18.70 | % | | | 9.78 | % |
| Deutsche Global Small Cap VIP | | 6-Month‡ | | | 1-Year | | | 3-Year | | | 5-Year | | | 10-Year | |
| Class B | Growth of $10,000 | | $ | 10,277 | | | $ | 12,457 | | | $ | 13,720 | | | $ | 22,519 | | | $ | 24,650 | |
| Average annual total return | | | 2.77 | % | | | 24.57 | % | | | 11.12 | % | | | 17.63 | % | | | 9.44 | % |
| S&P Developed Small Cap Index | Growth of $10,000 | | $ | 10,648 | | | $ | 12,798 | | | $ | 14,267 | | | $ | 23,566 | | | $ | 25,415 | |
| Average annual total return | | | 6.48 | % | | | 27.98 | % | | | 12.58 | % | | | 18.70 | % | | | 9.78 | % |
The growth of $10,000 is cumulative.
‡ Total returns shown for periods less than one year are not annualized.
Portfolio Summary (Unaudited) Asset Allocation (As a % of Investment Portfolio excluding Securities Lending Collateral) | 6/30/14 | 12/31/13 |
| | | |
| Common Stocks | 98% | 99% |
| Cash Equivalents | 2% | 1% |
| | 100% | 100% |
Geographical Diversification (As a % of Investment Portfolio excluding Cash Equivalents and Securities Lending Collateral) | 6/30/14 | 12/31/13 |
| | | |
| United States | 43% | 44% |
| Continental Europe | 19% | 18% |
| Asia (excluding Japan) | 13% | 11% |
| United Kingdom | 12% | 14% |
| Japan | 7% | 8% |
| Canada | 3% | 2% |
| Latin America | 1% | 1% |
| Australia | 0% | 0% |
| Other | 2% | 2% |
| | 100% | 100% |
Sector Diversification (As a % of Investment Portfolio excluding Cash Equivalents and Securities Lending Collateral) | 6/30/14 | 12/31/13 |
| | | |
| Industrials | 25% | 25% |
| Consumer Discretionary | 23% | 23% |
| Financials | 16% | 17% |
| Health Care | 14% | 14% |
| Information Technology | 10% | 10% |
| Energy | 5% | 6% |
| Consumer Staples | 5% | 4% |
| Materials | 2% | 1% |
| | 100% | 100% |
Portfolio holdings and characteristics are subject to change.
For more complete details about the Fund's investment portfolio, see page 6.
Following the Fund's fiscal first and third quarter-end, a complete portfolio holdings listing is filed with the SEC on Form N-Q. The form will be available on the SEC's Web site at sec.gov, and it also may be reviewed and copied at the SEC's Public Reference Room in Washington, D.C. Information on the operation of the SEC's Public Reference Room may be obtained by calling (800) SEC-0330. The Fund's portfolio holdings are also posted on deutschefunds.com from time to time. Please see the Fund's current prospectus for more information.
Joseph Axtell, CFA
Portfolio Manager
Investment Portfolio June 30, 2014 (Unaudited) | | | Shares | | | Value ($) | |
| | | | |
| Common Stocks 97.0% | |
| Australia 0.4% | |
| Austal Ltd.* (Cost $696,239) | | | 541,414 | | | | 653,473 | |
| Bermuda 0.9% | |
| Lazard Ltd. "A" (a) (Cost $704,031) | | | 28,744 | | | | 1,482,041 | |
| Canada 2.5% | |
| Quebecor, Inc. "B" | | | 68,168 | | | | 1,649,499 | |
| SunOpta, Inc.* | | | 158,500 | | | | 2,231,680 | |
| (Cost $2,834,197) | | | | 3,881,179 | |
| China 1.4% | |
| Charm Communications, Inc. (ADR)* | | | 98,491 | | | | 443,209 | |
| Minth Group Ltd. | | | 875,439 | | | | 1,703,347 | |
| (Cost $1,318,430) | | | | 2,146,556 | |
| Cyprus 0.9% | |
| Prosafe SE (Cost $1,318,219) | | | 165,815 | | | | 1,367,859 | |
| Denmark 1.2% | |
| GN Store Nord AS (Cost $915,547) | | | 66,118 | | | | 1,894,342 | |
| Finland 0.8% | |
| Cramo Oyj (Cost $1,168,046) | | | 53,392 | | | | 1,299,159 | |
| France 2.1% | |
| Flamel Technologies SA (ADR)* | | | 131,623 | | | | 1,974,345 | |
| JC Decaux SA (b) | | | 33,667 | | | | 1,256,231 | |
| (Cost $2,033,790) | | | | 3,230,576 | |
| Germany 4.4% | |
| M.A.X. Automation AG | | | 168,740 | | | | 939,935 | |
| Patrizia Immobilien AG | | | 63,794 | | | | 847,325 | |
| Rational AG | | | 3,657 | | | | 1,182,028 | |
| United Internet AG (Registered) | | | 61,105 | | | | 2,692,117 | |
| Vib Vermoegen AG | | | 65,560 | | | | 1,243,333 | |
| (Cost $3,176,787) | | | | 6,904,738 | |
| Hong Kong 5.4% | |
| Hong Kong Television Network Ltd.* | | | 1,264,391 | | | | 398,059 | |
| K Wah International Holdings Ltd. | | | 2,966,526 | | | | 2,070,720 | |
| Playmates Toys Ltd. | | | 3,094,492 | | | | 1,177,842 | |
| REXLot Holdings Ltd. (b) | | | 17,982,850 | | | | 2,111,426 | |
| Sun Hung Kai & Co., Ltd. | | | 1,436,654 | | | | 1,143,703 | |
| Techtronic Industries Co., Ltd. | | | 501,140 | | | | 1,606,798 | |
| (Cost $5,298,408) | | | | 8,508,548 | |
| Indonesia 0.8% | |
| PT Arwana Citramulia Tbk (Cost $1,006,872) | | | 14,521,519 | | | | 1,237,177 | |
| Ireland 2.7% | |
| C&C Group PLC | | | 152,623 | | | | 949,844 | |
| Paddy Power PLC | | | 21,457 | | | | 1,410,292 | |
| Ryanair Holdings PLC* | | | 202,146 | | | | 1,912,678 | |
| (Cost $977,190) | | | | 4,272,814 | |
| Italy 0.8% | |
| Prysmian SpA (Cost $1,072,825) | | | 55,487 | | | | 1,253,643 | |
| | | Shares | | | Value ($) | |
| | | | | | | | | |
| Japan 6.4% | |
| Ai Holdings Corp. | | | 70,964 | | | | 1,291,019 | |
| Avex Group Holdings, Inc. | | | 72,313 | | | | 1,274,159 | |
| Kusuri No Aoki Co., Ltd. | | | 48,906 | | | | 1,771,729 | |
| MISUMI Group, Inc. | | | 27,828 | | | | 765,576 | |
| Nippon Seiki Co., Ltd. | | | 102,649 | | | | 1,982,963 | |
| United Arrows Ltd. | | | 28,219 | | | | 1,137,896 | |
| Universal Entertainment Corp. (b) | | | 49,078 | | | | 870,571 | |
| UT Holdings Co., Ltd. | | | 137,600 | | | | 859,788 | |
| (Cost $7,320,242) | | | | 9,953,701 | |
| Malaysia 1.3% | |
| Hartalega Holdings Bhd. | | | 548,989 | | | | 1,061,732 | |
| Tune Ins Holdings Bhd. | | | 1,359,962 | | | | 961,418 | |
| (Cost $1,367,757) | | | | 2,023,150 | |
| Netherlands 4.1% | |
| Brunel International NV | | | 49,148 | | | | 1,434,465 | |
| Chicago Bridge & Iron Co. NV (c) | | | 12,800 | | | | 872,960 | |
| Constellium NV "A"* (c) | | | 82,843 | | | | 2,655,947 | |
| SBM Offshore NV* | | | 88,716 | | | | 1,431,628 | |
| (Cost $4,120,102) | | | | 6,395,000 | |
| Panama 0.7% | |
| Banco Latinoamericano de Comercio Exterior SA "E" (Cost $903,207) | | | 37,637 | | | | 1,116,690 | |
| Philippines 1.1% | |
| Alliance Global Group, Inc. | | | 2,396,749 | | | | 1,597,833 | |
| Century Properties Group, Inc. | | | 1,877,780 | | | | 58,506 | |
| House of Investments, Inc. | | | 93,640 | | | | 12,871 | |
| (Cost $870,488) | | | | 1,669,210 | |
| Singapore 1.7% | |
| Lian Beng Group Ltd. | | | 3,250,348 | | | | 1,811,686 | |
| UE E&C Ltd. | | | 875,904 | | | | 835,934 | |
| (Cost $1,877,905) | | | | 2,647,620 | |
| Switzerland 1.2% | |
| Dufry AG (Registered)* (b) (Cost $1,154,175) | | | 9,898 | | | | 1,799,231 | |
| Taiwan 0.6% | |
| Kinpo Electronics, Inc. (Cost $821,502) | | | 2,042,529 | | | | 954,293 | |
| Thailand 0.6% | |
| Malee Sampran PCL (Foreign Registered) (Cost $1,132,482) | | | 676,472 | | | | 932,741 | |
| United Kingdom 12.1% | |
| Arrow Global Group PLC* | | | 363,026 | | | | 1,428,950 | |
| Babcock International Group PLC | | | 127,123 | | | | 2,528,027 | |
| Clinigen Healthcare Ltd. | | | 102,427 | | | | 662,171 | |
| Crest Nicholson Holdings PLC | | | 238,220 | | | | 1,405,714 | |
| Domino's Pizza Group PLC | | | 94,503 | | | | 847,478 | |
| Hargreaves Lansdown PLC | | | 68,051 | | | | 1,441,805 | |
| HellermannTyton Group PLC | | | 237,370 | | | | 1,265,016 | |
| Howden Joinery Group PLC | | | 217,474 | | | | 1,152,285 | |
| IG Group Holdings PLC | | | 109,476 | | | | 1,100,723 | |
| Jardine Lloyd Thompson Group PLC | | | 53,491 | | | | 952,063 | |
| | | Shares | | | Value ($) | |
| | | | | | | | | |
| John Wood Group PLC | | | 79,643 | | | | 1,099,268 | |
| Monitise PLC* | | | 764,288 | | | | 676,891 | |
| Nanoco Group PLC* | | | 375,044 | | | | 677,152 | |
| Polypipe Group PLC* | | | 306,543 | | | | 1,311,544 | |
| Rotork PLC | | | 28,212 | | | | 1,289,130 | |
| Spirax-Sarco Engineering PLC | | | 21,443 | | | | 1,002,944 | |
| (Cost $12,818,745) | | | | 18,841,161 | |
| United States 42.9% | |
| Advance Auto Parts, Inc. | | | 10,602 | | | | 1,430,422 | |
| Affiliated Managers Group, Inc.* | | | 7,434 | | | | 1,526,944 | |
| Altra Industrial Motion Corp. | | | 29,532 | | | | 1,074,669 | |
| BE Aerospace, Inc.* | | | 16,382 | | | | 1,515,171 | |
| Cancer Genetics, Inc.* (b) | | | 50,318 | | | | 568,593 | |
| Cardtronics, Inc.* | | | 30,821 | | | | 1,050,380 | |
| Chart Industries, Inc.* (b) | | | 13,944 | | | | 1,153,727 | |
| Cognex Corp.* | | | 28,518 | | | | 1,095,091 | |
| CONMED Corp. | | | 21,163 | | | | 934,346 | |
| Dresser-Rand Group, Inc.* | | | 16,517 | | | | 1,052,628 | |
| Encore Capital Group, Inc.* (b) | | | 33,098 | | | | 1,503,311 | |
| Financial Engines, Inc. (b) | | | 14,433 | | | | 653,526 | |
| Fox Factory Holding Corp.* | | | 64,710 | | | | 1,138,249 | |
| Furiex Pharmaceuticals, Inc.* | | | 10,679 | | | | 1,133,896 | |
| Gentherm, Inc.* | | | 18,314 | | | | 814,057 | |
| Hain Celestial Group, Inc.* | | | 9,527 | | | | 845,426 | |
| Harris Corp. | | | 17,120 | | | | 1,296,840 | |
| HeartWare International, Inc.* | | | 12,111 | | | | 1,071,824 | |
| Imperva, Inc.* | | | 24,351 | | | | 637,509 | |
| Jack in the Box, Inc. | | | 17,646 | | | | 1,055,937 | |
| Jarden Corp.* | | | 19,627 | | | | 1,164,862 | |
| Kindred Healthcare, Inc. | | | 54,736 | | | | 1,264,402 | |
| Leucadia National Corp. | | | 48,574 | | | | 1,273,610 | |
| Manitowoc Co., Inc. (b) | | | 47,980 | | | | 1,576,623 | |
| Middleby Corp.* | | | 14,370 | | | | 1,188,686 | |
| Molina Healthcare, Inc.* (b) | | | 34,729 | | | | 1,549,955 | |
| NOW, Inc.* | | | 23,583 | | | | 853,940 | |
| Oasis Petroleum, Inc.* | | | 20,300 | | | | 1,134,567 | |
| Ocwen Financial Corp.* | | | 38,210 | | | | 1,417,591 | |
| Oil States International, Inc.* | | | 14,045 | | | | 900,144 | |
| Orexigen Therapeutics, Inc.* (b) | | | 83,992 | | | | 519,071 | |
| Pacira Pharmaceuticals, Inc.* | | | 9,772 | | | | 897,656 | |
| PAREXEL International Corp.* | | | 22,290 | | | | 1,177,804 | |
| Primoris Services Corp. | | | 41,564 | | | | 1,198,706 | |
| Providence Service Corp.* | | | 33,774 | | | | 1,235,791 | |
| PTC, Inc.* | | | 26,897 | | | | 1,043,604 | |
| Retrophin, Inc.* | | | 61,103 | | | | 717,349 | |
| Roadrunner Transportation Systems, Inc.* | | | 37,336 | | | | 1,049,142 | |
| Sinclair Broadcast Group, Inc. "A" (b) | | | 44,647 | | | | 1,551,483 | |
| Sunesis Pharmaceuticals, Inc.* (b) | | | 26,913 | | | | 175,473 | |
| Sunshine Heart, Inc.* | | | 129,438 | | | | 724,853 | |
| Synta Pharmaceuticals Corp.* | | | 110,127 | | | | 450,419 | |
| | | Shares | | | Value ($) | |
| | | | | | | | | |
| Tenneco, Inc.* | | | 26,716 | | | | 1,755,241 | |
| The Bancorp., Inc.* | | | 57,973 | | | | 690,458 | |
| The WhiteWave Foods Co.* | | | 34,965 | | | | 1,131,817 | |
| Thoratec Corp.* | | | 46,191 | | | | 1,610,218 | |
| TIBCO Software, Inc.* | | | 35,463 | | | | 715,289 | |
| TiVo, Inc.* | | | 78,441 | | | | 1,012,673 | |
| TriNet Group, Inc.* | | | 36,756 | | | | 884,717 | |
| Tristate Capital Holdings, Inc.* | | | 66,710 | | | | 942,612 | |
| Ultra Clean Holdings, Inc.* | | | 85,996 | | | | 778,264 | |
| United Rentals, Inc.* (b) | | | 18,668 | | | | 1,955,100 | |
| Urban Outfitters, Inc.* | | | 35,603 | | | | 1,205,518 | |
| VeriFone Systems, Inc.* | | | 42,654 | | | | 1,567,535 | |
| WABCO Holdings, Inc.* | | | 16,502 | | | | 1,762,744 | |
| Waddell & Reed Financial, Inc. "A" | | | 29,215 | | | | 1,828,567 | |
| WageWorks, Inc.* | | | 25,051 | | | | 1,207,709 | |
| Zeltiq Aesthetics, Inc.* | | | 96,953 | | | | 1,472,716 | |
| Zions Bancorp. (b) | | | 39,320 | | | | 1,158,760 | |
| Zoe's Kitchen, Inc.* (b) | | | 23,563 | | | | 810,097 | |
| (Cost $46,718,496) | | | | 67,108,312 | |
Total Common Stocks (Cost $101,625,682) | | | | 151,573,214 | |
| | |
| Warrants 0.1% | |
| Malaysia 0.0% | |
| Hartalega Holdings Bhd., Expiration Date 5/29/2015* (Cost $0) | | | 68,733 | | | | 44,951 | |
| United States 0.1% | |
| Sunesis Pharmaceuticals, Inc., Series A, Expiration Date 3/31/2016* | | | 26,913 | | | | 76,702 | |
| Sunesis Pharmaceuticals, Inc., Series B, Expiration Date 3/31/2016* | | | 26,913 | | | | 54,499 | |
| (Cost $73,472) | | | | 131,201 | |
Total Warrants (Cost $73,472) | | | | 176,152 | |
| | |
| Securities Lending Collateral 11.6% | |
| Daily Assets Fund Institutional, 0.08% (d) (e) (Cost $18,140,495) | | | 18,140,495 | | | | 18,140,495 | |
| | |
| Cash Equivalents 2.3% | |
| Central Cash Management Fund, 0.06% (d) (Cost $3,583,294) | | | 3,583,294 | | | | 3,583,294 | |
| | | % of Net Assets | | | Value ($) | |
| | | | |
Total Investment Portfolio (Cost $123,422,943)† | | | 111.0 | | | | 173,473,155 | |
| Other Assets and Liabilities, Net | | | (11.0 | ) | | | (17,225,177 | ) |
| Net Assets | | | 100.0 | | | | 156,247,978 | |
* Non-income producing security.
† The cost for federal income tax purposes was $124,754,929. At June 30, 2014, net unrealized appreciation for all securities based on tax cost was $48,718,226. This consisted of aggregate gross unrealized appreciation for all securities in which there was an excess of value over tax cost of $54,344,037 and aggregate gross unrealized depreciation for all securities in which there was an excess of tax cost over value of $5,625,811.
(a) Listed on the NASDAQ Stock Market, Inc.
(b) All or a portion of these securities were on loan. In addition, "Other Assets and Liabilities, Net" may include pending sales that are also on loan. The value of securities loaned at June 30, 2014 amounted to $17,212,688, which is 11.0% of net assets.
(c) Listed on the New York Stock Exchange.
(d) Affiliated fund managed by Deutsche Investment Management Americas Inc. The rate shown is the annualized seven-day yield at period end.
(e) Represents collateral held in connection with securities lending. Income earned by the Fund is net of borrower rebates.
ADR: American Depositary Receipt
Fair Value Measurements
Various inputs are used in determining the value of the Fund's investments. These inputs are summarized in three broad levels. Level 1 includes quoted prices in active markets for identical securities. Level 2 includes other significant observable inputs (including quoted prices for similar securities, interest rates, prepayment speeds and credit risk). Level 3 includes significant unobservable inputs (including the Fund's own assumptions in determining the fair value of investments). The level assigned to the securities valuations may not be an indication of the risk or liquidity associated with investing in those securities.
The following is a summary of the inputs used as of June 30, 2014 in valuing the Fund's investments. For information on the Fund's policy regarding the valuation of investments, please refer to the Security Valuation section of Note A in the accompanying Notes to Financial Statements.
| Assets | | Level 1 | | | Level 2 | | | Level 3 | | | Total | |
| | |
| Common Stocks & Warrants | |
| Australia | | $ | — | | | $ | 653,473 | | | $ | — | | | $ | 653,473 | |
| Bermuda | | | 1,482,041 | | | | — | | | | — | | | | 1,482,041 | |
| Canada | | | 3,881,179 | | | | — | | | | — | | | | 3,881,179 | |
| China | | | 443,209 | | | | 1,703,347 | | | | — | | | | 2,146,556 | |
| Cyprus | | | — | | | | 1,367,859 | | | | — | | | | 1,367,859 | |
| Denmark | | | — | | | | 1,894,342 | | | | — | | | | 1,894,342 | |
| Finland | | | — | | | | 1,299,159 | | | | — | | | | 1,299,159 | |
| France | | | 1,974,345 | | | | 1,256,231 | | | | — | | | | 3,230,576 | |
| Germany | | | — | | | | 6,904,738 | | | | — | | | | 6,904,738 | |
| Hong Kong | | | — | | | | 8,508,548 | | | | — | | | | 8,508,548 | |
| Indonesia | | | — | | | | 1,237,177 | | | | — | | | | 1,237,177 | |
| Ireland | | | — | | | | 4,272,814 | | | | — | | | | 4,272,814 | |
| Italy | | | — | | | | 1,253,643 | | | | — | | | | 1,253,643 | |
| Japan | | | — | | | | 9,953,701 | | | | — | | | | 9,953,701 | |
| Malaysia | | | — | | | | 2,068,101 | | | | — | | | | 2,068,101 | |
| Netherlands | | | 3,528,907 | | | | 2,866,093 | | | | — | | | | 6,395,000 | |
| Panama | | | 1,116,690 | | | | — | | | | — | | | | 1,116,690 | |
| Philippines | | | — | | | | 1,669,210 | | | | — | | | | 1,669,210 | |
| Singapore | | | — | | | | 2,647,620 | | | | — | | | | 2,647,620 | |
| Switzerland | | | — | | | | 1,799,231 | | | | — | | | | 1,799,231 | |
| Taiwan | | | — | | | | 954,293 | | | | — | | | | 954,293 | |
| Thailand | | | — | | | | 932,741 | | | | — | | | | 932,741 | |
| United Kingdom | | | — | | | | 18,841,161 | | | | — | | | | 18,841,161 | |
| United States | | | 67,239,513 | | | | — | | | | — | | | | 67,239,513 | |
| Short-Term Investments (f) | | | 21,723,789 | | | | — | | | | — | | | | 21,723,789 | |
| Total | | $ | 101,389,673 | | | $ | 72,083,482 | | | $ | — | | | $ | 173,473,155 | |
There have been no transfers between fair value measurement levels during the period ended June 30, 2014.
(f) See Investment Portfolio for additional detailed categorizations.
The accompanying notes are an integral part of the financial statements.
Statement of Assets and Liabilities | as of June 30, 2014 (Unaudited) | |
| Assets | |
Investments: Investments in non-affiliated securities, at value (cost $101,699,154) — including $17,212,688 of securities loaned | | $ | 151,749,366 | |
| Investment in Daily Assets Fund Institutional (cost $18,140,495)* | | | 18,140,495 | |
| Investment in Central Cash Management Fund (cost $3,583,294) | | | 3,583,294 | |
| Total investments in securities, at value (cost $123,422,943) | | | 173,473,155 | |
| Foreign currency, at value (cost $258,722) | | | 261,003 | |
| Receivable for investments sold | | | 2,224,405 | |
| Receivable for Fund shares sold | | | 13,519 | |
| Dividends receivable | | | 190,503 | |
| Interest receivable | | | 5,055 | |
| Foreign taxes recoverable | | | 105,765 | |
| Other assets | | | 1,103 | |
| Total assets | | | 176,274,508 | |
| Liabilities | |
| Payable upon return of securities loaned | | | 18,140,495 | |
| Payable for investments purchased | | | 1,614,918 | |
| Payable for Fund shares redeemed | | | 102,644 | |
| Accrued management fee | | | 94,988 | |
| Accrued Trustees' fees | | | 131 | |
| Other accrued expenses and payables | | | 73,354 | |
| Total liabilities | | | 20,026,530 | |
| Net assets, at value | | $ | 156,247,978 | |
| Net Assets Consist of | |
| Distributions in excess of net investment income | | | (598,800 | ) |
Net unrealized appreciation (depreciation) on: Investments | | | 50,050,212 | |
| Foreign currency | | | 8,884 | |
| Accumulated net realized gain (loss) | | | 11,553,009 | |
| Paid-in capital | | | 95,234,673 | |
| Net assets, at value | | $ | 156,247,978 | |
Class A Net Asset Value, offering and redemption price per share ($153,118,368 ÷ 9,768,622 outstanding shares of beneficial interest, $.01 par value, unlimited number of shares authorized) | | $ | 15.67 | |
Class B Net Asset Value, offering and redemption price per share ($3,129,610 ÷ 203,945 outstanding shares of beneficial interest, $.01 par value, unlimited number of shares authorized) | | $ | 15.35 | |
* Represents collateral on securities loaned.
The accompanying notes are an integral part of the financial statements.
Statement of Operations
| for the six months ended June 30, 2014 (Unaudited) | |
| Investment Income | |
Income: Dividends (net of foreign taxes withheld of $57,354) | | $ | 1,053,605 | |
| Income distributions — Central Cash Management Fund | | | 1,023 | |
| Securities lending income, including income from Daily Assets Fund Institutional, net of borrower rebates | | | 36,141 | |
| Total income | | | 1,090,769 | |
Expenses: Management fee | | | 684,742 | |
| Administration fee | | | 76,937 | |
| Services to shareholders | | | 1,464 | |
| Distribution service fee (Class B) | | | 3,500 | |
| Record keeping fee (Class B) | | | 172 | |
| Custodian fee | | | 32,206 | |
| Professional fees | | | 35,232 | |
| Reports to shareholders | | | 15,810 | |
| Trustees' fees and expenses | | | 3,620 | |
| Other | | | 12,208 | |
| Total expenses before expense reductions | | | 865,891 | |
| Expense reductions | | | (125,751 | ) |
| Total expenses after expense reductions | | | 740,140 | |
| Net investment income (loss) | | | 350,629 | |
| Realized and Unrealized Gain (Loss) | |
Net realized gain (loss) from: Investments | | | 12,042,509 | |
| Foreign currency | | | 53 | |
| | | | 12,042,562 | |
Change in net unrealized appreciation (depreciation) on: Investments | | | (8,017,865 | ) |
| Foreign currency | | | 3,241 | |
| | | | (8,014,624 | ) |
| Net gain (loss) | | | 4,027,938 | |
| Net increase (decrease) in net assets resulting from operations | | $ | 4,378,567 | |
The accompanying notes are an integral part of the financial statements.
Statement of Changes in Net Assets | Increase (Decrease) in Net Assets | | Six Months Ended June 30, 2014 (Unaudited) | | | Year Ended December 31, 2013 | |
Operations: Net investment income (loss) | | $ | 350,629 | | | $ | 392,707 | |
Operations: Net investment income (loss) | | $ | 350,629 | | | $ | 392,707 | |
| Net realized gain (loss) | | | 12,042,562 | | | | 17,021,484 | |
| Change in net unrealized appreciation (depreciation) | | | (8,014,624 | ) | | | 25,576,735 | |
| Net increase (decrease) in net assets resulting from operations | | | 4,378,567 | | | | 42,990,926 | |
Distributions to shareholders from: Net investment income: Class A | | | (1,278,879 | ) | | | (881,158 | ) |
| Class B | | | (17,935 | ) | | | (8,337 | ) |
Net realized gains: Class A | | | (16,572,319 | ) | | | (9,356,181 | ) |
| Class B | | | (315,539 | ) | | | (145,558 | ) |
| Total distributions | | | (18,184,672 | ) | | | (10,391,234 | ) |
Fund share transactions: Class A Proceeds from shares sold | | | 3,186,843 | | | | 7,422,087 | |
| Reinvestment of distributions | | | 17,851,198 | | | | 10,237,339 | |
| Payments for shares redeemed | | | (8,279,149 | ) | | | (19,526,673 | ) |
| Net increase (decrease) in net assets from Class A share transactions | | | 12,758,892 | | | | (1,867,247 | ) |
Class B Proceeds from shares sold | | | 665,585 | | | | 496,180 | |
| Reinvestment of distributions | | | 333,474 | | | | 153,895 | |
| Payments for redeemed | | | (232,486 | ) | | | (384,768 | ) |
| Net increase (decrease) in net assets from Class B share transactions | | | 766,573 | | | | 265,307 | |
| Increase (decrease) in net assets | | | (280,640 | ) | | | 30,997,752 | |
| Net assets at beginning of period | | | 156,528,618 | | | | 125,530,866 | |
| Net assets at end of period (including distributions in excess of net investment income and undistributed net investment income of $598,800 and $347,385, respectively) | | $ | 156,247,978 | | | $ | 156,528,618 | |
| Other Information | |
Class A Shares outstanding at beginning of period | | | 8,893,756 | | | | 8,977,791 | |
| Shares sold | | | 189,533 | | | | 479,388 | |
| Shares issued to shareholders in reinvestment of distributions | | | 1,182,982 | | | | 718,410 | |
| Shares redeemed | | | (497,649 | ) | | | (1,281,833 | ) |
| Net increase (decrease) in Class A shares | | | 874,866 | | | | (84,035 | ) |
| Shares outstanding at end of period | | | 9,768,622 | | | | 8,893,756 | |
Class B Shares outstanding at beginning of period | | | 154,023 | | | | 136,607 | |
| Shares sold | | | 41,598 | | | | 32,424 | |
| Shares issued to shareholders in reinvestment of distributions | | | 22,563 | | | | 11,000 | |
| Shares redeemed | | | (14,239 | ) | | | (26,008 | ) |
| Net increase (decrease) in Class B shares | | | 49,922 | | | | 17,416 | |
| Shares outstanding at end of period | | | 203,945 | | | | 154,023 | |
The accompanying notes are an integral part of the financial statements.
| | | | | | Years Ended December 31, | |
| Class A | | Six Months Ended 6/30/14 (Unaudited) | | | 2013 | | | 2012 | | | 2011 | | | 2010 | | | 2009 | |
| Selected Per Share Data | |
| Net asset value, beginning of period | | $ | 17.31 | | | $ | 13.78 | | | $ | 12.67 | | | $ | 14.28 | | | $ | 11.32 | | | $ | 7.79 | |
Income (loss) from investment operations: Net investment income (loss)a | | | .04 | | | | .04 | | | | .09 | | | | .08 | | | | .05 | | | | .04 | |
| Net realized and unrealized gain (loss) | | | .37 | | | | 4.66 | | | | 1.83 | | | | (1.45 | ) | | | 2.96 | | | | 3.64 | |
| Total from investment operations | | | .41 | | | | 4.70 | | | | 1.92 | | | | (1.37 | ) | | | 3.01 | | | | 3.68 | |
Less distributions from: Net investment income | | | (.15 | ) | | | (.10 | ) | | | (.09 | ) | | | (.24 | ) | | | (.05 | ) | | | (.15 | ) |
| Net realized gains | | | (1.90 | ) | | | (1.07 | ) | | | (.72 | ) | | | — | | | | — | | | | — | |
| Total distributions | | | (2.05 | ) | | | (1.17 | ) | | | (.81 | ) | | | (.24 | ) | | | (.05 | ) | | | (.15 | ) |
| Net asset value, end of period | | $ | 15.67 | | | $ | 17.31 | | | $ | 13.78 | | | $ | 12.67 | | | $ | 14.28 | | | $ | 11.32 | |
Total Return (%)b | | | 2.89 | ** | | | 35.94 | | | | 15.37 | | | | (9.90 | ) | | | 26.64 | | | | 48.20 | |
| Ratios to Average Net Assets and Supplemental Data | |
| Net assets, end of period ($ millions) | | | 153 | | | | 154 | | | | 124 | | | | 123 | | | | 158 | | | | 139 | |
| Ratio of expenses before expense reductions (%) | | | 1.12 | * | | | 1.14 | | | | 1.11 | | | | 1.12 | | | | 1.12 | | | | 1.11 | |
| Ratio of expenses after expense reductions (%) | | | .96 | * | | | .94 | | | | .98 | | | | 1.00 | | | | 1.04 | | | | .99 | |
| Ratio of net investment income (loss) (%) | | | .46 | * | | | .28 | | | | .69 | | | | .57 | | | | .42 | | | | .47 | |
| Portfolio turnover rate (%) | | | 23 | ** | | | 39 | | | | 36 | | | | 31 | | | | 39 | | | | 53 | |
a Based on average shares outstanding during the period. b Total return would have been lower had certain expenses not been reduced. * Annualized ** Not annualized | |
| | | | | | Years Ended December 31, | |
| Class B | | Six Months Ended 6/30/14 (Unaudited) | | | 2013 | | | 2012 | | | 2011 | | | 2010 | | | 2009 | |
| Selected Per Share Data | |
| Net asset value, beginning of period | | $ | 16.97 | | | $ | 13.52 | | | $ | 12.45 | | | $ | 14.03 | | | $ | 11.11 | | | $ | 7.65 | |
Income (loss) from investment operations: Net investment income (loss)a | | | .02 | | | | .01 | | | | .06 | | | | .05 | | | | .03 | | | | .02 | |
| Net realized and unrealized gain (loss) | | | .37 | | | | 4.57 | | | | 1.79 | | | | (1.43 | ) | | | 2.90 | | | | 3.57 | |
| Total from investment operations | | | .39 | | | | 4.58 | | | | 1.85 | | | | (1.38 | ) | | | 2.93 | | | | 3.59 | |
Less distributions from: Net investment income | | | (.11 | ) | | | (.06 | ) | | | (.06 | ) | | | (.20 | ) | | | (.01 | ) | | | (.13 | ) |
| Net realized gains | | | (1.90 | ) | | | (1.07 | ) | | | (.72 | ) | | | — | | | | — | | | | — | |
| Total distributions | | | (2.01 | ) | | | (1.13 | ) | | | (.78 | ) | | | (.20 | ) | | | (.01 | ) | | | (.13 | ) |
| Net asset value, end of period | | $ | 15.35 | | | $ | 16.97 | | | $ | 13.52 | | | $ | 12.45 | | | $ | 14.03 | | | $ | 11.11 | |
Total Return (%)b | | | 2.77 | ** | | | 35.67 | | | | 15.01 | | | | (10.08 | ) | | | 26.38 | | | | 47.66 | |
| Ratios to Average Net Assets and Supplemental Data | |
| Net assets, end of period ($ millions) | | | 3 | | | | 3 | | | | 2 | | | | 2 | | | | 2 | | | | 7 | |
| Ratio of expenses before expense reductions (%) | | | 1.39 | * | | | 1.34 | | | | 1.43 | | | | 1.38 | | | | 1.34 | | | | 1.42 | |
| Ratio of expenses after expense reductions (%) | | | 1.23 | * | | | 1.15 | | | | 1.23 | | | | 1.25 | | | | 1.26 | | | | 1.30 | |
| Ratio of net investment income (loss) (%) | | | .22 | * | | | .07 | | | | .44 | | | | .32 | | | | .20 | | | | .16 | |
| Portfolio turnover rate (%) | | | 23 | ** | | | 39 | | | | 36 | | | | 31 | | | | 39 | | | | 53 | |
a Based on average shares outstanding during the period. b Total return would have been lower had certain expenses not been reduced. * Annualized ** Not annualized | |
Notes to Financial Statements (Unaudited)
A. Organization and Significant Accounting Policies
Deutsche Variable Series I (formerly DWS Variable Series I) (the "Series") is registered under the Investment Company Act of 1940, as amended (the "1940 Act"), as an open-end, registered management investment company organized as a Massachusetts business trust. The Series consists of five diversified funds: Deutsche Bond VIP, Deutsche Core Equity VIP, Deutsche Capital Growth VIP, Deutsche Global Small Cap VIP and Deutsche International VIP (individually or collectively hereinafter referred to as a "Fund" or the "Funds" and formerly known as DWS Bond VIP, DWS Core Equity VIP, DWS Capital Growth VIP, DWS Global Small Cap Growth VIP and DWS International VIP, respectively). These financial statements report on Deutsche Global Small Cap VIP. The Series is intended to be the underlying investment vehicle for variable annuity contracts and variable life insurance policies to be offered by the separate accounts of certain life insurance companies ("Participating Insurance Companies").
Multiple Classes of Shares of Beneficial Interest. The Fund offers two classes of shares (Class A shares and Class B shares). Class B shares are subject to Rule 12b-1 distribution fees under the 1940 Act and recordkeeping fees equal to an annual rate of 0.25% and up to 0.15%, respectively, of the average daily net assets of the Class B shares of the Fund. Class A shares are not subject to such fees.
Investment income, realized and unrealized gains and losses, and certain fund-level expenses and expense reductions, if any, are borne pro rata on the basis of relative net assets by the holders of all classes of shares, except that each class bears certain expenses unique to that class (including the applicable 12b-1 distribution fees). Differences in class-level expenses may result in payment of different per share dividends by class. All shares have equal rights with respect to voting subject to class-specific arrangements.
The Fund's financial statements are prepared in accordance with accounting principles generally accepted in the United States of America, which require the use of management estimates. Actual results could differ from those estimates. The policies described below are followed consistently by the Fund in the preparation of its financial statements.
Security Valuation. Investments are stated at value determined as of the close of regular trading on the New York Stock Exchange on each day the exchange is open for trading.
Various inputs are used in determining the value of the Fund's investments. These inputs are summarized in three broad levels. Level 1 includes quoted prices in active markets for identical securities. Level 2 includes other significant observable inputs (including quoted prices for similar securities, interest rates, prepayment speeds and credit risk). Level 3 includes significant unobservable inputs (including the Fund's own assumptions in determining the fair value of investments). The level assigned to the securities valuations may not be an indication of the risk or liquidity associated with investing in those securities.
Equity securities are valued at the most recent sale price or official closing price reported on the exchange (U.S. or foreign) or over-the-counter market on which they trade. Securities for which no sales are reported are valued at the calculated mean between the most recent bid and asked quotations on the relevant market or, if a mean cannot be determined, at the most recent bid quotation. Equity securities are generally categorized as Level 1 securities. For certain international equity securities, in order to adjust for events which may occur between the close of the foreign exchanges and the close of the New York Stock Exchange, a fair valuation model may be used. This fair valuation model takes into account comparisons to the valuation of American Depository Receipts (ADRs), exchange-traded funds, futures contracts and certain indices and these securities are categorized as Level 2.
Investments in open-end investment companies are valued at their net asset value each business day and are categorized as Level 1.
Securities and other assets for which market quotations are not readily available or for which the above valuation procedures are deemed not to reflect fair value are valued in a manner that is intended to reflect their fair value as determined in accordance with procedures approved by the Trustees and are generally categorized as Level 3. In accordance with the Fund's valuation procedures, factors considered in determining value may include, but are not limited to, the type of the security; the size of the holding; the initial cost of the security; the existence of any contractual restrictions on the security's disposition; the price and extent of public trading in similar securities of the issuer or of comparable companies; quotations or evaluated prices from broker-dealers and/or pricing services; information obtained from the issuer, analysts, and/or the appropriate stock exchange (for exchange-traded securities); an analysis of the company's or issuer's financial statements; an evaluation of the forces that influence the issuer and the market(s) in which the security is purchased and sold; and with respect to debt securities, the maturity, coupon, creditworthiness, currency denomination and the movement of the market in which the security is normally traded. The value determined under these procedures may differ from published values for the same securities.
Disclosure about the classification of fair value measurements is included in a table following the Fund's Investment Portfolio.
Securities Lending. Deutsche Bank AG, as lending agent, lends securities of the Fund to certain financial institutions under the terms of the Security Lending Agreement. The Fund retains the benefits of owning the securities it has loaned and continues to receive interest and dividends generated by the securities and to participate in any changes in their market value. The Fund requires the borrowers of the securities to maintain collateral with the Fund consisting of either cash or liquid, unencumbered assets having a value at least equal to the value of the securities loaned. When the collateral falls below specified amounts, the lending agent will use its best effort to obtain additional collateral on the next business day to meet required amounts under the security lending agreement. The Fund may invest the cash collateral into a joint trading account in an affiliated money market fund pursuant to Exemptive Orders issued by the SEC. The Fund receives compensation for lending its securities either in the form of fees or by earning interest on invested cash collateral net of borrower rebates and fees paid to a lending agent. Either the Fund or the borrower may terminate the loan. There may be risks of delay and costs in recovery of securities or even loss of rights in the collateral should the borrower of the securities fail financially. If the Fund is not able to recover securities lent, the Fund may sell the collateral and purchase a replacement investment in the market, incurring the risk that the value of the replacement security is greater than the value of the collateral. The Fund is also subject to all investment risks associated with the reinvestment of any cash collateral received, including, but not limited to, interest rate, credit and liquidity risk associated with such investments.
As of June 30, 2014, the Fund had securities on loan. The value of the related collateral exceeded the value of the securities loaned at period end.
Foreign Currency Translations. The books and records of the Fund are maintained in U.S. dollars. Investment securities and other assets and liabilities denominated in a foreign currency are translated into U.S. dollars at the prevailing exchange rates at period end. Purchases and sales of investment securities, income and expenses are translated into U.S. dollars at the prevailing exchange rates on the respective dates of the transactions.
Net realized and unrealized gains and losses on foreign currency transactions represent net gains and losses between trade and settlement dates on securities transactions, the acquisition and disposition of foreign currencies, and the difference between the amount of net investment income accrued and the U.S. dollar amount actually received. That portion of both realized and unrealized gains and losses on investments that results from fluctuations in foreign currency exchange rates is not separately disclosed but is included with net realized and unrealized gain/appreciation and loss/depreciation on investments.
Taxes. The Fund is treated as a separate taxpayer as provided for in the Internal Revenue Code, as amended. It is the Fund's policy to comply with the requirements of the Internal Revenue Code, as amended, which are applicable to regulated investment companies, and to distribute all of its taxable income to the separate accounts of the Participating Insurance Companies which hold its shares.
Additionally, the Fund may be subject to taxes imposed by the governments of countries in which it invests and are generally based on income and/or capital gains earned or repatriated. Estimated tax liabilities on certain foreign securities are recorded on an accrual basis and are reflected as components of interest income or net change in unrealized gain/loss on investments. Tax liabilities realized as a result of security sales are reflected as a component of net realized gain/loss on investments.
The Fund has reviewed the tax positions for the open tax years as of December 31, 2013 and has determined that no provision for income tax and/or uncertain tax provisions is required in the Fund's financial statements. The Fund's federal tax returns for the prior three fiscal years remain open subject to examination by the Internal Revenue Service.
Distribution of Income and Gains. Distributions from net investment income of the Fund, if any, are declared and distributed to shareholders annually. Net realized gains from investment transactions, in excess of available capital loss carryforwards, would be taxable to the Fund if not distributed, and, therefore, will be distributed to shareholders at least annually. The Fund may also make additional distributions for tax purposes if necessary.
The timing and characterization of certain income and capital gain distributions are determined annually in accordance with federal tax regulations which may differ from accounting principles generally accepted in the United States of America. These differences primarily relate to income received from passive foreign investment companies and certain securities sold at a loss. As a result, net investment income (loss) and net realized gain (loss) on investment transactions for a reporting period may differ significantly from distributions during such period. Accordingly, the Fund may periodically make reclassifications among certain of its capital accounts without impacting the net asset value of the Fund.
The tax character of current year distributions will be determined at the end of the current fiscal year.
Expenses. Expenses of the Series arising in connection with a specific Fund are allocated to that Fund. Other Series expenses which cannot be directly attributed to a Fund are apportioned among the Funds in the Series based upon the relative net assets or other appropriate measures.
Contingencies. In the normal course of business, the Fund may enter into contracts with service providers that contain general indemnification clauses. The Fund's maximum exposure under these arrangements is unknown as this would involve future claims that may be made against the Fund that have not yet been made. However, based on experience, the Fund expects the risk of loss to be remote.
Other. Investment transactions are accounted for on a trade date plus one basis for daily net asset value calculations. However, for financial reporting purposes, investment transactions are reported on trade date. Interest income is recorded on the accrual basis net of foreign withholding taxes. Dividend income is recorded on the ex-dividend date net of foreign withholding taxes. Certain dividends from foreign securities may be recorded subsequent to the ex-dividend date as soon as the Fund is informed of such dividends. Realized gains and losses from investment transactions are recorded on an identified cost basis. Proceeds from litigation payments, if any, are included in net realized gain (loss) from investments.
B. Purchases and Sales of Securities
During the six months ended June 30, 2014, purchases and sales of investment securities (excluding short-term investments) aggregated $34,060,662 and $39,437,883, respectively.
C. Related Parties
Management Agreement. Under the Investment Management Agreement with Deutsche Investment Management Americas Inc. ("DIMA" or the "Advisor"), an indirect, wholly owned subsidiary of Deutsche Bank AG, the Advisor directs the investments of the Fund in accordance with its investment objectives, policies and restrictions. The Advisor determines the securities, instruments and other contracts relating to investments to be purchased, sold or entered into by the Fund.
Pursuant to the Investment Management Agreement with the Advisor, the Fund pays a monthly management fee based on the Fund's average daily net assets, computed and accrued daily and payable monthly, at the following annual rates:
| First $500 million of average daily net assets | | | .890 | % |
| Next $500 million of average daily net assets | | | .875 | % |
| Next $1 billion of average daily net assets | | | .860 | % |
| Over $2 billion of average daily net assets | | | .845 | % |
Accordingly, for the six months ended June 30, 2014, the fee pursuant to the Investment Management agreement was equivalent to an annualized effective rate (exclusive of any applicable waivers/reimbursements) of 0.89% of the Fund's average daily net assets.
For the period from January 1, 2013 through April 30, 2014, the Advisor had contractually agreed to waive all or a portion of its fees and/or reimburse certain operating expenses of the Fund to the extent necessary to maintain the operating expenses (excluding certain expenses such as extraordinary expenses, taxes, brokerage and interest) of each class as follows:
For the period from May 1, 2014 through April 30, 2015, the Advisor has contractually agreed to waive all or a portion of its fees and/or reimburse certain operating expenses of the Fund to the extent necessary to maintain the operating expenses (excluding certain expenses such as extraordinary expenses, taxes, brokerage and interest) of each class as follows:
For the six months ended June 30, 2014, fees waived and/or expenses reimbursed for each class are as follows:
| Class A | | $ | 123,467 | |
| Class B | | | 2,284 | |
| | | $ | 125,751 | |
Administration Fee. Pursuant to an Administrative Services Agreement, DIMA provides most administrative services to the Fund. For all services provided under the Administrative Services Agreement, the Fund pays the Advisor an annual fee ("Administration Fee") of 0.10% of the Fund's average daily net assets, computed and accrued daily and payable monthly. For the six months ended June 30, 2014, the Administration Fee was $76,937, of which $12,697 is unpaid.
Service Provider Fees. DeAWM Service Company ("DSC"), an affiliate of the Advisor, is the transfer agent, dividend-paying agent and shareholder service agent for the Fund. Pursuant to a sub-transfer agency agreement between DSC and DST Systems, Inc. ("DST"), DSC has delegated certain transfer agent, dividend-paying agent and shareholder service agent functions to DST. DSC compensates DST out of the shareholder servicing fee it receives from the Fund. For the six months ended June 30, 2014, the amounts charged to the Fund by DSC were as follows:
| Services to Shareholders | | Total Aggregated | | | Unpaid at June 30, 2014 | |
| Class A | | $ | 211 | | | $ | 104 | |
| Class B | | | 106 | | | | 73 | |
| | | $ | 317 | | | $ | 177 | |
Distribution Service Agreement. DeAWM Distributors, Inc. ("DDI"), also an affiliate of the Advisor, is the Series' Distributor. In accordance with the Master Distribution Plan, DDI receives 12b-1 fees of 0.25% of average daily net assets of Class B shares. Pursuant to the Master Distribution Plan, DDI remits these fees to the Participating Insurance Companies for various costs incurred or paid by these companies in connection with marketing and distribution of Class B shares. For the six months ended June 30, 2014, the Distribution Service Fee aggregated $3,500, of which $628 is unpaid.
Typesetting and Filing Service Fees. Under an agreement with DIMA, DIMA is compensated for providing typesetting and certain regulatory filing services to the Fund. For the six months ended June 30, 2014, the amount charged to the Fund by DIMA included in the Statement of Operations under "reports to shareholders" aggregated $7,422, of which $1,076 is unpaid.
Trustees' Fees and Expenses. The Fund paid retainer fees to each Trustee not affiliated with the Advisor, plus specified amounts to the Board Chairperson and Vice Chairperson and to each committee Chairperson.
Affiliated Cash Management Vehicles. The Fund may invest uninvested cash balances in Central Cash Management Fund and Deutsche Variable NAV Money Fund, affiliated money market funds which are managed by the Advisor. Each affiliated money market fund seeks to provide a high level of current income consistent with liquidity and the preservation of capital. Each affiliated money market fund is managed in accordance with Rule 2a-7 under the Investment Company Act of 1940, which governs the quality, maturity, diversity and liquidity of instruments in which a money market fund may invest. Central Cash Management Fund seeks to maintain a stable net asset value, and Deutsche Variable NAV Money Fund maintains a floating net asset value. The Fund indirectly bears its proportionate share of the expenses of each affiliated money market fund in which it invests. Central Cash Management Fund does not pay the Advisor an investment management fee. To the extent that Deutsche Variable NAV Money Fund pays an investment management fee to the Advisor, the Advisor will waive an amount of the investment management fee payable to the Advisor by the Fund equal to the amount of the investment management fee payable on the Fund's assets invested in Deutsche Variable NAV Money Fund.
Securities Lending Agent Fees. Deutsche Bank AG serves as securities lending agent for the Fund. For the six months ended June 30, 2014, the Fund incurred securities lending agent fees to Deutsche Bank AG in the amount of $3,189.
D. Ownership of the Fund
At June 30, 2014, four participating insurance companies were owners of record of 10% or more of the total outstanding Class A shares of the Fund, each owning 52%, 15%, 10% and 10%, respectively. Three participating insurance companies were owners of record of 10% or more of the total outstanding Class B shares of the Fund, each owning 67%, 18% and 11%, respectively.
E. Line of Credit
The Fund and other affiliated funds (the "Participants") share in a $400 million revolving credit facility provided by a syndication of banks. The Fund may borrow for temporary or emergency purposes, including the meeting of redemption requests that otherwise might require the untimely disposition of securities. The Participants are charged an annual commitment fee which is allocated based on net assets, among each of the Participants. Interest is calculated at a rate per annum equal to the sum of the Federal Funds Rate plus 1.25 percent plus if LIBOR exceeds the Federal Funds Rate the amount of such excess. The Fund may borrow up to a maximum of 33 percent of its net assets under the agreement. The Fund had no outstanding loans at June 30, 2014.
F. Fund Name Change
Effective August 11, 2014, the "DWS Funds" were rebranded "Deutsche Funds."
Information About Your Fund's Expenses (Unaudited)
As an investor of the Fund, you incur two types of costs: ongoing expenses and transaction costs. Ongoing expenses include management fees, distribution and service (12b-1) fees and other Fund expenses. Examples of transaction costs include contract charges, redemption fees and account maintenance fees, which are not shown in this section. The following tables are intended to help you understand your ongoing expenses (in dollars) of investing in the Fund and to help you compare these expenses with the ongoing expenses of investing in other mutual funds. In the most recent six-month period, the Fund limited these expenses; had it not done so, expenses would have been higher. The example in the table is based on an investment of $1,000 invested at the beginning of the six-month period and held for the entire period (January 1, 2014 to June 30, 2014).
The tables illustrate your Fund's expenses in two ways:
—Actual Fund Return. This helps you estimate the actual dollar amount of ongoing expenses (but not transaction costs) paid on a $1,000 investment in the Fund using the Fund's actual return during the period. To estimate the expenses you paid over the period, simply divide your account value by $1,000 (for example, an $8,600 account value divided by $1,000 = 8.6), then multiply the result by the number in the "Expenses Paid per $1,000" line under the share class you hold.
—Hypothetical 5% Fund Return. This helps you to compare your Fund's ongoing expenses (but not transaction costs) with those of other mutual funds using the Fund's actual expense ratio and a hypothetical rate of return of 5% per year before expenses. Examples using a 5% hypothetical Fund return may be found in the shareholder reports of other mutual funds. The hypothetical account values and expenses may not be used to estimate the actual ending account balance or expenses you paid for the period.
Please note that the expenses shown in these tables are meant to highlight your ongoing expenses only and do not reflect any transaction costs. The "Expenses Paid per $1,000" line of the tables is useful in comparing ongoing expenses only and will not help you determine the relative total expense of owning different funds. If these transaction costs had been included, your costs would have been higher.
Expenses and Value of a $1,000 Investment for the six months ended June 30, 2014 | |
| Actual Fund Return | | Class A | | | Class B | |
| Beginning Account Value 1/1/14 | | $ | 1,000.00 | | | $ | 1,000.00 | |
| Ending Account Value 6/30/14 | | $ | 1,028,90 | | | $ | 1,027.70 | |
| Expenses Paid per $1,000* | | $ | 4.83 | | | $ | 6.18 | |
| Hypothetical 5% Fund Return | | Class A | | | Class B | |
| Beginning Account Value 1/1/14 | | $ | 1,000.00 | | | $ | 1,000.00 | |
| Ending Account Value 6/30/14 | | $ | 1,020.03 | | | $ | 1,018.70 | |
| Expenses Paid per $1,000* | | $ | 4.81 | | | $ | 6.16 | |
* Expenses are equal to the Fund's annualized expense ratio for each share class, multiplied by the average account value over the period, multiplied by 181 (the number of days in the most recent six-month period), then divided by 365.
| Annualized Expense Ratios | | Class A | | Class B | |
| Deutsche Variable Series I — Deutsche Global Small Cap VIP | | .96% | | 1.23% | |
For more information, please refer to the Fund's prospectus.
These tables do not reflect charges and fees ("contract charges") associated with the separate account that invests in the Fund or any variable life insurance policy or variable annuity contract for which the Fund is an investment option.
For an analysis of the fees associated with an investment in the fund or similar funds, please refer to the current and hypothetical expense calculators for Variable Insurance Products which can be found at deutschefunds.com/EN/resources/calculators.jsp.
The Series' policies and procedures for voting proxies for portfolio securities and information about how the Series voted proxies related to its portfolio securities during the 12-month period ended June 30 are available on our Web site — deutschefunds.com (click on "proxy voting"at the bottom of the page) — or on the SEC's Web site — sec.gov. To obtain a written copy of the Series' policies and procedures without charge, upon request, call us toll free at (800) 728-3337.
Advisory Agreement Board Considerations and Fee Evaluation
The Board of Trustees approved the renewal of DWS Global Small Cap VIP's (formerly DWS Global Small Cap Growth VIP's) investment management agreement (the "Agreement") with Deutsche Investment Management Americas Inc. ("DIMA") in September 2013.
In terms of the process that the Board followed prior to approving the Agreement, shareholders should know that:
— In September 2013, all of the Fund's Trustees were independent of DIMA and its affiliates.
— The Trustees met frequently during the past year to discuss fund matters and dedicated a substantial amount of time to contract review matters. Over the course of several months, the Board's Contract Committee, in coordination with the Board's Equity Oversight Committee, reviewed comprehensive materials received from DIMA, independent third parties and independent counsel. These materials included an analysis of the Fund's performance, fees and expenses, and profitability compiled by a fee consultant retained by the Fund's Independent Trustees (the "Fee Consultant"). The Board also received extensive information throughout the year regarding performance of the Fund.
— The Independent Trustees regularly meet privately with their independent counsel to discuss contract review and other matters. In addition, the Independent Trustees were also advised by the Fee Consultant in the course of their review of the Fund's contractual arrangements and considered a comprehensive report prepared by the Fee Consultant in connection with their deliberations.
— In connection with reviewing the Agreement, the Board also reviewed the terms of the Fund's Rule 12b-1 plan, distribution agreement, administrative services agreement, transfer agency agreement and other material service agreements.
— Based on its evaluation of the information provided, the Contract Committee presented its findings and recommendations to the Board. The Board then reviewed the Contract Committee's findings and recommendations.
In connection with the contract review process, the Contract Committee and the Board considered the factors discussed below, among others. The Board also considered that DIMA and its predecessors have managed the Fund since its inception, and the Board believes that a long-term relationship with a capable, conscientious advisor is in the best interests of the Fund. The Board considered, generally, that shareholders chose to invest or remain invested in the Fund knowing that DIMA managed the Fund, and that the Agreement was approved by the Fund's shareholders. DIMA is part of Deutsche Bank AG, a major global banking institution that is engaged in a wide range of financial services. The Board believes that there are advantages to being part of a global asset management business that offers a wide range of investing expertise and resources, including hundreds of portfolio managers and analysts with research capabilities in many countries throughout the world.
As part of the contract review process, the Board carefully considered the fees and expenses of each DWS fund overseen by the Board in light of the fund's performance. In many cases, this led to a negotiation with DIMA of lower expense caps as part of the 2012 and 2013 contract review processes than had previously been in place. As part of these negotiations, the Board indicated that it would consider relaxing these new lower caps in future years following sustained improvements in performance, among other considerations.
In June 2012, Deutsche Bank AG ("DB"), DIMA's parent company, announced that DB would combine its Asset Management (of which DIMA was a part) and Wealth Management divisions. DB has advised the Independent Trustees that the U.S. asset management business is a critical and integral part of DB, and that it has, and will continue to, reinvest a significant portion of the substantial savings it expects to realize by combining its Asset Management and Wealth Management divisions into the new Asset and Wealth Management ("AWM") division, including ongoing enhancements to its investment capabilities. DB also has confirmed its commitment to maintaining strong legal and compliance groups within the AWM division.
While shareholders may focus primarily on fund performance and fees, the Fund's Board considers these and many other factors, including the quality and integrity of DIMA's personnel and such other issues as back-office operations, fund valuations, and compliance policies and procedures.
Nature, Quality and Extent of Services. The Board considered the terms of the Agreement, including the scope of advisory services provided under the Agreement. The Board noted that, under the Agreement, DIMA provides portfolio management services to the Fund and that, pursuant to a separate administrative services agreement, DIMA provides administrative services to the Fund. The Board considered the experience and skills of senior management and investment personnel, the resources made available to such personnel, the ability of DIMA to attract and retain high-quality personnel, and the organizational depth and stability of DIMA. The Board reviewed the Fund's performance over short-term and long-term periods and compared those returns to various agreed-upon performance measures, including market indices and a peer universe compiled by the Fee Consultant using information supplied by Morningstar Direct ("Morningstar"), an independent fund data service. The Board also noted that it has put into place a process of identifying "Focus Funds" (e.g., funds performing poorly relative to their benchmark or a peer universe compiled by an independent fund data service), and receives more frequent reporting and information from DIMA regarding such funds, along with DIMA's remedial plans to address underperformance. The Board believes this process is an effective manner of identifying and addressing underperforming funds. Based on the information provided, the Board noted that for the one-, three- and five-year periods ended December 31, 2012, the Fund's performance (Class A shares) was in the 4th quartile, 1st quartile and 3rd quartile, respectively, of the applicable Morningstar universe (the 1st quartile being the best performers and the 4th quartile being the worst performers). The Board also observed that the Fund has underperformed its benchmark in each of the one-, three- and five-year periods ended December 31, 2012. The Board noted the disappointing investment performance of the Fund in recent periods and continued to discuss with senior management of DIMA the factors contributing to such underperformance and actions being taken to improve performance. The Board observed that the Fund had experienced improved relative performance during the first seven months of 2013. The Board recognized the efforts by DIMA in recent years to enhance its investment platform and improve long-term performance across the DWS fund complex.
Fees and Expenses. The Board considered the Fund's investment management fee schedule, operating expenses and total expense ratios, and comparative information provided by Lipper Inc. ("Lipper") and the Fee Consultant regarding investment management fee rates paid to other investment advisors by similar funds (1st quartile being the most favorable and 4th quartile being the least favorable). With respect to management fees paid to other investment advisors by similar funds, the Board noted that the contractual fee rates paid by the Fund, which include a 0.10% fee paid to DIMA under the Fund's administrative services agreement, were higher than the median (4th quartile) of the applicable Lipper peer group (based on Lipper data provided as of December 31, 2012). The Board noted that the Fund's Class A shares total (net) operating expenses were expected to be higher than the median (3rd quartile) of the applicable Lipper expense universe (based on Lipper data provided as of December 31, 2012) ("Lipper Universe Expenses"). The Board also reviewed data comparing each share class's total (net) operating expenses to the applicable Lipper Universe Expenses. The Board considered the Fund's management fee rate as compared to fees charged by DIMA to comparable funds and considered differences between the Fund and the comparable funds. The Board also considered how the Fund's total (net) operating expenses compared to the total (net) operating expenses of a more customized peer group selected by Lipper (based on such factors as asset size).
The Board also noted that the expense limitations agreed to by DIMA helped to ensure that the Fund's total (net) operating expenses would remain competitive.
The information considered by the Board as part of its review of management fees included information regarding fees charged by DIMA and its affiliates to similar institutional accounts and to similar funds offered primarily to European investors ("DWS Europe funds"), in each case as applicable. The Board observed that advisory fee rates for institutional accounts generally were lower than the management fees charged by similarly managed DWS U.S. mutual funds ("DWS Funds"), but also took note of the differences in services provided to DWS Funds as compared to institutional accounts. In the case of DWS Europe funds, the Board observed that fee rates for DWS Europe funds generally were higher than for similarly managed DWS Funds, but noted that differences in the types of services provided to DWS Funds relative to DWS Europe funds made it difficult to compare such fees.
On the basis of the information provided, the Board concluded that management fees were reasonable and appropriate in light of the nature, quality and extent of services provided by DIMA.
Profitability. The Board reviewed detailed information regarding revenues received by DIMA under the Agreement. The Board considered the estimated costs and pre-tax profits realized by DIMA from advising the DWS Funds, as well as estimates of the pre-tax profits attributable to managing the Fund in particular. The Board also received information regarding the estimated enterprise-wide profitability of DWS and its affiliates with respect to all fund services in totality and by fund. The Board and the Fee Consultant reviewed DIMA's methodology in allocating its costs to the management of the Fund. Based on the information provided, the Board concluded that the pre-tax profits realized by DIMA in connection with the management of the Fund were not unreasonable. The Board also reviewed information regarding the profitability of certain similar investment management firms. The Board noted that while information regarding the profitability of such firms is limited (and in some cases is not necessarily prepared on a comparable basis), DIMA and its affiliates' overall profitability with respect to the DWS fund complex (after taking into account distribution and other services provided to the funds by DIMA and its affiliates) was lower than the overall profitability levels of many comparable firms for which such data was available.
Economies of Scale. The Board considered whether there are economies of scale with respect to the management of the Fund and whether the Fund benefits from any economies of scale. The Board noted that the Fund's management fee schedule includes fee breakpoints. The Board concluded that the Fund's fee schedule represents an appropriate sharing between the Fund and DIMA of such economies of scale as may exist in the management of the Fund at current asset levels.
Other Benefits to DIMA and Its Affiliates. The Board also considered the character and amount of other incidental benefits received by DIMA and its affiliates, including any fees received by DIMA for administrative services provided to the Fund and any fees received by an affiliate of DIMA for distribution services. The Board also considered benefits to DIMA related to brokerage and soft-dollar allocations, including allocating brokerage to pay for research generated by parties other than the executing broker dealers, which pertain primarily to funds investing in equity securities, along with the incidental public relations benefits to DIMA related to DWS Funds advertising and cross-selling opportunities among DIMA products and services. The Board concluded that management fees were reasonable in light of these fallout benefits.
Compliance. The Board considered the significant attention and resources dedicated by DIMA to documenting and enhancing its compliance processes in recent years. The Board noted in particular (i) the experience and seniority of both DIMA's chief compliance officer and the Fund's chief compliance officer; (ii) the large number of DIMA compliance personnel; and (iii) the substantial commitment of resources by DIMA and its affiliates to compliance matters.
Based on all of the information considered and the conclusions reached, the Board unanimously determined that the continuation of the Agreement is in the best interests of the Fund. In making this determination, the Board did not give particular weight to any single factor identified above. The Board considered these factors over the course of numerous meetings, certain of which were in executive session with only the Independent Trustees and their independent counsel present. It is possible that individual Trustees may have weighed these factors differently in reaching their individual decisions to approve the continuation of the Agreement.
DeAWM Distributors, Inc.
222 South Riverside Plaza
Chicago, IL 60606
(800) 621-1148
VS1gloscg-3 (R-028377-3 8/14)
June 30, 2014
Semiannual Report
Deutsche Variable Series I
(formerly DWS Variable Series I)
Deutsche International VIP
(formerly DWS International VIP)
Contents
7 Statement of Assets and Liabilities 8 Statement of Operations 9 Statement of Changes in Net Assets 12 Notes to Financial Statements 17 Information About Your Fund's Expenses 19 Advisory Agreement Board Considerations and Fee Evaluation |
This report must be preceded or accompanied by a prospectus. To obtain an additional prospectus or summary prospectus, if available, call (800) 728-3337 or your financial representative. We advise you to consider the Fund's objectives, risks, charges and expenses carefully before investing. The summary prospectus and prospectus contain this and other important information about the Fund. Please read the prospectus carefully before you invest.
The fund will be managed on the premise that stocks with lower CROCI® Economic P/E Ratios may outperform stocks with higher CROCI® Economic P/E Ratios over time. This premise may not always be correct and prospective investors should evaluate this assumption prior to investing in the fund. Investing in derivatives entails special risks relating to liquidity, leverage and credit that may reduce returns and/or increase volatility. Investing in foreign securities, particularly those of emerging markets, presents certain risks, such as currency fluctuations, political and economic changes, and market risks. The fund may lend securities to approved institutions. Stocks may decline in value. See the prospectus for details.
Deutsche Asset & Wealth Management represents the asset management and wealth management activities conducted by Deutsche Bank AG or any of its subsidiaries, including the Advisor and DeAWM Distributors, Inc.
NOT FDIC/NCUA INSURED NO BANK GUARANTEE MAY LOSE VALUE NOT A DEPOSIT
NOT INSURED BY ANY FEDERAL GOVERNMENT AGENCY
Dear Shareholder:
I am very pleased to tell you that the DWS funds have been renamed Deutsche funds, aligning more closely with the Deutsche Asset & Wealth Management brand. We are proud to adopt the Deutsche name — a brand that fully represents the global access, discipline and intelligence that support all of our products and services.
Deutsche Asset & Wealth Management combines the asset management and wealth management divisions of Deutsche Bank to deliver a comprehensive suite of active, passive and alternative investment capabilities. Your investment in the Deutsche funds means you have access to the thought leadership and resources of one of the world’s largest and most influential financial institutions.
In conjunction with your fund’s name change, please note that the Deutsche funds’ Web address has changed as well. The former dws-investments.com is now deutschefunds.com.
In addition, key service providers have been renamed as follows:
| Former Name | New name, effective August 11, 2014 |
| DWS Investments Distributors, Inc. | DeAWM Distributors, Inc. |
| DWS Trust Company | DeAWM Trust Company |
| DWS Investments Service Company | DeAWM Service Company |
These changes have no effect on the day-to-day management of your investment, and there is no action required on your part. You will continue to experience the benefits that come from our decades of experience, in-depth research and worldwide network of investment professionals.
Thanks for your continued support. We appreciate your trust and the opportunity to put our capabilities to work for you.
Best regards,
Brian Binder
President, Deutsche Funds
Performance Summary June 30, 2014 (Unaudited)
Fund performance shown is historical, assumes reinvestment of all dividend and capital gain distributions, and does not guarantee future results. Investment return and principal value fluctuate with changing market conditions so that, when redeemed, shares may be worth more or less than their original cost. Current performance may be lower or higher than the performance data quoted. Please contact your participating insurance company for the Fund's most recent month-end performance. Performance doesn't reflect charges and fees ("contract charges") associated with the separate account that invests in the Fund or any variable life insurance policy or variable annuity contract for which the Fund is an investment option. These charges and fees will reduce returns. While all share classes have the same underlying portfolio, their performance will differ.
The gross expense ratios of the Fund, as stated in the fee table of the prospectus dated May 1, 2014 are 1.02% and 1.30% for Class A and Class B shares, respectively, and may differ from the expense ratios disclosed in the Financial Highlights tables in this report.
| Growth of an Assumed $10,000 Investment |
| MSCI EAFE Index is an unmanaged index that tracks international stock performance in the 22 developed markets of Europe, Australasia and the Far East. Returns reflect reinvestment of dividends net of withholding taxes. The index is calculated using closing local market prices and translates into U.S. dollars using the London close foreign exchange rates. Index returns do not reflect any fees or expenses and it is not possible to invest directly into an index. |
| |
| Yearly periods ended June 30 | |
| Comparative Results | |
| Deutsche International VIP | | 6-Month‡ | | | 1-Year | | | 3-Year | | | 5-Year | | | 10-Year | |
| Class A | Growth of $10,000 | | $ | 10,193 | | | $ | 11,916 | | | $ | 12,035 | | | $ | 15,551 | | | $ | 16,548 | |
| Average annual total return | | | 1.93 | % | | | 19.16 | % | | | 6.37 | % | | | 9.23 | % | | | 5.17 | % |
MSCI EAFE® Index | Growth of $10,000 | | $ | 10,478 | | | $ | 12,357 | | | $ | 12,631 | | | $ | 17,441 | | | $ | 19,549 | |
| Average annual total return | | | 4.78 | % | | | 23.57 | % | | | 8.10 | % | | | 11.77 | % | | | 6.93 | % |
| Deutsche International VIP | | 6-Month‡ | | | 1-Year | | | 3-Year | | | 5-Year | | | 10-Year | |
| Class B | Growth of $10,000 | | $ | 10,177 | | | $ | 11,880 | | | $ | 11,947 | | | $ | 15,347 | | | $ | 16,080 | |
| Average annual total return | | | 1.77 | % | | | 18.80 | % | | | 6.11 | % | | | 8.94 | % | | | 4.86 | % |
MSCI EAFE® Index | Growth of $10,000 | | $ | 10,478 | | | $ | 12,357 | | | $ | 12,631 | | | $ | 17,441 | | | $ | 19,549 | |
| Average annual total return | | | 4.78 | % | | | 23.57 | % | | | 8.10 | % | | | 11.77 | % | | | 6.93 | % |
The growth of $10,000 is cumulative.
‡ Total returns shown for periods less than one year are not annualized.
Portfolio Summary (Unaudited) Asset Allocation (As a % of Investment Portfolio excluding Securities Lending Collateral) | 6/30/14 | 12/31/13 |
| | | |
| Common Stocks | 99% | 97% |
| Cash Equivalents | 1% | 3% |
| | 100% | 100% |
Geographical Diversification
(As a % of Investment Portfolio excluding Cash Equivalents and Securities Lending Collateral) | 6/30/14 | 12/31/13 |
| | | |
| Continental Europe | 42% | 53% |
| United Kingdom | 25% | 15% |
| Japan | 21% | 20% |
| Asia (excluding Japan) | 6% | 4% |
| Australia | 6% | 8% |
| | 100% | 100% |
Sector Diversification
(As a % of Investment Portfolio excluding Cash Equivalents and Securities Lending Collateral) | 6/30/14 | 12/31/13 |
| | | |
| Materials | 24% | 6% |
| Industrials | 18% | 13% |
| Energy | 16% | 6% |
| Health Care | 14% | 9% |
| Utilities | 12% | 4% |
| Consumer Discretionary | 8% | 14% |
| Information Technology | 4% | 5% |
| Telecommunication Services | 2% | 8% |
| Consumer Staples | 2% | 9% |
| Financials | — | 26% |
| | 100% | 100% |
Portfolio holdings and characteristics are subject to change.
For more complete details about the Fund's investment portfolio, see page 6.
Following the Fund's fiscal first and third quarter-end, a complete portfolio holdings listing is filed with the SEC on Form N-Q. The form will be available on the SEC's Web site at sec.gov, and it also may be reviewed and copied at the SEC's Public Reference Room in Washington, D.C. Information on the operation of the SEC's Public Reference Room may be obtained by calling (800) SEC-0330. The Fund's portfolio holdings are also posted on deutschefunds.com from time to time. Please see the Fund's current prospectus for more information.
Di Kumble, CFA
Portfolio Manager
Investment Portfolio June 30, 2014 (Unaudited) | | | Shares | | | Value ($) | |
| | | | |
| Common Stocks 98.9% | |
| Australia 5.7% | |
| BHP Billiton Ltd. | | | 82,484 | | | | 2,792,240 | |
| Origin Energy Ltd. | | | 208,243 | | | | 2,870,822 | |
| Woodside Petroleum Ltd. | | | 76,038 | | | | 2,944,719 | |
| (Cost $8,416,114) | | | | 8,607,781 | |
| Austria 1.9% | |
| OMV AG (Cost $2,933,852) | | | 63,932 | | | | 2,888,890 | |
| Denmark 2.1% | |
| A P Moller-Maersk AS "B" (Cost $2,922,656) | | | 1,246 | | | | 3,096,207 | |
| Finland 2.4% | |
| Fortum Oyj (Cost $2,805,274) | | | 131,056 | | | | 3,519,113 | |
| France 5.9% | |
| GDF Suez | | | 109,812 | | | | 3,023,100 | |
| Sanofi | | | 27,044 | | | | 2,872,893 | |
| Total SA | | | 41,480 | | | | 2,997,829 | |
| (Cost $8,174,611) | | | | 8,893,822 | |
| Germany 9.8% | |
| Continental AG | | | 12,520 | | | | 2,899,846 | |
| E.ON SE | | | 152,016 | | | | 3,138,986 | |
| Hochtief AG | | | 31,243 | | | | 2,704,190 | |
| K+S AG (Registered) (a) | | | 86,269 | | | | 2,836,848 | |
| Merck KGaA | | | 34,802 | | | | 3,020,812 | |
| (Cost $14,505,718) | | | | 14,600,682 | |
| Hong Kong 2.0% | |
| CLP Holdings Ltd. (Cost $2,914,261) | | | 365,000 | | | | 2,985,781 | |
| Japan 20.7% | |
| Asahi Kasei Corp. | | | 426,000 | | | | 3,258,970 | |
| Bridgestone Corp. (a) | | | 79,500 | | | | 2,781,970 | |
| Daiichi Sankyo Co., Ltd. | | | 172,800 | | | | 3,223,849 | |
| Kyocera Corp. | | | 63,700 | | | | 3,023,243 | |
| Nitto Denko Corp. | | | 65,400 | | | | 3,064,546 | |
| Otsuka Holdings Co., Ltd. | | | 100,700 | | | | 3,121,248 | |
| Sekisui House Ltd. | | | 241,100 | | | | 3,305,739 | |
| Sumitomo Chemical Co., Ltd. | | | 775,000 | | | | 2,930,013 | |
| Sumitomo Metal Mining Co., Ltd. | | | 189,000 | | | | 3,069,000 | |
| Toyota Industries Corp. | | | 62,200 | | | | 3,211,154 | |
| (Cost $28,369,482) | | | | 30,989,732 | |
| Luxembourg 2.0% | |
| Tenaris SA (Cost $2,904,467) | | | 128,001 | | | | 3,014,675 | |
| Netherlands 6.0% | |
| Koninklijke (Royal) KPN NV* | | | 852,293 | | | | 3,105,507 | |
| Koninklijke Ahold NV | | | 152,516 | | | | 2,863,199 | |
| Koninklijke DSM NV | | | 40,537 | | | | 2,952,435 | |
| (Cost $8,744,183) | | | | 8,921,141 | |
| | | Shares | | | Value ($) | |
| | | | | | | | | |
| Norway 2.0% | |
| Statoil ASA (Cost $2,982,537) | | | 99,867 | | | | 3,067,395 | |
| Singapore 4.0% | |
| Keppel Corp., Ltd. | | | 345,000 | | | | 2,985,444 | |
| Singapore Airlines Ltd. | | | 354,000 | | | | 2,941,246 | |
| (Cost $5,832,638) | | | | 5,926,690 | |
| Sweden 3.9% | |
| Atlas Copco AB "A" | | | 99,391 | | | | 2,872,448 | |
| Telefonaktiebolaget LM Ericsson "B" | | | 240,944 | | | | 2,911,933 | |
| (Cost $5,794,181) | | | | 5,784,381 | |
| Switzerland 5.9% | |
| Novartis AG (Registered) | | | 33,982 | | | | 3,077,080 | |
| Syngenta AG (Registered) | | | 7,422 | | | | 2,764,419 | |
| Transocean Ltd. (a) (b) | | | 67,600 | | | | 3,044,028 | |
| (Cost $8,706,494) | | | | 8,885,527 | |
| United Kingdom 24.6% | |
| Anglo American PLC | | | 113,191 | | | | 2,770,125 | |
| Antofagasta PLC | | | 218,333 | | | | 2,850,988 | |
| AstraZeneca PLC | | | 36,845 | | | | 2,736,968 | |
| BAE Systems PLC | | | 428,771 | | | | 3,176,614 | |
| Centrica PLC | | | 516,793 | | | | 2,764,758 | |
| easyJet PLC | | | 105,613 | | | | 2,467,184 | |
| GlaxoSmithKline PLC | | | 104,015 | | | | 2,784,096 | |
| Petrofac Ltd. | | | 119,070 | | | | 2,451,430 | |
| Rexam PLC | | | 308,255 | | | | 2,822,380 | |
| Rio Tinto PLC | | | 53,975 | | | | 2,871,409 | |
| Rolls-Royce Holdings PLC* | | | 167,744 | | | | 3,068,854 | |
| Smiths Group PLC | | | 133,285 | | | | 2,958,508 | |
| SSE PLC | | | 114,625 | | | | 3,073,971 | |
| (Cost $37,658,633) | | | | 36,797,285 | |
Total Common Stocks (Cost $143,665,101) | | | | 147,979,102 | |
| | |
| Securities Lending Collateral 6.0% | |
| Daily Assets Fund Institutional, 0.08% (c) (d) (Cost $8,945,664) | | | 8,945,664 | | | | 8,945,664 | |
| | |
| Cash Equivalents 0.9% | |
| Central Cash Management Fund, 0.06% (c) (Cost $1,403,095) | | | 1,403,095 | | | | 1,403,095 | |
| | | % of Net Assets | | | Value ($) | |
| | | | |
Total Investment Portfolio (Cost $154,013,860)† | | | 105.8 | | | | 158,327,861 | |
| Other Assets and Liabilities, Net | | | (5.8 | ) | | | (8,617,698 | ) |
| Net Assets | | | 100.0 | | | | 149,710,163 | |
* Non-income producing security.
† The cost for federal income tax purposes was $154,035,993. At June 30, 2014, net unrealized appreciation for all securities based on tax cost was $4,291,868. This consisted of aggregate gross unrealized appreciation for all securities in which there was an excess of value over tax cost of $6,442,610 and aggregate gross unrealized depreciation for all securities in which there was an excess of tax cost over value of $2,150,742.
(a) All or a portion of these securities were on loan. In addition, "Other Assets and Liabilities, Net" may include pending sales that are also on loan. The value of securities loaned at June 30, 2014 amounted to $8,656,326, which is 5.8% of net assets.
(b) Listed on the New York Stock Exchange.
(c) Affiliated fund managed by Deutsche Investment Management Americas Inc. The rate shown is the annualized seven-day yield at period end.
(d) Represents collateral held in connection with securities lending. Income earned by the Fund is net of borrower rebates.
Fair Value Measurements
Various inputs are used in determining the value of the Fund's investments. These inputs are summarized in three broad levels. Level 1 includes quoted prices in active markets for identical securities. Level 2 includes other significant observable inputs (including quoted prices for similar securities, interest rates, prepayment speeds and credit risk). Level 3 includes significant unobservable inputs (including the Fund's own assumptions in determining the fair value of investments). The level assigned to the securities valuations may not be an indication of the risk or liquidity associated with investing in those securities.
The following is a summary of the inputs used as of June 30, 2014 in valuing the Fund's investments. For information on the Fund's policy regarding the valuation of investments, please refer to the Security Valuation section of Note A in the accompanying Notes to Financial Statements.
| Assets | | Level 1 | | | Level 2 | | | Level 3 | | | Total | |
| | |
| Common Stocks | |
| Australia | | $ | — | | | $ | 8,607,781 | | | $ | — | | | $ | 8,607,781 | |
| Austria | | | — | | | | 2,888,890 | | | | — | | | | 2,888,890 | |
| Denmark | | | — | | | | 3,096,207 | | | | — | | | | 3,096,207 | |
| Finland | | | — | | | | 3,519,113 | | | | — | | | | 3,519,113 | |
| France | | | — | | | | 8,893,822 | | | | — | | | | 8,893,822 | |
| Germany | | | — | | | | 14,600,682 | | | | — | | | | 14,600,682 | |
| Hong Kong | | | — | | | | 2,985,781 | | | | — | | | | 2,985,781 | |
| Japan | | | — | | | | 30,989,732 | | | | — | | | | 30,989,732 | |
| Luxembourg | | | — | | | | 3,014,675 | | | | — | | | | 3,014,675 | |
| Netherlands | | | — | | | | 8,921,141 | | | | — | | | | 8,921,141 | |
| Norway | | | — | | | | 3,067,395 | | | | — | | | | 3,067,395 | |
| Singapore | | | — | | | | 5,926,690 | | | | — | | | | 5,926,690 | |
| Sweden | | | — | | | | 5,784,381 | | | | — | | | | 5,784,381 | |
| Switzerland | | | 3,044,028 | | | | 5,841,499 | | | | — | | | | 8,885,527 | |
| United Kingdom | | | — | | | | 36,797,285 | | | | — | | | | 36,797,285 | |
| Short-Term Investments (e) | | | 10,348,759 | | | | — | | | | — | | | | 10,348,759 | |
| Total | | $ | 13,392,787 | | | $ | 144,935,074 | | | $ | — | | | $ | 158,327,861 | |
There have been no transfers between fair value measurement levels during the period ended June 30, 2014.
(e) See Investment Portfolio for additional detailed categorizations.
The accompanying notes are an integral part of the financial statements.
Statement of Assets and Liabilities | as of June 30, 2014 (Unaudited) | |
| Assets | |
Investments: Investments in non-affiliated securities, at value (cost $143,665,101) — including $8,656,326 of securities loaned | | $ | 147,979,102 | |
| Investment in Daily Assets Fund Institutional (cost $8,945,664)* | | | 8,945,664 | |
| Investment in Central Cash Management Fund (cost $1,403,095) | | | 1,403,095 | |
| Total investments, at value (cost $154,013,860) | | | 158,327,861 | |
| Foreign currency, at value (cost $10,744) | | | 10,292 | |
| Receivable for Fund shares sold | | | 30,706 | |
| Dividends receivable | | | 141,431 | |
| Interest receivable | | | 4,198 | |
| Foreign taxes recoverable | | | 428,324 | |
| Other assets | | | 1,103 | |
| Total assets | | | 158,943,915 | |
| Liabilities | |
| Payable upon return of securities loaned | | | 8,945,664 | |
| Payable for Fund shares redeemed | | | 100,520 | |
| Accrued Trustees' fees | | | 356 | |
| Accrued management fee | | | 91,420 | |
| Other accrued expenses and payables | | | 95,792 | |
| Total liabilities | | | 9,233,752 | |
| Net assets, at value | | $ | 149,710,163 | |
| Net Assets Consist of | |
| Undistributed net investment income | | | 4,015,618 | |
Net unrealized appreciation (depreciation) on: Investments | | | 4,314,001 | |
| Foreign currency | | | 28,901 | |
| Accumulated net realized gain (loss) | | | (106,446,763 | ) |
| Paid-in capital | | | 247,798,406 | |
| Net assets, at value | | $ | 149,710,163 | |
Class A Net Asset Value, offering and redemption price per share ($149,399,820 ÷ 16,459,064 outstanding shares of beneficial interest, $.01 par value, unlimited number of shares authorized) | | $ | 9.08 | |
Class B Net Asset Value, offering and redemption price per share ($310,343 ÷ 34,097 outstanding shares of beneficial interest, $.01 par value, unlimited number of shares authorized) | | $ | 9.10 | |
* Represents collateral on securities loaned.
The accompanying notes are an integral part of the financial statements.
Statement of Operations
| for the six months ended June 30, 2014 (Unaudited) | |
| Investment Income | |
Income: Dividends (net of foreign taxes withheld of $304,445) | | $ | 4,782,264 | |
| Interest | | | 196 | |
| Income distributions — Central Cash Management Fund | | | 749 | |
| Securities lending income, including income from Daily Assets Fund Institutional, net of borrower rebates | | | 43,844 | |
| Total income | | | 4,827,053 | |
Expenses: Management fee | | | 579,699 | |
| Administration fee | | | 73,380 | |
| Services to shareholders | | | 1,634 | |
| Distribution service fee (Class B) | | | 373 | |
| Custodian fee | | | 25,462 | |
| Professional fees | | | 35,837 | |
| Reports to shareholders | | | 21,545 | |
| Trustees' fees and expenses | | | 4,043 | |
| Other | | | 13,042 | |
| Total expenses before expense reductions | | | 755,015 | |
| Expense reductions | | | (42,027 | ) |
| Total expenses after expense reductions | | | 712,988 | |
| Net investment income (loss) | | | 4,114,065 | |
| Realized and Unrealized Gain (Loss) | |
Net realized gain (loss) from: Investments | | | 20,921,510 | |
| Futures | | | 94,022 | |
| Foreign currency | | | 25,043 | |
| | | | 21,040,575 | |
Change in net unrealized appreciation (depreciation) on: Investments | | | (22,205,704 | ) |
| Futures | | | (151,875 | ) |
| Foreign currency | | | (4,670 | ) |
| | | | (22,362,249 | ) |
| Net gain (loss) | | | (1,321,674 | ) |
| Net increase (decrease) in net assets resulting from operations | | $ | 2,792,391 | |
The accompanying notes are an integral part of the financial statements.
Statement of Changes in Net Assets | Increase (Decrease) in Net Assets | | Six Months Ended June 30, 2014 (Unaudited) | | | Year Ended December 31, 2013 | |
Operations: Net investment income (loss) | | $ | 4,114,065 | | | $ | 2,656,367 | |
Operations: Net investment income (loss) | | $ | 4,114,065 | | | $ | 2,656,367 | |
| Net realized gain (loss) | | | 21,040,575 | | | | 23,022,418 | |
| Change in net unrealized appreciation (depreciation) | | | (22,362,249 | ) | | | 4,153,981 | |
| Net increase (decrease) in net assets resulting from operations | | | 2,792,391 | | | | 29,832,766 | |
Distributions to shareholders from: Net investment income: Class A | | | (2,472,725 | ) | | | (7,421,568 | ) |
| Class B | | | (4,273 | ) | | | (14,321 | ) |
| Total distributions | | | (2,476,998 | ) | | | (7,435,889 | ) |
Fund share transactions: Class A Proceeds from shares sold | | | 4,032,231 | | | | 9,888,983 | |
| Reinvestment of distributions | | | 2,472,725 | | | | 7,421,568 | |
| Payments for shares redeemed | | | (8,630,828 | ) | | | (118,556,623 | ) |
| Net increase (decrease) in net assets from Class A share transactions | | | (2,125,872 | ) | | | (101,246,072 | ) |
Class B Proceeds from shares sold | | | 6,969 | | | | 37,829 | |
| Reinvestment of distributions | | | 4,273 | | | | 14,321 | |
| Payments for shares redeemed | | | (7,518 | ) | | | (64,353 | ) |
| Net increase (decrease) in net assets from Class B share transactions | | | 3,724 | | | | (12,203 | ) |
| Increase (decrease) in net assets | | | (1,806,755 | ) | | | (78,861,398 | ) |
| Net assets at beginning of period | | | 151,516,918 | | | | 230,378,316 | |
| Net assets at end of period (including undistributed net investment income of $4,015,618 and $2,378,551, respectively) | | $ | 149,710,163 | | | $ | 151,516,918 | |
| Other Information | |
Class A Shares outstanding at beginning of period | | | 16,697,511 | | | | 28,915,018 | |
| Shares sold | | | 451,867 | | | | 1,188,292 | |
| Shares issued to shareholders in reinvestment of distributions | | | 279,089 | | | | 930,021 | |
| Shares redeemed | | | (969,403 | ) | | | (14,335,820 | ) |
| Net increase (decrease) in Class A shares | | | (238,447 | ) | | | (12,217,507 | ) |
| Shares outstanding at end of period | | | 16,459,064 | | | | 16,697,511 | |
Class B Shares outstanding at beginning of period | | | 33,679 | | | | 35,208 | |
| Shares sold | | | 779 | | | | 4,565 | |
| Shares issued to shareholders in reinvestment of distributions | | | 481 | | | | 1,790 | |
| Shares redeemed | | | (842 | ) | | | (7,884 | ) |
| Net increase (decrease) in Class B shares | | | 418 | | | | (1,529 | ) |
| Shares outstanding at end of period | | | 34,097 | | | | 33,679 | |
The accompanying notes are an integral part of the financial statements.
| | | | | | Years Ended December 31, | |
| Class A | | Six Months Ended 6/30/14 (Unaudited) | | | 2013 | | | 2012 | | | 2011 | | | 2010 | | | 2009 | |
| Selected Per Share Data | |
| Net asset value, beginning of period | | $ | 9.06 | | | $ | 7.96 | | | $ | 6.74 | | | $ | 8.22 | | | $ | 8.26 | | | $ | 6.52 | |
Income (loss) from investment operations: Net investment income (loss)a | | | .25 | | | | .14 | | | | .22 | | | | .15 | | | | .13 | | | | .12 | |
| Net realized and unrealized gain (loss) | | | (.08 | ) | | | 1.41 | | | | 1.16 | | | | (1.49 | ) | | | (.00 | )*** | | | 1.93 | |
| Total from investment operations | | | .17 | | | | 1.55 | | | | 1.38 | | | | (1.34 | ) | | | .13 | | | | 2.05 | |
Less distributions from: Net investment income | | | (.15 | ) | | | (.45 | ) | | | (.16 | ) | | | (.14 | ) | | | (.17 | ) | | | (.31 | ) |
| Net asset value, end of period | | $ | 9.08 | | | $ | 9.06 | | | $ | 7.96 | | | $ | 6.74 | | | $ | 8.22 | | | $ | 8.26 | |
| Total Return (%) | | | 1.93 | b** | | | 20.23 | b | | | 20.65 | | | | (16.67 | ) | | | 1.62 | b | | | 33.52 | |
| Ratios to Average Net Assets and Supplemental Data | |
| Net assets, end of period ($ millions) | | | 149 | | | | 151 | | | | 230 | | | | 211 | | | | 288 | | | | 344 | |
| Ratio of expenses before expense reductions (%) | | | 1.03 | * | | | 1.02 | | | | .98 | | | | 1.00 | | | | .99 | | | | .94 | |
| Ratio of expenses after expense reductions (%) | | | .97 | * | | | 1.01 | | | | .98 | | | | 1.00 | | | | .99 | | | | .94 | |
| Ratio of net investment income (loss) (%) | | | 2.78 | c | | | 1.64 | | | | 2.99 | | | | 1.98 | | | | 1.68 | | | | 1.69 | |
| Portfolio turnover rate (%) | | | 113 | ** | | | 97 | | | | 85 | | | | 174 | | | | 228 | | | | 81 | |
a Based on average shares outstanding during the period. b Total return would have been lower had certain expenses not been reduced. c Not annualized. The ratio for the six months ended June 30, 2014 has not been annualized since the Fund believes it would not be appropriate because the Fund's dividend income is not earned ratably throughout the fiscal year. * Annualized ** Not annualized *** Amount is less than $.005. | |
| | | | | | Years Ended December 31, | |
| Class B | | Six Months Ended 6/30/14 (Unaudited) | | | 2013 | | | 2012 | | | 2011 | | | 2010 | | | 2009 | |
| Selected Per Share Data | |
| Net asset value, beginning of period | | $ | 9.07 | | | $ | 7.96 | | | $ | 6.75 | | | $ | 8.22 | | | $ | 8.26 | | | $ | 6.52 | |
Income (loss) from investment operations: Net investment income (loss)a | | | .24 | | | | .13 | | | | .20 | | | | .13 | | | | .11 | | | | .10 | |
| Net realized and unrealized gain (loss) | | | (.08 | ) | | | 1.41 | | | | 1.15 | | | | (1.48 | ) | | | (.00 | )*** | | | 1.94 | |
| Total from investment operations | | | .16 | | | | 1.54 | | | | 1.35 | | | | (1.35 | ) | | | .11 | | | | 2.04 | |
Less distributions from: Net investment income | | | (.13 | ) | | | (.43 | ) | | | (.14 | ) | | | (.12 | ) | | | (.15 | ) | | | (.30 | ) |
| Net asset value, end of period | | $ | 9.10 | | | $ | 9.07 | | | $ | 7.96 | | | $ | 6.75 | | | $ | 8.22 | | | $ | 8.26 | |
| Total Return (%) | | | 1.77 | b** | | | 20.01 | b | | | 20.13 | | | | (16.77 | ) | | | 1.33 | b | | | 32.89 | |
| Ratios to Average Net Assets and Supplemental Data | |
| Net assets, end of period ($ millions) | | | .31 | | | | .31 | | | | .28 | | | | .24 | | | | .36 | | | | .50 | |
| Ratio of expenses before expense reductions (%) | | | 1.30 | * | | | 1.30 | | | | 1.26 | | | | 1.28 | | | | 1.26 | | | | 1.22 | |
| Ratio of expenses after expense reductions (%) | | | 1.23 | * | | | 1.27 | | | | 1.26 | | | | 1.28 | | | | 1.26 | | | | 1.22 | |
| Ratio of net investment income (loss) (%) | | | 2.65 | c | | | 1.62 | | | | 2.73 | | | | 1.70 | | | | 1.41 | | | | 1.42 | |
| Portfolio turnover rate (%) | | | 113 | ** | | | 97 | | | | 85 | | | | 174 | | | | 228 | | | | 81 | |
a Based on average shares outstanding during the period. b Total return would have been lower had certain expenses not been reduced. c Not annualized. The ratio for the six months ended June 30, 2014 has not been annualized since the Fund believes it would not be appropriate because the Fund's dividend income is not earned ratably throughout the fiscal year. * Annualized ** Not annualized *** Amount is less than $.005. | |
Notes to Financial Statements (Unaudited)
A. Organization and Significant Accounting Policies
Deutsche Variable Series I (formerly DWS Variable Series I) (the "Series") is registered under the Investment Company Act of 1940, as amended (the "1940 Act"), as an open-end, registered management investment company organized as a Massachusetts business trust. The Series consists of five diversified funds: Deutsche Bond VIP, Deutsche Core Equity VIP, Deutsche Capital Growth VIP, Deutsche Global Small Cap VIP and Deutsche International VIP (individually or collectively hereinafter referred to as a "Fund" or the "Funds" and formerly known as DWS Bond VIP, DWS Core Equity VIP, DWS Capital Growth VIP, DWS Global Small Cap Growth VIP and DWS International VIP, respectively). These financial statements report on Deutsche International VIP. The Series is intended to be the underlying investment vehicle for variable annuity contracts and variable life insurance policies to be offered by the separate accounts of certain life insurance companies ("Participating Insurance Companies").
Multiple Classes of Shares of Beneficial Interest. The Fund offers two classes of shares (Class A shares and Class B shares). Class B shares are subject to Rule 12b-1 distribution fees under the 1940 Act and recordkeeping fees equal to an annual rate of 0.25% and up to 0.15%, respectively, of the average daily net assets of the Class B shares of the Fund. Class A shares are not subject to such fees.
Investment income, realized and unrealized gains and losses, and certain fund-level expenses and expense reductions, if any, are borne pro rata on the basis of relative net assets by the holders of all classes of shares, except that each class bears certain expenses unique to that class (including the applicable 12b-1 distribution fees and recordkeeping fees). Differences in class-level expenses may result in payment of different per share dividends by class. All shares have equal rights with respect to voting subject to class-specific arrangements.
The Fund's financial statements are prepared in accordance with accounting principles generally accepted in the United States of America, which require the use of management estimates. Actual results could differ from those estimates. The policies described below are followed consistently by the Fund in the preparation of its financial statements.
Security Valuation. Investments are stated at value determined as of the close of regular trading on the New York Stock Exchange on each day the exchange is open for trading.
Various inputs are used in determining the value of the Fund's investments. These inputs are summarized in three broad levels. Level 1 includes quoted prices in active markets for identical securities. Level 2 includes other significant observable inputs (including quoted prices for similar securities, interest rates, prepayment speeds and credit risk). Level 3 includes significant unobservable inputs (including the Fund's own assumptions in determining the fair value of investments). The level assigned to the securities valuations may not be an indication of the risk or liquidity associated with investing in those securities.
Equity securities are valued at the most recent sale price or official closing price reported on the exchange (U.S. or foreign) or over-the-counter market on which they trade. Securities for which no sales are reported are valued at the calculated mean between the most recent bid and asked quotations on the relevant market or, if a mean cannot be determined, at the most recent bid quotation. Equity securities are generally categorized as Level 1 securities. For certain international equity securities, in order to adjust for events which may occur between the close of the foreign exchanges and the close of the New York Stock Exchange, a fair valuation model may be used. This fair valuation model takes into account comparisons to the valuation of American Depository Receipts (ADRs), exchange-traded funds, futures contracts and certain indices and these securities are categorized as Level 2.
Investments in open-end investment companies are valued at their net asset value each business day and are categorized as Level 1.
Futures contracts are generally valued at the settlement prices established each day on the exchange on which they are traded and are categorized as Level 1.
Securities and other assets for which market quotations are not readily available or for which the above valuation procedures are deemed not to reflect fair value are valued in a manner that is intended to reflect their fair value as determined in accordance with procedures approved by the Trustees and are generally categorized as Level 3. In accordance with the Fund's valuation procedures, factors considered in determining value may include, but are not limited to, the type of the security; the size of the holding; the initial cost of the security; the existence of any contractual restrictions on the security's disposition; the price and extent of public trading in similar securities of the issuer or of comparable companies; quotations or evaluated prices from broker-dealers and/or pricing services; information obtained from the issuer, analysts, and/or the appropriate stock exchange (for exchange-traded securities); an analysis of the company's or issuer's financial statements; an evaluation of the forces that influence the issuer and the market(s) in which the security is purchased and sold; and with respect to debt securities, the maturity, coupon, creditworthiness, currency denomination and the movement of the market in which the security is normally traded. The value determined under these procedures may differ from published values for the same securities.
Disclosure about the classification of fair value measurements is included in a table following the Fund's Investment Portfolio.
Securities Lending. Deutsche Bank AG, as lending agent, lends securities of the Fund to certain financial institutions under the terms of the Security Lending Agreement. The Fund retains the benefits of owning the securities it has loaned and continues to receive interest and dividends generated by the securities and to participate in any changes in their market value. The Fund requires the borrowers of the securities to maintain collateral with the Fund consisting of either cash or liquid, unencumbered assets having a value at least equal to the value of the securities loaned. When the collateral falls below specified amounts, the lending agent will use its best effort to obtain additional collateral on the next business day to meet required amounts under the security lending agreement. The Fund may invest the cash collateral into a joint trading account in an affiliated money market fund pursuant to Exemptive Orders issued by the SEC. The Fund receives compensation for lending its securities either in the form of fees or by earning interest on invested cash collateral net of borrower rebates and fees paid to a lending agent. Either the Fund or the borrower may terminate the loan. There may be risks of delay and costs in recovery of securities or even loss of rights in the collateral should the borrower of the securities fail financially. If the Fund is not able to recover securities lent, the Fund may sell the collateral and purchase a replacement investment in the market, incurring the risk that the value of the replacement security is greater than the value of the collateral. The Fund is also subject to all investment risks associated with the reinvestment of any cash collateral received, including, but not limited to, interest rate, credit and liquidity risk associated with such investments.
As of June 30, 2014, the Fund had securities on loan. The value of the related collateral exceeded the value of the securities loaned at period end.
Foreign Currency Translations. The books and records of the Fund are maintained in U.S. dollars. Investment securities and other assets and liabilities denominated in a foreign currency are translated into U.S. dollars at the prevailing exchange rates at period end. Purchases and sales of investment securities, income and expenses are translated into U.S. dollars at the prevailing exchange rates on the respective dates of the transactions.
Net realized and unrealized gains and losses on foreign currency transactions represent net gains and losses between trade and settlement dates on securities transactions, the acquisition and disposition of foreign currencies, and the difference between the amount of net investment income accrued and the U.S. dollar amount actually received. That portion of both realized and unrealized gains and losses on investments that results from fluctuations in foreign currency exchange rates is not separately disclosed but is included with net realized and unrealized gain/appreciation and loss/depreciation on investments.
Taxes. The Fund is treated as a separate taxpayer as provided for in the Internal Revenue Code, as amended. It is the Fund's policy to comply with the requirements of the Internal Revenue Code, as amended, which are applicable to regulated investment companies, and to distribute all of its taxable income to the separate accounts of the Participating Insurance Companies which hold its shares.
Additionally, the Fund may be subject to taxes imposed by the governments of countries in which it invests and are generally based on income and/or capital gains earned or repatriated. Estimated tax liabilities on certain foreign securities are recorded on an accrual basis and are reflected as components of interest income or net change in unrealized gain/loss on investments. Tax liabilities realized as a result of security sales are reflected as a component of net realized gain/loss on investments.
Under the Regulated Investment Company Modernization Act of 2010, net capital losses incurred post-enactment may be carried forward indefinitely, and their character is retained as short-term and/or long-term. Previously, net capital losses were carried forward for eight years and treated as short-term losses. As a transition rule, the Act requires that post-enactment net capital losses be used before pre-enactment net capital losses.
At December 31, 2013, the Fund had a net tax basis capital loss carryforward of approximately $127,313,000, including $124,587,000 of pre-enactment losses, which may be applied against any realized net taxable capital gains of each succeeding year until fully utilized or until December 31, 2016 ($25,765,000) and December 31, 2017 ($98,822,000), the respective expiration dates, whichever occurs first; and approximately $2,726,000 of post-enactment short-term losses, which may be applied against realized net taxable capital gains indefinitely.
The Fund has reviewed the tax positions for the open tax years as of December 31, 2013 and has determined that no provision for income tax and/or uncertain tax provisions is required in the Fund's financial statements. The Fund's federal tax returns for the prior three fiscal years remain open subject to examination by the Internal Revenue Service.
Distribution of Income and Gains. Distributions from net investment income of the Fund, if any, are declared and distributed to shareholders annually. Net realized gains from investment transactions, in excess of available capital loss carryforwards, would be taxable to the Fund if not distributed and, therefore, will be distributed to shareholders at least annually. The Fund may also make additional distributions for tax purposes if necessary.
The timing and characterization of certain income and capital gain distributions are determined annually in accordance with federal tax regulations which may differ from accounting principles generally accepted in the United States of America. These differences primarily relate to investments in foreign denominated investments, futures contracts, passive foreign investment companies and certain securities sold at a loss. As a result, net investment income (loss) and net realized gain (loss) on investment transactions for a reporting period may differ significantly from distributions during such period. Accordingly, the Fund may periodically make reclassifications among certain of its capital accounts without impacting the net asset value of the Fund.
The tax character of current year distributions will be determined at the end of the current fiscal year.
Expenses. Expenses of the Series arising in connection with a specific Fund are allocated to that Fund. Other Series expenses which cannot be directly attributed to a Fund are apportioned among the Funds in the Series based upon the relative net assets or other appropriate measures.
Contingencies. In the normal course of business, the Fund may enter into contracts with service providers that contain general indemnification clauses. The Fund's maximum exposure under these arrangements is unknown as this would involve future claims that may be made against the Fund that have not yet been made. However, based on experience, the Fund expects the risk of loss to be remote.
Other. Investment transactions are accounted for on a trade date plus one basis for daily net asset value calculations. However, for financial reporting purposes, investment transactions are reported on trade date. Interest income is recorded on the accrual basis net of foreign withholding taxes. Dividend income is recorded on the ex-dividend date net of foreign withholding taxes. Certain dividends from foreign securities may be recorded subsequent to the ex-dividend date as soon as the Fund is informed of such dividends. Realized gains and losses from investment transactions are recorded on an identified cost basis. Proceeds from litigation payments, if any, are included in net realized gain (loss) from investments.
B. Derivative Instruments
Futures Contracts. A futures contract is an agreement between a buyer or seller and an established futures exchange or its clearinghouse in which the buyer or seller agrees to take or make a delivery of a specific amount of a financial instrument at a specified price on a specific date (settlement date). For the six months ended June 30, 2014, the Fund entered into futures contracts to keep cash on hand to meet shareholder redemptions or other needs while maintaining exposure to the stock market.
Upon entering into a futures contract, the Fund is required to deposit with a financial intermediary cash or securities ("initial margin") in an amount equal to a certain percentage of the face value indicated in the futures contract. Subsequent payments ("variation margin") are made or received by the Fund dependent upon the daily fluctuations in the value and are recorded for financial reporting purposes as unrealized gains or losses by the Fund. Gains or losses are realized when the contract expires or is closed. Since all futures contracts are exchange-traded, counterparty risk is minimized as the exchange's clearinghouse acts as the counterparty, and guarantees the futures against default.
Certain risks may arise upon entering into futures contracts, including the risk that an illiquid market will limit the Fund's ability to close out a futures contract prior to the settlement date and the risk that the futures contract is not well correlated with the security, index or currency to which it relates. Risk of loss may exceed amounts disclosed in the Statement of Assets and Liabilities.
There were no open futures contracts at June 30, 2014. For the six months ended June 30, 2014, the investment in futures contracts purchased had a total notional value generally indicative of a range from $0 to approximately $4,603,000.
The amount of unrealized and realized gains and losses on derivative instruments recognized in Fund earnings during the six months ended June 30, 2014 and the related location in the accompanying Statement of Operations is summarized in the following tables by primary underlying risk exposure:
| Realized Gain (Loss) | | Futures Contracts | |
| Equity Contracts (a) | | $ | 94,022 | |
The above derivative is located in the following Statement of Operations account: (a) Net realized gain (loss) from futures | |
| Change in Net Unrealized Appreciation (Depreciation) | | Futures Contracts | |
| Equity Contracts (a) | | $ | (151,875 | ) |
The above derivative is located in the following Statement of Operations account: (a) Change in net unrealized appreciation (depreciation) on futures | |
C. Purchases and Sales of Securities
During the six months ended June 30, 2014, purchases and sales of investment securities (excluding short-term investments) aggregated $166,409,186 and $164,536,996, respectively.
D. Related Parties
Management Agreement. Under the Investment Management Agreement with Deutsche Investment Management Americas Inc. ("DIMA" or the "Advisor"), an indirect, wholly owned subsidiary of Deutsche Bank AG, the Advisor directs the investments of the Fund in accordance with its investment objectives, policies and restrictions. The Advisor determines the securities, instruments and other contracts relating to investments to be purchased, sold or entered into by the Fund.
Pursuant to the Investment Management Agreement with the Advisor, the Fund pays a monthly management fee based on the Fund's average daily net assets, computed and accrued daily and payable monthly, at the following annual rates:
| First $500 million of average daily net assets | | | .790 | % |
| Over $500 million of average daily net assets | | | .640 | % |
Accordingly, for the six months ended June 30, 2014, the fee pursuant to the Investment Management Agreement was equivalent to an annualized effective rate (exclusive of any applicable waivers/reimbursements) of 0.79% of the Fund's average daily net assets.
For the period from January 1, 2014 through September 30, 2014, the Advisor has contractually agreed to waive all or a portion of its fees and/or reimburse certain operating expenses of the Fund to the extent necessary to maintain the operating expenses (excluding certain expenses such as extraordinary expenses, taxes, brokerage and interest) of each class as follows:
For the six months ended June 30, 2014, fees waived and/or expenses reimbursed for each class are as follows:
| Class A | | $ | 41,918 | |
| Class B | | | 109 | |
| | | $ | 42,027 | |
Administration Fee. Pursuant to an Administrative Services Agreement, DIMA provides most administrative services to the Fund. For all services provided under the Administrative Services Agreement, the Fund pays the Advisor an annual fee ("Administration Fee") of 0.10% of the Fund's average daily net assets, computed and accrued daily and payable monthly. For the six months ended June 30, 2014, the Administration Fee was $73,380, of which $12,246 is unpaid.
Service Provider Fees. DeAWM Service Company ("DSC"), an affiliate of the Advisor, is the transfer agent, dividend-paying agent and shareholder service agent for the Fund. Pursuant to a sub-transfer agency agreement between DSC and DST Systems, Inc. ("DST"), DSC has delegated certain transfer agent, dividend-paying agent and shareholder service agent functions to DST. DSC compensates DST out of the shareholder servicing fee it receives from the Fund. For the six months ended June 30, 2014, the amounts charged to the Fund by DSC were as follows:
| Services to Shareholders | | Total Aggregated | | | Unpaid at June 30, 2014 | |
| Class A | | $ | 327 | | | $ | 163 | |
| Class B | | | 40 | | | | 19 | |
| | | $ | 367 | | | $ | 182 | |
Distribution Service Agreement. DeAWM Distributors, Inc. ("DDI"), also an affiliate of the Advisor, is the Series' Distributor. In accordance with the Master Distribution Plan, DDI receives 12b-1 fees of 0.25% of average daily net assets of Class B shares. Pursuant to the Master Distribution Plan, DDI remits these fees to the Participating Insurance Companies for various costs incurred or paid by these companies in connection with marketing and distribution of Class B shares. For the six months ended June 30, 2014, the Distribution Service Fee aggregated $373, of which $63 is unpaid.
Typesetting and Filing Service Fees. Under an agreement with DIMA, DIMA is compensated for providing typesetting and certain regulatory filing services to the Fund. For the six months ended June 30, 2014, the amount charged to the Fund by DIMA included in the Statement of Operations under "reports to shareholders" aggregated $7,662, of which $318 is unpaid.
Trustees' Fees and Expenses. The Fund paid retainer fees to each Trustee not affiliated with the Advisor, plus specified amounts to the Board Chairperson and Vice Chairperson and to each committee Chairperson.
Affiliated Cash Management Vehicles. The Fund may invest uninvested cash balances in Central Cash Management Fund and Deutsche Variable NAV Money Fund, affiliated money market funds which are managed by the Advisor. Each affiliated money market fund seeks to provide a high level of current income consistent with liquidity and the preservation of capital. Each affiliated money market fund is managed in accordance with Rule 2a-7 under the Investment Company Act of 1940, which governs the quality, maturity, diversity and liquidity of instruments in which a money market fund may invest. Central Cash Management Fund seeks to maintain a stable net asset value, and Deutsche Variable NAV Money Fund maintains a floating net asset value. The Fund indirectly bears its proportionate share of the expenses of each affiliated money market fund in which it invests. Central Cash Management Fund does not pay the Advisor an investment management fee. To the extent that Deutsche Variable NAV Money Fund pays an investment management fee to the Advisor, the Advisor will waive an amount of the investment management fee payable to the Advisor by the Fund equal to the amount of the investment management fee payable on the Fund's assets invested in Deutsche Variable NAV Money Fund.
Securities Lending Agent Fees. Deutsche Bank AG serves as securities lending agent for the Fund. For the six months ended June 30, 2014, the Fund incurred securities lending agent fees to Deutsche Bank AG in the amount of $3,820.
E. Ownership of the Fund
At June 30, 2014, three participating insurance companies were owners of record of 10% or more of the total outstanding Class A shares of the Fund, each owning 24%, 12% and 11%, respectively. One participating insurance company was the owner of record of 10% or more of the total outstanding Class B shares of the Fund, owning 90%.
F. Line of Credit
The Fund and other affiliated funds (the "Participants") share in a $400 million revolving credit facility provided by a syndication of banks. The Fund may borrow for temporary or emergency purposes, including the meeting of redemption requests that otherwise might require the untimely disposition of securities. The Participants are charged an annual commitment fee which is allocated based on net assets, among each of the Participants. Interest is calculated at a rate per annum equal to the sum of the Federal Funds Rate plus 1.25 percent plus if LIBOR exceeds the Federal Funds Rate the amount of such excess. The Fund may borrow up to a maximum of 33 percent of its net assets under the agreement. The Fund had no outstanding loans at June 30, 2014.
G. Change in Investment Strategy
Effective May 1, 2014, the Fund changed its management process and investment team. Portfolio management intends to select approximately fifty stocks with the lowest positive Cash Return on Capital Invested (CROCI®) Economic Price Earnings ratio from a universe comprising approximately 330 of the largest equities by market capitalization in the MSCI EAFE Index, excluding financial stocks. The CROCI® Economic Price Earnings Ratio (CROCI® P/E Ratio) is a proprietary measure of company valuation using the same relationship between valuation and return as an accounting P/E ratio (i.e., price/book value divided by return on equity). At times, the number of stocks held in the Fund may differ from fifty stocks as a result of corporate actions, mergers or other events. The CROCI® strategy is supplied by the CROCI® Investment Strategy and Valuation Group, a unit within Deutsche Asset & Wealth Management, through a licensing agreement with the Fund's investment advisor. For a full description of the Fund's investment strategy, please see the Fund's current prospectus dated May 1, 2014.
H. Fund Name Change
Effective August 11, 2014, the "DWS Funds" were rebranded "Deutsche Funds."
Information About Your Fund's Expenses (Unaudited)
As an investor of the Fund, you incur two types of costs: ongoing expenses and transaction costs. Ongoing expenses include management fees, distribution and service (12b-1) fees and other Fund expenses. Examples of transaction costs include contract charges, redemption fees and account maintenance fees, which are not shown in this section. The following tables are intended to help you understand your ongoing expenses (in dollars) of investing in the Fund and to help you compare these expenses with the ongoing expenses of investing in other mutual funds. In the most recent six-month period, the Fund limited these expenses; had it not done so, expenses would have been higher. The example in the table is based on an investment of $1,000 invested at the beginning of the six-month period and held for the entire period (January 1, 2014 to June 30, 2014).
The tables illustrate your Fund's expenses in two ways:
—Actual Fund Return. This helps you estimate the actual dollar amount of ongoing expenses (but not transaction costs) paid on a $1,000 investment in the Fund using the Fund's actual return during the period. To estimate the expenses you paid over the period, simply divide your account value by $1,000 (for example, an $8,600 account value divided by $1,000 = 8.6), then multiply the result by the number in the "Expenses Paid per $1,000" line under the share class you hold.
—Hypothetical 5% Fund Return. This helps you to compare your Fund's ongoing expenses (but not transaction costs) with those of other mutual funds using the Fund's actual expense ratio and a hypothetical rate of return of 5% per year before expenses. Examples using a 5% hypothetical Fund return may be found in the shareholder reports of other mutual funds. The hypothetical account values and expenses may not be used to estimate the actual ending account balance or expenses you paid for the period.
Please note that the expenses shown in these tables are meant to highlight your ongoing expenses only and do not reflect any transaction costs. The "Expenses Paid per $1,000" line of the tables is useful in comparing ongoing expenses only and will not help you determine the relative total expense of owning different funds. If these transaction costs had been included, your costs would have been higher.
Expenses and Value of a $1,000 Investment for the six months ended June 30, 2014 | |
| Actual Fund Return | | Class A | | | Class B | |
| Beginning Account Value 1/1/14 | | $ | 1,000.00 | | | $ | 1,000.00 | |
| Ending Account Value 6/30/14 | | $ | 1,019.30 | | | $ | 1,017.70 | |
| Expenses Paid per $1,000* | | $ | 4.86 | | | $ | 6.15 | |
| Hypothetical 5% Fund Return | | Class A | | | Class B | |
| Beginning Account Value 1/1/14 | | $ | 1,000.00 | | | $ | 1,000.00 | |
| Ending Account Value 6/30/14 | | $ | 1,019.98 | | | $ | 1,018.70 | |
| Expenses Paid per $1,000* | | $ | 4.86 | | | $ | 6.16 | |
* Expenses are equal to the Fund's annualized expense ratio for each share class, multiplied by the average account value over the period, multiplied by 181 (the number of days in the most recent six-month period), then divided by 365.
| Annualized Expense Ratios | Class A | | Class B | |
| Deutsche Variable Series I — Deutsche International VIP | .97% | | 1.23% | |
For more information, please refer to the Fund's prospectus.
These tables do not reflect charges and fees ("contract charges") associated with the separate account that invests in the Fund or any variable life insurance policy or variable annuity contract for which the Fund is an investment option.
For an analysis of the fees associated with an investment in the fund or similar funds, please refer to the current and hypothetical expense calculators for Variable Insurance Products which can be found at deutschefunds.com/EN/resources/calculators.jsp.
The Series' policies and procedures for voting proxies for portfolio securities and information about how the Series voted proxies related to its portfolio securities during the 12-month period ended June 30 are available on our Web site — deutschefunds.com (click on "proxy voting"at the bottom of the page) — or on the SEC's Web site — sec.gov. To obtain a written copy of the Series' policies and procedures without charge, upon request, call us toll free at (800) 728-3337.
Advisory Agreement Board Considerations and Fee Evaluation
The Board of Trustees approved the renewal of DWS International VIP's investment management agreement (the "Agreement") with Deutsche Investment Management Americas Inc. ("DIMA") in September 2013.
In terms of the process that the Board followed prior to approving the Agreement, shareholders should know that:
— In September 2013, all of the Fund's Trustees were independent of DIMA and its affiliates.
— The Trustees met frequently during the past year to discuss fund matters and dedicated a substantial amount of time to contract review matters. Over the course of several months, the Board's Contract Committee, in coordination with the Board's Equity Oversight Committee, reviewed comprehensive materials received from DIMA, independent third parties and independent counsel. These materials included an analysis of the Fund's performance, fees and expenses, and profitability compiled by a fee consultant retained by the Fund's Independent Trustees (the "Fee Consultant"). The Board also received extensive information throughout the year regarding performance of the Fund.
— The Independent Trustees regularly meet privately with their independent counsel to discuss contract review and other matters. In addition, the Independent Trustees were also advised by the Fee Consultant in the course of their review of the Fund's contractual arrangements and considered a comprehensive report prepared by the Fee Consultant in connection with their deliberations.
— In connection with reviewing the Agreement, the Board also reviewed the terms of the Fund's Rule 12b-1 plan, distribution agreement, administrative services agreement, transfer agency agreement and other material service agreements.
— Based on its evaluation of the information provided, the Contract Committee presented its findings and recommendations to the Board. The Board then reviewed the Contract Committee's findings and recommendations.
In connection with the contract review process, the Contract Committee and the Board considered the factors discussed below, among others. The Board also considered that DIMA and its predecessors have managed the Fund since its inception, and the Board believes that a long-term relationship with a capable, conscientious advisor is in the best interests of the Fund. The Board considered, generally, that shareholders chose to invest or remain invested in the Fund knowing that DIMA managed the Fund, and that the Agreement was approved by the Fund's shareholders. DIMA is part of Deutsche Bank AG, a major global banking institution that is engaged in a wide range of financial services. The Board believes that there are advantages to being part of a global asset management business that offers a wide range of investing expertise and resources, including hundreds of portfolio managers and analysts with research capabilities in many countries throughout the world.
As part of the contract review process, the Board carefully considered the fees and expenses of each DWS fund overseen by the Board in light of the fund's performance. In many cases, this led to a negotiation with DIMA of lower expense caps as part of the 2012 and 2013 contract review processes than had previously been in place. As part of these negotiations, the Board indicated that it would consider relaxing these new lower caps in future years following sustained improvements in performance, among other considerations.
In June 2012, Deutsche Bank AG ("DB"), DIMA's parent company, announced that DB would combine its Asset Management (of which DIMA was a part) and Wealth Management divisions. DB has advised the Independent Trustees that the U.S. asset management business is a critical and integral part of DB, and that it has, and will continue to, reinvest a significant portion of the substantial savings it expects to realize by combining its Asset Management and Wealth Management divisions into the new Asset and Wealth Management ("AWM") division, including ongoing enhancements to its investment capabilities. DB also has confirmed its commitment to maintaining strong legal and compliance groups within the AWM division.
While shareholders may focus primarily on fund performance and fees, the Fund's Board considers these and many other factors, including the quality and integrity of DIMA's personnel and such other issues as back-office operations, fund valuations, and compliance policies and procedures.
Nature, Quality and Extent of Services.The Board considered the terms of the Agreement, including the scope of advisory services provided under the Agreement. The Board noted that, under the Agreement, DIMA provides portfolio management services to the Fund and that, pursuant to a separate administrative services agreement, DIMA provides administrative services to the Fund. The Board considered the experience and skills of senior management and investment personnel, the resources made available to such personnel, the ability of DIMA to attract and retain high-quality personnel, and the organizational depth and stability of DIMA. The Board reviewed the Fund's performance over short-term and long-term periods and compared those returns to various agreed-upon performance measures, including market indices and a peer universe compiled by the Fee Consultant using information supplied by Morningstar Direct ("Morningstar"), an independent fund data service. The Board also noted that it has put into place a process of identifying "Focus Funds" (e.g., funds performing poorly relative to their benchmark or a peer universe compiled by an independent fund data service), and receives more frequent reporting and information from DIMA regarding such funds, along with DIMA's remedial plans to address underperformance. The Board believes this process is an effective manner of identifying and addressing underperforming funds. Based on the information provided, the Board noted that for the one-, three- and five-year periods ended December 31, 2012, the Fund's performance (Class A shares) was in the 1st quartile, 4th quartile and 4th quartile, respectively, of the applicable Morningstar universe (the 1st quartile being the best performers and the 4th quartile being the worst performers). The Board also observed that the Fund has outperformed its benchmark in the one-year period and has underperformed its benchmark in the three- and five-year periods ended December 31, 2012. The Board noted the disappointing investment performance of the Fund in some past periods and continued to discuss with senior management of DIMA the factors contributing to such underperformance and actions being taken to improve performance. The Board observed that the Fund had experienced improved relative performance in 2012 and during the first seven months of 2013. The Board recognized the efforts by DIMA in recent years to enhance its investment platform and improve long-term performance across the DWS fund complex.
Fees and Expenses. The Board considered the Fund's investment management fee schedule, operating expenses and total expense ratios, and comparative information provided by Lipper Inc. ("Lipper") and the Fee Consultant regarding investment management fee rates paid to other investment advisors by similar funds (1st quartile being the most favorable and 4th quartile being the least favorable). With respect to management fees paid to other investment advisors by similar funds, the Board noted that the contractual fee rates paid by the Fund, which include a 0.10% fee paid to DIMA under the Fund's administrative services agreement, were approximately at the median of the applicable Lipper peer group (based on Lipper data provided as of December 31, 2012). The Board noted that the Fund's Class A shares total (net) operating expenses were expected to be approximately at the median of the applicable Lipper expense universe (based on Lipper data provided as of December 31, 2012) ("Lipper Universe Expenses"). The Board also reviewed data comparing each share class's total (net) operating expenses to the applicable Lipper Universe Expenses. The Board considered the Fund's management fee rate as compared to fees charged by DIMA to comparable funds and considered differences between the Fund and the comparable funds. The Board also considered how the Fund's total (net) operating expenses compared to the total (net) operating expenses of a more customized peer group selected by Lipper (based on such factors as asset size).
The information considered by the Board as part of its review of management fees included information regarding fees charged by DIMA and its affiliates to similar institutional accounts and to similar funds offered primarily to European investors ("DWS Europe funds"), in each case as applicable. The Board observed that advisory fee rates for institutional accounts generally were lower than the management fees charged by similarly managed DWS U.S. mutual funds ("DWS Funds"), but also took note of the differences in services provided to DWS Funds as compared to institutional accounts. In the case of DWS Europe funds, the Board observed that fee rates for DWS Europe funds generally were higher than for similarly managed DWS Funds, but noted that differences in the types of services provided to DWS Funds relative to DWS Europe funds made it difficult to compare such fees.
On the basis of the information provided, the Board concluded that management fees were reasonable and appropriate in light of the nature, quality and extent of services provided by DIMA.
Profitability. The Board reviewed detailed information regarding revenues received by DIMA under the Agreement. The Board considered the estimated costs and pre-tax profits realized by DIMA from advising the DWS Funds, as well as estimates of the pre-tax profits attributable to managing the Fund in particular. The Board also received information regarding the estimated enterprise-wide profitability of DWS and its affiliates with respect to all fund services in totality and by fund. The Board and the Fee Consultant reviewed DIMA's methodology in allocating its costs to the management of the Fund. Based on the information provided, the Board concluded that the pre-tax profits realized by DIMA in connection with the management of the Fund were not unreasonable. The Board also reviewed information regarding the profitability of certain similar investment management firms. The Board noted that while information regarding the profitability of such firms is limited (and in some cases is not necessarily prepared on a comparable basis), DIMA and its affiliates' overall profitability with respect to the DWS fund complex (after taking into account distribution and other services provided to the funds by DIMA and its affiliates) was lower than the overall profitability levels of many comparable firms for which such data was available.
Economies of Scale. The Board considered whether there are economies of scale with respect to the management of the Fund and whether the Fund benefits from any economies of scale. The Board noted that the Fund's management fee schedule includes fee breakpoints. The Board concluded that the Fund's fee schedule represents an appropriate sharing between the Fund and DIMA of such economies of scale as may exist in the management of the Fund at current asset levels.
Other Benefits to DIMA and Its Affiliates. The Board also considered the character and amount of other incidental benefits received by DIMA and its affiliates, including any fees received by DIMA for administrative services provided to the Fund and any fees received by an affiliate of DIMA for distribution services. The Board also considered benefits to DIMA related to brokerage and soft-dollar allocations, including allocating brokerage to pay for research generated by parties other than the executing broker dealers, which pertain primarily to funds investing in equity securities, along with the incidental public relations benefits to DIMA related to DWS Funds advertising and cross-selling opportunities among DIMA products and services. The Board concluded that management fees were reasonable in light of these fallout benefits.
Compliance. The Board considered the significant attention and resources dedicated by DIMA to documenting and enhancing its compliance processes in recent years. The Board noted in particular (i) the experience and seniority of both DIMA's chief compliance officer and the Fund's chief compliance officer; (ii) the large number of DIMA compliance personnel; and (iii) the substantial commitment of resources by DIMA and its affiliates to compliance matters.
Based on all of the information considered and the conclusions reached, the Board unanimously determined that the continuation of the Agreement is in the best interests of the Fund. In making this determination, the Board did not give particular weight to any single factor identified above. The Board considered these factors over the course of numerous meetings, certain of which were in executive session with only the Independent Trustees and their independent counsel present. It is possible that individual Trustees may have weighed these factors differently in reaching their individual decisions to approve the continuation of the Agreement.
Notes
DeAWM Distributors, Inc.
222 South Riverside Plaza
Chicago, IL 60606
(800) 621-1148
VS1int-3 (R-028378-3 8/14)