UNITED STATES
SECURITIES AND EXCHANGE COMMISSION
WASHINGTON, D. C. 20549
FORM N-CSRS
Investment Company Act file number: 811-04257
Deutsche Variable Series I
(Exact Name of Registrant as Specified in Charter)
345 Park Avenue
New York, NY 10154-0004
(Address of Principal Executive Offices) (Zip Code)
Registrant’s Telephone Number, including Area Code: (212) 250-3220
Paul Schubert
345 Park Avenue
New York, NY 10154-0004
(Name and Address of Agent for Service)
| Date of fiscal year end: | 12/31 |
| | |
| Date of reporting period: | 6/30/2017 |
| ITEM 1. | REPORT TO STOCKHOLDERS |
| | |

June 30, 2017
Semiannual Report
Deutsche Variable Series I
Deutsche Bond VIP

Contents
3 Performance Summary 4 Portfolio Summary 4 Portfolio Management Team 5 Investment Portfolio 14 Statement of Assets and Liabilities 13 Statement of Operations 16 Statements of Changes in Net Assets 17 Financial Highlights 18 Notes to Financial Statements 25 Information About Your Fund's Expenses 26 Proxy Voting 27 Advisory Agreement Board Considerations and Fee Evaluation |
This report must be preceded or accompanied by a prospectus. To obtain an additional prospectus or summary prospectus, if available, call (800) 728-3337 or your financial representative. We advise you to consider the Fund's objectives, risks, charges and expenses carefully before investing. The summary prospectus and prospectus contain this and other important information about the Fund. Please read the prospectus carefully before you invest.
Bond investments are subject to interest-rate, credit, liquidity and market risks to varying degrees. When interest rates rise, bond prices generally fall. Credit risk refers to the ability of an issuer to make timely payments of principal and interest. Investments in lower-quality ("junk bonds") and non-rated securities present greater risk of loss than investments in higher-quality securities. Investing in foreign securities, particularly those of emerging markets, presents certain risks, such as currency fluctuations, political and economic changes, and market risks. Emerging markets tend to be more volatile and less liquid than the markets of more mature economies, and generally have less diverse and less mature economic structures and less stable political systems than those of developed countries. Investing in derivatives entails special risks relating to liquidity, leverage and credit that may reduce returns and/or increase volatility. See the prospectus for details.
Deutsche Asset Management represents the asset management activities conducted by Deutsche Bank AG or any of its subsidiaries.
Deutsche AM Distributors, Inc., 222 South Riverside Plaza, Chicago, IL 60606, (800) 621-1148
NOT FDIC/NCUA INSURED NO BANK GUARANTEE MAY LOSE VALUE NOT A DEPOSIT
NOT INSURED BY ANY FEDERAL GOVERNMENT AGENCY
Performance Summary June 30, 2017 (Unaudited)
Fund performance shown is historical, assumes reinvestment of all dividend and capital gain distributions, and does not guarantee future results. Investment return and principal value fluctuate with changing market conditions so that, when redeemed, shares may be worth more or less than their original cost. Current performance may be lower or higher than the performance data quoted. Please contact your participating insurance company for the Fund's most recent month-end performance. Performance doesn't reflect charges and fees ("contract charges") associated with the separate account that invests in the Fund or any variable life insurance policy or variable annuity contract for which the Fund is an investment option. These charges and fees will reduce returns.
The gross expense ratio of the Fund, as stated in the fee table of the prospectus dated May 1, 2017 is 0.80% for Class A shares and may differ from the expense ratio disclosed in the Financial Highlights table in this report.
Generally accepted accounting principles require adjustments to be made to the net assets of the Fund at period end for financial reporting purposes only, and as such, the total return based on the unadjusted net asset value per share may differ from the total return reported in the financial highlights.
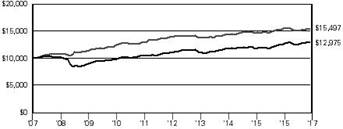
| Growth of an Assumed $10,000 Investment |
■ Deutsche Bond VIP — Class A ■ Bloomberg Barclays U.S. Aggregate Bond Index | The Bloomberg Barclays U.S. Aggregate Bond Index is an unmanaged index representing domestic taxable investment-grade bonds, with index components for government and corporate securities, mortgage pass-through securities, and asset-backed securities with an average maturity of one year or more. Index returns do not reflect any fees or expenses and it is not possible to invest directly into an index. |
 | |
| Yearly periods ended June 30 | | |
| Comparative Results |
| Deutsche Bond VIP | 6-Month‡ | 1-Year | 3-Year | 5-Year | 10-Year |
| Class A | Growth of $10,000 | $10,342 | $10,231 | $11,000 | $11,733 | $12,975 |
| Average annual total return | 3.42% | 2.31% | 3.23% | 3.25% | 2.64% |
| Bloomberg Barclays U.S. Aggregate Bond Index | Growth of $10,000 | $10,227 | $9,969 | $10,763 | $11,157 | $15,497 |
| Average annual total return | 2.27% | –0.31% | 2.48% | 2.21% | 4.48% |
The growth of $10,000 is cumulative.
‡ Total returns shown for periods less than one year are not annualized.
Portfolio Summary (Unaudited)
| Asset Allocation (As a % of Total Net Assets) | 6/30/17 | 12/31/16 |
| | | |
| Corporate Bonds | 61% | 49% |
| Government & Agency Obligations | 16% | 23% |
| Mortgage-Backed Securities Pass-Throughs | 16% | 19% |
| Asset-Backed | 6% | 5% |
| Collateralized Mortgage Obligations | 3% | 3% |
| Commercial Mortgage-Backed Securities | 2% | 2% |
| Short-Term U.S. Treasury Obligations | 1% | 1% |
| Cash Equivalents, Securities Lending Collateral and other Assets and Liabilities, net | –5% | –2% |
| | 100% | 100% |
| Quality (Excludes Cash Equivalents and Securities Lending Collateral) | 6/30/17 | 12/31/16 |
| | | |
| AAA | 31% | 47% |
| AA | 4% | 5% |
| A | 15% | 10% |
| BBB | 28% | 22% |
| BB | 18% | 14% |
| B | 3% | 1% |
| Not Rated | 1% | 1% |
| | 100% | 100% |
| Interest Rate Sensitivity | 6/30/17 | 12/31/16 |
| | | |
| Effective Maturity | 9.6 years | 8.7 years |
| Effective Duration | 5.9 years | 5.9 years |
The quality ratings represent the higher of Moody's Investors Service, Inc. ("Moody's"), Fitch Ratings, Inc. ("Fitch") or Standard & Poor's Corporation ("S&P") credit ratings. The ratings of Moody's, Fitch and S&P represent their opinions as to the quality of the securities they rate. Credit quality measures a bond issuer's ability to repay interest and principal in a timely manner. Ratings are relative and subjective and are not absolute standards of quality. Credit quality does not remove market risk and is subject to change.
Effective maturity is the weighted average of the maturity date of bonds held by the Fund taking into consideration any available maturity shortening features.
Effective duration is an approximate measure of the Fund's sensitivity to interest rate changes taking into consideration any maturity shortening features.
Portfolio holdings and characteristics are subject to change.
For more complete details about the Fund's investment portfolio, see page 5.
Following the Fund's fiscal first and third quarter-end, a complete portfolio holdings listing is filed with the SEC on Form N-Q. The form will be available on the SEC's Web site at sec.gov, and it also may be reviewed and copied at the SEC's Public Reference Room in Washington, D.C. Information on the operation of the SEC's Public Reference Room may be obtained by calling (800) SEC-0330. The Fund's portfolio holdings are also posted on deutschefunds.com from time to time. Please see the Fund's current prospectus for more information.
Portfolio Management Team
Gary Russell, CFA, Managing Director
Thomas M. Farina, CFA, Managing Director
Gregory M. Staples, CFA, Managing Director
Portfolio Managers
Investment Portfolio June 30, 2017 (Unaudited)
| | Principal Amount ($)(a) | Value ($) |
| | | | | |
| Corporate Bonds 61.0% |
| Consumer Discretionary 11.3% |
| AMC Networks, Inc., 5.0%, 4/1/2024 | 265,000 | 271,294 |
| BMW U.S. Capital LLC, 144A, 3.3%, 4/6/2027 | 305,000 | 307,681 |
| CalAtlantic Group, Inc., 5.0%, 6/15/2027 | | 525,000 | 526,312 |
| CCO Holdings LLC, 144A, 5.125%, 5/1/2027 | | 414,000 | 423,315 |
| Charter Communications Operating LLC: | |
| | 3.579%, 7/23/2020 | | 90,000 | 93,004 |
| | 4.908%, 7/23/2025 | | 673,000 | 727,055 |
| | 144A, 5.375%, 5/1/2047 | | 35,000 | 37,028 |
| CVS Health Corp., 5.125%, 7/20/2045 | 110,000 | 126,103 |
| General Motors Co.: |
| | 6.6%, 4/1/2036 | | 55,000 | 63,724 |
| | 6.75%, 4/1/2046 | | 50,000 | 59,301 |
| General Motors Financial Co., Inc., 3.15%, 6/30/2022 | 1,115,000 | 1,116,726 |
| Hilton Domestic Operating Co., Inc., 144A, 4.25%, 9/1/2024 | 310,000 | 314,262 |
| Hilton Worldwide Finance LLC, 144A, 4.875%, 4/1/2027 | 455,000 | 476,044 |
| KFC Holding Co., 144A, 4.75%, 6/1/2027 | | 290,000 | 296,163 |
| Lennar Corp., 4.125%, 1/15/2022 | 505,000 | 522,044 |
| Myriad International Holdings BV, 144A, 4.85%, 7/6/2027 (b) | 500,000 | 501,250 |
| NCL Corp., Ltd., 144A, 4.75%, 12/15/2021 | | 295,000 | 306,207 |
| Nordstrom, Inc.: |
| | 4.0%, 3/15/2027 | | 85,000 | 83,177 |
| | 5.0%, 1/15/2044 | | 135,000 | 128,624 |
| PetSmart, Inc., 144A, 5.875%, 6/1/2025 | 135,000 | 130,106 |
| PulteGroup, Inc., 5.0%, 1/15/2027 | 625,000 | 641,406 |
| Sabre GLBL, Inc., 144A, 5.375%, 4/15/2023 | | 300,000 | 312,750 |
| Toll Brothers Finance Corp., 4.875%, 11/15/2025 | | 300,000 | 311,250 |
| VeriSign, Inc., 144A, 4.75%, 7/15/2027 (b) | | 405,000 | 409,556 |
| Viacom, Inc.: |
| | 5.875%, 2/28/2057 | | 80,000 | 83,200 |
| | 6.25%, 2/28/2057 | | 85,000 | 88,400 |
| Walgreens Boots Alliance, Inc., 4.8%, 11/18/2044 | 90,000 | 95,774 |
| | 8,451,756 |
| Consumer Staples 1.4% |
| Anheuser-Busch InBev Finance, Inc., 4.9%, 2/1/2046 | 235,000 | 265,231 |
| Kraft Heinz Foods Co., 4.375%, 6/1/2046 | | 175,000 | 171,383 |
| Molson Coors Brewing Co., 4.2%, 7/15/2046 | | 120,000 | 118,341 |
| PepsiCo, Inc., 4.45%, 4/14/2046 | 50,000 | 54,504 |
| Reckitt Benckiser Treasury Services PLC: | |
| | 144A, 2.75%, 6/26/2024 | | 200,000 | 198,303 |
| | 144A, 3.0%, 6/26/2027 | | 220,000 | 217,090 |
| | 1,024,852 |
| | Principal Amount ($)(a) | Value ($) |
| | | | | |
| Energy 8.0% |
| Canadian Natural Resources Ltd.: |
| | 3.85%, 6/1/2027 | | 105,000 | 104,149 |
| | 4.95%, 6/1/2047 | | 80,000 | 81,192 |
| Cenovus Energy, Inc., 144A, 5.4%, 6/15/2047 | | 205,000 | 191,345 |
| Concho Resources, Inc., 5.5%, 4/1/2023 | | 150,000 | 154,125 |
| Continental Resources, Inc., 5.0%, 9/15/2022 | | 150,000 | 147,187 |
| Enbridge, Inc.: |
| | 2.9%, 7/15/2022 (b) | | 110,000 | 109,780 |
| | 3.7%, 7/15/2027 (b) | | 95,000 | 94,930 |
| | 5.5%, 12/1/2046 | | 60,000 | 67,111 |
| Energy Transfer Partners LP, 5.95%, 10/1/2043 | | 90,000 | 95,344 |
| EnLink Midstream Partners LP, 5.45%, 6/1/2047 | 120,000 | 119,651 |
| Halliburton Co., 4.85%, 11/15/2035 | 195,000 | 208,477 |
| Hess Corp.: |
| | 5.6%, 2/15/2041 | | 180,000 | 176,952 |
| | 5.8%, 4/1/2047 | | 90,000 | 90,749 |
| Kinder Morgan Energy Partners LP, 4.7%, 11/1/2042 | 160,000 | 151,053 |
| Marathon Oil Corp., 5.2%, 6/1/2045 | 100,000 | 95,877 |
| Newfield Exploration Co., 5.75%, 1/30/2022 | | 150,000 | 157,875 |
| Noble Holding International Ltd.: |
| | 5.75%, 3/16/2018 | | 30,000 | 30,182 |
| | 7.75%, 1/15/2024 (c) | | 650,000 | 514,312 |
| Petrobras Global Finance BV: |
| | 6.125%, 1/17/2022 | | 131,000 | 135,126 |
| | 8.375%, 5/23/2021 | | 575,000 | 643,643 |
| Petroleos del Peru SA, 144A, 5.625%, 6/19/2047 | | 300,000 | 303,000 |
| Petroleos Mexicanos: |
| | 4.625%, 9/21/2023 | | 135,000 | 136,620 |
| | 144A, 5.375%, 3/13/2022 | | 157,000 | 165,282 |
| Plains All American Pipeline LP: |
| | 2.85%, 1/31/2023 | | 165,000 | 160,068 |
| | 4.3%, 1/31/2043 | | 95,000 | 81,286 |
| | 4.5%, 12/15/2026 | | 165,000 | 166,873 |
| Regency Energy Partners LP, 4.5%, 11/1/2023 | | 130,000 | 134,891 |
| Rosneft Finance SA, 144A, 7.25%, 2/2/2020 | | 400,000 | 439,487 |
| Sabine Pass Liquefaction LLC, 5.0%, 3/15/2027 | | 505,000 | 537,558 |
| Sunoco Logistics Partners Operations LP, 5.3%, 4/1/2044 | 90,000 | 87,740 |
| Transcanada Trust, 5.3%, 3/15/2077 | 380,000 | 390,640 |
| | 5,972,505 |
| Financials 14.9% |
| AIA Group Ltd., 144A, 4.5%, 3/16/2046 | | 200,000 | 212,546 |
| ANZ New Zealand International Ltd., 144A, 2.125%, 7/28/2021 | | 200,000 | 196,699 |
| Ares Capital Corp.: |
| | 3.625%, 1/19/2022 | | 180,000 | 182,083 |
| | 3.875%, 1/15/2020 | | 200,000 | 203,923 |
| | Principal Amount ($)(a) | Value ($) |
| | | | | |
| Bank of America Corp., 3.824%, 1/20/2028 | | 360,000 | 366,251 |
| Banque Federative du Credit Mutuel SA, 144A, 2.5%, 4/13/2021 | 205,000 | 204,737 |
| Barclays PLC, 4.836%, 5/9/2028 | 690,000 | 705,380 |
| BBVA Bancomer SA, 144A, 6.75%, 9/30/2022 | | 250,000 | 284,063 |
| Blackstone Holdings Finance Co., LLC, 144A, 5.0%, 6/15/2044 | 50,000 | 54,396 |
| BNP Paribas SA, 144A, 4.625%, 3/13/2027 | | 420,000 | 442,895 |
| Branch Banking & Trust Co., 1.45%, 5/10/2019 | | 180,000 | 178,602 |
| Citigroup, Inc., 3.2%, 10/21/2026 | 380,000 | 369,558 |
| Credit Agricole SA, 144A, 2.375%, 7/1/2021 (c) | | 250,000 | 249,031 |
| Credit Suisse Group AG, 144A, 4.282%, 1/9/2028 | 250,000 | 258,420 |
| Credit Suisse Group Funding Guernsey Ltd., 3.8%, 6/9/2023 | 250,000 | 257,739 |
| Everest Reinsurance Holdings, Inc., 4.868%, 6/1/2044 | 100,000 | 102,936 |
| FS Investment Corp., 4.75%, 5/15/2022 | | 150,000 | 154,020 |
| HSBC Holdings PLC: |
| | 4.375%, 11/23/2026 | | 200,000 | 207,524 |
| | 6.0%, 5/22/2027 | | 225,000 | 232,650 |
| JPMorgan Chase & Co., 2.95%, 10/1/2026 | | 380,000 | 366,738 |
| KKR Group Finance Co. III LLC, 144A, 5.125%, 6/1/2044 | 70,000 | 74,058 |
| Legg Mason, Inc., 5.625%, 1/15/2044 | | 100,000 | 106,213 |
| Loews Corp., 4.125%, 5/15/2043 | 80,000 | 79,411 |
| Macquarie Bank Ltd., 144A, 6.125%, 3/8/2027 | | 295,000 | 301,638 |
| Macquarie Group Ltd., 144A, 6.0%, 1/14/2020 | | 390,000 | 423,672 |
| Manulife Financial Corp.: |
| | 4.061%, 2/24/2032 | | 280,000 | 282,496 |
| | 4.9%, 9/17/2020 | | 80,000 | 86,012 |
| Massachusetts Mutual Life Insurance Co., 144A, 4.5%, 4/15/2065 | 30,000 | 30,344 |
| Morgan Stanley, 3.625%, 1/20/2027 | 280,000 | 282,013 |
| Nationwide Building Society, 144A, 2.45%, 7/27/2021 | 200,000 | 199,867 |
| Nationwide Financial Services, Inc., 144A, 5.3%, 11/18/2044 | 90,000 | 102,347 |
| QBE Insurance Group Ltd., 144A, 2.4%, 5/1/2018 | 260,000 | 260,152 |
| Royal Bank of Scotland Group PLC, |
| | 3.498%, 5/15/2023 | | 400,000 | 402,594 |
| Santander Holdings U.S.A., Inc., 144A, 3.7%, 3/28/2022 | 290,000 | 293,748 |
| Santander UK Group Holdings PLC, 2.875%, 8/5/2021 | 335,000 | 335,770 |
| Societe Generale SA, 144A, 7.375%, 12/29/2049 | | 476,000 | 511,700 |
| Standard Chartered PLC, 144A, 3.05%, 1/15/2021 | 200,000 | 202,464 |
| Suncorp-Metway Ltd.: |
| | 144A, 2.1%, 5/3/2019 | | 95,000 | 94,759 |
| | 144A, 2.8%, 5/4/2022 | | 205,000 | 205,418 |
| Swiss Re Treasury U.S. Corp., 144A, 4.25%, 12/6/2042 | 70,000 | 71,975 |
| | Principal Amount ($)(a) | Value ($) |
| | | | | |
| The Goldman Sachs Group, Inc., 3.75%, 2/25/2026 | 370,000 | 376,753 |
| Unifin Financiera SAB de CV SOFOM ENR, 144A, 7.0%, 1/15/2025 | 415,000 | 409,813 |
| Voya Financial, Inc., 4.8%, 6/15/2046 | 120,000 | 124,992 |
| Wells Fargo & Co., 3.0%, 10/23/2026 | 380,000 | 370,028 |
| Woori Bank, 144A, 4.5%, 12/29/2049 | 250,000 | 247,833 |
| | 11,106,261 |
| Health Care 2.0% |
| Aetna, Inc., 2.8%, 6/15/2023 | | 85,000 | 84,853 |
| Anthem, Inc., 3.3%, 1/15/2023 | 60,000 | 61,194 |
| Bristol-Myers Squibb Co., 3.25%, 2/27/2027 | | 320,000 | 322,762 |
| HCA, Inc., 5.25%, 6/15/2026 | | 300,000 | 323,550 |
| Mylan NV, 5.25%, 6/15/2046 | | 45,000 | 49,225 |
| Shire Acquisitions Investments Ireland DAC, 3.2%, 9/23/2026 | 263,000 | 257,176 |
| Stryker Corp.: |
| | 3.375%, 11/1/2025 | | 80,000 | 81,415 |
| | 4.625%, 3/15/2046 | | 40,000 | 43,699 |
| Teva Pharmaceutical Finance Netherlands III BV, 2.2%, 7/21/2021 | | 150,000 | 147,249 |
| UnitedHealth Group, Inc.: |
| | 3.45%, 1/15/2027 | | 50,000 | 51,410 |
| | 4.2%, 1/15/2047 | | 80,000 | 84,392 |
| | 1,506,925 |
| Industrials 4.2% |
| Acwa Power Management & Investments One Ltd., 144A, 5.95%, 12/15/2039 | | 450,000 | 459,056 |
| Bombardier, Inc., 144A, 8.75%, 12/1/2021 | | 495,000 | 549,450 |
| Booz Allen Hamilton, Inc., 144A, 5.125%, 5/1/2025 | 20,000 | 19,650 |
| FedEx Corp., 4.55%, 4/1/2046 | 90,000 | 94,539 |
| KAR Auction Services, Inc., 144A, 5.125%, 6/1/2025 | | 280,000 | 285,250 |
| Northrop Grumman Corp., 3.2%, 2/1/2027 | | 170,000 | 171,168 |
| Rockwell Collins, Inc., 4.35%, 4/15/2047 | | 170,000 | 177,789 |
| Siemens Financieringsmaatschappij NV: | |
| | 144A, 3.4%, 3/16/2027 | | 250,000 | 255,486 |
| | 144A, 4.2%, 3/16/2047 | | 250,000 | 264,811 |
| Transurban Finance Co. Pty Ltd., 144A, 3.375%, 3/22/2027 | 130,000 | 126,965 |
| United Rentals North America, Inc.: |
| | 5.5%, 5/15/2027 | | 330,000 | 339,900 |
| | 5.875%, 9/15/2026 | | 365,000 | 388,725 |
| | 3,132,789 |
| Information Technology 4.6% |
| Apple, Inc., 3.45%, 2/9/2045 | | 60,000 | 56,379 |
| Broadcom Corp., 144A, 3.625%, 1/15/2024 | | 125,000 | 127,875 |
| CA, Inc., 3.6%, 8/15/2022 | | 90,000 | 91,010 |
| Dell International LLC: |
| | 144A, 4.42%, 6/15/2021 | | 120,000 | 126,506 |
| | 144A, 5.875%, 6/15/2021 | | 1,220,000 | 1,277,950 |
| | 144A, 8.1%, 7/15/2036 | | 90,000 | 113,121 |
| | Principal Amount ($)(a) | Value ($) |
| | | | | |
| DXC Technology Co., 144A, 4.75%, 4/15/2027 | | 400,000 | 417,074 |
| eBay, Inc., 3.8%, 3/9/2022 | | 81,000 | 84,645 |
| Fidelity National Information Services, Inc., 3.625%, 10/15/2020 | 140,000 | 146,656 |
| Hewlett Packard Enterprise Co., 3.6%, 10/15/2020 | 90,000 | 92,799 |
| j2 Cloud Services LLC, 144A, 6.0%, 7/15/2025 | | 170,000 | 175,100 |
| Seagate HDD Cayman: |
| | 144A, 4.25%, 3/1/2022 | | 90,000 | 91,483 |
| | 5.75%, 12/1/2034 | | 110,000 | 110,045 |
| Symantec Corp., 144A, 5.0%, 4/15/2025 | | 115,000 | 120,354 |
| Tencent Holdings Ltd., 144A, 3.8%, 2/11/2025 | | 250,000 | 260,358 |
| Xilinx, Inc., 2.95%, 6/1/2024 | | 130,000 | 130,350 |
| | 3,421,705 |
| Materials 5.3% |
| Anglo American Capital PLC, 144A, 4.75%, 4/10/2027 | 400,000 | 410,920 |
| AngloGold Ashanti Holdings PLC, 5.125%, 8/1/2022 (c) | 250,000 | 261,125 |
| Bluestar Finance Holdings Ltd., REG S, 4.375%, 6/11/2020 | 300,000 | 310,358 |
| Cemex SAB de CV, 144A, 7.75%, 4/16/2026 | | 200,000 | 228,750 |
| CF Industries, Inc., 3.45%, 6/1/2023 (c) | | 450,000 | 425,250 |
| Freeport-McMoRan, Inc., 2.375%, 3/15/2018 | | 150,000 | 149,250 |
| Glencore Funding LLC, 144A, 4.625%, 4/29/2024 | | 40,000 | 41,816 |
| LYB International Finance II BV, 3.5%, 3/2/2027 | 325,000 | 320,366 |
| Mexichem SAB de CV, 144A, 5.875%, 9/17/2044 | | 300,000 | 300,450 |
| Reynolds Group Issuer, Inc., 5.75%, 10/15/2020 | | 325,000 | 332,585 |
| Rio Tinto Finance U.S.A. Ltd., 3.75%, 6/15/2025 | | 90,000 | 94,729 |
| St. Marys Cement, Inc., 144A, 5.75%, 1/28/2027 | 430,000 | 423,034 |
| Vale Overseas Ltd., 6.25%, 8/10/2026 | 242,000 | 261,058 |
| Yamana Gold, Inc., 4.95%, 7/15/2024 | | 405,000 | 409,194 |
| | 3,968,885 |
| Real Estate 3.8% |
| CBL & Associates LP: |
| | (REIT), 5.25%, 12/1/2023 (c) | 145,000 | 141,443 |
| | (REIT), 5.95%, 12/15/2026 (c) | 125,000 | 123,778 |
| Crown Castle International Corp., (REIT), 5.25%, 1/15/2023 | 135,000 | 149,963 |
| CyrusOne LP: |
| | 144A, (REIT), 5.0%, 3/15/2024 | 110,000 | 113,300 |
| | 144A, (REIT), 5.375%, 3/15/2027 | 75,000 | 78,094 |
| Equinix, Inc., (REIT), 5.375%, 4/1/2023 | 345,000 | 358,369 |
| Government Properties Income Trust, (REIT), 3.75%, 8/15/2019 | 110,000 | 110,857 |
| Hospitality Properties Trust, (REIT), 5.0%, 8/15/2022 | 220,000 | 235,820 |
| Host Hotels & Resorts LP, (REIT), 3.875%, 4/1/2024 | 135,000 | 137,323 |
| | Principal Amount ($)(a) | Value ($) |
| | | | | |
| Howard Hughes Corp., 144A, 5.375%, 3/15/2025 | | 280,000 | 286,300 |
| MGM Growth Properties Operating Partnership LP, (REIT), 4.5%, 9/1/2026 | 280,000 | 281,750 |
| Omega Healthcare Investors, Inc.: |
| | (REIT), 4.75%, 1/15/2028 | | 145,000 | 144,754 |
| | (REIT), 4.95%, 4/1/2024 | | 130,000 | 136,159 |
| Select Income REIT: |
| | (REIT), 4.15%, 2/1/2022 | | 120,000 | 120,974 |
| | (REIT), 4.25%, 5/15/2024 | | 80,000 | 79,285 |
| VEREIT Operating Partnership LP, (REIT), 4.125%, 6/1/2021 | 285,000 | 297,272 |
| | 2,795,441 |
| Telecommunication Services 3.1% |
| AT&T, Inc.: |
| | 3.4%, 5/15/2025 | | 200,000 | 196,618 |
| | 4.25%, 3/1/2027 | | 218,000 | 225,402 |
| | 4.5%, 5/15/2035 | | 260,000 | 255,786 |
| Bharti Airtel International Netherlands BV, 144A, 5.125%, 3/11/2023 | 300,000 | 315,747 |
| Deutsche Telekom International Finance BV, 144A, 2.82%, 1/19/2022 | 250,000 | 251,432 |
| Sprint Spectrum Co., LLC, 144A, 3.36%, 3/20/2023 | 200,000 | 201,750 |
| Telefonica Emisiones SAU, 5.213%, 3/8/2047 | | 300,000 | 323,920 |
| Verizon Communications, Inc.: |
| | 2.625%, 8/15/2026 | | 450,000 | 413,908 |
| | 4.272%, 1/15/2036 | | 150,000 | 144,773 |
| | 2,329,336 |
| Utilities 2.4% |
| AmeriGas Partners LP, 5.5%, 5/20/2025 | | 208,000 | 212,160 |
| EDP Finance BV, 144A, 3.625%, 7/15/2024 | | 200,000 | 198,488 |
| Electricite de France SA, 144A, 4.75%, 10/13/2035 | 150,000 | 160,218 |
| Enel Finance International NV, 144A, 4.75%, 5/25/2047 | 200,000 | 205,792 |
| Great Plains Energy, Inc., 4.85%, 4/1/2047 | | 85,000 | 87,464 |
| Israel Electric Corp., Ltd., Series 6, 144A, REG S, 5.0%, 11/12/2024 | 300,000 | 322,350 |
| NRG Energy, Inc., 6.625%, 1/15/2027 | 270,000 | 270,337 |
| Southern Co., 3.25%, 7/1/2026 | 205,000 | 200,544 |
| Southern Power Co., Series F, 4.95%, 12/15/2046 | 87,000 | 89,840 |
| | 1,747,193 |
| Total Corporate Bonds (Cost $44,646,410) | 45,457,648 |
| |
| Mortgage-Backed Securities Pass-Throughs 16.1% |
| Federal Home Loan Mortgage Corp.: | |
| | 4.0%, 8/1/2039 | | 431,080 | 457,675 |
| | 5.5%, with various maturities from 10/1/2023 until 6/1/2035 | 807,824 | 905,132 |
| | 6.5%, 3/1/2026 | | 111,419 | 121,906 |
| | Principal Amount ($)(a) | Value ($) |
| | | | | |
| Federal National Mortgage Association: | |
| | 3.0%*, 9/1/2038 | | 28,189 | 29,572 |
| | 3.5%, with various maturities from 12/1/2046 until 1/1/2047 | 2,497,134 | 2,577,262 |
| | 5.0%, with various maturities from 10/1/2033 until 8/1/2040 | 809,583 | 886,106 |
| | 5.5%, with various maturities from 12/1/2032 until 8/1/2037 | 848,157 | 947,274 |
| | 6.0%, with various maturities from 4/1/2024 until 3/1/2025 | 236,561 | 265,971 |
| | 6.5%, with various maturities from 11/1/2024 until 12/1/2037 | 272,086 | 309,317 |
| Government National Mortgage Association: | |
| | 3.5%, 7/1/2047 (b) | | 1,100,000 | 1,139,359 |
| | 4.0%, with various maturities from 2/15/2041 until 7/1/2047 (b) | 4,143,286 | 4,367,133 |
| Total Mortgage-Backed Securities Pass-Throughs (Cost $11,839,966) | 12,006,707 |
| |
| Asset-Backed 5.6% |
| Automobile Receivables 0.7% |
| Avis Budget Rental Car Funding AESOP LLC, "C", Series 2015-1A, 144A, 3.96%, 7/20/2021 | 500,000 | 497,299 |
| Credit Card Receivables 1.3% |
| World Financial Network Credit Card Master Trust, "M", Series 2016-A, 2.33%, 4/15/2025 | 1,000,000 | 991,071 |
| Miscellaneous 3.6% |
| Domino's Pizza Master Issuer LLC, "A23", Series 2017-1A, 144A, 4.118%, 7/25/2047 (b) | 1,140,000 | 1,139,287 |
| Hilton Grand Vacations Trust, "B", Series 2014-AA, 144A, 2.07%, 11/25/2026 | 154,358 | 152,555 |
| PennyMac LLC, "A1", Series 2015-NPL1, 144A, 4.0%, 3/25/2055 | 174,530 | 175,337 |
| Taco Bell Funding LLC, "A2I", Series 2016-1A, 144A, 3.832%, 5/25/2046 | 739,413 | 755,909 |
| Voya CLO Ltd., "C", Series 2015-1A, 144A, 4.424%*, 4/18/2027 | 500,000 | 494,613 |
| | 2,717,701 |
| Total Asset-Backed (Cost $4,190,043) | 4,206,071 |
| |
| Commercial Mortgage-Backed Securities 1.6% |
| FHLMC Multifamily Structured Pass-Through Certificates: | |
| | "X1", Series K043, Interest Only, 0.675%**, 12/25/2024 | 4,966,172 | 172,932 |
| | "X1", Series K054, Interest Only, 1.318%**, 1/25/2026 | 1,843,639 | 152,952 |
| JPMBB Commercial Mortgage Securities Trust, "A3", Series 2014-C19, 3.669%, 4/15/2047 | 150,000 | 155,895 |
| | Principal Amount ($)(a) | Value ($) |
| | | | | |
| JPMorgan Chase Commercial Mortgage Securities Corp., "A4", Series 2007-C1, 5.716%, 2/15/2051 | 674,885 | 678,653 |
| Total Commercial Mortgage-Backed Securities (Cost $1,204,860) | 1,160,432 |
| |
| Collateralized Mortgage Obligations 3.0% |
| Countrywide Home Loans, "A2", Series 2006-1, 6.0%, 3/25/2036 | 223,852 | 190,800 |
| CS First Boston Mortgage Securities Corp., "10A3", Series 2005-10, 6.0%, 11/25/2035 | 90,916 | 51,714 |
| Federal Home Loan Mortgage Corp.: | |
| | "PI", Series 4485, Interest Only, 3.5%, 6/15/2045 | 1,969,928 | 317,073 |
| | "PI", Series 3940, Interest Only, 4.0%, 2/15/2041 | 320,701 | 45,948 |
| | "C31", Series 303, Interest Only, 4.5%, 12/15/2042 | 1,483,651 | 292,150 |
| Federal National Mortgage Association, "ZL" , Series 2017-55, 3.0%, 10/25/2046 | 500,000 | 459,222 |
| Government National Mortgage Association: | |
| | "PL", Series 2013-19, 2.5%, 2/20/2043 | | 684,500 | 647,813 |
| | "PI", Series 2015-40, Interest Only, 4.0%, 4/20/2044 | 365,801 | 48,139 |
| | "PI", Series 2014-108, Interest Only, 4.5%, 12/20/2039 | 273,199 | 46,009 |
| | "EI", Series 2011-162, Interest Only, 4.5%, 5/20/2040 | 431,568 | 20,479 |
| | "DI", Series 2011-40, Interest Only, 4.5%, 12/20/2040 | 436,812 | 5,957 |
| | "IN", Series 2009-69, Interest Only, 5.5%, 8/20/2039 | 79,133 | 14,354 |
| | "IV", Series 2009-69, Interest Only, 5.5%, 8/20/2039 | 153,133 | 25,823 |
| | "IJ", Series 2009-75, Interest Only, 6.0%, 8/16/2039 | 66,653 | 11,477 |
| MASTR Alternative Loans Trust: |
| | "5A1", Series 2005-1, 5.5%, 1/25/2020 | | 35,324 | 36,071 |
| | "8A1", Series 2004-3, 7.0%, 4/25/2034 | | 6,855 | 7,344 |
| Total Collateralized Mortgage Obligations (Cost $2,527,491) | 2,220,373 |
| |
| Government & Agency Obligations 16.2% |
| Other Government Related (d) 4.3% |
| Credit Bank of Moscow, 144A, 8.875%, 11/10/2022 | | 1,250,000 | 1,199,520 |
| European Financial Stability Facility, REG S, 1.25%, 5/24/2033 | EUR | 1,316,000 | 1,474,171 |
| Novatek OAO, 144A, 6.604%, 2/3/2021 | | 300,000 | 332,187 |
| Vnesheconombank, 144A, 6.902%, 7/9/2020 | | 150,000 | 162,988 |
| | 3,168,866 |
| | Principal Amount ($)(a) | Value ($) |
| | | | | |
| Sovereign Bonds 5.4% |
| Government of Australia, Series 150, REG S, 3.0%, 3/21/2047 | AUD | 1,105,000 | 772,703 |
| Government of New Zealand, Series 0427, REG S, 4.5%, 4/15/2027 | NZD | 900,000 | 743,115 |
| KazAgro National Management Holding JSC, 144A, 4.625%, 5/24/2023 | | 250,000 | 248,850 |
| Kingdom of Norway, Series 479, 144A, REG S, 1.75%, 2/17/2027 | NOK | 12,785,000 | 1,545,854 |
| Province of British Columbia Canada, 2.25%, 6/2/2026 | | 500,000 | 484,206 |
| Republic of Sri Lanka, 144A, 6.2%, 5/11/2027 | | 200,000 | 199,682 |
| | 3,994,410 |
| U.S. Government Sponsored Agency 0.9% |
| Federal Home Loan Mortgage Corp., 6.25%, 7/15/2032 | 500,000 | 710,771 |
| U.S. Treasury Obligations 5.6% |
| U.S. Treasury Bond, 3.0%, 2/15/2047 | 170,000 | 175,366 |
| U.S. Treasury Note, 0.75%, 10/31/2017 (e) | | 4,000,000 | 3,995,440 |
| | 4,170,806 |
| Total Government & Agency Obligations (Cost $12,096,473) | 12,044,853 |
| |
| | Principal Amount ($)(a) | Value ($) |
| | | | | |
| Short-Term U.S. Treasury Obligation 1.1% |
| U.S. Treasury Bill, 0.59%***, 8/10/2017 (f) (Cost $803,417) | 804,000 | 803,260 |
| |
Shares | Value ($) |
| | | | | |
| Securities Lending Collateral 2.3% |
| Deutsche Government & Agency Securities Portfolio "Deutsche Government Cash Institutional Shares", 0.87% (g) (h) (Cost $1,732,418) | 1,732,418 | 1,732,418 |
| |
| Cash Equivalents 0.0% |
| Deutsche Central Cash Management Government Fund, 1.03% (g) (Cost $4,856) | 4,856 | 4,856 |
| | | | | |
| | % of Net Assets | Value ($) |
| | |
| Total Investment Portfolio (Cost $79,045,934)† | 106.9 | 79,636,618 |
| Other Assets and Liabilities, Net | (6.9) | (5,111,134) |
| Net Assets | 100.0 | 74,525,484 |
* Floating rate securities' yields vary with a designated market index or market rate, such as the coupon-equivalent of the U.S. Treasury Bill rate. These securities are shown at their current rate as of June 30, 2017.
** These securities are shown at their current rate as of June 30, 2017.
*** Annualized yield at time of purchase; not a coupon rate.
† The cost for federal income tax purposes was $79,128,239. At June 30, 2017, net unrealized appreciation for all securities based on tax cost was $508,379. This consisted of aggregate gross unrealized appreciation for all securities in which there was an excess of value over tax cost of $1,394,173 and aggregate gross unrealized depreciation for all securities in which there was an excess of tax cost over value of $885,794.
(a) Principal amount stated in U.S. dollars unless otherwise noted.
(b) When-issued or delayed delivery security included.
(c) All or a portion of these securities were on loan. In addition, "Other Assets and Liabilities, Net" may include pending sales that are also on loan. The value of securities loaned at June 30, 2017 amounted to $1,661,674, which is 2.2% of net assets.
(d) Government-backed debt issued by financial companies or government sponsored enterprises.
(e) At June 30, 2017, this security has been pledged, in whole or in part, to cover initial margin requirements for open centrally cleared swap contracts.
(f) At June 30, 2017, this security has been pledged, in whole or in part, to cover initial margin requirements for open futures contracts.
(g) Affiliated fund managed by Deutsche Investment Management Americas Inc. The rate shown is the annualized seven-day yield at period end.
(h) Represents collateral held in connection with securities lending. Income earned by the Fund is net of borrower rebates.
144A: Security exempt from registration under Rule 144A of the Securities Act of 1933. These securities may be resold in transactions exempt from registration, normally to qualified institutional buyers.
CLO: Collateralized Loan Obligation
Interest Only: Interest Only (IO) bonds represent the "interest only" portion of payments on a pool of underlying mortgages or mortgage-backed securities. IO securities are subject to prepayment risk of the pool of underlying mortgages.
JSC: Joint Stock Company
REG S: Securities sold under Regulation S may not be offered, sold or delivered within the United States or to, or for the account or benefit of, U.S. persons, except pursuant to an exemption from, or in a transaction not subject to, the registration requirements of the Securities Act of 1933.
REIT: Real Estate Investment Trust
Included in the portfolio are investments in mortgage- or asset-backed securities, which are interests in separate pools of mortgages or assets. Effective maturities of these investments may be shorter than stated maturities due to prepayments. Some separate investments in the Federal Home Loan Mortgage Corp., Federal National Mortgage Association and Government National Mortgage Association issues which have similar coupon rates have been aggregated for presentation purposes in this investment portfolio.
At June 30, 2017, open futures contracts purchased were as follows:
| Futures | Currency | Expiration Date | Contracts | Notional Value ($) | Unrealized (Depreciation) ($) |
| 10 Year U.S. Treasury Note | USD | 9/20/2017 | 23 | 2,887,219 | (7,955) |
| 5 Year U.S. Treasury Note | USD | 9/29/2017 | 46 | 5,420,453 | (12,578) |
| U.S. Treasury Long Bond | USD | 9/20/2017 | 10 | 1,536,875 | (3,645) |
| Total unrealized depreciation | (24,178) |
At June 30, 2017, open futures contracts sold were as follows:
| Futures | Currency | Expiration Date | Contracts | Notional Value ($) | Unrealized Appreciation/ (Depreciation) ($) |
| Euro-BTP Italian Government Bond | EUR | 9/7/2017 | 11 | 1,697,851 | 24,511 |
| Euro-OAT French Government Bond | EUR | 9/7/2017 | 16 | 2,713,382 | 3,439 |
| Federal Republic of Germany Euro-Bund | EUR | 9/7/2017 | 8 | 1,479,038 | 24,110 |
| Ultra 10 Year U.S. Treasury Note | USD | 9/20/2017 | 42 | 5,662,125 | 9,759 |
| Ultra Long U.S. Treasury Bond | USD | 9/20/2017 | 58 | 9,620,750 | (139,454) |
| United Kingdom Long Gilt Bond | GBP | 9/27/2017 | 14 | 2,289,680 | 45,194 |
| Total net unrealized depreciation | (32,441) |
At June 30, 2017, open interest rate swap contracts were as follows:
| Centrally Cleared Swaps |
Effective/
Expiration Dates | Notional Amount | Currency | Cash Flows Paid by the Fund | Cash Flows Received by the Fund | Value ($) | Unrealized Appreciation/ (Depreciation) ($) |
12/16/2015
9/16/2025 | 500,000 | USD | Floating — 3-Month LIBOR | Fixed — 2.64% | 20,649 | 17,971 |
12/16/2015
9/17/2035 | 6,700,000 | USD | Floating — 3-Month LIBOR | Fixed — 2.938% | 495,907 | 360,727 |
6/15/2017
6/15/2022 | 328,000,000 | JPY | Floating — 6-Month JPY LIBOR | Fixed — 0.105% | 710 | 710 |
6/15/2017
6/15/2047 | 59,800,000 | JPY | Fixed — 0.811% | Floating — 6-Month JPY LIBOR | 3,892 | 3,892 |
12/16/2015
9/18/2045 | 3,600,000 | USD | Floating — 3-Month LIBOR | Fixed — 2.998% | 361,609 | 246,511 |
9/30/2015
9/30/2045 | 2,000,000 | USD | Fixed — 2.88% | Floating — 3-Month LIBOR | (157,704) | (118,302) |
12/4/2015
12/4/2045 | 2,000,000 | USD | Fixed — 2.615% | Floating — 3-Month LIBOR | (39,438) | 1,685 |
9/16/2015
9/16/2045 | 4,695,000 | USD | Floating — 3-Month LIBOR | Fixed — 3.0% | 473,293 | 193,909 |
| Total net unrealized appreciation | 707,103 |
LIBOR: London Interbank Offered Rate; U.S. 3-Month LIBOR rate at June 30, 2017 is 1.3%; JPY 6-Month LIBOR rate at June 30, 2017 is 0.02%
At June 30, 2017, the Fund had the following open forward foreign currency exchange contracts:
| Contracts to Deliver | | In Exchange For | | Settlement Date | | Unrealized Appreciation ($) | Counterparty |
| USD | 965,176 | | NZD | 1,323,711 | | 8/1/2017 | | 4,266 | Australia & New Zealand Banking Group Ltd. |
| NOK | 16,287,831 | | SEK | 16,767,508 | | 8/14/2017 | | 42,680 | Danske Bank AS |
| USD | 1,506,750 | | JPY | 170,960,712 | | 8/14/2017 | | 16,196 | Barclays Bank PLC |
| JPY | 170,960,712 | | USD | 1,550,777 | | 8/14/2017 | | 27,830 | Citigroup, Inc. |
| USD | 822,524 | | AUD | 1,100,000 | | 8/25/2017 | | 22,333 | JPMorgan Chase Securities, Inc. |
| NZD | 2,100,000 | | CAD | 2,010,908 | | 9/14/2017 | | 15,793 | Citigroup, Inc. |
| USD | 1,515,257 | | CAD | 2,000,000 | | 9/25/2017 | | 29,096 | Canadian Imperial Bank of Commerce |
| Total unrealized appreciation | | | | 158,194 |
| Contracts to Deliver | | In Exchange For | | Settlement Date | | Unrealized Depreciation ($) | Counterparty |
| NZD | 1,323,711 | | USD | 904,816 | | 8/1/2017 | | (64,626) | Australia & New Zealand Banking Group Ltd. |
| AUD | 2,044,706 | | NZD | 2,144,899 | | 8/14/2017 | | (147) | Australia & New Zealand Banking Group Ltd. |
| NZD | 2,173,001 | | AUD | 2,044,706 | | 8/14/2017 | | (20,429) | Bank of America |
| SEK | 16,787,053 | | NOK | 16,287,831 | | 8/14/2017 | | (45,006) | Danske Bank AS |
| NZD | 1,100,000 | | USD | 753,449 | | 8/16/2017 | | (51,934) | JPMorgan Chase Securities, Inc. |
| AUD | 1,100,000 | | USD | 823,565 | | 8/25/2017 | | (21,292) | Australia & New Zealand Banking Group Ltd. |
| NOK | 12,853,000 | | USD | 1,540,175 | | 8/28/2017 | | (1,155) | Toronto Dominion Bank |
| CAD | 2,013,272 | | NZD | 2,100,000 | | 9/14/2017 | | (17,618) | BNP Paribas |
| CAD | 2,000,000 | | USD | 1,538,837 | | 9/25/2017 | | (5,517) | Canadian Imperial Bank of Commerce |
| EUR | 1,347,936 | | NOK | 12,800,000 | | 9/26/2017 | | (10,909) | Danske Bank AS |
| NOK | 12,800,000 | | EUR | 1,327,618 | | 9/26/2017 | | (12,405) | Goldman Sachs & Co. |
| AUD | 1,048,000 | | USD | 799,194 | | 9/29/2017 | | (5,376) | Australia & New Zealand Banking Group Ltd. |
| EUR | 1,298,000 | | USD | 1,489,760 | | 10/5/2017 | | (393) | Citigroup, Inc. |
| Total unrealized depreciation | | | | (256,807) |
| Currency Abbreviations |
AUD Australian Dollar CAD Canadian Dollar EUR Euro GBP British Pound JPY Japanese yen NOK Norwegian Krone NZD New Zealand Dollar SEK Swedish Krona USD United States Dollar |
For information on the Fund's policy and additional disclosures regarding futures contracts, interest rate swap contracts and forward foreign currency exchange contracts, please refer to Note B in the accompanying Notes to Financial Statements.
Fair Value Measurements
Various inputs are used in determining the value of the Fund's investments. These inputs are summarized in three broad levels. Level 1 includes quoted prices in active markets for identical securities. Level 2 includes other significant observable inputs (including quoted prices for similar securities, interest rates, prepayment speeds and credit risk). Level 3 includes significant unobservable inputs (including the Fund's own assumptions in determining the fair value of investments). The level assigned to the securities valuations may not be an indication of the risk or liquidity associated with investing in those securities.
The following is a summary of the inputs used as of June 30, 2017 in valuing the Fund's investments. For information on the Fund's policy regarding the valuation of investments, please refer to the Security Valuation section of Note A in the accompanying Notes to Financial Statements.
| Assets | Level 1 | Level 2 | Level 3 | Total |
| |
| Fixed Income Investments (i) |
| | Corporate Bonds | $ — | $ 45,457,648 | $ — | $ 45,457,648 |
| | Mortgage-Backed Securities Pass-Throughs | — | 12,006,707 | — | 12,006,707 |
| | Asset-Backed | — | 4,206,071 | — | 4,206,071 |
| | Commercial Mortgage-Backed Securities | — | 1,160,432 | — | 1,160,432 |
| | Collateralized Mortgage Obligations | — | 2,220,373 | — | 2,220,373 |
| | Government & Agency Obligations | — | 12,044,853 | — | 12,044,853 |
| | Short-Term U.S. Treasury Obligations | — | 803,260 | — | 803,260 |
| Short-Term Investments (i) | 1,737,274 | — | — | 1,737,274 |
| Derivatives (j) |
| | Futures Contracts | 107,013 | — | — | 107,013 |
| | Interest Rate Swap Contracts | — | 825,405 | — | 825,405 |
| | Forward Foreign Currency Exchange Contracts | — | 158,194 | — | 158,194 |
| Total | $ 1,844,287 | $ 78,882,943 | $ — | $ 80,727,230 |
| Liabilities | Level 1 | Level 2 | Level 3 | Level 2 |
| |
| Derivatives (j) |
| | Futures Contracts | $ (163,632) | $ — | $ — | $ (163,632) |
| | Interest Rate Swap Contracts | — | (118,302) | — | (118,302) |
| | Forward Foreign Currency Exchange Contracts | — | (256,807) | — | (256,807) |
| Total | $ (163,632) | $ (375,109) | $ — | $ (538,741) |
There have been no transfers between fair value measurement levels during the period ended June 30, 2017.
(i) See Investment Portfolio for additional detailed categorizations.
(j) Derivatives include unrealized appreciation (depreciation) on open futures contracts, interest rate swap contracts and forward foreign currency exchange contracts.
The accompanying notes are an integral part of the financial statements.
Statement of Assets and Liabilities
| as of June 30, 2017 (Unaudited) |
| Assets |
Investments: Investments in non-affiliated securities, at value (cost $77,308,660) — including $1,661,674 of securities loaned | $ 77,899,344 |
| Investment in Government & Agency Securities Portfolio (cost $1,732,418)* | 1,732,418 |
| Investment in Deutsche Central Cash Management Government Fund (cost $4,856) | 4,856 |
| Total investments in securities, at value (cost $79,045,934) | 79,636,618 |
| Cash | 618,617 |
| Foreign currency, at value (cost $38,750) | 38,065 |
| Receivable for investments sold | 1,351,905 |
| Receivable for Fund shares sold | 542,435 |
| Interest receivable | 675,764 |
| Receivable for variation margin on futures contracts | 96,600 |
| Net receivable for pending swap contracts | 14,335 |
| Unrealized appreciation on forward foreign currency exchange contracts | 158,194 |
| Foreign taxes recoverable | 1,572 |
| Other assets | 242 |
| Total assets | 83,134,347 |
| Liabilities |
| Payable upon return of securities loaned | 1,732,418 |
| Payable for investments purchased | 1,771,587 |
| Payable for investments purchased — when-issued/delayed delivery securities | 4,558,264 |
| Line of credit loan payable | 100,000 |
| Payable for Fund shares redeemed | 13,660 |
| Payable for variation margin on centrally cleared swaps | 47,508 |
| Unrealized depreciation on forward foreign currency exchange contracts | 256,807 |
| Accrued management fee | 18,902 |
| Accrued Trustees' fees | 630 |
| Other accrued expenses and payables | 109,087 |
| Total liabilities | 8,608,863 |
| Net assets, at value | $ 74,525,484 |
| Net Assets Consist of |
| Undistributed net investment income | 1,011,741 |
Net unrealized appreciation (depreciation) on: Investments | 590,684 |
| Swap contracts | 707,103 |
| Futures | (56,619) |
| Foreign currency | (98,722) |
| Accumulated net realized gain (loss) | (17,128,991) |
| Paid-in capital | 89,500,288 |
| Net assets, at value | $ 74,525,484 |
Class A Net Asset Value, offering and redemption price per share ($74,525,484 ÷ 13,374,399 outstanding shares of beneficial interest, $.01 par value, unlimited number of shares authorized) | $ 5.57 |
* Represents collateral on securities loaned.
The accompanying notes are an integral part of the financial statements.
Statement of Operations
| for the six months ended June 30, 2017 (Unaudited) |
| Investment Income |
Income: Interest | $ 1,360,400 |
| Income distributions — Deutsche Central Cash Management Government Fund | 1,342 |
| Securities lending income, net of borrower rebates | 4,145 |
| Total income | 1,365,887 |
Expenses: Management fee | 145,645 |
| Administration fee | 37,345 |
| Services to shareholders | 824 |
| Custodian fee | 12,056 |
| Professional fees | 46,692 |
| Reports to shareholders | 17,216 |
| Trustees' fees and expenses | 3,715 |
| Interest expense | 129 |
| Other | 18,299 |
| Total expenses before expense reductions | 281,921 |
| Expense reductions | (40,038) |
| Total expenses after expense reductions | 241,883 |
| Net investment income | 1,124,004 |
| Realized and Unrealized Gain (Loss) |
Net realized gain (loss) from: Investments | 478,932 |
| Swap contracts | (115,996) |
| Futures | (301,836) |
| Foreign currency | 63,201 |
| | 124,301 |
Change in net unrealized appreciation (depreciation) on: Investments | 1,013,241 |
| Swap contracts | 457,285 |
| Futures | (125,443) |
| Foreign currency | (33,341) |
| | 1,311,742 |
| Net gain (loss) | 1,436,043 |
| Net increase (decrease) in net assets resulting from operations | $ 2,560,047 |
The accompanying notes are an integral part of the financial statements.
Statements of Changes in Net Assets
| Increase (Decrease) in Net Assets | Six Months Ended June 30, 2017 (Unaudited) | Year Ended December 31, 2016 | |
| |
Operations: Net investment income | $ 1,124,004 | $ 2,156,650 | |
| Net realized gain (loss) | 124,301 | 1,349,873 | |
| Change in net unrealized appreciation (depreciation) | 1,311,742 | 1,028,989 | |
| Net increase (decrease) in net assets resulting from operations | 2,560,047 | 4,535,512 | |
Distributions to shareholders from: Net investment income: Class A | (1,811,823) | (4,037,321) | |
Fund share transactions: Class A Proceeds from shares sold | 2,562,111 | 10,928,699 | |
| Reinvestment of distributions | 1,811,823 | 4,037,321 | |
| Payments for shares redeemed | (7,567,452) | (18,293,243) | |
| Net increase (decrease) in net assets from Class A share transactions | (3,193,518) | (3,327,223) | |
| Increase (decrease) in net assets | (2,445,294) | (2,829,032) | |
| Net assets at beginning of period | 76,970,778 | 79,799,810 | |
| Net assets at end of period (including undistributed net investment income of $1,011,741 and $1,699,560, respectively) | $ 74,525,484 | $ 76,970,778 | |
| Other Information | |
Class A Shares outstanding at beginning of period | 13,944,103 | 14,528,974 | |
| Shares sold | 459,460 | 1,951,337 | |
| Shares issued to shareholders in reinvestment of distributions | 328,229 | 739,436 | |
| Shares redeemed | (1,357,393) | (3,275,644) | |
| Net increase (decrease) in Class A shares | (569,704) | (584,871) | |
| Shares outstanding at end of period | 13,374,399 | 13,944,103 | |
The accompanying notes are an integral part of the financial statements.
Financial Highlights
| Class A | Six Months Ended 6/30/17 (Unaudited) |
Years Ended December 31, |
| 2016 | 2015 | 2014 | 2013 | 2012 |
| Selected Per Share Data |
| Net asset value, beginning of period | $ 5.52 | $ 5.49 | $ 5.67 | $ 5.51 | $ 5.89 | $ 5.72 |
Income (loss) from investment operations: Net investment incomea | .08 | .15 | .14 | .17 | .16 | .16 |
| Net realized and unrealized gain (loss) | .11 | .17 | (.15) | .19 | (.33) | .27 |
| Total from investment operations | .19 | .32 | (.01) | .36 | (.17) | .43 |
Less distributions from: Net investment income | (.14) | (.29) | (.17) | (.20) | (.21) | (.26) |
| Net asset value, end of period | $ 5.57 | $ 5.52 | $ 5.49 | $ 5.67 | $ 5.51 | $ 5.89 |
| Total Return (%) | 3.42b** | 5.93b | (.29)b | 6.63b | (3.03)b | 7.77 |
| Ratios to Average Net Assets and Supplemental Data |
| Net assets, end of period ($ millions) | 75 | 77 | 80 | 101 | 105 | 190 |
| Ratio of expenses before expense reductions (%)c | .75* | .78 | .69 | .69 | .65 | .58 |
| Ratio of expenses after expense reductions (%)c | .65* | .64 | .64 | .61 | .56 | .58 |
| Ratio of net investment income (%) | 3.01* | 2.68 | 2.54 | 2.99 | 2.88 | 2.81 |
| Portfolio turnover rate (%) | 106** | 236 | 197 | 273 | 418 | 115 |
a Based on average shares outstanding during the period. b Total return would have been lower had certain expenses not been reduced. c Expense ratio does not reflect charges and fees associated with the separate account that invests in the Fund or any variable life insurance policy or variable annuity contract for which the Fund is an investment option. * Annualized ** Not annualized |
| | | | | | | | |
Notes to Financial Statements (Unaudited)
A. Organization and Significant Accounting Policies
Deutsche Variable Series I (the "Trust") is registered under the Investment Company Act of 1940, as amended (the "1940 Act"), as an open-end, registered management investment company organized as a Massachusetts business trust. The Trust consists of five diversified funds: Deutsche Bond VIP, Deutsche Capital Growth VIP, Deutsche Core Equity VIP, Deutsche CROCI® International VIP and Deutsche Global Small Cap VIP (individually or collectively hereinafter referred to as a "Fund" or the "Funds"). These financial statements report on Deutsche Bond VIP. The Trust is intended to be the underlying investment vehicle for variable annuity contracts and variable life insurance policies to be offered by the separate accounts of certain life insurance companies ("Participating Insurance Companies").
The Fund's financial statements are prepared in accordance with accounting principles generally accepted in the United States of America ("U.S. GAAP") which require the use of management estimates. Actual results could differ from those estimates. The Fund qualifies as an investment company under Topic 946 of Accounting Standards Codification of U.S. GAAP. The policies described below are followed consistently by the Fund in the preparation of its financial statements.
Security Valuation. Investments are stated at value determined as of the close of regular trading on the New York Stock Exchange on each day the exchange is open for trading.
Various inputs are used in determining the value of the Fund's investments. These inputs are summarized in three broad levels. Level 1 includes quoted prices in active markets for identical securities. Level 2 includes other significant observable inputs (including quoted prices for similar securities, interest rates, prepayment speeds and credit risk). Level 3 includes significant unobservable inputs (including the Fund's own assumptions in determining the fair value of investments). The level assigned to the securities valuations may not be an indication of the risk or liquidity associated with investing in those securities.
Debt securities are valued at prices supplied by independent pricing services approved by the Trustees of the Series. Such services may use various pricing techniques which take into account appropriate factors such as yield, quality, coupon rate, maturity, type of issue, trading characteristics, prepayment speeds and other data, as well as broker quotes. If the pricing services are unable to provide valuations, debt securities are valued at the average of the most recent reliable bid quotations or evaluated prices, as applicable, obtained from broker-dealers. These securities are generally categorized as Level 2.
Investments in open-end investment companies are valued at their net asset value each business day and are categorized as Level 1.
Futures contracts are generally valued at the settlement prices established each day on the exchange on which they are traded and are categorized as Level 1.
Swap contracts are valued daily based upon prices supplied by a Board approved pricing vendor, if available, and otherwise are valued at the price provided by the broker-dealer. Swap contracts are generally categorized as Level 2.
Forward currency contracts are valued at the prevailing forward exchange rate of the underlying currencies and are categorized as Level 2.
Securities and other assets for which market quotations are not readily available or for which the above valuation procedures are deemed not to reflect fair value are valued in a manner that is intended to reflect their fair value as determined in accordance with procedures approved by the Trustees and are generally categorized as Level 3. In accordance with the Fund's valuation procedures, factors considered in determining value may include, but are not limited to, the type of the security; the size of the holding; the initial cost of the security; the existence of any contractual restrictions on the security's disposition; the price and extent of public trading in similar securities of the issuer or of comparable companies; quotations or evaluated prices from broker-dealers and/or pricing services; information obtained from the issuer, analysts, and/or the appropriate stock exchange (for exchange-traded securities); an analysis of the company's or issuer's financial statements; an evaluation of the forces that influence the issuer and the market(s) in which the security is purchased and sold; and with respect to debt securities, the maturity, coupon, creditworthiness, currency denomination and the movement of the market in which the security is normally traded. The value determined under these procedures may differ from published values for the same securities.
Disclosure about the classification of fair value measurements is included in a table following the Fund's Investment Portfolio.
Securities Lending. Deutsche Bank AG, as lending agent, lends securities of the Fund to certain financial institutions under the terms of its securities lending agreement. During the term of the loans, the Fund continues to receive interest and dividends generated by the securities and to participate in any changes in their market value. The Fund requires the borrowers of the securities to maintain collateral with the Fund consisting of either cash or liquid, unencumbered assets having a value at least equal to the value of the securities loaned. When the collateral falls below specified amounts, the lending agent will use its best effort to obtain additional collateral on the next business day to meet required amounts under the securities lending agreement. As of period end, any securities on loan were collateralized by cash. During the six months ended June 30, 2017, the Fund invested the cash collateral into a joint trading account in affiliated money market funds managed by Deutsche Investment Management Americas Inc. As of June 30, 2017, the Fund invested the cash collateral in Deutsche Government & Agency Securities Portfolio. Deutsche Investment Management Americas Inc. receives a management/administration fee (0.13% annualized effective rate as of June 30, 2017) on the cash collateral invested in Deutsche Government & Agency Securities Portfolio. The Fund receives compensation for lending its securities either in the form of fees or by earning interest on invested cash collateral net of borrower rebates and fees paid to a lending agent. Either the Fund or the borrower may terminate the loan at any time and the borrower, after notice, is required to return borrowed securities within a standard time period. There may be risks of delay and costs in recovery of securities or even loss of rights in the collateral should the borrower of the securities fail financially. If the Fund is not able to recover securities lent, the Fund may sell the collateral and purchase a replacement investment in the market, incurring the risk that the value of the replacement security is greater than the value of the collateral. The Fund is also subject to all investment risks associated with the reinvestment of any cash collateral received, including, but not limited to, interest rate, credit and liquidity risk associated with such investments.
As of June 30, 2017, the Fund had securities on loan, which were classified as corporate bonds in the Investment Portfolio. The value of the related collateral exceeded the value of the securities loaned at period end. As of period end, the remaining contractual maturity of the collateral agreements was overnight and continuous.
Foreign Currency Translations. The books and records of the Fund are maintained in U.S. dollars. Investment securities and other assets and liabilities denominated in a foreign currency are translated into U.S. dollars at the prevailing exchange rates at period end. Purchases and sales of investment securities, income and expenses are translated into U.S. dollars at the prevailing exchange rates on the respective dates of the transactions.
Net realized and unrealized gains and losses on foreign currency transactions represent net gains and losses between trade and settlement dates on securities transactions, the acquisition and disposition of foreign currencies, and the difference between the amount of net investment income accrued and the U.S. dollar amount actually received. The portion of both realized and unrealized gains and losses on investments that results from fluctuations in foreign currency exchange rates is not separately disclosed but is included with net realized and unrealized gain/appreciation and loss/depreciation on investments.
When-Issued/Delayed Delivery Securities. The Fund may purchase or sell securities with delivery or payment to occur at a later date beyond the normal settlement period. At the time the Fund enters into a commitment to purchase or sell a security, the transaction is recorded and the value of the transaction is reflected in the net asset value. The price of such security and the date when the security will be delivered and paid for are fixed at the time the transaction is negotiated. The value of the security may vary with market fluctuations. At the time the Fund enters into a purchase transaction it is required to segregate cash or other liquid assets at least equal to the amount of the commitment. Additionally, the Fund may be required to post securities and/or cash collateral in accordance with the terms of the commitment.
Certain risks may arise upon entering into when-issued or delayed delivery transactions from the potential inability of counterparties to meet the terms of their contracts or if the issuer does not issue the securities due to political, economic, or other factors. Additionally, losses may arise due to changes in the value of the underlying securities.
Taxes. The Fund is treated as a separate taxpayer as provided for in the Internal Revenue Code, as amended. It is the Fund's policy to comply with the requirements of the Internal Revenue Code, as amended, which are applicable to regulated investment companies, and to distribute all of its taxable income to the separate accounts of the Participating Insurance Companies which hold its shares.
Additionally, the Fund may be subject to taxes imposed by the governments of countries in which it invests and are generally based on income and/or capital gains earned or repatriated. Estimated tax liabilities on certain foreign securities are recorded on an accrual basis and are reflected as components of interest income or net change in unrealized gain/loss on investments. Tax liabilities realized as a result of security sales are reflected as a component of net realized gain/loss on investments.
Under the Regulated Investment Company Modernization Act of 2010, net capital losses incurred post-enactment may be carried forward indefinitely, and their character is retained as short-term and/or long-term. Previously, net capital losses were carried forward for eight years and treated as short-term losses. As a transition rule, the Act requires that post-enactment net capital losses be used before pre-enactment net capital losses.
At December 31, 2016, the Fund had a net tax basis capital loss carryforward of approximately $14,056,000 of pre-enactment losses, which may be applied against any realized net taxable capital gains until December 31, 2017, the expiration date and approximately $3,046,000 of post-enactment losses, which may be applied against realized net taxable capital gains indefinitely, including short-term losses ($190,000) and long-term losses ($2,856,000).
The Fund has reviewed the tax positions for the open tax years as of December 31, 2016 and has determined that no provision for income tax and/or uncertain tax provisions is required in the Fund's financial statements. The Fund's federal tax returns for the prior three fiscal years remain open subject to examination by the Internal Revenue Service.
Distribution of Income and Gains. Distributions from net investment income of the Fund, if any, are declared and distributed to shareholders annually. Net realized gains from investment transactions, in excess of available capital loss carryforwards, would be taxable to the Fund if not distributed, and, therefore, will be distributed to shareholders at least annually. The Fund may also make additional distributions for tax purposes if necessary.
The timing and characterization of certain income and capital gain distributions are determined annually in accordance with federal tax regulations which may differ from accounting principles generally accepted in the United States of America. These differences primarily relate to investments in foreign denominated investments, investments in forward foreign currency exchange contracts, futures contracts, swap contracts and certain securities sold at a loss. As a result, net investment income (loss) and net realized gain (loss) on investment transactions for a reporting period may differ significantly from distributions during such period. Accordingly, the Fund may periodically make reclassifications among certain of its capital accounts without impacting the net asset value of the Fund.
The tax character of current year distributions will be determined at the end of the current fiscal year.
Expenses. Expenses of the Trust arising in connection with a specific Fund are allocated to that Fund. Other Trust expenses which cannot be directly attributed to a Fund are apportioned among the Funds in the Trust based upon the relative net assets or other appropriate measures.
Contingencies. In the normal course of business, the Fund may enter into contracts with service providers that contain general indemnification clauses. The Fund's maximum exposure under these arrangements is unknown, as this would involve future claims that may be made against the Fund that have not yet been made. However, based on experience, the Fund expects the risk of loss to be remote.
Other. Investment transactions are accounted for on a trade date plus one basis for daily net asset value calculations. However, for financial reporting purposes, investment transactions are reported on trade date. Interest income is recorded on the accrual basis net of foreign withholding taxes. Realized gains and losses from investment transactions are recorded on an identified cost basis. Proceeds from litigation payments, if any, are included in net realized gain (loss) from investments. All discounts and premiums are accreted/amortized for both tax and financial reporting purposes.
B. Derivative Instruments
Futures Contracts. A futures contract is an agreement between a buyer or seller and an established futures exchange or its clearinghouse in which the buyer or seller agrees to take or make a delivery of a specific amount of a financial instrument at a specified price on a specific date (settlement date). For the six months ended June 30, 2017, the Fund invested in interest rate futures to gain exposure to different parts of the yield curve while managing the overall duration. The Fund also entered into interest rate futures contracts for non-hedging purposes to seek to enhance potential gains.
Upon entering into a futures contract, the Fund is required to deposit with a financial intermediary cash or securities ("initial margin") in an amount equal to a certain percentage of the face value indicated in the futures contract. Subsequent payments ("variation margin") are made or received by the Fund dependent upon the daily fluctuations in the value and are recorded for financial reporting purposes as unrealized gains or losses by the Fund. Gains or losses are realized when the contract expires or is closed. Since all futures contracts are exchange traded, counterparty risk is minimized as the exchange's clearinghouse acts as the counterparty, and guarantees the futures against default.
Certain risks may arise upon entering into futures contracts, including the risk that an illiquid market will limit the Fund's ability to close out a futures contract prior to the settlement date and the risk that the futures contract is not well correlated with the security, index or currency to which it relates. Risk of loss may exceed amounts disclosed in the Statement of Assets and Liabilities.
A summary of the open futures contracts as of June 30, 2017, is included in a table following the Fund's Investment Portfolio. For the six months ended June 30, 2017, the investment in futures contracts purchased had a total notional value generally indicative of a range from $1,367,000 to approximately $11,550,000, and the investment in futures contracts sold had a total notional value generally indicative of a range from approximately $13,513,000 to $23,463,000.
Swaps. A swap is a contract between two parties to exchange future cash flows at periodic intervals based on the notional amount of the swap. A bilateral swap is a transaction between the fund and a counterparty where cash flows are exchanged between the two parties. A centrally cleared swap is a transaction executed between the fund and a counterparty, then cleared by a clearing member through a central clearinghouse. The central clearinghouse serves as the counterparty, with whom the fund exchanges cash flows.
The value of a swap is adjusted daily, and the change in value, if any, is recorded as unrealized appreciation or depreciation in the Statement of Assets and Liabilities. Gains or losses are realized when the swap expires or is closed. Certain risks may arise when entering into swap transactions including counterparty default; liquidity; or unfavorable changes in interest rates or the value of the underlying reference security, commodity or index. In connection with bilateral swaps, securities and/or cash may be identified as collateral in accordance with the terms of the swap agreement to provide assets of value and recourse in the event of default. The maximum counterparty credit risk is the net present value of the cash flows to be received from or paid to the counterparty over the term of the swap, to the extent that this amount is beneficial to the Fund, in addition to any related collateral posted to the counterparty by the Fund. This risk may be partially reduced by a master netting arrangement between the Fund and the counterparty. Upon entering into a centrally cleared swap, the Fund is required to deposit with a financial intermediary cash or securities ("initial margin") in an amount equal to a certain percentage of the notional amount of the swap. Subsequent payments ("variation margin") are made or received by the Fund dependent upon the daily fluctuations in the value of the swap. In a cleared swap transaction, counterparty risk is minimized as the central clearinghouse acts as the counterparty.
An upfront payment, if any, made by the Fund is recorded as an asset in the Statement of Assets and Liabilities. An upfront payment, if any, received by the Fund is recorded as a liability in the Statement of Assets and Liabilities. Payments received or made at the end of the measurement period are recorded as realized gain or loss in the Statement of Operations.
Interest rate swaps are agreements in which the Fund agrees to pay to the counterparty a fixed rate payment in exchange for the counterparty agreeing to pay to the Fund a variable rate payment, or the Fund agrees to receive from the counterparty a fixed rate payment in exchange for the counterparty agreeing to receive from the Fund a variable rate payment. The payment obligations are based on the notional amount of the swap. For the six months ended June 30, 2017, the Fund entered into interest rate swap agreements to gain exposure to different parts of the yield curve while managing overall duration.
A summary of the open interest rate swap contracts as of June 30, 2017 is included in a table following the Fund's Investment Portfolio. For the six months ended June 30, 2017, the investment in interest rate swap contracts had a total USD equivalent notional amount generally indicative of a range from approximately $23,021,000 to $46,521,000.
Forward Foreign Currency Exchange Contracts. A forward foreign currency exchange contract ("forward currency contract") is a commitment to purchase or sell a foreign currency at the settlement date at a negotiated rate. The Fund is subject to foreign exchange rate risk in its securities denominated in foreign currencies. Changes in exchange rates between foreign currencies and the U.S. dollar may affect the U.S. dollar value of foreign securities or the income or gains received on these securities. To reduce the effect of currency fluctuations, the Fund may enter into forward currency contracts. For the six months ended June 30, 2017, the Fund invested in forward currency contracts to hedge its exposure to changes in foreign currency exchange rates on its foreign currency denominated securities. In addition, the Fund also engaged in forward currency contracts for non-hedging purposes to seek to enhance potential gains.
Forward currency contracts are valued at the prevailing forward exchange rate of the underlying currencies and unrealized gain (loss) is recorded daily. On the settlement date of the forward currency contract, the Fund records a realized gain or loss equal to the difference between the value of the contract at the time it was opened and the value of the contract at the time it was closed. Certain risks may arise upon entering into forward currency contracts from the potential inability of counterparties to meet the terms of their contracts. The maximum counterparty credit risk to the Fund is measured by the unrealized gain on appreciated contracts. Additionally, when utilizing forward currency contracts to hedge, the Fund gives up the opportunity to profit from favorable exchange rate movements during the term of the contract.
A summary of the open forward currency contracts as of June 30, 2017, is included in a table following the Fund's Investment Portfolio. For the six months ended June 30, 2017, the investment in forward currency contracts U.S. dollars purchased had a total contract value generally indicative of a range from $796,000 to approximately $10,899,000, and the investment in forward currency contracts U.S. dollars sold had a total contract value generally indicative of a range from $0 to approximately $5,542,000.
The investment in forward currency contracts long vs. other foreign currencies sold had a total contract value generally indicative of a range from $6,409,000 to approximately $12,896,000.
The following tables summarize the value of the Fund's derivative instruments held as of June 30, 2017 and the related location in the accompanying Statement of Assets and Liabilities, presented by primary underlying risk exposure:
| Asset Derivatives | Forward Contracts | Swap
Contracts | Futures Contracts | Total |
| Interest Rate Contracts (a) | $ — | $ 825,405 | $ 107,013 | $ 932,418 |
| Foreign Exchange Contracts (b) | 158,194 | — | — | 158,194 |
| | $ 158,194 | $ 825,405 | $ 107,013 | $ 1,090,612 |
Each of the above derivatives is located in the following Statement of Assets and Liabilities accounts: (a) Includes cumulative appreciation of centrally cleared swaps and futures contracts as disclosed in the Investment Portfolio. Unsettled variation margin is disclosed separately within the Statement of Assets and Liabilities. (b) Unrealized appreciation on forward currency exchange contracts |
| Liability Derivatives | Forward Contracts | Swap
Contracts | Futures Contracts | Total |
| Interest Rate Contracts (c) | $ — | $ (118,302) | $ (163,632) | $ (281,934) |
| Foreign Exchange Contracts (d) | (256,807) | — | — | (256,807) |
| | $ (256,807) | $ (118,302) | $ (163,632) | $ (538,741) |
Each of the above derivatives is located in the following Statement of Assets and Liabilities accounts: (c) Includes cumulative depreciation of centrally cleared swaps and futures contracts as disclosed in the Investment Portfolio. Unsettled variation margin is disclosed separately within the Statement of Assets and Liabilities. (d) Unrealized depreciation on forward foreign currency exchange contracts |
Additionally, the amount of unrealized and realized gains and losses on derivative instruments recognized in Fund earnings during the six months ended June 30, 2017 and the related location in the accompanying Statement of Operations is summarized in the following tables by primary underlying risk exposure:
| Realized Gain (Loss) | Forward Contracts | Swap
Contracts | Futures Contracts | Total |
| Interest Rate Contract (e) | $ — | $ (115,996) | $ (301,836) | $ (417,832) |
| Foreign Exchange Contracts (f) | 141,498 | — | — | 141,498 |
| | $ 141,498 | $ (115,996) | $ (301,836) | $ (276,334) |
Each of the above derivatives is located in the following Statement of Operations accounts: (e) Net realized gain (loss) from swap contracts and futures, respectively (f) Net realized gain (loss) from foreign currency (Statement of Operations includes both forward currency contracts and foreign currency transactions) |
| Change in Net Unrealized Appreciation (Depreciation) | Forward Contracts | Swap Contracts | Futures Contracts | Total |
| Interest Rate Contracts (g) | $ — | $ 457,285 | $ (125,443) | $ 331,842 |
| Foreign Exchange Contracts (h) | (97,909) | — | — | (97,909) |
| | $ (97,909) | $ 457,285 | $ (125,443) | $ 233,933 |
Each of the above derivatives is located in the following Statement of Operations accounts: (g) Change in net unrealized appreciation (depreciation) on swap contracts and futures, respectively (h) Change in net unrealized appreciation (depreciation) on foreign currency (Statement of Operations includes both forward currency contracts and foreign currency transactions) |
As of June 30, 2017, the Fund has transactions subject to enforceable master netting agreements which govern the terms of certain transactions, and reduce the counterparty risk associated with such transactions. Master netting agreements allow a Fund to close out and net total exposure to a counterparty in the event of a deterioration in the credit quality or contractual default with respect to all of the transactions with a counterparty. As defined by the master netting agreement, the Fund may have collateral agreements with certain counterparties to mitigate risk. For financial reporting purposes the Statement of Assets and Liabilities generally shows derivatives assets and liabilities on a gross basis, which reflects the full risks and exposures prior to netting. A reconciliation of the gross amounts on the Statement of Assets and Liabilities to the net amounts by a counterparty, including any collateral exposure, is included in the following tables:
| Counterparty | Gross Amounts of Assets Presented in the Statement of Assets and Liabilities | Financial Instruments and Derivatives Available for Offset | Collateral Received | Net Amount of Derivative Assets |
| Australia & New Zealand Banking Group Ltd. | $ 4,266 | $ (4,266) | $ — | $ — |
| Barclays Bank PLC | 16,196 | — | — | 16,196 |
| Canadian Imperial Bank of Commerce | 29,096 | (5,517) | — | 23,579 |
| Citigroup, Inc. | 43,623 | (393) | — | 43,230 |
| Danske Bank AS | 42,680 | (42,680) | — | — |
| JPMorgan Chase Securities, Inc. | 22,333 | (22,333) | — | — |
| | $ 158,194 | $ (75,189) | $ — | $ 83,005 |
| Counterparty | Gross Amounts of Liabilities Presented in the Statement of Assets and Liabilities | Financial Instruments and Derivatives Available for Offset | Collateral Pledged | Net Amount of Derivative Liabilities |
| Australia & New Zealand Banking Group Ltd. | $ 91,441 | $ (4,266) | $ — | $ 87,175 |
| Bank of America | 20,429 | — | — | 20,429 |
| BNP Paribas | 17,618 | — | — | 17,618 |
| Canadian Imperial Bank of Commerce | 5,517 | (5,517) | — | — |
| Citigroup, Inc. | 393 | (393) | — | — |
| Danske Bank AS | 55,915 | (42,680) | — | 13,235 |
| Goldman Sachs & Co. | 12,405 | — | — | 12,405 |
| JPMorgan Chase Securities, Inc. | 51,934 | (22,333) | — | 29,601 |
| Toronto Dominion Bank | 1,155 | — | — | 1,155 |
| | $ 256,807 | $ (75,189) | $ — | $ 181,618 |
C. Purchases and Sales of Securities
During the six months ended June 30, 2017, purchases and sales of investment securities (excluding short-term investments and U.S. Treasury obligations) aggregated $63,207,453 and $55,123,255, respectively. Purchases and sales of U.S. Treasury obligations aggregated $16,607,795 and $26,549,589, respectively.
D. Related Parties
Management Agreement. Under the Investment Management Agreement with Deutsche Investment Management Americas Inc. ("DIMA" or the "Advisor"), an indirect, wholly owned subsidiary of Deutsche Bank AG, the Advisor directs the investments of the Fund in accordance with its investment objectives, policies and restrictions. The Advisor determines the securities, instruments and other contracts relating to investments to be purchased, sold or entered into by the Fund.
Pursuant to the Investment Management Agreement with the Advisor, the Fund pays a monthly management fee based on the Fund's average daily net assets, computed and accrued daily and payable monthly, at the following annual rates:
| First $250 million of average daily net assets | .390% |
| Next $750 million of average daily net assets | .365% |
| Over $1 billion of average daily net assets | .340% |
Accordingly, for the six months ended June 30, 2017, the fee pursuant to the Investment Management Agreement was equivalent to an annualized rate (exclusive of any applicable waivers/reimbursements) of 0.39% of the Fund's average daily net assets.
For the period from January 1, 2017 through April 30, 2017, the Advisor had contractually agreed to waive its fees and/or reimburse certain operating expenses to the extent necessary to maintain the total annual operating expenses (excluding certain expenses such as extraordinary expenses, taxes, brokerage and interest expense) of Class A at 0.64%.
Effective May 1, 2017 through April 30, 2018, the Advisor has contractually agreed to waive its fees and/or reimburse certain operating expenses to the extent necessary to maintain the total annual operating expenses (excluding certain expenses such as extraordinary expenses, taxes, brokerage and interest expense) of Class A at 0.66%.
For the six months ended June 30, 2017, fees waived and/or expenses reimbursed were $40,038.
Administration Fee. Pursuant to an Administrative Services Agreement, DIMA provides most administrative services to the Fund. For all services provided under the Administrative Services Agreement, the Fund pays the Advisor an annual fee ("Administration Fee") of 0.10% of the Fund's average daily net assets, computed and accrued daily and payable monthly. For the six months ended June 30, 2017, the Administration Fee was $37,345, of which $6,127 is unpaid.
Service Provider Fees. Deutsche AM Service Company ("DSC"), an affiliate of the Advisor, is the transfer agent, dividend-paying agent and shareholder service agent for the Fund. Pursuant to a sub-transfer agency agreement between DSC and DST Systems, Inc. ("DST"), DSC has delegated certain transfer agent, dividend-paying agent and shareholder service agent functions to DST. DSC compensates DST out of the shareholder servicing fee it receives from the Fund. For the six months ended June 30, 2017, the amounts charged to the Fund by DSC aggregated $281, of which $137 is unpaid.
Typesetting and Filing Service Fees. Under an agreement with DIMA, DIMA is compensated for providing typesetting and certain regulatory filing services to the Fund. For the six months ended June 30, 2017, the amount charged to the Fund by DIMA included in the Statement of Operations under "Reports to shareholders" aggregated $7,184, all of which is unpaid.
Trustees' Fees and Expenses. The Fund paid retainer fees to each Trustee not affiliated with the Advisor, plus specified amounts to the Board Chairperson and Vice Chairperson and to each committee Chairperson.
Affiliated Cash Management Vehicles. The Fund may invest uninvested cash balances in Deutsche Central Cash Management Government Fund and Deutsche Variable NAV Money Fund, affiliated money market funds which are managed by the Advisor. Each affiliated money market fund is managed in accordance with Rule 2a-7 under the 1940 Act, which governs the quality, maturity, diversity and liquidity of instruments in which a money market fund may invest. Deutsche Central Cash Management Government Fund seeks to maintain a stable net asset value, and Deutsche Variable NAV Money Fund maintains a floating net asset value. The Fund indirectly bears its proportionate share of the expenses of each affiliated money market fund in which it invests. Deutsche Central Cash Management Government Fund does not pay the Advisor an investment management fee. To the extent that Deutsche Variable NAV Money Fund pays an investment management fee to the Advisor, the Advisor will waive an amount of the investment management fee payable to the Advisor by the Fund equal to the amount of the investment management fee payable on the Fund's assets invested in Deutsche Variable NAV Money Fund.
Securities Lending Agent Fees. Deutsche Bank AG serves as securities lending agent for the Fund. For the six months ended June 30, 2017, the Fund incurred securities lending agent fees to Deutsche Bank AG in the amount of $312.
E. Ownership of the Fund
At June 30, 2017, four participating insurance companies were owners of record of 10% or more of the total outstanding Class A shares of the Fund, each owning 37%, 25%, 16% and 11%, respectively.
F. Line of Credit
The Fund and other affiliated funds (the "Participants") share in a $400 million revolving credit facility provided by a syndication of banks. The Fund may borrow for temporary or emergency purposes, including the meeting of redemption requests that otherwise might require the untimely disposition of securities. The Participants are charged an annual commitment fee which is allocated based on net assets, among each of the Participants. Interest is calculated at a rate per annum equal to the sum of the Federal Funds Rate plus 1.25 percent plus if the one-month LIBOR exceeds the Federal Funds Rate, the amount of such excess. The Fund may borrow up to a maximum of 33 percent of its net assets under the agreement.
At June 30, 2017, the Fund had a $100,000 outstanding loan. Interest expense incurred on the borrowings was $129 for the six months ended June 30, 2017. The average dollar amount of the borrowings was $375,000, the weighted average interest rate on these borrowings was 2.09% and the Fund had a loan outstanding for 6 days throughout the period. The borrowings were valued at cost, which approximates fair value.
Information About Your Fund's Expenses (Unaudited)
As an investor of the Fund, you incur two types of costs: ongoing expenses and transaction costs. Ongoing expenses include management fees and other Fund expenses. Examples of transaction costs include contract charges, which are not shown in this section. The following tables are intended to help you understand your ongoing expenses (in dollars) of investing in the Fund and to help you compare these expenses with the ongoing expenses of investing in other mutual funds. In the most recent six-month period, the Fund limited these expenses; had it not done so, expenses would have been higher. The example in the table is based on an investment of $1,000 invested at the beginning of the six-month period and held for the entire period (January 1, 2017 to June 30, 2017).
The tables illustrate your Fund's expenses in two ways:
— Actual Fund Return. This helps you estimate the actual dollar amount of ongoing expenses (but not transaction costs) paid on a $1,000 investment in the Fund using the Fund's actual return during the period. To estimate the expenses you paid over the period, simply divide your account value by $1,000 (for example, an $8,600 account value divided by $1,000 = 8.6), then multiply the result by the number in the "Expenses Paid per $1,000" line under the share class you hold.
— Hypothetical 5% Fund Return. This helps you to compare your Fund's ongoing expenses (but not transaction costs) with those of other mutual funds using the Fund's actual expense ratio and a hypothetical rate of return of 5% per year before expenses. Examples using a 5% hypothetical Fund return may be found in the shareholder reports of other mutual funds. The hypothetical account values and expenses may not be used to estimate the actual ending account balance or expenses you paid for the period.
Please note that the expenses shown in these tables are meant to highlight your ongoing expenses only and do not reflect any transaction costs. The "Expenses Paid per $1,000" line of the tables is useful in comparing ongoing expenses only and will not help you determine the relative total expense of owning different funds. If these transaction costs had been included, your costs would have been higher.
| Expenses and Value of a $1,000 Investment for the six months ended June 30, 2017 |
| Actual Fund Return | Class A | |
| Beginning Account Value 1/1/17 | $ 1,000.00 | |
| Ending Account Value 6/30/17 | $ 1,034.20 | |
| Expenses Paid per $1,000* | $ 3.28 | |
| Hypothetical 5% Fund Return | Class A | |
| Beginning Account Value 1/1/17 | $ 1,000.00 | |
| Ending Account Value 6/30/17 | $ 1,021.57 | |
| Expenses Paid per $1,000* | $ 3.26 | |
* Expenses are equal to the Fund's annualized expense ratio, multiplied by the average account value over the period, multiplied by 181 (the number of days in the most recent six-month period), then divided by 365.
| Annualized Expense Ratio | Class A | |
| Deutsche Variable Series I — Deutsche Bond VIP | .65% | |
For more information, please refer to the Fund's prospectus.
These tables do not reflect charges and fees ("contract charges") associated with the separate account that invests in the Fund or any variable life insurance policy or variable annuity contract for which the Fund is an investment option.
For an analysis of the fees associated with an investment in the fund or similar funds, please refer to the current and hypothetical expense calculators for Variable Insurance Products which can be found at deutschefunds.com/EN/resources/calculators.jsp.
Proxy Voting
The Trust's policies and procedures for voting proxies for portfolio securities and information about how the Trust voted proxies related to its portfolio securities during the most recent 12-month period ended June 30 are available on our Web site — deutschefunds.com (click on "proxy voting"at the bottom of the page) — or on the SEC's Web site — sec.gov. To obtain a written copy of the Trust's policies and procedures without charge, upon request, call us toll free at (800) 728-3337.
Advisory Agreement Board Considerations and Fee Evaluation
The Board of Trustees (hereinafter referred to as the "Board" or "Trustees") approved the renewal of Deutsche Bond VIP’s (the "Fund") investment management agreement (the "Agreement") with Deutsche Investment Management Americas Inc. ("DIMA") in September 2016.
In terms of the process that the Board followed prior to approving the Agreement, shareholders should know that:
— During the entire process, all of the Fund’s Trustees were independent of DIMA and its affiliates (the "Independent Trustees").
— The Board met frequently during the past year to discuss fund matters and dedicated a substantial amount of time to contract review matters. Over the course of several months, the Board’s Contract Committee reviewed extensive materials received from DIMA, independent third parties and independent counsel. These materials included an analysis of the Fund’s performance, fees and expenses, and profitability from a fee consultant retained by the Fund’s Independent Trustees (the "Fee Consultant"). The Board also received extensive information throughout the year regarding performance of the Fund.
— The Independent Trustees regularly meet privately with counsel to discuss contract review and other matters. In addition, the Independent Trustees were advised by the Fee Consultant in the course of their review of the Fund’s contractual arrangements and considered a comprehensive report prepared by the Fee Consultant in connection with their deliberations.
— In connection with reviewing the Agreement, the Board also reviewed the terms of the Fund’s distribution agreement, administrative services agreement, transfer agency agreement and other material service agreements.
— Based on its evaluation of the information provided, the Contract Committee presented its findings and recommendations to the Board. The Board then reviewed the Contract Committee’s findings and recommendations.
In connection with the contract review process, the Contract Committee and the Board considered the factors discussed below, among others. The Board also considered that DIMA and its predecessors have managed the Fund since its inception, and the Board believes that a long-term relationship with a capable, conscientious advisor is in the best interests of the Fund. The Board considered, generally, that shareholders chose to invest or remain invested in the Fund knowing that DIMA managed the Fund, and that the Agreement was approved by the Fund’s shareholders. DIMA is part of Deutsche Bank AG’s ("Deutsche Bank") Asset Management ("Deutsche AM") division. Deutsche AM is a global asset management business that offers a wide range of investing expertise and resources, including research capabilities in many countries throughout the world. Deutsche Bank has advised the Board that the U.S. asset management business continues to be a critical and integral part of Deutsche Bank, and that Deutsche Bank will continue to invest in Deutsche AM and seek to enhance Deutsche AM’s investment platform. Deutsche Bank also has confirmed its commitment to maintaining strong legal and compliance groups within the Deutsche AM division.
As part of the contract review process, the Board carefully considered the fees and expenses of each Deutsche fund overseen by the Board in light of the fund’s performance. In many cases, this led to the negotiation and implementation of expense caps. As part of these negotiations, the Board indicated that it would consider relaxing these caps in future years following sustained improvements in performance, among other considerations.
While shareholders may focus primarily on fund performance and fees, the Fund’s Board considers these and many other factors, including the quality and integrity of DIMA’s personnel and such other issues as back-office operations, fund valuations, and compliance policies and procedures.
Nature, Quality and Extent of Services. The Board considered the terms of the Agreement, including the scope of advisory services provided under the Agreement. The Board noted that, under the Agreement, DIMA provides portfolio management services to the Fund and that, pursuant to a separate administrative services agreement, DIMA provides administrative services to the Fund. The Board considered the experience and skills of senior management and investment personnel and the resources made available to such personnel. The Board reviewed the Fund’s performance over short-term and long-term periods and compared those returns to various agreed-upon performance measures, including market index(es) and a peer universe compiled using information supplied by Morningstar Direct ("Morningstar"), an independent fund data service. The Board also noted that it has put into place a process of identifying "Focus Funds" (e.g., funds performing poorly relative to a peer universe), and receives additional reporting from DIMA regarding such funds and, where appropriate, DIMA’s plans to address underperformance. The Board believes this process is an effective manner of identifying and addressing underperforming funds. Based on the information provided, the Board noted that for the one-, three- and five-year periods ended December 31, 2015, the Fund’s performance (Class A shares) was in the 3rd quartile, 3rd quartile and 2nd quartile, respectively, of the applicable Morningstar universe (the 1st quartile being the best performers and the 4th quartile being the worst performers). The Board also observed that the Fund has outperformed its benchmark in the five-year period and has underperformed its benchmark in the one- and three-year periods ended December 31, 2015.
Fees and Expenses. The Board considered the Fund’s investment management fee schedule, operating expenses and total expense ratios, and comparative information provided by Broadridge Financial Solutions, Inc. ("Broadridge") and the Fee Consultant regarding investment management fee rates paid to other investment advisors by similar funds (1st quartile being the most favorable and 4th quartile being the least favorable). With respect to management fees paid to other investment advisors by similar funds, the Board noted that the contractual fee rates paid by the Fund, which include a 0.10% fee paid to DIMA under the Fund’s administrative services agreement, were higher than the median (3rd quartile) of the applicable Broadridge peer group (based on Broadridge data provided as of December 31, 2015). The Board noted that the Fund’s Class A shares total (net) operating expenses were expected to be higher than the median (3rd quartile) of the applicable Broadridge expense universe (based on Broadridge data provided as of December 31, 2015, and analyzing Broadridge expense universe Class A (net) expenses less any applicable 12b-1 fees) ("Broadridge Universe Expenses"). The Board noted that the expense limitation agreed to by DIMA was expected to help the Fund’s total (net) operating expenses remain competitive. The Board considered the Fund’s management fee rate as compared to fees charged by DIMA to comparable Deutsche U.S. registered funds ("Deutsche Funds") and considered differences between the Fund and the comparable Deutsche Funds. The information requested by the Board as part of its review of fees and expenses also included information about institutional accounts (including any sub-advised funds and accounts) and funds offered primarily to European investors ("Deutsche Europe funds") managed by Deutsche AM. The Board noted that DIMA indicated that Deutsche AM manages an institutional account comparable to the Fund, but that Deutsche AM does not manage any comparable Deutsche Europe funds. The Board took note of the differences in services provided to Deutsche Funds as compared to institutional accounts and that such differences made comparison difficult.
On the basis of the information provided, the Board concluded that management fees were reasonable and appropriate in light of the nature, quality and extent of services provided by DIMA.
Profitability. The Board reviewed detailed information regarding revenues received by DIMA under the Agreement. The Board considered the estimated costs and pre-tax profits realized by DIMA from advising the Deutsche Funds, as well as estimates of the pre-tax profits attributable to managing the Fund in particular. The Board also received information regarding the estimated enterprise-wide profitability of DIMA and its affiliates with respect to all fund services in totality and by fund. The Board and the Fee Consultant reviewed DIMA’s methodology in allocating its costs to the management of the Fund. Based on the information provided, the Board concluded that the pre-tax profits realized by DIMA in connection with the management of the Fund were not unreasonable. The Board also reviewed certain publicly available information regarding the profitability of certain similar investment management firms. The Board noted that while information regarding the profitability of such firms is limited (and in some cases is not necessarily prepared on a comparable basis), DIMA and its affiliates’ overall profitability with respect to the Deutsche Funds (after taking into account distribution and other services provided to the funds by DIMA and its affiliates) was lower than the overall profitability levels of most comparable firms for which such data was available.
Economies of Scale. The Board considered whether there are economies of scale with respect to the management of the Fund and whether the Fund benefits from any economies of scale. The Board noted that the Fund’s investment management fee schedule includes fee breakpoints. The Board concluded that the Fund’s fee schedule represents an appropriate sharing between the Fund and DIMA of such economies of scale as may exist in the management of the Fund at current asset levels.
Other Benefits to DIMA and Its Affiliates. The Board also considered the character and amount of other incidental benefits received by DIMA and its affiliates, including any fees received by DIMA for administrative services provided to the Fund. The Board also considered benefits to DIMA related to brokerage and soft-dollar allocations, including allocating brokerage to pay for research generated by parties other than the executing broker dealers, which pertain primarily to funds investing in equity securities, along with the incidental public relations benefits to DIMA related to Deutsche Funds advertising and cross-selling opportunities among DIMA products and services. The Board considered these benefits in reaching its conclusion that the Fund’s management fees were reasonable.
Compliance. The Board considered the significant attention and resources dedicated by DIMA to documenting and enhancing its compliance processes in recent years. The Board noted in particular (i) the experience, seniority and time commitment of the individuals serving as DIMA’s and the Fund’s chief compliance officers; (ii) the large number of DIMA compliance personnel; and (iii) the substantial commitment of resources by DIMA and its affiliates to compliance matters.
Based on all of the information considered and the conclusions reached, the Board unanimously determined that the continuation of the Agreement is in the best interests of the Fund. In making this determination, the Board did not give particular weight to any single factor identified above. The Board considered these factors over the course of numerous meetings, certain of which were in executive session with only the Independent Trustees and counsel present. It is possible that individual Independent Trustees may have weighed these factors differently in reaching their individual decisions to approve the continuation of the Agreement.

VS1bond-3 (R-028373-6 8/17)

June 30, 2017
Semiannual Report
Deutsche Variable Series I
Deutsche Capital Growth VIP

Contents
3 Performance Summary 4 Portfolio Summary 4 Portfolio Manager 5 Investment Portfolio 9 Statement of Assets and Liabilities 10 Statement of Operations 10 Statements of Changes in Net Assets 12 Financial Highlights 13 Notes to Financial Statements 17 Information About Your Fund's Expenses 18 Proxy Voting 19 Advisory Agreement Board Considerations and Fee Evaluation |
This report must be preceded or accompanied by a prospectus. To obtain an additional prospectus or summary prospectus, if available, call (800) 728-3337 or your financial representative. We advise you to consider the Fund's objectives, risks, charges and expenses carefully before investing. The summary prospectus and prospectus contain this and other important information about the Fund. Please read the prospectus carefully before you invest.
Stocks may decline in value. The Fund may lend securities to approved institutions. See the prospectus for details.
Deutsche Asset Management represents the asset management activities conducted by Deutsche Bank AG or any of its subsidiaries.
Deutsche AM Distributors, Inc., 222 South Riverside Plaza, Chicago, IL 60606, (800) 621-1148
NOT FDIC/NCUA INSURED NO BANK GUARANTEE MAY LOSE VALUE NOT A DEPOSIT
NOT INSURED BY ANY FEDERAL GOVERNMENT AGENCY
Performance Summary June 30, 2017 (Unaudited)
Fund performance shown is historical, assumes reinvestment of all dividend and capital gain distributions, and does not guarantee future results. Investment return and principal value fluctuate with changing market conditions so that, when redeemed, shares may be worth more or less than their original cost. Current performance may be lower or higher than the performance data quoted. Please contact your participating insurance company for the Fund's most recent month-end performance. Performance doesn't reflect charges and fees ("contract charges") associated with the separate account that invests in the Fund or any variable life insurance policy or variable annuity contract for which the Fund is an investment option. These charges and fees will reduce returns. While all share classes have the same underlying portfolio, their performance will differ.
The gross expense ratios of the Fund, as stated in the fee table of the prospectus dated May 1, 2017 are 0.50% and 0.76% for Class A and Class B shares, respectively, and may differ from the expense ratios disclosed in the Financial Highlights tables in this report.
Generally accepted accounting principles require adjustments to be made to the net assets of the Fund at period end for financial reporting purposes only, and as such, the total return based on the unadjusted net asset value per share may differ from the total return reported in the financial highlights.
| Growth of an Assumed $10,000 Investment |
■ Deutsche Capital Growth VIP — Class A ■ Russell 1000® Growth Index | The Russell 1000® Growth Index is an unmanaged index that consists of those stocks in the Russell 1000® Index that have higher price-to-book ratios and higher forecasted growth values. Index returns do not reflect any fees or expenses and it is not possible to invest directly into an index. |
 | |
| Yearly periods ended June 30 | |
| Comparative Results |
| Deutsche Capital Growth VIP | 6-Month‡ | 1-Year | 3-Year | 5-Year | 10-Year |
| Class A | Growth of $10,000 | $11,406 | $12,240 | $13,899 | $20,579 | $22,772 |
| Average annual total return | 14.06% | 22.40% | 11.60% | 15.53% | 8.58% |
| Russell 1000 Growth Index | Growth of $10,000 | $11,399 | $12,042 | $13,716 | $20,380 | $23,474 |
| Average annual total return | 13.99% | 20.42% | 11.11% | 15.30% | 8.91% |
| Deutsche Capital Growth VIP | 6-Month‡ | 1-Year | 3-Year | 5-Year | 10-Year |
| Class B | Growth of $10,000 | $11,392 | $12,214 | $13,796 | $20,291 | $22,087 |
| Average annual total return | 13.92% | 22.14% | 11.32% | 15.20% | 8.25% |
| Russell 1000 Growth Index | Growth of $10,000 | $11,399 | $12,042 | $13,716 | $20,380 | $23,474 |
| Average annual total return | 13.99% | 20.42% | 11.11% | 15.30% | 8.91% |
The growth of $10,000 is cumulative.
‡ Total returns shown for periods less than one year are not annualized.
Portfolio Summary (Unaudited)
| Asset Allocation (As a % of Investment Portfolio) | 6/30/17 | 12/31/16 |
| | | |
| Common Stocks | 98% | 99% |
| Cash Equivalents | 2% | 1% |
| Convertible Preferred Stocks | 0% | 0% |
| | 100% | 100% |
| Sector Diversification (As a % of Investment Portfolio excluding Cash Equivalents) | 6/30/17 | 12/31/16 |
| | | |
| Information Technology | 34% | 31% |
| Consumer Discretionary | 18% | 18% |
| Health Care | 17% | 17% |
| Industrials | 11% | 10% |
| Consumer Staples | 7% | 10% |
| Financials | 5% | 5% |
| Materials | 3% | 4% |
| Real Estate | 2% | 2% |
| Telecommunication Services | 2% | 2% |
| Energy | 1% | 1% |
| | 100% | 100% |
Portfolio holdings and characteristics are subject to change.
For more complete details about the Fund's investment portfolio, see page 5.
Following the Fund's fiscal first and third quarter-end, a complete portfolio holdings listing is filed with the SEC on Form N-Q. The form will be available on the SEC's Web site at sec.gov, and it also may be reviewed and copied at the SEC's Public Reference Room in Washington, D.C. Information on the operation of the SEC's Public Reference Room may be obtained by calling (800) SEC-0330. The Fund's portfolio holdings are also posted on deutschefunds.com from time to time. Please see the Fund's current prospectus for more information.
Portfolio Manager
Sebastian P. Werner, PhD, Director
Portfolio Manager
Investment Portfolio June 30, 2017 (Unaudited)
| | Shares | Value ($) |
| | | |
| Common Stocks 97.7% |
| Consumer Discretionary 17.5% |
| Hotels, Restaurants & Leisure 0.7% |
| Las Vegas Sands Corp. | 94,234 | 6,020,610 |
| Household Durables 1.6% |
| Newell Brands, Inc. | 259,615 | 13,920,557 |
| Internet & Direct Marketing Retail 3.4% |
| Amazon.com, Inc.* | 29,410 | 28,468,880 |
| Media 5.3% |
| Comcast Corp. "A" | 392,122 | 15,261,388 |
| Time Warner, Inc. | 116,220 | 11,669,650 |
| Walt Disney Co. | 166,338 | 17,673,413 |
| | 44,604,451 |
| Multiline Retail 0.5% |
| Dollar General Corp. | 57,402 | 4,138,110 |
| Specialty Retail 4.8% |
| Burlington Stores, Inc.* | 50,355 | 4,632,156 |
| Home Depot, Inc. | 143,271 | 21,977,771 |
| L Brands, Inc. | 128,338 | 6,916,135 |
| O'Reilly Automotive, Inc.* | 32,940 | 7,205,296 |
| | 40,731,358 |
| Textiles, Apparel & Luxury Goods 1.2% |
| NIKE, Inc. "B" | 173,948 | 10,262,932 |
| Consumer Staples 7.2% |
| Beverages 1.8% |
| PepsiCo, Inc. | 128,191 | 14,804,779 |
| Food & Staples Retailing 2.7% |
| Costco Wholesale Corp. | 51,238 | 8,194,493 |
| CVS Health Corp. | 158,648 | 12,764,818 |
| Rite Aid Corp.* | 600,108 | 1,770,319 |
| | 22,729,630 |
| Food Products 1.7% |
| Conagra Brands, Inc. | 104,490 | 3,736,562 |
| Pinnacle Foods, Inc. | 181,812 | 10,799,633 |
| | 14,536,195 |
| Personal Products 1.0% |
| Estee Lauder Companies, Inc. "A" | 90,481 | 8,684,366 |
| Energy 0.8% |
| Oil, Gas & Consumable Fuels |
| Concho Resources, Inc.* | 53,183 | 6,463,330 |
| Financials 4.8% |
| Banks 1.0% |
| SVB Financial Group* | 45,912 | 8,070,871 |
| Capital Markets 2.2% |
| Intercontinental Exchange, Inc. | 137,833 | 9,085,951 |
| The Charles Schwab Corp. | 216,882 | 9,317,251 |
| | 18,403,202 |
| Insurance 1.6% |
| Progressive Corp. | 314,870 | 13,882,618 |
| | Shares | Value ($) |
| | | |
| Health Care 17.0% |
| Biotechnology 7.0% |
| Alexion Pharmaceuticals, Inc.* | 32,384 | 3,940,161 |
| Biogen, Inc.* | 25,322 | 6,871,378 |
| BioMarin Pharmaceutical, Inc.* | 60,384 | 5,484,075 |
| Celgene Corp.* | 170,525 | 22,146,082 |
| Gilead Sciences, Inc. | 182,186 | 12,895,125 |
| Shire PLC (ADR) | 44,184 | 7,302,289 |
| | 58,639,110 |
| Health Care Equipment & Supplies 3.8% |
| Becton, Dickinson & Co. | 81,651 | 15,930,927 |
| Danaher Corp. | 128,361 | 10,832,385 |
| The Cooper Companies, Inc. | 20,003 | 4,789,118 |
| | 31,552,430 |
| Health Care Providers & Services 2.5% |
| Cigna Corp. | 87,541 | 14,653,488 |
| McKesson Corp. | 40,840 | 6,719,814 |
| | 21,373,302 |
| Life Sciences Tools & Services 1.8% |
| Thermo Fisher Scientific, Inc. | 88,110 | 15,372,552 |
| Pharmaceuticals 1.9% |
| Allergan PLC | 49,375 | 12,002,569 |
| Bristol-Myers Squibb Co. | 76,863 | 4,282,806 |
| | 16,285,375 |
| Industrials 10.3% |
| Aerospace & Defense 3.1% |
| Boeing Co. | 93,119 | 18,414,282 |
| TransDigm Group, Inc. | 29,479 | 7,926,019 |
| | 26,340,301 |
| Electrical Equipment 2.1% |
| Acuity Brands, Inc. | 22,605 | 4,595,144 |
| AMETEK, Inc. | 209,645 | 12,698,198 |
| | 17,293,342 |
| Industrial Conglomerates 1.3% |
| Roper Technologies, Inc. | 48,838 | 11,307,462 |
| Machinery 0.7% |
| Parker-Hannifin Corp. | 36,162 | 5,779,411 |
| Professional Services 1.9% |
| Equifax, Inc. | 37,966 | 5,217,287 |
| Verisk Analytics, Inc.* | 126,475 | 10,670,696 |
| | 15,887,983 |
| Road & Rail 1.2% |
| Norfolk Southern Corp. | 81,684 | 9,940,943 |
| Information Technology 33.2% |
| Internet Software & Services 6.9% |
| Alphabet, Inc. "A"* | 22,758 | 21,157,658 |
| Alphabet, Inc. "C"* | 20,914 | 19,005,179 |
| Facebook, Inc. "A"* | 122,856 | 18,548,799 |
| | 58,711,636 |
| IT Services 7.4% |
| Cognizant Technology Solutions Corp. "A" | 190,362 | 12,640,037 |
| Fidelity National Information Services, Inc. | 118,728 | 10,139,371 |
| Fiserv, Inc.* | 73,997 | 9,052,793 |
| Global Payments, Inc. | 70,863 | 6,400,346 |
| Visa, Inc. "A" | 257,967 | 24,192,146 |
| | 62,424,693 |
| | Shares | Value ($) |
| | | |
| Semiconductors & Semiconductor Equipment 5.2% |
| Analog Devices, Inc. | 108,081 | 8,408,702 |
| Broadcom Ltd. | 76,000 | 17,711,800 |
| NVIDIA Corp. | 82,840 | 11,975,350 |
| NXP Semiconductors NV* | 51,116 | 5,594,646 |
| | 43,690,498 |
| Software 6.9% |
| Adobe Systems, Inc.* | 82,864 | 11,720,284 |
| Microsoft Corp. | 575,140 | 39,644,400 |
| Oracle Corp. | 133,386 | 6,687,974 |
| | 58,052,658 |
| Technology Hardware, Storage & Peripherals 6.8% |
| Apple, Inc. | 400,599 | 57,694,268 |
| Materials 2.8% |
| Chemicals 1.1% |
| Albemarle Corp. | 85,974 | 9,073,696 |
| Construction Materials 0.9% |
| Vulcan Materials Co. | 60,237 | 7,630,823 |
| Containers & Packaging 0.8% |
| Sealed Air Corp. | 158,397 | 7,089,850 |
| Real Estate 2.3% |
| Equity Real Estate Investment Trusts (REITs) |
| Digital Realty Trust, Inc. | 97,320 | 10,992,294 |
| Prologis, Inc. | 147,007 | 8,620,490 |
| | 19,612,784 |
| | Shares | Value ($) |
| | | |
| Telecommunication Services 1.8% |
| Diversified Telecommunication Services |
| Level 3 Communications, Inc.* | 106,285 | 6,302,701 |
| Zayo Group Holdings, Inc.* | 295,187 | 9,121,278 |
| | 15,423,979 |
| Total Common Stocks (Cost $463,561,085) | 824,898,985 |
| |
| Convertible Preferred Stocks 0.1% |
| Health Care 0.1% |
| Allergan PLC, Series A, 5.5% | 1,100 | 954,888 |
| Industrials 0.0% |
| Stericycle, Inc. Series A, 5.25% | 3,000 | 200,820 |
| Total Convertible Preferred Stocks (Cost $1,400,000) | 1,155,708 |
| |
| Cash Equivalents 2.3% |
| Deutsche Central Cash Management Government Fund, 1.03% (a) (Cost $19,391,909) | 19,391,909 | 19,391,909 |
| | % of Net Assets | Value ($) |
| | |
| Total Investment Portfolio (Cost $484,352,994)† | 100.1 | 845,446,602 |
| Other Assets and Liabilities, Net | (0.1) | (591,579) |
| Net Assets | 100.0 | 844,855,023 |
* Non-income producing security.
† The cost for federal income tax purposes was $485,177,586. At June 30, 2017, net unrealized appreciation for all securities based on tax cost was $360,269,016. This consisted of aggregate gross unrealized appreciation for all securities in which there was an excess of value over tax cost of $374,550,593 and aggregate gross unrealized depreciation for all securities in which there was an excess of tax cost over value of $14,281,577.
(a) Affiliated fund managed by Deutsche Investment Management Americas Inc. The rate shown is the annualized seven-day yield at period end.
ADR: American Depositary Receipt
Fair Value Measurements
Various inputs are used in determining the value of the Fund's investments. These inputs are summarized in three broad levels. Level 1 includes quoted prices in active markets for identical securities. Level 2 includes other significant observable inputs (including quoted prices for similar securities, interest rates, prepayment speeds and credit risk). Level 3 includes significant unobservable inputs (including the Fund's own assumptions in determining the fair value of investments). The level assigned to the securities valuations may not be an indication of the risk or liquidity associated with investing in those securities.
The following is a summary of the inputs used as of June 30, 2017 in valuing the Fund's investments. For information on the Fund's policy regarding the valuation of investments, please refer to the Security Valuation section of Note A in the accompanying Notes to Financial Statements.
| Assets | Level 1 | Level 2 | Level 3 | Total |
| |
| Common Stocks (b) | $ 824,898,985 | $ — | $ — | $ 824,898,985 |
| Convertible Preferred Stocks (b) | 1,155,708 | — | — | 1,155,708 |
| Short-Term Investments | 19,391,909 | — | — | 19,391,909 |
| Total | $ 845,446,602 | $ — | $ — | $ 845,446,602 |
There have been no transfers between fair value measurement levels during the period ended June 30, 2017.
(b) See Investment Portfolio for additional detailed categorizations.
The accompanying notes are an integral part of the financial statements.
Statement of Assets and Liabilities
| as of June 30, 2017 (Unaudited) |
| Assets |
Investments: Investments in non-affiliated securities, at value (cost $464,961,085) | $ 826,054,693 |
| Investment in Deutsche Central Cash Management Government Fund (cost $19,391,909) | 19,391,909 |
| Total investments in securities, at value (cost $484,352,994) | 845,446,602 |
| Receivable for Fund shares sold | 26,653 |
| Dividends receivable | 215,020 |
| Interest receivable | 17,624 |
| Due from Advisor | 34,034 |
| Other assets | 4,192 |
| Total assets | 845,744,125 |
| Liabilities |
| Payable for Fund shares redeemed | 476,333 |
| Accrued management fee | 260,685 |
| Accrued Trustees' fees | 389 |
| Other accrued expenses and payables | 151,695 |
| Total liabilities | 889,102 |
| Net assets, at value | $ 844,855,023 |
| Net Assets Consist of |
| Undistributed net investment income | 3,306,995 |
Net unrealized appreciation (depreciation) on Investments | 361,093,608 |
| Accumulated net realized gain (loss) | 14,006,574 |
| Paid-in capital | 466,447,846 |
| Net assets, at value | $ 844,855,023 |
Class A Net Asset Value, offering and redemption price per share ($838,990,679 ÷ 30,100,172 outstanding shares of beneficial interest, $.01 par value, unlimited number of shares authorized) | $ 27.87 |
Class B Net Asset Value, offering and redemption price per share ($5,864,344 ÷ 210,885 outstanding shares of beneficial interest, $.01 par value, unlimited number of shares authorized) | $ 27.81 |
The accompanying notes are an integral part of the financial statements.
Statement of Operations
| for the six months ended June 30, 2017 (Unaudited) |
| Investment Income |
Income: Dividends | $ 5,185,635 |
| Income distributions — Deutsche Central Cash Management Government Fund | 84,030 |
| Securities lending income, net of borrower rebates | 752 |
| Total income | 5,270,417 |
Expenses: Management fee | 1,507,328 |
| Administration fee | 404,475 |
| Services to shareholders | 1,734 |
| Record keeping fee (Class B) | 67 |
| Distribution service fees (Class B) | 7,207 |
| Custodian fee | 4,824 |
| Professional fees | 40,001 |
| Reports to shareholders | 25,159 |
| Trustees' fees and expenses | 21,462 |
| Other | 16,832 |
| Total expenses | 2,029,089 |
| Net investment income (loss) | 3,241,328 |
| Realized and Unrealized Gain (Loss) |
Net realized gain (loss) from Investments | 14,883,215 |
| Payments by affiliates (see Note F) | 34,034 |
| | 14,917,249 |
| Change in net unrealized appreciation (depreciation) on investments | 87,596,263 |
| Net gain (loss) | 102,513,512 |
| Net increase (decrease) in net assets resulting from operations | $ 105,754,840 |
The accompanying notes are an integral part of the financial statements.
Statements of Changes in Net Assets
| Increase (Decrease) in Net Assets | Six Months Ended June 30, 2017 (Unaudited) | Year Ended December 31, 2016 | |
| |
Operations: Net investment income (loss) | $ 3,241,328 | $ 6,308,105 | |
| Net realized gain (loss) | 14,917,249 | 70,814,016 | |
| Change in net unrealized appreciation (depreciation) | 87,596,263 | (49,459,182) | |
| Net increase (decrease) in net assets resulting from operations | 105,754,840 | 27,662,939 | |
Distributions to shareholders from: Net investment income: Class A | (6,004,257) | (6,231,720) | |
| Class B | (28,374) | (20,032) | |
Net realized gains: Class A | (63,517,984) | (66,067,535) | |
| Class B | (466,086) | (322,737) | |
| Total distributions | (70,016,701) | (72,642,024) | |
Fund share transactions: Class A Proceeds from shares sold | 41,282,119 | 15,616,714 | |
| Reinvestment of distributions | 69,522,241 | 72,299,255 | |
| Payments for shares redeemed | (52,138,055) | (147,165,346) | |
| Net increase (decrease) in net assets from Class A share transactions | 58,666,305 | (59,249,377) | |
Class B Proceeds from shares sold | 1,026,940 | 2,848,370 | |
| Reinvestment of distributions | 494,460 | 342,769 | |
| Payments for shares redeemed | (1,175,597) | (1,421,396) | |
| Net increase (decrease) in net assets from Class B share transactions | 345,803 | 1,769,743 | |
| Increase (decrease) in net assets | 94,750,247 | (102,458,719) | |
| Net assets at beginning of period | 750,104,776 | 852,563,495 | |
| Net assets at end of period (including undistributed net investment income of $3,306,995 and $6,098,298, respectively) | $ 844,855,023 | $ 750,104,776 | |
| Other Information | |
Class A Shares outstanding at beginning of period | 27,895,381 | 30,084,968 | |
| Shares sold | 1,489,917 | 591,265 | |
| Shares issued to shareholders in reinvestment of distributions | 2,573,944 | 2,877,010 | |
| Shares redeemed | (1,859,070) | (5,657,862) | |
| Net increase (decrease) in Class A shares | 2,204,791 | (2,189,587) | |
| Shares outstanding at end of period | 30,100,172 | 27,895,381 | |
Class B Shares outstanding at beginning of period | 197,662 | 127,214 | |
| Shares sold | 37,029 | 111,807 | |
| Shares issued to shareholders in reinvestment of distributions | 18,341 | 13,667 | |
| Shares redeemed | (42,147) | (55,026) | |
| Net increase (decrease) in Class B shares | 13,223 | 70,448 | |
| Shares outstanding at end of period | 210,885 | 197,662 | |
The accompanying notes are an integral part of the financial statements.
Financial Highlights
| Class A | Six Months Ended 6/30/17 (Unaudited) |
Years Ended December 31, |
| 2016 | 2015 | 2014 | 2013 | 2012 |
| Selected Per Share Data |
| Net asset value, beginning of period | $ 26.70 | $ 28.22 | $ 29.95 | $ 28.41 | $ 21.38 | $ 18.58 |
Income (loss) from investment operations: Net investment income (loss)a | .11 | .21 | .20 | .21 | .21 | .28 |
| Net realized and unrealized gain (loss) | 3.57 | .83 | 2.34 | 3.18 | 7.12 | 2.70 |
| Total from investment operations | 3.68 | 1.04 | 2.54 | 3.39 | 7.33 | 2.98 |
Less distributions from: Net investment income | (.22) | (.22) | (.22) | (.18) | (.30) | (.18) |
| Net realized gains | (2.29) | (2.34) | (4.05) | (1.67) | — | — |
| Total distributions | (2.51) | (2.56) | (4.27) | (1.85) | (.30) | (.18) |
| Net asset value, end of period | $ 27.87 | $ 26.70 | $ 28.22 | $ 29.95 | $ 28.41 | $ 21.38 |
| Total Return (%) | 14.06** | 4.25 | 8.62 | 12.97 | 34.65 | 16.05 |
| Ratios to Average Net Assets and Supplemental Data |
| Net assets, end of period ($ millions) | 839 | 745 | 849 | 890 | 837 | 701 |
| Ratio of expenses (%)b | .50* | .50 | .49 | .50 | .50 | .50 |
| Ratio of net investment income (loss) (%) | .80* | .82 | .70 | .76 | .85 | 1.32 |
| Portfolio turnover rate (%) | 6** | 35 | 35 | 47 | 37 | 25 |
a Based on average shares outstanding during the period. b Expense ratio does not reflect charges and fees associated with the separate account that invests in the Fund or any variable life insurance policy or variable annuity contract for which the Fund is an investment option. * Annualized ** Not annualized |
| | | | | | | | |
| Class B | Six Months Ended 6/30/17 (Unaudited) |
Years Ended December 31, |
| 2016 | 2015 | 2014 | 2013 | 2012 |
| Selected Per Share Data |
| Net asset value, beginning of period | $ 26.61 | $ 28.12 | $ 29.84 | $ 28.29 | $ 21.29 | $ 18.51 |
Income (loss) from investment operations: Net investment income (loss)a | .08 | .15 | .13 | .09 | .13 | .20 |
| Net realized and unrealized gain (loss) | 3.55 | .83 | 2.32 | 3.22 | 7.10 | 2.69 |
| Total from investment operations | 3.63 | .98 | 2.45 | 3.31 | 7.23 | 2.89 |
Less distributions from: Net investment income | (.14) | (.15) | (.12) | (.09) | (.23) | (.11) |
| Net realized gains | (2.29) | (2.34) | (4.05) | (1.67) | — | — |
| Total distributions | (2.43) | (2.49) | (4.17) | (1.76) | (.23) | (.11) |
| Net asset value, end of period | $ 27.81 | $ 26.61 | $ 28.12 | $ 29.84 | $ 28.29 | $ 21.29 |
| Total Return (%) | 13.92** | 4.00 | 8.33 | 12.67 | 34.19 | 15.61 |
| Ratios to Average Net Assets and Supplemental Data |
| Net assets, end of period ($ millions) | 6 | 5 | 4 | 3 | 14 | 13 |
| Ratio of expenses (%)b | .76* | .76 | .76 | .80 | .83 | .83 |
| Ratio of net investment income (loss) (%) | .55* | .58 | .44 | .33 | .52 | .97 |
| Portfolio turnover rate (%) | 6** | 35 | 35 | 47 | 37 | 25 |
a Based on average shares outstanding during the period. b Expense ratio does not reflect charges and fees associated with the separate account that invests in the Fund or any variable life insurance policy or variable annuity contract for which the Fund is an investment option. * Annualized ** Not annualized |
| | | | | | | | |
Notes to Financial Statements (Unaudited)
A. Organization and Significant Accounting Policies
Deutsche Variable Series I (the "Trust") is registered under the Investment Company Act of 1940, as amended (the "1940 Act"), as an open-end, registered management investment company organized as a Massachusetts business trust. The Trust consists of five diversified funds: Deutsche Bond VIP, Deutsche Capital Growth VIP, Deutsche Core Equity VIP, Deutsche CROCI® International VIP and Deutsche Global Small Cap VIP (individually or collectively hereinafter referred to as a "Fund" or the "Funds"). These financial statements report on Deutsche Capital Growth VIP. The Trust is intended to be the underlying investment vehicle for variable annuity contracts and variable life insurance policies to be offered by the separate accounts of certain life insurance companies ("Participating Insurance Companies").
Multiple Classes of Shares of Beneficial Interest. The Fund offers two classes of shares (Class A shares and Class B shares). Class B shares are subject to Rule 12b-1 distribution fees under the 1940 Act and record keeping fees equal to an annual rate of 0.25% and up to 0.15%, respectively, of the average daily net assets of the Class B shares of the Fund. Class A shares are not subject to such fees.
Investment income, realized and unrealized gains and losses, and certain fund-level expenses and expense reductions, if any, are borne pro rata on the basis of relative net assets by the holders of all classes of shares, except that each class bears certain expenses unique to that class (including the applicable 12b-1 distribution fees and recordkeeping fees). Differences in class-level expenses may result in payment of different per share dividends by class. All shares have equal rights with respect to voting subject to class-specific arrangements.
The Fund's financial statements are prepared in accordance with accounting principles generally accepted in the United States of America ("U.S. GAAP") which require the use of management estimates. Actual results could differ from those estimates. The Fund qualifies as an investment company under Topic 946 of Accounting Standards Codification of U.S. GAAP. The policies described below are followed consistently by the Fund in the preparation of its financial statements.
Security Valuation. Investments are stated at value determined as of the close of regular trading on the New York Stock Exchange on each day the exchange is open for trading.
Various inputs are used in determining the value of the Fund's investments. These inputs are summarized in three broad levels. Level 1 includes quoted prices in active markets for identical securities. Level 2 includes other significant observable inputs (including quoted prices for similar securities, interest rates, prepayment speeds and credit risk). Level 3 includes significant unobservable inputs (including the Fund's own assumptions in determining the fair value of investments). The level assigned to the securities valuations may not be an indication of the risk or liquidity associated with investing in those securities.
Equity securities are valued at the most recent sale price or official closing price reported on the exchange (U.S. or foreign) or over-the-counter market on which they trade. Securities for which no sales are reported are valued at the calculated mean between the most recent bid and asked quotations on the relevant market or, if a mean cannot be determined, at the most recent bid quotation. Equity securities are generally categorized as Level 1.
Investments in open-end investment companies are valued at their net asset value each business day and are categorized as Level 1.
Debt securities are valued at prices supplied by independent pricing services approved by the Fund's Board. Such services may use various pricing techniques which take into account appropriate factors such as yield, quality, coupon rate, maturity, type of issue, trading characteristics, prepayment speeds and other data, as well as broker quotes. If the pricing services are unable to provide valuations, debt securities are valued at the average of the most recent reliable bid quotations or evaluated prices, as applicable, obtained from broker-dealers. These securities are generally categorized as Level 2.
Securities and other assets for which market quotations are not readily available or for which the above valuation procedures are deemed not to reflect fair value are valued in a manner that is intended to reflect their fair value as determined in accordance with procedures approved by the Trustees and are generally categorized as Level 3. In accordance with the Fund's valuation procedures, factors considered in determining value may include, but are not limited to, the type of the security; the size of the holding; the initial cost of the security; the existence of any contractual restrictions on the security's disposition; the price and extent of public trading in similar securities of the issuer or of comparable companies; quotations or evaluated prices from broker-dealers and/or pricing services; information obtained from the issuer, analysts, and/or the appropriate stock exchange (for exchange-traded securities); an analysis of the company's or issuer's financial statements; an evaluation of the forces that influence the issuer and the market(s) in which the security is purchased and sold; and with respect to debt securities, the maturity, coupon, creditworthiness, currency denomination and the movement of the market in which the security is normally traded. The value determined under these procedures may differ from published values for the same securities.
Disclosure about the classification of fair value measurements is included in a table following the Fund's Investment Portfolio.
Securities Lending. Deutsche Bank AG, as lending agent, lends securities of the Fund to certain financial institutions under the terms of its securities lending agreement. During the term of the loans, the Fund continues to receive interest and dividends generated by the securities and to participate in any changes in their market value. The Fund requires the borrowers of the securities to maintain collateral with the Fund consisting of either cash or liquid, unencumbered assets having a value at least equal to the value of the securities loaned. When the collateral falls below specified amounts, the lending agent will use its best effort to obtain additional collateral on the next business day to meet required amounts under the securities lending agreement. During the six months ended June 30, 2017, the Fund invested the cash collateral into a joint trading account in affiliated money market funds including Deutsche Government & Agency Securities Portfolio managed by Deutsche Investment Management Americas Inc. Deutsche Investment Management Americas Inc. receives a management/administration fee (0.13% annualized effective rate as of June 30, 2017) on the cash collateral invested in Deutsche Government & Agency Securities Portfolio. The Fund receives compensation for lending its securities either in the form of fees or by earning interest on invested cash collateral net of borrower rebates and fees paid to a lending agent. Either the Fund or the borrower may terminate the loan at any time and the borrower, after notice, is required to return borrowed securities within a standard time period. There may be risks of delay and costs in recovery of securities or even loss of rights in the collateral should the borrower of the securities fail financially. If the Fund is not able to recover securities lent, the Fund may sell the collateral and purchase a replacement investment in the market, incurring the risk that the value of the replacement security is greater than the value of the collateral. The Fund is also subject to all investment risks associated with the reinvestment of any cash collateral received, including, but not limited to, interest rate, credit and liquidity risk associated with such investments.
As of June 30, 2017, the Fund had no securities on loan.
Foreign Currency Translations. The books and records of the Fund are maintained in U.S. dollars. Investment securities and other assets and liabilities denominated in a foreign currency are translated into U.S. dollars at the prevailing exchange rates at period end. Purchases and sales of investment securities, income and expenses are translated into U.S. dollars at the prevailing exchange rates on the respective dates of the transactions.
Net realized and unrealized gains and losses on foreign currency transactions represent net gains and losses between trade and settlement dates on securities transactions, the acquisition and disposition of foreign currencies, and the difference between the amount of net investment income accrued and the U.S. dollar amount actually received. The portion of both realized and unrealized gains and losses on investments that results from fluctuations in foreign currency exchange rates is not separately disclosed but is included with net realized and unrealized gain/appreciation and loss/depreciation on investments.
Federal Income Taxes. The Fund is treated as a separate taxpayer as provided for in the Internal Revenue Code, as amended. It is the Fund's policy to comply with the requirements of the Internal Revenue Code, as amended, which are applicable to regulated investment companies, and to distribute all of its taxable income to the separate accounts of the Participating Insurance Companies which hold its shares.
The Fund has reviewed the tax positions for the open tax years as of December 31, 2016 and has determined that no provision for income tax and/or uncertain tax provisions is required in the Fund's financial statements. The Fund's federal tax returns for the prior three fiscal years remain open subject to examination by the Internal Revenue Service.
Distribution of Income and Gains. Distributions from net investment income of the Fund, if any, are declared and distributed to shareholders annually. Net realized gains from investment transactions, in excess of available capital loss carryforwards, would be taxable to the Fund if not distributed, and, therefore, will be distributed to shareholders at least annually. The Fund may also make additional distributions for tax purposes if necessary.
The timing and characterization of certain income and capital gain distributions are determined annually in accordance with federal tax regulations which may differ from accounting principles generally accepted in the United States of America. These differences primarily relate to certain securities sold at a loss. As a result, net investment income (loss) and net realized gain (loss) on investment transactions for a reporting period may differ significantly from distributions during such period. Accordingly, the Fund may periodically make reclassifications among certain of its capital accounts without impacting the net asset value of the Fund.
The tax character of current year distributions will be determined at the end of the current fiscal year.
Expenses. Expenses of the Trust arising in connection with a specific Fund are allocated to that Fund. Other Trust expenses which cannot be directly attributed to a Fund are apportioned among the Funds in the Trust based upon the relative net assets or other appropriate measures.
Contingencies. In the normal course of business, the Fund may enter into contracts with service providers that contain general indemnification clauses. The Fund's maximum exposure under these arrangements is unknown, as this would involve future claims that may be made against the Fund that have not yet been made. However, based on experience, the Fund expects the risk of loss to be remote.
Other. Investment transactions are accounted for on a trade date plus one basis for daily net asset value calculations. However, for financial reporting purposes, investment transactions are reported on trade date. Interest income is recorded on the accrual basis. Dividend income is recorded on the ex-dividend date net of foreign withholding taxes. Realized gains and losses from investment transactions are recorded on an identified cost basis. Proceeds from litigation payments, if any, are included in net realized gain (loss) from investments.
B. Purchases and Sales of Securities
During the six months ended June 30, 2017, purchases and sales of investment securities (excluding short-term investments) aggregated $48,347,805 and $70,295,617, respectively.
C. Related Parties
Management Agreement. Under the Investment Management Agreement with Deutsche Investment Management Americas Inc. ("DIMA" or the "Advisor"), an indirect, wholly owned subsidiary of Deutsche Bank AG, the Advisor directs the investments of the Fund in accordance with its investment objectives, policies and restrictions. The Advisor determines the securities, instruments and other contracts relating to investments to be purchased, sold or entered into by the Fund.
Pursuant to the Investment Management Agreement with the Advisor, the Fund pays a monthly management fee based on the Fund's average daily net assets, computed and accrued daily and payable monthly at the following annual rates:
| First $250 million of average daily net assets | .390% |
| Next $750 million of average daily net assets | .365% |
| Over $1 billion of average daily net assets | .340% |
Accordingly, for the six months ended June 30, 2017, the fee pursuant to the Investment Management Agreement was equivalent to an annualized rate (exclusive of any applicable waivers/reimbursements) of 0.37% of the Fund's average daily net assets.
For the period from January 1, 2017 through September 30, 2017, the Advisor has contractually agreed to waive all or a portion of its fees and/or reimburse certain operating expenses to the extent necessary to maintain the total annual operating expenses (excluding certain expenses such as extraordinary expenses, taxes, brokerage and interest expense) of each class as follows:
Administration Fee. Pursuant to an Administrative Services Agreement, DIMA provides most administrative services to the Fund. For all services provided under the Administrative Services Agreement, the Fund pays the Advisor an annual fee ("Administration Fee") of 0.10% of the Fund's average daily net assets, computed and accrued daily and payable monthly. For the six months ended June 30, 2017, the Administration Fee was $404,475, of which $70,013 is unpaid.
Service Provider Fees. Deutsche AM Service Company ("DSC"), an affiliate of the Advisor, is the transfer agent, dividend-paying agent and shareholder service agent for the Fund. Pursuant to a sub-transfer agency agreement between DSC and DST Systems, Inc. ("DST"), DSC has delegated certain transfer agent, dividend-paying agent and shareholder service agent functions to DST. DSC compensates DST out of the shareholder servicing fee it receives from the Fund. For the six months ended June 30, 2017, the amounts charged to the Fund by DSC were as follows:
| Services to Shareholders | Total Aggregated | Unpaid at June 30, 2017 |
| Class A | $ 362 | $ 173 |
| Class B | 105 | 52 |
| | $ 467 | $ 225 |
Distribution Service Agreement. Deutsche AM Distributors, Inc. ("DDI"), also an affiliate of the Advisor, is the Trust's Distributor. In accordance with the Master Distribution Plan, DDI receives 12b-1 fees of 0.25% of average daily net assets of Class B shares. Pursuant to the Master Distribution Plan, DDI remits these fees to the Participating Insurance Companies for various costs incurred or paid by these companies in connection with marketing and distribution of Class B shares. For the six months ended June 30, 2017, the Distribution Service Fee aggregated $7,207, of which $1,234 is unpaid.
Typesetting and Filing Service Fees. Under an agreement with DIMA, DIMA is compensated for providing typesetting and certain regulatory filing services to the Fund. For the six months ended June 30, 2017, the amount charged to the Fund by DIMA included in the Statement of Operations under "Reports to shareholders" aggregated $5,792, of which $5,238 is unpaid.
Trustees' Fees and Expenses. The Fund paid retainer fees to each Trustee not affiliated with the Advisor, plus specified amounts to the Board Chairperson and Vice Chairperson and to each committee Chairperson.
Affiliated Cash Management Vehicles. The Fund may invest uninvested cash balances in Deutsche Central Cash Management Government Fund and Deutsche Variable NAV Money Fund, affiliated money market funds which are managed by the Advisor. Each affiliated money market fund is managed in accordance with Rule 2a-7 under the 1940 Act, which governs the quality, maturity, diversity and liquidity of instruments in which a money market fund may invest. Deutsche Central Cash Management Government Fund seeks to maintain a stable net asset value, and Deutsche Variable NAV Money Fund maintains a floating net asset value. The Fund indirectly bears its proportionate share of the expenses of each affiliated money market fund in which it invests. Deutsche Central Cash Management Government Fund does not pay the Advisor an investment management fee. To the extent that Deutsche Variable NAV Money Fund pays an investment management fee to the Advisor, the Advisor will waive an amount of the investment management fee payable to the Advisor by the Fund equal to the amount of the investment management fee payable on the Fund's assets invested in Deutsche Variable NAV Money Fund.
Securities Lending Agent Fees. Deutsche Bank AG serves as lending agent for the Fund. For the six months ended June 30, 2017, the Fund incurred securities lending agent fees to Deutsche Bank AG in the amount of $57.
D. Ownership of the Fund
At June 30, 2017, three participating insurance companies were owners of record of 10% or more of the total outstanding Class A shares of the Fund, each owning 47%, 30% and 10%, respectively. Two participating insurance companies were the owners of record of 10% or more of the total outstanding Class B shares of the Fund, each owning 56% and 37%, respectively.
E. Line of Credit
The Fund and other affiliated funds (the "Participants") share in a $400 million revolving credit facility provided by a syndication of banks. The Fund may borrow for temporary or emergency purposes, including the meeting of redemption requests that otherwise might require the untimely disposition of securities. The Participants are charged an annual commitment fee which is allocated based on net assets, among each of the Participants. Interest is calculated at a rate per annum equal to the sum of the Federal Funds Rate plus 1.25 percent plus if the one-month LIBOR exceeds the Federal Funds Rate, the amount of such excess. The Fund may borrow up to a maximum of 33 percent of its net assets under the agreement. The Fund had no outstanding loans at June 30, 2017.
F. Payment by Affiliate
During the six months ended June 30, 2017, the Advisor agreed to reimburse the Fund $34,034 for commission costs incurred in connection with purchases and sales of portfolio assets due to certain changes in the principal investment strategy. The amount reimbursed was less than 0.01% of the Fund’s average net assets, thus having no impact on the Fund’s total return.
Information About Your Fund's Expenses (Unaudited)
As an investor of the Fund, you incur two types of costs: ongoing expenses and transaction costs. Ongoing expenses include management fees, distribution and service (12b-1) fees and other Fund expenses. Examples of transaction costs include contract charges, which are not shown in this section. The following tables are intended to help you understand your ongoing expenses (in dollars) of investing in the Fund and to help you compare these expenses with the ongoing expenses of investing in other mutual funds. The example in the table is based on an investment of $1,000 invested at the beginning of the six-month period and held for the entire period (January 1, 2017 to June 30, 2017).
The tables illustrate your Fund's expenses in two ways:
— Actual Fund Return. This helps you estimate the actual dollar amount of ongoing expenses (but not transaction costs) paid on a $1,000 investment in the Fund using the Fund's actual return during the period. To estimate the expenses you paid over the period, simply divide your account value by $1,000 (for example, an $8,600 account value divided by $1,000 = 8.6), then multiply the result by the number in the "Expenses Paid per $1,000" line under the share class you hold.
— Hypothetical 5% Fund Return. This helps you to compare your Fund's ongoing expenses (but not transaction costs) with those of other mutual funds using the Fund's actual expense ratio and a hypothetical rate of return of 5% per year before expenses. Examples using a 5% hypothetical Fund return may be found in the shareholder reports of other mutual funds. The hypothetical account values and expenses may not be used to estimate the actual ending account balance or expenses you paid for the period.
Please note that the expenses shown in these tables are meant to highlight your ongoing expenses only and do not reflect any transaction costs. The "Expenses Paid per $1,000" line of the tables is useful in comparing ongoing expenses only and will not help you determine the relative total expense of owning different funds. If these transaction costs had been included, your costs would have been higher.
| Expenses and Value of a $1,000 Investment for the six months ended June 30, 2017 |
| Actual Fund Return | Class A | | Class B | |
| Beginning Account Value 1/1/17 | $ 1,000.00 | | $ 1,000.00 | |
| Ending Account Value 6/30/17 | $ 1,140.60 | | $ 1,139.20 | |
| Expenses Paid per $1,000* | $ 2.65 | | $ 4.03 | |
| Hypothetical 5% Fund Return | Class A | | Class B | |
| Beginning Account Value 1/1/17 | $ 1,000.00 | | $ 1,000.00 | |
| Ending Account Value 6/30/17 | $ 1,022.32 | | $ 1,021.03 | |
| Expenses Paid per $1,000* | $ 2.51 | | $ 3.81 | |
* Expenses are equal to the Fund's annualized expense ratio for each share class, multiplied by the average account value over the period, multiplied by 181 (the number of days in the most recent six-month period), then divided by 365.
| Annualized Expense Ratios | Class A | | Class B | |
| Deutsche Variable Series I — Deutsche Capital Growth VIP | .50% | | .76% | |
For more information, please refer to the Fund's prospectus.
These tables do not reflect charges and fees ("contract charges") associated with the separate account that invests in the Fund or any variable life insurance policy or variable annuity contract for which the Fund is an investment option.
For an analysis of the fees associated with an investment in the fund or similar funds, please refer to the current and hypothetical expense calculators for Variable Insurance Products which can be found at deutschefunds.com/EN/resources/calculators.jsp.
Proxy Voting
The Trust's policies and procedures for voting proxies for portfolio securities and information about how the Trust voted proxies related to its portfolio securities during the most recent 12-month period ended June 30 are available on our Web site — deutschefunds.com (click on "proxy voting"at the bottom of the page) — or on the SEC's Web site — sec.gov. To obtain a written copy of the Trust's policies and procedures without charge, upon request, call us toll free at (800) 728-3337.
Advisory Agreement Board Considerations and Fee Evaluation
The Board of Trustees (hereinafter referred to as the "Board" or "Trustees") approved the renewal of Deutsche Capital Growth VIP’s (the "Fund") investment management agreement (the "Agreement") with Deutsche Investment Management Americas Inc. ("DIMA") in September 2016.
In terms of the process that the Board followed prior to approving the Agreement, shareholders should know that:
— During the entire process, all of the Fund’s Trustees were independent of DIMA and its affiliates (the "Independent Trustees").
— The Board met frequently during the past year to discuss fund matters and dedicated a substantial amount of time to contract review matters. Over the course of several months, the Board’s Contract Committee reviewed extensive materials received from DIMA, independent third parties and independent counsel. These materials included an analysis of the Fund’s performance, fees and expenses, and profitability from a fee consultant retained by the Fund’s Independent Trustees (the "Fee Consultant"). The Board also received extensive information throughout the year regarding performance of the Fund.
— The Independent Trustees regularly meet privately with counsel to discuss contract review and other matters. In addition, the Independent Trustees were advised by the Fee Consultant in the course of their review of the Fund’s contractual arrangements and considered a comprehensive report prepared by the Fee Consultant in connection with their deliberations.
— In connection with reviewing the Agreement, the Board also reviewed the terms of the Fund’s Rule 12b-1 plan, distribution agreement, administrative services agreement, transfer agency agreement and other material service agreements.
— Based on its evaluation of the information provided, the Contract Committee presented its findings and recommendations to the Board. The Board then reviewed the Contract Committee’s findings and recommendations.
In connection with the contract review process, the Contract Committee and the Board considered the factors discussed below, among others. The Board also considered that DIMA and its predecessors have managed the Fund since its inception, and the Board believes that a long-term relationship with a capable, conscientious advisor is in the best interests of the Fund. The Board considered, generally, that shareholders chose to invest or remain invested in the Fund knowing that DIMA managed the Fund, and that the Agreement was approved by the Fund’s shareholders. DIMA is part of Deutsche Bank AG’s ("Deutsche Bank") Asset Management ("Deutsche AM") division. Deutsche AM is a global asset management business that offers a wide range of investing expertise and resources, including research capabilities in many countries throughout the world. Deutsche Bank has advised the Board that the U.S. asset management business continues to be a critical and integral part of Deutsche Bank, and that Deutsche Bank will continue to invest in Deutsche AM and seek to enhance Deutsche AM’s investment platform. Deutsche Bank also has confirmed its commitment to maintaining strong legal and compliance groups within the Deutsche AM division.
As part of the contract review process, the Board carefully considered the fees and expenses of each Deutsche fund overseen by the Board in light of the fund’s performance. In many cases, this led to the negotiation and implementation of expense caps. As part of these negotiations, the Board indicated that it would consider relaxing these caps in future years following sustained improvements in performance, among other considerations.
While shareholders may focus primarily on fund performance and fees, the Fund’s Board considers these and many other factors, including the quality and integrity of DIMA’s personnel and such other issues as back-office operations, fund valuations, and compliance policies and procedures.
Nature, Quality and Extent of Services. The Board considered the terms of the Agreement, including the scope of advisory services provided under the Agreement. The Board noted that, under the Agreement, DIMA provides portfolio management services to the Fund and that, pursuant to a separate administrative services agreement, DIMA provides administrative services to the Fund. The Board considered the experience and skills of senior management and investment personnel and the resources made available to such personnel. The Board reviewed the Fund’s performance over short-term and long-term periods and compared those returns to various agreed-upon performance measures, including market index(es) and a peer universe compiled using information supplied by Morningstar Direct ("Morningstar"), an independent fund data service. The Board also noted that it has put into place a process of identifying "Focus Funds" (e.g., funds performing poorly relative to a peer universe), and receives additional reporting from DIMA regarding such funds and, where appropriate, DIMA’s plans to address underperformance. The Board believes this process is an effective manner of identifying and addressing underperforming funds. Based on the information provided, the Board noted that for the one-, three- and five-year periods ended December 31, 2015, the Fund’s performance (Class A shares) was in the 2nd quartile of the applicable Morningstar universe (the 1st quartile being the best performers and the 4th quartile being the worst performers). The Board also observed that the Fund has outperformed its benchmark in the one- and three-year periods and has underperformed its benchmark in the five-year period ended December 31, 2015.
Fees and Expenses. The Board considered the Fund’s investment management fee schedule, operating expenses and total expense ratios, and comparative information provided by Broadridge Financial Solutions, Inc. ("Broadridge") and the Fee Consultant regarding investment management fee rates paid to other investment advisors by similar funds (1st quartile being the most favorable and 4th quartile being the least favorable). With respect to management fees paid to other investment advisors by similar funds, the Board noted that the contractual fee rates paid by the Fund, which include a 0.10% fee paid to DIMA under the Fund’s administrative services agreement, were lower than the median (1st quartile) of the applicable Broadridge peer group (based on Broadridge data provided as of December 31, 2015). The Board noted that the Fund’s Class A shares total (net) operating expenses were expected to be lower than the median (1st quartile) of the applicable Broadridge expense universe (based on Broadridge data provided as of December 31, 2015, and analyzing Broadridge expense universe Class A (net) expenses less any applicable 12b-1 fees) ("Broadridge Universe Expenses"). The Board also reviewed data comparing each share class’s total (net) operating expenses to the applicable Broadridge Universe Expenses. The Board noted that the expense limitations agreed to by DIMA were expected to help the Fund’s total (net) operating expenses remain competitive. The Board considered the Fund’s management fee rate as compared to fees charged by DIMA to comparable Deutsche U.S. registered funds ("Deutsche Funds") and considered differences between the Fund and the comparable Deutsche Funds. The information requested by the Board as part of its review of fees and expenses also included information about institutional accounts (including any sub-advised funds and accounts) and funds offered primarily to European investors ("Deutsche Europe funds") managed by Deutsche AM. The Board noted that DIMA indicated that Deutsche AM does not manage any institutional accounts or Deutsche Europe funds comparable to the Fund.
On the basis of the information provided, the Board concluded that management fees were reasonable and appropriate in light of the nature, quality and extent of services provided by DIMA.
Profitability. The Board reviewed detailed information regarding revenues received by DIMA under the Agreement. The Board considered the estimated costs and pre-tax profits realized by DIMA from advising the Deutsche Funds, as well as estimates of the pre-tax profits attributable to managing the Fund in particular. The Board also received information regarding the estimated enterprise-wide profitability of DIMA and its affiliates with respect to all fund services in totality and by fund. The Board and the Fee Consultant reviewed DIMA’s methodology in allocating its costs to the management of the Fund. Based on the information provided, the Board concluded that the pre-tax profits realized by DIMA in connection with the management of the Fund were not unreasonable. The Board also reviewed certain publicly available information regarding the profitability of certain similar investment management firms. The Board noted that while information regarding the profitability of such firms is limited (and in some cases is not necessarily prepared on a comparable basis), DIMA and its affiliates’ overall profitability with respect to the Deutsche Funds (after taking into account distribution and other services provided to the funds by DIMA and its affiliates) was lower than the overall profitability levels of most comparable firms for which such data was available.
Economies of Scale. The Board considered whether there are economies of scale with respect to the management of the Fund and whether the Fund benefits from any economies of scale. The Board noted that the Fund’s investment management fee schedule includes fee breakpoints. The Board concluded that the Fund’s fee schedule represents an appropriate sharing between the Fund and DIMA of such economies of scale as may exist in the management of the Fund at current asset levels.
Other Benefits to DIMA and Its Affiliates. The Board also considered the character and amount of other incidental benefits received by DIMA and its affiliates, including any fees received by DIMA for administrative services provided to the Fund and any fees received by an affiliate of DIMA for distribution services. The Board also considered benefits to DIMA related to brokerage and soft-dollar allocations, including allocating brokerage to pay for research generated by parties other than the executing broker dealers, which pertain primarily to funds investing in equity securities, along with the incidental public relations benefits to DIMA related to Deutsche Funds advertising and cross-selling opportunities among DIMA products and services. The Board considered these benefits in reaching its conclusion that the Fund’s management fees were reasonable.
Compliance. The Board considered the significant attention and resources dedicated by DIMA to documenting and enhancing its compliance processes in recent years. The Board noted in particular (i) the experience, seniority and time commitment of the individuals serving as DIMA’s and the Fund’s chief compliance officers; (ii) the large number of DIMA compliance personnel; and (iii) the substantial commitment of resources by DIMA and its affiliates to compliance matters.
Based on all of the information considered and the conclusions reached, the Board unanimously determined that the continuation of the Agreement is in the best interests of the Fund. In making this determination, the Board did not give particular weight to any single factor identified above. The Board considered these factors over the course of numerous meetings, certain of which were in executive session with only the Independent Trustees and counsel present. It is possible that individual Independent Trustees may have weighed these factors differently in reaching their individual decisions to approve the continuation of the Agreement.

VS1capgro-3 (R-028374-6 8/17)

June 30, 2017
Semiannual Report
Deutsche Variable Series I
Deutsche Core Equity VIP

Contents
3 Performance Summary 4 Portfolio Summary 4 Portfolio Management Team 5 Investment Portfolio 8 Statement of Assets and Liabilities 10 Statement of Operations 10 Statements of Changes in Net Assets 12 Financial Highlights 13 Notes to Financial Statements 17 Information About Your Fund's Expenses 18 Proxy Voting 19 Advisory Agreement Board Considerations and Fee Evaluation |
This report must be preceded or accompanied by a prospectus. To obtain an additional prospectus or summary prospectus, if available, call (800) 728-3337 or your financial representative. We advise you to consider the Fund's objectives, risks, charges and expenses carefully before investing. The summary prospectus and prospectus contain this and other important information about the Fund. Please read the prospectus carefully before you invest.
Stocks may decline in value. Fund management could be wrong in its analysis of industries, companies, economic trends and favor a security that underperforms the market. The Fund may lend securities to approved institutions. Investing in derivatives entails special risks relating to liquidity, leverage and credit that may reduce returns and/or increase volatility. See the prospectus for details.
Deutsche Asset Management represents the asset management activities conducted by Deutsche Bank AG or any of its subsidiaries.
Deutsche AM Distributors, Inc., 222 South Riverside Plaza, Chicago, IL 60606, (800) 621-1148
NOT FDIC/NCUA INSURED NO BANK GUARANTEE MAY LOSE VALUE NOT A DEPOSIT
NOT INSURED BY ANY FEDERAL GOVERNMENT AGENCY
Performance Summary June 30, 2017 (Unaudited)
Fund performance shown is historical, assumes reinvestment of all dividend and capital gain distributions, and does not guarantee future results. Investment return and principal value fluctuate with changing market conditions so that, when redeemed, shares may be worth more or less than their original cost. Current performance may be lower or higher than the performance data quoted. Please contact your participating insurance company for the Fund's most recent month-end performance. Performance doesn't reflect charges and fees ("contract charges") associated with the separate account that invests in the Fund or any variable life insurance policy or variable annuity contract for which the Fund is an investment option. These charges and fees will reduce returns. While all share classes have the same underlying portfolio, their performance will differ.
The gross expense ratios of the Fund, as stated in the fee table of the prospectus dated May 1, 2017 are 0.57% and 0.86% for Class A and Class B shares, respectively, and may differ from the expense ratios disclosed in the Financial Highlights tables in this report.
Generally accepted accounting principles require adjustments to be made to the net assets of the Fund at period end for financial reporting purposes only, and as such, the total return based on the unadjusted net asset value per share may differ from the total return reported in the financial highlights.
| Growth of an Assumed $10,000 Investment |
■ Deutsche Core Equity VIP — Class A ■ Russell 1000® Index | The Russell 1000® Index is an unmanaged index that measures the performance of the 1,000 largest companies in the Russell 3000® Index, which represents approximately 92% of the total market capitalization of the Russell 3000 Index. Index returns do not reflect any fees or expenses and it is not possible to invest directly into an index. |
 | |
| Yearly periods ended June 30 | |
| Comparative Results |
| Deutsche Core Equity VIP | 6-Month‡ | 1-Year | 3-Year | 5-Year | 10-Year |
| Class A | Growth of $10,000 | $10,854 | $11,933 | $13,364 | $21,140 | $20,794 |
| Average annual total return | 8.54% | 19.33% | 10.15% | 16.15% | 7.60% |
| Russell 1000® Index | Growth of $10,000 | $10,927 | $11,803 | $13,044 | $19,825 | $20,211 |
| Average annual total return | 9.27% | 18.03% | 9.26% | 14.67% | 7.29% |
| Deutsche Core Equity VIP | 6-Month‡ | 1-Year | 3-Year | 5-Year | 10-Year |
| Class B | Growth of $10,000 | $10,838 | $11,898 | $13,254 | $20,885 | $20,283 |
| Average annual total return | 8.38% | 18.98% | 9.85% | 15.87% | 7.33% |
| Russell 1000® Index | Growth of $10,000 | $10,927 | $11,803 | $13,044 | $19,825 | $20,211 |
| Average annual total return | 9.27% | 18.03% | 9.26% | 14.67% | 7.29% |
The growth of $10,000 is cumulative.
‡ Total returns shown for periods less than one year are not annualized.
Portfolio Summary (Unaudited)
| Asset Allocation (As a % of Investment Portfolio excluding Securities Lending Collateral) | 6/30/17 | 12/31/16 |
| | | |
| Common Stocks | 100% | 99% |
| Cash Equivalents | 0% | 1% |
| Convertible Preferred Stock | — | 0% |
| | 100% | 100% |
| Sector Diversification (As a % of Investment Portfolio excluding Cash Equivalents and Securities Lending Collateral) | 6/30/17 | 12/31/16 |
| | | |
| Information Technology | 22% | 21% |
| Financials | 15% | 17% |
| Health Care | 14% | 12% |
| Consumer Discretionary | 12% | 11% |
| Industrials | 11% | 11% |
| Consumer Staples | 8% | 9% |
| Energy | 6% | 8% |
| Real Estate | 4% | 3% |
| Utilities | 3% | 3% |
| Materials | 3% | 3% |
| Telecommunication Services | 2% | 2% |
| | 100% | 100% |
Portfolio holdings and characteristics are subject to change.
For more complete details about the Fund's investment portfolio, see page 5.
Following the Fund's fiscal first and third quarter-end, a complete portfolio holdings listing is filed with the SEC on Form N-Q. The form will be available on the SEC's Web site at sec.gov, and it also may be reviewed and copied at the SEC's Public Reference Room in Washington, D.C. Information on the operation of the SEC's Public Reference Room may be obtained by calling (800) SEC-0330. The Fund's portfolio holdings are also posted on deutschefunds.com from time to time. Please see the Fund's current prospectus for more information.
Portfolio Management Team
Pankaj Bhatnagar, PhD, Managing Director
Di Kumble, CFA, Managing Director
Arno V. Puskar, Director
Portfolio Managers
Investment Portfolio June 30, 2017 (Unaudited)
| | Shares | Value ($) |
| | | |
| Common Stocks 99.6% |
| Consumer Discretionary 11.7% |
| Auto Components 1.2% |
| BorgWarner, Inc. | 25,564 | 1,082,891 |
| Goodyear Tire & Rubber Co. | 26,710 | 933,782 |
| | 2,016,673 |
| Hotels, Restaurants & Leisure 1.4% |
| Brinker International, Inc. | 38,401 | 1,463,078 |
| Las Vegas Sands Corp. | 14,053 | 897,846 |
| | 2,360,924 |
| Household Durables 0.6% |
| Newell Brands, Inc. | 17,287 | 926,929 |
| Internet & Direct Marketing Retail 2.0% |
| Amazon.com, Inc.* | 3,534 | 3,420,912 |
| Media 3.2% |
| Comcast Corp. "A" | 48,505 | 1,887,815 |
| Omnicom Group, Inc. | 20,460 | 1,696,134 |
| Regal Entertainment Group "A" (a) | 42,518 | 869,918 |
| Walt Disney Co. | 9,582 | 1,018,087 |
| | 5,471,954 |
| Specialty Retail 1.8% |
| Home Depot, Inc. | 4,677 | 717,452 |
| L Brands, Inc. | 25,455 | 1,371,770 |
| Ulta Salon, Cosmetics & Fragrance, Inc.* | 3,008 | 864,319 |
| | 2,953,541 |
| Textiles, Apparel & Luxury Goods 1.5% |
| NIKE, Inc. "B" | 29,769 | 1,756,371 |
| VF Corp. | 13,950 | 803,520 |
| | 2,559,891 |
| Consumer Staples 7.5% |
| Beverages 1.6% |
| PepsiCo, Inc. | 23,874 | 2,757,208 |
| Food & Staples Retailing 3.2% |
| Sysco Corp. | 62,907 | 3,166,109 |
| Wal-Mart Stores, Inc. | 21,716 | 1,643,467 |
| Whole Foods Market, Inc. | 12,036 | 506,836 |
| | 5,316,412 |
| Food Products 2.4% |
| Conagra Brands, Inc. | 34,389 | 1,229,751 |
| Pinnacle Foods, Inc. | 24,534 | 1,457,319 |
| The JM Smucker Co. | 11,510 | 1,361,978 |
| | 4,049,048 |
| Personal Products 0.3% |
| Coty, Inc. "A" | 13,878 | 260,351 |
| Estee Lauder Companies, Inc. "A" | 3,232 | 310,208 |
| | 570,559 |
| Energy 6.4% |
| Oil, Gas & Consumable Fuels |
| Antero Resources Corp.* | 42,952 | 928,193 |
| Chevron Corp. | 16,093 | 1,678,983 |
| Concho Resources, Inc.* | 21,239 | 2,581,175 |
| Devon Energy Corp. | 29,841 | 954,017 |
| Energen Corp.* | 23,843 | 1,177,129 |
| EQT Corp. | 31,710 | 1,857,889 |
| Occidental Petroleum Corp. | 15,150 | 907,030 |
| Parsley Energy, Inc. "A"* | 27,501 | 763,153 |
| | 10,847,569 |
| | Shares | Value ($) |
| | | |
| Financials 14.5% |
| Banks 4.9% |
| Citigroup, Inc. | 62,764 | 4,197,656 |
| PacWest Bancorp. | 18,188 | 849,380 |
| U.S. Bancorp. | 60,722 | 3,152,686 |
| | 8,199,722 |
| Capital Markets 6.7% |
| Ameriprise Financial, Inc. | 27,456 | 3,494,874 |
| BlackRock, Inc. | 2,463 | 1,040,396 |
| E*TRADE Financial Corp.* | 35,883 | 1,364,630 |
| Lazard Ltd. "A" | 29,843 | 1,382,626 |
| Northern Trust Corp. | 17,398 | 1,691,260 |
| S&P Global, Inc. | 9,351 | 1,365,153 |
| SEI Investments Co. | 19,214 | 1,033,329 |
| | 11,372,268 |
| Insurance 2.9% |
| Chubb Ltd. | 14,861 | 2,160,492 |
| MetLife, Inc. | 49,320 | 2,709,641 |
| | 4,870,133 |
| Health Care 14.2% |
| Biotechnology 2.4% |
| Gilead Sciences, Inc. | 55,929 | 3,958,655 |
| Health Care Equipment & Supplies 2.0% |
| Becton, Dickinson & Co. | 15,258 | 2,976,988 |
| Boston Scientific Corp.* | 14,471 | 401,136 |
| | 3,378,124 |
| Health Care Providers & Services 2.6% |
| Cardinal Health, Inc. | 5,029 | 391,859 |
| Cigna Corp. | 13,825 | 2,314,167 |
| McKesson Corp. | 9,852 | 1,621,048 |
| | 4,327,074 |
| Life Sciences Tools & Services 1.8% |
| Thermo Fisher Scientific, Inc. | 17,749 | 3,096,668 |
| Pharmaceuticals 5.4% |
| Allergan PLC | 8,257 | 2,007,194 |
| Bristol-Myers Squibb Co. | 16,597 | 924,785 |
| Eli Lilly & Co. | 10,985 | 904,066 |
| Endo International PLC* | 39,414 | 440,254 |
| Merck & Co., Inc. | 29,061 | 1,862,520 |
| Pfizer, Inc. | 90,375 | 3,035,696 |
| | 9,174,515 |
| Industrials 10.8% |
| Aerospace & Defense 1.1% |
| Boeing Co. | 9,493 | 1,877,241 |
| Electrical Equipment 2.4% |
| AMETEK, Inc. | 46,110 | 2,792,882 |
| Regal Beloit Corp. | 15,034 | 1,226,023 |
| | 4,018,905 |
| Industrial Conglomerates 3.8% |
| General Electric Co. | 62,913 | 1,699,280 |
| Honeywell International, Inc. | 13,329 | 1,776,623 |
| Roper Technologies, Inc. | 12,836 | 2,971,919 |
| | 6,447,822 |
| Machinery 1.8% |
| Ingersoll-Rand PLC | 15,238 | 1,392,601 |
| Parker-Hannifin Corp. | 10,071 | 1,609,547 |
| | 3,002,148 |
| | Shares | Value ($) |
| | | |
| Road & Rail 1.7% |
| Norfolk Southern Corp. | 24,460 | 2,976,782 |
| Information Technology 22.3% |
| Communications Equipment 1.1% |
| Cisco Systems, Inc. | 61,166 | 1,914,496 |
| Internet Software & Services 3.6% |
| Alphabet, Inc. "A"* | 3,328 | 3,093,975 |
| Alphabet, Inc. "C"* | 2,925 | 2,658,036 |
| Pandora Media, Inc.* (a) | 31,472 | 280,730 |
| | 6,032,741 |
| IT Services 5.1% |
| Cognizant Technology Solutions Corp. "A" | 17,708 | 1,175,811 |
| Fidelity National Information Services, Inc. | 31,622 | 2,700,519 |
| Visa, Inc. "A" | 50,889 | 4,772,370 |
| | 8,648,700 |
| Semiconductors & Semiconductor Equipment 4.7% |
| Analog Devices, Inc. | 9,338 | 726,496 |
| Intel Corp. | 33,046 | 1,114,972 |
| NVIDIA Corp. | 20,220 | 2,923,003 |
| Texas Instruments, Inc. | 16,358 | 1,258,421 |
| Xilinx, Inc. | 28,386 | 1,825,788 |
| | 7,848,680 |
| Software 3.7% |
| Microsoft Corp. | 90,754 | 6,255,673 |
| Technology Hardware, Storage & Peripherals 4.1% |
| Apple, Inc. | 48,416 | 6,972,872 |
| Materials 3.3% |
| Chemicals 1.0% |
| AdvanSix, Inc.* | 533 | 16,651 |
| Albemarle Corp. | 15,818 | 1,669,431 |
| | 1,686,082 |
| Construction Materials 0.9% |
| Vulcan Materials Co. | 11,707 | 1,483,043 |
| Metals & Mining 1.4% |
| Freeport-McMoRan, Inc.* | 103,350 | 1,241,234 |
| Steel Dynamics, Inc. | 34,362 | 1,230,503 |
| | 2,471,737 |
| | Shares | Value ($) |
| | | |
| Real Estate 3.6% |
| Equity Real Estate Investment Trusts (REITs) |
| Digital Realty Trust, Inc. | 29,678 | 3,352,130 |
| Kimco Realty Corp. | 40,597 | 744,955 |
| Prologis, Inc. | 27,289 | 1,600,227 |
| STORE Capital Corp. | 18,015 | 404,437 |
| | 6,101,749 |
| Telecommunication Services 1.9% |
| Diversified Telecommunication Services 0.3% |
| Frontier Communications Corp. (a) | 411,587 | 477,441 |
| Wireless Telecommunication Services 1.6% |
| T-Mobile U.S., Inc.* | 44,356 | 2,688,861 |
| Utilities 3.4% |
| Electric Utilities 1.0% |
| NextEra Energy, Inc. | 12,320 | 1,726,402 |
| Multi-Utilities 1.0% |
| CenterPoint Energy, Inc. | 60,377 | 1,653,122 |
| Water Utilities 1.4% |
| American Water Works Co., Inc. | 30,410 | 2,370,459 |
| Total Common Stocks (Cost $129,980,004) | 168,283,735 |
| |
| Securities Lending Collateral 1.0% |
| Deutsche Government & Agency Securities Portfolio "Deutsche Government Cash Institutional Shares", 0.87% (b) (c) (Cost $1,684,957) | 1,684,957 | 1,684,957 |
| |
| Cash Equivalents 0.4% |
| Deutsche Central Cash Management Government Fund, 1.03% (b) (Cost $713,974) | 713,974 | 713,974 |
| | % of Net Assets | Value ($) |
| | |
| Total Investment Portfolio (Cost $132,378,935)† | 101.0 | 170,682,666 |
| Other Assets and Liabilities, Net | (1.0) | (1,655,010) |
| Net Assets | 100.0 | 169,027,656 |
* Non-income producing security.
† The cost for federal income tax purposes was $132,582,374. At June 30, 2017, net unrealized appreciation for all securities based on tax cost was $38,100,292. This consisted of aggregate gross unrealized appreciation for all securities in which there was an excess of value over tax cost of $42,596,088 and aggregate gross unrealized depreciation for all securities in which there was an excess of tax cost over value of $4,495,796.
(a) All or a portion of these securities were on loan. In addition, "Other Assets and Liabilities, Net" may include pending sales that are also on loan. The value of securities loaned at June 30, 2017 amounted to $1,607,251, which is 1.0% of net assets.
(b) Affiliated fund managed by Deutsche Investment Management Americas Inc. The rate shown is the annualized seven-day yield at period end.
(c) Represents collateral held in connection with securities lending. Income earned by the Fund is net of borrower rebates.
Fair Value Measurements
Various inputs are used in determining the value of the Fund's investments. These inputs are summarized in three broad levels. Level 1 includes quoted prices in active markets for identical securities. Level 2 includes other significant observable inputs (including quoted prices for similar securities, interest rates, prepayment speeds and credit risk). Level 3 includes significant unobservable inputs (including the Fund's own assumptions in determining the fair value of investments). The level assigned to the securities valuations may not be an indication of the risk or liquidity associated with investing in those securities.
The following is a summary of the inputs used as of June 30, 2017 in valuing the Fund's investments. For information on the Fund's policy regarding the valuation of investments, please refer to the Security Valuation section of Note A in the accompanying Notes to Financial Statements.
| Assets | Level 1 | Level 2 | Level 3 | Total |
| |
| Common Stocks (d) | $ 168,283,735 | $ — | $ — | $ 168,283,735 |
| Short-Term Investments (d) | 2,398,931 | — | — | 2,398,931 |
| Total | $ 170,682,666 | $ — | $ — | $ 170,682,666 |
There have been no transfers between fair value measurement levels during the period ended June 30, 2017.
(d) See Investment Portfolio for additional detailed categorizations.
The accompanying notes are an integral part of the financial statements.
Statement of Assets and Liabilities
| as of June 30, 2017 (Unaudited) |
| Assets |
Investments: Investments in non-affiliated securities, at value (cost $129,980,004) — including $1,607,251 of securities loaned | $ 168,283,735 |
| Investment in Deutsche Government & Agency Securities Portfolio (cost $1,684,957)* | 1,684,957 |
| Investment in Deutsche Central Cash Management Government Fund (cost $713,974) | 713,974 |
| Total investments in securities, at value (cost $132,378,935) | 170,682,666 |
| Cash | 10,000 |
| Receivable for Fund shares sold | 111,636 |
| Dividends receivable | 129,390 |
| Interest receivable | 3,686 |
| Foreign taxes recoverable | 829 |
| Other assets | 1,070 |
| Total assets | 170,939,277 |
| Liabilities |
| Payable upon return of securities loaned | 1,684,957 |
| Payable for Fund shares redeemed | 91,726 |
| Accrued management fee | 54,688 |
| Accrued Trustees' fees | 732 |
| Other accrued expenses and payables | 79,518 |
| Total liabilities | 1,911,621 |
| Net assets, at value | $ 169,027,656 |
| Net Assets Consist of |
| Undistributed net investment income | 1,173,486 |
| Net unrealized appreciation (depreciation) on investments | 38,303,731 |
| Accumulated net realized gain (loss) | 7,822,104 |
| Paid-in capital | 121,728,335 |
| Net assets, at value | $ 169,027,656 |
Class A Net Asset Value, offering and redemption price per share ($166,780,101 ÷ 12,702,608 outstanding shares of beneficial interest, $.01 par value, unlimited number of shares authorized) | $ 13.13 |
Class B Net Asset Value, offering and redemption price per share ($2,247,555 ÷ 171,209 outstanding shares of beneficial interest, $.01 par value, unlimited number of shares authorized) | $ 13.13 |
* Represents collateral on securities loaned.
The accompanying notes are an integral part of the financial statements.
Statement of Operations
| for the six months ended June 30, 2017 (Unaudited) |
| Investment Income |
Income: Dividends (net of foreign taxes withheld of $1,687) | $ 1,616,463 |
| Income distributions — Deutsche Central Cash Management Government Fund | 2,877 |
| Securities lending income, net of borrower rebates | 10,616 |
| Total income | 1,629,956 |
Expenses: Management fee | 325,901 |
| Administration fee | 83,564 |
| Services to shareholders | 732 |
| Record keeping fee (Class B) | 308 |
| Distribution service fee (Class B) | 2,664 |
| Custodian fee | 936 |
| Professional fees | 37,465 |
| Reports to shareholders | 14,972 |
| Trustees' fees and expenses | 5,914 |
| Other | 5,300 |
| Total expenses | 477,756 |
| Net investment income | 1,152,200 |
| Realized and Unrealized Gain (Loss) |
| Net realized gain (loss) from investments | 8,111,227 |
| Change in net unrealized appreciation (depreciation) on investments | 4,510,601 |
| Net gain (loss) | 12,621,828 |
| Net increase (decrease) in net assets resulting from operations | $ 13,774,028 |
The accompanying notes are an integral part of the financial statements.
Statements of Changes in Net Assets
| Increase (Decrease) in Net Assets | Six Months Ended June 30, 2017 (Unaudited) | Year Ended December 31, 2016 | |
| |
Operations: Net investment income | $ 1,152,200 | $ 2,159,171 | |
| Net realized gain (loss) | 8,111,227 | 11,458,572 | |
| Change in net unrealized appreciation (depreciation) | 4,510,601 | 1,593,775 | |
| Net increase (decrease) in net assets resulting from operations | 13,774,028 | 15,211,518 | |
Distributions to shareholders from: Net investment income: Class A | (2,009,714) | (2,276,718) | |
| Class B | (19,752) | (23,854) | |
Net realized gains: Class A | (11,463,123) | (14,473,682) | |
| Class B | (148,543) | (187,911) | |
| Total distributions | (13,641,132) | (16,962,165) | |
Fund share transactions: Class A Proceeds from shares sold | 3,139,369 | 5,821,528 | |
| Reinvestment of distributions | 13,472,837 | 16,750,400 | |
| Payments for shares redeemed | (12,780,236) | (34,089,364) | |
| Net increase (decrease) in net assets from Class A share transactions | 3,831,970 | (11,517,436) | |
Class B Proceeds from shares sold | 189,508 | 189,791 | |
| Reinvestment of distributions | 168,295 | 211,765 | |
| Payments for shares redeemed | (158,500) | (396,205) | |
| Net increase (decrease) in net assets from Class B share transactions | 199,303 | 5,351 | |
| Increase (decrease) in net assets | 4,164,169 | (13,262,732) | |
| Net assets at beginning of period | 164,863,487 | 178,126,219 | |
| Net assets at end of period (including undistributed net investment income of $1,173,486 and $2,050,752, respectively) | $ 169,027,656 | $ 164,863,487 | |
| Other Information | |
Class A Shares outstanding at beginning of period | 12,373,665 | 13,252,114 | |
| Shares sold | 232,428 | 461,980 | |
| Shares issued to shareholders in reinvestment of distributions | 1,047,654 | 1,400,535 | |
| Shares redeemed | (951,139) | (2,740,964) | |
| Net increase (decrease) in Class A shares | 328,943 | (878,449) | |
| Shares outstanding at end of period | 12,702,608 | 12,373,665 | |
Class B Shares outstanding at beginning of period | 155,615 | 154,548 | |
| Shares sold | 14,365 | 15,369 | |
| Shares issued to shareholders in reinvestment of distributions | 13,087 | 17,691 | |
| Shares redeemed | (11,858) | (31,993) | |
| Net increase (decrease) in Class B shares | 15,594 | 1,067 | |
| Shares outstanding at end of period | 171,209 | 155,615 | |
The accompanying notes are an integral part of the financial statements.
Financial Highlights
| Class A | Six Months Ended 6/30/17 (Unaudited) |
Years Ended December 31, |
| 2016 | 2015 | 2014 | 2013 | 2012 |
| Selected Per Share Data |
| Net asset value, beginning of period | $ 13.16 | $ 13.29 | $ 12.76 | $ 11.54 | $ 8.53 | $ 7.46 |
Income (loss) from investment operations: Net investment incomea | .09 | .17 | .15 | .10 | .12 | .15 |
| Net realized and unrealized gain (loss) | 1.01 | 1.09 | .52 | 1.25 | 3.03 | 1.03 |
| Total from investment operations | 1.10 | 1.26 | .67 | 1.35 | 3.15 | 1.18 |
Less distributions from: Net investment income | (.17) | (.19) | (.11) | (.13) | (.14) | (.11) |
| Net realized gains | (.96) | (1.20) | (.03) | — | — | — |
| Total distributions | (1.13) | (1.39) | (.14) | (.13) | (.14) | (.11) |
| Net asset value, end of period | $ 13.13 | $ 13.16 | $ 13.29 | $ 12.76 | $ 11.54 | $ 8.53 |
| Total Return (%) | 8.54** | 10.48 | 5.25 | 11.82 | 37.33 | 15.81 |
| Ratios to Average Net Assets and Supplemental Data |
| Net assets, end of period ($ millions) | 167 | 163 | 176 | 220 | 223 | 180 |
| Ratio of expenses (%) | .57* | .57 | .56 | .57 | .56 | .59 |
| Ratio of net investment income (%)b | 1.38* | 1.34 | 1.11 | .86 | 1.20 | 1.90 |
| Portfolio turnover rate (%) | 17** | 43 | 27 | 48 | 238 | 307 |
a Based on average shares outstanding during the period. b Expense ratio does not reflect charges and fees associated with the separate account that invests in the Fund or any variable life insurance policy or variable annuity contract for which the Fund is an investment option. * Annualized ** Not annualized |
| | | | | | | | |
| Class B | Six Months Ended 6/30/17 (Unaudited) |
Years Ended December 31, |
| 2016 | 2015 | 2014 | 2013 | 2012 |
| Selected Per Share Data |
| Net asset value, beginning of period | $ 13.14 | $ 13.26 | $ 12.74 | $ 11.53 | $ 8.51 | $ 7.45 |
Income (loss) from investment operations: Net investment incomea | .07 | .13 | .11 | .07 | .10 | .11 |
| Net realized and unrealized gain (loss) | 1.01 | 1.10 | .52 | 1.24 | 3.03 | 1.03 |
| Total from investment operations | 1.08 | 1.23 | .63 | 1.31 | 3.13 | 1.14 |
Less distributions from: Net investment income | (.13) | (.15) | (.08) | (.10) | (.11) | (.08) |
| Net realized gains | (.96) | (1.20) | (.03) | — | — | — |
| Total distributions | (1.09) | (1.35) | (.11) | (.10) | (.11) | (.08) |
| Net asset value, end of period | $ 13.13 | $ 13.14 | $ 13.26 | $ 12.74 | $ 11.53 | $ 8.51 |
| Total Return (%) | 8.38** | 10.25 | 4.91 | 11.52 | 37.10 | 15.41 |
| Ratios to Average Net Assets and Supplemental Data |
| Net assets, end of period ($ millions) | 2 | 2 | 2 | 2 | 2 | 2 |
| Ratio of expenses (%) | .85* | .86 | .83 | .82 | .76 | .90 |
| Ratio of net investment income (%)b | 1.10* | 1.06 | .84 | .60 | 1.00 | 1.41 |
| Portfolio turnover rate (%) | 17** | 43 | 27 | 48 | 238 | 307 |
a Based on average shares outstanding during the period. b Expense ratio does not reflect charges and fees associated with the separate account that invests in the Fund or any variable life insurance policy or variable annuity contract for which the Fund is an investment option. * Annualized ** Not annualized |
| | | | | | | | |
Notes to Financial Statements (Unaudited)
A. Organization and Significant Accounting Policies
Deutsche Variable Series I (the "Trust") is registered under the Investment Company Act of 1940, as amended (the "1940 Act"), as an open-end, registered management investment company organized as a Massachusetts business trust. The Trust consists of five diversified funds: Deutsche Bond VIP, Deutsche Capital Growth VIP, Deutsche Core Equity VIP, Deutsche CROCI® International VIP and Deutsche Global Small Cap VIP (individually or collectively hereinafter referred to as a "Fund" or the "Funds"). These financial statements report on Deutsche Core Equity VIP. The Trust is intended to be the underlying investment vehicle for variable annuity contracts and variable life insurance policies to be offered by the separate accounts of certain life insurance companies ("Participating Insurance Companies").
Multiple Classes of Shares of Beneficial Interest. The Fund offers two classes of shares (Class A shares and Class B shares). Class B shares are subject to Rule 12b-1 distribution fees under the 1940 Act and recordkeeping fees equal to an annual rate of 0.25% and up to 0.15%, respectively, of the average daily net assets of the Class B shares of the Fund. Class A shares are not subject to such fees.
Investment income, realized and unrealized gains and losses, and certain fund-level expenses and expense reductions, if any, are borne pro rata on the basis of relative net assets by the holders of all classes of shares, except that each class bears certain expenses unique to that class (including the applicable 12b-1 distribution fees and recordkeeping fees). Differences in class-level expenses may result in payment of different per share dividends by class. All shares have equal rights with respect to voting subject to class-specific arrangements.
The Fund's financial statements are prepared in accordance with accounting principles generally accepted in the United States of America ("U.S. GAAP") which require the use of management estimates. Actual results could differ from those estimates. The Fund qualifies as an investment company under Topic 946 of Accounting Standards Codification of U.S. GAAP. The policies described below are followed consistently by the Fund in the preparation of its financial statements.
Security Valuation. Investments are stated at value determined as of the close of regular trading on the New York Stock Exchange on each day the exchange is open for trading.
Various inputs are used in determining the value of the Fund's investments. These inputs are summarized in three broad levels. Level 1 includes quoted prices in active markets for identical securities. Level 2 includes other significant observable inputs (including quoted prices for similar securities, interest rates, prepayment speeds and credit risk). Level 3 includes significant unobservable inputs (including the Fund's own assumptions in determining the fair value of investments). The level assigned to the securities valuations may not be an indication of the risk or liquidity associated with investing in those securities.
Equity securities are valued at the most recent sale price or official closing price reported on the exchange (U.S. or foreign) or over-the-counter market on which they trade. Securities for which no sales are reported are valued at the calculated mean between the most recent bid and asked quotations on the relevant market or, if a mean cannot be determined, at the most recent bid quotation. Equity securities are generally categorized as Level 1.
Investments in open-end investment companies are valued at their net asset value each business day and are categorized as Level 1.
Debt securities are valued at prices supplied by independent pricing services approved by the Fund's Board. Such services may use various pricing techniques which take into account appropriate factors such as yield, quality, coupon rate, maturity, type of issue, trading characteristics, prepayment speeds and other data, as well as broker quotes. If the pricing services are unable to provide valuations, debt securities are valued at the average of the most recent reliable bid quotations or evaluated prices, as applicable, obtained from broker-dealers. These securities are generally categorized as Level 2.
Securities and other assets for which market quotations are not readily available or for which the above valuation procedures are deemed not to reflect fair value are valued in a manner that is intended to reflect their fair value as determined in accordance with procedures approved by the Trustees and are generally categorized as Level 3. In accordance with the Fund's valuation procedures, factors used in determining value may include, but are not limited to, the type of the security; the size of the holding; the initial cost of the security; the existence of any contractual restrictions on the security's disposition; the price and extent of public trading in similar securities of the issuer or of comparable companies; quotations or evaluated prices from broker-dealers and/or pricing services; information obtained from the issuer, analysts, and/or the appropriate stock exchange (for exchange-traded securities); an analysis of the company's or issuer's financial statements; an evaluation of the forces that influence the issuer and the market(s) in which the security is purchased and sold; and with respect to debt securities, the maturity, coupon, creditworthiness, currency denomination and the movement of the market in which the security is normally traded. The value determined under these procedures may differ from published values for the same securities.
Disclosure about the classification of fair value measurements is included in a table following the Fund's Investment Portfolio.
Securities Lending. Deutsche Bank AG, as lending agent, lends securities of the Fund to certain financial institutions under the terms of its securities lending agreement. During the term of the loans, the Fund continues to receive interest and dividends generated by the securities and to participate in any changes in their market value. The Fund requires the borrowers of the securities to maintain collateral with the Fund consisting of either cash or liquid, unencumbered assets having a value at least equal to the value of the securities loaned. When the collateral falls below specified amounts, the lending agent will use its best effort to obtain additional collateral on the next business day to meet required amounts under the securities lending agreement. As of period end, any securities on loan were collateralized by cash. During the six months ended June 30, 2017, the Fund invested the cash collateral into a joint trading account in affiliated money market funds managed by Deutsche Investment Management Americas Inc. As of June 30, 2017, the Fund invested the cash collateral in Deutsche Government & Agency Securities Portfolio. Deutsche Investment Management Americas Inc. receives a management/administration fee (0.13% annualized effective rate as of June 30, 2017) on the cash collateral invested in Deutsche Government & Agency Securities Portfolio. The Fund receives compensation for lending its securities either in the form of fees or by earning interest on invested cash collateral net of borrower rebates and fees paid to a lending agent. Either the Fund or the borrower may terminate the loan at any time and the borrower, after notice, is required to return borrowed securities within a standard time period. There may be risks of delay and costs in recovery of securities or even loss of rights in the collateral should the borrower of the securities fail financially. If the Fund is not able to recover securities lent, the Fund may sell the collateral and purchase a replacement investment in the market, incurring the risk that the value of the replacement security is greater than the value of the collateral. The Fund is also subject to all investment risks associated with the reinvestment of any cash collateral received, including, but not limited to, interest rate, credit and liquidity risk associated with such investments.
As of June 30, 2017, the Fund had securities on loan, which were classified as common stock in the Investment Portfolio. The value of the related collateral exceeded the value of the securities loaned at period end. As of period end, the remaining contractual maturity of the collateral agreements were overnight and continuous.
Foreign Currency Translations. The books and records of the Fund are maintained in U.S. dollars. Investment securities and other assets and liabilities denominated in a foreign currency are translated into U.S. dollars at the prevailing exchange rates at period end. Purchases and sales of investment securities, income and expenses are translated into U.S. dollars at the prevailing exchange rates on the respective dates of the transactions.
Net realized and unrealized gains and losses on foreign currency transactions represent net gains and losses between trade and settlement dates on securities transactions, the acquisition and disposition of foreign currencies, and the difference between the amount of net investment income accrued and the U.S. dollar amount actually received. The portion of both realized and unrealized gains and losses on investments that results from fluctuations in foreign currency exchange rates is not separately disclosed but is included with net realized and unrealized gain/appreciation and loss/depreciation on investments.
Federal Income Taxes. The Fund is treated as a separate taxpayer as provided for in the Internal Revenue Code, as amended. It is the Fund's policy to comply with the requirements of the Internal Revenue Code, as amended, which are applicable to regulated investment companies, and to distribute all of its taxable income to the separate accounts of the Participating Insurance Companies which hold its shares.
The Fund has reviewed the tax positions for the open tax years as of December 31, 2016 and has determined that no provision for income tax and/or uncertain tax provisions is required in the Fund's financial statements. The Fund's federal tax returns for the prior three fiscal years remain open subject to examination by the Internal Revenue Service.
Distribution of Income and Gains. Distributions from net investment income of the Fund, if any, are declared and distributed to shareholders annually. Net realized gains from investment transactions, in excess of available capital loss carryforwards, would be taxable to the Fund if not distributed, and, therefore, will be distributed to shareholders at least annually. The Fund may also make additional distributions for tax purposes if necessary.
The timing and characterization of certain income and capital gain distributions are determined annually in accordance with federal tax regulations which may differ from accounting principles generally accepted in the United States of America. These differences primarily relate to certain securities sold at a loss. As a result, net investment income (loss) and net realized gain (loss) on investment transactions for a reporting period may differ significantly from distributions during such period. Accordingly, the Fund may periodically make reclassifications among certain of its capital accounts without impacting the net asset value of the Fund.
The tax character of current year distributions will be determined at the end of the current fiscal year.
Expenses. Expenses of the Trust arising in connection with a specific Fund are allocated to that Fund. Other Trust expenses which cannot be directly attributed to a Fund are apportioned among the Funds in the Trust based upon the relative net assets or other appropriate measures.
Contingencies. In the normal course of business, the Fund may enter into contracts with service providers that contain general indemnification clauses. The Fund's maximum exposure under these arrangements is unknown, as this would involve future claims that may be made against the Fund that have not yet been made. However, based on experience, the Fund expects the risk of loss to be remote.
Other. Investment transactions are accounted for on a trade date plus one basis for daily net asset value calculations. However, for financial reporting purposes, investment transactions are reported on trade date. Interest income is recorded on the accrual basis. Dividend income is recorded on the ex-dividend date net of foreign withholding taxes. Realized gains and losses from investment transactions are recorded on an identified cost basis. Proceeds from litigation payments, if any, are included in net realized gain (loss) from investments.
B. Purchases and Sales of Securities
During the six months ended June 30, 2017, purchases and sales of investment securities (excluding short-term investments) aggregated $28,025,975 and $34,749,944, respectively.
C. Related Parties
Management Agreement. Under the Investment Management Agreement with Deutsche Investment Management Americas Inc. ("DIMA" or the "Advisor"), an indirect, wholly owned subsidiary of Deutsche Bank AG, the Advisor directs the investments of the Fund in accordance with its investment objectives, policies and restrictions. The Advisor determines the securities, instruments and other contracts relating to investments to be purchased, sold or entered into by the Fund.
Pursuant to the Investment Management Agreement with the Advisor, the Fund pays a monthly management fee based on the Fund's average daily net assets, computed and accrued daily and payable monthly, at the following annual rates:
| First $250 million of average daily net assets | .390% |
| Next $750 million of average daily net assets | .365% |
| Over $1 billion of average daily net assets | .340% |
Accordingly, for the six months ended June 30, 2017, the fee pursuant to the Investment Management Agreement was equivalent to an annualized rate (exclusive of any applicable waivers/reimbursements) of 0.39% of the Fund's average daily net assets.
For the period from January 1, 2017 through September 30, 2017, the Advisor has contractually agreed to waive its fees and/or reimburse certain operating expenses of the Fund to the extent necessary to maintain the total annual operating expenses (excluding certain expenses such as extraordinary expenses, taxes, brokerage and interest) of each class as follows:
Administration Fee. Pursuant to an Administrative Services Agreement, DIMA provides most administrative services to the Fund. For all services provided under the Administrative Services Agreement, the Fund pays the Advisor an annual fee ("Administration Fee") of 0.10% of the Fund's average daily net assets, computed and accrued daily and payable monthly. For the six months ended June 30, 2017, the Administration Fee was $83,564, of which $14,023 is unpaid.
Service Provider Fees. Deutsche AM Service Company ("DSC"), an affiliate of the Advisor, is the transfer agent, dividend-paying agent and shareholder service agent for the Fund. Pursuant to a sub-transfer agency agreement between DSC and DST Systems, Inc. ("DST"), DSC has delegated certain transfer agent, dividend-paying agent and shareholder service agent functions to DST. DSC compensates DST out of the shareholder servicing fee it receives from the Fund. For the six months ended June 30, 2017, the amounts charged to the Fund by DSC were as follows:
| Services to Shareholders | Total Aggregated | Unpaid at June 30, 2017 |
| Class A | $ 302 | $ 144 |
| Class B | 60 | 29 |
| | $ 362 | $ 173 |
Distribution Service Agreement. Deutsche AM Distributors, Inc. ("DDI"), also an affiliate of the Advisor, is the Trust's Distributor. In accordance with the Master Distribution Plan, DDI receives 12b-1 fees of 0.25% of average daily net assets of Class B shares. Pursuant to the Master Distribution Plan, DDI remits these fees to the Participating Insurance Companies for various costs incurred or paid by these companies in connection with marketing and distribution of Class B shares. For the six months ended June 30, 2017, the Distribution Service Fee aggregated $2,664, of which $469 is unpaid.
Typesetting and Filing Service Fees. Under an agreement with DIMA, DIMA is compensated for providing typesetting and certain regulatory filing services to the Fund. For the six months ended June 30, 2017, the amount charged to the Fund by DIMA included in the Statement of Operations under "Reports to shareholders" aggregated $6,005, of which $4,875 is unpaid.
Trustees' Fees and Expenses. The Fund paid retainer fees to each Trustee not affiliated with the Advisor, plus specified amounts to the Board Chairperson and Vice Chairperson and to each committee Chairperson.
Affiliated Cash Management Vehicles. The Fund may invest uninvested cash balances in Deutsche Central Cash Management Government Fund and Deutsche Variable NAV Money Fund, affiliated money market funds which are managed by the Advisor. Each affiliated money market fund is managed in accordance with Rule 2a-7 under the 1940 Act, which governs the quality, maturity, diversity and liquidity of instruments in which a money market fund may invest. Deutsche Central Cash Management Government Fund seeks to maintain a stable net asset value, and Deutsche Variable NAV Money Fund maintains a floating net asset value. The Fund indirectly bears its proportionate share of the expenses of each affiliated money market fund in which it invests. Deutsche Central Cash Management Government Fund does not pay the Advisor an investment management fee. To the extent that Deutsche Variable NAV Money Fund pays an investment management fee to the Advisor, the Advisor will waive an amount of the investment management fee payable to the Advisor by the Fund equal to the amount of the investment management fee payable on the Fund's assets invested in Deutsche Variable NAV Money Fund.
Security Lending Fees. Deutsche Bank AG serves as securities lending agent for the Fund. For the six months ended June 30, 2017, the Fund incurred lending agent fees to Deutsche Bank AG for the amount of $799.
D. Ownership of the Fund
At June 30, 2017, three participating insurance companies were owners of record of 10% or more of the total outstanding Class A shares of the Fund, each owning 37%, 33% and 10%, respectively. Two participating insurance companies were owners of record of 10% or more of the total outstanding Class B shares of the Fund, each owning 61% and 12%, respectively.
E. Line of Credit
The Fund and other affiliated funds (the "Participants") share in a $400 million revolving credit facility provided by a syndication of banks. The Fund may borrow for temporary or emergency purposes, including the meeting of redemption requests that otherwise might require the untimely disposition of securities. The Participants are charged an annual commitment fee which is allocated based on net assets, among each of the Participants. Interest is calculated at a rate per annum equal to the sum of the Federal Funds Rate plus 1.25 percent plus if the one-month LIBOR exceeds the Federal Funds Rate, the amount of such excess. The Fund may borrow up to a maximum of 33 percent of its net assets under the agreement. The Fund had no outstanding loans at June 30, 2017.
Information About Your Fund's Expenses (Unaudited)
As an investor of the Fund, you incur two types of costs: ongoing expenses and transaction costs. Ongoing expenses include management fees, distribution and service (12b-1) fees and other Fund expenses. Examples of transaction costs include contract charges, which are not shown in this section. The following tables are intended to help you understand your ongoing expenses (in dollars) of investing in the Fund and to help you compare these expenses with the ongoing expenses of investing in other mutual funds. The example in the table is based on an investment of $1,000 invested at the beginning of the six-month period and held for the entire period (January 1, 2017 to June 30, 2017).
The tables illustrate your Fund's expenses in two ways:
— Actual Fund Return. This helps you estimate the actual dollar amount of ongoing expenses (but not transaction costs) paid on a $1,000 investment in the Fund using the Fund's actual return during the period. To estimate the expenses you paid over the period, simply divide your account value by $1,000 (for example, an $8,600 account value divided by $1,000 = 8.6), then multiply the result by the number in the "Expenses Paid per $1,000" line under the share class you hold.
— Hypothetical 5% Fund Return. This helps you to compare your Fund's ongoing expenses (but not transaction costs) with those of other mutual funds using the Fund's actual expense ratio and a hypothetical rate of return of 5% per year before expenses. Examples using a 5% hypothetical Fund return may be found in the shareholder reports of other mutual funds. The hypothetical account values and expenses may not be used to estimate the actual ending account balance or expenses you paid for the period.
Please note that the expenses shown in these tables are meant to highlight your ongoing expenses only and do not reflect any transaction costs. The "Expenses Paid per $1,000" line of the tables is useful in comparing ongoing expenses only and will not help you determine the relative total expense of owning different funds. If these transaction costs had been included, your costs would have been higher.
| Expenses and Value of a $1,000 Investment for the six months ended June 30, 2017 |
| Actual Fund Return | Class A | | Class B | |
| Beginning Account Value 1/1/17 | $ 1,000.00 | | $ 1,000.00 | |
| Ending Account Value 6/30/17 | $ 1,085.40 | | $ 1,083.80 | |
| Expenses Paid per $1,000* | $ 2.95 | | $ 4.39 | |
| Hypothetical 5% Fund Return | Class A | | Class B | |
| Beginning Account Value 1/1/17 | $ 1,000.00 | | $ 1,000.00 | |
| Ending Account Value 6/30/17 | $ 1,021.97 | | $ 1,020.58 | |
| Expenses Paid per $1,000* | $ 2.86 | | $ 4.26 | |
* Expenses are equal to the Fund's annualized expense ratio for each share class, multiplied by the average account value over the period, multiplied by 181 (the number of days in the most recent six-month period), then divided by 365.
| Annualized Expense Ratios | Class A | | Class B | |
| Deutsche Variable Series I — Deutsche Core Equity VIP | .57% | | .85% | |
For more information, please refer to the Fund's prospectus.
These tables do not reflect charges and fees ("contract charges") associated with the separate account that invests in the Fund or any variable life insurance policy or variable annuity contract for which the Fund is an investment option.
For an analysis of the fees associated with an investment in the fund or similar funds, please refer to the current and hypothetical expense calculators for Variable Insurance Products which can be found at deutschefunds.com/EN/resources/calculators.jsp.
Proxy Voting
The Trust's policies and procedures for voting proxies for portfolio securities and information about how the Trust voted proxies related to its portfolio securities during the most recent 12-month period ended June 30 are available on our Web site — deutschefunds.com (click on "proxy voting"at the bottom of the page) — or on the SEC's Web site — sec.gov. To obtain a written copy of the Trust's policies and procedures without charge, upon request, call us toll free at (800) 728-3337.
Advisory Agreement Board Considerations and Fee Evaluation
The Board of Trustees (hereinafter referred to as the "Board" or "Trustees") approved the renewal of Deutsche Core Equity VIP’s (the "Fund") investment management agreement (the "Agreement") with Deutsche Investment Management Americas Inc. ("DIMA") in September 2016.
In terms of the process that the Board followed prior to approving the Agreement, shareholders should know that:
— During the entire process, all of the Fund’s Trustees were independent of DIMA and its affiliates (the "Independent Trustees").
— The Board met frequently during the past year to discuss fund matters and dedicated a substantial amount of time to contract review matters. Over the course of several months, the Board’s Contract Committee reviewed extensive materials received from DIMA, independent third parties and independent counsel. These materials included an analysis of the Fund’s performance, fees and expenses, and profitability from a fee consultant retained by the Fund’s Independent Trustees (the "Fee Consultant"). The Board also received extensive information throughout the year regarding performance of the Fund.
— The Independent Trustees regularly meet privately with counsel to discuss contract review and other matters. In addition, the Independent Trustees were advised by the Fee Consultant in the course of their review of the Fund’s contractual arrangements and considered a comprehensive report prepared by the Fee Consultant in connection with their deliberations.
— In connection with reviewing the Agreement, the Board also reviewed the terms of the Fund’s Rule 12b-1 plan, distribution agreement, administrative services agreement, transfer agency agreement and other material service agreements.
— Based on its evaluation of the information provided, the Contract Committee presented its findings and recommendations to the Board. The Board then reviewed the Contract Committee’s findings and recommendations.
In connection with the contract review process, the Contract Committee and the Board considered the factors discussed below, among others. The Board also considered that DIMA and its predecessors have managed the Fund since its inception, and the Board believes that a long-term relationship with a capable, conscientious advisor is in the best interests of the Fund. The Board considered, generally, that shareholders chose to invest or remain invested in the Fund knowing that DIMA managed the Fund, and that the Agreement was approved by the Fund’s shareholders. DIMA is part of Deutsche Bank AG’s ("Deutsche Bank") Asset Management ("Deutsche AM") division. Deutsche AM is a global asset management business that offers a wide range of investing expertise and resources, including research capabilities in many countries throughout the world. Deutsche Bank has advised the Board that the U.S. asset management business continues to be a critical and integral part of Deutsche Bank, and that Deutsche Bank will continue to invest in Deutsche AM and seek to enhance Deutsche AM’s investment platform. Deutsche Bank also has confirmed its commitment to maintaining strong legal and compliance groups within the Deutsche AM division.
As part of the contract review process, the Board carefully considered the fees and expenses of each Deutsche fund overseen by the Board in light of the fund’s performance. In many cases, this led to the negotiation and implementation of expense caps. As part of these negotiations, the Board indicated that it would consider relaxing these caps in future years following sustained improvements in performance, among other considerations.
While shareholders may focus primarily on fund performance and fees, the Fund’s Board considers these and many other factors, including the quality and integrity of DIMA’s personnel and such other issues as back-office operations, fund valuations, and compliance policies and procedures.
Nature, Quality and Extent of Services. The Board considered the terms of the Agreement, including the scope of advisory services provided under the Agreement. The Board noted that, under the Agreement, DIMA provides portfolio management services to the Fund and that, pursuant to a separate administrative services agreement, DIMA provides administrative services to the Fund. The Board considered the experience and skills of senior management and investment personnel and the resources made available to such personnel. The Board reviewed the Fund’s performance over short-term and long-term periods and compared those returns to various agreed-upon performance measures, including market index(es) and a peer universe compiled using information supplied by Morningstar Direct ("Morningstar"), an independent fund data service. The Board also noted that it has put into place a process of identifying "Focus Funds" (e.g., funds performing poorly relative to a peer universe), and receives additional reporting from DIMA regarding such funds and, where appropriate, DIMA’s plans to address underperformance. The Board believes this process is an effective manner of identifying and addressing underperforming funds. Based on the information provided, the Board noted that for the one-, three- and five-year periods ended December 31, 2015, the Fund’s performance (Class A shares) was in the 1st quartile of the applicable Morningstar universe (the 1st quartile being the best performers and the 4th quartile being the worst performers). The Board also observed that the Fund has outperformed its benchmark in the one-, three- and five-year periods ended December 31, 2015.
Fees and Expenses. The Board considered the Fund’s investment management fee schedule, operating expenses and total expense ratios, and comparative information provided by Broadridge Financial Solutions, Inc. ("Broadridge") and the Fee Consultant regarding investment management fee rates paid to other investment advisors by similar funds (1st quartile being the most favorable and 4th quartile being the least favorable). With respect to management fees paid to other investment advisors by similar funds, the Board noted that the contractual fee rates paid by the Fund, which include a 0.10% fee paid to DIMA under the Fund’s administrative services agreement, were lower than the median (1st quartile) of the applicable Broadridge peer group (based on Broadridge data provided as of December 31, 2015). The Board noted that the Fund’s Class A shares total (net) operating expenses were expected to be lower than the median (1st quartile) of the applicable Broadridge expense universe (based on Broadridge data provided as of December 31, 2015, and analyzing Broadridge expense universe Class A (net) expenses less any applicable 12b-1 fees) ("Broadridge Universe Expenses"). The Board also reviewed data comparing each share class’s total (net) operating expenses to the applicable Broadridge Universe Expenses. The Board noted that the expense limitations agreed to by DIMA were expected to help the Fund’s total (net) operating expenses remain competitive. The Board considered the Fund’s management fee rate as compared to fees charged by DIMA to a comparable Deutsche U.S. registered fund ("Deutsche Funds") and considered differences between the Fund and the comparable Deutsche Fund. The information requested by the Board as part of its review of fees and expenses also included information about institutional accounts (including any sub-advised funds and accounts) and funds offered primarily to European investors ("Deutsche Europe funds") managed by Deutsche AM. The Board noted that DIMA indicated that Deutsche AM does not manage any institutional accounts or Deutsche Europe funds comparable to the Fund.
On the basis of the information provided, the Board concluded that management fees were reasonable and appropriate in light of the nature, quality and extent of services provided by DIMA.
Profitability. The Board reviewed detailed information regarding revenues received by DIMA under the Agreement. The Board considered the estimated costs and pre-tax profits realized by DIMA from advising the Deutsche Funds, as well as estimates of the pre-tax profits attributable to managing the Fund in particular. The Board also received information regarding the estimated enterprise-wide profitability of DIMA and its affiliates with respect to all fund services in totality and by fund. The Board and the Fee Consultant reviewed DIMA’s methodology in allocating its costs to the management of the Fund. Based on the information provided, the Board concluded that the pre-tax profits realized by DIMA in connection with the management of the Fund were not unreasonable. The Board also reviewed certain publicly available information regarding the profitability of certain similar investment management firms. The Board noted that while information regarding the profitability of such firms is limited (and in some cases is not necessarily prepared on a comparable basis), DIMA and its affiliates’ overall profitability with respect to the Deutsche Funds (after taking into account distribution and other services provided to the funds by DIMA and its affiliates) was lower than the overall profitability levels of most comparable firms for which such data was available.
Economies of Scale. The Board considered whether there are economies of scale with respect to the management of the Fund and whether the Fund benefits from any economies of scale. The Board noted that the Fund’s investment management fee schedule includes fee breakpoints. The Board concluded that the Fund’s fee schedule represents an appropriate sharing between the Fund and DIMA of such economies of scale as may exist in the management of the Fund at current asset levels.
Other Benefits to DIMA and Its Affiliates. The Board also considered the character and amount of other incidental benefits received by DIMA and its affiliates, including any fees received by DIMA for administrative services provided to the Fund and any fees received by an affiliate of DIMA for distribution services. The Board also considered benefits to DIMA related to brokerage and soft-dollar allocations, including allocating brokerage to pay for research generated by parties other than the executing broker dealers, which pertain primarily to funds investing in equity securities, along with the incidental public relations benefits to DIMA related to Deutsche Funds advertising and cross-selling opportunities among DIMA products and services. The Board considered these benefits in reaching its conclusion that the Fund’s management fees were reasonable.
Compliance. The Board considered the significant attention and resources dedicated by DIMA to documenting and enhancing its compliance processes in recent years. The Board noted in particular (i) the experience, seniority and time commitment of the individuals serving as DIMA’s and the Fund’s chief compliance officers; (ii) the large number of DIMA compliance personnel; and (iii) the substantial commitment of resources by DIMA and its affiliates to compliance matters.
Based on all of the information considered and the conclusions reached, the Board unanimously determined that the continuation of the Agreement is in the best interests of the Fund. In making this determination, the Board did not give particular weight to any single factor identified above. The Board considered these factors over the course of numerous meetings, certain of which were in executive session with only the Independent Trustees and counsel present. It is possible that individual Independent Trustees may have weighed these factors differently in reaching their individual decisions to approve the continuation of the Agreement.
Notes

VS1coreq-3 (R-028376-6 8/17)

June 30, 2017
Semiannual Report
Deutsche Variable Series I
Deutsche CROCI® International VIP

Contents
3 Performance Summary 4 Portfolio Summary 4 Portfolio Management Team 5 Investment Portfolio 8 Statement of Assets and Liabilities 9 Statement of Operations 9 Statements of Changes in Net Assets 11 Financial Highlights 12 Notes to Financial Statements 18 Information About Your Fund's Expenses 19 Proxy Voting 20 Advisory Agreement Board Considerations and Fee Evaluation |
This report must be preceded or accompanied by a prospectus. To obtain an additional prospectus or summary prospectus, if available, call (800) 728-3337 or your financial representative. We advise you to consider the Fund's objectives, risks, charges and expenses carefully before investing. The summary prospectus and prospectus contain this and other important information about the Fund. Please read the prospectus carefully before you invest.
Investing in foreign securities, particularly those of emerging markets, presents certain risks, such as currency fluctuations, political and economic changes, and market risks. Emerging markets tend to be more volatile and less liquid than the markets of more mature economies, and generally have less diverse and less mature economic structures and less stable political systems than those of developed countries. Stocks may decline in value. The Fund will be managed on the premise that stocks with lower CROCI® Economic P/E Ratios may outperform stocks with higher CROCI® Economic P/E Ratios over time. This premise may not always be correct and prospective investors should evaluate this assumption prior to investing in the Fund. Investing in derivatives entails special risks relating to liquidity, leverage and credit that may reduce returns and/or increase volatility. The Fund may lend securities to approved institutions. See the prospectus for details.
In June 2016, citizens of the United Kingdom voted that the United Kingdom should leave the European Union and in March 2017, the United Kingdom initiated its withdrawal from the European Union, which is expected to take place by March 2019. Significant uncertainty exists regarding the timing and terms of the United Kingdom's anticipated withdrawal from the European Union and the effects such withdrawal may have on the United Kingdom, other European countries and the global economy.
Deutsche Asset Management represents the asset management activities conducted by Deutsche Bank AG or any of its subsidiaries.
Deutsche AM Distributors, Inc., 222 South Riverside Plaza, Chicago, IL 60606, (800) 621-1148
NOT FDIC/NCUA INSURED NO BANK GUARANTEE MAY LOSE VALUE NOT A DEPOSIT
NOT INSURED BY ANY FEDERAL GOVERNMENT AGENCY
Performance Summary June 30, 2017 (Unaudited)
Fund performance shown is historical, assumes reinvestment of all dividend and capital gain distributions, and does not guarantee future results. Investment return and principal value fluctuate with changing market conditions so that, when redeemed, shares may be worth more or less than their original cost. Current performance may be lower or higher than the performance data quoted. Please contact your participating insurance company for the Fund's most recent month-end performance. Performance doesn't reflect charges and fees ("contract charges") associated with the separate account that invests in the Fund or any variable life insurance policy or variable annuity contract for which the Fund is an investment option. These charges and fees will reduce returns. While all share classes have the same underlying portfolio, their performance will differ.
The gross expense ratios of the Fund, as stated in the fee table of the prospectus dated May 1, 2017 are 1.12% and 1.40% for Class A and Class B shares, respectively, and may differ from the expense ratios disclosed in the Financial Highlights tables in this report.
Generally accepted accounting principles require adjustments to be made to the net assets of the Fund at period end for financial reporting purposes only, and as such, the total return based on the unadjusted net asset value per share may differ from the total return reported in the financial highlights.
| Growth of an Assumed $10,000 Investment |
■ Deutsche CROCI® International VIP — Class A ■ MSCI EAFE® Index | MSCI EAFE Index is an equity index which captures large and mid cap representation across developed markets countries around the world, excluding the US and Canada. Index returns do not reflect any fees or expenses and it is not possible to invest directly into an index. |
 | |
| Yearly periods ended June 30 | |
| Comparative Results |
| Deutsche CROCI® International VIP | 6-Month‡ | 1-Year | 3-Year | 5-Year | 10-Year |
| Class A | Growth of $10,000 | $11,465 | $12,530 | $9,450 | $13,264 | $8,510 |
| Average annual total return | 14.65% | 25.30% | –1.87% | 5.81% | –1.60% |
| MSCI EAFE® Index | Growth of $10,000 | $11,381 | $12,027 | $10,348 | $15,169 | $11,074 |
| Average annual total return | 13.81% | 20.27% | 1.15% | 8.69% | 1.03% |
| Deutsche CROCI® International VIP | 6-Month‡ | 1-Year | 3-Year | 5-Year | 10-Year |
| Class B | Growth of $10,000 | $11,448 | $12,510 | $9,381 | $13,103 | $8,287 |
| Average annual total return | 14.48% | 25.10% | –2.11% | 5.55% | –1.86% |
| MSCI EAFE® Index | Growth of $10,000 | $11,381 | $12,027 | $10,348 | $15,169 | $11,074 |
| Average annual total return | 13.81% | 20.27% | 1.15% | 8.69% | 1.03% |
The growth of $10,000 is cumulative.
‡ Total returns shown for periods less than one year are not annualized.
Portfolio Summary (Unaudited)
| Asset Allocation (As a % of Investment Portfolio) | 6/30/17 | 12/31/16 |
| | | |
| Common Stocks | 95% | 94% |
| Cash Equivalents | 3% | 6% |
| Preferred Stock | 2% | — |
| | 100% | 100% |
Geographical Diversification
(As a % of Investment Portfolio excluding Cash Equivalents) | 6/30/17 | 12/31/16 |
| | | |
| Japan | 24% | 23% |
| United Kingdom | 19% | 27% |
| Switzerland | 17% | 19% |
| Germany | 12% | 8% |
| France | 10% | 6% |
| Hong Kong | 8% | 7% |
| Singapore | 4% | 4% |
| Spain | 2% | 4% |
| Finland | 2% | — |
| Netherlands | 2% | 2% |
| Austria | 0% | — |
| | 100% | 100% |
Sector Diversification
(As a % of Investment Portfolio excluding Cash Equivalents) | 6/30/17 | 12/31/16 |
| | | |
| Industrials | 26% | 28% |
| Consumer Staples | 18% | 11% |
| Health Care | 18% | 17% |
| Consumer Discretionary | 18% | 23% |
| Utilities | 14% | 17% |
| Materials | 6% | 4% |
| Real Estate | 0% | — |
| | 100% | 100% |
Portfolio holdings and characteristics are subject to change.
For more complete details about the Fund's investment portfolio, see page 5.
Following the Fund's fiscal first and third quarter-end, a complete portfolio holdings listing is filed with the SEC on Form N-Q. The form will be available on the SEC's Web site at sec.gov, and it also may be reviewed and copied at the SEC's Public Reference Room in Washington, D.C. Information on the operation of the SEC's Public Reference Room may be obtained by calling (800) SEC-0330. The Fund's portfolio holdings are also posted on deutschefunds.com from time to time. Please see the Fund's current prospectus for more information.
Portfolio Management Team
Di Kumble, CFA, Managing Director
John Moody, Vice President
Portfolio Managers
Investment Portfolio June 30, 2017 (Unaudited)
| |
Shares | Value ($) |
| | | |
| Common Stocks 94.8% |
| Austria 0.0% |
| Immofinanz AG* (Cost $0) | 6,693 | 15,296 |
| Finland 2.1% |
| Fortum Oyj (Cost $2,014,445) | 136,218 | 2,136,132 |
| France 10.0% |
| Cie Generale des Etablissements Michelin | 15,412 | 2,048,967 |
| Danone SA | 28,526 | 2,144,153 |
| L'Oreal SA | 9,804 | 2,042,449 |
| Pernod Ricard SA | 15,874 | 2,125,799 |
| Sanofi | 21,395 | 2,046,784 |
| (Cost $9,528,754) | 10,408,152 |
| Germany 9.6% |
| Bayer AG (Registered) | 16,278 | 2,104,605 |
| Beiersdorf AG | 19,930 | 2,095,110 |
| Continental AG | 8,974 | 1,936,672 |
| Merck KGaA | 16,822 | 2,031,800 |
| Siemens AG (Registered) | 13,729 | 1,887,157 |
| (Cost $8,882,821) | 10,055,344 |
| Hong Kong 7.7% |
| CLP Holdings Ltd. | 188,149 | 1,990,548 |
| HK Electric Investments & HK Electric Investments Ltd. "SS", 144A, (Units) | 2,266,500 | 2,090,158 |
| Hong Kong & China Gas Co., Ltd. | 1,098,632 | 2,065,709 |
| MTR Corp., Ltd. | 343,731 | 1,934,944 |
| (Cost $6,775,771) | 8,081,359 |
| Japan 23.3% |
| ANA Holdings, Inc. | 662,000 | 2,297,798 |
| Astellas Pharma, Inc. | 146,000 | 1,784,192 |
| Bridgestone Corp. | 47,608 | 2,048,657 |
| Central Japan Railway Co. | 11,600 | 1,888,384 |
| Daiichi Sankyo Co., Ltd. | 90,200 | 2,122,778 |
| ITOCHU Corp. | 141,100 | 2,093,762 |
| Osaka Gas Co., Ltd. | 532,000 | 2,173,407 |
| Secom Co., Ltd. | 27,500 | 2,084,352 |
| Sekisui House Ltd. | 120,400 | 2,118,976 |
| Subaru Corp. | 51,700 | 1,740,264 |
| Sumitomo Electric Industries Ltd. | 122,100 | 1,878,044 |
| Toyota Industries Corp. | 39,935 | 2,098,385 |
| (Cost $22,666,144) | 24,328,999 |
| Netherlands 1.9% |
| Koninklijke DSM NV (Cost $1,824,250) | 27,804 | 2,020,973 |
| |
Shares | Value ($) |
| | | |
| Singapore 3.7% |
| Keppel Corp., Ltd. | 421,916 | 1,927,621 |
| Singapore Airlines Ltd. | 268,341 | 1,972,479 |
| (Cost $4,334,733) | 3,900,100 |
| Spain 2.1% |
| Iberdrola SA (Cost $1,922,018) | 276,860 | 2,192,322 |
| Switzerland 15.8% |
| ABB Ltd. (Registered) | 81,504 | 2,012,738 |
| Givaudan SA (Registered) | 1,018 | 2,036,212 |
| Kuehne + Nagel International AG (Registered) | 13,190 | 2,200,855 |
| Nestle SA (Registered) | 25,543 | 2,222,926 |
| Novartis AG (Registered) | 25,794 | 2,146,586 |
| Roche Holding AG (Genusschein) | 7,601 | 1,935,722 |
| Schindler Holding AG | 9,701 | 2,052,699 |
| Wolseley PLC | 31,359 | 1,924,955 |
| (Cost $14,963,084) | 16,532,693 |
| United Kingdom 18.6% |
| British American Tobacco PLC | 29,394 | 2,003,795 |
| Bunzl PLC | 64,487 | 1,921,716 |
| Diageo PLC | 68,646 | 2,028,220 |
| GlaxoSmithKline PLC | 99,914 | 2,128,325 |
| Imperial Brands PLC | 40,255 | 1,808,052 |
| Johnson Matthey PLC | 52,205 | 1,952,119 |
| Kingfisher PLC | 466,356 | 1,826,467 |
| National Grid PLC | 140,335 | 1,739,693 |
| Persimmon PLC | 66,231 | 1,934,006 |
| Smith & Nephew PLC | 121,325 | 2,093,761 |
| (Cost $19,239,164) | 19,436,154 |
| Total Common Stocks (Cost $92,151,184) | 99,107,524 |
| |
| Preferred Stock 1.9% |
| Germany |
| Henkel AG & Co. KGaA (Cost $1,776,435) | 14,534 | 2,000,300 |
| |
| Cash Equivalents 2.6% |
| Deutsche Central Cash Management Government Fund, 1.03% (a) (Cost $2,717,888) | 2,717,888 | 2,717,888 |
| | % of Net Assets | Value ($) |
| | |
| Total Investment Portfolio (Cost $96,645,507)† | 99.3 | 103,825,712 |
| Other Assets and Liabilities, Net | 0.7 | 684,203 |
| Net Assets | 100.0 | 104,509,915 |
* Non-income producing security.
† The cost for federal income tax purposes was $97,567,706. At June 30, 2017, net unrealized appreciation for all securities based on tax cost was $6,258,006. This consisted of aggregate gross unrealized appreciation for all securities in which there was an excess of value over tax cost of $9,317,959 and aggregate gross unrealized depreciation for all securities in which there was an excess of tax cost over value of $3,059,953.
(a) Affiliated fund managed by Deutsche Investment Management Americas Inc. The rate shown is the annualized seven-day yield at period end.
144A: Security exempt from registration under Rule 144A of the Securities Act of 1933. These securities may be resold in transactions exempt from registration, normally to qualified institutional buyers.
As of June 30, 2017, the Fund had the following open forward foreign currency exchange contracts:
| Contracts to Deliver | | In Exchange For | | Settlement Date | | Unrealized Appreciation ($) | Counterparty |
| JPY | 2,751,942,949 | | USD | 24,558,117 | | 7/31/2017 | | 57,234 | Citigroup,Inc. |
| | | | | | | | | | |
| Currency Abbreviations |
JPY Japanese Yen USD United States Dollar |
For information on the Fund's policy and additional disclosures regarding forward foreign currency exchange contracts, please refer to the Derivatives section of Note B in the accompanying Notes to Financial Statements.
Fair Value Measurements
Various inputs are used in determining the value of the Fund's investments. These inputs are summarized in three broad levels. Level 1 includes quoted prices in active markets for identical securities. Level 2 includes other significant observable inputs (including quoted prices for similar securities, interest rates, prepayment speeds and credit risk). Level 3 includes significant unobservable inputs (including the Fund's own assumptions in determining the fair value of investments). The level assigned to the securities valuations may not be an indication of the risk or liquidity associated with investing in those securities.
The following is a summary of the inputs used as of June 30, 2017 in valuing the Fund's investments. For information on the Fund's policy regarding the valuation of investments, please refer to the Security Valuation section of Note A in the accompanying Notes to Financial Statements.
| Assets | Level 1 | Level 2 | Level 3 | Total |
| |
| Common Stocks |
| | Austria | $ 15,296 | $ — | $ — | $ 15,296 |
| | Finland | 2,136,132 | — | — | 2,136,132 |
| | France | 10,408,152 | — | — | 10,408,152 |
| | Germany | 10,055,344 | — | — | 10,055,344 |
| | Hong Kong | 8,081,359 | — | — | 8,081,359 |
| | Japan | 24,328,999 | — | — | 24,328,999 |
| | Netherlands | 2,020,973 | — | — | 2,020,973 |
| | Singapore | 3,900,100 | — | — | 3,900,100 |
| | Spain | 2,192,322 | — | — | 2,192,322 |
| | Switzerland | 16,532,693 | — | — | 16,532,693 |
| | United Kingdom | 19,436,154 | — | — | 19,436,154 |
| Preferred Stock | 2,000,300 | — | — | 2,000,300 |
| Short-Term Investments | 2,717,888 | — | — | 2,717,888 |
| Derivatives (b) | | | | |
| | Forward Foreign Currency Exchange Contracts | — | 57,234 | — | 57,234 |
| Total | $ 103,825,712 | $ 57,234 | $ — | $ 103,882,946 |
As a result of the fair valuation model utilized by the Fund, certain international securities transferred from Level 2 to Level 1. During the period ended June 30, 2017, the amount of the transfers between Level 2 and Level 1 was $88,543,680.
Transfers between price levels are recognized at the beginning of the reporting year.
(b) Derivatives include unrealized appreciation (depreciation) on forward foreign currency exchange contracts.
The accompanying notes are an integral part of the financial statements.
Statement of Assets and Liabilities
| as of June 30, 2017 (Unaudited) |
| Assets |
Investments: Investments in non-affiliated securities, at value (cost $93,927,619) | $ 101,107,824 |
| Investment in Deutsche Central Cash Management Government Fund (cost $2,717,888) | 2,717,888 |
| Total investments, at value (cost $96,645,507) | 103,825,712 |
| Foreign currency, at value (cost $176,767) | 178,979 |
| Receivable for Fund shares sold | 8,162 |
| Dividends receivable | 392,267 |
| Interest receivable | 1,787 |
| Unrealized appreciation on forward foreign currency exchange contracts | 57,234 |
| Foreign taxes recoverable | 238,352 |
| Other assets | 1,609 |
| Total assets | 104,704,102 |
| Liabilities |
| Payable for Fund shares redeemed | 61,380 |
| Accrued management fee | 41,994 |
| Accrued Trustees' fees | 452 |
| Other accrued expenses and payables | 90,361 |
| Total liabilities | 194,187 |
| Net assets, at value | $ 104,509,915 |
| Net Assets Consist of |
| Undistributed net investment income | 2,034,968 |
Net unrealized appreciation (depreciation) on: Investments | 7,180,205 |
| Foreign currency | 67,594 |
| Accumulated net realized gain (loss) | (135,634,879) |
| Paid-in capital | 230,862,027 |
| Net assets, at value | $ 104,509,915 |
Class A Net Asset Value, offering and redemption price per share ($104,197,744 ÷ 15,108,794 outstanding shares of beneficial interest, $.01 par value, unlimited number of shares authorized) | $ 6.90 |
Class B Net Asset Value, offering and redemption price per share ($312,171 ÷ 45,123 outstanding shares of beneficial interest, $.01 par value, unlimited number of shares authorized) | $ 6.92 |
The accompanying notes are an integral part of the financial statements.
Statement of Operations
| for the six months ended June 30, 2017 (Unaudited) |
| Investment Income |
Income: Dividends (net of foreign taxes withheld of $176,866) | $ 2,105,731 |
| Income distributions — Deutsche Central Cash Management Government Fund | 5,460 |
| Securities lending income, net of borrower rebates | 12,680 |
| Total income | 2,123,871 |
Expenses: Management fee | 389,593 |
| Administration fee | 49,315 |
| Services to shareholders | 1,376 |
| Distribution service fee (Class B) | 367 |
| Custodian fee | 32,646 |
| Professional fees | 38,456 |
| Reports to shareholders | 17,131 |
| Trustees' fees and expenses | 3,259 |
| Other | 12,513 |
| Total expenses before expense reductions | 544,656 |
| Expense reductions | (130,039) |
| Total expenses after expense reductions | 414,617 |
| Net investment income (loss) | 1,709,254 |
| Realized and Unrealized Gain (Loss) |
Net realized gain (loss) from: Investments | 873,617 |
| Foreign currency | (2,294,610) |
| | (1,420,993) |
Change in net unrealized appreciation (depreciation) on: Investments | 12,589,744 |
| Foreign currency | 518,968 |
| | 13,108,712 |
| Net gain (loss) | 11,687,719 |
| Net increase (decrease) in net assets resulting from operations | $ 13,396,973 |
The accompanying notes are an integral part of the financial statements.
Statements of Changes in Net Assets
| Increase (Decrease) in Net Assets | Six Months Ended June 30, 2017 (Unaudited) | Year Ended December 31, 2016 | |
| |
Operations: Net investment income (loss) | $ 1,709,254 | $ 2,302,440 | |
| Net realized gain (loss) | (1,420,993) | (8,480,561) | |
| Change in net unrealized appreciation (depreciation) | 13,108,712 | 6,340,956 | |
| Net increase (decrease) in net assets resulting from operations | 13,396,973 | 162,835 | |
Distributions to shareholders from: Net investment income: Class A | (7,067,244) | (9,803,744) | |
| Class B | (20,366) | (26,284) | |
| Total distributions | (7,087,610) | (9,830,028) | |
Fund share transactions: Class A Proceeds from shares sold | 3,668,827 | 4,349,614 | |
| Reinvestment of distributions | 7,067,244 | 9,803,744 | |
| Payments for shares redeemed | (6,735,405) | (15,723,948) | |
| Net increase (decrease) in net assets from Class A share transactions | 4,000,666 | (1,570,590) | |
Class B Proceeds from shares sold | 4,571 | 16,738 | |
| Reinvestment of distributions | 20,366 | 26,284 | |
| Payments for shares redeemed | (5,672) | (15,735) | |
| Net increase (decrease) in net assets from Class B share transactions | 19,265 | 27,287 | |
| Increase (decrease) in net assets | 10,329,294 | (11,210,496) | |
| Net assets at beginning of period | 94,180,621 | 105,391,117 | |
| Net assets at end of period (including undistributed net investment income of $2,034,968 and $7,413,324, respectively) | $ 104,509,915 | $ 94,180,621 | |
| Other Information | |
Class A Shares outstanding at beginning of period | 14,512,126 | 14,702,326 | |
| Shares sold | 534,047 | 690,002 | |
| Shares issued to shareholders in reinvestment of distributions | 1,054,813 | 1,563,596 | |
| Shares redeemed | (992,192) | (2,443,798) | |
| Net increase (decrease) in Class A shares | 596,668 | (190,200) | |
| Shares outstanding at end of period | 15,108,794 | 14,512,126 | |
Class B Shares outstanding at beginning of period | 42,251 | 37,903 | |
| Shares sold | 670 | 2,658 | |
| Shares issued to shareholders in reinvestment of distributions | 3,026 | 4,179 | |
| Shares redeemed | (824) | (2,489) | |
| Net increase (decrease) in Class B shares | 2,872 | 4,348 | |
| Shares outstanding at end of period | 45,123 | 42,251 | |
The accompanying notes are an integral part of the financial statements.
Financial Highlights
| Class A | Six Months Ended 6/30/17 (Unaudited) |
Years Ended December 31, |
| 2016 | 2015 | 2014 | 2013 | 2012 |
| Selected Per Share Data |
| Net asset value, beginning of period | $ 6.47 | $ 7.15 | $ 7.86 | $ 9.06 | $ 7.96 | $ 6.74 |
Income (loss) from investment operations: Net investment income (loss)a | .12 | .16 | .21 | .31b | .14 | .22 |
| Net realized and unrealized gain (loss) | .81 | (.13) | (.59) | (1.36) | 1.41 | 1.16 |
| Total from investment operations | .93 | .03 | (.38) | (1.05) | 1.55 | 1.38 |
Less distributions from: Net investment income | (.50) | (.71) | (.33) | (.15) | (.45) | (.16) |
| Net asset value, end of period | $ 6.90 | $ 6.47 | $ 7.15 | $ 7.86 | $ 9.06 | $ 7.96 |
| Total Return (%) | 14.65c** | .74c | (5.48)c | (11.76)c | 20.23c | 20.65 |
| Ratios to Average Net Assets and Supplemental Data |
| Net assets, end of period ($ millions) | 104 | 94 | 105 | 126 | 151 | 230 |
| Ratio of expenses before expense reductions (%)d | 1.10* | 1.12 | 1.05 | 1.04 | 1.02 | .98 |
| Ratio of expenses after expense reductions (%)d | .84* | .84 | .98 | .98 | 1.01 | .98 |
| Ratio of net investment income (loss) (%) | 3.47* | 2.46 | 2.74 | 3.55b | 1.64 | 2.99 |
| Portfolio turnover rate (%) | 42** | 67 | 99 | 135 | 97 | 85 |
a Based on average shares outstanding during the period. b Net investment income per share and the ratio of net investment income include non-recurring dividend income amounting to $0.08 per share and 0.95% of average daily net assets, for the year ended December 31, 2014. c Total return would have been lower had certain expenses not been reduced. d Expense ratio does not reflect charges and fees associated with the separate account that invests in the Fund or any variable life insurance policy or variable annuity contract for which the Fund is an investment option. * Annualized ** Not annualized |
| | | | | | | | |
| Class B | Six Months Ended 6/30/17 (Unaudited) |
Years Ended December 31, |
| 2016 | 2015 | 2014 | 2013 | 2012 |
| Selected Per Share Data |
| Net asset value, beginning of period | $ 6.48 | $ 7.16 | $ 7.87 | $ 9.07 | $ 7.96 | $ 6.75 |
Income (loss) from investment operations: Net investment income (loss)a | .10 | .14 | .19 | .28b | .13 | .20 |
| Net realized and unrealized gain (loss) | .82 | (.13) | (.59) | (1.35) | 1.41 | 1.15 |
| Total from investment operations | .92 | .01 | (.40) | (1.07) | 1.54 | 1.35 |
Less distributions from: Net investment income | (.48) | (.69) | (.31) | (.13) | (.43) | (.14) |
| Net asset value, end of period | $ 6.92 | $ 6.48 | $ 7.16 | $ 7.87 | $ 9.07 | $ 7.96 |
| Total Return (%) | 14.48c** | .48c | (5.71)c | (11.98)c | 20.01c | 20.13 |
| Ratios to Average Net Assets and Supplemental Data |
| Net assets, end of period ($ millions) | .31 | .27 | .27 | .26 | .31 | .28 |
| Ratio of expenses before expense reductions (%)d | 1.38* | 1.40 | 1.33 | 1.31 | 1.30 | 1.26 |
| Ratio of expenses after expense reductions (%)d | 1.09* | 1.10 | 1.23 | 1.23 | 1.27 | 1.26 |
| Ratio of net investment income (loss) (%) | 3.03* | 2.18 | 2.47 | 3.26b | 1.62 | 2.73 |
| Portfolio turnover rate (%) | 42** | 67 | 99 | 135 | 97 | 85 |
a Based on average shares outstanding during the period. b Net investment income per share and the ratio of net investment income include non-recurring dividend income amounting to $0.08 per share and 0.95% of average daily net assets, for the year ended December 31, 2014. c Total return would have been lower had certain expenses not been reduced. d Expense ratio does not reflect charges and fees associated with the separate account that invests in the Fund or any variable life insurance policy or variable annuity contract for which the Fund is an investment option. * Annualized ** Not annualized |
| | | | | | | | |
Notes to Financial Statements (Unaudited)
A. Organization and Significant Accounting Policies
Deutsche Variable Series I (the "Trust") is registered under the Investment Company Act of 1940, as amended (the "1940 Act"), as an open-end, registered management investment company organized as a Massachusetts business trust. The Trust consists of five diversified funds: Deutsche Bond VIP, Deutsche Capital Growth VIP, Deutsche Core Equity VIP, Deutsche CROCI® International VIP and Deutsche Global Small Cap VIP (individually or collectively hereinafter referred to as a "Fund" or the "Funds"). These financial statements report on Deutsche CROCI® International VIP. The Trust is intended to be the underlying investment vehicle for variable annuity contracts and variable life insurance policies to be offered by the separate accounts of certain life insurance companies ("Participating Insurance Companies").
Multiple Classes of Shares of Beneficial Interest. The Fund offers two classes of shares (Class A shares and Class B shares). Class B shares are subject to Rule 12b-1 distribution fees under the 1940 Act and recordkeeping fees equal to an annual rate of 0.25% and up to 0.15%, respectively, of the average daily net assets of the Class B shares of the Fund. Class A shares are not subject to such fees.
Investment income, realized and unrealized gains and losses, and certain fund-level expenses and expense reductions, if any, are borne pro rata on the basis of relative net assets by the holders of all classes of shares, except that each class bears certain expenses unique to that class (including the applicable 12b-1 distribution fees and recordkeeping fees). Differences in class-level expenses may result in payment of different per share dividends by class. All shares have equal rights with respect to voting subject to class-specific arrangements.
The Fund's financial statements are prepared in accordance with accounting principles generally accepted in the United States of America ("U.S. GAAP") which require the use of management estimates. Actual results could differ from those estimates. The Fund qualifies as an investment company under Topic 946 of Accounting Standards Codification of U.S. GAAP. The policies described below are followed consistently by the Fund in the preparation of its financial statements.
Security Valuation. Investments are stated at value determined as of the close of regular trading on the New York Stock Exchange on each day the exchange is open for trading.
Various inputs are used in determining the value of the Fund's investments. These inputs are summarized in three broad levels. Level 1 includes quoted prices in active markets for identical securities. Level 2 includes other significant observable inputs (including quoted prices for similar securities, interest rates, prepayment speeds and credit risk). Level 3 includes significant unobservable inputs (including the Fund's own assumptions in determining the fair value of investments). The level assigned to the securities valuations may not be an indication of the risk or liquidity associated with investing in those securities.
Equity securities are valued at the most recent sale price or official closing price reported on the exchange (U.S. or foreign) or over-the-counter market on which they trade. Securities for which no sales are reported are valued at the calculated mean between the most recent bid and asked quotations on the relevant market or, if a mean cannot be determined, at the most recent bid quotation. Equity securities are generally categorized as Level 1 securities. For certain international equity securities, in order to adjust for events which may occur between the close of the foreign exchanges and the close of the New York Stock Exchange, a fair valuation model may be used. This fair valuation model takes into account comparisons to the valuation of American Depository Receipts (ADRs), exchange-traded funds, futures contracts and certain indices and these securities are categorized as Level 2.
Investments in open-end investment companies are valued at their net asset value each business day and are categorized as Level 1.
Forward currency contracts are valued at the prevailing forward exchange rate of the underlying currencies and are categorized as Level 2.
Securities and other assets for which market quotations are not readily available or for which the above valuation procedures are deemed not to reflect fair value are valued in a manner that is intended to reflect their fair value as determined in accordance with procedures approved by the Trustees and are generally categorized as Level 3. In accordance with the Fund's valuation procedures, factors considered in determining value may include, but are not limited to, the type of the security; the size of the holding; the initial cost of the security; the existence of any contractual restrictions on the security's disposition; the price and extent of public trading in similar securities of the issuer or of comparable companies; quotations or evaluated prices from broker-dealers and/or pricing services; information obtained from the issuer, analysts, and/or the appropriate stock exchange (for exchange-traded securities); an analysis of the company's or issuer's financial statements; an evaluation of the forces that influence the issuer and the market(s) in which the security is purchased and sold; and with respect to debt securities, the maturity, coupon, creditworthiness, currency denomination and the movement of the market in which the security is normally traded. The value determined under these procedures may differ from published values for the same securities.
Disclosure about the classification of fair value measurements is included in a table following the Fund's Investment Portfolio.
Securities Lending. Deutsche Bank AG, as lending agent, lends securities of the Fund to certain financial institutions under the terms of its securities lending agreement. During the term of the loans, the Fund continues to receive interest and dividends generated by the securities and to participate in any changes in their market value. The Fund requires the borrowers of the securities to maintain collateral with the Fund consisting of either cash or liquid, unencumbered assets having a value at least equal to the value of the securities loaned. When the collateral falls below specified amounts, the lending agent will use its best effort to obtain additional collateral on the next business day to meet required amounts under the securities lending agreement. During the six months ended June 30, 2017, the Fund invested the cash collateral into a joint trading account in affiliated money market funds including Deutsche Government & Agency Securities Portfolio managed by Deutsche Investment Management Americas Inc. Deutsche Investment Management Americas Inc. receives a management/administration fee (0.13% annualized effective rate as of June 30, 2017) on the cash collateral invested in Deutsche Government & Agency Securities Portfolio. The Fund receives compensation for lending its securities either in the form of fees or by earning interest on invested cash collateral net of borrower rebates and fees paid to a lending agent. Either the Fund or the borrower may terminate the loan at any time, and the borrower, after notice, is required to return borrowed securities within a standard time period. There may be risks of delay and costs in recovery of securities or even loss of rights in the collateral should the borrower of the securities fail financially. If the Fund is not able to recover securities lent, the Fund may sell the collateral and purchase a replacement investment in the market, incurring the risk that the value of the replacement security is greater than the value of the collateral. The Fund is also subject to all investment risks associated with the reinvestment of any cash collateral received, including, but not limited to, interest rate, credit and liquidity risk associated with such investments.
As of June 30, 2017, the Fund had no securities on loan.
Foreign Currency Translations. The books and records of the Fund are maintained in U.S. dollars. Investment securities and other assets and liabilities denominated in a foreign currency are translated into U.S. dollars at the prevailing exchange rates at period end. Purchases and sales of investment securities, income and expenses are translated into U.S. dollars at the prevailing exchange rates on the respective dates of the transactions.
Net realized and unrealized gains and losses on foreign currency transactions represent net gains and losses between trade and settlement dates on securities transactions, the acquisition and disposition of foreign currencies, and the difference between the amount of net investment income accrued and the U.S. dollar amount actually received. The portion of both realized and unrealized gains and losses on investments that results from fluctuations in foreign currency exchange rates is not separately disclosed but is included with net realized and unrealized gain/appreciation and loss/depreciation on investments.
Taxes. The Fund is treated as a separate taxpayer as provided for in the Internal Revenue Code, as amended. It is the Fund's policy to comply with the requirements of the Internal Revenue Code, as amended, which are applicable to regulated investment companies, and to distribute all of its taxable income to the separate accounts of the Participating Insurance Companies which hold its shares.
Additionally, the Fund may be subject to taxes imposed by the governments of countries in which it invests and are generally based on income and/or capital gains earned or repatriated, a portion of which may be recoverable. Based upon the current interpretation of the tax rules and regulations, estimated tax liabilities and recoveries on certain foreign securities are recorded on an accrual basis and are reflected as components of interest income or net change in unrealized gain/loss on investments. Tax liabilities realized as a result of security sales are reflected as a component of net realized gain/loss on investments.
Under the Regulated Investment Company Modernization Act of 2010, net capital losses incurred post-enactment may be carried forward indefinitely, and their character is retained as short-term and/or long-term. Previously, net capital losses were carried forward for eight years and treated as short-term losses. As a transition rule, the Act requires that post-enactment net capital losses be used before pre-enactment net capital losses.
At December 31, 2016, the Fund had a net tax basis capital loss carryforward of approximately $98,822,000 of pre-enactment losses, which may be applied against any realized net taxable capital gains of each succeeding year until fully utilized or until December 31, 2017, the expiration date, whichever occurs first; and approximately $34,525,000 of post-enactment losses, which may be applied against realized net taxable capital gains indefinitely, including short-term losses ($11,496,000) and long-term losses ($23,029,000).
The Fund has reviewed the tax positions for the open tax years as of December 31, 2016 and has determined that no provision for income tax and/or uncertain tax provisions is required in the Fund's financial statements. The Fund's federal tax returns for the prior three fiscal years remain open subject to examination by the Internal Revenue Service.
Distribution of Income and Gains. Distributions from net investment income of the Fund, if any, are declared and distributed to shareholders annually. Net realized gains from investment transactions, in excess of available capital loss carryforwards, would be taxable to the Fund if not distributed and, therefore, will be distributed to shareholders at least annually. The Fund may also make additional distributions for tax purposes if necessary.
The timing and characterization of certain income and capital gain distributions are determined annually in accordance with federal tax regulations which may differ from accounting principles generally accepted in the United States of America. These differences primarily relate to investments in foreign denominated investments, forward currency contracts, passive foreign investment companies and certain securities sold at a loss. As a result, net investment income (loss) and net realized gain (loss) on investment transactions for a reporting period may differ significantly from distributions during such period. Accordingly, the Fund may periodically make reclassifications among certain of its capital accounts without impacting the net asset value of the Fund.
The tax character of current year distributions will be determined at the end of the current fiscal year.
Expenses. Expenses of the Trust arising in connection with a specific Fund are allocated to that Fund. Other Trust expenses which cannot be directly attributed to a Fund are apportioned among the Funds in the Trust based upon the relative net assets or other appropriate measures.
Contingencies. In the normal course of business, the Fund may enter into contracts with service providers that contain general indemnification clauses. The Fund's maximum exposure under these arrangements is unknown, as this would involve future claims that may be made against the Fund that have not yet been made. However, based on experience, the Fund expects the risk of loss to be remote.
Other. Investment transactions are accounted for on a trade date plus one basis for daily net asset value calculations. However, for financial reporting purposes, investment transactions are reported on trade date. Interest income is recorded on the accrual basis net of foreign withholding taxes. Dividend income is recorded on the ex-dividend date net of foreign withholding taxes. Certain dividends from foreign securities may be recorded subsequent to the ex-dividend date as soon as the Fund is informed of such dividends. Realized gains and losses from investment transactions are recorded on an identified cost basis. Proceeds from litigation payments, if any, are included in net realized gain (loss) from investments.
B. Derivative Instruments
Forward Foreign Currency Exchange Contracts. A forward foreign currency exchange contract ("forward currency contract") is a commitment to purchase or sell a foreign currency at the settlement date at a negotiated rate. For the six months ended June 30, 2017, the Fund entered into forward currency contracts in order to hedge its exposure to changes in foreign currency exchange rates on its foreign currency denominated portfolio holdings.
Forward currency contracts are valued at the prevailing forward exchange rate of the underlying currencies and unrealized gain (loss) is recorded daily. On the settlement date of the forward currency contract, the Fund records a realized gain or loss equal to the difference between the value of the contract at the time it was opened and the value of the contract at the time it was closed. Certain risks may arise upon entering into forward currency contracts from the potential inability of counterparties to meet the terms of their contracts. The maximum counterparty credit risk to the Fund is measured by the unrealized gain on appreciated contracts. Additionally, when utilizing forward currency contracts to hedge, the Fund gives up the opportunity to profit from favorable exchange rate movements during the term of the contract.
A summary of the open forward currency contracts as of June 30, 2017 is included in a table following the Fund's Investment Portfolio. For the six months ended June 30, 2017, the investment in forward currency contracts short vs. U.S. dollars had a total contract value generally indicative of a range from approximately $24,558,000 to $99,269,000, and the investment in forward currency contracts long vs. U.S. dollars had a total contract value generally indicative of a range from $0 to approximately $1,824,000.
The following tables summarize the value of the Fund's derivative instruments held as of June 30, 2017 and the related location in the accompanying Statement of Assets and Liabilities, presented by primary underlying risk exposure:
| Asset Derivative | Forward Contracts |
| Foreign Exchange Contracts (a) | $ 57,234 |
The above derivative is located in the following Statement of Assets and Liabilities account: (a) Unrealized appreciation on forward foreign currency exchange contracts |
Additionally, the amount of unrealized and realized gains and losses on derivative instruments recognized in Fund earnings during the six months ended June 30, 2017 and the related location in the accompanying Statement of Operations is summarized in the following tables by primary underlying risk exposure:
| Realized Gain (Loss) | Forward Contracts |
| Foreign Exchange Contracts (b) | $ (2,244,331) |
The above derivative is located in the following Statement of Operations account: (b) Net realized gain (loss) from foreign currency (Statement of Operations includes both forward currency contracts and foreign currency transactions) |
| Change in Net Unrealized Appreciation (Depreciation) | Forward Contracts |
| Foreign Exchange Contracts (c) | $ 497,943 |
The above derivative is located in the following Statement of Operations account: (c) Change in net unrealized appreciation (depreciation) on foreign currency (Statement of Operations includes both forward currency contracts and foreign currency transactions) |
As of June 30, 2017, the Fund has transactions subject to enforceable master netting agreements, which govern the terms of certain transactions, and reduce the counterparty risk associated with such transactions. Master netting agreements allow a Fund to close out and net total exposure to a counterparty in the event of a deterioration in the credit quality or contractual default with respect to all of the transactions with a counterparty. As defined by the master netting agreement, the Fund may have collateral agreements with certain counterparties to mitigate risk. For financial reporting purposes the Statement of Assets and Liabilities generally shows derivatives assets and liabilities on a gross basis, which reflects the full risks and exposures prior to netting. A reconciliation of the gross amounts on the Statement of Assets and Liabilities to the net amounts by counterparty, including any collateral exposure, is included in the following tables:
| Counterparty | Gross Amounts of Assets Presented in the Statement of Assets and Liabilities | Financial Instruments and Derivatives Available for Offset | Collateral Received | Net Amount of Derivative Assets |
| Citigroup, Inc. | $ 57,234 | $ — | $ — | $ 57,234 |
C. Purchases and Sales of Securities
During the six months ended June 30, 2017, purchases and sales of investment securities (excluding short-term investments) aggregated $40,238,217 and $41,133,714, respectively.
D. Related Parties
Management Agreement. Under the Investment Management Agreement with Deutsche Investment Management Americas Inc. ("DIMA" or the "Advisor"), an indirect, wholly owned subsidiary of Deutsche Bank AG, the Advisor directs the investments of the Fund in accordance with its investment objectives, policies and restrictions. The Advisor determines the securities, instruments and other contracts relating to investments to be purchased, sold or entered into by the Fund.
Pursuant to the Investment Management Agreement with the Advisor, the Fund pays a monthly management fee based on the Fund's average daily net assets, computed and accrued daily and payable monthly, at the following annual rates:
| First $500 million of average daily net assets | .790% |
| Over $500 million of average daily net assets | .640% |
Accordingly, for the six months ended June 30, 2017, the fee pursuant to the Investment Management Agreement was equivalent to an annualized rate (exclusive of any applicable waivers/reimbursements) of 0.79% of the Fund's average daily net assets.
For the period from January 1, 2017 through April 30, 2018, the Advisor has contractually agreed to waive all or a portion of its fees and/or reimburse certain operating expenses of the Fund to the extent necessary to maintain the total annual operating expenses (excluding certain expenses such as extraordinary expenses, taxes, brokerage and interest) of each class as follows:
For the six months ended June 30, 2017, fees waived and/or expenses reimbursed for each class are as follows:
| Class A | $ 129,613 |
| Class B | 426 |
| | $ 130,039 |
Administration Fee. Pursuant to an Administrative Services Agreement, DIMA provides most administrative services to the Fund. For all services provided under the Administrative Services Agreement, the Fund pays the Advisor an annual fee ("Administration Fee") of 0.10% of the Fund's average daily net assets, computed and accrued daily and payable monthly. For the six months ended June 30, 2017, the Administration Fee was $49,315, of which $8,633 is unpaid.
Service Provider Fees. Deutsche AM Service Company ("DSC"), an affiliate of the Advisor, is the transfer agent, dividend-paying agent and shareholder service agent for the Fund. Pursuant to a sub-transfer agency agreement between DSC and DST Systems, Inc. ("DST"), DSC has delegated certain transfer agent, dividend-paying agent and shareholder service agent functions to DST. DSC compensates DST out of the shareholder servicing fee it receives from the Fund. For the six months ended June 30, 2017, the amounts charged to the Fund by DSC were as follows:
| Services to Shareholders | Total Aggregated | Unpaid at June 30, 2017 |
| Class A | $ 310 | $ 152 |
| Class B | 40 | 20 |
| | $ 350 | $ 172 |
Distribution Service Agreement. Deutsche AM Distributors, Inc. ("DDI"), also an affiliate of the Advisor, is the Trusts' Distributor. In accordance with the Master Distribution Plan, DDI receives 12b-1 fees of 0.25% of average daily net assets of Class B shares. Pursuant to the Master Distribution Plan, DDI remits these fees to the Participating Insurance Companies for various costs incurred or paid by these companies in connection with marketing and distribution of Class B shares. For the six months ended June 30, 2017, the Distribution Service Fee aggregated $367, of which $64 is unpaid.
Typesetting and Filing Service Fees. Under an agreement with DIMA, DIMA is compensated for providing typesetting and certain regulatory filing services to the Fund. For the six months ended June 30, 2017, the amount charged to the Fund by DIMA included in the Statement of Operations under "Reports to shareholders" aggregated $6,184, of which $4,855 is unpaid.
Trustees' Fees and Expenses. The Fund paid retainer fees to each Trustee not affiliated with the Advisor, plus specified amounts to the Board Chairperson and Vice Chairperson and to each committee Chairperson.
Affiliated Cash Management Vehicles. The Fund may invest uninvested cash balances in Deutsche Central Cash Management Government Fund and Deutsche Variable NAV Money Fund, affiliated money market funds which are managed by the Advisor. Each affiliated money market fund is managed in accordance with Rule 2a-7 under the 1940 Act, which governs the quality, maturity, diversity and liquidity of instruments in which a money market fund may invest. Deutsche Central Cash Management Government Fund seeks to maintain a stable net asset value, and Deutsche Variable NAV Money Fund maintains a floating net asset value. The Fund indirectly bears its proportionate share of the expenses of each affiliated money market fund in which it invests. Deutsche Central Cash Management Government Fund does not pay the Advisor an investment management fee. To the extent that Deutsche Variable NAV Money Fund pays an investment management fee to the Advisor, the Advisor will waive an amount of the investment management fee payable to the Advisor by the Fund equal to the amount of the investment management fee payable on the Fund's assets invested in Deutsche Variable NAV Money Fund.
Securities Lending Agent Fees. Deutsche Bank AG serves as securities lending agent for the Fund. For the six months ended June 30, 2017, the Fund incurred securities lending agent fees to Deutsche Bank AG in the amount of $951.
E. Ownership of the Fund
At June 30, 2017, five participating insurance companies were owners of record of 10% or more of the total outstanding Class A shares of the Fund, each owning 22%, 16%, 12%, 11% and 10%, respectively. Two participating insurance companies were owners of record of 10% or more of the total outstanding Class B shares of the Fund, each owning 83% and 10%, respectively.
F. Line of Credit
The Fund and other affiliated funds (the "Participants") share in a $400 million revolving credit facility provided by a syndication of banks. The Fund may borrow for temporary or emergency purposes, including the meeting of redemption requests that otherwise might require the untimely disposition of securities. The Participants are charged an annual commitment fee which is allocated based on net assets, among each of the Participants. Interest is calculated at a rate per annum equal to the sum of the Federal Funds Rate plus 1.25 percent plus if the one-month LIBOR exceeds the Federal Funds Rate, the amount of such excess. The Fund may borrow up to a maximum of 33 percent of its net assets under the agreement. The Fund had no outstanding loans at June 30, 2017.
Information About Your Fund's Expenses (Unaudited)
As an investor of the Fund, you incur two types of costs: ongoing expenses and transaction costs. Ongoing expenses include management fees, distribution and service (12b-1) fees and other Fund expenses. Examples of transaction costs include contract charges, which are not shown in this section. The following tables are intended to help you understand your ongoing expenses (in dollars) of investing in the Fund and to help you compare these expenses with the ongoing expenses of investing in other mutual funds. In the most recent six-month period, the Fund limited these expenses; had it not done so, expenses would have been higher. The example in the table is based on an investment of $1,000 invested at the beginning of the six-month period and held for the entire period (January 1, 2017 to June 30, 2017).
The tables illustrate your Fund's expenses in two ways:
— Actual Fund Return. This helps you estimate the actual dollar amount of ongoing expenses (but not transaction costs) paid on a $1,000 investment in the Fund using the Fund's actual return during the period. To estimate the expenses you paid over the period, simply divide your account value by $1,000 (for example, an $8,600 account value divided by $1,000 = 8.6), then multiply the result by the number in the "Expenses Paid per $1,000" line under the share class you hold.
— Hypothetical 5% Fund Return. This helps you to compare your Fund's ongoing expenses (but not transaction costs) with those of other mutual funds using the Fund's actual expense ratio and a hypothetical rate of return of 5% per year before expenses. Examples using a 5% hypothetical Fund return may be found in the shareholder reports of other mutual funds. The hypothetical account values and expenses may not be used to estimate the actual ending account balance or expenses you paid for the period.
Please note that the expenses shown in these tables are meant to highlight your ongoing expenses only and do not reflect any transaction costs. The "Expenses Paid per $1,000" line of the tables is useful in comparing ongoing expenses only and will not help you determine the relative total expense of owning different funds. If these transaction costs had been included, your costs would have been higher.
| Expenses and Value of a $1,000 Investment for the six months ended June 30, 2017 |
| Actual Fund Return | Class A | | Class B | |
| Beginning Account Value 1/1/17 | $ 1,000.00 | | $ 1,000.00 | |
| Ending Account Value 6/30/17 | $ 1,146.50 | | $ 1,144.80 | |
| Expenses Paid per $1,000* | $ 4.47 | | $ 5.80 | |
| Hypothetical 5% Fund Return | Class A | | Class B | |
| Beginning Account Value 1/1/17 | $ 1,000.00 | | $ 1,000.00 | |
| Ending Account Value 6/30/17 | $ 1,020,63 | | $ 1,019.39 | |
| Expenses Paid per $1,000* | $ 4.21 | | $ 5.46 | |
* Expenses are equal to the Fund's annualized expense ratio for each share class, multiplied by the average account value over the period, multiplied by 181 (the number of days in the most recent six-month period), then divided by 365.
| Annualized Expense Ratios | Class A | | Class B | |
| Deutsche Variable Series I — Deutsche CROCI® International VIP | .84% | | 1.09% | |
For more information, please refer to the Fund's prospectus.
These tables do not reflect charges and fees ("contract charges") associated with the separate account that invests in the Fund or any variable life insurance policy or variable annuity contract for which the Fund is an investment option.
For an analysis of the fees associated with an investment in the fund or similar funds, please refer to the current and hypothetical expense calculators for Variable Insurance Products which can be found at deutschefunds.com/EN/resources/calculators.jsp.
Proxy Voting
The Trusts' policies and procedures for voting proxies for portfolio securities and information about how the Trust voted proxies related to its portfolio securities during the most recent 12-month period ended June 30 are available on our Web site — deutschefunds.com (click on "proxy voting"at the bottom of the page) — or on the SEC's Web site — sec.gov. To obtain a written copy of the Trusts' policies and procedures without charge, upon request, call us toll free at (800) 728-3337.
Advisory Agreement Board Considerations and Fee Evaluation
The Board of Trustees (hereinafter referred to as the "Board" or "Trustees") approved the renewal of Deutsche CROCI® International VIP’s (the "Fund") investment management agreement (the "Agreement") with Deutsche Investment Management Americas Inc. ("DIMA") in September 2016.
In terms of the process that the Board followed prior to approving the Agreement, shareholders should know that:
— During the entire process, all of the Fund’s Trustees were independent of DIMA and its affiliates (the "Independent Trustees").
— The Board met frequently during the past year to discuss fund matters and dedicated a substantial amount of time to contract review matters. Over the course of several months, the Board’s Contract Committee reviewed extensive materials received from DIMA, independent third parties and independent counsel. These materials included an analysis of the Fund’s performance, fees and expenses, and profitability from a fee consultant retained by the Fund’s Independent Trustees (the "Fee Consultant"). The Board also received extensive information throughout the year regarding performance of the Fund.
— The Independent Trustees regularly meet privately with counsel to discuss contract review and other matters. In addition, the Independent Trustees were advised by the Fee Consultant in the course of their review of the Fund’s contractual arrangements and considered a comprehensive report prepared by the Fee Consultant in connection with their deliberations.
— In connection with reviewing the Agreement, the Board also reviewed the terms of the Fund’s Rule 12b-1 plan, distribution agreement, administrative services agreement, transfer agency agreement and other material service agreements.
— Based on its evaluation of the information provided, the Contract Committee presented its findings and recommendations to the Board. The Board then reviewed the Contract Committee’s findings and recommendations.
In connection with the contract review process, the Contract Committee and the Board considered the factors discussed below, among others. The Board also considered that DIMA and its predecessors have managed the Fund since its inception, and the Board believes that a long-term relationship with a capable, conscientious advisor is in the best interests of the Fund. The Board considered, generally, that shareholders chose to invest or remain invested in the Fund knowing that DIMA managed the Fund, and that the Agreement was approved by the Fund’s shareholders. DIMA is part of Deutsche Bank AG’s ("Deutsche Bank") Asset Management ("Deutsche AM") division. Deutsche AM is a global asset management business that offers a wide range of investing expertise and resources, including research capabilities in many countries throughout the world. Deutsche Bank has advised the Board that the U.S. asset management business continues to be a critical and integral part of Deutsche Bank, and that Deutsche Bank will continue to invest in Deutsche AM and seek to enhance Deutsche AM’s investment platform. Deutsche Bank also has confirmed its commitment to maintaining strong legal and compliance groups within the Deutsche AM division.
As part of the contract review process, the Board carefully considered the fees and expenses of each Deutsche fund overseen by the Board in light of the fund’s performance. In many cases, this led to the negotiation and implementation of expense caps. As part of these negotiations, the Board indicated that it would consider relaxing these caps in future years following sustained improvements in performance, among other considerations.
While shareholders may focus primarily on fund performance and fees, the Fund’s Board considers these and many other factors, including the quality and integrity of DIMA’s personnel and such other issues as back-office operations, fund valuations, and compliance policies and procedures.
Nature, Quality and Extent of Services. The Board considered the terms of the Agreement, including the scope of advisory services provided under the Agreement. The Board noted that, under the Agreement, DIMA provides portfolio management services to the Fund and that, pursuant to a separate administrative services agreement, DIMA provides administrative services to the Fund. The Board considered the experience and skills of senior management and investment personnel and the resources made available to such personnel. The Board reviewed the Fund’s performance over short-term and long-term periods and compared those returns to various agreed-upon performance measures, including market index(es) and a peer universe compiled using information supplied by Morningstar Direct ("Morningstar"), an independent fund data service. The Board also noted that it has put into place a process of identifying "Focus Funds" (e.g., funds performing poorly relative to a peer universe), and receives additional reporting from DIMA regarding such funds and, where appropriate, DIMA’s plans to address underperformance. The Board believes this process is an effective manner of identifying and addressing underperforming funds. Based on the information provided, the Board noted that for the one-, three- and five-year periods ended December 31, 2015, the Fund’s performance (Class A shares) was in the 4th quartile of the applicable Morningstar universe (the 1st quartile being the best performers and the 4th quartile being the worst performers). The Board also observed that the Fund has underperformed its benchmark in the one-, three- and five-year periods ended December 31, 2015. The Board noted the disappointing investment performance of the Fund in recent periods and continued to discuss with senior management of DIMA the factors contributing to such underperformance and actions being taken to improve performance. The Board recognized the efforts by DIMA in recent years to enhance its investment platform and improve long-term performance across the Deutsche fund complex.
Fees and Expenses. The Board considered the Fund’s investment management fee schedule, operating expenses and total expense ratios, and comparative information provided by Broadridge Financial Solutions, Inc. ("Broadridge") and the Fee Consultant regarding investment management fee rates paid to other investment advisors by similar funds (1st quartile being the most favorable and 4th quartile being the least favorable). With respect to management fees paid to other investment advisors by similar funds, the Board noted that the contractual fee rates paid by the Fund, which include a 0.10% fee paid to DIMA under the Fund’s administrative services agreement, were higher than the median (3rd quartile) of the applicable Broadridge peer group (based on Broadridge data provided as of December 31, 2015). The Board noted that the Fund’s Class A shares total (net) operating expenses were expected to be lower than the median (2nd quartile) of the applicable Broadridge expense universe (based on Broadridge data provided as of December 31, 2015, and analyzing Broadridge expense universe Class A (net) expenses less any applicable 12b-1 fees) ("Broadridge Universe Expenses"). The Board also reviewed data comparing each share class’s total (net) operating expenses to the applicable Broadridge Universe Expenses. The Board noted that the expense limitations agreed to by DIMA were expected to help the Fund’s total (net) operating expenses remain competitive. The Board considered the Fund’s management fee rate as compared to fees charged by DIMA to comparable Deutsche U.S. registered funds ("Deutsche Funds") and considered differences between the Fund and the comparable funds. The information requested by the Board as part of its review of fees and expenses also included information about institutional accounts (including any sub-advised funds and accounts) and funds offered primarily to European investors ("Deutsche Europe funds") managed by Deutsche AM. The Board noted that DIMA indicated that Deutsche AM does not manage any institutional accounts or Deutsche Europe funds comparable to the Fund.
On the basis of the information provided, the Board concluded that management fees were reasonable and appropriate in light of the nature, quality and extent of services provided by DIMA.
Profitability. The Board reviewed detailed information regarding revenues received by DIMA under the Agreement. The Board considered the estimated costs and pre-tax profits realized by DIMA from advising the Deutsche Funds, as well as estimates of the pre-tax profits attributable to managing the Fund in particular. The Board also received information regarding the estimated enterprise-wide profitability of DIMA and its affiliates with respect to all fund services in totality and by fund. The Board and the Fee Consultant reviewed DIMA’s methodology in allocating its costs to the management of the Fund. Based on the information provided, the Board concluded that the pre-tax profits realized by DIMA in connection with the management of the Fund were not unreasonable. The Board also reviewed certain publicly available information regarding the profitability of certain similar investment management firms. The Board noted that while information regarding the profitability of such firms is limited (and in some cases is not necessarily prepared on a comparable basis), DIMA and its affiliates’ overall profitability with respect to the Deutsche Funds (after taking into account distribution and other services provided to the funds by DIMA and its affiliates) was lower than the overall profitability levels of most comparable firms for which such data was available.
Economies of Scale. The Board considered whether there are economies of scale with respect to the management of the Fund and whether the Fund benefits from any economies of scale. The Board noted that the Fund’s investment management fee schedule includes fee breakpoints. The Board concluded that the Fund’s fee schedule represents an appropriate sharing between the Fund and DIMA of such economies of scale as may exist in the management of the Fund at current asset levels.
Other Benefits to DIMA and Its Affiliates. The Board also considered the character and amount of other incidental benefits received by DIMA and its affiliates, including any fees received by DIMA for administrative services provided to the Fund and any fees received by an affiliate of DIMA for distribution services. The Board noted that DIMA pays a licensing fee to an affiliate related to the Fund’s use of the CROCI® strategy. The Board also considered benefits to DIMA related to brokerage and soft-dollar allocations, including allocating brokerage to pay for research generated by parties other than the executing broker dealers, which pertain primarily to funds investing in equity securities, along with the incidental public relations benefits to DIMA related to Deutsche Funds advertising and cross-selling opportunities among DIMA products and services. The Board considered these benefits in reaching its conclusion that the Fund’s management fees were reasonable.
Compliance. The Board considered the significant attention and resources dedicated by DIMA to documenting and enhancing its compliance processes in recent years. The Board noted in particular (i) the experience, seniority and time commitment of the individuals serving as DIMA’s and the Fund’s chief compliance officers; (ii) the large number of DIMA compliance personnel; and (iii) the substantial commitment of resources by DIMA and its affiliates to compliance matters.
Based on all of the information considered and the conclusions reached, the Board unanimously determined that the continuation of the Agreement is in the best interests of the Fund. In making this determination, the Board did not give particular weight to any single factor identified above. The Board considered these factors over the course of numerous meetings, certain of which were in executive session with only the Independent Trustees and counsel present. It is possible that individual Independent Trustees may have weighed these factors differently in reaching their individual decisions to approve the continuation of the Agreement.
Notes

VS1cint-3 (R-028378-6 8/17)

June 30, 2017
Semiannual Report
Deutsche Variable Series I
Deutsche Global Small Cap VIP

Contents
3 Performance Summary 4 Portfolio Summary 4 Portfolio Manager 5 Investment Portfolio 10 Statement of Assets and Liabilities 10 Statement of Operations 11 Statements of Changes in Net Assets 13 Financial Highlights 14 Notes to Financial Statements 18 Information About Your Fund's Expenses 19 Proxy Voting 20 Advisory Agreement Board Considerations and Fee Evaluation |
This report must be preceded or accompanied by a prospectus. To obtain an additional prospectus or summary prospectus, if available, call (800) 728-3337 or your financial representative. We advise you to consider the Fund's objectives, risks, charges and expenses carefully before investing. The summary prospectus and prospectus contain this and other important information about the Fund. Please read the prospectus carefully before you invest.
Stocks may decline in value. Smaller company stocks tend to be more volatile than medium-sized or large company stocks. Investing in foreign securities, particularly those of emerging markets, presents certain risks, such as currency fluctuations, political and economic changes, and market risks. Emerging markets tend to be more volatile and less liquid than the markets of more mature economies, and generally have less diverse and less mature economic structures and less stable political systems than those of developed countries. The Fund may lend securities to approved institutions. See the prospectus for details.
Deutsche Asset Management represents the asset management activities conducted by Deutsche Bank AG or any of its subsidiaries.
Deutsche AM Distributors, Inc., 222 South Riverside Plaza, Chicago, IL 60606, (800) 621-1148
NOT FDIC/NCUA INSURED NO BANK GUARANTEE MAY LOSE VALUE NOT A DEPOSIT
NOT INSURED BY ANY FEDERAL GOVERNMENT AGENCY
Performance Summary June 30, 2017 (Unaudited)
Fund performance shown is historical, assumes reinvestment of all dividend and capital gain distributions, and does not guarantee future results. Investment return and principal value fluctuate with changing market conditions so that, when redeemed, shares may be worth more or less than their original cost. Current performance may be lower or higher than the performance data quoted. Please contact your participating insurance company for the Fund's most recent month-end performance. Performance doesn't reflect charges and fees ("contract charges") associated with the separate account that invests in the Fund or any variable life insurance policy or variable annuity contract for which the Fund is an investment option. These charges and fees will reduce returns. While all share classes have the same underlying portfolio, their performance will differ.
The gross expense ratios of the Fund, as stated in the fee table of the prospectus dated May 1, 2017 are 1.17% and 1.47% for Class A and Class B shares, respectively, and may differ from the expense ratios disclosed in the Financial Highlights tables in this report.
Generally accepted accounting principles require adjustments to be made to the net assets of the Fund at period end for financial reporting purposes only, and as such, the total return based on the unadjusted net asset value per share may differ from the total return reported in the financial highlights.
| Growth of an Assumed $10,000 Investment |
■ Deutsche Global Small Cap VIP — Class A ■ S&P® Developed Small Cap Index | The S&P® Developed SmallCap comprises the stocks representing the lowest 15% of float-adjusted market cap in each developed country. It Is a subset of the S&P® Global BMI, a comprehensive, rules-based index measuring global stock market performance. Index returns do not reflect any fees or expenses and it is not possible to invest directly into an index. |
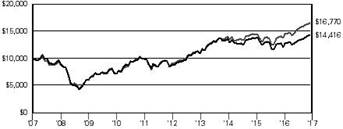 | |
| Yearly periods ended June 30 | |
| Comparative Results |
| Deutsche Global Small Cap VIP | 6-Month‡ | 1-Year | 3-Year | 5-Year | 10-Year |
| Class A | Growth of $10,000 | $10,997 | $11,875 | $10,529 | $16,499 | $14,416 |
| Average annual total return | 9.97% | 18.75% | 1.73% | 10.53% | 3.72% |
| S&P Developed Small Cap Index | Growth of $10,000 | $11,032 | $12,098 | $11,894 | $18,670 | $16,770 |
| Average annual total return | 10.32% | 20.98% | 5.95% | 13.30% | 5.31% |
| Deutsche Global Small Cap VIP | 6-Month‡ | 1-Year | 3-Year | 5-Year | 10-Year |
| Class B | Growth of $10,000 | $10,972 | $11,841 | $10,529 | $16,499 | $14,416 |
| Average annual total return | 9.72% | 18.41% | 1.45% | 10.24% | 3.43% |
| S&P Developed Small Cap Index | Growth of $10,000 | $11,032 | $12,098 | $11,894 | $18,670 | $16,770 |
| Average annual total return | 10.32% | 20.98% | 5.95% | 13.30% | 5.31% |
The growth of $10,000 is cumulative.
‡ Total returns shown for periods less than one year are not annualized.
Portfolio Summary (Unaudited)
| Asset Allocation (As a % of Investment Portfolio excluding Securities Lending Collateral) | 6/30/17 | 12/31/16 |
| | | |
| Common Stocks | 96% | 97% |
| Cash Equivalents | 4% | 3% |
| Convertible Preferred Stock | 0% | 0% |
| Rights | 0% | — |
| Warrant | 0% | 0% |
| | 100% | 100% |
| Geographical Diversification (As a % of Investment Portfolio excluding Cash Equivalents and Securities Lending Collateral) | 6/30/17 | 12/31/16 |
| | | |
| United States | 53% | 55% |
| Japan | 9% | 10% |
| United Kingdom | 7% | 8% |
| Ireland | 4% | 3% |
| Germany | 3% | 4% |
| Italy | 3% | 2% |
| Canada | 2% | 2% |
| France | 2% | 3% |
| Netherlands | 2% | 2% |
| Hong Kong | 1% | 1% |
| Malaysia | 0% | 0% |
| Other | 14% | 10% |
| | 100% | 100% |
| Sector Diversification (As a % of Investment Portfolio excluding Cash Equivalents and Securities Lending Collateral) | 6/30/17 | 12/31/16 |
| | | |
| Industrials | 21% | 19% |
| Consumer Discretionary | 21% | 23% |
| Information Technology | 19% | 19% |
| Health Care | 13% | 12% |
| Financials | 10% | 11% |
| Consumer Staples | 5% | 5% |
| Materials | 5% | 5% |
| Energy | 4% | 5% |
| Real Estate | 2% | 1% |
| | 100% | 100% |
Portfolio holdings and characteristics are subject to change.
For more complete details about the Fund's investment portfolio, see page 5.
Following the Fund's fiscal first and third quarter-end, a complete portfolio holdings listing is filed with the SEC on Form N-Q. The form will be available on the SEC's Web site at sec.gov, and it also may be reviewed and copied at the SEC's Public Reference Room in Washington, D.C. Information on the operation of the SEC's Public Reference Room may be obtained by calling (800) SEC-0330. The Fund's portfolio holdings are also posted on deutschefunds.com from time to time. Please see the Fund's current prospectus for more information.
Portfolio Manager
Joseph Axtell, CFA, Managing Director
Portfolio Manager
Investment Portfolio June 30, 2017 (Unaudited)
| | Shares | Value ($) |
| | | |
| Common Stocks 95.7% |
| Austria 0.7% |
| Lenzing AG (Cost $697,854) | 3,755 | 672,908 |
| Bermuda 1.1% |
| Lazard Ltd. "A" (a) (Cost $546,996) | 22,449 | 1,040,062 |
| Canada 2.1% |
| Quebecor, Inc. "B" | 30,781 | 1,018,754 |
| SunOpta, Inc.* (b) | 100,054 | 1,020,551 |
| (Cost $1,328,513) | 2,039,305 |
| China 0.6% |
| Minth Group Ltd. (Cost $47,643) | 145,036 | 614,886 |
| Finland 1.2% |
| Cramo Oyj (Cost $796,334) | 37,620 | 1,125,753 |
| France 2.0% |
| Altran Technologies SA | 75,264 | 1,226,688 |
| Criteo SA (ADR)* (b) | 13,534 | 663,843 |
| (Cost $1,620,727) | 1,890,531 |
| Germany 3.2% |
| M.A.X. Automation AG | 41,340 | 351,243 |
| PATRIZIA Immobilien AG* | 50,662 | 956,196 |
| Rational AG | 1,064 | 566,305 |
| United Internet AG (Registered) | 21,779 | 1,197,601 |
| (Cost $868,288) | 3,071,345 |
| Hong Kong 1.2% |
| Techtronic Industries Co., Ltd. (Cost $302,134) | 245,041 | 1,126,741 |
| India 1.0% |
| WNS Holdings Ltd. (ADR)* (Cost $817,019) | 28,558 | 981,253 |
| Indonesia 0.9% |
| PT Arwana Citramulia Tbk | 8,070,309 | 290,879 |
| PT Matahari Department Store Tbk | 515,300 | 548,247 |
| (Cost $1,072,810) | 839,126 |
| Ireland 4.1% |
| Avadel Pharmaceuticals PLC (ADR)* | 114,494 | 1,262,869 |
| Dalata Hotel Group PLC* | 115,961 | 638,384 |
| Greencore Group PLC | 311,920 | 999,400 |
| Ryanair Holdings PLC* | 49,682 | 1,019,127 |
| (Cost $3,189,549) | 3,919,780 |
| Israel 1.3% |
| Kornit Digital Ltd.* (a) | 28,818 | 557,628 |
| Mellanox Technologies Ltd.* (a) (b) | 14,698 | 636,424 |
| (Cost $1,117,224) | 1,194,052 |
| Italy 2.5% |
| Moncler SpA | 57,900 | 1,355,674 |
| Prysmian SpA | 36,037 | 1,059,861 |
| (Cost $1,637,216) | 2,415,535 |
| Japan 9.0% |
| Ai Holdings Corp. (b) | 37,317 | 1,003,636 |
| Anicom Holdings, Inc. (b) | 26,300 | 575,923 |
| BRONCO BILLY Co., Ltd. (b) | 9,600 | 224,562 |
| | Shares | Value ($) |
| | | |
| Daikyonishikawa Corp. | 73,600 | 980,897 |
| Kura Corp. | 5,700 | 262,005 |
| Kusuri no Aoki Holdings Co., Ltd. | 15,458 | 809,492 |
| MISUMI Group, Inc. | 20,774 | 473,937 |
| Nippon Seiki Co., Ltd. | 28,964 | 581,984 |
| Optex Group Co., Ltd. | 10,900 | 352,269 |
| Syuppin Co., Ltd. | 35,900 | 631,661 |
| Topcon Corp. | 28,200 | 484,897 |
| UT Group Co., Ltd.* | 76,924 | 1,234,477 |
| Zenkoku Hosho Co., Ltd. | 24,100 | 984,570 |
| (Cost $5,214,523) | 8,600,310 |
| Korea 1.3% |
| i-SENS, Inc. | 19,340 | 464,843 |
| Vieworks Co., Ltd. | 16,222 | 815,247 |
| (Cost $1,504,239) | 1,280,090 |
| Luxembourg 0.7% |
| B&M European Value Retail SA (Cost $716,899) | 154,959 | 683,586 |
| Malaysia 0.1% |
| Tune Protect Group Bhd. (Cost $201,429) | 405,414 | 117,110 |
| Netherlands 1.6% |
| Brunel International NV | 16,686 | 233,459 |
| Core Laboratories NV | 6,197 | 627,570 |
| SBM Offshore NV | 41,771 | 669,354 |
| (Cost $1,418,184) | 1,530,383 |
| Panama 0.8% |
| Banco Latinoamericano de Comercio Exterior SA "E" (Cost $632,388) | 26,626 | 729,020 |
| Spain 1.1% |
| Talgo SA 144A | 93,426 | 564,691 |
| Telepizza Group SA 144A* | 79,606 | 459,156 |
| (Cost $1,074,346) | 1,023,847 |
| Sweden 1.3% |
| Boozt AB 144A* | 16,069 | 158,311 |
| Nobina AB 144A | 199,650 | 1,083,007 |
| (Cost $998,074) | 1,241,318 |
| Taiwan 0.5% |
| Basso Industry Corp. (Cost $467,474) | 172,000 | 480,605 |
| United Kingdom 6.9% |
| accesso Technology Group PLC* | 21,200 | 482,519 |
| Arrow Global Group PLC | 144,139 | 760,791 |
| Cardtronics PLC "A"* (a) | 20,375 | 669,523 |
| Clinigen Healthcare Ltd. | 59,148 | 663,291 |
| Domino's Pizza Group PLC | 168,986 | 646,861 |
| Electrocomponents PLC | 152,863 | 1,148,786 |
| Meggitt PLC | 113,889 | 707,408 |
| Polypipe Group PLC | 123,640 | 615,636 |
| Scapa Group PLC | 146,461 | 903,240 |
| (Cost $4,940,343) | 6,598,055 |
| United States 50.5% |
| Advance Auto Parts, Inc. | 4,033 | 470,207 |
| Advanced Disposal Services, Inc.* | 32,179 | 731,429 |
| | Shares | Value ($) |
| | | |
| Affiliated Managers Group, Inc. | 6,900 | 1,144,434 |
| Ambarella, Inc.* (b) | 10,500 | 509,775 |
| Atkore International Group, Inc.* | 21,356 | 481,578 |
| AZZ, Inc. | 14,703 | 820,427 |
| Belden, Inc. | 14,000 | 1,056,020 |
| Berry Global Group, Inc.* | 14,971 | 853,497 |
| BioScrip, Inc.* (b) | 246,700 | 669,791 |
| Cardiovascular Systems, Inc.* | 15,900 | 512,457 |
| Casey's General Stores, Inc. | 9,746 | 1,043,894 |
| Cognex Corp. | 11,019 | 935,513 |
| Commercial Metals Co. | 46,240 | 898,443 |
| Cypress Semiconductor Corp. | 64,475 | 880,084 |
| Del Taco Restaurants, Inc.* | 83,798 | 1,152,222 |
| Deluxe Corp. | 12,400 | 858,328 |
| Diamondback Energy, Inc.* | 9,912 | 880,285 |
| Dolby Laboratories, Inc. "A" | 16,500 | 807,840 |
| FCB Financial Holdings, Inc. "A"* | 18,879 | 901,472 |
| Five9, Inc.* | 33,200 | 714,464 |
| Fox Factory Holding Corp.* | 27,685 | 985,586 |
| Gentherm, Inc.* | 31,493 | 1,221,928 |
| Gibraltar Industries, Inc.* | 29,173 | 1,040,017 |
| Hain Celestial Group, Inc.* | 14,946 | 580,204 |
| Helen of Troy Ltd.* | 11,200 | 1,053,920 |
| Horizon Global Corp.* | 41,100 | 590,196 |
| Inphi Corp.* (b) | 17,115 | 587,045 |
| Jack in the Box, Inc. | 9,453 | 931,121 |
| Kindred Healthcare, Inc. | 66,309 | 772,500 |
| Knowles Corp.* | 60,776 | 1,028,330 |
| Leucadia National Corp. | 29,018 | 759,111 |
| Ligand Pharmaceuticals, Inc.* (b) | 4,480 | 543,872 |
| Masonite International Corp.* | 10,632 | 802,716 |
| Matador Resources Co.* | 34,637 | 740,193 |
| Molina Healthcare, Inc.* | 21,563 | 1,491,728 |
| National Storage Affiliates Trust (REIT) | 39,135 | 904,410 |
| NETGEAR, Inc.* | 13,300 | 573,230 |
| Neurocrine Biosciences, Inc.* | 12,407 | 570,722 |
| Pacira Pharmaceuticals, Inc.* | 17,897 | 853,687 |
| PAREXEL International Corp.* | 8,552 | 743,254 |
| Patterson-UTI Energy, Inc. | 28,455 | 574,506 |
| Primoris Services Corp. | 39,173 | 976,975 |
| Providence Service Corp.* | 17,930 | 907,437 |
| Retrophin, Inc.* | 56,926 | 1,103,795 |
| Rush Enterprises, Inc. "A"* | 40,223 | 1,495,491 |
| Samsonite International SA | 119,400 | 498,555 |
| Sinclair Broadcast Group, Inc. "A" | 30,645 | 1,008,220 |
| Solaris Oilfield Infrastructure, Inc. "A"* (b) | 41,587 | 479,498 |
| South State Corp. | 8,387 | 718,766 |
| Super Micro Computer, Inc.* | 25,738 | 634,442 |
| Tenneco, Inc. | 13,738 | 794,469 |
| | Shares | Value ($) |
| | | |
| TiVo Corp. | 31,708 | 591,354 |
| Trinseo SA | 15,831 | 1,087,590 |
| TriState Capital Holdings, Inc.* | 22,960 | 578,592 |
| WABCO Holdings, Inc.* | 8,420 | 1,073,634 |
| Welbilt, Inc.* | 61,740 | 1,163,799 |
| WEX, Inc.* | 7,161 | 746,677 |
| Zions Bancorp. | 15,982 | 701,770 |
| (Cost $39,223,366) | 48,231,500 |
| Total Common Stocks (Cost $70,433,572) | 91,447,101 |
| |
| Convertible Preferred Stock 0.2% |
| United States |
| Providence Service Corp. (Cost $196,900) | 1,969 | 249,877 |
| |
| Right 0.0% |
| Spain |
| Talgo SA* (Cost $7,539) | 93,426 | 7,362 |
| |
| Warrants 0.0% |
| France |
| Parrot SA, Expiration Date 12/15/2022* | 13,230 | 1,959 |
| Parrot SA, Expiration Date 12/22/2022* | 13,230 | 1,996 |
| Total Warrants (Cost $0) | 3,955 |
| |
| Securities Lending Collateral 6.2% |
| Deutsche Government & Agency Securities Portfolio "Deutsche Government Cash Institutional Shares", 0.87% (c) (d) (Cost $5,918,648) | 5,918,648 | 5,918,648 |
| |
| Cash Equivalents 4.1% |
| Deutsche Central Cash Management Government Fund, 1.03% (c) (Cost $3,900,465) | 3,900,465 | 3,900,465 |
| | % of Net Assets | Value ($) |
| | |
| Total Investment Portfolio (Cost $80,457,124)† | 106.2 | 101,527,408 |
| Other Assets and Liabilities, Net | (6.2) | (5,942,336) |
| Net Assets | 100.0 | 95,585,072 |
* Non-income producing security.
† The cost for federal income tax purposes was $81,536,302. At June 30, 2017, net unrealized appreciation for all securities based on tax cost was $19,991,106. This consisted of aggregate gross unrealized appreciation for all securities in which there was an excess of value over tax cost of $23,911,163 and aggregate gross unrealized depreciation for all securities in which there was an excess of tax cost over value of $3,920,057.
(a) Listed on the NASDAQ Exchange.
(b) All or a portion of these securities were on loan. In addition, "Other Assets and Liabilities, Net" may include pending sales that are also on loan. The value of securities loaned at June 30, 2017 amounted to $5,838,436, which is 6.1% of net assets.
(c) Affiliated fund managed by Deutsche Investment Management Americas Inc. The rate shown is the annualized seven-day yield at period end.
(d) Represents collateral held in connection with securities lending. Income earned by the Fund is net of borrower rebates.
144A: Security exempt from registration under Rule 144A of the Securities Act of 1933. These securities may be resold in transactions exempt from registration, normally to qualified institutional buyers.
ADR: American Depositary Receipt
REIT: Real Estate Investment Trust
The accompanying notes are an integral part of the financial statements.
Fair Value Measurements
Various inputs are used in determining the value of the Fund's investments. These inputs are summarized in three broad levels. Level 1 includes quoted prices in active markets for identical securities. Level 2 includes other significant observable inputs (including quoted prices for similar securities, interest rates, prepayment speeds and credit risk). Level 3 includes significant unobservable inputs (including the Fund's own assumptions in determining the fair value of investments). The level assigned to the securities valuations may not be an indication of the risk or liquidity associated with investing in those securities.
The following is a summary of the inputs used as of June 30, 2017 in valuing the Fund's investments. For information on the Fund's policy regarding the valuation of investments, please refer to the Security Valuation section of Note A in the accompanying Notes to Financial Statements.
| Assets | Level 1 | Level 2 | Level 3 | Total |
| |
| Common Stocks | | | | |
| | Austria | $ 672,908 | $ — | $ — | $ 672,908 |
| | Bermuda | 1,040,062 | — | — | 1,040,062 |
| | Canada | 2,039,305 | — | — | 2,039,305 |
| | China | 614,886 | — | — | 614,886 |
| | Finland | 1,125,753 | — | — | 1,125,753 |
| | France | 1,890,531 | — | — | 1,890,531 |
| | Germany | 3,071,345 | — | — | 3,071,345 |
| | Hong Kong | 1,126,741 | — | — | 1,126,741 |
| | India | 981,253 | — | — | 981,253 |
| | Indonesia | 839,126 | — | — | 839,126 |
| | Ireland | 3,919,780 | — | — | 3,919,780 |
| | Israel | 1,194,052 | — | — | 1,194,052 |
| | Italy | 2,415,535 | — | — | 2,415,535 |
| | Japan | 8,600,310 | — | — | 8,600,310 |
| | Korea | 1,280,090 | — | — | 1,280,090 |
| | Luxembourg | 683,586 | — | — | 683,586 |
| | Malaysia | 117,110 | — | — | 117,110 |
| | Netherlands | 1,530,383 | — | — | 1,530,383 |
| | Panama | 729,020 | — | — | 729,020 |
| | Spain | 1,023,847 | — | — | 1,023,847 |
| | Sweden | 1,241,318 | — | — | 1,241,318 |
| | Taiwan | 480,605 | — | — | 480,605 |
| | United Kingdom | 6,598,055 | — | — | 6,598,055 |
| | United States | 48,231,500 | — | — | 48,231,500 |
| Convertible Preferred Stock | — | — | 249,877 | 249,877 |
| Rights | 7,362 | — | — | 7,362 |
| Warrants (e) | — | — | 3,955 | 3,955 |
| Short-Term Investments (e) | 9,819,113 | — | — | 9,819,113 |
| Total | $ 101,273,576 | $ — | $ 253,832 | $ 101,527,408 |
As a result of the fair valuation model utilized by the Fund, certain international equity securities transferred from Level 2 to Level 1. During the period ended June 30 2017, the amount of transfers between Level 2 and Level 1 was $31,147,651.
Transfers between price levels are recognized at the beginning of the reporting year.
(e) See Investment Portfolio for additional detailed categorizations.
The accompanying notes are an integral part of the financial statements.
Statement of Assets and Liabilities
| as of June 30, 2017 (Unaudited) |
| Assets |
Investments: Investments in non-affiliated securities, at value (cost $70,638,011) – including $5,838,436 of securities loaned | $ 91,708,295 |
| Investment in Deutsche Government & Agency Securities Portfolio (cost $5,918,648)* | 5,918,648 |
| Investment in Deutsche Central Cash Management Government Fund (cost $3,900,465) | 3,900,465 |
| Total investments in securities, at value (cost $80,457,124) | 101,527,408 |
| Foreign currency, at value (cost $190,919) | 193,592 |
| Receivable for investments sold | 109,520 |
| Receivable for Fund shares sold | 28,739 |
| Dividends receivable | 61,441 |
| Interest receivable | 7,839 |
| Foreign taxes recoverable | 23,599 |
| Other assets | 875 |
| Total assets | 101,953,013 |
| Liabilities |
| Payable upon return of securities loaned | 5,918,648 |
| Payable for Fund shares redeemed | 314,312 |
| Accrued management fee | 55,361 |
| Accrued Trustees' fees | 510 |
| Other accrued expenses and payables | 79,110 |
| Total liabilities | 6,367,941 |
| Net assets, at value | $ 95,585,072 |
| Net Assets Consist of |
| Distributions in excess of net investment income | (313,447) |
Net unrealized appreciation (depreciation) on: Investments | 21,070,284 |
| Foreign currency | 2,757 |
| Accumulated net realized gain (loss) | 5,975,395 |
| Paid-in capital | 68,850,083 |
| Net assets, at value | $ 95,585,072 |
Class A Net Asset Value, offering and redemption price per share ($92,858,539 ÷ 7,856,904 outstanding shares of beneficial interest, $.01 par value, unlimited number of shares authorized) | $ 11.82 |
Class B Net Asset Value, offering and redemption price per share ($2,726,533 ÷ 238,262 outstanding shares of beneficial interest, $.01 par value, unlimited number of shares authorized) | $ 11.44 |
* Represents collateral on securities loaned.
The accompanying notes are an integral part of the financial statements.
Statement of Operations
| for the six months ended June 30, 2017 (Unaudited) |
| Investment Income |
Income: Dividends (net of foreign taxes withheld of $43,171) | $ 546,359 |
| Income distributions — Deutsche Central Cash Management Government Fund | 13,940 |
| Securities lending income, net of borrower rebates | 24,100 |
| Total income | 584,399 |
Expenses: Management fee | 414,023 |
| Administration fee | 46,519 |
| Services to shareholders | 1,204 |
| Record keeping fee (Class B) | 421 |
| Distribution service fee (Class B) | 3,326 |
| Custodian fee | 22,374 |
| Professional fees | 37,006 |
| Reports to shareholders | 13,275 |
| Trustees' fees and expenses | 3,259 |
| Other | 8,307 |
| Total expenses before expense reductions | 549,714 |
| Expense reductions | (85,448) |
| Total expenses after expense reductions | 464,266 |
| Net investment income (loss) | 120,133 |
| Realized and Unrealized Gain (Loss) |
Net realized gain (loss) from: Investments | 6,644,960 |
| Foreign currency | 6,590 |
| | 6,651,550 |
Change in net unrealized appreciation (depreciation) on: Investments | 2,057,224 |
| Foreign currency | 13,494 |
| | 2,070,718 |
| Net gain (loss) | 8,722,268 |
| Net increase (decrease) in net assets resulting from operations | $ 8,842,401 |
The accompanying notes are an integral part of the financial statements.
Statements of Changes in Net Assets
| Increase (Decrease) in Net Assets | Six Months Ended June 30, 2017 (Unaudited) | Year Ended December 31, 2016 | |
| |
Operations: Net investment income (loss) | $ 120,133 | $ 191,099 | |
| Net realized gain (loss) | 6,651,550 | 8,666,143 | |
| Change in net unrealized appreciation (depreciation) | 2,070,718 | (8,347,993) | |
| Net increase (decrease) in net assets resulting from operations | 8,842,401 | 509,249 | |
Distributions to shareholders from: Net investment income: Class A | — | (351,519) | |
| Class B | — | (3,345) | |
Net realized gains: Class A | (8,009,441) | (10,844,338) | |
| Class B | (245,528) | (308,285) | |
| Total distributions | (8,254,969) | (11,507,487) | |
Fund share transactions: Class A Proceeds from shares sold | 1,961,287 | 4,096,927 | |
| Reinvestment of distributions | 8,009,441 | 11,195,858 | |
| Payments for shares redeemed | (6,725,761) | (19,689,215) | |
| Net increase (decrease) in net assets from Class A share transactions | 3,244,967 | (4,396,430) | |
Class B Proceeds from shares sold | 170,763 | 238,868 | |
| Reinvestment of distributions | 245,528 | 311,629 | |
| Payments for shares redeemed | (264,772) | (366,666) | |
| Net increase (decrease) in net assets from Class B share transactions | 151,519 | 183,831 | |
| Increase (decrease) in net assets | 3,983,918 | (15,210,837) | |
| Net assets at beginning of period | 91,601,154 | 106,811,991 | |
| Net assets at end of period (including distributions in excess of net investment income of $313,447 and $433,580, respectively) | $ 95,585,072 | $ 91,601,154 | |
| Other Information | |
Class A Shares outstanding at beginning of period | 7,559,752 | 7,905,300 | |
| Shares sold | 163,735 | 354,371 | |
| Shares issued to shareholders in reinvestment of distributions | 695,868 | 973,553 | |
| Shares redeemed | (562,451) | (1,673,472) | |
| Net increase (decrease) in Class A shares | 297,152 | (345,548) | |
| Shares outstanding at end of period | 7,856,904 | 7,559,752 | |
Class B Shares outstanding at beginning of period | 224,620 | 207,982 | |
| Shares sold | 14,608 | 20,941 | |
| Shares issued to shareholders in reinvestment of distributions | 22,020 | 27,824 | |
| Shares redeemed | (22,986) | (32,127) | |
| Net increase (decrease) in Class B shares | 13,642 | 16,638 | |
| Shares outstanding at end of period | 238,262 | 224,620 | |
The accompanying notes are an integral part of the financial statements.
Financial Highlights
| Class A | Six Months Ended 6/30/17 (Unaudited) |
Years Ended December 31, |
| 2016 | 2015 | 2014 | 2013 | 2012 |
| Selected Per Share Data |
| Net asset value, beginning of period | $ 11.78 | $ 13.17 | $ 14.61 | $ 17.31 | $ 13.78 | $ 12.67 |
Income (loss) from investment operations: Net investment income (loss)a | .02 | .03 | .06 | .04 | .04 | .09 |
| Net realized and unrealized gain (loss) | 1.11 | .15 | .21 | (.69) | 4.66 | 1.83 |
| Total from investment operations | 1.13 | .18 | .27 | (.65) | 4.70 | 1.92 |
Less distributions from: Net investment income | — | (.05) | (.14) | (.15) | (.10) | (.09) |
| Net realized gains | (1.09) | (1.52) | (1.57) | (1.90) | (1.07) | (.72) |
| Total distributions | (1.09) | (1.57) | (1.71) | (2.05) | (1.17) | (.81) |
| Net asset value, end of period | $ 11.82 | $ 11.78 | $ 13.17 | $ 14.61 | $ 17.31 | $ 13.78 |
| Total Return (%)b | 9.97** | 1.57 | 1.16 | (4.13) | 35.94 | 15.37 |
| Ratios to Average Net Assets and Supplemental Data |
| Net assets, end of period ($ millions) | 93 | 89 | 104 | 135 | 154 | 124 |
| Ratio of expenses before expense reductions (%)c | 1.17* | 1.17 | 1.12 | 1.13 | 1.14 | 1.11 |
| Ratio of expenses after expense reductions (%)c | .99* | 1.02 | .99 | .97 | .94 | .98 |
| Ratio of net investment income (loss) (%) | .27* | .22 | .41 | .27 | .28 | .69 |
| Portfolio turnover rate (%) | 21** | 41 | 27 | 33 | 39 | 36 |
a Based on average shares outstanding during the period. b Total return would have been lower had certain expenses not been reduced. c Expense ratio does not reflect charges and fees associated with the separate account that invests in the Fund or any variable life insurance policy or variable annuity contract for which the Fund is an investment option. * Annualized ** Not annualized |
| | | | | | | | |
| Class B | Six Months Ended 6/30/17 (Unaudited) | 2016 | 2015 | 2014 | 2013 | 2012 |
| Selected Per Share Data |
| Net asset value, beginning of period | $ 11.45 | $ 12.85 | $ 14.29 | $ 16.97 | $ 13.52 | $ 12.45 |
Income (loss) from investment operations: Net investment income (loss)a | (.00)*** | (.03) | .02 | .00*** | .01 | .06 |
| Net realized and unrealized gain (loss) | 1.08 | .17 | .21 | (.67) | 4.57 | 1.79 |
| Total from investment operations | 1.08 | .14 | .23 | (.67) | 4.58 | 1.85 |
Less distributions from: Net investment income | — | (.02) | (.10) | (.11) | (.06) | (.06) |
| Net realized gains | (1.09) | (1.52) | (1.57) | (1.90) | (1.07) | (.72) |
| Total distributions | (1.09) | (1.54) | (1.67) | (2.01) | (1.13) | (.78) |
| Net asset value, end of period | $ 11.44 | $ 11.45 | $ 12.85 | $ 14.29 | $ 16.97 | $ 13.52 |
| Total Return (%)b | 9.72** | 1.34 | .86 | (4.33) | 35.67 | 15.01 |
| Ratios to Average Net Assets and Supplemental Data |
| Net assets, end of period ($ millions) | 3 | 3 | 3 | 3 | 3 | 2 |
| Ratio of expenses before expense reductions (%)c | 1.46* | 1.47 | 1.41 | 1.41 | 1.34 | 1.43 |
| Ratio of expenses after expense reductions (%)c | 1.27* | 1.30 | 1.24 | 1.25 | 1.15 | 1.23 |
| Ratio of net investment income (loss) (%) | (.02)* | (.23) | .15 | .02 | .07 | .44 |
| Portfolio turnover rate (%) | 21** | 41 | 27 | 33 | 39 | 36 |
a Based on average shares outstanding during the period. b Total return would have been lower had certain expenses not been reduced. c Expense ratio does not reflect charges and fees associated with the separate account that invests in the Fund or any variable life insurance policy or variable annuity contract for which the Fund is an investment option. * Annualized ** Not annualized *** Amount is less than $.005. |
| | | | | | | | |
Notes to Financial Statements (Unaudited)
A. Organization and Significant Accounting Policies
Deutsche Variable Series I (the "Trust") is registered under the Investment Company Act of 1940, as amended (the "1940 Act"), as an open-end, registered management investment company organized as a Massachusetts business trust. The Trust consists of five diversified funds: Deutsche Bond VIP, Deutsche Capital Growth VIP, Deutsche Core Equity VIP, Deutsche CROCI® International VIP and Deutsche Global Small Cap VIP (individually or collectively hereinafter referred to as a "Fund" or the "Funds"). These financial statements report on Deutsche Global Small Cap VIP. The Trust is intended to be the underlying investment vehicle for variable annuity contracts and variable life insurance policies to be offered by the separate accounts of certain life insurance companies ("Participating Insurance Companies").
Multiple Classes of Shares of Beneficial Interest. The Fund offers two classes of shares (Class A shares and Class B shares). Class B shares are subject to Rule 12b-1 distribution fees under the 1940 Act and recordkeeping fees equal to an annual rate of 0.25% and up to 0.15%, respectively, of the average daily net assets of the Class B shares of the Fund. Class A shares are not subject to such fees.
Investment income, realized and unrealized gains and losses, and certain fund-level expenses and expense reductions, if any, are borne pro rata on the basis of relative net assets by the holders of all classes of shares, except that each class bears certain expenses unique to that class (including the applicable 12b-1 distribution fees). Differences in class-level expenses may result in payment of different per share dividends by class. All shares have equal rights with respect to voting subject to class-specific arrangements.
The Fund's financial statements are prepared in accordance with accounting principles generally accepted in the United States of America ("U.S. GAAP") which require the use of management estimates. Actual results could differ from those estimates. The Fund qualifies as an investment company under Topic 946 of Accounting Standards Codification of U.S. GAAP. The policies described below are followed consistently by the Fund in the preparation of its financial statements.
Security Valuation. Investments are stated at value determined as of the close of regular trading on the New York Stock Exchange on each day the exchange is open for trading.
Various inputs are used in determining the value of the Fund's investments. These inputs are summarized in three broad levels. Level 1 includes quoted prices in active markets for identical securities. Level 2 includes other significant observable inputs (including quoted prices for similar securities, interest rates, prepayment speeds and credit risk). Level 3 includes significant unobservable inputs (including the Fund's own assumptions in determining the fair value of investments). The level assigned to the securities valuations may not be an indication of the risk or liquidity associated with investing in those securities.
Equity securities are valued at the most recent sale price or official closing price reported on the exchange (U.S. or foreign) or over-the-counter market on which they trade. Securities for which no sales are reported are valued at the calculated mean between the most recent bid and asked quotations on the relevant market or, if a mean cannot be determined, at the most recent bid quotation. Equity securities are generally categorized as Level 1 securities. For certain international equity securities, in order to adjust for events which may occur between the close of the foreign exchanges and the close of the New York Stock Exchange, a fair valuation model may be used. This fair valuation model takes into account comparisons to the valuation of American Depository Receipts (ADRs), exchange-traded funds, futures contracts and certain indices and these securities are categorized as Level 2.
Investments in open-end investment companies are valued at their net asset value each business day and are categorized as Level 1.
Securities and other assets for which market quotations are not readily available or for which the above valuation procedures are deemed not to reflect fair value are valued in a manner that is intended to reflect their fair value as determined in accordance with procedures approved by the Trustees and are generally categorized as Level 3. In accordance with the Fund's valuation procedures, factors considered in determining value may include, but are not limited to, the type of the security; the size of the holding; the initial cost of the security; the existence of any contractual restrictions on the security's disposition; the price and extent of public trading in similar securities of the issuer or of comparable companies; quotations or evaluated prices from broker-dealers and/or pricing services; information obtained from the issuer, analysts, and/or the appropriate stock exchange (for exchange-traded securities); an analysis of the company's or issuer's financial statements; an evaluation of the forces that influence the issuer and the market(s) in which the security is purchased and sold; and with respect to debt securities, the maturity, coupon, creditworthiness, currency denomination and the movement of the market in which the security is normally traded. The value determined under these procedures may differ from published values for the same securities.
Disclosure about the classification of fair value measurements is included in a table following the Fund's Investment Portfolio.
Securities Lending. Brown Brothers Harriman & Co., as lending agent, lends securities of the Fund to certain financial institutions under the terms of its securities lending agreement. During the term of the loans, the Fund continues to receive interest and dividends generated by the securities and to participate in any changes in their market value. The Fund requires the borrowers of the securities to maintain collateral with the Fund consisting of either cash or liquid, unencumbered assets having a value at least equal to the value of the securities loaned. When the collateral falls below specified amounts, the lending agent will use its best effort to obtain additional collateral on the next business day to meet required amounts under the securities lending agreement. As of period end, any securities on loan were collateralized by cash. During the six months ended June 30, 2017, the Fund invested the cash collateral into a joint trading account in affiliated money market funds managed by Deutsche Investment Management Americas Inc. As of June 30, 2017, the Fund invested the cash collateral in Deutsche Government & Agency Securities Portfolio. Deutsche Investment Management Americas Inc. receives a management/administration fee (0.13% annualized effective rate as of June 30, 2017) on the cash collateral invested in Deutsche Government & Agency Securities Portfolio. The Fund receives compensation for lending its securities either in the form of fees or by earning interest on invested cash collateral net of borrower rebates and fees paid to a lending agent. Either the Fund or the borrower may terminate the loan at any time, and the borrower, after notice, is required to return borrowed securities within a standard time period. There may be risks of delay and costs in recovery of securities or even loss of rights in the collateral should the borrower of the securities fail financially. If the Fund is not able to recover securities lent, the Fund may sell the collateral and purchase a replacement investment in the market, incurring the risk that the value of the replacement security is greater than the value of the collateral. The Fund is also subject to all investment risks associated with the reinvestment of any cash collateral received, including, but not limited to, interest rate, credit and liquidity risk associated with such investments.
As of June 30, 2017, the Fund had securities on loan, which were classified as common stock in the Investment Portfolio. The value of the related collateral exceeded the value of the securities loaned at period end. As of period end, the remaining contractual maturity of the collateral agreements were overnight and continuous.
Foreign Currency Translations. The books and records of the Fund are maintained in U.S. dollars. Investment securities and other assets and liabilities denominated in a foreign currency are translated into U.S. dollars at the prevailing exchange rates at period end. Purchases and sales of investment securities, income and expenses are translated into U.S. dollars at the prevailing exchange rates on the respective dates of the transactions.
Net realized and unrealized gains and losses on foreign currency transactions represent net gains and losses between trade and settlement dates on securities transactions, the acquisition and disposition of foreign currencies, and the difference between the amount of net investment income accrued and the U.S. dollar amount actually received. The portion of both realized and unrealized gains and losses on investments that results from fluctuations in foreign currency exchange rates is not separately disclosed but is included with net realized and unrealized gain/appreciation and loss/depreciation on investments.
Taxes. The Fund is treated as a separate taxpayer as provided for in the Internal Revenue Code, as amended. It is the Fund's policy to comply with the requirements of the Internal Revenue Code, as amended, which are applicable to regulated investment companies, and to distribute all of its taxable income to the separate accounts of the Participating Insurance Companies which hold its shares.
Additionally, the Fund may be subject to taxes imposed by the governments of countries in which it invests and are generally based on income and/or capital gains earned or repatriated, a portion of which may be recoverable. Based upon the current interpretation of the tax rules and regulations, estimated tax liabilities and recoveries on certain foreign securities are recorded on an accrual basis and are reflected as components of interest income or net change in unrealized gain/loss on investments. Tax liabilities realized as a result of security sales are reflected as a component of net realized gain/loss on investments.
The Fund has reviewed the tax positions for the open tax years as of December 31, 2016 and has determined that no provision for income tax and/or uncertain tax provisions is required in the Fund's financial statements. The Fund's federal tax returns for the prior three fiscal years remain open subject to examination by the Internal Revenue Service.
Distribution of Income and Gains. Distributions from net investment income of the Fund, if any, are declared and distributed to shareholders annually. Net realized gains from investment transactions, in excess of available capital loss carryforwards, would be taxable to the Fund if not distributed, and, therefore, will be distributed to shareholders at least annually. The Fund may also make additional distributions for tax purposes if necessary.
The timing and characterization of certain income and capital gain distributions are determined annually in accordance with federal tax regulations which may differ from accounting principles generally accepted in the United States of America. These differences primarily relate to income received from passive foreign investment companies and certain securities sold at a loss. As a result, net investment income (loss) and net realized gain (loss) on investment transactions for a reporting period may differ significantly from distributions during such period. Accordingly, the Fund may periodically make reclassifications among certain of its capital accounts without impacting the net asset value of the Fund.
The tax character of current year distributions will be determined at the end of the current fiscal year.
Expenses. Expenses of the Trust arising in connection with a specific Fund are allocated to that Fund. Other Trust expenses which cannot be directly attributed to a Fund are apportioned among the Funds in the Trust based upon the relative net assets or other appropriate measures.
Contingencies. In the normal course of business, the Fund may enter into contracts with service providers that contain general indemnification clauses. The Fund's maximum exposure under these arrangements is unknown, as this would involve future claims that may be made against the Fund that have not yet been made. However, based on experience, the Fund expects the risk of loss to be remote.
Other. Investment transactions are accounted for on a trade date plus one basis for daily net asset value calculations. However, for financial reporting purposes, investment transactions are reported on trade date. Interest income is recorded on the accrual basis net of foreign withholding taxes. Dividend income is recorded on the ex-dividend date net of foreign withholding taxes. Certain dividends from foreign securities may be recorded subsequent to the ex-dividend date as soon as the Fund is informed of such dividends. Realized gains and losses from investment transactions are recorded on an identified cost basis. Proceeds from litigation payments, if any, are included in net realized gain (loss) from investments.
B. Purchases and Sales of Securities
During the six months ended June 30, 2017, purchases and sales of investment securities (excluding short-term investments) aggregated $18,455,889 and $24,420,875, respectively.
C. Related Parties
Management Agreement. Under the Investment Management Agreement with Deutsche Investment Management Americas Inc. ("DIMA" or the "Advisor"), an indirect, wholly owned subsidiary of Deutsche Bank AG, the Advisor directs the investments of the Fund in accordance with its investment objectives, policies and restrictions. The Advisor determines the securities, instruments and other contracts relating to investments to be purchased, sold or entered into by the Fund.
Pursuant to the Investment Management Agreement with the Advisor, the Fund pays a monthly management fee based on the Fund's average daily net assets, computed and accrued daily and payable monthly, at the following annual rates:
| First $500 million of average daily net assets | .890% |
| Next $500 million of average daily net assets | .875% |
| Next $1 billion of average daily net assets | .860% |
| Over $2 billion of average daily net assets | .845% |
Accordingly, for the six months ended June 30, 2017, the fee pursuant to the Investment Management Agreement was equivalent to an annualized rate (exclusive of any applicable waivers/reimbursements) of 0.89% of the Fund's average daily net assets.
For the period from January 1, 2017 through April 30, 2018, the Advisor has contractually agreed to waive all or a portion of its fees and/or reimburse certain operating expenses of the Fund to the extent necessary to maintain the total annual operating expenses (excluding certain expenses such as extraordinary expenses, taxes, brokerage and interest) of each class as follows:
For the six months ended June 30, 2017, fees waived and/or expenses reimbursed for each class are as follows:
| Class A | $ 82,902 |
| Class B | 2,546 |
| | $ 85,448 |
Administration Fee. Pursuant to an Administrative Services Agreement, DIMA provides most administrative services to the Fund. For all services provided under the Administrative Services Agreement, the Fund pays the Advisor an annual fee ("Administration Fee") of 0.10% of the Fund's average daily net assets, computed and accrued daily and payable monthly. For the six months ended June 30, 2017, the Administration Fee was $46,519, of which $7,883 is unpaid.
Service Provider Fees. Deutsche AM Service Company ("DSC"), an affiliate of the Advisor, is the transfer agent, dividend-paying agent and shareholder service agent for the Fund. Pursuant to a sub-transfer agency agreement between DSC and DST Systems, Inc. ("DST"), DSC has delegated certain transfer agent, dividend-paying agent and shareholder service agent functions to DST. DSC compensates DST out of the shareholder servicing fee it receives from the Fund. For the six months ended June 30, 2017, the amounts charged to the Fund by DSC were as follows:
| Services to Shareholders | Total Aggregated | Unpaid at June 30, 2017 |
| Class A | $ 238 | $ 111 |
| Class B | 91 | 45 |
| | $ 329 | $ 156 |
Distribution Service Agreement. Deutsche AM Distributors, Inc. ("DDI"), also an affiliate of the Advisor, is the Trust's Distributor. In accordance with the Master Distribution Plan, DDI receives 12b-1 fees of 0.25% of average daily net assets of Class B shares. Pursuant to the Master Distribution Plan, DDI remits these fees to the Participating Insurance Companies for various costs incurred or paid by these companies in connection with marketing and distribution of Class B shares. For the six months ended June 30, 2017, the Distribution Service Fee aggregated $3,326, of which $556 is unpaid.
Typesetting and Filing Service Fees. Under an agreement with DIMA, DIMA is compensated for providing typesetting and certain regulatory filing services to the Fund. For the six months ended June 30, 2017, the amount charged to the Fund by DIMA included in the Statement of Operations under "Reports to shareholders" aggregated $6,094, of which $5,868 is unpaid.
Trustees' Fees and Expenses. The Fund paid retainer fees to each Trustee not affiliated with the Advisor, plus specified amounts to the Board Chairperson and Vice Chairperson and to each committee Chairperson.
Affiliated Cash Management Vehicles. The Fund may invest uninvested cash balances in Deutsche Central Cash Management Government Fund and Deutsche Variable NAV Money Fund, affiliated money market funds which are managed by the Advisor. Each affiliated money market fund is managed in accordance with Rule 2a-7 under the 1940 Act, which governs the quality, maturity, diversity and liquidity of instruments in which a money market fund may invest. Deutsche Central Cash Management Government Fund seeks to maintain a stable net asset value, and Deutsche Variable NAV Money Fund maintains a floating net asset value. The Fund indirectly bears its proportionate share of the expenses of each affiliated money market fund in which it invests. Deutsche Central Cash Management Government Fund does not pay the Advisor an investment management fee. To the extent that Deutsche Variable NAV Money Fund pays an investment management fee to the Advisor, the Advisor will waive an amount of the investment management fee payable to the Advisor by the Fund equal to the amount of the investment management fee payable on the Fund's assets invested in Deutsche Variable NAV Money Fund.
D. Ownership of the Fund
At June 30, 2017, four participating insurance companies were owners of record of 10% or more of the total outstanding Class A shares of the Fund, each owning 40%, 18%,15% and 10%, respectively. Two participating insurance companies were owners of record of 10% or more of the total outstanding Class B shares of the Fund, each owning 70% and 18%, respectively.
E. Line of Credit
The Fund and other affiliated funds (the "Participants") share in a $400 million revolving credit facility provided by a syndication of banks. The Fund may borrow for temporary or emergency purposes, including the meeting of redemption requests that otherwise might require the untimely disposition of securities. The Participants are charged an annual commitment fee which is allocated based on net assets, among each of the Participants. Interest is calculated at a rate per annum equal to the sum of the Federal Funds Rate plus 1.25 percent plus if the one-month LIBOR exceeds the Federal Funds Rate, the amount of such excess. The Fund may borrow up to a maximum of 33 percent of its net assets under the agreement. The Fund had no outstanding loans at June 30, 2017.
Information About Your Fund's Expenses (Unaudited)
As an investor of the Fund, you incur two types of costs: ongoing expenses and transaction costs. Ongoing expenses include management fees, distribution and service (12b-1) fees and other Fund expenses. Examples of transaction costs include contract charges, which are not shown in this section. The following tables are intended to help you understand your ongoing expenses (in dollars) of investing in the Fund and to help you compare these expenses with the ongoing expenses of investing in other mutual funds. In the most recent six-month period, the Fund limited these expenses; had it not done so, expenses would have been higher. The example in the table is based on an investment of $1,000 invested at the beginning of the six-month period and held for the entire period (January 1, 2017 to June 30, 2017).
The tables illustrate your Fund's expenses in two ways:
— Actual Fund Return. This helps you estimate the actual dollar amount of ongoing expenses (but not transaction costs) paid on a $1,000 investment in the Fund using the Fund's actual return during the period. To estimate the expenses you paid over the period, simply divide your account value by $1,000 (for example, an $8,600 account value divided by $1,000 = 8.6), then multiply the result by the number in the "Expenses Paid per $1,000" line under the share class you hold.
— Hypothetical 5% Fund Return. This helps you to compare your Fund's ongoing expenses (but not transaction costs) with those of other mutual funds using the Fund's actual expense ratio and a hypothetical rate of return of 5% per year before expenses. Examples using a 5% hypothetical Fund return may be found in the shareholder reports of other mutual funds. The hypothetical account values and expenses may not be used to estimate the actual ending account balance or expenses you paid for the period.
Please note that the expenses shown in these tables are meant to highlight your ongoing expenses only and do not reflect any transaction costs. The "Expenses Paid per $1,000" line of the tables is useful in comparing ongoing expenses only and will not help you determine the relative total expense of owning different funds. If these transaction costs had been included, your costs would have been higher.
| Expenses and Value of a $1,000 Investment for the six months ended June 30, 2017 |
| Actual Fund Return | Class A | | Class B | |
| Beginning Account Value 1/1/17 | $ 1,000.00 | | $ 1,000.00 | |
| Ending Account Value 6/30/17 | $ 1,099.70 | | $ 1,097.20 | |
| Expenses Paid per $1,000* | $ 5.15 | | $ 6.60 | |
| Hypothetical 5% Fund Return | Class A | | Class B | |
| Beginning Account Value 1/1/17 | $ 1,000.00 | | $ 1,000.00 | |
| Ending Account Value 6/30/17 | $ 1,019.89 | | $ 1,018.50 | |
| Expenses Paid per $1,000* | $ 4.96 | | $ 6.36 | |
* Expenses are equal to the Fund's annualized expense ratio for each share class, multiplied by the average account value over the period, multiplied by 181 (the number of days in the most recent six-month period), then divided by 365.
| Annualized Expense Ratios | | Class A | | Class B | |
| Deutsche Variable Series I — Deutsche Global Small Cap VIP | | .99% | | 1.27% | |
For more information, please refer to the Fund's prospectus.
These tables do not reflect charges and fees ("contract charges") associated with the separate account that invests in the Fund or any variable life insurance policy or variable annuity contract for which the Fund is an investment option.
For an analysis of the fees associated with an investment in the fund or similar funds, please refer to the current and hypothetical expense calculators for Variable Insurance Products which can be found at deutschefunds.com/EN/resources/calculators.jsp.
Proxy Voting
The Trust's policies and procedures for voting proxies for portfolio securities and information about how the Trust voted proxies related to its portfolio securities during the most recent 12-month period ended June 30 are available on our Web site — deutschefunds.com (click on "proxy voting"at the bottom of the page) — or on the SEC's Web site — sec.gov. To obtain a written copy of the Trust's policies and procedures without charge, upon request, call us toll free at (800) 728-3337.
Advisory Agreement Board Considerations and Fee Evaluation
The Board of Trustees (hereinafter referred to as the "Board" or "Trustees") approved the renewal of Deutsche Global Small Cap VIP’s (the "Fund") investment management agreement (the "Agreement") with Deutsche Investment Management Americas Inc. ("DIMA") in September 2016.
In terms of the process that the Board followed prior to approving the Agreement, shareholders should know that:
— During the entire process, all of the Fund’s Trustees were independent of DIMA and its affiliates (the "Independent Trustees").
— The Board met frequently during the past year to discuss fund matters and dedicated a substantial amount of time to contract review matters. Over the course of several months, the Board’s Contract Committee reviewed extensive materials received from DIMA, independent third parties and independent counsel. These materials included an analysis of the Fund’s performance, fees and expenses, and profitability from a fee consultant retained by the Fund’s Independent Trustees (the "Fee Consultant"). The Board also received extensive information throughout the year regarding performance of the Fund.
— The Independent Trustees regularly meet privately with counsel to discuss contract review and other matters. In addition, the Independent Trustees were advised by the Fee Consultant in the course of their review of the Fund’s contractual arrangements and considered a comprehensive report prepared by the Fee Consultant in connection with their deliberations.
— In connection with reviewing the Agreement, the Board also reviewed the terms of the Fund’s Rule 12b-1 plan, distribution agreement, administrative services agreement, transfer agency agreement and other material service agreements.
— Based on its evaluation of the information provided, the Contract Committee presented its findings and recommendations to the Board. The Board then reviewed the Contract Committee’s findings and recommendations.
In connection with the contract review process, the Contract Committee and the Board considered the factors discussed below, among others. The Board also considered that DIMA and its predecessors have managed the Fund since its inception, and the Board believes that a long-term relationship with a capable, conscientious advisor is in the best interests of the Fund. The Board considered, generally, that shareholders chose to invest or remain invested in the Fund knowing that DIMA managed the Fund, and that the Agreement was approved by the Fund’s shareholders. DIMA is part of Deutsche Bank AG’s ("Deutsche Bank") Asset Management ("Deutsche AM") division. Deutsche AM is a global asset management business that offers a wide range of investing expertise and resources, including research capabilities in many countries throughout the world. Deutsche Bank has advised the Board that the U.S. asset management business continues to be a critical and integral part of Deutsche Bank, and that Deutsche Bank will continue to invest in Deutsche AM and seek to enhance Deutsche AM’s investment platform. Deutsche Bank also has confirmed its commitment to maintaining strong legal and compliance groups within the Deutsche AM division.
As part of the contract review process, the Board carefully considered the fees and expenses of each Deutsche fund overseen by the Board in light of the fund’s performance. In many cases, this led to the negotiation and implementation of expense caps. As part of these negotiations, the Board indicated that it would consider relaxing these caps in future years following sustained improvements in performance, among other considerations.
While shareholders may focus primarily on fund performance and fees, the Fund’s Board considers these and many other factors, including the quality and integrity of DIMA’s personnel and such other issues as back-office operations, fund valuations, and compliance policies and procedures.
Nature, Quality and Extent of Services. The Board considered the terms of the Agreement, including the scope of advisory services provided under the Agreement. The Board noted that, under the Agreement, DIMA provides portfolio management services to the Fund and that, pursuant to a separate administrative services agreement, DIMA provides administrative services to the Fund. The Board considered the experience and skills of senior management and investment personnel and the resources made available to such personnel. The Board reviewed the Fund’s performance over short-term and long-term periods and compared those returns to various agreed-upon performance measures, including market index(es) and a peer universe compiled using information supplied by Morningstar Direct ("Morningstar"), an independent fund data service. The Board also noted that it has put into place a process of identifying "Focus Funds" (e.g., funds performing poorly relative to a peer universe), and receives additional reporting from DIMA regarding such funds and, where appropriate, DIMA’s plans to address underperformance. The Board believes this process is an effective manner of identifying and addressing underperforming funds. Based on the information provided, the Board noted that for the one-, three- and five-year periods ended December 31, 2015, the Fund’s performance (Class A shares) was in the 2nd quartile, 2nd quartile and 3rd quartile, respectively, of the applicable Morningstar universe (the 1st quartile being the best performers and the 4th quartile being the worst performers). The Board also observed that the Fund has outperformed its benchmark in the one-year period and has underperformed its benchmark in the three- and five-year periods ended December 31, 2015. The Board observed that there were significant limitations to the usefulness of the comparative data provided by Morningstar, noting that the applicable Morningstar universe for the Fund included funds that pursue substantially different investment programs as compared to that pursued by the Fund.
Fees and Expenses. The Board considered the Fund’s investment management fee schedule, operating expenses and total expense ratios, and comparative information provided by Broadridge Financial Solutions, Inc. ("Broadridge") and the Fee Consultant regarding investment management fee rates paid to other investment advisors by similar funds (1st quartile being the most favorable and 4th quartile being the least favorable). With respect to management fees paid to other investment advisors by similar funds, the Board noted that the contractual fee rates paid by the Fund, which include a 0.10% fee paid to DIMA under the Fund’s administrative services agreement, were higher than the median (4th quartile) of the applicable Broadridge peer group (based on Broadridge data provided as of December 31, 2015). The Board noted that the Fund’s Class A shares total (net) operating expenses were expected to be higher than the median (3rd quartile) of the applicable Broadridge expense universe (based on Broadridge data provided as of December 31, 2015, and analyzing Broadridge expense universe Class A (net) expenses less any applicable 12b-1 fees) ("Broadridge Universe Expenses"). The Board also reviewed data comparing each share class’s total (net) operating expenses to the applicable Broadridge Universe Expenses. The Board noted that the expense limitations agreed to by DIMA were expected to help the Fund’s total (net) operating expenses remain competitive. The Board also observed that the Broadridge expense universe for the Fund included funds that pursue substantially different investment programs as compared to that pursued by the Fund. The Board considered the Fund’s management fee rate as compared to fees charged by DIMA to a comparable Deutsche U.S. registered fund ("Deutsche Funds") and considered differences between the Fund and the comparable Deutsche Fund. The information requested by the Board as part of its review of fees and expenses also included information about institutional accounts (including any sub-advised funds and accounts) and funds offered primarily to European investors ("Deutsche Europe funds") managed by Deutsche AM. The Board noted that DIMA indicated that Deutsche AM manages an institutional account comparable to the Fund, but that Deutsche AM does not manage any comparable Deutsche Europe funds. The Board took note of the differences in services provided to Deutsche Funds as compared to institutional accounts and that such differences made comparison difficult.
On the basis of the information provided, the Board concluded that management fees were reasonable and appropriate in light of the nature, quality and extent of services provided by DIMA.
Profitability. The Board reviewed detailed information regarding revenues received by DIMA under the Agreement. The Board considered the estimated costs and pre-tax profits realized by DIMA from advising the Deutsche Funds, as well as estimates of the pre-tax profits attributable to managing the Fund in particular. The Board also received information regarding the estimated enterprise-wide profitability of DIMA and its affiliates with respect to all fund services in totality and by fund. The Board and the Fee Consultant reviewed DIMA’s methodology in allocating its costs to the management of the Fund. Based on the information provided, the Board concluded that the pre-tax profits realized by DIMA in connection with the management of the Fund were not unreasonable. The Board also reviewed certain publicly available information regarding the profitability of certain similar investment management firms. The Board noted that while information regarding the profitability of such firms is limited (and in some cases is not necessarily prepared on a comparable basis), DIMA and its affiliates’ overall profitability with respect to the Deutsche Funds (after taking into account distribution and other services provided to the funds by DIMA and its affiliates) was lower than the overall profitability levels of most comparable firms for which such data was available.
Economies of Scale. The Board considered whether there are economies of scale with respect to the management of the Fund and whether the Fund benefits from any economies of scale. The Board noted that the Fund’s investment management fee schedule includes fee breakpoints. The Board concluded that the Fund’s fee schedule represents an appropriate sharing between the Fund and DIMA of such economies of scale as may exist in the management of the Fund at current asset levels.
Other Benefits to DIMA and Its Affiliates. The Board also considered the character and amount of other incidental benefits received by DIMA and its affiliates, including any fees received by DIMA for administrative services provided to the Fund and any fees received by an affiliate of DIMA for distribution services. The Board also considered benefits to DIMA related to brokerage and soft-dollar allocations, including allocating brokerage to pay for research generated by parties other than the executing broker dealers, which pertain primarily to funds investing in equity securities, along with the incidental public relations benefits to DIMA related to Deutsche Funds advertising and cross-selling opportunities among DIMA products and services. The Board considered these benefits in reaching its conclusion that the Fund’s management fees were reasonable.
Compliance. The Board considered the significant attention and resources dedicated by DIMA to documenting and enhancing its compliance processes in recent years. The Board noted in particular (i) the experience, seniority and time commitment of the individuals serving as DIMA’s and the Fund’s chief compliance officers; (ii) the large number of DIMA compliance personnel; and (iii) the substantial commitment of resources by DIMA and its affiliates to compliance matters.
Based on all of the information considered and the conclusions reached, the Board unanimously determined that the continuation of the Agreement is in the best interests of the Fund. In making this determination, the Board did not give particular weight to any single factor identified above. The Board considered these factors over the course of numerous meetings, certain of which were in executive session with only the Independent Trustees and counsel present. It is possible that individual Independent Trustees may have weighed these factors differently in reaching their individual decisions to approve the continuation of the Agreement.
Notes

VS1glosc-3 (R-028377-6 8/17)
| | |
| ITEM 2. | CODE OF ETHICS |
| | |
| | Not applicable. |
| | |
| ITEM 3. | AUDIT COMMITTEE FINANCIAL EXPERT |
| | |
| | Not applicable |
| | |
| ITEM 4. | PRINCIPAL ACCOUNTANT FEES AND SERVICES |
| | |
| | Not applicable |
| | |
| ITEM 5. | AUDIT COMMITTEE OF LISTED REGISTRANTS |
| | |
| | Not applicable |
| | |
| ITEM 6. | SCHEDULE OF INVESTMENTS |
| | |
| | Not applicable |
| | |
| ITEM 7. | DISCLOSURE OF PROXY VOTING POLICIES AND PROCEDURES FOR CLOSED-END MANAGEMENT INVESTMENT COMPANIES |
| | |
| | Not applicable |
| | |
| ITEM 8. | PORTFOLIO MANAGERS OF CLOSED-END MANAGEMENT INVESTMENT COMPANIES |
| | |
| | Not applicable |
| | |
| ITEM 9. | PURCHASES OF EQUITY SECURITIES BY CLOSED-END MANAGEMENT INVESTMENT COMPANY AND AFFILIATED PURCHASERS |
| | |
| | Not applicable |
| | |
| ITEM 10. | SUBMISSION OF MATTERS TO A VOTE OF SECURITY HOLDERS |
| | |
| | There were no material changes to the procedures by which shareholders may recommend nominees to the Fund’s Board. The primary function of the Nominating and Governance Committee is to identify and recommend individuals for membership on the Board and oversee the administration of the Board Governance Guidelines. Shareholders may recommend candidates for Board positions by forwarding their correspondence by U.S. mail or courier service to Keith R. Fox, Deutsche Funds Board Chair, c/o Thomas R. Hiller, Ropes & Gray LLP, Prudential Tower, 800 Boylston Street, Boston, MA 02199-3600. |
| | |
| ITEM 11. | CONTROLS AND PROCEDURES |
| | |
| | (a) | The Chief Executive and Financial Officers concluded that the Registrant’s Disclosure Controls and Procedures are effective based on the evaluation of the Disclosure Controls and Procedures as of a date within 90 days of the filing date of this report. |
| | |
| | (b) | There have been no changes in the registrant’s internal control over financial reporting that occurred during the second fiscal quarter of the period covered by this report that has materially affected, or is reasonably likely to materially affect, the registrant’s internal controls over financial reporting. |
| | |
ITEM 12. | EXHIBITS |
| | |
| | (a)(1) | Not applicable |
| | |
| | (a)(2) | Certification pursuant to Rule 30a-2(a) under the Investment Company Act of 1940 (17 CFR 270.30a-2(a)) is filed and attached hereto as Exhibit 99.CERT. |
| | |
| | (b) | Certification pursuant to Rule 30a-2(b) under the Investment Company Act of 1940 (17 CFR 270.30a-2(b)) is furnished and attached hereto as Exhibit 99.906CERT. |
SIGNATURES
Pursuant to the requirements of the Securities Exchange Act of 1934 and the Investment Company Act of 1940, the registrant has duly caused this report to be signed on its behalf by the undersigned, thereunto duly authorized.
| Registrant: | Deutsche Variable Series I |
| | |
| | |
| By: | /s/Brian E. Binder Brian E. Binder President |
| | |
| Date: | 8/22/2017 |
Pursuant to the requirements of the Securities Exchange Act of 1934 and the Investment Company Act of 1940, this report has been signed below by the following persons on behalf of the registrant and in the capacities and on the dates indicated.
| By: | /s/Brian E. Binder Brian E. Binder President |
| | |
| Date: | 8/22/2017 |
| | |
| | |
| | |
| By: | /s/Paul Schubert Paul Schubert Chief Financial Officer and Treasurer |
| | |
| Date: | 8/22/2017 |