UNITED STATES
SECURITIES AND EXCHANGE COMMISSION
WASHINGTON, D. C. 20549
FORM N-CSRS
Investment Company Act file number: 811-04257
DWS Variable Series I
(Exact Name of Registrant as Specified in Charter)
345 Park Avenue
New York, NY 10154-0004
(Address of Principal Executive Offices) (Zip Code)
Registrant’s Telephone Number, including Area Code: (212) 250-3220
Paul Schubert
60 Wall Street
New York, NY 10005
(Name and Address of Agent for Service)
| Date of fiscal year end: | 12/31 |
| | |
| Date of reporting period: | 6/30/2013 |
| ITEM 1. | REPORT TO STOCKHOLDERS |
| | |
JUNE 30, 2013
SEMIANNUAL REPORT
DWS VARIABLE SERIES I
DWS Bond VIP
Contents
20 Statement of Assets and Liabilities 21 Statement of Operations 22 Statement of Changes in Net Assets 24 Notes to Financial Statements 33 Information About Your Fund's Expenses 35 Summary of Management Fee Evaluation by Independent Fee Consultant |
This report must be preceded or accompanied by a prospectus. To obtain an additional prospectus or summary prospectus, if available, call (800) 728-3337 or your financial representative. We advise you to consider the Fund's objectives, risks, charges and expenses carefully before investing. The summary prospectus and prospectus contain this and other important information about the Fund. Please read the prospectus carefully before you invest.
Bond investments are subject to interest-rate and credit risks. When interest rates rise, bond prices generally fall. Credit risk refers to the ability of an issuer to make timely payments of principal and interest. Investments in lower-quality ("junk bonds") and non-rated securities present greater risk of loss than investments in higher-quality securities. Investing in derivatives entails special risks relating to liquidity, leverage and credit that may reduce returns and/or increase volatility. Investing in foreign securities, particularly those of emerging markets, presents certain risks, such as currency fluctuations, political and economic changes, and market risks. See the prospectus for details.
DWS Investments is part of the Deutsche Asset & Wealth Management division of Deutsche Bank AG.
NOT FDIC/NCUA INSURED NO BANK GUARANTEE MAY LOSE VALUE NOT A DEPOSIT
NOT INSURED BY ANY FEDERAL GOVERNMENT AGENCY
Performance Summary June 30, 2013 (Unaudited)
Fund performance shown is historical, assumes reinvestment of all dividend and capital gain distributions, and does not guarantee future results. Investment return and principal value fluctuate with changing market conditions so that, when redeemed, shares may be worth more or less than their original cost. Current performance may be lower or higher than the performance data quoted. Please contact your participating insurance company for the Fund's most recent month-end performance. Performance doesn't reflect charges and fees ("contract charges") associated with the separate account that invests in the Fund or any variable life insurance policy or variable annuity contract for which the Fund is an investment option. These charges and fees will reduce returns.
The gross expense ratio of the Fund, as stated in the fee table of the prospectus dated May 1, 2013 is 0.58% for Class A shares and may differ from the expense ratio disclosed in the Financial Highlights table in this report.
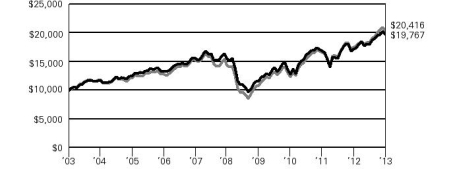
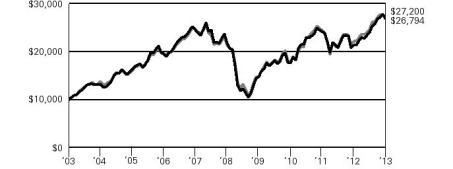
| Growth of an Assumed $10,000 Investment |
| The Barclays U.S. Aggregate Bond Index is an unmanaged index representing domestic taxable investment-grade bonds, with index components for government and corporate securities, mortgage pass-through securities, and asset-backed securities with an average maturity of one year or more. Index returns do not reflect any fees or expenses and it is not possible to invest directly into an index. |
| |
| Yearly periods ended June 30 | |
| Comparative Results | |
| DWS Bond VIP | | 6-Month‡ | | | 1-Year | | | 3-Year | | | 5-Year | | | 10-Year | |
| Class A | Growth of $10,000 | | $ | 9,609 | | | $ | 9,982 | | | $ | 11,162 | | | $ | 10,885 | | | $ | 12,701 | |
| Average annual total return | | | -3.91 | % | | | -0.18 | % | | | 3.73 | % | | | 1.71 | % | | | 2.42 | % |
| Barclays U.S. Aggregate Bond Index | Growth of $10,000 | | $ | 9,756 | | | $ | 9,931 | | | $ | 11,090 | | | $ | 12,878 | | | $ | 15,559 | |
| Average annual total return | | | -2.44 | % | | | -0.69 | % | | | 3.51 | % | | | 5.19 | % | | | 4.52 | % |
The growth of $10,000 is cumulative.
‡ Total returns shown for periods less than one year are not annualized.
Portfolio Summary (Unaudited)
Asset Allocation (As a % of Total Net Assets) | 6/30/13 | 12/31/12 |
| | | |
| Corporate Bonds | 38% | 35% |
| Mortgage-Backed Securities Pass-Throughs | 36% | 34% |
| Government & Agency Obligations | 22% | 22% |
| Commercial Mortgage-Backed Securities | 7% | 5% |
| Collateralized Mortgage Obligations | 5% | 5% |
| Municipal Bonds and Notes | 5% | 6% |
| Loan Participations and Assignments | 2% | 1% |
| Asset-Backed | 2% | 1% |
| Cash Equivalents and other Assets and Liabilities, net | -17% | -9% |
| | 100% | 100% |
Quality (Excludes Cash Equivalents and Securities Lending Collateral) | 6/30/13 | 12/31/12 |
| | | |
| AAA | 55% | 53% |
| AA | 8% | 7% |
| A | 8% | 8% |
| BBB | 16% | 18% |
| BB or Below | 10% | 11% |
| Not Rated | 3% | 3% |
| | 100% | 100% |
| Interest Rate Sensitivity | 6/30/13 | 12/31/12 |
| | | |
| Effective Maturity | 9.4 years | 7.9 years |
| Effective Duration | 6.1 years | 4.9 years |
The quality ratings represent the higher of Moody's Investors Service, Inc. ("Moody's") or Standard & Poor's Corporation ("S&P") credit ratings. The ratings of Moody's and S&P represent their opinions as to the quality of the securities they rate. Credit quality measures a bond issuer's ability to repay interest and principal in a timely manner. Ratings are relative and subjective and are not absolute standards of quality. Credit quality does not remove market risk and is subject to change.
Effective maturity is the weighted average of the maturity date of bonds held by the Fund taking into consideration any available maturity shortening features.
Effective duration is an approximate measure of the Fund's sensitivity to interest rate changes taking into consideration any maturity shortening features.
Portfolio holdings and characteristics are subject to change.
For more complete details about the Fund's investment portfolio, see page 7.
Following the Fund's fiscal first and third quarter-end, a complete portfolio holdings listing is filed with the SEC on Form N-Q. The form will be available on the SEC's Web site at www.sec.gov, and it also may be reviewed and copied at the SEC's Public Reference Room in Washington, D.C. Information on the operation of the SEC's Public Reference Room may be obtained by calling (800) SEC-0330. The Fund's portfolio holdings are also posted on www.dws-investments.com from time to time. Please see the Fund's current prospectus for more information.
William Chepolis, CFA
John D. Ryan
Gary Russell, CFA
Portfolio Managers
Investment Portfolio June 30, 2013 (Unaudited) | | | Principal Amount ($)(a) | | | Value ($) | |
| | | | |
| Corporate Bonds 37.7% | |
| Consumer Discretionary 3.0% | |
| AMC Entertainment, Inc., 8.75%, 6/1/2019 | | | | 115,000 | | | | 123,050 | |
| APX Group, Inc., 144A, 6.375%, 12/1/2019 | | | | 15,000 | | | | 14,250 | |
| Asbury Automotive Group, Inc., 144A, 8.375%, 11/15/2020 | | | | 5,000 | | | | 5,538 | |
| Ashton Woods U.S.A. LLC, 144A, 6.875%, 2/15/2021 | | | | 25,000 | | | | 25,250 | |
| Avis Budget Car Rental LLC, 144A, 5.5%, 4/1/2023 | | | | 15,000 | | | | 14,475 | |
| BC Mountain LLC, 144A, 7.0%, 2/1/2021 | | | | 15,000 | | | | 15,300 | |
| Boyd Gaming Corp., 9.0%, 7/1/2020 (b) | | | | 10,000 | | | | 10,138 | |
| British Sky Broadcasting Group PLC, 144A, 3.125%, 11/26/2022 | | | | 330,000 | | | | 308,588 | |
| Caesar's Entertainment Operating Co., Inc., 8.5%, 2/15/2020 | | | | 185,000 | | | | 174,362 | |
| Caesar's Operating Escrow LLC, 144A, 9.0%, 2/15/2020 | | | | 15,000 | | | | 14,288 | |
| CCO Holdings LLC, 6.5%, 4/30/2021 | | | | 155,000 | | | | 161,587 | |
| CDR DB Sub, Inc., 144A, 7.75%, 10/15/2020 | | | | 15,000 | | | | 15,037 | |
| Cequel Communications Holdings I LLC, 144A, 6.375%, 9/15/2020 | | | | 80,000 | | | | 81,400 | |
| Clear Channel Communications, Inc., 144A, 11.25%, 3/1/2021 | | | | 20,000 | | | | 20,850 | |
| Clear Channel Worldwide Holdings, Inc.: | | |
| Series A, 144A, 6.5%, 11/15/2022 | | | | 15,000 | | | | 15,375 | |
| Series B, 144A, 6.5%, 11/15/2022 | | | | 25,000 | | | | 25,750 | |
| Series B, 7.625%, 3/15/2020 | | | | 75,000 | | | | 77,625 | |
| Cox Communications, Inc., 144A, 3.25%, 12/15/2022 | | | | 230,000 | | | | 216,390 | |
| Cumulus Media Holdings, Inc., 7.75%, 5/1/2019 | | | | 5,000 | | | | 4,888 | |
| Delphi Corp., 5.0%, 2/15/2023 | | | | 20,000 | | | | 20,550 | |
| DIRECTV Holdings LLC, 2.4%, 3/15/2017 | | | | 1,050,000 | | | | 1,055,075 | |
| DISH DBS Corp., 7.875%, 9/1/2019 | | | | 90,000 | | | | 100,800 | |
| Griffey Intermediate, Inc., 144A, 7.0%, 10/15/2020 | | | | 25,000 | | | | 24,125 | |
| Hot Topic, Inc., 144A, 9.25%, 6/15/2021 | | | | 10,000 | | | | 10,125 | |
| Jo-Ann Stores Holdings, Inc., 144A, 9.75%, 10/15/2019 (PIK) | | | | 15,000 | | | | 15,412 | |
| Macy's Retail Holdings, Inc., 3.875%, 1/15/2022 | | | | 300,000 | | | | 300,783 | |
| MDC Partners, Inc., 144A, 6.75%, 4/1/2020 | | | | 15,000 | | | | 14,963 | |
| | | Principal Amount ($)(a) | | | Value ($) | |
| | | | | | | | | |
| Mediacom Broadband LLC, 6.375%, 4/1/2023 | | | | 10,000 | | | | 9,950 | |
| Mediacom LLC, 9.125%, 8/15/2019 | | | | 85,000 | | | | 91,375 | |
| MGM Resorts International: | |
| 6.625%, 12/15/2021 | | | | 40,000 | | | | 41,250 | |
| 6.75%, 10/1/2020 (b) | | | | 10,000 | | | | 10,350 | |
| 8.625%, 2/1/2019 | | | | 105,000 | | | | 118,650 | |
| Norcraft Companies LP, 10.5%, 12/15/2015 | | | | 65,000 | | | | 67,437 | |
| Petco Holdings, Inc., 144A, 8.5%, 10/15/2017 (PIK) | | | | 5,000 | | | | 5,100 | |
| Quebecor Media, Inc., 5.75%, 1/15/2023 | | | | 15,000 | | | | 14,625 | |
| SACI Falabella, 144A, 3.75%, 4/30/2023 | | | | 200,000 | | | | 183,000 | |
| Serta Simmons Holdings LLC, 144A, 8.125%, 10/1/2020 | | | | 15,000 | | | | 15,262 | |
| SIWF Merger Sub, Inc., 144A, 6.25%, 6/1/2021 | | | | 10,000 | | | | 9,800 | |
| Starz LLC, 5.0%, 9/15/2019 | | | | 10,000 | | | | 9,925 | |
| Taylor Morrison Communities, Inc., 144A, 5.25%, 4/15/2021 | | | | 15,000 | | | | 14,250 | |
| Viking Cruises Ltd., 144A, 8.5%, 10/15/2022 | | | | 15,000 | | | | 16,425 | |
| | | | | 3,473,373 | |
| Consumer Staples 1.4% | |
| Anadolu Efes Biracilik Ve Malt Sanayii AS, 144A, 3.375%, 11/1/2022 | | | | 250,000 | | | | 215,000 | |
| B&G Foods, Inc., 4.625%, 6/1/2021 | | | | 15,000 | | | | 14,325 | |
| Chiquita Brands International, Inc., 144A, 7.875%, 2/1/2021 | | | | 15,000 | | | | 15,713 | |
| ConAgra Foods, Inc., 3.25%, 9/15/2022 | | | | 350,000 | | | | 333,893 | |
| Controladora Mabe SA de CV, 144A, 7.875%, 10/28/2019 | | | | 200,000 | | | | 214,000 | |
| Del Monte Corp., 7.625%, 2/15/2019 | | | | 25,000 | | | | 25,687 | |
| Hawk Acquisition Sub, Inc., 144A, 4.25%, 10/15/2020 | | | | 125,000 | | | | 119,531 | |
| JBS U.S.A. LLC, 144A, 8.25%, 2/1/2020 | | | | 115,000 | | | | 120,462 | |
| Pilgrim's Pride Corp., 7.875%, 12/15/2018 | | | | 115,000 | | | | 122,475 | |
| Reynolds Group Issuer, Inc.: | |
| 5.75%, 10/15/2020 | | | | 25,000 | | | | 25,188 | |
| 7.125%, 4/15/2019 | | | | 265,000 | | | | 279,906 | |
| Smithfield Foods, Inc., 6.625%, 8/15/2022 | | | | 35,000 | | | | 37,625 | |
| Sun Products Corp., 144A, 7.75%, 3/15/2021 | | | | 25,000 | | | | 24,813 | |
| Tops Holding Corp., 144A, 8.875%, 12/15/2017 | | | | 5,000 | | | | 5,413 | |
| | | | | 1,554,031 | |
| Energy 4.4% | |
| Access Midstream Partners LP, 4.875%, 5/15/2023 | | | | 15,000 | | | | 13,913 | |
| | | Principal Amount ($)(a) | | | Value ($) | |
| | | | | | | | | |
| Berry Petroleum Co.: | |
| 6.375%, 9/15/2022 | | | | 15,000 | | | | 14,944 | |
| 6.75%, 11/1/2020 | | | | 15,000 | | | | 15,525 | |
| BreitBurn Energy Partners LP, 7.875%, 4/15/2022 | | | | 15,000 | | | | 15,300 | |
| Chaparral Energy, Inc., 7.625%, 11/15/2022 | | | | 25,000 | | | | 25,500 | |
| Chesapeake Energy Corp., 5.75%, 3/15/2023 | | | | 10,000 | | | | 10,125 | |
| Continental Resources, Inc.: | |
| 144A, 4.5%, 4/15/2023 | | | | 5,000 | | | | 4,863 | |
| 5.0%, 9/15/2022 | | | | 15,000 | | | | 15,262 | |
| DCP Midstream LLC, 144A, 9.75%, 3/15/2019 | | | | 760,000 | | | | 980,120 | |
| DCP Midstream Operating LP, 3.875%, 3/15/2023 | | | | 250,000 | | | | 234,471 | |
| Denbury Resources, Inc., 4.625%, 7/15/2023 | | | | 35,000 | | | | 32,287 | |
| Eagle Rock Energy Partners LP, 8.375%, 6/1/2019 | | | | 25,000 | | | | 25,437 | |
| EDC Finance Ltd., 144A, 4.875%, 4/17/2020 | | | | 200,000 | | | | 183,000 | |
| Enterprise Products Operating LLC, 6.125%, 10/15/2039 | | | | 460,000 | | | | 511,557 | |
| EP Energy LLC, 7.75%, 9/1/2022 | | | | 25,000 | | | | 26,750 | |
| EPE Holdings LLC, 144A, 8.125%, 12/15/2017 (PIK) | | | | 26,072 | | | | 26,593 | |
| FMC Technologies, Inc., 3.45%, 10/1/2022 | | | | 300,000 | | | | 287,380 | |
| Halcon Resources Corp.: | |
| 8.875%, 5/15/2021 | | | | 35,000 | | | | 33,950 | |
| 9.75%, 7/15/2020 | | | | 15,000 | | | | 14,963 | |
| KazMunayGas National Co. JSC, 144A, 5.75%, 4/30/2043 | | | | 200,000 | | | | 177,000 | |
| Kodiak Oil & Gas Corp., 144A, 5.5%, 1/15/2021 | | | | 15,000 | | | | 14,625 | |
| Linn Energy LLC, 144A, 6.25%, 11/1/2019 | | | | 150,000 | | | | 142,875 | |
| MEG Energy Corp., 144A, 6.375%, 1/30/2023 | | | | 45,000 | | | | 43,650 | |
| Memorial Production Partners LP, 144A, 7.625%, 5/1/2021 | | | | 25,000 | | | | 24,625 | |
| Midstates Petroleum Co., Inc.: | |
| 144A, 9.25%, 6/1/2021 | | | | 30,000 | | | | 28,200 | |
| 144A, 10.75%, 10/1/2020 | | | | 15,000 | | | | 15,075 | |
| Oasis Petroleum, Inc.: | |
| 6.5%, 11/1/2021 | | | | 75,000 | | | | 76,875 | |
| 6.875%, 1/15/2023 | | | | 15,000 | | | | 15,450 | |
| Odebrecht Drilling Norbe VIII/IX Ltd., 144A, 6.35%, 6/30/2021 | | | | 95,000 | | | | 95,950 | |
| Offshore Group Investment Ltd.: | |
| 144A, 7.125%, 4/1/2023 | | | | 25,000 | | | | 24,562 | |
| 7.5%, 11/1/2019 (b) | | | | 40,000 | | | | 41,700 | |
| ONEOK Partners LP, 6.15%, 10/1/2016 | | | | 878,000 | | | | 1,000,967 | |
| Pacific Drilling SA, 144A, 5.375%, 6/1/2020 | | | | 15,000 | | | | 14,025 | |
| Plains Exploration & Production Co., 6.75%, 2/1/2022 | | | | 5,000 | | | | 5,299 | |
| Range Resources Corp., 5.0%, 3/15/2023 | | | | 5,000 | | | | 4,888 | |
| | | Principal Amount ($)(a) | | | Value ($) | |
| | | | | | | | | |
| SandRidge Energy, Inc., 7.5%, 3/15/2021 | | | | 55,000 | | | | 52,525 | |
| Talos Production LLC, 144A, 9.75%, 2/15/2018 | | | | 25,000 | | | | 23,750 | |
| Tesoro Corp., 5.375%, 10/1/2022 | | | | 10,000 | | | | 10,125 | |
| Transocean, Inc., 3.8%, 10/15/2022 | | | | 555,000 | | | | 528,666 | |
| Transportadora de Gas Internacional SA ESP, 144A, 5.7%, 3/20/2022 | | | | 200,000 | | | | 206,500 | |
| | | | | 5,019,272 | |
| Financials 15.2% | |
| American International Group, Inc., 4.875%, 6/1/2022 (b) | | | | 400,000 | | | | 426,370 | |
| American Tower Corp., (REIT), 3.5%, 1/31/2023 | | | | 280,000 | | | | 256,389 | |
| Atlantic Finance Ltd., (REIT), 144A, 10.75%, 5/27/2014 | | | | 500,000 | | | | 528,662 | |
| Bank of America Corp., 3.3%, 1/11/2023 | | | | 800,000 | | | | 756,118 | |
| Barclays Bank PLC, 7.625%, 11/21/2022 (b) | | | | 1,090,000 | | | | 1,069,562 | |
| BBVA Bancomer SA, 144A, 6.75%, 9/30/2022 | | | | 200,000 | | | | 216,000 | |
| CNA Financial Corp., 5.75%, 8/15/2021 | | | | 500,000 | | | | 562,759 | |
| CNH Capital LLC, 144A, 3.625%, 4/15/2018 | | | | 15,000 | | | | 14,288 | |
| Cooperatieve Centrale Raiffeisen-Boerenleenbank BA, 3.95%, 11/9/2022 | | | | 525,000 | | | | 502,043 | |
| Development Bank of Kazakhstan JSC, Series 3, 6.5%, 6/3/2020 | | | | 500,000 | | | | 525,000 | |
| E*TRADE Financial Corp.: | |
| 6.375%, 11/15/2019 | | | | 40,000 | | | | 40,600 | |
| 6.75%, 6/1/2016 | | | | 205,000 | | | | 210,638 | |
| Ford Motor Credit Co., LLC, 3.0%, 6/12/2017 | | | | 485,000 | | | | 486,022 | |
| General Electric Capital Corp., 3.1%, 1/9/2023 | | | | 1,000,000 | | | | 944,666 | |
| Glencore Funding LLC, 144A, 4.125%, 5/30/2023 | | | | 100,000 | | | | 89,188 | |
| Hartford Financial Services Group, Inc.: | |
| 4.3%, 4/15/2043 | | | | 615,000 | | | | 532,674 | |
| 6.0%, 1/15/2019 | | | | 117,000 | | | | 131,894 | |
| ING Bank NV, 144A, 2.0%, 9/25/2015 | | | | 1,310,000 | | | | 1,321,109 | |
| International Lease Finance Corp.: | |
| 4.625%, 4/15/2021 | | | | 25,000 | | | | 23,000 | |
| 6.25%, 5/15/2019 | | | | 5,000 | | | | 5,138 | |
| Intesa Sanpaolo SpA, 3.875%, 1/16/2018 | | | | 895,000 | | | | 859,389 | |
| Jefferies Group LLC, 5.125%, 1/20/2023 (b) | | | | 300,000 | | | | 297,687 | |
| JPMorgan Chase & Co., 5.125%, 9/15/2014 | | | | 1,100,000 | | | | 1,154,080 | |
| Loews Corp., 2.625%, 5/15/2023 | | | | 160,000 | | | | 145,534 | |
| Macquarie Bank Ltd., 144A, 3.45%, 7/27/2015 | | | | 525,000 | | | | 544,068 | |
| Mizuho Corporate Bank Ltd., 144A, 2.95%, 10/17/2022 | | | | 500,000 | | | | 458,549 | |
| | | Principal Amount ($)(a) | | | Value ($) | |
| | | | | | | | | |
| Morgan Stanley: | |
| 3.75%, 2/25/2023 (b) | | | | 835,000 | | | | 798,496 | |
| 4.1%, 5/22/2023 | | | | 85,000 | | | | 78,533 | |
| Neuberger Berman Group LLC, 144A, 5.875%, 3/15/2022 | | | | 155,000 | | | | 158,100 | |
| Nordea Bank AB, 144A, 4.25%, 9/21/2022 | | | | 555,000 | | | | 547,549 | |
| OPB Finance Trust, Series C, 2.9%, 5/24/2023 | CAD | | | 380,000 | | | | 343,651 | |
| PNC Bank NA, 6.875%, 4/1/2018 | | | | 200,000 | | | | 239,872 | |
| Principal Financial Group, Inc., 3.3%, 9/15/2022 | | | | 605,000 | | | | 587,715 | |
| Royal Bank of Scotland Group PLC, 6.1%, 6/10/2023 (b) | | | | 100,000 | | | | 94,871 | |
| Skandinaviska Enskilda Banken AB, 144A, 1.375%, 5/29/2018 (b) | | | | 640,000 | | | | 616,512 | |
| SLM Corp., 5.5%, 1/25/2023 (b) | | | | 630,000 | | | | 599,889 | |
| The Goldman Sachs Group, Inc., 6.0%, 6/15/2020 | | | | 880,000 | | | | 988,788 | |
| Turkiye Vakiflar Bankasi Tao, 144A, 3.75%, 4/15/2018 | | | | 250,000 | | | | 235,000 | |
| | | | | 17,390,403 | |
| Health Care 1.4% | |
| Agilent Technologies, Inc., 3.2%, 10/1/2022 | | | | 300,000 | | | | 278,110 | |
| Biomet, Inc.: | |
| 6.5%, 8/1/2020 | | | | 25,000 | | | | 25,766 | |
| 6.5%, 10/1/2020 (b) | | | | 5,000 | | | | 4,987 | |
| Community Health Systems, Inc., 7.125%, 7/15/2020 | | | | 125,000 | | | | 128,750 | |
| Fresenius Medical Care U.S. Finance II, Inc., 144A, 5.875%, 1/31/2022 | | | | 10,000 | | | | 10,525 | |
| HCA, Inc.: | |
| 6.5%, 2/15/2020 | | | | 235,000 | | | | 254,241 | |
| 7.5%, 2/15/2022 | | | | 190,000 | | | | 210,425 | |
| IMS Health, Inc., 144A, 6.0%, 11/1/2020 | | | | 15,000 | | | | 15,262 | |
| Laboratory Corp. of America Holdings, 3.75%, 8/23/2022 | | | | 265,000 | | | | 253,138 | |
| Mallinckrodt International Finance SA, 144A, 4.75%, 4/15/2023 | | | | 110,000 | | | | 104,787 | |
| Sky Growth Acquisition Corp., 144A, 7.375%, 10/15/2020 | | | | 10,000 | | | | 10,250 | |
| Tenet Healthcare Corp.: | |
| 144A, 4.5%, 4/1/2021 | | | | 5,000 | | | | 4,663 | |
| 6.25%, 11/1/2018 | | | | 60,000 | | | | 63,150 | |
| Zoetis, Inc., 144A, 3.25%, 2/1/2023 | | | | 220,000 | | | | 209,026 | |
| | | | | 1,573,080 | |
| Industrials 1.6% | |
| Accuride Corp., 9.5%, 8/1/2018 | | | | 5,000 | | | | 5,088 | |
| Air Lease Corp., 4.75%, 3/1/2020 | | | | 20,000 | | | | 19,300 | |
| Alphabet Holding Co., Inc., 7.75%, 11/1/2017 (PIK) | | | | 15,000 | | | | 15,375 | |
| BE Aerospace, Inc., 6.875%, 10/1/2020 | | | | 55,000 | | | | 59,400 | |
| | | Principal Amount ($)(a) | | | Value ($) | |
| | | | | | | | | |
| Belden, Inc., 144A, 5.5%, 9/1/2022 | | | | 25,000 | | | | 24,562 | |
| Bombardier, Inc., 144A, 5.75%, 3/15/2022 | | | | 175,000 | | | | 173,687 | |
| Clean Harbors, Inc., 5.125%, 6/1/2021 | | | | 15,000 | | | | 15,113 | |
| DigitalGlobe, Inc., 144A, 5.25%, 2/1/2021 | | | | 10,000 | | | | 9,600 | |
| Ferreycorp SAA, 144A, 4.875%, 4/26/2020 | | | | 200,000 | | | | 188,000 | |
| FTI Consulting, Inc., 144A, 6.0%, 11/15/2022 | | | | 15,000 | | | | 15,187 | |
| GenCorp, Inc., 144A, 7.125%, 3/15/2021 | | | | 50,000 | | | | 51,750 | |
| Georgian Railway JSC, 144A, 7.75%, 7/11/2022 | | | | 200,000 | | | | 216,140 | |
| Grupo KUO SAB De CV, 144A, 6.25%, 12/4/2022 | | | | 200,000 | | | | 204,750 | |
| Ingersoll-Rand Global Holding Co., Ltd., 144A, 2.875%, 1/15/2019 | | | | 10,000 | | | | 9,865 | |
| Kenan Advantage Group, Inc., 144A, 8.375%, 12/15/2018 | | | | 25,000 | | | | 26,000 | |
| Meritor, Inc., 6.75%, 6/15/2021 | | | 10,000 | | | | 9,550 | |
| Navios Maritime Holdings, Inc., 8.875%, 11/1/2017 | | | | 15,000 | | | | 15,525 | |
| Navios South American Logistics, Inc., 144A, 9.25%, 4/15/2019 | | | | 5,000 | | | | 5,363 | |
| Owens Corning, Inc., 4.2%, 12/15/2022 | | | | 190,000 | | | | 184,108 | |
| Ply Gem Industries, Inc., 9.375%, 4/15/2017 | | | | 6,000 | | | | 6,345 | |
| Total System Services, Inc., 3.75%, 6/1/2023 | | | | 30,000 | | | | 27,855 | |
| TransDigm, Inc.: | |
| 144A, 7.5%, 7/15/2021 (c) | | | | 20,000 | | | | 20,450 | |
| 7.75%, 12/15/2018 | | | | 25,000 | | | | 26,312 | |
| Transnet SOC Ltd., 144A, 4.0%, 7/26/2022 | | | | 500,000 | | | | 437,200 | |
| U.S. Airways Group, Inc., 6.125%, 6/1/2018 | | | | 15,000 | | | | 14,175 | |
| United Rentals North America, Inc.: | |
| 6.125%, 6/15/2023 | | | | 5,000 | | | | 4,975 | |
| 7.625%, 4/15/2022 | | | | 85,000 | | | | 92,012 | |
| Watco Companies LLC, 144A, 6.375%, 4/1/2023 | | | | 15,000 | | | | 14,925 | |
| | | | | 1,892,612 | |
| Information Technology 2.0% | |
| Alliance Data Systems Corp., 144A, 5.25%, 12/1/2017 | | | | 15,000 | | | | 15,450 | |
| CDW LLC, 8.5%, 4/1/2019 | | | | 160,000 | | | | 172,000 | |
| CyrusOne LP, 144A, 6.375%, 11/15/2022 | | | | 5,000 | | | | 5,125 | |
| Equinix, Inc.: | |
| 5.375%, 4/1/2023 | | | | 45,000 | | | | 44,100 | |
| 7.0%, 7/15/2021 | | | | 140,000 | | | | 151,900 | |
| First Data Corp.: | |
| 144A, 6.75%, 11/1/2020 | | | | 105,000 | | | | 106,838 | |
| 144A, 7.375%, 6/15/2019 | | | | 190,000 | | | | 195,225 | |
| 144A, 10.625%, 6/15/2021 | | | | 30,000 | | | | 29,625 | |
| Fiserv, Inc., 3.5%, 10/1/2022 | | | | 715,000 | | | | 678,623 | |
| Freescale Semiconductor, Inc., 144A, 9.25%, 4/15/2018 | | | | 80,000 | | | | 86,200 | |
| Hewlett-Packard Co., 3.3%, 12/9/2016 | | | | 715,000 | | | | 742,204 | |
| | | Principal Amount ($)(a) | | | Value ($) | |
| | | | | | | | | |
| Hughes Satellite Systems Corp.: | |
| 6.5%, 6/15/2019 | | | | 15,000 | | | | 15,900 | |
| 7.625%, 6/15/2021 | | | | 50,000 | | | | 53,125 | |
| IAC/InterActiveCorp., 144A, 4.75%, 12/15/2022 | | | | 15,000 | | | | 14,175 | |
| | | | | 2,310,490 | |
| Materials 3.6% | |
| Anglo American Capital PLC, 144A, 4.125%, 9/27/2022 | | | | 750,000 | | | | 708,358 | |
| ArcelorMittal, 6.125%, 6/1/2018 | | | | 500,000 | | | | 515,000 | |
| Axiall Corp., 144A, 4.875%, 5/15/2023 | | | | 5,000 | | | | 4,750 | |
| Barrick Gold Corp., 144A, 2.5%, 5/1/2018 | | | | 170,000 | | | | 152,555 | |
| Bluescope Steel Ltd., 144A, 7.125%, 5/1/2018 | | | | 10,000 | | | | 10,150 | |
| BOE Merger Corp., 144A, 9.5%, 11/1/2017 (PIK) | | | | 30,000 | | | | 30,600 | |
| Braskem America Finance Co., 144A, 7.125%, 7/22/2041 | | | | 250,000 | | | | 236,562 | |
| Eagle Spinco, Inc., 144A, 4.625%, 2/15/2021 | | | | 10,000 | | | | 9,600 | |
| FMG Resources (August 2006) Pty Ltd., 144A, 6.0%, 4/1/2017 (b) | | | | 375,000 | | | | 364,687 | |
| FQM Akubra, Inc.: | |
| 144A, 7.5%, 6/1/2021 | | | | 40,000 | | | | 38,300 | |
| 144A, 8.75%, 6/1/2020 | | | | 25,000 | | | | 25,563 | |
| Freeport-McMoRan Copper & Gold, Inc., 3.55%, 3/1/2022 | | | | 790,000 | | | | 717,602 | |
| GTL Trade Finance, Inc., 144A, 7.25%, 10/20/2017 | | | | 200,000 | | | | 216,000 | |
| Hexion U.S. Finance Corp.: | |
| 6.625%, 4/15/2020 | | | | 75,000 | | | | 74,813 | |
| 8.875%, 2/1/2018 | | | | 35,000 | | | | 35,700 | |
| Huntsman International LLC: | |
| 4.875%, 11/15/2020 (b) | | | | 15,000 | | | | 14,813 | |
| 8.625%, 3/15/2021 | | | | 70,000 | | | | 76,825 | |
| IAMGOLD Corp., 144A, 6.75%, 10/1/2020 | | | | 5,000 | | | | 4,225 | |
| Novelis, Inc., 8.75%, 12/15/2020 | | | | 265,000 | | | | 284,212 | |
| Polymer Group, Inc., 7.75%, 2/1/2019 | | | | 65,000 | | | | 67,600 | |
| PolyOne Corp., 144A, 5.25%, 3/15/2023 | | | | 35,000 | | | | 34,475 | |
| Polyus Gold International Ltd., 144A, 5.625%, 4/29/2020 | | | | 200,000 | | | | 194,000 | |
| Sealed Air Corp., 144A, 5.25%, 4/1/2023 | | | | 10,000 | | | | 9,725 | |
| Tronox Finance LLC, 144A, 6.375%, 8/15/2020 | | | | 15,000 | | | | 14,138 | |
| Votorantim Overseas IV, 144A, 7.75%, 6/24/2020 | | | | 250,000 | | | | 279,375 | |
| | | | | 4,119,628 | |
| Telecommunication Services 3.2% | |
| America Movil SAB de CV, Series 12, 6.45%, 12/5/2022 | MXN | | | 2,000,000 | | | | 149,481 | |
| CC Holdings GS V LLC, 3.849%, 4/15/2023 | | | | 490,000 | | | | 462,048 | |
| | | Principal Amount ($)(a) | | | Value ($) | |
| | | | | | | | | |
| CenturyLink, Inc., Series V, 5.625%, 4/1/2020 | | | | 5,000 | | | | 5,050 | |
| Cincinnati Bell, Inc.: | |
| 8.375%, 10/15/2020 | | | | 210,000 | | | | 215,775 | |
| 8.75%, 3/15/2018 | | | | 95,000 | | | | 95,119 | |
| Cricket Communications, Inc., 7.75%, 10/15/2020 | | | | 190,000 | | | | 182,400 | |
| Digicel Ltd., 144A, 8.25%, 9/1/2017 | | | | 295,000 | | | | 306,800 | |
| Frontier Communications Corp.: | |
| 7.125%, 1/15/2023 | | | | 110,000 | | | | 109,450 | |
| 7.625%, 4/15/2024 | | | | 5,000 | | | | 5,013 | |
| 8.5%, 4/15/2020 | | | | 280,000 | | | | 308,700 | |
| Intelsat Jackson Holdings SA: | |
| 144A, 5.5%, 8/1/2023 | | | | 35,000 | | | | 32,900 | |
| 144A, 6.625%, 12/15/2022 | | | | 15,000 | | | | 14,550 | |
| 7.5%, 4/1/2021 | | | | 265,000 | | | | 278,250 | |
| Intelsat Luxembourg SA, 144A, 7.75%, 6/1/2021 | | | | 45,000 | | | | 45,450 | |
| Level 3 Communications, Inc., 8.875%, 6/1/2019 (b) | | | | 80,000 | | | | 83,200 | |
| Level 3 Financing, Inc., 7.0%, 6/1/2020 | | | | 160,000 | | | | 159,600 | |
| MetroPCS Wireless, Inc., 6.625%, 11/15/2020 | | | | 175,000 | | | | 181,562 | |
| Millicom International Cellular SA, 144A, 4.75%, 5/22/2020 | | | | 200,000 | | | | 190,052 | |
| SBA Communications Corp., 144A, 5.625%, 10/1/2019 | | | | 15,000 | | | | 14,850 | |
| Sprint Nextel Corp.: | |
| 6.0%, 11/15/2022 | | | | 25,000 | | | | 24,500 | |
| 8.375%, 8/15/2017 | | | | 60,000 | | | | 67,350 | |
| Telefonica Emisiones SAU, 4.57%, 4/27/2023 | | | | 170,000 | | | | 162,741 | |
| Telemar Norte Leste SA, 144A, 5.5%, 10/23/2020 | | | | 200,000 | | | | 186,000 | |
| tw telecom holdings, Inc., 5.375%, 10/1/2022 | | | | 15,000 | | | | 14,888 | |
| Windstream Corp.: | |
| 6.375%, 8/1/2023 | | | | 15,000 | | | | 14,025 | |
| 7.5%, 6/1/2022 | | | | 10,000 | | | | 10,200 | |
| 7.5%, 4/1/2023 | | | | 5,000 | | | | 5,075 | |
| 7.75%, 10/15/2020 (b) | | | | 330,000 | | | | 341,550 | |
| 7.75%, 10/1/2021 | | | | 20,000 | | | | 20,700 | |
| | | | | 3,687,279 | |
| Utilities 1.9% | |
| AES Corp., 8.0%, 10/15/2017 | | | | 20,000 | | | | 22,500 | |
| American Electric Power Co., Inc., Series F, 2.95%, 12/15/2022 | | | | 410,000 | | | | 381,667 | |
| Calpine Corp.: | |
| 144A, 7.5%, 2/15/2021 | | | | 205,000 | | | | 218,837 | |
| 144A, 7.875%, 7/31/2020 | | | | 10,000 | | | | 10,850 | |
| DTE Energy Co., 7.625%, 5/15/2014 | | | | 300,000 | | | | 317,791 | |
| Electricite de France SA, 144A, 5.25%, 1/29/2049 | | | | 400,000 | | | | 382,400 | |
| Majapahit Holding BV, REG S, 7.75%, 10/17/2016 | | | | 100,000 | | | | 110,750 | |
| Mexico Generadora de Energia S de rl, 144A, 5.5%, 12/6/2032 | | | | 200,000 | | | | 188,000 | |
| | | Principal Amount ($)(a) | | | Value ($) | |
| | | | | | | | | |
| PPL Energy Supply LLC, 4.6%, 12/15/2021 | | | | 500,000 | | | | 508,812 | |
| | | | | 2,141,607 | |
Total Corporate Bonds (Cost $43,989,222) | | | | 43,161,775 | |
| | |
| Mortgage-Backed Securities Pass-Throughs 36.2% | |
| Federal Home Loan Mortgage Corp.: | |
| 3.5%, 4/1/2042 | | | | 8,084,982 | | | | 8,207,204 | |
| 4.0%, 8/1/2039 | | | | 851,484 | | | | 890,898 | |
| 5.5%, with various maturities from 10/1/2023 until 8/1/2024 | | | | 136,868 | | | | 148,382 | |
| 6.5%, 3/1/2026 | | | | 381,794 | | | | 424,209 | |
| Federal National Mortgage Association: | | |
| 2.627%*, 8/1/2037 | | | | 231,251 | | | | 246,263 | |
| 3.0%, 9/1/2042 (c) | | | | 4,500,000 | | | | 4,400,156 | |
| 3.5%, 1/1/2042 (c) | | | | 10,000,000 | | | | 10,156,250 | |
| 4.0%, 9/1/2040 | | | | 682,590 | | | | 713,547 | |
| 4.5%, 10/1/2033 | | | | 156,524 | | | | 165,909 | |
| 5.0%, with various maturities from 2/1/2021 until 8/1/2040 | | | | 2,206,088 | | | | 2,392,850 | |
| 5.004%*, 9/1/2038 | | | | 109,748 | | | | 115,526 | |
| 5.5%, with various maturities from 12/1/2032 until 4/1/2037 | | | | 1,288,463 | | | | 1,398,486 | |
| 6.0%, with various maturities from 4/1/2024 until 3/1/2025 | | | | 741,809 | | | | 816,927 | |
| 6.5%, with various maturities from 3/1/2017 until 12/1/2037 | | | | 897,093 | | | | 999,531 | |
| 8.0%, 9/1/2015 | | | | 6,286 | | | | 6,584 | |
| Government National Mortgage Association, 3.5%, 4/1/2042 (c) | | | | 10,000,000 | | | | 10,267,188 | |
Total Mortgage-Backed Securities Pass-Throughs (Cost $41,638,038) | | | | 41,349,910 | |
| | |
| Asset-Backed 1.6% | |
| Credit Card Receivables | |
| Citibank Omni Master Trust, "A14", Series 2009-A14A, 144A, 2.943%*, 8/15/2018 (Cost $1,842,012) | | | | 1,750,000 | | | | 1,797,185 | |
| | |
| Commercial Mortgage-Backed Securities 7.3% | |
| Banc of America Large Loan, Inc., "HLTN", Series 2010-HLTN, 144A, 2.493%*, 11/15/2015 | | | | 1,698,067 | | | | 1,699,385 | |
| Banc of America Merrill Lynch Commercial Mortgage, Inc., "A2", Series 2007-2, 5.634%*, 4/10/2049 | | | | 33,112 | | | | 33,479 | |
| Bear Stearns Commercial Mortgage Securities, Inc., "A4", Series 2007- PW16, 5.905%*, 6/11/2040 | | | | 240,000 | | | | 271,099 | |
| | | Principal Amount ($)(a) | | | Value ($) | |
| | | | | | | | | |
| Commercial Mortgage Trust, "A4", Series 2007-GG9, 5.444%, 3/10/2039 | | | | 1,750,000 | | | | 1,934,331 | |
| Del Coronado Trust, "M", Series 2013-HDMZ, 144A, 5.193%*, 3/15/2018 | | | | 125,000 | | | | 125,650 | |
| JPMorgan Chase Commercial Mortgage Securities Corp.: | | |
| "C", Series 2012-HSBC, 144A, 4.021%, 7/5/2032 | | | | 230,000 | | | | 222,646 | |
| "A4", Series 2007-C1, 5.716%, 2/15/2051 | | | | 960,000 | | | | 1,072,087 | |
| "F", Series 2007-LD11, 6.003%*, 6/15/2049 | | | | 650,000 | | | | 65,096 | |
| "G", Series 2007-LD11, 144A, 6.003%*, 6/15/2049 | | | | 760,000 | | | | 60,829 | |
| "H", Series 2007-LD11, 144A, 6.003%*, 6/15/2049 | | | | 460,000 | | | | 32,207 | |
| LB-UBS Commercial Mortgage Trust, "A4", Series 2007-C6, 5.858%, 7/15/2040 | | | | 1,315,000 | | | | 1,456,263 | |
| Merrill Lynch Mortgage Trust, "ASB", Series 2007-C1, 6.038%*, 6/12/2050 | | | | 1,238,421 | | | | 1,316,391 | |
| Wachovia Bank Commercial Mortgage Trust, "H", Series 2007-C32, 144A, 5.937%*, 6/15/2049 | | | | 770,000 | | | | 57,750 | |
Total Commercial Mortgage-Backed Securities (Cost $10,247,348) | | | | 8,347,213 | |
| | |
| Collateralized Mortgage Obligations 5.3% | |
| Countrywide Home Loans, "A2", Series 2006-1, 6.0%, 3/25/2036 | | | | 452,297 | | | | 401,552 | |
| CS First Boston Mortgage Securities Corp., "10A3", Series 2005-10, 6.0%, 11/25/2035 | | | | 135,636 | | | | 92,983 | |
| Federal Home Loan Mortgage Corp.: | | |
| "PE", Series 2898, 5.0%, 5/15/2033 | | | | 118,787 | | | | 121,341 | |
| "JS", Series 3572, Interest Only, 6.608%*, 9/15/2039 | | | | 887,444 | | | | 137,524 | |
| Federal National Mortgage Association: | | |
| "QD", Series 2005-29, 5.0%, 8/25/2033 | | | | 263,761 | | | | 271,299 | |
| "EG", Series 2005-22, 5.0%, 11/25/2033 | | | | 441,461 | | | | 455,793 | |
| "TC", Series 2007-77, 5.5%, 9/25/2034 | | | | 102,155 | | | | 103,035 | |
| "SI", Series 2007-23, Interest Only, 6.577%*, 3/25/2037 | | | | 380,087 | | | | 67,217 | |
| Government National Mortgage Association: | | |
| "DI", Series 2012-102, Interest Only, 2.5%, 8/20/2027 | | | | 4,527,220 | | | | 487,807 | |
| | | Principal Amount ($)(a) | | | Value ($) | |
| | | | | | | | | |
| "PL", Series 2013-19, 2.5%, 2/20/2043 | | | | 684,500 | | | | 583,950 | |
| "HX", Series 2012-91, 3.0%, 9/20/2040 | | | | 421,863 | | | | 433,682 | |
| "GI", Series 2010-89, Interest Only, 4.5%, 5/20/2039 | | | | 1,757,013 | | | | 236,565 | |
| "PD", Series 2011-25, 4.5%, 10/16/2039 | | | | 1,000,000 | | | | 1,065,524 | |
| "EI", Series 2011-162, Interest Only, 4.5%, 5/20/2040 | | | | 1,980,628 | | | | 322,770 | |
| "DI", Series 2011-40, Interest Only, 4.5%, 12/20/2040 | | | | 4,595,433 | | | | 649,898 | |
| "IM", Series 2010-87, Interest Only, 4.75%, 3/20/2036 | | | | 1,623,518 | | | | 105,356 | |
| "IN", Series 2009-69, Interest Only, 5.5%, 8/20/2039 | | | | 287,480 | | | | 46,127 | |
| "IV", Series 2009-69, Interest Only, 5.5%, 8/20/2039 | | | | 567,912 | | | | 92,510 | |
| "IJ", Series 2009-75, Interest Only, 6.0%, 8/16/2039 | | | | 235,121 | | | | 43,374 | |
| "AI", Series 2007-38, Interest Only, 6.268%*, 6/16/2037 | | | | 144,427 | | | | 19,582 | |
| "D", Series 1996-7, 7.5%, 5/16/2026 | | | | 133,058 | | | | 153,493 | |
| MASTR Alternative Loans Trust: | |
| "5A1", Series 2005-1, 5.5%, 1/25/2020 | | | | 170,534 | | | | 173,911 | |
| "8A1", Series 2004-3, 7.0%, 4/25/2034 | | | | 9,469 | | | | 9,554 | |
Total Collateralized Mortgage Obligations (Cost $6,140,899) | | | | 6,074,847 | |
| | |
| Government & Agency Obligations 22.4% | |
| Other Government Related (d) 1.7% | |
| KFW, 1.875%, 6/13/2018 | CAD | | | 965,000 | | | | 898,036 | |
| Queensland Treasury Corp., Series 23, 4.25%, 7/21/2023 | AUD | | | 1,230,000 | | | | 1,075,508 | |
| | | | | 1,973,544 | |
| Sovereign Bonds 2.1% | |
| Government of Japan, Series 144, 1.5%, 3/20/2033 | JPY | | | 108,000,000 | | | | 1,054,148 | |
| Republic of Belarus, REG S, 8.75%, 8/3/2015 | | | | 500,000 | | | | 501,250 | |
| Republic of El Salvador, REG S, 8.25%, 4/10/2032 | | | | 40,000 | | | | 41,700 | |
| Russian Federation: | |
| Series 6204, 7.5%, 3/15/2018 | RUB | | | 3,400,000 | | | | 106,717 | |
| Series 6207, 8.15%, 2/3/2027 | RUB | | | 10,200,000 | | | | 318,825 | |
| United Mexican States: | |
| Series M, 7.75%, 5/29/2031 | MXN | | | 2,700,000 | | | | 230,284 | |
| Series M 20, 8.5%, 5/31/2029 | MXN | | | 1,350,000 | | | | 124,188 | |
| | | | | 2,377,112 | |
| | | Principal Amount ($)(a) | | | Value ($) | |
| | | | | | | | | |
| U.S. Government Sponsored Agencies 0.8% | |
| Federal Home Loan Mortgage Corp., 2.375%, 1/13/2022 | | | 350,000 | | | | 338,701 | |
| Federal National Mortgage Association, 0.875%, 5/21/2018 (b) | | | 630,000 | | | | 610,044 | |
| | | | | 948,745 | |
| U.S. Treasury Obligations 17.8% | |
| U.S. Treasury Bill, 0.1%**, 9/5/2013 (e) | | | | 433,000 | | | | 432,984 | |
| U.S. Treasury Bond, 3.75%, 8/15/2041 | | | | 2,500,000 | | | | 2,639,452 | |
| U.S. Treasury Notes: | |
| 0.75%, 6/15/2014 (f) | | | | 2,500,000 | | | | 2,513,183 | |
| 1.0%, 8/31/2016 | | | | 14,650,000 | | | | 14,763,303 | |
| | | | | 20,348,922 | |
Total Government & Agency Obligations (Cost $26,147,336) | | | | 25,648,323 | |
| Loan Participations and Assignments 1.7% | |
| Sovereign Loans | |
| Gazprom Neft OAO, 144A, 4.375%, 9/19/2022 | | | | 250,000 | | | | 228,963 | |
| Gazprom OAO, 144A, 9.25%, 4/23/2019 | | | | 100,000 | | | | 120,500 | |
| National JSC Naftogaz of Ukraine, 9.5%, 9/30/2014 | | | | 250,000 | | | | 249,375 | |
| Russian Railways, 5.739%, 4/3/2017 | | | | 400,000 | | | | 424,000 | |
| Uralkali OJSC, 144A, 3.723%, 4/30/2018 (b) | | | | 200,000 | | | | 192,250 | |
| Vimpel Communications, 144A, 9.125%, 4/30/2018 | | | | 200,000 | | | | 227,500 | |
| VTB Bank OJSC, 144A, 6.0%, 4/12/2017 | | | | 500,000 | | | | 520,000 | |
Total Loan Participations and Assignments (Cost $2,018,178) | | | | 1,962,588 | |
| | |
| Municipal Bonds and Notes 5.1% | |
| Gwinnett County, GA, Development Authority Revenue, Gwinnett Stadium Project, 6.4%, 1/1/2028 | | | 655,000 | | | | 724,233 | |
| Kentucky, Asset/Liability Commission, General Fund Revenue, 3.165%, 4/1/2018 | | | 1,715,001 | | | | 1,781,234 | |
| Michigan, Western Michigan University Revenue, 4.41%, 11/15/2014, INS: AMBAC | | | 320,000 | | | | 322,640 | |
| New Jersey, Economic Development Authority Revenue, Series B, 6.5%, 11/1/2013, INS: AGC | | | 860,000 | | | | 873,949 | |
| New Jersey, State Economic Development Authority Revenue, Series B, 6.5%, 11/1/2014, INS: AGC | | | 585,000 | | | | 619,802 | |
| Port Authority New York & New Jersey, One Hundred Fiftieth Series, 4.75%, 9/15/2016 | | | 930,000 | | | | 1,013,598 | |
| Virgin Islands, Port Authority Marine Revenue, Series B, 5.08%, 9/1/2013, INS: AGMC | | | 160,000 | | | | 160,304 | |
| | | Principal Amount ($)(a) | | | Value ($) | |
| | | | | | | | | |
| Washington, Central Puget Sound Regional Transit Authority, Sales & Use Tax Revenue, Series A, 5.0%, 11/1/2036 | | | 285,000 | | | | 303,236 | |
Total Municipal Bonds and Notes (Cost $5,503,791) | | | | 5,798,996 | |
| | | Shares | | | Value ($) | |
| | | | |
| Preferred Stock 0.0% | |
| Financials | |
| Ally Financial, Inc., 144A, 7.0% (Cost $14,594) | | | 15 | | | | 14,258 | |
| | | Contracts | | | Value ($) | |
| | | | |
| Call Options Purchased 0.0% | |
| Options on Exchange-Traded Futures Contracts | |
| 10 Year U.S. Treasury Note Future, Expiration Date 8/23/2013, Strike Price $132.5 (Cost $12,062) | | | 24 | | | | 1,125 | |
| | | Shares | | | Value ($) | |
| | | | |
| Securities Lending Collateral 4.5% | |
| Daily Assets Fund Institutional, 0.10% (g) (h) (Cost $5,169,839) | | | 5,169,839 | | | | 5,169,839 | |
| | |
| Cash Equivalents 3.3% | |
| Central Cash Management Fund, 0.07% (g) (Cost $3,794,189) | | | 3,794,189 | | | | 3,794,189 | |
| | | % of Net Assets | | | Value ($) | |
| | | | |
Total Investment Portfolio (Cost $146,517,508)† | | | 125.1 | | | | 143,120,248 | |
| Other Assets and Liabilities, Net | | | (25.1 | ) | | | (28,716,565 | ) |
| Net Assets | | | 100.0 | | | | 114,403,683 | |
* Floating rate securities' yields vary with a designated market index or market rate, such as the coupon-equivalent of the U.S. Treasury Bill rate. These securities are shown at their current rate as of June 30, 2013.
** Annualized yield at time of purchase; not a coupon rate.
† The cost for federal income tax purposes was $146,517,508. At June 30, 2013, net unrealized depreciation for all securities based on tax cost was $3,397,260. This consisted of aggregate gross unrealized appreciation for all securities in which there was an excess of value over tax cost of $1,941,548 and aggregate gross unrealized depreciation for all securities in which there was an excess of tax cost over value of $5,338,808.
(a) Principal amount stated in U.S. dollars unless otherwise noted.
(b) All or a portion of these securities were on loan (see Notes to Financial Statements). The value of securities loaned at June 30, 2013 amounted to $5,013,650, which is 4.4% of net assets.
(c) When-issued or delayed delivery security included.
(d) Government-backed debt issued by financial companies or government sponsored enterprises.
(e) At June 30, 2013, this security has been pledged, in whole or in part, to cover initial margin requirements for open futures contracts.
(f) At June 30, 2013, this security has been pledged, in whole or in part, as collateral for open swap contracts.
(g) Affiliated fund managed by Deutsche Investment Management Americas Inc. The rate shown is the annualized seven-day yield at period end.
(h) Represents collateral held in connection with securities lending. Income earned by the Fund is net of borrower rebates.
144A: Security exempt from registration under Rule 144A of the Securities Act of 1933. These securities may be resold in transactions exempt from registration, normally to qualified institutional buyers.
AGC: Assured Guaranty Corp.
AGMC: Assured Guaranty Municipal Corp.
AMBAC: Ambac Financial Group, Inc.
INS: Insured
Interest Only: Interest Only (IO) bonds represent the "interest only" portion of payments on a pool of underlying mortgages or mortgage-backed securities. IO securities are subject to prepayment risk of the pool of underlying mortgages.
PIK: Denotes that all or a portion of the income is paid in-kind in the form of additional principal.
REG S: Securities sold under Regulation S may not be offered, sold or delivered within the United States or to, or for the account or benefit of, U.S. persons, except pursuant to an exemption from, or in a transaction not subject to, the registration requirements of the Securities Act of 1933.
REIT: Real Estate Investment Trust
Included in the portfolio are investments in mortgage or asset-backed securities which are interests in separate pools of mortgages or assets. Effective maturities of these investments may be shorter than stated maturities due to prepayments. Some separate investments in the Federal Home Loan Mortgage Corp., Federal National Mortgage Association and issues which have similar coupon rates have been aggregated for presentation purposes in this investment portfolio.
At June 30, 2013, open futures contracts purchased were as follows:
| Futures | Currency | Expiration Date | | Contracts | | | Notional Value ($) | | | Unrealized Depreciation ($) | |
| 10 Year Canadian Government Bond | CAD | 9/19/2013 | | | 5 | | | | 624,750 | | | | (25,222 | ) |
| 10 Year U.S. Treasury Note | USD | 9/19/2013 | | | 200 | | | | 25,312,500 | | | | (757,152 | ) |
| Federal Republic of Germany Euro-Bund | EUR | 9/6/2013 | | | 5 | | | | 921,047 | | | | (18,167 | ) |
| Total unrealized depreciation | | | | (800,541 | ) |
At June 30, 2013, open futures contracts sold were as follows:
| Futures | Currency | Expiration Date | | Contracts | | | Notional Value ($) | | | Unrealized Depreciation ($) | |
| Ultra Long U.S. Treasury Bond | USD | 9/19/2013 | | | 5 | | | | 736,563 | | | | (12,288 | ) |
At June 30, 2013, open written options contracts were as follows:
| Options on Exchange-Traded Futures Contracts | | Contracts | | Expiration Date | | Strike Price ($) | | | Premiums Received ($) | | | Value ($) (i) | |
Put Options 10 Year U.S. Treasury Note Future | | | 24 | | 8/23/2013 | | | 130.0 | | | | 19,438 | | | | (87,000 | ) |
(i) Unrealized depreciation on written options on exchange-traded futures contracts at June 30, 2013 was $67,562.
| Options on Interest Rate Swap Contracts | Swap Effective/ Expiration Date | | Contract Amount | | Option Expiration Date | | Premiums Received ($) | | | Value ($) (j) | |
Call Options Received Fixed — 4.064% - Pay Floating — LIBOR | 5/13/2014 5/13/2044 | | | 2,000,000 | 1 | 5/9/2014 | | | 14,750 | | | | (55,362 | ) |
Put Options Pay Fixed — 2.385% - Receive Floating — LIBOR | 3/31/2014 3/31/2044 | | | 2,000,000 | 2 | 3/27/2014 | | | 27,300 | | | | (6,382 | ) |
| Pay Fixed — 2.423% - Receive Floating — LIBOR | 3/20/2014 3/20/2044 | | | 2,000,000 | 3 | 3/18/2014 | | | 28,800 | | | | (7,250 | ) |
| Pay Fixed — 2.064% - Receive Floating — LIBOR | 5/13/2014 5/13/2044 | | | 2,000,000 | 1 | 5/9/2014 | | | 14,750 | | | | (2,218 | ) |
| Total Put Options | | | 70,850 | | | | (15,850 | ) |
| Total | | | 85,600 | | | | (71,212 | ) |
(j) Unrealized appreciation on written options on interest rate swap contracts at June 30, 2013 was $14,388.
At June 30, 2013, open credit default swap contracts sold were as follows:
Effective/ Expiration Date | | Notional Amount ($) (k) | | | Fixed Cash Flows Received | | Underlying Debt Obligation/ Quality Rating (l) | | Value ($) | | | Upfront Payments Paid ($) | | | Unrealized Appreciation ($) | |
9/20/2012 12/20/2017 | | | 50,000 | 4 | | | 5.0 | % | General Motors Corp., 3.3%, 12/20/2017, BB+ | | | 6,217 | | | | 3,324 | | | | 2,893 | |
(k) The maximum potential amount of future undiscounted payments that the Fund could be required to make under a credit default swap contract would be the notional amount of the contract. These potential amounts would be partially offset by any recovery values of the referenced debt obligation or net amounts received from the settlement of buy protection credit default swap contracts entered into by the Fund for the same referenced debt obligation, if any.
(l) The quality ratings represent the higher of Moody's Investors Service, Inc. ("Moody's") or Standard & Poor's Corporation ("S&P") credit ratings and are unaudited.
At June 30, 2013, open interest rate swap contracts were as follows:
Effective/ Expiration Date | | Notional Amount ($) | | Cash Flows Paid by the Fund | Cash Flows Received by the Fund | | Value ($) | | | Upfront Payments Paid/ (Received) ($) | | | Unrealized Appreciation/ (Depreciation) ($) | |
5/1/2014 5/1/2016 | | | 25,000,000 | 5 | Fixed — 0.528% | Floating — LIBOR | | | 198,959 | | | | — | | | | 198,959 | |
5/1/2014 5/1/2034 | | | 3,000,000 | 3 | Floating — LIBOR | Fixed — 2.791% | | | (319,977 | ) | | | 7,242 | | | | (327,219 | ) |
5/1/2014 5/1/2019 | | | 15,000,000 | 6 | Fixed — 1.233% | Floating — LIBOR | | | 610,937 | | | | (9,229 | ) | | | 620,166 | |
5/1/2014 5/1/2024 | | | 12,000,000 | 2 | Fixed — 2.156% | Floating — LIBOR | | | 934,208 | | | | (2,033 | ) | | | 936,241 | |
5/1/2014 5/1/2044 | | | 1,500,000 | 2 | Floating — LIBOR | Fixed — 2.922% | | | (185,027 | ) | | | 2,487 | | | | (187,514 | ) |
| Total net unrealized appreciation | | | | 1,240,633 | |
Counterparties:
1 Nomura International PLC
2 Barclays Bank PLC
3 JPMorgan Chase Securities, Inc.
4 UBS AG
5 BNP Paribas
6 Citigroup, Inc.
LIBOR: London Interbank Offered Rate
At June 30, 2013, the Fund had the following open forward foreign currency exchange contracts:
| Contracts to Deliver | | In Exchange For | | Settlement Date | | Unrealized Appreciation ($) | | Counterparty |
| NOK | | | 10,730,174 | | EUR | | | 1,400,000 | | 7/5/2013 | | | 56,184 | | Citigroup, Inc. |
| AUD | | | 600,000 | | USD | | | 625,106 | | 7/5/2013 | | | 76,584 | | Nomura International PLC |
| USD | | | 9,507 | | NOK | | | 57,957 | | 7/5/2013 | | | 32 | | Citigroup, Inc. |
| GBP | | | 900,000 | | USD | | | 1,373,765 | | 7/5/2013 | | | 4,959 | | JPMorgan Chase Securities, Inc. |
| JPY | | | 90,000,000 | | USD | | | 926,117 | | 7/10/2013 | | | 18,642 | | Nomura International PLC |
| EUR | | | 700,000 | | USD | | | 927,199 | | 7/11/2013 | | | 16,003 | | JPMorgan Chase Securities, Inc. |
| GBP | | | 600,000 | | USD | | | 933,057 | | 7/11/2013 | | | 20,558 | | BNP Paribas |
| SGD | | | 1,800,000 | | USD | | | 1,446,729 | | 7/11/2013 | | | 26,578 | | JPMorgan Chase Securities, Inc. |
| EUR | | | 700,000 | | USD | | | 928,794 | | 7/11/2013 | | | 17,598 | | Barclays Bank PLC |
| AUD | | | 1,500,000 | | NZD | | | 1,790,160 | | 7/12/2013 | | | 15,476 | | Citigroup, Inc. |
| CZK | | | 17,200,000 | | USD | | | 883,048 | | 7/12/2013 | | | 22,389 | | Bank of America |
| CZK | | | 17,100,000 | | USD | | | 885,293 | | 7/12/2013 | | | 29,638 | | BNP Paribas |
| USD | | | 887,544 | | ZAR | | | 8,800,000 | | 7/15/2013 | | | 683 | | Barclays Bank PLC |
| NZD | | | 1,100,000 | | USD | | | 876,664 | | 7/15/2013 | | | 25,166 | | Citigroup, Inc. |
| JPY | | | 60,000,000 | | USD | | | 605,152 | | 7/16/2013 | | | 154 | | Nomura International PLC |
| JPY | | | 60,000,000 | | USD | | | 613,907 | | 7/16/2013 | | | 8,909 | | Bank of America |
| EUR | | | 900,000 | | USD | | | 1,199,080 | | 7/17/2013 | | | 27,514 | | Nomura International PLC |
| GBP | | | 800,000 | | USD | | | 1,253,747 | | 7/17/2013 | | | 37,133 | | JPMorgan Chase Securities, Inc. |
| JPY | | | 90,000,000 | | USD | | | 913,300 | | 7/24/2013 | | | 5,776 | | Barclays Bank PLC |
| USD | | | 583,686 | | ZAR | | | 6,000,000 | | 7/25/2013 | | | 21,015 | | Barclays Bank PLC |
| USD | | | 819,656 | | AUD | | | 900,000 | | 7/26/2013 | | | 1,816 | | JPMorgan Chase Securities, Inc. |
| CAD | | | 900,000 | | USD | | | 855,608 | | 7/26/2013 | | | 394 | | Nomura International PLC |
| AUD | | | 900,000 | | USD | | | 831,535 | | 7/26/2013 | | | 10,062 | | BNP Paribas |
| CAD | | | 1,100,000 | | USD | | | 1,076,818 | | 7/31/2013 | | | 31,658 | | JPMorgan Chase Securities, Inc. |
| AUD | | | 1,243,690 | | USD | | | 1,207,630 | | 7/31/2013 | | | 72,801 | | JPMorgan Chase Securities, Inc. |
| CAD | | | 759,475 | | USD | | | 735,820 | | 7/31/2013 | | | 14,208 | | Nomura International PLC |
| JPY | | | 30,000,000 | | USD | | | 307,148 | | 8/1/2013 | | | 4,631 | | Nomura International PLC |
| USD | | | 1,107,823 | | JPY | | | 110,000,000 | | 8/2/2013 | | | 1,409 | | JPMorgan Chase Securities, Inc. |
| Total unrealized appreciation | | | | | 567,970 | |
| Contracts to Deliver | | In Exchange For | | Settlement Date | | Unrealized Depreciation ($) | | Counterparty |
| USD | | | 627,750 | | AUD | | | 600,000 | | 7/5/2013 | | | (79,228 | ) | Barclays Bank PLC |
| USD | | | 909,592 | | JPY | | | 90,000,000 | | 7/5/2013 | | | (2,133 | ) | Nomura International PLC |
| USD | | | 1,401,422 | | GBP | | | 900,000 | | 7/5/2013 | | | (32,615 | ) | BNP Paribas |
| JPY | | | 90,000,000 | | USD | | | 898,307 | | 7/5/2013 | | | (9,152 | ) | Nomura International PLC |
| EUR | | | 1,400,000 | | NOK | | | 10,672,217 | | 7/5/2013 | | | (65,724 | ) | UBS AG |
| USD | | | 931,055 | | JPY | | | 90,000,000 | | 7/10/2013 | | | (23,580 | ) | Barclays Bank PLC |
| USD | | | 933,264 | | GBP | | | 600,000 | | 7/11/2013 | | | (20,765 | ) | Barclays Bank PLC |
| USD | | | 1,431,725 | | SGD | | | 1,800,000 | | 7/11/2013 | | | (11,573 | ) | Nomura International PLC |
| USD | | | 1,863,428 | | EUR | | | 1,400,000 | | 7/11/2013 | | | (41,037 | ) | Barclays Bank PLC |
| NZD | | | 1,084,052 | | AUD | | | 900,000 | | 7/12/2013 | | | (16,994 | ) | Nomura International PLC |
| NZD | | | 717,352 | | AUD | | | 600,000 | | 7/12/2013 | | | (7,188 | ) | BNP Paribas |
| USD | | | 1,789,151 | | CZK | | | 34,300,000 | | 7/12/2013 | | | (72,838 | ) | Barclays Bank PLC |
| USD | | | 8,711 | | NZD | | | 11,244 | | 7/12/2013 | | | (5 | ) | Barclays Bank PLC |
| USD | | | 586,735 | | INR | | | 34,500,000 | | 7/15/2013 | | | (7,779 | ) | Citigroup, Inc. |
| USD | | | 884,879 | | NZD | | | 1,100,000 | | 7/15/2013 | | | (33,381 | ) | JPMorgan Chase Securities, Inc. |
| ZAR | | | 8,800,000 | | USD | | | 877,679 | | 7/15/2013 | | | (10,548 | ) | UBS AG |
| INR | | | 34,500,000 | | USD | | | 566,689 | | 7/15/2013 | | | (12,268 | ) | Citigroup, Inc. |
| USD | | | 1,210,388 | | JPY | | | 120,000,000 | | 7/16/2013 | | | (393 | ) | Nomura International PLC |
| USD | | | 1,258,000 | | GBP | | | 800,000 | | 7/17/2013 | | | (41,385 | ) | UBS AG |
| USD | | | 1,190,076 | | EUR | | | 900,000 | | 7/17/2013 | | | (18,510 | ) | Nomura International PLC |
| USD | | | 881,152 | | ZAR | | | 8,700,000 | | 7/19/2013 | | | (3,545 | ) | JPMorgan Chase Securities, Inc. |
| ZAR | | | 8,700,000 | | USD | | | 871,606 | | 7/19/2013 | | | (6,000 | ) | JPMorgan Chase Securities, Inc. |
| NOK | | | 5,557,509 | | EUR | | | 700,000 | | 7/24/2013 | | | (2,899 | ) | BNP Paribas |
| USD | | | 921,003 | | JPY | | | 90,000,000 | | 7/24/2013 | | | (13,479 | ) | Nomura International PLC |
| ZAR | | | 6,000,000 | | USD | | | 592,826 | | 7/25/2013 | | | (11,875 | ) | Citigroup, Inc. |
| TWD | | | 25,900,000 | | USD | | | 861,610 | | 7/29/2013 | | | (2,754 | ) | JPMorgan Chase Securities, Inc. |
| JPY | | | 108,517,971 | | USD | | | 1,092,583 | | 7/31/2013 | | | (1,694 | ) | Nomura International PLC |
| USD | | | 302,877 | | JPY | | | 30,000,000 | | 8/1/2013 | | | (360 | ) | UBS AG |
| ZAR | | | 8,800,000 | | USD | | | 879,903 | | 8/1/2013 | | | (6,194 | ) | Citigroup, Inc. |
| USD | | | 888,234 | | ZAR | | | 8,800,000 | | 8/1/2013 | | | (2,137 | ) | Citigroup, Inc. |
| USD | | | 2,057,685 | | MXN | | | 26,600,000 | | 8/19/2013 | | | (14,121 | ) | JPMorgan Chase Securities, Inc. |
| Total unrealized depreciation | | | | | (572,154 | ) |
| Currency Abbreviations |
AUD Australian Dollar CAD Canadian Dollar CZK Czech Koruna EUR Euro GBP Great British Pound INR Indian Rupee JPY Japanese Yen MXN Mexican Peso NOK Norwegian Krone NZD New Zealand Dollar RUB Russian Ruble SGD Singapore Dollar TWD Taiwan Dollar USD United States Dollar ZAR South African Rand |
For information on the Fund's policy and additional disclosures regarding options purchased, futures contracts, written options, credit default swap contracts, interest rate swap contracts and forward foreign currency exchange contracts, please refer to Note B in the accompanying Notes to Financial Statements.
Fair Value Measurements
Various inputs are used in determining the value of the Fund's investments. These inputs are summarized in three broad levels. Level 1 includes quoted prices in active markets for identical securities. Level 2 includes other significant observable inputs (including quoted prices for similar securities, interest rates, prepayment speeds, and credit risk). Level 3 includes significant unobservable inputs (including the Fund's own assumptions in determining the fair value of investments). The inputs or methodology used for valuing securities are not necessarily an indication of the risk associated with investing in those securities.
The following is a summary of the inputs used as of June 30, 2013 in valuing the Fund's investments. For information on the Fund's policy regarding the valuation of investments, please refer to the Security Valuation section of Note A in the accompanying Notes to Financial Statements.
| Assets | | Level 1 | | | Level 2 | | | Level 3 | | | Total | |
| | |
| Fixed Income Investments (m) | |
| Corporate Bonds | | $ | — | | | $ | 43,161,775 | | | $ | — | | | $ | 43,161,775 | |
| Mortgage-Backed Securities Pass-Throughs | | | — | | | | 41,349,910 | | | | — | | | | 41,349,910 | |
| Asset-Backed | | | — | | | | 1,797,185 | | | | — | | | | 1,797,185 | |
| Commercial Mortgage-Backed Securities | | | — | | | | 8,347,213 | | | | — | | | | 8,347,213 | |
| Collateralized Mortgage Obligations | | | — | | | | 6,074,847 | | | | — | | | | 6,074,847 | |
| Government & Agency Obligations | | | — | | | | 25,648,323 | | | | — | | | | 25,648,323 | |
| Loan Participations and Assignments | | | — | | | | 1,962,588 | | | | — | | | | 1,962,588 | |
| Municipal Bonds and Notes | | | — | | | | 5,798,996 | | | | — | | | | 5,798,996 | |
| Preferred Stock | | | — | | | | 14,258 | | | | — | | | | 14,258 | |
| Short-Term Investments (m) | | | 8,964,028 | | | | — | | | | — | | | | 8,964,028 | |
| Derivatives (n) | |
| Purchased Options | | | 1,125 | | | | — | | | | — | | | | 1,125 | |
| Credit Default Swap Contracts | | | — | | | | 2,893 | | | | — | | | | 2,893 | |
| Interest Rate Swap Contracts | | | — | | | | 1,755,366 | | | | — | | | | 1,755,366 | |
| Forward Foreign Currency Exchange Contracts | | | — | | | | 567,970 | | | | — | | | | 567,970 | |
| Total | | $ | 8,965,153 | | | $ | 136,481,324 | | | $ | — | | | $ | 145,446,477 | |
| Liabilities | |
| Derivatives (n) | |
| Written Options | | $ | (87,000 | ) | | $ | (71,212 | ) | | $ | — | | | $ | (158,212 | ) |
| Futures Contracts | | | (812,829 | ) | | | — | | | | — | | | | (812,829 | ) |
| Interest Rate Swap Contracts | | | — | | | | (514,733 | ) | | | — | | | | (514,733 | ) |
| Forward Foreign Currency Exchange Contracts | | | — | | | | (572,154 | ) | | | — | | | | (572,154 | ) |
| Total | | $ | (899,829 | ) | | $ | (1,158,099 | ) | | $ | — | | | $ | (2,057,928 | ) |
There have been no transfers between fair value measurement levels during the period ended June 30, 2013.
(m) See Investment Portfolio for additional detailed categorizations.
(n) Derivatives include value of options purchased, unrealized appreciation (depreciation) on futures contracts, credit default swap contracts, interest rate swap contracts, forward foreign currency exchange contracts and written options, at value.
The accompanying notes are an integral part of the financial statements.
Statement of Assets and Liabilities | as of June 30, 2013 (Unaudited) | |
| Assets | |
Investments: Investments in non-affiliated securities, at value (cost $137,553,480) — including $5,013,650 of securities loaned | | $ | 134,156,220 | |
| Investment in Daily Assets Fund Institutional (cost $5,169,839)* | | | 5,169,839 | |
| Investment in Central Cash Management Fund (cost $3,794,189) | | | 3,794,189 | |
| Total investments, at value (cost $146,517,508) | | | 143,120,248 | |
| Cash | | | 26,847 | |
| Foreign currency, at value (cost $306,763) | | | 287,604 | |
| Deposit from broker for swap contracts | | | 360,000 | |
| Receivable for investments sold | | | 469,785 | |
| Receivable for investments sold — when-issued securities | | | 9,748,385 | |
| Receivable for Fund shares sold | | | 18,962 | |
| Interest receivable | | | 1,073,757 | |
| Unrealized appreciation on swap contracts | | | 1,758,259 | |
| Unrealized appreciation on forward foreign currency exchange contracts | | | 567,970 | |
| Upfront payments paid on swap contracts | | | 13,053 | |
| Foreign taxes recoverable | | | 1,037 | |
| Other assets | | | 3,227 | |
| Total assets | | | 157,449,134 | |
| Liabilities | |
| Payable upon return of securities loaned | | | 5,169,839 | |
| Payable for investments purchased | | | 791,457 | |
| Payable for investments purchased — when-issued securities | | | 35,044,148 | |
| Payable for Fund shares redeemed | | | 199,317 | |
| Payable for variation margin on swap contracts | | | 10,905 | |
| Payable upon return of deposit for swap contracts | | | 360,000 | |
| Options written, at value (premiums received $105,038) | | | 158,212 | |
| Net payable for pending swap contracts | | | 117,418 | |
| Unrealized depreciation on swap contracts | | | 514,733 | |
| Unrealized depreciation on forward foreign currency exchange contracts | | | 572,154 | |
| Upfront payments received on swap contracts | | | 11,262 | |
| Accrued management fee | | | 27,785 | |
| Accrued Trustees' fees | | | 2,628 | |
| Other accrued expenses and payables | | | 65,593 | |
| Total liabilities | | | 43,045,451 | |
| Net assets, at value | | $ | 114,403,683 | |
| Net Assets Consist of | |
| Undistributed net investment income | | | 1,748,525 | |
Net unrealized appreciation (depreciation) on: Investments | | | (3,397,260 | ) |
| Swap contracts | | | 1,243,526 | |
| Futures | | | (812,829 | ) |
| Foreign currency | | | (25,189 | ) |
| Written options | | | (53,174 | ) |
| Accumulated net realized gain (loss) | | | (78,985,968 | ) |
| Paid-in capital | | | 194,686,052 | |
| Net assets, at value | | $ | 114,403,683 | |
Class A Net Asset Value, offering and redemption price per share ($114,403,683 ÷ 20,965,100 outstanding shares of beneficial interest, $.01 par value, unlimited number of shares authorized) | | $ | 5.46 | |
* Represents collateral on securities loaned.
The accompanying notes are an integral part of the financial statements.
| for the six months ended June 30, 2013 (Unaudited) | |
| Investment Income | |
Income: Interest (net of foreign taxes withheld of $461) | | $ | 2,440,439 | |
| Income distributions — Central Cash Management Fund | | | 4,569 | |
| Securities lending income, including income from Daily Assets Fund Institutional, net of borrower rebates | | | 8,097 | |
| Total income | | | 2,453,105 | |
Expenses: Management fee | | | 292,354 | |
| Administration fee | | | 74,963 | |
| Services to shareholders | | | 1,364 | |
| Custodian fee | | | 19,001 | |
| Professional fees | | | 31,007 | |
| Reports to shareholders | | | 22,799 | |
| Trustees' fees and expenses | | | 5,767 | |
| Other | | | 7,925 | |
| Total expenses before expense reductions | | | 455,180 | |
| Expense reductions | | | (41,295 | ) |
| Total expenses after expense reductions | | | 413,885 | |
| Net investment income | | | 2,039,220 | |
| Realized and Unrealized Gain (Loss) | |
Net realized gain (loss) from: Investments | | | 1,394,124 | |
| Swap contracts | | | 147,781 | |
| Futures | | | (591,550 | ) |
| Written options | | | 84,004 | |
| Foreign currency | | | (407,612 | ) |
| | | | 626,747 | |
Change in net unrealized appreciation (depreciation) on: Investments | | | (7,689,538 | ) |
| Swap contracts | | | 1,031,726 | |
| Futures | | | (820,154 | ) |
| Written options | | | (129,178 | ) |
| Foreign currency | | | 1,391 | |
| | | | (7,605,753 | ) |
| Net gain (loss) | | | (6,979,006 | ) |
| Net increase (decrease) in net assets resulting from operations | | $ | (4,939,786 | ) |
The accompanying notes are an integral part of the financial statements.
Statement of Changes in Net Assets | Increase (Decrease) in Net Assets | | Six Months Ended June 30, 2013 (Unaudited) | | | Year Ended December 31, 2012 | |
Operations: Net investment income | | $ | 2,039,220 | | | $ | 4,611,965 | |
| Net realized gain (loss) | | | 626,747 | | | | 7,673,239 | |
| Change in net unrealized appreciation (depreciation) | | | (7,605,753 | ) | | | (104,078 | ) |
| Net increase (decrease) in net assets resulting from operations | | | (4,939,786 | ) | | | 12,181,126 | |
Distributions to shareholders from: Net investment income: Class A | | | (4,386,055 | ) | | | (4,882,203 | ) |
Fund share transactions: Class A Proceeds from shares sold | | | 2,823,300 | | | | 33,310,645 | |
| Net assets acquired in tax-free reorganization* | | | — | | | | 78,348,206 | |
| Reinvestment of distributions | | | 4,386,055 | | | | 4,882,203 | |
| Payments for shares redeemed | | | (73,726,792 | ) | | | (45,528,835 | ) |
| Net increase (decrease) in net assets from Class A share transactions | | | (66,517,437 | ) | | | 71,012,219 | |
| Increase (decrease) in net assets | | | (75,843,278 | ) | | | 78,311,142 | |
| Net assets at beginning of period | | | 190,246,961 | | | | 111,935,819 | |
| Net assets at end of period (including undistributed net investment income of $1,748,525 and $4,095,360, respectively) | | $ | 114,403,683 | | | $ | 190,246,961 | |
| Other Information | |
Class A Shares outstanding at beginning of period | | | 32,324,964 | | | | 19,571,536 | |
| Shares sold | | | 487,650 | | | | 5,773,870 | |
| Shares issued in tax-free reorganization* | | | — | | | | 13,990,523 | |
| Shares issued to shareholders in reinvestment of distributions | | | 768,136 | | | | 873,382 | |
| Shares redeemed | | | (12,615,650 | ) | | | (7,884,347 | ) |
| Net increase (decrease) in Class A shares | | | (11,359,864 | ) | | | 12,753,428 | |
| Shares outstanding at end of period | | | 20,965,100 | | | | 32,324,964 | |
* On April 30, 2012, DWS Core Fixed Income VIP was acquired by the Fund through a tax-free reorganization (see Note H).
The accompanying notes are an integral part of the financial statements.
| | | | | | Years Ended December 31, | |
| Class A | | Six Months Ended 6/30/13 (Unaudited) | | | 2012 | | | 2011 | | | 2010 | | | 2009 | | | 2008 | |
| Selected Per Share Data | |
| Net asset value, beginning of period | | $ | 5.89 | | | $ | 5.72 | | | $ | 5.66 | | | $ | 5.54 | | | $ | 5.50 | | | $ | 6.98 | |
Income (loss) from investment operations: Net investment incomea | | | .08 | | | | .16 | | | | .22 | | | | .19 | | | | .25 | | | | .37 | |
| Net realized and unrealized gain (loss) | | | (.30 | ) | | | .27 | | | | .09 | | | | .18 | | | | .26 | | | | (1.48 | ) |
| Total from investment operations | | | (.22 | ) | | | .43 | | | | .31 | | | | .37 | | | | .51 | | | | (1.11 | ) |
Less distributions from: Net investment income | | | (.21 | ) | | | (.26 | ) | | | (.25 | ) | | | (.25 | ) | | | (.47 | ) | | | (.37 | ) |
| Net asset value, end of period | | $ | 5.46 | | | $ | 5.89 | | | $ | 5.72 | | | $ | 5.66 | | | $ | 5.54 | | | $ | 5.50 | |
| Total Return (%) | | | (3.91 | )b** | | | 7.77 | | | | 5.68 | | | | 6.79 | | | | 10.07 | | | | (16.77 | ) |
| Ratios to Average Net Assets and Supplemental Data | |
| Net assets, end of period ($ millions) | | | 114 | | | | 190 | | | | 112 | | | | 155 | | | | 159 | | | | 155 | |
| Ratio of expenses before expense reductions (%) | | | .61 | * | | | .58 | | | | .62 | | | | .59 | | | | .59 | | | | .59 | |
| Ratio of expenses after expense reductions (%) | | | .55 | * | | | .58 | | | | .62 | | | | .59 | | | | .59 | | | | .59 | |
| Ratio of net investment income (%) | | | 2.72 | * | | | 2.81 | | | | 3.86 | | | | 3.42 | | | | 4.68 | | | | 5.76 | |
| Portfolio turnover rate (%) | | | 181 | ** | | | 115 | | | | 219 | | | | 357 | | | | 284 | | | | 196 | |
a Based on average shares outstanding during the period. b Total return would have been lower had certain expenses not been reduced. * Annualized ** Not annualized | |
Notes to Financial Statements (Unaudited)
A. Organization and Significant Accounting Policies
DWS Variable Series I (the "Series") is registered under the Investment Company Act of 1940, as amended (the "1940 Act"), as an open-end, registered management investment company organized as a Massachusetts business trust. The Series consists of five diversified funds: DWS Bond VIP, DWS Core Equity VIP, DWS Capital Growth VIP, DWS Global Small Cap Growth VIP and DWS International VIP (individually or collectively hereinafter referred to as a "Fund" or the "Funds"). These financial statements report on DWS Bond VIP. The Series is intended to be the underlying investment vehicle for variable annuity contracts and variable life insurance policies to be offered by the separate accounts of certain life insurance companies ("Participating Insurance Companies").
The Fund's financial statements are prepared in accordance with accounting principles generally accepted in the United States of America, which require the use of management estimates. Actual results could differ from those estimates. The policies described below are followed consistently by the Fund in the preparation of its financial statements.
Security Valuation. Investments are stated at value determined as of the close of regular trading on the New York Stock Exchange on each day the exchange is open for trading.
Various inputs are used in determining the value of the Fund's investments. These inputs are summarized in three broad levels. Level 1 includes quoted prices in active markets for identical securities. Level 2 includes other significant observable inputs (including quoted prices for similar securities, interest rates, prepayment speeds, and credit risk). Level 3 includes significant unobservable inputs (including the Fund's own assumptions in determining the fair value of investments). The inputs or methodology used for valuing securities are not necessarily an indication of the risk associated with investing in those securities.
Debt securities and loan participations and assignments are valued at prices supplied by independent pricing services approved by the Trustees of the Series. If the pricing services are unable to provide valuations, securities are valued at the most recent bid quotation or evaluated price, as applicable, obtained from one or more broker-dealers. Such services may use various pricing techniques which take into account appropriate factors such as yield, quality, coupon rate, maturity, type of issue, trading characteristics and other data, as well as broker quotes. These securities are generally categorized as Level 2.
Money market instruments purchased with an original or remaining maturity of sixty days or less, maturing at par, are valued at amortized cost, which approximates value, and are categorized as Level 2. Investments in open-end investment companies are valued at their net asset value each business day and are categorized as Level 1.
Futures contracts are generally valued at the settlement prices established each day on the exchange on which they are traded and are categorized as Level 1.
Swap contracts are valued daily based upon prices supplied by a Board approved pricing vendor, if available, and otherwise are valued at the price provided by the broker-dealer. Swap contracts are generally categorized as Level 2.
Forward currency contracts are valued at the prevailing forward exchange rate of the underlying currencies and are categorized as Level 2.
Exchange-traded options are valued at the last sale price or, in the absence of a sale, the mean between the closing bid and asked prices or at the most recent asked price (bid for purchased options) if no bid or asked price are available. Exchange-traded options are categorized as Level 1. Over-the-counter written or purchased options are valued at the price provided by the broker-dealer with which the option was traded and are generally categorized as Level 2.
Securities and other assets for which market quotations are not readily available or for which the above valuation procedures are deemed not to reflect fair value are valued in a manner that is intended to reflect their fair value as determined in accordance with procedures approved by the Trustees and are generally categorized as Level 3. In accordance with the Fund's valuation procedures, factors used in determining value may include, but are not limited to, the type of the security; the size of the holding; the initial cost of the security; the existence of any contractual restrictions on the security's disposition; the price and extent of public trading in similar securities of the issuer or of comparable companies; quotations or evaluated prices from broker-dealers and/or pricing services; information obtained from the issuer, analysts, and/or the appropriate stock exchange (for exchange-traded securities); an analysis of the company's or issuer's financial statements; an evaluation of the forces that influence the issuer and the market(s) in which the security is purchased and sold and with respect to debt securities; the maturity, coupon, creditworthiness, currency denomination and the movement of the market in which the security is normally traded. The value determined under these procedures may differ from published values for the same securities.
Disclosure about the classification of fair value measurements is included in a table following the Fund's Investment Portfolio.
Securities Lending. Deutsche Bank AG, as lending agent, lends securities of the Fund to certain financial institutions under the terms of the Security Lending Agreement. The Fund retains the benefits of owning the securities it has loaned and continues to receive interest and dividends generated by the securities and to participate in any changes in their market value. The Fund requires the borrowers of the securities to maintain collateral with the Fund consisting of either cash or liquid, unencumbered assets having a value at least equal to the value of the securities loaned. When the collateral falls below specified amounts, the lending agent will use its best effort to obtain additional collateral on the next business day to meet required amounts under the security lending agreement. The Fund may invest the cash collateral into a joint trading account in an affiliated money market fund pursuant to Exemptive Orders issued by the SEC. The Fund receives compensation for lending its securities either in the form of fees or by earning interest on invested cash collateral net of borrower rebates and fees paid to a lending agent. Either the Fund or the borrower may terminate the loan. There may be risks of delay and costs in recovery of securities or even loss of rights in the collateral should the borrower of the securities fail financially. If the Fund is not able to recover securities lent, the Fund may sell the collateral and purchase a replacement investment in the market, incurring the risk that the value of the replacement security is greater than the value of the collateral. The Fund is also subject to all investment risks associated with the reinvestment of any cash collateral received, including, but not limited to, interest rate, credit and liquidity risk associated with such investments.
As of June 30, 2013, the Fund had securities on loan with a gross value of $5,013,650. The value of the related collateral, $5,169,839, exceeded the value of the securities loaned at period end.
Foreign Currency Translations. The books and records of the Fund are maintained in U.S. dollars. Investment securities and other assets and liabilities denominated in a foreign currency are translated into U.S. dollars at the prevailing exchange rates at period end. Purchases and sales of investment securities, income and expenses are translated into U.S. dollars at the prevailing exchange rates on the respective dates of the transactions.
Net realized and unrealized gains and losses on foreign currency transactions represent net gains and losses between trade and settlement dates on securities transactions, the acquisition and disposition of foreign currencies, and the difference between the amount of net investment income accrued and the U.S. dollar amount actually received. That portion of both realized and unrealized gains and losses on investments that results from fluctuations in foreign currency exchange rates is not separately disclosed but is included with net realized and unrealized gain/appreciation and loss/depreciation on investments.
Loan Participations and Assignments. Loan Participations and Assignments are portions of loans originated by banks and sold in pieces to investors. These U.S. dollar-denominated fixed and floating rate loans ("Loans") in which the Fund invests, are arranged between the borrower and one or more financial institutions ("Lenders"). These Loans may take the form of Senior Loans, which are corporate obligations often issued in connection with recapitalizations, acquisitions, leveraged buy-outs and refinancings, and Sovereign Loans, which are debt instruments between a foreign sovereign entity and one or more financial institutions. The Fund invests in such Loans in the form of participations in Loans ("Participations") or assignments of all or a portion of Loans from third parties ("Assignments"). Participations typically result in the Fund having a contractual relationship only with the Lender, not with the borrower. The Fund has the right to receive payments of principal, interest and any fees to which it is entitled from the Lender selling the Participation and only upon receipt by the Lender of the payments from the borrower. In connection with purchasing Participations, the Fund generally has no right to enforce compliance by the borrower with the terms of the loan agreement relating to the Loan, or any rights of set-off against the borrower, and the Fund will not benefit directly from any collateral supporting the Loan in which it has purchased the Participation. As a result, the Fund assumes the credit risk of both the borrower and the Lender that is selling the Participation. Assignments typically result in the Fund having a direct contractual relationship with the borrower, and the Fund may enforce compliance by the borrower with the terms of the loan agreement. Loans held by the Fund generally in the form of Assignments but the Fund may also invest in Participations. All Loan Participations and Assignments involve interest rate risk, liquidity risk and credit risk, including the potential default or insolvency of the borrower.
When-Issued/Delayed Delivery Securities. The Fund may purchase or sell securities with delivery or payment to occur at a later date beyond the normal settlement period. At the time the Fund enters into a commitment to purchase or sell a security, the transaction is recorded and the value of the transaction is reflected in the net asset value. The price of such security and the date when the security will be delivered and paid for are fixed at the time the transaction is negotiated. The value of the security may vary with market fluctuations. At the time the Fund enters into a purchase transaction it is required to segregate cash or other liquid assets at least equal to the amount of the commitment.
Certain risks may arise upon entering into when-issued or delayed delivery transactions from the potential inability of counterparties to meet the terms of their contracts or if the issuer does not issue the securities due to political, economic, or other factors. Additionally, losses may arise due to changes in the value of the underlying securities.
Taxes. The Fund is treated as a separate taxpayer as provided for in the Internal Revenue Code, as amended. It is the Fund's policy to comply with the requirements of the Internal Revenue Code, as amended, which are applicable to regulated investment companies, and to distribute all of its taxable income to the separate accounts of the Participating Insurance Companies which hold its shares.
Additionally, the Fund may be subject to taxes imposed by the governments of countries in which it invests and are generally based on income and/or capital gains earned or repatriated. Estimated tax liabilities on certain foreign securities are recorded on an accrual basis and are reflected as components of interest income or net change in unrealized gain/loss on investments. Tax liabilities realized as a result of security sales are reflected as a component of net realized gain/loss on investments.
Under the Regulated Investment Company Modernization Act of 2010, net capital losses incurred post-enactment may be carried forward indefinitely, and their character is retained as short-term and/or long-term. Previously, net capital losses were carried forward for eight years and treated as short-term losses. As a transition rule, the Act requires that post-enactment net capital losses be used before pre-enactment net capital losses.
At December 31, 2012, the Fund had a net tax basis capital loss carryforward of approximately $79,389,000, including $45,070,000 inherited from its merger with DWS Core Fixed Income VIP in fiscal year 2012, which may be applied against any realized net taxable capital gains of each succeeding year until fully utilized or until December 31, 2016 ($45,070,000) and December 31, 2017 ($34,319,000), the respective expiration dates, whichever occurs first, and which may be subject to certain limitations under Sections 381-384 of the Internal Revenue Code.
The Fund has reviewed the tax positions for the open tax years as of December 31, 2012 and has determined that no provision for income tax is required in the Fund's financial statements. The Fund's federal tax returns for the prior three fiscal years remain open subject to examination by the Internal Revenue Service.
Distribution of Income and Gains. Distributions from net investment income of the Fund, if any, are declared and distributed to shareholders annually. Net realized gains from investment transactions, in excess of available capital loss carryforwards, would be taxable to the Fund if not distributed, and, therefore, will be distributed to shareholders at least annually. The Fund may also make additional distributions for tax purposes if necessary.
The timing and characterization of certain income and capital gain distributions are determined annually in accordance with federal tax regulations which may differ from accounting principles generally accepted in the United States of America. These differences primarily relate to investments in foreign denominated investments, investments in forward foreign currency exchange contracts, futures contracts, swap contracts and certain securities sold at a loss. As a result, net investment income (loss) and net realized gain (loss) on investment transactions for a reporting period may differ significantly from distributions during such period. Accordingly, the Fund may periodically make reclassifications among certain of its capital accounts without impacting the net asset value of the Fund.
The tax character of current year distributions will be determined at the end of the current fiscal year.
Expenses. Expenses of the Series arising in connection with a specific Fund are allocated to that Fund. Other Series expenses which cannot be directly attributed to a Fund are apportioned among the Funds in the Series based upon the relative net assets or other appropriate measures.
Contingencies. In the normal course of business, the Fund may enter into contracts with service providers that contain general indemnification clauses. The Fund's maximum exposure under these arrangements is unknown as this would involve future claims that may be made against the Fund that have not yet been made. However, based on experience, the Fund expects the risk of loss to be remote.
Other. Investment transactions are accounted for on a trade date plus one basis for daily net asset value calculations. However, for financial reporting purposes, investment transactions are reported on trade date. Interest income is recorded on the accrual basis net of foreign withholding taxes. Realized gains and losses from investment transactions are recorded on an identified cost basis and may include proceeds from litigation. All discounts and premiums are accreted/amortized for both tax and financial reporting purposes.
B. Derivative Instruments
Futures Contracts. A futures contract is an agreement between a buyer or seller and an established futures exchange or its clearinghouse in which the buyer or seller agrees to take or make a delivery of a specific amount of a financial instrument at a specified price on a specific date (settlement date). For the six months ended June 30, 2013, the Fund invested in interest rate futures to gain exposure to different parts of the yield curve while managing the overall duration. The Fund also entered into interest rate futures contracts for non-hedging purposes to seek to enhance potential gains.
Upon entering into a futures contract, the Fund is required to deposit with a financial intermediary cash or securities ("initial margin") in an amount equal to a certain percentage of the face value indicated in the futures contract. Subsequent payments ("variation margin") are made or received by the Fund dependent upon the daily fluctuations in the value and are recorded for financial reporting purposes as unrealized gains or losses by the Fund. Gains or losses are realized when the contract expires or is closed. Since all futures contracts are exchange traded, counterparty risk is minimized as the exchange's clearinghouse acts as the counterparty, and guarantees the futures against default.
Certain risks may arise upon entering into futures contracts, including the risk that an illiquid market will limit the Fund's ability to close out a futures contract prior to the settlement date and the risk that the futures contract is not well correlated with the security, index or currency to which it relates. Risk of loss may exceed amounts disclosed in the Statement of Assets and Liabilities.
A summary of the open futures contracts as of June 30, 2013, is included in a table following the Fund's Investment Portfolio. For the six months ended June 30, 2013, the investment in futures contracts purchased had a total notional value generally indicative of a range from approximately $8,763,000 to $26,858,000, and the investment in futures contracts sold had a total notional value generally indicative of a range from $0 to approximately $6,995,000.
Options. An option contract is a contract in which the writer (seller) of the option grants the buyer of the option, upon payment of a premium, the right to purchase from (call option), or sell to (put option), the writer a designated instrument at a specified price within a specified period of time. Certain options, including options on indices, will require cash settlement by the Fund if exercised. For the six months ended June 30, 2013, the Fund entered into options on interest rate futures and on interest rate swaps in order to hedge against potential adverse interest rate movements of portfolio assets.
If the Fund writes a covered call option, the Fund foregoes, in exchange for the premium, the opportunity to profit during the option period from an increase in the market value of the underlying security above the exercise price. If the Fund writes a put option it accepts the risk of a decline in the value of the underlying security below the exercise price. Over-the-counter options have the risk of the potential inability of counterparties to meet the terms of their contracts. The Fund's maximum exposure to purchased options is limited to the premium initially paid. In addition, certain risks may arise upon entering into option contracts including the risk that an illiquid secondary market will limit the Fund's ability to close out an option contract prior to the expiration date and that a change in the value of the option contract may not correlate exactly with changes in the value of the securities or currencies hedged.
A summary of the open purchased option contracts as of June 30, 2013 is included in the Fund's Investment Portfolio. A summary of open written option contracts is included in the table following the Fund's Investment Portfolio. For the six months ended June 30, 2013, the investment in written options contracts had a total value generally indicative of a range from approximately $26,000 to $158,000, and purchased option contracts had a total value generally indicative of a range from approximately $1,000 to $15,000.
Credit Default Swap Contracts. A credit default swap is a contract between a buyer and a seller of protection against pre-defined credit events for the reference entity. The Fund may enter into credit default swap contracts to gain exposure to an underlying issuer's credit quality characteristics without directly investing in that issuer or to hedge against the risk of a credit event on debt securities. As a seller in the credit default swap contract, the Fund is required to pay the par (or other agreed-upon) value of the referenced entity to the counterparty with the occurrence of a credit event by a third party, such as a U.S. or foreign corporate issuer, on the reference entity, which would likely result in a loss to the Fund. In return, the Fund receives from the counterparty a periodic stream of payments over the term of the contract provided that no credit event has occurred. If no credit event occurs, the Fund keeps the stream of payments with no payment obligations. The Fund may also buy credit default swap contracts, in which case the Fund functions as the counterparty referenced above. This involves the risk that the contract may expire worthless. It also involves counterparty risk that the seller may fail to satisfy its payment obligations to the Fund with the occurrence of a credit event. When the Fund sells a credit default swap contract it will cover its commitment. This may be achieved by, among other methods, maintaining cash or liquid assets equal to the aggregate notional value of the reference entities for all outstanding credit default swap contracts sold by the Fund. For the six months ended June 30, 2013, the Fund entered into credit default swap contracts to gain exposure to the underlying issuer's credit quality characteristics and hedge the risk of default on Fund securities.
The value of the credit default swap is adjusted daily and the change in value, if any, is recorded daily as unrealized appreciation or depreciation in the Statement of Assets and Liabilities. An upfront payment, if any, made by the Fund is recorded as an asset in the Statement of Assets and Liabilities. An upfront payment, if any, received by the Fund is recorded as a liability in the Statement of Assets and Liabilities. Under the terms of the credit default swap contracts, the Fund receives or makes quarterly payments based on a specified interest rate on a fixed notional amount. These payments are recorded as a realized gain or loss in the Statement of Operations. Payments received or made as a result of a credit event or termination of the contract are recognized, net of a proportional amount of the upfront payment, as realized gains or losses in the Statement of Operations.
A summary of the open credit default swap contracts as of June 30, 2013 is included in a table following the Fund's Investment Portfolio. For the six months ended June 30, 2013, the investment in credit default swap contracts sold had a total notional value generally indicative of a range from $50,000 to $2,750,000.
Interest Rate Swap Contracts. For the six months ended June 30, 2013, the Fund entered into interest rate swap transactions to gain exposure to different parts of the yield curve while managing overall duration. The use of interest rate swaps is a highly specialized activity that involves investment techniques and risks different from those associated with ordinary portfolio security transactions. In an interest rate swap, the Fund agrees to pay to the other party to the interest rate swap (which is known as the "counterparty") a fixed rate payment in exchange for the counterparty agreeing to pay to the Fund a variable rate payment, or the Fund agrees to receive from the counterparty a fixed rate payment in exchange for the counterparty agreeing to receive from the Fund a variable rate payment. In addition, both the Fund and counterparty may agree to exchange variable rate payments based on different indices. The payment obligations are based on the notional amount of the swap. Certain risks may arise when entering into swap transactions including counterparty default, liquidity or unfavorable changes in interest rates. In connection with these agreements, securities and or cash may be identified as collateral in accordance with the terms of the swap agreements to provide assets of value and recourse in the event of default. The maximum counterparty credit risk is the net present value of the cash flows to be received from or paid to the counterparty over the term of the interest rate swap contract, to the extent that this amount is beneficial to the Fund, in addition to any related collateral posted to the counterparty by the Fund. This risk may be partially reduced by a master netting arrangement between the Fund and the counterparty. The value of the swap is adjusted daily and the change in value, if any, is recorded as unrealized appreciation or depreciation in the Statement of Assets and Liabilities. An upfront payment, if any, made by the Fund is recorded as an asset in the Statement of Assets and Liabilities. An upfront payment, if any, received by the Fund is recorded as a liability in the Statement of Assets and Liabilities. Payments received or made at the end of the measurement period are recorded as realized gain or loss in the Statement of Operations.
A summary of the open interest rate swap contracts as of June 30, 2013 is included in a table following the Fund's Investment Portfolio. For the six months ended June 30, 2013, the investment in interest rate swap contracts had a total notional amount generally indicative of a range from $27,500,000 to $56,500,000.
Forward Foreign Currency Exchange Contracts. A forward foreign currency exchange contract ("forward currency contract") is a commitment to purchase or sell a foreign currency at the settlement date at a negotiated rate. The Fund is subject to foreign exchange rate risk in its securities denominated in foreign currencies. Changes in exchange rates between foreign currencies and the U.S. dollar may affect the U.S. dollar value of foreign securities or the income or gains received on these securities. To reduce the effect of currency fluctuations, the Fund may enter into forward currency contracts. For the six months ended June 30, 2013, the Fund invested in forward currency contracts to hedge its exposure to changes in foreign currency exchange rates on its foreign currency denominated securities. In addition, the Fund also engaged in forward currency contracts for non-hedging purposes to seek to enhance potential gains.
Forward currency contracts are valued at the prevailing forward exchange rate of the underlying currencies and unrealized gain (loss) is recorded daily. On the settlement date of the forward currency contract, the Fund records a realized gain or loss equal to the difference between the value of the contract at the time it was opened and the value of the contract at the time it was closed. Certain risks may arise upon entering into forward currency contracts from the potential inability of counterparties to meet the terms of their contracts. The maximum counterparty credit risk to the Fund is measured by the unrealized gain on appreciated contracts. Additionally, when utilizing forward currency contracts to hedge, the Fund gives up the opportunity to profit from favorable exchange rate movements during the term of the contract.
A summary of the open forward currency contracts as of June 30, 2013, is included in a table following the Fund's Investment Portfolio. For the six months ended June 30, 2013, the investment in forward currency contracts U.S. dollars purchased had a total contract value generally indicative of a range from approximately $8,954,000 to $26,047,000, and the investment in forward currency contracts U.S. dollars sold had a total contract value generally indicative of a range from approximately $5,889,000 to $23,485,000.
The investment in forward currency contracts long vs. other foreign currencies sold had a total contract value generally indicative of a range from $0 to approximately $7,457,000.
The following tables summarize the value of the Fund's derivative instruments held as of June 30, 2013 and the related location in the accompanying Statement of Assets and Liabilities, presented by primary underlying risk exposure:
| Asset Derivatives | | Purchased Options | | | Forward Contracts | | | Swap Contracts | | | Total | |
| Interest Rate Contracts (a) | | $ | 1,125 | | | $ | — | | | $ | 1,755,366 | | | $ | 1,756,491 | |
| Credit Contracts (a) | | | — | | | | — | | | | 2,893 | | | | 2,893 | |
| Foreign Exchange Contracts (b) | | | — | | | | 567,970 | | | | — | | | | 567,970 | |
| | | $ | 1,125 | | | $ | 567,970 | | | $ | 1,758,259 | | | $ | 2,327,354 | |
Each of the above derivatives is located in the following Statement of Assets and Liabilities accounts:
(a) Investments in securities, at value (includes purchased options) and unrealized appreciation on swap contracts
(b) Unrealized appreciation on forward foreign currency exchange contracts
| Liability Derivatives | | Written Options | | | Forward Contracts | | | Swap Contracts | | | Futures Contracts | | | Total | |
| Interest Rate Contracts (a) (b) | | $ | (158,212 | ) | | $ | — | | | $ | (514,733 | ) | | $ | (812,829 | ) | | $ | (1,485,774 | ) |
| Foreign Exchange Contracts (c) | | | — | | | | (572,154 | ) | | | — | | | | — | | | | (572,154 | ) |
| | | $ | (158,212 | ) | | $ | (572,154 | ) | | $ | (514,733 | ) | | $ | (812,829 | ) | | $ | (2,057,928 | ) |
Each of the above derivatives is located in the following Statement of Assets and Liabilities accounts:
(a) Options written, at value and unrealized depreciation on swap contracts
(b) Includes cumulative depreciation of futures contracts as disclosed in the Investment Portfolio. Unsettled variation margin is disclosed separately within the Statement of Assets and Liabilities.
(c) Unrealized depreciation on forward foreign currency exchange contracts
Additionally, the amount of unrealized and realized gains and losses on derivative instruments recognized in Fund earnings during the six months ended June 30, 2013 and the related location in the accompanying Statement of Operations is summarized in the following tables by primary underlying risk exposure:
| Realized Gain (Loss) | | Purchased Options | | | Written Options | | | Forward Contracts | | | Swap Contracts | | | Futures Contracts | | | Total | |
| Interest Rate Contracts (a) | | $ | (932 | ) | | $ | 84,004 | | | $ | — | | | $ | 142,459 | | | $ | (591,550 | ) | | $ | (366,019 | ) |
| Credit Contracts (b) | | | — | | | | — | | | | — | | | | 5,322 | | | | — | | | | 5,322 | |
| Foreign Exchange Contracts (c) | | | — | | | | — | | | | (368,630 | ) | | | — | | | | — | | | | (368,630 | ) |
| | | $ | (932 | ) | | $ | 84,004 | | | $ | (368,630 | ) | | $ | 147,781 | | | $ | (591,550 | ) | | $ | (729,327 | ) |
Each of the above derivatives is located in the following Statement of Operations accounts:
(a) Net realized gain (loss) from investments (includes purchased options), written options, swap contracts and futures, respectively
(b) Net realized gain (loss) from swap contracts
(c) Net realized gain (loss) from foreign currency (Statement of Operations includes both forward currency contracts and foreign currency transactions)
| Change in Net Unrealized Appreciation (Depreciation) | | Purchased Options | | | Written Options | | | Forward Contracts | | | Swap Contracts | | | Futures Contracts | | | Total | |
| Interest Rate Contracts (a) | | $ | (10,435 | ) | | $ | (129,178 | ) | | $ | — | | | $ | 1,123,214 | | | $ | (820,154 | ) | | $ | 163,447 | |
| Credit Contracts (b) | | | — | | | | — | | | | — | | | | (91,488 | ) | | | — | | | | (91,488 | ) |
| Foreign Exchange Contracts (c) | | | — | | | | — | | | | 14,725 | | | | — | | | | — | | | | 14,725 | |
| | | $ | (10,435 | ) | | $ | (129,178 | ) | | $ | 14,725 | | | $ | 1,031,726 | | | $ | (820,154 | ) | | $ | 86,684 | |
Each of the above derivatives is located in the following Statement of Operations accounts:
(a) Change in net unrealized appreciation (depreciation) on investments (includes purchased options), written options, swaps contracts and futures, respectively.
(b) Change in net unrealized appreciation (depreciation) on swap contracts
(c) Change in net unrealized appreciation (depreciation) on foreign currency (Statement of Operations includes both forward currency contracts and foreign currency transactions)
As of June 30, 2013, the Fund has transactions subject to enforceable master netting agreements. A reconciliation of the gross amounts on the Statement of Assets and Liabilities to the net amounts by derivative type, including any collateral exposure, is included in the following tables:
| Counterparty | | Gross Amounts of Assets Presented in the Statement of Assets and Liabilities (a) | | | Financial Instruments and Derivatives Available for Offset | | | Non-Cash Collateral Received | | | Collateral Received (c) | | | Net Amount of Derivative Assets | |
| Bank of America | | $ | 31,298 | | | $ | — | | | $ | — | | | $ | — | | | $ | 31,298 | |
| Barclays Bank PLC | | | 981,313 | | | | (431,349 | ) | | | — | | | | — | | | | 549,964 | |
| BNP Paribas | | | 259,217 | | | | (42,702 | ) | | | — | | | | — | | | | 216,515 | |
| Citigroup, Inc. | | | 717,024 | | | | (40,253 | ) | | | — | | | | (360,000 | ) | | | 316,771 | |
| JPMorgan Chase Securities, Inc. | | | 192,357 | | | | (192,357 | ) | | | — | | | | — | | | | — | |
| Nomura International PLC | | | 142,127 | | | | (131,508 | ) | | | — | | | | — | | | | 10,619 | |
| UBS AG | | | 2,893 | | | | (2,893 | ) | | | — | | | | — | | | | — | |
| Exchange Traded Options and Futures (b) | | | 1,125 | | | | — | | | | — | | | | — | | | | 1,125 | |
| | | $ | 2,327,354 | | | $ | (841,062 | ) | | $ | — | | | $ | (360,000 | ) | | $ | 1,126,292 | |
| Counterparty | | Gross Amounts of Liabilities Presented in the Statement of Assets and Liabilities (a) | | | Financial Instruments and Derivatives Available for Offset | | | Non-Cash Collateral Pledged (c) | | | Collateral Pledged | | | Net Amount of Derivative Liabilities | |
| Barclays Bank PLC | | $ | 431,349 | | | $ | (431,349 | ) | | $ | — | | | $ | — | | | $ | — | |
| BNP Paribas | | | 42,702 | | | | (42,702 | ) | | | — | | | | — | | | | — | |
| Citigroup, Inc. | | | 40,253 | | | | (40,253 | ) | | | — | | | | — | | | | — | |
| JPMorgan Chase Securities, Inc. | | | 394,270 | | | | (192,357 | ) | | | (201,913 | ) | | | — | | | | — | |
| Nomura International PLC | | | 131,508 | | | | (131,508 | ) | | | — | | | | — | | | | — | |
| UBS AG | | | 118,017 | | | | (2,893 | ) | | | — | | | | — | | | | 115,124 | |
| Exchange Traded Options and Futures (b) | | | 899,829 | | | | — | | | | — | | | | — | | | | 899,829 | |
| | | $ | 2,057,928 | | | $ | (841,062 | ) | | $ | (201,913 | ) | | $ | — | | | $ | 1,014,953 | |
(a) Forward foreign currency exchange contracts, swap contracts and over-the-counter purchased options and written options are netted.
(b) Includes financial instruments (purchased options or futures) which are not subject to a master netting arrangement, or another similar arrangement.
(c) The actual collateral received and/or pledged may be more than the amount shown.
C. Purchases and Sales of Securities
During the six months ended June 30, 2013, purchases and sales of investment securities (excluding short-term investments and U.S. Treasury obligations) aggregated $305,750,538 and $352,606,609, respectively. Purchases and sales of U.S. Treasury obligations aggregated $2,516,317 and $18,412,911, respectively.
For the six months ended June 30, 2013, transactions for written options on interest rate swap contracts and futures contracts were as follows:
| | | Contracts/ Contract Amount | | | Premiums | |
| Outstanding, beginning of period | | | 5,700,015 | | | $ | 102,441 | |
| Options written | | | 8,000,024 | | | | 105,038 | |
| Options closed | | | (5,700,000 | ) | | | (96,615 | ) |
| Options expired | | | (15 | ) | | | (5,826 | ) |
| Outstanding, end of period | | | 8,000,024 | | | $ | 105,038 | |
D. Related Parties
Management Agreement. Under the Investment Management Agreement with Deutsche Investment Management Americas Inc. ("DIMA" or the "Advisor"), an indirect, wholly owned subsidiary of Deutsche Bank AG, the Advisor directs the investments of the Fund in accordance with its investment objectives, policies and restrictions. The Advisor determines the securities, instruments and other contracts relating to investments to be purchased, sold or entered into by the Fund.
Pursuant to the Investment Management Agreement with the Advisor, the Fund pays a monthly management fee based on the Fund's average daily net assets, computed and accrued daily and payable monthly, at the following annual rates:
| First $250 million of average daily net assets | | | .390 | % |
| Next $750 million of average daily net assets | | | .365 | % |
| Over $1 billion of average daily net assets | | | .340 | % |
Accordingly, for the six months ended June 30, 2013, the Advisor waived a portion of its management fee pursuant to the Investment Management Agreement aggregating $40,987, and the amount charged aggregated $251,367, which was equivalent to an annualized effective rate of 0.34% of the Fund's average daily net assets.
For the period from January 1, 2013 through September 30, 2013, the Advisor has contractually agreed to waive its fees and/or reimburse certain operating expenses to the extent necessary to maintain the operating expenses (excluding certain expenses such as extraordinary expenses, taxes, brokerage and interest expense) of Class A at 0.55%.
Administration Fee. Pursuant to an Administrative Services Agreement, DIMA provides most administrative services to the Fund. For all services provided under the Administrative Services Agreement, the Fund pays the Advisor an annual fee ("Administration Fee") of 0.10% of the Fund's average daily net assets, computed and accrued daily and payable monthly. For the six months ended June 30, 2013, the Administration Fee was $74,963, of which $9,608 is unpaid.
Service Provider Fees. DWS Investments Service Company ("DISC"), an affiliate of the Advisor, is the transfer agent, dividend-paying agent and shareholder service agent for the Fund. Pursuant to a sub-transfer agency agreement between DISC and DST Systems, Inc. ("DST"), DISC has delegated certain transfer agent, dividend-paying agent and shareholder service agent functions to DST. DISC compensates DST out of the shareholder servicing fee it receives from the Fund. For the six months ended June 30, 2013, the amounts charged to the Fund by DISC aggregated $308, all of which was waived.
Typesetting and Filing Service Fees. Under an agreement with DIMA, DIMA is compensated for providing typesetting and certain regulatory filing services to the Fund. For the six months ended June 30, 2013, the amount charged to the Fund by DIMA included in the Statement of Operations under "reports to shareholders" aggregated $7,459, of which $6,983 is unpaid.
Trustees' Fees and Expenses. The Fund paid retainer fees to each Trustee not affiliated with the Advisor, plus specified amounts to the Board Chairperson and Vice Chairperson and to each committee Chairperson.
Affiliated Cash Management Vehicles. The Fund may invest uninvested cash balances in Central Cash Management Fund and DWS Variable NAV Money Fund, affiliated money market funds which are managed by the Advisor. Each affiliated money market fund seeks to provide a high level of current income consistent with liquidity and the preservation of capital. Each affiliated money market fund is managed in accordance with Rule 2a-7 under the Investment Company Act of 1940, which governs the quality, maturity, diversity and liquidity of instruments in which a money market fund may invest. Central Cash Management Fund seeks to maintain a stable net asset value, and DWS Variable NAV Money Fund maintains a floating net asset value. The Fund indirectly bears its proportionate share of the expenses of each affiliated money market fund in which it invests. Central Cash Management Fund does not pay the Advisor an investment management fee. To the extent that DWS Variable NAV Money Fund pays an investment management fee to the Advisor, the Advisor will waive an amount of the investment management fee payable to the Advisor by the Fund equal to the amount of the investment management fee payable on the Fund's assets invested in DWS Variable NAV Money Fund.
Securities Lending Agent Fees. Deutsche Bank AG serves as securities lending agent for the Fund. For the six months ended June 30, 2013, the Fund incurred securities lending agent fees to Deutsche Bank AG in the amount of $900.
E. Investing in Emerging Markets
Investing in emerging markets may involve special risks and considerations not typically associated with investing in developed markets. These risks include revaluation of currencies, high rates of inflation or deflation, repatriation restrictions on income and capital, and future adverse political, social and economic developments. Moreover, securities issued in these markets may be less liquid, subject to government ownership controls or delayed settlements and may have prices more volatile or less easily assessed than those of comparable securities of issuers in developed markets.
F. Ownership of the Fund
Three participating insurance companies were owners of record of 10% or more of the total outstanding Class A shares of the Fund, owning 35%, 25% and 13%, respectively.
G. Line of Credit
The Fund and other affiliated funds (the "Participants") share in a $375 million revolving credit facility provided by a syndication of banks. The Fund may borrow for temporary or emergency purposes, including the meeting of redemption requests that otherwise might require the untimely disposition of securities. The Participants are charged an annual commitment fee which is allocated based on net assets, among each of the Participants. Interest is calculated at a rate per annum equal to the sum of the Federal Funds Rate plus 1.25 percent plus if LIBOR exceeds the Federal Funds Rate the amount of such excess. The Fund may borrow up to a maximum of 33 percent of its net assets under the agreement. The Fund had no outstanding loans at June 30, 2013.
H. Acquisition of Assets
On April 30, 2012, the Fund acquired all of the net assets of DWS Core Fixed Income VIP pursuant to a plan of reorganization approved by the Board of Trustees on November 18, 2011. The acquisition was accomplished by a tax-free exchange of 8,800,059 Class A shares of DWS Core Fixed Income VIP for 13,990,523 Class A shares of the Fund outstanding on April 30, 2012. DWS Core Fixed Income VIP's net assets at that date, $78,348,206, including $2,794,520 of net unrealized appreciation, were combined with those of the Fund. The aggregate net assets of the Fund immediately before the acquisition were $109,635,421. The combined net assets of the Fund immediately following the acquisition were $187,983,627.
Information About Your Fund's Expenses (Unaudited)
As an investor of the Fund, you incur two types of costs: ongoing expenses and transaction costs. Ongoing expenses include management fees and other Fund expenses. Examples of transaction costs include contract charges, redemption fees and account maintenance fees, which are not shown in this section. The following tables are intended to help you understand your ongoing expenses (in dollars) of investing in the Fund and to help you compare these expenses with the ongoing expenses of investing in other mutual funds. In the most recent six-month period, the Fund limited these expenses; had it not done so, expenses would have been higher. The example in the table is based on an investment of $1,000 invested at the beginning of the six-month period and held for the entire period (January 1, 2013 to June 30, 2013).
The tables illustrate your Fund's expenses in two ways:
•Actual Fund Return. This helps you estimate the actual dollar amount of ongoing expenses (but not transaction costs) paid on a $1,000 investment in the Fund using the Fund's actual return during the period. To estimate the expenses you paid over the period, simply divide your account value by $1,000 (for example, an $8,600 account value divided by $1,000 = 8.6), then multiply the result by the number in the "Expenses Paid per $1,000" line under the share class you hold.
• Hypothetical 5% Fund Return. This helps you to compare your Fund's ongoing expenses (but not transaction costs) with those of other mutual funds using the Fund's actual expense ratio and a hypothetical rate of return of 5% per year before expenses. Examples using a 5% hypothetical Fund return may be found in the shareholder reports of other mutual funds. The hypothetical account values and expenses may not be used to estimate the actual ending account balance or expenses you paid for the period.
Please note that the expenses shown in these tables are meant to highlight your ongoing expenses only and do not reflect any transaction costs. The "Expenses Paid per $1,000" line of the tables is useful in comparing ongoing expenses only and will not help you determine the relative total expense of owning different funds. If these transaction costs had been included, your costs would have been higher.
Expenses and Value of a $1,000 Investment for the six months ended June 30, 2013 | |
| Actual Fund Return | | Class A | |
| Beginning Account Value 1/1/13 | | $ | 1,000.00 | |
| Ending Account Value 6/30/13 | | $ | 960.90 | |
| Expenses Paid per $1,000* | | $ | 2.67 | |
| Hypothetical 5% Fund Return | | Class A | |
| Beginning Account Value 1/1/13 | | $ | 1,000.00 | |
| Ending Account Value 6/30/13 | | $ | 1,022.07 | |
| Expenses Paid per $1,000* | | $ | 2.76 | |
* Expenses are equal to the Fund's annualized expense ratio, multiplied by the average account value over the period, multiplied by 181 (the number of days in the most recent six-month period), then divided by 365.
| Annualized Expense Ratio | Class A |
| DWS Variable Series I — DWS Bond VIP | .55% |
For more information, please refer to the Fund's prospectus.
These tables do not reflect charges and fees ("contract charges") associated with the separate account that invests in the Fund or any variable life insurance policy or variable annuity contract for which the Fund is an investment option.
For an analysis of the fees associated with an investment in the Fund or similar funds, please refer to http://apps.finra.org/fundanalyzer/1/fa.aspx.
The Series' policies and procedures for voting proxies for portfolio securities and information about how the Series voted proxies related to its portfolio securities during the 12-month period ended June 30 are available on our Web site — www.dws-investments.com (click on "proxy voting"at the bottom of the page) — or on the SEC's Web site — www.sec.gov. To obtain a written copy of the Series' policies and procedures without charge, upon request, call us toll free at (800) 728-3337.
Summary of Management Fee Evaluation by Independent Fee Consultant
September 17, 2012
Pursuant to an Order entered into by Deutsche Investment Management Americas and affiliates (collectively, "DeAM") with the Attorney General of New York, I, Thomas H. Mack, have been appointed the Independent Fee Consultant for the DWS Funds (formerly the DWS Scudder Funds). My duties include preparing an annual written evaluation of the management fees DeAM charges the Funds, considering among other factors the management fees charged by other mutual fund companies for like services, management fees DeAM charges other clients for like services, DeAM's costs of supplying services under the management agreements and related profit margins, possible economies of scale if a Fund grows larger, and the nature and quality of DeAM's services, including fund performance. This report summarizes my evaluation for 2012, including my qualifications, the evaluation process for each of the DWS Funds, consideration of certain complex-level factors, and my conclusions. I served in substantially the same capacity in 2007, 2008, 2009, 2010 and 2011.
Qualifications
For more than 35 years I have served in various professional capacities within the investment management business. I have held investment analysis and advisory positions, including securities analyst, portfolio strategist and director of investment policy with a large investment firm. I have also performed business management functions, including business development, financial management and marketing research and analysis.
Since 1991, I have been an independent consultant within the asset management industry. I have provided services to over 125 client organizations, including investment managers, mutual fund boards, product distributors and related organizations. Over the past ten years I have completed a number of assignments for mutual fund boards, specifically including assisting boards with management contract renewal.
I hold a Master of Business Administration degree, with highest honors, from Harvard University and Master of Science and Bachelor of Science (highest honors) degrees from the University of California at Berkeley. I am an independent director and audit committee financial expert for two closed-end mutual funds and have served in various leadership and financial oversight capacities with non-profit organizations.
Evaluation of Fees for each DWS Fund
My work focused primarily on evaluating, fund-by-fund, the fees charged to each of the 103 mutual fund portfolios in the DWS Fund family. For each Fund, I considered each of the key factors mentioned above, as well as any other relevant information. In doing so I worked closely with the Funds' Independent Directors in their annual contract renewal process, as well as in their approval of contracts for several new funds (documented separately).
In evaluating each Fund's fees, I reviewed comprehensive materials provided by or on behalf of DeAM, including expense information prepared by Lipper Analytical, comparative performance information, profitability data, manager histories, and other materials. I also accessed certain additional information from the Lipper and Morningstar databases and drew on my industry knowledge and experience.
To facilitate evaluating this considerable body of information, I prepared for each Fund a document summarizing the key data elements in each area as well as additional analytics discussed below. This made it possible to consider each key data element in the context of the others.
In the course of contract renewal, DeAM agreed to implement a number of fee and expense adjustments requested by the Independent Directors which will favorably impact future fees and expenses, and my evaluation includes the effects of these changes.
Fees and Expenses Compared with Other Funds
The competitive fee and expense evaluation for each fund focused on two primary comparisons:
The Fund's contractual management fee (the advisory fee plus the administration fee where applicable) compared with those of a group of typically 12-15 funds in the same Lipper investment category (e.g. Large Capitalization Growth) having similar distribution arrangements and being of similar size.
The Fund's total expenses compared with a broader universe of funds from the same Lipper investment category and having similar distribution arrangements.
These two comparisons provide a view of not only the level of the fee compared with funds of similar scale but also the total expense the Fund bears for all the services it receives, in comparison with the investment choices available in the Fund's investment category and distribution channel. The principal figure-of-merit used in these comparisons was the subject Fund's percentile ranking against peers.
DeAM's Fees for Similar Services to Others
DeAM provided management fee schedules for all of its US domiciled fund and non-fund investment management accounts in any of the investment categories where there is a DWS Fund. These similar products included the other DWS Funds, non-fund pooled accounts, institutional accounts and sub-advisory accounts. Using this information, I calculated for each Fund the fee that would be charged to each similar product, at the subject Fund's asset level.
Evaluating information regarding non-fund products is difficult because there are varying levels of services required for different types of accounts, with mutual funds generally requiring considerably more regulatory and administrative types of service as well as having more frequent cash flows than other types of accounts. Also, while mutual fund fees for similar fund products can be expected to be similar, there will be some differences due to different pricing conditions in different distribution channels (e.g. retail funds versus those used in variable insurance products), differences in underlying investment processes and other factors.
Costs and Profit Margins
DeAM provided a detailed profitability analysis for each Fund. After making some adjustments so that the presentation would be more comparable to the available industry figures, I reviewed profit margins from investment management alone, from investment management plus other fund services (excluding distribution) provided to the Funds by DeAM (principally shareholder services), and DeAM profits from all sources, including distribution. A later section comments on overall profitability.
Economies of Scale
Economies of scale — an expected decline in management cost per dollar of fund assets as fund assets grow — are very rarely quantified and documented because of inherent difficulties in collecting and analyzing relevant data. However, in virtually every investment category that I reviewed, larger funds tend to have lower fees and lower total expenses than smaller funds. To see how each DWS Fund compares with this industry observation, I reviewed:
The trend in Fund assets over the last five years and the accompanying trend in total expenses. This shows if the Fund has grown and, if so, whether total expense (management fees as well as other expenses) have declined as a percent of assets.
Whether the Fund has break-points in its management fee schedule, the extent of the fee reduction built into the schedule and the asset levels where the breaks take effect, and in the case of a sub-advised Fund how the Fund's break-points compare with those of the sub-advisory fee schedule.
How the Fund's contractual fee schedule compares with trends in the industry data. To accomplish this, I constructed a chart showing how actual latest-fiscal-year contractual fees of the Fund and of other similar funds relate to average fund assets, with the subject Fund's contractual fee schedule superimposed.
Quality of Service — Performance
The quality-of-service evaluation focused on investment performance, which is the principal result of the investment management service. Each Fund's performance was reviewed over the past 1, 3, 5 and 10 years, as applicable, and compared with that of other funds in the same investment category and with a suitable market index.
In addition, I calculated and reviewed risk-adjusted returns relative to an index of similar mutual funds' returns and a suitable market index. The risk-adjusted returns analysis provides a way of determining the extent to which the Fund's return comparisons are mainly the product of investment value-added (or lack thereof) or alternatively taking considerably more or less risk than is typical in its investment category.
I also received and considered the history of portfolio manager changes for each Fund, as this provided an important context for evaluating the performance results.
Complex-Level Considerations
While this evaluation was conducted mainly at the individual fund level, there are some issues relating to the reasonableness of fees that can alternatively be considered across the whole fund complex:
I reviewed DeAM's profitability analysis for all DWS Funds, with a view toward determining if the allocation procedures used were reasonable and how profit levels compared with public data for other investment managers.
I considered whether DeAM and affiliates receive any significant ancillary or "fallout" benefits that should be considered in interpreting the direct profitability results. These would be situations where serving as the investment manager of the Funds is beneficial to another part of the Deutsche Bank organization.
I considered how aggregated DWS Fund expenses had varied over the years, by asset class and in the context of trends in asset levels.
I considered how aggregated DWS Fund performance measures relative to appropriate peers had varied by asset class and over time.
I reviewed the structure of the DeAM organization, trends in staffing levels, and information on compensation of investment management and other professionals compared with industry data.
Findings
Based on the process and analysis discussed above, which included reviewing a wide range of information from management and external data sources and considering among other factors the fees DeAM charges other clients, the fees charged by other fund managers, DeAM's costs and profits associated with managing the Funds, economies of scale, possible fall-out benefits, and the nature and quality of services provided, in my opinion the management fees charged the DWS Funds are reasonable.
Thomas H. Mack
President, Thomas H. Mack & Co., Inc.
Notes
DWS Investments Distributors, Inc.
222 South Riverside Plaza
Chicago, IL 60606
(800) 621-1148
VS1bond-3 (R-028373-2 8/13)
JUNE 30, 2013
SEMIANNUAL REPORT
DWS VARIABLE SERIES I
DWS Capital Growth VIP

Contents
8 Statement of Assets and Liabilities 9 Statement of Operations 10 Statement of Changes in Net Assets 14 Notes to Financial Statements 18 Information About Your Fund's Expenses 20 Summary of Management Fee Evaluation by Independent Fee Consultant |
This report must be preceded or accompanied by a prospectus. To obtain an additional prospectus or summary prospectus, if available, call (800) 728-3337 or your financial representative. We advise you to consider the Fund's objectives, risks, charges and expenses carefully before investing. The summary prospectus and prospectus contain this and other important information about the Fund. Please read the prospectus carefully before you invest.
The Fund may lend securities to approved institutions. Stocks may decline in value. See the prospectus for details.
DWS Investments is part of the Deutsche Asset & Wealth Management division of Deutsche Bank AG.
NOT FDIC/NCUA INSURED NO BANK GUARANTEE MAY LOSE VALUE NOT A DEPOSIT
NOT INSURED BY ANY FEDERAL GOVERNMENT AGENCY
Performance Summary June 30, 2013 (Unaudited)
Fund performance shown is historical, assumes reinvestment of all dividend and capital gain distributions, and does not guarantee future results. Investment return and principal value fluctuate with changing market conditions so that, when redeemed, shares may be worth more or less than their original cost. Current performance may be lower or higher than the performance data quoted. Please contact your participating insurance company for the Fund's most recent month-end performance. Performance doesn't reflect charges and fees ("contract charges") associated with the separate account that invests in the Fund or any variable life insurance policy or variable annuity contract for which the Fund is an investment option. These charges and fees will reduce returns. While all share classes have the same underlying portfolio, their performance will differ.
The gross expense ratios of the Fund, as stated in the fee table of the prospectus dated May 1, 2013 are 0.50% and 0.83% for Class A and Class B shares, respectively, and may differ from the expense ratios disclosed in the Financial Highlights tables in this report.
| Growth of an Assumed $10,000 Investment |
| The Russell 1000® Growth Index is an unmanaged, capitalization-weighted index containing those securities in the Russell 1000® Index with higher price-to-book ratios and higher forecasted growth values. Index returns do not reflect any fees or expenses and it is not possible to invest directly into an index. |
| |
| Yearly periods ended June 30 | |
| Comparative Results | |
| DWS Capital Growth VIP | | 6-Month‡ | | | 1-Year | | | 3-Year | | | 5-Year | | | 10-Year | |
| Class A | Growth of $10,000 | | $ | 11,033 | | | $ | 11,558 | | | $ | 15,509 | | | $ | 12,902 | | | $ | 19,767 | |
| Average annual total return | | | 10.33 | % | | | 15.58 | % | | | 15.75 | % | | | 5.23 | % | | | 7.05 | % |
| Russell 1000 Growth Index | Growth of $10,000 | | $ | 11,180 | | | $ | 11,707 | | | $ | 16,715 | | | $ | 14,338 | | | $ | 20,416 | |
| Average annual total return | | | 11.80 | % | | | 17.07 | % | | | 18.68 | % | | | 7.47 | % | | | 7.40 | % |
| DWS Capital Growth VIP | | 6-Month‡ | | | 1-Year | | | 3-Year | | | 5-Year | | | 10-Year | |
| Class B | Growth of $10,000 | | $ | 11,019 | | | $ | 11,523 | | | $ | 15,362 | | | $ | 12,696 | | | $ | 19,098 | |
| Average annual total return | | | 10.19 | % | | | 15.23 | % | | | 15.38 | % | | | 4.89 | % | | | 6.68 | % |
| Russell 1000 Growth Index | Growth of $10,000 | | $ | 11,180 | | | $ | 11,707 | | | $ | 16,715 | | | $ | 14,338 | | | $ | 20,416 | |
| Average annual total return | | | 11.80 | % | | | 17.07 | % | | | 18.68 | % | | | 7.47 | % | | | 7.40 | % |
The growth of $10,000 is cumulative.
‡ Total returns shown for periods less than one year are not annualized.
Portfolio Summary (Unaudited)
Asset Allocation (As a % of Investment Portfolio excluding Securities Lending Collateral) | 6/30/13 | 12/31/12 |
| | | |
| Common Stocks | 99% | 97% |
| Cash Equivalents | 1% | 3% |
| | 100% | 100% |
Sector Diversification (As a % of Common Stocks) | 6/30/13 | 12/31/12 |
| | | |
| Information Technology | 26% | 32% |
| Consumer Discretionary | 19% | 16% |
| Health Care | 15% | 13% |
| Industrials | 13% | 13% |
| Consumer Staples | 12% | 13% |
| Financials | 5% | 5% |
| Energy | 5% | 5% |
| Materials | 4% | 3% |
| Telecommunication Services | 1% | — |
| Utilities | 0% | 0% |
| | 100% | 100% |
Portfolio holdings and characteristics are subject to change.
For more complete details about the Fund's investment portfolio, see page 5.
Following the Fund's fiscal first and third quarter-end, a complete portfolio holdings listing is filed with the SEC on Form N-Q. The form will be available on the SEC's Web site at www.sec.gov, and it also may be reviewed and copied at the SEC's Public Reference Room in Washington, D.C. Information on the operation of the SEC's Public Reference Room may be obtained by calling (800) SEC-0330. The Fund's portfolio holdings are also posted on www.dws-investments.com from time to time. Please see the Fund's current prospectus for more information.
Owen Fitzpatrick, CFA
Lead Portfolio Manager
Thomas M. Hynes, Jr., CFA
Brendan O'Neill, CFA
Portfolio Managers
Investment Portfolio June 30, 2013 (Unaudited) | | | Shares | | | Value ($) | |
| | | | |
| Common Stocks 99.1% | |
| Consumer Discretionary 19.5% | |
| Auto Components 0.8% | |
| BorgWarner, Inc.* (a) | | | 67,529 | | | | 5,817,623 | |
| Hotels, Restaurants & Leisure 3.3% | |
| Brinker International, Inc. (a) | | | 145,313 | | | | 5,729,692 | |
| Las Vegas Sands Corp. | | | 147,340 | | | | 7,798,706 | |
| Norwegian Cruise Line Holdings Ltd.* (a) | | | 63,092 | | | | 1,912,319 | |
| Starwood Hotels & Resorts Worldwide, Inc. (a) | | | 140,028 | | | | 8,848,369 | |
| | | | | | | | 24,289,086 | |
| Household Durables 0.0% | |
| Taylor Morrison Home Corp. "A"* (a) | | | 4,650 | | | | 113,367 | |
| Internet & Catalog Retail 1.5% | |
| Amazon.com, Inc.* | | | 40,690 | | | | 11,299,206 | |
| Media 3.4% | |
| Comcast Corp. "A" | | | 348,980 | | | | 14,615,282 | |
| News Corp. "A" | | | 327,415 | | | | 10,673,729 | |
| | | | | | | | 25,289,011 | |
| Multiline Retail 1.1% | |
| Dollar General Corp.* | | | 163,296 | | | | 8,235,017 | |
| Specialty Retail 5.3% | |
| Dick's Sporting Goods, Inc. (a) | | | 193,194 | | | | 9,671,292 | |
| GNC Holdings, Inc. "A" (a) | | | 98,889 | | | | 4,371,883 | |
| Home Depot, Inc. | | | 186,589 | | | | 14,455,050 | |
| L Brands, Inc. (a) | | | 213,613 | | | | 10,520,440 | |
| | | | | | | | 39,018,665 | |
| Textiles, Apparel & Luxury Goods 4.1% | |
| NIKE, Inc. "B" | | | 349,769 | | | | 22,273,290 | |
| VF Corp. (a) | | | 42,135 | | | | 8,134,583 | |
| | | | | | | | 30,407,873 | |
| Consumer Staples 12.2% | |
| Beverages 3.7% | |
| Beam, Inc. | | | 152,794 | | | | 9,642,829 | |
| PepsiCo, Inc. | | | 214,302 | | | | 17,527,761 | |
| | | | | | | | 27,170,590 | |
| Food & Staples Retailing 4.4% | |
| Costco Wholesale Corp. | | | 133,314 | | | | 14,740,529 | |
| Whole Foods Market, Inc. (a) | | | 342,500 | | | | 17,631,900 | |
| | | | | | | | 32,372,429 | |
| Food Products 4.1% | |
| Hillshire Brands Co. | | | 282,957 | | | | 9,360,217 | |
| Kraft Foods Group, Inc. | | | 117,403 | | | | 6,559,306 | |
| Mead Johnson Nutrition Co. | | | 86,951 | | | | 6,889,128 | |
| Mondelez International, Inc. "A" | | | 276,682 | | | | 7,893,737 | |
| | | | | | | | 30,702,388 | |
| Energy 4.8% | |
| Energy Equipment & Services 2.5% | |
| Cameron International Corp.* | | | 97,224 | | | | 5,946,220 | |
| Schlumberger Ltd. | | | 175,383 | | | | 12,567,946 | |
| | | | | | | | 18,514,166 | |
| | | Shares | | | Value ($) | |
| | | | | | | | | |
| Oil, Gas & Consumable Fuels 2.3% | |
| Anadarko Petroleum Corp. | | | 103,655 | | | | 8,907,074 | |
| Concho Resources, Inc.* | | | 46,999 | | | | 3,934,756 | |
| Pioneer Natural Resources Co. | | | 27,661 | | | | 4,003,930 | |
| | | | | | | | 16,845,760 | |
| Financials 5.3% | |
| Capital Markets 3.0% | |
| Affiliated Managers Group, Inc.* (a) | | | 82,215 | | | | 13,478,327 | |
| Ameriprise Financial, Inc. | | | 67,147 | | | | 5,430,850 | |
| Charles Schwab Corp. | | | 137,127 | | | | 2,911,206 | |
| | | | | | | | 21,820,383 | |
| Consumer Finance 1.3% | |
| Discover Financial Services | | | 208,339 | | | | 9,925,270 | |
| Real Estate Investment Trusts 0.9% | |
| American Tower Corp. (REIT) | | | 89,066 | | | | 6,516,959 | |
| Real Estate Management & Development 0.1% | |
| Realogy Holdings Corp.* | | | 16,893 | | | | 811,540 | |
| Health Care 14.4% | |
| Biotechnology 7.7% | |
| Celgene Corp.* | | | 183,949 | | | | 21,505,478 | |
| Cepheid, Inc.* (a) | | | 155,369 | | | | 5,347,801 | |
| Gilead Sciences, Inc.* (a) | | | 432,697 | | | | 22,158,413 | |
| Medivation, Inc.* (a) | | | 162,921 | | | | 8,015,713 | |
| | | | | | | | 57,027,405 | |
| Health Care Equipment & Supplies 1.6% | |
| CareFusion Corp.* | | | 211,364 | | | | 7,788,764 | |
| St. Jude Medical, Inc. | | | 96,067 | | | | 4,383,537 | |
| | | | | | | | 12,172,301 | |
| Health Care Providers & Services 3.8% | |
| Express Scripts Holding Co.* | | | 276,663 | | | | 17,067,340 | |
| McKesson Corp. | | | 97,284 | | | | 11,139,018 | |
| | | | | | | | 28,206,358 | |
| Life Sciences Tools & Services 1.3% | |
| Thermo Fisher Scientific, Inc. (a) | | | 113,595 | | | | 9,613,545 | |
| Industrials 12.5% | |
| Aerospace & Defense 2.1% | |
| Boeing Co. | | | 74,437 | | | | 7,625,326 | |
| TransDigm Group, Inc. | | | 51,056 | | | | 8,004,049 | |
| | | | | | | | 15,629,375 | |
| Commercial Services & Supplies 0.9% | |
| Stericycle, Inc.* (a) | | | 57,396 | | | | 6,338,240 | |
| Electrical Equipment 3.4% | |
| AMETEK, Inc. (a) | | | 276,403 | | | | 11,691,847 | |
| Regal-Beloit Corp. | | | 51,146 | | | | 3,316,307 | |
| Roper Industries, Inc. (a) | | | 82,510 | | | | 10,249,392 | |
| | | | | | | | 25,257,546 | |
| Industrial Conglomerates 1.2% | |
| General Electric Co. | | | 378,408 | | | | 8,775,282 | |
| Machinery 3.7% | |
| Dover Corp. (a) | | | 115,280 | | | | 8,952,645 | |
| Parker Hannifin Corp. (a) | | | 139,888 | | | | 13,345,315 | |
| SPX Corp. (a) | | | 73,208 | | | | 5,269,512 | |
| | | | | | | | 27,567,472 | |
| | | Shares | | | Value ($) | |
| | | | | | | | | |
| Road & Rail 1.2% | |
| Norfolk Southern Corp. | | | 127,134 | | | | 9,236,285 | |
| Information Technology 25.6% | |
| Communications Equipment 2.4% | |
| QUALCOMM, Inc. | | | 290,287 | | | | 17,730,730 | |
| Computers & Peripherals 5.8% | |
| Apple, Inc. | | | 74,673 | | | | 29,576,482 | |
| EMC Corp. (a) | | | 535,358 | | | | 12,645,156 | |
| Stratasys Ltd.* | | | 7,070 | | | | 592,042 | |
| | | | | | | | 42,813,680 | |
| Internet Software & Services 4.8% | |
| eBay, Inc.* | | | 132,187 | | | | 6,836,711 | |
| Google, Inc. "A"* | | | 33,264 | | | | 29,284,628 | |
| | | | | | | | 36,121,339 | |
| IT Services 5.6% | |
| Accenture PLC "A" (a) | | | 161,668 | | | | 11,633,629 | |
| International Business Machines Corp. | | | 61,141 | | | | 11,684,657 | |
| Visa, Inc. "A" (a) | | | 101,366 | | | | 18,524,636 | |
| | | | | | | | 41,842,922 | |
| Semiconductors & Semiconductor Equipment 0.5% | |
| Broadcom Corp. "A" (a) | | | 104,049 | | | | 3,512,694 | |
| Software 6.5% | |
| Check Point Software Technologies Ltd.* (a) | | | 106,080 | | | | 5,270,054 | |
| Citrix Systems, Inc.* | | | 110,348 | | | | 6,657,295 | |
| Microsoft Corp. | | | 301,483 | | | | 10,410,208 | |
| Oracle Corp. | | | 730,565 | | | | 22,442,957 | |
| Solera Holdings, Inc. | | | 60,132 | | | | 3,346,346 | |
| | | | | | | | 48,126,860 | |
| | | Shares | | | Value ($) | |
| | | | | | | | | |
| Materials 4.0% | |
| Chemicals | |
| Ecolab, Inc. (a) | | | 133,604 | | | | 11,381,725 | |
| LyondellBasell Industries NV "A" | | | 89,527 | | | | 5,932,059 | |
| Monsanto Co. | | | 127,755 | | | | 12,622,194 | |
| | | | | | | | 29,935,978 | |
| Telecommunication Services 0.5% | |
| Wireless Telecommunication Services | |
| Crown Castle International Corp.* | | | 54,177 | | | | 3,921,873 | |
| Utilities 0.3% | |
| Water Utilities | |
| American Water Works Co., Inc. | | | 60,792 | | | | 2,506,454 | |
Total Common Stocks (Cost $470,849,603) | | | | 735,485,672 | |
| | |
| Securities Lending Collateral 16.6% | |
| Daily Assets Fund Institutional, 0.10% (b) (c) (Cost $123,356,477) | | | 123,356,477 | | | | 123,356,477 | |
| | |
| Cash Equivalents 0.9% | |
| Central Cash Management Fund, 0.07% (b) (Cost $6,524,732) | | | 6,524,732 | | | | 6,524,732 | |
| | | % of Net Assets | | | Value ($) | |
| | | | |
Total Investment Portfolio (Cost $600,730,812)† | | | 116.6 | | | | 865,366,881 | |
| Other Assets and Liabilities, Net (a) | | | (16.6 | ) | | | (123,405,791 | ) |
| Net Assets | | | 100.0 | | | | 741,961,090 | |
* Non-income producing security.
† The cost for federal income tax purposes was $603,069,362. At June 30, 2013, net unrealized appreciation for all securities based on tax cost was $262,297,519. This consisted of aggregate gross unrealized appreciation for all securities in which there was an excess of value over tax cost of $268,631,694 and aggregate gross unrealized depreciation for all securities in which there was an excess of tax cost over value of $6,334,175.
(a) All or a portion of these securities were on loan. In addition, included in other assets and liabilities, net are pending sales, that are also on loan (see Notes to Financial Statements). The value of securities loaned at June 30, 2013 amounted to $119,269,494, which is 16.1% of net assets.
(b) Affiliated fund managed by Deutsche Investment Management Americas Inc. The rate shown is the annualized seven-day yield at period end.
(c) Represents collateral held in connection with securities lending. Income earned by the Fund is net of borrower rebates.
REIT: Real Estate Investment Trust
Fair Value Measurements
Various inputs are used in determining the value of the Fund's investments. These inputs are summarized in three broad levels. Level 1 includes quoted prices in active markets for identical securities. Level 2 includes other significant observable inputs (including quoted prices for similar securities, interest rates, prepayment speeds, and credit risk). Level 3 includes significant unobservable inputs (including the Fund's own assumptions in determining the fair value of investments). The inputs or methodology used for valuing securities are not necessarily an indication of the risk associated with investing in those securities.
The following is a summary of the inputs used as of June 30, 2013 in valuing the Fund's investments. For information on the Fund's policy regarding the valuation of investments, please refer to the Security Valuation section of Note A in the accompanying Notes to Financial Statements.
| Assets | | Level 1 | | | Level 2 | | | Level 3 | | | Total | |
| | |
| Common Stocks (d) | | $ | 735,485,672 | | | $ | — | | | $ | — | | | $ | 735,485,672 | |
| Short-Term Investments (d) | | | 129,881,209 | | | | — | | | | — | | | | 129,881,209 | |
| Total | | $ | 865,366,881 | | | $ | — | | | $ | — | | | $ | 865,366,881 | |
There have been no transfers between fair value measurement levels during the period ended June 30, 2013.
(d) See Investment Portfolio for additional detailed categorizations.
The accompanying notes are an integral part of the financial statements.
Statement of Assets and Liabilities | as of June 30, 2013 (Unaudited) | |
| Assets | |
Investments: Investments in non-affiliated securities, at value (cost $470,849,603) — including $119,269,494 of securities loaned | | $ | 735,485,672 | |
| Investment in Daily Assets Fund Institutional (cost $123,356,477)* | | | 123,356,477 | |
| Investment in Central Cash Management Fund (cost $6,524,732) | | | 6,524,732 | |
| Total investments in securities, at value (cost $600,730,812) | | | 865,366,881 | |
| Foreign currency, at value (cost $3,675) | | | 3,487 | |
| Receivable for investments sold | | | 42,021,529 | |
| Receivable for Fund shares sold | | | 70,289 | |
| Dividends receivable | | | 647,960 | |
| Interest receivable | | | 3,655 | |
| Foreign taxes recoverable | | | 28,627 | |
| Other assets | | | 4,664 | |
| Total assets | | | 908,147,092 | |
| Liabilities | |
| Payable upon return of securities loaned | | | 123,356,477 | |
| Payable for investments purchased | | | 42,173,008 | |
| Payable for Fund shares redeemed | | | 290,831 | |
| Accrued management fee | | | 231,333 | |
| Accrued Trustees' fees | | | 706 | |
| Other accrued expenses and payables | | | 133,647 | |
| Total liabilities | | | 166,186,002 | |
| Net assets, at value | | $ | 741,961,090 | |
| Net Assets Consist of | |
| Undistributed net investment income | | | 2,444,538 | |
Net unrealized appreciation (depreciation) on: Investments | | | 264,636,069 | |
| Foreign currency | | | 3,489 | |
| Accumulated net realized gain (loss) | | | (38,850,036 | ) |
| Paid-in capital | | | 513,727,030 | |
| Net assets, at value | | $ | 741,961,090 | |
Class A Net Asset Value, offering and redemption price per share ($728,827,763 ÷ 31,304,064 outstanding shares of beneficial interest, $.01 par value, unlimited number of shares authorized) | | $ | 23.28 | |
Class B Net Asset Value, offering and redemption price per share ($13,133,327 ÷ 565,478 outstanding shares of beneficial interest, $.01 par value, unlimited number of shares authorized) | | $ | 23.23 | |
* Represents collateral on securities loaned.
The accompanying notes are an integral part of the financial statements.
Statement of Operations
| for the six months ended June 30, 2013 (Unaudited) | |
| Investment Income | |
Income: Dividends (net of foreign taxes withheld of $12,380) | | $ | 4,451,551 | |
| Income distributions — Central Cash Management Fund | | | 4,269 | |
| Securities lending income, including income from Daily Assets Fund Institutional, net of borrower rebates | | | 20,672 | |
| Total income | | | 4,476,492 | |
Expenses: Management fee | | | 1,387,835 | |
| Administration fee | | | 371,737 | |
| Services to shareholders | | | 2,592 | |
| Distribution and service fees (Class B) | | | 16,703 | |
| Record keeping fee (Class B) | | | 5,333 | |
| Custodian fee | | | 8,032 | |
| Professional fees | | | 33,976 | |
| Reports to shareholders | | | 1,832 | |
| Trustees' fees and expenses | | | 14,804 | |
| Total expenses | | | 1,842,844 | |
| Net investment income (loss) | | | 2,633,648 | |
| Realized and Unrealized Gain (Loss) | |
Net realized gain (loss) from: Investments | | | 50,176,232 | |
| Foreign currency | | | (1,009 | ) |
| | | �� | 50,175,223 | |
Change in net unrealized appreciation (depreciation) on: Investments | | | 20,309,437 | |
| Foreign currency | | | (1,048 | ) |
| | | | 20,308,389 | |
| Net gain (loss) | | | 70,483,612 | |
| Net increase (decrease) in net assets resulting from operations | | $ | 73,117,260 | |
The accompanying notes are an integral part of the financial statements.
Statement of Changes in Net Assets | Increase (Decrease) in Net Assets | | Six Months Ended June 30, 2013 (Unaudited) | | | Year Ended December 31, 2012 | |
Operations: Net investment income (loss) | | $ | 2,633,648 | | | $ | 9,693,194 | |
| Net realized gain (loss) | | | 50,175,223 | | | | 39,822,591 | |
| Change in net unrealized appreciation (depreciation) | | | 20,308,389 | | | | 58,817,893 | |
| Net increase (decrease) in net assets resulting from operations | | | 73,117,260 | | | | 108,333,678 | |
Distributions to shareholders from: Net investment income: Class A | | | (9,616,234 | ) | | | (6,353,433 | ) |
| Class B | | | (131,767 | ) | | | (73,349 | ) |
| Total distributions | | | (9,748,001 | ) | | | (6,426,782 | ) |
Fund share transactions: Class A Proceeds from shares sold | | | 4,965,062 | | | | 16,829,443 | |
| Reinvestment of distributions | | | 9,616,234 | | | | 6,353,433 | |
| Payments for shares redeemed | | | (49,069,341 | ) | | | (99,466,658 | ) |
| Net increase (decrease) in net assets from Class A share transactions | | | (34,488,045 | ) | | | (76,283,782 | ) |
Class B Proceeds from shares sold | | | 303,236 | | | | 580,173 | |
| Reinvestment of distributions | | | 131,767 | | | | 73,349 | |
| Payments for shares redeemed | | | (1,252,837 | ) | | | (2,697,364 | ) |
| Net increase (decrease) in net assets from Class B share transactions | | | (817,834 | ) | | | (2,043,842 | ) |
| Increase (decrease) in net assets | | | 28,063,380 | | | | 23,579,272 | |
| Net assets at beginning of period | | | 713,897,710 | | | | 690,318,438 | |
| Net assets at end of period (including undistributed net investment income of $2,444,538 and $9,558,891, respectively) | | $ | 741,961,090 | | | $ | 713,897,710 | |
| Other Information | |
Class A Shares outstanding at beginning of period | | | 32,798,165 | | | | 36,451,466 | |
| Shares sold | | | 216,183 | | | | 801,185 | |
| Shares issued to shareholders in reinvestment of distributions | | | 419,923 | | | | 298,283 | |
| Shares redeemed | | | (2,130,207 | ) | | | (4,752,769 | ) |
| Net increase (decrease) in Class A shares | | | (1,494,101 | ) | | | (3,653,301 | ) |
| Shares outstanding at end of period | | | 31,304,064 | | | | 32,798,165 | |
Class B Shares outstanding at beginning of period | | | 600,771 | | | | 698,290 | |
| Shares sold | | | 13,273 | | | | 28,055 | |
| Shares issued to shareholders in reinvestment of distributions | | | 5,764 | | | | 3,450 | |
| Shares redeemed | | | (54,330 | ) | | | (129,024 | ) |
| Net increase (decrease) in Class B shares | | | (35,293 | ) | | | (97,519 | ) |
| Shares outstanding at end of period | | | 565,478 | | | | 600,771 | |
The accompanying notes are an integral part of the financial statements.
| | | | | | Years Ended December 31, | |
| Class A | | Six Months Ended 6/30/13 (Unaudited) | | | 2012 | | | 2011 | | | 2010 | | | 2009 | | | 2008 | |
| Selected Per Share Data | |
| Net asset value, beginning of period | | $ | 21.38 | | | $ | 18.58 | | | $ | 19.59 | | | $ | 16.93 | | | $ | 13.55 | | | $ | 20.41 | |
Income (loss) from investment operations: Net investment income (loss)a | | | .08 | | | | .28 | | | | .17 | | | | .14 | c | | | .14 | | | | .16 | |
| Net realized and unrealized gain (loss) | | | 2.12 | | | | 2.70 | | | | (1.03 | ) | | | 2.68 | | | | 3.43 | | | | (6.83 | ) |
| Total from investment operations | | | 2.20 | | | | 2.98 | | | | (.86 | ) | | | 2.82 | | | | 3.57 | | | | (6.67 | ) |
Less distributions from: Net investment income | | | (.30 | ) | | | (.18 | ) | | | (.15 | ) | | | (.16 | ) | | | (.19 | ) | | | (.19 | ) |
| Net asset value, end of period | | $ | 23.28 | | | $ | 21.38 | | | $ | 18.58 | | | $ | 19.59 | | | $ | 16.93 | | | $ | 13.55 | |
| Total Return (%) | | | 10.33 | ** | | | 16.05 | | | | (4.47 | ) | | | 16.71 | b | | | 26.87 | b | | | (32.98 | )b |
| Ratios to Average Net Assets and Supplemental Data | |
| Net assets, end of period ($ millions) | | | 729 | | | | 701 | | | | 677 | | | | 729 | | | | 715 | | | | 594 | |
| Ratio of expenses before expense reductions (%) | | | .50 | * | | | .50 | | | | .50 | | | | .51 | | | | .51 | | | | .50 | |
| Ratio of expenses after expense reductions (%) | | | .50 | * | | | .50 | | | | .50 | | | | .51 | | | | .49 | | | | .49 | |
| Ratio of net investment income (loss) (%) | | | .70 | * | | | 1.32 | | | | .86 | | | | .78 | c | | | .98 | | | | .89 | |
| Portfolio turnover rate (%) | | | 20 | ** | | | 25 | | | | 47 | | | | 42 | | | | 76 | | | | 21 | |
a Based on average shares outstanding during the period. b Total return would have been lower had certain expenses not been reduced. c Net investment income per share and ratio of net investment income include non-recurring dividend income amounting to $0.05 per share and 0.28% of average daily net assets for the year ended December 31, 2010. * Annualized ** Not annualized | |
| | | | | | Years Ended December 31, | |
| Class B | | Six Months Ended 6/30/13 (Unaudited) | | | 2012 | | | 2011 | | | 2010 | | | 2009 | | | 2008 | |
| Selected Per Share Data | |
| Net asset value, beginning of period | | $ | 21.29 | | | $ | 18.51 | | | $ | 19.51 | | | $ | 16.86 | | | $ | 13.49 | | | $ | 20.31 | |
Income (loss) from investment operations: Net investment income (loss)a | | | .04 | | | | .20 | | | | .10 | | | | .08 | c | | | .09 | | | | .10 | |
| Net realized and unrealized gain (loss) | | | 2.13 | | | | 2.69 | | | | (1.02 | ) | | | 2.67 | | | | 3.43 | | | | (6.81 | ) |
| Total from investment operations | | | 2.17 | | | | 2.89 | | | | (.92 | ) | | | 2.75 | | | | 3.52 | | | | (6.71 | ) |
Less distributions from: Net investment income | | | (.23 | ) | | | (.11 | ) | | | (.08 | ) | | | (.10 | ) | | | (.15 | ) | | | (.11 | ) |
| Net asset value, end of period | | $ | 23.23 | | | $ | 21.29 | | | $ | 18.51 | | | $ | 19.51 | | | $ | 16.86 | | | $ | 13.49 | |
| Total Return (%) | | | 10.19 | ** | | | 15.61 | | | | (4.76 | ) | | | 16.33 | b | | | 26.49 | b | | | (33.20 | )b |
| Ratios to Average Net Assets and Supplemental Data | |
| Net assets, end of period ($ millions) | | | 13 | | | | 13 | | | | 13 | | | | 12 | | | | 12 | | | | 10 | |
| Ratio of expenses before expense reductions (%) | | | .83 | * | | | .83 | | | | .84 | | | | .85 | | | | .85 | | | | .85 | |
| Ratio of expenses after expense reductions (%) | | | .83 | * | | | .83 | | | | .84 | | | | .84 | | | | .82 | | | | .82 | |
| Ratio of net investment income (loss) (%) | | | .37 | * | | | .97 | | | | .52 | | | | .45 | c | | | .65 | | | | .56 | |
| Portfolio turnover rate (%) | | | 20 | ** | | | 25 | | | | 47 | | | | 42 | | | | 76 | | | | 21 | |
a Based on average shares outstanding during the period. b Total return would have been lower had certain expenses not been reduced. c Net investment income per share and ratio of net investment income include non-recurring dividend income amounting to $0.05 per share and 0.28% of average daily net assets for the year ended December 31, 2010. * Annualized ** Not annualized | |
Notes to Financial Statements (Unaudited)
A. Organization and Significant Accounting Policies
DWS Variable Series I (the "Series") is registered under the Investment Company Act of 1940, as amended (the "1940 Act"), as an open-end, registered management investment company organized as a Massachusetts business trust. The Series consists of five diversified funds: DWS Bond VIP, DWS Core Equity VIP, DWS Capital Growth VIP, DWS Global Small Cap Growth VIP and DWS International VIP (individually or collectively hereinafter referred to as a "Fund" or the "Funds"). These financial statements report on DWS Capital Growth VIP. The Series is intended to be the underlying investment vehicle for variable annuity contracts and variable life insurance policies to be offered by the separate accounts of certain life insurance companies ("Participating Insurance Companies").
Multiple Classes of Shares of Beneficial Interest. The Fund offers two classes of shares (Class A shares and Class B shares). Class B shares are subject to Rule 12b-1 distribution fees under the 1940 Act and record keeping fees equal to an annual rate of 0.25% and up to 0.15%, respectively, of the average daily net assets of the Class B shares of the Fund. Class A shares are not subject to such fees.
Investment income, realized and unrealized gains and losses, and certain fund-level expenses and expense reductions, if any, are borne pro rata on the basis of relative net assets by the holders of all classes of shares, except that each class bears certain expenses unique to that class (including the applicable 12b-1 distribution fees and recordkeeping fees). Differences in class-level expenses may result in payment of different per share dividends by class. All shares have equal rights with respect to voting subject to class-specific arrangements.
The Fund's financial statements are prepared in accordance with accounting principles generally accepted in the United States of America, which require the use of management estimates. Actual results could differ from those estimates. The policies described below are followed consistently by the Fund in the preparation of its financial statements.
Security Valuation. Investments are stated at value determined as of the close of regular trading on the New York Stock Exchange on each day the exchange is open for trading.
Various inputs are used in determining the value of the Fund's investments. These inputs are summarized in three broad levels. Level 1 includes quoted prices in active markets for identical securities. Level 2 includes other significant observable inputs (including quoted prices for similar securities, interest rates, prepayment speeds, and credit risk). Level 3 includes significant unobservable inputs (including the Fund's own assumptions in determining the fair value of investments). The inputs or methodology used for valuing securities are not necessarily an indication of the risk associated with investing in those securities.
Equity securities are valued at the most recent sale price or official closing price reported on the exchange (U.S. or foreign) or over-the-counter market on which they trade and are categorized as Level 1 securities. Securities for which no sales are reported are valued at the calculated mean between the most recent bid and asked quotations on the relevant market or, if a mean cannot be determined, at the most recent bid quotation.
Investments in open-end investment companies are valued at their net asset value each business day and are categorized as Level 1.
Securities and other assets for which market quotations are not readily available or for which the above valuation procedures are deemed not to reflect fair value are valued in a manner that is intended to reflect their fair value as determined in accordance with procedures approved by the Trustees and are generally categorized as Level 3. In accordance with the Fund's valuation procedures, factors used in determining value may include, but are not limited to, the type of the security; the size of the holding; the initial cost of the security; the existence of any contractual restrictions on the security's disposition; the price and extent of public trading in similar securities of the issuer or of comparable companies; quotations or evaluated prices from broker-dealers and/or pricing services; information obtained from the issuer, analysts, and/or the appropriate stock exchange (for exchange-traded securities); an analysis of the company's or issuer's financial statements; an evaluation of the forces that influence the issuer and the market(s) in which the security is purchased and sold and with respect to debt securities; the maturity, coupon, creditworthiness, currency denomination and the movement of the market in which the security is normally traded. The value determined under these procedures may differ from published values for the same securities.
Disclosure about the classification of fair value measurements is included in a table following the Fund's Investment Portfolio.
Securities Lending. Brown Brothers Harriman & Co., as lending agent, lends securities of the Fund to certain financial institutions under the terms of the Security Lending Agreement. The Fund retains the benefits of owning the securities it has loaned and continues to receive interest and dividends generated by the securities and to participate in any changes in their market value. The Fund requires the borrowers of the securities to maintain collateral with the Fund consisting of either cash or liquid, unencumbered assets having a value at least equal to the value of the securities loaned. When the collateral falls below specified amounts, the lending agent will use its best effort to obtain additional collateral on the next business day to meet required amounts under the security lending agreement. The Fund may invest the cash collateral into a joint trading account in an affiliated money market fund pursuant to Exemptive Orders issued by the SEC. The Fund receives compensation for lending its securities either in the form of fees or by earning interest on invested cash collateral net of borrower rebates and fees paid to a lending agent. Either the Fund or the borrower may terminate the loan. There may be risks of delay and costs in recovery of securities or even loss of rights in the collateral should the borrower of the securities fail financially. If the Fund is not able to recover securities lent, the Fund may sell the collateral and purchase a replacement investment in the market, incurring the risk that the value of the replacement security is greater than the value of the collateral. The Fund is also subject to all investment risks associated with the reinvestment of any cash collateral received, including, but not limited to, interest rate, credit and liquidity risk associated with such investments.
As of June 30, 2013, the Fund had securities on loan with a gross value of $119,269,494. The value of the related collateral, $123,356,477, exceeded the value of the securities loaned at period end.
Foreign Currency Translations. The books and records of the Fund are maintained in U.S. dollars. Investment securities and other assets and liabilities denominated in a foreign currency are translated into U.S. dollars at the prevailing exchange rates at period end. Purchases and sales of investment securities, income and expenses are translated into U.S. dollars at the prevailing exchange rates on the respective dates of the transactions.
Net realized and unrealized gains and losses on foreign currency transactions represent net gains and losses between trade and settlement dates on securities transactions, the acquisition and disposition of foreign currencies, and the difference between the amount of net investment income accrued and the U.S. dollar amount actually received. That portion of both realized and unrealized gains and losses on investments that results from fluctuations in foreign currency exchange rates is not separately disclosed but is included with net realized and unrealized gain/appreciation and loss/depreciation on investments.
Federal Income Taxes. The Fund is treated as a separate taxpayer as provided for in the Internal Revenue Code, as amended. It is the Fund's policy to comply with the requirements of the Internal Revenue Code, as amended, which are applicable to regulated investment companies, and to distribute all of its taxable income to the separate accounts of the Participating Insurance Companies which hold its shares.
Under the Regulated Investment Company Modernization Act of 2010, net capital losses incurred post-enactment may be carried forward indefinitely, and their character is retained as short-term and/or long-term. Previously, net capital losses were carried forward for eight years and treated as short-term. As a transition rule, the Act requires that post-enactment net capital losses be used before pre-enactment net capital losses.
At December 31, 2012, the Fund had a net tax basis capital loss carryforward of approximately $86,678,000 of pre-enactment losses, including $48,520,000 inherited from its merger with other affiliated funds in previous years, which may be applied against any realized net taxable capital gains of each year until fully utilized or until December 31, 2015 ($6,855,000), December 31, 2016 ($41,665,000) and December 31, 2017 ($38,158,000), the respective expiration dates, whichever occurs first, and which may be subject to certain limitations under Section 382-384 of the Internal Revenue Code.
The Fund has reviewed the tax positions for the open tax years as of December 31, 2012 and has determined that no provision for income tax is required in the Fund's financial statements. The Fund's federal tax returns for the prior three fiscal years remain open subject to examination by the Internal Revenue Service.
Distribution of Income and Gains. Distributions from net investment income of the Fund, if any, are declared and distributed to shareholders annually. Net realized gains from investment transactions, in excess of available capital loss carryforwards, would be taxable to the Fund if not distributed, and, therefore, will be distributed to shareholders at least annually. The Fund may also make additional distributions for tax purposes if necessary.
The timing and characterization of certain income and capital gain distributions are determined annually in accordance with federal tax regulations which may differ from accounting principles generally accepted in the United States of America. These differences primarily relate to certain securities sold at a loss. As a result, net investment income (loss) and net realized gain (loss) on investment transactions for a reporting period may differ significantly from distributions during such period. Accordingly, the Fund may periodically make reclassifications among certain of its capital accounts without impacting the net asset value of the Fund.
The tax character of current year distributions will be determined at the end of the current fiscal year.
Expenses. Expenses of the Series arising in connection with a specific Fund are allocated to that Fund. Other Series expenses which cannot be directly attributed to a Fund are apportioned among the Funds in the Series based upon the relative net assets or other appropriate measures.
Contingencies. In the normal course of business, the Fund may enter into contracts with service providers that contain general indemnification clauses. The Fund's maximum exposure under these arrangements is unknown as this would involve future claims that may be made against the Fund that have not yet been made. However, based on experience, the Fund expects the risk of loss to be remote.
Other. Investment transactions are accounted for on a trade date plus one basis for daily net asset value calculations. However, for financial reporting purposes, investment transactions are reported on trade date. Interest income is recorded on the accrual basis. Dividend income is recorded on the ex-dividend date net of foreign withholding taxes. Certain dividends from foreign securities may be recorded subsequent to the ex-dividend date as soon as the Fund is informed of such dividends. Realized gains and losses from investment transactions are recorded on an identified cost basis and may include proceeds from litigation.
B. Purchases and Sales of Securities
During the six months ended June 30, 2013, purchases and sales of investment securities (excluding short-term investments) aggregated $145,367,218 and $171,541,260, respectively.
C. Related Parties
Management Agreement. Under the Investment Management Agreement with Deutsche Investment Management Americas Inc. ("DIMA" or the "Advisor"), an indirect, wholly owned subsidiary of Deutsche Bank AG, the Advisor directs the investments of the Fund in accordance with its investment objectives, policies and restrictions. The Advisor determines the securities, instruments and other contracts relating to investments to be purchased, sold or entered into by the Fund.
Pursuant to the Investment Management Agreement with the Advisor, the Fund pays a monthly management fee based on the Fund's average daily net assets, computed and accrued daily and payable monthly at the following annual rates:
| First $250 million of average daily net assets | | | .390 | % |
| Next $750 million of average daily net assets | | | .365 | % |
| Over $1 billion of average daily net assets | | | .340 | % |
Accordingly, for the six months ended June 30, 2013, the fee pursuant to the Investment Management Agreement was equivalent to an annualized effective rate of 0.37% of the Fund's average daily net assets.
For the period from January 1, 2013 through September 30, 2013, the Advisor has contractually agreed to waive all or a portion of its fees and/or reimburse certain operating expenses of the Fund to the extent necessary to maintain the operating expenses (excluding certain expenses such as extraordinary expenses, taxes, brokerage and interest) of each class as follows:
Administration Fee. Pursuant to an Administrative Services Agreement, DIMA provides most administrative services to the Fund. For all services provided under the Administrative Services Agreement, the Fund pays the Advisor an annual fee ("Administration Fee") of 0.10% of the Fund's average daily net assets, computed and accrued daily and payable monthly. For the six months ended June 30, 2013, the Administration Fee was $371,737, of which $61,972 is unpaid.
Service Provider Fees. DWS Investments Service Company ("DISC"), an affiliate of the Advisor, is the transfer agent, dividend-paying agent and shareholder service agent for the Fund. Pursuant to a sub-transfer agency agreement between DISC and DST Systems, Inc. ("DST"), DISC has delegated certain transfer agent, dividend-paying agent and shareholder service agent functions to DST. DISC compensates DST out of the shareholder servicing fee it receives from the Fund. For the six months ended June 30, 2013, the amounts charged to the Fund by DISC were as follows:
| Services to Shareholders | | Total Aggregated | | | Unpaid at June 30, 2013 | |
| Class A | | $ | 362 | | | $ | 124 | |
| Class B | | | 75 | | | | 21 | |
| | | $ | 437 | | | $ | 145 | |
Distribution Service Agreement. DWS Investments Distributors, Inc. ("DIDI"), also an affiliate of the Advisor, is the Series' Distributor. In accordance with the Master Distribution Plan, DIDI receives 12b-1 fees of 0.25% of average daily net assets of Class B shares. Pursuant to the Master Distribution Plan, DIDI remits these fees to the Participating Insurance Companies for various costs incurred or paid by these companies in connection with marketing and distribution of Class B shares. For the six months ended June 30, 2013, the Distribution Service Fee aggregated $16,703, of which $2,762 is unpaid.
Typesetting and Filing Service Fees. Under an agreement with DIMA, DIMA is compensated for providing typesetting and certain regulatory filing services to the Fund. For the six months ended June 30, 2013, the amount charged to the Fund by DIMA included in the Statement of Operations under "reports to shareholders" aggregated $7,463, of which $7,368 is unpaid.
Trustees' Fees and Expenses. The Fund paid retainer fees to each Trustee not affiliated with the Advisor, plus specified amounts to the Board Chairperson and Vice Chairperson and to each committee Chairperson.
Affiliated Cash Management Vehicles. The Fund may invest uninvested cash balances in Central Cash Management Fund and DWS Variable NAV Money Fund, affiliated money market funds which are managed by the Advisor. Each affiliated money market fund seeks to provide a high level of current income consistent with liquidity and the preservation of capital. Each affiliated money market fund is managed in accordance with Rule 2a-7 under the Investment Company Act of 1940, which governs the quality, maturity, diversity and liquidity of instruments in which a money market fund may invest. Central Cash Management Fund seeks to maintain a stable net asset value, and DWS Variable NAV Money Fund maintains a floating net asset value. The Fund indirectly bears its proportionate share of the expenses of each affiliated money market fund in which it invests. Central Cash Management Fund does not pay the Advisor an investment management fee. To the extent that DWS Variable NAV Money Fund pays an investment management fee to the Advisor, the Advisor will waive an amount of the investment management fee payable to the Advisor by the Fund equal to the amount of the investment management fee payable on the Fund's assets invested in DWS Variable NAV Money Fund.
D. Ownership of the Fund
Three participating insurance companies were owners of record of 10% or more of the total outstanding Class A shares of the Fund, each owning 38%, 26% and 13%.
E. Line of Credit
The Fund and other affiliated funds (the "Participants") share in a $375 million revolving credit facility provided by a syndication of banks. The Fund may borrow for temporary or emergency purposes, including the meeting of redemption requests that otherwise might require the untimely disposition of securities. The Participants are charged an annual commitment fee which is allocated based on net assets, among each of the Participants. Interest is calculated at a rate per annum equal to the sum of the Federal Funds Rate plus 1.25 percent plus if LIBOR exceeds the Federal Funds Rate the amount of such excess. The Fund may borrow up to a maximum of 33 percent of its net assets under the agreement. The Fund had no outstanding loans at June 30, 2013.
Information About Your Fund's Expenses (Unaudited)
As an investor of the Fund, you incur two types of costs: ongoing expenses and transaction costs. Ongoing expenses include management fees, distribution and service (12b-1) fees and other Fund expenses. Examples of transaction costs include contract charges and account maintenance fees, which are not shown in this section. The following tables are intended to help you understand your ongoing expenses (in dollars) of investing in the Fund and to help you compare these expenses with the ongoing expenses of investing in other mutual funds. The example in the table is based on an investment of $1,000 invested at the beginning of the six-month period and held for the entire period (January 1, 2013 to June 30, 2013).
The tables illustrate your Fund's expenses in two ways:
•Actual Fund Return. This helps you estimate the actual dollar amount of ongoing expenses (but not transaction costs) paid on a $1,000 investment in the Fund using the Fund's actual return during the period. To estimate the expenses you paid over the period, simply divide your account value by $1,000 (for example, an $8,600 account value divided by $1,000 = 8.6), then multiply the result by the number in the "Expenses Paid per $1,000" line under the share class you hold.
• Hypothetical 5% Fund Return. This helps you to compare your Fund's ongoing expenses (but not transaction costs) with those of other mutual funds using the Fund's actual expense ratio and a hypothetical rate of return of 5% per year before expenses. Examples using a 5% hypothetical Fund return may be found in the shareholder reports of other mutual funds. The hypothetical account values and expenses may not be used to estimate the actual ending account balance or expenses you paid for the period.
Please note that the expenses shown in these tables are meant to highlight your ongoing expenses only and do not reflect any transaction costs. The "Expenses Paid per $1,000" line of the tables is useful in comparing ongoing expenses only and will not help you determine the relative total expense of owning different funds. If these transaction costs had been included, your costs would have been higher.
Expenses and Value of a $1,000 Investment for the six months ended June 30, 2013 | |
| Actual Fund Return | | Class A | | | Class B | |
| Beginning Account Value 1/1/13 | | $ | 1,000.00 | | | $ | 1,000.00 | |
| Ending Account Value 6/30/13 | | $ | 1,103.30 | | | $ | 1,101.90 | |
| Expenses Paid per $1,000* | | $ | 2.61 | | | $ | 4.33 | |
| Hypothetical 5% Fund Return | | Class A | | | Class B | |
| Beginning Account Value 1/1/13 | | $ | 1,000.00 | | | $ | 1,000.00 | |
| Ending Account Value 6/30/13 | | $ | 1,022.32 | | | $ | 1,020.68 | |
| Expenses Paid per $1,000* | | $ | 2.51 | | | $ | 4.16 | |
* Expenses are equal to the Fund's annualized expense ratio for each share class, multiplied by the average account value over the period, multiplied by 181 (the number of days in the most recent six-month period), then divided by 365.
| Annualized Expense Ratios | Class A | | Class B | |
| DWS Variable Series I — DWS Capital Growth VIP | .50% | | .83% | |
For more information, please refer to the Fund's prospectus.
These tables do not reflect charges and fees ("contract charges") associated with the separate account that invests in the Fund or any variable life insurance policy or variable annuity contract for which the Fund is an investment option.
For an analysis of the fees associated with an investment in the Fund or similar funds, please refer to http://apps.finra.org/fundanalyzer/1/fa.aspx.
The Series' policies and procedures for voting proxies for portfolio securities and information about how the Series voted proxies related to its portfolio securities during the 12-month period ended June 30 are available on our Web site — www.dws-investments.com (click on "proxy voting"at the bottom of the page) — or on the SEC's Web site — www.sec.gov. To obtain a written copy of the Series' policies and procedures without charge, upon request, call us toll free at (800) 728-3337.
Summary of Management Fee Evaluation by Independent Fee Consultant
September 17, 2012
Pursuant to an Order entered into by Deutsche Investment Management Americas and affiliates (collectively, "DeAM") with the Attorney General of New York, I, Thomas H. Mack, have been appointed the Independent Fee Consultant for the DWS Funds (formerly the DWS Scudder Funds). My duties include preparing an annual written evaluation of the management fees DeAM charges the Funds, considering among other factors the management fees charged by other mutual fund companies for like services, management fees DeAM charges other clients for like services, DeAM's costs of supplying services under the management agreements and related profit margins, possible economies of scale if a Fund grows larger, and the nature and quality of DeAM's services, including fund performance. This report summarizes my evaluation for 2012, including my qualifications, the evaluation process for each of the DWS Funds, consideration of certain complex-level factors, and my conclusions. I served in substantially the same capacity in 2007, 2008, 2009, 2010 and 2011.
Qualifications
For more than 35 years I have served in various professional capacities within the investment management business. I have held investment analysis and advisory positions, including securities analyst, portfolio strategist and director of investment policy with a large investment firm. I have also performed business management functions, including business development, financial management and marketing research and analysis.
Since 1991, I have been an independent consultant within the asset management industry. I have provided services to over 125 client organizations, including investment managers, mutual fund boards, product distributors and related organizations. Over the past ten years I have completed a number of assignments for mutual fund boards, specifically including assisting boards with management contract renewal.
I hold a Master of Business Administration degree, with highest honors, from Harvard University and Master of Science and Bachelor of Science (highest honors) degrees from the University of California at Berkeley. I am an independent director and audit committee financial expert for two closed-end mutual funds and have served in various leadership and financial oversight capacities with non-profit organizations.
Evaluation of Fees for each DWS Fund
My work focused primarily on evaluating, fund-by-fund, the fees charged to each of the 103 mutual fund portfolios in the DWS Fund family. For each Fund, I considered each of the key factors mentioned above, as well as any other relevant information. In doing so I worked closely with the Funds' Independent Directors in their annual contract renewal process, as well as in their approval of contracts for several new funds (documented separately).
In evaluating each Fund's fees, I reviewed comprehensive materials provided by or on behalf of DeAM, including expense information prepared by Lipper Analytical, comparative performance information, profitability data, manager histories, and other materials. I also accessed certain additional information from the Lipper and Morningstar databases and drew on my industry knowledge and experience.
To facilitate evaluating this considerable body of information, I prepared for each Fund a document summarizing the key data elements in each area as well as additional analytics discussed below. This made it possible to consider each key data element in the context of the others.
In the course of contract renewal, DeAM agreed to implement a number of fee and expense adjustments requested by the Independent Directors which will favorably impact future fees and expenses, and my evaluation includes the effects of these changes.
Fees and Expenses Compared with Other Funds
The competitive fee and expense evaluation for each fund focused on two primary comparisons:
The Fund's contractual management fee (the advisory fee plus the administration fee where applicable) compared with those of a group of typically 12-15 funds in the same Lipper investment category (e.g. Large Capitalization Growth) having similar distribution arrangements and being of similar size.
The Fund's total expenses compared with a broader universe of funds from the same Lipper investment category and having similar distribution arrangements.
These two comparisons provide a view of not only the level of the fee compared with funds of similar scale but also the total expense the Fund bears for all the services it receives, in comparison with the investment choices available in the Fund's investment category and distribution channel. The principal figure-of-merit used in these comparisons was the subject Fund's percentile ranking against peers.
DeAM's Fees for Similar Services to Others
DeAM provided management fee schedules for all of its US domiciled fund and non-fund investment management accounts in any of the investment categories where there is a DWS Fund. These similar products included the other DWS Funds, non-fund pooled accounts, institutional accounts and sub-advisory accounts. Using this information, I calculated for each Fund the fee that would be charged to each similar product, at the subject Fund's asset level.
Evaluating information regarding non-fund products is difficult because there are varying levels of services required for different types of accounts, with mutual funds generally requiring considerably more regulatory and administrative types of service as well as having more frequent cash flows than other types of accounts. Also, while mutual fund fees for similar fund products can be expected to be similar, there will be some differences due to different pricing conditions in different distribution channels (e.g. retail funds versus those used in variable insurance products), differences in underlying investment processes and other factors.
Costs and Profit Margins
DeAM provided a detailed profitability analysis for each Fund. After making some adjustments so that the presentation would be more comparable to the available industry figures, I reviewed profit margins from investment management alone, from investment management plus other fund services (excluding distribution) provided to the Funds by DeAM (principally shareholder services), and DeAM profits from all sources, including distribution. A later section comments on overall profitability.
Economies of Scale
Economies of scale — an expected decline in management cost per dollar of fund assets as fund assets grow — are very rarely quantified and documented because of inherent difficulties in collecting and analyzing relevant data. However, in virtually every investment category that I reviewed, larger funds tend to have lower fees and lower total expenses than smaller funds. To see how each DWS Fund compares with this industry observation, I reviewed:
The trend in Fund assets over the last five years and the accompanying trend in total expenses. This shows if the Fund has grown and, if so, whether total expense (management fees as well as other expenses) have declined as a percent of assets.
Whether the Fund has break-points in its management fee schedule, the extent of the fee reduction built into the schedule and the asset levels where the breaks take effect, and in the case of a sub-advised Fund how the Fund's break-points compare with those of the sub-advisory fee schedule.
How the Fund's contractual fee schedule compares with trends in the industry data. To accomplish this, I constructed a chart showing how actual latest-fiscal-year contractual fees of the Fund and of other similar funds relate to average fund assets, with the subject Fund's contractual fee schedule superimposed.
Quality of Service — Performance
The quality-of-service evaluation focused on investment performance, which is the principal result of the investment management service. Each Fund's performance was reviewed over the past 1, 3, 5 and 10 years, as applicable, and compared with that of other funds in the same investment category and with a suitable market index.
In addition, I calculated and reviewed risk-adjusted returns relative to an index of similar mutual funds' returns and a suitable market index. The risk-adjusted returns analysis provides a way of determining the extent to which the Fund's return comparisons are mainly the product of investment value-added (or lack thereof) or alternatively taking considerably more or less risk than is typical in its investment category.
I also received and considered the history of portfolio manager changes for each Fund, as this provided an important context for evaluating the performance results.
Complex-Level Considerations
While this evaluation was conducted mainly at the individual fund level, there are some issues relating to the reasonableness of fees that can alternatively be considered across the whole fund complex:
I reviewed DeAM's profitability analysis for all DWS Funds, with a view toward determining if the allocation procedures used were reasonable and how profit levels compared with public data for other investment managers.
I considered whether DeAM and affiliates receive any significant ancillary or "fallout" benefits that should be considered in interpreting the direct profitability results. These would be situations where serving as the investment manager of the Funds is beneficial to another part of the Deutsche Bank organization.
I considered how aggregated DWS Fund expenses had varied over the years, by asset class and in the context of trends in asset levels.
I considered how aggregated DWS Fund performance measures relative to appropriate peers had varied by asset class and over time.
I reviewed the structure of the DeAM organization, trends in staffing levels, and information on compensation of investment management and other professionals compared with industry data.
Findings
Based on the process and analysis discussed above, which included reviewing a wide range of information from management and external data sources and considering among other factors the fees DeAM charges other clients, the fees charged by other fund managers, DeAM's costs and profits associated with managing the Funds, economies of scale, possible fall-out benefits, and the nature and quality of services provided, in my opinion the management fees charged the DWS Funds are reasonable.
Thomas H. Mack
President, Thomas H. Mack & Co., Inc.
DWS Investments Distributors, Inc.
222 South Riverside Plaza
Chicago, IL 60606
(800) 621-1148
VS1capgro-3 (R-028374-2 8/13)
JUNE 30, 2013
SEMIANNUAL REPORT
DWS VARIABLE SERIES I
DWS Core Equity VIP
Contents
13 Statement of Assets and Liabilities 14 Statement of Operations 15 Statement of Changes in Net Assets 18 Notes to Financial Statements 23 Information About Your Fund's Expenses 25 Summary of Management Fee Evaluation by Independent Fee Consultant |
This report must be preceded or accompanied by a prospectus. To obtain an additional prospectus or summary prospectus, if available, call (800) 728-3337 or your financial representative. We advise you to consider the Fund's objectives, risks, charges and expenses carefully before investing. The summary prospectus and prospectus contain this and other important information about the Fund. Please read the prospectus carefully before you invest.
Investing in derivatives entails special risks relating to liquidity, leverage and credit that may reduce returns and/or increase volatility. The Fund may lend securities to approved institutions. Fund management could be wrong in its analysis of industries, companies, economic trends and favor a security that underperforms the market. Stocks may decline in value. See the prospectus for details.
DWS Investments is part of the Deutsche Asset & Wealth Management division of Deutsche Bank AG.
NOT FDIC/NCUA INSURED NO BANK GUARANTEE MAY LOSE VALUE NOT A DEPOSIT
NOT INSURED BY ANY FEDERAL GOVERNMENT AGENCY
Performance Summary June 30, 2013 (Unaudited)
Fund performance shown is historical, assumes reinvestment of all dividend and capital gain distributions, and does not guarantee future results. Investment return and principal value fluctuate with changing market conditions so that, when redeemed, shares may be worth more or less than their original cost. Current performance may be lower or higher than the performance data quoted. Please contact your participating insurance company for the Fund's most recent month-end performance. Performance doesn't reflect charges and fees ("contract charges") associated with the separate account that invests in the Fund or any variable life insurance policy or variable annuity contract for which the Fund is an investment option. These charges and fees will reduce returns. While all share classes have the same underlying portfolio, their performance will differ.
The gross expense ratios of the Fund, as stated in the fee table of the prospectus dated May 1, 2013 are 0.59% and 0.90% for Class A and Class B shares, respectively, and may differ from the expense ratios disclosed in the Financial Highlights tables in this report.
| Growth of an Assumed $10,000 Investment |
| The Russell 1000® Index is an unmanaged index that measures the performance of the 1,000 largest companies in the Russell 3000® Index, which represents approximately 92% of the total market capitalization of the Russell 3000 Index. Index returns do not reflect any fees or expenses and it is not possible to invest directly into an index. |
| |
| Yearly periods ended June 30 | |
| Comparative Results | |
| DWS Core Equity VIP | | 6-Month‡ | | | 1-Year | | | 3-Year | | | 5-Year | | | 10-Year | |
| Class A | Growth of $10,000 | | $ | 11,448 | | | $ | 12,487 | | | $ | 16,117 | | | $ | 14,057 | | | $ | 19,294 | |
| Average annual total return | | | 14.48 | % | | | 24.87 | % | | | 17.25 | % | | | 7.05 | % | | | 6.79 | % |
Russell 1000® Index | Growth of $10,000 | | $ | 11,391 | | | $ | 12,124 | | | $ | 16,695 | | | $ | 14,104 | | | $ | 20,938 | |
| Average annual total return | | | 13.91 | % | | | 21.24 | % | | | 18.63 | % | | | 7.12 | % | | | 7.67 | % |
| DWS Core Equity VIP | | 6-Month‡ | | | 1-Year | | | 3-Year | | | 5-Year | | | 10-Year | |
| Class B | Growth of $10,000 | | $ | 11,439 | | | $ | 12,464 | | | $ | 15,986 | | | $ | 13,912 | | �� | $ | 18,759 | |
| Average annual total return | | | 14.39 | % | | | 24.64 | % | | | 16.93 | % | | | 6.83 | % | | | 6.49 | % |
Russell 1000® Index | Growth of $10,000 | | $ | 11,391 | | | $ | 12,124 | | | $ | 16,695 | | | $ | 14,104 | | | $ | 20,938 | |
| Average annual total return | | | 13.91 | % | | | 21.24 | % | | | 18.63 | % | | | 7.12 | % | | | 7.67 | % |
The growth of $10,000 is cumulative.
‡ Total returns shown for periods less than one year are not annualized.
Portfolio Summary (Unaudited)
Asset Allocation (As a % of Investment Portfolio excluding Securities Lending Collateral) | 6/30/13 | 12/31/12 |
| | | |
| Common Stocks | 99% | 99% |
| Cash Equivalents | 1% | 1% |
| | 100% | 100% |
Sector Diversification (As a % of Common Stocks) | 6/30/13 | 12/31/12 |
| | | |
| Financials | 19% | 16% |
| Information Technology | 17% | 18% |
| Health Care | 16% | 12% |
| Consumer Discretionary | 11% | 13% |
| Energy | 11% | 12% |
| Consumer Staples | 10% | 12% |
| Industrials | 9% | 8% |
| Materials | 4% | 6% |
| Utilities | 2% | 1% |
| Telecommunication Services | 1% | 2% |
| | 100% | 100% |
Portfolio holdings and characteristics are subject to change.
For more complete details about the Fund's investment portfolio, see page 7.
Following the Fund's fiscal first and third quarter-end, a complete portfolio holdings listing is filed with the SEC on Form N-Q. The form will be available on the SEC's Web site at www.sec.gov, and it also may be reviewed and copied at the SEC's Public Reference Room in Washington, D.C. Information on the operation of the SEC's Public Reference Room may be obtained by calling (800) SEC-0330. The Fund's portfolio holdings are also posted on www.dws-investments.com from time to time. Please see the Fund's current prospectus for more information.
Effective July 12, 2013, QS Investors no longer serves as subadvisor to the fund and day-to-day portfolio management of the fund transitioned to Deutsche Investment Management Americas Inc.
The new portfolio management team for the fund is as follows:
Owen Fitzpatrick, CFA
Lead Portfolio Manager, Deutsche Investment Management Americas Inc.
Thomas M. Hynes, Jr., CFA
Brendan O'Neill, CFA
Pankaj Bhatnagar, PhD
Portfolio Managers, Deutsche Investment Management Americas Inc.
Investment Portfolio June 30, 2013 (Unaudited) | | | Shares | | | Value ($) | |
| | | | |
| Common Stocks 98.7% | |
| Consumer Discretionary 10.7% | |
| Auto Components 0.5% | |
| Cooper Tire & Rubber Co. | | | 20,300 | | | | 673,351 | |
| Magna International, Inc. | | | 3,800 | | | | 270,636 | |
| Stoneridge, Inc.* | | | 13,800 | | | | 160,632 | |
| | | | | | | | 1,104,619 | |
| Diversified Consumer Services 0.1% | |
| H&R Block, Inc. | | | 5,000 | | | | 138,750 | |
| Hotels, Restaurants & Leisure 1.0% | |
| Las Vegas Sands Corp. | | | 20,400 | | | | 1,079,772 | |
| Six Flags Entertainment Corp. | | | 5,200 | | | | 182,832 | |
| Starwood Hotels & Resorts Worldwide, Inc. | | | 10,400 | | | | 657,176 | |
| | | | | | | | 1,919,780 | |
| Household Durables 0.7% | |
| Sony Corp. (ADR) | | | 6,400 | | | | 135,616 | |
| Whirlpool Corp. | | | 11,500 | | | | 1,315,140 | |
| | | | | | | | 1,450,756 | |
| Leisure Equipment & Products 1.2% | |
| Smith & Wesson Holding Corp.* | | | 237,800 | | | | 2,373,244 | |
| Media 3.3% | |
| Comcast Corp. "A" | | | 79,000 | | | | 3,308,520 | |
| Comcast Corp. Special "A" | | | 7,100 | | | | 281,657 | |
| DIRECTV* | | | 13,100 | | | | 807,222 | |
| Time Warner, Inc. | | | 12,500 | | | | 722,750 | |
| Walt Disney Co. (a) | | | 21,400 | | | | 1,351,410 | |
| | | | | | | | 6,471,559 | |
| Multiline Retail 0.2% | |
| Dillard's, Inc. "A" | | | 5,615 | | | | 460,262 | |
| Specialty Retail 3.7% | |
| Best Buy Co., Inc. (a) | | | 103,000 | | | | 2,814,990 | |
| Brown Shoe Co., Inc. (a) | | | 6,000 | | | | 129,180 | |
| GameStop Corp. "A" | | | 8,600 | | | | 361,458 | |
| Home Depot, Inc. | | | 2,000 | | | | 154,940 | |
| The Gap, Inc. | | | 64,000 | | | | 2,670,720 | |
| TJX Companies, Inc. | | | 22,000 | | | | 1,101,320 | |
| | | | | | | | 7,232,608 | |
| Consumer Staples 10.1% | |
| Beverages 0.4% | |
| PepsiCo, Inc. | | | 9,100 | | | | 744,289 | |
| Food & Staples Retailing 3.6% | |
| Costco Wholesale Corp. | | | 14,100 | | | | 1,559,037 | |
| CVS Caremark Corp. | | | 20,000 | | | | 1,143,600 | |
| Kroger Co. | | | 70,900 | | | | 2,448,886 | |
| Walgreen Co. | | | 42,800 | | | | 1,891,760 | |
| | | | | | | | 7,043,283 | |
| Food Products 2.5% | |
| General Mills, Inc. | | | 18,400 | | | | 892,952 | |
| Green Mountain Coffee Roasters, Inc.* (a) | | | 3,000 | | | | 225,180 | |
| The Hershey Co. | | | 16,700 | | | | 1,490,976 | |
| Tyson Foods, Inc. "A" (a) | | | 92,200 | | | | 2,367,696 | |
| Unilever PLC (ADR) | | | 1,800 | | | | 72,810 | |
| | | | | | | | 5,049,614 | |
| | | Shares | | | Value ($) | |
| | | | | | | | | |
| Household Products 0.7% | |
| Kimberly-Clark Corp. (a) | | | 13,600 | | | | 1,321,104 | |
| Personal Products 0.5% | |
| Avon Products, Inc. | | | 44,800 | | | | 942,144 | |
| Tobacco 2.4% | |
| Altria Group, Inc. (a) | | | 37,100 | | | | 1,298,129 | |
| Lorillard, Inc. (a) | | | 78,200 | | | | 3,415,776 | |
| | | | | | | | 4,713,905 | |
| Energy 10.5% | |
| Oil, Gas & Consumable Fuels | |
| Alon U.S.A. Energy, Inc. (a) | | | 5,200 | | | | 75,192 | |
| Chevron Corp. | | | 13,700 | | | | 1,621,258 | |
| ConocoPhillips | | | 3,200 | | | | 193,600 | |
| Marathon Oil Corp. | | | 34,400 | | | | 1,189,552 | |
| Marathon Petroleum Corp. | | | 40,700 | | | | 2,892,142 | |
| Murphy Oil Corp. | | | 8,700 | | | | 529,743 | |
| Phillips 66 | | | 27,300 | | | | 1,608,243 | |
| Royal Dutch Shell PLC (ADR) | | | 55,200 | | | | 3,521,760 | |
| Southwestern Energy Co.* (a) | | | 25,700 | | | | 938,821 | |
| Statoil ASA (ADR) | | | 79,800 | | | | 1,651,062 | |
| Tesoro Corp. | | | 56,300 | | | | 2,945,616 | |
| Valero Energy Corp. | | | 58,000 | | | | 2,016,660 | |
| Western Refining, Inc. (a) | | | 54,100 | | | | 1,518,587 | |
| | | | | | | | 20,702,236 | |
| Financials 18.4% | |
| Capital Markets 2.2% | |
| Franklin Resources, Inc. | | | 6,700 | | | | 911,334 | |
| Invesco Ltd. | | | 12,000 | | | | 381,600 | |
| State Street Corp. | | | 22,600 | | | | 1,473,746 | |
| T. Rowe Price Group, Inc. (a) | | | 8,000 | | | | 585,200 | |
| The Goldman Sachs Group, Inc. | | | 3,900 | | | | 589,875 | |
| Waddell & Reed Financial, Inc. "A" | | | 10,400 | | | | 452,400 | |
| | | | | | | | 4,394,155 | |
| Commercial Banks 2.6% | |
| First Niagara Financial Group, Inc. | | | 7,300 | | | | 73,511 | |
| PNC Financial Services Group, Inc. | | | 14,600 | | | | 1,064,632 | |
| Popular, Inc.* (a) | | | 26,300 | | | | 797,679 | |
| Regions Financial Corp. | | | 150,300 | | | | 1,432,359 | |
| SunTrust Banks, Inc. | | | 9,600 | | | | 303,072 | |
| Zions Bancorp. (a) | | | 53,000 | | | | 1,530,640 | |
| | | | | | | | 5,201,893 | |
| Consumer Finance 1.5% | |
| Discover Financial Services | | | 62,800 | | | | 2,991,792 | |
| Diversified Financial Services 3.2% | |
| Bank of America Corp. | | | 62,100 | | | | 798,606 | |
| CBOE Holdings, Inc. | | | 4,700 | | | | 219,208 | |
| Citigroup, Inc. | | | 41,200 | | | | 1,976,364 | |
| JPMorgan Chase & Co. | | | 62,600 | | | | 3,304,654 | |
| | | | | | | | 6,298,832 | |
| Insurance 6.9% | |
| Aflac, Inc. | | | 21,400 | | | | 1,243,768 | |
| Allstate Corp. | | | 35,100 | | | | 1,689,012 | |
| Arch Capital Group Ltd.* (a) | | | 6,600 | | | | 339,306 | |
| Axis Capital Holdings Ltd. | | | 9,300 | | | | 425,754 | |
| Chubb Corp. | | | 20,900 | | | | 1,769,185 | |
| Cincinnati Financial Corp. | | | 10,100 | | | | 463,590 | |
| Everest Re Group Ltd. | | | 12,100 | | | | 1,551,946 | |
| | | Shares | | | Value ($) | |
| | | | | | | | | |
| MetLife, Inc. | | | 8,600 | | | | 393,536 | |
| Progressive Corp. | | | 121,200 | | | | 3,080,904 | |
| The Travelers Companies, Inc. | | | 27,500 | | | | 2,197,800 | |
| XL Group PLC | | | 11,900 | | | | 360,808 | |
| | | | | | | | 13,515,609 | |
| Real Estate Investment Trusts 2.0% | |
| Host Hotels & Resorts, Inc. (REIT) | | | 40,500 | | | | 683,235 | |
| Potlatch Corp. (REIT) | | | 1,700 | | | | 68,748 | |
| The Geo Group, Inc. (REIT) | | | 10,100 | | | | 342,895 | |
| Weyerhaeuser Co. (REIT) | | | 100,500 | | | | 2,863,245 | |
| | | | | | | | 3,958,123 | |
| Health Care 15.9% | |
| Biotechnology 4.0% | |
| Amgen, Inc. | | | 14,200 | | | | 1,400,972 | |
| Biogen Idec, Inc.* | | | 9,900 | | | | 2,130,480 | |
| Celgene Corp.* | | | 20,400 | | | | 2,384,964 | |
| Myriad Genetics, Inc.* | | | 14,400 | | | | 386,928 | |
| PDL BioPharma, Inc. (a) | | | 208,200 | | | | 1,607,304 | |
| | | | | | | | 7,910,648 | |
| Health Care Equipment & Supplies 0.9% | |
| Abbott Laboratories | | | 50,900 | | | | 1,775,392 | |
| Health Care Providers & Services 5.7% | |
| Aetna, Inc. | | | 50,200 | | | | 3,189,708 | |
| AmerisourceBergen Corp. | | | 24,700 | | | | 1,379,001 | |
| Health Net, Inc.* | | | 74,900 | | | | 2,383,318 | |
| Humana, Inc. | | | 15,000 | | | | 1,265,700 | |
| WellPoint, Inc. | | | 36,900 | | | | 3,019,896 | |
| | | | | | | | 11,237,623 | |
| Life Sciences Tools & Services 0.3% | |
| Covance, Inc.* (a) | | | 5,300 | | | | 403,542 | |
| PAREXEL International Corp.* (a) | | | 3,900 | | | | 179,166 | |
| | | | | | | | 582,708 | |
| Pharmaceuticals 5.0% | |
| Actavis, Inc.* | | | 12,000 | | | | 1,514,640 | |
| Eli Lilly & Co. | | | 58,600 | | | | 2,878,432 | |
| Johnson & Johnson | | | 47,500 | | | | 4,078,350 | |
| Pfizer, Inc. | | | 2,400 | | | | 67,224 | |
| Sciclone Pharmaceuticals, Inc.* | | | 14,500 | | | | 71,920 | |
| Valeant Pharmaceuticals International, Inc.* | | | 15,200 | | | | 1,308,416 | |
| Warner Chilcott PLC "A" | | | 800 | | | | 15,904 | |
| | | | | | | | 9,934,886 | |
| Industrials 9.4% | |
| Aerospace & Defense 6.2% | |
| Alliant Techsystems, Inc. | | | 7,200 | | | | 592,776 | |
| Boeing Co. | | | 40,100 | | | | 4,107,844 | |
| Exelis, Inc. | | | 40,500 | | | | 558,495 | |
| Huntington Ingalls Industries, Inc. | | | 10,700 | | | | 604,336 | |
| Lockheed Martin Corp. | | | 9,400 | | | | 1,019,524 | |
| Northrop Grumman Corp. | | | 19,700 | | | | 1,631,160 | |
| Raytheon Co. (a) | | | 52,700 | | | | 3,484,524 | |
| United Technologies Corp. | | | 1,600 | | | | 148,704 | |
| | | | | | | | 12,147,363 | |
| Air Freight & Logistics 0.7% | |
| FedEx Corp. | | | 13,700 | | | | 1,350,546 | |
| Airlines 0.5% | |
| Delta Air Lines, Inc.* | | | 56,700 | | | | 1,060,857 | |
| | | Shares | | | Value ($) | |
| | | | | | | | | |
| Building Products 0.3% | |
| A.O. Smith Corp. | | | 8,400 | | | | 304,752 | |
| Masco Corp. | | | 15,000 | | | | 292,350 | |
| | | | | | | | 597,102 | |
| Commercial Services & Supplies 0.1% | |
| R.R. Donnelley & Sons Co. (a) | | | 2,500 | | | | 35,025 | |
| UniFirst Corp. | | | 1,400 | | | | 127,750 | |
| Viad Corp. | | | 4,200 | | | | 102,984 | |
| | | | | | | | 265,759 | |
| Electrical Equipment 0.3% | |
| Coleman Cable, Inc. | | | 10,700 | | | | 193,242 | |
| Generac Holdings, Inc. | | | 7,800 | | | | 288,678 | |
| | | | | | | | 481,920 | |
| Industrial Conglomerates 0.3% | |
| Koninklijke Philips Electronics NV | | | 20,900 | | | | 568,271 | |
| Machinery 0.8% | |
| Meritor, Inc.* | | | 21,700 | | | | 152,985 | |
| Mueller Water Products, Inc. "A" (a) | | | 5,400 | | | | 37,314 | |
| Oshkosh Corp.* | | | 32,400 | | | | 1,230,228 | |
| Trinity Industries, Inc. | | | 5,500 | | | | 211,420 | |
| | | | | | | | 1,631,947 | |
| Road & Rail 0.2% | |
| Ryder System, Inc. | | | 7,500 | | | | 455,925 | |
| Information Technology 16.3% | |
| Communications Equipment 1.9% | |
| Cisco Systems, Inc. | | | 57,000 | | | | 1,385,670 | |
| InterDigital, Inc. | | | 47,400 | | | | 2,116,410 | |
| Research In Motion Ltd.* (a) | | | 29,600 | | | | 309,912 | |
| | | | | | | | 3,811,992 | |
| Computers & Peripherals 4.4% | |
| Apple, Inc. | | | 900 | | | | 356,472 | |
| Hewlett-Packard Co. | | | 137,700 | | | | 3,414,960 | |
| Lexmark International, Inc. "A" | | | 19,600 | | | | 599,172 | |
| Seagate Technology PLC | | | 22,300 | | | | 999,709 | |
| Western Digital Corp. | | | 52,700 | | | | 3,272,143 | |
| | | | | | | | 8,642,456 | |
| Internet Software & Services 3.1% | |
| AOL, Inc. (a) | | | 85,400 | | | | 3,115,392 | |
| eBay, Inc.* | | | 47,300 | | | | 2,446,356 | |
| Google, Inc. "A"* | | | 400 | | | | 352,148 | |
| Sohu.com, Inc.* | | | 2,600 | | | | 160,212 | |
| | | | | | | | 6,074,108 | |
| IT Services 3.1% | |
| Accenture PLC "A" | | | 15,700 | | | | 1,129,772 | |
| Computer Sciences Corp. (a) | | | 59,200 | | | | 2,591,184 | |
| Convergys Corp. (a) | | | 34,400 | | | | 599,592 | |
| CoreLogic, Inc.* | | | 27,000 | | | | 625,590 | |
| International Business Machines Corp. | | | 1,200 | | | | 229,332 | |
| MAXIMUS, Inc. | | | 200 | | | | 14,896 | |
| Visa, Inc. "A" (a) | | | 4,800 | | | | 877,200 | |
| | | | | | | | 6,067,566 | |
| Semiconductors & Semiconductor Equipment 2.4% | |
| Cree, Inc.* (a) | | | 8,300 | | | | 530,038 | |
| First Solar, Inc.* (a) | | | 35,900 | | | | 1,605,807 | |
| Intel Corp. | | | 57,500 | | | | 1,392,650 | |
| Kulicke & Soffa Industries, Inc.* | | | 30,800 | | | | 340,648 | |
| Texas Instruments, Inc. | | | 25,800 | | | | 899,646 | |
| | | | | | | | 4,768,789 | |
| | | Shares | | | Value ($) | |
| | | | | | | | | |
| Software 1.4% | |
| Activision Blizzard, Inc. | | | 71,100 | | | | 1,013,886 | |
| CA, Inc. (a) | | | 22,200 | | | | 635,586 | |
| Microsoft Corp. | | | 35,200 | | | | 1,215,456 | |
| | | | | | | | 2,864,928 | |
| Materials 4.0% | |
| Chemicals 3.4% | |
| CF Industries Holdings, Inc. | | | 6,200 | | | | 1,063,300 | |
| Dow Chemical Co. | | | 6,400 | | | | 205,888 | |
| FutureFuel Corp. | | | 26,400 | | | | 374,088 | |
| LyondellBasell Industries NV "A" | | | 19,300 | | | | 1,278,818 | |
| Monsanto Co. | | | 18,500 | | | | 1,827,800 | |
| PPG Industries, Inc. | | | 3,500 | | | | 512,435 | |
| Westlake Chemical Corp. | | | 13,900 | | | | 1,340,099 | |
| | | | | | | | 6,602,428 | |
| Metals & Mining 0.5% | |
| BHP Billiton PLC (ADR) | | | 18,000 | | | | 922,860 | |
| Paper & Forest Products 0.1% | |
| International Paper Co. | | | 6,200 | | | | 274,722 | |
| Telecommunication Services 1.5% | |
| Diversified Telecommunication Services | |
| CenturyLink, Inc. | | | 9,100 | | | | 321,685 | |
| Deutsche Telekom AG (ADR) | | | 14,100 | | | | 164,406 | |
| Nippon Telegraph & Telephone Corp. (ADR) | | | 6,800 | | | | 176,868 | |
| Verizon Communications, Inc. (a) | | | 46,400 | | | | 2,335,776 | |
| | | | | | | | 2,998,735 | |
| | | Shares | | | Value ($) | |
| | | | | | | | | |
| Utilities 1.9% | |
| Multi-Utilities | |
| Consolidated Edison, Inc. | | | 8,500 | | | | 495,635 | |
| MDU Resources Group, Inc. | | | 57,500 | | | | 1,489,825 | |
| Public Service Enterprise Group, Inc. | | | 50,900 | | | | 1,662,393 | |
| | | | | | | | 3,647,853 | |
Total Common Stocks (Cost $171,503,388) | | | | 194,705,941 | |
| | |
| Securities Lending Collateral 17.4% | |
| Daily Assets Fund Institutional, 0.10% (b) (c) (Cost $34,382,415) | | | 34,382,415 | | | | 34,382,415 | |
| | |
| Cash Equivalents 1.1% | |
| Central Cash Management Fund, 0.07% (b) (Cost $2,159,766) | | | 2,159,766 | | | | 2,159,766 | |
| | | % of Net Assets | | | Value ($) | |
| | | | |
Total Investment Portfolio (Cost $208,045,569)† | | | 117.2 | | | | 231,248,122 | |
| Other Assets and Liabilities, Net (a) | | | (17.2 | ) | | | (34,001,838 | ) |
| Net Assets | | | 100.0 | | | | 197,246,284 | |
* Non-income producing security.
† The cost for federal income tax purposes was $209,336,492. At June 30, 2013, net unrealized appreciation for all securities based on tax cost was $21,911,630. This consisted of aggregate gross unrealized appreciation for all securities in which there was an excess of value over tax cost of $25,361,525 and aggregate gross unrealized depreciation for all securities in which there was an excess of tax cost over value of $3,449,895.
(a) All or a portion of these securities were on loan amounting to $30,250,830. In addition, included in other assets and liabilities, net are pending sales, amounting to $3,001,767, that are also on loan (see Notes to Financial Statements). The value of all securities loaned at June 30, 2013 amounted to $33,252,597, which is 16.9% of net assets.
(b) Affiliated fund managed by Deutsche Investment Management Americas Inc. The rate shown is the annualized seven-day yield at period end.
(c) Represents collateral held in connection with securities lending. Income earned by the Fund is net of borrower rebates.
ADR: American Depositary Receipt
REIT: Real Estate Investment Trust
At June 30, 2013, open futures contracts purchased were as follows:
| Futures | Currency | Expiration Date | | Contracts | | | Notional Value ($) | | | Unrealized Depreciation ($) | |
| S&P 500 E-Mini Index | USD | 9/20/2013 | | | 31 | | | | 2,478,915 | | | | (53,475 | ) |
| Currency Abbreviation |
| USD United States Dollar |
For information on the Fund's policy and additional disclosures regarding futures contracts, please refer to the Derivatives section of Note B in the accompanying Notes to Financial Statements.
Fair Value Measurements
Various inputs are used in determining the value of the Fund's investments. These inputs are summarized in three broad levels. Level 1 includes quoted prices in active markets for identical securities. Level 2 includes other significant observable inputs (including quoted prices for similar securities, interest rates, prepayment speeds, and credit risk). Level 3 includes significant unobservable inputs (including the Fund's own assumptions in determining the fair value of investments). The inputs or methodology used for valuing securities are not necessarily an indication of the risk associated with investing in those securities.
The following is a summary of the inputs used as of June 30, 2013 in valuing the Fund's investments. For information on the Fund's policy regarding the valuation of investments, please refer to the Security Valuation section of Note A in the accompanying Notes to Financial Statements.
| Assets | | Level 1 | | | Level 2 | | | Level 3 | | | Total | |
| | |
| Common Stocks (d) | | $ | 194,705,941 | | | $ | — | | | $ | — | | | $ | 194,705,941 | |
| Short-Term Investments (d) | | | 36,542,181 | | | | — | | | | — | | | | 36,542,181 | |
| Total | | $ | 231,248,122 | | | $ | — | | | $ | — | | | $ | 231,248,122 | |
| Liabilities | |
Derivatives (e) Futures Contracts | | $ | (53,475 | ) | | $ | — | | | $ | — | | | $ | (53,475 | ) |
| Total | | $ | (53,475 | ) | | $ | — | | | $ | — | | | $ | (53,475 | ) |
There have been no transfers between fair value measurement levels during the period ended June 30, 2013.
(d) See Investment Portfolio for additional detailed categorizations.
(e) Derivatives include unrealized appreciation (depreciation) on futures contracts.
The accompanying notes are an integral part of the financial statements.
Statement of Assets and Liabilities | as of June 30, 2013 (Unaudited) | |
| Assets | |
Investments: Investments in non-affiliated securities, at value (cost $171,503,388) — including $30,250,830 of securities loaned | | $ | 194,705,941 | |
| Investment in Daily Assets Fund Institutional (cost $34,382,415)* | | | 34,382,415 | |
| Investment in Central Cash Management Fund (cost $2,159,766) | | | 2,159,766 | |
| Total investments in securities, at value (cost $208,045,569) | | | 231,248,122 | |
| Cash | | | 2,687 | |
| Deposit with broker for futures contracts | | | 213,280 | |
| Receivable for investments sold | | | 18,447,537 | |
| Receivable for Fund shares sold | | | 1,197 | |
| Dividends receivable | | | 165,951 | |
| Interest receivable | | | 7,085 | |
| Foreign taxes recoverable | | | 3,596 | |
| Other assets | | | 1,824 | |
| Total assets | | | 250,091,279 | |
| Liabilities | |
| Payable upon return of securities loaned | | | 34,382,415 | |
| Payable for investments purchased | | | 18,103,580 | |
| Payable for Fund shares redeemed | | | 160,982 | |
| Payable for variation margin on futures contracts | | | 53,475 | |
| Accrued management fee | | | 64,125 | |
| Accrued Trustees' fees | | | 259 | |
| Other accrued expenses and payables | | | 80,159 | |
| Total liabilities | | | 52,844,995 | |
| Net assets, at value | | $ | 197,246,284 | |
| Net Assets Consist of | |
| Undistributed net investment income | | | 1,424,862 | |
Net unrealized appreciation (depreciation) on: Investments | | | 23,202,553 | |
| Futures | | | (53,475 | ) |
| Accumulated net realized gain (loss) | | | (44,965,835 | ) |
| Paid-in capital | | | 217,638,179 | |
| Net assets, at value | | $ | 197,246,284 | |
Class A Net Asset Value, offering and redemption price per share ($195,630,594 ÷ 20,337,948 outstanding shares of beneficial interest, $.01 par value, unlimited number of shares authorized) | | $ | 9.62 | |
Class B Net Asset Value, offering and redemption price per share ($1,615,690 ÷ 167,913 outstanding shares of beneficial interest, $.01 par value, unlimited number of shares authorized) | | $ | 9.62 | |
* Represents collateral on securities loaned.
The accompanying notes are an integral part of the financial statements.
Statement of Operations
| for the six months ended June 30, 2013 (Unaudited) | |
| Investment Income | |
Income: Dividends (net of foreign taxes withheld of $26,358) | | $ | 2,001,180 | |
| Income distributions — Central Cash Management Fund | | | 837 | |
| Securities lending income, including income from Daily Assets Fund Institutional, net of borrower rebates | | | 79,579 | |
| Total income | | | 2,081,596 | |
Expenses: Management fee | | | 380,568 | |
| Administration fee | | | 97,582 | |
| Services to shareholders | | | 1,754 | |
| Distribution service fee (Class B) | | | 2,110 | |
| Custodian fee | | | 12,069 | |
| Professional fees | | | 26,723 | |
| Reports to shareholders | | | 23,380 | |
| Trustees' fees and expenses | | | 4,722 | |
| Total expenses | | | 548,908 | |
| Net investment income | | | 1,532,688 | |
| Realized and Unrealized Gain (Loss) | |
Net realized gain (loss) from: Investments | | | 20,387,728 | |
| Futures | | | 239,251 | |
| Foreign currency | | | (188 | ) |
| | | | 20,626,791 | |
Change in net unrealized appreciation (depreciation) on: Investments | | | 3,783,685 | |
| Futures | | | (46,207 | ) |
| | | | 3,737,478 | |
| Net gain (loss) | | | 24,364,269 | |
| Net increase (decrease) in net assets resulting from operations | | $ | 25,896,957 | |
The accompanying notes are an integral part of the financial statements.
Statement of Changes in Net Assets | Increase (Decrease) in Net Assets | | Six Months Ended June 30, 2013 (Unaudited) | | | Year Ended December 31, 2012 | |
Operations: Net investment income | | $ | 1,532,688 | | | $ | 2,877,688 | |
| Net realized gain (loss) | | | 20,626,791 | | | | 14,826,400 | |
| Change in net unrealized appreciation (depreciation) | | | 3,737,478 | | | | (1,133,622 | ) |
| Net increase (decrease) in net assets resulting from operations | | | 25,896,957 | | | | 16,570,466 | |
Distributions to shareholders from: Net investment income: Class A | | | (2,931,105 | ) | | | (1,157,831 | ) |
| Class B | | | (20,449 | ) | | | (17,067 | ) |
| Total distributions | | | (2,951,554 | ) | | | (1,174,898 | ) |
Fund share transactions: Class A Proceeds from shares sold | | | 4,778,060 | | | | 5,653,743 | |
| Net assets acquired in tax-free reorganization* | | | — | | | | 103,303,156 | |
| Reinvestment of distributions | | | 2,931,105 | | | | 1,157,831 | |
| Payments for shares redeemed | | | (14,851,313 | ) | | | (30,735,177 | ) |
| Net increase (decrease) in net assets from Class A share transactions | | | (7,142,148 | ) | | | 79,379,553 | |
Class B Proceeds from shares sold | | | 5,578 | | | | 52,927 | |
| Net assets acquired in tax-free reorganization* | | | — | | | | 34,921 | |
| Reinvestment of distributions | | | 20,449 | | | | 17,067 | |
| Payments for shares redeemed | | | (229,299 | ) | | | (312,213 | ) |
| Net increase (decrease) in net assets from Class B share transactions | | | (203,272 | ) | | | (207,298 | ) |
| Increase (decrease) in net assets | | | 15,599,983 | | | | 94,567,823 | |
| Net assets at beginning of period | | | 181,646,301 | | | | 87,078,478 | |
| Net assets at end of period (including undistributed net investment income of $1,424,862 and $2,843,728, respectively) | | $ | 197,246,284 | | | $ | 181,646,301 | |
| Other Information | |
Class A Shares outstanding at beginning of period | | | 21,101,010 | | | | 11,456,872 | |
| Shares sold | | | 500,702 | | | | 703,069 | |
| Shares issued in tax-free reorganization* | | | — | | | | 12,597,547 | |
| Shares issued to shareholders in reinvestment of distributions | | | 308,213 | | | | 141,027 | |
| Shares redeemed | | | (1,571,977 | ) | | | (3,797,505 | ) |
| Net increase (decrease) in Class A shares | | | (763,062 | ) | | | 9,644,138 | |
| Shares outstanding at end of period | | | 20,337,948 | | | | 21,101,010 | |
Class B Shares outstanding at beginning of period | | | 188,843 | | | | 214,502 | |
| Shares sold | | | 594 | | | | 6,501 | |
| Shares issued in tax-free reorganization* | | | — | | | | 4,259 | |
| Shares issued to shareholders in reinvestment of distributions | | | 2,148 | | | | 2,076 | |
| Shares redeemed | | | (23,672 | ) | | | (38,495 | ) |
| Net increase (decrease) in Class B shares | | | (20,930 | ) | | | (25,659 | ) |
| Shares outstanding at end of period | | | 167,913 | | | | 188,843 | |
* On April 30, 2012, DWS Blue Chip VIP was acquired by the Fund through a tax-free reorganization (see Note G).
The accompanying notes are an integral part of the financial statements.
| | | | | | Years Ended December 31, | |
| Class A | | Six Months Ended 6/30/13 (Unaudited) | | | 2012 | | | 2011 | | | 2010 | | | 2009 | | | 2008 | |
| Selected Per Share Data | |
| Net asset value, beginning of period | | $ | 8.53 | | | $ | 7.46 | | | $ | 7.56 | | | $ | 6.71 | | | $ | 5.12 | | | $ | 10.81 | |
Income (loss) from investment operations: Net investment incomea | | | .07 | | | | .15 | | | | .10 | | | | .09 | | | | .10 | | | | .10 | |
| Net realized and unrealized gain (loss) | | | 1.16 | | | | 1.03 | | | | (.10 | ) | | | .87 | | | | 1.61 | | | | (3.45 | ) |
| Total from investment operations | | | 1.23 | | | | 1.18 | | | | .00 | | | | .96 | | | | 1.71 | | | | (3.35 | ) |
Less distributions from: Net investment income | | | (.14 | ) | | | (.11 | ) | | | (.10 | ) | | | (.11 | ) | | | (.12 | ) | | | (.18 | ) |
| Net realized gains | | | — | | | | — | | | | — | | | | — | | | | — | | | | (2.16 | ) |
| Total distributions | | | (.14 | ) | | | (.11 | ) | | | (.10 | ) | | | (.11 | ) | | | (.12 | ) | | | (2.34 | ) |
| Net asset value, end of period | | $ | 9.62 | | | $ | 8.53 | | | $ | 7.46 | | | $ | 7.56 | | | $ | 6.71 | | | $ | 5.12 | |
| Total Return (%) | | | 14.48 | ** | | | 15.81 | | | | (.14 | ) | | | 14.40 | b | | | 34.15 | b | | | (38.31 | )b |
| Ratios to Average Net Assets and Supplemental Data | |
| Net assets, end of period ($ millions) | | | 196 | | | | 180 | | | | 85 | | | | 98 | | | | 101 | | | | 94 | |
| Ratio of expenses before expense reductions (%) | | | .57 | * | | | .59 | | | | .63 | | | | .63 | | | | .63 | | | | .60 | |
| Ratio of expenses after expense reductions (%) | | | .57 | * | | | .59 | | | | .63 | | | | .60 | | | | .54 | | | | .54 | |
| Ratio of net investment income (%) | | | 1.56 | * | | | 1.90 | | | | 1.25 | | | | 1.32 | | | | 1.74 | | | | 1.34 | |
| Portfolio turnover rate (%) | | | 145 | ** | | | 307 | | | | 215 | | | | 145 | | | | 82 | | | | 130 | |
a Based on average shares outstanding during the period. b Total return would have been lower had certain expenses not been reduced. * Annualized ** Not annualized | |
| | | | | | Years Ended December 31, | |
| Class B | | Six Months Ended 6/30/13 (Unaudited) | | | 2012 | | | 2011 | | | 2010 | | | 2009 | | | 2008 | |
| Selected Per Share Data | |
| Net asset value, beginning of period | | $ | 8.51 | | | $ | 7.45 | | | $ | 7.55 | | | $ | 6.70 | | | $ | 5.12 | | | $ | 10.77 | |
Income (loss) from investment operations: Net investment incomea | | | .07 | | | | .11 | | | | .08 | | | | .07 | | | | .08 | | | | .08 | |
| Net realized and unrealized gain (loss) | | | 1.15 | | | | 1.03 | | | | (.10 | ) | | | .87 | | | | 1.60 | | | | (3.42 | ) |
| Total from investment operations | | | 1.22 | | | | 1.14 | | | | (.02 | ) | | | .94 | | | | 1.68 | | | | (3.34 | ) |
Less distributions from: Net investment income | | | (.11 | ) | | | (.08 | ) | | | (.08 | ) | �� | | (.09 | ) | | | (.10 | ) | | | (.15 | ) |
| Net realized gains | | | — | | | | — | | | | — | | | | — | | | | — | | | | (2.16 | ) |
| Total distributions | | | (.11 | ) | | | (.08 | ) | | | (.08 | ) | | | (.09 | ) | | | (.10 | ) | | | (2.31 | ) |
| Net asset value, end of period | | $ | 9.62 | | | $ | 8.51 | | | $ | 7.45 | | | $ | 7.55 | | | $ | 6.70 | | | $ | 5.12 | |
| Total Return (%) | | | 14.39 | ** | | | 15.41 | | | | (.40 | ) | | | 14.12 | b | | | 33.64 | b | | | (38.29 | )b |
| Ratios to Average Net Assets and Supplemental Data | |
| Net assets, end of period ($ millions) | | | 2 | | | | 2 | | | | 2 | | | | 2 | | | | 2 | | | | 2 | |
| Ratio of expenses before expense reductions (%) | | | .77 | * | | | .90 | | | | .88 | | | | .88 | | | | .89 | | | | .82 | |
| Ratio of expenses after expense reductions (%) | | | .77 | * | | | .90 | | | | .88 | | | | .85 | | | | .80 | | | | .77 | |
| Ratio of net investment income (%) | | | 1.36 | * | | | 1.41 | | | | .99 | | | | 1.07 | | | | 1.48 | | | | 1.12 | |
| Portfolio turnover rate (%) | | | 145 | ** | | | 307 | | | | 215 | | | | 145 | | | | 82 | | | | 130 | |
a Based on average shares outstanding during the period. b Total return would have been lower had certain expenses not been reduced. * Annualized ** Not annualized | |
Notes to Financial Statements (Unaudited)
A. Organization and Significant Accounting Policies
DWS Variable Series I (the "Series") is registered under the Investment Company Act of 1940, as amended (the "1940 Act"), as an open-end, registered management investment company organized as a Massachusetts business trust. The Series consists of five diversified funds: DWS Bond VIP, DWS Core Equity VIP, DWS Capital Growth VIP, DWS Global Small Cap Growth VIP and DWS International VIP (individually or collectively hereinafter referred to as a "Fund" or the "Funds"). These financial statements report on DWS Core Equity VIP. The Series is intended to be the underlying investment vehicle for variable annuity contracts and variable life insurance policies to be offered by the separate accounts of certain life insurance companies ("Participating Insurance Companies").
Multiple Classes of Shares of Beneficial Interest. The Fund offers two classes of shares (Class A shares and Class B shares). Class B shares are subject to Rule 12b-1 distribution fees under the 1940 Act and recordkeeping fees equal to an annual rate of 0.25% and up to 0.15%, respectively, of the average daily net assets of the Class B shares of the Fund. Class A shares are not subject to such fees.
Investment income, realized and unrealized gains and losses, and certain fund-level expenses and expense reductions, if any, are borne pro rata on the basis of relative net assets by the holders of all classes of shares, except that each class bears certain expenses unique to that class (including the applicable 12b-1 distribution fees and recordkeeping fees). Differences in class-level expenses may result in payment of different per share dividends by class. All shares have equal rights with respect to voting subject to class-specific arrangements.
The Fund's financial statements are prepared in accordance with accounting principles generally accepted in the United States of America, which require the use of management estimates. Actual results could differ from those estimates. The policies described below are followed consistently by the Fund in the preparation of its financial statements.
Security Valuation. Investments are stated at value determined as of the close of regular trading on the New York Stock Exchange on each day the exchange is open for trading.
Various inputs are used in determining the value of the Fund's investments. These inputs are summarized in three broad levels. Level 1 includes quoted prices in active markets for identical securities. Level 2 includes other significant observable inputs (including quoted prices for similar securities, interest rates, prepayment speeds, and credit risk). Level 3 includes significant unobservable inputs (including the Fund's own assumptions in determining the fair value of investments). The inputs or methodology used for valuing securities are not necessarily an indication of the risk associated with investing in those securities.
Equity securities are valued at the most recent sale price or official closing price reported on the exchange (U.S. or foreign) or over-the-counter market on which they trade and are categorized as Level 1 securities. Securities for which no sales are reported are valued at the calculated mean between the most recent bid and asked quotations on the relevant market or, if a mean cannot be determined, at the most recent bid quotation.
Investments in open-end investment companies are valued at their net asset value each business day and are categorized as Level 1.
Futures contracts are generally valued at the settlement prices established each day on the exchange on which they are traded and are categorized as Level 1.
Securities and other assets for which market quotations are not readily available or for which the above valuation procedures are deemed not to reflect fair value are valued in a manner that is intended to reflect their fair value as determined in accordance with procedures approved by the Trustees and are generally categorized as Level 3. In accordance with the Fund's valuation procedures, factors used in determining value may include, but are not limited to, the type of the security; the size of the holding; the initial cost of the security; the existence of any contractual restrictions on the security's disposition; the price and extent of public trading in similar securities of the issuer or of comparable companies; quotations or evaluated prices from broker-dealers and/or pricing services; information obtained from the issuer, analysts, and/or the appropriate stock exchange (for exchange-traded securities); an analysis of the company's or issuer's financial statements; an evaluation of the forces that influence the issuer and the market(s) in which the security is purchased and sold and with respect to debt securities; the maturity, coupon, creditworthiness, currency denomination and the movement of the market in which the security is normally traded. The value determined under these procedures may differ from published values for the same securities.
Disclosure about the classification of fair value measurements is included in a table following the Fund's Investment Portfolio.
Securities Lending. Brown Brothers Harriman & Co., as lending agent, lends securities of the Fund to certain financial institutions under the terms of the Security Lending Agreement. The Fund retains the benefits of owning the securities it has loaned and continues to receive interest and dividends generated by the securities and to participate in any changes in their market value. The Fund requires the borrowers of the securities to maintain collateral with the Fund consisting of either cash or liquid, unencumbered assets having a value at least equal to the value of the securities loaned. When the collateral falls below specified amounts, the lending agent will use its best effort to obtain additional collateral on the next business day to meet required amounts under the security lending agreement. The Fund may invest the cash collateral into a joint trading account in an affiliated money market fund pursuant to Exemptive Orders issued by the SEC. The Fund receives compensation for lending its securities either in the form of fees or by earning interest on invested cash collateral net of borrower rebates and fees paid to a lending agent. Either the Fund or the borrower may terminate the loan. There may be risks of delay and costs in recovery of securities or even loss of rights in the collateral should the borrower of the securities fail financially. If the Fund is not able to recover securities lent, the Fund may sell the collateral and purchase a replacement investment in the market, incurring the risk that the value of the replacement security is greater than the value of the collateral. The Fund is also subject to all investment risks associated with the reinvestment of any cash collateral received, including, but not limited to, interest rate, credit and liquidity risk associated with such investments.
As of June 30, 2013, the Fund had securities on loan with a gross value of $33,252,597. The value of the related collateral, $34,382,415, exceeded the value of the securities loaned at period end.
Foreign Currency Translations. The books and records of the Fund are maintained in U.S. dollars. Investment securities and other assets and liabilities denominated in a foreign currency are translated into U.S. dollars at the prevailing exchange rates at period end. Purchases and sales of investment securities, income and expenses are translated into U.S. dollars at the prevailing exchange rates on the respective dates of the transactions.
Net realized and unrealized gains and losses on foreign currency transactions represent net gains and losses between trade and settlement dates on securities transactions, the acquisition and disposition of foreign currencies, and the difference between the amount of net investment income accrued and the U.S. dollar amount actually received. That portion of both realized and unrealized gains and losses on investments that results from fluctuations in foreign currency exchange rates is not separately disclosed but is included with net realized and unrealized gain/appreciation and loss/depreciation on investments.
Federal Income Taxes. The Fund is treated as a separate taxpayer as provided for in the Internal Revenue Code, as amended. It is the Fund's policy to comply with the requirements of the Internal Revenue Code, as amended, which are applicable to regulated investment companies, and to distribute all of its taxable income to the separate accounts of the Participating Insurance Companies which hold its shares.
Under the Regulated Investment Company Modernization Act of 2010, net capital losses incurred post-enactment may be carried forward indefinitely, and their character is retained as short-term and/or long-term. Previously, net capital losses were carried forward for eight years and treated as short-term losses. As a transition rule, the Act requires that post-enactment net capital losses be used before pre-enactment net capital losses.
At December 31, 2012, the Fund had a net tax basis capital loss carryforward of approximately $63,882,000 of pre-enactment losses, including $27,700,000 inherited from its merger with DWS Blue Chip VIP in fiscal year 2012, which may be applied against any realized net taxable capital gains of each succeeding year until fully utilized or until December 31, 2016 ($34,761,000) and December 31, 2017 ($29,121,000), the respective expiration dates, whichever occurs first, and which may be subject to certain limitations under Sections 381-384 of the Internal Revenue Code.
In addition, from November 1, 2012 through December 31, 2012, the Fund elects to defer qualified late year net short-term realized capital losses of approximately $427,000 and treat them as arising in the fiscal year ending December 31, 2013.
The Fund has reviewed the tax positions for the open tax years as of December 31, 2012 and has determined that no provision for income tax is required in the Fund's financial statements. The Fund's federal tax returns for the prior three fiscal years remain open subject to examination by the Internal Revenue Service.
Distribution of Income and Gains. Distributions from net investment income of the Fund, if any, are declared and distributed to shareholders annually. Net realized gains from investment transactions, in excess of available capital loss carryforwards, would be taxable to the Fund if not distributed, and, therefore, will be distributed to shareholders at least annually. The Fund may also make additional distributions for tax purposes if necessary.
The timing and characterization of certain income and capital gain distributions are determined annually in accordance with federal tax regulations which may differ from accounting principles generally accepted in the United States of America. These differences primarily relate to futures contracts and certain securities sold at a loss. As a result, net investment income (loss) and net realized gain (loss) on investment transactions for a reporting period may differ significantly from distributions during such period. Accordingly, the Fund may periodically make reclassifications among certain of its capital accounts without impacting the net asset value of the Fund.
The tax character of current year distributions will be determined at the end of the current fiscal year.
Expenses. Expenses of the Series arising in connection with a specific Fund are allocated to that Fund. Other Series expenses which cannot be directly attributed to a Fund are apportioned among the Funds in the Series based upon the relative net assets or other appropriate measures.
Contingencies. In the normal course of business, the Fund may enter into contracts with service providers that contain general indemnification clauses. The Fund's maximum exposure under these arrangements is unknown as this would involve future claims that may be made against the Fund that have not yet been made. However, based on experience, the Fund expects the risk of loss to be remote.
Other. Investment transactions are accounted for on a trade date plus one basis for daily net asset value calculations. However, for financial reporting purposes, investment transactions are reported on trade date. Interest income is recorded on the accrual basis. Dividend income is recorded on the ex-dividend date net of foreign withholding taxes. Realized gains and losses from investment transactions are recorded on an identified cost basis and may include proceeds from litigation.
B. Derivative Instruments
Futures Contracts. A futures contract is an agreement between a buyer or seller and an established futures exchange or its clearinghouse in which the buyer or seller agrees to take or make a delivery of a specific amount of a financial instrument at a specified price on a specific date (settlement date). For the six months ended June 30, 2013, the Fund entered into futures contracts in circumstances where portfolio management believed they offered an economic means of gaining exposure to a particular asset class or to keep cash on hand to meet shareholder redemptions or other needs while maintaining exposure to the market.
Upon entering into a futures contract, the Fund is required to deposit with a financial intermediary cash or securities ("initial margin") in an amount equal to a certain percentage of the face value indicated in the futures contract. Subsequent payments ("variation margin") are made or received by the Fund dependent upon the daily fluctuations in the value and are recorded for financial reporting purposes as unrealized gains or losses by the Fund. Gains or losses are realized when the contract expires or is closed. Since all futures contracts are exchange traded, counterparty risk is minimized as the exchange's clearinghouse acts as the counterparty, and guarantees the futures against default.
Certain risks may arise upon entering into futures contracts, including the risk that an illiquid market will limit the Fund's ability to close out a futures contract prior to the settlement date and the risk that the futures contract is not well correlated with the security, index or currency to which it relates. Risk of loss may exceed amounts disclosed in the Statement of Assets and Liabilities.
A summary of the open futures contracts as of June 30, 2013, is included in a table following the Fund's Investment Portfolio. For the six months ended June 30, 2013, the investment in futures contracts purchased had a total notional value generally indicative of a range from approximately $1,349,000 to $2,479,000.
The following table summarizes the value of the Fund's derivative instruments held as of June 30, 2013 and the related location in the accompanying Statement of Assets and Liabilities, presented by primary underlying risk exposure:
| Liability Derivative | | Futures Contracts | |
| Equity Contracts (a) | | $ | (53,475 | ) |
The above derivative is located in the following Statement of Assets and Liabilities account:
(a) Includes cumulative depreciation of futures contracts as disclosed in the Investment Portfolio. Unsettled variation margin is disclosed separately within the Statement of Assets and Liabilities.
Additionally, the amount of unrealized and realized gains and losses on derivative instruments recognized in Fund earnings during the six months ended June 30, 2013 and the related location in the accompanying Statement of Operations is summarized in the following tables by primary underlying risk exposure:
| Realized Gain (Loss) | | Futures Contracts | |
| Equity Contracts (a) | | $ | 239,251 | |
The above derivative is located in the following Statement of Operations account:
(a) Net realized gain (loss) from futures
| Change in Net Unrealized Appreciation (Depreciation) | | Futures Contracts | |
| Equity Contracts (a) | | $ | (46,207 | ) |
The above derivative is located in the following Statement of Operations account:
(a) Change in net unrealized appreciation (depreciation) on futures
C. Purchases and Sales of Securities
During the six months ended June 30, 2013, purchases and sales of investment securities (excluding short-term investments) aggregated $279,244,230 and $288,945,957, respectively.
D. Related Parties
Management Agreement. Under the Investment Management Agreement with Deutsche Investment Management Americas Inc. ("DIMA" or the "Advisor"), an indirect, wholly owned subsidiary of Deutsche Bank AG, the Advisor directs the investments of the Fund in accordance with its investment objectives, policies and restrictions. The Advisor determines the securities, instruments and other contracts relating to investments to be purchased, sold or entered into by the Fund or delegates such responsibility to the Fund's subadvisor.
QS Investors, LLC ("QS Investors") acted as subadvisor to the Fund. As a subadvisor, QS Investors made investment decisions and buys and sells securities for the Fund. QS Investors was paid by the Advisor for the services QS Investors provided to the Fund. Effective July 12, 2013, QS Investors no longer acts as subadvisor to the Fund and day-to-day portfolio management of the Fund transitioned to DIMA.
Pursuant to the Investment Management Agreement with the Advisor, the Fund pays a monthly management fee based on the Fund's average daily net assets, computed and accrued daily and payable monthly, at the following annual rates:
| First $250 million of average daily net assets | | | .390 | % |
| Next $750 million of average daily net assets | | | .365 | % |
| Over $1 billion of average daily net assets | | | .340 | % |
Accordingly, for the six months ended June 30, 2013, the fee pursuant to the Investment Management Agreement was equivalent to an annualized effective rate of 0.39% of the Fund's average daily net assets.
Administration Fee. Pursuant to an Administrative Services Agreement, DIMA provides most administrative services to the Fund. For all services provided under the Administrative Services Agreement, the Fund pays the Advisor an annual fee ("Administration Fee") of 0.10% of the Fund's average daily net assets, computed and accrued daily and payable monthly. For the six months ended June 30, 2013, the Administration Fee was $97,582, of which $16,442 is unpaid.
Service Provider Fees. DWS Investments Service Company ("DISC"), an affiliate of the Advisor, is the transfer agent, dividend-paying agent and shareholder service agent for the Fund. Pursuant to a sub-transfer agency agreement between DISC and DST Systems, Inc. ("DST"), DISC has delegated certain transfer agent, dividend-paying agent and shareholder service agent functions to DST. DISC compensates DST out of the shareholder servicing fee it receives from the Fund. For the six months ended June 30, 2013, the amounts charged to the Fund by DISC were as follows:
| Services to Shareholders | | Total Aggregated | | | Unpaid at June 30, 2013 | |
| Class A | | $ | 266 | | | $ | 87 | |
| Class B | | | 40 | | | | 13 | |
| | | $ | 306 | | | $ | 100 | |
Distribution Service Agreement. DWS Investments Distributors, Inc. ("DIDI"), also an affiliate of the Advisor, is the Series' Distributor. In accordance with the Master Distribution Plan, DIDI receives 12b-1 fees of 0.25% of average daily net assets of Class B shares. Pursuant to the Master Distribution Plan, DIDI remits these fees to the Participating Insurance Companies for various costs incurred or paid by these companies in connection with marketing and distribution of Class B shares. For the six months ended June 30, 2013, the Distribution Service Fee aggregated $2,110, of which $336 is unpaid.
Typesetting and Filing Service Fees. Under an agreement with DIMA, DIMA is compensated for providing typesetting and certain regulatory filing services to the Fund. For the six months ended June 30, 2013, the amount charged to the Fund by DIMA included in the Statement of Operations under "reports to shareholders" aggregated $7,995, all of which is unpaid.
Trustees' Fees and Expenses. The Fund paid retainer fees to each Trustee not affiliated with the Advisor, plus specified amounts to the Board Chairperson and Vice Chairperson and to each committee Chairperson.
Affiliated Cash Management Vehicles. The Fund may invest uninvested cash balances in Central Cash Management Fund and DWS Variable NAV Money Fund, affiliated money market funds which are managed by the Advisor. Each affiliated money market fund seeks to provide a high level of current income consistent with liquidity and the preservation of capital. Each affiliated money market fund is managed in accordance with Rule 2a-7 under the Investment Company Act of 1940, which governs the quality, maturity, diversity and liquidity of instruments in which a money market fund may invest. Central Cash Management Fund seeks to maintain a stable net asset value, and DWS Variable NAV Money Fund maintains a floating net asset value. The Fund indirectly bears its proportionate share of the expenses of each affiliated money market fund in which it invests. Central Cash Management Fund does not pay the Advisor an investment management fee. To the extent that DWS Variable NAV Money Fund pays an investment management fee to the Advisor, the Advisor will waive an amount of the investment management fee payable to the Advisor by the Fund equal to the amount of the investment management fee payable on the Fund's assets invested in DWS Variable NAV Money Fund.
E. Ownership of the Fund
Two participating insurance companies were owners of record of 10% or more of the total outstanding Class A shares of the Fund, each owning 42% and 34%.
F. Line of Credit
The Fund and other affiliated funds (the "Participants") share in a $375 million revolving credit facility provided by a syndication of banks. The Fund may borrow for temporary or emergency purposes, including the meeting of redemption requests that otherwise might require the untimely disposition of securities. The Participants are charged an annual commitment fee which is allocated based on net assets, among each of the Participants. Interest is calculated at a rate per annum equal to the sum of the Federal Funds Rate plus 1.25 percent plus if LIBOR exceeds the Federal Funds Rate the amount of such excess. The Fund may borrow up to a maximum of 33 percent of its net assets under the agreement. The Fund had no outstanding loans at June 30, 2013.
G. Acquisition of Assets
On April 30, 2012, the Fund acquired all of the net assets of DWS Blue Chip VIP pursuant to a plan of reorganization approved by the Board of Trustees on November 18, 2011. The acquisition was accomplished by a tax-free exchange of 8,967,004 Class A shares and 3,018 Class B shares of DWS Blue Chip VIP for 12,597,547 Class A shares and 4,259 Class B shares of the Fund, respectively, outstanding on April 30, 2012. DWS Blue Chip VIP's net assets at that date, $103,338,077, including $13,470,096 of net unrealized appreciation, were combined with those of the Fund. The aggregate net assets of the Fund immediately before the acquisition were $92,542,116. The combined net assets of the Fund immediately following the acquisition were $195,880,193.
Information About Your Fund's Expenses (Unaudited)
As an investor of the Fund, you incur two types of costs: ongoing expenses and transaction costs. Ongoing expenses include management fees, distribution and service (12b-1) fees and other Fund expenses. Examples of transaction costs include contract charges, redemption fees and account maintenance fees, which are not shown in this section. The following tables are intended to help you understand your ongoing expenses (in dollars) of investing in the Fund and to help you compare these expenses with the ongoing expenses of investing in other mutual funds. The example in the table is based on an investment of $1,000 invested at the beginning of the six-month period and held for the entire period (January 1, 2013 to June 30, 2013).
The tables illustrate your Fund's expenses in two ways:
•Actual Fund Return. This helps you estimate the actual dollar amount of ongoing expenses (but not transaction costs) paid on a $1,000 investment in the Fund using the Fund's actual return during the period. To estimate the expenses you paid over the period, simply divide your account value by $1,000 (for example, an $8,600 account value divided by $1,000 = 8.6), then multiply the result by the number in the "Expenses Paid per $1,000" line under the share class you hold.
• Hypothetical 5% Fund Return. This helps you to compare your Fund's ongoing expenses (but not transaction costs) with those of other mutual funds using the Fund's actual expense ratio and a hypothetical rate of return of 5% per year before expenses. Examples using a 5% hypothetical Fund return may be found in the shareholder reports of other mutual funds. The hypothetical account values and expenses may not be used to estimate the actual ending account balance or expenses you paid for the period.
Please note that the expenses shown in these tables are meant to highlight your ongoing expenses only and do not reflect any transaction costs. The "Expenses Paid per $1,000" line of the tables is useful in comparing ongoing expenses only and will not help you determine the relative total expense of owning different funds. If these transaction costs had been included, your costs would have been higher.
Expenses and Value of a $1,000 Investment for the six months ended June 30, 2013 | |
| Actual Fund Return | | Class A | | | Class B | |
| Beginning Account Value 1/1/13 | | $ | 1,000.00 | | | $ | 1,000.00 | |
| Ending Account Value 6/30/13 | | $ | 1,144.80 | | | $ | 1,143.90 | |
| Expenses Paid per $1,000* | | $ | 3.03 | | | $ | 4.04 | |
| Hypothetical 5% Portfolio Return | | Class A | | | Class B | |
| Beginning Account Value 1/1/13 | | $ | 1,000.00 | | | $ | 1,000.00 | |
| Ending Account Value 6/30/13 | | $ | 1,021.97 | | | $ | 1,021.03 | |
| Expenses Paid per $1,000* | | $ | 2.86 | | | $ | 3.81 | |
* Expenses are equal to the Fund's annualized expense ratio for each share class, multiplied by the average account value over the period, multiplied by 181 (the number of days in the most recent six-month period), then divided by 365.
| Annualized Expense Ratios | Class A | | Class B | |
| DWS Variable Series I — DWS Core Equity VIP | .57% | | .77% | |
For more information, please refer to the Fund's prospectus.
These tables do not reflect charges and fees ("contract charges") associated with the separate account that invests in the Fund or any variable life insurance policy or variable annuity contract for which the Fund is an investment option.
For an analysis of the fees associated with an investment in the Fund or similar funds, please refer to http://apps.finra.org/fundanalyzer/1/fa.aspx.
The Series' policies and procedures for voting proxies for portfolio securities and information about how the Series voted proxies related to its portfolio securities during the 12-month period ended June 30 are available on our Web site — www.dws-investments.com (click on "proxy voting"at the bottom of the page) — or on the SEC's Web site — www.sec.gov. To obtain a written copy of the Series' policies and procedures without charge, upon request, call us toll free at (800) 728-3337.
Summary of Management Fee Evaluation by Independent Fee Consultant
September 17, 2012
Pursuant to an Order entered into by Deutsche Investment Management Americas and affiliates (collectively, "DeAM") with the Attorney General of New York, I, Thomas H. Mack, have been appointed the Independent Fee Consultant for the DWS Funds (formerly the DWS Scudder Funds). My duties include preparing an annual written evaluation of the management fees DeAM charges the Funds, considering among other factors the management fees charged by other mutual fund companies for like services, management fees DeAM charges other clients for like services, DeAM's costs of supplying services under the management agreements and related profit margins, possible economies of scale if a Fund grows larger, and the nature and quality of DeAM's services, including fund performance. This report summarizes my evaluation for 2012, including my qualifications, the evaluation process for each of the DWS Funds, consideration of certain complex-level factors, and my conclusions. I served in substantially the same capacity in 2007, 2008, 2009, 2010 and 2011.
Qualifications
For more than 35 years I have served in various professional capacities within the investment management business. I have held investment analysis and advisory positions, including securities analyst, portfolio strategist and director of investment policy with a large investment firm. I have also performed business management functions, including business development, financial management and marketing research and analysis.
Since 1991, I have been an independent consultant within the asset management industry. I have provided services to over 125 client organizations, including investment managers, mutual fund boards, product distributors and related organizations. Over the past ten years I have completed a number of assignments for mutual fund boards, specifically including assisting boards with management contract renewal.
I hold a Master of Business Administration degree, with highest honors, from Harvard University and Master of Science and Bachelor of Science (highest honors) degrees from the University of California at Berkeley. I am an independent director and audit committee financial expert for two closed-end mutual funds and have served in various leadership and financial oversight capacities with non-profit organizations.
Evaluation of Fees for each DWS Fund
My work focused primarily on evaluating, fund-by-fund, the fees charged to each of the 103 mutual fund portfolios in the DWS Fund family. For each Fund, I considered each of the key factors mentioned above, as well as any other relevant information. In doing so I worked closely with the Funds' Independent Directors in their annual contract renewal process, as well as in their approval of contracts for several new funds (documented separately).
In evaluating each Fund's fees, I reviewed comprehensive materials provided by or on behalf of DeAM, including expense information prepared by Lipper Analytical, comparative performance information, profitability data, manager histories, and other materials. I also accessed certain additional information from the Lipper and Morningstar databases and drew on my industry knowledge and experience.
To facilitate evaluating this considerable body of information, I prepared for each Fund a document summarizing the key data elements in each area as well as additional analytics discussed below. This made it possible to consider each key data element in the context of the others.
In the course of contract renewal, DeAM agreed to implement a number of fee and expense adjustments requested by the Independent Directors which will favorably impact future fees and expenses, and my evaluation includes the effects of these changes.
Fees and Expenses Compared with Other Funds
The competitive fee and expense evaluation for each fund focused on two primary comparisons:
The Fund's contractual management fee (the advisory fee plus the administration fee where applicable) compared with those of a group of typically 12-15 funds in the same Lipper investment category (e.g. Large Capitalization Growth) having similar distribution arrangements and being of similar size.
The Fund's total expenses compared with a broader universe of funds from the same Lipper investment category and having similar distribution arrangements.
These two comparisons provide a view of not only the level of the fee compared with funds of similar scale but also the total expense the Fund bears for all the services it receives, in comparison with the investment choices available in the Fund's investment category and distribution channel. The principal figure-of-merit used in these comparisons was the subject Fund's percentile ranking against peers.
DeAM's Fees for Similar Services to Others
DeAM provided management fee schedules for all of its US domiciled fund and non-fund investment management accounts in any of the investment categories where there is a DWS Fund. These similar products included the other DWS Funds, non-fund pooled accounts, institutional accounts and sub-advisory accounts. Using this information, I calculated for each Fund the fee that would be charged to each similar product, at the subject Fund's asset level.
Evaluating information regarding non-fund products is difficult because there are varying levels of services required for different types of accounts, with mutual funds generally requiring considerably more regulatory and administrative types of service as well as having more frequent cash flows than other types of accounts. Also, while mutual fund fees for similar fund products can be expected to be similar, there will be some differences due to different pricing conditions in different distribution channels (e.g. retail funds versus those used in variable insurance products), differences in underlying investment processes and other factors.
Costs and Profit Margins
DeAM provided a detailed profitability analysis for each Fund. After making some adjustments so that the presentation would be more comparable to the available industry figures, I reviewed profit margins from investment management alone, from investment management plus other fund services (excluding distribution) provided to the Funds by DeAM (principally shareholder services), and DeAM profits from all sources, including distribution. A later section comments on overall profitability.
Economies of Scale
Economies of scale — an expected decline in management cost per dollar of fund assets as fund assets grow — are very rarely quantified and documented because of inherent difficulties in collecting and analyzing relevant data. However, in virtually every investment category that I reviewed, larger funds tend to have lower fees and lower total expenses than smaller funds. To see how each DWS Fund compares with this industry observation, I reviewed:
The trend in Fund assets over the last five years and the accompanying trend in total expenses. This shows if the Fund has grown and, if so, whether total expense (management fees as well as other expenses) have declined as a percent of assets.
Whether the Fund has break-points in its management fee schedule, the extent of the fee reduction built into the schedule and the asset levels where the breaks take effect, and in the case of a sub-advised Fund how the Fund's break-points compare with those of the sub-advisory fee schedule.
How the Fund's contractual fee schedule compares with trends in the industry data. To accomplish this, I constructed a chart showing how actual latest-fiscal-year contractual fees of the Fund and of other similar funds relate to average fund assets, with the subject Fund's contractual fee schedule superimposed.
Quality of Service — Performance
The quality-of-service evaluation focused on investment performance, which is the principal result of the investment management service. Each Fund's performance was reviewed over the past 1, 3, 5 and 10 years, as applicable, and compared with that of other funds in the same investment category and with a suitable market index.
In addition, I calculated and reviewed risk-adjusted returns relative to an index of similar mutual funds' returns and a suitable market index. The risk-adjusted returns analysis provides a way of determining the extent to which the Fund's return comparisons are mainly the product of investment value-added (or lack thereof) or alternatively taking considerably more or less risk than is typical in its investment category.
I also received and considered the history of portfolio manager changes for each Fund, as this provided an important context for evaluating the performance results.
Complex-Level Considerations
While this evaluation was conducted mainly at the individual fund level, there are some issues relating to the reasonableness of fees that can alternatively be considered across the whole fund complex:
I reviewed DeAM's profitability analysis for all DWS Funds, with a view toward determining if the allocation procedures used were reasonable and how profit levels compared with public data for other investment managers.
I considered whether DeAM and affiliates receive any significant ancillary or "fallout" benefits that should be considered in interpreting the direct profitability results. These would be situations where serving as the investment manager of the Funds is beneficial to another part of the Deutsche Bank organization.
I considered how aggregated DWS Fund expenses had varied over the years, by asset class and in the context of trends in asset levels.
I considered how aggregated DWS Fund performance measures relative to appropriate peers had varied by asset class and over time.
I reviewed the structure of the DeAM organization, trends in staffing levels, and information on compensation of investment management and other professionals compared with industry data.
Findings
Based on the process and analysis discussed above, which included reviewing a wide range of information from management and external data sources and considering among other factors the fees DeAM charges other clients, the fees charged by other fund managers, DeAM's costs and profits associated with managing the Funds, economies of scale, possible fall-out benefits, and the nature and quality of services provided, in my opinion the management fees charged the DWS Funds are reasonable.
Thomas H. Mack
President, Thomas H. Mack & Co., Inc.
Notes
DWS Investments Distributors, Inc.
222 South Riverside Plaza
Chicago, IL 60606
(800) 621-1148
VS1coreq-3 (R-028376-2 8/13)
JUNE 30, 2013
SEMIANNUAL REPORT
DWS VARIABLE SERIES I
DWS Global Small Cap Growth VIP
Contents
12 Statement of Assets and Liabilities 13 Statement of Operations 14 Statement of Changes in Net Assets 17 Notes to Financial Statements 21 Information About Your Fund's Expenses 23 Summary of Management Fee Evaluation by Independent Fee Consultant |
This report must be preceded or accompanied by a prospectus. To obtain an additional prospectus or summary prospectus, if available, call (800) 728-3337 or your financial representative. We advise you to consider the Fund's objectives, risks, charges and expenses carefully before investing. The summary prospectus and prospectus contain this and other important information about the Fund. Please read the prospectus carefully before you invest.
Investing in foreign securities, particularly those of emerging markets, presents certain risks, such as currency fluctuations, political and economic changes, and market risks. The Fund may lend securities to approved institutions. Smaller company stocks tend to be more volatile than medium-sized or large company stocks. Stocks may decline in value. See the prospectus for details.
DWS Investments is part of the Deutsche Asset & Wealth Management division of Deutsche Bank AG.
NOT FDIC/NCUA INSURED NO BANK GUARANTEE MAY LOSE VALUE NOT A DEPOSIT
NOT INSURED BY ANY FEDERAL GOVERNMENT AGENCY
Performance Summary June 30, 2013 (Unaudited)
Fund performance shown is historical, assumes reinvestment of all dividend and capital gain distributions, and does not guarantee future results. Investment return and principal value fluctuate with changing market conditions so that, when redeemed, shares may be worth more or less than their original cost. Current performance may be lower or higher than the performance data quoted. Please contact your participating insurance company for the Fund's most recent month-end performance. Performance doesn't reflect charges and fees ("contract charges") associated with the separate account that invests in the Fund or any variable life insurance policy or variable annuity contract for which the Fund is an investment option. These charges and fees will reduce returns. While all share classes have the same underlying portfolio, their performance will differ.
The gross expense ratios of the Fund, as stated in the fee table of the prospectus dated May 1, 2013 are 1.11% and 1.43% for Class A and Class B shares, respectively, and may differ from the expense ratios disclosed in the Financial Highlights tables in this report.
| Growth of an Assumed $10,000 Investment |
| The S&P® Developed SmallCap comprises the stocks representing the lowest 15% of float-adjusted market cap in each developed country. It Is a subset of the S&P® Global BMI, a comprehensive, rules-based index measuring global stock market performance. Index returns do not reflect any fees or expenses and it is not possible to invest directly into an index. |
| |
| Yearly periods ended June 30 | |
| Comparative Results | |
| DWS Global Small Cap Growth VIP | | 6-Month‡ | | | 1-Year | | | 3-Year | | | 5-Year | | | 10-Year | |
| Class A | Growth of $10,000 | | $ | 11,199 | | | $ | 12,546 | | | $ | 15,251 | | | $ | 12,307 | | | $ | 26,794 | |
| Average annual total return | | | 11.99 | % | | | 25.46 | % | | | 15.11 | % | | | 4.24 | % | | | 10.36 | % |
| S&P Developed SmallCap Index | Growth of $10,000 | | $ | 11,032 | | | $ | 12,266 | | | $ | 15,463 | | | $ | 12,723 | | | $ | 27,200 | |
| Average annual total return | | | 10.32 | % | | | 22.66 | % | | | 15.64 | % | | | 4.93 | % | | | 10.52 | % |
| DWS Global Small Cap Growth VIP | | 6-Month‡ | | | 1-Year | | | 3-Year | | | 5-Year | | | 10-Year | |
| Class B | Growth of $10,000 | | $ | 11,193 | | | $ | 12,516 | | | $ | 15,148 | | | $ | 12,132 | | | $ | 26,125 | |
| Average annual total return | | | 11.93 | % | | | 25.16 | % | | | 14.85 | % | | | 3.94 | % | | | 10.08 | % |
| S&P Developed SmallCap Index | Growth of $10,000 | | $ | 11,032 | | | $ | 12,266 | | | $ | 15,463 | | | $ | 12,723 | | | $ | 27,200 | |
| Average annual total return | | | 10.32 | % | | | 22.66 | % | | | 15.64 | % | | | 4.93 | % | | | 10.52 | % |
The growth of $10,000 is cumulative.
‡ Total returns shown for periods less than one year are not annualized.
Portfolio Summary (Unaudited)
Asset Allocation (As a % of Investment Portfolio excluding Securities Lending Collateral) | 6/30/13 | 12/31/12 |
| | | |
| Common Stocks | 98% | 99% |
| Cash Equivalents | 2% | 1% |
| | 100% | 100% |
Geographical Diversification (As a % of Investment Portfolio excluding Cash Equivalents and Securities Lending Collateral) | 6/30/13 | 12/31/12 |
| | | |
| United States | 44% | 42% |
| Continental Europe | 20% | 24% |
| Asia (excluding Japan) | 12% | 10% |
| United Kingdom | 11% | 9% |
| Japan | 9% | 8% |
| Canada | 2% | 3% |
| Latin America | 1% | 1% |
| Australia | 0% | 1% |
| Middle East | — | 1% |
| Other | 1% | 1% |
| | 100% | 100% |
Sector Diversification (As a % of Investment Portfolio excluding Cash Equivalents and Securities Lending Collateral) | 6/30/13 | 12/31/12 |
| | | |
| Industrials | 26% | 27% |
| Consumer Discretionary | 23% | 21% |
| Financials | 16% | 13% |
| Health Care | 14% | 14% |
| Information Technology | 7% | 9% |
| Energy | 6% | 7% |
| Consumer Staples | 6% | 6% |
| Materials | 2% | 3% |
| | 100% | 100% |
Portfolio holdings and characteristics are subject to change.
For more complete details about the Fund's investment portfolio, see page 7.
Following the Fund's fiscal first and third quarter-end, a complete portfolio holdings listing is filed with the SEC on Form N-Q. The form will be available on the SEC's Web site at www.sec.gov, and it also may be reviewed and copied at the SEC's Public Reference Room in Washington, D.C. Information on the operation of the SEC's Public Reference Room may be obtained by calling (800) SEC-0330. The Fund's portfolio holdings are also posted on www.dws-investments.com from time to time. Please see the Fund's current prospectus for more information.
Joseph Axtell, CFA
Portfolio Manager
Investment Portfolio June 30, 2013 (Unaudited) | | | Shares | | | Value ($) | |
| | | | |
| Common Stocks 97.1% | |
| Australia 0.3% | |
| Austal Ltd.* (Cost $764,055) | | | 576,906 | | | | 397,343 | |
| Austria 0.1% | |
| AMS AG (Cost $186,042) | | | 1,974 | | | | 145,732 | |
| Bermuda 0.8% | |
| Lazard Ltd. "A" (a) (Cost $799,420) | | | 32,102 | | | | 1,032,079 | |
| Brazil 0.6% | |
| Fleury SA (Cost $1,141,734) | | | 99,543 | | | | 811,922 | |
| Canada 1.2% | |
| Americas Petrogas, Inc.* | | | 149,587 | | | | 126,588 | |
| SunOpta, Inc.* | | | 184,529 | | | | 1,400,575 | |
| (Cost $1,921,510) | | | | 1,527,163 | |
| China 1.6% | |
| Charm Communications, Inc. (ADR) | | | 106,708 | | | | 482,320 | |
| Minth Group Ltd. | | | 1,045,047 | | | | 1,641,540 | |
| (Cost $1,486,336) | | | | 2,123,860 | |
| Cyprus 0.9% | |
| ProSafe SE (Cost $1,032,641) | | | 138,127 | | | | 1,210,058 | |
| Denmark 0.8% | |
| GN Store Nord AS (Cost $708,985) | | | 55,244 | | | | 1,042,987 | |
| France 1.6% | |
| Flamel Technologies SA (ADR)* | | | 156,961 | | | | 965,310 | |
| JC Decaux SA (b) | | | 45,026 | | | | 1,227,293 | |
| (Cost $3,020,804) | | | | 2,192,603 | |
| Germany 4.5% | |
| Fresenius Medical Care AG & Co. KGaA | | | 10,009 | | | | 709,111 | |
| Gerresheimer AG | | | 14,879 | | | | 859,844 | |
| M.A.X. Automation AG | | | 190,057 | | | | 1,038,866 | |
| Rational AG | | | 4,084 | | | | 1,368,331 | |
| United Internet AG (Registered) | | | 69,777 | | | | 1,966,614 | |
| (Cost $2,325,200) | | | | 5,942,766 | |
| Gibraltar 0.3% | |
| Bwin.Party Digital Entertainment PLC (Cost $971,421) | | | 260,980 | | | | 445,648 | |
| Hong Kong 3.1% | |
| K Wah International Holdings Ltd. | | | 3,383,062 | | | | 1,539,866 | |
| REXLot Holdings Ltd. | | | 19,870,685 | | | | 1,301,199 | |
| Techtronic Industries Co., Ltd. | | | 558,848 | | | | 1,333,565 | |
| (Cost $2,741,443) | | | | 4,174,630 | |
| Indonesia 1.5% | |
| PT Arwana Citramulia Tbk | | | 3,250,896 | | | | 1,045,895 | |
| PT Ciputra Property Tbk | | | 8,149,270 | | | | 969,234 | |
| (Cost $1,884,482) | | | | 2,015,129 | |
| Ireland 4.1% | |
| C&C Group PLC | | | 237,410 | | | | 1,287,231 | |
| Paddy Power PLC | | | 23,961 | | | | 2,055,994 | |
| Ryanair Holdings PLC | | | 229,466 | | | | 2,132,193 | |
| (Cost $1,598,542) | | | | 5,475,418 | |
| | | Shares | | | Value ($) | |
| | | | | | | | | |
| Italy 0.6% | |
| Prysmian SpA (Cost $755,286) | | | 41,990 | | | | 780,710 | |
| Japan 8.5% | |
| Ai Holdings Corp. | | | 89,568 | | | | 789,363 | |
| Avex Group Holdings, Inc. | | | 50,083 | | | | 1,578,119 | |
| Hajime Construction Co., Ltd. (b) | | | 29,262 | | | | 1,628,809 | |
| Kusuri No Aoki Co., Ltd. | | | 20,104 | | | | 1,325,746 | |
| Medical System Network Co., Ltd. | | | 113,898 | | | | 483,918 | |
| MISUMI Group, Inc. | | | 30,937 | | | | 845,886 | |
| Nippon Seiki Co., Ltd. | | | 119,125 | | | | 1,538,759 | |
| OSG Corp. | | | 28,060 | | | | 421,294 | |
| Sumikin Bussan Corp. | | | 50,187 | | | | 137,648 | |
| United Arrows Ltd. | | | 38,930 | | | | 1,630,992 | |
| Universal Entertainment Corp. | | | 55,322 | | | | 978,891 | |
| (Cost $8,591,988) | | | | 11,359,425 | |
| Luxembourg 0.4% | |
| L'Occitane International SA (Cost $356,205) | | | 181,565 | | | | 488,156 | |
| Malaysia 1.5% | |
| Hartalega Holdings Bhd. | | | 661,740 | | | | 1,338,166 | |
| Tune Ins Holdings Bhd.* | | | 1,159,601 | | | | 677,401 | |
| (Cost $1,363,457) | | | | 2,015,567 | |
| Netherlands 4.0% | |
| Brunel International NV | | | 27,592 | | | | 1,161,651 | |
| Chicago Bridge & Iron Co. NV (c) | | | 20,728 | | | | 1,236,633 | |
| Koninklijke Vopak NV | | | 23,438 | | | | 1,381,933 | |
| SBM Offshore NV* | | | 91,819 | | | | 1,537,005 | |
| (Cost $2,592,005) | | | | 5,317,222 | |
| Panama 0.6% | |
| Banco Latinoamericano de Comercio Exterior SA "E" (Cost $827,404) | | | 34,592 | | | | 774,515 | |
| Philippines 1.9% | |
| Alliance Global Group, Inc. | | | 2,642,914 | | | | 1,413,832 | |
| GT Capital Holdings, Inc. | | | 51,907 | | | | 951,160 | |
| House of Investments, Inc. | | | 914,640 | | | | 158,623 | |
| (Cost $1,737,279) | | | | 2,523,615 | |
| Singapore 1.9% | |
| Lian Beng Group Ltd. | | | 2,616,511 | | | | 1,069,978 | |
| Yongnam Holdings Ltd. | | | 5,236,440 | | | | 1,421,135 | |
| (Cost $1,939,414) | | | | 2,491,113 | |
| Switzerland 1.5% | |
| Dufry AG (Registered)* | | | 11,004 | | | | 1,331,431 | |
| OC Oerlikon Corp. AG (Registered) | | | 61,341 | | | | 723,724 | |
| (Cost $2,106,354) | | | | 2,055,155 | |
| Thailand 0.4% | |
| Malee Sampran Factory PCL (Foreign Registered) (Cost $975,784) | | | 483,098 | | | | 529,593 | |
| United Kingdom 10.7% | |
| ARM Holdings PLC | | | 45,571 | | | | 551,400 | |
| Ashmore Group PLC | | | 227,745 | | | | 1,185,568 | |
| Babcock International Group PLC | | | 140,923 | | | | 2,372,712 | |
| | | Shares | | | Value ($) | |
| | | | | | | | | |
| Burberry Group PLC | | | 42,593 | | | | 878,671 | |
| Crest Nicholson Holdings PLC* | | | 142,199 | | | | 691,701 | |
| Domino's Pizza Group PLC | | | 106,167 | | | | 1,085,759 | |
| Essentra PLC | | | 100,949 | | | | 1,074,752 | |
| Hargreaves Lansdown PLC | | | 90,725 | | | | 1,220,231 | |
| HellermannTyton Group PLC* | | | 317,895 | | | | 1,251,666 | |
| IG Group Holdings PLC | | | 124,645 | | | | 1,102,840 | |
| John Wood Group PLC | | | 84,863 | | | | 1,048,465 | |
| Nanoco Group PLC* | | | 289,978 | | | | 582,086 | |
| Rotork PLC | | | 31,784 | | | | 1,285,837 | |
| (Cost $8,234,102) | | | | 14,331,688 | |
| United States 43.7% | |
| Advance Auto Parts, Inc. | | | 11,760 | | | | 954,559 | |
| Aecom Technology Corp.* | | | 33,549 | | | | 1,066,523 | |
| Aeropostale, Inc.* | | | 50,024 | | | | 690,331 | |
| Affiliated Managers Group, Inc.* | | | 9,257 | | | | 1,517,593 | |
| Altra Holdings, Inc. | | | 28,488 | | | | 780,001 | |
| Applied Industrial Technologies, Inc. | | | 21,610 | | | | 1,044,411 | |
| Ascena Retail Group, Inc.* (b) | | | 31,888 | | | | 556,446 | |
| athenahealth, Inc.* | | | 8,408 | | | | 712,326 | |
| BE Aerospace, Inc.* | | | 31,443 | | | | 1,983,424 | |
| Blount International, Inc.* | | | 56,289 | | | | 665,336 | |
| BorgWarner, Inc.* | | | 12,292 | | | | 1,058,956 | |
| Cardtronics, Inc.* | | | 25,979 | | | | 717,020 | |
| Catamaran Corp.* | | | 24,515 | | | | 1,194,371 | |
| Centene Corp.* | | | 16,447 | | | | 862,810 | |
| Cognex Corp. | | | 16,251 | | | | 734,870 | |
| CONMED Corp. | | | 23,733 | | | | 741,419 | |
| Deckers Outdoor Corp.* (b) | | | 17,006 | | | | 858,973 | |
| Derma Sciences, Inc.* | | | 58,282 | | | | 778,065 | |
| DFC Global Corp.* | | | 59,624 | | | | 823,407 | |
| Dresser-Rand Group, Inc.* | | | 20,965 | | | | 1,257,481 | |
| Encore Capital Group, Inc.* (b) | | | 36,520 | | | | 1,209,177 | |
| Furiex Pharmaceuticals, Inc.* | | | 18,193 | | | | 619,836 | |
| Green Mountain Coffee Roasters, Inc.* (b) | | | 22,093 | | | | 1,658,301 | |
| Hain Celestial Group, Inc.* (b) | | | 10,151 | | | | 659,510 | |
| Harris Corp. | | | 18,951 | | | | 933,337 | |
| Haynes International, Inc. | | | 15,185 | | | | 726,906 | |
| HeartWare International, Inc.* | | | 10,980 | | | | 1,044,308 | |
| Hi-Tech Pharmacal Co., Inc. | | | 42,001 | | | | 1,394,433 | |
| Jack in the Box, Inc.* | | | 18,802 | | | | 738,731 | |
| Jarden Corp.* | | | 37,094 | | | | 1,622,863 | |
| Leucadia National Corp. | | | 43,364 | | | | 1,137,004 | |
| Manitowoc Co., Inc. (b) | | | 81,547 | | | | 1,460,507 | |
| MICROS Systems, Inc.* (b) | | | 15,314 | | | | 660,799 | |
| NxStage Medical, Inc.* | | | 61,958 | | | | 884,760 | |
| Oasis Petroleum, Inc.* | | | 18,235 | | | | 708,794 | |
| Ocwen Financial Corp.* | | | 33,204 | | | | 1,368,669 | |
| | | Shares | | | Value ($) | |
| | | | | | | | | |
| Oil States International, Inc.* | | | 11,540 | | | | 1,069,066 | |
| Pacira Pharmaceuticals, Inc.* | | | 85,413 | | | | 2,476,977 | |
| PTC, Inc.* | | | 30,002 | | | | 735,949 | |
| Roadrunner Transportation Systems, Inc.* | | | 32,995 | | | | 918,581 | |
| Rosetta Resources, Inc.* | | | 13,311 | | | | 565,984 | |
| Schweitzer-Mauduit International, Inc. | | | 13,806 | | | | 688,643 | |
| Sears Hometown & Outlet Stores, Inc.* | | | 28,577 | | | | 1,249,386 | |
| Signature Bank* | | | 10,463 | | | | 868,638 | |
| Stericycle, Inc.* | | | 6,553 | | | | 723,648 | |
| Sunshine Heart, Inc.* | | | 110,980 | | | | 595,963 | |
| Tenneco, Inc.* | | | 25,558 | | | | 1,157,266 | |
| The Bancorp., Inc.* | | | 29,870 | | | | 447,751 | |
| Thoratec Corp.* | | | 35,971 | | | | 1,126,252 | |
| TIBCO Software, Inc.* | | | 40,313 | | | | 862,698 | |
| TiVo, Inc.* | | | 70,178 | | | | 775,467 | |
| Tristate Capital Holdings, Inc.* | | | 56,467 | | | | 776,421 | |
| United Rentals, Inc.* (b) | | | 22,588 | | | | 1,127,367 | |
| Urban Outfitters, Inc.* | | | 29,154 | | | | 1,172,574 | |
| WABCO Holdings, Inc.* | | | 19,527 | | | | 1,458,472 | |
| Waddell & Reed Financial, Inc. "A" | | | 32,588 | | | | 1,417,578 | |
| WageWorks, Inc.* | | | 31,914 | | | | 1,099,437 | |
| Zions Bancorp. (b) | | | 41,897 | | | | 1,209,985 | |
| (Cost $39,873,988) | | | | 58,350,360 | |
Total Common Stocks (Cost $89,622,780) | | | | 129,554,457 | |
| | |
| Warrants 0.0% | |
| Malaysia | |
| Hartalega Holdings Bhd., Expiration Date 5/29/2015* (Cost $0) | | | 68,733 | | | | 51,980 | |
| | |
| Securities Lending Collateral 9.2% | |
| Daily Assets Fund Institutional, 0.10% (d) (e) (Cost $12,312,833) | | | 12,312,833 | | | | 12,312,833 | |
| | |
| Cash Equivalents 2.0% | |
| Central Cash Management Fund, 0.07% (d) (Cost $2,712,251) | | | 2,712,251 | | | | 2,712,251 | |
| | | % of Net Assets | | | Value ($) | |
| | | | |
Total Investment Portfolio (Cost $104,647,864)† | | | 108.3 | | | | 144,631,521 | |
| Other Assets and Liabilities, Net | | | (8.3 | ) | | | (11,124,992 | ) |
| Net Assets | | | 100.0 | | | | 133,506,529 | |
* Non-income producing security.
† The cost for federal income tax purposes was $105,203,586. At June 30, 2013, net unrealized appreciation for all securities based on tax cost was $39,427,935. This consisted of aggregate gross unrealized appreciation for all securities in which there was an excess of value over tax cost of $46,032,502 and aggregate gross unrealized depreciation for all securities in which there was an excess of tax cost over value of $6,604,567.
(a) Listed on the NASDAQ Stock Market, Inc.
(b) All or a portion of these securities were on loan (see Notes to Financial Statements). The value of securities loaned at June 30, 2013 amounted to $11,906,419, which is 8.9% of net assets.
(c) Listed on the New York Stock Exchange.
(d) Affiliated fund managed by Deutsche Investment Management Americas Inc. The rate shown is the annualized seven-day yield at period end.
(e) Represents collateral held in connection with securities lending. Income earned by the Fund is net of borrower rebates.
ADR: American Depositary Receipt
Fair Value Measurements
Various inputs are used in determining the value of the Fund's investments. These inputs are summarized in three broad levels. Level 1 includes quoted prices in active markets for identical securities. Level 2 includes other significant observable inputs (including quoted prices for similar securities, interest rates, prepayment speeds, and credit risk). Level 3 includes significant unobservable inputs (including the Fund's own assumptions in determining the fair value of investments). The inputs or methodology used for valuing securities are not necessarily an indication of the risk associated with investing in those securities.
The following is a summary of the inputs used as of June 30, 2013 in valuing the Fund's investments. For information on the Fund's policy regarding the valuation of investments, please refer to the Security Valuation section of Note A in the accompanying Notes to Financial Statements.
| Assets | | Level 1 | | | Level 2 | | | Level 3 | | | Total | |
| | |
| Common Stocks & Warrants | |
| Australia | | $ | — | | | $ | 397,343 | | | $ | — | | | $ | 397,343 | |
| Austria | | | — | | | | 145,732 | | | | — | | | | 145,732 | |
| Bermuda | | | 1,032,079 | | | | — | | | | — | | | | 1,032,079 | |
| Brazil | | | 811,922 | | | | — | | | | — | | | | 811,922 | |
| Canada | | | 1,527,163 | | | | — | | | | — | | | | 1,527,163 | |
| China | | | 482,320 | | | | 1,641,540 | | | | — | | | | 2,123,860 | |
| Cyprus | | | — | | | | 1,210,058 | | | | — | | | | 1,210,058 | |
| Denmark | | | — | | | | 1,042,987 | | | | — | | | | 1,042,987 | |
| France | | | 965,310 | | | | 1,227,293 | | | | — | | | | 2,192,603 | |
| Germany | | | — | | | | 5,942,766 | | | | — | | | | 5,942,766 | |
| Gibraltar | | | — | | | | 445,648 | | | | — | | | | 445,648 | |
| Hong Kong | | | — | | | | 4,174,630 | | | | — | | | | 4,174,630 | |
| Indonesia | | | — | | | | 2,015,129 | | | | — | | | | 2,015,129 | |
| Ireland | | | — | | | | 5,475,418 | | | | — | | | | 5,475,418 | |
| Italy | | | — | | | | 780,710 | | | | — | | | | 780,710 | |
| Japan | | | — | | | | 11,359,425 | | | | — | | | | 11,359,425 | |
| Luxembourg | | | — | | | | 488,156 | | | | — | | | | 488,156 | |
| Malaysia | | | — | | | | 2,067,547 | | | | — | | | | 2,067,547 | |
| Netherlands | | | 1,236,633 | | | | 4,080,589 | | | | — | | | | 5,317,222 | |
| Panama | | | 774,515 | | | | — | | | | — | | | | 774,515 | |
| Philippines | | | — | | | | 2,523,615 | | | | — | | | | 2,523,615 | |
| Singapore | | | — | | | | 2,491,113 | | | | — | | | | 2,491,113 | |
| Switzerland | | | — | | | | 2,055,155 | | | | — | | | | 2,055,155 | |
| Thailand | | | — | | | | 529,593 | | | | — | | | | 529,593 | |
| United Kingdom | | | — | | | | 14,331,688 | | | | — | | | | 14,331,688 | |
| United States | | | 58,350,360 | | | | — | | | | — | | | | 58,350,360 | |
| Short-Term Investments (f) | | | 15,025,084 | | | | — | | | | — | | | | 15,025,084 | |
| Total | | $ | 80,205,386 | | | $ | 64,426,135 | | | $ | — | | | $ | 144,631,521 | |
During the period ended June 30, 2013, the amount of transfers between Level 3 and Level 2 was $51,980. The investment was transferred from Level 3 to Level 2 as a result of the availability of a pricing source supported by observable inputs.
Transfers between price levels are recognized at the beginning of the reporting period.
(f) See Investment Portfolio for additional detailed categorizations.
The accompanying notes are an integral part of the financial statements.
Statement of Assets and Liabilities | as of June 30, 2013 (Unaudited) | |
| Assets | |
Investments: Investments in non-affiliated securities, at value (cost 89,622,780) — including $11,906,419 of securities loaned | | $ | 129,606,437 | |
| Investment in Daily Assets Fund Institutional (cost $12,312,833)* | | | 12,312,833 | |
| Investment in Central Cash Management Fund (cost $2,712,251) | | | 2,712,251 | |
| Total investments in securities, at value (cost $104,647,864) | | | 144,631,521 | |
| Foreign currency, at value (cost $177,616) | | | 174,814 | |
| Receivable for investments sold | | | 966,435 | |
| Receivable for Fund shares sold | | | 83,351 | |
| Dividends receivable | | | 151,608 | |
| Interest receivable | | | 2,750 | |
| Foreign taxes recoverable | | | 76,112 | |
| Other assets | | | 964 | |
| Total assets | | | 146,087,555 | |
| Liabilities | |
| Payable upon return of securities loaned | | | 12,312,833 | |
| Payable for investments purchased | | | 37,827 | |
| Payable for Fund shares redeemed | | | 92,872 | |
| Accrued management fee | | | 61,010 | |
| Accrued Trustees' fees | | | 408 | |
| Other accrued expenses and payables | | | 76,076 | |
| Total liabilities | | | 12,581,026 | |
| Net assets, at value | | $ | 133,506,529 | |
| Net Assets Consist of | |
| Undistributed net investment income | | | 279,453 | |
Net unrealized appreciation (depreciation) on: Investments | | | 39,983,657 | |
| Foreign currency | | | (1,935 | ) |
| Accumulated net realized gain (loss) | | | 6,658,530 | |
| Paid-in capital | | | 86,586,824 | |
| Net assets, at value | | $ | 133,506,529 | |
Class A Net Asset Value, offering and redemption price per share ($131,493,968 ÷ 9,221,877 outstanding shares of beneficial interest, $.01 par value, unlimited number of shares authorized) | | $ | 14.26 | |
Class B Net Asset Value, offering and redemption price per share ($2,012,561 ÷ 143,739 outstanding shares of beneficial interest, $.01 par value, unlimited number of shares authorized) | | $ | 14.00 | |
* Represents collateral on securities loaned.
The accompanying notes are an integral part of the financial statements.
Statement of Operations
| for the six months ended June 30, 2013 (Unaudited) | |
| Investment Income | |
Income: Dividends (net of foreign taxes withheld of $56,310) | | $ | 921,139 | |
| Income distributions — Central Cash Management Fund | | | 1,295 | |
| Securities lending income, including income from Daily Assets Fund Institutional, net of borrower rebates | | | 41,950 | |
| Total income | | | 964,384 | |
Expenses: Management fee | | | 598,640 | |
| Administration fee | | | 67,263 | |
| Services to shareholders | | | 1,432 | |
| Distribution service fee (Class B) | | | 2,496 | |
| Record keeping fee (Class B) | | | 38 | |
| Custodian fee | | | 29,083 | |
| Professional fees | | | 33,925 | |
| Reports to shareholders | | | 16,743 | |
| Trustees' fees and expenses | | | 2,896 | |
| Other | | | 8,239 | |
| Total expenses before expense reductions | | | 760,755 | |
| Expense reductions | | | (126,350 | ) |
| Total expenses after expense reductions | | | 634,405 | |
| Net investment income (loss) | | | 329,979 | |
| Realized and Unrealized Gain (Loss) | |
Net realized gain (loss) from: Investments | | | 7,288,193 | |
| Foreign currency | | | (11,688 | ) |
| | | | 7,276,505 | |
Change in net unrealized appreciation (depreciation) on: Investments | | | 7,492,010 | |
| Foreign currency | | | (7,273 | ) |
| | | | 7,484,737 | |
| Net gain (loss) | | | 14,761,242 | |
| Net increase (decrease) in net assets resulting from operations | | $ | 15,091,221 | |
The accompanying notes are an integral part of the financial statements.
Statement of Changes in Net Assets | Increase (Decrease) in Net Assets | | Six Months Ended June 30, 2013 (Unaudited) | | | Year Ended December 31, 2012 | |
Operations: Net investment income (loss) | | $ | 329,979 | | | $ | 860,631 | |
| Net realized gain (loss) | | | 7,276,505 | | | | 9,539,908 | |
| Change in net unrealized appreciation (depreciation) | | | 7,484,737 | | | | 7,657,855 | |
| Net increase (decrease) in net assets resulting from operations | | | 15,091,221 | | | | 18,058,394 | |
Distributions to shareholders from: Net investment income: Class A | | | (881,158 | ) | | | (847,848 | ) |
| Class B | | | (8,337 | ) | | | (8,192 | ) |
Net realized gains: Class A | | | (9,356,181 | ) | | | (6,623,008 | ) |
| Class B | | | (145,558 | ) | | | (104,904 | ) |
| Total distributions | | | (10,391,234 | ) | | | (7,583,952 | ) |
Fund share transactions: Class A Proceeds from shares sold | | | 3,384,027 | | | | 3,854,918 | |
| Reinvestment of distributions | | | 10,237,339 | | | | 7,470,856 | |
| Payments for shares redeemed | | | (10,445,518 | ) | | | (21,145,077 | ) |
| Net increase (decrease) in net assets from Class A share transactions | | | 3,175,848 | | | | (9,819,303 | ) |
Class B Proceeds from shares sold | | | 154,180 | | | | 79,415 | |
| Reinvestment of distributions | | | 153,895 | | | | 113,096 | |
| Payments for redeemed | | | (208,247 | ) | | | (365,396 | ) |
| Net increase (decrease) in net assets from Class B share transactions | | | 99,828 | | | | (172,885 | ) |
| Increase (decrease) in net assets | | | 7,975,663 | | | | 482,254 | |
| Net assets at beginning of period | | | 125,530,866 | | | | 125,048,612 | |
| Net assets at end of period (including undistributed net investment income of $279,453 and $838,969, respectively) | | $ | 133,506,529 | | | $ | 125,530,866 | |
| Other Information | |
Class A Shares outstanding at beginning of period | | | 8,977,791 | | | | 9,718,286 | |
| Shares sold | | | 231,269 | | | | 294,057 | |
| Shares issued to shareholders in reinvestment of distributions | | | 718,410 | | | | 561,297 | |
| Shares redeemed | | | (705,593 | ) | | | (1,595,849 | ) |
| Net increase (decrease) in Class A shares | | | 244,086 | | | | (740,495 | ) |
| Shares outstanding at end of period | | | 9,221,877 | | | | 8,977,791 | |
Class B Shares outstanding at beginning of period | | | 136,607 | | | | 150,330 | |
| Shares sold | | | 10,576 | | | | 6,256 | |
| Shares issued to shareholders in reinvestment of distributions | | | 11,000 | | | | 8,640 | |
| Shares redeemed | | | (14,444 | ) | | | (28,619 | ) |
| Net increase (decrease) in Class B shares | | | 7,132 | | | | (13,723 | ) |
| Shares outstanding at end of period | | | 143,739 | | | | 136,607 | |
The accompanying notes are an integral part of the financial statements.
| | | | | | Years Ended December 31, | |
| Class A | | Six Months Ended 6/30/13 (Unaudited) | | | 2012 | | | 2011 | | | 2010 | | | 2009 | | | 2008 | |
| Selected Per Share Data | |
| Net asset value, beginning of period | | $ | 13.78 | | | $ | 12.67 | | | $ | 14.28 | | | $ | 11.32 | | | $ | 7.79 | | | $ | 18.28 | |
Income (loss) from investment operations: Net investment income (loss)a | | | .04 | | | | .09 | | | | .08 | | | | .05 | | | | .04 | | | | .20 | c |
| Net realized and unrealized gain (loss) | | | 1.61 | | | | 1.83 | | | | (1.45 | ) | | | 2.96 | | | | 3.64 | | | | (8.18 | ) |
| Total from investment operations | | | 1.65 | | | | 1.92 | | | | (1.37 | ) | | | 3.01 | | | | 3.68 | | | | (7.98 | ) |
Less distributions from: Net investment income | | | (.10 | ) | | | (.09 | ) | | | (.24 | ) | | | (.05 | ) | | | (.15 | ) | | | (.04 | ) |
| Net realized gains | | | (1.07 | ) | | | (.72 | ) | | | — | | | | — | | | | — | | | | (2.47 | ) |
| Total distributions | | | (1.17 | ) | | | (.81 | ) | | | (.24 | ) | | | (.05 | ) | | | (.15 | ) | | | (2.51 | ) |
| Net asset value, end of period | | $ | 14.26 | | | $ | 13.78 | | | $ | 12.67 | | | $ | 14.28 | | | $ | 11.32 | | | $ | 7.79 | |
Total Return (%)b | | | 11.99 | ** | | | 15.37 | | | | (9.90 | ) | | | 26.64 | | | | 48.20 | | | | (49.96 | ) |
| Ratios to Average Net Assets and Supplemental Data | |
| Net assets, end of period ($ millions) | | | 131 | | | | 124 | | | | 123 | | | | 158 | | | | 139 | | | | 117 | |
| Ratio of expenses before expense reductions (%) | | | 1.13 | * | | | 1.11 | | | | 1.12 | | | | 1.12 | | | | 1.11 | | | | 1.11 | |
| Ratio of expenses after expense reductions (%) | | | .94 | * | | | .98 | | | | 1.00 | | | | 1.04 | | | | .99 | | | | .99 | |
| Ratio of net investment income (loss) (%) | | | .49 | * | | | .69 | | | | .57 | | | | .42 | | | | .47 | | | | 1.53 | c |
| Portfolio turnover rate (%) | | | 19 | ** | | | 36 | | | | 31 | | | | 39 | | | | 53 | | | | 21 | |
a Based on average shares outstanding during the period. b Total return would have been lower had certain expenses not been reduced. c Net investment income per share and the ratio of net investment income include non-recurring dividend income amounting to $0.05 per share and 0.37% of average daily net assets for the year ended December 31, 2008. * Annualized ** Not annualized | |
| | | | | | Years Ended December 31, | |
| Class B | | Six Months Ended 6/30/13 (Unaudited) | | | 2012 | | | 2011 | | | 2010 | | | 2009 | | | 2008 | |
| Selected Per Share Data | |
| Net asset value, beginning of period | | $ | 13.52 | | | $ | 12.45 | | | $ | 14.03 | | | $ | 11.11 | | | $ | 7.65 | | | $ | 18.03 | |
Income (loss) from investment operations: Net investment income (loss)a | | | .03 | | | | .06 | | | | .05 | | | | .03 | | | | .02 | | | | .16 | c |
| Net realized and unrealized gain (loss) | | | 1.58 | | | | 1.79 | | | | (1.43 | ) | | | 2.90 | | | | 3.57 | | | | (8.07 | ) |
| Total from investment operations | | | 1.61 | | | | 1.85 | | | | (1.38 | ) | | | 2.93 | | | | 3.59 | | | | (7.91 | ) |
Less distributions from: Net investment income | | | (.06 | ) | | | (.06 | ) | | | (.20 | ) | | | (.01 | ) | | | (.13 | ) | | | — | |
| Net realized gains | | | (1.07 | ) | | | (.72 | ) | | | — | | | | — | | | | — | | | | (2.47 | ) |
| Total distributions | | | (1.13 | ) | | | (.78 | ) | | | (.20 | ) | | | (.01 | ) | | | (.13 | ) | | | (2.47 | ) |
| Net asset value, end of period | | $ | 14.00 | | | $ | 13.52 | | | $ | 12.45 | | | $ | 14.03 | | | $ | 11.11 | | | $ | 7.65 | |
Total Return (%)b | | | 11.93 | ** | | | 15.01 | | | | (10.08 | ) | | | 26.38 | | | | 47.66 | | | | (50.16 | ) |
| Ratios to Average Net Assets and Supplemental Data | |
| Net assets, end of period ($ millions) | | | 2 | | | | 2 | | | | 2 | | | | 2 | | | | 7 | | | | 5 | |
| Ratio of expenses before expense reductions (%) | | | 1.33 | * | | | 1.43 | | | | 1.38 | | | | 1.34 | | | | 1.42 | | | | 1.42 | |
| Ratio of expenses after expense reductions (%) | | | 1.14 | * | | | 1.23 | | | | 1.25 | | | | 1.26 | | | | 1.30 | | | | 1.30 | |
| Ratio of net investment income (loss) (%) | | | .30 | * | | | .44 | | | | .32 | | | | .20 | | | | .16 | | | | 1.21 | c |
| Portfolio turnover rate (%) | | | 19 | ** | | | 36 | | | | 31 | | | | 39 | | | | 53 | | | | 21 | |
a Based on average shares outstanding during the period. b Total return would have been lower had certain expenses not been reduced. c Net investment income per share and the ratio of net investment income include non-recurring dividend income amounting to $0.05 per share and 0.37% of average daily net assets for the year ended December 31, 2008. * Annualized ** Not annualized | |
Notes to Financial Statements (Unaudited)
A. Organization and Significant Accounting Policies
DWS Variable Series I (the "Series") is registered under the Investment Company Act of 1940, as amended (the "1940 Act"), as an open-end, registered management investment company organized as a Massachusetts business trust. The Series consists of five diversified funds: DWS Bond VIP, DWS Core Equity VIP, DWS Capital Growth VIP, DWS Global Small Cap Growth VIP and DWS International VIP (individually or collectively hereinafter referred to as a "Fund" or the "Funds"). These financial statements report on DWS Global Small Cap Growth VIP. The Series is intended to be the underlying investment vehicle for variable annuity contracts and variable life insurance policies to be offered by the separate accounts of certain life insurance companies ("Participating Insurance Companies").
Multiple Classes of Shares of Beneficial Interest. The Fund offers two classes of shares (Class A shares and Class B shares). Class B shares are subject to Rule 12b-1 distribution fees under the 1940 Act and recordkeeping fees equal to an annual rate of 0.25% and up to 0.15%, respectively, of the average daily net assets of the Class B shares of the Fund. Class A shares are not subject to such fees.
Investment income, realized and unrealized gains and losses, and certain fund-level expenses and expense reductions, if any, are borne pro rata on the basis of relative net assets by the holders of all classes of shares, except that each class bears certain expenses unique to that class (including the applicable 12b-1 distribution fees). Differences in class-level expenses may result in payment of different per share dividends by class. All shares have equal rights with respect to voting subject to class-specific arrangements.
The Fund's financial statements are prepared in accordance with accounting principles generally accepted in the United States of America, which require the use of management estimates. Actual results could differ from those estimates. The policies described below are followed consistently by the Fund in the preparation of its financial statements.
Security Valuation. Investments are stated at value determined as of the close of regular trading on the New York Stock Exchange on each day the exchange is open for trading.
Various inputs are used in determining the value of the Fund's investments. These inputs are summarized in three broad levels. Level 1 includes quoted prices in active markets for identical securities. Level 2 includes other significant observable inputs (including quoted prices for similar securities, interest rates, prepayment speeds, and credit risk). Level 3 includes significant unobservable inputs (including the Fund's own assumptions in determining the fair value of investments). The inputs or methodology used for valuing securities are not necessarily an indication of the risk associated with investing in those securities.
Equity securities are valued at the most recent sale price or official closing price reported on the exchange (U.S. or foreign) or over-the-counter market on which they trade and are categorized as Level 1 securities. Securities for which no sales are reported are valued at the calculated mean between the most recent bid and asked quotations on the relevant market or, if a mean cannot be determined, at the most recent bid quotation. For certain international equity securities, in order to adjust for events which may occur between the close of the foreign exchanges and the close of the New York Stock Exchange, a fair valuation model may be used. This fair valuation model takes into account comparisons to the valuation of American Depository Receipts (ADRs), exchange-traded funds, futures contracts and certain indices and these securities are categorized as Level 2.
Investments in open-end investment companies are valued at their net asset value each business day and are categorized as Level 1.
Securities and other assets for which market quotations are not readily available or for which the above valuation procedures are deemed not to reflect fair value are valued in a manner that is intended to reflect their fair value as determined in accordance with procedures approved by the Trustees and are generally categorized as Level 3. In accordance with the Fund's valuation procedures, factors used in determining value may include, but are not limited to, the type of the security; the size of the holding; the initial cost of the security; the existence of any contractual restrictions on the security's disposition; the price and extent of public trading in similar securities of the issuer or of comparable companies; quotations or evaluated prices from broker-dealers and/or pricing services; information obtained from the issuer, analysts, and/or the appropriate stock exchange (for exchange-traded securities); an analysis of the company's or issuer's financial statements; an evaluation of the forces that influence the issuer and the market(s) in which the security is purchased and sold and with respect to debt securities; the maturity, coupon, creditworthiness, currency denomination and the movement of the market in which the security is normally traded. The value determined under these procedures may differ from published values for the same securities.
Disclosure about the classification of fair value measurements is included in a table following the Fund's Investment Portfolio.
Securities Lending. Deutsche Bank AG, as lending agent, lends securities of the Fund to certain financial institutions under the terms of the Security Lending Agreement. The Fund retains the benefits of owning the securities it has loaned and continues to receive interest and dividends generated by the securities and to participate in any changes in their market value. The Fund requires the borrowers of the securities to maintain collateral with the Fund consisting of either cash or liquid, unencumbered assets having a value at least equal to the value of the securities loaned. When the collateral falls below specified amounts, the lending agent will use its best effort to obtain additional collateral on the next business day to meet required amounts under the security lending agreement. The Fund may invest the cash collateral into a joint trading account in an affiliated money market fund pursuant to Exemptive Orders issued by the SEC. The Fund receives compensation for lending its securities either in the form of fees or by earning interest on invested cash collateral net of borrower rebates and fees paid to a lending agent. Either the Fund or the borrower may terminate the loan. There may be risks of delay and costs in recovery of securities or even loss of rights in the collateral should the borrower of the securities fail financially. If the Fund is not able to recover securities lent, the Fund may sell the collateral and purchase a replacement investment in the market, incurring the risk that the value of the replacement security is greater than the value of the collateral. The Fund is also subject to all investment risks associated with the reinvestment of any cash collateral received, including, but not limited to, interest rate, credit and liquidity risk associated with such investments.
As of June 30, 2013, the Fund had securities on loan with a gross value of $11,906,419. The value of the related collateral, $12,312,833, exceeded the value of the securities loaned at period end.
Foreign Currency Translations. The books and records of the Fund are maintained in U.S. dollars. Investment securities and other assets and liabilities denominated in a foreign currency are translated into U.S. dollars at the prevailing exchange rates at period end. Purchases and sales of investment securities, income and expenses are translated into U.S. dollars at the prevailing exchange rates on the respective dates of the transactions.
Net realized and unrealized gains and losses on foreign currency transactions represent net gains and losses between trade and settlement dates on securities transactions, the acquisition and disposition of foreign currencies, and the difference between the amount of net investment income accrued and the U.S. dollar amount actually received. That portion of both realized and unrealized gains and losses on investments that results from fluctuations in foreign currency exchange rates is not separately disclosed but is included with net realized and unrealized gain/appreciation and loss/depreciation on investments.
Taxes. The Fund is treated as a separate taxpayer as provided for in the Internal Revenue Code, as amended. It is the Fund's policy to comply with the requirements of the Internal Revenue Code, as amended, which are applicable to regulated investment companies, and to distribute all of its taxable income to the separate accounts of the Participating Insurance Companies which hold its shares.
Additionally, the Fund may be subject to taxes imposed by the governments of countries in which it invests and are generally based on income and/or capital gains earned or repatriated. Estimated tax liabilities on certain foreign securities are recorded on an accrual basis and are reflected as components of interest income or net change in unrealized gain/loss on investments. Tax liabilities realized as a result of security sales are reflected as a component of net realized gain/loss on investments.
The Fund has reviewed the tax positions for the open tax years as of December 31, 2012 and has determined that no provision for income tax is required in the Fund's financial statements. The Fund's federal tax returns for the prior three fiscal years remain open subject to examination by the Internal Revenue Service.
Distribution of Income and Gains. Distributions from net investment income of the Fund, if any, are declared and distributed to shareholders annually. Net realized gains from investment transactions, in excess of available capital loss carryforwards, would be taxable to the Fund if not distributed, and, therefore, will be distributed to shareholders at least annually. The Fund may also make additional distributions for tax purposes if necessary.
The timing and characterization of certain income and capital gain distributions are determined annually in accordance with federal tax regulations which may differ from accounting principles generally accepted in the United States of America. These differences primarily relate to certain securities sold at a loss. As a result, net investment income (loss) and net realized gain (loss) on investment transactions for a reporting period may differ significantly from distributions during such period. Accordingly, the Fund may periodically make reclassifications among certain of its capital accounts without impacting the net asset value of the Fund.
The tax character of current year distributions will be determined at the end of the current fiscal year.
Expenses. Expenses of the Series arising in connection with a specific Fund are allocated to that Fund. Other Series expenses which cannot be directly attributed to a Fund are apportioned among the Funds in the Series based upon the relative net assets or other appropriate measures.
Contingencies. In the normal course of business, the Fund may enter into contracts with service providers that contain general indemnification clauses. The Fund's maximum exposure under these arrangements is unknown as this would involve future claims that may be made against the Fund that have not yet been made. However, based on experience, the Fund expects the risk of loss to be remote.
Other. Investment transactions are accounted for on a trade date plus one basis for daily net asset value calculations. However, for financial reporting purposes, investment transactions are reported on trade date. Interest income is recorded on the accrual basis net of foreign withholding taxes. Dividend income is recorded on the ex-dividend date net of foreign withholding taxes. Certain dividends from foreign securities may be recorded subsequent to the ex-dividend date as soon as the Fund is informed of such dividends. Realized gains and losses from investment transactions are recorded on an identified cost basis and may include proceeds from litigation.
B. Purchases and Sales of Securities
During the six months ended June 30, 2013, purchases and sales of investment securities (excluding short-term investments) aggregated $25,596,576 and $34,678,044, respectively.
C. Related Parties
Management Agreement. Under the Investment Management Agreement with Deutsche Investment Management Americas Inc. ("DIMA" or the "Advisor"), an indirect, wholly owned subsidiary of Deutsche Bank AG, the Advisor directs the investments of the Fund in accordance with its investment objectives, policies and restrictions. The Advisor determines the securities, instruments and other contracts relating to investments to be purchased, sold or entered into by the Fund.
Pursuant to the Investment Management Agreement with the Advisor, the Fund pays a monthly management fee based on the Fund's average daily net assets, computed and accrued daily and payable monthly, at the following annual rates:
| First $500 million of average daily net assets | | | .890 | % |
| Next $500 million of average daily net assets | | | .875 | % |
| Next $1 billion of average daily net assets | | | .860 | % |
| Over $2 billion of average daily net assets | | | .845 | % |
For the period from January 1, 2013 through April 30, 2014, the Advisor has contractually agreed to waive all or a portion of its fees and/or reimburse certain operating expenses of the Fund to the extent necessary to maintain the operating expenses (excluding certain expenses such as extraordinary expenses, taxes, brokerage and interest) of each class as follows:
Accordingly, for the six months ended June 30, 2013, the Advisor waived a portion of its management fee pursuant to the Investment Management Agreement aggregating $126,136, and the amount charged aggregated $472,504, which was equivalent to an annualized effective rate of 0.70% of the Fund's average daily net assets.
Administration Fee. Pursuant to an Administrative Services Agreement, DIMA provides most administrative services to the Fund. For all services provided under the Administrative Services Agreement, the Fund pays the Advisor an annual fee ("Administration Fee") of 0.10% of the Fund's average daily net assets, computed and accrued daily and payable monthly. For the six months ended June 30, 2013, the Administration Fee was $67,263, of which $11,211 is unpaid.
Service Provider Fees. DWS Investments Service Company ("DISC"), an affiliate of the Advisor, is the transfer agent, dividend-paying agent and shareholder service agent for the Fund. Pursuant to a sub-transfer agency agreement between DISC and DST Systems, Inc. ("DST"), DISC has delegated certain transfer agent, dividend-paying agent and shareholder service agent functions to DST. DISC compensates DST out of the shareholder servicing fee it receives from the Fund. For the six months ended June 30, 2013, the amounts charged to the Fund by DISC were as follows:
| Services to Shareholders | | Total Aggregated | | | Waived | | | Unpaid | |
| Class A | | $ | 214 | | | $ | 214 | | | $ | — | |
| Class B | | | 71 | | | | — | | | | 71 | |
| | | $ | 285 | | | $ | 214 | | | $ | 71 | |
Distribution Service Agreement. DWS Investments Distributors, Inc. ("DIDI"), also an affiliate of the Advisor, is the Series' Distributor. In accordance with the Master Distribution Plan, DIDI receives 12b-1 fees of 0.25% of average daily net assets of Class B shares. Pursuant to the Master Distribution Plan, DIDI remits these fees to the Participating Insurance Companies for various costs incurred or paid by these companies in connection with marketing and distribution of Class B shares. For the six months ended June 30, 2013, the Distribution Service Fee aggregated $2,496, of which $426 is unpaid.
Typesetting and Filing Service Fees. Under an agreement with DIMA, DIMA is compensated for providing typesetting and certain regulatory filing services to the Fund. For the six months ended June 30, 2013, the amount charged to the Fund by DIMA included in the Statement of Operations under "reports to shareholders" aggregated $7,784, all of which is unpaid.
Trustees' Fees and Expenses. The Fund paid retainer fees to each Trustee not affiliated with the Advisor, plus specified amounts to the Board Chairperson and Vice Chairperson and to each committee Chairperson.
Affiliated Cash Management Vehicles. The Fund may invest uninvested cash balances in Central Cash Management Fund and DWS Variable NAV Money Fund, affiliated money market funds which are managed by the Advisor. Each affiliated money market fund seeks to provide a high level of current income consistent with liquidity and the preservation of capital. Each affiliated money market fund is managed in accordance with Rule 2a-7 under the Investment Company Act of 1940, which governs the quality, maturity, diversity and liquidity of instruments in which a money market fund may invest. Central Cash Management Fund seeks to maintain a stable net asset value, and DWS Variable NAV Money Fund maintains a floating net asset value. The Fund indirectly bears its proportionate share of the expenses of each affiliated money market fund in which it invests. Central Cash Management Fund does not pay the Advisor an investment management fee. To the extent that DWS Variable NAV Money Fund pays an investment management fee to the Advisor, the Advisor will waive an amount of the investment management fee payable to the Advisor by the Fund equal to the amount of the investment management fee payable on the Fund's assets invested in DWS Variable NAV Money Fund.
Securities Lending Agent Fees. Deutsche Bank AG serves as securities lending agent for the Fund. For the six months ended June 30, 2013, the Fund incurred securities lending agent fees to Deutsche Bank AG in the amount of $4,661.
D. Ownership of the Fund
Three participating insurance companies were owners of record of 10% or more of the total outstanding Class A shares of the Fund, each owning 50%, 16% and 10%.
E. Line of Credit
The Fund and other affiliated funds (the "Participants") share in a $375 million revolving credit facility provided by a syndication of banks. The Fund may borrow for temporary or emergency purposes, including the meeting of redemption requests that otherwise might require the untimely disposition of securities. The Participants are charged an annual commitment fee which is allocated based on net assets, among each of the Participants. Interest is calculated at a rate per annum equal to the sum of the Federal Funds Rate plus 1.25 percent plus if LIBOR exceeds the Federal Funds Rate the amount of such excess. The Fund may borrow up to a maximum of 33 percent of its net assets under the agreement. The Fund had no outstanding loans at June 30, 2013.
Information About Your Fund's Expenses (Unaudited)
As an investor of the Fund, you incur two types of costs: ongoing expenses and transaction costs. Ongoing expenses include management fees, distribution and service (12b-1) fees and other Fund expenses. Examples of transaction costs include contract charges, redemption fees and account maintenance fees, which are not shown in this section. The following tables are intended to help you understand your ongoing expenses (in dollars) of investing in the Fund and to help you compare these expenses with the ongoing expenses of investing in other mutual funds. In the most recent six-month period, the Fund limited these expenses; had it not done so, expenses would have been higher. The example in the table is based on an investment of $1,000 invested at the beginning of the six-month period and held for the entire period (January 1, 2013 to June 30, 2013).
The tables illustrate your Fund's expenses in two ways:
•Actual Fund Return. This helps you estimate the actual dollar amount of ongoing expenses (but not transaction costs) paid on a $1,000 investment in the Fund using the Fund's actual return during the period. To estimate the expenses you paid over the period, simply divide your account value by $1,000 (for example, an $8,600 account value divided by $1,000 = 8.6), then multiply the result by the number in the "Expenses Paid per $1,000" line under the share class you hold.
• Hypothetical 5% Fund Return. This helps you to compare your Fund's ongoing expenses (but not transaction costs) with those of other mutual funds using the Fund's actual expense ratio and a hypothetical rate of return of 5% per year before expenses. Examples using a 5% hypothetical Fund return may be found in the shareholder reports of other mutual funds. The hypothetical account values and expenses may not be used to estimate the actual ending account balance or expenses you paid for the period.
Please note that the expenses shown in these tables are meant to highlight your ongoing expenses only and do not reflect any transaction costs. The "Expenses Paid per $1,000" line of the tables is useful in comparing ongoing expenses only and will not help you determine the relative total expense of owning different funds. If these transaction costs had been included, your costs would have been higher.
Expenses and Value of a $1,000 Investment for the six months ended June 30, 2013 | |
| Actual Fund Return | | Class A | | | Class B | |
| Beginning Account Value 1/1/13 | | $ | 1,000.00 | | | $ | 1,000.00 | |
| Ending Account Value 6/30/13 | | $ | 1,119.90 | | | $ | 1,119.30 | |
| Expenses Paid per $1,000* | | $ | 4.94 | | | $ | 5.99 | |
| Hypothetical 5% Fund Return | | Class A | | | Class B | |
| Beginning Account Value 1/1/13 | | $ | 1,000.00 | | | $ | 1,000.00 | |
| Ending Account Value 6/30/13 | | $ | 1,020.13 | | | $ | 1,019.14 | |
| Expenses Paid per $1,000* | | $ | 4.71 | | | $ | 5.71 | |
* Expenses are equal to the Fund's annualized expense ratio for each share class, multiplied by the average account value over the period, multiplied by 181 (the number of days in the most recent six-month period), then divided by 365.
| Annualized Expense Ratios | Class A | | Class B | |
| DWS Variable Series I — DWS Global Small Cap Growth VIP | .94% | | 1.14% | |
For more information, please refer to the Fund's prospectus.
These tables do not reflect charges and fees ("contract charges") associated with the separate account that invests in the Fund or any variable life insurance policy or variable annuity contract for which the Fund is an investment option.
For an analysis of the fees associated with an investment in the Fund or similar funds, please refer to http://apps.finra.org/fundanalyzer/1/fa.aspx.
The Series' policies and procedures for voting proxies for portfolio securities and information about how the Series voted proxies related to its portfolio securities during the 12-month period ended June 30 are available on our Web site — www.dws-investments.com (click on "proxy voting"at the bottom of the page) — or on the SEC's Web site — www.sec.gov. To obtain a written copy of the Series' policies and procedures without charge, upon request, call us toll free at (800) 728-3337.
Summary of Management Fee Evaluation by Independent Fee Consultant
September 17, 2012
Pursuant to an Order entered into by Deutsche Investment Management Americas and affiliates (collectively, "DeAM") with the Attorney General of New York, I, Thomas H. Mack, have been appointed the Independent Fee Consultant for the DWS Funds (formerly the DWS Scudder Funds). My duties include preparing an annual written evaluation of the management fees DeAM charges the Funds, considering among other factors the management fees charged by other mutual fund companies for like services, management fees DeAM charges other clients for like services, DeAM's costs of supplying services under the management agreements and related profit margins, possible economies of scale if a Fund grows larger, and the nature and quality of DeAM's services, including fund performance. This report summarizes my evaluation for 2012, including my qualifications, the evaluation process for each of the DWS Funds, consideration of certain complex-level factors, and my conclusions. I served in substantially the same capacity in 2007, 2008, 2009, 2010 and 2011.
Qualifications
For more than 35 years I have served in various professional capacities within the investment management business. I have held investment analysis and advisory positions, including securities analyst, portfolio strategist and director of investment policy with a large investment firm. I have also performed business management functions, including business development, financial management and marketing research and analysis.
Since 1991, I have been an independent consultant within the asset management industry. I have provided services to over 125 client organizations, including investment managers, mutual fund boards, product distributors and related organizations. Over the past ten years I have completed a number of assignments for mutual fund boards, specifically including assisting boards with management contract renewal.
I hold a Master of Business Administration degree, with highest honors, from Harvard University and Master of Science and Bachelor of Science (highest honors) degrees from the University of California at Berkeley. I am an independent director and audit committee financial expert for two closed-end mutual funds and have served in various leadership and financial oversight capacities with non-profit organizations.
Evaluation of Fees for each DWS Fund
My work focused primarily on evaluating, fund-by-fund, the fees charged to each of the 103 mutual fund portfolios in the DWS Fund family. For each Fund, I considered each of the key factors mentioned above, as well as any other relevant information. In doing so I worked closely with the Funds' Independent Directors in their annual contract renewal process, as well as in their approval of contracts for several new funds (documented separately).
In evaluating each Fund's fees, I reviewed comprehensive materials provided by or on behalf of DeAM, including expense information prepared by Lipper Analytical, comparative performance information, profitability data, manager histories, and other materials. I also accessed certain additional information from the Lipper and Morningstar databases and drew on my industry knowledge and experience.
To facilitate evaluating this considerable body of information, I prepared for each Fund a document summarizing the key data elements in each area as well as additional analytics discussed below. This made it possible to consider each key data element in the context of the others.
In the course of contract renewal, DeAM agreed to implement a number of fee and expense adjustments requested by the Independent Directors which will favorably impact future fees and expenses, and my evaluation includes the effects of these changes.
Fees and Expenses Compared with Other Funds
The competitive fee and expense evaluation for each fund focused on two primary comparisons:
The Fund's contractual management fee (the advisory fee plus the administration fee where applicable) compared with those of a group of typically 12-15 funds in the same Lipper investment category (e.g. Large Capitalization Growth) having similar distribution arrangements and being of similar size.
The Fund's total expenses compared with a broader universe of funds from the same Lipper investment category and having similar distribution arrangements.
These two comparisons provide a view of not only the level of the fee compared with funds of similar scale but also the total expense the Fund bears for all the services it receives, in comparison with the investment choices available in the Fund's investment category and distribution channel. The principal figure-of-merit used in these comparisons was the subject Fund's percentile ranking against peers.
DeAM's Fees for Similar Services to Others
DeAM provided management fee schedules for all of its US domiciled fund and non-fund investment management accounts in any of the investment categories where there is a DWS Fund. These similar products included the other DWS Funds, non-fund pooled accounts, institutional accounts and sub-advisory accounts. Using this information, I calculated for each Fund the fee that would be charged to each similar product, at the subject Fund's asset level.
Evaluating information regarding non-fund products is difficult because there are varying levels of services required for different types of accounts, with mutual funds generally requiring considerably more regulatory and administrative types of service as well as having more frequent cash flows than other types of accounts. Also, while mutual fund fees for similar fund products can be expected to be similar, there will be some differences due to different pricing conditions in different distribution channels (e.g. retail funds versus those used in variable insurance products), differences in underlying investment processes and other factors.
Costs and Profit Margins
DeAM provided a detailed profitability analysis for each Fund. After making some adjustments so that the presentation would be more comparable to the available industry figures, I reviewed profit margins from investment management alone, from investment management plus other fund services (excluding distribution) provided to the Funds by DeAM (principally shareholder services), and DeAM profits from all sources, including distribution. A later section comments on overall profitability.
Economies of Scale
Economies of scale — an expected decline in management cost per dollar of fund assets as fund assets grow — are very rarely quantified and documented because of inherent difficulties in collecting and analyzing relevant data. However, in virtually every investment category that I reviewed, larger funds tend to have lower fees and lower total expenses than smaller funds. To see how each DWS Fund compares with this industry observation, I reviewed:
The trend in Fund assets over the last five years and the accompanying trend in total expenses. This shows if the Fund has grown and, if so, whether total expense (management fees as well as other expenses) have declined as a percent of assets.
Whether the Fund has break-points in its management fee schedule, the extent of the fee reduction built into the schedule and the asset levels where the breaks take effect, and in the case of a sub-advised Fund how the Fund's break-points compare with those of the sub-advisory fee schedule.
How the Fund's contractual fee schedule compares with trends in the industry data. To accomplish this, I constructed a chart showing how actual latest-fiscal-year contractual fees of the Fund and of other similar funds relate to average fund assets, with the subject Fund's contractual fee schedule superimposed.
Quality of Service — Performance
The quality-of-service evaluation focused on investment performance, which is the principal result of the investment management service. Each Fund's performance was reviewed over the past 1, 3, 5 and 10 years, as applicable, and compared with that of other funds in the same investment category and with a suitable market index.
In addition, I calculated and reviewed risk-adjusted returns relative to an index of similar mutual funds' returns and a suitable market index. The risk-adjusted returns analysis provides a way of determining the extent to which the Fund's return comparisons are mainly the product of investment value-added (or lack thereof) or alternatively taking considerably more or less risk than is typical in its investment category.
I also received and considered the history of portfolio manager changes for each Fund, as this provided an important context for evaluating the performance results.
Complex-Level Considerations
While this evaluation was conducted mainly at the individual fund level, there are some issues relating to the reasonableness of fees that can alternatively be considered across the whole fund complex:
I reviewed DeAM's profitability analysis for all DWS Funds, with a view toward determining if the allocation procedures used were reasonable and how profit levels compared with public data for other investment managers.
I considered whether DeAM and affiliates receive any significant ancillary or "fallout" benefits that should be considered in interpreting the direct profitability results. These would be situations where serving as the investment manager of the Funds is beneficial to another part of the Deutsche Bank organization.
I considered how aggregated DWS Fund expenses had varied over the years, by asset class and in the context of trends in asset levels.
I considered how aggregated DWS Fund performance measures relative to appropriate peers had varied by asset class and over time.
I reviewed the structure of the DeAM organization, trends in staffing levels, and information on compensation of investment management and other professionals compared with industry data.
Findings
Based on the process and analysis discussed above, which included reviewing a wide range of information from management and external data sources and considering among other factors the fees DeAM charges other clients, the fees charged by other fund managers, DeAM's costs and profits associated with managing the Funds, economies of scale, possible fall-out benefits, and the nature and quality of services provided, in my opinion the management fees charged the DWS Funds are reasonable.
Thomas H. Mack
President, Thomas H. Mack & Co., Inc.
Notes
DWS Investments Distributors, Inc.
222 South Riverside Plaza
Chicago, IL 60606
(800) 621-1148
VS1gloscg-3 (R-028377-2 8/13)
JUNE 30, 2013
SEMIANNUAL REPORT
DWS VARIABLE SERIES I
DWS International VIP
Contents
8 Statement of Assets and Liabilities 9 Statement of Operations 10 Statement of Changes in Net Assets 14 Notes to Financial Statements 19 Information About Your Fund's Expenses 21 Summary of Management Fee Evaluation by Independent Fee Consultant |
This report must be preceded or accompanied by a prospectus. To obtain an additional prospectus or summary prospectus, if available, call (800) 728-3337 or your financial representative. We advise you to consider the Fund's objectives, risks, charges and expenses carefully before investing. The summary prospectus and prospectus contain this and other important information about the Fund. Please read the prospectus carefully before you invest.
Investing in derivatives entails special risks relating to liquidity, leverage and credit that may reduce returns and/or increase volatility. Investing in foreign securities, particularly those of emerging markets, presents certain risks, such as currency fluctuations, political and economic changes, and market risks. The Fund may lend securities to approved institutions. Stocks may decline in value. See the prospectus for details.
DWS Investments is part of the Deutsche Asset & Wealth Management division of Deutsche Bank AG.
NOT FDIC/NCUA INSURED NO BANK GUARANTEE MAY LOSE VALUE NOT A DEPOSIT
NOT INSURED BY ANY FEDERAL GOVERNMENT AGENCY
Performance Summary June 30, 2013 (Unaudited)
Fund performance shown is historical, assumes reinvestment of all dividend and capital gain distributions, and does not guarantee future results. Investment return and principal value fluctuate with changing market conditions so that, when redeemed, shares may be worth more or less than their original cost. Current performance may be lower or higher than the performance data quoted. Please contact your participating insurance company for the Fund's most recent month-end performance. Performance doesn't reflect charges and fees ("contract charges") associated with the separate account that invests in the Fund or any variable life insurance policy or variable annuity contract for which the Fund is an investment option. These charges and fees will reduce returns. While all share classes have the same underlying portfolio, their performance will differ.
The gross expense ratios of the Fund, as stated in the fee table of the prospectus dated May 1, 2013 are 0.98% and 1.26% for Class A and Class B shares, respectively, and may differ from the expense ratios disclosed in the Financial Highlights tables in this report.
| Growth of an Assumed $10,000 Investment |
| MSCI EAFE Index is an unmanaged index that tracks international stock performance in the 22 developed markets of Europe, Australasia and the Far East. Returns reflect reinvestment of dividends net of withholding taxes. The index is calculated using closing local market prices and translates into U.S. dollars using the London close foreign exchange rates. Index returns do not reflect any fees or expenses and it is not possible to invest directly into an index. |
| |
| Yearly periods ended June 30 | |
| Comparative Results | |
| DWS International VIP | | 6-Month‡ | | | 1-Year | | | 3-Year | | | 5-Year | | | 10-Year | |
| Class A | Growth of $10,000 | | $ | 10,284 | | | $ | 11,779 | | | $ | 12,498 | | | $ | 7,804 | | | $ | 17,160 | |
| Average annual total return | | | 2.84 | % | | | 17.79 | % | | | 7.72 | % | | | -4.84 | % | | | 5.55 | % |
MSCI EAFE® Index | Growth of $10,000 | | $ | 10,410 | | | $ | 11,862 | | | $ | 13,325 | | | $ | 9,688 | | | $ | 20,941 | |
| Average annual total return | | | 4.10 | % | | | 18.62 | % | | | 10.04 | % | | | -0.63 | % | | | 7.67 | % |
| DWS International VIP | | 6-Month‡ | | | 1-Year | | | 3-Year | | | 5-Year | | | 10-Year | |
| Class B | Growth of $10,000 | | $ | 10,281 | | | $ | 11,758 | | | $ | 12,407 | | | $ | 7,712 | | | $ | 16,683 | |
| Average annual total return | | | 2.81 | % | | | 17.58 | % | | | 7.45 | % | | | -5.06 | % | | | 5.25 | % |
MSCI EAFE® Index | Growth of $10,000 | | $ | 10,410 | | | $ | 11,862 | | | $ | 13,325 | | | $ | 9,688 | | | $ | 20,941 | |
| Average annual total return | | | 4.10 | % | | | 18.62 | % | | | 10.04 | % | | | -0.63 | % | | | 7.67 | % |
The growth of $10,000 is cumulative.
‡ Total returns shown for periods less than one year are not annualized.
Portfolio Summary (Unaudited)
Asset Allocation (As a % of Investment Portfolio excluding Securities Lending Collateral) | 6/30/13 | 12/31/12 |
| | | |
| Common Stocks | 97% | 100% |
| Cash Equivalents | 3% | 0% |
| Preferred Stocks | 0% | — |
| | 100% | 100% |
Geographical Diversification
(As a % of Investment Portfolio excluding Cash Equivalents and Securities Lending Collateral) | 6/30/13 | 12/31/12 |
| | | |
| Continental Europe | 53% | 50% |
| Japan | 23% | 24% |
| United Kingdom | 14% | 13% |
| Asia (excluding Japan) | 5% | 6% |
| Australia | 4% | 6% |
| Other | 1% | 1% |
| | 100% | 100% |
Sector Diversification (As a % of Investment Portfolio excluding Cash Equivalents and Securities Lending Collateral) | 6/30/13 | 12/31/12 |
| | | |
| Financials | 23% | 27% |
| Industrials | 16% | 21% |
| Consumer Discretionary | 12% | 11% |
| Telecommunication Services | 9% | 10% |
| Materials | 8% | 6% |
| Consumer Staples | 8% | 2% |
| Utilities | 8% | 12% |
| Health Care | 7% | 0% |
| Information Technology | 6% | 7% |
| Energy | 3% | 4% |
| | 100% | 100% |
Portfolio holdings and characteristics are subject to change.
For more complete details about the Fund's investment portfolio, see page 5.
Following the Fund's fiscal first and third quarter-end, a complete portfolio holdings listing is filed with the SEC on Form N-Q. The form will be available on the SEC's Web site at www.sec.gov, and it also may be reviewed and copied at the SEC's Public Reference Room in Washington, D.C. Information on the operation of the SEC's Public Reference Room may be obtained by calling (800) SEC-0330. The Fund's portfolio holdings are also posted on www.dws-investments.com from time to time. Please see the Fund's current prospectus for more information.
Thomas Voecking
Anna Wallentin
Juergen Foerster
Johannes Prix, PhD
Portfolio Managers
Investment Portfolio June 30, 2013 (Unaudited) | | | Shares | | | Value ($) | |
| | | | |
| Common Stocks 95.9% | |
| Australia 3.8% | |
| Australia & New Zealand Banking Group Ltd. | | | 61,700 | | | | 1,601,467 | |
| BHP Billiton Ltd. | | | 69,500 | | | | 2,002,657 | |
| Coca-Cola Amatil Ltd. | | | 36,000 | | | | 416,878 | |
| Lend Lease Group | | | 40,000 | | | | 303,566 | |
| Macquarie Group Ltd. | | | 10,300 | | | | 390,638 | |
| Rio Tinto Ltd. | | | 8,300 | | | | 394,229 | |
| (Cost $5,348,620) | | | | 5,109,435 | |
| Belgium 0.3% | |
| Anheuser-Busch InBev NV (Cost $412,423) | | | 4,300 | | | | 381,475 | |
| Denmark 0.9% | |
| Coloplast AS "B" (Cost $1,130,982) | | | 21,400 | | | | 1,197,766 | |
| Finland 1.1% | |
| Fortum Oyj (Cost $1,334,079) | | | 75,000 | | | | 1,401,052 | |
| France 6.8% | |
| Dassault Systemes SA | | | 34,900 | | | | 4,269,283 | |
| European Aeronautic Defence & Space Co. | | | 5,800 | | | | 308,416 | |
| L'Oreal SA | | | 13,500 | | | | 2,207,275 | |
| Publicis Groupe | | | 10,000 | | | | 709,104 | |
| Sanofi | | | 14,700 | | | | 1,514,939 | |
| (Cost $6,885,256) | | | | 9,009,017 | |
| Germany 12.4% | |
| Adidas AG | | | 51,500 | | | | 5,566,280 | |
| BASF SE | | | 32,100 | | | | 2,866,953 | |
| Bayer AG (Registered) | | | 5,100 | | | | 543,694 | |
| Beiersdorf AG | | | 6,700 | | | | 584,206 | |
| Continental AG | | | 3,000 | | | | 399,730 | |
| Deutsche Post AG (Registered) | | | 85,000 | | | | 2,112,322 | |
| Hannover Rueckversicherung SE (Registered) | | | 7,700 | | | | 553,387 | |
| HeidelbergCement AG | | | 6,800 | | | | 457,203 | |
| Muenchener Rueckversicherungs-Gesellschaft AG (Registered) | | | 9,800 | | | | 1,799,532 | |
| Siemens AG (Registered) | | | 12,500 | | | | 1,263,033 | |
| Suedzucker AG | | | 14,000 | | | | 433,350 | |
| (Cost $13,228,308) | | | | 16,579,690 | |
| Hong Kong 5.0% | |
| BOC Hong Kong (Holdings) Ltd. | | | 1,785,000 | | | | 5,451,524 | |
| Link REIT (REIT) | | | 82,000 | | | | 400,830 | |
| Noble Group Ltd. | | | 970,000 | | | | 742,258 | |
| (Cost $6,073,737) | | | | 6,594,612 | |
| Italy 3.9% | |
| Snam SpA (Cost $4,886,999) | | | 1,130,000 | | | | 5,145,341 | |
| Japan 21.7% | |
| Bridgestone Corp. | | | 74,500 | | | | 2,539,346 | |
| Canon, Inc. (a) | | | 56,800 | | | | 1,865,522 | |
| Daiwa House Industry Co., Ltd. | | | 21,000 | | | | 391,976 | |
| FANUC Corp. | | | 31,000 | | | | 4,495,222 | |
| Fast Retailing Co., Ltd. | | | 10,500 | | | | 3,541,887 | |
| Hitachi Ltd. | | | 192,000 | | | | 1,233,352 | |
| Japan Tobacco, Inc. | | | 12,000 | | | | 424,122 | |
| | | Shares | | | Value ($) | |
| | | | | | | | | |
| JGC Corp. | | | 55,000 | | | | 1,979,956 | |
| Keyence Corp. | | | 1,300 | | | | 414,897 | |
| Marubeni Corp. | | | 280,000 | | | | 1,872,001 | |
| Mitsubishi Estate Co., Ltd. | | | 122,000 | | | | 3,249,211 | |
| Mitsubishi Heavy Industries Ltd. | | | 92,000 | | | | 511,176 | |
| Mitsui & Co., Ltd. | | | 140,000 | | | | 1,759,016 | |
| Mizuho Financial Group, Inc. | | | 199,000 | | | | 414,191 | |
| Nabtesco Corp. | | | 99,200 | | | | 2,063,639 | |
| Nikon Corp. | | | 20,000 | | | | 466,690 | |
| SoftBank Corp. | | | 8,600 | | | | 502,141 | |
| Sumitomo Mitsui Financial Group, Inc. | | | 9,400 | | | | 431,306 | |
| Sumitomo Realty & Development Co., Ltd. | | | 13,300 | | | | 530,450 | |
| Suzuki Motor Corp. | | | 10,600 | | | | 244,460 | |
| (Cost $25,174,938) | | | | 28,930,561 | |
| Netherlands 8.2% | |
| Aegon NV | | | 60,000 | | | | 400,556 | |
| Akzo Nobel NV | | | 11,700 | | | | 657,204 | |
| ASML Holding NV | | | 5,400 | | | | 423,651 | |
| ING Groep NV (CVA)* | | | 550,357 | | | | 5,028,995 | |
| Koninklijke DSM NV | | | 6,000 | | | | 390,363 | |
| Royal Dutch Shell PLC "B" | | | 120,000 | | | | 3,968,493 | |
| (Cost $9,765,220) | | | | 10,869,262 | |
| Norway 2.5% | |
| DnB ASA | | | 207,576 | | | | 2,998,794 | |
| Telenor ASA | | | 19,000 | | | | 376,647 | |
| (Cost $2,540,231) | | | | 3,375,441 | |
| Singapore 0.6% | |
| United Overseas Bank Ltd. (Cost $848,648) | | | 55,000 | | | | 857,932 | |
| Spain 0.5% | |
| Inditex SA (Cost $809,189) | | | 5,800 | | | | 715,445 | |
| Sweden 5.1% | |
| SKF AB "B" | | | 16,000 | | | | 372,882 | |
| Swedbank AB "A" | | | 66,000 | | | | 1,506,304 | |
| Swedish Match AB | | | 7,700 | | | | 272,220 | |
| TeliaSonera AB | | | 724,000 | | | | 4,704,132 | |
| (Cost $6,271,176) | | | | 6,855,538 | |
| Switzerland 9.1% | |
| Cie Financiere Richemont SA "A" | | | 5,000 | | | | 438,608 | |
| Nestle SA (Registered) | | | 20,000 | | | | 1,308,129 | |
| Roche Holding AG (Genusschein) | | | 24,000 | | | | 5,946,825 | |
| Sika AG (Bearer) | | | 180 | | | | 464,738 | |
| Swatch Group AG (Registered) | | | 2,600 | | | | 243,945 | |
| Swiss Life Holding AG (Registered)* | | | 2,100 | | | | 339,774 | |
| Syngenta AG (Registered) | | | 8,550 | | | | 3,334,399 | |
| (Cost $11,615,511) | | | | 12,076,418 | |
| United Kingdom 14.0% | |
| Barclays PLC | | | 141,000 | | | | 604,431 | |
| British American Tobacco PLC | | | 19,300 | | | | 991,121 | |
| Capita PLC | | | 212,000 | | | | 3,123,557 | |
| Centrica PLC | | | 526,000 | | | | 2,886,756 | |
| Diageo PLC | | | 64,700 | | | | 1,855,805 | |
| Inmarsat PLC | | | 180,000 | | | | 1,847,286 | |
| | | Shares | | | Value ($) | |
| | | | | | | | | |
| Old Mutual PLC | | | 620,000 | | | | 1,701,640 | |
| SABMiller PLC | | | 27,200 | | | | 1,308,829 | |
| Vodafone Group PLC | | | 1,373,000 | | | | 3,940,122 | |
| WPP PLC | | | 25,000 | | | | 427,114 | |
| (Cost $16,570,517) | | | | 18,686,661 | |
Total Common Stocks (Cost $112,895,834) | | | | 127,785,646 | |
| | |
| Preferred Stock 0.2% | |
| Germany | |
| Henkel AG & Co. KGaA (Cost $257,406) | | | 3,000 | | | | 281,509 | |
| | |
| | | Shares | | | Value ($) | |
| | | | | | | | | |
| Securities Lending Collateral 1.5% | |
| Daily Assets Fund Institutional, 0.10% (b) (c) (Cost $1,958,985) | | | 1,958,985 | | | | 1,958,985 | |
| | |
| Cash Equivalents 3.3% | |
| Central Cash Management Fund, 0.07% (b) (Cost $4,367,248) | | | 4,367,248 | | | | 4,367,248 | |
| | | % of Net Assets | | | Value ($) | |
| | | | |
Total Investment Portfolio (Cost $119,479,473)† | | | 100.9 | | | | 134,393,388 | |
| Other Assets and Liabilities, Net | | | (0.9 | ) | | | (1,164,487 | ) |
| Net Assets | | | 100.0 | | | | 133,228,901 | |
* Non-income producing security.
† The cost for federal income tax purposes was $120,823,547. At June 30, 2013, net unrealized appreciation for all securities based on tax cost was $13,569,841. This consisted of aggregate gross unrealized appreciation for all securities in which there was an excess of value over tax cost of $17,473,216 and aggregate gross unrealized depreciation for all securities in which there was an excess of tax cost over value of $3,903,375.
(a) All or a portion of these securities were on loan (see Notes to Financial Statements). The value of securities loaned at June 30, 2013 amounted to $1,862,238, which is 1.4% of net assets.
(b) Affiliated fund managed by Deutsche Investment Management Americas Inc. The rate shown is the annualized seven-day yield at period end.
(c) Represents collateral held in connection with securities lending. Income earned by the Fund is net of borrower rebates.
CVA: Certificaten Van Aandelen (Certificate of Stock)
REIT: Real Estate Investment Trust
At June 30, 2013, open futures contracts purchased were as follows:
| Futures | Currency | Expiration Date | | Contracts | | | Notional Value ($) | | | Unrealized Depreciation ($) | |
| S&P 500 E-Mini Index | USD | 9/20/2013 | | | 70 | | | | 5,597,550 | | | | (120,750 | ) |
| Currency Abbreviation |
| USD United States Dollar |
For information on the Fund's policy and additional disclosures regarding futures contracts, please refer to the Derivatives section of Note B in the accompanying Notes to Financial Statements.
Fair Value Measurements
Various inputs are used in determining the value of the Fund's investments. These inputs are summarized in three broad levels. Level 1 includes quoted prices in active markets for identical securities. Level 2 includes other significant observable inputs (including quoted prices for similar securities, interest rates, prepayment speeds, and credit risk). Level 3 includes significant unobservable inputs (including the Fund's own assumptions in determining the fair value of investments). The inputs or methodology used for valuing securities are not necessarily an indication of the risk associated with investing in those securities.
The following is a summary of the inputs used as of June 30, 2013 in valuing the Fund's investments. For information on the Fund's policy regarding the valuation of investments, please refer to the Security Valuation section of Note A in the accompanying Notes to Financial Statements.
| Assets | | Level 1 | | | Level 2 | | | Level 3 | | | Total | |
| | |
Common Stocks (d) | |
| Australia | | $ | — | | | $ | 5,109,435 | | | $ | — | | | $ | 5,109,435 | |
| Belgium | | | — | | | | 381,475 | | | | — | | | | 381,475 | |
| Denmark | | | — | | | | 1,197,766 | | | | — | | | | 1,197,766 | |
| Finland | | | — | | | | 1,401,052 | | | | — | | | | 1,401,052 | |
| France | | | — | | | | 9,009,017 | | | | — | | | | 9,009,017 | |
| Germany | | | — | | | | 16,579,690 | | | | — | | | | 16,579,690 | |
| Hong Kong | | | — | | | | 6,594,612 | | | | — | | | | 6,594,612 | |
| Italy | | | — | | | | 5,145,341 | | | | — | | | | 5,145,341 | |
| Japan | | | — | | | | 28,930,561 | | | | — | | | | 28,930,561 | |
| Netherlands | | | — | | | | 10,869,262 | | | | — | | | | 10,869,262 | |
| Norway | | | — | | | | 3,375,441 | | | | — | | | | 3,375,441 | |
| Singapore | | | — | | | | 857,932 | | | | — | | | | 857,932 | |
| Spain | | | — | | | | 715,445 | | | | — | | | | 715,445 | |
| Sweden | | | — | | | | 6,855,538 | | | | — | | | | 6,855,538 | |
| Switzerland | | | — | | | | 12,076,418 | | | | — | | | | 12,076,418 | |
| United Kingdom | | | — | | | | 18,686,661 | | | | — | | | | 18,686,661 | |
| Preferred Stock | | | | | | | | | | | | | | | | |
| Germany | | | — | | | | 281,509 | | | | — | | | | 281,509 | |
| Short-Term Investments (d) | | | 6,326,233 | | | | — | | | | — | | | | 6,326,233 | |
| Total | | $ | 6,326,233 | | | $ | 128,067,155 | | | $ | — | | | $ | 134,393,388 | |
| Liabilities | |
Derivatives (e) Futures Contracts | | $ | (120,750 | ) | | $ | — | | | $ | — | | | $ | (120,750 | ) |
| Total | | $ | (120,750 | ) | | $ | — | | | $ | — | | | $ | (120,750 | ) |
There have been no transfers between fair value measurement levels during the period ended June 30, 2013.
(d) See Investment Portfolio for additional detailed categorizations.
(e) Derivatives include unrealized appreciation (depreciation) on futures contracts.
The accompanying notes are an integral part of the financial statements.
Statement of Assets and Liabilities | as of June 30, 2013 (Unaudited) | |
| Assets | |
Investments: Investments in non-affiliated securities, at value (cost $113,153,240) — including $1,862,238 of securities loaned | | $ | 128,067,155 | |
| Investment in Daily Assets Fund Institutional (cost $1,958,985)* | | | 1,958,985 | |
| Investment in Central Cash Management Fund (cost $4,367,248) | | | 4,367,248 | |
| Total investments, at value (cost $119,479,473) | | | 134,393,388 | |
| Foreign currency, at value (cost $237,431) | | | 235,433 | |
| Deposit with broker for futures contracts | | | 245,000 | |
| Receivable for Fund shares sold | | | 18,786 | |
| Dividends receivable | | | 281,502 | |
| Interest receivable | | | 3,315 | |
| Foreign taxes recoverable | | | 261,737 | |
| Other assets | | | 1,486 | |
| Total assets | | | 135,440,647 | |
| Liabilities | |
| Payable upon return of securities loaned | | | 1,958,985 | |
| Payable for Fund shares redeemed | | | 54,004 | |
| Payable for variation margin on futures contracts | | | 25,550 | |
| Accrued Trustees' fees | | | 2,085 | |
| Accrued management fee | | | 88,042 | |
| Other accrued expenses and payables | | | 83,080 | |
| Total liabilities | | | 2,211,746 | |
| Net assets, at value | | $ | 133,228,901 | |
| Net Assets Consist of | |
| Undistributed net investment income | | | 1,221,132 | |
Net unrealized appreciation (depreciation) on: Investments | | | 14,913,915 | |
| Futures | | | (120,750 | ) |
| Foreign currency | | | (1,523 | ) |
| Accumulated net realized gain (loss) | | | (136,549,605 | ) |
| Paid-in capital | | | 253,765,732 | |
| Net assets, at value | | $ | 133,228,901 | |
Class A Net Asset Value, offering and redemption price per share ($132,969,216 ÷ 17,158,555 outstanding shares of beneficial interest, $.01 par value, unlimited number of shares authorized) | | $ | 7.75 | |
Class B Net Asset Value, offering and redemption price per share ($259,685 ÷ 33,424 outstanding shares of beneficial interest, $.01 par value, unlimited number of shares authorized) | | $ | 7.77 | |
* Represents collateral on securities loaned.
The accompanying notes are an integral part of the financial statements.
Statement of Operations
| for the six months ended June 30, 2013 (Unaudited) | |
| Investment Income | |
Income: Dividends (net of foreign taxes withheld of $284,898) | | $ | 2,947,336 | |
| Income distributions — Central Cash Management Fund | | | 4,352 | |
| Securities lending income, including income from Daily Assets Fund Institutional, net of borrower rebates | | | 85,925 | |
| Total income | | | 3,037,613 | |
Expenses: Management fee | | | 712,435 | |
| Administration fee | | | 90,182 | |
| Services to shareholders | | | 1,861 | |
| Custodian fee | | | 29,283 | |
| Distribution service fee (Class B) | | | 343 | |
| Professional fees | | | 31,848 | |
| Reports to shareholders | | | 23,951 | |
| Trustees' fees and expenses | | | 4,409 | |
| Other | | | 10,686 | |
| Total expenses | | | 904,998 | |
| Net investment income (loss) | | | 2,132,615 | |
| Realized and Unrealized Gain (Loss) | |
Net realized gain (loss) from: Investments | | | 12,557,354 | |
| Futures | | | 978,247 | |
| Foreign currency | | | (209,117 | ) |
| | | | 13,326,484 | |
Change in net unrealized appreciation (depreciation) on: Investments | | | (7,667,770 | ) |
| Futures | | | (155,688 | ) |
| Foreign currency | | | 63,930 | |
| | | | (7,759,528 | ) |
| Net gain (loss) | | | 5,566,956 | |
| Net increase (decrease) in net assets resulting from operations | | $ | 7,699,571 | |
The accompanying notes are an integral part of the financial statements.
Statement of Changes in Net Assets | Increase (Decrease) in Net Assets | | Six Months Ended June 30, 2013 (Unaudited) | | | Year Ended December 31, 2012 | |
Operations: Net investment income (loss) | | $ | 2,132,615 | | | $ | 6,560,034 | |
| Net realized gain (loss) | | | 13,326,484 | | | | (18,682,583 | ) |
| Change in net unrealized appreciation (depreciation) | | | (7,759,528 | ) | | | 53,381,763 | |
| Net increase (decrease) in net assets resulting from operations | | | 7,699,571 | | | | 41,259,214 | |
Distributions to shareholders from: Net investment income: Class A | | | (7,421,568 | ) | | | (4,756,093 | ) |
| Class B | | | (14,321 | ) | | | (4,778 | ) |
| Total distributions | | | (7,435,889 | ) | | | (4,760,871 | ) |
Fund share transactions: Class A Proceeds from shares sold | | | 3,301,639 | | | | 8,058,394 | |
| Reinvestment of distributions | | | 7,421,568 | | | | 4,756,093 | |
| Payments for shares redeemed | | | (108,121,619 | ) | | | (29,986,864 | ) |
| Net increase (decrease) in net assets from Class A share transactions | | | (97,398,412 | ) | | | (17,172,377 | ) |
Class B Proceeds from shares sold | | | 18,869 | | | | 38,387 | |
| Reinvestment of distributions | | | 14,321 | | | | 4,778 | |
| Payments for shares redeemed | | | (47,875 | ) | | | (40,070 | ) |
| Net increase (decrease) in net assets from Class B share transactions | | | (14,685 | ) | | | 3,095 | |
| Increase (decrease) in net assets | | | (97,149,415 | ) | | | 19,329,061 | |
| Net assets at beginning of period | | | 230,378,316 | | | | 211,049,255 | |
| Net assets at end of period (including undistributed net investment income of $1,221,132 and $6,524,406, respectively) | | $ | 133,228,901 | | | $ | 230,378,316 | |
| Other Information | |
Class A Shares outstanding at beginning of period | | | 28,915,018 | | | | 31,267,358 | |
| Shares sold | | | 407,070 | | | | 1,102,311 | |
| Shares issued to shareholders in reinvestment of distributions | | | 930,021 | | | | 650,628 | |
| Shares redeemed | | | (13,093,554 | ) | | | (4,105,279 | ) |
| Net increase (decrease) in Class A shares | | | (11,756,463 | ) | | | (2,352,340 | ) |
| Shares outstanding at end of period | | | 17,158,555 | | | | 28,915,018 | |
Class B Shares outstanding at beginning of period | | | 35,208 | | | | 34,893 | |
| Shares sold | | | 2,342 | | | | 5,248 | |
| Shares issued to shareholders in reinvestment of distributions | | | 1,790 | | | | 652 | |
| Shares redeemed | | | (5,916 | ) | | | (5,585 | ) |
| Net increase (decrease) in Class B shares | | | (1,784 | ) | | | 315 | |
| Shares outstanding at end of period | | | 33,424 | | | | 35,208 | |
The accompanying notes are an integral part of the financial statements.
| | | | | | Years Ended December 31, | |
| Class A | | Six Months Ended 6/30/13 (Unaudited) | | | 2012 | | | 2011 | | | 2010 | | | 2009 | | | 2008 | |
| Selected Per Share Data | |
| Net asset value, beginning of period | | $ | 7.96 | | | $ | 6.74 | | | $ | 8.22 | | | $ | 8.26 | | | $ | 6.52 | | | $ | 15.01 | |
Income (loss) from investment operations: Net investment income (loss)a | | | .10 | | | | .22 | | | | .15 | | | | .13 | | | | .12 | | | | .29 | c |
| Net realized and unrealized gain (loss) | | | .14 | | | | 1.16 | | | | (1.49 | ) | | | (.00 | )*** | | | 1.93 | | | | (6.46 | ) |
| Total from investment operations | | | .24 | | | | 1.38 | | | | (1.34 | ) | | | .13 | | | | 2.05 | | | | (6.17 | ) |
Less distributions from: Net investment income | | | (.45 | ) | | | (.16 | ) | | | (.14 | ) | | | (.17 | ) | | | (.31 | ) | | | (.17 | ) |
| Net realized gains | | | — | | | | — | | | | — | | | | — | | | | — | | | | (2.15 | ) |
| Total distributions | | | (.45 | ) | | | (.16 | ) | | | (.14 | ) | | | (.17 | ) | | | (.31 | ) | | | (2.32 | ) |
| Net asset value, end of period | | $ | 7.75 | | | $ | 7.96 | | | $ | 6.74 | | | $ | 8.22 | | | $ | 8.26 | | | $ | 6.52 | |
| Total Return (%) | | | 2.84 | ** | | | 20.65 | | | | (16.67 | ) | | | 1.62 | b | | | 33.52 | | | | (48.21 | )b,d |
| Ratios to Average Net Assets and Supplemental Data | |
| Net assets, end of period ($ millions) | | | 133 | | | | 230 | | | | 211 | | | | 288 | | | | 344 | | | | 297 | |
| Ratio of expenses before expense reductions (%) | | | 1.00 | * | | | .98 | | | | 1.00 | | | | .99 | | | | .94 | | | | 1.01 | |
| Ratio of expenses after expense reductions (%) | | | 1.00 | * | | | .98 | | | | 1.00 | | | | .99 | | | | .94 | | | | .97 | |
| Ratio of net investment income (loss) (%) | | | 2.36 | * | | | 2.99 | | | | 1.98 | | | | 1.68 | | | | 1.69 | | | | 2.74 | c |
| Portfolio turnover rate (%) | | | 49 | ** | | | 85 | | | | 174 | | | | 228 | | | | 81 | | | | 123 | |
a Based on average shares outstanding during the period. b Total return would have been lower had certain expenses not been reduced. c Net investment income per share and the ratio of net investment income include non-recurring dividend income amounting to $0.09 per share and 0.82% of average daily net assets for the year ended December 31, 2008. d Includes a reimbursement from the Advisor to reimburse the effect of losses incurred as the result of certain operation errors during the period. Excluding this reimbursement, total return would have been 0.06% lower. * Annualized ** Not annualized *** Amount is less than $.005. | |
| | | | | | Years Ended December 31, | |
| Class B | | Six Months Ended 6/30/13 (Unaudited) | | | 2012 | | | 2011 | | | 2010 | | | 2009 | | | 2008 | |
| Selected Per Share Data | |
| Net asset value, beginning of period | | $ | 7.96 | | | $ | 6.75 | | | $ | 8.22 | | | $ | 8.26 | | | $ | 6.52 | | | $ | 14.98 | |
Income (loss) from investment operations: Net investment income (loss)a | | | .11 | | | | .20 | | | | .13 | | | | .11 | | | | .10 | | | | .23 | c |
| Net realized and unrealized gain (loss) | | | .13 | | | | 1.15 | | | | (1.48 | ) | | | (.00 | )*** | | | 1.94 | | | | (6.43 | ) |
| Total from investment operations | | | .24 | | | | 1.35 | | | | (1.35 | ) | | | .11 | | | | 2.04 | | | | (6.20 | ) |
Less distributions from: Net investment income | | | (.43 | ) | | | (.14 | ) | | | (.12 | ) | | | (.15 | ) | | | (.30 | ) | | | (.11 | ) |
| Net realized gains | | | — | | | | — | | | | — | | | | — | | | | — | | | | (2.15 | ) |
| Total distributions | | | (.43 | ) | | | (.14 | ) | | | (.12 | ) | | | (.15 | ) | | | (.30 | ) | | | (2.26 | ) |
| Net asset value, end of period | | $ | 7.77 | | | $ | 7.96 | | | $ | 6.75 | | | $ | 8.22 | | | $ | 8.26 | | | $ | 6.52 | |
| Total Return (%) | | | 2.81 | ** | | | 20.13 | | | | (16.77 | ) | | | 1.33 | b | | | 32.89 | | | | (48.25 | )b,d |
| Ratios to Average Net Assets and Supplemental Data | |
| Net assets, end of period ($ millions) | | | .26 | | | | .28 | | | | .24 | | | | .36 | | | | .50 | | | | .40 | |
| Ratio of expenses before expense reductions (%) | | | 1.28 | * | | | 1.26 | | | | 1.28 | | | | 1.26 | | | | 1.22 | | | | 1.33 | |
| Ratio of expenses after expense reductions (%) | | | 1.28 | * | | | 1.26 | | | | 1.28 | | | | 1.26 | | | | 1.22 | | | | 1.28 | |
| Ratio of net investment income (loss) (%) | | | 2.80 | * | | | 2.73 | | | | 1.70 | | | | 1.41 | | | | 1.42 | | | | 2.42 | c |
| Portfolio turnover rate (%) | | | 49 | ** | | | 85 | | | | 174 | | | | 228 | | | | 81 | | | | 123 | |
a Based on average shares outstanding during the period. b Total return would have been lower had certain expenses not been reduced. c Net investment income per share and the ratio of net investment income include non-recurring dividend income amounting to $0.09 per share and 0.82% of average daily net assets for the year ended December 31, 2008. d Includes a reimbursement from the Advisor to reimburse the effect of losses incurred as the result of certain operation errors during the period. Excluding this reimbursement, total return would have been 0.06% lower. * Annualized ** Not annualized *** Amount is less than $.005. | |
Notes to Financial Statements (Unaudited)
A. Organization and Significant Accounting Policies
DWS Variable Series I (the "Series") is registered under the Investment Company Act of 1940, as amended (the "1940 Act"), as an open-end, registered management investment company organized as a Massachusetts business trust. The Series consists of five diversified funds: DWS Bond VIP, DWS Core Equity VIP, DWS Capital Growth VIP, DWS Global Small Cap Growth VIP and DWS International VIP (individually or collectively hereinafter referred to as a "Fund" or the "Funds"). These financial statements report on DWS International VIP. The Series is intended to be the underlying investment vehicle for variable annuity contracts and variable life insurance policies to be offered by the separate accounts of certain life insurance companies ("Participating Insurance Companies").
Multiple Classes of Shares of Beneficial Interest. The Fund offers two classes of shares (Class A shares and Class B shares). Class B shares are subject to Rule 12b-1 distribution fees under the 1940 Act and recordkeeping fees equal to an annual rate of 0.25% and up to 0.15%, respectively, of the average daily net assets of the Class B shares of the Fund. Class A shares are not subject to such fees.
Investment income, realized and unrealized gains and losses, and certain fund-level expenses and expense reductions, if any, are borne pro rata on the basis of relative net assets by the holders of all classes of shares, except that each class bears certain expenses unique to that class (including the applicable 12b-1 distribution fees and recordkeeping fees). Differences in class-level expenses may result in payment of different per share dividends by class. All shares have equal rights with respect to voting subject to class-specific arrangements.
The Fund's financial statements are prepared in accordance with accounting principles generally accepted in the United States of America, which require the use of management estimates. Actual results could differ from those estimates. The policies described below are followed consistently by the Fund in the preparation of its financial statements.
Security Valuation. Investments are stated at value determined as of the close of regular trading on the New York Stock Exchange on each day the exchange is open for trading.
Various inputs are used in determining the value of the Fund's investments. These inputs are summarized in three broad levels. Level 1 includes quoted prices in active markets for identical securities. Level 2 includes other significant observable inputs (including quoted prices for similar securities, interest rates, prepayment speeds, and credit risk). Level 3 includes significant unobservable inputs (including the Fund's own assumptions in determining the fair value of investments). The inputs or methodology used for valuing securities are not necessarily an indication of the risk associated with investing in those securities.
Equity securities are valued at the most recent sale price or official closing price reported on the exchange (U.S. or foreign) or over-the-counter market on which they trade and are categorized as Level 1 securities. Securities for which no sales are reported are valued at the calculated mean between the most recent bid and asked quotations on the relevant market or, if a mean cannot be determined, at the most recent bid quotation. For certain international equity securities, in order to adjust for events which may occur between the close of the foreign exchanges and the close of the New York Stock Exchange, a fair valuation model may be used. This fair valuation model takes into account comparisons to the valuation of American Depository Receipts (ADRs), exchange-traded funds, futures contracts and certain indices and these securities are categorized as Level 2.
Investments in open-end investment companies are valued at their net asset value each business day and are categorized as Level 1.
Futures contracts are generally valued at the settlement prices established each day on the exchange on which they are traded and are categorized as Level 1.
Securities and other assets for which market quotations are not readily available or for which the above valuation procedures are deemed not to reflect fair value are valued in a manner that is intended to reflect their fair value as determined in accordance with procedures approved by the Trustees and are generally categorized as Level 3. In accordance with the Fund's valuation procedures, factors used in determining value may include, but are not limited to, the type of the security; the size of the holding; the initial cost of the security; the existence of any contractual restrictions on the security's disposition; the price and extent of public trading in similar securities of the issuer or of comparable companies; quotations or evaluated prices from broker-dealers and/or pricing services; information obtained from the issuer, analysts, and/or the appropriate stock exchange (for exchange-traded securities); an analysis of the company's or issuer's financial statements; an evaluation of the forces that influence the issuer and the market(s) in which the security is purchased and sold and with respect to debt securities; the maturity, coupon, creditworthiness, currency denomination and the movement of the market in which the security is normally traded. The value determined under these procedures may differ from published values for the same securities.
Disclosure about the classification of fair value measurements is included in a table following the Fund's Investment Portfolio.
Securities Lending. Deutsche Bank AG, as lending agent, lends securities of the Fund to certain financial institutions under the terms of the Security Lending Agreement. The Fund retains the benefits of owning the securities it has loaned and continues to receive interest and dividends generated by the securities and to participate in any changes in their market value. The Fund requires the borrowers of the securities to maintain collateral with the Fund consisting of either cash or liquid, unencumbered assets having a value at least equal to the value of the securities loaned. When the collateral falls below specified amounts, the lending agent will use its best effort to obtain additional collateral on the next business day to meet required amounts under the security lending agreement. The Fund may invest the cash collateral into a joint trading account in an affiliated money market fund pursuant to Exemptive Orders issued by the SEC. The Fund receives compensation for lending its securities either in the form of fees or by earning interest on invested cash collateral net of borrower rebates and fees paid to a lending agent. Either the Fund or the borrower may terminate the loan. There may be risks of delay and costs in recovery of securities or even loss of rights in the collateral should the borrower of the securities fail financially. If the Fund is not able to recover securities lent, the Fund may sell the collateral and purchase a replacement investment in the market, incurring the risk that the value of the replacement security is greater than the value of the collateral. The Fund is also subject to all investment risks associated with the reinvestment of any cash collateral received, including, but not limited to, interest rate, credit and liquidity risk associated with such investments.
As of June 30, 2013, the Fund had securities on loan with a gross value of $1,862,238. The value of the related collateral, $1,958,985, exceeded the value of the securities loaned at period end.
Foreign Currency Translations. The books and records of the Fund are maintained in U.S. dollars. Investment securities and other assets and liabilities denominated in a foreign currency are translated into U.S. dollars at the prevailing exchange rates at period end. Purchases and sales of investment securities, income and expenses are translated into U.S. dollars at the prevailing exchange rates on the respective dates of the transactions.
Net realized and unrealized gains and losses on foreign currency transactions represent net gains and losses between trade and settlement dates on securities transactions, the acquisition and disposition of foreign currencies, and the difference between the amount of net investment income accrued and the U.S. dollar amount actually received. That portion of both realized and unrealized gains and losses on investments that results from fluctuations in foreign currency exchange rates is not separately disclosed but is included with net realized and unrealized gain/appreciation and loss/depreciation on investments.
Taxes. The Fund is treated as a separate taxpayer as provided for in the Internal Revenue Code, as amended. It is the Fund's policy to comply with the requirements of the Internal Revenue Code, as amended, which are applicable to regulated investment companies, and to distribute all of its taxable income to the separate accounts of the Participating Insurance Companies which hold its shares.
Additionally, the Fund may be subject to taxes imposed by the governments of countries in which it invests and are generally based on income and/or capital gains earned or repatriated. Estimated tax liabilities on certain foreign securities are recorded on an accrual basis and are reflected as components of interest income or net change in unrealized gain/loss on investments. Tax liabilities realized as a result of security sales are reflected as a component of net realized gain/loss on investments.
Under the Regulated Investment Company Modernization Act of 2010, net capital losses incurred post-enactment may be carried forward indefinitely, and their character is retained as short-term and/or long-term. Previously, net capital losses were carried forward for eight years and treated as short-term losses. As a transition rule, the Act requires that post-enactment net capital losses be used before pre-enactment net capital losses.
At December 31, 2012, the Fund had a net tax basis capital loss carryforward of approximately $149,313,000, including $124,587,000 of pre-enactment losses, which may be applied against any realized net taxable capital gains of each succeeding year until fully utilized or until December 31, 2016 ($25,765,000) and December 31, 2017 ($98,822,000), the respective expiration dates, whichever occurs first; and approximately $24,726,000 of post-enactment losses, which may be applied against realized net taxable capital gains indefinitely, including short-term losses ($15,693,000) and long-term losses ($9,033,000).
The Fund has reviewed the tax positions for the open tax years as of December 31, 2012 and has determined that no provision for income tax is required in the Fund's financial statements. The Fund's federal tax returns for the prior three fiscal years remain open subject to examination by the Internal Revenue Service.
Distribution of Income and Gains. Distributions from net investment income of the Fund, if any, are declared and distributed to shareholders annually. Net realized gains from investment transactions, in excess of available capital loss carryforwards, would be taxable to the Fund if not distributed and, therefore, will be distributed to shareholders at least annually. The Fund may also make additional distributions for tax purposes if necessary.
The timing and characterization of certain income and capital gain distributions are determined annually in accordance with federal tax regulations which may differ from accounting principles generally accepted in the United States of America. These differences primarily relate to investments in foreign denominated investments, futures contracts, passive foreign investment companies and certain securities sold at a loss. As a result, net investment income (loss) and net realized gain (loss) on investment transactions for a reporting period may differ significantly from distributions during such period. Accordingly, the Fund may periodically make reclassifications among certain of its capital accounts without impacting the net asset value of the Fund.
The tax character of current year distributions will be determined at the end of the current fiscal year.
Expenses. Expenses of the Series arising in connection with a specific Fund are allocated to that Fund. Other Series expenses which cannot be directly attributed to a Fund are apportioned among the Funds in the Series based upon the relative net assets or other appropriate measures.
Contingencies. In the normal course of business, the Fund may enter into contracts with service providers that contain general indemnification clauses. The Fund's maximum exposure under these arrangements is unknown as this would involve future claims that may be made against the Fund that have not yet been made. However, based on experience, the Fund expects the risk of loss to be remote.
Other. Investment transactions are accounted for on a trade date plus one basis for daily net asset value calculations. However, for financial reporting purposes, investment transactions are reported on trade date. Interest income is recorded on the accrual basis net of foreign withholding taxes. Dividend income is recorded on the ex-dividend date net of foreign withholding taxes. Certain dividends from foreign securities may be recorded subsequent to the ex-dividend date as soon as the Fund is informed of such dividends. Realized gains and losses from investment transactions are recorded on an identified cost basis and may include proceeds from litigation.
B. Derivative Instruments
Futures Contracts. A futures contract is an agreement between a buyer or seller and an established futures exchange or its clearinghouse in which the buyer or seller agrees to take or make a delivery of a specific amount of a financial instrument at a specified price on a specific date (settlement date). For the six months ended June 30, 2013, the Fund entered into futures contracts to keep cash on hand to meet shareholder redemptions or other needs while maintaining exposure to the market.
Upon entering into a futures contract, the Fund is required to deposit with a financial intermediary cash or securities ("initial margin") in an amount equal to a certain percentage of the face value indicated in the futures contract. Subsequent payments ("variation margin") are made or received by the Fund dependent upon the daily fluctuations in the value and are recorded for financial reporting purposes as unrealized gains or losses by the Fund. Gains or losses are realized when the contract expires or is closed. Since all futures contracts are exchange-traded, counterparty risk is minimized as the exchange's clearinghouse acts as the counterparty, and guarantees the futures against default.
Certain risks may arise upon entering into futures contracts, including the risk that an illiquid market will limit the Fund's ability to close out a futures contract prior to the settlement date and the risk that the futures contract is not well correlated with the security, index or currency to which it relates. Risk of loss may exceed amounts disclosed in the Statement of Assets and Liabilities.
A summary of the open futures contracts as of June 30, 2013 is included in a table following the Fund's Investment Portfolio. For the six months ended June 30, 2013, the investment in futures contracts purchased had a total notional value generally indicative of a range from approximately $4,615,000 to $6,641,000.
| Liability Derivative | | Futures Contracts | |
| Equity Contracts (a) | | $ | (120,750 | ) |
The above derivative is located in the following Statement of Assets and Liabilities account:
(a) Includes cumulative appreciation of futures contracts as disclosed in the Investment Portfolio. Unsettled variation margin is disclosed separately within the Statement of Assets and Liabilities.
Additionally, the amount of unrealized and realized gains and losses on derivative instruments recognized in Fund earnings during the six months ended June 30, 2013 and the related location in the accompanying Statement of Operations is summarized in the following tables by primary underlying risk exposure:
| Realized Gain (Loss) | | Futures Contracts | |
| Equity Contracts (a) | | $ | 978,247 | |
The above derivative is located in the following Statement of Operations account:
(a) Net realized gain (loss) from futures
| Change in Net Unrealized Appreciation (Depreciation) | | Futures Contracts | |
| Equity Contracts (a) | | $ | (155,688 | ) |
The above derivative is located in the following Statement of Operations account:
(a) Change in net unrealized appreciation (depreciation) on futures
C. Purchases and Sales of Securities
During the six months ended June 30, 2013, purchases and sales of investment securities (excluding short-term investments) aggregated $82,355,181 and $185,591,121, respectively.
D. Related Parties
Management Agreement. Under the Investment Management Agreement with Deutsche Investment Management Americas Inc. ("DIMA" or the "Advisor"), an indirect, wholly owned subsidiary of Deutsche Bank AG, the Advisor directs the investments of the Fund in accordance with its investment objectives, policies and restrictions. The Advisor determines the securities, instruments and other contracts relating to investments to be purchased, sold or entered into by the Fund.
Pursuant to the Investment Management Agreement with the Advisor, the Fund pays a monthly management fee based on the Fund's average daily net assets, computed and accrued daily and payable monthly, at the following annual rates:
| First $500 million of average daily net assets | | | .790 | % |
| Over $500 million of average daily net assets | | | .640 | % |
Accordingly, for the six months ended June 30, 2013, the fee pursuant to the Investment Management Agreement was equivalent to an annualized effective rate of 0.79% of the Fund's average daily net assets.
For the period from January 1, 2013 through April 30, 2014 the Advisor has contractually agreed to waive all or a portion of its fees and/or reimburse certain operating expenses of the Fund to the extent necessary to maintain the operating expenses (excluding certain expenses such as extraordinary expenses, taxes, brokerage and interest) of each class as follows:
Administration Fee. Pursuant to an Administrative Services Agreement, DIMA provides most administrative services to the Fund. For all services provided under the Administrative Services Agreement, the Fund pays the Advisor an annual fee ("Administration Fee") of 0.10% of the Fund's average daily net assets, computed and accrued daily and payable monthly. For the six months ended June 30, 2013, the Administration Fee was $90,182, of which $11,145 is unpaid.
Service Provider Fees. DWS Investments Service Company ("DISC"), an affiliate of the Advisor, is the transfer agent, dividend-paying agent and shareholder service agent for the Fund. Pursuant to a sub-transfer agency agreement between DISC and DST Systems, Inc. ("DST"), DISC has delegated certain transfer agent, dividend-paying agent and shareholder service agent functions to DST. DISC compensates DST out of the shareholder servicing fee it receives from the Fund. For the six months ended June 30, 2013, the amounts charged to the Fund by DISC were as follows:
| Services to Shareholders | | Total Aggregated | | | Unpaid at June 30, 2013 | |
| Class A | | $ | 342 | | | $ | 113 | |
| Class B | | | 40 | | | | 13 | |
| | | $ | 382 | | | $ | 126 | |
Distribution Service Agreement. DWS Investments Distributors, Inc. ("DIDI"), also an affiliate of the Advisor, is the Series' Distributor. In accordance with the Master Distribution Plan, DIDI receives 12b-1 fees of 0.25% of average daily net assets of Class B shares. Pursuant to the Master Distribution Plan, DIDI remits these fees to the Participating Insurance Companies for various costs incurred or paid by these companies in connection with marketing and distribution of Class B shares. For the six months ended June 30, 2013, the Distribution Service Fee aggregated $343, of which $54 is unpaid.
Typesetting and Filing Service Fees. Under an agreement with DIMA, DIMA is compensated for providing typesetting and certain regulatory filing services to the Fund. For the six months ended June 30, 2013, the amount charged to the Fund by DIMA included in the Statement of Operations under "reports to shareholders" aggregated $7,702, all of which is unpaid.
Trustees' Fees and Expenses. The Fund paid retainer fees to each Trustee not affiliated with the Advisor, plus specified amounts to the Board Chairperson and Vice Chairperson and to each committee Chairperson.
Affiliated Cash Management Vehicles. The Fund may invest uninvested cash balances in Central Cash Management Fund and DWS Variable NAV Money Fund, affiliated money market funds which are managed by the Advisor. Each affiliated money market fund seeks to provide a high level of current income consistent with liquidity and the preservation of capital. Each affiliated money market fund is managed in accordance with Rule 2a-7 under the Investment Company Act of 1940, which governs the quality, maturity, diversity and liquidity of instruments in which a money market fund may invest. Central Cash Management Fund seeks to maintain a stable net asset value, and DWS Variable NAV Money Fund maintains a floating net asset value. The Fund indirectly bears its proportionate share of the expenses of each affiliated money market fund in which it invests. Central Cash Management Fund does not pay the Advisor an investment management fee. To the extent that DWS Variable NAV Money Fund pays an investment management fee to the Advisor, the Advisor will waive an amount of the investment management fee payable to the Advisor by the Fund equal to the amount of the investment management fee payable on the Fund's assets invested in DWS Variable NAV Money Fund.
Securities Lending Agent Fees. Deutsche Bank AG serves as securities lending agent for the Fund. For the six months ended June 30, 2013, the Fund incurred securities lending agent fees to Deutsche Bank AG in the amount of $9,557.
E. Ownership of the Fund
Two participating insurance companies were owners of record of 10% or more of the total outstanding Class A shares of the Fund, each owning 23%, 12% and 12%.
F. Line of Credit
The Fund and other affiliated funds (the "Participants") share in a $375 million revolving credit facility provided by a syndication of banks. The Fund may borrow for temporary or emergency purposes, including the meeting of redemption requests that otherwise might require the untimely disposition of securities. The Participants are charged an annual commitment fee which is allocated based on net assets, among each of the Participants. Interest is calculated at a rate per annum equal to the sum of the Federal Funds Rate plus 1.25 percent plus if LIBOR exceeds the Federal Funds Rate the amount of such excess. The Fund may borrow up to a maximum of 33 percent of its net assets under the agreement. The Fund had no outstanding loans at June 30, 2013.
Information About Your Fund's Expenses (Unaudited)
As an investor of the Fund, you incur two types of costs: ongoing expenses and transaction costs. Ongoing expenses include management fees, distribution and service (12b-1) fees and other Fund expenses. Examples of transaction costs include contract charges, redemption fees and account maintenance fees, which are not shown in this section. The following tables are intended to help you understand your ongoing expenses (in dollars) of investing in the Fund and to help you compare these expenses with the ongoing expenses of investing in other mutual funds. The example in the table is based on an investment of $1,000 invested at the beginning of the six-month period and held for the entire period (January 1, 2013 to June 30, 2013).
The tables illustrate your Fund's expenses in two ways:
•Actual Fund Return. This helps you estimate the actual dollar amount of ongoing expenses (but not transaction costs) paid on a $1,000 investment in the Fund using the Fund's actual return during the period. To estimate the expenses you paid over the period, simply divide your account value by $1,000 (for example, an $8,600 account value divided by $1,000 = 8.6), then multiply the result by the number in the "Expenses Paid per $1,000" line under the share class you hold.
• Hypothetical 5% Fund Return. This helps you to compare your Fund's ongoing expenses (but not transaction costs) with those of other mutual funds using the Fund's actual expense ratio and a hypothetical rate of return of 5% per year before expenses. Examples using a 5% hypothetical Fund return may be found in the shareholder reports of other mutual funds. The hypothetical account values and expenses may not be used to estimate the actual ending account balance or expenses you paid for the period.
Please note that the expenses shown in these tables are meant to highlight your ongoing expenses only and do not reflect any transaction costs. The "Expenses Paid per $1,000" line of the tables is useful in comparing ongoing expenses only and will not help you determine the relative total expense of owning different funds. If these transaction costs had been included, your costs would have been higher.
Expenses and Value of a $1,000 Investment for the six months ended June 30, 2013 | |
| Actual Fund Return | | Class A | | | Class B | |
| Beginning Account Value 1/1/13 | | $ | 1,000.00 | | | $ | 1,000.00 | |
| Ending Account Value 6/30/13 | | $ | 1,028.40 | | | $ | 1,028.10 | |
| Expenses Paid per $1,000* | | $ | 5.03 | | | $ | 6.44 | |
| Hypothetical 5% Fund Return | | Class A | | | Class B | |
| Beginning Account Value 1/1/13 | | $ | 1,000.00 | | | $ | 1,000.00 | |
| Ending Account Value 6/30/13 | | $ | 1,019.84 | | | $ | 1,018.45 | |
| Expenses Paid per $1,000* | | $ | 5.01 | | | $ | 6.41 | |
* Expenses are equal to the Fund's annualized expense ratio for each share class, multiplied by the average account value over the period, multiplied by 181 (the number of days in the most recent six-month period), then divided by 365.
| Annualized Expense Ratios | Class A | | Class B | |
| DWS Variable Series I — DWS International VIP | 1.00% | | 1.28% | |
For more information, please refer to the Fund's prospectus.
These tables do not reflect charges and fees ("contract charges") associated with the separate account that invests in the Fund or any variable life insurance policy or variable annuity contract for which the Fund is an investment option.
For an analysis of the fees associated with an investment in the Fund or similar funds, please refer to http://apps.finra.org/fundanalyzer/1/fa.aspx.
The Series' policies and procedures for voting proxies for portfolio securities and information about how the Series voted proxies related to its portfolio securities during the 12-month period ended June 30 are available on our Web site — www.dws-investments.com (click on "proxy voting"at the bottom of the page) — or on the SEC's Web site — www.sec.gov. To obtain a written copy of the Series' policies and procedures without charge, upon request, call us toll free at (800) 728-3337.
Summary of Management Fee Evaluation by Independent Fee Consultant
September 17, 2012
Pursuant to an Order entered into by Deutsche Investment Management Americas and affiliates (collectively, "DeAM") with the Attorney General of New York, I, Thomas H. Mack, have been appointed the Independent Fee Consultant for the DWS Funds (formerly the DWS Scudder Funds). My duties include preparing an annual written evaluation of the management fees DeAM charges the Funds, considering among other factors the management fees charged by other mutual fund companies for like services, management fees DeAM charges other clients for like services, DeAM's costs of supplying services under the management agreements and related profit margins, possible economies of scale if a Fund grows larger, and the nature and quality of DeAM's services, including fund performance. This report summarizes my evaluation for 2012, including my qualifications, the evaluation process for each of the DWS Funds, consideration of certain complex-level factors, and my conclusions. I served in substantially the same capacity in 2007, 2008, 2009, 2010 and 2011.
Qualifications
For more than 35 years I have served in various professional capacities within the investment management business. I have held investment analysis and advisory positions, including securities analyst, portfolio strategist and director of investment policy with a large investment firm. I have also performed business management functions, including business development, financial management and marketing research and analysis.
Since 1991, I have been an independent consultant within the asset management industry. I have provided services to over 125 client organizations, including investment managers, mutual fund boards, product distributors and related organizations. Over the past ten years I have completed a number of assignments for mutual fund boards, specifically including assisting boards with management contract renewal.
I hold a Master of Business Administration degree, with highest honors, from Harvard University and Master of Science and Bachelor of Science (highest honors) degrees from the University of California at Berkeley. I am an independent director and audit committee financial expert for two closed-end mutual funds and have served in various leadership and financial oversight capacities with non-profit organizations.
Evaluation of Fees for each DWS Fund
My work focused primarily on evaluating, fund-by-fund, the fees charged to each of the 103 mutual fund portfolios in the DWS Fund family. For each Fund, I considered each of the key factors mentioned above, as well as any other relevant information. In doing so I worked closely with the Funds' Independent Directors in their annual contract renewal process, as well as in their approval of contracts for several new funds (documented separately).
In evaluating each Fund's fees, I reviewed comprehensive materials provided by or on behalf of DeAM, including expense information prepared by Lipper Analytical, comparative performance information, profitability data, manager histories, and other materials. I also accessed certain additional information from the Lipper and Morningstar databases and drew on my industry knowledge and experience.
To facilitate evaluating this considerable body of information, I prepared for each Fund a document summarizing the key data elements in each area as well as additional analytics discussed below. This made it possible to consider each key data element in the context of the others.
In the course of contract renewal, DeAM agreed to implement a number of fee and expense adjustments requested by the Independent Directors which will favorably impact future fees and expenses, and my evaluation includes the effects of these changes.
Fees and Expenses Compared with Other Funds
The competitive fee and expense evaluation for each fund focused on two primary comparisons:
The Fund's contractual management fee (the advisory fee plus the administration fee where applicable) compared with those of a group of typically 12-15 funds in the same Lipper investment category (e.g. Large Capitalization Growth) having similar distribution arrangements and being of similar size.
The Fund's total expenses compared with a broader universe of funds from the same Lipper investment category and having similar distribution arrangements.
These two comparisons provide a view of not only the level of the fee compared with funds of similar scale but also the total expense the Fund bears for all the services it receives, in comparison with the investment choices available in the Fund's investment category and distribution channel. The principal figure-of-merit used in these comparisons was the subject Fund's percentile ranking against peers.
DeAM's Fees for Similar Services to Others
DeAM provided management fee schedules for all of its US domiciled fund and non-fund investment management accounts in any of the investment categories where there is a DWS Fund. These similar products included the other DWS Funds, non-fund pooled accounts, institutional accounts and sub-advisory accounts. Using this information, I calculated for each Fund the fee that would be charged to each similar product, at the subject Fund's asset level.
Evaluating information regarding non-fund products is difficult because there are varying levels of services required for different types of accounts, with mutual funds generally requiring considerably more regulatory and administrative types of service as well as having more frequent cash flows than other types of accounts. Also, while mutual fund fees for similar fund products can be expected to be similar, there will be some differences due to different pricing conditions in different distribution channels (e.g. retail funds versus those used in variable insurance products), differences in underlying investment processes and other factors.
Costs and Profit Margins
DeAM provided a detailed profitability analysis for each Fund. After making some adjustments so that the presentation would be more comparable to the available industry figures, I reviewed profit margins from investment management alone, from investment management plus other fund services (excluding distribution) provided to the Funds by DeAM (principally shareholder services), and DeAM profits from all sources, including distribution. A later section comments on overall profitability.
Economies of Scale
Economies of scale — an expected decline in management cost per dollar of fund assets as fund assets grow — are very rarely quantified and documented because of inherent difficulties in collecting and analyzing relevant data. However, in virtually every investment category that I reviewed, larger funds tend to have lower fees and lower total expenses than smaller funds. To see how each DWS Fund compares with this industry observation, I reviewed:
The trend in Fund assets over the last five years and the accompanying trend in total expenses. This shows if the Fund has grown and, if so, whether total expense (management fees as well as other expenses) have declined as a percent of assets.
Whether the Fund has break-points in its management fee schedule, the extent of the fee reduction built into the schedule and the asset levels where the breaks take effect, and in the case of a sub-advised Fund how the Fund's break-points compare with those of the sub-advisory fee schedule.
How the Fund's contractual fee schedule compares with trends in the industry data. To accomplish this, I constructed a chart showing how actual latest-fiscal-year contractual fees of the Fund and of other similar funds relate to average fund assets, with the subject Fund's contractual fee schedule superimposed.
Quality of Service — Performance
The quality-of-service evaluation focused on investment performance, which is the principal result of the investment management service. Each Fund's performance was reviewed over the past 1, 3, 5 and 10 years, as applicable, and compared with that of other funds in the same investment category and with a suitable market index.
In addition, I calculated and reviewed risk-adjusted returns relative to an index of similar mutual funds' returns and a suitable market index. The risk-adjusted returns analysis provides a way of determining the extent to which the Fund's return comparisons are mainly the product of investment value-added (or lack thereof) or alternatively taking considerably more or less risk than is typical in its investment category.
I also received and considered the history of portfolio manager changes for each Fund, as this provided an important context for evaluating the performance results.
Complex-Level Considerations
While this evaluation was conducted mainly at the individual fund level, there are some issues relating to the reasonableness of fees that can alternatively be considered across the whole fund complex:
I reviewed DeAM's profitability analysis for all DWS Funds, with a view toward determining if the allocation procedures used were reasonable and how profit levels compared with public data for other investment managers.
I considered whether DeAM and affiliates receive any significant ancillary or "fallout" benefits that should be considered in interpreting the direct profitability results. These would be situations where serving as the investment manager of the Funds is beneficial to another part of the Deutsche Bank organization.
I considered how aggregated DWS Fund expenses had varied over the years, by asset class and in the context of trends in asset levels.
I considered how aggregated DWS Fund performance measures relative to appropriate peers had varied by asset class and over time.
I reviewed the structure of the DeAM organization, trends in staffing levels, and information on compensation of investment management and other professionals compared with industry data.
Findings
Based on the process and analysis discussed above, which included reviewing a wide range of information from management and external data sources and considering among other factors the fees DeAM charges other clients, the fees charged by other fund managers, DeAM's costs and profits associated with managing the Funds, economies of scale, possible fall-out benefits, and the nature and quality of services provided, in my opinion the management fees charged the DWS Funds are reasonable.
Thomas H. Mack
President, Thomas H. Mack & Co., Inc.
DWS Investments Distributors, Inc.
222 South Riverside Plaza
Chicago, IL 60606
(800) 621-1148
VS1int-3 (R-028378-2 8/13)
| | |
| ITEM 2. | CODE OF ETHICS |
| | |
| | Not applicable. |
| | |
| ITEM 3. | AUDIT COMMITTEE FINANCIAL EXPERT |
| | |
| | Not applicable |
| | |
| ITEM 4. | PRINCIPAL ACCOUNTANT FEES AND SERVICES |
| | |
| | Not applicable |
| | |
| ITEM 5. | AUDIT COMMITTEE OF LISTED REGISTRANTS |
| | |
| | Not applicable |
| | |
| ITEM 6. | SCHEDULE OF INVESTMENTS |
| | |
| | Not applicable |
| | |
| ITEM 7. | DISCLOSURE OF PROXY VOTING POLICIES AND PROCEDURES FOR CLOSED-END MANAGEMENT INVESTMENT COMPANIES |
| | |
| | Not applicable |
| | |
| ITEM 8. | PORTFOLIO MANAGERS OF CLOSED-END MANAGEMENT INVESTMENT COMPANIES |
| | |
| | Not applicable |
| | |
| ITEM 9. | PURCHASES OF EQUITY SECURITIES BY CLOSED-END MANAGEMENT INVESTMENT COMPANY AND AFFILIATED PURCHASERS |
| | |
| | Not applicable |
| | |
| ITEM 10. | SUBMISSION OF MATTERS TO A VOTE OF SECURITY HOLDERS |
| | |
| | There were no material changes to the procedures by which shareholders may recommend nominees to the Fund’s Board. The primary function of the Nominating and Governance Committee is to identify and recommend individuals for membership on the Board and oversee the administration of the Board Governance Guidelines. Shareholders may recommend candidates for Board positions by forwarding their correspondence by U.S. mail or courier service to Kenneth C. Froewiss, Independent Chairman, DWS Mutual Funds, P.O. Box 78, Short Hills, NJ 07078. |
| | |
| ITEM 11. | CONTROLS AND PROCEDURES |
| | |
| | (a) | The Chief Executive and Financial Officers concluded that the Registrant’s Disclosure Controls and Procedures are effective based on the evaluation of the Disclosure Controls and Procedures as of a date within 90 days of the filing date of this report. |
| | |
| | (b) | There have been no changes in the registrant’s internal control over financial reporting that occurred during the second fiscal quarter of the period covered by this report that has materially affected, or is reasonably likely to materially affect, the registrant’s internal controls over financial reporting. |
| | |
| ITEM 12. | EXHIBITS |
| | |
| | (a)(1) | Certification pursuant to Rule 30a-2(a) under the Investment Company Act of 1940 (17 CFR 270.30a-2(a)) is filed and attached hereto as Exhibit 99.CERT. |
| | |
| | (b) | Certification pursuant to Rule 30a-2(b) under the Investment Company Act of 1940 (17 CFR 270.30a-2(b)) is furnished and attached hereto as Exhibit 99.906CERT. |
Form N-CSRS Item F
SIGNATURES
Pursuant to the requirements of the Securities Exchange Act of 1934 and the Investment Company Act of 1940, the registrant has duly caused this report to be signed on its behalf by the undersigned, thereunto duly authorized.
| Registrant: | DWS Variable Series I |
| | |
| | |
| By: | /s/W. Douglas Beck W. Douglas Beck President |
| | |
| Date: | August 19, 2013 |
Pursuant to the requirements of the Securities Exchange Act of 1934 and the Investment Company Act of 1940, this report has been signed below by the following persons on behalf of the registrant and in the capacities and on the dates indicated.
| By: | /s/W. Douglas Beck W. Douglas Beck President |
| | |
| Date: | August 19, 2013 |
| | |
| | |
| | |
| By: | /s/Paul Schubert Paul Schubert Chief Financial Officer and Treasurer |
| | |
| Date: | August 19, 2013 |