UNITED STATES
SECURITIES AND EXCHANGE COMMISSION
Washington, D.C. 20549
FORM N-CSR
CERTIFIED SHAREHOLDER REPORT OF REGISTERED
MANAGEMENT INVESTMENT COMPANIES
Investment Company Act file number: 811-04323
Natixis Funds Trust I
(Exact name of Registrant as specified in charter)
888 Boylston Street, Suite 800 Boston, Massachusetts 02199-8197
(Address of principal executive offices) (Zip code)
Russell L. Kane, Esq.
Natixis Distribution, L.P.
888 Boylston Street, Suite 800
Boston, Massachusetts 02199-8197
(Name and address of agent for service)
Registrant’s telephone number, including area code: (617) 449-2822
Date of fiscal year end: September 30
Date of reporting period: September 30, 2017
Item 1. Reports to Stockholders.
The Registrant’s annual report transmitted to shareholders pursuant to Rule 30e-1 under the Investment Company Act of 1940 is as follows:
ANNUAL REPORT
September 30, 2017

Loomis Sayles High Income Fund
Loomis Sayles Intermediate Duration Bond Fund
Loomis Sayles Limited Term Government
and Agency Fund

TABLE OF CONTENTS
Portfolio Review page 1
Portfolio of Investments page 23
Financial Statements page 63
Notes to Financial Statements page 79
Shareholder Supplement enclosed
| (previously | posted to the Funds’ website) |
LOOMIS SAYLES HIGH INCOME FUND
| | |
| Managers | | Symbols |
| Matthew J. Eagan, CFA® | | Class A NEFHX |
| Elaine M. Stokes | | Class C NEHCX |
| Loomis, Sayles & Company, L.P. | | Class N LSHNX |
| | Class Y NEHYX |
Investment Goal
The Fund seeks high current income plus the opportunity for capital appreciation to produce a high total return.
Market Conditions
Following the November 2016 US presidential election, investors expected less accommodative US monetary policy and pro-business reform. These expectations drove the US dollar and equities higher, and weighed on many fixed income assets as the US Treasury yield curve steepened (a curve that shows the relationship among bond yields across the maturity spectrum). The Federal Reserve (Fed) raised interest rates on December 14, 2016, March 15, 2017 and June 14, 2017; investors took the increases in stride as a number of developments supported fixed income market performance through the rest of the period. The yield curve flattened out, the US dollar declined, global growth strengthened and corporate profits rebounded. Government bond yields remained low, driving investors into riskier assets like high yield credit and emerging markets. As a result, nearly all asset classes posted positive returns for the full period.
All US Treasury yields rose during the 12-month period. However, much of the rise in longer-maturity yields took place shortly after the US presidential election while the two-year yield rose steadily over the entire period. Longer-term US Treasury yields declined from the start of 2017 until early September, when expectations for new and expansionary US fiscal policy and inflation began to rise.
Overall, investment grade corporate bonds generated positive return and outperformed duration-matched Treasuries (duration refers to a security’s price sensitivity to interest rate changes). The sector’s longer duration was beneficial as investors moved to the long end of the yield curve. High yield credit was a leading asset class throughout the period, benefiting from the “risk-on” environment and the search for yield. Improving corporate profits around the globe provided an additional tailwind to the sector.
After hitting a 14-year high during the fourth quarter of 2016, the US dollar steadily weakened through the rest of the period as risk appetite remained strong and fears about China’s economy and the potential for a US trade war waned. Many developed and emerging market currencies rallied versus the US dollar and unhedged returns were broadly positive. Emerging market bonds struggled at the beginning of the period, hurt by uncertainties related to global trade, the incoming US administration and geopolitics. But as 2017 progressed, sentiment shifted, emerging market bonds rallied and the asset class
1 |
posted broadly positive returns for the full period. The sector benefited from the weakening US dollar, a rebound in corporate profits, and improving emerging market GDP growth.
Portfolio Review
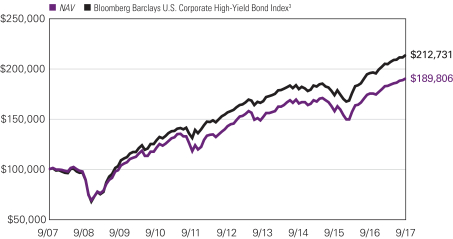
For the 12 months ended September 30, 2017, Class Y shares of Loomis Sayles High Income Fund returned 8.47% at net asset value. The Fund underperformed its benchmark, the Bloomberg Barclays U.S. Corporate High-Yield Bond Index, which returned 8.88%.
Explanation of Fund Performance
Security selection within high yield corporate credit was a leading contributor to results, with positive contributions from energy, metals and mining, and pharmaceuticals names. An out-of-benchmark allocation to convertible securities also contributed to performance, led by pharmaceutical and technology holdings. In addition, security selection among securitized assets aided results. Finally, an out-of-benchmark allocation to investment grade corporate bonds generated positive return.
The Fund’s out-of-benchmark exposure to equities was the most significant detractor from performance. Selected energy-related equity holdings were among the biggest laggards. An allocation to reserves (typically cash, cash equivalents and short-dated US Treasuries) also weighed on performance.
Outlook
Fund positioning reflects our outlook for stable economic growth and inflation. US and global GDP growth are steadily improving, and US inflation indicators are below Fed and consensus expectations. These inflationary trends support the Fed’s gradual shift to less accommodative monetary policy. The Fed’s balance sheet normalization program formally starts in October, and one more interest rate hike looks possible by year-end.
Steady economic growth is also supporting risk assets, and we are maintaining our exposure to corporate bonds. Spreads (the difference in yield between non-Treasury and Treasury securities of similar maturity) have tightened significantly, and the risk premiums for the investment grade and high yield markets are lower with increasing downside risks.
Within the high yield sector, we believe valuations have become less compelling, and we do not expect broad-based price appreciation from current levels. The underlying fundamentals of the sector remain supportive given the positive outlook for corporate profits and the low probability of defaults or economic recession. At this stage of the credit cycle1, we are seeing increasing debt levels, but overall, balance sheets remain healthy and interest rate coverage is strong. We are watching for idiosyncratic risk factors or volatility that may allow us to selectively add to existing positions or establish exposure to new issues. In general, we are focusing on undervalued issues and looking for areas where we can move up in quality.
We have been taking a highly selective approach to non-US exposure. We are primarily maintaining current allocations to selected developed market sovereign and credit positions, along with emerging market local-pay bonds that we believe offer attractive yields and total return potential. The risk profile of the global market has been largely
| 2
LOOMIS SAYLES HIGH INCOME FUND
driven by anticipated central bank action, election cycles, geopolitical risks and trade policy uncertainty. In the current global growth environment, the US dollar is likely to be range bound and it may trend lower over the near term.
Looking ahead, our investment themes are centered on broadening portfolio diversification, generating income, lowering duration and reducing overall interest rate sensitivity. In terms of asset allocation, the Fund is structurally very different from the benchmark and is well-positioned going into the Fund’s next fiscal year, in our view. We are also comfortable keeping a larger allocation to reserve-type positions, and we will patiently monitor market developments for better buying opportunities where we feel we can add long-term value for our investors.
During periods in which the US dollar appreciates relative to foreign currencies, funds that hold non-US-dollar-denominated bonds may realize currency losses in connection with the maturity or sale of certain bonds. These losses impact a fund’s ordinary income distributions (to the extent that losses are not offset by realized currency gains within the fund’s fiscal year). A recognized currency loss, in accordance with federal tax rules, decreases the amount of ordinary income a fund has available to distribute, even though these bonds continue to generate coupon income.
Fund officers have analyzed the Fund’s current portfolio of investments, its schedule of maturities and the corresponding amounts of unrealized currency losses that may become realized in the fiscal year ending on September 30, 2018. Based on this analysis, Fund officers believe that realized currency losses may have less of an impact on this Fund’s distributions in the 2018 fiscal year. This analysis is based on certain assumptions, including but not limited to the level of foreign currency exchange rates, security prices, interest rates, fund advisors’ ability to manage realized currency losses and the net asset level of the Fund. Changes to these assumptions could materially impact the analysis and the amounts of future Fund distributions. Fund officers will continue to monitor on a regular basis and take the necessary actions required to manage the Fund’s distributions to address realized currency losses while seeking to avoid a return of capital distribution.
| 1 | A credit cycle is a cyclical pattern that follows credit availability and corporate health. |
3 |
Hypothetical Growth of $100,000 Investment in Class Y Shares1,4
September 30, 2007 through September 30, 2017
See notes to chart on page 5.
| 4
LOOMIS SAYLES HIGH INCOME FUND
Average Annual Total Returns — September 30, 20174
| | | | | | | | | | | | | | | | | | | | | | | | |
| | | | | | | | | | | | | | | Expense Ratios5 | |
| | | 1 Year | | | 5 Years | | | 10 Years | | | Life of Class N | | | Gross | | | Net | |
| | | | | | | |
| Class Y (Inception 2/29/08)1 | | | | | | | | | | | | | | | | | | | | | | | | |
| NAV | | | 8.47 | % | | | 5.89 | % | | | 6.62 | % | | | — | % | | | 0.89 | % | | | 0.80 | % |
| | | | | | | |
| Class A (Inception 2/22/84) | | | | | | | | | | | | | | | | | | | | | | | | |
| NAV | | | 8.17 | | | | 5.60 | | | | 6.38 | | | | — | | | | 1.14 | | | | 1.05 | |
| With 4.25% Maximum Sales Charge | | | 3.52 | | | | 4.71 | | | | 5.91 | | | | — | | | | | | | | | |
| | | | | | | |
| Class C (Inception 3/2/98) | | | | | | | | | | | | | | | | | | | | | | | | |
| NAV | | | 7.33 | | | | 4.80 | | | | 5.59 | | | | — | | | | 1.89 | | | | 1.80 | |
| With CDSC2 | | | 6.33 | | | | 4.80 | | | | 5.59 | | | | — | | | | | | | | | |
| | | | | | | |
| Class N (Inception 11/30/16) | | | | | | | | | | | | | | | | | | | | | | | | |
| NAV | | | — | | | | — | | | | — | | | | 8.99 | | | | 0.77 | | | | 0.75 | |
| | | | | | | |
| Comparative Performance | | | | | | | | | | | | | | | | | | | | | | | | |
| Bloomberg Barclays U.S. Corporate High-Yield Bond Index3 | | | 8.88 | | | | 6.36 | | | | 7.84 | | | | 5.37 | | | | | | | | | |
Performance data shown represents past performance and is no guarantee of, and not necessarily indicative of, future results. Total return and value will vary, and you may have a gain or loss when shares are sold. Current performance may be lower or higher than quoted. For most recent month-end performance, visit im.natixis.com. Performance for other share classes will be greater or less than shown based on differences in fees and sales charges. You may not invest directly in an index. Performance for periods less than one year is cumulative, not annualized. Returns reflect changes in share price and reinvestment of dividends and capital gains, if any. The table(s) do not reflect taxes shareholders might owe on any fund distributions or when they redeem their shares.
| 1 | Prior to the inception of Class Y shares (2/29/08), performance is that of Class A shares, and reflects the higher net expenses of that share class. |
| 2 | Class C shares performance assumes a 1% CDSC applied when you sell shares within one year of purchase. |
| 3 | The Bloomberg Barclays U.S. Corporate High-Yield Bond Index measures the market of USD-denominated, non-investment grade, fixed-rate, taxable corporate bonds. Securities are classified as high yield if the middle rating of Moody’s, Fitch, and S&P is Ba1/BB /BB or below, excluding emerging market debt. The Bloomberg Barclays U.S. Corporate High-Yield Bond Index was created in 1986, with history backfilled to July 1, 1983, and rolls up into the Bloomberg Barclays U.S. Universal and Global High-Yield Indices. You may not invest directly in an index. |
| 4 | Fund performance has been increased by fee waivers and/or expense reimbursements, if any, without which performance would have been lower. |
| 5 | Expense ratios are as shown in the Fund’s prospectus in effect as of the date of this report. The expense ratios for the current reporting period can be found in the Financial Highlights section of this report under Ratios to Average Net Assets. Net expenses reflect contractual expense caps set to expire on 1/31/19. When a Fund’s expenses are below the cap, gross and net expense ratios will be the same. See Note 6 of the Notes to Financial Statements for more information about the Fund’s expense caps. |
5 |
LOOMIS SAYLES INTERMEDIATE DURATION BOND FUND
| | |
| Managers | | Symbols |
| Christopher T. Harms | | Class A LSDRX |
| Clifton V. Rowe, CFA® | | Class C LSCDX |
| Kurt L. Wagner, CFA®, CIC | | Class Y LSDIX |
Investment Goal
The Fund’s investment objective is above-average total return through a combination of current income and capital appreciation.
Market Conditions
Following the November 2016 US presidential election, investors expected less accommodative US monetary policy and pro-business reform. These expectations drove the US dollar and equities higher, and weighed on many fixed income assets as the US Treasury yield curve steepened (a curve that shows the relationship among bond yields across the maturity spectrum). The Federal Reserve (Fed) raised interest rates on December 14, 2016, March 15, 2017 and June 14, 2017; investors took the increases in stride as a number of developments supported fixed income market performance through the rest of the period. The yield curve flattened out, the US dollar declined, global growth strengthened and corporate profits rebounded. Government bond yields remained low, driving investors into riskier assets such as high yield credit and emerging markets. As a result, nearly all asset classes posted positive returns for the full period.
All US Treasury yields rose during the 12-month period. However, much of the rise in longer-maturity yields took place shortly after the US presidential election while the two-year yield rose steadily over the entire period. Longer-term US Treasury yields declined from the start of 2017 until early September, when expectations for new and expansionary US fiscal policy and inflation began to rise.
Overall, investment grade corporate bonds generated positive return and outperformed duration-matched Treasuries (duration refers to a security’s price sensitivity to interest rate changes). The sector’s longer duration was beneficial as investors moved to the long end of the yield curve.
High yield credit was a leading asset class throughout the period, benefiting from the “risk-on” environment and the search for yield. Improving corporate profits around the globe provided an additional tailwind to the sector.
Securitized credit assets generated positive total returns and outperformed duration-matched Treasuries. In September 2017, volatility remained muted after the Fed announced it would start tapering mortgage-backed security (MBS) reinvestments in October 2017; the move had been well telegraphed and was largely expected.
| 6
LOOMIS SAYLES INTERMEDIATE DURATION BOND FUND
Performance Results
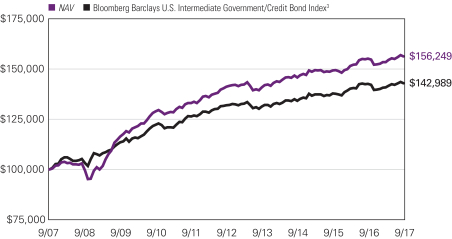
For the 12 months ended September 30, 2017, Class Y shares of Loomis Sayles Intermediate Duration Bond Fund returned 0.69% at net asset value. The Fund outperformed its benchmark, the Bloomberg Barclays U.S. Intermediate Government/Credit Bond Index, which returned 0.23%.
Explanation of Fund Performance
Overall, the Fund’s tilt away from risk-free assets and into spread sectors (non-government sectors) contributed the most to performance. A meaningful underweight to US Treasuries proved to help performance as much as the Fund’s overweight to investment grade corporate bonds.
Within investment grade corporate bonds, the Fund’s overweight to financials and security selection within industrial bonds drove performance during the period.
The Fund’s exposure to non-agency securitized credit contributed to absolute return during the period and had a significant impact on relative performance. Holdings of asset-backed securities (ABS) proved to be a positive contributor to relative return, and our allocation to commercial mortgage-backed securities (CMBS) also generated positive relative results.
The Fund’s underweight exposure to government-related securities detracted slightly from relative performance. While the Fund’s interest-rate sensitivity was similar to the benchmark during a period of rising interest rates, differences in the Fund’s interest rate sensitivity at various points on the yield curve slightly weighed on relative return.
Outlook
We believe that the Fed will tighten monetary conditions in a gradual and measured way as aggregate demand remains healthy, with the third hike of 2017 coming in December. The Fed began balance sheet reductions in October. We expect the market reaction to this activity to remain contained, given the well-telegraphed taper “caps” on both US Treasuries and MBS.
Corporate fundamentals have continued to indicate the United States is in the late expansion phase of the credit cycle,1 with slowing margin growth, increased mergers and acquisitions and rising leverage. Our view is that the cycle will continue to evolve slowly. The Trump administration may implement fiscal programs and tax reforms that could support asset classes like credit, although any impact is likely a 2018 event.
Any reductions in corporate borrowing may preserve balance sheet health, promoting tighter credit spreads (the difference in yield between non-Treasury and Treasury yields of similar maturity) and lower default rates. While valuations may not be as attractive as they were last year, we continue to favor investment grade credit. We believe the primary risks to the credit markets include the pace of global growth, the timing of Fed tightening, shareholder-friendly activity and commodity price volatility.
We remain underweight government bonds given low yields and continue to favor sectors offering a yield advantage over Treasuries. We continue to be modestly overweight credit.
7 |
We are focused on security selection opportunities, buying new issues with concessions and secondary bonds that can offer favorable risk-return profiles.
We believe valuations in CMBS are fair. We continue to maintain an overweight to the sector, particularly senior parts of the capital stack. We think many areas of the MBS market appear overvalued and do not adequately compensate for prepayment risk. We are focused on securities with limited prepayment risk. The high-quality ABS sector remains attractive relative to government bonds. We are maintaining our exposure to the consumer through prime and subprime auto loans and credit card receivables.
The Fund continues to have a yield advantage and exposure to more credit-sensitive sectors relative to the benchmark. Finally, we continue to monitor and diversify our portfolios and holdings with an eye toward minimizing undue exposure to macro and/or issuer events.
| 1 | A credit cycle is a cyclical pattern that follows credit availability and corporate health. |
Hypothetical Growth of $100,000 Investment in Class Y Shares1,4,5
September 30, 2007 through September 30, 2017
See notes to chart on page 9.
| 8
LOOMIS SAYLES INTERMEDIATE DURATION BOND FUND
Average Annual Total Returns — September 30, 20174,5
| | | | | | | | | | | | | | | | | | | | |
| | | | | |
| | | | | | | | | | | | Expense Ratios6 | |
| | | 1 Year | | | 5 Years | | | 10 Years | | | Gross | | | Net | |
| | | | | | |
| Class Y (Inception 1/28/98)1 | | | | | | | | | | | | | | | | | | | | |
| NAV | | | 0.69 | % | | | 2.05 | % | | | 4.56 | % | | | 0.47 | % | | | 0.40 | % |
| | | | | | |
| Class A (Inception 5/28/10)1 | | | | | | | | | | | | | | | | | | | | |
| NAV | | | 0.44 | | | | 1.79 | | | | 4.30 | | | | 0.72 | | | | 0.65 | |
| With 4.25% Maximum Sales Charge | | | -3.86 | | | | 0.91 | | | | 3.85 | | | | | | | | | |
| | | | | | |
| Class C (Inception 8/31/16)1 | | | | | | | | | | | | | | | | | | | | |
| NAV | | | -0.29 | | | | 1.01 | | | | 3.37 | | | | 1.56 | | | | 1.40 | |
| With CDSC2 | | | -1.27 | | | | 1.01 | | | | 3.37 | | | | | | | | | |
| | | | | | |
| Comparative Performance | | | | | | | | | | | | | | | | | | | | |
| Bloomberg Barclays U.S. Intermediate Government/Credit Bond Index3 | | | 0.23 | | | | 1.61 | | | | 3.64 | | | | | | | | | |
Performance data shown represents past performance and is no guarantee of, and not necessarily indicative of, future results. Total return and value will vary, and you may have a gain or loss when shares are sold. Current performance may be lower or higher than quoted. For most recent month-end performance, visit im.natixis.com. Performance for other share classes will be greater or less than shown based on differences in fees and sales charges. You may not invest directly in an index. Performance for periods less than one year is cumulative, not annualized. Returns reflect changes in share price and reinvestment of dividends and capital gains, if any. The table(s) do not reflect taxes shareholders might owe on any fund distributions or when they redeem their shares.
| 1 | Effective August 31, 2016, the Fund’s Retail Class shares and Institutional Class shares were redesignated as Class A shares and Class Y shares, respectively. Accordingly, the returns shown in the table for Class A shares prior to August 31, 2016 are those of Retail Class shares, restated to reflect the sales loads of Class A shares, and the returns in the table for Class Y shares prior to August 31, 2016 are those of Institutional Class shares. Prior to the inception of Retail Class shares (May 28, 2010), performance is that of Institutional Class shares, restated to reflect the higher net expenses and sales loads of Class A shares. Prior to the inception of Class C shares (August 31, 2016), performance is that of Retail Class shares, restated to reflect the higher net expenses and sales loads of Class C shares. |
| 2 | Class C shares performance assumes a 1% CDSC applied when you sell shares within one year of purchase. |
| 3 | The Bloomberg Barclays U.S. Intermediate Government/Credit Bond Index includes securities in the intermediate maturity range with in the Government and Credit Indices. The Government Index includes treasuries (i.e., public obligations of the U.S. Treasury that have remaining maturities of more than one year) and agencies (i.e., publicly issued debt of U.S. Government agencies, quasi-federal corporations, and corporate or foreign debt guaranteed by the U.S. Government). The Credit Index includes publicly issued U.S. corporate and foreign debentures and secured notes that meet specified maturity, liquidity, and quality requirements. You may not invest directly in an index. |
| 4 | The Fund revised its investment strategy on May 28, 2010; performance may have been different had the current investment strategy been in place for all periods shown. |
| 5 | Fund performance has been increased by fee waivers and/or expense reimbursements, if any, without which performance would have been lower. |
| 6 | Expense ratios are as shown in the Fund’s prospectus in effect as of the date of this report. The expense ratios for the current reporting period can be found in the Financial Highlights section of this report under Ratios to Average Net Assets. Net expenses reflect contractual expense caps set to expire on 1/31/18. When a Fund’s expenses are below the cap, gross and net expense ratios will be the same. See Note 6 of the Notes to Financial Statements for more information about the Fund’s expense caps. |
9 |
LOOMIS SAYLES LIMITED TERM GOVERNMENT AND AGENCY FUND
| | |
| Managers | | Symbols |
| Christopher T. Harms | | Class A NEFLX |
| Clifton V. Rowe, CFA® | | Class C NECLX |
| Kurt L. Wagner, CFA®, CIC | | Class N LGANX |
| Loomis, Sayles & Company, L.P. | | Class Y NELYX |
Investment Goal
The Fund seeks a high current return consistent with preservation of capital.
Market Conditions
Following the November 2016 US presidential election, investors expected less accommodative US monetary policy and pro-business reform. These expectations drove the US dollar and equities higher, and weighed on many fixed income assets as the US Treasury yield curve steepened (a curve that shows the relationship among bond yields across the maturity spectrum). The Federal Reserve (Fed) raised interest rates in December 2016 and in March and June 2017; investors took the increases in stride as a number of developments supported fixed income market performance through the rest of the period. The yield curve flattened out, the US dollar declined, global growth strengthened and corporate profits rebounded. Government bond yields remained low, driving investors into riskier assets such as high yield credit and emerging markets. As a result, nearly all asset classes posted positive returns for the full period.
All US Treasury yields rose during the 12-month period. However, much of the rise in longer-maturity yields took place shortly after the US presidential election while the two-year yield rose steadily over the entire period. Longer-term US Treasury yields declined from the start of 2017 until early September, when expectations for new and expansionary US fiscal policy and inflation began to rise.
Securitized credit assets generated positive total returns and outperformed duration-matched Treasuries (duration refers to a security’s price sensitivity to interest rate changes). In September 2017, volatility remained muted after the Fed announced it would start tapering its mortgage-backed security (MBS) reinvestments in October 2017; the move had been well telegraphed and was largely expected.
Performance Results
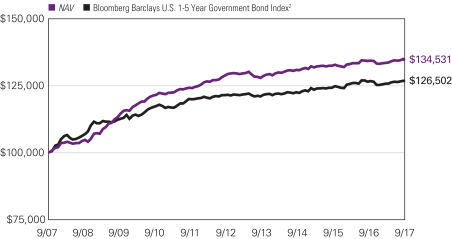
For the 12 months ended September 30, 2017, Class Y shares of Loomis Sayles Limited Term Government and Agency Fund returned 0.22% at net asset value. The Fund outperformed its benchmark, the Bloomberg Barclays U.S. 1–5 Year Government Bond Index, which returned -0.06%.
Explanation of Fund Performance
Within securitized assets, a significant allocation to agency collateralized mortgage obligations (CMOs) made the largest positive contribution to relative performance. Agency
| 10
LOOMIS SAYLES LIMITED TERM GOVERNMENT AND AGENCY FUND
MBS was another one of the Fund’s larger allocations over the 12 months. These securities helped performance but to a lesser degree than CMO securities.
The Fund’s allocation to agency and non-agency commercial mortgage-backed securities (CMBS) generated positive absolute and relative performance. These bonds considerably outperformed Treasuries of comparable duration. Out-of-benchmark exposure to asset-backed securities (ABS) also boosted relative performance as selected car loan names performed particularly well.
Conversely, an underweight allocation to bonds issued by federal government agencies slightly detracted from performance for the period.
Outlook
Agency MBS spreads (the difference in yield between agency MBS and Treasuries of similar maturity) are narrow relative to history. Additionally, refinancing risk is beginning to increase, as mortgages issued in recent years are of relatively high quality compared with those issued in earlier years. Therefore, we favor an underweight to recently issued 30-year MBS and prefer sectors less likely to face refinancing risk, such as low loan balance mortgages and home equity conversion mortgages.
Within the commercial real estate sector, top-tier assets and markets have generally recovered and are at or above prior peak levels. We believe investment grade CMBS remain attractive.
We believe ABS currently offer an attractive combination of strong credit quality and enhanced yield. We favor higher yielding securities and bonds of less frequent issuers. Our analysis indicates the credit risk of these securities is inefficiently priced and they offer potentially attractive opportunities for additional yield.
11 |
Hypothetical Growth of $100,000 Investment in Class Y Shares3
September 30, 2007 through September 30, 2017
See notes to chart on page 13.
| 12
LOOMIS SAYLES LIMITED TERM GOVERNMENT AND AGENCY FUND
Average Annual Total Returns — September 30, 20173
| | | | | | | | | | | | | | | | | | | | | | | | |
| | | | | | | | | | | | | | | Expense Ratios4 | |
| | | 1 Year | | | 5 Years | | | 10 Years | | | Life of Class N | | | Gross | | | Net | |
| | | | | | | |
| Class Y (Inception 3/31/94) | | | | | | | | | | | | | | | | | | | | | | | | |
| NAV | | | 0.22 | % | | | 0.81 | % | | | 3.01 | % | | | — | % | | | 0.52 | % | | | 0.52 | % |
| | | | | | | |
| Class A (Inception 1/3/89) | | | | | | | | | | | | | | | | | | | | | | | | |
| NAV | | | -0.04 | | | | 0.55 | | | | 2.74 | | | | — | | | | 0.77 | | | | 0.77 | |
| With 2.25% Maximum Sales Charge | | | -2.25 | | | | 0.09 | | | | 2.51 | | | | — | | | | | | | | | |
| | | | | | | |
| Class C (Inception 12/30/94) | | | | | | | | | | | | | | | | | | | | | | | | |
| NAV | | | -0.79 | | | | -0.20 | | | | 1.99 | | | | — | | | | 1.52 | | | | 1.52 | |
| With CDSC1 | | | -1.77 | | | | -0.20 | | | | 1.99 | | | | — | | | | | | | | | |
| | | | | | | |
| Class N (Inception 2/1/17) | | | | | | | | | | | | | | | | | | | | | | | | |
| NAV | | | — | | | | — | | | | — | | | | 1.12 | | | | 0.44 | | | | 0.44 | |
| | | | | | | |
| Comparative Performance | | | | | | | | | | | | | | | | | | | | | | | | |
| Bloomberg Barclays U.S. 1-5 Year Government Bond Index2 | | | -0.06 | | | | 0.83 | | | | 2.38 | | | | 0.94 | | | | | | | | | |
Performance data shown represents past performance and is no guarantee of, and not necessarily indicative of, future results. Total return and value will vary, and you may have a gain or loss when shares are sold. Current performance may be lower or higher than quoted. For most recent month-end performance, visit im.natixis.com. Performance for other share classes will be greater or less than shown based on differences in fees and sales charges. You may not invest directly in an index. Performance for periods less than one year is cumulative, not annualized. Returns reflect changes in share price and reinvestment of dividends and capital gains, if any. The table(s) do not reflect taxes shareholders might owe on any fund distributions or when they redeem their shares.
| 1 | Class C shares performance assumes a 1% CDSC applied when you sell shares within one year of purchase. |
| 2 | The Bloomberg Barclays U.S. 1-5 Year Government Bond Index is a subindex of the Bloomberg Barclays U.S. Government Index, which is composed of the Bloomberg Barclays U.S. Treasury and U.S. Agency Indices. The Bloomberg Barclays U.S. Government Index includes Treasuries (public obligations of the U.S. Treasury that have remaining maturities of more than one year) and U.S. agency debentures (publicly issued debt of U.S. government agencies, quasi-federal corporations, and corporate or foreign debt guaranteed by the U.S. government). The Bloomberg Barclays U.S. Government Index is a component of the Bloomberg Barclays U.S. Government/Credit Index and the Bloomberg Barclays U.S. Aggregate Index. |
| 3 | Fund performance has been increased by fee waivers and/or expense reimbursements, if any, without which performance would have been lower. |
| 4 | Expense ratios are as shown in the Fund’s prospectus in effect as of the date of this report. The expense ratios for the current reporting period can be found in the Financial Highlights section of this report under Ratios to Average Net Assets. Net expenses reflect contractual expense caps set to expire on 1/31/18. When a Fund’s expenses are below the cap, gross and net expense ratios will be the same. See Note 6 of the Notes to Financial Statements for more information about the Fund’s expense caps. |
13 |
ADDITIONAL INFORMATION
The views expressed in this report reflect those of the portfolio managers as of the dates indicated. The managers’ views are subject to change at any time without notice based on changes in market or other conditions. References to specific securities or industries should not be regarded as investment advice. Because the Funds are actively managed, there is no assurance that they will continue to invest in the securities or industries mentioned.
All investing involves risk, including the risk of loss. There is no assurance that any investment will meet its performance objectives or that losses will be avoided.
ADDITIONAL INDEX INFORMATION
This document may contain references to third party copyrights, indexes, and trademarks, each of which is the property of its respective owner. Such owner is not affiliated with Natixis Investment Managers or any of its related or affiliated companies (collectively “Natixis Affiliates”) and does not sponsor, endorse or participate in the provision of any Natixis Affiliates services, funds or other financial products.
The index information contained herein is derived from third parties and is provided on an “as is” basis. The user of this information assumes the entire risk of use of this information. Each of the third party entities involved in compiling, computing or creating index information disclaims all warranties (including, without limitation, any warranties of originality, accuracy, completeness, timeliness, non-infringement, merchantability and fitness for a particular purpose) with respect to such information.
PROXY VOTING INFORMATION
A description of the Natixis Funds’ proxy voting policies and procedures is available without charge, upon request, by calling Natixis Funds at 800-225-5478; on the Natixis Funds’ website at im.natixis.com; and on the Securities and Exchange Commission’s (“SEC’s”) website at www.sec.gov. Information regarding how the funds voted proxies relating to portfolio securities the most recent 12-month period ended June 30 is available from the Natixis Funds’ website and the SEC’s website.
QUARTERLY PORTFOLIO SCHEDULES
The Natixis Funds file complete schedules of portfolio holdings with the SEC for the first and third quarters of each fiscal year on Form N-Q. The Funds’ Forms N-Q are available on the SEC’s website at www.sec.gov and may be reviewed and copied at the SEC’s Public Reference Room in Washington, DC. Information on the operation of the Public Reference Room may be obtained by calling 800-SEC-0330.
| 14
UNDERSTANDING FUND EXPENSES
As a mutual fund shareholder, you incur different costs: transaction costs, including sales charges (loads) on purchases and contingent deferred sales charges on redemptions, and ongoing costs, including management fees, distribution and/or service fees (12b-1 fees), and other fund expenses. Certain exemptions may apply. These costs are described in more detail in the Funds’ prospectuses. The following examples are intended to help you understand the ongoing costs of investing in the Funds and help you compare these with the ongoing costs of investing in other mutual funds.
The first line in the table of each class of Fund shares shows the actual account values and actual Fund expenses you would have paid on a $1,000 investment in the Fund from April 1, 2017 through September 30, 2017. To estimate the expenses you paid over the period, simply divide your account value by $1,000 (for example $8,600 account value divided by $1,000 = 8.6) and multiply the result by the number in the Expenses Paid During Period column as shown below for your class.
The second line in the table of each class of Fund shares provides information about hypothetical account values and hypothetical expenses based on the Fund’s actual expense ratios and an assumed rate of return of 5% per year before expenses, which is not the Fund’s actual return. The hypothetical account values and expenses may not be used to estimate the actual ending account balance or expenses you paid on your investment for the period. You may use this information to compare the ongoing costs of investing in the Fund to other funds. To do so, compare this 5% hypothetical example with the 5% hypothetical examples that appear in the shareholder reports of the other funds.
Please note that the expenses shown reflect ongoing costs only, and do not include any transaction costs, such as sales charges. Therefore, the second line in the table of each fund is useful in comparing ongoing costs only, and will not help you determine the relative costs of owning different funds. If transaction costs were included, total costs would be higher.
15 |
| | | | | | | | | | | | |
| LOOMIS SAYLES HIGH INCOME FUND | | BEGINNING
ACCOUNT VALUE
4/1/2017 | | | ENDING
ACCOUNT VALUE
9/30/2017 | | | EXPENSES PAID
DURING PERIOD*
4/1/2017 – 9/30/2017 | |
| Class A | | | | | | | | | | | | |
| Actual | | | $1,000.00 | | | | $1,037.20 | | | | $5.52 | |
| Hypothetical (5% return before expenses) | | | $1,000.00 | | | | $1,019.65 | | | | $5.47 | |
| Class C | | | | | | | | | | | | |
| Actual | | | $1,000.00 | | | | $1,033.20 | | | | $9.33 | |
| Hypothetical (5% return before expenses) | | | $1,000.00 | | | | $1,015.89 | | | | $9.25 | |
| Class N | | | | | | | | | | | | |
| Actual | | | $1,000.00 | | | | $1,038.80 | | | | $3.88 | |
| Hypothetical (5% return before expenses) | | | $1,000.00 | | | | $1,021.26 | | | | $3.85 | |
| Class Y | | | | | | | | | | | | |
| Actual | | | $1,000.00 | | | | $1,038.60 | | | | $4.19 | |
| Hypothetical (5% return before expenses) | | | $1,000.00 | | | | $1,020.96 | | | | $4.15 | |
| * | Expenses are equal to the Fund’s annualized expense ratio (after waiver/reimbursement): 1.08%, 1.83%, 0.76% and 0.82% for Class A, C, N and Y, respectively, multiplied by the average account value over the period, multiplied by the number of days in the most recent fiscal half-year (183), divided by 365 (to reflect the half-year period). |
| | | | | | | | | | | | |
LOOMIS SAYLES INTERMEDIATE
DURATION BOND FUND | | BEGINNING
ACCOUNT VALUE
4/1/2017 | | | ENDING
ACCOUNT VALUE
9/30/2017 | | | EXPENSES PAID
DURING PERIOD*
4/1/2017 – 9/30/2017 | |
| Class A | | | | | | | | | | | | |
| Actual | | | $1,000.00 | | | | $1,015.70 | | | | $3.28 | |
| Hypothetical (5% return before expenses) | | | $1,000.00 | | | | $1,021.81 | | | | $3.29 | |
| Class C | | | | | | | | | | | | |
| Actual | | | $1,000.00 | | | | $1,012.80 | | | | $7.06 | |
| Hypothetical (5% return before expenses) | | | $1,000.00 | | | | $1,018.05 | | | | $7.08 | |
| Class Y | | | | | | | | | | | | |
| Actual | | | $1,000.00 | | | | $1,017.90 | | | | $2.02 | |
| Hypothetical (5% return before expenses) | | | $1,000.00 | | | | $1,023.06 | | | | $2.03 | |
| * | Expenses are equal to the Fund’s annualized expense ratio (after waiver/reimbursement): 0.65%, 1.40% and 0.40% for Class A, C and Y, respectively, multiplied by the average account value over the period, multiplied by the number of days in the most recent fiscal half-year (183), divided by 365 (to reflect the half-year period). |
| 16
| | | | | | | | | | | | |
LOOMIS SAYLES LIMITED TERM
GOVERNMENT AND AGENCY FUND | | BEGINNING
ACCOUNT VALUE
4/1/2017 | | | ENDING
ACCOUNT VALUE
9/30/2017 | | | EXPENSES PAID
DURING PERIOD*
4/1/2017 – 9/30/2017 | |
| Class A | | | | | | | | | | | | |
| Actual | | | $1,000.00 | | | | $1,005.60 | | | | $4.02 | |
| Hypothetical (5% return before expenses) | | | $1,000.00 | | | | $1,021.06 | | | | $4.05 | |
| Class C | | | | | | | | | | | | |
| Actual | | | $1,000.00 | | | | $1,001.80 | | | | $7.78 | |
| Hypothetical (5% return before expenses) | | | $1,000.00 | | | | $1,017.30 | | | | $7.84 | |
| Class N | | | | | | | | | | | | |
| Actual | | | $1,000.00 | | | | $1,008.20 | | | | $2.32 | |
| Hypothetical (5% return before expenses) | | | $1,000.00 | | | | $1,022.76 | | | | $2.33 | |
| Class Y | | | | | | | | | | | | |
| Actual | | | $1,000.00 | | | | $1,007.70 | | | | $2.77 | |
| Hypothetical (5% return before expenses) | | | $1,000.00 | | | | $1,022.31 | | | | $2.79 | |
| * | Hypothetical expenses are equal to the Fund’s annualized expense ratio: 0.80%, 1.55%, 0.46% and 0.55% for Class A, C, N and Y, respectively, multiplied by the average account value over the period, multiplied by the number of days in the most recent fiscal half-year (183), divided by 365 (to reflect the half-year period). |
17 |
BOARD APPROVAL OF THE EXISTING ADVISORY AGREEMENTS
The Board of Trustees of the Trusts (the “Board”), including the Independent Trustees, considers matters bearing on each Fund’s advisory agreement (collectively, the “Agreements”) at most of its meetings throughout the year. Each year, usually in the spring, the Contract Review Committee of the Board meets to review the Agreements to determine whether to recommend that the full Board approve the continuation of the Agreements, typically for an additional one-year period. After the Contract Review Committee has made its recommendation, the full Board, including the Independent Trustees, determines whether to approve the continuation of the Agreements.
In connection with these meetings, the Trustees receive materials that the Funds’ investment adviser (the “Adviser”) believes to be reasonably necessary for the Trustees to evaluate the Agreements. These materials generally include, among other items, (i) information on the investment performance of the Funds and the performance of peer groups of funds and the Funds’ performance benchmarks, (ii) information on the Funds’ advisory fees and other expenses, including information comparing the Funds’ expenses to the fees charged to institutional accounts with similar strategies managed by the Adviser, if any, and to those of peer groups of funds and information about any applicable expense caps and/or fee “breakpoints,” (iii) sales and redemption data in respect of the Funds, (iv) information about the profitability of the Agreements to the Adviser and (v) information obtained through the completion by the Adviser of a questionnaire distributed on behalf of the Trustees. The Board, including the Independent Trustees, also considers other matters such as (i) the Adviser’s financial results and financial condition, (ii) each Fund’s investment objective and strategies and the size, education and experience of the Adviser’s investment staff and its use of technology, external research and trading cost measurement tools, (iii) arrangements in respect of the distribution of the Funds’ shares and the related costs, (iv) the allocation of the Funds’ brokerage, if any, including, if applicable, allocations to brokers affiliated with the Adviser and the use of “soft” commission dollars to pay Fund expenses and to pay for research and other similar services, (v) the resources devoted to, and the record of compliance with, the Funds’ investment policies and restrictions, policies on personal securities transactions and other compliance policies, (vi) each Adviser’s policies and procedures relating to, among other things, compliance, trading and best execution, proxy voting and valuation, (vii) information about amounts invested by the Funds’ portfolio managers in the Funds or in similar accounts that they manage and (viii) the general economic outlook with particular emphasis on the mutual fund industry. Throughout the process, the Trustees are afforded the opportunity to ask questions of and request additional materials from the Adviser.
In addition to the materials requested by the Trustees in connection with their annual consideration of the continuation of the Agreements, the Trustees receive materials in advance of each regular quarterly meeting of the Board that provide detailed information about the Funds’ investment performance and the fees charged to the Funds for advisory and other services. This information generally includes, among other things, an internal performance rating for each Fund based on agreed-upon criteria, graphs showing each Fund’s performance and fee differentials against each Fund’s peer group/category,
| 18
performance ratings provided by a third-party, total return information for various periods, and third-party performance rankings for various periods comparing a Fund against similarly categorized funds. The portfolio management team for each Fund or other representatives of the Adviser make periodic presentations to the Contract Review Committee and/or the full Board, and Funds identified as presenting possible performance concerns may be subject to more frequent board presentations and reviews. In addition, each quarter the Trustees are provided with detailed statistical information about each Fund’s portfolio. The Trustees also receive periodic updates between meetings.
The Board most recently approved the continuation of the Agreements at its meeting held in June 2017. The Agreements were continued for a one-year period for the Funds. In considering whether to approve the continuation of the Agreements, the Board, including the Independent Trustees, did not identify any single factor as determinative. Individual Trustees may have evaluated the information presented differently from one another, giving different weights to various factors. Matters considered by the Trustees, including the Independent Trustees, in connection with their approval of the Agreements included, but were not limited to, the factors listed below.
The nature, extent and quality of the services provided to the Funds under the Agreements. The Trustees considered the nature, extent and quality of the services provided by the Adviser and its affiliates to the Funds and the resources dedicated to the Funds by the Adviser and its affiliates.
The Trustees considered not only the advisory services provided by the Adviser to the Funds, but also the monitoring and oversight services provided by Natixis Advisors, L.P. (“Natixis Advisors”). They also considered the administrative services provided by Natixis Advisors and its affiliates to the Funds.
For each Fund, the Trustees also considered the benefits to shareholders of investing in a mutual fund that is part of a family of funds that offers shareholders the right to exchange shares of one type of fund for shares of another type of fund, and provides a variety of fund and shareholder services.
After reviewing these and related factors, the Trustees concluded, within the context of their overall conclusions regarding each of the Agreements, that the nature, extent and quality of services provided supported the renewal of the Agreements.
Investment performance of the Funds and the Adviser. As noted above, the Trustees received information about the performance of the Funds over various time periods, including information that compared the performance of the Funds to the performance of peer groups and categories of funds and the Funds’ respective performance benchmarks. In addition, the Trustees also reviewed data prepared by an independent third party that analyzed the performance of the Funds using a variety of performance metrics, including metrics that also measured the performance of the Funds on a risk adjusted basis.
19 |
The Board noted that, through December 31, 2016, each Fund’s one- and three-year performance stated as percentile rankings within categories selected by the independent third-party data provider was as follows (where the best performance would be in the first percentile of its category):
| | | | | | | | |
| | | One-Year | | | Three-Year | |
Loomis Sayles High Income Fund | | | 33 | % | | | 39 | % |
Loomis Sayles Intermediate Duration Bond Fund | | | 70 | % | | | 81 | % |
Loomis Sayles Limited Term Government and Agency Fund | | | 29 | % | | | 21 | % |
In the case of Loomis Sayles Intermediate Duration Bond Fund, which had performance that lagged that of a relevant peer group median and/or category median for all periods, the Board concluded that other factors relevant to performance supported renewal of the Agreements. These factors included the following: (1) that the underperformance was attributable, to a significant extent, to investment decisions (such as security selection or sector allocation) by the Adviser that were reasonable and consistent with the Fund’s investment objective and policies; and (2) that the Fund’s more recent performance, although lagging in certain periods, had shown improvement relative to its category.
The Trustees also considered the Adviser’s performance and reputation generally, the performance of the fund family generally, and the historical responsiveness of the Adviser to Trustee concerns about performance and the willingness of the Adviser to take steps intended to improve performance.
After reviewing these and related factors, the Trustees concluded, within the context of their overall conclusions regarding each of the Agreements, that the performance of the Funds and the Adviser and/or other relevant factors supported the renewal of the Agreements.
The costs of the services to be provided and profits to be realized by the Adviser and its affiliates from their respective relationships with the Funds. The Trustees considered the fees charged to the Funds for advisory services as well as the total expense levels of the Funds. This information included comparisons (provided both by management and also by an independent third party) of the Funds’ advisory fees and total expense levels to those of their peer groups and information about the advisory fees charged by the Adviser to comparable accounts (such as institutional separate accounts), as well as information about differences in such fees and the reasons for any such differences. In considering the fees charged to comparable accounts, the Trustees considered, among other things, management’s representations about the differences between managing mutual funds as compared to other types of accounts, including the additional resources required to effectively manage mutual fund assets and the greater regulatory costs associated with the management of such assets. In evaluating each Fund’s advisory fee, the Trustees also took into account the demands, complexity and quality of the investment management of such Fund, as well as the need for the Adviser to offer competitive compensation and the potential need to expend additional resources to the extent the Fund grows in size. The Trustees considered that over the past several years, management had made recommendations regarding reductions in advisory fee rates, implementation of advisory fee breakpoints and the institution of advisory fee waivers and expense caps for various funds in
| 20
the fund family. They noted that the Funds in this report have expense caps in place, and they considered the amounts waived or reimbursed by the Adviser for certain Funds that had current expenses over their respective caps. The Trustees also considered that the current expenses of Loomis Sayles Limited Term Government and Agency Fund are below its cap. The Trustees noted that Loomis Sayles High Income Fund had a total advisory fee rate that was above the median of a peer group of funds. In this regard, the Trustees considered the factors that management believed justified such relatively higher advisory fee rate, including: (1) that the Fund’s fee rate was only one basis point above the median of the Fund’s peer group; and (2) that management had proposed to reduce the Fund’s expense cap.
The Trustees also considered the compensation directly or indirectly received or to be received by the Adviser and its affiliates from their relationships with the Funds. The Trustees reviewed information provided by management as to the profitability of the Adviser’s and its affiliates’ relationships with the Funds, and information about the allocation of expenses used to calculate profitability. They also reviewed information provided by management about the effect of distribution costs and changes in asset levels on Adviser profitability, including information regarding resources spent on distribution activities. When reviewing profitability, the Trustees also considered information about court cases in which adviser compensation or profitability were issues, the performance of the relevant Funds, the expense levels of the Funds, and whether the Adviser had implemented breakpoints and/or expense caps with respect to such Funds.
After reviewing these and related factors, the Trustees concluded, within the context of their overall conclusions regarding each of the Agreements, that the advisory fee charged to each of the Funds was fair and reasonable, and that the costs of these services generally and the related profitability of the Adviser and its affiliates in respect of their relationships with the Funds supported the renewal of the Agreements.
Economies of Scale. The Trustees considered the existence of any economies of scale in the provision of services by the Adviser and whether those economies are shared with the Funds through breakpoints in their investment advisory fees or other means, such as expense waivers or caps. The Trustees also discussed with management the factors considered with respect to the implementation of breakpoints in investment advisory fees or expense waivers or caps for certain funds. Management explained that a number of factors are taken into account in considering the possible implementation of breakpoints or an expense cap for a fund, including, among other things, factors such as a fund’s assets, the projected growth of a fund, projected profitability and a fund’s fees and performance. With respect to economies of scale, the Trustees noted that each of the Funds was subject to an expense cap or waiver. The Trustees also considered management’s proposal to reduce Loomis Sayles High Income Fund’s expense cap. In considering these issues, the Trustees also took note of the costs of the services provided (both on an absolute and on a relative basis) and the profitability to the Adviser and its affiliates of their relationships with the Funds, as discussed above.
After reviewing these and related factors, the Trustees concluded, within the context of their overall conclusions regarding each of the Agreements, that the extent to which economies of scale were shared with the Funds supported the renewal of the Agreements.
21 |
The Trustees also considered other factors, which included but were not limited to the following:
| · | | The effect of recent market and economic events on the performance, asset levels and expense ratios of each Fund. |
| · | | Whether each Fund has operated in accordance with its investment objective and the Fund’s record of compliance with its investment restrictions, and the compliance programs of the Funds and the Adviser. They also considered the compliance-related resources the Adviser and its affiliates were providing to the Funds. |
| · | | The nature, quality, cost and extent of administrative and shareholder services performed by the Adviser and its affiliates, both under the Agreements and under separate agreements covering administrative services. |
| · | | So-called “fallout benefits” to the Adviser, such as the engagement of affiliates of the Adviser to provide distribution, administrative and brokerage services to the Funds, and the benefits of research made available to the Adviser by reason of brokerage commissions (if any) generated by the Funds’ securities transactions. The Trustees also considered the benefits to the parent company of Natixis Advisors from the retention of the Adviser. The Trustees considered the possible conflicts of interest associated with these fallout and other benefits, and the reporting, disclosure and other processes in place to disclose and monitor such possible conflicts of interest. |
| · | | The Trustees’ review and discussion of the Funds’ advisory arrangements in prior years, and management’s record of responding to Trustee concerns raised during the year and in prior years. |
Based on their evaluation of all factors that they deemed to be material, including those factors described above, and assisted by the advice of independent counsel, the Trustees, including the Independent Trustees, concluded that each of the existing Agreements, with the reduction in Loomis Sayles High Income Fund’s expense cap described above, should be continued through June 30, 2018.
| 22
Portfolio of Investments – as of September 30, 2017
Loomis Sayles High Income Fund
| | | | | | | | |
Principal
Amount (‡) | | | Description | | Value (†) | |
| | Bonds and Notes — 90.4% of Net Assets | |
| | Non-Convertible Bonds — 81.6% | |
| | | | ABS Home Equity — 1.5% | | | | |
| $ | 101,145 | | | Banc of America Alternative Loan Trust, Series 2003-8, Class 1CB1, 5.500%, 10/25/2033 | | $ | 103,069 | |
| | 106,380 | | | Banc of America Funding Trust, Series 2005-7, Class 3A1, 5.750%, 11/25/2035 | | | 111,931 | |
| | 84,577 | | | Banc of America Funding Trust, Series 2007-4, Class 5A1, 5.500%, 11/25/2034 | | | 86,455 | |
| | 29,479 | | | Countrywide Home Loan Mortgage Pass Through Trust, Series 2005-HYB7, Class 2A, 3.294%, 11/20/2035(k) | | | 27,040 | |
| | 218,880 | | | DSLA Mortgage Loan Trust, Series 2005-AR5, Class 2A1A, 1-month LIBOR + 0.330%, 1.567%, 9/19/2045(a) | | | 179,078 | |
| | 250,000 | | | Freddie Mac Structured Agency Credit Risk Debt Notes, Series 2013-DN2, Class M2, 1-month LIBOR + 4.250%, 5.487%, 11/25/2023(a) | | | 275,001 | |
| | 305,000 | | | Freddie Mac Structured Agency Credit Risk Debt Notes, Series 2015-DNA1, Class M3, 1-month LIBOR + 3.300%, 4.537%, 10/25/2027(a) | | | 338,190 | |
| | 151,491 | | | GMAC Mortgage Corp. Loan Trust, Series 2005-AR4, Class 3A1, 4.002%, 7/19/2035(k) | | | 146,751 | |
| | 267,307 | | | MASTR Adjustable Rate Mortgages Trust, Series 2005-2, Class 3A1, 3.422%, 3/25/2035(k) | | | 262,898 | |
| | 303,384 | | | MASTR Adjustable Rate Mortgages Trust, Series 2005-2, Class 4A1, 3.294%, 3/25/2035(k) | | | 286,590 | |
| | 58,608 | | | New York Mortgage Trust, Series 2006-1, Class 2A2, 3.616%, 5/25/2036(k) | | | 57,257 | |
| | 100,000 | | | RCO Mortgage LLC, Series 2017-1, Class A2, 5.125%, 8/25/2022, 144A(k) | | | 99,954 | |
| | 470,000 | | | VOLT LVI LLC, Series 2017-NPL3, Class A2, 5.875%, 3/25/2047, 144A(k) | | | 473,477 | |
| | 220,000 | | | VOLT XL LLC, Series 2015-NP14, Class A2, 4.875%, 11/27/2045, 144A(k) | | | 220,501 | |
| | | | | | | | |
| | | | | | | 2,668,192 | |
| | | | | | | | |
| | | | ABS Other — 0.1% | | | | |
| | 252,798 | | | AIM Aviation Finance Ltd., Series 2015-1A, Class B1, 5.072%, 2/15/2040, 144A(k) | | | 249,289 | |
| | | | | | | | |
| | | | Aerospace & Defense — 2.2% | | | | |
| | 210,000 | | | Embraer Netherlands Finance BV, 5.050%, 6/15/2025 | | | 222,862 | |
| | 95,000 | | | Engility Corp., 8.875%, 9/01/2024 | | | 104,263 | |
| | 770,000 | | | KLX, Inc., 5.875%, 12/01/2022, 144A | | | 806,729 | |
| | 1,500,000 | | | Meccanica Holdings USA, Inc., 6.250%, 1/15/2040, 144A | | | 1,695,000 | |
| | 900,000 | | | Meccanica Holdings USA, Inc., 7.375%, 7/15/2039, 144A | | | 1,100,250 | |
| | | | | | | | |
| | | | | | | 3,929,104 | |
| | | | | | | | |
| | | | Airlines — 0.4% | | | | |
| | 535,000 | | | Latam Finance Ltd., 6.875%, 4/11/2024, 144A | | | 565,762 | |
| | 57,504 | | | Virgin Australia Pass Through Certificates, Series 2013-1B, 6.000%, 4/23/2022, 144A | | | 59,653 | |
| | 69,937 | | | Virgin Australia Pass Through Certificates, Series 2013-1C, 7.125%, 10/23/2018, 144A | | | 72,017 | |
| | | | | | | | |
| | | | | | | 697,432 | |
| | | | | | | | |
See accompanying notes to financial statements.
23 |
Portfolio of Investments – as of September 30, 2017
Loomis Sayles High Income Fund – (continued)
| | | | | | | | |
Principal
Amount (‡) | | | Description | | Value (†) | |
| | | | Automotive — 1.2% | | | | |
| $ | 645,000 | | | Allison Transmission, Inc., 4.750%, 10/01/2027, 144A | | $ | 649,837 | |
| | 195,000 | | | Allison Transmission, Inc., 5.000%, 10/01/2024, 144A | | | 202,381 | |
| | 285,000 | | | Dana Financing Luxembourg S.a.r.l., 5.750%, 4/15/2025, 144A | | | 300,497 | |
| | 115,000 | | | Goodyear Tire & Rubber Co. (The), 5.000%, 5/31/2026 | | | 119,888 | |
| | 240,000 | | | Goodyear Tire & Rubber Co. (The), 5.125%, 11/15/2023 | | | 251,100 | |
| | 670,000 | | | Midas Intermediate Holdco II LLC/Midas Intermediate Holdco II Finance, Inc., 7.875%, 10/01/2022, 144A | | | 678,375 | |
| | | | | | | | |
| | | | | | | 2,202,078 | |
| | | | | | | | |
| | | | Banking — 4.3% | | | | |
| | 1,985,000 | | | Ally Financial, Inc., 4.625%, 3/30/2025 | | | 2,081,769 | |
| | 485,000 | | | Ally Financial, Inc., 5.750%, 11/20/2025 | | | 525,837 | |
| | 6,605,000 | | | Banco Hipotecario S.A., Argentina Deposit Rates Badlar Pvt Banks + 2.500%, 22.479%, 1/12/2020, 144A, (ARS)(a) | | | 374,796 | |
| | 2,855,000 | | | Banco Macro S.A., 17.500%, 5/08/2022, 144A, (ARS) | | | 156,884 | |
| | 7,075,000 | | | Banco Supervielle S.A., Argentina Deposit Rates Badlar Pvt Banks + 4.500%, 25.042%, 8/09/2020, 144A, (ARS)(a) | | | 413,768 | |
| | 1,280,000 | | | Barclays PLC, 5.200%, 5/12/2026 | | | 1,366,597 | |
| | 1,195,000 | | | Commerzbank AG, 8.125%, 9/19/2023, 144A | | | 1,448,758 | |
| | 470,000 | | | Intesa Sanpaolo SpA, 5.017%, 6/26/2024, 144A | | | 477,803 | |
| | 895,000 | | | Intesa Sanpaolo SpA, 5.710%, 1/15/2026, 144A | | | 943,212 | |
| | | | | | | | |
| | | | | | | 7,789,424 | |
| | | | | | | | |
| | | | Brokerage — 0.3% | | | | |
| | 535,000 | | | Jefferies Finance LLC/JFIN Co-Issuer Corp., 6.875%, 4/15/2022, 144A | | | 537,675 | |
| | | | | | | | |
| | | | Building Materials — 0.8% | | | | |
| | 230,000 | | | Cemex SAB de CV, 5.700%, 1/11/2025, 144A | | | 245,180 | |
| | 350,000 | | | Cemex SAB de CV, 7.750%, 4/16/2026, 144A | | | 402,150 | |
| | 50,000 | | | Masco Corp., 6.500%, 8/15/2032 | | | 59,625 | |
| | 161,000 | | | Masco Corp., 7.750%, 8/01/2029 | | | 212,004 | |
| | 245,000 | | | NCI Building Systems, Inc., 8.250%, 1/15/2023, 144A | | | 262,762 | |
| | 180,000 | | | U.S. Concrete, Inc., 6.375%, 6/01/2024 | | | 193,950 | |
| | | | | | | | |
| | | | | | | 1,375,671 | |
| | | | | | | | |
| | | | Cable Satellite — 6.8% | | | | |
| | 795,000 | | | Altice Financing S.A., 6.625%, 2/15/2023, 144A | | | 842,700 | |
| | 475,000 | | | CCO Holdings LLC/CCO Holdings Capital Corp., 5.125%, 2/15/2023 | | | 490,438 | |
| | 625,000 | | | CCO Holdings LLC/CCO Holdings Capital Corp., 5.125%, 5/01/2023, 144A | | | 650,781 | |
| | 430,000 | | | CCO Holdings LLC/CCO Holdings Capital Corp., 5.250%, 9/30/2022 | | | 442,900 | |
| | 15,000 | | | CCO Holdings LLC/CCO Holdings Capital Corp., 5.750%, 1/15/2024 | | | 15,581 | |
| | 865,000 | | | CCO Holdings LLC/CCO Holdings Capital Corp., 5.750%, 2/15/2026, 144A | | | 906,952 | |
| | 760,000 | | | CSC Holdings LLC, 5.250%, 6/01/2024 | | | 768,550 | |
| | 600,000 | | | CSC Holdings LLC, 5.500%, 4/15/2027, 144A | | | 624,000 | |
| | 75,000 | | | CSC Holdings LLC, 6.750%, 11/15/2021 | | | 82,875 | |
| | 220,000 | | | CSC Holdings LLC, 10.125%, 1/15/2023, 144A | | | 253,825 | |
| | 895,000 | | | DISH DBS Corp., 5.125%, 5/01/2020 | | | 938,363 | |
| | 1,620,000 | | | DISH DBS Corp., 5.875%, 11/15/2024 | | | 1,697,962 | |
| | 295,000 | | | DISH DBS Corp., 7.750%, 7/01/2026 | | | 338,710 | |
See accompanying notes to financial statements.
| 24
Portfolio of Investments – as of September 30, 2017
Loomis Sayles High Income Fund – (continued)
| | | | | | | | |
Principal
Amount (‡) | | | Description | | Value (†) | |
| | | | Cable Satellite — continued | | | | |
| $ | 355,000 | | | Sirius XM Radio, Inc., 5.000%, 8/01/2027, 144A | | $ | 362,100 | |
| | 1,485,000 | | | Unitymedia GmbH, 6.125%, 1/15/2025, 144A | | | 1,583,381 | |
| | 265,000 | | | Virgin Media Finance PLC, 6.000%, 10/15/2024, 144A | | | 278,581 | |
| | 485,000 | | | Virgin Media Finance PLC, 6.375%, 4/15/2023, 144A | | | 506,219 | |
| | 375,000 | | | Virgin Media Secured Finance PLC, 5.500%, 1/15/2025, 144A | | | 394,219 | |
| | 141,963 | | | Wave Holdco LLC/Wave Holdco Corp., PIK, 8.250%, 7/15/2019, 144A(b) | | | 142,318 | |
| | 840,000 | | | Ziggo Secured Finance BV, 5.500%, 1/15/2027, 144A | | | 860,740 | |
| | | | | | | | |
| | | | | | | 12,181,195 | |
| | | | | | | | |
| | | | Chemicals — 0.8% | | | | |
| | 1,510,000 | | | Hercules LLC, 6.500%, 6/30/2029(c)(d) | | | 1,517,550 | |
| | | | | | | | |
| | | | Construction Machinery — 1.1% | | | | |
| | 225,000 | | | Ashtead Capital, Inc., 4.125%, 8/15/2025, 144A | | | 231,750 | |
| | 235,000 | | | Ashtead Capital, Inc., 4.375%, 8/15/2027, 144A | | | 242,050 | |
| | 615,000 | | | United Rentals North America, Inc., 4.625%, 10/15/2025 | | | 622,687 | |
| | 15,000 | | | United Rentals North America, Inc., 5.500%, 5/15/2027 | | | 15,994 | |
| | 800,000 | | | United Rentals North America, Inc., 5.750%, 11/15/2024 | | | 849,000 | |
| | | | | | | | |
| | | | | | | 1,961,481 | |
| | | | | | | | |
| | | | Consumer Cyclical Services — 0.7% | | | | |
| | 1,095,000 | | | ServiceMaster Co. LLC (The), 7.450%, 8/15/2027 | | | 1,196,287 | |
| | | | | | | | |
| | | | Consumer Products — 0.2% | | | | |
| | 290,000 | | | Avon International Operations, Inc., 7.875%, 8/15/2022, 144A | | | 300,875 | |
| | | | | | | | |
| | | | Electric — 1.6% | | | | |
| | 125,000 | | | AES Corp., 5.125%, 9/01/2027 | | | 128,125 | |
| | 520,000 | | | AES Corp. (The), 5.500%, 4/15/2025 | | | 546,952 | |
| | 150,000 | | | AES Corp. (The), 6.000%, 5/15/2026 | | | 161,438 | |
| | 1,502,000 | | | Enel SpA, (fixed rate to 9/24/2023, variable rate thereafter), 8.750%, 9/24/2073, 144A | | | 1,819,297 | |
| | 245,000 | | | Minejesa Capital BV, 4.625%, 8/10/2030, 144A | | | 250,147 | |
| | | | | | | | |
| | | | | | | 2,905,959 | |
| | | | | | | | |
| | | | Environmental — 0.1% | | | | |
| | 100,000 | | | GFL Environmental, Inc., 5.625%, 5/01/2022, 144A | | | 104,000 | |
| | 95,000 | | | GFL Environmental, Inc., 9.875%, 2/01/2021, 144A | | | 101,449 | |
| | | | | | | | |
| | | | | | | 205,449 | |
| | | | | | | | |
| | | | Finance Companies — 3.9% | | | | |
| | 1,055,000 | | | Aircastle Ltd., 4.125%, 5/01/2024 | | | 1,091,925 | |
| | 515,000 | | | Aircastle Ltd., 5.500%, 2/15/2022 | | | 562,637 | |
| | 600,000 | | | iStar, Inc., 4.000%, 11/01/2017 | | | 600,480 | |
| | 120,000 | | | iStar, Inc., 4.625%, 9/15/2020 | | | 122,700 | |
| | 505,000 | | | iStar, Inc., 5.000%, 7/01/2019 | | | 511,628 | |
| | 395,000 | | | iStar, Inc., 5.250%, 9/15/2022 | | | 400,925 | |
| | 720,000 | | | Ladder Capital Finance Holdings LLLP/Ladder Capital Finance Corp., 5.250%, 10/01/2025, 144A | | | 713,254 | |
| | 255,000 | | | Ladder Capital Finance Holdings LLLP/Ladder Capital Finance Corp., 5.875%, 8/01/2021, 144A | | | 260,738 | |
See accompanying notes to financial statements.
25 |
Portfolio of Investments – as of September 30, 2017
Loomis Sayles High Income Fund – (continued)
| | | | | | | | |
Principal
Amount (‡) | | | Description | | Value (†) | |
| | | | Finance Companies — continued | | | | |
| $ | 315,000 | | | Provident Funding Associates LP/PFG Finance Corp., 6.375%, 6/15/2025, 144A | | $ | 330,750 | |
| | 710,000 | | | Quicken Loans, Inc., 5.750%, 5/01/2025, 144A | | | 745,500 | |
| | 1,110,000 | | | Springleaf Finance Corp., 7.750%, 10/01/2021 | | | 1,253,967 | |
| | 405,000 | | | Unifin Financiera SAB de CV SOFOM ENR, 7.250%, 9/27/2023, 144A | | | 420,993 | |
| | | | | | | | |
| | | | | | | 7,015,497 | |
| | | | | | | | |
| | | | Financial Other — 0.9% | | | | |
| | 565,000 | | | Icahn Enterprises LP/Icahn Enterprises Finance Corp, 6.000%, 8/01/2020 | | | 583,052 | |
| | 180,000 | | | Icahn Enterprises LP/Icahn Enterprises Finance Corp., 5.875%, 2/01/2022 | | | 185,400 | |
| | 804,000 | | | Rialto Holdings LLC/Rialto Corp., 7.000%, 12/01/2018, 144A | | | 810,030 | |
| | | | | | | | |
| | | | | | | 1,578,482 | |
| | | | | | | | |
| | | | Food & Beverage — 1.8% | | | | |
| | 200,000 | | | BRF GmbH, 4.350%, 9/29/2026, 144A | | | 196,010 | |
| | 840,000 | | | Cosan Luxembourg S.A., 7.000%, 1/20/2027, 144A | | | 911,786 | |
| | 330,000 | | | JBS USA LUX S.A./JBS USA Finance, Inc., 5.750%, 6/15/2025, 144A | | | 328,763 | |
| | 255,000 | | | JBS USA LUX S.A./JBS USA Finance, Inc., 7.250%, 6/01/2021, 144A | | | 260,100 | |
| | 385,000 | | | Marfrig Holdings Europe BV, 8.000%, 6/08/2023, 144A | | | 399,049 | |
| | 260,000 | | | Pilgrim’s Pride Corp., 5.875%, 9/30/2027, 144A | | | 265,525 | |
| | 830,000 | | | Post Holdings, Inc., 5.750%, 3/01/2027, 144A | | | 854,900 | |
| | | | | | | | |
| | | | | | | 3,216,133 | |
| | | | | | | | |
| | | | Gaming — 0.9% | | | | |
| | 175,000 | | | Boyd Gaming Corp., 6.375%, 4/01/2026 | | | 190,969 | |
| | 375,000 | | | GLP Capital LP/GLP Financing II, Inc., 5.375%, 4/15/2026 | | | 409,219 | |
| | 210,000 | | | MGM Growth Properties Operating Partnership LP/MGP Finance Co., 4.500%, 1/15/2028, 144A | | | 211,848 | |
| | 725,000 | | | MGM Resorts International, 6.000%, 3/15/2023 | | | 799,312 | |
| | | | | | | | |
| | | | | | | 1,611,348 | |
| | | | | | | | |
| | | | Government Owned – No Guarantee — 3.0% | | | | |
| | 740,000 | | | Petrobras Global Finance BV, 5.625%, 5/20/2043 | | | 660,450 | |
| | 1,160,000 | | | Petrobras Global Finance BV, 5.999%, 1/27/2028, 144A | | | 1,159,130 | |
| | 165,000 | | | Petrobras Global Finance BV, 6.250%, 3/17/2024 | | | 176,303 | |
| | 50,000 | | | Petrobras Global Finance BV, 6.750%, 1/27/2041 | | | 49,750 | |
| | 160,000 | | | Petrobras Global Finance BV, 6.875%, 1/20/2040 | | | 162,000 | |
| | 405,000 | | | Petrobras Global Finance BV, 7.250%, 3/17/2044 | | | 421,706 | |
| | 160,521(††) | | | Petroleos Mexicanos, 7.190%, 9/12/2024, 144A, (MXN) | | | 805,690 | |
| | 129,850(††) | | | Petroleos Mexicanos, 7.470%, 11/12/2026, (MXN) | | | 646,141 | |
| | 710,000 | | | YPF S.A., 6.950%, 7/21/2027, 144A | | | 752,600 | |
| | 510,000 | | | YPF S.A., Argentina Deposit Rates Badlar Pvt Banks + 4.000%, 24.104%, 7/07/2020, 144A(a) | | | 482,010 | |
| | | | | | | | |
| | | | | | | 5,315,780 | |
| | | | | | | | |
| | | | Health Insurance — 0.2% | | | | |
| | 365,000 | | | Centene Corp., 6.125%, 2/15/2024 | | | 394,656 | |
| | | | | | | | |
See accompanying notes to financial statements.
| 26
Portfolio of Investments – as of September 30, 2017
Loomis Sayles High Income Fund – (continued)
| | | | | | | | |
Principal
Amount (‡) | | | Description | | Value (†) | |
| | | | Healthcare — 5.0% | | | | |
| $ | 235,000 | | | CHS/Community Health Systems, Inc., 6.250%, 3/31/2023 | | $ | 230,888 | |
| | 960,000 | | | CHS/Community Health Systems, Inc., 6.875%, 2/01/2022 | | | 753,600 | |
| | 360,000 | | | Envision Healthcare Corp., 5.625%, 7/15/2022 | | | 375,300 | |
| | 155,000 | | | HCA, Inc., 4.500%, 2/15/2027 | | | 158,488 | |
| | 25,000 | | | HCA, Inc., 5.250%, 4/15/2025 | | | 27,031 | |
| | 90,000 | | | HCA, Inc., 5.250%, 6/15/2026 | | | 96,975 | |
| | 260,000 | | | HCA, Inc., 5.375%, 2/01/2025 | | | 273,975 | |
| | 170,000 | | | HCA, Inc., 7.050%, 12/01/2027 | | | 191,675 | |
| | 655,000 | | | HCA, Inc., 7.500%, 12/15/2023 | | | 763,075 | |
| | 145,000 | | | HCA, Inc., 7.500%, 11/06/2033 | | | 164,575 | |
| | 590,000 | | | HCA, Inc., 7.690%, 6/15/2025 | | | 685,875 | |
| | 480,000 | | | HCA, Inc., 8.360%, 4/15/2024 | | | 576,000 | |
| | 820,000 | | | HCA, Inc., MTN, 7.580%, 9/15/2025 | | | 947,100 | |
| | 515,000 | | | HCA, Inc., MTN, 7.750%, 7/15/2036 | | | 585,812 | |
| | 865,000 | | | MEDNAX, Inc., 5.250%, 12/01/2023, 144A | | | 906,087 | |
| | 200,000 | | | Quintiles IMS, Inc., 5.000%, 10/15/2026, 144A | | | 212,000 | |
| | 555,000 | | | SP Finco LLC, 6.750%, 7/01/2025, 144A | | | 521,700 | |
| | 390,000 | | | Tenet Healthcare Corp., 5.125%, 5/01/2025, 144A | | | 384,638 | |
| | 180,000 | | | Tenet Healthcare Corp., 6.875%, 11/15/2031 | | | 157,500 | |
| | 830,000 | | | Tenet Healthcare Corp., 7.500%, 1/01/2022, 144A | | | 878,762 | |
| | | | | | | | |
| | | | | | | 8,891,056 | |
| | | | | | | | |
| | | | Home Construction — 2.0% | | | | |
| | 1,200,000 | | | Corporacion GEO SAB de CV, 8.875%, 3/27/2022, 144A(c)(e)(f)(g) | | | 12 | |
| | 750,000 | | | K. Hovnanian Enterprises, Inc., 5.000%, 11/01/2021(c)(d) | | | 674,115 | |
| | 800,000 | | | Lennar Corp., 4.750%, 5/30/2025 | | | 836,000 | |
| | 1,130,000 | | | PulteGroup, Inc., 5.500%, 3/01/2026 | | | 1,232,152 | |
| | 915,000 | | | TRI Pointe Group, Inc./TRI Pointe Homes, Inc., 4.375%, 6/15/2019 | | | 934,444 | |
| | | | | | | | |
| | | | | | | 3,676,723 | |
| | | | | | | | |
| | | | Independent Energy — 8.3% | | | | |
| | 335,000 | | | Aker BP ASA, 6.000%, 7/01/2022, 144A | | | 348,400 | |
| | 1,205,000 | | | Antero Resources Corp., 5.125%, 12/01/2022 | | | 1,232,112 | |
| | 110,000 | | | Antero Resources Corp., 5.375%, 11/01/2021 | | | 112,888 | |
| | 310,000 | | | Ascent Resources Utica Holdings LLC/ARU Finance Corp., 10.000%, 4/01/2022, 144A | | | 332,475 | |
| | 685,000 | | | Baytex Energy Corp., 5.625%, 6/01/2024, 144A | | | 621,637 | |
| | 90,000 | | | California Resources Corp., 5.500%, 9/15/2021 | | | 47,925 | |
| | 41,000 | | | California Resources Corp., 6.000%, 11/15/2024 | | | 18,655 | |
| | 460,000 | | | California Resources Corp., 8.000%, 12/15/2022, 144A | | | 299,000 | |
| | 140,000 | | | Callon Petroleum Co., 6.125%, 10/01/2024 | | | 144,900 | |
| | 153,000 | | | Chesapeake Energy Corp., 4.875%, 4/15/2022 | | | 142,290 | |
| | 8,000 | | | Chesapeake Energy Corp., 5.750%, 3/15/2023 | | | 7,380 | |
| | 13,000 | | | Chesapeake Energy Corp., 6.125%, 2/15/2021 | | | 13,098 | |
| | 34,000 | | | Chesapeake Energy Corp., 6.625%, 8/15/2020 | | | 35,020 | |
| | 795,000 | | | CONSOL Energy, Inc., 5.875%, 4/15/2022 | | | 802,950 | |
| | 645,000 | | | Continental Resources, Inc., 3.800%, 6/01/2024 | | | 622,425 | |
| | 235,000 | | | Continental Resources, Inc., 4.500%, 4/15/2023 | | | 235,588 | |
See accompanying notes to financial statements.
27 |
Portfolio of Investments – as of September 30, 2017
Loomis Sayles High Income Fund – (continued)
| | | | | | | | |
Principal
Amount (‡) | | | Description | | Value (†) | |
| | | | Independent Energy — continued | | | | |
| $ | 470,000 | | | Continental Resources, Inc., 5.000%, 9/15/2022 | | $ | 477,637 | |
| | 690,000 | | | Eclipse Resources Corp., 8.875%, 7/15/2023 | | | 702,075 | |
| | 835,000 | | | Halcon Resources Corp., 6.750%, 2/15/2025, 144A | | | 864,225 | |
| | 145,000 | | | Matador Resources Co., 6.875%, 4/15/2023 | | | 153,519 | |
| | 410,000 | | | MEG Energy Corp., 6.375%, 1/30/2023, 144A | | | 357,725 | |
| | 300,000 | | | MEG Energy Corp., 6.500%, 1/15/2025, 144A | | | 292,875 | |
| | 585,000 | | | MEG Energy Corp., 7.000%, 3/31/2024, 144A | | | 501,637 | |
| | 185,000 | | | Newfield Exploration Co., 5.625%, 7/01/2024 | | | 198,413 | |
| | 625,000 | | | Oasis Petroleum, Inc., 6.875%, 3/15/2022 | | | 635,937 | |
| | 100,000 | | | PDC Energy, Inc., 6.125%, 9/15/2024 | | | 104,500 | |
| | 445,000 | | | QEP Resources, Inc., 5.375%, 10/01/2022 | | | 437,212 | |
| | 1,150,000 | | | Rex Energy Corp., (Step to 8.000% on 10/01/2017), 1.000%, 10/01/2020(h) | | | 575,000 | |
| | 1,025,000 | | | Rice Energy, Inc., 6.250%, 5/01/2022 | | | 1,071,125 | |
| | 565,000 | | | RSP Permian, Inc., 6.625%, 10/01/2022 | | | 592,544 | |
| | 330,000 | | | Sanchez Energy Corp., 6.125%, 1/15/2023 | | | 282,150 | |
| | 325,000 | | | Seven Generations Energy Ltd., 5.375%, 9/30/2025, 144A | | | 327,437 | |
| | 920,000 | | | SM Energy Co., 5.000%, 1/15/2024 | | | 867,100 | |
| | 35,000 | | | SM Energy Co., 6.125%, 11/15/2022 | | | 35,088 | |
| | 60,000 | | | SM Energy Co., 6.500%, 1/01/2023 | | | 60,450 | |
| | 190,000 | | | SM Energy Co., 6.750%, 9/15/2026 | | | 190,000 | |
| | 395,000 | | | Southwestern Energy Co., 6.700%, 1/23/2025 | | | 400,925 | |
| | 285,000 | | | Southwestern Energy Co., 7.500%, 4/01/2026 | | | 296,400 | |
| | 55,000 | | | Whiting Petroleum Corp., 5.000%, 3/15/2019 | | | 55,017 | |
| | 455,000 | | | Whiting Petroleum Corp., 5.750%, 3/15/2021 | | | 447,037 | |
| | | | | | | | |
| | | | | | | 14,942,771 | |
| | | | | | | | |
| | | | Industrial Other — 0.2% | | | | |
| | 315,000 | | | II-VI, Inc., 0.250%, 9/01/2022, 144A | | | 351,619 | |
| | | | | | | | |
| | | | Integrated Energy — 0.1% | | | | |
| | 200,000 | | | Geopark Ltd., 6.500%, 9/21/2024, 144A | | | 200,468 | |
| | | | | | | | |
| | | | Leisure — 0.1% | | | | |
| | 130,000 | | | Constellation Merger Sub, Inc., 8.500%, 9/15/2025, 144A | | | 127,725 | |
| | | | | | | | |
| | | | Life Insurance — 0.2% | | | | |
| | 340,000 | | | CNO Financial Group, Inc., 5.250%, 5/30/2025 | | | 362,950 | |
| | | | | | | | |
| | | | Local Authorities — 0.4% | | | | |
| | 325,000 | | | Provincia de Buenos Aires, 6.500%, 2/15/2023, 144A | | | 342,417 | |
| | 270,000 | | | Provincia de Buenos Aires, 7.875%, 6/15/2027, 144A | | | 292,626 | |
| | 2,390,000 | | | Provincia de Buenos Aires, Argentina Deposit Rates Badlar Pvt Banks + 3.830%, 25.330%, 5/31/2022, (ARS)(a) | | | 142,411 | |
| | | | | | | | |
| | | | | | | 777,454 | |
| | | | | | | | |
| | | | Lodging — 0.9% | | | | |
| | 150,000 | | | Hilton Domestic Operating Co., Inc., 4.250%, 9/01/2024 | | | 153,000 | |
| | 755,000 | | | Hilton Worldwide Finance LLC/Hilton Worldwide Finance Corp., 4.625%, 4/01/2025 | | | 777,650 | |
| | 705,000 | | | Hilton Worldwide Finance LLC/Hilton Worldwide Finance Corp., 4.875%, 4/01/2027 | | | 740,250 | |
| | | | | | | | |
| | | | | | | 1,670,900 | |
| | | | | | | | |
See accompanying notes to financial statements.
| 28
Portfolio of Investments – as of September 30, 2017
Loomis Sayles High Income Fund – (continued)
| | | | | | | | |
Principal
Amount (‡) | | | Description | | Value (†) | |
| | | | Media Entertainment — 2.0% | | | | |
| $ | 890,000 | | | AMC Networks, Inc., 4.750%, 8/01/2025 | | $ | 898,900 | |
| | 470,000 | | | Clear Channel Worldwide Holdings, Inc., 7.625%, 3/15/2020 | | | 464,125 | |
| | 1,155,000 | | | Clear Channel Worldwide Holdings, Inc., Series B, 6.500%, 11/15/2022 | | | 1,189,650 | |
| | 975,000 | | | Viacom, Inc., 4.375%, 3/15/2043 | | | 839,943 | |
| | 49,000 | | | Viacom, Inc., 4.850%, 12/15/2034 | | | 46,176 | |
| | 105,000 | | | Viacom, Inc., (fixed rate to 2/28/2027, variable rate thereafter), 6.250%, 2/28/2057 | | | 105,656 | |
| | | | | | | | |
| | | | | | | 3,544,450 | |
| | | | | | | | |
| | | | Metals & Mining — 2.9% | | | | |
| | 1,395,000 | | | ArcelorMittal, 7.250%, 3/01/2041 | | | 1,651,331 | |
| | 180,000 | | | Constellium NV, 4.625%, 5/15/2021, 144A, (EUR) | | | 216,631 | |
| | 145,000 | | | First Quantum Minerals Ltd., 7.000%, 2/15/2021, 144A | | | 149,169 | |
| | 270,000 | | | First Quantum Minerals Ltd., 7.250%, 5/15/2022, 144A | | | 276,412 | |
| | 1,375,000 | | | Freeport-McMoRan, Inc., 4.550%, 11/14/2024 | | | 1,376,375 | |
| | 85,000 | | | Freeport-McMoRan, Inc., 5.450%, 3/15/2043 | | | 79,422 | |
| | 245,000 | | | Glencore Finance Canada Ltd., 5.550%, 10/25/2042, 144A | | | 270,993 | |
| | 440,000 | | | Lundin Mining Corp., 7.500%, 11/01/2020, 144A | | | 457,600 | |
| | 440,000 | | | Stillwater Mining Co., 6.125%, 6/27/2022, 144A | | | 445,852 | |
| | 80,000 | | | Vale Overseas Ltd., 6.875%, 11/10/2039 | | | 91,696 | |
| | 190,000 | | | Vale S.A., 5.625%, 9/11/2042 | | | 193,800 | |
| | | | | | | | |
| | | | | | | 5,209,281 | |
| | | | | | | | |
| | | | Midstream — 4.3% | | | | |
| | 355,000 | | | Andeavor Logistics LP/Tesoro Logistics Finance Corp., 5.500%, 10/15/2019 | | | 373,637 | |
| | 360,000 | | | Andeavor Logistics LP/Tesoro Logistics Finance Corp., 6.250%, 10/15/2022 | | | 382,950 | |
| | 435,000 | | | Cheniere Corpus Christi Holdings LLC, 5.125%, 6/30/2027, 144A | | | 448,050 | |
| | 66,000 | | | Gibson Energy, Inc., 6.750%, 7/15/2021, 144A | | | 68,310 | |
| | 75,000 | | | Kinder Morgan Energy Partners LP, 4.700%, 11/01/2042 | | | 72,068 | |
| | 30,000 | | | Kinder Morgan Energy Partners LP, 5.000%, 3/01/2043 | | | 29,863 | |
| | 570,000 | | | NGL Energy Partners LP/NGL Energy Finance Corp., 5.125%, 7/15/2019 | | | 569,550 | |
| | 190,000 | | | NGL Energy Partners LP/NGL Energy Finance Corp., 6.125%, 3/01/2025 | | | 176,700 | |
| | 390,000 | | | NGL Energy Partners LP/NGL Energy Finance Corp., 6.875%, 10/15/2021 | | | 390,000 | |
| | 145,000 | | | NGL Energy Partners LP/NGL Energy Finance Corp., 7.500%, 11/01/2023 | | | 144,275 | |
| | 165,000 | | | NGPL PipeCo LLC, 4.375%, 8/15/2022, 144A | | | 171,188 | |
| | 700,000 | | | NGPL PipeCo LLC, 4.875%, 8/15/2027, 144A | | | 733,495 | |
| | 480,000 | | | Sabine Pass Liquefaction LLC, 5.625%, 3/01/2025 | | | 529,505 | |
| | 425,000 | | | Sabine Pass Liquefaction LLC, 6.250%, 3/15/2022 | | | 478,016 | |
| | 385,000 | | | SemGroup Corp./Rose Rock Finance Corp., 5.625%, 7/15/2022 | | | 376,337 | |
| | 935,000 | | | Summit Midstream Holdings LLC/Summit Midstream Finance Corp., 5.500%, 8/15/2022 | | | 939,675 | |
| | 973,000 | | | Targa Resources Partners LP/Targa Resources Partners Finance Corp., 4.125%, 11/15/2019 | | | 982,730 | |
| | 95,000 | | | Targa Resources Partners LP/Targa Resources Partners Finance Corp., 4.250%, 11/15/2023 | | | 94,169 | |
| | 640,000 | | | Targa Resources Partners LP/Targa Resources Partners Finance Corp., 5.250%, 5/01/2023 | | | 652,800 | |
| | 180,000 | | | Western Refining Logistics LP/WNRL Finance Corp., 7.500%, 2/15/2023 | | | 192,600 | |
| | | | | | | | |
| | | | | | | 7,805,918 | |
| | | | | | | | |
See accompanying notes to financial statements.
29 |
Portfolio of Investments – as of September 30, 2017
Loomis Sayles High Income Fund – (continued)
| | | | | | | | |
Principal
Amount (‡) | | | Description | | Value (†) | |
| | | | Non-Agency Commercial Mortgage-Backed Securities — 1.4% | | | | |
| $ | 935,000 | | | BXHTL Mortgage Trust, Series 2015-DRMZ, Class M, 1-month LIBOR + 8.200%, 9.433%, 5/15/2020, 144A(a)(c)(d)(e) | | $ | 939,675 | |
| | 1,020,000 | | | Credit Suisse Mortgage Trust, Series 2014-USA, Class E, 4.373%, 9/15/2037, 144A | | | 909,041 | |
| | 554,472 | | | GS Mortgage Securities Trust, Series 2007-GG10, Class AM, 5.780%, 8/10/2045(k) | | | 566,285 | |
| | 38,392 | | | JPMorgan Chase Commercial Mortgage Securities Trust, Series 2007-LDPX, Class AM, 5.464%, 1/15/2049(k) | | | 38,360 | |
| | | | | | | | |
| | | | | | | 2,453,361 | |
| | | | | | | | |
| | | | Oil Field Services — 0.7% | | | | |
| | 430,000 | | | Ensco PLC, 5.750%, 10/01/2044 | | | 308,525 | |
| | 160,000 | | | Noble Holding International Ltd., 5.250%, 3/15/2042 | | | 104,800 | |
| | 160,000 | | | Noble Holding International Ltd., 6.050%, 3/01/2041 | | | 109,200 | |
| | 420,000 | | | Noble Holding International Ltd., 7.750%, 1/15/2024 | | | 372,750 | |
| | 35,000 | | | Parker Drilling Co., 6.750%, 7/15/2022 | | | 28,033 | |
| | 266,000 | | | Transocean Proteus Ltd., 6.250%, 12/01/2024, 144A | | | 278,635 | |
| | | | | | | | |
| | | | | | | 1,201,943 | |
| | | | | | | | |
| | | | Packaging — 1.3% | | | | |
| | 200,000 | | | ARD Finance S.A., PIK, 7.125%, 9/15/2023(b) | | | 214,060 | |
| | 395,000 | | | Ardagh Packaging Finance PLC/Ardagh MP Holdings USA, Inc., 4.625%, 5/15/2023, 144A | | | 405,744 | |
| | 200,000 | | | Ardagh Packaging Finance PLC/Ardagh MP Holdings USA, Inc., 7.250%, 5/15/2024, 144A | | | 219,374 | |
| | 755,000 | | | Sealed Air Corp., 6.875%, 7/15/2033, 144A | | | 885,237 | |
| | 600,000 | | | Signode Industrial Group Lux S.A./Signode Industrial Group U.S., Inc., 6.375%, 5/01/2022, 144A | | | 622,500 | |
| | | | | | | | |
| | | | | | | 2,346,915 | |
| | | | | | | | |
| | | | Paper — 0.4% | | | | |
| | 440,000 | | | Klabin Finance S.A., 4.875%, 9/19/2027, 144A | | | 436,656 | |
| | 210,000 | | | Suzano Austria GmbH, 5.750%, 7/14/2026, 144A | | | 225,603 | |
| | | | | | | | |
| | | | | | | 662,259 | |
| | | | | | | | |
| | | | Pharmaceuticals — 1.1% | | | | |
| | 200,000 | | | Endo Dac/Endo Finance LLC/Endo Finance, Inc., 5.875%, 10/15/2024, 144A | | | 209,500 | |
| | 530,000 | | | Valeant Pharmaceuticals International, 7.250%, 7/15/2022, 144A | | | 516,750 | |
| | 265,000 | | | Valeant Pharmaceuticals International, Inc., 5.500%, 3/01/2023, 144A | | | 232,538 | |
| | 85,000 | | | Valeant Pharmaceuticals International, Inc., 5.625%, 12/01/2021, 144A | | | 79,475 | |
| | 990,000 | | | Valeant Pharmaceuticals International, Inc., 5.875%, 5/15/2023, 144A | | | 874,912 | |
| | | | | | | | |
| | | | | | | 1,913,175 | |
| | | | | | | | |
| | | | Property & Casualty Insurance — 0.6% | | | | |
| | 180,000 | | | Ardonagh Midco 3 PLC, 8.375%, 7/15/2023, 144A, (GBP) | | | 249,890 | |
| | 786,000 | | | HUB International Ltd., 7.875%, 10/01/2021, 144A | | | 818,423 | |
| | | | | | | | |
| | | | | | | 1,068,313 | |
| | | | | | | | |
See accompanying notes to financial statements.
| 30
Portfolio of Investments – as of September 30, 2017
Loomis Sayles High Income Fund – (continued)
| | | | | | | | |
Principal
Amount (‡) | | | Description | | Value (†) | |
| | | | Restaurants — 0.5% | | | | |
| $ | 890,000 | | | 1011778 B.C. ULC/New Red Finance, Inc., 5.000%, 10/15/2025, 144A | | $ | 901,036 | |
| | | | | | | | |
| | | | Retailers — 1.1% | | | | |
| | 40,000 | | | Dillard’s, Inc., 7.000%, 12/01/2028 | | | 44,148 | |
| | 435,000 | | | Dillard’s, Inc., 7.750%, 7/15/2026 | | | 504,191 | |
| | 205,000 | | | Dillard’s, Inc., 7.750%, 5/15/2027 | | | 238,893 | |
| | 1,035,000 | | | GameStop Corp., 5.500%, 10/01/2019, 144A | | | 1,058,288 | |
| | 520,000 | | | Nine West Holdings, Inc., 6.125%, 11/15/2034 | | | 83,200 | |
| | | | | | | | |
| | | | | | | 1,928,720 | |
| | | | | | | | |
| | | | Sovereigns — 0.4% | | | | |
| | 10,810,000 | | | Argentina Politica Monetaria, Argentina Central Bank 7-day Repo Reference Rate, 26.250%, 6/21/2020, (ARS)(a) | | | 660,618 | |
| | | | | | | | |
| | | | Supermarkets — 0.6% | | | | |
| | 335,000 | | | Albertson’s Cos. LLC/Safeway, Inc./New Albertson’s, Inc./Albertson’s LLC, 5.750%, 3/15/2025 | | | 294,800 | |
| | 935,000 | | | New Albertson’s, Inc., Series C, MTN, 6.625%, 6/01/2028 | | | 719,950 | |
| | | | | | | | |
| | | | | | | 1,014,750 | |
| | | | | | | | |
| | | | Supranational — 2.0% | | | | |
| | 6,785,000 | | | European Investment Bank, EMTN, 8.750%, 9/18/2021, (TRY) | | | 1,825,139 | |
| | 5,190,000,000 | | | International Bank for Reconstruction and Development, 4.250%, 6/20/2019, (COP) | | | 1,727,541 | |
| | | | | | | | |
| | | | | | | 3,552,680 | |
| | | | | | | | |
| | | | Technology — 4.7% | | | | |
| | 416,000 | | | Blackboard, Inc., 9.750%, 10/15/2021, 144A | | | 371,280 | |
| | 170,000 | | | Camelot Finance S.A., 7.875%, 10/15/2024, 144A | | | 183,175 | |
| | 60,000 | | | CommScope Technologies LLC, 6.000%, 6/15/2025, 144A | | | 64,125 | |
| | 1,440,000 | | | Dell International LLC/EMC Corp., 6.020%, 6/15/2026, 144A | | | 1,599,192 | |
| | 1,345,000 | | | Dell International LLC/EMC Corp., 8.350%, 7/15/2046, 144A | | | 1,727,427 | |
| | 480,000 | | | Equinix, Inc., 5.375%, 1/01/2022 | | | 503,280 | |
| | 430,000 | | | First Data Corp., 5.000%, 1/15/2024, 144A | | | 446,469 | |
| | 800,000 | | | First Data Corp., 7.000%, 12/01/2023, 144A | | | 854,240 | |
| | 55,000 | | | Micron Technology, Inc., 5.250%, 1/15/2024, 144A | | | 57,888 | |
| | 95,000 | | | Micron Technology, Inc., 5.500%, 2/01/2025 | | | 101,294 | |
| | 110,000 | | | Microsemi Corp., 9.125%, 4/15/2023, 144A | | | 125,813 | |
| | 515,000 | | | Open Text Corp., 5.625%, 1/15/2023, 144A | | | 539,462 | |
| | 190,000 | | | Open Text Corp., 5.875%, 6/01/2026, 144A | | | 208,525 | |
| | 275,000 | | | Sabre GLBL, Inc., 5.250%, 11/15/2023, 144A | | | 282,562 | |
| | 405,000 | | | Sabre GLBL, Inc., 5.375%, 4/15/2023, 144A | | | 419,701 | |
| | 755,000 | | | Western Digital Corp., 10.500%, 4/01/2024 | | | 887,125 | |
| | | | | | | | |
| | | | | | | 8,371,558 | |
| | | | | | | | |
| | | | Transportation Services — 0.1% | | | | |
| | 275,000 | | | APL Ltd., 8.000%, 1/15/2024(c)(d) | | | 260,563 | |
| | | | | | | | |
See accompanying notes to financial statements.
31 |
Portfolio of Investments – as of September 30, 2017
Loomis Sayles High Income Fund – (continued)
| | | | | | | | |
Principal
Amount (‡) | | | Description | | Value (†) | |
| | | | Treasuries — 1.2% | | | | |
| | 263,668(††) | | | Mexican Fixed Rate Bonds, Series M, 5.750%, 3/05/2026, (MXN) | | $ | 1,350,093 | |
| | 131,759(††) | | | Mexican Fixed Rate Bonds, Series M-20, 10.000%, 12/05/2024, (MXN) | | | 856,723 | |
| | | | | | | | |
| | | | | | | 2,206,816 | |
| | | | | | | | |
| | | | Wireless — 3.6% | | | | |
| | 100,000 | | | Altice Luxembourg S.A., 7.250%, 5/15/2022, 144A, (EUR) | | | 125,636 | |
| | 355,000 | | | Altice Luxembourg S.A., 7.625%, 2/15/2025, 144A | | | 382,956 | |
| | 785,000 | | | Altice Luxembourg S.A., 7.750%, 5/15/2022, 144A | | | 833,081 | |
| | 6,000,000 | | | America Movil SAB de CV, 6.450%, 12/05/2022, (MXN) | | | 313,407 | |
| | 6,100,000 | | | America Movil SAB de CV, 8.460%, 12/18/2036, (MXN) | | | 311,107 | |
| | 200,000 | | | Millicom International Cellular S.A., 5.125%, 1/15/2028, 144A | | | 201,700 | |
| | 105,000 | | | Nokia Oyj, 3.375%, 6/12/2022 | | | 105,787 | |
| | 170,000 | | | Nokia Oyj, 4.375%, 6/12/2027 | | | 174,888 | |
| | 605,000 | | | SFR Group S.A., 7.375%, 5/01/2026, 144A | | | 653,400 | |
| | 786,000 | | | Sprint Capital Corp., 6.875%, 11/15/2028 | | | 880,320 | |
| | 1,420,000 | | | Sprint Corp., 7.250%, 9/15/2021 | | | 1,577,975 | |
| | 605,000 | | | T-Mobile USA, Inc., 6.000%, 4/15/2024 | | | 642,056 | |
| | 200,000 | | | Wind Acquisition Finance S.A., 4.750%, 7/15/2020, 144A | | | 202,188 | |
| | | | | | | | |
| | | | | | | 6,404,501 | |
| | | | | | | | |
| | | | Wirelines — 2.7% | | | | |
| | 705,000 | | | CenturyLink, Inc., 7.650%, 3/15/2042 | | | 615,112 | |
| | 130,000 | | | Cincinnati Bell Telephone Co. LLC, 6.300%, 12/01/2028 | | | 127,702 | |
| | 60,000,000 | | | Empresa de Telecomunicaniones de Bogota, 7.000%, 1/17/2023, 144A, (COP) | | | 16,368 | |
| | 405,000 | | | Frontier Communications Corp., 9.000%, 8/15/2031 | | | 314,888 | |
| | 340,000 | | | Frontier Communications Corp., 10.500%, 9/15/2022 | | | 294,950 | |
| | 15,000 | | | Frontier Communications Corp., 11.000%, 9/15/2025 | | | 12,713 | |
| | 705,000 | | | Level 3 Communications, Inc., 5.750%, 12/01/2022 | | | 724,387 | |
| | 1,545,000 | | | Level 3 Financing, Inc., 5.250%, 3/15/2026 | | | 1,583,146 | |
| | 345,000 | | | Telecom Italia Capital S.A., 6.375%, 11/15/2033 | | | 397,181 | |
| | 250,000 | | | Telecom Italia Capital S.A., 7.200%, 7/18/2036 | | | 308,738 | |
| | 35,000 | | | Telecom Italia Capital S.A., 7.721%, 6/04/2038 | | | 44,898 | |
| | 505,000 | | | Windstream Services LLC, 7.750%, 10/15/2020 | | | 404,000 | |
| | | | | | | | |
| | | | | | | 4,844,083 | |
| | | | | | | | |
| | | | Total Non-Convertible Bonds
(Identified Cost $140,877,965) | | | 146,202,163 | |
| | | | | | | | |
| | Convertible Bonds — 8.8% | | | | |
| | | | Building Materials — 0.1% | | | | |
| | 130,000 | | | Tutor Perini Corp., 2.875%, 6/15/2021 | | | 151,369 | |
| | | | | | | | |
| | | | Cable Satellite — 0.5% | | | | |
| | 845,000 | | | Dish Network Corp., 2.375%, 3/15/2024, 144A | | | 839,719 | |
| | | | | | | | |
| | | | Consumer Cyclical Services — 0.5% | | | | |
| | 860,000 | | | Macquarie Infrastructure Corp., 2.000%, 10/01/2023 | | | 833,125 | |
| | | | | | | | |
| | | | Diversified Operations — 0.1% | | | | |
| | 160,000 | | | RWT Holdings, Inc., 5.625%, 11/15/2019 | | | 164,800 | |
| | | | | | | | |
See accompanying notes to financial statements.
| 32
Portfolio of Investments – as of September 30, 2017
Loomis Sayles High Income Fund – (continued)
| | | | | | | | |
Principal
Amount (‡) | | | Description | | Value (†) | |
| | | | Healthcare — 0.9% | | | | |
| $ | 510,000 | | | Evolent Health, Inc., 2.000%, 12/01/2021, 144A | | $ | 573,113 | |
| | 940,000 | | | Teladoc, Inc., 3.000%, 12/15/2022, 144A | | | 1,020,487 | |
| | | | | | | | |
| | | | | | | 1,593,600 | |
| | | | | | | | |
| | | | Leisure — 0.1% | | | | |
| | 185,000 | | | Rovi Corp., 0.500%, 3/01/2020 | | | 187,209 | |
| | | | | | | | |
| | | | Midstream — 0.7% | | | | |
| | 940,000 | | | Chesapeake Energy Corp., 5.500%, 9/15/2026, 144A | | | 862,450 | |
| | 195,000 | | | PDC Energy, Inc., 1.125%, 9/15/2021 | | | 189,881 | |
| | 60,000 | | | SM Energy Co., 1.500%, 7/01/2021 | | | 56,325 | |
| | 170,000 | | | Whiting Petroleum Corp., 1.250%, 4/01/2020 | | | 151,513 | |
| | | | | | | | |
| | | | | | | 1,260,169 | |
| | | | | | | | |
| | | | Oil Field Services — 0.5% | | | | |
| | 255,000 | | | Hercules Capital, Inc., 4.375%, 2/01/2022, 144A | | | 258,984 | |
| | 860,000 | | | Nabors Industries, Inc., 0.750%, 1/15/2024, 144A | | | 699,288 | |
| | | | | | | | |
| | | | | | | 958,272 | |
| | | | | | | | |
| | | | Pharmaceuticals — 2.7% | | | | |
| | 760,000 | | | BioMarin Pharmaceutical, Inc., 0.599%, 8/01/2024 | | | 769,975 | |
| | 895,000 | | | BioMarin Pharmaceutical, Inc., 1.500%, 10/15/2020 | | | 1,071,203 | |
| | 115,000 | | | Dermira, Inc., 3.000%, 5/15/2022, 144A | | | 123,769 | |
| | 465,000 | | | Horizon Pharma Investment Ltd., 2.500%, 3/15/2022 | | | 419,953 | |
| | 375,000 | | | Impax Laboratories, Inc., 2.000%, 6/15/2022 | | | 337,031 | |
| | 1,100,000 | | | Intercept Pharmaceuticals, Inc., 3.250%, 7/01/2023 | | | 849,750 | |
| | 105,000 | | | Ionis Pharmaceuticals, Inc., 1.000%, 11/15/2021 | | | 110,906 | |
| | 960,000 | | | Neurocrine Biosciences, Inc., 2.250%, 5/15/2024, 144A | | | 1,092,600 | |
| | 100,000 | | | Pacira Pharmaceuticals, Inc., 2.375%, 4/01/2022, 144A | | | 97,625 | |
| | | | | | | | |
| | | | | | | 4,872,812 | |
| | | | | | | | |
| | | | Railroads — 0.4% | | | | |
| | 415,000 | | | Echo Global Logistics, Inc., 2.500%, 5/01/2020 | | | 399,178 | |
| | 275,000 | | | Greenbrier Cos., Inc. (The), 2.875%, 2/01/2024, 144A | | | 309,031 | |
| | | | | | | | |
| | | | | | | 708,209 | |
| | | | | | | | |
| | | | REITs – Mortgage — 0.1% | | | | |
| | 265,000 | | | iStar, Inc., 3.125%, 9/15/2022, 144A | | | 267,319 | |
| | | | | | | | |
| | | | Technology — 2.2% | | | | |
| | 130,000 | | | Cypress Semiconductor Corp., 4.500%, 1/15/2022 | | | 169,731 | |
| | 1,370,000 | | | Finisar Corp., 0.500%, 12/15/2036, 144A | | | 1,284,375 | |
| | 495,000 | | | MagnaChip Semiconductor S.A., 5.000%, 3/01/2021, 144A | | | 751,781 | |
| | 1,210,000 | | | Nuance Communications, Inc., 1.000%, 12/15/2035 | | | 1,134,871 | |
| | 115,000 | | | Nuance Communications, Inc., 1.250%, 4/01/2025, 144A | | | 111,119 | |
| | 450,000 | | | Verint Systems, Inc., 1.500%, 6/01/2021 | | | 439,875 | |
| | | | | | | | |
| | | | | | | 3,891,752 | |
| | | | | | | | |
| | | | Total Convertible Bonds
(Identified Cost $15,567,455) | | | 15,728,355 | |
| | | | | | | | |
| | | | | | | | |
| | | | Total Bonds and Notes
(Identified Cost $156,445,420) | | | 161,930,518 | |
| | | | | | | | |
See accompanying notes to financial statements.
33 |
Portfolio of Investments – as of September 30, 2017
Loomis Sayles High Income Fund – (continued)
| | | | | | | | |
Principal
Amount (‡) | | | Description | | Value (†) | |
| | Senior Loans — 0.8% | | | | |
| | | | Independent Energy — 0.3% | | | | |
| $ | 531,086 | | | Chesapeake Energy Corp., Term Loan, 3-month LIBOR + 7.500%, 8.814%, 8/23/2021(a) | | $ | 571,746 | |
| | | | | | | | |
| | | | Other Utility — 0.2% | | | | |
| | 237,569 | | | PowerTeam Services LLC, 1st Lien Term Loan, 3-month LIBOR + 3.250%, 4.583%, 5/06/2020(a) | | | 236,975 | |
| | 95,000 | | | PowerTeam Services LLC, 2nd Lien Term Loan, 3-month LIBOR + 7.250%, 8.583%, 11/06/2020(a) | | | 94,406 | |
| | | | | | | | |
| | | | | | | 331,381 | |
| | | | | | | | |
| | | | Supermarkets — 0.3% | | | | |
| | 433,224 | | | Albertsons LLC, USD 2017 Term Loan B4, 1-month LIBOR + 2.750%, 3.985%, 8/25/2021(a) | | | 417,316 | |
| | | | | | | | |
| | | | Total Senior Loans
(Identified Cost $1,296,007) | | | 1,320,443 | |
| | | | | | | | |
| Shares | | | | | | |
| | Preferred Stocks — 1.3% | |
| | Convertible Preferred Stocks — 1.0% | |
| | | | Food & Beverage — 0.5% | | | | |
| | 9,229 | | | Bunge Ltd., 4.875% | | | 958,086 | |
| | | | | | | | |
| | | | Midstream — 0.4% | | | | |
| | 988 | | | Chesapeake Energy Corp., 5.750% | | | 602,680 | |
| | 20 | | | Chesapeake Energy Corp., 5.750%, 144A | | | 12,200 | |
| | 137 | | | Chesapeake Energy Corp., 5.750% | | | 78,347 | |
| | | | | | | | |
| | | | | | | 693,227 | |
| | | | | | | | |
| | | | Technology — 0.1% | | | | |
| | 1,889 | | | Belden, Inc., 6.750% | | | 204,125 | |
| | | | | | | | |
| | | | Total Convertible Preferred Stocks
(Identified Cost $1,842,200) | | | 1,855,438 | |
| | | | | | | | |
| | Non-Convertible Preferred Stocks — 0.3% | |
| | | | Finance Companies — 0.3% | | | | |
| | 12,925 | | | iStar, Inc., Series E, 7.875% | | | 325,064 | |
| | 7,500 | | | iStar, Inc., Series F, 7.800% | | | 188,700 | |
| | 550 | | | iStar, Inc., Series G, 7.650% | | | 13,959 | |
| | | | | | | | |
| | | | | | | 527,723 | |
| | | | | | | | |
| | | | Total Non-Convertible Preferred Stocks
(Identified Cost $417,822) | | | 527,723 | |
| | | | | | | | |
| | | | | | | | |
| | | | Total Preferred Stocks
(Identified Cost $2,260,022) | | | 2,383,161 | |
| | | | | | | | |
See accompanying notes to financial statements.
| 34
Portfolio of Investments – as of September 30, 2017
Loomis Sayles High Income Fund – (continued)
| | | | | | | | |
Shares | | | Description | | Value (†) | |
| | Other Investments — 1.0% | | | | |
| | | | Aircraft ABS — 1.0% | | | | |
| | 8,415 | | | Aergen LLC(c)(e)(f) | | $ | 863,261 | |
| | 100 | | | ECAF I Blocker Ltd.(c)(e)(f) | | | 990,301 | |
| | | | | | | | |
| | | | Total Aircraft ABS
(Identified Cost $1,841,500) | | | 1,853,562 | |
| | | | | | | | |
| | Common Stocks — 1.6% | | | | |
| | | | Media — 0.0% | | | | |
| | 4,113 | | | Dex Media, Inc.(c)(e)(f)(i)(j) | | | 23,855 | |
| | | | | | | | |
| | | | Oil, Gas & Consumable Fuels — 1.4% | | | | |
| | 24,185 | | | Bonanza Creek Energy, Inc.(i) | | | 797,863 | |
| | 8,265 | | | Frontera Energy Corp.(i) | | | 288,472 | |
| | 12,992 | | | Halcon Resources Corp.(i) | | | 88,346 | |
| | 14,882 | | | Kinder Morgan, Inc. | | | 285,437 | |
| | 3,403 | | | Paragon Offshore Ltd., Litigation Units Class A(e)(f)(i)(l) | | | 3,063 | |
| | 5,106 | | | Paragon Offshore Ltd., Litigation Units Class B(e)(f)(i)(m) | | | 96,161 | |
| | 3,403 | | | Paragon Offshore Ltd.(e)(f)(i) | | | 55,299 | |
| | 1,725 | | | Rex Energy Corp.(i) | | | 4,657 | |
| | 162,248 | | | Whiting Petroleum Corp.(i) | | | 885,874 | |
| | | | | | | | |
| | | | | | | 2,505,172 | |
| | | | | | | | |
| | | | Pharmaceuticals — 0.2% | | | | |
| | 5,539 | | | Bristol-Myers Squibb Co. | | | 353,056 | |
| | | | | | | | |
| | | | Total Common Stocks
(Identified Cost $7,587,253) | | | 2,882,083 | |
| | | | | | | | |
| | Warrants — 0.0% | |
| | 3,528 | | | Halcon Resources Corp., Expiration on 9/9/2020 at $14.04(i) | | | 1,940 | |
| | 10,360 | | | FairPoint Communications, Inc., Expiration on 1/24/2018 at $48.81(c)(e)(f)(i) | | | — | |
| | | | | | | | |
| | | | Total Warrants
(Identified Cost $—) | | | 1,940 | |
| | | | | | | | |
Principal
Amount (‡) | | | | | | |
| | Short-Term Investments — 3.5% | |
| $ | 6,240,308 | | | Tri-Party Repurchase Agreement with Fixed Income Clearing Corporation, dated 9/29/2017 at 0.340% to be repurchased at $6,240,485 on 10/02/2017 collateralized by $6,050,000 U.S. Treasury Inflation Note, 0.125% due 4/15/2020 valued at $6,367,123 including accrued interest (Note 2 of Notes to Financial Statements) (Identified Cost $6,240,308) | | | 6,240,308 | |
| | | | | | | | |
| | | | | | | | |
| | | | Total Investments — 98.6%
(Identified Cost $175,670,510) | | | 176,612,015 | |
| | | | Other assets less liabilities — 1.4% | | | 2,595,898 | |
| | | | | | | | |
| | | | Net Assets — 100.0% | | $ | 179,207,913 | |
| | | | | | | | |
| | | | | | | | |
See accompanying notes to financial statements.
35 |
Portfolio of Investments – as of September 30, 2017
Loomis Sayles High Income Fund – (continued)
| | | | | | | | |
| | | | | | | | |
| | (‡) | | | Principal Amount stated in U.S. dollars unless otherwise noted. | |
| | (†) | | | See Note 2 of Notes to Financial Statements. | |
| | (††) | | | Amount shown represents units. One unit represents a principal amount of 100. | |
| | (a) | | | Variable rate security. Rate as of September 30, 2017 is disclosed. | |
| | (b) | | | Payment-in-kind security for which the issuer has the option at each interest payment date of making interest payments in cash or additional principal. For the period ended September 30, 2017, interest payments were made in cash. | |
| | (c) | | | Illiquid security. (Unaudited) | |
| | (d) | | | Securities classified as fair valued pursuant to the Fund’s pricing policies and procedures. At September 30, 2017, the value of these securities amounted to $3,391,903 or 1.9% of net assets. See Note 2 of Notes to Financial Statements. | |
| | (e) | | | Level 3 security. Value has been determined using significant unobservable inputs. See Note 3 of Notes to Financial Statements. | |
| | (f) | | | Fair valued by the Fund’s adviser. At September 30, 2017, the value of these securities amounted to $2,031,952 or 1.1% of net assets. See Note 2 of Notes to Financial Statements. | |
| | (g) | | | The issuer is in default with respect to interest and/or principal payments. Income is not being accrued. | |
| | (h) | | | Coupon rate is a fixed rate for an initial period then resets at a specified date and rate. | |
| | (i) | | | Non-income producing security. | |
| | (j) | | | Security subject to restrictions on resale. This security was acquired on August 12, 2016 at a cost of $20,040. At September 30, 2017, the value of this security amounted to $23,855 or less than 0.1% of net assets. | |
| | (k) | | | Variable rate security. The interest rate adjusts periodically based on changes in current interest rates and prepayments on the underlying pool of assets. Rate as of September 30, 2017 is disclosed. | |
| | (l) | | | Security subject to restrictions on resale. This security was acquired on July 18, 2017 at a cost of $25,887. At September 30, 2017, the value of this security amounted to $3,063 or less than 0.1% of net assets. | |
| | (m) | | | Security subject to restrictions on resale. This security was acquired on July 18, 2017 at a cost of $517,958. At September 30, 2017, the value of this security amounted to $96,161 or 0.1% of net assets. | |
| | | | | | | | |
| | 144A | | | All or a portion of these securities are exempt from registration under Rule 144A of the Securities Act of 1933. These securities may be resold in transactions exempt from registration, normally to qualified institutional buyers. At September 30, 2017, the value of Rule 144A holdings amounted to $71,664,260 or 40.0% of net assets. | |
| | ABS | | | Asset-Backed Securities | |
| | EMTN | | | Euro Medium Term Note | |
| | LIBOR | | | London Interbank Offered Rate | |
| | MTN | | | Medium Term Note | |
| | PIK | | | Payment-in-Kind | |
| | REITs | | | Real Estate Investment Trusts | |
| | | | | | | | |
| | ARS | | | Argentine Peso | |
| | COP | | | Colombian Peso | |
| | EUR | | | Euro | |
| | GBP | | | British Pound | |
| | MXN | | | Mexican Peso | |
| | TRY | | | Turkish Lira | |
See accompanying notes to financial statements.
| 36
Portfolio of Investments – as of September 30, 2017
Loomis Sayles High Income Fund – (continued)
Industry Summary at September 30, 2017
| | | | |
Independent Energy | | | 8.6 | % |
Cable Satellite | | | 7.3 | |
Technology | | | 7.0 | |
Healthcare | | | 5.9 | |
Midstream | | | 5.4 | |
Banking | | | 4.3 | |
Finance Companies | | | 4.2 | |
Pharmaceuticals | | | 4.0 | |
Wireless | | | 3.6 | |
Government Owned - No Guarantee | | | 3.0 | |
Metals & Mining | | | 2.9 | |
Wirelines | | | 2.7 | |
Food & Beverage | | | 2.3 | |
Aerospace & Defense | | | 2.2 | |
Home Construction | | | 2.0 | |
Supranational | | | 2.0 | |
Media Entertainment | | | 2.0 | |
Other Investments, less than 2% each | | | 25.7 | |
Short-Term Investments | | | 3.5 | |
| | | | |
Total Investments | | | 98.6 | |
Other assets less liabilities | | | 1.4 | |
| | | | |
Net Assets | | | 100.0 | % |
| | | | |
See accompanying notes to financial statements.
37 |
Portfolio of Investments – as of September 30, 2017
Loomis Sayles Intermediate Duration Bond Fund
| | | | | | | | |
Principal
Amount | | | Description | | Value (†) | |
| | Bonds and Notes — 99.0% of Net Assets | |
| | | | ABS Car Loan — 11.6% | | | | |
| $ | 3,862 | | | AmeriCredit Automobile Receivables Trust, Series 2014-1, Class B, 1.680%, 7/08/2019 | | $ | 3,862 | |
| | 375,000 | | | AmeriCredit Automobile Receivables Trust, Series 2015-3, Class C, 2.730%, 3/08/2021 | | | 378,692 | |
| | 152,000 | | | AmeriCredit Automobile Receivables Trust, Series 2016-1, Class C, 2.890%, 1/10/2022 | | | 153,896 | |
| | 72,000 | | | AmeriCredit Automobile Receivables Trust, Series 2016-2, Class C, 2.870%, 11/08/2021 | | | 72,899 | |
| | 160,000 | | | AmeriCredit Automobile Receivables Trust, Series 2016-3, Class C, 2.240%, 4/08/2022 | | | 159,406 | |
| | 555,000 | | | Americredit Automobile Receivables Trust, Series 2016-4, Class B, 1.830%, 12/08/2021 | | | 550,995 | |
| | 110,000 | | | AmeriCredit Automobile Receivables Trust, Series 2017-1, Class B, 2.300%, 2/18/2022 | | | 110,206 | |
| | 300,000 | | | AmeriCredit Automobile Receivables Trust, Series 2017-2, Class B, 2.400%, 5/18/2022 | | | 300,845 | |
| | 170,000 | | | AmeriCredit Automobile Receivables Trust, Series 2017-3, Class B, 2.240%, 6/19/2023 | | | 169,496 | |
| | 210,000 | | | Avis Budget Rental Car Funding AESOP LLC, Series 2014-1A, Class A, 2.460%, 7/20/2020, 144A | | | 210,673 | |
| | 360,000 | | | Avis Budget Rental Car Funding AESOP LLC, Series 2016-1A, Class A, 2.990%, 6/20/2022, 144A | | | 363,191 | |
| | 365,000 | | | Avis Budget Rental Car Funding AESOP LLC, Series 2017-1A, Class A, 3.070%, 9/20/2023, 144A | | | 367,935 | |
| | 3,962 | | | California Republic Auto Receivables Trust, Series 2013-2, Class A2, 1.230%, 3/15/2019 | | | 3,961 | |
| | 520,000 | | | California Republic Auto Recievables Trust, Series 2017-1, Class A4, 2.280%, 6/15/2022 | | | 521,721 | |
| | 163,064 | | | Capital Auto Receivables Asset Trust, Series 2015-1, Class A3, 1.610%, 6/20/2019 | | | 163,096 | |
| | 36,399 | | | CarFinance Capital Auto Trust, Series 2014-2A, Class A, 1.440%, 11/16/2020, 144A | | | 36,379 | |
| | 1,000,000 | | | CarMax Auto Owner Trust, Series 2017-2, Class A3, 1.930%, 3/15/2022(d) | | | 999,716 | |
| | 325,000 | | | Chrysler Capital Auto Receivables Trust, Series 2016-BA, Class A3, 1.640%, 7/15/2021, 144A | | | 324,063 | |
| | 465,000 | | | CPS Auto Receivables Trust, Series 2015-A, Class B, 2.790%, 2/16/2021, 144A | | | 467,733 | |
| | 125,000 | | | CPS Auto Receivables Trust, Series 2017-C, Class B, 2.300%, 7/15/2021, 144A | | | 124,806 | |
| | 275,000 | | | Credit Acceptance Auto Loan Trust, Series 2015-1A, Class B, 2.610%, 1/17/2023, 144A | | | 275,707 | |
| | 800,000 | | | Credit Acceptance Auto Loan Trust, Series 2016-2A, Class B, 3.180%, 5/15/2024, 144A | | | 805,838 | |
| | 275,000 | | | Credit Acceptance Auto Loan Trust, Series 2016-3A, Class A, 2.150%, 4/15/2024, 144A | | | 274,316 | |
| | 185,733 | | | Drive Auto Receivables Trust, Series 2015-BA, Class C, 2.760%, 7/15/2021, 144A | | | 186,600 | |
| | 362,000 | | | Drive Auto Receivables Trust, Series 2016-BA, Class C, 3.190%, 7/15/2022, 144A | | | 365,674 | |
See accompanying notes to financial statements.
| 38
Portfolio of Investments – as of September 30, 2017
Loomis Sayles Intermediate Duration Bond Fund – (continued)
| | | | | | | | |
Principal
Amount | | | Description | | Value (†) | |
| | | | ABS Car Loan — continued | | | | |
| $ | 470,000 | | | Drive Auto Receivables Trust, Series 2016-CA, Class B, 2.370%, 11/16/2020, 144A | | $ | 471,822 | |
| | 230,000 | | | Drive Auto Receivables Trust, Series 2017-AA, Class C, 2.980%, 1/18/2022, 144A | | | 232,443 | |
| | 275,000 | | | Drive Auto Receivables Trust, Series 2017-BA, Class C, 2.610%, 8/16/2021, 144A | | | 276,044 | |
| | 107,000 | | | DT Auto Owner Trust, Series 2015-2A, Class D, 4.250%, 2/15/2022, 144A | | | 108,933 | |
| | 335,000 | | | DT Auto Owner Trust, Series 2015-3A, Class D, 4.530%, 10/17/2022, 144A | | | 341,143 | |
| | 255,000 | | | DT Auto Owner Trust, Series 2016-2A, Class D, 5.430%, 11/15/2022, 144A | | | 264,859 | |
| | 440,000 | | | DT Auto Owner Trust, Series 2016-4A, Class C, 2.740%, 10/17/2022, 144A | | | 440,939 | |
| | 90,000 | | | DT Auto Owner Trust, Series 2017-1A, Class C, 2.700%, 11/15/2022, 144A | | | 90,030 | |
| | 350,000 | | | DT Auto Owner Trust, Series 2017-3A, Class B, 2.400%, 5/17/2021, 144A | | | 349,722 | |
| | 300,000 | | | Exeter Automobile Receivables Trust, Series 2017-2A, Class B, 2.820%, 5/16/2022, 144A | | | 299,805 | |
| | 260,000 | | | First Investors Auto Owner Trust, Series 2017-1A, Class A2, 2.200%, 3/15/2022, 144A | | | 259,944 | |
| | 315,000 | | | First Investors Auto Owner Trust, Series 2017-2A, Class A2, 2.270%, 7/15/2022, 144A | | | 314,580 | |
| | 290,000 | | | Flagship Credit Auto Trust, Series 2015-2B, 3.080%, 12/15/2021, 144A | | | 292,299 | |
| | 195,000 | | | Flagship Credit Auto Trust, Series 2016-2, Class B, 3.840%, 9/15/2022, 144A | | | 199,374 | |
| | 135,000 | | | Flagship Credit Auto Trust, Series 2016-3, Class B, 2.430%, 6/15/2021, 144A | | | 135,374 | |
| | 160,000 | | | Flagship Credit Auto Trust, Series 2016-4, Class B, 2.410%, 10/15/2021, 144A | | | 160,221 | |
| | 230,000 | | | Ford Credit Auto Owner Trust, Series 2014-2, Class A, 2.310%, 4/15/2026, 144A | | | 231,875 | |
| | 705,000 | | | Ford Credit Auto Owner Trust, Series 2016-2, Class A, 2.030%, 12/15/2027, 144A | | | 699,572 | |
| | 115,000 | | | Ford Credit Auto Owner Trust/Ford Credit, Series 2014-1, Class A, 2.260%, 11/15/2025, 144A | | | 115,840 | |
| | 590,000 | | | GM Financial Automobile Leasing Trust, Series 2016-2, Class A3, 1.620%, 9/20/2019 | | | 589,799 | |
| | 275,000 | | | GM Financial Consumer Automobile, Series 2017-1A, Class A3, 1.780%, 10/18/2021, 144A | | | 274,731 | |
| | 490,000 | | | Hyundai Auto Lease Securitization Trust, Series 2016-C, Class A4, 1.650%, 7/15/2020, 144A | | | 488,882 | |
| | 275,000 | | | Hyundai Auto Lease Securitization Trust, Series 2017-A, Class A3, 1.880%, 8/17/2020, 144A | | | 275,377 | |
| | 900,000 | | | Hyundai Auto Lease Securitization Trust, Series 2017-B, Class A3, 1.970%, 7/15/2020, 144A(d) | | | 901,188 | |
| | 595,000 | | | NextGear Floorplan Master Owner Trust, Series 2014-1A, Class A, 1.920%, 10/15/2019, 144A | | | 595,076 | |
| | 120,000 | | | NextGear Floorplan Master Owner Trust, Series 2016-2A, Class A2, 2.190%, 9/15/2021, 144A | | | 119,665 | |
| | 510,000 | | | NextGear Floorplan Master Owner Trust, Series 2017-1A, Class A2, 2.540%, 4/18/2022, 144A | | | 510,578 | |
| | 71,873 | | | Prestige Auto Receivables Trust, Series 2015-1, Class A3, 1.530%, 2/15/2021, 144A | | | 71,872 | |
| | 505,000 | | | Prestige Auto Receivables Trust, Series 2016-2A, Class A3, 1.760%, 1/15/2021, 144A | | | 503,265 | |
| | 188,000 | | | Santander Drive Auto Receivables Trust, Series 2016-2, Class C, 2.660%, 11/15/2021 | | | 189,585 | |
See accompanying notes to financial statements.
39 |
Portfolio of Investments – as of September 30, 2017
Loomis Sayles Intermediate Duration Bond Fund – (continued)
| | | | | | | | |
Principal
Amount | | | Description | | Value (†) | |
| | | | ABS Car Loan — continued | | | | |
| $ | 500,000 | | | Santander Drive Auto Receivables Trust, Series 2016-3, Class B, 1.890%, 6/15/2021 | | $ | 499,261 | |
| | 165,000 | | | Santander Drive Auto Receivables Trust, Series 2017-1, Class B, 2.100%, 6/15/2021 | | | 165,008 | |
| | 265,000 | | | Santander Drive Auto Receivables Trust, Series 2017-2, Class B, 2.210%, 10/15/2021 | | | 265,412 | |
| | 800,000 | | | Westlake Automobile Receivables Trust, Series 2016-3A, Class B, 2.070%, 12/15/2021, 144A | | | 798,328 | |
| | 295,000 | | | Westlake Automobile Receivables Trust, Series 2017-1A, Class B, 2.300%, 10/17/2022, 144A | | | 295,554 | |
| | 103,847 | | | World Omni Auto Receivables Trust, Series 2014-B, Class A3, 1.140%, 1/15/2020 | | | 103,725 | |
| | 1,330,000 | | | World Omni Auto Receivables Trust, Series 2017-A, Class A3, 1.930%, 9/15/2022(d) | | | 1,330,026 | |
| | 110,000 | | | World Omni Auto Receivables Trust, Series 2017-B, Class A3, 1.950%, 2/15/2023 | | | 109,777 | |
| | | | | | | | |
| | | | | | | 20,763,634 | |
| | | | | | | | |
| | | | ABS Credit Card — 3.3% | | | | |
| | 605,000 | | | American Express Credit Account Master Trust, Series 2017-1, Class A, 1.930%, 9/15/2022 | | | 605,821 | |
| | 630,000 | | | Bank of America Credit Card Trust, Series 2017-A1, Class A1, 1.950%, 8/15/2022 | | | 630,907 | |
| | 415,000 | | | Barclays Dryrock Issuance Trust, Series 2014-3, Class A, 2.410%, 7/15/2022 | | | 419,392 | |
| | 745,000 | | | Capital One Multi-Asset Execution Trust, Series 2017-A1, Class A1, 2.000%, 1/17/2023(d) | | | 747,145 | |
| | 1,085,000 | | | Chase Issuance Trust, Series 2016-A4, Class A4, 1.490%, 7/15/2022(d) | | | 1,071,521 | |
| | 260,000 | | | Citibank Credit Card Issuance Trust, Series 2014-A1, Class A1, 2.880%, 1/23/2023 | | | 267,174 | |
| | 470,000 | | | Synchrony Credit Card Master Note Trust, Series 2016-3, Class A, 1.580%, 9/15/2022 | | | 467,288 | |
| | 501,000 | | | World Financial Network Credit Card Master Trust, Series 2012-A, Class A, 3.140%, 1/17/2023 | | | 510,195 | |
| | 555,000 | | | World Financial Network Credit Card Master Trust, Series 2016-C, Class A, 1.720%, 8/15/2023 | | | 551,534 | |
| | 730,000 | | | World Financial Network Credit Card Master Trust, Series 2017-A, Class A, 2.120%, 3/15/2024(d) | | | 730,242 | |
| | | | | | | | |
| | | | | | | 6,001,219 | |
| | | | | | | | |
| | | | ABS Home Equity — 1.1% | | | | |
| | 418,559 | | | Bayview Opportunity Master Fund IVa Trust, Series 2016-SPL1, Class A, 4.000%, 4/28/2055, 144A | | | 433,437 | |
| | 296,368 | | | Colony American Finance Ltd., Series 2015-1, Class A, 2.896%, 10/15/2047, 144A | | | 298,135 | |
| | 207,353 | | | Colony American Homes, Series 2014-1A, Class A, 1-month LIBOR + 1.150%, 2.384%, 5/17/2031, 144A(a) | | | 208,221 | |
| | 19,148 | | | Countrywide Alternative Loan Trust, Series 2006-J5, Class 4A1, 4.956%, 7/25/2021(c) | | | 18,609 | |
See accompanying notes to financial statements.
| 40
Portfolio of Investments – as of September 30, 2017
Loomis Sayles Intermediate Duration Bond Fund – (continued)
| | | | | | | | |
Principal
Amount | | | Description | | Value (†) | |
| | | | ABS Home Equity — continued | | | | |
| $ | 12,743 | | | Countrywide Asset-Backed Certificates, Series 2004-S1, Class A3, 5.115%, 2/25/2035(c) | | $ | 12,876 | |
| | 500,000 | | | Freddie Mac Structured Agency Credit Risk Debt Notes, Series 2015-DNA1, Class M2, 1-month LIBOR + 1.850%, 3.087%, 10/25/2027(a) | | | 510,792 | |
| | 176,107 | | | Mill City Mortgage Trust, Series 2016-1, Class A1, 2.500%, 4/25/2057, 144A(c) | | | 176,015 | |
| | 156,218 | | | Towd Point Mortgage Trust, Series 2015-2, Class 1AE2, 2.750%, 11/25/2060, 144A(c) | | | 156,905 | |
| | 69,212 | | | Wells Fargo Mortgage Backed Securities Trust, Series 2005-AR10, Class 2A4, 3.296%, 5/01/2035(c) | | | 70,851 | |
| | | | | | | | |
| | | | | | | 1,885,841 | |
| | | | | | | | |
| | | | ABS Other — 2.0% | | | | |
| | 131,625 | | | DB Master Finance LLC, Series 2015-1A, Class A2I, 3.262%, 2/20/2045, 144A | | | 131,832 | |
| | 26,173 | | | FRS I LLC, Series 2013-1A, Class A1, 1.800%, 4/15/2043, 144A | | | 26,065 | |
| | 270,000 | | | John Deere Owner Trust, Series 2017-B, Class A3, 1.820%, 10/15/2021 | | | 269,822 | |
| | 414,615 | | | Merlin Aviation Holdings DAC, Series 2016-1, Class A, 4.500%, 12/15/2032, 144A(c) | | | 418,361 | |
| | 30,760 | | | OneMain Financial Issuance Trust, Series 2014-2A, Class A, 2.470%, 9/18/2024, 144A | | | 30,795 | |
| | 385,000 | | | OneMain Financial Issuance Trust, Series 2015-1A, Class A, 3.190%, 3/18/2026, 144A | | | 388,767 | |
| | 350,000 | | | OneMain Financial Issuance Trust, Series 2016-1A, Class A, 3.660%, 2/20/2029, 144A | | | 358,278 | |
| | 343,083 | | | S-Jets Ltd., Series 2017-1, Class A, 3.967%, 8/15/2042, 144A | | | 342,144 | |
| | 211,606 | | | Shenton Aircraft Investment I Ltd., Series 2015-1A, Class A, 4.750%, 10/15/2042, 144A | | | 221,571 | |
| | 179,155 | | | Sierra Receivables Funding Co. LLC, Series 2017-1A, Class A, 2.910%, 3/20/2034, 144A | | | 180,143 | |
| | 176,458 | | | TAL Advantage V LLC, Series 2014-1A, Class A, 3.510%, 2/22/2039, 144A | | | 176,453 | |
| | 78,593 | | | TAL Advantage V LLC, Series 2014-2A, Class A2, 3.330%, 5/20/2039, 144A | | | 78,407 | |
| | 179,167 | | | TAL Advantage V LLC, Series 2014-3A, Class A, 3.270%, 11/21/2039, 144A | | | 178,255 | |
| | 795,000 | | | Verizon Owner Trust, Series 2017-1A, Class A, 2.060%, 9/20/2021, 144A(d) | | | 797,171 | |
| | | | | | | | |
| | | | | | | 3,598,064 | |
| | | | | | | | |
| | | | ABS Student Loan — 0.9% | | | | |
| | 199,952 | | | Earnest Student Loan Program LLC, Series 2017-A, Class A2, 2.650%, 1/25/2041, 144A | | | 199,027 | |
| | 313,842 | | | North Carolina State Education Assistance Authority, Series 2011-2, Class A2, 3-month LIBOR + 0.800%, 2.114%, 7/25/2025(a) | | | 314,366 | |
| | 100,238 | | | SoFi Professional Loan Program LLC, Series 2015-A, Class A2, 2.420%, 3/25/2030, 144A | | | 100,298 | |
| | 368,815 | | | SoFi Professional Loan Program LLC, Series 2015-C, Class A2, 2.510%, 8/25/2033, 144A | | | 369,556 | |
| | 295,000 | | | SoFi Professional Loan Program LLC, Series 2016-B, Class A2B, 2.740%, 10/25/2032, 144A | | | 297,218 | |
| | 276,564 | | | South Carolina Student Loan Corp., Series 2010-1, Class A2, 3-month LIBOR + 1.000%, 2.314%, 7/25/2025(a) | | | 278,569 | |
| | | | | | | | |
| | | | | | | 1,559,034 | |
| | | | | | | | |
See accompanying notes to financial statements.
41 |
Portfolio of Investments – as of September 30, 2017
Loomis Sayles Intermediate Duration Bond Fund – (continued)
| | | | | | | | |
Principal
Amount | | | Description | | Value (†) | |
| | | | Aerospace & Defense — 0.7% | | | | |
| $ | 580,000 | | | General Dynamics Corp., 2.625%, 11/15/2027 | | $ | 561,299 | |
| | 450,000 | | | Rolls-Royce PLC, 2.375%, 10/14/2020, 144A | | | 448,992 | |
| | 270,000 | | | Textron, Inc., 3.375%, 3/01/2028 | | | 268,069 | |
| | | | | | | | |
| | | | | | | 1,278,360 | |
| | | | | | | | |
| | | | Agency Commercial Mortgage-Backed Securities — 2.1% | | | | |
| | 648,018 | | | FHLMC Multifamily Structured Pass Through Certificates, Series K013, Class A2, 3.974%, 1/25/2021(c) | | | 685,760 | |
| | 509,476 | | | FHLMC Multifamily Structured Pass Through Certificates, Series K029, Class A2, 3.320%, 2/25/2023(c) | | | 533,937 | |
| | 701,647 | | | FHLMC Multifamily Structured Pass Through Certificates, Series K042, Class A2, 2.670%, 12/25/2024 | | | 705,818 | |
| | 1,014,484 | | | FHLMC Multifamily Structured Pass Through Certificates, Series K711, Class A2, 1.730%, 7/25/2019(d) | | | 1,012,852 | |
| | 625,673 | | | FHLMC Multifamily Structured Pass Through Certificates, Series KLH2, Class A, 1-month LIBOR + 0.700%, 1.932%, 11/25/2022(a) | | | 628,222 | |
| | 161,033 | | | FHLMC Multifamily Structured Pass Through Certificates, Series KP03, Class A2, 1.780%, 7/25/2019 | | | 160,965 | |
| | | | | | | | |
| | | | | | | 3,727,554 | |
| | | | | | | | |
| | | | Airlines — 0.0% | | | | |
| | 59,516 | | | Delta Air Lines Pass Through Trust, Series 2009-1, Class A, 7.750%, 6/17/2021 | | | 65,156 | |
| | | | | | | | |
| | | | Automotive — 3.9% | | | | |
| | 500,000 | | | American Honda Finance Corp., MTN, 1.200%, 7/12/2019 | | | 495,467 | |
| | 425,000 | | | American Honda Finance Corp., MTN, 2.000%, 2/14/2020 | | | 425,938 | |
| | 585,000 | | | BMW U.S. Capital LLC, 1.850%, 9/15/2021, 144A | | | 574,741 | |
| | 740,000 | | | Daimler Finance North America LLC, 2.200%, 5/05/2020, 144A | | | 740,875 | |
| | 220,000 | | | Daimler Finance North America LLC, 2.450%, 5/18/2020, 144A | | | 221,545 | |
| | 45,000 | | | Delphi Automotive PLC, 3.150%, 11/19/2020 | | | 46,042 | |
| | 360,000 | | | Ford Motor Credit Co. LLC, 2.459%, 3/27/2020 | | | 360,284 | |
| | 670,000 | | | Ford Motor Credit Co. LLC, 2.979%, 8/03/2022 | | | 667,181 | |
| | 955,000 | | | General Motors Co., 3-month LIBOR + 0.800%, 2.112%, 8/07/2020(a) | | | 955,861 | |
| | 730,000 | | | Hyundai Capital America, 2.750%, 9/18/2020, 144A | | | 728,680 | |
| | 930,000 | | | Nissan Motor Acceptance Corp., 2.150%, 7/13/2020, 144A | | | 932,197 | |
| | 150,000 | | | PACCAR Financial Corp., MTN, 1.200%, 8/12/2019 | | | 148,189 | |
| | 660,000 | | | Toyota Motor Credit Corp., 2.150%, 9/08/2022 | | | 652,682 | |
| | | | | | | | |
| | | | | | | 6,949,682 | |
| | | | | | | | |
| | | | Banking — 17.9% | | | | |
| | 530,000 | | | ABN AMRO Bank NV, 1.800%, 9/20/2019, 144A | | | 527,546 | |
| | 955,000 | | | American Express Co., 2.500%, 8/01/2022 | | | 953,906 | |
| | 915,000 | | | ANZ New Zealand (Int’l) Ltd., 2.200%, 7/17/2020, 144A | | | 915,750 | |
| | 116,000 | | | Bank of America Corp., MTN, 6.875%, 4/25/2018 | | | 119,339 | |
| | 365,000 | | | Bank of Montreal, MTN, 1.500%, 7/18/2019 | | | 362,685 | |
| | 545,000 | | | Bank of Montreal, MTN, 2.100%, 12/12/2019 | | | 546,956 | |
| | 875,000 | | | Bank of Montreal, MTN, 2.350%, 9/11/2022 | | | 866,207 | |
| | 1,080,000 | | | Bank of New York Mellon Corp. (The), MTN, (fixed rate to 5/16/2022, variable rate thereafter), 2.661%, 5/16/2023 | | | 1,084,484 | |
See accompanying notes to financial statements.
| 42
Portfolio of Investments – as of September 30, 2017
Loomis Sayles Intermediate Duration Bond Fund – (continued)
| | | | | | | | |
Principal
Amount | | | Description | | Value (†) | |
| | | | Banking — continued | | | | |
| $ | 740,000 | | | Bank of Nova Scotia, 2.150%, 7/14/2020 | | $ | 742,009 | |
| | 450,000 | | | Banque Federative du Credit Mutuel S.A., 2.200%, 7/20/2020, 144A | | | 449,750 | |
| | 930,000 | | | Banque Federative du Credit Mutuel S.A., 2.700%, 7/20/2022, 144A | | | 934,354 | |
| | 490,000 | | | BNZ International Funding Ltd., 2.400%, 2/21/2020, 144A | | | 491,853 | |
| | 750,000 | | | Capital One Financial Corp., 2.500%, 5/12/2020 | | | 753,492 | |
| | 435,000 | | | Citigroup, Inc., 2.750%, 4/25/2022 | | | 437,092 | |
| | 215,000 | | | Citigroup, Inc., 2.900%, 12/08/2021 | | | 217,649 | |
| | 625,000 | | | Citizens Bank NA, 2.250%, 3/02/2020 | | | 625,827 | |
| | 430,000 | | | Citizens Bank NA, Series BKNT, 2.500%, 3/14/2019 | | | 433,032 | |
| | 250,000 | | | Comerica Bank, 2.500%, 6/02/2020 | | | 251,363 | |
| | 970,000 | | | Commonwealth Bank of Australia, 1.750%, 11/07/2019, 144A | | | 965,005 | |
| | 615,000 | | | Commonwealth Bank of Australia, 3.150%, 9/19/2027, 144A | | | 609,393 | |
| | 595,000 | | | Credit Agricole S.A., 3.250%, 10/04/2024, 144A | | | 595,179 | |
| | 615,000 | | | Credit Suisse Group AG, (fixed rate to 12/14/2022, variable rate thereafter), 2.997%, 12/14/2023, 144A | | | 613,175 | |
| | 735,000 | | | Danske Bank AS, 2.200%, 3/02/2020, 144A | | | 736,618 | |
| | 1,060,000 | | | Deutsche Bank AG, 2.700%, 7/13/2020 | | | 1,064,299 | |
| | 780,000 | | | Fifth Third Bank, Series BKNT, 1.625%, 9/27/2019 | | | 775,201 | |
| | 215,000 | | | Goldman Sachs Group, Inc. (The), 2.750%, 9/15/2020 | | | 217,778 | |
| | 185,000 | | | HSBC USA, Inc., 2.375%, 11/13/2019 | | | 186,317 | |
| | 580,000 | | | Intesa Sanpaolo SpA, 3.125%, 7/14/2022, 144A | | | 581,431 | |
| | 1,035,000 | | | JPMorgan Chase & Co., 3-month LIBOR + 0.550%, 1.867%, 3/09/2021(a) | | | 1,035,859 | |
| | 585,000 | | | JPMorgan Chase Bank NA, 1.650%, 9/23/2019 | | | 582,852 | |
| | 555,000 | | | Key Bank NA, Series BKNT, 1.600%, 8/22/2019 | | | 552,023 | |
| | 910,000 | | | KeyBank N.A., 2.400%, 6/09/2022 | | | 906,296 | |
| | 460,000 | | | Mizuho Bank Ltd., 1.800%, 3/26/2018, 144A | | | 459,931 | |
| | 670,000 | | | Mizuho Financial Group, Inc., 3.170%, 9/11/2027 | | | 655,728 | |
| | 855,000 | | | Morgan Stanley, Series 3NC2, 3-month LIBOR + 0.800%, 2.109%, 2/14/2020(a) | | | 859,351 | |
| | 295,000 | | | National Bank of Canada, 2.100%, 12/14/2018 | | | 295,693 | |
| | 540,000 | | | Nordea Bank AB, 1.625%, 9/30/2019, 144A | | | 536,522 | |
| | 845,000 | | | Nordea Bank AB, 2.125%, 5/29/2020, 144A | | | 845,828 | |
| | 315,000 | | | Northern Trust Corp., (fixed rate to 5/8/2027, variable rate thereafter), 3.375%, 5/08/2032 | | | 315,116 | |
| | 652,000 | | | Royal Bank of Canada, GMTN, 1.625%, 4/15/2019 | | | 649,983 | |
| | 855,000 | | | Santander Holdings USA, Inc., 3.700%, 3/28/2022, 144A | | | 871,109 | |
| | 605,000 | | | State Street Corp., (fixed rate to 5/15/2022, variable rate thereafter), 2.653%, 5/15/2023 | | | 608,358 | |
| | 475,000 | | | Sumitomo Mitsui Financial Group, Inc., 2.784%, 7/12/2022 | | | 476,840 | |
| | 525,000 | | | Svenska Handelsbanken AB, Series BKNT, 1.500%, 9/06/2019 | | | 521,349 | |
| | 840,000 | | | U.S. Bank NA, 2.000%, 1/24/2020 | | | 842,262 | |
| | 920,000 | | | UBS AG, 2.200%, 6/08/2020, 144A | | | 921,932 | |
| | 455,000 | | | UniCredit SpA, 3.750%, 4/12/2022, 144A | | | 466,404 | |
| | 855,000 | | | Wells Fargo & Co., MTN, 2.625%, 7/22/2022 | | | 856,430 | |
| | 755,000 | | | Wells Fargo & Co., MTN, 3.300%, 9/09/2024 | | | 767,433 | |
| | 770,000 | | | Wells Fargo Bank NA, 1.750%, 5/24/2019 | | | 769,467 | |
| | 375,000 | | | Westpac Banking Corp., 2.500%, 6/28/2022 | | | 374,820 | |
| | | | | | | | |
| | | | | | | 32,229,276 | |
| | | | | | | | |
See accompanying notes to financial statements.
43 |
Portfolio of Investments – as of September 30, 2017
Loomis Sayles Intermediate Duration Bond Fund – (continued)
| | | | | | | | |
Principal
Amount | | | Description | | Value (†) | |
| | | | Brokerage — 0.5% | | | | |
| $ | 335,000 | | | CBOE Holdings, Inc., 1.950%, 6/28/2019 | | $ | 334,665 | |
| | 480,000 | | | E*TRADE Financial Corp., 2.950%, 8/24/2022 | | | 481,067 | |
| | | | | | | | |
| | | | | | | 815,732 | |
| | | | | | | | |
| | | | Building Materials — 0.4% | | | | |
| | 107,000 | | | Fortune Brands Home & Security, Inc., 3.000%, 6/15/2020 | | | 108,599 | |
| | 600,000 | | | Martin Marietta Materials, Inc., 3-month LIBOR + 0.650%, 1.965%, 5/22/2020(a) | | | 602,426 | |
| | 40,000 | | | Masco Corp., 3.500%, 4/01/2021 | | | 41,075 | |
| | 4,000 | | | Masco Corp., 7.125%, 3/15/2020 | | | 4,440 | |
| | | | | | | | |
| | | | | | | 756,540 | |
| | | | | | | | |
| | | | Cable Satellite — 0.5% | | | | |
| | 300,000 | | | Charter Communications Operating LLC/Charter Communications Operating Capital Corp., 4.908%, 7/23/2025 | | | 320,704 | |
| | 645,000 | | | Cox Communications, Inc., 3.150%, 8/15/2024, 144A | | | 640,953 | |
| | | | | | | | |
| | | | | | | 961,657 | |
| | | | | | | | |
| | | | Chemicals — 0.3% | | | | |
| | 107,000 | | | Airgas, Inc., 3.050%, 8/01/2020 | | | 109,443 | |
| | 9,000 | | | Eastman Chemical Co., 4.500%, 1/15/2021 | | | 9,526 | |
| | 385,000 | | | EI du Pont de Nemours & Co., 2.200%, 5/01/2020 | | | 387,478 | |
| | 45,000 | | | Methanex Corp., 3.250%, 12/15/2019 | | | 45,414 | |
| | | | | | | | |
| | | | | | | 551,861 | |
| | | | | | | | |
| | | | Collateralized Mortgage Obligations — 1.7% | | | | |
| | 211,826 | | | Government National Mortgage Association, Series 2014-H14, Class FA, 1-month LIBOR + 0.500%, 1.731%, 7/20/2064(a) | | | 211,488 | |
| | 143,787 | | | Government National Mortgage Association, Series 2014-H15, Class FA, 1-month LIBOR + 0.500%, 1.731%, 7/20/2064(a) | | | 143,536 | |
| | 345,087 | | | Government National Mortgage Association, Series 2015-H09, Class HA, 1.750%, 3/20/2065 | | | 344,338 | |
| | 555,860 | | | Government National Mortgage Association, Series 2015-H10, Class JA, 2.250%, 4/20/2065 | | | 544,559 | |
| | 577,472 | | | Government National Mortgage Association, Series 2016-H06, Class FC, 1-month LIBOR + 0.920%, 2.151%, 2/20/2066(a) | | | 584,481 | |
| | 1,220,658 | | | Government National Mortgage Association, Series 2016-H10, Class FJ, 1-month LIBOR + 0.600%, 1.831%, 4/20/2066(a)(d) | | | 1,223,367 | |
| | | | | | | | |
| | | | | | | 3,051,769 | |
| | | | | | | | |
| | | | Construction Machinery — 0.6% | | | | |
| | 174,000 | | | John Deere Capital Corp., 2.450%, 9/11/2020 | | | 175,984 | |
| | 565,000 | | | John Deere Capital Corp., MTN, 2.800%, 9/08/2027 | | | 555,480 | |
| | 350,000 | | | John Deere Capital Corp., MTN, 1.950%, 6/22/2020 | | | 350,354 | |
| | | | | | | | |
| | | | | | | 1,081,818 | |
| | | | | | | | |
| | | | Consumer Cyclical Services — 1.2% | | | | |
| | 225,000 | | | Alibaba Group Holding Ltd., 2.500%, 11/28/2019 | | | 226,840 | |
| | 885,000 | | | Expedia, Inc., 3.800%, 2/15/2028, 144A | | | 877,185 | |
| | 1,020,000 | | | Western Union Co. (The), 3.600%, 3/15/2022 | | | 1,035,571 | |
| | | | | | | | |
| | | | | | | 2,139,596 | |
| | | | | | | | |
See accompanying notes to financial statements.
| 44
Portfolio of Investments – as of September 30, 2017
Loomis Sayles Intermediate Duration Bond Fund – (continued)
| | | | | | | | |
Principal
Amount | | | Description | | Value (†) | |
| | | | Consumer Products — 0.2% | | | | |
| $ | 120,000 | | | Church & Dwight Co., Inc., 2.450%, 8/01/2022 | | $ | 119,552 | |
| | 170,000 | | | Hasbro, Inc., 3.500%, 9/15/2027 | | | 168,484 | |
| | | | | | | | |
| | | | | | | 288,036 | |
| | | | | | | | |
| | | | Diversified Manufacturing — 0.7% | | | | |
| | 620,000 | | | Eaton Corp., 3.103%, 9/15/2027 | | | 612,518 | |
| | 80,000 | | | Snap-on, Inc., 4.250%, 1/15/2018 | | | 80,588 | |
| | 615,000 | | | United Technologies Corp., 2.800%, 5/04/2024 | | | 615,550 | |
| | | | | | | | |
| | | | | | | 1,308,656 | |
| | | | | | | | |
| | | | Electric — 2.5% | | | | |
| | 120,000 | | | Consolidated Edison Co. of New York, Inc., Series B, 2.900%, 12/01/2026 | | | 118,101 | |
| | 1,035,000 | | | Consolidated Edison, Inc., Series A, 2.000%, 3/15/2020 | | | 1,034,794 | |
| | 451,000 | | | Exelon Corp., 2.450%, 4/15/2021 | | | 451,040 | |
| | 179,000 | | | Exelon Generation Co. LLC, 2.950%, 1/15/2020 | | | 182,166 | |
| | 116,000 | | | Exelon Generation Co. LLC, 4.250%, 6/15/2022 | | | 124,029 | |
| | 395,000 | | | Fortis, Inc., 2.100%, 10/04/2021 | | | 387,828 | |
| | 188,000 | | | National Rural Utilities Cooperative Finance Corp., (fixed rate to 4/30/2023, variable rate thereafter), 4.750%, 4/30/2043 | | | 195,175 | |
| | 690,000 | | | National Rural Utilities Cooperative Finance Corp., MTN, 1.500%, 11/01/2019 | | | 684,546 | |
| | 280,000 | | | NextEra Energy Capital Holdings, Inc., 1.649%, 9/01/2018 | | | 279,878 | |
| | 273,000 | | | Southern Co. (The), 2.750%, 6/15/2020 | | | 277,499 | |
| | 720,000 | | | Southern Power Co., Series E, 2.500%, 12/15/2021 | | | 716,894 | |
| | | | | | | | |
| | | | | | | 4,451,950 | |
| | | | | | | | |
| | | | Finance Companies — 0.4% | | | | |
| | 665,000 | | | Ares Capital Corp., 3.500%, 2/10/2023 | | | 657,584 | |
| | | | | | | | |
| | | | Financial Other — 0.6% | | | | |
| | 410,000 | | | Mitsubishi UFJ Lease & Finance Co. Ltd., 2.652%, 9/19/2022, 144A | | | 406,527 | |
| | 615,000 | | | ORIX Corp., 2.900%, 7/18/2022 | | | 617,335 | |
| | | | | | | | |
| | | | | | | 1,023,862 | |
| | | | | | | | |
| | | | Food & Beverage — 1.8% | | | | |
| | 9,000 | | | Anheuser-Busch Cos. LLC, 5.000%, 3/01/2019 | | | 9,397 | |
| | 210,000 | | | Dr Pepper Snapple Group, Inc., 3.430%, 6/15/2027, 144A | | | 211,086 | |
| | 950,000 | | | Kraft Heinz Food Co., 3-month LIBOR + 0.570%, 1.879%, 2/10/2021(a) | | | 950,854 | |
| | 845,000 | | | Molson Coors Brewing Co., 2.250%, 3/15/2020, 144A | | | 844,474 | |
| | 140,000 | | | Smithfield Foods, Inc., 3.350%, 2/01/2022, 144A | | | 142,666 | |
| | 1,070,000 | | | Tyson Foods, Inc., 3-month LIBOR + 0.450%, 1.768%, 5/30/2019(a) | | | 1,071,572 | |
| | | | | | | | |
| | | | | | | 3,230,049 | |
| | | | | | | | |
| | | | Government Owned – No Guarantee — 1.1% | | | | |
| | 445,000 | | | Petroleos Mexicanos, 6.375%, 2/04/2021 | | | 487,502 | |
| | 155,000 | | | Petroleos Mexicanos, 6.875%, 8/04/2026 | | | 176,312 | |
| | 625,000 | | | Sinopec Group, 3.250%, 9/13/2027, 144A | | | 618,212 | |
| | 780,000 | | | Sinopec Group Overseas Development 2016 Ltd., 1.750%, 9/29/2019, 144A | | | 771,631 | |
| | | | | | | | |
| | | | | | | 2,053,657 | |
| | | | | | | | |
See accompanying notes to financial statements.
45 |
Portfolio of Investments – as of September 30, 2017
Loomis Sayles Intermediate Duration Bond Fund – (continued)
| | | | | | | | |
Principal
Amount | | | Description | | Value (†) | |
| | | | Healthcare — 1.2% | | | | |
| $ | 41,000 | | | Agilent Technologies, Inc., 6.500%, 11/01/2017 | | $ | 41,134 | |
| | 750,000 | | | Becton, Dickinson and Co., 2.133%, 6/06/2019 | | | 752,065 | |
| | 640,000 | | | Cardinal Health, Inc., 1.948%, 6/14/2019 | | | 640,255 | |
| | 390,000 | | | Express Scripts Holding Co., 3.500%, 6/15/2024 | | | 395,719 | |
| | 183,000 | | | Life Technologies Corp., 6.000%, 3/01/2020 | | | 198,824 | |
| | 94,000 | | | Quest Diagnostics, Inc., 4.750%, 1/30/2020 | | | 99,395 | |
| | | | | | | | |
| | | | | | | 2,127,392 | |
| | | | | | | | |
| | | | Hybrid ARMs — 0.1% | | | | |
| | 55,884 | | | FHLMC, 1-year CMT + 2.248%, 3.111%, 1/01/2035(a) | | | 58,979 | |
| | 155,491 | | | FHLMC, 1-year CMT + 2.495%, 3.268%, 5/01/2036(a) | | | 165,295 | |
| | | | | | | | |
| | | | | | | 224,274 | |
| | | | | | | | |
| | | | Independent Energy — 0.5% | | | | |
| | 240,000 | | | Concho Resources, Inc., 3.750%, 10/01/2027 | | | 241,068 | |
| | 107,000 | | | ConocoPhillips Co., 2.875%, 11/15/2021 | | | 109,008 | |
| | 179,000 | | | Encana Corp., 6.500%, 5/15/2019 | | | 190,485 | |
| | 445,000 | | | EQT Corp., 3.900%, 10/01/2027 | | | 445,078 | |
| | | | | | | | |
| | | | | | | 985,639 | |
| | | | | | | | |
| | | | Integrated Energy — 1.4% | | | | |
| | 620,000 | | | BP Capital Markets PLC, 3.279%, 9/19/2027 | | | 619,398 | |
| | 845,000 | | | Cenovus Energy, Inc., 4.250%, 4/15/2027, 144A | | | 837,803 | |
| | 1,030,000 | | | Chevron Corp., 1.991%, 3/03/2020 | | | 1,033,876 | |
| | | | | | | | |
| | | | | | | 2,491,077 | |
| | | | | | | | |
| | | | Life Insurance — 1.9% | | | | |
| | 85,000 | | | AIG Global Funding, 2.150%, 7/02/2020, 144A | | | 84,880 | |
| | 535,000 | | | Athene Global Funding, 2.750%, 4/20/2020, 144A | | | 539,246 | |
| | 535,000 | | | Athene Global Funding, 3.000%, 7/01/2022, 144A | | | 532,841 | |
| | 655,000 | | | Brighthouse Financial, Inc., 3.700%, 6/22/2027, 144A | | | 643,129 | |
| | 830,000 | | | Jackson National Life Global Funding, 2.200%, 1/30/2020, 144A | | | 830,632 | |
| | 344,000 | | | Reliance Standard Life Global Funding II, 2.150%, 10/15/2018, 144A | | | 345,379 | |
| | 63,000 | | | Unum Group, 5.625%, 9/15/2020 | | | 68,612 | |
| | 295,000 | | | Voya Financial, Inc., 3.125%, 7/15/2024 | | | 291,137 | |
| | | | | | | | |
| | | | | | | 3,335,856 | |
| | | | | | | | |
| | | | Media Entertainment — 0.9% | | | | |
| | 95,000 | | | Activision Blizzard, Inc., 2.300%, 9/15/2021 | | | 94,464 | |
| | 230,000 | | | Discovery Communications LLC, 3.950%, 3/20/2028 | | | 228,352 | |
| | 715,000 | | | Moody’s Corp., 3-month LIBOR + 0.350%, 1.666%, 9/04/2018(a) | | | 716,261 | |
| | 112,000 | | | S&P Global, Inc, 3.300%, 8/14/2020 | | | 114,892 | |
| | 480,000 | | | Walt Disney Co. (The), MTN, 1.950%, 3/04/2020 | | | 481,600 | |
| | | | | | | | |
| | | | | | | 1,635,569 | |
| | | | | | | | |
| | | | Metals & Mining — 0.0% | | | | |
| | 40,000 | | | Barrick North America Finance LLC, 4.400%, 5/30/2021 | | | 43,015 | |
| | 31,000 | | | Reliance Steel & Aluminum Co., 4.500%, 4/15/2023 | | | 32,893 | |
| | | | | | | | |
| | | | | | | 75,908 | |
| | | | | | | | |
See accompanying notes to financial statements.
| 46
Portfolio of Investments – as of September 30, 2017
Loomis Sayles Intermediate Duration Bond Fund – (continued)
| | | | | | | | |
Principal
Amount | | | Description | | Value (†) | |
| | | | Midstream — 0.6% | | | | |
| $ | 155,000 | | | Enbridge, Inc., 3.500%, 6/10/2024 | | $ | 157,400 | |
| | 255,000 | | | Energy Transfer LP, 2.500%, 6/15/2018 | | | 256,001 | |
| | 60,000 | | | Energy Transfer LP, 4.900%, 2/01/2024 | | | 63,639 | |
| | 255,000 | | | Kinder Morgan Energy Partners LP, 4.150%, 2/01/2024 | | | 264,324 | |
| | 160,000 | | | Plains All American Pipeline LP/PAA Finance Corp., 3.850%, 10/15/2023 | | | 160,613 | |
| | 143,000 | | | Williams Partners LP, 3.600%, 3/15/2022 | | | 147,747 | |
| | | | | | | | |
| | | | | | | 1,049,724 | |
| | | | | | | | |
| | | | Mortgage Related — 4.4% | | | | |
| | 4,429 | | | FHLMC, 3.000%, 10/01/2026 | | | 4,555 | |
| | 462 | | | FHLMC, 6.500%, 1/01/2024 | | | 512 | |
| | 82 | | | FHLMC, 8.000%, 7/01/2025 | | | 91 | |
| | 167 | | | FNMA, 6.000%, 9/01/2021 | | | 170 | |
| | 421,390 | | | GNMA, 4.288%, 2/20/2063(c) | | | 437,884 | |
| | 231,799 | | | GNMA, 4.297%, 2/20/2063(c) | | | 242,097 | |
| | 293,208 | | | GNMA, 4.412%, with various maturities in 2066(b)(c) | | | 320,122 | |
| | 103,536 | | | GNMA, 4.426%, 9/20/2066(c) | | | 112,877 | |
| | 68,453 | | | GNMA, 4.448%, 11/20/2066(c) | | | 74,677 | |
| | 188,183 | | | GNMA, 4.466%, 10/20/2062(c) | | | 195,558 | |
| | 185,432 | | | GNMA, 4.467%, 5/20/2062(c) | | | 191,347 | |
| | 117,522 | | | GNMA, 4.477%, 11/20/2066(c) | | | 128,545 | |
| | 67,617 | | | GNMA, 4.479%, 8/20/2066(c) | | | 73,749 | |
| | 434,326 | | | GNMA, 4.498%, 4/20/2063(c) | | | 452,691 | |
| | 247,579 | | | GNMA, 4.504%, 5/20/2062(c) | | | 255,320 | |
| | 226,201 | | | GNMA, 4.518%, 4/20/2063(c) | | | 235,976 | |
| | 113,837 | | | GNMA, 4.522%, 10/20/2066(c) | | | 124,712 | |
| | 1,115,841 | | | GNMA, 4.534%, 4/20/2067(c)(d) | | | 1,232,463 | |
| | 187,574 | | | GNMA, 4.539%, 9/20/2066(c) | | | 206,266 | |
| | 193,924 | | | GNMA, 4.559%, 3/20/2062(c) | | | 199,947 | �� |
| | 100,902 | | | GNMA, 4.562%, 10/20/2066(c) | | | 111,346 | |
| | 220,484 | | | GNMA, 4.563%, 3/20/2063(c) | | | 230,148 | |
| | 506,922 | | | GNMA, 4.566%, 7/20/2067(c)(d) | | | 557,642 | |
| | 174,141 | | | GNMA, 4.580%, 6/20/2062(c) | | | 179,611 | |
| | 254,434 | | | GNMA, 4.581%, 2/20/2063(c) | | | 264,736 | |
| | 842,190 | | | GNMA, 4.594%, 1/20/2067(c)(d) | | | 931,912 | |
| | 349,770 | | | GNMA, 4.599%, 11/20/2064(c) | | | 362,027 | |
| | 141,452 | | | GNMA, 4.602%, 7/20/2062(c) | | | 146,021 | |
| | 142,822 | | | GNMA, 4.683%, 8/20/2061(c) | | | 145,168 | |
| | 474,585 | | | GNMA, 4.684%, 5/20/2064(c) | | | 515,813 | |
| | 1,502 | | | GNMA, 6.500%, 12/15/2023 | | | 1,657 | |
| | 191 | | | GNMA, 8.500%, 9/15/2022 | | | 192 | |
| | 493 | | | GNMA, 9.500%, 1/15/2019 | | | 499 | |
| | | | | | | | |
| | | | | | | 7,936,331 | |
| | | | | | | | |
| | | | Natural Gas — 0.5% | | | | |
| | 965,000 | | | Sempra Energy, 1.625%, 10/07/2019 | | | 958,915 | |
| | | | | | | | |
See accompanying notes to financial statements.
47 |
Portfolio of Investments – as of September 30, 2017
Loomis Sayles Intermediate Duration Bond Fund – (continued)
| | | | | | | | |
Principal
Amount | | | Description | | Value (†) | |
| | | | Non-Agency Commercial Mortgage-Backed Securities — 7.5% | | | | |
| $ | 565,000 | | | Barclays Commercial Mortgage Securities Trust, Series 2017-C1, Class A2, 3.189%, 2/15/2050(d) | | $ | 581,140 | |
| | 491,600 | | | CFCRE Commercial Mortgage Trust, Series 2016-C3, Class A3, 3.865%, 1/10/2048 | | | 515,359 | |
| | 361,996 | | | CFCRE Commercial Mortgage Trust, Series 2016-C4, Class A4, 3.283%, 5/10/2058 | | | 365,292 | |
| | 992,138 | | | Citigroup Commercial Mortgage Trust, Series 2016-GC37, Class A4, 3.314%, 4/10/2049(d) | | | 1,007,096 | |
| | 263,676 | | | Commercial Mortgage Pass Through Certificates, Series 2013-CR8, Class A5, 3.612%, 6/10/2046(c) | | | 276,350 | |
| | 535,000 | | | Commercial Mortgage Pass Through Certificates, Series 2012-LTRT, Class A2, 3.400%, 10/05/2030, 144A | | | 535,747 | |
| | 84,913 | | | Commercial Mortgage Pass Through Certificates, Series 2014-CR14, Class A2, 3.147%, 2/10/2047 | | | 85,969 | |
| | 232,393 | | | Commercial Mortgage Pass Through Certificates, Series 2014-CR15, Class A2, 2.928%, 2/10/2047 | | | 235,307 | |
| | 205,578 | | | Commercial Mortgage Pass Through Certificates, Series 2014-CR16, Class ASB, 3.653%, 4/10/2047 | | | 215,184 | |
| | 478,193 | | | Commercial Mortgage Pass Through Certificates, Series 2014-LC17, Class A3, 3.723%, 10/10/2047 | | | 492,496 | |
| | 730,000 | | | Commercial Mortgage Pass Through Certificates, Series 2014-TWC, Class A, 1-month LIBOR + 0.850%, 2.087%, 2/13/2032, 144A(a) | | | 730,342 | |
| | 280,000 | | | Commercial Mortgage Pass Through Certificates, Series 2014-UBS3, Class A4, 3.819%, 6/10/2047 | | | 294,745 | |
| | 520,299 | | | Commercial Mortgage Pass Through Certificates, Series 2016-DC2, Class A5, 3.765%, 2/10/2049 | | | 544,389 | |
| | 280,000 | | | Commercial Mortgage Trust, Series 2015-DC1, Class A5, 3.350%, 2/10/2048 | | | 285,902 | |
| | 380,000 | | | Credit Suisse Mortgage Capital Certificates, Series 2014-USA, Class A2, 3.953%, 9/15/2037, 144A | | | 393,625 | |
| | 84,913 | | | CSAIL Commercial Mortgage Trust, Series 2015-C4, Class ASB, 3.617%, 11/15/2048 | | | 89,075 | |
| | 107,224 | | | GP Portfolio Trust, Series 2014-GPP, Class A, 1-month LIBOR + 1.200%, 2.427%, 2/15/2027, 144A(a) | | | 107,462 | |
| | 340,000 | | | GS Mortgage Securities Corp. Trust, Series 2013-PEMB, Class A, 3.668%, 3/05/2033, 144A(c) | | | 336,971 | |
| | 330,000 | | | GS Mortgage Securities Trust, Series 2014-GC18, Class A4, 4.074%, 1/10/2047 | | | 352,623 | |
| | 216,993 | | | GS Mortgage Securities Trust, Series 2014-GC20, Class A3, 3.680%, 4/10/2047 | | | 222,691 | |
| | 355,000 | | | Hudsons Bay Simon JV Trust, Series 2015-HB7, Class A7, 3.914%, 8/05/2034, 144A | | | 359,557 | |
| | 120,665 | | | JPMorgan Chase Commercial Mortgage Securities Trust, Series 2014-C19, Class ASB, 3.584%, 4/15/2047 | | | 125,709 | |
| | 43,022 | | | JPMorgan Chase Commercial Mortgage Securities Trust, Series 2014-FL5, Class A, 1-month LIBOR + 0.980%, 2.207%, 7/15/2031, 144A(a) | | | 43,086 | |
| | 459,170 | | | JPMorgan Chase Commercial Mortgage Securities Trust, Series 2015-SGP, Class A, 1-month LIBOR + 1.700%, 2.927%, 7/15/2036, 144A(a) | | | 460,174 | |
| | 259,993 | | | JPMorgan Chase Commercial Mortgage Securities Trust, Series 2017-JP5, Class A1, 2.086%, 3/15/2050 | | | 259,774 | |
See accompanying notes to financial statements.
| 48
Portfolio of Investments – as of September 30, 2017
Loomis Sayles Intermediate Duration Bond Fund – (continued)
| | | | | | | | |
Principal
Amount | | | Description | | Value (†) | |
| | | | Non-Agency Commercial Mortgage-Backed Securities — continued | | | | |
| $ | 240,000 | | | Morgan Stanley Bank of America Merrill Lynch Trust, Series 2013-C10, Class A4, 4.219%, 7/15/2046(c) | | $ | 258,035 | |
| | 263,676 | | | Morgan Stanley Bank of America Merrill Lynch Trust, Series 2014-C14, Class A3, 3.669%, 2/15/2047 | | | 274,459 | |
| | 129,604 | | | Morgan Stanley Bank of America Merrill Lynch Trust, Series 2015-C22, Class A4, 3.306%, 4/15/2048 | | | 132,391 | |
| | 185,000 | | | SCG Trust, Series 2013-SRP1, Class B, 1-month LIBOR + 2.500%, 3.977%, 11/15/2026, 144A(a) | | | 182,195 | |
| | 505,000 | | | UBS-Barclays Commercial Mortgage Trust, Series 2012-TFT, Class A, 2.892%, 6/05/2030, 144A | | | 500,322 | |
| | 565,000 | | | UBS-Barclays Commercial Mortgage Trust, Series 2013-C6, Class A4, 3.244%, 4/10/2046(d) | | | 583,253 | |
| | 201,109 | | | Wells Fargo Commercial Mortgage Trust, Series 2016-C33, Class A4, 3.426%, 3/15/2059 | | | 206,407 | |
| | 1,295,000 | | | Wells Fargo Commercial Mortgage Trust, Series 2017-RC1, Class A2, 3.118%, 1/15/2060(d) | | | 1,329,615 | |
| | 174,460 | | | WFCG Commercial Mortgage Trust, Series 2015-BXRP, Class A, 1-month LIBOR + 1.122%, 2.356%, 11/15/2029, 144A(a) | | | 174,459 | |
| | 178,764 | | | WFRBS Commercial Mortgage Trust, Series 2004-C19, Class A3, 3.660%, 3/15/2047 | | | 186,095 | |
| | 325,000 | | | WFRBS Commercial Mortgage Trust, Series 2014-C19, Class A5, 4.101%, 3/15/2047 | | | 347,389 | |
| | 348,589 | | | WFRBS Commercial Mortgage Trust, Series 2014-C20, Class ASB, 3.638%, 5/15/2047 | | | 365,094 | |
| | | | | | | | |
| | | | | | | 13,455,779 | |
| | | | | | | | |
| | | | Pharmaceuticals — 0.7% | | | | |
| | 22,000 | | | Amgen, Inc., 2.200%, 5/22/2019 | | | 22,102 | |
| | 425,000 | | | Novartis Capital Corp. (The), 1.800%, 2/14/2020 | | | 425,142 | |
| | 775,000 | | | Shire Acquisitions Investments Ireland DAC, 1.900%, 9/23/2019 | | | 773,468 | |
| | | | | | | | |
| | | | | | | 1,220,712 | |
| | | | | | | | |
| | | | Property & Casualty Insurance — 0.3% | | | | |
| | 310,000 | | | Kemper Corp., 4.350%, 2/15/2025 | | | 314,256 | |
| | 235,000 | | | RenaissanceRe Finance, Inc., 3.450%, 7/01/2027 | | | 231,612 | |
| | | | | | | | |
| | | | | | | 545,868 | |
| | | | | | | | |
| | | | Railroads — 0.3% | | | | |
| | 206,000 | | | CSX Corp., 3.700%, 10/30/2020 | | | 214,619 | |
| | 27,000 | | | CSX Corp., 6.150%, 5/01/2037 | | | 34,557 | |
| | 215,000 | | | Union Pacific Corp., 3.646%, 2/15/2024 | | | 226,830 | |
| | | | | | | | |
| | | | | | | 476,006 | |
| | | | | | | | |
| | | | REITs – Health Care — 0.4% | | | | |
| | 31,000 | | | Healthcare Realty Trust, Inc., 3.750%, 4/15/2023 | | | 31,522 | |
| | 290,000 | | | MPT Operating Partnership LP/MPT Finance Corp., 5.000%, 10/15/2027 | | | 297,250 | |
| | 465,000 | | | Omega Healthcare Investors, Inc., 4.750%, 1/15/2028 | | | 466,849 | |
| | | | | | | | |
| | | | | | | 795,621 | |
| | | | | | | | |
See accompanying notes to financial statements.
49 |
Portfolio of Investments – as of September 30, 2017
Loomis Sayles Intermediate Duration Bond Fund – (continued)
| | | | | | | | |
Principal
Amount | | | Description | | Value (†) | |
| | | | REITs – Shopping Centers — 0.5% | | | | |
| $ | 480,000 | | | Brixmor Operating Partnership LP, 3.650%, 6/15/2024 | | $ | 477,616 | |
| | 435,000 | | | Kimco Realty Corp., 3.800%, 4/01/2027 | | | 439,339 | |
| | | | | | | | |
| | | | | | | 916,955 | |
| | | | | | | | |
| | | | REITs – Single Tenant — 0.2% | | | | |
| | 315,000 | | | Select Income REIT, 4.250%, 5/15/2024 | | | 315,984 | |
| | | | | | | | |
| | | | Restaurants — 0.6% | | | | |
| | 1,030,000 | | | McDonald’s Corp., MTN, 2.625%, 1/15/2022 | | | 1,037,415 | |
| | | | | | | | |
| | | | Retailers — 0.6% | | | | |
| | 1,080,000 | | | Costco Wholesale Corp., 2.750%, 5/18/2024 | | | 1,082,462 | |
| | | | | | | | |
| | | | Sovereigns — 0.6% | | | | |
| | 680,000 | | | Kingdom of Saudi Arabia, 3.625%, 3/04/2028, 144A | | | 678,273 | |
| | 465,000 | | | Republic of South Africa, 4.850%, 9/27/2027 | | | 460,196 | |
| | | | | | | | |
| | | | | | | 1,138,469 | |
| | | | | | | | |
| | | | Technology — 3.4% | | | | |
| | 45,000 | | | Apple, Inc., 2.250%, 2/23/2021 | | | 45,362 | |
| | 380,000 | | | Apple, Inc., 3.000%, 2/09/2024 | | | 389,405 | |
| | 455,000 | | | Arrow Electronics, Inc., 3.250%, 9/08/2024 | | | 449,882 | |
| | 450,000 | | | Genpact Luxembourg S.a.r.l., 3.700%, 4/01/2022, 144A | | | 455,201 | |
| | 610,000 | | | Hewlett Packard Enterprise Co., 2.100%, 10/04/2019, 144A | | | 610,207 | |
| | 120,000 | | | Hewlett Packard Enterprise Co., 4.900%, 10/15/2025 | | | 126,944 | |
| | 246,000 | | | HP, Inc., 4.300%, 6/01/2021 | | | 260,659 | |
| | 665,000 | | | IBM Credit LLC, 2.200%, 9/08/2022 | | | 659,516 | |
| | 89,000 | | | Jabil, Inc., 5.625%, 12/15/2020 | | | 96,405 | |
| | 22,000 | | | Jabil, Inc., 8.250%, 3/15/2018 | | | 22,538 | |
| | 885,000 | | | NetApp, Inc., 2.000%, 9/27/2019 | | | 884,723 | |
| | 385,000 | | | Pitney Bowes, Inc., 3.875%, 5/15/2022 | | | 378,804 | |
| | 425,000 | | | Pitney Bowes, Inc., 4.700%, 4/01/2023 | | | 417,896 | |
| | 655,000 | | | Seagate HDD Cayman, 4.875%, 3/01/2024, 144A | | | 645,544 | |
| | 725,000 | | | Xerox Corp., 3.625%, 3/15/2023 | | | 718,930 | |
| | | | | | | | |
| | | | | | | 6,162,016 | |
| | | | | | | | |
| | | | Tobacco — 0.0% | | | | |
| | 5,000 | | | Philip Morris International, Inc., 5.650%, 5/16/2018 | | | 5,127 | |
| | | | | | | | |
| | | | Transportation Services — 0.2% | | | | |
| | 430,000 | | | TTX Co., 2.600%, 6/15/2020, 144A | | | 431,900 | |
| | | | | | | | |
| | | | Treasuries — 15.0% | | | | |
| | 7,200,000 | | | U.S. Treasury Bond, 2.250%, 8/15/2027 | | | 7,151,063 | |
| | 13,435,000 | | | U.S. Treasury Note, 1.625%, 8/31/2022 | | | 13,250,269 | |
| | 3,585,000 | | | U.S. Treasury Note, 1.875%, 8/31/2022 | | | 3,575,757 | |
| | 2,990,000 | | | U.S. Treasury Note, 2.250%, 1/31/2024 | | | 3,016,279 | |
| | | | | | | | |
| | | | | | | 26,993,368 | |
| | | | | | | | |
| | | | Wirelines — 1.2% | | | | |
| | 400,000 | | | Deutsche Telekom International Finance BV, 1.500%, 9/19/2019, 144A | | | 395,944 | |
| | 790,000 | | | Orange S.A., 1.625%, 11/03/2019 | | | 784,597 | |
See accompanying notes to financial statements.
| 50
Portfolio of Investments – as of September 30, 2017
Loomis Sayles Intermediate Duration Bond Fund – (continued)
| | | | | | | | |
Principal
Amount | | | Description | | Value (†) | |
| | | | Wirelines — continued | | | | |
| $ | 870,000 | | | Verizon Communications, Inc., 4.125%, 3/16/2027 | | $ | 907,770 | |
| | | | | | | | |
| | | | | | | 2,088,311 | |
| | | | | | | | |
| | | | Total Bonds and Notes
(Identified Cost $178,001,785) | | | 177,917,265 | |
| | | | | | | | |
| | Short-Term Investments — 1.3% | | | | |
| | 2,392,787 | | | Tri-Party Repurchase Agreement with Fixed Income Clearing Corporation, dated 9/29/2017 at 0.340% to be repurchased at $2,392,855 on 10/02/2017 collateralized by $2,440,000 U.S. Treasury Note, 1.250% due 10/31/2019 valued at $2,442,108 including accrued interest (Note 2 of Notes to Financial Statements) (Identified Cost $2,392,787) | | | 2,392,787 | |
| | | | | | | | |
| | | | | | | | |
| | | | Total Investments — 100.3%
(Identified Cost $180,394,572) | | | 180,310,052 | |
| | | | Other assets less liabilities — (0.3)% | | | (589,785 | ) |
| | | | | | | | |
| | | | Net Assets — 100.0% | | $ | 179,720,267 | |
| | | | | | | | |
| | | | | | | | |
| | (†) | | | See Note 2 of Notes to Financial Statements. | | | | |
| | (a) | | | Variable rate security. Rate as of September 30, 2017 is disclosed. | | | | |
| | (b) | | | The Fund’s investment in mortgage related securities of Government National Mortgage Association are interests in separate pools of mortgages. All separate investments in securities of each issuer which have the same coupon rate have been aggregated for the purpose of presentation in the Portfolio of Investments. | |
| | (c) | | | Variable rate security. The interest rate adjusts periodically based on changes in current interest rates and prepayments on the underlying pool of assets. Rate as of September 30, 2017 is disclosed. | |
| | (d) | | | Security (or a portion thereof) has been designated to cover the Fund’s obligations under open derivative contracts. | |
| | | | | | | | |
| | 144A | | | All or a portion of these securities are exempt from registration under Rule 144A of the Securities Act of 1933. These securities may be resold in transactions exempt from registration, normally to qualified institutional buyers. At September 30, 2017, the value of Rule 144A holdings amounted to $50,025,767 or 27.8% of net assets. | |
| | ABS | | | Asset-Backed Securities | | | | |
| | ARMs | | | Adjustable Rate Mortgages | | | | |
| | CMT | | | Constant Maturity Treasury | | | | |
| | FHLMC | | | Federal Home Loan Mortgage Corp. | | | | |
| | FNMA | | | Federal National Mortgage Association | | | | |
| | GMTN | | | Global Medium Term Note | | | | |
| | GNMA | | | Government National Mortgage Association | | | | |
| | LIBOR | | | London Interbank Offered Rate | | | | |
| | MTN | | | Medium Term Note | | | | |
| | REITs | | | Real Estate Investment Trusts | | | | |
See accompanying notes to financial statements.
51 |
Portfolio of Investments – as of September 30, 2017
Loomis Sayles Intermediate Duration Bond Fund – (continued)
At September 30, 2017, open long futures contracts were as follows:
| | | | | | | | | | | | | | | | | | | | |
| Financial Futures | | Expiration
Date | | | Contracts | | | Notional
Amount | | | Value | | | Unrealized
Appreciation
(Depreciation) | |
5 Year U.S. Treasury Note | | | 12/29/2017 | | | | 80 | | | $ | 9,503,275 | | | $ | 9,400,000 | | | $ | (103,275 | ) |
| | | | | | | | | | | | | | | | | | | | |
Industry Summary at September 30, 2017
| | | | |
Banking | | | 17.9 | % |
Treasuries | | | 15.0 | |
ABS Car Loan | | | 11.6 | |
Non-Agency Commercial Mortgage-Backed Securities | | | 7.5 | |
Mortgage Related | | | 4.4 | |
Automotive | | | 3.9 | |
Technology | | | 3.4 | |
ABS Credit Card | | | 3.3 | |
Electric | | | 2.5 | |
Agency Commercial Mortgage-Backed Securities | | | 2.1 | |
ABS Other | | | 2.0 | |
Other Investments, less than 2% each | | | 25.4 | |
Short-Term Investments | | | 1.3 | |
| | | | |
Total Investments | | | 100.3 | |
Other assets less liabilities (including futures contracts) | | | (0.3 | ) |
| | | | |
Net Assets | | | 100.0 | % |
| | | | |
See accompanying notes to financial statements.
| 52
Portfolio of Investments – as of September 30, 2017
Loomis Sayles Limited Term Government and Agency Fund
| | | | | | | | |
Principal
Amount | | | Description | | Value (†) | |
| | Bonds and Notes — 92.5% of Net Assets | |
| | | | ABS Car Loan — 2.0% | | | | |
| $ | 1,550,000 | | | Avis Budget Rental Car Funding AESOP LLC, Series 2016-1A, Class A, 2.990%, 6/20/2022, 144A | | $ | 1,563,739 | |
| | 317,749 | | | CPS Auto Receivables Trust, Series 2015-C, Class A, 1.770%, 6/17/2019, 144A | | | 317,809 | |
| | 1,825,000 | | | Credit Acceptance Auto Loan Trust, Series 2016-2A, Class A, 2.420%, 11/15/2023, 144A | | | 1,833,698 | |
| | 2,875,000 | | | Credit Acceptance Auto Loan Trust, Series 2016-3A, Class A, 2.150%, 4/15/2024, 144A | | | 2,867,847 | |
| | 2,310,000 | | | Flagship Credit Auto Trust, Series 2016-4, Class A2, 1.960%, 2/16/2021, 144A | | | 2,311,430 | |
| | 3,500,000 | | | NextGear Floorplan Master Owner Trust, Series 2014-1A, Class A, 1.920%, 10/15/2019, 144A | | | 3,500,447 | |
| | 725,000 | | | NextGear Floorplan Master Owner Trust, Series 2016-1A, Class A2, 2.740%, 4/15/2021, 144A | | | 731,080 | |
| | 1,495,000 | | | NextGear Floorplan Master Owner Trust, Series 2017-1A, Class A2, 2.540%, 4/18/2022, 144A | | | 1,496,696 | |
| | | | | | | | |
| | | | | | | 14,622,746 | |
| | | | | | | | |
| | | | ABS Home Equity — 0.5% | | | | |
| | 2,186,080 | | | Home Partners of America Trust, Series 2016-1, Class A, 1-month LIBOR + 1.650%, 2.884%, 3/17/2033, 144A(a) | | | 2,209,319 | |
| | 1,427,835 | | | Towd Point Mortgage Trust, Series 2015-2, Class 1AE2, 2.750%, 11/25/2060, 144A(g) | | | 1,434,114 | |
| | | | | | | | |
| | | | | | | 3,643,433 | |
| | | | | | | | |
| | | | ABS Student Loan — 0.0% | | | | |
| | 275,594 | | | SoFi Professional Loan Program LLC, Series 2016-D, Class A1, 1-month LIBOR + 0.950%, 2.187%, 1/25/2039, 144A(a) | | | 278,313 | |
| | | | | | | | |
| | | | Agency Commercial Mortgage-Backed Securities — 16.9% | | | | |
| | 4,214,203 | | | Federal National Mortgage Association, Series 2015-M17, Class FA, 1-month LIBOR + 0.930%, 2.162%, 11/25/2022(a) | | | 4,216,131 | |
| | 1,000,000 | | | Federal National Mortgage Association, Series 2016-M3, Class ASQ2, 2.263%, 2/25/2023 | | | 997,294 | |
| | 6,000,000 | | | FHLMC Multifamily Structured Pass Through Certificates, Series K006, Class A2, 4.251%, 1/25/2020 | | | 6,277,790 | |
| | 4,305,000 | | | FHLMC Multifamily Structured Pass Through Certificates, Series K014, Class A2, 3.871%, 4/25/2021 | | | 4,548,375 | |
| | 4,000,000 | | | FHLMC Multifamily Structured Pass Through Certificates, Series K015, Class A2, 3.230%, 7/25/2021 | | | 4,148,592 | |
| | 6,625,000 | | | FHLMC Multifamily Structured Pass Through Certificates, Series K017, Class A2, 2.873%, 12/25/2021 | | | 6,797,383 | |
| | 2,580,000 | | | FHLMC Multifamily Structured Pass Through Certificates, Series K064, Class A2, 3.224%, 3/25/2027(g) | | | 2,660,113 | |
| | 3,441,337 | | | FHLMC Multifamily Structured Pass Through Certificates, Series K703, Class A2, 2.699%, 5/25/2018 | | | 3,449,820 | |
| | 679,226 | | | FHLMC Multifamily Structured Pass Through Certificates, Series K704, Class A2, 2.412%, 8/25/2018 | | | 681,419 | |
| | 2,541,425 | | | FHLMC Multifamily Structured Pass Through Certificates, Series K706, Class A2, 2.323%, 10/25/2018 | | | 2,553,057 | |
See accompanying notes to financial statements.
53 |
Portfolio of Investments – as of September 30, 2017
Loomis Sayles Limited Term Government and Agency Fund – (continued)
| | | | | | | | |
Principal
Amount | | | Description | | Value (†) | |
| | | | Agency Commercial Mortgage-Backed Securities — continued | | | | |
| $ | 7,727,120 | | | FHLMC Multifamily Structured Pass Through Certificates, Series K708, Class A2, 2.130%, 1/25/2019 | | $ | 7,759,202 | |
| | 34,370,000 | | | FHLMC Multifamily Structured Pass Through Certificates, Series K711, Class A2, 1.730%, 7/25/2019 | | | 34,314,705 | |
| | 2,689,397 | | | FHLMC Multifamily Structured Pass Through Certificates, Series K725, Class A1, 2.666%, 5/25/2023 | | | 2,734,974 | |
| | 4,100,025 | | | FHLMC Multifamily Structured Pass Through Certificates, Series KABM, Class A, 1-month LIBOR + 0.700%, 1.932%, 9/25/2022(a) | | | 4,107,441 | |
| | 1,064,430 | | | FHLMC Multifamily Structured Pass Through Certificates, Series KF06, Class A, 1-month LIBOR + 0.330%, 1.562%, 11/25/2021(a) | | | 1,063,593 | |
| | 8,700,404 | | | FHLMC Multifamily Structured Pass Through Certificates, Series KF14, Class A, 1-month LIBOR + 0.650%, 1.882%, 1/25/2023(a) | | | 8,719,476 | |
| | 4,027,154 | | | FHLMC Multifamily Structured Pass Through Certificates, Series KJ04, Class A1, 1.376%, 10/25/2020 | | | 4,005,377 | |
| | 19,300,000 | | | FHLMC Multifamily Structured Pass Through Certificates, Series KLH2, Class A, 1-month LIBOR + 0.700%, 1.932%, 11/25/2022(a) | | | 19,378,640 | |
| | 6,975,663 | | | FHLMC Multifamily Structured Pass Through Certificates, Series KP03, Class A2, 1.780%, 7/25/2019 | | | 6,972,689 | |
| | 182,926 | | | Government National Mortgage Association, Series 2003-72, Class Z, 5.265%, 11/16/2045(g) | | | 194,044 | |
| | 159,379 | | | Government National Mortgage Association, Series 2003-88, Class Z, 4.771%, 3/16/2046(g) | | | 167,064 | |
| | | | | | | | |
| | | | | | | 125,747,179 | |
| | | | | | | | |
| | | | Collateralized Mortgage Obligations — 16.1% | | | | |
| | 76,091 | | | Federal Home Loan Mortgage Corp., REMIC, Series 1500, Class FD, 7-year Treasury - 0.200%, 1.810%,
5/15/2023(a)(b)(c) | | | 73,634 | |
| | 50,312 | | | Federal Home Loan Mortgage Corp., REMIC, Series 1552, Class I, 10-year Treasury - 0.650%, 1.540%,
8/15/2023(a)(b)(c) | | | 49,678 | |
| | 193,448 | | | Federal Home Loan Mortgage Corp., REMIC, Series 2131, Class ZB, 6.000%, 3/15/2029 | | | 208,308 | |
| | 467,004 | | | Federal Home Loan Mortgage Corp., REMIC, Series 2874, Class BC, 5.000%, 10/15/2019 | | | 475,669 | |
| | 864,326 | | | Federal Home Loan Mortgage Corp., REMIC, Series 2931, Class DE, 4.000%, 2/15/2020 | | | 876,418 | |
| | 1,507,662 | | | Federal Home Loan Mortgage Corp., REMIC, Series 2978, Class JG, 5.500%, 5/15/2035 | | | 1,678,855 | |
| | 2,245,294 | | | Federal Home Loan Mortgage Corp., REMIC, Series 3036, Class NE, 5.000%, 9/15/2035 | | | 2,448,581 | |
| | 1,824,700 | | | Federal Home Loan Mortgage Corp., REMIC, Series 3412, Class AY, 5.500%, 2/15/2038 | | | 1,954,298 | |
| | 1,667,766 | | | Federal Home Loan Mortgage Corp., REMIC, Series 3561, Class W, 3.024%, 6/15/2048(d)(g) | | | 1,590,875 | |
| | 1,887,475 | | | Federal Home Loan Mortgage Corp., REMIC, Series 3620, Class AT, 4.217%, 12/15/2036(d)(g) | | | 1,988,184 | |
| | 775,121 | | | Federal Home Loan Mortgage Corp., REMIC, Series 4212, Class FW, 1-month LIBOR + 2.100%, 3.334%, 6/15/2043(a) | | | 756,323 | |
See accompanying notes to financial statements.
| 54
Portfolio of Investments – as of September 30, 2017
Loomis Sayles Limited Term Government and Agency Fund – (continued)
| | | | | | | | |
Principal
Amount | | | Description | | Value (†) | |
| | | | Collateralized Mortgage Obligations — continued | | | | |
| $ | 1,551,718 | | | Federal National Mortgage Association, REMIC, Series 2003-48, Class GH, 5.500%, 6/25/2033 | | $ | 1,732,413 | |
| | 48,263 | | | Federal National Mortgage Association, REMIC, Series 1992-162, Class FB, 7-year Treasury - 0.050%, 1.950%, 9/25/2022(a)(b)(c) | | | 47,752 | |
| | 49,419 | | | Federal National Mortgage Association, REMIC, Series 1994-42, Class FD, 10-year Treasury - 0.500%, 1.690%, 4/25/2024(a)(b)(c) | | | 48,913 | |
| | 10,928 | | | Federal National Mortgage Association, REMIC, Series 2002-W10, Class A7, 3.857%, 8/25/2042(b)(c)(g) | | | 11,666 | |
| | 802,598 | | | Federal National Mortgage Association, REMIC, Series 2005-100, Class BQ, 5.500%, 11/25/2025 | | | 852,699 | |
| | 808,709 | | | Federal National Mortgage Association, REMIC, Series 2007-73, Class A1, 1-month LIBOR + 0.060%, 1.297%, 7/25/2037(a) | | | 793,656 | |
| | 1,764,772 | | | Federal National Mortgage Association, REMIC, Series 2008-86, Class LA, 3.441%, 8/25/2038(g) | | | 1,841,005 | |
| | 5,412,360 | | | Federal National Mortgage Association, REMIC, Series 2013-67, Class NF, 1-month LIBOR + 1.000%, 2.237%, 7/25/2043(a) | | | 5,262,798 | |
| | 32,780 | | | Federal National Mortgage Association, REMIC, Series G93-19, Class FD, 10-year Treasury - 0.650%, 1.530%, 4/25/2023(a)(b)(c) | | | 32,443 | |
| | 10,094 | | | FHLMC Structured Pass Through Securities, Series T-60, Class 2A1, 3.626%, 3/25/2044(b)(c)(g) | | | 10,468 | |
| | 743,809 | | | FHLMC Structured Pass Through Securities, Series T-62, Class 1A1, 12-month MTA + 1.200%, 2.030%, 10/25/2044(a) | | | 755,873 | |
| | 1,267,347 | | | Government National Mortgage Association, Series 2010-H20, Class AF, 1-month LIBOR + 0.330%, 1.561%, 10/20/2060(a) | | | 1,258,815 | |
| | 1,149,273 | | | Government National Mortgage Association, Series 2010-H24, Class FA, 1-month LIBOR + 0.350%, 1.581%, 10/20/2060(a) | | | 1,141,817 | |
| | 986,041 | | | Government National Mortgage Association, Series 2011-H06, Class FA, 1-month LIBOR + 0.450%, 1.681%,
2/20/2061(a) | | | 984,747 | |
| | 1,614,628 | | | Government National Mortgage Association, Series 2012-124, Class HT, 7.269%,
7/20/2032(g) | | | 1,809,322 | |
| | 1,215,475 | | | Government National Mortgage Association, Series 2012-H15, Class FA, 1-month LIBOR + 0.450%, 1.681%,
5/20/2062(a) | | | 1,216,766 | |
| | 1,139,014 | | | Government National Mortgage Association, Series 2012-H18, Class NA, 1-month LIBOR + 0.520%, 1.751%,
8/20/2062(a) | | | 1,138,620 | |
| | 4,380,387 | | | Government National Mortgage Association, Series 2012-H29, Class HF, 1-month LIBOR + 0.500%, 1.731%,
10/20/2062(a) | | | 4,385,288 | |
| | 3,673,455 | | | Government National Mortgage Association, Series 2013-H02, Class GF, 1-month LIBOR + 0.500%, 1.731%,
12/20/2062(a) | | | 3,678,932 | |
| | 4,423,893 | | | Government National Mortgage Association, Series 2013-H08, Class FA, 1-month LIBOR + 0.350%, 1.581%,
3/20/2063(a) | | | 4,404,586 | |
| | 3,207,897 | | | Government National Mortgage Association, Series 2013-H10, Class FA, 1-month LIBOR + 0.400%, 1.631%,
3/20/2063(a) | | | 3,199,522 | |
| | 10,999,057 | | | Government National Mortgage Association, Series 2013-H22, Class FT, 1-year CMT + 0.650%, 1.880%,
4/20/2063(a) | | | 11,087,838 | |
| | 6,376,841 | | | Government National Mortgage Association, Series 2014-H14, Class FA, 1-month LIBOR + 0.500%, 1.731%,
7/20/2064(a) | | | 6,366,694 | |
| | 4,273,066 | | | Government National Mortgage Association, Series 2014-H15, Class FA, 1-month LIBOR + 0.500%, 1.731%,
7/20/2064(a) | | | 4,265,601 | |
See accompanying notes to financial statements.
55 |
Portfolio of Investments – as of September 30, 2017
Loomis Sayles Limited Term Government and Agency Fund – (continued)
| | | | | | | | |
Principal
Amount | | | Description | | Value (†) | |
| | | | Collateralized Mortgage Obligations — continued | | | | |
| $ | 3,165,989 | | | Government National Mortgage Association, Series 2015-H05, Class FA, 1-month LIBOR + 0.300%, 1.531%,
4/20/2061(a) | | $ | 3,165,654 | |
| | 9,219,131 | | | Government National Mortgage Association, Series 2015-H09, Class HA, 1.750%, 3/20/2065 | | | 9,199,138 | |
| | 9,394,734 | | | Government National Mortgage Association, Series 2015-H10, Class JA, 2.250%, 4/20/2065 | | | 9,203,736 | |
| | 1,721,337 | | | Government National Mortgage Association, Series 2015-H11, Class FA, 1-month LIBOR + 0.250%, 1.481%,
4/20/2065(a) | | | 1,720,462 | |
| | 4,902,224 | | | Government National Mortgage Association, Series 2015-H19, Class FH, 1-month LIBOR + 0.300%, 1.531%,
7/20/2065(a) | | | 4,901,412 | |
| | 1,493,377 | | | Government National Mortgage Association, Series 2015-H29, Class FA, 1-month LIBOR + 0.700%, 1.931%,
10/20/2065(a) | | | 1,498,095 | |
| | 888,741 | | | Government National Mortgage Association, Series 2015-H30, Class FA, 1-month LIBOR + 0.680%, 1.911%,
8/20/2061(a) | | | 891,473 | |
| | 6,326,714 | | | Government National Mortgage Association, Series 2016-H06, Class FC, 1-month LIBOR + 0.920%, 2.151%,
2/20/2066(a) | | | 6,403,502 | |
| | 4,551,299 | | | Government National Mortgage Association, Series 2016-H10, Class FJ, 1-month LIBOR + 0.600%, 1.831%,
4/20/2066(a) | | | 4,561,398 | |
| | 7,676,104 | | | Government National Mortgage Association, Series 2016-H19, Class FJ, 1-month LIBOR + 0.400%, 1.631%,
9/20/2063(a) | | | 7,685,834 | |
| | 263,799 | | | NCUA Guaranteed Notes, Series 2010-A1, Class A, 1-month LIBOR + 0.350%, 1.582%, 12/07/2020(a) | | | 263,956 | |
| | 637,567 | | | NCUA Guaranteed Notes, Series 2010-R1, Class 1A, 1-month LIBOR + 0.450%, 1.681%, 10/07/2020(a) | | | 639,459 | |
| | 1,149,046 | | | NCUA Guaranteed Notes, Series 2010-R3, Class 1A, 1-month LIBOR + 0.560%, 1.791%, 12/08/2020(a) | | | 1,151,403 | |
| | 77,655 | | | NCUA Guaranteed Notes, Series 2010-R3, Class 2A, 1-month LIBOR + 0.560%, 1.791%, 12/08/2020(a) | | | 78,128 | |
| | | | | | | | |
| | | | | | | 119,792,707 | |
| | | | | | | | |
| | | | Hybrid ARMs — 12.4% | | | | |
| | 1,371,695 | | | FHLMC, 1-year CMT + 2.285%, 2.881%, 2/01/2036(a) | | | 1,451,190 | |
| | 698,129 | | | FHLMC, 1-year CMT + 2.165%, 2.924%, 4/01/2036(a) | | | 721,875 | |
| | 257,529 | | | FHLMC, 1-year CMT + 2.221%, 2.955%, 9/01/2038(a) | | | 270,984 | |
| | 2,705,529 | | | FHLMC, 1-year CMT + 2.264%, 2.983%, 2/01/2036(a) | | | 2,854,575 | |
| | 4,384,778 | | | FHLMC, 1-year CMT + 2.252%, 3.054%, 3/01/2037(a) | | | 4,621,115 | |
| | 878,901 | | | FHLMC, 1-year CMT + 2.196%, 3.056%, 9/01/2038(a) | | | 927,154 | |
| | 1,079,995 | | | FHLMC, 1-year CMT + 2.245%, 3.089%, 3/01/2036(a) | | | 1,140,599 | |
| | 432,881 | | | FHLMC, 1-year CMT + 2.250%, 3.105%, 2/01/2035(a) | | | 456,435 | |
| | 649,203 | | | FHLMC, 6-month LIBOR + 1.731%, 3.106%, 6/01/2037(a) | | | 668,829 | |
| | 101,963 | | | FHLMC, 12-month LIBOR + 1.724%, 3.158%, 12/01/2037(a) | | | 105,720 | |
| | 1,064,973 | | | FHLMC, 1-year CMT + 2.249%, 3.218%, 9/01/2038(a) | | | 1,122,313 | |
| | 1,801,538 | | | FHLMC, 1-year CMT + 2.220%, 3.319%, 7/01/2033(a) | | | 1,899,821 | |
| | 501,257 | | | FHLMC, 12-month LIBOR + 1.640%, 3.386%, 11/01/2038(a) | | | 523,048 | |
| | 1,843,306 | | | FHLMC, 12-month LIBOR + 1.766%, 3.448%, 9/01/2035(a) | | | 1,942,271 | |
| | 467,091 | | | FHLMC, 12-month LIBOR + 1.900%, 3.534%, 12/01/2034(a) | | | 493,883 | |
| | 518,531 | | | FHLMC, 12-month LIBOR + 1.909%, 3.543%, 4/01/2037(a) | | | 548,077 | |
| | 653,723 | | | FHLMC, 12-month LIBOR + 1.856%, 3.564%, 11/01/2038(a) | | | 690,175 | |
See accompanying notes to financial statements.
| 56
Portfolio of Investments – as of September 30, 2017
Loomis Sayles Limited Term Government and Agency Fund – (continued)
| | | | | | | | |
Principal
Amount | | | Description | | Value (†) | |
| | | | Hybrid ARMs — continued | | | | |
| $ | 1,672,402 | | | FHLMC, 12-month LIBOR + 1.821%, 3.570%, 4/01/2037(a) | | $ | 1,753,922 | |
| | 801,117 | | | FHLMC, 12-month LIBOR + 1.879%, 3.628%, 3/01/2038(a) | | | 841,146 | |
| | 2,999,451 | | | FHLMC, 12-month LIBOR + 1.897%, 3.646%, 9/01/2041(a) | | | 3,138,918 | |
| | 521,266 | | | FHLMC, 12-month LIBOR + 2.180%, 3.888%, 3/01/2037(a) | | | 556,261 | |
| | 1,060,986 | | | FNMA, 1-year CMT + 2.185%, 2.853%, 1/01/2036(a) | | | 1,117,656 | |
| | 1,373,622 | | | FNMA, 6-month LIBOR + 1.543%, 2.933%, 7/01/2035(a) | | | 1,420,088 | |
| | 3,688,861 | | | FNMA, 1-year CMT + 2.220%, 2.950%, 4/01/2034(a) | | | 3,891,983 | |
| | 153,569 | | | FNMA, 6-month LIBOR + 1.504%, 2.952%, 2/01/2037(a) | | | 158,478 | |
| | 474,986 | | | FNMA, 1-year CMT + 2.185%, 2.972%, 12/01/2034(a) | | | 496,089 | |
| | 323,845 | | | FNMA, 1-year CMT + 2.214%, 3.011%, 4/01/2033(a) | | | 339,498 | |
| | 583,879 | | | FNMA, 1-year CMT + 2.127%, 3.012%, 9/01/2034(a) | | | 614,650 | |
| | 1,154,507 | | | FNMA, 1-year CMT + 2.287%, 3.039%, 10/01/2033(a) | | | 1,212,250 | |
| | 1,167,318 | | | FNMA, 1-year CMT + 2.231%, 3.090%, 4/01/2034(a) | | | 1,232,353 | |
| | 2,237,520 | | | FNMA, 1-year CMT + 2.174%, 3.114%, 11/01/2033(a) | | | 2,358,642 | |
| | 808,831 | | | FNMA, 1-year CMT + 2.509%, 3.114%, 5/01/2035(a) | | | 861,879 | |
| | 5,037,535 | | | FNMA, 1-year CMT + 2.194%, 3.125%, 10/01/2034(a) | | | 5,310,260 | |
| | 3,458,665 | | | FNMA, 1-year CMT + 2.180%, 3.128%, 12/01/2040(a) | | | 3,642,517 | |
| | 524,494 | | | FNMA, 12-month LIBOR + 1.660%, 3.154%, 10/01/2033(a) | | | 551,966 | |
| | 410,248 | | | FNMA, 12-month LIBOR + 1.746%, 3.178%, 11/01/2035(a) | | | 432,090 | |
| | 1,236,991 | | | FNMA, 1-year CMT + 2.200%, 3.191%, 6/01/2036(a) | | | 1,304,694 | |
| | 640,385 | | | FNMA, 1-year CMT + 2.145%, 3.246%, 9/01/2036(a) | | | 673,747 | |
| | 2,641,620 | | | FNMA, 12-month LIBOR + 1.585%, 3.258%, 7/01/2035(a) | | | 2,773,171 | |
| | 2,710,311 | | | FNMA, 12-month LIBOR + 1.560%, 3.259%, 4/01/2037(a) | | | 2,840,146 | |
| | 421,196 | | | FNMA, 1-year CMT + 2.500%, 3.265%, 8/01/2036(a) | | | 449,620 | |
| | 2,901,635 | | | FNMA, 1-year CMT + 2.274%, 3.273%, 6/01/2037(a) | | | 3,063,547 | |
| | 3,629,971 | | | FNMA, 12-month LIBOR + 1.800%, 3.286%, 10/01/2041(a) | | | 3,789,010 | |
| | 1,147,199 | | | FNMA, 1-year CMT + 2.287%, 3.287%, 6/01/2033(a) | | | 1,213,942 | |
| | 3,909,514 | | | FNMA, 12-month LIBOR + 1.540%, 3.298%, 9/01/2037(a) | | | 4,079,460 | |
| | 1,334,537 | | | FNMA, 1-year CMT + 2.223%, 3.348%, 8/01/2035(a) | | | 1,405,656 | |
| | 2,980,055 | | | FNMA, 12-month LIBOR + 1.614%, 3.364%, 7/01/2038(a) | | | 3,108,431 | |
| | 295,088 | | | FNMA, 12-month LIBOR + 1.620%, 3.371%, 8/01/2035(a) | | | 308,741 | |
| | 580,466 | | | FNMA, 12-month LIBOR + 1.677%, 3.373%, 11/01/2036(a) | | | 610,703 | |
| | 1,172,986 | | | FNMA, 12-month LIBOR + 1.659%, 3.374%, 4/01/2037(a) | | | 1,224,749 | |
| | 792,524 | | | FNMA, 12-month LIBOR + 1.632%, 3.405%, 8/01/2034(a) | | | 832,995 | |
| | 391,807 | | | FNMA, 12-month LIBOR + 1.657%, 3.407%, 8/01/2038(a) | | | 407,641 | |
| | 1,315,017 | | | FNMA, 12-month LIBOR + 1.800%, 3.425%, 12/01/2041(a) | | | 1,377,659 | |
| | 146,722 | | | FNMA, 12-month LIBOR + 1.841%, 3.432%, 1/01/2037(a) | | | 154,641 | |
| | 2,644,711 | | | FNMA, 6-month LIBOR + 2.092%, 3.461%, 7/01/2037(a) | | | 2,794,530 | |
| | 2,059,762 | | | FNMA, 12-month LIBOR + 1.736%, 3.484%, 9/01/2037(a) | | | 2,162,083 | |
| | 849,578 | | | FNMA, 12-month LIBOR + 1.829%, 3.505%, 2/01/2037(a) | | | 900,809 | |
| | 213,937 | | | FNMA, 1-year CMT + 2.439%, 3.536%, 8/01/2033(a) | | | 225,317 | |
| | 2,306,458 | | | FNMA, 12-month LIBOR + 1.784%, 3.546%, 3/01/2037(a) | | | 2,418,022 | |
| | 1,359,840 | | | FNMA, 12-month LIBOR + 1.820%, 3.546%, 2/01/2047(a) | | | 1,446,158 | |
| | 282,832 | | | FNMA, 12-month LIBOR + 1.800%, 3.550%, 3/01/2034(a) | | | 298,824 | |
| | 515,799 | | | FNMA, 12-month LIBOR + 1.802%, 3.552%, 7/01/2041(a) | | | 540,520 | |
| | 911,513 | | | FNMA, 12-month LIBOR + 2.473%, 4.338%, 6/01/2035(a) | | | 979,515 | |
| | | | | | | | |
| | | | | | | 91,753,041 | |
| | | | | | | | |
See accompanying notes to financial statements.
57 |
Portfolio of Investments – as of September 30, 2017
Loomis Sayles Limited Term Government and Agency Fund – (continued)
| | | | | | | | |
Principal
Amount | | | Description | | Value (†) | |
| | | | Mortgage Related — 16.7% | | | | |
| $ | 90,430 | | | FHLMC, 3.000%, 10/01/2026 | | $ | 93,007 | |
| | 644,634 | | | FHLMC, 4.000%, with various maturities from 2024 to 2042(e) | | | 679,401 | |
| | 409,121 | | | FHLMC, 4.500%, with various maturities from 2025 to 2034(e) | | | 433,225 | |
| | 181,179 | | | FHLMC, 5.500%, 10/01/2023 | | | 191,935 | |
| | 195,218 | | | FHLMC, COFI + 1.250%, 5.769%, 6/01/2020(a) | | | 199,725 | |
| | 347,558 | | | FHLMC, COFI + 1.250%, 5.903%, 8/01/2020(a) | | | 357,874 | |
| | 147,642 | | | FHLMC, COFI + 1.250%, 5.923%, 10/01/2020(a) | | | 151,742 | |
| | 242,460 | | | FHLMC, COFI + 1.250%, 5.953%, 11/01/2020(a) | | | 250,171 | |
| | 11,663 | | | FHLMC, 6.000%, 11/01/2019 | | | 11,945 | |
| | 309,295 | | | FHLMC, 6.500%, 12/01/2034 | | | 348,965 | |
| | 356 | | | FHLMC, 7.500%, 6/01/2026 | | | 395 | |
| | 8,460 | | | FHLMC, 11.500%, 4/01/2020 | | | 8,565 | |
| | 168,888 | | | FNMA, 3.000%, 3/01/2042 | | | 170,306 | |
| | 1,802,271 | | | FNMA, 5.000%, with various maturities from 2037 to 2038(e) | | | 1,985,949 | |
| | 985,666 | | | FNMA, 5.500%, with various maturities from 2018 to 2033(e) | | | 1,076,744 | |
| | 1,166,532 | | | FNMA, 6.000%, with various maturities from 2017 to 2022(e) | | | 1,236,447 | |
| | 208,159 | | | FNMA, 6.500%, with various maturities from 2032 to 2037(e) | | | 231,430 | |
| | 7,056 | | | FNMA, 7.000%, 12/01/2022 | | | 7,068 | |
| | 78,597 | | | FNMA, 7.500%, with various maturities from 2030 to 2032(e) | | | 86,126 | |
| | 3,888,902 | | | GNMA, 1-month LIBOR + 1.719%, 2.965%, 2/20/2061(a) | | | 4,055,947 | |
| | 2,915,674 | | | GNMA, 1-month LIBOR + 1.890%, 3.122%, 2/20/2063(a) | | | 3,054,076 | |
| | 3,956,361 | | | GNMA, 1-month LIBOR + 2.165%, 3.385%, 3/20/2063(a) | | | 4,161,564 | |
| | 958,706 | | | GNMA, 1-month LIBOR + 2.269%, 3.486%, 5/20/2065(a) | | | 1,026,964 | |
| | 1,111,008 | | | GNMA, 1-month LIBOR + 2.274%, 3.489%, 6/20/2065(a) | | | 1,193,862 | |
| | 2,188,834 | | | GNMA, 1-month LIBOR + 2.364%, 3.597%, 2/20/2063(a) | | | 2,309,714 | |
| | 1,880,983 | | | GNMA, 4.430%, 3/20/2063(g) | | | 1,959,614 | |
| | 1,663,588 | | | GNMA, 4.441%, 2/20/2063(g) | | | 1,731,073 | |
| | 3,272,430 | | | GNMA, 4.445%, 6/20/2063(g) | | | 3,431,676 | |
| | 3,701,347 | | | GNMA, 4.477%, 2/20/2062(g) | | | 3,806,172 | |
| | 4,306,144 | | | GNMA, 4.492%, 10/20/2065(g) | | | 4,688,944 | |
| | 3,554,976 | | | GNMA, 4.519%, 12/20/2061(g) | | | 3,647,130 | |
| | 13,207,030 | | | GNMA, 4.520%, 12/20/2061(g) | | | 13,515,165 | |
| | 6,436,674 | | | GNMA, 4.540%, 12/20/2062(g) | | | 6,685,089 | |
| | 1,625,733 | | | GNMA, 4.559%, 3/20/2062(g) | | | 1,676,225 | |
| | 3,479,634 | | | GNMA, 4.580%, 6/20/2062(g) | | | 3,588,915 | |
| | 10,450,883 | | | GNMA, 4.585%, 11/20/2062(g) | | | 10,835,675 | |
| | 1,330,677 | | | GNMA, 4.586%, 4/20/2063(g) | | | 1,388,309 | |
| | 612,901 | | | GNMA, 4.588%, 7/20/2063(g) | | | 656,744 | |
| | 854,450 | | | GNMA, 4.592%, 8/20/2061(g) | | | 873,377 | |
| | 2,093,971 | | | GNMA, 4.604%, 2/20/2066(g) | | | 2,270,849 | |
| | 1,873,960 | | | GNMA, 4.632%, 3/20/2064(g) | | | 2,012,573 | |
| | 1,371,026 | | | GNMA, 4.635%, 3/20/2062(g) | | | 1,409,277 | |
| | 417,480 | | | GNMA, 4.654%, 1/20/2064(g) | | | 449,958 | |
| | 5,587,103 | | | GNMA, 4.671%, 2/20/2062(g) | | | 5,740,066 | |
| | 7,122,486 | | | GNMA, 4.683%, with various maturities from 2061 to 2063(e)(g) | | | 7,366,104 | |
| | 1,562,550 | | | GNMA, 4.684%, 5/20/2064(g) | | | 1,698,292 | |
| | 2,524,957 | | | GNMA, 4.685%, 2/20/2062(g) | | | 2,589,577 | |
See accompanying notes to financial statements.
| 58
Portfolio of Investments – as of September 30, 2017
Loomis Sayles Limited Term Government and Agency Fund – (continued)
| | | | | | | | |
Principal
Amount | | | Description | | Value (†) | |
| | | | Mortgage Related — continued | | | | |
| $ | 865,138 | | | GNMA, 4.699%, 6/20/2061(g) | | $ | 877,781 | |
| | 5,050,086 | | | GNMA, 4.700%, with various maturities in 2061(e)(g) | | | 5,138,809 | |
| | 957,647 | | | GNMA, 4.716%, 3/20/2061(g) | | | 971,494 | |
| | 973,625 | | | GNMA, 4.737%, 8/20/2062(g) | | | 1,001,375 | |
| | 375,511 | | | GNMA, 5.018%, 4/20/2061(g) | | | 388,552 | |
| | 16,783 | | | GNMA, 6.000%, 12/15/2031 | | | 19,247 | |
| | 65,764 | | | GNMA, 6.500%, 5/15/2031 | | | 75,355 | |
| | 68,685 | | | GNMA, 7.000%, 10/15/2028 | | | 76,080 | |
| | 3,872,523 | | | Government National Mortgage Association, Series 2015-H04, Class FL, 1-month LIBOR + 0.470%, 1.701%, 2/20/2065(a) | | | 3,861,734 | |
| | 5,895,032 | | | Government National Mortgage Association, Series 2015-H12, Class FL, 1-month LIBOR + 0.230%, 1.461%, 5/20/2065(a) | | | 5,844,949 | |
| | | | | | | | |
| | | | | | | 123,599,327 | |
| | | | | | | | |
| | | | Non-Agency Commercial Mortgage-Backed Securities — 4.5% | | | | |
| | 3,445,000 | | | Banc of America Merrill Lynch Commercial Mortgage, Inc., Series 2016-ASHF, Class A, 1-month LIBOR + 1.900%, 3.127%, 12/15/2033, 144A(a) | | | 3,463,120 | |
| | 478,172 | | | Barclays Commercial Mortgage Securities, Series 2015-RRI, Class A, 1-month LIBOR + 1.250%, 2.477%, 5/15/2032, 144A(a) | | | 478,473 | |
| | 1,310,000 | | | Commercial Mortgage Pass Through Certificates, Series 2012-LTRT, Class A2, 3.400%, 10/05/2030, 144A | | | 1,311,828 | |
| | 2,520,717 | | | Commercial Mortgage Pass Through Certificates, Series 2014-FL5, Class A, 1-month LIBOR + 1.370%, 2.604%, 10/15/2031, 144A(a) | | | 2,529,094 | |
| | 1,488,000 | | | Commercial Mortgage Pass Through Certificates, Series 2014-UBS2, Class A5, 3.961%, 3/10/2047 | | | 1,576,902 | |
| | 4,282,000 | | | Commercial Mortgage Pass Through Certificates, Series 2016-DC2, Class ASB, 3.550%, 2/10/2049 | | | 4,444,863 | |
| | 1,399,000 | | | DBUBS Mortgage Trust, Series 2011-LC2A, Class A4, 4.537%, 7/10/2044, 144A | | | 1,489,869 | |
| | 1,177,707 | | | GP Portfolio Trust, Series 2014-GPP, Class A, 1-month LIBOR + 1.200%, 2.427%, 2/15/2027, 144A(a) | | | 1,180,319 | |
| | 2,600,000 | | | Hudsons Bay Simon JV Trust, Series 2015-HB7, Class A7, 3.914%, 8/05/2034, 144A | | | 2,633,376 | |
| | 5,535,000 | | | JPMorgan Chase Commercial Mortgage Securities Corp., Series 2014-CBM, Class A, 1-month LIBOR + 0.900%, 2.134%, 10/15/2029, 144A(a) | | | 5,536,727 | |
| | 202,755 | | | JPMorgan Chase Commercial Mortgage Securities Trust, Series 2014-FL5, Class A, 1-month LIBOR + 0.980%, 2.207%, 7/15/2031, 144A(a) | | | 203,059 | |
| | 3,633,627 | | | JPMorgan Chase Commercial Mortgage Securities Trust, Series 2015-SGP, Class A, 1-month LIBOR + 1.700%, 2.927%, 7/15/2036, 144A(a) | | | 3,641,569 | |
| | 1,040,000 | | | Morgan Stanley Bank of America Merrill Lynch Trust, Series 2013-C8, Class A4, 3.134%, 12/15/2048 | | | 1,069,135 | |
| | 3,700,000 | | | Starwood Retail Property Trust, Inc., 1-month LIBOR + 1.220%, 2.454%, 11/15/2027, 144A(a) | | | 3,692,613 | |
| | | | | | | | |
| | | | | | | 33,250,947 | |
| | | | | | | | |
| | | | Sovereigns — 0.3% | | | | |
| | 1,955,000 | | | U.S. Department of Housing and Urban Development, Series 4, 1.880%, 8/01/2019 | | | 1,966,104 | |
| | | | | | | | |
See accompanying notes to financial statements.
59 |
Portfolio of Investments – as of September 30, 2017
Loomis Sayles Limited Term Government and Agency Fund – (continued)
| | | | | | | | |
Principal
Amount | | | Description | | Value (†) | |
| | | | Treasuries — 23.1% | | | | |
| $ | 7,100,000 | | | U.S. Treasury Note, 0.875%, 7/31/2019 | | $ | 7,025,949 | |
| | 20,395,000 | | | U.S. Treasury Note, 1.125%, 6/30/2021 | | | 19,923,366 | |
| | 25,890,000 | | | U.S. Treasury Note, 1.125%, 8/31/2021 | | | 25,234,659 | |
| | 4,145,000 | | | U.S. Treasury Note, 1.375%, 1/31/2021 | | | 4,101,121 | |
| | 8,460,000 | | | U.S. Treasury Note, 1.750%, 6/30/2022 | | | 8,398,202 | |
| | 9,730,000 | | | U.S. Treasury Note, 1.750%, 9/30/2022 | | | 9,640,302 | |
| | 7,895,000 | | | U.S. Treasury Note, 1.875%, 4/30/2022 | | | 7,887,907 | |
| | 1,395,000 | | | U.S. Treasury Note, 1.875%, 7/31/2022 | | | 1,391,949 | |
| | 17,015,000 | | | U.S. Treasury Note, 2.000%, 12/31/2021 | | | 17,120,679 | |
| | 16,230,000 | | | U.S. Treasury Note, 2.125%, 9/30/2024 | | | 16,186,889 | |
| | 14,520,000 | | | U.S. Treasury Note, 2.000%, 11/15/2026 | | | 14,149,627 | |
| | 13,945,000 | | | U.S. Treasury Note, 2.125%, 9/30/2021 | | | 14,113,865 | |
| | 26,120,000 | | | U.S. Treasury Note, 2.250%, 1/31/2024 | | | 26,349,570 | |
| | | | | | | | |
| | | | | | | 171,524,085 | |
| | | | | | | | |
| | | | Total Bonds and Notes
(Identified Cost $694,606,720) | | | 686,177,882 | |
| | | | | | | | |
| | Short-Term Investments — 13.0% | | | | |
| | 7,310,000 | | | Federal Home Loan Bank Discount Notes, 0.850%-0.990%, 10/02/2017(f) | | | 7,310,000 | |
| | 7,435,000 | | | Federal Home Loan Bank Discount Notes, 0.950%, 10/05/2017(f) | | | 7,434,383 | |
| | 6,755,000 | | | Federal Home Loan Bank Discount Notes, 0.950%, 10/06/2017(f) | | | 6,754,257 | |
| | 16,250,000 | | | Federal Home Loan Bank Discount Notes, 0.985%, 10/31/2017(f) | | | 16,237,032 | |
| | 9,805,000 | | | Federal Home Loan Bank Discount Notes, 1.070%, 11/02/2017(f) | | | 9,796,558 | |
| | 33,360,000 | | | Federal National Mortgage Association Discount Notes, 0.900%-0.950%, 10/02/2017(f) | | | 33,360,000 | |
| | 4,131,975 | | | Tri-Party Repurchase Agreement with Fixed Income Clearing Corporation, dated 9/29/2017 at 0.340% to be repurchased at $4,132,092 on 10/02/2017 collateralized by $4,005,000 U.S. Treasury Inflation Note, 0.125% due 4/15/2020 valued at $4,214,930 including accrued interest (Note 2 of Notes to Financial Statements) | | | 4,131,975 | |
| | 1,390,000 | | | U.S. Treasury Bills, 1.025%, 12/07/2017(f) | | | 1,387,490 | |
| | 9,795,000 | | | U.S. Treasury Bills, 1.036%, 02/01/2018(f) | | | 9,759,648 | |
| | | | | | | | |
| | | | Total Short-Term Investments
(Identified Cost $96,169,819) | | | 96,171,343 | |
| | | | | | | | |
| | | | | | | | |
| | | | Total Investments — 105.5%
(Identified Cost $790,776,539) | | | 782,349,225 | |
| | | | Other assets less liabilities — (5.5)% | | | (40,581,627 | ) |
| | | | | | | | |
| | | | Net Assets — 100.0% | | $ | 741,767,598 | |
| | | | | | | | |
| | | | | | | | |
| | (†) | | | See Note 2 of Notes to Financial Statements. | |
| | (a) | | | Variable rate security. Rate as of September 30, 2017 is disclosed. | | | | |
| | (b) | | | Level 3 security. Value has been determined using significant unobservable inputs. See Note 3 of Notes to Financial Statements. | |
| | (c) | | | Fair valued by the Fund’s adviser. At September 30, 2017, the value of these securities amounted to $274,554 or less than 0.1% of net assets. See Note 2 of Notes to Financial Statements. | |
See accompanying notes to financial statements.
| 60
Portfolio of Investments – as of September 30, 2017
Loomis Sayles Limited Term Government and Agency Fund – (continued)
| | | | | | | | |
| | | | | | | | |
| | (d) | | | Security represents right to receive monthly interest payments on an underlying pool of mortgages. Principal shown is the outstanding par amount of the pool held as of the end of the period. | |
| | (e) | | | The Fund’s investment in mortgage related securities of Federal Home Loan Mortgage Corporation, Federal National Mortgage Association and Government National Mortgage Association are interests in separate pools of mortgages. All separate investments in securities of each issuer which have the same coupon rate have been aggregated for the purpose of presentation in the Portfolio of Investments. | |
| | (f) | | | Interest rate represents discount rate at time of purchase; not a coupon rate. | |
| | (g) | | | Variable rate security. The interest rate adjusts periodically based on changes in current interest rates and prepayments on the underlying pool of assets. Rate as of September 30, 2017 is disclosed. | |
| | | | | | | | |
| | 144A | | | All or a portion of these securities are exempt from registration under Rule 144A of the Securities Act of 1933. These securities may be resold in transactions exempt from registration, normally to qualified institutional buyers. At September 30, 2017, the value of Rule 144A holdings amounted to $44,704,539 or 6.0% of net assets. | |
| | ABS | | | Asset-Backed Securities | | | | |
| | ARMs | | | Adjustable Rate Mortgages | | | | |
| | CMT | | | Constant Maturity Treasuries | | | | |
| | COFI | | | Cost Of Funds Index | | | | |
| | FHLMC | | | Federal Home Loan Mortgage Corp. | | | | |
| | FNMA | | | Federal National Mortgage Association | | | | |
| | GNMA | | | Government National Mortgage Association | | | | |
| | LIBOR | | | London Interbank Offered Rate | | | | |
| | MTA | | | Monthly Treasury Average Index | | | | |
| | REMIC | | | Real Estate Mortgage Investment Conduit | | | | |
Industry Summary at September 30, 2017
| | | | |
Treasuries | | | 23.1 | % |
Agency Commercial Mortgage-Backed Securities | | | 16.9 | |
Mortgage Related | | | 16.7 | |
Collateralized Mortgage Obligations | | | 16.1 | |
Hybrid ARMs | | | 12.4 | |
Non-Agency Commercial Mortgage-Backed Securities | | | 4.5 | |
ABS Car Loan | | | 2.0 | |
Other Investments, less than 2% each | | | 0.8 | |
Short-Term Investments | | | 13.0 | |
| | | | |
Total Investments | | | 105.5 | |
Other assets less liabilities | | | (5.5 | ) |
| | | | |
Net Assets | | | 100.0 | % |
| | | | |
See accompanying notes to financial statements.
61 |
This Page Intentionally Left Blank
| 62
Statements of Assets and Liabilities
September 30, 2017
| | | | | | | | | | | | |
| | | High Income
Fund | | | Intermediate
Duration Bond
Fund | | | Limited Term
Government
and Agency
Fund | |
ASSETS | |
Investments at cost | | $ | 175,670,510 | | | $ | 180,394,572 | | | $ | 790,776,539 | |
Net unrealized appreciation (depreciation) | | | 941,505 | | | | (84,520 | ) | | | (8,427,314 | ) |
| | | | | | | | | | | | |
Investments at value | | | 176,612,015 | | | | 180,310,052 | | | | 782,349,225 | |
Cash | | | 62,338 | | | | 4,057,303 | | | | — | |
Due from brokers (Note 2) | | | — | | | | 60,000 | | | | — | |
Foreign currency at value (identified cost $40,801, $0 and $0, respectively) | | | 41,276 | | | | — | | | | — | |
Receivable for Fund shares sold | | | 813,835 | | | | 365,354 | | | | 1,027,897 | |
Receivable for securities sold | | | 228,039 | | | | 5,471,875 | | | | 42,397,492 | |
Dividends and interest receivable | | | 2,385,968 | | | | 652,050 | | | | 2,583,787 | |
Tax reclaims receivable | | | 1,280 | | | | 305 | | | | — | |
Prepaid expenses (Note 8) | | | 232 | | | | 247 | | | | 731 | |
| | | | | | | | | | | | |
TOTAL ASSETS | | | 180,144,983 | | | | 190,917,186 | | | | 828,359,132 | |
| | | | | | | | | | | | |
LIABILITIES | |
Payable for securities purchased | | | 573,104 | | | | 10,959,923 | | | | 84,188,709 | |
Payable for Fund shares redeemed | | | 65,462 | | | | 27,312 | | | | 1,456,159 | |
Payable for variation margin on futures contracts (Note 2) | | | — | | | | 13,125 | | | | — | |
Distributions payable | | | — | | | | — | | | | 229,846 | |
Management fees payable (Note 6) | | | 67,126 | | | | 11,066 | | | | 209,625 | |
Deferred Trustees’ fees (Note 6) | | | 149,738 | | | | 102,583 | | | | 297,934 | |
Administrative fees payable (Note 6) | | | 6,532 | | | | 6,698 | | | | 27,431 | |
Payable to distributor (Note 6d) | | | 2,420 | | | | 1,262 | | | | 4,522 | |
Other accounts payable and accrued expenses | | | 72,688 | | | | 74,950 | | | | 177,308 | |
| | | | | | | | | | | | |
TOTAL LIABILITIES | | | 937,070 | | | | 11,196,919 | | | | 86,591,534 | |
| | | | | | | | | | | | |
NET ASSETS | | $ | 179,207,913 | | | $ | 179,720,267 | | | $ | 741,767,598 | |
| | | | | | | | | | | | |
NET ASSETS CONSIST OF: | |
Paid-in capital | | $ | 179,763,967 | | | $ | 181,077,241 | | | $ | 771,874,059 | |
Undistributed (Distributions in excess of) net investment income | | | (357,359 | ) | | | (24,507 | ) | | | 367,737 | |
Accumulated net realized loss on investments, forward foreign currency contracts and foreign currency transactions | | | (1,139,590 | ) | | | (1,144,672 | ) | | | (22,046,884 | ) |
Net unrealized appreciation (depreciation) on investments, futures contracts and foreign currency translations | | | 940,895 | | | | (187,795 | ) | | | (8,427,314 | ) |
| | | | | | | | | | | | |
NET ASSETS | | $ | 179,207,913 | | | $ | 179,720,267 | | | $ | 741,767,598 | |
| | | | | | | | | | | | |
See accompanying notes to financial statements.
63 |
Statements of Assets and Liabilities (continued)
September 30, 2017
| | | | | | | | | | | | |
| | | High Income
Fund | | | Intermediate
Duration Bond
Fund | | | Limited Term
Government
and Agency
Fund | |
COMPUTATION OF NET ASSET VALUE AND
OFFERING PRICE: | |
Class A shares: | |
Net assets | | $ | 34,039,331 | | | $ | 21,827,511 | | | $ | 336,226,724 | |
| | | | | | | | | | | | |
Shares of beneficial interest | | | 7,783,979 | | | | 2,120,486 | | | | 29,694,359 | |
| | | | | | | | | | | | |
Net asset value and redemption price per share | | $ | 4.37 | | | $ | 10.29 | | | $ | 11.32 | |
| | | | | | | | | | | | |
Offering price per share (100/[100-maximum sales charge] of net asset value) (Note 1) | | $ | 4.56 | | | $ | 10.75 | | | $ | 11.58 | |
| | | | | | | | | | | | |
Class C shares: (redemption price per share is equal to net asset value less any applicable contingent deferred sales charge) (Note 1) | | | | | | | | | | | | |
Net assets | | $ | 11,227,332 | | | $ | 3,225,055 | | | $ | 43,319,090 | |
| | | | | | | | | | | | |
Shares of beneficial interest | | | 2,560,461 | | | | 313,176 | | | | 3,822,512 | |
| | | | | | | | | | | | |
Net asset value and offering price per share | | $ | 4.38 | | | $ | 10.30 | | | $ | 11.33 | |
| | | | | | | | | | | | |
Class N shares: | |
Net assets | | $ | 1,092 | | | $ | — | | | $ | 1,899,604 | |
| | | | | | | | | | | | |
Shares of beneficial interest | | | 250 | | | | — | | | | 167,284 | |
| | | | | | | | | | | | |
Net asset value, offering and redemption price per share | | $ | 4.36 | (a) | | $ | — | | | $ | 11.36 | |
| | | | | | | | | | | | |
Class Y shares: | |
Net assets | | $ | 133,940,158 | | | $ | 154,667,701 | | | $ | 360,322,180 | |
| | | | | | | | | | | | |
Shares of beneficial interest | | | 30,708,845 | | | | 15,030,498 | �� | | | 31,720,255 | |
| | | | | | | | | | | | |
Net asset value, offering and redemption price per share | | $ | 4.36 | | | $ | 10.29 | | | $ | 11.36 | |
| | | | | | | | | | | | |
| (a) | Net asset value calculations have been determined utilizing fractional share and penny amounts. |
See accompanying notes to financial statements.
| 64
Statements of Operations
For the Year Ended September 30, 2017
| | | | | | | | | | | | |
| | | High Income
Fund | | | Intermediate
Duration Bond
Fund | | | Limited Term
Government
and Agency
Fund | |
INVESTMENT INCOME | |
Interest | | $ | 10,124,492 | | | $ | 4,137,730 | | | $ | 11,940,183 | |
Dividends | | | 519,832 | | | | — | | | | — | |
Less net foreign taxes withheld | | | (7,820 | ) | | | (139 | ) | | | — | |
| | | | | | | | | | | | |
| | | 10,636,504 | | | | 4,137,591 | | | | 11,940,183 | |
| | | | | | | | | | | | |
Expenses | |
Management fees (Note 6) | | | 1,042,422 | | | | 443,227 | | | | 2,966,461 | |
Service and distribution fees (Note 6) | | | 204,814 | | | | 82,291 | | | | 1,520,083 | |
Administrative fees (Note 6) | | | 77,527 | | | | 79,109 | | | | 362,331 | |
Trustees’ fees and expenses (Note 6) | | | 36,722 | | | | 31,504 | | | | 68,823 | |
Transfer agent fees and expenses (Notes 6 and 7) | | | 214,608 | | | | 81,778 | | | | 731,628 | |
Audit and tax services fees | | | 54,578 | | | | 62,586 | | | | 56,782 | |
Custodian fees and expenses | | | 24,746 | | | | 22,464 | | | | 45,088 | |
Legal fees | | | 3,832 | | | | 3,893 | | | | 18,715 | |
Registration fees | | | 64,371 | | | | 72,653 | | | | 111,097 | |
Shareholder reporting expenses | | | 34,566 | | | | 26,480 | | | | 83,156 | |
Miscellaneous expenses (Note 8) | | | 16,483 | | | | 14,278 | | | | 39,212 | |
| | | | | | | | | | | | |
Total expenses | | | 1,774,669 | | | | 920,263 | | | | 6,003,376 | |
Less waiver and/or expense reimbursement (Note 6) | | | (115,021 | ) | | | (128,732 | ) | | | (17,792 | ) |
| | | | | | | | | | | | |
Net expenses | | | 1,659,648 | | | | 791,531 | | | | 5,985,584 | |
| | | | | | | | | | | | |
Net investment income | | | 8,976,856 | | | | 3,346,060 | | | | 5,954,599 | |
| | | | | | | | | | | | |
NET REALIZED AND UNREALIZED GAIN (LOSS) ON INVESTMENTS, FORWARD FOREIGN CURRENCY CONTRACTS, FUTURES CONTRACTS AND FOREIGN CURRENCY TRANSACTIONS | | | | | | | | | | | | |
Net realized gain (loss) on: | |
Investments | | | 825,959 | | | | (364,816 | ) | | | (1,193,894 | ) |
Forward foreign currency contracts (Note 2d) | | | 3,351 | | | | — | | | | — | |
Foreign currency transactions (Note 2c) | | | 9,540 | | | | — | | | | — | |
Net change in unrealized appreciation (depreciation) on: | | | | | | | | | | | | |
Investments | | | 3,998,872 | | | | (1,410,095 | ) | | | (5,444,007 | ) |
Forward foreign currency contracts (Note 2d) | | | (233 | ) | | | — | | | | — | |
Futures contracts | | | — | | | | (103,275 | ) | | | — | |
Foreign currency translations (Note 2c) | | | 1,068 | | | | — | | | | — | |
| | | | | | | | | | | | |
Net realized and unrealized gain (loss) on investments, forward foreign currency contracts, futures contracts and foreign currency transactions | | | 4,838,557 | | | | (1,878,186 | ) | | | (6,637,901 | ) |
| | | | | | | | | | | | |
NET INCREASE (DECREASE) IN NET ASSETS RESULTING FROM OPERATIONS | | $ | 13,815,413 | | | $ | 1,467,874 | | | $ | (683,302 | ) |
| | | | | | | | | | | | |
See accompanying notes to financial statements.
65 |
Statements of Changes in Net Assets
| | | | | | | | | | | | | | | | |
| | | High Income Fund | | | Intermediate Duration
Bond Fund | |
| | | Year Ended
September 30,
2017 | | | Year Ended
September 30,
2016 | | | Year Ended
September 30,
2017 | | | Year Ended
September 30,
2016 | |
FROM OPERATIONS: | |
Net investment income | | $ | 8,976,856 | | | $ | 8,583,675 | | | $ | 3,346,060 | | | $ | 2,750,862 | |
Net realized gain (loss) on investments, forward foreign currency contracts and foreign currency transactions | | | 838,850 | | | | (5,345,683 | ) | | | (364,816 | ) | | | 1,570,969 | |
Net change in unrealized appreciation (depreciation) on investments, futures contracts, forward foreign currency contracts and foreign currency translations | | | 3,999,707 | | | | 13,406,022 | | | | (1,513,370 | ) | | | 1,160,767 | |
| | | | | | | | | | | | | | | | |
Net increase in net assets resulting from operations | | | 13,815,413 | | | | 16,644,014 | | | | 1,467,874 | | | | 5,482,598 | |
| | | | | | | | | | | | | | | | |
FROM DISTRIBUTIONS TO SHAREHOLDERS: | |
Net investment income | | | | | | | | | | | | | | | | |
Class A | | | (1,577,362 | ) | | | (1,391,187 | ) | | | (390,277 | ) | | | (390,657 | ) |
Class B(a) | | | — | | | | (14 | ) | | | — | | | | — | |
Class C | | | (453,429 | ) | | | (384,341 | ) | | | (36,839 | ) | | | (1 | ) |
Class N | | | (41 | ) | | | — | | | | — | | | | — | |
Class Y | | | (6,175,066 | ) | | | (4,855,484 | ) | | | (3,322,106 | ) | | | (2,556,145 | ) |
Net realized capital gains | | | | | | | | | | | | | | | | |
Class A | | | — | | | | (81,866 | ) | | | (146,821 | ) | | | (64,649 | ) |
Class B(a) | | | — | | | | (3 | ) | | | — | | | | — | |
Class C | | | — | | | | (29,530 | ) | | | (22,477 | ) | | | — | |
Class Y | | | — | | | | (273,287 | ) | | | (1,093,586 | ) | | | (284,383 | ) |
| | | | | | | | | | | | | | | | |
Total distributions | | | (8,205,898 | ) | | | (7,015,712 | ) | | | (5,012,106 | ) | | | (3,295,835 | ) |
| | | | | | | | | | | | | | | | |
NET INCREASE (DECREASE) IN NET ASSETS FROM CAPITAL SHARE TRANSACTIONS (NOTE 11) | | | (2,678,063 | ) | | | (670,213 | ) | | | 21,450,975 | | | | 52,609,062 | |
| | | | | | | | | | | | | | | | |
Net increase in net assets | | | 2,931,452 | | | | 8,958,089 | | | | 17,906,743 | | | | 54,795,825 | |
NET ASSETS | |
Beginning of the year | | | 176,276,461 | | | | 167,318,372 | | | | 161,813,524 | | | | 107,017,699 | |
| | | | | | | | | | | | | | | | |
End of the year | | $ | 179,207,913 | | | $ | 176,276,461 | | | $ | 179,720,267 | | | $ | 161,813,524 | |
| | | | | | | | | | | | | | | | |
DISTRIBUTIONS IN EXCESS OF NET INVESTMENT INCOME | | $ | (357,359 | ) | | $ | (462,119 | ) | | $ | (24,507 | ) | | $ | (46,973 | ) |
| | | | | | | | | | | | | | | | |
| (a) | On January 11, 2016, Class B shares were converted into Class A shares. See Note 1 of Notes to Financial Statements. |
See accompanying notes to financial statements.
| 66
Statements of Changes in Net Assets (continued)
| | | | | | | | |
| | | Limited Term Government and
Agency Fund | |
| | | Year Ended
September 30,
2017 | | | Year Ended
September 30,
2016 | |
FROM OPERATIONS: | |
Net investment income | | $ | 5,954,599 | | | $ | 9,196,702 | |
Net realized gain (loss) on investments | | | (1,193,894 | ) | | | 2,246,153 | |
Net change in unrealized appreciation (depreciation) on investments | | | (5,444,007 | ) | | | (2,140,764 | ) |
| | | | | | | | |
Net increase (decrease) in net assets resulting from operations | | | (683,302 | ) | | | 9,302,091 | |
| | | | | | | | |
FROM DISTRIBUTIONS TO SHAREHOLDERS: | |
Net investment income | | | | | | | | |
Class A | | | (6,178,474 | ) | | | (5,792,542 | ) |
Class B(a) | | | — | | | | (5,359 | ) |
Class C | | | (492,969 | ) | | | (543,862 | ) |
Class N | | | (19,353 | ) | | | — | |
Class Y | | | (6,976,388 | ) | | | (7,311,896 | ) |
| | | | | | | | |
Total distributions | | | (13,667,184 | ) | | | (13,653,659 | ) |
| | | | | | | | |
NET INCREASE (DECREASE) IN NET ASSETS FROM CAPITAL SHARE TRANSACTIONS (NOTE 11) | | | (171,478,152 | ) | | | 88,093,679 | |
| | | | | | | | |
Net increase (decrease) in net assets | | | (185,828,638 | ) | | | 83,742,111 | |
NET ASSETS | |
Beginning of the year | | | 927,596,236 | | | | 843,854,125 | |
| | | | | | | | |
End of the year | | $ | 741,767,598 | | | $ | 927,596,236 | |
| | | | | | | | |
UNDISTRIBUTED NET INVESTMENT INCOME | | $ | 367,737 | | | $ | 206,971 | |
| | | | | | | | |
| (a) | On January 11, 2016, Class B shares were converted into Class A shares. See Note 1 of Notes to Financial Statements. |
See accompanying notes to financial statements.
67 |
Financial Highlights
For a share outstanding throughout each period.
| | | | | | | | | | | | | | | | | | | | |
| | | High Income Fund—Class A | |
| | | Year Ended
September 30,
2017 | | | Year Ended
September 30,
2016 | | | Year Ended
September 30,
2015 | | | Year Ended
September 30,
2014 | | | Year Ended
September 30,
2013 | |
Net asset value, beginning of the period | | $ | 4.23 | | | $ | 3.99 | | | $ | 4.49 | | | $ | 4.59 | | | $ | 4.60 | |
| | | | | | | | | | | | | | | | | | | | |
INCOME (LOSS) FROM INVESTMENT OPERATIONS: | | | | | | | | | | | | | | | | | | | | |
Net investment income(a) | | | 0.22 | | | | 0.20 | | | | 0.19 | | | | 0.21 | | | | 0.24 | |
Net realized and unrealized gain (loss) | | | 0.12 | | | | 0.21 | | | | (0.39 | ) | | | 0.17 | | | | 0.03 | |
| | | | | | | | | | | | | | | | | | | | |
Total from Investment Operations | | | 0.34 | | | | 0.41 | | | | (0.20 | ) | | | 0.38 | | | | 0.27 | |
| | | | | | | | | | | | | | | | | | | | |
LESS DISTRIBUTIONS FROM: | | | | | | | | | | | | | | | | | | | | |
Net investment income | | | (0.20 | ) | | | (0.16 | ) | | | (0.19 | ) | | | (0.22 | ) | | | (0.27 | ) |
Net realized capital gains | | | — | | | | (0.01 | ) | | | (0.11 | ) | | | (0.26 | ) | | | (0.01 | ) |
| | | | | | | | | | | | | | | | | | | | |
Total Distributions | | | (0.20 | ) | | | (0.17 | ) | | | (0.30 | ) | | | (0.48 | ) | | | (0.28 | ) |
| | | | | | | | | | | | | | | | | | | | |
Net asset value, end of the period | | $ | 4.37 | | | $ | 4.23 | | | $ | 3.99 | | | $ | 4.49 | | | $ | 4.59 | |
| | | | | | | | | | | | | | | | | | | | |
Total return(b) | | | 8.17 | %(c) | | | 10.66 | %(c) | | | (4.78 | )%(c) | | | 8.42 | % | | | 6.27 | % |
RATIOS TO AVERAGE NET ASSETS: | | | | | | | | | | | | | | | | | | | | |
Net assets, end of the period (000’s) | | $ | 34,039 | | | $ | 34,820 | | | $ | 37,870 | | | $ | 42,630 | | | $ | 45,791 | |
Net expenses | | | 1.09 | %(d)(e) | | | 1.10 | %(d) | | | 1.11 | %(d)(f) | | | 1.14 | % | | | 1.15 | %(g) |
Gross expenses | | | 1.15 | % | | | 1.14 | % | | | 1.13 | % | | | 1.14 | % | | | 1.15 | %(g) |
Net investment income | | | 5.03 | % | | | 5.16 | % | | | 4.41 | % | | | 4.57 | % | | | 5.11 | % |
Portfolio turnover rate | | | 46 | % | | | 38 | % | | | 69 | % | | | 59 | % | | | 47 | % |
| (a) | Per share net investment income has been calculated using the average shares outstanding during the period. |
| (b) | A sales charge for Class A shares is not reflected in total return calculations. |
| (c) | Had certain expenses not been waived/reimbursed during the period, total returns would have been lower. |
| (d) | The investment adviser agreed to waive its fees and/or reimburse a portion of the Fund’s expenses during the period. Without this waiver/reimbursement, expenses would have been higher. |
| (e) | Effective July 1, 2017, the expense limit decreased to 1.05%. |
| (f) | Effective July 1, 2015, the expense limit decreased to 1.10%. |
| (g) | Includes fee/expense recovery of 0.02%. |
See accompanying notes to financial statements.
| 68
Financial Highlights (continued)
For a share outstanding throughout each period.
| | | | | | | | | | | | | | | | | | | | |
| | | High Income Fund—Class C | |
| | | Year Ended
September 30,
2017 | | | Year Ended
September 30,
2016 | | | Year Ended
September 30,
2015 | | | Year Ended
September 30,
2014 | | | Year Ended
September 30,
2013 | |
Net asset value, beginning of the period | | $ | 4.24 | | | $ | 4.00 | | | $ | 4.50 | | | $ | 4.61 | | | $ | 4.61 | |
| | | | | | | | | | | | | | | | | | | | |
INCOME (LOSS) FROM INVESTMENT OPERATIONS: | | | | | | | | | | | | | | | | | | | | |
Net investment income(a) | | | 0.18 | | | | 0.18 | | | | 0.16 | | | | 0.18 | | | | 0.21 | |
Net realized and unrealized gain (loss) | | | 0.12 | | | | 0.20 | | | | (0.39 | ) | | | 0.16 | | | | 0.04 | |
| | | | | | | | | | | | | | | | | | | | |
Total from Investment Operations | | | 0.30 | | | | 0.38 | | | | (0.23 | ) | | | 0.34 | | | | 0.25 | |
| | | | | | | | | | | | | | | | | | | | |
LESS DISTRIBUTIONS FROM: | | | | | | | | | | | | | | | | | | | | |
Net investment income | | | (0.16 | ) | | | (0.13 | ) | | | (0.16 | ) | | | (0.19 | ) | | | (0.24 | ) |
Net realized capital gains | | | — | | | | (0.01 | ) | | | (0.11 | ) | | | (0.26 | ) | | | (0.01 | ) |
| | | | | | | | | | | | | | | | | | | | |
Total Distributions | | | (0.16 | ) | | | (0.14 | ) | | | (0.27 | ) | | | (0.45 | ) | | | (0.25 | ) |
| | | | | | | | | | | | | | | | | | | | |
Net asset value, end of the period | | $ | 4.38 | | | $ | 4.24 | | | $ | 4.00 | | | $ | 4.50 | | | $ | 4.61 | |
| | | | | | | | | | | | | | | | | | | | |
Total return(b) | | | 7.33 | %(c) | | | 9.81 | %(c) | | | (5.48 | )%(c) | | | 7.60 | % | | | 5.46 | % |
RATIOS TO AVERAGE NET ASSETS: | | | | | | | | | | | | | | | | | | | | |
Net assets, end of the period (000’s) | | $ | 11,227 | | | $ | 12,288 | | | $ | 12,609 | | | $ | 14,555 | | | $ | 15,233 | |
Net expenses | | | 1.84 | %(d)(e) | | | 1.85 | %(d) | | | 1.86 | %(d)(f) | | | 1.89 | % | | | 1.90 | %(g) |
Gross expenses | | | 1.90 | % | | | 1.89 | % | | | 1.88 | % | | | 1.89 | % | | | 1.90 | %(g) |
Net investment income | | | 4.29 | % | | | 4.43 | % | | | 3.68 | % | | | 3.84 | % | | | 4.36 | % |
Portfolio turnover rate | | | 46 | % | | | 38 | % | | | 69 | % | | | 59 | % | | | 47 | % |
| (a) | Per share net investment income has been calculated using the average shares outstanding during the period. |
| (b) | A contingent deferred sales charge for Class C shares is not reflected in total return calculations. |
| (c) | Had certain expenses not been waived/reimbursed during the period, total returns would have been lower. |
| (d) | The investment adviser agreed to waive its fees and/or reimburse a portion of the Fund’s expenses during the period. Without this waiver/reimbursement, expenses would have been higher. |
| (e) | Effective July 1, 2017, the expense limit decreased to 1.80%. |
| (f) | Effective July 1, 2015, the expense limit decreased to 1.85%. |
| (g) | Includes fee/expense recovery of 0.01%. |
See accompanying notes to financial statements.
69 |
Financial Highlights (continued)
For a share outstanding throughout each period.
| | | | |
| | | High Income
Fund—Class N | |
| | | Period Ended
September 30,
2017* | |
Net asset value, beginning of the period | | $ | 4.16 | |
| | | | |
INCOME (LOSS) FROM INVESTMENT OPERATIONS: | |
Net investment income(a) | | | 0.19 | |
Net realized and unrealized gain (loss) | | | 0.18 | |
| | | | |
Total from Investment Operations | | | 0.37 | |
| | | | |
LESS DISTRIBUTIONS FROM: | |
Net investment income | | | (0.17 | ) |
| | | | |
Net asset value, end of the period | | $ | 4.36 | |
| | | | |
Total return(b)(c) | | | 8.99 | % |
RATIOS TO AVERAGE NET ASSETS: | |
Net assets, end of the period (000’s) | | $ | 1 | |
Net expenses(d)(e)(f) | | | 0.75 | % |
Gross expenses(e) | | | 31.73 | % |
Net investment income(e) | | | 5.19 | % |
Portfolio turnover rate(g) | | | 46 | % |
| * | From commencement of Class operations on November 30, 2016 through September 30, 2017. |
| (a) | Per share net investment income has been calculated using the average shares outstanding during the period. |
| (b) | Periods less than one year are not annualized. |
| (c) | Had certain expenses not been waived/reimbursed during the period, total returns would have been lower. |
| (d) | The investment adviser agreed to waive its fees and/or reimburse a portion of the Fund’s expenses during the period. Without this waiver/reimbursement, expenses would have been higher. |
| (e) | Computed on an annualized basis for periods less than one year. |
| (f) | Effective July 1, 2017, the expense limit decreased to 0.75%. |
| (g) | Represents the Fund’s portfolio turnover rate for the year ended September 30, 2017. |
See accompanying notes to financial statements.
| 70
Financial Highlights (continued)
For a share outstanding throughout each period.
| | | | | | | | | | | | | | | | | | | | |
| | | High Income Fund—Class Y | |
| | | Year Ended
September 30,
2017 | | | Year Ended
September 30,
2016 | | | Year Ended
September 30,
2015 | | | Year Ended
September 30,
2014 | | | Year Ended
September 30,
2013 | |
Net asset value, beginning of the period | | $ | 4.22 | | | $ | 3.98 | | | $ | 4.48 | | | $ | 4.59 | | | $ | 4.59 | |
| | | | | | | | | | | | | | | | | | | | |
INCOME (LOSS) FROM INVESTMENT OPERATIONS: | | | | | | | | | | | | | | | | | | | | |
Net investment income(a) | | | 0.23 | | | | 0.21 | | | | 0.20 | | | | 0.22 | | | | 0.25 | |
Net realized and unrealized gain (loss) | | | 0.12 | | | | 0.21 | | | | (0.39 | ) | | | 0.16 | | | | 0.04 | |
| | | | | | | | | | | | | | | | | | | | |
Total from Investment Operations | | | 0.35 | | | | 0.42 | | | | (0.19 | ) | | | 0.38 | | | | 0.29 | |
| | | | | | | | | | | | | | | | | | | | |
LESS DISTRIBUTIONS FROM: | | | | | | | | | | | | | | | | | | | | |
Net investment income | | | (0.21 | ) | | | (0.17 | ) | | | (0.20 | ) | | | (0.23 | ) | | | (0.28 | ) |
Net realized capital gains | | | — | | | | (0.01 | ) | | | (0.11 | ) | | | (0.26 | ) | | | (0.01 | ) |
| | | | | | | | | | | | | | | | | | | | |
Total Distributions | | | (0.21 | ) | | | (0.18 | ) | | | (0.31 | ) | | | (0.49 | ) | | | (0.29 | ) |
| | | | | | | | | | | | | | | | | | | | |
Net asset value, end of the period | | $ | 4.36 | | | $ | 4.22 | | | $ | 3.98 | | | $ | 4.48 | | | $ | 4.59 | |
| | | | | | | | | | | | | | | | | | | | |
Total return | | | 8.47 | %(b) | | | 10.98 | %(b) | | | (4.54 | )%(b) | | | 8.72 | % | | | 6.56 | % |
RATIOS TO AVERAGE NET ASSETS: | | | | | | | | | | | | | | | | | | | | |
Net assets, end of the period (000’s) | | $ | 133,940 | | | $ | 129,169 | | | $ | 116,837 | | | $ | 125,185 | | | $ | 108,170 | |
Net expenses | | | 0.84 | %(c)(d) | | | 0.85 | %(c) | | | 0.86 | %(c)(e) | | | 0.89 | % | | | 0.90 | %(f) |
Gross expenses | | | 0.90 | % | | | 0.89 | % | | | 0.88 | % | | | 0.89 | % | | | 0.90 | %(f) |
Net investment income | | | 5.28 | % | | | 5.43 | % | | | 4.67 | % | | | 4.83 | % | | | 5.37 | % |
Portfolio turnover rate | | | 46 | % | | | 38 | % | | | 69 | % | | | 59 | % | | | 47 | % |
| (a) | Per share net investment income has been calculated using the average shares outstanding during the period. |
| (b) | Had certain expenses not been waived/reimbursed during the period, total returns would have been lower. |
| (c) | The investment adviser agreed to waive its fees and/or reimburse a portion of the Fund’s expenses during the period. Without this waiver/reimbursement, expenses would have been higher. |
| (d) | Effective July 1, 2017, the expense limit decreased to 0.80%. |
| (e) | Effective July 1, 2015, the expense limit decreased to 0.85%. |
| (f) | Includes fee/expense recovery of 0.01%. |
See accompanying notes to financial statements.
71 |
Financial Highlights (continued)
For a share outstanding throughout each period.
| | | | | | | | | | | | | | | | | | | | |
| | | Intermediate Duration Bond Fund—Class A* | |
| | | Year Ended
September 30,
2017 | | | Year Ended
September 30,
2016 | | | Year Ended
September 30,
2015 | | | Year Ended
September 30,
2014 | | | Year Ended
September 30,
2013 | |
Net asset value, beginning of the period | | $ | 10.52 | | | $ | 10.39 | | | $ | 10.39 | | | $ | 10.34 | | | $ | 10.80 | |
| | | | | | | | | | | | | | | | | | | | |
INCOME (LOSS) FROM INVESTMENT OPERATIONS: | | | | | | | | | | | | | | | | | | | | |
Net investment income(a) | | | 0.17 | | | | 0.20 | | | | 0.20 | | | | 0.22 | | | | 0.18 | |
Net realized and unrealized gain (loss) | | | (0.12 | ) | | | 0.17 | | | | 0.03 | | | | 0.11 | | | | (0.23 | ) |
| | | | | | | | | | | | | | | | | | | | |
Total from Investment Operations | | | 0.05 | | | | 0.37 | | | | 0.23 | | | | 0.33 | | | | (0.05 | ) |
| | | | | | | | | | | | | | | | | | | | |
LESS DISTRIBUTIONS FROM: | | | | | | | | | | | | | | | | | | | | |
Net investment income | | | (0.20 | ) | | | (0.21 | ) | | | (0.22 | ) | | | (0.25 | ) | | | (0.24 | ) |
Net realized capital gains | | | (0.08 | ) | | | (0.03 | ) | | | (0.01 | ) | | | (0.03 | ) | | | (0.17 | ) |
| | | | | | | | | | | | | | | | | | | | |
Total Distributions | | | (0.28 | ) | | | (0.24 | ) | | | (0.23 | ) | | | (0.28 | ) | | | (0.41 | ) |
| | | | | | | | | | | | | | | | | | | | |
Net asset value, end of the period | | $ | 10.29 | | | $ | 10.52 | | | $ | 10.39 | | | $ | 10.39 | | | $ | 10.34 | |
| | | | | | | | | | | | | | | | | | | | |
Total return(b)(c) | | | 0.44 | % | | | 3.64 | % | | | 2.17 | % | | | 3.24 | % | | | (0.46 | )% |
RATIOS TO AVERAGE NET ASSETS: | | | | | | | | | | | | | | | | | | | | |
Net assets, end of the period (000’s) | | $ | 21,828 | | | $ | 19,327 | | | $ | 18,425 | | | $ | 5,931 | | | $ | 5,601 | |
Net expenses(d) | | | 0.65 | % | | | 0.65 | % | | | 0.65 | % | | | 0.65 | % | | | 0.65 | % |
Gross expenses | | | 0.72 | % | | | 0.72 | % | | | 0.71 | % | | | 0.85 | % | | | 0.79 | % |
Net investment income | | | 1.69 | % | | | 1.89 | % | | | 1.93 | % | | | 2.07 | % | | | 1.71 | % |
Portfolio turnover rate | | | 216 | % | | | 151 | % | | | 151 | % | | | 134 | % | | | 124 | % |
| * | Effective August 31, 2016, Retail Class shares were redesignated as Class A shares. See Note 1 of Notes to Financial Statements. |
| (a) | Per share net investment income has been calculated using the average shares outstanding during the period. |
| (b) | A sales charge for Class A shares is not reflected in total return calculations. |
| (c) | Had certain expenses not been waived/reimbursed during the period, total returns would have been lower. |
| (d) | The investment adviser agreed to waive its fees and/or reimburse a portion of the Fund’s expenses during the period. Without this waiver/reimbursement, expenses would have been higher. |
See accompanying notes to financial statements.
| 72
Financial Highlights (continued)
For a share outstanding throughout each period.
| | | | | | | | |
| | | Intermediate Duration Bond
Fund—Class C | |
| | | Year Ended
September 30,
2017 | | | Period Ended
September 30,
2016* | |
Net asset value, beginning of the period | | $ | 10.53 | | | $ | 10.53 | |
| | | | | | | | |
INCOME (LOSS) FROM INVESTMENT OPERATIONS: | |
Net investment income(a) | | | 0.10 | | | | 0.01 | |
Net realized and unrealized gain (loss) | | | (0.13 | ) | | | 0.00 | (b) |
| | | | | | | | |
Total from Investment Operations | | | (0.03 | ) | | | 0.01 | |
| | | | | | | | |
LESS DISTRIBUTIONS FROM: | |
Net investment income | | | (0.12 | ) | | | (0.01 | ) |
Net realized capital gains | | | (0.08 | ) | | | — | |
| | | | | | | | |
Total Distributions | | | (0.20 | ) | | | (0.01 | ) |
| | | | | | | | |
Net asset value, end of the period | | $ | 10.30 | | | $ | 10.53 | |
| | | | | | | | |
Total return(c)(d) | | | (0.29 | )% | | | 0.08 | %(e) |
RATIOS TO AVERAGE NET ASSETS: | |
Net assets, end of the period (000’s) | | $ | 3,225 | | | $ | 3,088 | |
Net expenses(f) | | | 1.40 | % | | | 1.40 | %(g) |
Gross expenses | | | 1.48 | % | | | 1.56 | %(g) |
Net investment income | | | 0.95 | % | | | 0.86 | %(g) |
Portfolio turnover rate | | | 216 | % | | | 151 | % |
| * | From commencement of Class operations on August 31, 2016 through September 30, 2016. |
| (a) | Per share net investment income has been calculated using the average shares outstanding during the period. |
| (b) | Amount rounds to less than $0.01 per share. |
| (c) | A contingent deferred sales charge for Class C shares is not reflected in total return calculations. |
| (d) | Had certain expenses not been waived/reimbursed during the period, total returns would have been lower. |
| (e) | Periods less than one year are not annualized. |
| (f) | The investment adviser agreed to waive its fees and/or reimburse a portion of the Fund’s expenses during the period. Without this waiver/reimbursement, expenses would have been higher. |
| (g) | Computed on an annualized basis for periods less than one year. |
See accompanying notes to financial statements.
73 |
Financial Highlights (continued)
For a share outstanding throughout each period.
| | | | | | | | | | | | | | | | | | | | |
| | | Intermediate Duration Bond Fund—Class Y* | |
| | | Year Ended
September 30,
2017 | | | Year Ended
September 30,
2016 | | | Year Ended
September 30,
2015 | | | Year Ended
September 30,
2014 | | | Year Ended
September 30,
2013 | |
Net asset value, beginning of the period | | $ | 10.52 | | | $ | 10.39 | | | $ | 10.39 | | | $ | 10.33 | | | $ | 10.80 | |
| | | | | | | | | | | | | | | | | | | | |
INCOME (LOSS) FROM INVESTMENT OPERATIONS: | | | | | | | | | | | | | | | | | | | | |
Net investment income(a) | | | 0.20 | | | | 0.22 | | | | 0.22 | | | | 0.24 | | | | 0.21 | |
Net realized and unrealized gain (loss) | | | (0.13 | ) | | | 0.18 | | | | 0.04 | | | | 0.12 | | | | (0.24 | ) |
| | | | | | | | | | | | | | | | | | | | |
Total from Investment Operations | | | 0.07 | | | | 0.40 | | | | 0.26 | | | | 0.36 | | | | (0.03 | ) |
| | | | | | | | | | | | | | | | | | | | |
LESS DISTRIBUTIONS FROM: | | | | | | | | | | | | | | | | | | | | |
Net investment income | | | (0.22 | ) | | | (0.24 | ) | | | (0.25 | ) | | | (0.27 | ) | | | (0.27 | ) |
Net realized capital gains | | | (0.08 | ) | | | (0.03 | ) | | | (0.01 | ) | | | (0.03 | ) | | | (0.17 | ) |
| | | | | | | | | | | | | | | | | | | | |
Total Distributions | | | (0.30 | ) | | | (0.27 | ) | | | (0.26 | ) | | | (0.30 | ) | | | (0.44 | ) |
| | | | | | | | | | | | | | | | | | | | |
Net asset value, end of the period | | $ | 10.29 | | | $ | 10.52 | | | $ | 10.39 | | | $ | 10.39 | | | $ | 10.33 | |
| | | | | | | | | | | | | | | | | | | | |
Total return(b) | | | 0.69 | % | | | 3.90 | % | | | 2.42 | % | | | 3.60 | % | | | (0.30 | )% |
RATIOS TO AVERAGE NET ASSETS: | | | | | | | | | | | | | | | | | | | | |
Net assets, end of the period (000’s) | | $ | 154,668 | | | $ | 139,398 | | | $ | 88,592 | | | $ | 66,759 | | | $ | 66,424 | |
Net expenses(c) | | | 0.40 | % | | | 0.40 | % | | | 0.40 | % | | | 0.40 | % | | | 0.40 | % |
Gross expenses | | | 0.47 | % | | | 0.47 | % | | | 0.47 | % | | | 0.57 | % | | | 0.48 | % |
Net investment income | | | 1.93 | % | | | 2.11 | % | | | 2.15 | % | | | 2.31 | % | | | 1.97 | % |
Portfolio turnover rate | | | 216 | % | | | 151 | % | | | 151 | % | | | 134 | % | | | 124 | % |
| * | Effective August 31, 2016, Institutional Class shares were redesignated as Class Y shares. See Note 1 of Notes to Financial Statements. |
| (a) | Per share net investment income has been calculated using the average shares outstanding during the period. |
| (b) | Had certain expenses not been waived/reimbursed during the period, total returns would have been lower. |
| (c) | The investment adviser agreed to waive its fees and/or reimburse a portion of the Fund’s expenses during the period. Without this waiver/reimbursement, expenses would have been higher. |
See accompanying notes to financial statements.
| 74
Financial Highlights (continued)
For a share outstanding throughout each period.
| | | | | | | | | | | | | | | | | | | | |
| | | Limited Term Government and Agency Fund—Class A | |
| | | Year Ended
September 30,
2017 | | | Year Ended
September 30,
2016 | | | Year Ended
September 30,
2015 | | | Year Ended
September 30,
2014 | | | Year Ended
September 30,
2013 | |
Net asset value, beginning of the period | | $ | 11.51 | | | $ | 11.57 | | | $ | 11.61 | | | $ | 11.68 | | | $ | 12.04 | |
| | | | | | | | | | | | | | | | | | | | |
INCOME (LOSS) FROM INVESTMENT OPERATIONS: | | | | | | | | | | | | | | | | | | | | |
Net investment income(a) | | | 0.08 | | | | 0.11 | | | | 0.14 | | | | 0.16 | | | | 0.13 | |
Net realized and unrealized gain (loss) | | | (0.09 | ) | | | 0.00 | (b) | | | 0.01 | (c) | | | 0.01 | | | | (0.23 | ) |
| | | | | | | | | | | | | | | | | | | | |
Total from Investment Operations | | | (0.01 | ) | | | 0.11 | | | | 0.15 | | | | 0.17 | | | | (0.10 | ) |
| | | | | | | | | | | | | | | | | | | | |
LESS DISTRIBUTIONS FROM: | | | | | | | | | | | | | | | | | | | | |
Net investment income | | | (0.18 | ) | | | (0.17 | ) | | | (0.19 | ) | | | (0.24 | ) | | | (0.26 | ) |
Net realized capital gains | | | — | | | | — | | | | — | | | | — | | | | (0.00 | )(b) |
Paid-in capital | | | — | | | | — | | | | — | | | | — | | | | (0.00 | )(b) |
| | | | | | | | | | | | | | | | | | | | |
Total Distributions | | | (0.18 | ) | | | (0.17 | ) | | | (0.19 | ) | | | (0.24 | ) | | | (0.26 | ) |
| | | | | | | | | | | | | | | | | | | | |
Net asset value, end of the period | | $ | 11.32 | | | $ | 11.51 | | | $ | 11.57 | | | $ | 11.61 | | | $ | 11.68 | |
| | | | | | | | | | | | | | | | | | | | |
Total return(d) | | | (0.04 | )% | | | 0.93 | % | | | 1.26 | % | | | 1.44 | % | | | (0.81 | )% |
RATIOS TO AVERAGE NET ASSETS: | | | | | | | | | | | | | | | | | | | | |
Net assets, end of the period (000’s) | | $ | 336,227 | | | $ | 442,671 | | | $ | 346,317 | | | $ | 314,360 | | | $ | 355,212 | |
Net expenses | | | 0.80 | % | | | 0.77 | % | | | 0.77 | % | | | 0.80 | %(e) | | | 0.87 | %(f) |
Gross expenses | | | 0.80 | % | | | 0.77 | % | | | 0.77 | % | | | 0.80 | %(e) | | | 0.87 | %(f) |
Net investment income | | | 0.67 | % | | | 0.96 | % | | | 1.21 | % | | | 1.35 | % | | | 1.11 | % |
Portfolio turnover rate | | | 126 | % | | | 109 | %(g) | | | 48 | % | | | 24 | % | | | 39 | % |
| (a) | Per share net investment income has been calculated using the average shares outstanding during the period. |
| (b) | Amount rounds to less than $0.01 per share. |
| (c) | The amount shown for a share outstanding does not correspond with the aggregate realized and unrealized gain (loss) on investments for the period due to the timing of sales and redemptions of fund shares in relation to fluctuating market values of investments of the Fund. |
| (d) | A sales charge for Class A shares is not reflected in total return calculations. |
| (e) | Includes fee/expense recovery of less than 0.01%. |
| (f) | Includes corporate tax expenses of 0.03%. Without this expense the ratio of net expenses would have been 0.84%. |
| (g) | The variation in the Fund’s turnover rate from 2015 to 2016 was primarily due to fluctuation in the level of fund assets due to shareholder flows. |
See accompanying notes to financial statements.
75 |
Financial Highlights (continued)
For a share outstanding throughout each period.
| | | | | | | | | | | | | | | | | | | | |
| | | Limited Term Government and Agency Fund— Class C | |
| | | Year Ended
September 30,
2017 | | | Year Ended
September 30,
2016 | | | Year Ended
September 30,
2015 | | | Year Ended
September 30,
2014 | | | Year Ended
September 30,
2013 | |
Net asset value, beginning of the period | | $ | 11.52 | | | $ | 11.58 | | | $ | 11.62 | | | $ | 11.69 | | | $ | 12.05 | |
| | | | | | | | | | | | | | | | | | | | |
INCOME (LOSS) FROM INVESTMENT OPERATIONS: | | | | | | | | | | | | | | | | | | | | |
Net investment income (loss)(a) | | | (0.01 | ) | | | 0.02 | | | | 0.05 | | | | 0.07 | | | | 0.04 | |
Net realized and unrealized gain (loss) | | | (0.08 | ) | | | 0.00 | (b) | | | 0.01 | (c) | | | 0.01 | | | | (0.23 | ) |
| | | | | | | | | | | | | | | | | | | | |
Total from Investment Operations | | | (0.09 | ) | | | 0.02 | | | | 0.06 | | | | 0.08 | | | | (0.19 | ) |
| | | | | | | | | | | | | | | | | | | | |
LESS DISTRIBUTIONS FROM: | | | | | | | | | | | | | | | | | | | | |
Net investment income | | | (0.10 | ) | | | (0.08 | ) | | | (0.10 | ) | | | (0.15 | ) | | | (0.17 | ) |
Net realized capital gains | | | — | | | | — | | | | — | | | | — | | | | (0.00 | )(b) |
Paid-in capital | | | — | | | | — | | | | — | | | | — | | | | (0.00 | )(b) |
| | | | | | | | | | | | | | | | | | | | |
Total Distributions | | | (0.10 | ) | | | (0.08 | ) | | | (0.10 | ) | | | (0.15 | ) | | | (0.17 | ) |
| | | | | | | | | | | | | | | | | | | | |
Net asset value, end of the period | | $ | 11.33 | | | $ | 11.52 | | | $ | 11.58 | | | $ | 11.62 | | | $ | 11.69 | |
| | | | | | | | | | | | | | | | | | | | |
Total return(d) | | | (0.79 | )% | | | 0.18 | % | | | 0.51 | % | | | 0.69 | % | | | (1.55 | )% |
RATIOS TO AVERAGE NET ASSETS: | | | | | | | | | | | | | | | | | | | | |
Net assets, end of the period (000’s) | | $ | 43,319 | | | $ | 73,027 | | | $ | 63,167 | | | $ | 56,936 | | | $ | 71,963 | |
Net expenses | | | 1.55 | % | | | 1.52 | % | | | 1.53 | % | | | 1.55 | %(e) | | | 1.62 | %(f) |
Gross expenses | | | 1.55 | % | | | 1.52 | % | | | 1.53 | % | | | 1.55 | %(e) | | | 1.62 | %(f) |
Net investment income (loss) | | | (0.09 | )% | | | 0.21 | % | | | 0.47 | % | | | 0.61 | % | | | 0.36 | % |
Portfolio turnover rate | | | 126 | % | | | 109 | %(g) | | | 48 | % | | | 24 | % | | | 39 | % |
| (a) | Per share net investment income (loss) has been calculated using the average shares outstanding during the period. |
| (b) | Amount rounds to less than $0.01 per share. |
| (c) | The amount shown for a share outstanding does not correspond with the aggregate realized and unrealized gain (loss) on investments for the period due to the timing of sales and redemptions of fund shares in relation to fluctuating market values of investments of the Fund. |
| (d) | A contingent deferred sales charge for Class C shares is not reflected in total return calculations. |
| (e) | Includes fee/expense recovery of less than 0.01%. |
| (f) | Includes corporate tax expenses of 0.03%. Without this expense the ratio of net expenses would have been 1.59%. |
| (g) | The variation in the Fund’s turnover rate from 2015 to 2016 was primarily due to fluctuation in the level of fund assets due to shareholder flows. |
See accompanying notes to financial statements.
| 76
Financial Highlights (continued)
For a share outstanding throughout each period.
| | | | |
| | | Limited Term
Government
and Agency
Fund—Class N | |
| | | Period Ended
September 30,
2017* | |
Net asset value, beginning of the period | | $ | 11.39 | |
| | | | |
INCOME (LOSS) FROM INVESTMENT OPERATIONS: | |
Net investment income(a) | | | 0.05 | |
Net realized and unrealized gain (loss)(b) | | | 0.08 | |
| | | | |
Total from Investment Operations | | | 0.13 | |
| | | | |
LESS DISTRIBUTIONS FROM: | |
Net investment income | | | (0.16 | ) |
| | | | |
Net asset value, end of the period | | $ | 11.36 | |
| | | | |
Total return(c)(d) | | | 1.12 | % |
RATIOS TO AVERAGE NET ASSETS: | |
Net assets, end of the period (000’s) | | $ | 1,900 | |
Net expenses(e)(f) | | | 0.47 | % |
Gross expenses(f) | | | 0.50 | % |
Net investment income(f) | | | 0.64 | % |
Portfolio turnover rate(g) | | | 126 | % |
| * | From commencement of Class operations on February 1, 2017 through September 30, 2017. |
| (a) | Per share net investment income has been calculated using the average shares outstanding during the period. |
| (b) | The amount shown for a share outstanding does not correspond with the aggregate realized and unrealized gain (loss) on investments for the period due to the timing of sales and redemptions of fund shares in relation to fluctuating market values of investments of the Fund. |
| (c) | Had certain expenses not been waived/reimbursed during the period, total returns would have been lower. |
| (d) | Periods less than one year are not annualized. |
| (e) | The investment adviser agreed to waive its fees and/or reimburse a portion of the Fund’s expenses during the period. Without this waiver/reimbursement, expenses would have been higher. |
| (f) | Computed on an annualized basis for periods less than one year. |
| (g) | Represents the Fund’s portfolio turnover rate for the year ended September 30, 2017. |
See accompanying notes to financial statements.
77 |
Financial Highlights (continued)
For a share outstanding throughout each period.
| | | | | | | | | | | | | | | | | | | | |
| | | Limited Term Government and Agency Fund—Class Y | |
| | | Year Ended
September 30,
2017 | | | Year Ended
September 30,
2016 | | | Year Ended
September 30,
2015 | | | Year Ended
September 30,
2014 | | | Year Ended
September 30,
2013 | |
Net asset value, beginning of the period | | $ | 11.55 | | | $ | 11.61 | | | $ | 11.65 | | | $ | 11.72 | | | $ | 12.08 | |
| | | | | | | | | | | | | | | | | | | | |
INCOME (LOSS) FROM INVESTMENT OPERATIONS: | | | | | | | | | | | | | | | | | | | | |
Net investment income(a) | | | 0.11 | | | | 0.14 | | | | 0.17 | | | | 0.18 | | | | 0.16 | |
Net realized and unrealized gain (loss) | | | (0.09 | ) | | | 0.00 | (b) | | | 0.01 | (c) | | | 0.02 | | | | (0.23 | ) |
| | | | | | | | | | | | | | | | | | | | |
Total from Investment Operations | | | 0.02 | | | | 0.14 | | | | 0.18 | | | | 0.20 | | | | (0.07 | ) |
| | | | | | | | | | | | | | | | | | | | |
LESS DISTRIBUTIONS FROM: | | | | | | | | | | | | | | | | | | | | |
Net investment income | | | (0.21 | ) | | | (0.20 | ) | | | (0.22 | ) | | | (0.27 | ) | | | (0.29 | ) |
Net realized capital gains | | | — | | | | — | | | | — | | | | — | | | | (0.00 | )(b) |
Paid-in capital | | | — | | | | — | | | | — | | | | — | | | | (0.00 | )(b) |
| | | | | | | | | | | | | | | | | | | | |
Total Distributions | | | (0.21 | ) | | | (0.20 | ) | | | (0.22 | ) | | | (0.27 | ) | | | (0.29 | ) |
| | | | | | | | | | | | | | | | | | | | |
Net asset value, end of the period | | $ | 11.36 | | | $ | 11.55 | | | $ | 11.61 | | | $ | 11.65 | | | $ | 11.72 | |
| | | | | | | | | | | | | | | | | | | | |
Total return | | | 0.22 | % | | | 1.19 | % | | | 1.51 | % | | | 1.70 | % | | | (0.56 | )% |
RATIOS TO AVERAGE NET ASSETS: | | | | | | | | | | | | | | | | | | | | |
Net assets, end of the period (000’s) | | $ | 360,322 | | | $ | 411,898 | | | $ | 431,727 | | | $ | 330,224 | | | $ | 252,127 | |
Net expenses | | | 0.55 | % | | | 0.52 | % | | | 0.52 | % | | | 0.55 | %(d) | | | 0.62 | %(e) |
Gross expenses | | | 0.55 | % | | | 0.52 | % | | | 0.52 | % | | | 0.55 | %(d) | | | 0.62 | %(e) |
Net investment income | | | 0.92 | % | | | 1.20 | % | | | 1.45 | % | | | 1.58 | % | | | 1.35 | % |
Portfolio turnover rate | | | 126 | % | | | 109 | %(f) | | | 48 | % | | | 24 | % | | | 39 | % |
| (a) | Per share net investment income has been calculated using the average shares outstanding during the period. |
| (b) | Amount rounds to less than $0.01 per share. |
| (c) | The amount shown for a share outstanding does not correspond with the aggregate realized and unrealized gain (loss) on investments for the period due to the timing of sales and redemptions of fund shares in relation to fluctuating market values of investments of the Fund. |
| (d) | Includes fee/expense recovery of less than 0.01%. |
| (e) | Includes corporate tax expenses of 0.03%. Without this expense the ratio of net expenses would have been 0.59%. |
| (f) | The variation in the Fund’s turnover rate from 2015 to 2016 was primarily due to fluctuation in the level of fund assets due to shareholder flows. |
See accompanying notes to financial statements.
| 78
Notes to Financial Statements
September 30, 2017
1. Organization. Loomis Sayles Funds I and Loomis Sayles Funds II (the “Trusts” and each a “Trust”) are each organized as a Massachusetts business trust. Each Trust is registered under the Investment Company Act of 1940, as amended (the “1940 Act”), as an open-end management investment company. Each Declaration of Trust permits the Board of Trustees to authorize the issuance of an unlimited number of shares of the Trust in multiple series. The financial statements for certain funds of the Trusts are presented in separate reports. The following funds (individually, a “Fund” and collectively, the “Funds”) are included in this report:
Loomis Sayles Funds I:
Loomis Sayles Intermediate Duration Bond Fund (the “Intermediate Duration Bond Fund”)
Loomis Sayles Funds II:
Loomis Sayles High Income Fund (the “High Income Fund”)
Loomis Sayles Limited Term Government and Agency Fund (the “Limited Term Government and Agency Fund”)
Each Fund is a diversified investment company.
The Funds each offer Class A, Class C and Class Y shares. In addition, High Income Fund and Limited Term Government and Agency Fund began offering Class N shares effective November 30, 2016 and February 1, 2017, respectively. Class T shares of the Funds are not currently available for purchase. As of the close of business on January 11, 2016, Class B shares of High Income Fund and Limited Term Government and Agency Fund were converted into Class A shares and are no longer offered.
Class A shares of Intermediate Duration Bond Fund and High Income Fund are sold with a maximum front-end sales charge of 4.25%. Class A shares of Limited Term Government and Agency Fund are sold with a maximum front-end sales charge of 2.25%. Class C shares do not pay a front-end sales charge, do not convert to any other class of shares, pay higher Rule 12b-1 fees than Class A shares and may be subject to a CDSC of 1.00% if those shares are redeemed within one year of acquisition, except for reinvested distributions. Class N and Class Y shares do not pay a front-end sales charge, a CDSC or Rule 12b-1 fees. Class N shares are offered with an initial minimum investment of $1,000,000. Class Y shares are offered with an initial minimum investment of $100,000. Certain categories of investors are exempted from the minimum investment amounts for Class N and Class Y as outlined in the relevant Funds’ prospectus.
Most expenses can be directly attributed to a Fund. Expenses which cannot be directly attributed to a Fund are generally apportioned based on the relative net assets of each of the funds in Natixis Funds Trust I, Natixis Funds Trust II, Natixis Funds Trust IV and Gateway Trust (“Natixis Funds Trusts”), Loomis Sayles Funds I and Loomis Sayles Funds II (“Loomis Sayles Funds Trusts”), and Natixis ETF Trust. Expenses of a Fund are borne pro rata by the holders of each class of shares, except that each class bears expenses unique to that class (such as the Rule 12b-1 fees applicable to Class A and
79 |
Notes to Financial Statements (continued)
September 30, 2017
Class C) and transfer agent fees for High Income Fund and Limited Term Government and Agency Fund are borne collectively for Class A, Class C and Class Y, and individually for Class N. In addition, each class votes as a class only with respect to its own Rule 12b-1 Plan. Shares of each class would receive their pro rata share of the net assets of a Fund if the Fund were liquidated. The Trustees approve separate distributions from net investment income on each class of shares.
2. Significant Accounting Policies. The following is a summary of significant accounting policies consistently followed by each Fund in the preparation of its financial statements. The Funds’ financial statements follow the accounting and reporting guidelines provided for investment companies and are prepared in accordance with accounting principles generally accepted in the United States of America which require the use of management estimates that affect the reported amounts and disclosures in the financial statements. Actual results could differ from those estimates. Management has evaluated the events and transactions subsequent to year-end through the date the financial statements were issued and has determined that there were no material events that would require disclosure in the Funds’ financial statements.
a. Valuation. Fund securities and other investments are valued at market value based on market quotations obtained or determined by independent pricing services recommended by the adviser and approved by the Board of Trustees. Fund securities and other investments for which market quotations are not readily available are valued at fair value as determined in good faith by the adviser pursuant to procedures approved by the Board of Trustees, as described below. Market value is determined as follows:
Debt securities and unlisted preferred equity securities are valued based on evaluated bids furnished to the Fund by an independent pricing service or bid prices obtained from broker-dealers. Senior loans are valued at bid prices supplied by an independent pricing service, if available. Listed equity securities (including shares of closed-end investment companies and exchange-traded funds) are valued at the last sale price quoted on the exchange where they are traded most extensively or, if there is no reported sale during the day, the closing bid quotation as reported by an independent pricing service. Securities traded on the NASDAQ Global Select Market, NASDAQ Global Market and NASDAQ Capital Market are valued at the NASDAQ Official Closing Price (“NOCP”), or if lacking an NOCP, at the most recent bid quotations on the applicable NASDAQ Market. Unlisted equity securities (except unlisted preferred equity securities) are valued at the last sale price quoted in the market where they are traded most extensively or, if there is no reported sale during the day, the closing bid quotation as reported by an independent pricing service. If there is no last sale price or closing bid quotation available, unlisted equity securities will be valued using evaluated bids furnished by an independent pricing service, if available. In some foreign markets, an official close price and a last sale price may be available from the foreign exchange
| 80
Notes to Financial Statements (continued)
September 30, 2017
or market. In those cases, the official close price is used. Broker-dealer bid prices may be used to value debt and unlisted equity securities and senior loans where an independent pricing service is unable to price a security or where an independent pricing service does not provide a reliable price for the security. Forward foreign currency contracts are valued utilizing interpolated rates determined based on information provided by an independent pricing service. Futures contracts are valued at the most recent settlement price on the exchange on which the adviser believes that, over time, they are traded most extensively. Centrally cleared credit default swap agreements are valued at settlement prices of the clearinghouse on which the contracts were traded or prices obtained from broker-dealers. Bilateral credit default swaps are valued based on mid prices (between the bid price and the ask price) supplied by an independent pricing service.
Fund securities and other investments for which market quotations are not readily available are valued at fair value as determined in good faith by the adviser pursuant to procedures approved by the Board of Trustees. The Funds may also value securities and other investments at fair value in other circumstances such as when extraordinary events occur after the close of a foreign market but prior to the close of the New York Stock Exchange (“NYSE”). This may include situations relating to a single issuer (such as a declaration of bankruptcy or a delisting of the issuer’s security from the primary market on which it has traded) as well as events affecting the securities markets in general (such as market disruptions or closings and significant fluctuations in U.S. and/or foreign markets). When fair valuing its securities or other investments, the Funds may, among other things, use modeling tools or other processes that may take into account factors such as securities or other market activity and/or significant events that occur after the close of the foreign market and before the time the Fund’s net asset value (“NAV”) is calculated. Fair value pricing may require subjective determinations about the value of a security, and fair values used to determine a Fund’s NAV may differ from quoted or published prices, or from prices that are used by others, for the same securities. In addition, the use of fair value pricing may not always result in adjustments to the prices of securities held by a Fund.
Illiquid securities for which market quotations are readily available and have been evaluated by the adviser are considered and classified as fair valued securities pursuant to the Funds’ pricing policies and procedures.
As of September 30, 2017, securities held by the Funds were fair valued as follows:
| | | | | | | | | | | | | | | | |
Fund | | Securities
classified as
fair valued | | | Percentage of
Net Assets | | | Securities fair
valued by the
Fund’s adviser | | | Percentage of Net Assets | |
High Income Fund | | $ | 3,391,903 | | | | 1.9 | % | | $ | 2,031,952 | | | | 1.1 | % |
Limited Term Government and Agency Fund | | | — | | | | — | | | | 274,554 | | | | Less than 0.1 | % |
81 |
Notes to Financial Statements (continued)
September 30, 2017
b. Investment Transactions and Related Investment Income. Investment transactions are accounted for on a trade date plus one day basis for daily NAV calculation. However, for financial reporting purposes, investment transactions are reported on trade date. Dividend income is recorded on ex-dividend date, or in the case of certain foreign securities, as soon as a Fund is notified, and interest income is recorded on an accrual basis. Interest income is increased by the accretion of discount and decreased by the amortization of premium, if applicable. Periodic principal adjustments for inflation-protected securities are recorded to interest income. Negative principal adjustments (in the event of deflation) are recorded as reductions of interest income to the extent of interest income earned, not to exceed the amount of positive principal adjustments on a cumulative basis. In determining net gain or loss on securities sold, the cost of securities has been determined on an identified cost basis. Investment income, non-class specific expenses and realized and unrealized gains and losses are allocated on a pro rata basis to each class based on the relative net assets of each class to the total net assets of the Fund.
c. Foreign Currency Translation. The books and records of the Funds are maintained in U.S. dollars. The values of securities, currencies and other assets and liabilities denominated in currencies other than U.S. dollars are translated into U.S. dollars based upon foreign exchange rates prevailing at the end of the period. Purchases and sales of investment securities, income and expenses are translated into U.S. dollars on the respective dates of such transactions.
Net realized foreign exchange gains or losses arise from sales of foreign currency, changes in exchange rates between the trade and settlement dates on securities transactions and the difference between the amounts of dividends, interest and foreign withholding taxes recorded on the Fund’s books and the U.S. dollar equivalent of the amounts actually received or paid. Net unrealized foreign exchange gains or losses arise from changes in the value of assets and liabilities, other than investment securities, as of the end of the fiscal period, resulting from changes in exchange rates. Net realized foreign exchange gains or losses and the net change in unrealized foreign exchange gains or losses are disclosed in the Statements of Operations. For federal income tax purposes, net realized foreign exchange gains or losses are characterized as ordinary income and may, if the funds have net losses, reduce the amount of income available to be distributed by the Funds.
The values of investment securities are presented at the foreign exchange rates prevailing at the end of the period for financial reporting purposes. Net realized and unrealized gains or losses on investments reported in the Statements of Operations reflect gains or losses resulting from changes in exchange rates and fluctuations which arise due to changes in market prices of investment securities. For federal income tax purposes, a portion of the net realized gain or loss on investments arising from changes in exchange rates, which is reflected in the Statements of Operations,
| 82
Notes to Financial Statements (continued)
September 30, 2017
may be characterized as ordinary income and may, if the Funds have net losses, reduce the amount of income available to be distributed by the Funds.
During the year ended September 30, 2017, the amount of income available to be distributed by High Income Fund has been reduced by $876,336, as a result of losses arising from changes in exchange rates.
The Funds may use foreign currency exchange contracts to facilitate transactions in foreign-denominated investments. Losses may arise from changes in the value of the foreign currency or if the counterparties do not perform under the contracts’ terms.
d. Forward Foreign Currency Contracts. The Funds may enter into forward foreign currency contracts, including forward foreign cross currency contracts to acquire exposure to foreign currencies or to hedge the Funds’ investments against currency fluctuation. A contract can also be used to offset a previous contract. These contracts involve market risk in excess of the unrealized gain or loss reflected in the Funds’ Statements of Assets and Liabilities. The U.S. dollar value of the currencies a Fund has committed to buy or sell represents the aggregate exposure to each currency a Fund has acquired or hedged through currency contracts outstanding at period end. Gains or losses are recorded for financial statement purposes as unrealized until settlement date. Contracts are traded over-the-counter directly with a counterparty. Risks may arise upon entering into these contracts from the potential inability of counterparties to meet the terms of their contracts and from unanticipated movements in the value of a foreign currency relative to the U.S. dollar. Certain contracts may require the movement of cash and/or securities as collateral for the Funds’ or counterparty’s net obligations under the contracts.
e. Futures Contracts. The Funds may enter into futures contracts. Futures contracts are agreements between two parties to buy and sell a particular instrument or index for a specified price on a specified future date.
When a Fund enters into a futures contract, it is required to deposit with (or for the benefit of) its broker an amount of cash or short-term high-quality securities as “initial margin.” As the value of the contract changes, the value of the futures contract position increases or declines. Subsequent payments, known as “variation margin,” are made or received by a Fund, depending on the price fluctuations in the fair value of the contract and the value of cash or securities on deposit with the broker. The aggregate principal amounts of the contracts are not recorded in the financial statements. Fluctuations in the value of the contracts are recorded in the Statements of Assets and Liabilities as an asset (liability) and in the Statements of Operations as unrealized appreciation (depreciation) until the contracts are closed, when they are recorded as realized gains (losses). Realized gain or loss on a futures position is equal to the difference between the value of the contract at the time it was opened and the value at the time it was closed, minus brokerage commissions. When a Fund enters into a futures contract certain risks may arise, such as illiquidity in the futures market,
83 |
Notes to Financial Statements (continued)
September 30, 2017
which may limit a Fund’s ability to close out a futures contract prior to settlement date, and unanticipated movements in the value of securities or interest rates.
Futures contracts are exchange-traded. Exchange-traded futures contracts are standardized and are settled through a clearing house with fulfillment supported by the credit of the exchange. Therefore, counterparty credit risks to the Funds are reduced; however, in the event that a counterparty enters into bankruptcy, a Fund’s claim against initial/variation margin on deposit with the counterparty may be subject to terms of a final settlement in bankruptcy court.
f. Swap Agreements. The Funds may enter into credit default swaps. A credit default swap is an agreement between two parties (the “protection buyer” and “protection seller”) to exchange the credit risk of an issuer (“reference obligation”) for a specified time period. The reference obligation may be one or more debt securities or an index of such securities. The Funds may be either the protection buyer or the protection seller. As a protection buyer, the Funds have the ability to hedge the downside risk of an issuer or group of issuers. As a protection seller, the Funds have the ability to gain exposure to an issuer or group of issuers whose bonds are unavailable or in short supply in the cash bond market, as well as realize additional income in the form of fees paid by the protection buyer. The protection buyer is obligated to pay the protection seller a stream of payments (“fees”) over the term of the contract, provided that no credit event, such as a default or a downgrade in credit rating, occurs on the reference obligation. The Funds may also pay or receive upfront premiums. If a credit event occurs, the protection seller must pay the protection buyer the difference between the agreed upon notional value and market value of the reference obligation. Market value in this case is determined by a facilitated auction whereby a minimum number of allowable broker bids, together with a specified valuation method, are used to calculate the value. The maximum potential amount of undiscounted future payments that a Fund as the protection seller could be required to make under a credit default swap agreement would be an amount equal to the notional amount of the agreement.
The notional amounts of swap agreements are not recorded in the financial statements. Swap agreements are valued daily and fluctuations in the value are recorded in the Statements of Operations as change in unrealized appreciation (depreciation) on swap agreements. Fees are accrued in accordance with the terms of the agreement and are recorded in the Statement of Assets and Liabilities as fees receivable or payable. When received or paid, fees are recorded in the Statement of Operations as realized gain or loss. Upfront premiums paid or received by the Funds are recorded on the Statements of Assets and Liabilities as an asset or liability, respectively, and are amortized or accreted over the term of the agreement and recorded as realized gain or loss. Payments made or received by the Funds as a result of a credit event or termination of the agreement are recorded as realized gain or loss.
| 84
Notes to Financial Statements (continued)
September 30, 2017
Swap agreements are privately negotiated in the over-the-counter (“OTC”) market and may be entered into as a bilateral contract or centrally cleared (“centrally cleared swaps”). Bilateral swap agreements are traded between counterparties and, as such, are subject to the risk that a party to the agreement will not be able to meet its obligations. In a centrally cleared swap, immediately following execution of the swap agreement, the swap agreement is novated to a central counterparty (the “CCP”) and the Fund faces the CCP through a broker. Upon entering into a centrally cleared swap, the Fund is required to deposit initial margin with the broker in the form of cash or securities in an amount that varies depending on the size and risk profile of the particular swap. Subsequent payments, known as “variation margin,” are made or received by the Fund based on the daily change in the value of the centrally cleared swap agreement. For centrally cleared swaps, the Fund’s counterparty credit risk is reduced as the CCP stands between the Fund and the counterparty. The Funds cover their net obligations under outstanding swap agreements by segregating or earmarking cash or securities.
No swap agreements were held by the Funds during the year ended September 30, 2017.
g. When-Issued and Delayed Delivery Transactions. The Funds may enter into when-issued or delayed delivery transactions. When-issued refers to transactions made conditionally because a security, although authorized, has not been issued. Delayed delivery refers to transactions for which delivery or payment will occur at a later date, beyond the normal settlement period. The price of when-issued and delayed delivery securities and the date when the securities will be delivered and paid for are fixed at the time the transaction is negotiated. The security and the obligation to pay for it are recorded by the Funds at the time the commitment is entered into. The value of the security may vary with market fluctuations during the time before the Funds take delivery of the security. No interest accrues to the Funds until the transaction settles.
Delayed delivery transactions include those designated as To Be Announced (“TBAs”) in the Portfolios of Investments. For TBAs, the actual security that will be delivered to fulfill the transaction is not designated at the time of the trade. The security is “to be announced” 48 hours prior to the established trade settlement date. Certain transactions require the Funds or counterparty to post cash and/or securities as collateral for the net mark-to-market exposure to the other party. The Funds cover their net obligations under outstanding delayed delivery commitments by segregating or earmarking cash or securities at the custodian.
Purchases of when-issued or delayed delivery securities may have a similar effect on the Funds’ NAV as if the Funds’ had created a degree of leverage in the portfolio. Risks may arise upon entering into such transactions from the potential inability of counterparties to meet their obligations under the transactions. Additionally, losses may arise due to changes in the value of the underlying securities.
85 |
Notes to Financial Statements (continued)
September 30, 2017
There were no when-issued or delayed delivery securities held by the Funds as of September 30, 2017.
h. Federal and Foreign Income Taxes. The Trusts treat each Fund as a separate entity for federal income tax purposes. Each Fund intends to meet the requirements of the Internal Revenue Code of 1986, as amended, applicable to regulated investment companies, and to distribute to its shareholders substantially all of its net investment income and any net realized capital gains at least annually. Management has performed an analysis of each Fund’s tax positions for the open tax years as of September 30, 2017 and has concluded that no provisions for income tax are required. The Funds’ federal tax returns for the prior three fiscal years remain subject to examination by the Internal Revenue Service. Management is not aware of any events that are reasonably possible to occur in the next twelve months that would result in the amounts of any unrecognized tax benefits significantly increasing or decreasing for the Funds. However, management’s conclusions regarding tax positions taken may be subject to review and adjustment at a later date based on factors including, but not limited to, new tax laws and accounting regulations and interpretations thereof.
A Fund may be subject to foreign withholding taxes on investment income and taxes on capital gains on investments that are accrued and paid based upon the Fund’s understanding of the tax rules and regulations that exist in the countries in which the Fund invests. Foreign withholding taxes on dividend and interest income are reflected on the Statements of Operations as a reduction of investment income, net of amounts eligible to be reclaimed. Dividends and interest receivable on the Statements of Assets and Liabilities are net of foreign withholding taxes. Foreign withholding taxes where reclaims have been or will be filed are reflected on the Statements of Assets and Liabilities as tax reclaims receivable. Capital gains taxes paid are included in net realized gain (loss) on investments in the Statements of Operations. Accrued but unpaid capital gains taxes are reflected as foreign taxes payable on the Statements of Assets and Liabilities, if applicable, and reduce unrealized gains on investments. In the event that realized gains on investments are subsequently offset by realized losses, taxes paid on realized gains may be returned to a Fund. Such amounts, if applicable, are reflected as foreign tax rebates receivable on the Statements of Assets and Liabilities and are recorded as a realized gain when received.
i. Dividends and Distributions to Shareholders. Dividends and distributions are recorded on ex-dividend date. The timing and characterization of certain income and capital gain distributions are determined in accordance with federal tax regulations, which may differ from accounting principles generally accepted in the United States of America. Permanent differences are primarily due to differing treatments for book and tax purposes of items such as foreign currency gains and losses, corporate actions, premium amortization, defaulted and/or non-income producing securities, paydown gains and losses, return of capital distributions received, convertible bonds and distribution re-designations. Permanent book and tax basis differences relating to
| 86
Notes to Financial Statements (continued)
September 30, 2017
shareholder distributions will result in reclassifications to capital accounts. Temporary differences between book and tax distributable earnings are primarily due to deferred Trustees’ fees, wash sales, premium amortization, futures contracts mark-to-market, corporate actions, contingent payment debt instruments, convertible bonds, defaulted and/or non-income producing securities and return of capital distributions received. Amounts of income and capital gain available to be distributed on a tax basis are determined annually, and at other times during the Funds’ fiscal year as may be necessary to avoid knowingly declaring and paying a return of capital distribution. Distributions from net investment income and short-term capital gains are considered to be distributed from ordinary income for tax purposes.
The tax characterization of distributions is determined on an annual basis. The tax character of distributions paid to shareholders during the years ended September 30, 2017 and 2016 was as follows:
| | | | | | | | | | | | |
| | | 2017 Distributions Paid From: | |
Fund | | Ordinary Income | | | Long-Term
Capital Gains | | | Total | |
High Income Fund | | $ | 8,205,898 | | | $ | — | | | $ | 8,205,898 | |
Intermediate Duration Bond Fund | | | 4,972,573 | | | | 39,533 | | | | 5,012,106 | |
Limited Term Government and Agency Fund | | | 13,667,184 | | | | — | | | | 13,667,184 | |
| | | | | | | | | | | | |
| | | 2016 Distributions Paid From: | |
Fund | | Ordinary
Income | | | Long-Term
Capital Gains | | | Total | |
High Income Fund | | $ | 6,619,464 | | | $ | 396,248 | | | $ | 7,015,712 | |
Intermediate Duration Bond Fund | | | 3,295,835 | | | | — | | | | 3,295,835 | |
Limited Term Government and Agency Fund | | | 13,653,659 | | | | — | | | | 13,653,659 | |
Differences between these amounts and those reported in the Statements of Changes in Net Assets are primarily attributable to different book and tax treatment for short-term capital gains.
87 |
Notes to Financial Statements (continued)
September 30, 2017
As of September 30, 2017, the components of distributable earnings on a tax basis were as follows:
| | | | | | | | | | | | |
| | | High
Income
Fund | | | Intermediate
Duration
Bond
Fund | | | Limited
Term
Government
and
Agency
Fund | |
Undistributed ordinary income | | $ | — | | | $ | 78,076 | | | $ | 895,518 | |
Capital loss carryforward: | | | | | | | | | | | | |
Short-term: | |
No expiration date | | | — | | | | — | | | | (1,659,130 | ) |
Long-term: | |
No expiration date | | | (1,006,154 | ) | | | — | | | | (20,182,527 | ) |
| | | | | | | | | | | | |
Total capital loss carryforward | | | (1,006,154 | ) | | | — | | | | (21,841,657 | ) |
| | | | | | | | | | | | |
Late-year ordinary and post-October* capital loss deferrals | | | (2,258 | ) | | | (1,131,587 | ) | | | — | |
| | | | | | | | | | | | |
Unrealized appreciation (depreciation) | | | 703,961 | | | | (200,880 | ) | | | (8,632,541 | ) |
| | | | | | | | | | | | |
Total accumulated losses | | $ | (304,451 | ) | | $ | (1,254,391 | ) | | $ | (29,578,680 | ) |
| | | | | | | | | | | | |
Capital loss carryforward utilized in the current year | | $ | 1,559,466 | | | $ | — | | | $ | — | |
| | | | | | | | | | | | |
| * | Under current tax law, capital losses, foreign currency losses, and losses on passive foreign investment companies and contingent payment debt instruments after October 31 or December 31, as applicable, may be deferred and treated as occurring on the first day of the following taxable year. High Income Fund and Intermediate Duration Bond Fund are deferring foreign currency losses and capital losses, respectfully. |
As of September 30, 2017, unrealized appreciation (depreciation) on a tax basis was as follows:
| | | | | | | | | | | | |
| | | High
Income
Fund | | | Intermediate
Duration Bond
Fund | | | Limited
Term
Government
and
Agency
Fund | |
Unrealized appreciation (depreciation) | | | | | | | | | | | | |
Investments | | $ | 1,668,247 | | | $ | (200,880 | ) | | $ | (8,632,541 | ) |
Foreign currency translations | | | (964,286 | ) | | | — | | | | — | |
| | | | | | | | | | | | |
Total unrealized appreciation (depreciation) | | $ | 703,961 | | | $ | (200,880 | ) | | $ | (8,632,541 | ) |
| | | | | | | | | | | | |
| 88
Notes to Financial Statements (continued)
September 30, 2017
As of September 30, 2017, the cost of investments (including derivatives, if applicable) and unrealized appreciation (depreciation) on a federal tax basis were as follows:
| | | | | | | | | | | | |
| | | High
Income
Fund | | | Intermediate
Duration
Bond
Fund | | | Limited
Term
Government
and
Agency
Fund | |
Federal tax cost | | $ | 175,907,444 | | | $ | 180,510,932 | | | $ | 790,981,766 | |
| | | | | | | | | | | | |
Gross tax appreciation | | $ | 9,974,653 | | | $ | 746,282 | | | $ | 2,717,960 | |
Gross tax depreciation | | | (9,270,082 | ) | | | (947,162 | ) | | | (11,350,501 | ) |
| | | | | | | | | | | | |
Net tax appreciation (depreciation) | | $ | 704,571 | | | $ | (200,880 | ) | | $ | (8,632,541 | ) |
| | | | | | | | | | | | |
Differences between these amounts and those reported in the components of distributable earnings are primarily attributable to unrealized foreign exchange gains or losses.
j. Repurchase Agreements. Each Fund may enter into repurchase agreements, under the terms of a Master Repurchase Agreement, under which each Fund acquires securities as collateral and agrees to resell the securities at an agreed upon time and at an agreed upon price. It is each Fund’s policy that the market value of the collateral for repurchase agreements be at least equal to 102% of the repurchase price, including interest. Certain repurchase agreements are tri-party arrangements whereby the collateral is held in a segregated account for the benefit of the Fund and on behalf of the counterparty. Repurchase agreements could involve certain risks in the event of default or insolvency of the counterparty, including possible delays or restrictions upon a Fund’s ability to dispose of the underlying securities. As of September 30, 2017, each Fund, as applicable, had investments in repurchase agreements for which the value of the related collateral exceeded the value of the repurchase agreement. The gross value of repurchase agreements is included in the Statements of Assets and Liabilities for financial reporting purposes.
k. Due from Brokers. Transactions and positions in certain forward foreign currency contracts are maintained and cleared by registered U.S. broker/dealers pursuant to customer agreements between the Funds and the various broker/dealers. The due from broker balance in the Statement of Assets and Liabilities for Intermediate Duration Bond Fund represents cash pledged as initial margin for futures contracts. In certain circumstances the Fund’s use of cash held at brokers is restricted by regulation or broker mandated limits.
l. Securities Lending. The Funds have entered into an agreement with State Street Bank and Trust Company (“State Street Bank”), as agent of the Funds, to lend securities to certain designated borrowers. The loans are collateralized with cash or securities in an amount equal to at least 105% or 102% of the market value (including
89 |
Notes to Financial Statements (continued)
September 30, 2017
accrued interest) of the loaned international or domestic securities, respectively, when the loan is initiated. Thereafter, the value of the collateral must remain at least 102% of the market value (including accrued interest) of loaned securities for U.S. equities and U.S. corporate debt; at least 105% of the market value (including accrued interest) of loaned securities for non-U.S. equities; and at least 100% of the market value (including accrued interest) of loaned securities for U.S. Government securities, sovereign debt issued by non-U.S. Governments and non-U.S. corporate debt. In the event that the market value of the collateral falls below the required percentages described above, the borrower will deliver additional collateral on the next business day. As with other extensions of credit, the Funds may bear the risk of loss with respect to the investment of the collateral. The Funds invest cash collateral in short-term investments, a portion of the income from which is remitted to the borrowers and the remainder allocated between the Funds and State Street Bank as lending agent.
For the year ended September 30, 2017, none of the Funds had loaned securities under this agreement.
m. Indemnifications. Under the Trusts’ organizational documents, their officers and Trustees are indemnified against certain liabilities arising out of the performance of their duties to the Funds. Additionally, in the normal course of business, the Funds enter into contracts with service providers that contain general indemnification clauses. The Funds’ maximum exposure under these arrangements is unknown as this would involve future claims that may be made against the Funds that have not yet occurred. However, based on experience, the Funds expect the risk of loss to be remote.
3. Fair Value Measurements. In accordance with accounting standards related to fair value measurements and disclosures, the Funds have categorized the inputs utilized in determining the value of each Fund’s assets or liabilities. These inputs are summarized in the three broad levels listed below:
| | • | | Level 1 – quoted prices in active markets for identical assets or liabilities; |
| | • | | Level 2 – prices determined using other significant inputs that are observable either directly, or indirectly through corroboration with observable market data (which could include quoted prices for similar assets or liabilities, interest rates, credit risk, etc.); and |
| | • | | Level 3 – prices determined using significant unobservable inputs when quoted prices or observable inputs are unavailable such as when there is little or no market activity for an asset or liability (unobservable inputs reflect each Fund’s own assumptions in determining the fair value of assets or liabilities and would be based on the best information available). |
The inputs or methodology used for valuing securities are not necessarily an indication of the risk associated with investing in those securities.
| 90
Notes to Financial Statements (continued)
September 30, 2017
The Funds’ pricing policies and procedures are recommended by the adviser and approved by the Board of Trustees. Debt securities are valued based on evaluated bids furnished to the Funds by an independent pricing service. Broker-dealer bid prices may be used if an independent pricing service either is unable to price a security or does not provide a reliable price for a security. Broker-dealer bid prices for which the Funds do not have knowledge of the inputs used by the broker-dealer are categorized in Level 3. All security prices, including those obtained from an independent pricing service and broker-dealer bid prices, are reviewed on a daily basis by the adviser, subject to oversight by Fund management and the Board of Trustees. If the adviser, in good faith, believes that the price provided by an independent pricing service is unreliable, broker-dealer bid prices may be used until the price provided by the independent pricing service is considered to be reliable. Reliability of all security prices, including those obtained from an independent pricing service and broker-dealer bid prices, is tested in a variety of ways, including comparison to recent transaction prices and daily fluctuations, amongst other validation procedures in place. Securities for which market quotations are not readily available are valued at fair value as determined in good faith by the Funds’ adviser pursuant to procedures approved by the Board of Trustees. Fair valued securities may be categorized in Level 3.
The following is a summary of the inputs used to value the Funds’ investments as of September 30, 2017, at value:
High Income Fund
Asset Valuation Inputs
| | | | | | | | | | | | | | | | |
Description | | Level 1 | | | Level 2 | | | Level 3 | | | Total | |
Bonds and Notes | | | | | | | | | | | | | | | | |
Non-Convertible Bonds | | | | | | | | | | | | | | | | |
Home Construction | | $ | — | | | $ | 3,676,711 | | | $ | 12 | (c) | | $ | 3,676,723 | |
Non-Agency Commercial Mortgage-Backed Securities | | | — | | | | 1,513,686 | | | | 939,675 | (b) | | | 2,453,361 | |
All Other Non-Convertible Bonds(a) | | | — | | | | 140,072,079 | | | | — | | | | 140,072,079 | |
| | | | | | | | | | | | | | | | |
Total Non-Convertible Bonds | | | — | | | | 145,262,476 | | | | 939,687 | | | | 146,202,163 | |
| | | | | | | | | | | | | | | | |
Convertible Bonds(a) | | | — | | | | 15,728,355 | | | | — | | | | 15,728,355 | |
| | | | | | | | | | | | | | | | |
Total Bonds and Notes | | | — | | | | 160,990,831 | | | | 939,687 | | | | 161,930,518 | |
| | | | | | | | | | | | | | | | |
91 |
Notes to Financial Statements (continued)
September 30, 2017
High Income Fund (continued)
Asset Valuation Inputs (continued)
| | | | | | | | | | | | | | | | |
Description | | Level 1 | | | Level 2 | | | Level 3 | | | Total | |
Senior Loans | | $ | — | | | $ | 1,320,443 | | | $ | — | | | $ | 1,320,443 | |
Preferred Stocks | | | | | | | | | | | | | | | | |
Convertible Preferred Stocks | | | | | | | | | | | | | | | | |
Food & Beverage | | | — | | | | 958,086 | | | | — | | | | 958,086 | |
Midstream | | | — | | | | 693,227 | | | | — | | | | 693,227 | |
All Other Convertible Preferred Stocks(a) | | | 204,125 | | | | — | | | | — | | | | 204,125 | |
| | | | | | | | | | | | | | | | |
Total Convertible Preferred Stocks | | | 204,125 | | | | 1,651,313 | | | | — | | | | 1,855,438 | |
| | | | | | | | | | | | | | | | |
Non-Convertible Preferred Stocks(a) | | | 527,723 | | | | — | | | | — | | | | 527,723 | |
| | | | | | | | | | | | | | | | |
Total Preferred Stocks | | | 731,848 | | | | 1,651,313 | | | | — | | | | 2,383,161 | |
| | | | | | | | | | | | | | | | |
Other Investments(a) | | | — | | | | — | | | | 1,853,562 | (d) | | | 1,853,562 | |
Common Stocks | | | | | | | | | | | | | | | | |
Media | | | — | | | | — | | | | 23,855 | (d) | | | 23,855 | |
Oil, Gas & Consumable Fuels | | | 2,350,649 | | | | — | | | | 154,523 | (d) | | | 2,505,172 | |
All Other Common Stocks(a) | | | 353,056 | | | | — | | | | — | | | | 353,056 | |
| | | | | | | | | | | | | | | | |
Total Common Stocks | | | 2,703,705 | | | | — | | | | 178,378 | | | | 2,882,083 | |
| | | | | | | | | | | | | | | | |
Warrants | | | 1,940 | | | | — | | | | — | (e) | | | 1,940 | |
Short-Term Investments | | | — | | | | 6,240,308 | | | | — | | | | 6,240,308 | |
| | | | | | | | | | | | | | | | |
Total | | $ | 3,437,493 | | | $ | 170,202,895 | | | $ | 2,971,627 | | | $ | 176,612,015 | |
| | | | | | | | | | | | | | | | |
| (a) | Details of the major categories of the Fund’s investments are reflected within the Portfolio of Investments. |
| (b) | Valued using broker-dealer bid prices. |
| (c) | Fair valued by the Fund’s adviser. |
| (d) | Fair valued by the Fund’s adviser using broker-dealer bid prices for which the inputs are unobservable to the Fund. |
| (e) | Includes a security fair valued at zero using Level 3 inputs. |
A preferred stock valued at $324,791 was transferred from Level 1 to Level 2 during the period ended September 30, 2017. At September 30, 2016, this security was valued at the last sale price in accordance with the Fund’s valuation policies. At September 30, 2017, this security was valued on the basis of evaluated bids furnished to the Fund by an independent pricing service as a market price was not available.
All transfers are recognized as of the beginning of the reporting period.
| 92
Notes to Financial Statements (continued)
September 30, 2017
Intermediate Duration Bond Fund
Asset Valuation Inputs
| | | | | | | | | | | | | | | | |
Description | | Level 1 | | | Level 2 | | | Level 3 | | | Total | |
Bonds and Notes(a) | | $ | — | | | $ | 177,917,265 | | | $ | — | | | $ | 177,917,265 | |
Short-Term Investments | | | — | | | | 2,392,787 | | | | — | | | | 2,392,787 | |
| | | | | | | | | | | | | | | | |
Total | | $ | — | | | $ | 180,310,052 | | | $ | — | | | $ | 180,310,052 | |
| | | | | | | | | | | | | | | | |
Liability Valuation Inputs
| | | | | | | | | | | | | | | | |
Description | | Level 1 | | | Level 2 | | | Level 3 | | | Total | |
Futures Contracts (unrealized depreciation) | | | $ (103,275 | ) | | $ | — | | | $ | — | | | | $ (103,275 | ) |
| | | | | | | | | | | | | | | | |
| (a) | Details of the major categories of the Fund’s investments are reflected within the Portfolio of Investments. |
Limited Term Government and Agency Fund
Asset Valuation Inputs
| | | | | | | | | | | | | | | | |
Description | | Level 1 | | | Level 2 | | | Level 3 | | | Total | |
Bonds and Notes | | | | | | | | | | | | | | | | |
Collateralized Mortgage Obligations | | $ | — | | | $ | 119,518,153 | | | $ | 274,554 | (b) | | $ | 119,792,707 | |
All Other Non-Convertible Bonds(a) | | | — | | | | 566,385,175 | | | | — | | | | 566,385,175 | |
| | | | | | | | | | | | | | | | |
Total Bonds and Notes | | | — | | | | 685,903,328 | | | | 274,554 | | | | 686,177,882 | |
| | | | | | | | | | | | | | | | |
Short-Term Investments | | | — | | | | 96,171,343 | | | | — | | | | 96,171,343 | |
| | | | | | | | | | | | | | | | |
Total | | $ | — | | | $ | 782,074,671 | | | $ | 274,554 | | | $ | 782,349,225 | |
| | | | | | | | | | | | | | | | |
| (a) | Details of the major categories of the Fund’s investments are reflected within the Portfolio of Investments. |
| (b) | Fair valued by the Fund’s adviser. |
93 |
Notes to Financial Statements (continued)
September 30, 2017
The following is a reconciliation of Level 3 investments for which significant unobservable inputs were used to determine fair value as of September 30, 2016 and/or September 30, 2017:
High Income Fund
Asset Valuation Inputs
| | | | | | | | | | | | | | | | | | | | |
Investments in Securities | | Balance
as of
September 30,
2016 | | | Accrued
Discounts
(Premiums) | | | Realized
Gain
(Loss) | | | Change in
Unrealized
Appreciation
(Depreciation) | | | Purchases | |
Bonds and Notes | | | | | | | | | | | | | | | | | | | | |
Non-Convertible Bonds | | | | | | | | | | | | | | | | | | | | |
ABS Home Equity | | $ | 98,704 | | | $ | — | | | $ | — | | | $ | — | | | $ | — | |
Government Owned - No Guarantee | | | 594,150 | | | | — | | | | — | | | | — | | | | — | |
Home Construction | | | 23 | | | | 24,356 | | | | (1,039,996 | ) | | | 1,015,651 | | | | — | |
Non-Agency Commercial Mortgage-Backed Securities | | | 908,874 | | | | — | | | | — | | | | 30,801 | | | | — | |
Senior Loans | | | | | | | | | | | | | | | | | | | | |
Wirelines | | | 150,561 | | | | 57 | | | | 550 | | | | 8,156 | | | | — | |
Other Investments | | | | | | | | | | | | | | | | | | | | |
Aircraft ABS | | | 985,586 | | | | — | | | | — | | | | 26,476 | | | | 1,841,500 | |
Common Stocks | | | | | | | | | | | | | | | | | | | | |
Media | | | 8,177 | | | | — | | | | — | | | | 15,678 | | | | — | |
Oil, Gas & Consumable Fuels | | | — | | | | — | | | | (69 | ) | | | (1,036,840 | ) | | | 1,191,432 | |
Warrants | | | 5,383 | | | | — | | | | — | | | | — | | | | — | |
| | | | | | | | | | | | | | | | | | | | |
Total | | $ | 2,751,458 | | | $ | 24,413 | | | $ | (1,039,515 | ) | | $ | 59,922 | | | $ | 3,032,932 | |
| | | | | | | | | | | | | | | | | | | | |
| 94
Notes to Financial Statements (continued)
September 30, 2017
High Income Fund (continued)
Asset Valuation Inputs (continued)
| | | | | | | | | | | | | | | | | | | | |
Investments in Securities | | Sales | | | Transfers into
Level 3 | | | Transfers out of Level 3 | | | Balance
as of September 30, 2017 | | | Change in Unrealized Appreciation (Depreciation) from Investments Still Held at September 30, 2017 | |
Bonds and Notes | | | | | | | | | | | | | | | | | | | | |
Non-Convertible Bonds | | | | | | | | | | | | | | | | | | | | |
ABS Home Equity | | $ | — | | | $ | — | | | $ | (98,704 | ) | | $ | — | | | $ | — | |
Government Owned - No Guarantee | | | — | | | | — | | | | (594,150 | ) | | | — | | | | — | |
Home Construction | | | (22 | ) | | | — | | | | — | | | | 12 | | | | (21,186 | ) |
Non-Agency Commercial Mortgage-Backed Securities | | | — | | | | — | | | | — | | | | 939,675 | | | | 30,801 | |
Senior Loans | | | | | | | | | | | | | | | | | | | | |
Wirelines | | | (159,324 | ) | | | — | | | | — | | | | — | | | | — | |
Other Investments | | | | | | | | | | | | | | | | | | | | |
Aircraft ABS | | | (1,000,000 | ) | | | — | | | | — | | | | 1,853,562 | | | | 12,062 | |
Common Stocks | | | | | | | | | | | | | | | | | | | | |
Media | | | — | | | | — | | | | — | | | | 23,855 | | | | 15,678 | |
Oil, Gas & Consumable Fuels | | | — | | | | — | | | | — | | | | 154,523 | | | | (1,036,840 | ) |
Warrants | | | — | | | | — | | | | (5,383 | ) | | | — | (a) | | | — | |
| | | | | | | | | | | | | | | | | | | | |
Total | | $ | (1,159,346 | ) | | $ | — | | | $ | (698,237 | ) | | $ | 2,971,627 | | | $ | (999,485 | ) |
| | | | | | | | | | | | | | | | | | | | |
| (a) | Security fair valued at zero using Level 3 inputs. |
A debt security valued at $98,704 was transferred from Level 3 to Level 2 during the period ended September 30, 2017. At September 30, 2016, this security was valued at fair value as determined in good faith by the Fund’s investment adviser as an independent pricing service did not provide a reliable price for the security. At September 30, 2017, this security was valued on the basis of evaluated bids furnished to the Fund by an independent pricing service in accordance with the Fund’s valuation policies.
A debt security valued at $594,150 was transferred from Level 3 to Level 2 during the period ended September 30, 2017. At September 30, 2016, this security was valued using broker-dealer bid prices based on inputs unobservable to the Fund as an independent
95 |
Notes to Financial Statements (continued)
September 30, 2017
pricing service did not provide a reliable price for the security. At September 30, 2017, this security was valued on the basis of evaluated bids furnished to the Fund by an independent pricing service in accordance with the Fund’s valuation policies.
Warrants valued at $5,383 were transferred from Level 3 to Level 1 during the period ended September 30, 2017. At September 30, 2016, this security was valued at fair value as determined in good faith by the Fund’s investment adviser as an independent pricing service did not provide a reliable price for the security. At September 30, 2017, this security was valued at the last sale price in accordance with the Fund’s valuation policies.
All transfers are recognized as of the beginning of the reporting period.
Intermediate Duration Bond Fund
Asset Valuation Inputs
| | | | | | | | | | | | | | | | | | | | |
Investments in
Securities | | Balance as of September 30, 2016 | | | Accrued
Discounts
(Premiums) | | | Realized
Gain (Loss) | | | Change in
Unrealized
Appreciation
(Depreciation) | | | Purchases | |
Bonds and Notes | | | | | | | | | | | | | | | | | | | | |
Non-Convertible Bonds | | | | | | | | | | | | | | | | | | | | |
ABS Car Loan | | $ | 439,742 | | | $ | — | | | $ | — | | | $ | — | | | $ | — | |
ABS Home Equity | | | 23,756 | | | | — | | | | — | | | | — | | | | — | |
| | | | | | | | | | | | | | | | | | | | |
Total | | $ | 463,498 | | | $ | — | | | $ | — | | | $ | — | | | $ | — | |
| | | | | | | | | | | | | | | | | | | | |
| | | | | | | | | | | | | | | | | | | | |
Investments in
Securities | | Sales | | | Transfers
into
Level 3 | | | Transfers out of Level 3 | | | Balance
as of September 30, 2017 | | | Change in Unrealized Appreciation (Depreciation) from Investments Still
Held at September 30, 2017 | |
Bonds and Notes | | | | | | | | | | | | | | | | | | | | |
Non-Convertible Bonds | | | | | | | | | | | | | | | | | | | | |
ABS Car Loan | | $ | — | | | $ | — | | | $ | (439,742 | ) | | $ | — | | | $ | — | |
ABS Home Equity | | | — | | | | — | | | | (23,756 | ) | | | — | | | | — | |
| | | | | | | | | | | | | | | | | | | | |
Total | | $ | — | | | $ | — | | | $ | (463,498 | ) | | $ | — | | | $ | — | |
| | | | | | | | | | | | | | | | | | | | |
| 96
Notes to Financial Statements (continued)
September 30, 2017
A debt security valued at $439,742 was transferred from Level 3 to Level 2 during the period ended September 30, 2017. At September 30, 2016, this security was valued using broker-dealer bid prices based on inputs unobservable to the Fund as an independent pricing service was unable to price the security. At September 30, 2017, this security was valued on the basis of evaluated bids furnished to the Fund by an independent pricing service in accordance with the Fund’s valuation policies.
A debt security valued at $23,756 was transferred from Level 3 to Level 2 during the period ended September 30, 2017. At September 30, 2016, this security was valued at fair value as determined in good faith by the Fund’s investment adviser as an independent pricing service did not provide a reliable price for the security. At September 30, 2017, this security was valued on the basis of evaluated bids furnished to the Fund by an independent pricing service in accordance with the Fund’s valuation policies.
All transfers are recognized as of the beginning of the reporting period.
Limited Term Government and Agency Fund
Asset Valuation Inputs
| | | | | | | | | | | | | | | | | | | | |
Investments in Securities | | Balance
as of
September 30,
2016 | | | Accrued
Discounts
(Premiums) | | | Realized
Gain
(Loss) | | | Change in
Unrealized
Appreciation
(Depreciation) | | | Purchases | |
Bonds and Notes | | | | | | | | | | | | | | | | | | | | |
ABS Student Loan | | $ | 400,000 | | | $ | — | | | $ | — | | | $ | — | | | $ | — | |
Agency Commercial Mortgage-Backed Securities | | | 11,781,022 | | | | — | | | | (2,045,169 | ) | | | 1,626,193 | | | | — | |
Collateralized Mortgage Obligations | | | 1,488,611 | | | | — | | | | (53,757 | ) | �� | | 61,699 | | | | — | |
Non-Agency Commercial Mortgage-Backed Securities | | | 3,037,018 | | | | — | | | | (3,950 | ) | | | 6,932 | | | | — | |
| | | | | | | | | | | | | | | | | | | | |
Total | | $ | 16,706,651 | | | $ | — | | | $ | (2,102,876 | ) | | $ | 1,694,824 | | | $ | — | |
| | | | | | | | | | | | | | | | | | | | |
97 |
Notes to Financial Statements (continued)
September 30, 2017
Limited Term Government and Agency Fund (continued)
Asset Valuation Inputs (continued)
| | | | | | | | | | | | | | | | | | | | |
Investments in Securities | | Sales | | | Transfers
into
Level 3 | | | Transfers out of Level 3 | | | Balance
as of September 30, 2017 | | | Change in Unrealized Appreciation (Depreciation) from Investments Still
Held at September 30, 2017 | |
Bonds and Notes | | | | | | | | | | | | | | | | | | | | |
ABS Student Loan | | $ | — | | | $ | — | | | $ | (400,000 | ) | | $ | — | | | $ | — | |
Agency Commercial Mortgage-Backed Securities | | | (11,362,046 | ) | | | — | | | | — | | | | — | | | | — | |
Collateralized Mortgage Obligations | | | (945,337 | ) | | | — | | | | (276,662 | ) | | | 274,554 | | | | 2,994 | |
Non-Agency Commercial Mortgage-Backed Securities | | | (3,040,000 | ) | | | — | | | | — | | | | — | | | | — | |
| | | | | | | | | | | | | | | | | | | | |
Total | | $ | (15,347,383 | ) | | $ | — | | | $ | (676,662 | ) | | $ | 274,554 | | | $ | 2,994 | |
| | | | | | | | | | | | | | | | | | | | |
A debt security valued at $400,000 was transferred from Level 3 to Level 2 during the period ended September 30, 2017. At September 30, 2016, this security was valued using broker-dealer bid prices based on inputs unobservable to the Fund as an independent pricing service was unable to price the security. At September 30, 2017, this security was valued on the basis of evaluated bids furnished to the Fund by an independent pricing service in accordance with the Fund’s valuation policies.
A debt security valued at $276,662 was transferred from Level 3 to Level 2 during the period ended September 30, 2017. At September 30, 2016, this security was valued at fair value as determined in good faith by the Fund’s investment adviser as an independent pricing service did not provide a reliable price for the security. At September 30, 2017, this security was valued on the basis of evaluated bids furnished to the Fund by an independent pricing service in accordance with the Fund’s valuation policies.
All transfers are recognized as of the beginning of the reporting period.
4. Derivatives. Derivative instruments are defined as financial instruments whose value and performance are based on the value and performance of an underlying asset, reference rate or index. Derivative instruments that High Income Fund and Intermediate Duration Bond Fund used during the period include forward foreign currency contracts and futures contracts, respectfully.
| 98
Notes to Financial Statements (continued)
September 30, 2017
High Income Fund is subject to the risk that changes in foreign currency exchange rates will have an unfavorable effect on the value of Fund assets denominated in foreign currencies. The Fund may enter into forward foreign currency contracts for hedging purposes to protect the value of the Fund’s holdings of foreign securities. The Fund may also use forward foreign currency contracts to gain exposure to foreign currencies, regardless of whether securities denominated in such currencies are held in the Fund. During the year ended September 30, 2017, High Income Fund engaged in forward foreign currency transactions for hedging purposes.
Intermediate Duration Bond Fund is subject to the risk that changes in interest rates will affect the value of the Fund’s investments in fixed-income securities. A Fund will be subject to increased interest rate risk to the extent that it invests in fixed-income securities with longer maturities or durations, as compared to investing in fixed-income securities with shorter maturities or durations. The Fund may use futures contracts to hedge against changes in interest rates and to manage its duration without having to buy or sell portfolio securities. During the year ended September 30, 2017, Intermediate Duration Bond Fund used futures contracts for hedging purposes and to manage duration.
The following is a summary of derivative instruments for Intermediate Duration Bond Fund as of September 30, 2017, as reflected within the Statements of Assets and Liabilities:
| | | | |
Liabilities | | Unrealized
depreciation on futures contracts | |
Exchange-traded/cleared liability derivatives | |
Interest rate contracts | | $ | (103,275 | ) |
Transactions in derivative instruments for High Income Fund during the year ended September 30, 2017, as reflected within the Statements of Operations, were as follows:
| | | | |
Net Realized Gain (Loss) on: | | Forward foreign
currency contracts | |
Foreign exchange contracts | | $ | 3,351 | |
| |
Net Change in Unrealized
Appreciation (Depreciation) on: | | Forward foreign
currency contracts | |
Foreign exchange contracts | | $ | (233 | ) |
Transactions in derivative instruments for Intermediate Duration Bond Fund during the year ended September 30, 2017, as reflected within the Statements of Operations, were as follows:
| | | | |
Net Change in Unrealized
Appreciation (Depreciation) on: | | Futures
contracts | |
Interest rate contracts | | $ | (103,275 | ) |
99 |
Notes to Financial Statements (continued)
September 30, 2017
As the Funds value their derivatives at fair value and recognize changes in fair value through the Statements of Operations, they do not qualify for hedge accounting under authoritative guidance for derivative instruments. The Funds’ investments in derivatives may represent an economic hedge; however, they are considered to be non-hedge transactions for the purpose of these disclosures.
The volume of forward foreign currency and futures contract activity, as a percentage of net assets, based on gross month-end notional amounts outstanding during the period, including long and short positions at absolute value, was as follows for the year ended September 30, 2017:
| | | | |
High Income Fund | | Forwards | |
Average Notional Amount Outstanding | | | 0.08 | % |
Highest Notional Amount Outstanding | | | 0.21 | % |
Lowest Notional Amount Outstanding | | | 0.00 | % |
Notional Amount Outstanding as of September 30, 2017 | | | 0.00 | % |
| | | | |
Intermediate Duration Bond Fund | | Futures | |
Average Notional Amount Outstanding | | | 0.25 | % |
Highest Notional Amount Outstanding | | | 5.23 | % |
Lowest Notional Amount Outstanding | | | 0.00 | % |
Notional Amount Outstanding as of September 30, 2017 | | | 5.23 | % |
Notional amounts outstanding at the end of the prior period are included in the average notional amount outstanding.
Unrealized gain and/or loss on open forwards and futures is recorded in the Statements of Assets and Liabilities. The aggregate notional values of forward and futures contracts are not recorded in the Statements of Assets and Liabilities, and therefore are not included in the Funds’ net assets.
Over-the-counter derivatives, including forward foreign currency contracts, are entered into pursuant to International Swaps and Derivatives Association, Inc. (“ISDA”) agreements negotiated between the Funds and their counterparties. ISDA agreements typically contain, among other things, terms for the posting of collateral and master netting provisions in the event of a default or other termination event. Collateral is posted by a Fund or the counterparty to the extent of the net mark-to-market exposure to the other party of all open contracts under the agreement, subject to minimum transfer requirements. Master netting provisions allow the Funds and the counterparty, in the event of a default or other termination event, to offset amounts owed by each related to derivative contracts, including any posted collateral, to one net amount payable by either the Funds or the counterparty. The Funds’ ISDA agreements typically contain provisions that allow a counterparty to terminate open contracts early if the NAV of a Fund declines beyond a certain threshold. For financial
| 100
Notes to Financial Statements (continued)
September 30, 2017
reporting purposes, the Funds do not offset derivative assets and liabilities, and any related collateral received or pledged, on the Statements of Assets and Liabilities.
Counterparty risk is managed based on policies and procedures established by the Fund’s adviser. Such policies and procedures may include, but are not limited to, minimum counterparty credit rating requirements, monitoring of counterparty credit default swap spreads and posting of collateral. The Fund’s risk of loss from counterparty credit risk on over-the-counter derivatives is generally limited to the Fund’s aggregated unrealized gains and the amount of any collateral pledged to the counterparty, which may be offset by any collateral posted to the Fund by the counterparty. ISDA master agreements can help to manage counterparty risk by specifying collateral posting arrangements at pre-arranged exposure levels. Under these ISDA agreements, collateral is routinely transferred if the total net exposure in respect of certain transactions, net of existing collateral already in place, exceeds a specified amount (typically $250,000, depending on the counterparty). With exchange-traded derivatives, there is minimal counterparty credit risk to the Fund because the exchange’s clearinghouse, as counterparty to these instruments, stands between the buyer and the seller of the contract. Credit risk still exists in exchange-traded derivatives with respect to initial and variation margin that is held in a broker’s customer accounts. While brokers are required to segregate customer margin from their own assets, in the event that a broker becomes insolvent or goes into bankruptcy and at that time there is a shortfall in the aggregate amount of margin held by the broker for all its clients, U.S. bankruptcy laws will typically allocate that shortfall on a pro rata basis across all of the broker’s customers, potentially resulting in losses to the Fund. Based on balances reflected on the Fund’s Statement of Assets and Liabilities, the following table shows (i) the maximum amount of loss due to credit risk that, based on the gross fair value of the financial instrument, the Fund would incur if parties (including OTC derivative counterparties and brokers holding margin for exchange-traded derivatives) to the relevant financial instruments failed completely to perform according to the terms of the contracts and the collateral or other security, if any, for the amount due proved to be of no value to the Fund, and (ii) the amount of loss that the Fund would incur after taking into account master netting provisions pursuant to ISDA agreements, as of September 30, 2017:
| | | | | | | | |
Fund | | Maximum Amount of Loss - Gross | | | Maximum Amount of Loss - Net | |
Intermediate Duration Bond Fund | | $ | 60,000 | | | $ | 60,000 | |
101 |
Notes to Financial Statements (continued)
September 30, 2017
5. Purchases and Sales of Securities. For the year ended September 30, 2017, purchases and sales of securities (excluding short-term investments and including paydowns) were as follows:
| | | | | | | | | | | | | | | | |
| | | U.S. Government/
Agency Securities | | | Other Securities | |
Fund | | Purchases | | | Sales | | | Purchases | | | Sales | |
High Income Fund | | $ | 10,401,073 | | | $ | 10,403,665 | | | $ | 64,713,920 | | | $ | 64,377,698 | |
Intermediate Duration Bond Fund | | | 162,854,260 | | | | 173,805,354 | | | | 239,880,334 | | | | 204,713,816 | |
Limited Term Government and Agency Fund | | | 962,312,642 | | | | 1,084,022,479 | | | | 20,244,440 | | | | 109,944,981 | |
6. Management Fees and Other Transactions with Affiliates.
a. Management Fees. Loomis, Sayles & Company, L.P. (“Loomis Sayles”) serves as investment adviser to each Fund. Under the terms of the management agreements, each Fund pays a management fee at the following annual rates, calculated daily and payable monthly, based on each Fund’s average daily net assets:
| | | | | | | | | | | | |
| | | Percentage of Average Daily Net Assets | |
Fund | | First $500 million | | | Next $1.5 billion | | | Over
$2 billion | |
High Income Fund | | | 0.6000 | % | | | 0.6000 | % | | | 0.6000 | % |
Intermediate Duration Bond Fund | | | 0.2500 | % | | | 0.2500 | % | | | 0.2500 | % |
Limited Term Government and Agency Fund | | | 0.3750 | % | | | 0.3500 | % | | | 0.3000 | % |
Loomis Sayles has given binding undertakings to the Funds to waive management fees and/or reimburse certain expenses to limit the Funds’ operating expenses, exclusive of acquired fund fees and expenses, brokerage expenses, interest expense, taxes, organizational and extraordinary expenses such as litigation and indemnification expenses. These undertakings are in effect until January 31, 2018, except for High Income Fund which is in effect until January 31, 2019, may be terminated before then only with the consent of the Funds’ Board of Trustees, and are reevaluated on an annual basis. Management fees payable, as reflected on the Statements of Assets and Liabilities, is net of waivers and/or expense reimbursements, if any, pursuant to these undertakings. Waivers/reimbursements that exceed management fees payable are reflected on the Statements of Assets and Liabilities as receivable from investment adviser.
| 102
Notes to Financial Statements (continued)
September 30, 2017
For the year ended September 30, 2017 the expense limits as a percentage of average daily net assets under the expense limitation agreements were as follows:
| | | | | | | | | | | | | | | | |
| | | Expense Limit as a Percentage of
Average Daily Net Assets | |
Fund | | Class A | | | Class C | | | Class N | | | Class Y | |
High Income Fund | | | 1.05 | % | | | 1.80 | % | | | 0.75 | % | | | 0.80 | % |
Intermediate Duration Bond Fund | | | 0.65 | % | | | 1.40 | % | | | — | | | | 0.40 | % |
Limited Term Government and Agency Fund | | | 0.80 | % | | | 1.55 | % | | | 0.50 | % | | | 0.55 | % |
Prior to July 1, 2017, the expense limits as a percentage of average daily net assets under the expense limitation agreements for High Income Fund were as follows:
| | | | | | | | | | | | | | | | |
| | | Expense Limit as a Percentage of
Average Daily Net Assets | |
Fund | | Class A | | | Class C | | | Class N | | | Class Y | |
High Income Fund | | | 1.10 | % | | | 1.85 | % | | | 0.80 | % | | | 0.85 | % |
Loomis Sayles shall be permitted to recover expenses borne under the expense limitation agreements (whether through waiver of its management fees or otherwise) on a class by class basis in later periods to the extent the annual operating expenses of a class fall below a class’ expense limits, provided, however, that a class is not obligated to pay such waived/reimbursed fees or expenses more than one year after the end of the fiscal year in which the fees or expenses were waived/reimbursed.
For the year ended September 30, 2017, the management fees and waivers of management fees for each Fund were as follows:
| | | | | | | | | | | | | | | | | | | | |
Fund | | Gross Management Fees | | | Contractual Waivers of Management Fees1 | | | Net Management Fees | | | Percentage of Average Daily Net Assets | |
| | | | | Gross | | | Net | |
High Income Fund | | $ | 1,042,422 | | | $ | 25,903 | | | $ | 1,016,519 | | | | 0.60 | % | | | 0.59 | % |
Intermediate Duration Bond Fund | | | 443,227 | | | | 128,732 | | | | 314,495 | | | | 0.25 | % | | | 0.18 | % |
Limited Term Government and Agency Fund | | | 2,966,461 | | | | — | | | | 2,966,461 | | | | 0.37 | % | | | 0.37 | % |
For the year ended September 30, 2017, class-specific expenses have been reimbursed as follows:
| | | | | | | | | | | | | | | | | | | | |
| | | Reimbursement1 | |
Fund | | Class A | | | Class C | | | Class N | | | Class Y | | | Total | |
High Income Fund | | $ | 17,605 | | | $ | 5,947 | | | $ | — | | | $ | 65,295 | | | $ | 88,847 | |
Limited Term Government and Agency Fund | | | 8,822 | | | | 1,276 | | | | — | | | | 7,399 | | | | 17,497 | |
| 1 | Waiver/expense reimbursements are subject to possible recovery until September 30, 2018. |
103 |
Notes to Financial Statements (continued)
September 30, 2017
No expenses were recovered for any of the Funds during the year ended September 30, 2017 under the terms of the expense limitation agreements.
Certain officers and employees of Loomis Sayles are also officers or Trustees of the Trust. Loomis Sayles’ general partner is indirectly owned by Natixis Investment Managers, L.P. (“Natixis”), which is part of Natixis Investment Managers, an international asset management group based in Paris, France.
b. Service and Distribution Fees. Natixis Distribution, L.P. (“Natixis Distribution), which is a wholly-owned subsidiary of Natixis, has entered into a distribution agreement with the Trusts. Pursuant to this agreement, Natixis Distribution serves as principal underwriter of the Funds of the Trusts.
Pursuant to Rule 12b-1 under the 1940 Act, the Trusts have adopted a Service Plan relating to each Fund’s Class A shares (the “Class A Plans”) (effective August 31, 2016 for Intermediate Duration Bond Fund), and a Distribution and Service Plan relating to each Fund’s Class C shares (the “Class C Plans”).
Under the Class A Plans, each Fund pays Natixis Distribution a monthly service fee at an annual rate not to exceed 0.25% of the average daily net assets attributable to the Fund’s Class A shares, as reimbursement for expenses incurred by Natixis Distribution in providing personal services to investors in Class A shares and/or the maintenance of shareholder accounts.
Under the Class C Plans, each Fund pays Natixis Distribution a monthly service fee at an annual rate not to exceed 0.25% of the average daily net assets attributable to the Fund’s Class C shares, as compensation for services provided by Natixis Distribution in providing personal services to investors in Class C shares and/or the maintenance of shareholder accounts.
Also under the Class C Plans, each Fund pays Natixis Distribution a monthly distribution fee at the annual rate of 0.75% of the average daily net assets attributable to the Fund’s Class C shares, as compensation for services provided by Natixis Distribution in connection with the marketing or sale of Class C shares.
For the year ended September 30, 2017, the service and distribution fees for each Fund were as follows:
| | | | | | | | | | | | |
| | | Service Fees | | | Distribution Fees | |
Fund | | Class A | | | Class C | | | Class C | |
High Income Fund | | $ | 86,056 | | | $ | 29,690 | | | $ | 89,068 | |
Intermediate Duration Bond Fund | | | 51,023 | | | | 7,817 | | | | 23,451 | |
Limited Term Government and Agency Fund | | | 952,802 | | | | 141,820 | | | | 425,461 | |
c. Administrative Fees. Natixis Advisors, L.P. (“Natixis Advisors”) provides certain administrative services for the Funds and contracts with State Street Bank to serve as
| 104
Notes to Financial Statements (continued)
September 30, 2017
sub-administrator. Natixis Advisors is a wholly-owned subsidiary of Natixis. Pursuant to an agreement among Natixis Funds Trusts, Loomis Sayles Funds Trusts, Natixis ETF Trust and Natixis Advisors, each Fund pays Natixis Advisors monthly its pro rata portion of fees equal to an annual rate of 0.0575% of the first $15 billion of the average daily net assets of the Natixis Funds Trusts, Loomis Sayles Funds Trusts and Natixis ETF Trust, 0.0500% of the next $15 billion, 0.0400% of the next $30 billion, 0.0350% of the next $30 billion and 0.0325% of such assets in excess of $90 billion, subject to an annual aggregate minimum fee for the Natixis Funds Trusts, Loomis Sayles Funds Trusts and Natixis ETF Trust of $10 million, which is reevaluated on an annual basis.
For the year ended September 30, 2017, the administrative fees for each Fund were as follows:
| | | | |
Fund | | Administrative Fees | |
High Income Fund | | $ | 77,527 | |
Intermediate Duration Bond Fund | | | 79,109 | |
Limited Term Government and Agency Fund | | | 362,331 | |
d. Sub-Transfer Agent Fees. Natixis Distribution has entered into agreements, which include servicing agreements, with financial intermediaries that provide recordkeeping, processing, shareholder communications and other services to customers of the intermediaries that hold positions in the Funds and has agreed to compensate the intermediaries for providing those services. Intermediaries transact with the Funds primarily through the use of omnibus accounts on behalf of their customers who hold positions in the Funds. These services would have been provided by the Funds’ transfer agent and other service providers if the shareholders’ accounts were maintained directly at the Funds’ transfer agent. Accordingly, the Funds have agreed to reimburse Natixis Distribution for all or a portion of the servicing fees paid to these intermediaries. The reimbursement amounts (sub-transfer agent fees) paid to Natixis Distribution are subject to a current per-account equivalent fee limit approved by the Funds’ Board of Trustees, which is based on fees for similar services paid to the Funds’ transfer agent and other service providers. Class N shares do not bear such expenses.
For the year ended September 30, 2017, the sub-transfer agent fees (which are reflected in transfer agent fees and expenses in the Statements of Operations) for each Fund were as follows:
| | | | |
Fund | | Sub-Transfer Agent Fees | |
High Income Fund | | $ | 186,259 | |
Intermediate Duration Bond Fund | | | 73,438 | |
Limited Term Government and Agency Fund | | | 405,446 | |
105 |
Notes to Financial Statements (continued)
September 30, 2017
As of September 30, 2017, the Funds owe Natixis Distribution the following reimbursements for sub-transfer agent fees (which are reflected in the Statements of Assets and Liabilities as payable to distributor):
| | | | |
Fund | | Reimbursements of Sub-Transfer Agent Fees | |
High Income Fund | | $ | 2,420 | |
Intermediate Duration Bond Fund | | | 1,262 | |
Limited Term Government and Agency Fund | | | 4,522 | |
Sub-transfer agent fees attributable to Class A, Class C and Class Y are allocated on a pro rata basis to each class based on the relative net assets of each class to the total net assets of those classes.
e. Commissions. Commissions (including CDSCs) on Fund shares retained by Natixis Distribution during the year ended September 30, 2017 were as follows:
| | | | |
Fund | | Commissions | |
High Income Fund | | $ | 5,340 | |
Intermediate Duration Bond Fund | | | 21 | |
Limited Term Government and Agency Fund | | | 17,560 | |
f. Trustees Fees and Expenses. The Trusts do not pay any compensation directly to their officers or Trustees who are directors, officers or employees of Natixis Advisors, Natixis Distribution, Natixis or their affiliates. The Chairperson of the Board of Trustees receives a retainer fee at the annual rate of $325,000. The Chairperson does not receive any meeting attendance fees for Board of Trustees meetings or committee meetings that she attends. Each Independent Trustee (other than the Chairperson) receives, in the aggregate, a retainer fee at the annual rate of $155,000. Each Independent Trustee also receives a meeting attendance fee of $10,000 for each meeting of the Board of Trustees that he or she attends in person and $5,000 for each meeting of the Board of Trustees that he or she attends telephonically. In addition, the chairperson of the Contract Review Committee and the chairperson of the Audit Committee each receive an additional retainer fee at the annual rate of $17,500. The chairperson of the Governance Committee receives an additional retainer fee at the annual rate of $10,000. Each Contract Review Committee member is compensated $6,000 for each Committee meeting that he or she attends in person and $3,000 for each meeting that he or she attends telephonically. Each Audit Committee member is compensated $6,000 for each Committee meeting that he or she attends in person and $3,000 for each meeting that he or she attends telephonically. These fees are allocated among the funds in the Natixis Funds Trusts, Loomis Sayles Funds Trusts and Natixis ETF Trust based on a formula that takes into account, among other factors, the relative net assets of each fund. Trustees are reimbursed for travel expenses in connection with attendance at meetings.
| 106
Notes to Financial Statements (continued)
September 30, 2017
A deferred compensation plan (the “Plan”) is available to the Trustees on a voluntary basis. Deferred amounts remain in the Funds until distributed in accordance with the provisions of the Plan. The value of a participating Trustee’s deferral account is based on theoretical investments of deferred amounts, on the normal payment dates, in certain funds of the Natixis Funds Trusts, Loomis Sayles Funds Trusts and Natixis ETF Trust as designated by the participating Trustees. Changes in the value of participants’ deferral accounts are allocated pro rata among the funds in the Natixis Funds Trusts, Loomis Sayles Funds Trusts and Natixis ETF Trust, and are normally reflected as Trustees’ fees and expenses in the Statements of Operations. The portions of the accrued obligations allocated to the Funds under the Plan are reflected as Deferred Trustees’ fees in the Statements of Assets and Liabilities.
g. Affiliated Ownership. As of September 30, 2017, the percentage of each Fund’s net assets owned by affiliates is as follows:
| | |
High Income Fund | | Percentage of Net Assets |
Natixis Advisors | | Less than 0.01% |
| |
Intermediate Duration Bond Fund | | Percentage of Net Assets |
Loomis Sayles Retirement Plan | | 0.65% |
| |
Limited Term Government and Agency Fund | | Percentage of Net Assets |
Loomis Sayles Retirement Plan | | 0.52% |
Natixis Sustainable Future 2015 Fund | | 0.07% |
Natixis Sustainable Future 2020 Fund | | 0.06% |
Natixis Sustainable Future 2025 Fund | | 0.04% |
Natixis Sustainable Future 2030 Fund | | 0.02% |
Natixis Sustainable Future 2035 Fund | | 0.01% |
Natixis Sustainable Future 2040 Fund | | 0.01% |
Natixis Sustainable Future 2045 Fund | | 0.01% |
Natixis Sustainable Future 2050 Fund | | Less than 0.01% |
Natixis Sustainable Future 2055 Fund | | Less than 0.01% |
Natixis Sustainable Future 2060 Fund | | Less than 0.01% |
Investment activities of affiliated shareholders could have material impacts on the Funds.
h. Reimbursement of Transfer Agent Fees and Expenses. Natixis Advisors has given a binding contractual undertaking to the High Income Fund and Limited Term Government and Agency Fund to reimburse any and all transfer agency expenses for the Funds’ Class N shares. This undertaking is in effect through January 31, 2018 and is not subject to recovery under the expense limitation agreement described above.
107 |
Notes to Financial Statements (continued)
September 30, 2017
For the year ended September 30, 2017, Natixis Advisors reimbursed the Funds for transfer agency expenses as follows:
| | | | |
Fund | | Reimbursement of Transfer
Agency Expenses | |
| | | Class N | |
High Income Fund | | $ | 271 | |
Limited Term Government and Agency Fund | | | 295 | |
7. Class-Specific Transfer Agent Fees and Expenses. Transfer agent fees and expenses attributable to Class A, Class C, and Class Y are allocated on a pro rata basis to each class based on the relative net assets of each class to the total net assets of those classes. Transfer agent fees and expenses attributable to Class N are allocated to Class N.
Intermediate Duration Bond Fund allocates transfer agent fees and expenses on a pro rata basis based on the relative net assets of each class to the total net assets of those classes.
For the period from November 30, 2016, commencement of Class N operations, through September 30, 2017, High Income Fund incurred the following class-specific transfer agent fees and expenses (including sub-transfer agent fees, where applicable):
| | | | | | | | | | | | | | | | |
| | | Transfer Agent Fees and Expenses | |
Fund | | Class A | | | Class C | | | Class N | | | Class Y | |
High Income Fund | | $ | 35,584 | | | $ | 12,187 | | | $ | 271 | | | $ | 131,560 | |
For the period from February 1, 2017, commencement of Class N operations, through September 30, 2017, Limited Term Government and Agency Fund incurred the following class-specific transfer agent fees and expenses (including sub-transfer agent fees, where applicable):
| | | | | | | | | | | | | | | | |
| | | Transfer Agent Fees and Expenses | |
Fund | | Class A | | | Class C | | | Class N | | | Class Y | |
Limited Term Government and Agency Fund | | $ | 220,344 | | | $ | 31,475 | | | $ | 295 | | | $ | 222,566 | |
8. Line of Credit. Each Fund, together with certain other funds of Natixis Funds Trusts and Loomis Sayles Funds Trusts, entered into a 364-day, $400,000,000 syndicated, committed, unsecured line of credit with Citibank, N.A. to be used for temporary or emergency purposes only. Any one Fund may borrow up to the full $400,000,000 under the line of credit (as long as all borrowings by all Funds in the aggregate do not exceed the $400,000,000 limit at any time), subject to each Fund’s investment restrictions. Interest is charged to the Funds at a rate equal to the greater of the eurodollar or the federal funds rate plus 1.00%. In addition, a commitment fee of 0.15% per annum, payable on the last business day of each month, is accrued and apportioned among the participating funds based on their average daily unused portion of the line of credit.
| 108
Notes to Financial Statements (continued)
September 30, 2017
The Funds paid an arrangement fee, an upfront fee, and other fees in connection with the new line of credit agreement, which are being amortized over a period of 364 days and are reflected as miscellaneous expenses on the Statements of Operations. The unamortized balance is reflected as prepaid expenses on the Statements of Assets and Liabilities.
Prior to April 13, 2017, the commitment fee was 0.10% per annum based on the average daily unused portion of the line of credit.
For the year ended September 30, 2017, none of the Funds had borrowings under this agreement
9. Concentration of Risk. Limited Term Government and Agency Fund’s investments in mortgage-related and asset-backed securities are subject to certain risks not associated with investments in other securities. Mortgage-related and asset-backed securities are subject to the risk that unexpected changes in interest rates will have a direct effect on expected maturity. A shortened maturity may result in the reinvestment of prepaid amounts in securities with lower yields than the original obligations. An extended maturity may result in a reduction of a security’s value.
Each Fund’s investments in foreign securities are subject to foreign currency fluctuations, higher volatility than U.S. securities, varying degrees of regulation and limited liquidity. Greater political, economic, credit and information risks are also associated with foreign securities.
10. Concentration of Ownership. From time to time, a Fund may have a concentration of one or more accounts constituting a significant percentage of shares outstanding. Investment activities by holders of such accounts could have material impacts on the Funds. As of September 30, 2017, based on management’s evaluation of the shareholder account base, the Funds had accounts representing controlling ownership of more than 5% of the Fund’s total outstanding shares. The number of such accounts, based on accounts that represent more than 5% of an individual class of shares, and the aggregate percentage of net assets represented by such holdings were as follows:
| | | | | | | | |
Fund | | Number of 5%
Account Holders | | | Percentage
Ownership | |
High Income Fund | | | 2 | | | | 28.83 | % |
Intermediate Duration Bond Fund | | | 3 | | | | 21.25 | % |
Limited Term Government and Agency Fund | | | 1 | | | | 13.19 | % |
Omnibus shareholder accounts for which Natixis Advisors understands that the intermediary has discretion over the underlying shareholder accounts or investment models where a shareholder account may be invested for a non-discretionary customer are included in the table above. For other omnibus accounts, the Funds do
109 |
Notes to Financial Statements (continued)
September 30, 2017
not have information on the individual shareholder accounts underlying the omnibus accounts; therefore, there could be other 5% shareholders in addition to those disclosed in the table above.
11. Capital Shares. Each Fund may issue an unlimited number of shares of beneficial interest, without par value. Transactions in capital shares were as follows:
| | | | | | | | | | | | | | | | |
| |
| Year Ended
September 30, 2017 |
| |
| Year Ended
September 30, 2016 |
|
High Income Fund | | | Shares | | | | Amount | | | | Shares | | | | Amount | |
| Class A | |
Issued from the sale of shares | | | 2,869,491 | | | $ | 12,272,049 | | | | 5,509,748 | | | $ | 22,242,447 | |
Issued in connection with the reinvestment of distributions | | | 306,554 | | | | 1,311,455 | | | | 299,177 | | | | 1,169,586 | |
Redeemed | | | (3,623,241 | ) | | | (15,504,179 | ) | | | (7,071,447 | ) | | | (28,018,252 | ) |
| | | | | | | | | | | | | | | | |
Net change | | | (447,196 | ) | | $ | (1,920,675 | ) | | | (1,262,522 | ) | | $ | (4,606,219 | ) |
| | | | | | | | | | | | | | | | |
| Class B(a) | |
Issued in connection with the reinvestment of distributions | | | — | | | | — | | | | 4 | | | | 17 | |
Redeemed | | | — | | | | — | | | | (623 | ) | | | (2,485 | ) |
| | | | | | | | | | | | | | | | |
Net change | | | — | | | $ | — | | | | (619 | ) | | $ | (2,468 | ) |
| | | | | | | | | | | | | | | | |
| Class C | |
Issued from the sale of shares | | | 471,847 | | | $ | 2,010,717 | | | | 799,861 | | | $ | 3,141,922 | |
Issued in connection with the reinvestment of distributions | | | 88,277 | | | | 378,228 | | | | 88,851 | | | | 345,998 | |
Redeemed | | | (897,288 | ) | | | (3,849,291 | ) | | | (1,144,474 | ) | | | (4,485,915 | ) |
| | | | | | | | | | | | | | | | |
Net change | | | (337,164 | ) | | $ | (1,460,346 | ) | | | (255,762 | ) | | $ | (997,995 | ) |
| | | | | | | | | | | | | | | | |
| Class N(b) | |
Issued from the sale of shares | | | 240 | | | $ | 1,001 | | | | — | | | $ | — | |
Issued in connection with the reinvestment of distributions | | | 10 | | | | 41 | | | | — | | | | — | |
| | | | | | | | | | | | | | | | |
Net change | | | 250 | | | $ | 1,042 | | | | — | | | $ | — | |
| | | | | | | | | | | | | | | | |
| Class Y | |
Issued from the sale of shares | | | 9,715,068 | | | $ | 41,499,158 | | | | 14,901,804 | | | $ | 58,204,609 | |
Issued in connection with the reinvestment of distributions | | | 1,184,729 | | | | 5,054,088 | | | | 1,041,928 | | | | 4,056,961 | |
Redeemed | | | (10,799,917 | ) | | | (45,851,330 | ) | | | (14,689,863 | ) | | | (57,325,101 | ) |
| | | | | | | | | | | | | | | | |
Net change | | | 99,880 | | | $ | 701,916 | | | | 1,253,869 | | | $ | 4,936,469 | |
| | | | | | | | | | | | | | | | |
Increase (decrease) from capital share transactions | | | (684,230 | ) | | $ | (2,678,063 | ) | | | (265,034 | ) | | $ | (670,213 | ) |
| | | | | | | | | | | | | | | | |
| (a) | On January 11, 2016, Class B shares were converted into Class A shares. See Note 1 of Notes to Financial Statements. |
| (b) | From commencement of Class operations on November 30, 2016 through September 30, 2017. |
| 110
Notes to Financial Statements (continued)
September 30, 2017
11. Capital Shares (continued).
| | | | | | | | | | | | | | | | |
| |
| Year Ended
September 30, 2017 |
| |
| Year Ended
September 30, 2016 |
|
Intermediate Duration Bond Fund | | | Shares | | | | Amount | | | | Shares | | | | Amount | |
| Class A | |
Issued from the sale of shares | | | 495,534 | | | $ | 5,098,171 | | | | 525,035 | | | $ | 5,443,679 | |
Issued in connection with the reinvestment of distributions | | | 51,612 | | | | 528,641 | | | | 43,720 | | | | 453,187 | |
Redeemed | | | (263,005 | ) | | | (2,708,601 | ) | | | (505,357 | ) | | | (5,247,036 | ) |
| | | | | | | | | | | | | | | | |
Net change | | | 284,141 | | | $ | 2,918,211 | | | | 63,398 | | | $ | 649,830 | |
| | | | | | | | | | | | | | | | |
| Class C(a) | |
Issued from the sale of shares | | | 14,097 | | | $ | 144,076 | | | | 293,283 | | | $ | 3,088,274 | |
Issued in connection with the reinvestment of distributions | | | 5,796 | | | | 59,316 | | | | — | (b) | | | 1 | |
| | | | | | | | | | | | | | | | |
Net change | | | 19,893 | | | $ | 203,392 | | | | 293,283 | | | $ | 3,088,275 | |
| | | | | | | | | | | | | | | | |
| Class Y | |
Issued from the sale of shares | | | 6,045,802 | | | $ | 62,224,245 | | | | 7,746,460 | | | $ | 80,334,377 | |
Issued in connection with the reinvestment of distributions | | | 342,222 | | | | 3,505,355 | | | | 231,356 | | | | 2,401,500 | |
Redeemed | | | (4,606,062 | ) | | | (47,400,228 | ) | | | (1,681,603 | ) | | | (17,455,864 | ) |
Redeemed in-kind (Note 12) | | | — | | | | — | | | | (1,574,765 | ) | | | (16,409,056 | ) |
| | | | | | | | | | | | | | | | |
Net change | | | 1,781,962 | | | $ | 18,329,372 | | | | 4,721,448 | | | $ | 48,870,957 | |
| | | | | | | | | | | | | | | | |
Increase (decrease) from capital share transactions | | | 2,085,996 | | | $ | 21,450,975 | | | | 5,078,129 | | | $ | 52,609,062 | |
| | | | | | | | | | | | | | | | |
| (a) | From commencement of Class operations on August 31, 2016 through September 30, 2016. |
| (b) | Amount rounds to less than one share. |
111 |
Notes to Financial Statements (continued)
September 30, 2017
11. Capital Shares (continued).
| | | | | | | | | | | | | | | | |
| |
| Year Ended
September 30, 2017 |
| |
| Year Ended
September 30, 2016 |
|
Limited Term Government and Agency Fund | | | Shares | | | | Amount | | | | Shares | | | | Amount | |
| Class A | |
Issued from the sale of shares | | | 3,991,528 | | | $ | 45,399,327 | | | | 23,688,131 | | | $ | 272,639,541 | |
Issued in connection with the reinvestment of distributions | | | 454,875 | | | | 5,170,894 | | | | 418,361 | | | | 4,816,572 | |
Redeemed | | | (13,213,781 | ) | | | (150,164,121 | ) | | | (15,575,978 | ) | | | (179,339,659 | ) |
| | | | | | | | | | | | | | | | |
Net change | | | (8,767,378 | ) | | $ | (99,593,900 | ) | | | 8,530,514 | | | $ | 98,116,454 | |
| | | | | | | | | | | | | | | | |
| Class B(a) | |
Issued from the sale of shares | | | — | | | $ | — | | | | 1,448 | | | $ | 16,709 | |
Issued in connection with the reinvestment of distributions | | | — | | | | — | | | | 426 | | | | 4,887 | |
Redeemed | | | — | | | | — | | | | (230,595 | ) | | | (2,644,555 | ) |
| | | | | | | | | | | | | | | | |
Net change | | | — | | | $ | — | | | | (228,721 | ) | | $ | (2,622,959 | ) |
| | | | | | | | | | | | | | | | |
| Class C | |
Issued from the sale of shares | | | 757,506 | | | $ | 8,626,416 | | | | 4,330,687 | | | $ | 49,825,855 | |
Issued in connection with the reinvestment of distributions | | | 29,711 | | | | 337,959 | | | | 29,632 | | | | 341,361 | |
Redeemed | | | (3,304,176 | ) | | | (37,593,668 | ) | | | (3,475,708 | ) | | | (40,028,796 | ) |
| | | | | | | | | | | | | | | | |
Net change | | | (2,516,959 | ) | | $ | (28,629,293 | ) | | | 884,611 | | | $ | 10,138,420 | |
| | | | | | | | | | | | | | | | |
| Class N(b) | |
Issued from the sale of shares | | | 166,111 | | | $ | 1,892,253 | | | | — | | | $ | — | |
Issued in connection with the reinvestment of distributions | | | 1,700 | | | | 19,353 | | | | — | | | | — | |
Redeemed | | | (527 | ) | | | (5,984 | ) | | | — | | | | — | |
| | | | | | | | | | | | | | | | |
Net change | | | 167,284 | | | $ | 1,905,622 | | | | — | | | $ | — | |
| | | | | | | | | | | | | | | | |
| Class Y | |
Issued from the sale of shares | | | 13,725,909 | | | $ | 156,563,024 | | | | 22,122,240 | | | $ | 255,439,801 | |
Issued in connection with the reinvestment of distributions | | | 431,654 | | | | 4,921,367 | | | | 391,770 | | | | 4,524,155 | |
Redeemed | | | (18,111,061 | ) | | | (206,644,972 | ) | | | (24,037,266 | ) | | | (277,502,192 | ) |
| | | | | | | | | | | | | | | | |
Net change | | | (3,953,498 | ) | | $ | (45,160,581 | ) | | | (1,523,256 | ) | | $ | (17,538,236 | ) |
| | | | | | | | | | | | | | | | |
Increase (decrease) from capital share transactions | | | (15,070,551 | ) | | $ | (171,478,152 | ) | | | 7,663,148 | | | $ | 88,093,679 | |
| | | | | | | | | | | | | | | | |
| (a) | On January 11, 2016, Class B shares were converted into Class A shares. See Note 1 of Notes to Financial Statements. |
| (b) | From commencement of Class operations on February 1, 2017 through September 30, 2017. |
| 112
Notes to Financial Statements (continued)
September 30, 2017
12. Redemption In-Kind. In certain circumstances, a Fund may distribute portfolio securities rather than cash as payment for redemption of Fund shares (redemption in-kind). For financial reporting purposes, the Fund will recognize a gain on in-kind redemptions to the extent the value of the distributed securities on the date of redemption exceeds the cost of those securities; the Fund will recognize a loss if the cost exceeds value. Gains and losses realized on redemptions in-kind are not recognized for tax purposes, and are re-classified from realized gain (loss) to paid-in-capital. For the year ended September 30, 2016, Intermediate Duration Bond Fund participated in a redemption in-kind transaction. For the year ended September 30, 2017, none of the Funds participated in redemption in-kind transactions.
113 |
Report of Independent Registered Public Accounting Firm
To the Board of Trustees of Loomis Sayles Funds I and Loomis Sayles Funds II and Shareholders of Loomis Sayles Intermediate Duration Bond Fund, Loomis Sayles High Income Fund and Loomis Sayles Limited Term Government and Agency Fund:
In our opinion, the accompanying statements of assets and liabilities, including the portfolios of investments, and the related statements of operations and of changes in net assets and the financial highlights present fairly, in all material respects, the financial position of the Loomis Sayles Intermediate Duration Fixed Income Fund, a series of Loomis Sayles Funds I, and Loomis Sayles High Income Fund and Loomis Sayles Limited Term Government and Agency Fund, each a series of Loomis Sayles Funds II, (collectively, the “Funds”) as of September 30, 2017, the results of its operations for the year then ended, the changes in its net assets for each of the two years in the period then ended and the financial highlights for each of the periods indicated, in conformity with accounting principles generally accepted in the United States of America. These financial statements and financial highlights (hereafter referred to as “financial statements”) are the responsibility of the Fund’s management. Our responsibility is to express an opinion on these financial statements based on our audits. We conducted our audits of these financial statements in accordance with the standards of the Public Company Accounting Oversight Board (United States). Those standards require that we plan and perform the audit to obtain reasonable assurance about whether the financial statements are free of material misstatement. An audit includes examining, on a test basis, evidence supporting the amounts and disclosures in the financial statements, assessing the accounting principles used and significant estimates made by management, and evaluating the overall financial statement presentation. We believe that our audits, which included confirmation of securities as of September 30, 2017 by correspondence with the custodian and brokers, provide a reasonable basis for our opinion.
PricewaterhouseCoopers LLP
Boston, Massachusetts
November 21, 2017
| 114
2017 U.S. Tax Distribution Information to Shareholders (Unaudited)
Corporate Dividends Received Deduction. For the fiscal year ended September 30, 2017, a percentage of dividends distributed by the Funds listed below qualify for the dividends received deduction for corporate shareholders. These percentages are as follows:
| | | | |
Fund | | Qualifying
Percentage | |
High Income | | | 4.20 | % |
Capital Gains Distributions. Pursuant to Internal Revenue Section 852(b), the following Funds paid distributions, which have been designated as capital gains distributions for the fiscal year ended September 30, 2017, unless subsequently determined to be different.
| | | | |
Fund | | Amount | |
Intermediate Duration Bond | | $ | 39,533 | |
Qualified Dividend Income. For the fiscal year ended September 30, 2017, the Funds below will designate up to the maximum amount allowable pursuant to the Internal Revenue Code as qualified dividend income eligible for reduced tax rates. These lower rates range from 0% to 20% depending on an individual’s tax bracket. If the Funds pay a distribution during calendar year 2017, complete information will be reported in conjunction with Form 1099-DIV.
115 |
Trustee and Officer Information
The tables below provide certain information regarding the trustees and officers of Loomis Sayles Funds I and Loomis Sayles Funds II (the “Trusts”). Unless otherwise indicated, the address of all persons below is 888 Boylston Street, Suite 800, Boston, MA 02199-8197. The Funds’ Statements of Additional Information include additional information about the trustees of the Trusts and are available by calling Natixis Funds at 800-225-5478.
| | | | | | | | |
Name and Year of Birth | | Position(s) Held
with the Trusts,
Length of Time
Served and Term of Office1 | | Principal
Occupation(s)
During Past 5 Years | | Number of
Portfolios in
Fund Complex
Overseen2
and Other
Directorships Held
During Past 5 Years | | Experience,
Qualifications,
Attributes, Skills
for Board Membership |
| | | |
| INDEPENDENT TRUSTEES | | | | | | |
| | | | |
Kenneth A. Drucker (1945) | | Chairperson of the Board of Trustees since January 2017 Trustee since 2008 Ex Officio member of Audit Committee, Contract Review Committee and Governance Committee | | Retired | | 53 None | | Significant experience on the Board and on the boards of other business organizations (including at investment companies); executive experience (including as treasurer of an aerospace, automotive, and metal manufacturing corporation) |
| | | | |
Edmond J. English (1953) | | Trustee since 2013 Audit Committee Member | | Executive Chairman; formerly, Chief Executive Officer of Bob’s Discount Furniture (retail) | | 53 Director, Burlington Stores, Inc. (retail) | | Experience on the Board and significant experience on the boards of other business organizations (including retail companies and a bank); executive experience (including at a retail company) |
| 116
Trustee and Officer Information
| | | | | | | | |
Name and Year of Birth | | Position(s) Held
with the Trusts,
Length of Time
Served and Term of Office1 | | Principal
Occupation(s)
During Past 5 Years | | Number of
Portfolios in
Fund Complex
Overseen2
and Other
Directorships Held
During Past 5 Years | | Experience,
Qualifications,
Attributes, Skills
for Board Membership |
| | | |
INDEPENDENT TRUSTEES continued | | | | | | |
| | | | |
Richard A. Goglia (1951) | | Trustee since 2015 Audit Committee Member | | Retired; formerly Vice President and Treasurer of Raytheon Company (defense) | | 53 None | | Experience on the Board and executive experience (including his role as vice president and treasurer of a defense company and experience at a financial services company) |
| | | | |
Wendell J. Knox (1948) | | Trustee since 2009 Contract Review Committee Member and Governance Committee Member | | Director of Abt Associates Inc. (research and consulting) | | 53 Director, Eastern Bank (bank); Director, The Hanover Insurance Group (property and casualty insurance) | | Significant experience on the Board and on the boards of other business organizations (including at a bank and at a property and casualty insurance firm); executive experience (including roles as president and chief executive officer of a research and consulting company) |
117 |
Trustee and Officer Information
| | | | | | | | |
Name and Year of Birth | | Position(s) Held
with the Trusts,
Length of Time
Served and Term of Office1 | | Principal
Occupation(s)
During Past 5 Years | | Number of
Portfolios in
Fund Complex
Overseen2
and Other
Directorships Held
During Past 5 Years | | Experience,
Qualifications,
Attributes, Skills
for Board Membership |
| | | |
INDEPENDENT TRUSTEES continued | | | | | | |
| | | | |
Martin T. Meehan (1956) | | Trustee since 2012 Contract Review Committee Member | | President, University of Massachusetts; formerly, Chancellor and faculty member, University of Massachusetts Lowell | | 53 None | | Significant experience on the Board and on the boards of other business organizations; experience as President of the University of Massachusetts; government experience (including as a member of the U.S. House of Representatives); academic experience |
| | | | |
Maureen B. Mitchell3 (1951) | | Trustee since 2017 Contract Review Committee Member | | Retired; formerly President, Global Sales and Marketing, GE Asset Management, Inc. (financial services) | | 53 None | | Experience on the Board; financial services industry and executive experience (including role as president of global sales and marketing at a financial services company) |
| 118
Trustee and Officer Information
| | | | | | | | |
Name and Year of Birth | | Position(s) Held
with the Trusts,
Length of Time
Served and Term of Office1 | | Principal
Occupation(s)
During Past 5 Years | | Number of
Portfolios in
Fund Complex
Overseen2
and Other
Directorships Held
During Past 5 Years | | Experience,
Qualifications,
Attributes, Skills
for Board Membership |
| | | |
INDEPENDENT TRUSTEES continued | | | | | | |
| | | | |
Sandra O. Moose (1942) | | Trustee since 2003 Audit Committee Member and Governance Committee Member | | President, Strategic Advisory Services (management consulting) | | 53 Formerly, Director, AES Corporation (international power company); formerly, Director, Verizon Communications (telecommunications company) | | Significant experience on the Board and on the boards of other business organizations (including at a telecommunications company, an international power company and a specialty chemicals corporation); executive experience (including at a management consulting company) |
| | | | |
James P. Palermo (1955) | | Trustee since 2016 Contract Review Committee Member | | Founding Partner, Breton Capital Management, LLC (private equity); Partner, STEP Partners, LLC (private equity); formerly, Chief Executive Officer of Global Client Management of The Bank of New York Mellon Corporation | | 53 None | | Experience on the Board; financial services industry and executive experience (including roles as chief executive officer of client management and asset servicing for a banking and financial services company) |
119 |
Trustee and Officer Information
| | | | | | | | |
Name and Year of Birth | | Position(s) Held
with the Trusts,
Length of Time
Served and Term of Office1 | | Principal
Occupation(s)
During Past 5 Years | | Number of
Portfolios in
Fund Complex
Overseen2
and Other
Directorships Held
During Past 5 Years | | Experience,
Qualifications,
Attributes, Skills
for Board Membership |
| | | |
INDEPENDENT TRUSTEES continued | | | | | | |
| | | | |
Erik R. Sirri (1958) | | Trustee since 2009 Chairperson of the Audit Committee | | Professor of Finance at Babson College | | 53 None | | Significant experience on the Board; experience as Director of the Division of Trading and Markets at the Securities and Exchange Commission; academic experience; training as an economist |
| | | | |
Peter J. Smail (1952) | | Trustee since 2009 Chairperson of the Contract Review Committee and Governance Committee Member | | Retired | | 53 None | | Significant experience on the Board; mutual fund industry and executive experience (including roles as president and chief executive officer for an investment adviser) |
| | | | |
Cynthia L. Walker (1956) | | Trustee since 2005 Chairperson of the Governance Committee and Audit Committee Member | | Deputy Dean for Finance and Administration, Yale University School of Medicine | | 53 None | | Significant experience on the Board; executive experience in a variety of academic organizations (including roles as dean for finance and administration) |
| 120
Trustee and Officer Information
| | | | | | | | |
Name and Year of Birth | | Position(s) Held
with the Trusts,
Length of Time
Served and Term of Office1 | | Principal
Occupation(s)
During Past 5 Years | | Number of
Portfolios in
Fund Complex
Overseen2
and Other
Directorships Held
During Past 5 Years | | Experience,
Qualifications,
Attributes, Skills
for Board Membership |
| | | |
| INTERESTED TRUSTEES | | | | | | |
| | | | |
Kevin P. Charleston4 (1965) One Financial Center Boston, MA 02111 | | Trustee since 2015 President and Chief Executive Officer of Loomis Sayles Funds I since 2015 | | President, Chief Executive Officer and Chairman of the Board of Directors; formerly, Chief Financial Officer, Loomis, Sayles & Company, L.P. | | 53 None | | Experience on the Board; continuing service as President, Chief Executive Officer and Chairman of the Board of Directors of Loomis, Sayles & Company, L.P. |
| | | | |
David L. Giunta5 (1965) | | Trustee since 2011 President of Loomis Sayles Funds II and Executive Vice President of Loomis Sayles Funds I since 2008; Chief Executive Officer of Loomis Sayles Funds II since 2015 | | President and Chief Executive Officer, Natixis Advisors, L.P., Natixis Distribution L.P., Natixis Distribution Corporation and Chairman of the Board of Natixis Distribution Corporation | | 53 None | | Significant experience on the Board; experience as President and Chief Executive Officer, Natixis Advisors, L.P., Natixis Distribution L.P., Natixis Distribution Corporation and Chairman of the Board of Natixis Distribution Corporation |
| 1 | Each trustee serves until retirement, resignation or removal from the Board. The current retirement age is 75. The position of Chairperson of the Board is appointed for a three-year term. |
| 2 | The trustees of the Trusts serve as trustees of a fund complex that includes all series of the Natixis Funds Trust I, Natixis Funds Trust II, Natixis Funds Trust IV and Gateway Trust (collectively, the “Natixis Funds Trusts”), Loomis Sayles Funds I and Loomis Sayles Funds II (collectively, the “Loomis Sayles Funds Trusts”) and Natixis ETF Trust (collectively, the “Fund Complex”). |
| 3 | Ms. Mitchell was appointed as a Trustee effective July 1, 2017. |
| 4 | Mr. Charleston is deemed an “interested person” of the Trusts because he holds the following positions with an affiliated person of the Trusts: President, Chief Executive Officer and Chairman of the Board of Directors of Loomis, Sayles & Company, L.P. |
| 5 | Mr. Giunta is deemed an “interested person” of the Trusts because he holds the following positions with an affiliated person of the Trusts: President and Chief Executive Officer Natixis Advisors, L.P., Natixis Distribution L.P., Natixis Distribution Corporation and Chairman of the Board of Natixis Distribution Corporation. |
121 |
Trustee and Officer Information
| | | | | | |
Name and Year of Birth | | Position(s) Held with the Trusts | | Term of Office1 and Length of Time Served | | Principal Occupation(s) During Past 5 Years2 |
| | |
| OFFICERS OF THE TRUSTS | | | | |
| | | |
Daniel J. Fuss (1933) One Financial Center Boston, MA 02111 | | Executive Vice President | | Since June 2003 | | Vice Chairman and Director, Loomis, Sayles & Company, L.P. |
| | | |
Russell L. Kane (1969) | | Secretary, Clerk and Chief Legal Officer | | Since July 2016 | | Executive Vice President, General Counsel, Secretary and Clerk, Natixis Distribution Corporation, Natixis Advisors, L.P. and Natixis Distribution, L.P.; formerly, Chief Compliance Officer for Mutual Funds, Senior Vice President, Deputy General Counsel, Assistant Secretary and Assistant Clerk, Natixis Distribution Corporation, Natixis Advisors, L.P. and Natixis Distribution, L.P. |
| | | |
Michael C. Kardok (1959) | | Treasurer, Principal Financial and Accounting Officer | | Since October 2004 | | Senior Vice President, Natixis Advisors, L.P. and Natixis Distribution, L.P. |
| | | |
Rosa Licea-Mailloux (1976) | | Chief Compliance Officer, Assistant Secretary and Anti-Money Laundering Officer | | Since July 2016 | | Senior Vice President, Deputy General Counsel, Assistant Secretary and Assistant Clerk, Natixis Distribution Corporation, Natixis Advisors, L.P. and Natixis Distribution, L.P.; formerly, Associate General Counsel, Natixis Distribution, L.P. |
| 1 | Each officer of the Trusts serves for an indefinite term in accordance with the Trusts’ current by-laws until the date his or her successor is elected and qualified, or until he or she sooner dies, retires, is removed or becomes disqualified. |
| 2 | Each person listed above, except as noted, holds the same position(s) with the Fund Complex. Previous positions during the past five years with Natixis Distribution, L.P., Natixis Advisors, L.P. or Loomis, Sayles & Company, L.P. are omitted, if not materially different from a trustee’s or officer’s current position with such entity. |
| 122
NATIXIS FUNDS
Supplement dated June 30, 2017 to the Natixis Funds Summary Prospectuses, dated February 28, 2017, March 31, 2017, and May 1, 2017, as may be revised or supplemented from time to time, for the following funds:
LOOMIS SAYLES HIGH INCOME FUND
Effective July 1, 2017, Loomis, Sayles & Company, L.P. has given a binding contractual undertaking to the Fund to limit the amount of the Fund’s total annual fund operating expenses (exclusive of brokerage expenses, interest expense, taxes, acquired fund fees and expenses, organizational and extraordinary expenses, such as litigation and indemnification expenses) to 1.05%, 1.80%, 0.75%, 1.05% and 0.80% of the Fund’s average daily net assets for Class A, Class C, Class N, Class T and Class Y shares, respectively.
This undertaking is in effect through January 31, 2019.
Accordingly, the Annual Fund Operating Expenses table and the Example table within the section “Fund Fees & Expenses” are amended and restated as follows with respect to the Fund:
|
| Annual Fund Operating Expenses |
(expenses that you pay each year as a percentage of the value of your investment)
| | | | | | | | | | | | | | | | | | | | |
| | | Class A | | | Class C | | | Class N | | | Class T | | | Class Y | |
Management fees | | | 0.60 | % | | | 0.60 | % | | | 0.60 | % | | | 0.60 | % | | | 0.60 | % |
Distribution and/or service (12b-1) fees | | | 0.25 | % | | | 1.00 | % | | | 0.00 | % | | | 0.25 | % | | | 0.00 | % |
Other expenses | | | 0.29 | % | | | 0.29 | % | | | 0.17 | %1 | | | 0.29 | %1 | | | 0.29 | % |
Total annual fund operating expenses | | | 1.14 | % | | | 1.89 | % | | | 0.77 | % | | | 1.14 | % | | | 0.89 | % |
Fee waiver and/or expense reimbursement2,3 | | | 0.09 | % | | | 0.09 | % | | | 0.02 | % | | | 0.09 | % | | | 0.09 | % |
Total annual fund operating expenses after fee waiver and/or expense reimbursement | | | 1.05 | % | | | 1.80 | % | | | 0.75 | % | | | 1.05 | % | | | 0.80 | % |
| 1 | Other expenses are estimated for the current fiscal year. |
| 2 | Loomis, Sayles & Company, L.P. (“Loomis Sayles” or the “Adviser”) has given a binding contractual undertaking to the Fund to limit the amount of the Fund’s total annual fund operating expenses to 1.05%, 1.80%, 0.75%, 1.05% and 0.80% of the Fund’s average daily net assets for Class A, C, N, T and Y shares, respectively, exclusive of brokerage |
This page not part of shareholder report
| | expenses, interest expense, taxes, acquired fund fees and expenses, organizational and extraordinary expenses, such as litigation and indemnification expenses. This undertaking is in effect through January 31, 2019 and may be terminated before then only with the consent of the Fund’s Board of Trustees. The Adviser will be permitted to recover, on a class by class basis, management fees waived and/or expenses reimbursed to the extent that expenses in later periods fall below the applicable expense limitations for Class A, C, N, T and Y shares. The Fund will not be obligated to repay any such waived/reimbursed fees and expenses more than one year after the end of the fiscal year in which the fees or expenses were waived/reimbursed. |
| 3 | NGAM Advisors has given a binding contractual undertaking to the Fund to reimburse any and all transfer agency expenses for Class N shares. This undertaking is in effect through January 31, 2018 and may be terminated before then only with the consent of the Fund’s Board of Trustees. |
This example is intended to help you compare the cost of investing in the Fund with the cost of investing in other mutual funds. The example assumes that you invest $10,000 in the Fund for the time periods indicated and then redeem all of your shares at the end of those periods (except where indicated). The example also assumes that your investment has a 5% return each year and that the Fund’s operating expenses remain the same, except that the example is based on Total Annual Fund Operating Expenses After Fee Waiver and/or Expense Reimbursement assuming that such waiver and/or reimbursement will only be in place through the dates noted above and on the Total Annual Fund Operating Expenses for the remaining periods. Although your actual costs may be high or lower, based on these assumptions your costs would be:
| | | | | | | | | | | | | | | | |
| If shares are redeemed: | |
| | | 1 year | | | 3 years | | | 5 years | | | 10 years | |
Class A | | $ | 528 | | | $ | 758 | | | $ | 1,012 | | | $ | 1,740 | |
Class C | | $ | 283 | | | $ | 580 | | | $ | 1,008 | | | $ | 2,200 | |
Class N | | $ | 77 | | | $ | 243 | | | $ | 425 | | | $ | 951 | |
Class T | | $ | 354 | | | $ | 589 | | | $ | 848 | | | $ | 1,589 | |
Class Y | | $ | 82 | | | $ | 269 | | | $ | 479 | | | $ | 1,083 | |
| | | | | | | | | | | | | | | | |
| If shares are not redeemed: | |
| | | 1 year | | | 3 years | | | 5 years | | | 10 years | |
Class C | | $ | 183 | | | $ | 580 | | | $ | 1,008 | | | $ | 2,200 | |
This page not part of shareholder report
| | |
| AEW Real Estate Fund | | Loomis Sayles Limited Term Government and Agency Fund |
| ASG Dynamic Allocation Fund | | Loomis Sayles Multi-Asset Income Fund |
| ASG Global Alternatives Fund | | Loomis Sayles Senior Floating Rate and Fixed Income Fund |
| ASG Managed Futures Strategy Fund | | Loomis Sayles Strategic Alpha Fund |
| ASG Tactical U.S. Market Fund | | Loomis Sayles Strategic Income Fund |
| Gateway Equity Call Premium Fund | | Loomis Sayles Value Fund |
| Gateway Fund | | Mirova Global Green Bond Fund |
| Loomis Sayles Core Plus Bond Fund | | Mirova Global Sustainable Equity Fund |
| Loomis Sayles Dividend Income Fund | | McDonnell Intermediate Municipal Bond Fund |
| Loomis Sayles Global Equity and Income Fund | | Natixis Oakmark Fund |
| Loomis Sayles Global Growth Fund | | Natixis Oakmark International Fund |
| Loomis Sayles Growth Fund | | Natixis U.S. Equity Opportunities Fund |
| Loomis Sayles High Income Fund | | Vaughan Nelson Select Fund |
| Loomis Sayles Intermediate Duration Bond Fund | | Vaughan Nelson Small Cap Value Fund |
| Loomis Sayles Investment Grade Bond Fund | | Vaughan Nelson Value Opportunity Fund |
Effective July 1, 2017, the information under sub-sections “Class A and C Shares” and “Class A Shares,” as applicable, in the section “Purchase and Sale of Fund Shares” in each Fund’s Summary is hereby amended and restated as follows:
The following chart shows the investment minimums for various types of accounts:
| | | | | | | | |
| Type of Account | | Minimum Initial
Purchase | | | Minimum Subsequent
Purchase | |
Any account other than those listed below | | $ | 2,500 | | | $ | 50 | |
For shareholders participating in Natixis Funds’ Investment Builder Program | | $ | 1,000 | | | $ | 50 | |
For Traditional IRA, Roth IRA, Rollover IRA, SEP-IRA and Keogh plans using the Natixis Funds’ prototype document (direct accounts, not held through intermediary) | | $ | 1,000 | | | $ | 50 | |
Coverdell Education Savings Accounts using the Natixis Funds’ prototype document (direct accounts, not held through intermediary) | | $ | 500 | | | $ | 50 | |
This page not part of shareholder report
There is no initial or subsequent investment minimum for:
| | • | | Wrap Fee Programs of certain broker-dealers, the advisers or NGAM Distribution, L.P. Please consult your financial representative to determine if your wrap fee program is subject to additional or different conditions or fees. |
| | • | | Certain Retirement Plans. Please consult your retirement plan administrator to determine if your retirement plan is subject to additional or different conditions or fees. |
| | • | | Clients of a Registered Investment Adviser where the Registered Investment Adviser receives an advisory, management or consulting fee. |
Effective July 1, 2017, the information under sub-section “Class Y Shares” in the section “Purchase and Sale of Fund Shares” in each Fund’s Summary is hereby amended and restated as follows:
Class Y shares of the Fund are generally subject to a minimum initial investment of $100,000 and a minimum subsequent investment of $50, except there is no minimum initial or subsequent investment for:
| | • | | Wrap Fee Programs of certain broker-dealers, the advisers or NGAM Distribution, L.P. Please consult your financial representative to determine if your wrap fee program is subject to additional or different conditions or fees. |
| | • | | Certain Retirement Plans. Please consult your retirement plan administrator to determine if your retirement plan is subject to additional or different conditions or fees. |
| | • | | Certain Individual Retirement Accounts if the amounts invested represent rollover distributions from investments by any of the retirement plans invested in the Fund. |
| | • | | Clients of a Registered Investment Adviser where the Registered Investment Adviser receives an advisory, management or consulting fee. |
| | • | | Fund Trustees, former Fund trustees, employees of affiliates of the Natixis Funds and other individuals who are affiliated with any Natixis Fund (this also applies to any spouse, parents, children, siblings, grandparents, grandchildren and in-laws of those mentioned) and Natixis affiliate employee benefit plans. |
At the discretion of NGAM Advisors, clients of NGAM Advisors and its affiliates may purchase Class Y shares of the Fund below the stated minimums.
This page not part of shareholder report
Item 2. Code of Ethics.
The Registrant has adopted a code of ethics that applies to the Registrant’s principal executive officer, principal financial officer and persons performing similar functions. There have been no amendments or waivers of the Registrant’s code of ethics during the period.
Item 3. Audit Committee Financial Expert.
The Board of Trustees of the Registrant has established an audit committee Mr. Edmond J. English, Mr. Richard A. Goglia, Ms. Sandra O. Moose, Mr. Erik R. Sirri and Ms. Cynthia L. Walker are members of the audit committee and have been designated as “audit committee financial experts” by the Board of Trustees. Each of these individuals is also an Independent Trustee of the Registrant.
Item 4. Principal Accountant Fees and Services.
Fees billed by the Principal Accountant for services rendered to the Registrant.
The table below sets forth fees billed by the principal accountant, PricewaterhouseCoopers LLP, for the past two fiscal years for professional services rendered in connection with a) the audit of the Registrant’s annual financial statements and services provided in connection with regulatory filings; b) audit-related services (including services that are reasonably related to the performance of the audit of the Registrant’s financial statements and but not reported under “Audit Fees”); c) tax compliance, tax advice and tax planning and d) all other fees billed for professional services rendered by the principal accountant to the Registrant, other than the services reported as a part of (a) through (c) of this Item.
| | | | | | | | | | | | | | | | | | | | | | | | | | | | | | | | |
| | | Audit fees | | | Audit-related fees1 | | | Tax fees2 | | | All other fees | |
| | | 10/1/15-
9/30/16 | | | 10/1/16-
9/30/17 | | | 10/1/15-
9/30/16 | | | 10/1/16-
9/30/17 | | | 10/1/15-
9/30/16 | | | 10/1/16-
9/30/17 | | | 10/1/15-
9/30/16 | | | 10/1/16-
9/30/17 | |
Loomis Sayles Core Plus Bond Fund | | $ | 43,333 | | | $ | 43,753 | | | $ | 950 | | | $ | 2,337 | | | $ | 8,024 | | | $ | 8,024 | | | $ | — | | | $ | — | |
| | 1. | Audit-related fees consist of: |
| | | 2016 & 2017 – performance of agreed-upon procedures related to the Registrant’s deferred compensation plan. |
| | | 2017 – Prospectus Consent. |
| | | 2016 & 2017 – review of Registrant’s tax returns. |
Aggregate fees billed to the Registrant for non-audit services during 2016 and 2017 were $8,974 and $10,361, respectively.
Fees billed by the Principal Accountant for services rendered to the Adviser and Control Affiliates.
The following table sets forth the fees billed by the Registrant’s principal accountant for non-audit services rendered to Loomis, Sayles & Company, L.P. and entities controlling, controlled by or under common control with Loomis, Sayles & Company, L.P. (“Control Affiliates”) that provide ongoing services to the Registrant, for engagements that related directly to the operations and financial reporting of the Registrant for the last two fiscal years.
| | | | | | | | | | | | | | | | | | | | | | | | |
| | | Audit-related fees | | | Tax fees | | | All other fees | |
| | | 10/1/15-
9/30/16 | | | 10/1/16-
9/30/17 | | | 10/1/15-
9/30/16 | | | 10/1/16-
9/30/17 | | | 10/1/15-
9/30/16 | | | 10/1/16-
9/30/17 | |
Control Affiliates | | $ | — | | | $ | — | | | $ | — | | | $ | — | | | $ | — | | | $ | — | |
The following table sets forth the aggregate fees billed by the Registrant’s principal accountant for non-audit services rendered to Loomis, Sayles & Company, L.P. and Control Affiliates that provide ongoing services to the Registrant, for the last two fiscal years, including the fees disclosed in the table above.
| | | | | | | | |
| | | Aggregate Non-Audit Fees | |
| | | 10/1/15-9/30/16 | | | 10/1/16-9/30/17 | |
Control Affiliates | | $ | 119,120 | | | $ | 77,290 | |
None of the services described above were approved pursuant to (c)(7)(i)(C) of Regulation S-X.
Audit Committee Pre Approval Policies.
Annually, the Registrant’s Audit Committee reviews the audit, audit-related, tax and other non-audit services together with the projected fees, for services proposed to be rendered to the Trust and/or other entities for which pre-approval is required during the upcoming year. Any subsequent revisions to already pre-approved services or fees (including fee increases) and requests for pre-approval of new services would be presented for consideration quarterly as needed.
If, in the opinion of management, a proposed engagement by the Registrant’s independent accountants needs to commence before the next regularly scheduled Audit Committee meeting, any member of the Audit Committee who is an Independent Trustee of the Registrant is authorized to pre-approve the engagement, but only for engagements to provide audit, audit related and tax services. This approval is subject to review of the full Audit Committee at its next quarterly meeting. All other engagements require the approval of all the members of the Audit Committee.
Item 5. Audit Committee of Listed Registrants.
Not applicable.
Item 6. Schedule of Investments.
Included as part of the Report to Shareholders filed as Item 1 herewith.
Item 7. Disclosure of Proxy Voting Policies and Procedures for Closed-End Management Investment Companies.
Not applicable.
Item 8. Portfolio Managers of Closed-End Management Investment Companies
Not applicable.
Item 9. Purchases of Equity Securities by Closed-End Management Investment Companies and Affiliated Purchasers.
Not applicable.
Item 10. Submission of Matters to a Vote of Securities Holders.
There were no material changes to the procedures by which shareholders may recommend nominees to the Registrant’s Board of Trustees.
Item 11. Controls and Procedures.
The Registrant’s principal executive officer and principal financial officer have concluded that the Registrant’s disclosure controls and procedures are sufficient to ensure that information required to be disclosed by the Registrant in this Form N-CSR was recorded, processed, summarized and reported within the time periods specified in the Securities and Exchange Commission’s rules and forms, based upon such officers’ evaluation of these controls and procedures as of a date within 90 days of the filing date of the report.
There were no changes in the Registrant’s internal control over financial reporting that occurred during the Registrant’s last fiscal quarter of the period covered by the report that has materially affected, or is reasonably likely to materially affect, the Registrant’s internal control over financial reporting.
Item 12. Exhibits.
| | |
| (a) (1) | | Code of Ethics required by Item 2 hereof, filed herewith as Exhibit (a)(1). |
| |
| (a) (2) | | Certifications of Principal Executive Officer and Principal Financial Officer pursuant to Rule 30a-2(a) under the Investment Company Act of 1940 (17 CFR 270.30a-2(a)), filed herewith as Exhibits (a)(2)(1) and (a)(2)(2), respectively. |
| |
| (a) (3) | | Not applicable. |
| |
| (b) | | Certification of Principal Executive Officer and Principal Financial Officer pursuant to Section 906 of Sarbanes-Oxley Act of 2002 are filed herewith as Exhibit (b). |
SIGNATURES
Pursuant to the requirements of the Securities Exchange Act of 1934 and the Investment Company Act of 1940, the Registrant has duly caused this report to be signed on its behalf by the undersigned, thereunto duly authorized.
| | |
| Natixis Funds Trust I |
| |
| By: | | /s/ David L. Giunta |
| Name: | | David L. Giunta |
| Title: | | President and Chief Executive Officer |
| Date: | | November 21, 2017 |
Pursuant to the requirements of the Securities Exchange Act of 1934 and the Investment Company Act of 1940, this report has been signed by the following persons on behalf of the Registrant and in the capacities and on the dates indicated.
| | |
| By: | | /s/ David L. Giunta |
| Name: | | David L. Giunta |
| Title: | | President and Chief Executive Officer |
| Date: | | November 21, 2017 |
| | |
| By: | | /s/ Michael C. Kardok |
| Name: | | Michael C. Kardok |
| Title: | | Treasurer |
| Date: | | November 21, 2017 |