UNITED STATES
SECURITIES AND EXCHANGE COMMISSION
Washington, D.C. 20549
FORM N-CSR
CERTIFIED SHAREHOLDER REPORT OF REGISTERED
MANAGEMENT INVESTMENT COMPANIES
Investment Company Act file number: 811-04323
Natixis Funds Trust I
(Exact name of Registrant as specified in charter)
888 Boylston Street, Suite 800
Boston, Massachusetts 02199-8197
(Address of principal executive offices) (Zip code)
Russell L. Kane, Esq.
Natixis Distribution, L.P.
888 Boylston Street, Suite 800
Boston, Massachusetts 02199-8197
(Name and address of agent for service)
Registrant’s telephone number, including area code: (617) 449-2822
Date of fiscal year end: September 30
Date of reporting period: September 30, 2017
Item 1. Reports to Stockholders.
The Registrant’s annual report transmitted to shareholders pursuant to Rule 30e-1 under the Investment Company Act of 1940 is as follows:
ANNUAL REPORT
September 30, 2017

Loomis Sayles Core Plus Bond Fund

TABLE OF CONTENTS
Portfolio Review page 1
Portfolio of Investments page 14
Financial Statements page 33
Notes to Financial Statements page 41
Shareholder Supplement enclosed
(previously posted to the Fund’s website)
LOOMIS SAYLES CORE PLUS BOND FUND
| | | | |
| Managers | | Symbols | | |
| Peter W. Palfrey, CFA® | | Class A | | NEFRX |
| Richard G. Raczkowski | | Class C | | NECRX |
| Loomis, Sayles & Company, L.P. | | Class N | | NERNX |
| | Class Y | | NERYX |
Investment Goal
The Fund seeks high total investment return through a combination of current income and capital appreciation.
Market Conditions
Following the November 2016 US presidential election, investors expected less accommodative US monetary policy and pro-business reform. These expectations drove the US dollar and equities higher, and weighed on many fixed income assets as the US Treasury yield curve steepened (a curve that shows the relationship among bond yields across the maturity spectrum). The Federal Reserve (Fed) raised interest rates on December 14, 2016, March 15, 2017 and June 14, 2017; investors took the increases in stride as a number of developments supported fixed income market performance through the rest of the period. The yield curve flattened out, the US dollar declined, global growth strengthened and corporate profits rebounded. Government bond yields remained low, driving investors into riskier assets like high yield credit and emerging markets. As a result, nearly all asset classes posted positive returns for the full period.
Despite an early rise, US inflation stayed largely range-bound for most of the period, hovering just below the Fed’s 2% target. Europe and Japan also struggled to meet inflation targets, while emerging markets saw steep declines. The spread between developed market and emerging market inflation reached its lowest point in 30 years.
All US Treasury yields rose during the 12-month period. However, much of the rise in longer-maturity yields took place shortly after the US presidential election while the two-year yield rose steadily over the entire period. Despite increasing overall, longer-term US Treasury yields declined from the start of 2017 until early September, when expectations for new and expansionary US fiscal policy and inflation began to rise.
Overall, investment grade corporate bonds generated positive return and outperformed duration-matched Treasuries (duration refers to a security’s price sensitivity to interest rate changes). The sector’s longer duration was beneficial as investors moved to the long end of the yield curve. High yield credit was a leading asset class throughout the period, benefiting from the “risk-on” environment and the search for yield. Improving corporate profits around the globe provided an additional tailwind to the sector.
Securitized credit assets generated positive total returns and outperformed duration-matched Treasuries. In September 2017, volatility remained muted after the Fed announced it would start tapering mortgage-backed security (MBS) reinvestments in October 2017; the move had been well telegraphed and was largely expected.
1 |
Emerging market bonds struggled at the beginning of the period, hurt by uncertainties related to global trade, the incoming US administration and geopolitics. But as 2017 progressed, sentiment shifted, emerging market bonds rallied and the asset class posted broadly positive returns for the full period. The sector benefited from the weakening US dollar, a rebound in corporate profits, and improving emerging market GDP growth.
Performance Results
For the 12 months ended September 30, 2017, Class Y shares of the Loomis Sayles Core Plus Bond Fund returned 2.10% at net asset value. The Fund outperformed its benchmark, the Bloomberg Barclays U.S. Aggregate Bond Index, which returned 0.07%.
Explanation of Fund Performance
Out-of-benchmark exposure to high yield corporate securities, particularly within industrials and financials, generated positive absolute and relative results. Selected energy, basic industry, wireless and finance company names were among the greatest positive contributors to the Fund’s relative performance.
The Fund maintained a meaningful underweight to US Treasuries. This positioning aided performance, as the period proved more beneficial for riskier assets. The Fund maintained an allocation to US Treasury inflation protected securities (TIPS), comprising 1-, 10- and 30-year TIPS. TIPS exposure benefited total and relative performance as TIPS outperformed nominal US Treasuries.
The Fund’s investment grade corporate holdings aided absolute and relative performance. Security selection among industrial names was the largest contributor to excess return, as selected basic industry and technology issues posted positive results.
Non-US-dollar exposure, particularly to the Mexican peso, boosted absolute and relative performance. After hitting a 14-year high during the fourth quarter of 2016, the US dollar steadily weakened through the rest of the period as risk appetite remained strong and fears about China’s economy and the potential for a US trade war waned.
A small out-of-benchmark allocation to emerging market issues, primarily Yankee bonds (US dollar-denominated bonds issued by a non-US entity), aided absolute and relative performance. The weaker US dollar fueled currency rallies in many emerging and developed overseas markets. Emerging markets also benefited from the search for yield, positive risk sentiment and improving fundamentals.
Security selection within our government-related exposure was positive; in particular, government-related sovereigns and oil-related Yankee bonds performed well.
Our longer-than-benchmark nominal duration was the largest detractor from performance. Over the period, we reduced this overweight from approximately 0.7 years longer to approximately 0.1 years longer than the benchmark.
Within investment grade corporates, the Fund’s financial holdings dragged on relative performance, primarily due to security selection. An underweight allocation to utility names also diminished excess return. The Fund maintained a small out-of-benchmark bank loan allocation, which had a neutral impact on relative return.
| 2
LOOMIS SAYLES CORE PLUS BOND FUND
Outlook
We believe that the Fed will tighten monetary conditions in a gradual and measured way as aggregate demand remains healthy, with the third hike of 2017 coming in December. The Fed began balance sheet reductions in October. We expect the market reaction to this activity to remain contained, given the well-telegraphed taper “caps” on both US Treasuries and MBS.
Corporate fundamentals have continued to indicate the US is in the late expansion phase of the credit cycle,1 with slowing margin growth, increased mergers and acquisitions, and rising leverage. Our view is that the cycle will continue to evolve slowly. The Trump administration may implement fiscal programs and tax reforms that could support asset classes like credit, although any impact is likely a 2018 event. Any reductions in corporate borrowing may preserve balance sheet health, promoting tighter credit spreads (the difference in yield between non-Treasury and Treasury yields of similar maturity) and lower default rates. While valuations may not be as attractive as they were last year, we continue to favor high yield relative to investment grade securities. We believe the primary risks to the credit markets include the pace of global growth, the timing of Fed tightening, shareholder-friendly activity and commodity price volatility.
While portfolio positioning became more defensive during the second half of 2016, the Fund remains oriented toward reflation. We maintain a broad underweight to the government sectors and a broad overweight to sectors offering a yield advantage over Treasuries.
We continued to overweight high-quality asset-backed securities (ABS), commercial mortgage-backed securities (CMBS) and high yield, though we have reduced our high yield allocation from nearly 20% during the summer of 2016 to approximately 10% at present. We also have a modest underweight to investment grade credit and continue to underweight the more interest-rate-sensitive government sectors, including US Treasuries, agencies and agency MBS, as we believe these sectors are fully valued.
While we do not believe the broad investment grade corporate market offers compelling value, we see selected opportunities in lower-quality investment grade companies, particularly outside the US.
Despite lower default rates and significant spread tightening in high yield over the past year, we are maintaining our reduced out-of-benchmark allocation to high yield and continue to search for selected issues with attractive yield and carry. Our allocation is primarily in higher-quality, shorter-maturity high yield names, which we believe offer better protection than lower-quality, longer-maturity names.
We believe bank loans offer front-end yield and can help protect against rising rates; we currently view secured better-quality high yield loans as the most attractive.
In April, we added a 5% position in one-year TIPS, bringing our total TIPS position to about 14% of the portfolio. We also continue to find breakeven inflation levels (the difference between yields on nominal Treasuries and TIPS of the same maturity) on
| 1 | A credit cycle is a cyclical pattern that follows credit availability and corporate health. |
3 |
10- and 30-year TIPS attractive relative to historical levels and versus our inflation and rates expectations. We expect TIPS to provide an attractive alternative to long-dated US Treasuries going forward.
Our relative portfolio duration is approximately 0.1 years longer than the benchmark on a nominal basis, but we expect it to behave about 1 year shorter because of our TIPS and other out-of-benchmark positions. Approximately 30% of the portfolio total duration contribution comes from TIPS, which we believe may provide incremental protection from rising inflation pressures.
Our non-US dollar exposure is slightly over 2% of total market value, composed primarily of the Mexican peso and a small allocation to the Uruguayan peso. Our focus has been on more pro-cyclical economies and foreign currencies tied to the improving global growth story.
Overall, we remain underweight agency mortgages, but recently opportunistically reduced our underweight from 15% to just 10%. We have also been adding to our agency CMBS exposure as a source of high-quality, 7- to 9-year spread in the government space. We continue to view home-equity conversion mortgages (HECMs) as an attractive alternative to 15-year agency MBS exposure given more stable duration and option-adjusted spreads.
We believe our yield advantage over the benchmark, in combination with our underweight to the government sector, should help reduce interest rate risk.
We may opportunistically add exposure back to investment grade and high yield credit and emerging market debt and currencies in the coming months, as valuations permit. Given our belief that we remain in the late expansion phase of the credit cycle, we are unlikely to return to the levels of overall credit exposure that we carried in recent years without a significant repricing of credit markets or a more significant improvement in the US and global economic outlook.
During periods in which the US dollar appreciates relative to foreign currencies, funds that hold non-US-dollar-denominated bonds may realize currency losses in connection with the maturity or sale of certain bonds. These losses impact a fund’s ordinary income distributions (to the extent that losses are not offset by realized currency gains within the fund’s fiscal year). A recognized currency loss, in accordance with federal tax rules, decreases the amount of ordinary income a fund has available to distribute, even though these bonds continue to generate coupon income.
Fund officers have analyzed the fund’s current portfolio of investments, schedule of maturities and the corresponding amounts of unrealized currency losses that may become realized in the fiscal year ending on September 30, 2018. Based on this analysis, fund officers believe that realized currency losses may have less of an impact on this fund’s distributions in the 2018 fiscal year. This analysis is based on certain assumptions, including but not limited to the level of foreign currency exchange rates, security prices, interest rates, fund advisors’ ability to manage realized currency losses and the net asset level of the fund. Changes to these assumptions could materially impact the analysis and the amounts of future fund distributions. Fund officers will continue to monitor on a regular basis and take the necessary actions required to manage the fund’s distributions to address realized currency losses while seeking to avoid a return of capital distribution.
| 4
LOOMIS SAYLES CORE PLUS BOND FUND
Hypothetical Growth of $100,000 Investment in Class Y Shares3
September 30, 2007 to September 30, 2017
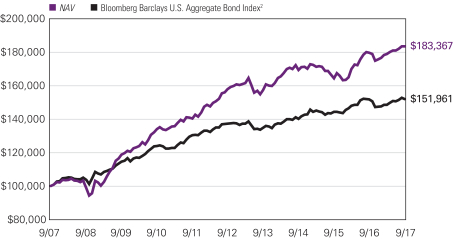
See notes to chart on page 6.
5 |
Average Annual Total Returns — September 30, 20173
| | | | | | | | | | | | | | | | | | | | | | | | |
| | | | | | | | | | | | | | | Expense Ratios4 | |
| | | 1 Year | | | 5 Years | | | 10 Years | | | Life of Class N | | | Gross | | | Net | |
| | | | | | | |
| Class Y (Inception 12/30/94) | | | | | | | | | | | | | | | | | | | | | | | | |
| NAV | | | 2.10 | % | | | 3.04 | % | | | 6.25 | % | | | — | % | | | 0.48 | % | | | 0.48 | % |
| | | | | | | |
| Class A (Inception 11/7/73) | | | | | | | | | | | | | | | | | | | | | | | | |
| NAV | | | 1.86 | | | | 2.79 | | | | 5.98 | | | | — | | | | 0.73 | | | | 0.73 | |
| With 4.25% Maximum Sales Charge | | | -2.47 | | | | 1.90 | | | | 5.52 | | | | — | | | | | | | | | |
| | | | | | | |
| Class C (Inception 12/30/94) | | | | | | | | | | | | | | | | | | | | | | | | |
| NAV | | | 1.08 | | | | 2.01 | | | | 5.19 | | | | — | | | | 1.48 | | | | 1.48 | |
| With CDSC1 | | | 0.09 | | | | 2.01 | | | | 5.19 | | | | | | | | | | | | | |
| | | | | | | |
| Class N (Inception 2/1/13) | | | | | | | | | | | | | | | | | | | | | | | | |
| NAV | | | 2.12 | | | | — | | | | — | | | | 2.97 | | | | 0.39 | | | | 0.39 | |
| | | | | | | |
| Comparative Performance | | | | | | | | | | | | | | | | | | | | | | | | |
| Bloomberg Barclays U.S. Aggregate Bond Index2 | | | 0.07 | | | | 2.06 | | | | 4.27 | | | | 2.35 | | | | | | | | | |
Performance data shown represents past performance and is no guarantee of, and not necessarily indicative of, future results. Total return and value will vary, and you may have a gain or loss when shares are sold. Current performance may be lower or higher than quoted. For most recent month-end performance, visit im.natixis.com. Performance for other share classes will be greater or less than shown based on differences and sales charges. You may not invest directly in an index. Performance for periods less than one year is cumulative, not annualized. Returns reflect changes in share price and reinvestment of dividends and capital gains, if any. The table(s) do not reflect taxes shareholders might owe on any fund distributions or when they redeem their shares.
| 1 | Class C shares performance assumes a 1% CDSC applied when you sell shares within one year of purchase. |
| 2 | The Bloomberg Barclays U.S. Aggregate Bond Index is a broad-based benchmark that measures the investment-grade, U.S. dollar-denominated, fixed-rate taxable bond market, including Treasuries, government-related and corporate securities, MBS (agency fixed-rate and hybrid ARM pass-throughs), ABS, and CMBS. The Bloomberg Barclays U.S. Aggregate Bond Index rolls up into other Bloomberg Barclays flagship indices, such as the multi-currency Bloomberg Barclays Global Aggregate Bond Index and the Bloomberg Barclays U.S. Universal Index, which includes high yield and emerging markets debt. The Bloomberg Barclays U.S. Aggregate Bond Index was created in 1986, with index history backfilled to January 1, 1976. You may not invest directly in an index. |
| 3 | Fund performance has been increased by fee waivers and/or expense reimbursements, if any, without which performance would have been lower. |
| 4 | Expense ratios are as shown in the Fund’s prospectus in effect as of the date of this report. The expense ratios for the current reporting period can be found in the Financial Highlights section of this report under Ratios to Average Net Assets. Net expenses reflect contractual expense caps set to expire on 1/31/18. When a Fund’s expenses are below the cap, gross and net expense ratios will be the same. See Note 6 of the Notes to Financial Statements for more information about the Fund’s expense caps. |
| 6
ADDITIONAL INFORMATION
The views expressed in this report reflect those of the portfolio managers as of the dates indicated. The managers’ views are subject to change at any time without notice based on changes in market or other conditions. References to specific securities or industries should not be regarded as investment advice. Because the Fund is actively managed, there is no assurance that it will continue to invest in the securities or industries mentioned.
All investing involves risk, including the risk of loss. There is no assurance that any investment will meet its performance objectives or that losses will be avoided.
ADDITIONAL INDEX INFORMATION
This document may contain references to third party copyrights, indexes, and trademarks, each of which is the property of its respective owner. Such owner is not affiliated with Natixis Investment Managers or any of its related or affiliated companies (collectively “Natixis Affiliates”) and does not sponsor, endorse or participate in the provision of any Natixis Affiliates services, funds or other financial products.
The index information contained herein is derived from third parties and is provided on an “as is” basis. The user of this information assumes the entire risk of use of this information. Each of the third party entities involved in compiling, computing or creating index information disclaims all warranties (including, without limitation, any warranties of originality, accuracy, completeness, timeliness, non-infringement, merchantability and fitness for a particular purpose) with respect to such information.
PROXY VOTING INFORMATION
A description of the Natixis Funds’ proxy voting policies and procedures is available without charge, upon request, by calling Natixis Funds at 800-225-5478; on the Fund’s website at im.natixis.com; and on the Securities and Exchange Commission’s (“SEC’s”) website at www.sec.gov. Information regarding how the Fund voted proxies relating to portfolio securities the most recent 12-month period ended June 30 is available from the Fund’s website and the SEC’s website.
QUARTERLY PORTFOLIO SCHEDULES
The Natixis Funds file complete schedules of portfolio holdings with the SEC for the first and third quarters of each fiscal year on Form N-Q. The Fund’s Forms N-Q are available on the SEC’s website at www.sec.gov and may be reviewed and copied at the SEC’s Public Reference Room in Washington, DC. Information on the operation of the Public Reference Room may be obtained by calling 800-SEC-0330.
7 |
UNDERSTANDING FUND EXPENSES
As a mutual fund shareholder, you incur different costs: transaction costs, including sales charges (loads) on purchases and contingent deferred sales charges on redemptions; and ongoing costs, including management fees, distribution and/or service fees (12b-1 fees), and other fund expenses. Certain exemptions may apply. These costs are described in more detail in the Fund’s prospectuses. The following examples are intended to help you understand the ongoing costs of investing in the Fund and help you compare these with the ongoing costs of investing in other mutual funds.
The first line in the table of each class of Fund shares shows the actual account values and actual fund expenses you would have paid on a $1,000 investment in the Fund from April 1, 2017 through September 30, 2017. To estimate the expenses you paid over the period, simply divide your account value by $1,000 (for example $8,600 account value divided by $1,000 = 8.6) and multiply the result by the number in the Expenses Paid During Period column as shown below for your class.
The second line in the table of each class of Fund shares provides information about hypothetical account values and hypothetical expenses based on the Fund’s actual expense ratios and an assumed rate of return of 5% per year before expenses, which is not the Fund’s actual return. The hypothetical account values and expenses may not be used to estimate the actual ending account balance or expenses you paid on your investment for the period. You may use this information to compare the ongoing costs of investing in the Fund to other funds. To do so, compare this 5% hypothetical example with the 5% hypothetical examples that appear in the shareholder reports of the other funds.
Please note that the expenses shown reflect ongoing costs only, and do not include any transaction costs, such as sales charges. Therefore, the second line in the table of each fund is useful in comparing ongoing costs only, and will not help you determine the relative costs of owning different funds. If transaction costs were included, total costs would be higher.
| | | | | | | | | | | | |
| LOOMIS SAYLES CORE PLUS BOND FUND | | BEGINNING
ACCOUNT VALUE
4/1/2017 | | | ENDING
ACCOUNT VALUE
9/30/2017 | | | EXPENSES PAID
DURING PERIOD*
4/1/2017 – 9/30/2017 | |
| Class A | | | | | | | | | | | | |
| Actual | | | $1,000.00 | | | | $1,024.00 | | | | $3.65 | |
| Hypothetical (5% return before expenses) | | | $1,000.00 | | | | $1,021.46 | | | | $3.65 | |
| Class C | | | | | | | | | | | | |
| Actual | | | $1,000.00 | | | | $1,020.20 | | | | $7.44 | |
| Hypothetical (5% return before expenses) | | | $1,000.00 | | | | $1,017.70 | | | | $7.44 | |
| Class N | | | | | | | | | | | | |
| Actual | | | $1,000.00 | | | | $1,025.60 | | | | $1.98 | |
| Hypothetical (5% return before expenses) | | | $1,000.00 | | | | $1,023.11 | | | | $1.98 | |
| Class Y | | | | | | | | | | | | |
| Actual | | | $1,000.00 | | | | $1,025.10 | | | | $2.39 | |
| Hypothetical (5% return before expenses) | | | $1,000.00 | | | | $1,022.71 | | | | $2.38 | |
| * | Hypothetical expenses are equal to the Fund’s annualized expense ratio: 0.72%, 1.47%, 0.39% and 0.47% for Class A, C, N and Y, respectively, multiplied by the average account value over the period, multiplied by the number of days in the most recent fiscal half-year (183), divided by 365 (to reflect the half-year period). |
| 8
BOARD APPROVAL OF THE EXISTING ADVISORY AGREEMENTS
The Board of Trustees of the Trust (the “Board”), including the Independent Trustees, considers matters bearing on the Fund’s advisory agreement and the Fund’s Advisory Administration Agreement (collectively, the “Agreements”) at most of its meetings throughout the year. Each year, usually in the spring, the Contract Review Committee of the Board meets to review the Agreements to determine whether to recommend that the full Board approve the continuation of the Agreements, typically for an additional one-year period. After the Contract Review Committee has made its recommendation, the full Board, including the Independent Trustees, determines whether to approve the continuation of the Agreements.
In connection with these meetings, the Trustees receive materials that the Fund’s investment adviser (the “Adviser”) believes to be reasonably necessary for the Trustees to evaluate the Agreements. These materials generally include, among other items, (i) information on the investment performance of the Fund and the performance of a peer group of funds and the Fund’s performance benchmarks, (ii) information on the Fund’s advisory fees and other expenses, including information comparing the Fund’s expenses to the fees charged to institutional accounts with similar strategies managed by the Adviser, if any, and to those of a peer group of funds and information about any applicable expense caps and/or fee “breakpoints,” (iii) sales and redemption data in respect of the Fund, (iv) information about the profitability of the Agreements to the Adviser and (v) information obtained through the completion by the Adviser of a questionnaire distributed on behalf of the Trustees. The Board, including the Independent Trustees, also considers other matters such as (i) the Adviser’s financial results and financial condition, (ii) the Fund’s investment objective and strategies and the size, education and experience of the Adviser’s investment staff and its use of technology, external research and trading cost measurement tools, (iii) arrangements in respect of the distribution of the Fund’s shares and the related costs, (iv) the allocation of the Fund’s brokerage, if any, including, if applicable, allocations to brokers affiliated with the Adviser and the use of “soft” commission dollars to pay Fund expenses and to pay for research and other similar services, (v) the resources devoted to, and the record of compliance with, the Fund’s investment policies and restrictions, policies on personal securities transactions and other compliance policies, (vi) the Adviser’s policies and procedures relating to, among other things, compliance, trading and best execution, proxy voting and valuation, (vii) information about amounts invested by the Fund’s portfolio managers in the Fund or in similar accounts that they manage and (viii) the general economic outlook with particular emphasis on the mutual fund industry. Throughout the process, the Trustees are afforded the opportunity to ask questions of and request additional materials from the Adviser.
In addition to the materials requested by the Trustees in connection with their annual consideration of the continuation of the Agreements, the Trustees receive materials in advance of each regular quarterly meeting of the Board that provide detailed information about the Fund’s investment performance and the fees charged to the Fund for advisory and other services. This information generally includes, among other things, an internal
9 |
performance rating for the Fund based on agreed-upon criteria, graphs showing the Fund’s performance and fee differentials against the Fund’s peer group/category, performance ratings provided by a third-party, total return information for various periods, and third-party performance rankings for various periods comparing the Fund against similarly categorized funds. The portfolio management team for the Fund or other representatives of the Adviser make periodic presentations to the Contract Review Committee and/or the full Board, and if the Fund is identified as presenting possible performance concerns it may be subject to more frequent board presentations and reviews. In addition, each quarter the Trustees are provided with detailed statistical information about the Fund’s portfolio. The Trustees also receive periodic updates between meetings.
The Board most recently approved the continuation of the Agreements at its meeting held in June 2017. The Agreements were continued for a one-year period for the Fund. In considering whether to approve the continuation of the Agreements, the Board, including the Independent Trustees, did not identify any single factor as determinative. Individual Trustees may have evaluated the information presented differently from one another, giving different weights to various factors. Matters considered by the Trustees, including the Independent Trustees, in connection with their approval of the Agreements included, but were not limited to, the factors listed below.
The nature, extent and quality of the services provided to the Fund under the Agreements. The Trustees considered the nature, extent and quality of the services provided by the Adviser and its affiliates to the Fund and the resources dedicated to the Fund by the Adviser and its affiliates.
The Trustees considered not only the advisory services provided by the Adviser to the Fund, but also the monitoring and oversight services provided by Natixis Advisors, L.P. (“Natixis Advisors”). They also considered the administrative services provided by Natixis Advisors and its affiliates to the Fund.
The Trustees also considered the benefits to shareholders of investing in a mutual fund that is part of a family of funds that offers shareholders the right to exchange shares of one type of fund for shares of another type of fund, and provides a variety of fund and shareholder services.
After reviewing these and related factors, the Trustees concluded, within the context of their overall conclusions regarding the Agreements, that the nature, extent and quality of services provided supported the renewal of the Agreements.
Investment performance of the Fund and the Adviser. As noted above, the Trustees received information about the performance of the Fund over various time periods, including information that compared the performance of the Fund to the performance of a peer group and category of funds and the Fund’s performance benchmark. In addition, the Trustees also reviewed data prepared by an independent third party that analyzed the performance of the Fund using a variety of performance metrics, including metrics that also measured the performance of the Fund on a risk adjusted basis.
The Board noted that, through December 31, 2016, the Fund’s one- and three-year performance stated as percentile rankings within categories selected by the independent
| 10
third-party data provider was as follows (where the best performance would be in the first percentile of its category):
| | | | | | | | |
| | | One-Year | | | Three-Year | |
Loomis Sayles Core Plus Bond Fund | | | 2 | % | | | 39 | % |
The Trustees also considered the Adviser’s performance and reputation generally, the performance of the fund family generally, and the historical responsiveness of the Adviser to Trustee concerns about performance and the willingness of the Adviser to take steps intended to improve performance.
After reviewing these and related factors, the Trustees concluded, within the context of their overall conclusions regarding the Agreements, that the performance of the Fund and the Adviser and/or other relevant factors supported the renewal of the Agreements.
The costs of the services to be provided and profits to be realized by the Adviser and its affiliates from their respective relationships with the Fund. The Trustees considered the fees charged to the Fund for advisory services as well as the total expense level of the Fund. This information included comparisons (provided both by management and also by an independent third party) of the Fund’s advisory fee and total expense level to those of its peer group and information about the advisory fees charged by the Adviser to comparable accounts (such as institutional separate accounts), as well as information about differences in such fees and the reasons for any such differences. In considering the fees charged to comparable accounts, the Trustees considered, among other things, management’s representations about the differences between managing mutual funds as compared to other types of accounts, including the additional resources required to effectively manage mutual fund assets and the greater regulatory costs associated with the management of such assets. In evaluating the Fund’s advisory fee, the Trustees also took into account the demands, complexity and quality of the investment management of the Fund, as well as the need for the Adviser to offer competitive compensation and the potential need to expend additional resources to the extent the Fund grows in size. The Trustees considered that over the past several years, management had made recommendations regarding reductions in advisory fee rates, implementation of advisory fee breakpoints and the institution of advisory fee waivers and expense caps for various funds in the fund family. The Trustees noted that the Fund currently has an expense cap in place, and that the current expenses are below the cap.
The Trustees also considered the compensation directly or indirectly received by the Adviser and its affiliates from their relationships with the Fund. The Trustees reviewed information provided by management as to the profitability of the Adviser’s and its affiliates’ relationships with the Fund, and information about the allocation of expenses used to calculate profitability. They also reviewed information provided by management about the effect of distribution costs and changes in asset levels on Adviser profitability, including information regarding resources spent on distribution activities. When reviewing profitability, the Trustees also considered information about court cases in which adviser compensation or profitability were issues, the performance of the Fund, the expense levels of the Fund, and whether the Adviser had implemented breakpoints and/or expense caps. The Trustees also noted management’s history of proposing additional advisory fee breakpoints as the Fund grew to substantially larger scale.
11 |
After reviewing these and related factors, the Trustees concluded, within the context of their overall conclusions regarding the Agreement, that the advisory fee charged to the Fund was fair and reasonable, and that the costs of these services generally and the related profitability of the Adviser and its affiliates in respect of their relationships with the Fund supported the renewal of the Agreements.
Economies of Scale. The Trustees considered the existence of any economies of scale in the provision of services by the Adviser and whether those economies are shared with the Fund through breakpoints in its investment advisory fee or other means, such as expense waivers or caps. The Trustees also discussed with management the factors considered with respect to the implementation of breakpoints in investment advisory fees or expense waivers or caps for certain funds. Management explained that a number of factors are taken into account in considering the possible implementation of breakpoints or an expense cap for a fund, including, among other things, factors such as a fund’s assets, the projected growth of a fund, projected profitability and a fund’s fees and performance. With respect to economies of scale, the Trustees noted that the Fund’s management fee and overall net expense ratio were below the median compared to a peer group of funds and that the Fund was subject to an expense cap or waiver, as well as breakpoints in the fees payable under the Agreements. In considering these issues, the Trustees also took note of the costs of the services provided (both on an absolute and on a relative basis) and the profitability to the Adviser and its affiliates of their relationships with the Fund, as discussed above.
After reviewing these and related factors, the Trustees concluded, within the context of their overall conclusions regarding the Agreements, that the extent to which economies of scale were shared with the Fund supported the renewal of the Agreements.
The Trustees also considered other factors, which included but were not limited to the following:
| · | | The effect of recent market and economic events on the performance, asset levels and expense ratios of the Fund. |
| · | | Whether the Fund has operated in accordance with its investment objective and the Fund’s record of compliance with its investment restrictions, and the compliance programs of the Fund and the Adviser. They also considered the compliance-related resources the Adviser and its affiliates were providing to the Fund. |
| · | | The nature, quality, cost and extent of administrative and shareholder services performed by the Adviser and its affiliates under the Agreements. |
| · | | So-called “fallout benefits” to the Adviser, such as the engagement of affiliates of the Adviser to provide distribution, administrative and brokerage services to the Fund, and the benefits of research made available to the Adviser by reason of brokerage commissions (if any) generated by the Fund’s securities transactions. The Trustees also considered the benefits to the parent company of Natixis Advisors from the retention of the Adviser. The Trustees considered the possible conflicts of interest associated with these fallout and other benefits, and the reporting, disclosure and other processes in place to disclose and monitor such possible conflicts of interest. |
| 12
| · | | The Trustees’ review and discussion of the Fund’s advisory arrangements in prior years, and management’s record of responding to Trustee concerns raised during the year and in prior years. |
Based on their evaluation of all factors that they deemed to be material, including those factors described above, and assisted by the advice of independent counsel, the Trustees, including the Independent Trustees, concluded that the existing Agreements should be continued through June 30, 2018.
13 |
Portfolio of Investments – as of September 30, 2017
Loomis Sayles Core Plus Bond Fund
| | | | | | | | |
Principal
Amount (‡) | | | Description | | Value (†) | |
| | Bonds and Notes — 92.1% of Net Assets | |
| | | | ABS Car Loan — 3.0% | | | | |
| $ | 3,060,000 | | | AmeriCredit Automobile Receivables Trust, Series 2014-2, Class C, 2.180%, 6/08/2020 | | $ | 3,068,624 | |
| | 1,553,774 | | | AmeriCredit Automobile Receivables Trust, Series 2014-3, Class B, 1.920%, 11/08/2019 | | | 1,554,545 | |
| | 4,262,000 | | | AmeriCredit Automobile Receivables Trust, Series 2014-3, Class C, 2.580%, 9/08/2020 | | | 4,290,090 | |
| | 2,438,000 | | | AmeriCredit Automobile Receivables Trust, Series 2014-4, Class C, 2.470%, 11/09/2020 | | | 2,453,815 | |
| | 16,421,000 | | | AmeriCredit Automobile Receivables Trust, Series 2015-1, Class C, 2.510%, 1/08/2021 | | | 16,536,922 | |
| | 7,135,000 | | | AmeriCredit Automobile Receivables Trust, Series 2015-4, Class B, 2.110%, 1/08/2021 | | | 7,149,164 | |
| | 4,495,000 | | | AmeriCredit Automobile Receivables Trust, Series 2015-4, Class C, 2.880%,��7/08/2021 | | | 4,536,421 | |
| | 485,000 | | | AmeriCredit Automobile Receivables Trust, Series 2017-1, Class A3, 1.870%, 8/18/2021 | | | 484,821 | |
| | 1,950,000 | | | Avis Budget Rental Car Funding AESOP LLC, Series 2012-3A, Class A, 2.100%, 3/20/2019, 144A | | | 1,951,936 | |
| | 1,535,000 | | | Avis Budget Rental Car Funding AESOP LLC, Series 2013-1A, Class B, 2.620%, 9/20/2019, 144A | | | 1,538,716 | |
| | 3,900,000 | | | Avis Budget Rental Car Funding AESOP LLC, Series 2013-2A, Class A, 2.970%, 2/20/2020, 144A | | | 3,936,324 | |
| | 2,000,000 | | | Avis Budget Rental Car Funding AESOP LLC, Series 2015-1A, Class A, 2.500%, 7/20/2021, 144A | | | 1,997,010 | |
| | 11,955,000 | | | Avis Budget Rental Car Funding AESOP LLC, Series 2016-1A, Class A, 2.990%, 6/20/2022, 144A | | | 12,060,969 | |
| | 15,005,000 | | | Avis Budget Rental Car Funding AESOP LLC, Series 2016-2A, Class A, 2.720%, 11/20/2022, 144A | | | 15,005,059 | |
| | 10,350,000 | | | Avis Budget Rental Car Funding AESOP LLC, Series 2017-1A, Class A, 3.070%, 9/20/2023, 144A | | | 10,433,239 | |
| | 2,602,681 | | | CPS Auto Receivables Trust, Series 2015-A, Class A, 1.530%, 7/15/2019, 144A | | | 2,601,870 | |
| | 2,910,984 | | | CPS Auto Receivables Trust, Series 2015-B, Class A, 1.650%, 11/15/2019, 144A | | | 2,910,995 | |
| | 14,384,000 | | | CPS Auto Receivables Trust, Series 2015-C, Class C, 3.420%, 8/16/2021, 144A | | | 14,502,664 | |
| | 6,754,034 | | | Credit Acceptance Auto Loan Trust, Series 2014-2A, Class B, 2.670%, 9/15/2022, 144A | | | 6,755,776 | |
| | 354,617 | | | Credit Acceptance Auto Loan Trust, Series 2015-1A, Class A, 2.000%, 7/15/2022, 144A | | | 354,678 | |
| | 7,515,000 | | | Credit Acceptance Auto Loan Trust, Series 2016-2A, Class A, 2.420%, 11/15/2023, 144A | | | 7,550,819 | |
| | 8,230,000 | | | Credit Acceptance Auto Loan Trust, Series 2016-3A, Class A, 2.150%, 4/15/2024, 144A | | | 8,209,523 | |
| | 3,600,000 | | | Credit Acceptance Auto Loan Trust, Series 2017-1A, Class A, 2.560%, 10/15/2025, 144A | | | 3,610,498 | |
See accompanying notes to financial statements.
| 14
Portfolio of Investments – as of September 30, 2017
Loomis Sayles Core Plus Bond Fund – (continued)
| | | | | | | | |
Principal
Amount (‡) | | | Description | | Value (†) | |
| | | | ABS Car Loan — continued | | | | |
| $ | 2,982,041 | | | Drive Auto Receivables Trust, Series 2016-BA, Class B, 2.560%, 6/15/2020, 144A | | $ | 2,989,243 | |
| | 7,260,000 | | | Drive Auto Receivables Trust, Series 2016-BA, Class C, 3.190%, 7/15/2022, 144A | | | 7,333,685 | |
| | 3,185,000 | | | Drive Auto Receivables Trust, Series 2017-1, Class B, 2.360%, 3/15/2021 | | | 3,190,533 | |
| | 2,595,000 | | | Drive Auto Receivables Trust, Series 2017-AA, Class B, 2.510%, 1/15/2021, 144A | | | 2,608,662 | |
| | 3,625,000 | | | Drive Auto Receivables Trust, Series 2017-AA, Class C, 2.980%, 1/18/2022, 144A | | | 3,663,497 | |
| | 1,325,000 | | | Drive Auto Receivables Trust, Series 2017-BA, Class B, 2.200%, 5/15/2020, 144A | | | 1,327,746 | |
| | 2,353,180 | | | DT Auto Owner Trust, Series 2014-3A, Class C, 3.040%, 9/15/2020, 144A | | | 2,357,890 | |
| | 2,489,245 | | | DT Auto Owner Trust, Series 2017-1A, Class A, 1.560%, 6/15/2020, 144A | | | 2,487,677 | |
| | 3,270,193 | | | DT Auto Owner Trust, Series 2017-2A, Class A, 1.720%, 5/15/2020, 144A | | | 3,270,497 | |
| | 1,417,206 | | | Exeter Automobile Receivables Trust, Series 2014-3A, Class B, 2.770%, 11/15/2019, 144A | | | 1,419,600 | |
| | 1,368,415 | | | Exeter Automobile Receivables Trust, Series 2016-1A, Class A, 2.350%, 7/15/2020, 144A | | | 1,369,614 | |
| | 3,348,015 | | | Exeter Automobile Receivables Trust, Series 2017-1A, Class A, 1.960%, 3/15/2021, 144A | | | 3,341,350 | |
| | 2,606,172 | | | First Investors Auto Owner Trust, Series 2014-3A, Class A3, 1.670%, 11/16/2020, 144A | | | 2,606,271 | |
| | 1,738,810 | | | First Investors Auto Owner Trust, Series 2017-1A, Class A1, 1.690%, 4/15/2021, 144A | | | 1,736,342 | |
| | 52,851 | | | Flagship Credit Auto Trust, Series 2014-2, Class A, 1.430%, 12/16/2019, 144A | | | 52,852 | |
| | 5,672,863 | | | Flagship Credit Auto Trust, Series 2016-1, Class A, 2.770%, 12/15/2020, 144A | | | 5,708,402 | |
| | 5,336,413 | | | Santander Drive Auto Receivables Trust, Series 2014-2, Class C, 2.330%, 11/15/2019 | | | 5,348,505 | |
| | 1,229,607 | | | Santander Drive Auto Receivables Trust, Series 2014-3, Class C, 2.130%, 8/17/2020 | | | 1,231,556 | |
| | 2,292,433 | | | Santander Drive Auto Receivables Trust, Series 2014-4, Class C, 2.600%, 11/16/2020 | | | 2,300,985 | |
| | 6,190,900 | | | Santander Drive Auto Receivables Trust, Series 2014-5, Class C, 2.460%, 6/15/2020 | | | 6,214,891 | |
| | 4,440,000 | | | Santander Drive Auto Receivables Trust, Series 2017-2, Class B, 2.210%, 10/15/2021 | | | 4,446,897 | |
| | | | | | | | |
| | | | | | | 198,501,173 | |
| | | | | | | | |
| | | | ABS Credit Card — 0.4% | | | | |
| | 463,000 | | | World Financial Network Credit Card Master Trust, Series 2012-A, Class A, 3.140%, 1/17/2023 | | | 471,497 | |
| | 11,115,000 | | | World Financial Network Credit Card Master Trust, Series 2016-A, Class A, 2.030%, 4/15/2025 | | | 10,986,604 | |
| | 12,265,000 | | | World Financial Network Credit Card Master Trust, Series 2016-C, Class A, 1.720%, 8/15/2023 | | | 12,188,408 | |
| | | | | | | | |
| | | | | | | 23,646,509 | |
| | | | | | | | |
See accompanying notes to financial statements.
15 |
Portfolio of Investments – as of September 30, 2017
Loomis Sayles Core Plus Bond Fund – (continued)
| | | | | | | | |
Principal
Amount (‡) | | | Description | | Value (†) | |
| | | | ABS Home Equity — 1.6% | | | | |
| $ | 5,338,683 | | | Bayview Opportunity Master Fund IVa Trust, Series 2016-SPL1, Class A, 4.000%, 4/28/2055, 144A | | $ | 5,528,446 | |
| | 2,891,833 | | | Bayview Opportunity Master Fund IVa Trust, Series 2017-RT1, Class A1, 3.000%, 3/28/2057, 144A(a) | | | 2,923,530 | |
| | 7,434,850 | | | Bayview Opportunity Master Fund IVa Trust, Series 2017-SPL1, Class A, 4.000%, 10/28/2064, 144A(a) | | | 7,748,637 | |
| | 3,149,719 | | | Bayview Opportunity Master Fund IVb Trust, Series 2017-SPL2, Class A, 4.000%, 6/28/2054, 144A(a) | | | 3,282,162 | |
| | 3,501,241 | | | Bayview Opportunity Master Fund IVb Trust, Series 2017-SPL3, Class A, 4.000%, 11/28/2053, 144A(a) | | | 3,645,584 | |
| | 17,225,950 | | | Colony American Finance Ltd., Series 2015-1, Class A, 2.896%, 10/15/2047, 144A | | | 17,328,675 | |
| | 4,003,237 | | | Colony American Homes, Series 2014-1A, Class A, 1-month LIBOR + 1.150%, 2.384%, 5/17/2031, 144A(m) | | | 4,019,989 | |
| | 99,775 | | | Countrywide Asset-Backed Certificates, Series 2004-S1, Class A3, 5.115%, 2/25/2035(a) | | | 100,812 | |
| | 10,310,350 | | | Home Partners of America Trust, Series 2016-1, Class A, 1-month LIBOR + 1.650%, 2.884%, 3/17/2033, 144A(m) | | | 10,419,953 | |
| | 6,156,480 | | | Mill City Mortgage Trust, Series 2015-2, Class A1, 3.000%, 9/25/2057, 144A(a) | | | 6,182,512 | |
| | 4,693,633 | | | Mill City Mortgage Trust, Series 2016-1, Class A1, 2.500%, 4/25/2057, 144A(a) | | | 4,691,175 | |
| | 2,890,000 | | | Sequoia Mortgage Trust, Series 2017-CH1, Class A1, 4.000%, 10/25/2047, 144A(a)(b) | | | 2,967,183 | |
| | 1,454,000 | | | Towd Point Mortgage Trust, Series 2015-1, Class A5, 3.521%, 10/25/2053, 144A(a) | | | 1,502,690 | |
| | 13,331,956 | | | Towd Point Mortgage Trust, Series 2015-2, Class 1AE2, 2.750%, 11/25/2060, 144A(a) | | | 13,390,580 | |
| | 5,018,000 | | | Towd Point Mortgage Trust, Series 2015-4, Class M2, 3.750%, 4/25/2055, 144A(a) | | | 5,115,995 | |
| | 9,655,785 | | | Towd Point Mortgage Trust, Series 2016-2, Class A1A, 2.750%, 8/25/2055, 144A(a) | | | 9,698,598 | |
| | 6,017,000 | | | Towd Point Mortgage Trust, Series 2016-2, Class M2, 3.000%, 8/25/2055, 144A(a) | | | 5,645,207 | |
| | 2,726,000 | | | Towd Point Mortgage Trust, Series 2016-3, Class M1, 3.500%, 4/25/2056, 144A(a) | | | 2,749,667 | |
| | | | | | | | |
| | | | | | | 106,941,395 | |
| | | | | | | | |
| | | | ABS Other — 1.0% | | | | |
| | 9,092,850 | | | DB Master Finance LLC, Series 2015-1A, Class A2I, 3.262%, 2/20/2045, 144A | | | 9,107,126 | |
| | 205,292 | | | OneMain Financial Issuance Trust, Series 2014-2A, Class A, 2.470%, 9/18/2024, 144A | | | 205,526 | |
| | 19,255,000 | | | OneMain Financial Issuance Trust, Series 2015-1A, Class A, 3.190%, 3/18/2026, 144A | | | 19,443,397 | |
| | 13,980,000 | | | OneMain Financial Issuance Trust, Series 2016-1A, Class A, 3.660%, 2/20/2029, 144A | | | 14,310,628 | |
| | 15,600,000 | | | OneMain Financial Issuance Trust, Series 2016-2A, Class A, 4.100%, 3/20/2028, 144A | | | 15,870,939 | |
See accompanying notes to financial statements.
| 16
Portfolio of Investments – as of September 30, 2017
Loomis Sayles Core Plus Bond Fund – (continued)
| | | | | | | | |
Principal
Amount (‡) | | | Description | | Value (†) | |
| | | | ABS Other — continued | | | | |
| $ | 6,209,200 | | | TAL Advantage V LLC, Series 2014-3A, Class A, 3.270%, 11/21/2039, 144A | | $ | 6,177,623 | |
| | | | | | | | |
| | | | | | | 65,115,239 | |
| | | | | | | | |
| | | | ABS Student Loan — 0.0% | | | | |
| | 604,865 | | | SoFi Professional Loan Program LLC, Series 2014-A, Class A2, 3.020%, 10/25/2027, 144A | | | 611,379 | |
| | 1,953,239 | | | SoFi Professional Loan Program LLC, Series 2014-B, Class A2, 2.550%, 8/27/2029, 144A | | | 1,960,903 | |
| | | | | | | | |
| | | | | | | 2,572,282 | |
| | | | | | | | |
| | | | Aerospace & Defense — 0.2% | | | | |
| | 921,000 | | | Bombardier, Inc., 5.750%, 3/15/2022, 144A | | | 891,068 | |
| | 12,842,000 | | | Embraer Netherlands Finance BV, 5.050%, 6/15/2025 | | | 13,628,572 | |
| | | | | | | | |
| | | | | | | 14,519,640 | |
| | | | | | | | |
| | | | Agency Commercial Mortgage-Backed Securities — 1.9% | | | | |
| | 15,165,000 | | | Federal National Mortgage Association, Series 2015-M15, Class A2, 2.923%, 10/25/2025(a) | | | 15,330,567 | |
| | 6,750,000 | | | Federal National Mortgage Association, Series 2015-M17, Class A2, 3.038%, 11/25/2025(a) | | | 6,866,932 | |
| | 10,975,000 | | | Federal National Mortgage Association, Series 2016-M4, Class A2, 2.576%, 3/25/2026 | | | 10,792,807 | |
| | 7,591,000 | | | Federal National Mortgage Association, Series 2017-M3, Class A2, 2.569%, 12/25/2026(a) | | | 7,387,999 | |
| | 7,200,000 | | | FHLMC Multifamily Structured Pass Through Certificates, Series K050, Class A2, 3.334%, 8/25/2025(a) | | | 7,531,819 | |
| | 5,580,000 | | | FHLMC Multifamily Structured Pass Through Certificates, Series K051, Class A2, 3.308%, 9/25/2025 | | | 5,828,164 | |
| | 8,680,450 | | | FHLMC Multifamily Structured Pass Through Certificates, Series K052, Class A2, 3.151%, 11/25/2025 | | | 8,964,254 | |
| | 5,810,000 | | | FHLMC Multifamily Structured Pass Through Certificates, Series K053, Class A2, 2.995%, 12/25/2025 | | | 5,930,670 | |
| | 11,220,000 | | | FHLMC Multifamily Structured Pass Through Certificates, Series K057, Class A2, 2.570%, 7/25/2026 | | | 11,056,493 | |
| | 2,770,000 | | | FHLMC Multifamily Structured Pass Through Certificates, Series K058, Class A2, 2.653%, 8/25/2026 | | | 2,742,126 | |
| | 6,195,000 | | | FHLMC Multifamily Structured Pass Through Certificates, Series K061, Class A2, 3.347%, 11/25/2026(a) | | | 6,453,509 | |
| | 6,995,000 | | | FHLMC Multifamily Structured Pass Through Certificates, Series K062, Class A2, 3.413%, 12/25/2026 | | | 7,318,725 | |
| | 5,105,490 | | | FHLMC Multifamily Structured Pass Through Certificates, Series K063, Class A2, 3.430%, 1/25/2027(a) | | | 5,348,632 | |
| | 11,410,000 | | | FHLMC Multifamily Structured Pass Through Certificates, Series K727, Class A2, 2.946%, 7/25/2024 | | | 11,675,923 | |
| | 7,760,000 | | | FHLMC Multifamily Structured Pass Through Certificates, Series KPLB, Class A, 2.770%, 5/25/2025 | | | 7,793,879 | |
| | | | | | | | |
| | | | | | | 121,022,499 | |
| | | | | | | | |
See accompanying notes to financial statements.
17 |
Portfolio of Investments – as of September 30, 2017
Loomis Sayles Core Plus Bond Fund – (continued)
| | | | | | | | |
Principal
Amount (‡) | | | Description | | Value (†) | |
| | | | Airlines — 0.1% | | | | |
| $ | 2,607,566 | | | Continental Airlines Pass Through Certificates, Series 2012-2, Class A, 4.000%, 4/29/2026 | | $ | 2,720,082 | |
| | 728,004 | | | Continental Airlines Pass Through Trust, Series 2010-1, Class A, 4.750%, 7/12/2022 | | | 773,141 | |
| | | | | | | | |
| | | | | | | 3,493,223 | |
| | | | | | | | |
| | | | Automotive — 2.0% | | | | |
| | 642,000 | | | American Axle & Manufacturing, Inc., 5.125%, 2/15/2019 | | | 642,803 | |
| | 1,285,000 | | | Ford Motor Credit Co. LLC, 2.375%, 1/16/2018 | | | 1,287,736 | |
| | 4,742,000 | | | Ford Motor Credit Co. LLC, 2.375%, 3/12/2019 | | | 4,765,516 | |
| | 12,010,000 | | | Ford Motor Credit Co. LLC, 3.336%, 3/18/2021 | | | 12,282,784 | |
| | 7,612,000 | | | Ford Motor Credit Co. LLC, 5.000%, 5/15/2018 | | | 7,763,393 | |
| | 27,688,000 | | | Ford Motor Credit Co. LLC, 5.750%, 2/01/2021 | | | 30,362,304 | |
| | 16,412,000 | | | Ford Motor Credit Co. LLC, 5.875%, 8/02/2021 | | | 18,255,169 | |
| | 16,051,000 | | | General Motors Co., 5.000%, 4/01/2035 | | | 16,381,209 | |
| | 14,829,000 | | | General Motors Co., 6.250%, 10/02/2043 | | | 16,947,186 | |
| | 22,752,000 | | | Hyundai Capital America, 3.000%, 10/30/2020, 144A | | | 22,875,535 | |
| | | | | | | | |
| | | | | | | 131,563,635 | |
| | | | | | | | |
| | | | Banking — 7.2% | | | | |
| | 17,853,000 | | | Ally Financial, Inc., 3.750%, 11/18/2019 | | | 18,245,766 | |
| | 16,016,000 | | | Banco Santander Chile, 3.875%, 9/20/2022, 144A | | | 16,825,005 | |
| | 7,967,000 | | | Bangkok Bank PCL, 2.750%, 3/27/2018, 144A | | | 7,986,918 | |
| | 34,130,000 | | | Bangkok Bank PCL, 3.300%, 10/03/2018, 144A | | | 34,516,693 | |
| | 6,608,000 | | | Bank of America Corp., 2.650%, 4/01/2019 | | | 6,667,471 | |
| | 2,370,000 | | | Bank of America Corp., 5.625%, 7/01/2020 | | | 2,581,263 | |
| | 5,715,000 | | | Bank of America Corp., GMTN, 2.625%, 4/19/2021 | | | 5,754,291 | |
| | 47,520,000 | | | Bank of America Corp., MTN, 5.000%, 5/13/2021(c) | | | 51,706,376 | |
| | 4,199,000 | | | Bank of America Corp., MTN, 6.875%, 4/25/2018 | | | 4,319,864 | |
| | 45,518,000 | | | Barclays PLC, 2.875%, 6/08/2020 | | | 45,976,366 | |
| | 7,058,000 | | | Barclays PLC, 3.200%, 8/10/2021 | | | 7,166,411 | |
| | 25,327,000 | | | BBVA Banco Continental S.A., 3.250%, 4/08/2018, 144A | | | 25,509,354 | |
| | 15,481,000 | | | Citigroup, Inc., 2.500%, 9/26/2018 | | | 15,583,984 | |
| | 5,780,000 | | | Citigroup, Inc., 2.650%, 10/26/2020 | | | 5,839,405 | |
| | 27,055,000 | | | Citigroup, Inc., 4.050%, 7/30/2022 | | | 28,321,470 | |
| | 5,780,000 | | | Goldman Sachs Group, Inc. (The), 2.600%, 4/23/2020 | | | 5,832,106 | |
| | 9,636,000 | | | Goldman Sachs Group, Inc. (The), 3.625%, 1/22/2023 | | | 9,983,962 | |
| | 14,867,000 | | | Goldman Sachs Group, Inc. (The), 5.750%, 1/24/2022 | | | 16,662,968 | |
| | 13,448,000 | | | Goldman Sachs Group, Inc. (The), 6.750%, 10/01/2037 | | | 17,741,832 | |
| | 3,205,000 | | | JPMorgan Chase & Co., 2.550%, 3/01/2021 | | | 3,237,044 | |
| | 8,819,000 | | | JPMorgan Chase & Co., 3.200%, 1/25/2023 | | | 9,044,585 | |
| | 1,785,000 | | | JPMorgan Chase & Co., 4.250%, 10/15/2020 | | | 1,889,851 | |
| | 10,223,000 | | | JPMorgan Chase & Co., 4.350%, 8/15/2021 | | | 10,952,765 | |
| | 23,597,000 | | | JPMorgan Chase & Co., 4.500%, 1/24/2022 | | | 25,567,598 | |
| | 3,235,000 | | | Lloyds Banking Group PLC, 3.000%, 1/11/2022 | | | 3,261,783 | |
| | 3,955,000 | | | Lloyds Banking Group PLC, 3.100%, 7/06/2021 | | | 4,021,450 | |
| | 7,690,000 | | | Morgan Stanley, 2.800%, 6/16/2020 | | | 7,818,267 | |
| | 3,381,000 | | | Morgan Stanley, 3.700%, 10/23/2024 | | | 3,502,627 | |
See accompanying notes to financial statements.
| 18
Portfolio of Investments – as of September 30, 2017
Loomis Sayles Core Plus Bond Fund – (continued)
| | | | | | | | |
Principal
Amount (‡) | | | Description | | Value (†) | |
| | | | Banking — continued | | | | |
| $ | 19,598,000 | | | Morgan Stanley, 5.750%, 1/25/2021 | | $ | 21,639,429 | |
| | 12,550,000 | | | Morgan Stanley, GMTN, 5.500%, 7/28/2021 | | | 13,920,882 | |
| | 21,770,000 | | | Morgan Stanley, Series F, 3.875%, 4/29/2024 | | | 22,782,558 | |
| | 4,977,000 | | | Morgan Stanley, Series F, GMTN, 6.625%, 4/01/2018 | | | 5,098,637 | |
| | 9,123,000 | | | Santander UK Group Holdings PLC, 5.625%, 9/15/2045, 144A | | | 10,582,169 | |
| | | | | | | | |
| | | | | | | 470,541,150 | |
| | | | | | | | |
| | | | Building Materials — 0.1% | | | | |
| | 8,563,000 | | | Owens Corning, 4.200%, 12/01/2024 | | | 9,019,030 | |
| | | | | | | | |
| | | | Cable Satellite — 0.5% | | | | |
| | 14,275,000 | | | Time Warner Cable LLC, 4.500%, 9/15/2042 | | | 13,529,082 | |
| | 3,939,000 | | | Time Warner Cable LLC, 5.500%, 9/01/2041 | | | 4,089,964 | |
| | 2,648,000 | | | Time Warner Cable LLC, 5.875%, 11/15/2040 | | | 2,905,820 | |
| | 8,447,000 | | | Time Warner Cable LLC, 6.550%, 5/01/2037 | | | 9,921,417 | |
| | 2,013,000 | | | Time Warner Cable LLC, 6.750%, 6/15/2039 | | | 2,415,280 | |
| | | | | | | | |
| | | | | | | 32,861,563 | |
| | | | | | | | |
| | | | Chemicals — 1.3% | | | | |
| | 26,749,000 | | | Braskem America Finance Co., 7.125%, 7/22/2041, 144A | | | 30,360,115 | |
| | 3,680,000 | | | Koppers, Inc., 6.000%, 2/15/2025, 144A | | | 3,956,000 | |
| | 3,566,000 | | | Methanex Corp., 3.250%, 12/15/2019 | | | 3,598,805 | |
| | 14,107,000 | | | Methanex Corp., 5.250%, 3/01/2022 | | | 14,862,857 | |
| | 7,727,000 | | | Mexichem SAB de CV, 5.875%, 9/17/2044, 144A | | | 8,016,762 | |
| | 11,165,000 | | | Mexichem SAB de CV, 6.750%, 9/19/2042, 144A(c) | | | 12,616,450 | |
| | 4,402,000 | | | RPM International, Inc., 3.450%, 11/15/2022 | | | 4,599,725 | |
| | 3,558,000 | | | RPM International, Inc., 6.125%, 10/15/2019 | | | 3,847,515 | |
| | 4,155,000 | | | Venator Finance S.a.r.l/Venator Materials LLC, 5.750%, 7/15/2025, 144A | | | 4,321,200 | |
| | | | | | | | |
| | | | | | | 86,179,429 | |
| | | | | | | | |
| | | | Collateralized Mortgage Obligations — 2.1% | | | | |
| | 5,000,000 | | | Federal Home Loan Mortgage Corp., REMIC, Series 3654, Class DC, 5.000%, 4/15/2030 | | | 5,628,313 | |
| | 33,656,455 | | | Federal Home Loan Mortgage Corp., Series 277, Class 30, 3.000%, 9/15/2042 | | | 34,041,931 | |
| | 3,402,996 | | | Federal Home Loan Mortgage Corp., Series 353, Class 300, 3.000%, 12/15/2046 | | | 3,427,528 | |
| | 620,741 | | | Government National Mortgage Association, Series 2010-H20, Class AF, 1-month LIBOR + 0.330%, 1.561%, 10/20/2060(m) | | | 616,563 | |
| | 481,632 | | | Government National Mortgage Association, Series 2010-H24, Class FA, 1-month LIBOR + 0.350%, 1.581%, 10/20/2060(m) | | | 478,507 | |
| | 426,977 | | | Government National Mortgage Association, Series 2011-H06, Class FA, 1-month LIBOR + 0.450%, 1.681%, 2/20/2061(m) | | | 426,417 | |
| | 4,770,495 | | | Government National Mortgage Association, Series 2012-H12, Class FA, 1-month LIBOR + 0.550%, 1.781%, 4/20/2062(m) | | | 4,778,453 | |
| | 634,727 | | | Government National Mortgage Association, Series 2012-H18, Class NA, 1-month LIBOR + 0.520%, 1.751%, 8/20/2062(m) | | | 634,508 | |
| | 5,193,297 | | | Government National Mortgage Association, Series 2012-H27, Class FA, 1-month LIBOR + 0.400%, 1.631%, 10/20/2062(m) | | | 5,178,550 | |
| | 2,846,852 | | | Government National Mortgage Association, Series 2013-H01, Class FA, 1.650%, 1/20/2063 | | | 2,828,243 | |
See accompanying notes to financial statements.
19 |
Portfolio of Investments – as of September 30, 2017
Loomis Sayles Core Plus Bond Fund – (continued)
| | | | | | | | |
Principal
Amount (‡) | | | Description | | Value (†) | |
| | | | Collateralized Mortgage Obligations — continued | | | | |
| $ | 4,538,624 | | | Government National Mortgage Association, Series 2013-H03, Class HA, 1.750%, 12/20/2062 | | $ | 4,515,927 | |
| | 6,489,674 | | | Government National Mortgage Association, Series 2013-H04, Class BA, 1.650%, 2/20/2063 | | | 6,447,792 | |
| | 16,627,274 | | | Government National Mortgage Association, Series 2013-H07, Class DA, 2.500%, 3/20/2063 | | | 16,738,186 | |
| | 23,115,095 | | | Government National Mortgage Association, Series 2013-H10, Class PA, 2.500%, 4/20/2063 | | | 23,129,854 | |
| | 22,173,885 | | | Government National Mortgage Association, Series 2015-H10, Class JA, 2.250%, 4/20/2065 | | | 21,723,083 | |
| | 3,298,227 | | | Government National Mortgage Association, Series 2015-H13, Class FL, 1-month LIBOR + 0.280%, 1.511%, 5/20/2063(m) | | | 3,297,232 | |
| | | | | | | | |
| | | | | | | 133,891,087 | |
| | | | | | | | |
| | | | Construction Machinery — 0.1% | | | | |
| | 8,705,000 | | | CNH Industrial Capital LLC, 4.375%, 4/05/2022 | | | 9,140,250 | |
| | | | | | | | |
| | | | Consumer Cyclical Services — 0.4% | | | | |
| | 26,745,000 | | | Amazon.com, Inc., 4.250%, 8/22/2057, 144A | | | 27,442,105 | |
| | | | | | | | |
| | | | Consumer Products — 0.1% | | | | |
| | 3,495,000 | | | Whirlpool Corp., MTN, 4.850%, 6/15/2021 | | | 3,783,689 | |
| | | | | | | | |
| | | | Diversified Manufacturing — 0.5% | | | | |
| | 1,158,000 | | | Crane Co., 6.550%, 11/15/2036 | | | 1,417,164 | |
| | 32,127,000 | | | Votorantim Cimentos S.A., 7.250%, 4/05/2041, 144A | | | 34,014,461 | |
| | | | | | | | |
| | | | | | | 35,431,625 | |
| | | | | | | | |
| | | | Electric — 0.6% | | | | |
| | 3,315,000 | | | Enel Americas S.A., 4.000%, 10/25/2026 | | | 3,393,598 | |
| | 3,364,000 | | | Enel Generacion Chile S.A., 4.250%, 4/15/2024 | | | 3,530,723 | |
| | 17,247,000 | | | National Rural Utilities Cooperative Finance Corp., (fixed rate to 4/30/2023, variable rate thereafter), 4.750%, 4/30/2043 | | | 17,905,258 | |
| | 8,413,000 | | | Transelec S.A., 4.250%, 1/14/2025, 144A | | | 8,745,492 | |
| | 4,380,000 | | | Transelec S.A., 4.625%, 7/26/2023, 144A | | | 4,684,178 | |
| | | | | | | | |
| | | | | | | 38,259,249 | |
| | | | | | | | |
| | | | Finance Companies — 2.2% | | | | |
| | 16,922,000 | | | AerCap Ireland Capital DAC/AerCap Global Aviation Trust, 3.750%, 5/15/2019 | | | 17,315,776 | |
| | 18,154,000 | | | International Lease Finance Corp., 5.875%, 4/01/2019 | | | 19,123,399 | |
| | 3,910,000 | | | International Lease Finance Corp., 5.875%, 8/15/2022 | | | 4,378,131 | |
| | 16,190,000 | | | International Lease Finance Corp., 6.250%, 5/15/2019 | | | 17,208,117 | |
| | 16,195,000 | | | iStar, Inc., 6.500%, 7/01/2021 | | | 16,923,775 | |
| | 14,547,000 | | | Navient LLC, MTN, 8.000%, 3/25/2020 | | | 16,038,068 | |
| | 13,509,000 | | | Quicken Loans, Inc., 5.750%, 5/01/2025, 144A | | | 14,184,450 | |
| | 39,143,000 | | | Springleaf Finance Corp., 5.250%, 12/15/2019 | | | 40,747,863 | |
| | | | | | | | |
| | | | | | | 145,919,579 | |
| | | | | | | | |
| | | | Financial Other — 0.2% | | | | |
| | 15,649,000 | | | Cielo S.A./Cielo USA, Inc., 3.750%, 11/16/2022, 144A | | | 15,453,387 | |
| | | | | | | | |
See accompanying notes to financial statements.
| 20
Portfolio of Investments – as of September 30, 2017
Loomis Sayles Core Plus Bond Fund – (continued)
| | | | | | | | |
Principal
Amount (‡) | | | Description | | Value (†) | |
| | | | Food & Beverage — 0.1% | | | | |
| $ | 3,490,000 | | | Gruma SAB de CV, 4.875%, 12/01/2024, 144A | | $ | 3,791,012 | |
| | 1,230,000 | | | Sigma Alimentos S.A. de CV, 6.875%, 12/16/2019, 144A | | | 1,357,613 | |
| | | | | | | | |
| | | | | | | 5,148,625 | |
| | | | | | | | |
| | | | Government Owned – No Guarantee — 2.9% | | | | |
| | 2,355,000 | | | Abu Dhabi National Energy Co. PJSC, 2.500%, 1/12/2018, 144A | | | 2,355,316 | |
| | 7,757,000 | | | CNPC General Capital Ltd., 3.950%, 4/19/2022, 144A | | | 8,136,985 | |
| | 17,981,000 | | | Dolphin Energy Ltd., 5.500%, 12/15/2021, 144A | | | 19,774,209 | |
| | 18,213,000 | | | OCP S.A., 5.625%, 4/25/2024, 144A | | | 19,620,865 | |
| | 7,355,000 | | | Ooredoo International Finance Ltd., 3.250%, 2/21/2023, 144A | | | 7,346,042 | |
| | 9,385,000 | | | Ooredoo International Finance Ltd., 3.875%, 1/31/2028, 144A | | | 9,446,322 | |
| | 2,862,000 | | | Ooredoo International Finance Ltd., 7.875%, 6/10/2019, 144A | | | 3,115,573 | |
| | 22,772,000 | | | Pertamina Persero PT, 5.625%, 5/20/2043, 144A | | | 24,511,348 | |
| | 10,497,000 | | | Petrobras Global Finance BV, 5.625%, 5/20/2043 | | | 9,368,572 | |
| | 27,590,000 | | | Petrobras Global Finance BV, 6.850%, 6/05/2115 | | | 26,313,962 | |
| | 24,068,000 | | | Tennessee Valley Authority, 4.250%, 9/15/2065 | | | 27,396,003 | |
| | 6,160,000 | | | Tennessee Valley Authority, 4.625%, 9/15/2060 | | | 7,465,864 | |
| | 6,401,000 | | | Tennessee Valley Authority, 4.875%, 1/15/2048 | | | 8,090,448 | |
| | 10,957,000 | | | Tennessee Valley Authority, 5.250%, 9/15/2039 | | | 14,368,298 | |
| | | | | | | | |
| | | | | | | 187,309,807 | |
| | | | | | | | |
| | | | Healthcare — 0.8% | | | | |
| | 16,635,000 | | | CHS/Community Health Systems, Inc., 6.250%, 3/31/2023 | | | 16,343,888 | |
| | 16,381,000 | | | Kindred Healthcare, Inc., 8.000%, 1/15/2020 | | | 16,089,254 | |
| | 3,089,000 | | | PerkinElmer, Inc., 5.000%, 11/15/2021 | | | 3,348,279 | |
| | 7,682,000 | | | Universal Health Services, Inc., 3.750%, 8/01/2019, 144A | | | 7,854,845 | |
| | 10,364,000 | | | Universal Health Services, Inc., 4.750%, 8/01/2022, 144A | | | 10,726,740 | |
| | | | | | | | |
| | | | | | | 54,363,006 | |
| | | | | | | | |
| | | | Hybrid ARMs — 0.0% | | | | |
| | 64,992 | | | FNMA, 6-month LIBOR + 1.504%, 2.952%, 2/01/2037(m) | | | 67,069 | |
| | | | | | | | |
| | | | Independent Energy — 1.6% | | | | |
| | 4,885,000 | | | MEG Energy Corp., 7.000%, 3/31/2024, 144A | | | 4,188,888 | |
| | 8,160,000 | | | Newfield Exploration Co., 5.375%, 1/01/2026 | | | 8,578,200 | |
| | 10,499,000 | | | Newfield Exploration Co., 5.750%, 1/30/2022 | | | 11,207,682 | |
| | 13,888,000 | | | Pan American Energy LLC/Argentine Branch, 7.875%, 5/07/2021, 144A | | | 14,987,513 | |
| | 13,612,000 | | | QEP Resources, Inc., 5.250%, 5/01/2023 | | | 13,237,670 | |
| | 6,862,000 | | | QEP Resources, Inc., 5.375%, 10/01/2022 | | | 6,741,915 | |
| | 10,701,000 | | | Range Resources Corp., 5.000%, 8/15/2022, 144A | | | 10,687,624 | |
| | 9,158,000 | | | SM Energy Co., 5.000%, 1/15/2024 | | | 8,631,415 | |
| | 775,000 | | | SM Energy Co., 5.625%, 6/01/2025 | | | 736,250 | |
| | 16,166,000 | | | SM Energy Co., 6.125%, 11/15/2022 | | | 16,206,415 | |
| | 1,096,000 | | | SM Energy Co., 6.500%, 11/15/2021 | | | 1,106,960 | |
| | 4,851,000 | | | SM Energy Co., 6.500%, 1/01/2023 | | | 4,887,382 | |
| | 1,045,000 | | | SM Energy Co., 6.750%, 9/15/2026 | | | 1,045,000 | |
| | | | | | | | |
| | | | | | | 102,242,914 | |
| | | | | | | | |
| | | | Industrial Other — 0.6% | | | | |
| | 5,919,000 | | | Briggs & Stratton Corp., 6.875%, 12/15/2020 | | | 6,525,698 | |
| | 7,035,000 | | | CBRE Services, Inc., 5.000%, 3/15/2023 | | | 7,289,302 | |
See accompanying notes to financial statements.
21 |
Portfolio of Investments – as of September 30, 2017
Loomis Sayles Core Plus Bond Fund – (continued)
| | | | | | | | |
Principal
Amount (‡) | | | Description | | Value (†) | |
| | | | Industrial Other — continued | | | | |
| $ | 9,275,000 | | | CK Hutchison International 16 Ltd., 2.750%, 10/03/2026, 144A | | $ | 8,929,457 | |
| | 5,859,000 | | | Ferreycorp SAA, 4.875%, 4/26/2020, 144A | | | 5,932,238 | |
| | 9,650,000 | | | President and Fellows of Harvard College, 3.300%, 7/15/2056 | | | 9,237,982 | |
| | | | | | | | |
| | | | | | | 37,914,677 | |
| | | | | | | | |
| | | | Media Entertainment — 1.3% | | | | |
| | 7,430,000 | | | AMC Networks, Inc., 4.750%, 8/01/2025 | | | 7,504,300 | |
| | 8,660,000 | | | Discovery Communications LLC, 5.000%, 9/20/2037 | | | 8,793,462 | |
| | 8,685,000 | | | Discovery Communications LLC, 5.200%, 9/20/2047 | | | 8,813,158 | |
| | 2,405,000 | | | EW Scripps Co. (The), 5.125%, 5/15/2025, 144A | | | 2,453,100 | |
| | 63,720,000 | | | Grupo Televisa SAB, EMTN, 7.250%, 5/14/2043, (MXN) | | | 2,757,704 | |
| | 15,635,000 | | | Myriad International Holdings BV, 4.850%, 7/06/2027, 144A | | | 16,150,799 | |
| | 32,599,000 | | | Myriad International Holdings BV, 6.000%, 7/18/2020, 144A | | | 35,173,017 | |
| | 5,638,000 | | | Viacom, Inc., 5.250%, 4/01/2044 | | | 5,399,604 | |
| | | | | | | | |
| | | | | | | 87,045,144 | |
| | | | | | | | |
| | | | Metals & Mining — 1.3% | | | | |
| | 12,381,000 | | | ArcelorMittal, 7.250%, 3/01/2041 | | | 14,656,009 | |
| | 4,470,000 | | | ArcelorMittal, 7.500%, 10/15/2039 | | | 5,364,000 | |
| | 14,896,000 | | | Freeport-McMoRan, Inc., 2.375%, 3/15/2018 | | | 14,896,000 | |
| | 12,627,000 | | | Freeport-McMoRan, Inc., 3.550%, 3/01/2022 | | | 12,433,681 | |
| | 5,097,000 | | | Freeport-McMoRan, Inc., 6.875%, 2/15/2023 | | | 5,555,730 | |
| | 11,203,000 | | | Goldcorp, Inc., 2.125%, 3/15/2018 | | | 11,214,258 | |
| | 18,444,000 | | | Southern Copper Corp., 5.875%, 4/23/2045 | | | 21,005,508 | |
| | | | | | | | |
| | | | | | | 85,125,186 | |
| | | | | | | | |
| | | | Midstream — 1.2% | | | | |
| | 1,600,000 | | | AmeriGas Partners LP/AmeriGas Finance Corp., 5.500%, 5/20/2025 | | | 1,644,000 | |
| | 670,000 | | | Energy Transfer LP, 5.150%, 2/01/2043 | | | 653,519 | |
| | 6,959,000 | | | Energy Transfer LP, 5.950%, 10/01/2043 | | | 7,451,073 | |
| | 10,082,000 | | | Energy Transfer LP, 6.500%, 2/01/2042 | | | 11,406,824 | |
| | 1,578,000 | | | Energy Transfer LP, 6.625%, 10/15/2036 | | | 1,795,044 | |
| | 13,236,000 | | | Energy Transfer LP/Regency Energy Finance Corp., 5.000%, 10/01/2022 | | | 14,296,193 | |
| | 331,000 | | | Energy Transfer LP/Regency Energy Finance Corp., 5.500%, 4/15/2023 | | | 340,599 | |
| | 2,745,000 | | | Energy Transfer LP/Regency Energy Finance Corp., 5.875%, 3/01/2022 | | | 3,038,359 | |
| | 2,555,000 | | | Kinder Morgan Energy Partners LP, 4.150%, 2/01/2024 | | | 2,648,419 | |
| | 10,668,000 | | | Kinder Morgan Energy Partners LP, 4.300%, 5/01/2024 | | | 11,101,257 | |
| | 4,861,000 | | | Kinder Morgan, Inc., 5.000%, 2/15/2021, 144A | | | 5,215,227 | |
| | 17,979,000 | | | Kinder Morgan, Inc., 5.625%, 11/15/2023, 144A | | | 20,025,603 | |
| | | | | | | | |
| | | | | | | 79,616,117 | |
| | | | | | | | |
| | | | Mortgage Related — 17.9% | | | | |
| | 26,956,958 | | | FHLMC, 3.000%, with various maturities from 2042 to 2046(d) | | | 27,100,369 | |
| | 50,439,743 | | | FHLMC, 3.500%, with various maturities from 2043 to 2047(d) | | | 52,257,912 | |
| | 21,311,626 | | | FHLMC, 4.000%, with various maturities from 2044 to 2046(d) | | | 22,540,269 | |
| | 20,616,017 | | | FHLMC, 4.500%, with various maturities from 2041 to 2047(d) | | | 22,342,218 | |
| | 4,441 | | | FHLMC, 5.500%, 12/01/2018 | | | 4,511 | |
| | 15,033 | | | FHLMC, 6.000%, 6/01/2035 | | | 17,075 | |
| | 100,938,335 | | | FNMA, 2.500%, with various maturities in 2046(d) | | | 97,772,878 | |
See accompanying notes to financial statements.
| 22
Portfolio of Investments – as of September 30, 2017
Loomis Sayles Core Plus Bond Fund – (continued)
| | | | | | | | |
Principal
Amount (‡) | | | Description | | Value (†) | |
| | | | Mortgage Related — continued | | | | |
| $ | 86,093,480 | | | FNMA, 3.000%, with various maturities from 2045 to 2047(d) | | $ | 86,567,469 | |
| | 131,899,121 | | | FNMA, 3.500%, with various maturities from 2042 to 2047(d) | | | 136,541,083 | |
| | 98,350,916 | | | FNMA, 4.000%, with various maturities from 2041 to 2047(d) | | | 104,041,962 | |
| | 33,669,827 | | | FNMA, 4.500%, with various maturities from 2043 to 2047(d) | | | 36,349,720 | |
| | 224,582 | | | FNMA, 6.000%, with various maturities from 2034 to 2037(d) | | | 256,493 | |
| | 22,698 | | | FNMA, 6.500%, with various maturities from 2029 to 2031(d) | | | 25,431 | |
| | 45,533 | | | FNMA, 7.000%, with various maturities in 2030(d) | | | 49,946 | |
| | 32,062 | | | FNMA, 7.500%, with various maturities from 2024 to 2032(d) | | | 36,113 | |
| | 14,740,000 | | | FNMA (TBA), 3.000%, 11/01/2047(e) | | | 14,765,334 | |
| | 344,635,000 | | | FNMA (TBA), 4.000%, 11/01/2047(e) | | | 362,324,460 | |
| | 654,847 | | | GNMA, 1-month LIBOR + 1.952, 3.172%, 9/20/2063(m) | | | 690,433 | |
| | 154,918 | | | GNMA, 4.131%, 1/20/2063(a) | | | 161,140 | |
| | 144,627 | | | GNMA, 4.300%, 5/20/2063(a) | | | 150,861 | |
| | 10,405,010 | | | GNMA, 4.376%, 12/20/2066(a) | | | 11,383,092 | |
| | 3,006,565 | | | GNMA, 4.412%, 10/20/2066(a) | | | 3,287,124 | |
| | 187,094 | | | GNMA, 4.421%, 7/20/2063(a) | | | 196,182 | |
| | 5,261,633 | | | GNMA, 4.425%, 11/20/2066(a) | | | 5,736,894 | |
| | 4,452,888 | | | GNMA, 4.478%, 10/20/2062(a) | | | 4,607,911 | |
| | 896,114 | | | GNMA, 4.495%, 12/20/2062(a) | | | 928,537 | |
| | 641,938 | | | GNMA, 4.499%, 7/20/2063(a) | | | 673,374 | |
| | 5,240,012 | | | GNMA, 4.500%, 2/20/2066(a) | | | 5,703,915 | |
| | 14,166,746 | | | GNMA, 4.520%, 12/20/2061(a)(c) | | | 14,497,271 | |
| | 9,816,072 | | | GNMA, 4.528%, with various maturities from 2063 to 2064(a)(d) | | | 10,591,394 | |
| | 6,065,715 | | | GNMA, 4.529%, with various maturities from 2062 to 2066(a)(d) | | | 6,586,537 | |
| | 872,852 | | | GNMA, 4.532%, 8/20/2062(a) | | | 903,162 | |
| | 9,782,241 | | | GNMA, 4.537%, with various maturities from 2062 to 2063(a)(d) | | | 10,219,066 | |
| | 3,623,182 | | | GNMA, 4.538%, 6/20/2066(a) | | | 3,980,970 | |
| | 3,126,236 | | | GNMA, 4.539%, 9/20/2066(a) | | | 3,437,766 | |
| | 4,651,714 | | | GNMA, 4.542%, 1/20/2065(a) | | | 5,037,806 | |
| | 2,637,812 | | | GNMA, 4.545%, 2/20/2066(a) | | | 2,883,312 | |
| | 12,852,778 | | | GNMA, 4.547%, 11/20/2062(a) | | | 13,324,828 | |
| | 15,349,497 | | | GNMA, 4.549%, with various maturities in 2066(a)(d) | | | 16,903,024 | |
| | 3,088,799 | | | GNMA, 4.550%, 1/20/2065(a) | | | 3,344,622 | |
| | 4,878,901 | | | GNMA, 4.565%, 2/20/2065(a) | | | 5,237,072 | |
| | 2,121,913 | | | GNMA, 4.580%, 6/20/2062(a) | | | 2,188,554 | |
| | 2,578,880 | | | GNMA, 4.581%, 4/20/2066(a) | | | 2,824,162 | |
| | 1,135,237 | | | GNMA, 4.583%, 6/20/2061(a) | | | 1,158,057 | |
| | 6,342,288 | | | GNMA, 4.586%, 10/20/2064(a) | | | 6,869,912 | |
| | 367,414 | | | GNMA, 4.592%, 8/20/2061(a) | | | 375,552 | |
| | 7,840,392 | | | GNMA, 4.595%, 12/20/2064(a) | | | 8,499,303 | |
| | 6,780,272 | | | GNMA, 4.598%, 2/20/2065(a) | | | 7,359,898 | |
| | 1,235,530 | | | GNMA, 4.613%, 7/20/2062(a) | | | 1,279,015 | |
| | 5,479,695 | | | GNMA, 4.615%, 3/20/2066(a) | | | 6,026,183 | |
| | 5,699,071 | | | GNMA, 4.616%, with various maturities from 2062 to 2065(a)(d) | | | 6,076,170 | |
| | 931,596 | | | GNMA, 4.631%, 1/20/2064(a) | | | 999,986 | |
| | 3,727,503 | | | GNMA, 4.644%, 1/20/2064(a) | | | 4,002,926 | |
| | 5,482,325 | | | GNMA, 4.648%, 5/20/2062(a) | | | 5,635,316 | |
See accompanying notes to financial statements.
23 |
Portfolio of Investments – as of September 30, 2017
Loomis Sayles Core Plus Bond Fund – (continued)
| | | | | | | | |
Principal
Amount (‡) | | | Description | | Value (†) | |
| | | | Mortgage Related — continued | | | | |
| $ | 2,849,494 | | | GNMA, 4.650%, 1/20/2061(a) | | $ | 2,907,220 | |
| | 603,044 | | | GNMA, 4.657%, 5/20/2062(a) | | | 620,176 | |
| | 5,930,184 | | | GNMA, 4.663%, 6/20/2064(a) | | | 6,403,522 | |
| | 6,721,500 | | | GNMA, 4.673%, 4/20/2062(a) | | | 6,914,225 | |
| | 248,268 | | | GNMA, 4.682%, 3/20/2062(a) | | | 255,531 | |
| | 902,007 | | | GNMA, 4.700%, with various maturities in 2061(a)(d) | | | 919,252 | |
| | 4,043,440 | | | GNMA, 4.708%, 1/20/2064(a) | | | 4,362,381 | |
| | 382,288 | | | GNMA, 5.500%, 4/15/2038 | | | 426,525 | |
| | 71,512 | | | GNMA, 6.000%, with various maturities from 2029 to 2038(d) | | | 81,115 | |
| | 59,498 | | | GNMA, 6.500%, with various maturities from 2029 to 2032(d) | | | 65,833 | |
| | 76,732 | | | GNMA, 7.000%, with various maturities from 2025 to 2029(d) | | | 80,228 | |
| | 17,713 | | | GNMA, 7.500%, with various maturities from 2025 to 2030(d) | | | 19,303 | |
| | 11,607 | | | GNMA, 8.500%, with various maturities from 2020 to 2023(d) | | | 11,658 | |
| | | | | | | | |
| | | | | | | 1,169,821,539 | |
| | | | | | | | |
| | | | Non-Agency Commercial Mortgage-Backed Securities — 1.2% | | | | |
| | 1,476,136 | | | Barclays Commercial Mortgage Securities, Series 2015-SLP, Class A, 1-month LIBOR + 1.110%, 2.344%, 2/15/2028, 144A(m) | | | 1,476,190 | |
| | 63,027 | | | Citigroup Commercial Mortgage Trust, Series 2008-C7, Class A4, 6.427%, 12/10/2049(a) | | | 62,995 | |
| | 1,025,000 | | | Commercial Mortgage Trust, Series 2010-C1, Class D, 6.324%, 7/10/2046, 144A(a) | | | 1,085,391 | |
| | 15,135,000 | | | Commercial Mortgage Trust, Series 2016-SAVA, Class A, 1-month LIBOR + 1.720%, 2.955%, 10/15/2034, 144A(m) | | | 15,191,723 | |
| | 3,950,000 | | | Commercial Mortgage Trust, Series 2016-SAVA, Class C, 1-month LIBOR + 3.000%, 4.235%, 10/15/2034, 144A(m) | | | 3,991,950 | |
| | 866,598 | | | Credit Suisse Mortgage Capital Certificates, Series 2008-C1, Class A3, 6.514%, 2/15/2041(a) | | | 865,946 | |
| | 3,052,113 | | | DBUBS Mortgage Trust, Series 2011-LC1A, Class E, 5.685%, 11/10/2046, 144A(a) | | | 3,213,554 | |
| | 527,331 | | | GP Portfolio Trust, Series 2014-GPP, Class A, 1-month LIBOR + 1.200%, 2.427%, 2/15/2027, 144A(m) | | | 528,501 | |
| | 3,181,000 | | | GP Portfolio Trust, Series 2014-GPP, Class D, 1-month LIBOR + 3.000%, 4.227%, 2/15/2027, 144A(m) | | | 3,189,812 | |
| | 6,637,000 | | | GS Mortgage Securities Trust, Series 2011-GC5, Class C, 5.565%, 8/10/2044, 144A(a) | | | 7,130,476 | |
| | 11,541,000 | | | JPMorgan Chase Commercial Mortgage Securities Corp., Series 2014-PHH, Class A, 1-month LIBOR + 1.450%, 2.427%, 8/15/2027, 144A(c)(m) | | | 11,540,986 | |
| | 232,599 | | | JPMorgan Chase Commercial Mortgage Securities Trust, Series 2007-C1, Class A4, 5.716%, 2/15/2051 | | | 232,392 | |
| | 522,649 | | | JPMorgan Chase Commercial Mortgage Securities Trust, Series 2014-FL5, Class A, 1-month LIBOR + 0.980%, 2.207%, 7/15/2031, 144A(m) | | | 523,431 | |
| | 3,968,000 | | | JPMorgan Chase Commercial Mortgage Securities Trust, Series 2014-FL5, Class B, 1-month LIBOR + 1.350%, 2.577%, 7/15/2031, 144A(m) | | | 3,991,197 | |
| | 2,205,000 | | | JPMorgan Chase Commercial Mortgage Securities Trust, Series 2014-FL5, Class C, 1-month LIBOR + 2.100%, 3.334%, 7/15/2031, 144A(m) | | | 2,183,854 | |
| | 529,893 | | | Morgan Stanley Capital I Trust, Series 2007-HQ13, Class A3, 5.569%, 12/15/2044 | | | 530,375 | |
See accompanying notes to financial statements.
| 24
Portfolio of Investments – as of September 30, 2017
Loomis Sayles Core Plus Bond Fund – (continued)
| | | | | | | | |
Principal
Amount (‡) | | | Description | | Value (†) | |
| | | | Non-Agency Commercial Mortgage-Backed Securities — continued | | | | |
| $ | 520,219 | | | Morgan Stanley Capital I Trust, Series 2008-T29, Class A4, 6.498%, 1/11/2043(a) | | $ | 523,406 | |
| | 7,018,000 | | | SCG Trust, Series 2013-SRP1, Class B, 1-month LIBOR + 2.500%, 3.977%, 11/15/2026, 144A(m) | | | 6,911,599 | |
| | 9,412,653 | | | Wells Fargo Commercial Mortgage Trust, Series 2010-C1, Class D, 5.785%, 11/15/2043, 144A(a) | | | 9,784,224 | |
| | 5,876,392 | | | WFRBS Commercial Mortgage Trust, Series 2011-C4, Class D, 5.414%, 6/15/2044, 144A(a) | | | 5,785,727 | |
| | | | | | | | |
| | | | | | | 78,743,729 | |
| | | | | | | | |
| | | | Oil Field Services — 1.5% | | | | |
| | 9,487,000 | | | Ensco PLC, 4.500%, 10/01/2024 | | | 7,874,210 | |
| | 7,342,000 | | | Ensco PLC, 5.750%, 10/01/2044 | | | 5,267,885 | |
| | 2,447,000 | | | Nabors Industries, Inc., 4.625%, 9/15/2021 | | | 2,400,507 | |
| | 3,434,000 | | | Nabors Industries, Inc., 5.000%, 9/15/2020 | | | 3,512,810 | |
| | 23,633,000 | | | Nabors Industries, Inc., 5.100%, 9/15/2023 | | | 22,745,817 | |
| | 4,150,000 | | | Nabors Industries, Inc., 5.500%, 1/15/2023 | | | 4,067,000 | |
| | 8,515,000 | | | Rowan Cos., Inc., 4.750%, 1/15/2024 | | | 7,408,050 | |
| | 14,138,000 | | | Rowan Cos., Inc., 4.875%, 6/01/2022 | | | 13,254,375 | |
| | 1,255,000 | | | Rowan Cos., Inc., 7.375%, 6/15/2025 | | | 1,226,763 | |
| | 29,916,000 | | | Thai Oil PCL, 4.875%, 1/23/2043, 144A | | | 31,860,222 | |
| | | | | | | | |
| | | | | | | 99,617,639 | |
| | | | | | | | |
| | | | Paper — 0.7% | | | | |
| | 5,797,000 | | | Celulosa Arauco y Constitucion S.A., 4.500%, 8/01/2024 | | | 6,106,089 | |
| | 6,681,000 | | | Celulosa Arauco y Constitucion S.A., 4.750%, 1/11/2022 | | | 7,064,171 | |
| | 8,312,000 | | | Celulosa Arauco y Constitucion S.A., 5.000%, 1/21/2021 | | | 8,863,305 | |
| | 21,515,000 | | | Suzano Austria GmbH, 5.750%, 7/14/2026, 144A | | | 23,113,564 | |
| | 1,989,000 | | | WestRock RKT Co., 4.900%, 3/01/2022 | | | 2,163,766 | |
| | | | | | | | |
| | | | | | | 47,310,895 | |
| | | | | | | | |
| | | | Pharmaceuticals — 0.3% | | | | |
| | 6,293,000 | | | Biogen, Inc., 2.900%, 9/15/2020 | | | 6,447,341 | |
| | 734,000 | | | Valeant Pharmaceuticals International, 6.750%, 8/15/2021, 144A | | | 720,238 | |
| | 3,418,000 | | | Valeant Pharmaceuticals International, Inc., 5.375%, 3/15/2020, 144A | | | 3,410,480 | |
| | 10,383,000 | | | Valeant Pharmaceuticals International, Inc., 5.500%, 3/01/2023, 144A | | | 9,111,082 | |
| | 2,760,000 | | | Valeant Pharmaceuticals International, Inc., 5.625%, 12/01/2021, 144A | | | 2,580,600 | |
| | | | | | | | |
| | | | | | | 22,269,741 | |
| | | | | | | | |
| | | | Property & Casualty Insurance — 0.4% | | | | |
| | 13,365,000 | | | Ardonagh Midco 3 PLC, 8.625%, 7/15/2023, 144A | | | 14,033,918 | |
| | 6,655,000 | | | Radian Group, Inc., 4.500%, 10/01/2024 | | | 6,788,100 | |
| | 3,171,000 | | | Willis Towers Watson PLC, 5.750%, 3/15/2021 | | | 3,484,575 | |
| | | | | | | | |
| | | | | | | 24,306,593 | |
| | | | | | | | |
| | | | Refining — 0.5% | | | | |
| | 28,300,000 | | | Ultrapar International S.A., 5.250%, 10/06/2026, 144A | | | 29,042,875 | |
| | | | | | | | |
See accompanying notes to financial statements.
25 |
Portfolio of Investments – as of September 30, 2017
Loomis Sayles Core Plus Bond Fund – (continued)
| | | | | | | | |
Principal
Amount (‡) | | | Description | | Value (†) | |
| | | | Retailers — 1.0% | | | | |
| $ | 2,235,000 | | | Cumberland Farms, Inc., 6.750%, 5/01/2025, 144A | | $ | 2,375,358 | |
| | 27,630,000 | | | El Puerto de Liverpool SAB de CV, 3.875%, 10/06/2026, 144A | | | 27,630,000 | |
| | 17,710,000 | | | GameStop Corp., 5.500%, 10/01/2019, 144A | | | 18,108,475 | |
| | 9,929,000 | | | SACI Falabella, 3.750%, 4/30/2023, 144A | | | 10,226,329 | |
| | 7,559,000 | | | SACI Falabella, 4.375%, 1/27/2025, 144A | | | 7,927,699 | |
| | | | | | | | |
| | | | | | | 66,267,861 | |
| | | | | | | | |
| | | | Sovereigns — 2.8% | | | | |
| | 32,145,000 | | | Kingdom of Saudi Arabia, 3.250%, 10/26/2026, 144A | | | 31,788,190 | |
| | 19,440,000 | | | Kingdom of Saudi Arabia, 4.500%, 10/26/2046, 144A | | | 19,398,787 | |
| | 14,180,000 | | | Mexico Government International Bond, 4.000%, 3/15/2115, (EUR) | | | 15,602,952 | |
| | 20,805,000 | | | Republic of Argentina, 7.500%, 4/22/2026 | | | 23,384,820 | |
| | 17,300,000 | | | Republic of Argentina, 7.625%, 4/22/2046 | | | 19,203,000 | |
| | 8,015,000 | | | Republic of Indonesia, 3.700%, 1/08/2022, 144A | | | 8,317,326 | |
| | 16,430,000 | | | Republic of Oman, 3.875%, 3/08/2022, 144A | | | 16,551,582 | |
| | 7,615,000 | | | Republic of Oman, 6.500%, 3/08/2047, 144A | | | 7,835,074 | |
| | 40,950,000 | | | State of Kuwait, 3.500%, 3/20/2027, 144A | | | 42,068,754 | |
| | | | | | | | |
| | | | | | | 184,150,485 | |
| | | | | | | | |
| | | | Supranational — 0.0% | | | | |
| | 13,158,000 | | | International Bank for Reconstruction & Development, 4.000%, 8/16/2018, (MXN) | | | 703,639 | |
| | | | | | | | |
| | | | Technology — 1.3% | | | | |
| | 2,680,000 | | | Cardtronics, Inc./Cardtronic USA, 5.500%, 5/01/2025, 144A | | | 2,741,680 | |
| | 3,036,000 | | | Dun & Bradstreet Corp. (The), 3.500%, 12/01/2017 | | | 3,042,019 | |
| | 3,906,000 | | | Equifax, Inc., 7.000%, 7/01/2037 | | | 4,737,242 | |
| | 15,427,000 | | | Hewlett Packard Enterprise Co., 3.600%, 10/15/2020 | | | 15,990,789 | |
| | 16,191,000 | | | Hewlett Packard Enterprise Co., 6.200%, 10/15/2035 | | | 17,382,627 | |
| | 3,601,000 | | | KLA-Tencor Corp., 3.375%, 11/01/2019 | | | 3,691,562 | |
| | 10,996,000 | | | Molex Electronic Technologies LLC, 2.878%, 4/15/2020, 144A | | | 11,067,110 | |
| | 7,255,000 | | | Molex Electronic Technologies LLC, 3.900%, 4/15/2025, 144A | | | 7,428,927 | |
| | 6,786,000 | | | Tencent Holdings Ltd., 3.375%, 3/05/2018, 144A | | | 6,827,416 | |
| | 12,486,000 | | | Tencent Holdings Ltd., 3.375%, 5/02/2019, 144A | | | 12,733,035 | |
| | | | | | | | |
| | | | | | | 85,642,407 | |
| | | | | | | | |
| | | | Treasuries — 25.9% | | | | |
| | 11,550,000(††) | | | Mexican Fixed Rate Bonds, Series M, 5.750%, 3/05/2026, (MXN) | | | 59,140,947 | |
| | 23,520,333(††) | | | Mexican Fixed Rate Bonds, Series M, 6.500%, 6/10/2021, (MXN) | | | 128,359,537 | |
| | 255,280,000 | | | Republic of Uruguay, 8.500%, 3/15/2028, 144A, (UYU) | | | 9,082,809 | |
| | 2,530,000 | | | U.S. Treasury Bond, 2.250%, 8/15/2046 | | | 2,224,522 | |
| | 2,485,000 | | | U.S. Treasury Bond, 2.500%, 5/15/2046 | | | 2,309,109 | |
| | 2,195,000 | | | U.S. Treasury Bond, 2.750%, 8/15/2047(c) | | | 2,147,327 | |
| | 6,610,000 | | | U.S. Treasury Bond, 2.875%, 8/15/2045 | | | 6,638,402 | |
| | 19,085,000 | | | U.S. Treasury Bond, 2.875%, 11/15/2046 | | | 19,152,841 | |
| | 7,963,100 | | | U.S. Treasury Bond, 3.000%, 5/15/2045 | | | 8,199,505 | |
| | 324,300 | | | U.S. Treasury Bond, 3.375%, 5/15/2044 | | | 357,452 | |
| | 753,700 | | | U.S. Treasury Bond, 3.625%, 2/15/2044 | | | 866,019 | |
| | 128,074,135 | | | U.S. Treasury Inflation Indexed Bond, 0.750%, 2/15/2045(c)(f) | | | 122,147,730 | |
See accompanying notes to financial statements.
| 26
Portfolio of Investments – as of September 30, 2017
Loomis Sayles Core Plus Bond Fund – (continued)
| | | | | | | | |
Principal
Amount (‡) | | | Description | | Value (†) | |
| | | | Treasuries — continued | | | | |
| $ | 129,665,339 | | | U.S. Treasury Inflation Indexed Bond, 0.875%, 2/15/2047(c)(f) | | $ | 127,780,821 | |
| | 169,777,775 | | | U.S. Treasury Inflation Indexed Bond, 1.000%, 2/15/2046(c)(f) | | | 172,237,872 | |
| | 325,008,483 | | | U.S. Treasury Inflation Indexed Note, 0.125%, 4/15/2018(c)(f) | | | 325,135,438 | |
| | 64,587,566 | | | U.S. Treasury Inflation Indexed Note, 0.125%, 7/15/2024(f) | | | 63,937,450 | |
| | 32,008,115 | | | U.S. Treasury Inflation Indexed Note, 0.250%, 1/15/2025(f) | | | 31,690,602 | |
| | 68,983,207 | | | U.S. Treasury Inflation Indexed Note, 0.625%, 1/15/2024(c)(f) | | | 70,440,380 | |
| | 19,615,000 | | | U.S. Treasury Note, 0.750%, 10/31/2017 | | | 19,610,489 | |
| | 153,115,000 | | | U.S. Treasury Note, 0.750%, 7/31/2018(c) | | | 152,397,274 | |
| | 72,575,000 | | | U.S. Treasury Note, 0.750%, 8/31/2018(c) | | | 72,178,106 | |
| | 35,550,000 | | | U.S. Treasury Note, 0.750%, 9/30/2018 | | | 35,334,756 | |
| | 29,180,000 | | | U.S. Treasury Note, 1.125%, 2/28/2019 | | | 29,062,596 | |
| | 60,735,000 | | | U.S. Treasury Note, 1.375%, 7/31/2019 | | | 60,637,729 | |
| | 21,724,000 | | | U.S. Treasury Note, 2.000%, 11/15/2026 | | | 21,169,868 | |
| | 113,450,000 | | | U.S. Treasury Note, 2.125%, 9/30/2024 | | | 113,148,648 | |
| | 45,437,000 | | | U.S. Treasury Note, 2.250%, 2/15/2027 | | | 45,161,893 | |
| | | | | | | | |
| | | | | | | 1,700,550,122 | |
| | | | | | | | |
| | | | Utility Other — 0.4% | | | | |
| | 25,420,000 | | | ACWA Power Management And Investments One Ltd., 5.950%, 12/15/2039, 144A | | | 26,196,428 | |
| | | | | | | | |
| | | | Wireless — 1.1% | | | | |
| | 1,424,000 | | | American Tower Corp., 4.700%, 3/15/2022 | | | 1,542,811 | |
| | 16,594,000 | | | Bharti Airtel International BV, 5.125%, 3/11/2023, 144A | | | 17,497,095 | |
| | 20,973,000 | | | Bharti Airtel Ltd., 4.375%, 6/10/2025, 144A | | | 21,245,250 | |
| | 14,383,000 | | | SK Telecom Co. Ltd., 2.125%, 5/01/2018, 144A | | | 14,370,303 | |
| | 3,055,000 | | | SK Telecom Co. Ltd., 6.625%, 7/20/2027, 144A | | | 3,846,856 | |
| | 11,565,000 | | | Sprint Capital Corp., 6.875%, 11/15/2028 | | | 12,952,800 | |
| | | | | | | | |
| | | | | | | 71,455,115 | |
| | | | | | | | |
| | | | Wirelines — 1.8% | | | | |
| | 720,000 | | | AT&T, Inc., 4.350%, 6/15/2045 | | | 660,831 | |
| | 6,549,000 | | | AT&T, Inc., 4.500%, 3/09/2048 | | | 6,041,067 | |
| | 1,615,000 | | | AT&T, Inc., 4.750%, 5/15/2046 | | | 1,553,132 | |
| | 7,715,000 | | | AT&T, Inc., 5.250%, 3/01/2037 | | | 8,119,091 | |
| | 11,815,000 | | | AT&T, Inc., 5.450%, 3/01/2047 | | | 12,498,032 | |
| | 9,515,000 | | | AT&T, Inc., 5.700%, 3/01/2057 | | | 10,231,768 | |
| | 11,187,000 | | | Colombia Telecomunicaciones S.A. E.S.P., 5.375%, 9/27/2022, 144A | | | 11,410,740 | |
| | 15,891,000 | | | Embarq Corp., 7.995%, 6/01/2036 | | | 16,129,365 | |
| | 2,301,000 | | | Frontier Communications Corp., 6.875%, 1/15/2025 | | | 1,719,997 | |
| | 942,000 | | | Frontier Communications Corp., 7.875%, 1/15/2027 | | | 678,240 | |
| | 5,000,000 | | | Telefonica Celular del Paraguay S.A., 6.750%, 12/13/2022, 144A | | | 5,199,100 | |
| | 3,890,000 | | | Telefonica Emisiones SAU, 5.134%, 4/27/2020 | | | 4,172,771 | |
| | 23,277,000 | | | Telefonica Emisiones SAU, 5.462%, 2/16/2021 | | | 25,513,417 | |
| | 4,280,000 | | | Verizon Communications, Inc., 2.450%, 11/01/2022 | | | 4,247,361 | |
| | 10,669,000 | | | Verizon Communications, Inc., 2.946%, 3/15/2022 | | | 10,849,778 | |
| | | | | | | | |
| | | | | | | 119,024,690 | |
| | | | | | | | |
| | | | Total Bonds and Notes
(Identified Cost $6,037,031,541) | | | 6,039,234,041 | |
| | | | | | | | |
See accompanying notes to financial statements.
27 |
Portfolio of Investments – as of September 30, 2017
Loomis Sayles Core Plus Bond Fund – (continued)
| | | | | | | | |
Principal
Amount (‡) | | | Description | | Value (†) | |
| | Senior Loans — 2.9% | |
| | | | Automotive — 0.2% | | | | |
| $ | 9,079,403 | | | Dayco Products LLC, 2017 Term Loan B, 3-month LIBOR + 5.000%, 6.317%, 5/19/2023(m) | | $ | 9,102,101 | |
| | 1,487,781 | | | Visteon Corp., Delayed Draw Term Loan B, 3-month LIBOR + 2.250%, 3.579%, 3/24/2024(m) | | | 1,491,500 | |
| | | | | | | | |
| | | | | | | 10,593,601 | |
| | | | | | | | |
| | | | Chemicals — 0.1% | | | | |
| | 1,825,425 | | | Ashland, Inc., 2017 Term Loan B, LIBOR + 2.000%, 3.292%, 5/24/2024(g) | | | 1,831,814 | |
| | 4,240,000 | | | Venator Materials Corp., Term Loan B, 3-month LIBOR + 3.000%, 4.312%, 8/08/2024(m) | | | 4,255,900 | |
| | | | | | | | |
| | | | | | | 6,087,714 | |
| | | | | | | | |
| | | | Consumer Products — 0.3% | | | | |
| | 23,449,832 | | | Serta Simmons Bedding LLC, 1st Lien Term Loan, 3-month LIBOR + 3.500%, 4.802%, 11/08/2023(h) | | | 22,731,330 | |
| | | | | | | | |
| | | | Electric — 0.2% | | | | |
| | 15,785,675 | | | AES Corp., 2017 Term Loan B, 3-month LIBOR + 2.000%, 3.317%, 5/24/2022(m) | | | 15,792,305 | |
| | | | | | | | |
| | | | Food & Beverage — 0.1% | | | | |
| | 7,341,600 | | | Post Holdings, Inc., 2017 Series A Incremental Term Loan, 1-month LIBOR + 2.250%, 3.490%, 5/24/2024(m) | | | 7,355,843 | |
| | | | | | | | |
| | | | Healthcare — 0.2% | | | | |
| | 14,452,375 | | | Team Health Holdings, Inc., 1st Lien Term Loan, 1-month LIBOR + 2.750%, 3.985%, 2/06/2024(m) | | | 14,172,432 | |
| | | | | | | | |
| | | | Leisure — 0.1% | | | | |
| | 3,253,650 | | | AMC Entertainment, Inc., New Term Loan B, 1-month LIBOR + 2.250%, 3.484%, 12/15/2023(m) | | | 3,237,382 | |
| | | | | | | | |
| | | | Lodging — 0.1% | | | | |
| | 6,730,729 | | | Four Seasons Hotels Ltd., New 1st Lien Term Loan, 1-month LIBOR + 2.500%, 3.735%, 11/30/2023(m) | | | 6,774,883 | |
| | | | | | | | |
| | | | Media Entertainment — 0.1% | | | | |
| | 7,665,828 | | | CBS Radio, Inc., Term Loan B, 1-month LIBOR + 3.500%, 4.737%, 10/17/2023(m) | | | 7,718,568 | |
| | | | | | | | |
| | | | Midstream — 0.2% | | | | |
| | 13,855,000 | | | Energy Transfer Equity LP, 2017 Term Loan B, 1-month LIBOR + 2.750%, 3.981%, 2/02/2024(m) | | | 13,916,378 | |
| | | | | | | | |
| | | | Pharmaceuticals — 0.1% | | | | |
| | 9,547,025 | | | Change Healthcare Holdings, Inc., 2017 Term Loan B, 1-month LIBOR + 2.750%, 3.985%, 3/01/2024(m) | | | 9,568,506 | |
| | | | | | | | |
| | | | Property & Casualty Insurance — 0.0% | | | | |
| | 2,770,000 | | | USI, Inc., 2017 Term Loan B, 3-month LIBOR + 3.000%, 4.314%, 5/16/2024(m) | | | 2,759,612 | |
| | | | | | | | |
| | | | Restaurants — 0.2% | | | | |
| | 10,869,884 | | | 1011778 B.C. Unlimited Liability Co., Term Loan B3, LIBOR + 2.250%, 3.523%, 2/16/2024(g) | | | 10,850,862 | |
| | | | | | | | |
See accompanying notes to financial statements.
| 28
Portfolio of Investments – as of September 30, 2017
Loomis Sayles Core Plus Bond Fund – (continued)
| | | | | | | | |
Principal
Amount (‡) | | | Description | | Value (†) | |
| | | | Retailers — 0.5% | | | | |
| $ | 14,634,250 | | | Michaels Stores, Inc., 2016 Term Loan B1, 1-month LIBOR + 2.750%, 3.985%, 1/30/2023(h) | | $ | 14,618,592 | |
| | 16,355,000 | | | Staples, Inc., 2017 Term Loan B, 8/06/2024(i) | | | 16,276,169 | |
| | | | | | | | |
| | | | | | | 30,894,761 | |
| | | | | | | | |
| | | | Technology — 0.2% | | | | |
| | 5,085,392 | | | First Data Corp., 2022 USD Term Loan, 1-month LIBOR + 2.250%, 3.487%, 7/08/2022(m) | | | 5,092,461 | |
| | 4,562,824 | | | First Data Corp., 2017 Term Loan, 1-month LIBOR + 2.500%, 3.737%, 4/26/2024(m) | | | 4,576,695 | |
| | 2,004,875 | | | Sabre GLBL, Inc., Incremental Term Loan B, 1-month LIBOR + 2.250%, 3.485%, 2/22/2024(m) | | | 2,013,516 | |
| | | | | | | | |
| | | | | | | 11,682,672 | |
| | | | | | | | |
| | | | Wirelines — 0.3% | | | | |
| | 8,289,785 | | | Consolidated Communications, Inc., 2016 Term Loan B, 1-month LIBOR + 3.000%, 4.240%, 10/04/2023(m) | | | 8,057,174 | |
| | 10,284,063 | | | Level 3 Financing, Inc., 2017 Term Loan B, 1-month LIBOR + 2.250%, 3.486%, 2/22/2024(m) | | | 10,276,041 | |
| | | | | | | | |
| | | | | | | 18,333,215 | |
| | | | | | | | |
| | | | Total Senior Loans
(Identified Cost $192,956,917) | | | 192,470,064 | |
| | | | | | | | |
| | | | | | | | |
| Shares | | | | | | |
| | Preferred Stocks — 0.3% | |
| | | | Cable Satellite — 0.3% | | | | |
| | 17,563,000 | | | NBCUniversal Enterprise, Inc., 5.250%, 144A(c)
(Identified Cost $18,210,290) | | | 18,748,502 | |
| | | | | | | | |
| | | | | | | | |
| | Common Stocks — 0.1% | |
| | | | Oil, Gas & Consumable Fuels — 0.1% | | | | |
| | 77,870 | | | Paragon Offshore Ltd.(b)(j)(k) | | | 1,265,387 | |
| | 77,870 | | | Paragon Offshore Ltd., Litigation Units Class A(b)(j)(k)(n) | | | 70,083 | |
| | 116,805 | | | Paragon Offshore Ltd., Litigation Units Class B(b)(j)(k)(o) | | | 2,199,789 | |
| | | | | | | | |
| | | | Total Common Stocks
(Identified Cost $19,777,522) | | | 3,535,259 | |
| | | | | | | | |
| | | | | | | | |
Principal
Amount (‡) | | | | | | |
| | Short-Term Investments — 12.7% | |
| $ | 34,230,000 | | | Federal Home Loan Bank Discount Notes, 0.990%, 10/02/2017(l) | | | 34,230,000 | |
| | 52,470,000 | | | Federal Home Loan Bank Discount Notes, 0.950%, 10/05/2017(l) | | | 52,465,645 | |
| | 13,115,000 | | | Federal Home Loan Bank Discount Notes, 0.950%, 10/06/2017(l) | | | 13,113,557 | |
| | 310,400,000 | | | Federal Home Loan Bank Discount Notes, 1.090%, 2/21/2018(l) | | | 309,041,069 | |
| | 113,845,000 | | | Federal Home Loan Bank Discount Notes, Series RB, 1.090%, 2/22/2018(l) | | | 113,343,058 | |
See accompanying notes to financial statements.
29 |
Portfolio of Investments – as of September 30, 2017
Loomis Sayles Core Plus Bond Fund – (continued)
| | | | | | | | |
Principal
Amount (‡) | | | Description | | Value (†) | |
| | Short-Term Investments — (continued) | |
| $ | 114,060,000 | | | Federal National Mortgage Association Discount Notes, 0.900%, 10/02/2017(l) | | $ | 114,060,000 | |
| | 196,638,445 | | | Tri-Party Repurchase Agreement with Fixed Income Clearing Corporation, dated 9/29/2017 at 0.340% to be repurchased at $196,644,016 on 10/02/2017 collateralized by $91,000,000 U.S. Treasury Note, 1.500% due 2/28/2019 valued at $91,230,048; $59,440,000 U.S. Treasury Inflation Note, 0.125% due 4/15/2019 valued at $62,412,238; $46,775,000 U.S. Treasury Note, 1.193% due 1/31/2019 valued at $46,933,895 including accrued interest (Note 2 of Notes to Financial Statements) | | | 196,638,445 | |
| | | | | | | | |
| | | | Total Short-Term Investments (Identified Cost $832,908,806) | | | 832,891,774 | |
| | | | | | | | |
| | | | | | | | |
| | | | Total Investments — 108.1% (Identified Cost $7,100,885,076) | | | 7,086,879,640 | |
| | | | Other assets less liabilities — (8.1)% | | | (530,942,266 | ) |
| | | | | | | | |
| | | | Net Assets — 100.0% | | $ | 6,555,937,374 | |
| | | | | | | | |
| | | | | | | | |
| | (‡) | | | Principal Amount stated in U.S. dollars unless otherwise noted. | |
| | (†) | | | See Note 2 of Notes to Financial Statements. | |
| | (††) | | | Amount shown represents units. One unit represents a principal amount of 100. | |
| | (a) | | | Variable rate security. The interest rate adjusts periodically based on changes in current interest rates and prepayments on the underlying pool of assets. Rate as of September 30, 2017 is disclosed. | |
| | (b) | | | Level 3 security. Value has been determined using significant unobservable inputs. See Note 3 of Notes to Financial Statements. | |
| | (c) | | | Security (or a portion thereof) has been designated to cover the Fund’s obligations under open derivative contracts or TBA transactions. | |
| | (d) | | | The Fund’s investment in mortgage related securities of Federal Home Loan Mortgage Corporation, Federal National Mortgage Association and Government National Mortgage Association are interests in separate pools of mortgages. All separate investments in securities of each issuer which have the same coupon rate have been aggregated for the purpose of presentation in the Portfolio of Investments. | |
| | (e) | | | When-issued/delayed delivery. See Note 2 of Notes to Financial Statements. | |
| | (f) | | | Treasury Inflation Protected Security (TIPS). | |
| | (g) | | | Variable rate security. Rate shown represents the weighted average rate of underlying contracts at September 30, 2017. Interest rates on contracts are primarily redetermined either weekly, monthly or quarterly by reference to the indicated base lending rate and spread and the reset period. | |
| | (h) | | | Variable rate security. Rate shown represents the weighted average rate of underlying contracts at September 30, 2017. | |
| | (i) | | | Position is unsettled. Contract rate was not determined at September 30, 2017 and does not take effect until settlement date. Maturity date is not finalized until settlement date. | |
| | (j) | | | Fair valued by the Fund’s adviser. At September 30, 2017, the value of these securities amounted to $3,535,259 or 0.1% of net assets. See Note 2 of Notes to Financial Statements. | |
| | (k) | | | Non-income producing security. | |
| | (l) | | | Interest rate represents discount rate at time of purchase; not a coupon rate. | |
| | (m) | | | Variable rate security. Rate as of September 30, 2017 is disclosed. | |
| | (n) | | | Security subject to restrictions on resale. This security was acquired on July 18, 2017 at a cost of $429,948. At September 30, 2017, the value of this security amounted to $70,083 or less than 0.1% of net assets. | |
| | (o) | | | Security subject to restrictions on resale. This security was acquired on July 18, 2017 at a cost of $8,598,870. At September 30, 2017, the value of this security amounted to $2,199,789 or less than 0.1% of net assets. | |
See accompanying notes to financial statements.
| 30
Portfolio of Investments – as of September 30, 2017
Loomis Sayles Core Plus Bond Fund – (continued)
| | | | | | | | |
| | | | | | | | |
| | 144A | | | All or a portion of these securities are exempt from registration under Rule 144A of the Securities Act of 1933. These securities may be resold in transactions exempt from registration, normally to qualified institutional buyers. At September 30, 2017, the value of Rule 144A holdings amounted to $1,386,007,605 or 21.1% of net assets. | |
| | ABS | | | Asset-Backed Securities | |
| | ARMs | | | Adjustable Rate Mortgages | |
| | EMTN | | | Euro Medium Term Note | |
| | FHLMC | | | Federal Home Loan Mortgage Corp. | |
| | FNMA | | | Federal National Mortgage Association | |
| | GMTN | | | Global Medium Term Note | |
| | GNMA | | | Government National Mortgage Association | |
| | LIBOR | | | London Interbank Offered Rate | |
| | MTN | | | Medium Term Note | |
| | PJSC | | | Private Joint-Stock Company | |
| | REMIC | | | Real Estate Mortgage Investment Conduit | |
| | TBA | | | To Be Announced | |
| | | | | | | | |
| | EUR | | | Euro | |
| | MXN | | | Mexican Peso | |
| | UYU | | | Uruguayan Peso | |
At September 30, 2017, the Fund had the following open forward foreign currency contracts:
| | | | | | | | | | | | | | | | | | | | | | | | | | |
| Counterparty | | Delivery
Date | | | Currency
Bought/Sold
(B/S) | | | Units of
Currency | | | In Exchange for | | | Notional
Value | | | Unrealized
Appreciation
(Depreciation) | |
| Bank of America, N.A. | | | 12/20/2017 | | | EUR | | | S | | | | 12,144,000 | | | $ | 14,539,283 | | | $ | 14,415,453 | | | $ | 123,830 | |
| HSBC Bank USA | | | 11/30/2017 | | | MXN | | | S | | | | 1,200,300,000 | | | | 66,212,854 | | | | 65,297,522 | | | | 915,332 | |
| | | | | | | | | | | | | | | | | | | | | | | | | | |
| Total | | | $ | 1,039,162 | |
| | | | | | | | | | | | | | | | | | | | | | | | | | |
Industry Summary at September 30, 2017
| | | | |
Treasuries | | | 25.9 | % |
Mortgage Related | | | 17.9 | |
Banking | | | 7.2 | |
ABS Car Loan | | | 3.0 | |
Government Owned - No Guarantee | | | 2.9 | |
Sovereigns | | | 2.8 | |
Finance Companies | | | 2.2 | |
Automotive | | | 2.2 | |
Wirelines | | | 2.1 | |
Collateralized Mortgage Obligations | | | 2.1 | |
Other Investments, less than 2% each | | | 27.1 | |
Short-Term Investments | | | 12.7 | |
| | | | |
Total Investments | | | 108.1 | |
Other assets less liabilities (including forward foreign currency contracts) | | | (8.1 | ) |
| | | | |
Net Assets | | | 100.0 | % |
| | | | |
See accompanying notes to financial statements.
31 |
This Page Intentionally Left Blank
| 32
Statement of Assets and Liabilities
September 30, 2017
| | | | |
ASSETS | |
Investments at cost | | $ | 7,100,885,076 | |
Net unrealized depreciation | | | (14,005,436 | ) |
| | | | |
Investments at value | | | 7,086,879,640 | |
Cash | | | 296,158 | |
Due from brokers (Note 2) | | | 193,000 | |
Receivable for Fund shares sold | | | 250,929,900 | |
Receivable for securities sold | | | 309,513,622 | |
Receivable for when-issued/delayed delivery securities sold (Note 2) | | | 260,799,241 | |
Interest receivable | | | 42,340,149 | |
Unrealized appreciation on forward foreign currency contracts (Note 2) | | | 1,039,162 | |
Tax reclaims receivable | | | 15,030 | |
Prepaid expenses (Note 8) | | | 7,139 | |
| | | | |
TOTAL ASSETS | | | 7,952,013,041 | |
| | | | |
LIABILITIES | |
Payable for securities purchased | | | 503,131,670 | |
Payable for when-issued/delayed delivery securities purchased (Note 2) | | | 638,819,794 | |
Payable for Fund shares redeemed | | | 251,301,120 | |
Management fees payable (Note 6) | | | 1,746,198 | |
Deferred Trustees’ fees (Note 6) | | | 506,954 | |
Administrative fees payable (Note 6) | | | 241,956 | |
Payable to distributor (Note 6d) | | | 44,666 | |
Other accounts payable and accrued expenses | | | 283,309 | |
| | | | |
TOTAL LIABILITIES | | | 1,396,075,667 | |
| | | | |
NET ASSETS | | $ | 6,555,937,374 | |
| | | | |
NET ASSETS CONSIST OF: | |
Paid-in capital | | $ | 6,682,293,833 | |
Undistributed net investment income | | | 1,849,136 | |
Accumulated net realized loss on investments, forward foreign currency contracts and foreign currency transactions | | | (115,196,967 | ) |
Net unrealized depreciation on investments and foreign currency translations | | | (13,008,628 | ) |
| | | | |
NET ASSETS | | $ | 6,555,937,374 | |
| | | | |
See accompanying notes to financial statements.
33 |
Statement of Assets and Liabilities (continued)
September 30, 2017
| | | | |
COMPUTATION OF NET ASSET VALUE AND OFFERING PRICE: | |
Class A shares: | |
Net assets | | $ | 676,891,727 | |
| | | | |
Shares of beneficial interest | | | 52,239,715 | |
| | | | |
Net asset value and redemption price per share | | $ | 12.96 | |
| | | | |
Offering price per share (100/95.75 of net asset value) (Note 1) | | $ | 13.54 | |
| | | | |
Class C shares: (redemption price per share is equal to net asset value less any applicable contingent deferred sales charge) (Note 1) | | | | |
Net assets | | $ | 248,687,421 | |
| | | | |
Shares of beneficial interest | | | 19,193,157 | |
| | | | |
Net asset value and offering price per share | | $ | 12.96 | |
| | | | |
Class N shares: | |
Net assets | | $ | 1,784,150,259 | |
| | | | |
Shares of beneficial interest | | | 136,568,968 | |
| | | | |
Net asset value, offering and redemption price per share | | $ | 13.06 | |
| | | | |
Class Y shares: | |
Net assets | | $ | 3,846,207,967 | |
| | | | |
Shares of beneficial interest | | | 294,555,318 | |
| | | | |
Net asset value, offering and redemption price per share | | $ | 13.06 | |
| | | | |
See accompanying notes to financial statements.
| 34
Statement of Operations
For the Year Ended September 30, 2017
| | | | |
INVESTMENT INCOME | |
Interest | | $ | 180,267,692 | |
Dividends | | | 14,085 | |
| | | | |
| | | 180,281,777 | |
| | | | |
Expenses | |
Management fees (Note 6) | | | 20,084,462 | |
Service and distribution fees (Note 6) | | | 4,619,557 | |
Administrative fees (Note 6) | | | 2,760,440 | |
Trustees’ fees and expenses (Notes 6) | | | 222,465 | |
Transfer agent fees and expenses (Notes 6 and 7) | | | 3,799,268 | |
Audit and tax services fees | | | 54,945 | |
Custodian fees and expenses | | | 269,278 | |
Legal fees | | | 134,284 | |
Registration fees | | | 86,174 | |
Shareholder reporting expenses | | | 189,886 | |
Miscellaneous expenses (Note 8) | | | 213,362 | |
| | | | |
Total expenses | | | 32,434,121 | |
| | | | |
Net investment income | | | 147,847,656 | |
| | | | |
NET REALIZED AND UNREALIZED GAIN (LOSS) ON INVESTMENTS, FORWARD FOREIGN CURRENCY CONTRACTS AND FOREIGN CURRENCY TRANSACTIONS | | | | |
Net realized gain (loss) on: | |
Investments | | | 2,756,366 | |
Forward foreign currency contracts (Note 2d) | | | (537,896 | ) |
Foreign currency transactions (Note 2c) | | | (203,881 | ) |
Net change in unrealized appreciation (depreciation) on: | |
Investments | | | (26,388,795 | ) |
Forward foreign currency contracts (Note 2d) | | | 1,021,411 | |
Foreign currency translations (Note 2c) | | | 64,425 | |
| | | | |
Net realized and unrealized loss on investments, forward foreign currency contracts and foreign currency transactions | | | (23,288,370 | ) |
| | | | |
NET INCREASE IN NET ASSETS RESULTING FROM OPERATIONS | | $ | 124,559,286 | |
| | | | |
See accompanying notes to financial statements.
35 |
Statement of Changes in Net Assets
| | | | | | | | |
| | | Year Ended
September 30,
2017 | | | Year Ended
September 30,
2016 | |
FROM OPERATIONS: | |
Net investment income | | $ | 147,847,656 | | | $ | 188,229,848 | |
Net realized gain (loss) on investments, forward foreign currency contracts and foreign currency transactions | | | 2,014,589 | | | | (54,963,966 | ) |
Net change in unrealized appreciation (depreciation) on investments, forward foreign currency contracts and foreign currency translations | | | (25,302,959 | ) | | | 390,813,245 | |
| | | | | | | | |
Net increase in net assets resulting from operations | | | 124,559,286 | | | | 524,079,127 | |
| | | | | | | | |
FROM DISTRIBUTIONS TO SHAREHOLDERS: | |
Net investment income | |
Class A | | | (18,803,246 | ) | | | (22,582,424 | ) |
Class B(a) | | | — | | | | (171 | ) |
Class C | | | (5,174,206 | ) | | | (6,795,665 | ) |
Class N | | | (58,740,189 | ) | | | (64,630,524 | ) |
Class Y | | | (90,552,059 | ) | | | (89,559,914 | ) |
| | | | | | | | |
Total distributions | | | (173,269,700 | ) | | | (183,568,698 | ) |
| | | | | | | | |
NET INCREASE (DECREASE) IN NET ASSETS FROM CAPITAL SHARE TRANSACTIONS (NOTE 10) | | | 418,423,155 | | | | (767,802,559 | ) |
| | | | | | | | |
Net increase (decrease) in net assets | | | 369,712,741 | | | | (427,292,130 | ) |
NET ASSETS | |
Beginning of the year | | | 6,186,224,633 | | | | 6,613,516,763 | |
| | | | | | | | |
End of the year | | $ | 6,555,937,374 | | | $ | 6,186,224,633 | |
| | | | | | | | |
UNDISTRIBUTED NET INVESTMENT INCOME | | $ | 1,849,136 | | | $ | 2,768,120 | |
| | | | | | | | |
| (a) | On January 11, 2016, Class B shares were converted into Class A shares. See Note 1 of Notes to Financial Statements. |
See accompanying notes to financial statements.
| 36
Financial Highlights
For a share outstanding throughout each period.
| | | | | | | | | | | | | | | | | | | | |
| | | Class A | |
| | | Year Ended
September 30,
2017 | | | Year Ended
September 30,
2016 | | | Year Ended
September 30,
2015 | | | Year Ended
September 30,
2014 | | | Year Ended
September 30,
2013 | |
Net asset value, beginning of the period | | $ | 13.06 | | | $ | 12.34 | | | $ | 13.18 | | | $ | 12.71 | | | $ | 13.52 | |
| | | | | | | | | | | | | | | | | | | | |
INCOME (LOSS) FROM INVESTMENT OPERATIONS: | | | | | | | | | | | | | | | | | | | | |
Net investment income(a) | | | 0.28 | | | | 0.37 | | | | 0.37 | | | | 0.42 | | | | 0.44 | |
Net realized and unrealized gain (loss) | | | (0.04 | ) | | | 0.71 | | | | (0.77 | ) | | | 0.51 | | | | (0.51 | ) |
| | | | | | | | | | | | | | | | | | | | |
Total from Investment Operations | | | 0.24 | | | | 1.08 | | | | (0.40 | ) | | | 0.93 | | | | (0.07 | ) |
| | | | | | | | | | | | | | | | | | | | |
LESS DISTRIBUTIONS FROM: | | | | | | | | | | | | | | | | | | | | |
Net investment income | | | (0.34 | ) | | | (0.36 | ) | | | (0.36 | ) | | | (0.46 | ) | | | (0.55 | ) |
Net realized capital gains | | | — | | | | — | | | | (0.08 | ) | | | (0.00 | )(b) | | | (0.19 | ) |
| | | | | | | | | | | | | | | | | | | | |
Total Distributions | | | (0.34 | ) | | | (0.36 | ) | | | (0.44 | ) | | | (0.46 | ) | | | (0.74 | ) |
| | | | | | | | | | | | | | | | | | | | |
Net asset value, end of the period | | $ | 12.96 | | | $ | 13.06 | | | $ | 12.34 | | | $ | 13.18 | | | $ | 12.71 | |
| | | | | | | | | | | | | | | | | | | | |
Total return(c) | | | 1.86 | % | | | 8.90 | % | | | (3.13 | )% | | | 7.43 | % | | | (0.61 | )% |
RATIOS TO AVERAGE NET ASSETS: | | | | | | | | | | | | | | | | | | | | |
Net assets, end of the period (000’s) | | $ | 676,892 | | | $ | 776,566 | | | $ | 912,662 | | | $ | 642,784 | | | $ | 436,199 | |
Net expenses | | | 0.73 | % | | | 0.73 | % | | | 0.74 | % | | | 0.79 | %(d) | | | 0.79 | % |
Gross expenses | | | 0.73 | % | | | 0.73 | % | | | 0.74 | % | | | 0.79 | %(d) | | | 0.79 | % |
Net investment income | | | 2.19 | % | | | 2.91 | % | | | 2.87 | % | | | 3.19 | % | | | 3.29 | % |
Portfolio turnover rate | | | 195 | % | | | 143 | % | | | 175 | % | | | 122 | % | | | 107 | % |
| (a) | Per share net investment income has been calculated using the average shares outstanding during the period. |
| (b) | Amount rounds to less than $0.01 per share. |
| (c) | A sales charge for Class A shares is not reflected in total return calculations. |
| (d) | Includes fee/expense recovery of less than 0.01%. |
See accompanying notes to financial statements.
37 |
Financial Highlights (continued)
For a share outstanding throughout each period.
| | | | | | | | | | | | | | | | | | | | |
| | | Class C | |
| | | Year Ended
September 30,
2017 | | | Year Ended
September 30,
2016 | | | Year Ended
September 30,
2015 | | | Year Ended
September 30,
2014 | | | Year Ended
September 30,
2013 | |
Net asset value, beginning of the period | | $ | 13.06 | | | $ | 12.33 | | | $ | 13.18 | | | $ | 12.72 | | | $ | 13.53 | |
| | | | | | | | | | | | | | | | | | | | |
INCOME (LOSS) FROM INVESTMENT OPERATIONS: | | | | | | | | | | | | | | | | | | | | |
Net investment income(a) | | | 0.19 | | | | 0.27 | | | | 0.27 | | | | 0.32 | | | | 0.34 | |
Net realized and unrealized gain (loss) | | | (0.05 | ) | | | 0.73 | | | | (0.77 | ) | | | 0.50 | | | | (0.51 | ) |
| | | | | | | | | | | | | | | | | | | | |
Total from Investment Operations | | | 0.14 | | | | 1.00 | | | | (0.50 | ) | | | 0.82 | | | | (0.17 | ) |
| | | | | | | | | | | | | | | | | | | | |
LESS DISTRIBUTIONS FROM: | | | | | | | | | | | | | | | | | | | | |
Net investment income | | | (0.24 | ) | | | (0.27 | ) | | | (0.27 | ) | | | (0.36 | ) | | | (0.45 | ) |
Net realized capital gains | | | — | | | | — | | | | (0.08 | ) | | | (0.00 | )(b) | | | (0.19 | ) |
| | | | | | | | | | | | | | | | | | | | |
Total Distributions | | | (0.24 | ) | | | (0.27 | ) | | | (0.35 | ) | | | (0.36 | ) | | | (0.64 | ) |
| | | | | | | | | | | | | | | | | | | | |
Net asset value, end of the period | | $ | 12.96 | | | $ | 13.06 | | | $ | 12.33 | | | $ | 13.18 | | | $ | 12.72 | |
| | | | | | | | | | | | | | | | | | | | |
Total return(c) | | | 1.08 | % | | | 8.17 | % | | | (3.86 | )% | | | 6.54 | % | | | (1.36 | )% |
RATIOS TO AVERAGE NET ASSETS: | | | | | | | | | | | | | | | | | | | | |
Net assets, end of the period (000’s) | | $ | 248,687 | | | $ | 321,626 | | | $ | 354,285 | | | $ | 256,307 | | | $ | 232,034 | |
Net expenses | | | 1.48 | % | | | 1.48 | % | | | 1.49 | % | | | 1.54 | %(d) | | | 1.54 | % |
Gross expenses | | | 1.48 | % | | | 1.48 | % | | | 1.49 | % | | | 1.54 | %(d) | | | 1.54 | % |
Net investment income | | | 1.44 | % | | | 2.16 | % | | | 2.11 | % | | | 2.46 | % | | | 2.54 | % |
Portfolio turnover rate | | | 195 | % | | | 143 | % | | | 175 | % | | | 122 | % | | | 107 | % |
| (a) | Per share net investment income has been calculated using the average shares outstanding during the period. |
| (b) | Amount rounds to less than $0.01 per share. |
| (c) | A contingent deferred sales charge for Class C shares is not reflected in total return calculations. |
| (d) | Includes fee/expense recovery of less than 0.01%. |
See accompanying notes to financial statements.
| 38
Financial Highlights (continued)
For a share outstanding throughout each period.
| | | | | | | | | | | | | | | | | | | | |
| | | Class N | |
| | | Year Ended
September 30,
2017 | | | Year Ended
September 30,
2016 | | | Year Ended
September 30,
2015 | | | Year Ended
September 30,
2014 | | | Period Ended
September 30,
2013* | |
Net asset value, beginning of the period | | $ | 13.17 | | | $ | 12.44 | | | $ | 13.28 | | | $ | 12.80 | | | $ | 13.43 | |
| | | | | | | | | | | | | | | | | | | | |
INCOME (LOSS) FROM INVESTMENT OPERATIONS: | | | | | | | | | | | | | | | | | | | | |
Net investment income(a) | | | 0.33 | | | | 0.41 | | | | 0.42 | | | | 0.46 | | | | 0.32 | |
Net realized and unrealized gain (loss) | | | (0.06 | ) | | | 0.73 | | | | (0.78 | ) | | | 0.52 | | | | (0.59 | ) |
| | | | | | | | | | | | | | | | | | | | |
Total from Investment Operations | | | 0.27 | | | | 1.14 | | | | (0.36 | ) | | | 0.98 | | | | (0.27 | ) |
| | | | | | | | | | | | | | | | | | | | |
LESS DISTRIBUTIONS FROM: | | | | | | | | | | | | | | | | | | | | |
Net investment income | | | (0.38 | ) | | | (0.41 | ) | | | (0.40 | ) | | | (0.50 | ) | | | (0.36 | ) |
Net realized capital gains | | | — | | | | — | | | | (0.08 | ) | | | (0.00 | )(b) | | | — | |
| | | | | | | | | | | | | | | | | | | | |
Total Distributions | | | (0.38 | ) | | | (0.41 | ) | | | (0.48 | ) | | | (0.50 | ) | | | (0.36 | ) |
| | | | | | | | | | | | | | | | | | | | |
Net asset value, end of the period | | $ | 13.06 | | | $ | 13.17 | | | $ | 12.44 | | | $ | 13.28 | | | $ | 12.80 | |
| | | | | | | | | | | | | | | | | | | | |
Total return | | | 2.12 | % | | | 9.33 | % | | | (2.82 | )% | | | 7.81 | % | | | (2.02 | )%(c) |
RATIOS TO AVERAGE NET ASSETS: | | | | | | | | | | | | | | | | | | | | |
Net assets, end of the period (000’s) | | $ | 1,784,150 | | | $ | 2,134,113 | | | $ | 2,209,110 | | | $ | 105,514 | | | $ | 19,247 | |
Net expenses | | | 0.39 | % | | | 0.39 | % | | | 0.40 | % | | | 0.46 | % | | | 0.44 | %(d) |
Gross expenses | | | 0.39 | % | | | 0.39 | % | | | 0.40 | % | | | 0.46 | % | | | 0.44 | %(d) |
Net investment income | | | 2.53 | % | | | 3.25 | % | | | 3.27 | % | | | 3.42 | % | | | 3.81 | %(d) |
Portfolio turnover rate | | | 195 | % | | | 143 | % | | | 175 | % | | | 122 | % | | | 107 | % |
| * | From commencement of Class operations on February 1, 2013 through September 30, 2013. |
| (a) | Per share net investment income has been calculated using the average shares outstanding during the period. |
| (b) | Amount rounds to less than $0.01 per share. |
| (c) | Periods less than one year are not annualized. |
| (d) | Computed on an annualized basis for periods less than one year. |
See accompanying notes to financial statements.
39 |
Financial Highlights (continued)
For a share outstanding throughout each period.
| | | | | | | | | | | | | | | | | | | | |
| | | Class Y | |
| | | Year Ended
September 30,
2017 | | | Year Ended
September 30,
2016 | | | Year Ended
September 30,
2015 | | | Year Ended
September 30,
2014 | | | Year Ended
September 30,
2013 | |
Net asset value, beginning of the period | | $ | 13.16 | | | $ | 12.43 | | | $ | 13.27 | | | $ | 12.80 | | | $ | 13.61 | |
| | | | | | | | | | | | | | | | | | | | |
INCOME (LOSS) FROM INVESTMENT OPERATIONS: | | | | | | | | | | | | | | | | | | | | |
Net investment income(a) | | | 0.31 | | | | 0.40 | | | | 0.41 | | | | 0.45 | | | | 0.47 | |
Net realized and unrealized gain (loss) | | | (0.04 | ) | | | 0.73 | | | | (0.78 | ) | | | 0.51 | | | | (0.51 | ) |
| | | | | | | | | | | | | | | | | | | | |
Total from Investment Operations | | | 0.27 | | | | 1.13 | | | | (0.37 | ) | | | 0.96 | | | | (0.04 | ) |
| | | | | | | | | | | | | | | | | | | | |
LESS DISTRIBUTIONS FROM: | | | | | | | | | | | | | | | | | | | | |
Net investment income | | | (0.37 | ) | | | (0.40 | ) | | | (0.39 | ) | | | (0.49 | ) | | | (0.58 | ) |
Net realized capital gains | | | — | | | | — | | | | (0.08 | ) | | | (0.00 | )(b) | | | (0.19 | ) |
| | | | | | | | | | | | | | | | | | | | |
Total Distributions | | | (0.37 | ) | | | (0.40 | ) | | | (0.47 | ) | | | (0.49 | ) | | | (0.77 | ) |
| | | | | | | | | | | | | | | | | | | | |
Net asset value, end of the period | | $ | 13.06 | | | $ | 13.16 | | | $ | 12.43 | | | $ | 13.27 | | | $ | 12.80 | |
| | | | | | | | | | | | | | | | | | | | |
Total return | | | 2.10 | % | | | 9.22 | % | | | (2.89 | )% | | | 7.65 | % | | | (0.35 | )% |
RATIOS TO AVERAGE NET ASSETS: | | | | | | | | | | | | | | | | | | | | |
Net assets, end of the period (000’s) | | $ | 3,846,208 | | | $ | 2,953,919 | | | $ | 3,137,371 | | | $ | 1,310,824 | | | $ | 627,617 | |
Net expenses | | | 0.48 | % | | | 0.48 | % | | | 0.49 | % | | | 0.54 | %(c) | | | 0.54 | % |
Gross expenses | | | 0.48 | % | | | 0.48 | % | | | 0.49 | % | | | 0.54 | %(c) | | | 0.54 | % |
Net investment income | | | 2.43 | % | | | 3.15 | % | | | 3.14 | % | | | 3.42 | % | | | 3.54 | % |
Portfolio turnover rate | | | 195 | % | | | 143 | % | | | 175 | % | | | 122 | % | | | 107 | % |
| (a) | Per share net investment income has been calculated using the average shares outstanding during the period. |
| (b) | Amount rounds to less than $0.01 per share. |
| (c) | Includes fee/expense recovery of less than 0.01%. |
See accompanying notes to financial statements.
| 40
Notes to Financial Statements
September 30, 2017
1. Organization. Natixis Funds Trust I (the “Trust”) is organized as a Massachusetts business trust. The Trust is registered under the Investment Company Act of 1940, as amended (the “1940 Act”) as an open-end management investment company. The Declaration of Trust permits the Board of Trustees to authorize the issuance of an unlimited number of shares of the Trust in multiple series. The financial statements for certain funds of the Trust are presented in separate reports. Information presented in these financial statements pertains to Loomis Sayles Core Plus Bond Fund (the “Fund”).
The Fund is a diversified investment company.
The Fund offers Class A, Class C, Class N and Class Y shares. As of the close of business on January 11, 2016, Class B shares were converted into Class A shares and are no longer offered. Class T shares of the Fund are not currently available for purchase.
Class A shares are sold with a maximum front-end sales charge of 4.25%. Class C shares do not pay a front-end sales charge, do not convert to any other class of shares, pay higher Rule 12b-1 fees than Class A shares and may be subject to a CDSC of 1.00% if those shares are redeemed within one year of acquisition, except for reinvested distributions. Class N and Class Y shares do not pay a front-end sales charge, a CDSC or Rule 12b-1 fees. Class N shares are offered with an initial minimum investment of $1,000,000. Class Y shares are offered with an initial minimum investment of $100,000. Certain categories of investors are exempted from the minimum investment amounts for Class N and Class Y as outlined in the Fund’s prospectus.
Most expenses can be directly attributed to a Fund. Expenses which cannot be directly attributed to a Fund are generally apportioned based on the relative net assets of each of the funds in Natixis Funds Trust I, Natixis Funds Trust II, Natixis Funds Trust IV and Gateway Trust (“Natixis Funds Trusts”), Loomis Sayles Funds I and Loomis Sayles Funds II (“Loomis Sayles Funds Trusts”), and Natixis ETF Trust. Expenses of the Fund are borne pro rata by the holders of each class of shares, except that each class bears expenses unique to that class (such as the Rule 12b-1 fees applicable to Class A and Class C), and transfer agent fees are borne collectively for Class A, Class C and Class Y, and individually for Class N. In addition, each class votes as a class only with respect to its own Rule 12b-1 Plan. Shares of each class would receive their pro rata share of the net assets of the Fund if the Fund were liquidated. The Trustees approve separate distributions from net investment income on each class of shares.
2. Significant Accounting Policies. The following is a summary of significant accounting policies consistently followed by the Fund in the preparation of its financial statements. The Fund’s financial statements follow the accounting and reporting guidelines provided for investment companies and are prepared in accordance with accounting principles generally accepted in the United States of America which require the use of management estimates that affect the reported amounts and disclosures in the financial statements. Actual results could differ from those
41 |
Notes to Financial Statements (continued)
September 30, 2017
estimates. Management has evaluated the events and transactions subsequent to year-end through the date the financial statements were issued and has determined that there were no material events that would require disclosure in the Fund’s financial statements.
a. Valuation. Fund securities and other investments are valued at market value based on market quotations obtained or determined by independent pricing services recommended by the adviser and approved by the Board of Trustees. Fund securities and other investments for which market quotations are not readily available are valued at fair value as determined in good faith by the adviser pursuant to procedures approved by the Board of Trustees, as described below. Market value is determined as follows:
Debt securities and unlisted preferred equity securities are valued based on evaluated bids furnished to the Fund by an independent pricing service or bid prices obtained from broker-dealers. Senior loans are valued at bid prices supplied by an independent pricing service, if available. Listed equity securities (including shares of closed-end investment companies and exchange-traded funds) are valued at the last sale price quoted on the exchange where they are traded most extensively or, if there is no reported sale during the day, the closing bid quotation as reported by an independent pricing service. Securities traded on the NASDAQ Global Select Market, NASDAQ Global Market and NASDAQ Capital Market are valued at the NASDAQ Official Closing Price (“NOCP”), or if lacking an NOCP, at the most recent bid quotations on the applicable NASDAQ Market. Unlisted equity securities (except unlisted preferred equity securities) are valued at the last sale price quoted in the market where they are traded most extensively or, if there is no reported sale during the day, the closing bid quotation as reported by an independent pricing service. If there is no last sale price or closing bid quotation available, unlisted equity securities will be valued using evaluated bids furnished by an independent pricing service, if available. In some foreign markets, an official close price and a last sale price may be available from the foreign exchange or market. In those cases, the official close price is used. Broker-dealer bid prices may be used to value debt and unlisted equity securities and senior loans where an independent pricing service is unable to price a security or where an independent pricing service does not provide a reliable price for the security. Forward foreign currency contracts are valued utilizing interpolated rates determined based on information provided by an independent pricing service.
Fund securities and other investments for which market quotations are not readily available are valued at fair value as determined in good faith by the adviser pursuant to procedures approved by the Board of Trustees. The Fund may also value securities and other investments at fair value in other circumstances such as when extraordinary events occur after the close of a foreign market but prior to the close of the New York Stock Exchange (“NYSE”). This may include situations relating to a single issuer (such as a declaration of bankruptcy or a delisting of the issuer’s security from the primary
| 42
Notes to Financial Statements (continued)
September 30, 2017
market on which it has traded) as well as events affecting the securities markets in general (such as market disruptions or closings and significant fluctuations in U.S. and/or foreign markets). When fair valuing its securities or other investments, the Fund may, among other things, use modeling tools or other processes that may take into account factors such as securities or other market activity and/or significant events that occur after the close of the foreign market and before the time the Fund’s net asset value (“NAV”) is calculated. Fair value pricing may require subjective determinations about the value of a security, and fair values used to determine a Fund’s NAV may differ from quoted or published prices, or from prices that are used by others, for the same securities. In addition, the use of fair value pricing may not always result in adjustments to the prices of securities held by the Fund.
Illiquid securities for which market quotations are readily available and have been evaluated by the adviser are considered and classified as fair valued securities pursuant to the Fund’s pricing policies and procedures.
As of September 30, 2017, securities held by the Fund were fair valued as follows:
| | | | |
Securities fair
valued by the
Fund’s adviser | | Percentage of
Net Assets | |
| $3,535,259 | | | 0.1 | % |
b. Investment Transactions and Related Investment Income. Investment transactions are accounted for on a trade date plus one day basis for daily NAV calculation. However, for financial reporting purposes, investment transactions are reported on trade date. Dividend income is recorded on ex-dividend date, or in the case of certain foreign securities, as soon as the Fund is notified, and interest income is recorded on an accrual basis. Interest income is increased by the accretion of discount and decreased by the amortization of premium, if applicable. Periodic principal adjustments for inflation-protected securities are recorded to interest income. Negative principal adjustments (in the event of deflation) are recorded as reductions of interest income to the extent of interest income earned, not to exceed the amount of positive principal adjustments on a cumulative basis. In determining net gain or loss on securities sold, the cost of securities has been determined on an identified cost basis. Investment income, non-class specific expenses and realized and unrealized gains and losses are allocated on a pro rata basis to each class based on the relative net assets of each class to the total net assets of the Fund.
c. Foreign Currency Translation. The books and records of the Fund are maintained in U.S. dollars. The values of securities, currencies and other assets and liabilities denominated in currencies other than U.S. dollars are translated into U.S. dollars based upon foreign exchange rates prevailing at the end of the period. Purchases and sales of investment securities, income and expenses are translated into U.S. dollars on the respective dates of such transactions.
43 |
Notes to Financial Statements (continued)
September 30, 2017
Net realized foreign exchange gains or losses arise from sales of foreign currency, changes in exchange rates between the trade and settlement dates on securities transactions and the difference between the amounts of dividends, interest and foreign withholding taxes recorded on the Fund’s books and the U.S. dollar equivalent of the amounts actually received or paid. Net unrealized foreign exchange gains or losses arise from changes in the value of assets and liabilities, other than investment securities, as of the end of the fiscal period, resulting from changes in exchange rates. Net realized foreign exchange gains or losses and the net change in unrealized foreign exchange gains or losses are disclosed in the Statement of Operations. For federal income tax purposes, net realized foreign exchange gains or losses are characterized as ordinary income and may, if the Fund has net losses, reduce or eliminate the amount of income available to be distributed by the Fund.
The values of investment securities are presented at the foreign exchange rates prevailing at the end of the period for financial reporting purposes. Net realized and unrealized gains or losses on investments reported in the Statement of Operations reflect gains or losses resulting from changes in exchange rates and fluctuations which arise due to changes in market prices of investment securities. For federal income tax purposes, a portion of the net realized gain or loss on investments arising from changes in exchange rates, which is reflected in the Statement of Operations, may be characterized as ordinary income and may, if the Fund has net losses, reduce or eliminate the amount of income available to be distributed by the Fund.
During the year ended September 30, 2017, the amount of income available to be distributed by the Fund has been reduced by $6,162,660 as a result of losses arising from changes in exchange rates.
The Fund may use foreign currency exchange contracts to facilitate transactions in foreign-denominated investments. Losses may arise from changes in the value of the foreign currency or if the counterparties do not perform under the contracts’ terms.
d. Forward Foreign Currency Contracts. The Fund may enter into forward foreign currency contracts, including forward foreign cross currency contracts, to acquire exposure to foreign currencies or to hedge the Fund’s investments against currency fluctuation. A contract can also be used to offset a previous contract. These contracts involve market risk in excess of the unrealized gain or loss reflected in the Fund’s Statement of Assets and Liabilities. The U.S. dollar value of the currencies the Fund has committed to buy or sell represents the aggregate exposure to each currency the Fund has acquired or hedged through currency contracts outstanding at period end. Gains or losses are recorded for financial statement purposes as unrealized until settlement date. Contracts are traded over-the-counter directly with a counterparty. Risks may arise upon entering into these contracts from the potential inability of counterparties to meet the terms of their contracts and from unanticipated movements in the value of a
| 44
Notes to Financial Statements (continued)
September 30, 2017
foreign currency relative to the U.S. dollar. Certain contracts may require the movement of cash and/or securities as collateral for the Fund’s or counterparty’s net obligations under the contracts.
e. When-Issued and Delayed Delivery Transactions. The Fund may enter into when-issued or delayed delivery transactions. When-issued refers to transactions made conditionally because a security, although authorized, has not been issued. Delayed delivery refers to transactions for which delivery or payment will occur at a later date, beyond the normal settlement period. The price of when-issued and delayed delivery securities and the date when the securities will be delivered and paid for are fixed at the time the transaction is negotiated. The security and the obligation to pay for it are recorded by the Fund at the time the commitment is entered into. The value of the security may vary with market fluctuations during the time before the Fund takes delivery of the security. No interest accrues to the Fund until the transaction settles.
Delayed delivery transactions include those designated as To Be Announced (“TBAs”) in the Portfolios of Investments. For TBAs, the actual security that will be delivered to fulfill the transaction is not designated at the time of the trade. The security is “to be announced” 48 hours prior to the established trade settlement date. Certain transactions require the Fund or counterparty to post cash and/or securities as collateral for the net mark-to-market exposure to the other party. The Fund covers its net obligations under outstanding delayed delivery commitments by segregating or earmarking cash or securities at the custodian.
Purchases of when-issued or delayed delivery securities may have a similar effect on the Fund’s NAV as if the Fund had created a degree of leverage in the portfolio. Risks may arise upon entering into such transactions from the potential inability of counterparties to meet their obligations under the transactions. Additionally, losses may arise due to changes in the value of the underlying securities.
f. Federal and Foreign Income Taxes. The Fund intends to meet the requirements of the Internal Revenue Code of 1986, as amended, applicable to regulated investment companies, and to distribute to its shareholders substantially all of its net investment income and any net realized capital gains at least annually. Management has performed an analysis of the Fund’s tax positions for the open tax years as of September 30, 2017 and has concluded that no provisions for income tax are required. The Fund’s federal tax returns for the prior three fiscal years remain subject to examination by the Internal Revenue Service. Management is not aware of any events that are reasonably possible to occur in the next twelve months that would result in the amounts of any unrecognized tax benefits significantly increasing or decreasing for the Fund. However, management’s conclusions regarding tax positions taken may be subject to review and adjustment at a later date based on factors including, but not limited to, new tax laws and accounting regulations and interpretations thereof.
45 |
Notes to Financial Statements (continued)
September 30, 2017
The Fund may be subject to foreign withholding taxes on investment income and taxes on capital gains on investments that are accrued and paid based upon the Fund’s understanding of the tax rules and regulations that exist in the countries in which the Fund invests. Foreign withholding taxes on dividend and interest income are reflected on the Statement of Operations as a reduction of investment income, net of amounts eligible to be reclaimed. Dividends and interest receivable on the Statement of Assets and Liabilities are net of foreign withholding taxes. Foreign withholding taxes where reclaims have been or will be filed are reflected on the Statement of Assets and Liabilities as tax reclaims receivable. Capital gains taxes paid are included in net realized gain (loss) on investments in the Statement of Operations. Accrued but unpaid capital gains taxes are reflected as foreign taxes payable on the Statement of Assets and Liabilities, if applicable, and reduce unrealized gains on investments. In the event that realized gains on investments are subsequently offset by realized losses, taxes paid on realized gains may be returned to the Fund. Such amounts, if applicable, are reflected as foreign tax rebates receivable on the Statement of Assets and Liabilities and are recorded as a realized gain when received.
g. Dividends and Distributions to Shareholders. Dividends and distributions are recorded on ex-dividend date. The timing and characterization of certain income and capital gain distributions are determined in accordance with federal tax regulations, which may differ from accounting principles generally accepted in the United States of America. Permanent differences are primarily due to differing treatments for book and tax purposes of items such as foreign currency gains and losses, premium amortization and paydown gains and losses. Permanent book and tax basis differences relating to shareholder distributions will result in reclassifications to capital accounts. Temporary differences between book and tax distributable earnings are primarily due to deferred Trustees’ fees, wash sales, premium amortization, forward foreign currency contracts mark-to-market, corporate actions and treasury inflation-protected bonds. Amounts of income and capital gain available to be distributed on a tax basis are determined annually, and at other times during the Fund’s fiscal year as may be necessary to avoid knowingly declaring and paying a return of capital distribution. Distributions from net investment income and short-term capital gains are considered to be distributed from ordinary income for tax purposes.
The tax characterization of distributions is determined on an annual basis. The tax character of distributions paid to shareholders during the years ended September 30, 2017 and 2016 were as follows:
| | | | | | | | | | | | | | | | | | | | |
2017 Distributions Paid From: | | | 2016 Distributions Paid From: | |
Ordinary
Income | | Long-Term
Capital Gains | | | Total | | | Ordinary
Income | | | Long-Term
Capital Gains | | | Total | |
| $173,269,700 | | $ | — | | | $ | 173,269,700 | | | $ | 183,568,698 | | | $ | — | | | $ | 183,568,698 | |
| 46
Notes to Financial Statements (continued)
September 30, 2017
As of September 30, 2017, the components of distributable earnings on a tax basis were as follows:
| | | | |
Undistributed ordinary income | | $ | 3,395,252 | |
| | | | |
Capital loss carryforward: | | | | |
Long-term: | | | | |
No expiration date | | | (77,584,753 | ) |
| | | | |
Unrealized depreciation | | | (51,660,004 | ) |
| | | | |
Total accumulated losses | | $ | (125,849,505 | ) |
| | | | |
As of September 30, 2017, unrealized depreciation on a tax basis was approximately as follows:
| | | | |
Unrealized depreciation | | | | |
Investments | | $ | (13,660,580 | ) |
Foreign currency translations | | | (37,999,424 | ) |
| | | | |
Total unrealized depreciation | | $ | (51,660,004 | ) |
| | | | |
As of September 30, 2017, the cost of investments (including derivatives, if applicable) and unrealized appreciation (depreciation) on a federal tax basis were as follows:
| | | | |
Federal tax cost | | $ | 7,138,497,290 | |
| | | | |
Gross tax appreciation | | | 81,997,896 | |
Gross tax depreciation | | | (133,615,546 | ) |
| | | | |
Net tax depreciation | | $ | (51,617,650 | ) |
| | | | |
Differences between these amounts and those reported in the components of distributable earnings are primarily attributable to unrealized foreign exchange gains or losses.
h. Repurchase Agreements. The Fund may enter into repurchase agreements, under the terms of a Master Repurchase Agreement, under which the Fund acquires securities as collateral and agrees to resell the securities at an agreed upon time and at an agreed upon price. It is the Fund’s policy that the market value of the collateral for repurchase agreements be at least equal to 102% of the repurchase price, including interest. Certain repurchase agreements are tri-party arrangements whereby the collateral is held in a segregated account for the benefit of the Fund and on behalf of the counterparty. Repurchase agreements could involve certain risks in the event of default or insolvency of the counterparty, including possible delays or restrictions upon the Fund’s ability to dispose of the underlying securities. As of September 30, 2017, the Fund had investments in repurchase agreements for which the value of the related collateral exceeded the value of the repurchase agreement. The gross value of repurchase agreements is included in the Statement of Assets and Liabilities for financial reporting purposes.
47 |
Notes to Financial Statements (continued)
September 30, 2017
i. Due from Brokers. Transactions and positions in certain forward foreign currency contacts and delayed delivery commitments are maintained and cleared by registered U.S. broker/dealers pursuant to customer agreements between the Fund and the various broker/dealers. The due from broker balance in the Statement of Assets and Liabilities for the Fund represents cash pledged as collateral for delayed delivery securities. In certain circumstances the Fund’s use of cash held at brokers is restricted by regulation or broker mandated limits.
j. Securities Lending. The Fund has entered into an agreement with State Street Bank and Trust Company (“State Street Bank”), as agent of the Fund, to lend securities to certain designated borrowers. The loans are collateralized with cash or securities in an amount equal to at least 105% or 102% of the market value (including accrued interest) of the loaned international or domestic securities, respectively, when the loan is initiated. Thereafter, the value of the collateral must remain at least 102% of the market value (including accrued interest) of loaned securities for U.S. equities and U.S. corporate debt; at least 105% of the market value (including accrued interest) of loaned securities for non-U.S. equities; and at least 100% of the market value (including accrued interest) of loaned securities for U.S. Government securities, sovereign debt issued by non-U.S. Governments and non-U.S. corporate debt. In the event that the market value of the collateral falls below the required percentages described above, the borrower will deliver additional collateral on the next business day. As with other extensions of credit, the Fund may bear the risk of loss with respect to the investment of the collateral. The Fund invests cash collateral in short-term investments, a portion of the income from which is remitted to the borrowers and the remainder allocated between the Fund and State Street Bank as lending agent.
For the year ended September 30, 2017, the Fund did not loan securities under this agreement.
k. Indemnifications. Under the Trust’s organizational documents, its officers and Trustees are indemnified against certain liabilities arising out of the performance of their duties to the Fund. Additionally, in the normal course of business, the Fund enters into contracts with service providers that contain general indemnification clauses. The Fund’s maximum exposure under these arrangements is unknown as this would involve future claims that may be made against the Fund that have not yet occurred. However, based on experience, the Fund expects the risk of loss to be remote.
3. Fair Value Measurements. In accordance with accounting standards related to fair value measurements and disclosures, the Fund has categorized the inputs utilized in determining the value of the Fund’s assets or liabilities. These inputs are summarized in the three broad levels listed below:
| | • | | Level 1 – quoted prices in active markets for identical assets or liabilities; |
| 48
Notes to Financial Statements (continued)
September 30, 2017
| | • | | Level 2 – prices determined using other significant inputs that are observable either directly, or indirectly through corroboration with observable market data (which could include quoted prices for similar assets or liabilities, interest rates, credit risk, etc.); and |
| | • | | Level 3 – prices determined using significant unobservable inputs when quoted prices or observable inputs are unavailable such as when there is little or no market activity for an asset or liability (unobservable inputs reflect the Fund’s own assumptions in determining the fair value of assets or liabilities and would be based on the best information available). |
The inputs or methodology used for valuing securities are not necessarily an indication of the risk associated with investing in those securities.
The Fund’s pricing policies and procedures are recommended by the adviser and approved by the Board of Trustees. Debt securities are valued based on evaluated bids furnished to the Fund by an independent pricing service. Broker-dealer bid prices may be used if an independent pricing service either is unable to price a security or does not provide a reliable price for a security. Broker-dealer bid prices for which the Fund does not have knowledge of the inputs used by the broker-dealer are categorized in Level 3. All security prices, including those obtained from an independent pricing service and broker-dealer bid prices, are reviewed on a daily basis by the adviser, subject to oversight by Fund management and the Board of Trustees. If the adviser, in good faith, believes that the price provided by an independent pricing service is unreliable, broker-dealer bid prices may be used until the price provided by the independent pricing service is considered to be reliable. Reliability of all security prices, including those obtained from an independent pricing service and broker-dealer bid prices, is tested in a variety of ways, including comparison to recent transaction prices and daily fluctuations, amongst other validation procedures in place. Securities for which market quotations are not readily available are valued at fair value as determined in good faith by the Fund’s adviser pursuant to procedures approved by the Board of Trustees. Fair valued securities may be categorized in Level 3.
49 |
Notes to Financial Statements (continued)
September 30, 2017
The following is a summary of the inputs used to value the Fund’s investments as of September 30, 2017, at value:
Asset Valuation Inputs
| | | | | | | | | | | | | | | | |
Description | | Level 1 | | | Level 2 | | | Level 3 | | | Total | |
Bonds and Notes | | | | | | | | | | | | | | | | |
ABS Home Equity | | $ | — | | | $ | 103,974,212 | | | $ | 2,967,183 | (b) | | $ | 106,941,395 | |
All Other Bonds and Notes(a) | | | — | | | | 5,932,292,646 | | | | — | | | | 5,932,292,646 | |
| | | | | | | | | | | | | | | | |
Total Bonds and Notes | | | — | | | | 6,036,266,858 | | | | 2,967,183 | | | | 6,039,234,041 | |
| | | | | | | | | | | | | | | | |
Senior Loans(a) | | | — | | | | 192,470,064 | | | | — | | | | 192,470,064 | |
Preferred Stocks(a) | | | — | | | | 18,748,502 | | | | — | | | | 18,748,502 | |
Common Stocks(a) | | | — | | | | — | | | | 3,535,259 | (c) | | | 3,535,259 | |
Short-Term Investments | | | — | | | | 832,891,774 | | | | — | | | | 832,891,774 | |
| | | | | | | | | | | | | | | | |
Total Investments | | | — | | | | 7,080,377,198 | | | | 6,502,442 | | | | 7,086,879,640 | |
| | | | | | | | | | | | | | | | |
Forward Foreign Currency Contracts (unrealized appreciation) | | | — | | | | 1,039,162 | | | | — | | | | 1,039,162 | |
| | | | | | | | | | | | | | | | |
Total | | $ | — | | | $ | 7,081,416,360 | | | $ | 6,502,442 | | | $ | 7,087,918,802 | |
| | | | | | | | | | | | | | | | |
| (a) | Details of the major categories of the Fund’s investments are reflected within the Portfolio of Investments. |
| (b) | Valued using broker-dealer bid prices. |
| (c) | Fair valued by the Fund’s adviser. |
For the year ended September 30, 2017, there were no transfers among Levels 1, 2 and 3.
| 50
Notes to Financial Statements (continued)
September 30, 2017
The following is a reconciliation of Level 3 investments for which significant unobservable inputs were used to determine fair value as of September 30, 2016 and/or September 30, 2017:
Asset Valuation Inputs
| | | | | | | | | | | | | | | | | | | | |
Investments in Securities | | Balance as of
September 30,
2016 | | | Accrued
Discounts
(Premiums) | | | Realized
Gain
(Loss) | | | Change in
Unrealized
Appreciation
(Depreciation) | | | Purchases | |
Bonds and Notes | | | | | | | | | | | | | | | | | | | | |
Non-Convertible Bonds | | | | | | | | | | | | | | | | | | | | |
ABS Home Equity | | $ | — | | | $ | — | | | $ | — | | | $ | — | | | $ | 2,967,183 | |
Non-Agency Commercial Mortgage-Backed Securities | | | 11,857,953 | | | | — | | | | (15,421 | ) | | | 27,065 | | | | — | |
Common Stocks | | | | | | | | | | | | | | | | | | | | |
Oil, Gas & Consumable Fuels | | | — | | | | — | | | | (92 | ) | | | (16,242,263 | ) | | | 19,777,614 | |
| | | | | | | | | | | | | | | | | | | | |
Total | | $ | 11,857,953 | | | $ | — | | | $ | (15,513 | ) | | $ | (16,215,198 | ) | | $ | 22,744,797 | |
| | | | | | | | | | | | | | | | | | | | |
| | | | | |
Investments in Securities | | Sales | | | Transfers
into Level 3 | | | Transfers
out of
Level 3 | | | Balance as of
September 30,
2017 | | | Change in
Unrealized
Appreciation
(Depreciation)
from
Investments
Still Held at
September 30,
2017 | |
Bonds and Notes | | | | | | | | | | | | | | | | | | | | |
Non-Convertible Bonds | | | | | | | | | | | | | | | | | | | | |
ABS Home Equity | | $ | — | | | $ | — | | | $ | — | | | $ | 2,967,183 | | | $ | — | |
Non-Agency Commercial Mortgage-Backed Securities | | | (11,869,597 | ) | | | — | | | | — | | | | — | | | | — | |
Common Stocks | | | | | | | | | | | | | | | | | | | | |
Oil, Gas & Consumable Fuels | | | — | | | | — | | | | — | | | | 3,535,259 | | | | (16,242,263 | ) |
| | | | | | | | | | | | | | | | | | | | |
Total | | $ | (11,869,597 | ) | | $ | — | | | $ | — | | | $ | 6,502,442 | | | $ | (16,242,263 | ) |
| | | | | | | | | | | | | | | | | | | | |
4. Derivatives. Derivative instruments are defined as financial instruments whose value and performance are based on the value and performance of an underlying asset, reference rate or index. Derivative instruments that the Fund used during the period include forward foreign currency contracts.
51 |
Notes to Financial Statements (continued)
September 30, 2017
The Fund is subject to the risk that changes in foreign currency exchange rates will have an unfavorable effect on the value of Fund assets denominated in foreign currencies. The Fund may enter into forward foreign currency contracts for hedging purposes to protect the value of the Fund’s holdings of foreign securities. During the year ended September 30, 2017, the Fund engaged in forward foreign currency transactions for hedging purposes.
The following is a summary of derivative instruments for the Fund as of September 30, 2017, as reflected within the Statement of Assets and Liabilities:
| | | | |
Assets | | Unrealized
appreciation on
forward foreign
currency contracts | |
Foreign exchange contracts | | $ | 1,039,162 | |
Transactions in derivative instruments for the Fund during the year ended September 30, 2017, as reflected within the Statement of Operations, were as follows:
| | | | |
Net Realized Gain (Loss) on: | | Forward foreign
currency contracts | |
Foreign exchange contracts | | $ | (537,896 | ) |
| |
Net Change in Unrealized Appreciation
(Depreciation) on: | | Forward foreign
currency contracts | |
Foreign exchange contracts | | $ | 1,021,411 | |
As the Fund values its derivatives at fair value and recognizes changes in fair value through the Statement of Operations, it does not qualify for hedge accounting under authoritative guidance for derivative instruments. The Fund’s investments in derivatives may represent an economic hedge; however, they are considered to be non-hedge transactions for the purpose of these disclosures.
The volume of forward foreign currency contract activity, as a percentage of net assets, based on gross month-end notional amounts outstanding during the period, including long and short positions at absolute value, was as follows for the year ended September 30, 2017:
| | | | |
| | | Forwards | |
Average Notional Amount Outstanding | | | 0.39 | % |
Highest Notional Amount Outstanding | | | 1.23 | % |
Lowest Notional Amount Outstanding | | | 0.21 | % |
Notional Amount Outstanding as of September 30, 2017 | | | 1.22 | % |
Notional amounts outstanding at the end of the prior period are included in the average notional amount outstanding.
| 52
Notes to Financial Statements (continued)
September 30, 2017
Unrealized gain and/or loss on open forwards is recorded in the Statement of Assets and Liabilities. The aggregate notional values of forward contracts are not recorded in the Statement of Assets and Liabilities, and therefore are not included in the Fund’s net assets.
Over-the-counter derivatives, including forward foreign currency contracts, are entered into pursuant to International Swaps and Derivatives Association, Inc. (“ISDA”) agreements negotiated between the Fund and its counterparties. ISDA agreements typically contain, among other things, terms for the posting of collateral and master netting provisions in the event of a default or other termination event. Collateral is posted by the Fund or the counterparty to the extent of the net mark-to-market exposure to the other party of all open contracts under the agreement, subject to minimum transfer requirements. Master netting provisions allow the Fund and the counterparty, in the event of a default or other termination event, to offset amounts owed by each related to derivative contracts, including any posted collateral, to one net amount payable by either the Fund or the counterparty. The Fund’s ISDA agreements typically contain provisions that allow a counterparty to terminate open contracts early if the NAV of the Fund declines beyond a certain threshold. For financial reporting purposes, the Fund does not offset derivative assets and liabilities, and any related collateral received or pledged, on the Statement of Assets and Liabilities.
As of September 30, 2017, gross amounts of over-the-counter derivative assets and liabilities not offset in the Statement of Assets and Liabilities and the related net amounts after taking into account master netting arrangements by counterparty, are as follows:
| | | | | | | | | | | | | | | | | | | | |
Counterparty | | Gross Amounts
of Assets | | | Offset
Amount | | | Net Asset
Balance | | | Collateral
(Received)/
Pledged | | | Net
Amount | |
Bank of America, N.A. | | $ | 123,830 | | | $ | — | | | $ | 123,830 | | | $ | — | | | $ | 123,830 | |
HSBC Bank USA | | | 915,332 | | | | — | | | | 915,332 | | | | — | | | | 915,332 | |
| | | | | | | | | | | | | | | | | | | | |
| | $ | 1,039,162 | | | $ | — | | | $ | 1,039,162 | | | $ | — | | | $ | 1,039,162 | |
| | | | | | | | | | | | | | | | | | | | |
The actual collateral received or pledged, if any, may exceed the amounts shown in the table due to overcollateralization. Timing differences may exist between when contracts under the ISDA agreements are marked-to-market and when collateral moves. The ISDA agreements include tri-party control agreements under which collateral is held for the benefit of the secured party at a third party custodian, State Street Bank.
Counterparty risk is managed based on policies and procedures established by the Fund’s adviser. Such policies and procedures may include, but are not limited to, minimum counterparty credit rating requirements, monitoring of counterparty credit
53 |
Notes to Financial Statements (continued)
September 30, 2017
default swap spreads and posting of collateral. The Fund’s risk of loss from counterparty credit risk on over-the-counter derivatives is generally limited to the Fund’s aggregated unrealized gains and the amount of any collateral pledged to the counterparty, which may be offset by any collateral posted to the Fund by the counterparty. ISDA master agreements can help to manage counterparty risk by specifying collateral posting arrangements at pre-arranged exposure levels. Under these ISDA agreements, collateral is routinely transferred if the total net exposure in respect of certain transactions, net of existing collateral already in place, exceeds a specified amount (typically $250,000, depending on the counterparty). With exchange-traded derivatives, there is minimal counterparty credit risk to the Fund because the exchange’s clearinghouse, as counterparty to these instruments, stands between the buyer and the seller of the contract. Credit risk still exists in exchange-traded derivatives with respect to initial and variation margin that is held in a broker’s customer accounts. While brokers are required to segregate customer margin from their own assets, in the event that a broker becomes insolvent or goes into bankruptcy and at that time there is a shortfall in the aggregate amount of margin held by the broker for all its clients, U.S. bankruptcy laws will typically allocate that shortfall on a pro rata basis across all of the broker’s customers, potentially resulting in losses to the Fund. Based on balances reflected on the Fund’s Statement of Assets and Liabilities, the following table shows (i) the maximum amount of loss due to credit risk that, based on the gross fair value of the financial instrument, the Fund would incur if parties (including OTC derivative counterparties and brokers holding margin for exchange-traded derivatives) to the relevant financial instruments failed completely to perform according to the terms of the contracts and the collateral or other security, if any, for the amount due proved to be of no value to the Fund, and (ii) the amount of loss that the Fund would incur after taking into account master netting provisions pursuant to ISDA agreements, as of September 30, 2017:
| | | | |
Maximum Amount of Loss - Gross | | Maximum Amount of Loss - Net | |
| $1,039,162 | | $ | 1,039,162 | |
5. Purchases and Sales of Securities. For the year ended September 30, 2017, purchases and sales of securities (excluding short-term investments and U.S. Government/Agency securities and including paydowns) were $1,198,340,282 and $1,586,352,715, respectively. Purchases and sales of U.S. Government/Agency securities (excluding short-term investments and including paydowns) were $10,614,506,421 and $9,959,234,999, respectively.
| 54
Notes to Financial Statements (continued)
September 30, 2017
6. Management Fees and Other Transactions with Affiliates.
a. Management Fees. Loomis, Sayles & Company, L.P. (“Loomis Sayles”) serves as investment adviser to the Fund. Under the terms of the management agreement, the Fund pays a management fee at the following annual rates, calculated daily and payable monthly, based on the Fund’s average daily net assets:
| | | | |
Percentage of Average Daily Net Assets |
First
$100 million | | Next
$1.9 billion | | Over
$2 billion |
0.2000% | | 0.1875% | | 0.1500% |
Natixis Advisors, L.P. (“Natixis Advisors”) serves as the advisory administrator to the Fund. Under the terms of the advisory administration agreement, the Fund pays an advisory administration fee at the following annual rates, calculated daily and payable monthly, based on its average daily net assets:
| | | | |
Percentage of Average Daily Net Assets |
First
$100 million | | Next
$1.9 billion | | Over
$2 billion |
0.2000% | | 0.1875% | | 0.1500% |
Management and advisory administration fees are presented in the Statement of Operations as management fees.
Loomis Sayles has given a binding undertaking to the Fund to waive management fees and/or reimburse certain expenses to limit the Fund’s operating expenses, exclusive of acquired fund fees and expenses, brokerage expenses, interest expense, taxes, organizational and extraordinary expenses such as litigation and indemnification expenses. This undertaking is in effect until January 31, 2018, may be terminated before then only with the consent of the Fund’s Board of Trustees and is reevaluated on an annual basis. Management fees payable, as reflected on the Statement of Assets and Liabilities, is net of waivers and/or expense reimbursements, if any, pursuant to this undertaking. Waivers/reimbursements that exceed management fees payable are reflected on the Statement of Assets and Liabilities as receivable from investment adviser.
For the year ended September 30, 2017 the expense limits as a percentage of average daily net assets under the expense limitation agreement were as follows:
| | | | | | |
Expense Limit as a Percentage of
Average Daily Net Assets |
Class A | | Class C | | Class N | | Class Y |
0.80% | | 1.55% | | 0.50% | | 0.55% |
55 |
Notes to Financial Statements (continued)
September 30, 2017
Loomis Sayles and Natixis Advisors have agreed to equally bear the waivers and/or expense reimbursements for the Fund.
Loomis Sayles (and Natixis Advisors) shall be permitted to recover expenses it has borne under the expense limitation agreement (whether through waiver of its management fees or otherwise) on a class by class basis in later periods to the extent the annual operating expenses of a class fall below a class’ expense limits, provided, however, that a class is not obligated to pay such waived/reimbursed fees or expenses more than one year after the end of the fiscal year in which the fees or expenses were waived/reimbursed.
For the year ended September 30, 2017, the management fees for the Fund were $10,042,231 (effective rate of 0.16% of average daily net assets) and the advisory administration fees for the Fund were $10,042,231 (effective rate of 0.16% of average daily net assets).
No expenses were recovered during the year ended September 30, 2017 under the terms of the expense limitation agreement.
Certain officers and employees of Loomis Sayles are also officers or Trustees of the Trust. Loomis Sayles’ general partner is indirectly owned by Natixis Investment Managers, L.P. (“Natixis”), which is part of Natixis Investment Managers, an international asset management group based in Paris, France.
b. Service and Distribution Fees. Natixis Distribution, L.P. (“Natixis Distribution”), which is a wholly-owned subsidiary of Natixis, has entered into a distribution agreement with the Trust. Pursuant to this agreement, Natixis Distribution serves as principal underwriter of the Funds of the Trust.
Pursuant to Rule 12b-1 under the 1940 Act, the Trust has adopted a Service Plan relating to the Fund’s Class A shares (the “Class A Plan”), and a Distribution and Service Plan relating to the Fund’s Class C shares (the “Class C Plan”).
Under the Class A Plan, the Fund pays Natixis Distribution a monthly service fee at an annual rate not to exceed 0.25% of the average daily net assets attributable to the Fund’s Class A shares, as reimbursement for expenses incurred by Natixis Distribution in providing personal services to investors in Class A shares and/or the maintenance of shareholder accounts.
Under the Class C Plan, the Fund pays Natixis Distribution a monthly service fee at an annual rate not to exceed 0.25% of the average daily net assets attributable to the Fund’s Class C shares, as compensation for services provided by Natixis Distribution in providing personal services to investors in Class C shares and/or the maintenance of shareholder accounts.
Also under the Class C Plan, the Fund pays Natixis Distribution a monthly distribution fee at an annual rate of 0.75% of the average daily net assets attributable to the Fund’s
| 56
Notes to Financial Statements (continued)
September 30, 2017
Class C shares, as compensation for services provided by Natixis Distribution in connection with the marketing or sale of Class C shares.
For the year ended September 30, 2017, the service and distribution fees for the Fund were as follows:
| | | | | | | | |
Service Fees | | | Distribution Fees | |
Class A | | Class C | | | Class C | |
$1,802,793 | | $ | 704,191 | | | $ | 2,112,573 | |
c. Administrative Fees. Natixis Advisors provides certain administrative services for the Fund and contracts with State Street Bank to serve as sub-administrator. Natixis Advisors is a wholly-owned subsidiary of Natixis. Pursuant to an agreement among Natixis Funds Trusts, Loomis Sayles Funds Trusts, Natixis ETF Trust and Natixis Advisors, the Fund pays Natixis Advisors monthly its pro rata portion of fees equal to an annual rate of 0.0575% of the first $15 billion of the average daily net assets of the Natixis Funds Trusts, Loomis Sayles Funds Trusts, and Natixis ETF Trust, 0.0500% of the next $15 billion, 0.0400% of the next $30 billion, 0.0350% of the next $30 billion and 0.0325% of such assets in excess of $90 billion, subject to an annual aggregate minimum fee for the Natixis Funds Trusts, Loomis Sayles Funds Trusts, and Natixis ETF Trust of $10 million, which is reevaluated on an annual basis.
For the year ended September 30, 2017, the administrative fees for the Fund were $2,760,440.
d. Sub-Transfer Agent Fees. Natixis Distribution has entered into agreements, which include servicing agreements, with financial intermediaries that provide recordkeeping, processing, shareholder communications and other services to customers of the intermediaries that hold positions in the Fund and has agreed to compensate the intermediaries for providing those services. Intermediaries transact with the Fund primarily through the use of omnibus accounts on behalf of their customers who hold positions in the Fund. These services would have been provided by the Fund’s transfer agent and other service providers if the shareholders’ accounts were maintained directly at the Fund’s transfer agent. Accordingly, the Fund has agreed to reimburse Natixis Distribution for all or a portion of the servicing fees paid to these intermediaries. The reimbursement amounts (sub-transfer agent fees) paid to Natixis Distribution are subject to a current per-account equivalent fee limit approved by the Fund’s Board of Trustees, which is based on fees for similar services paid to the Fund’s transfer agent and other service providers. Class N shares do not bear such expenses.
For the year ended September 30, 2017, the sub-transfer agent fees (which are reflected in transfer agent fees and expenses in the Statement of Operations) for the Fund were $3,565,050.
57 |
Notes to Financial Statements (continued)
September 30, 2017
As of September 30, 2017, the Fund owes Natixis Distribution $44,666 in reimbursements for sub-transfer agent fees (which are reflected in the Statement of Assets and Liabilities as payable to distributor).
Sub-transfer agent fees attributable to Class A, Class C and Class Y are allocated on a pro rata basis to each class based on the relative net assets of each class to the total net assets of those classes.
e. Commissions. Commissions (including CDSCs) on Fund shares retained by Natixis Distribution were $64,341 for the year ended September 30, 2017.
f. Trustees Fees and Expenses. The Trust does not pay any compensation directly to its officers or Trustees who are directors, officers or employees of Natixis Advisors, Natixis Distribution, Natixis or their affiliates. The Chairperson of the Board of Trustees receives a retainer fee at the annual rate of $325,000. The Chairperson does not receive any meeting attendance fees for Board of Trustees meetings or committee meetings that she attends. Each Independent Trustee (other than the Chairperson) receives, in the aggregate, a retainer fee at the annual rate of $155,000. Each Independent Trustee also receives a meeting attendance fee of $10,000 for each meeting of the Board of Trustees that he or she attends in person and $5,000 for each meeting of the Board of Trustees that he or she attends telephonically. In addition, the chairperson of the Contract Review Committee and the chairperson of the Audit Committee each receive an additional retainer fee at the annual rate of $17,500. The chairperson of the Governance Committee receives an additional retainer fee at the annual rate of $10,000. Each Contract Review Committee member is compensated $6,000 for each Committee meeting that he or she attends in person and $3,000 for each meeting that he or she attends telephonically. Each Audit Committee member is compensated $6,000 for each Committee meeting that he or she attends in person and $3,000 for each meeting that he or she attends telephonically. These fees are allocated among the funds in the Natixis Funds Trusts, Loomis Sayles Funds Trusts and Natixis ETF Trust based on a formula that takes into account, among other factors, the relative net assets of each fund. Trustees are reimbursed for travel expenses in connection with attendance at meetings.
A deferred compensation plan (the “Plan”) is available to the Trustees on a voluntary basis. Deferred amounts remain in the Fund until distributed in accordance with the provisions of the Plan. The value of a participating Trustee’s deferral account is based on theoretical investments of deferred amounts, on the normal payment dates, in certain funds of the Natixis Funds Trusts, Loomis Sayles Funds Trusts, and Natixis ETF Trust as designated by the participating Trustees. Changes in the value of participants’ deferral accounts are allocated pro rata among the funds in the Natixis Funds Trusts, Loomis Sayles Funds Trusts and Natixis ETF Trust, and are normally reflected as Trustees’ fees and expenses in the Statement of Operations. The portions of the accrued obligations allocated to the Fund under the Plan are reflected as Deferred Trustees’ fees in the Statement of Assets and Liabilities.
| 58
Notes to Financial Statements (continued)
September 30, 2017
g. Affiliated Ownership. As of September 30, 2017, Loomis Sayles Employees’ Profit Sharing Retirement Plan held shares of the Fund representing 0.09% of the Fund’s net assets.
Investment activities of affiliated shareholders could have material impacts on the Fund.
h. Payment by Affiliates. For the year ended September 30, 2017, Loomis Sayles reimbursed the Fund $93,438 in connection with a trading error.
7. Class-Specific Transfer Agent Fees and Expenses. For the year ended September 30, 2017, the Fund incurred the following class-specific transfer agent fees and expenses (including sub-transfer agent fees, where applicable):
| | | | | | | | | | | | | | |
| Transfer Agent Fees and Expenses | |
Class A | | | Class C | | | Class N | | | Class Y | |
| $ | 657,576 | | | $ | 257,163 | | | $ | 6,010 | | | $ | 2,878,519 | |
Transfer agent fees and expenses attributable to Class A, Class C and Class Y are allocated on a pro rata basis to each class based on the relative net assets of each class to the total net assets of those classes. Transfer agent fees and expenses attributable to Class N are allocated to Class N.
8. Line of Credit. The Fund, together with certain other funds of Natixis Funds Trusts and Loomis Sayles Funds Trusts, entered into a 364-day, $400,000,000 syndicated, committed, unsecured line of credit with Citibank, N.A. to be used for temporary or emergency purposes only. Any one Fund may borrow up to the full $400,000,000 under the line of credit (as long as all borrowings by all Funds in the aggregate do not exceed the $400,000,000 limit at any time) subject to each Fund’s investment restrictions. Interest is charged to the Funds at a rate equal to the greater of the eurodollar or the federal funds rate plus 1.00%. In addition, a commitment fee of 0.15% per annum, payable on the last business day of each month, is accrued and apportioned among the participating funds based on their average daily unused portion of the line of credit. The Funds paid an arrangement fee, an upfront fee, and other fees in connection with the new line of credit agreement, which are being amortized over a period of 364 days and are reflected as miscellaneous expenses on the Statement of Operations. The unamortized balance is reflected as prepaid expenses on the Statement of Assets and Liabilities.
Prior to April 13, 2017, the commitment fee was 0.10% per annum based on the average daily unused portion of the line of credit.
For the year ended September 30, 2017, the Fund had no borrowings under this agreement.
59 |
Notes to Financial Statements (continued)
September 30, 2017
9. Concentration of Ownership. From time to time, a Fund may have a concentration of one or more accounts constituting a significant percentage of shares outstanding. Investment activities by holders of such accounts could have material impacts on the Funds. As of September 30, 2017, based on management’s evaluation of the shareholder account base, the Fund had accounts representing controlling ownership of more than 5% of the Fund’s total outstanding shares. The number of such accounts, based on accounts that represent more than 5% of an individual class of shares, and the aggregate percentage of net assets represented by such holdings were as follows:
| | | | |
Number of 5%
Account Holders | | Percentage of
Ownership | |
| 2 | | | 14.65 | % |
Omnibus shareholder accounts for which Natixis Advisors understands that the intermediary has discretion over the underlying shareholder accounts or investment models where a shareholder account may be invested for a non-discretionary customer are included in the table above. For other omnibus accounts, the Funds do not have information on the individual shareholder accounts underlying the omnibus accounts; therefore, there could be other 5% shareholders in addition to those disclosed in the table above.
10. Capital Shares. The Fund may issue an unlimited number of shares of beneficial interest, without par value. Transactions in capital shares were as follows:
| | | | | | | | | | | | | | | | |
| |
| Year Ended
September 30, 2017 |
| |
| Year Ended
September 30, 2016 |
|
| | | | Shares | | | | Amount | | | | Shares | | | | Amount | |
| Class A | | | | | | | | | | | | | | | | |
Issued from the sale of shares | | | 15,637,589 | | | $ | 200,524,829 | | | | 17,603,070 | | | $ | 221,901,618 | |
Issued in connection with the reinvestment of distributions | | | 1,096,132 | | | | 14,055,453 | | | | 1,359,724 | | | | 17,125,510 | |
Redeemed | | | (23,948,162 | ) | | | (307,193,196 | ) | | | (33,478,739 | ) | | | (419,455,559 | ) |
| | | | | | | | | | | | | | | | |
Net change | | | (7,214,441 | ) | | $ | (92,612,914 | ) | | | (14,515,945 | ) | | $ | (180,428,431 | ) |
| | | | | | | | | | | | | | | | |
| Class B(a) | | | | | | | | | | | | | | | | |
Issued from the sale of shares | | | — | | | $ | — | | | | — | | | $ | — | |
Issued in connection with the reinvestment of distributions | | | — | | | | — | | | | 14 | | | | 171 | |
Redeemed | | | — | | | | — | | | | (7,201 | ) | | | (88,563 | ) |
| | | | | | | | | | | | | | | | |
Net change | | | — | | | $ | — | | | | (7,187 | ) | | $ | (88,392 | ) |
| | | | | | | | | | | | | | | | |
| Class C | | | | | | | | | | | | | | | | |
Issued from the sale of shares | | | 2,666,260 | | | $ | 34,096,004 | | | | 5,559,755 | | | $ | 69,393,641 | |
Issued in connection with the reinvestment of distributions | | | 274,196 | | | | 3,515,725 | | | | 343,977 | | | | 4,337,974 | |
Redeemed | | | (8,376,149 | ) | | | (107,455,917 | ) | | | (9,997,795 | ) | | | (124,770,957 | ) |
| | | | | | | | | | | | | | | | |
Net change | | | (5,435,693 | ) | | $ | (69,844,188 | ) | | | (4,094,063 | ) | | $ | (51,039,342 | ) |
| | | | | | | | | | | | | | | | |
| 60
Notes to Financial Statements (continued)
September 30, 2017
10. Capital Shares (continued).
| | | | | | | | | | | | | | | | |
| | | Year Ended
September 30, 2017 | | | Year Ended
September 30, 2016 | |
| | | | Shares | | | | Amount | | | | Shares | | | | Amount | |
| Class N | | | | | | | | | | | | | | | | |
Issued from the sale of shares | | | 36,906,742 | | | $ | 477,388,476 | | | | 33,716,292 | | | $ | 430,452,814 | |
Issued in connection with the reinvestment of distributions | | | 4,277,091 | | | | 55,301,834 | | | | 4,856,651 | | | | 61,684,560 | |
Redeemed | | | (66,708,809 | ) | | | (863,318,144 | ) | | | (34,783,568 | ) | | | (440,237,567 | ) |
Redeemed in-kind (Note 11) | | | — | | | | — | | | | (19,303,792 | ) | | | (243,999,935 | ) |
| | | | | | | | | | | | | | | | |
Net change | | | (25,524,976 | ) | | $ | (330,627,834 | ) | | | (15,514,417 | ) | | $ | (192,100,128 | ) |
| | | | | | | | | | | | | | | | |
| Class Y | | | | | | | | | | | | | | | | |
Issued from the sale of shares | | | 133,206,431 | | | $ | 1,727,593,992 | | | | 81,229,992 | | | $ | 1,029,374,760 | |
Issued in connection with the reinvestment of distributions | | | 5,875,066 | | | | 75,988,250 | | | | 5,980,360 | | | | 75,894,607 | |
Redeemed | | | (68,988,183 | ) | | | (892,074,151 | ) | | | (115,122,870 | ) | | | (1,449,415,633 | ) |
| | | | | | | | | | | | | | | | |
Net change | | | 70,093,314 | | | $ | 911,508,091 | | | | (27,912,518 | ) | | $ | (344,146,266 | ) |
| | | | | | | | | | | | | | | | |
Increase (decrease) from capital share transactions | | | 31,918,204 | | | $ | 418,423,155 | | | | (62,044,130 | ) | | $ | (767,802,559 | ) |
| | | | | | | | | | | | | | | | |
| (a) | On January 11, 2016, Class B shares were converted into Class A shares. See Note 1 of Notes to Financial Statements. |
11. Redemption In-Kind. In certain circumstances, a Fund may distribute portfolio securities rather than cash as payment for redemption of Fund shares (redemption in-kind). For financial reporting purposes, the Fund will recognize a gain on in-kind redemptions to the extent the value of the distributed securities on the date of redemption exceeds the cost of those securities; the Fund will recognize a loss if the cost exceeds value. Gains and losses realized on redemptions in-kind are not recognized for tax purposes, and are re-classified from realized gain (loss) to paid-in-capital. There were no redemption in-kind transactions for the Fund during the year ended September 30, 2017.
61 |
Report of Independent Registered Public
Accounting Firm
To the Board of Trustees of Natixis Funds I and Shareholders of Loomis Sayles Core Plus Bond Fund:
In our opinion, the accompanying statement of assets and liabilities, including the portfolio of investments, and the related statements of operations and of changes in net assets and the financial highlights present fairly, in all material respects, the financial position of the Loomis Sayles Core Plus Bond Fund, a series of Natixis Funds I, (the “Fund”) as of September 30, 2017, the results of its operations for the year then ended, the changes in its net assets for each of the two years in the period then ended and the financial highlights for each of the periods indicated, in conformity with accounting principles generally accepted in the United States of America. These financial statements and financial highlights (hereafter referred to as “financial statements”) are the responsibility of the Fund’s management. Our responsibility is to express an opinion on these financial statements based on our audits. We conducted our audits of these financial statements in accordance with the standards of the Public Company Accounting Oversight Board (United States). Those standards require that we plan and perform the audit to obtain reasonable assurance about whether the financial statements are free of material misstatement. An audit includes examining, on a test basis, evidence supporting the amounts and disclosures in the financial statements, assessing the accounting principles used and significant estimates made by management, and evaluating the overall financial statement presentation. We believe that our audits, which included confirmation of securities as of September 30, 2017 by correspondence with the custodian and brokers, provide a reasonable basis for our opinion.
PricewaterhouseCoopers LLP
Boston, Massachusetts
November 21, 2017
| 62
2017 U.S. Tax Distribution Information to
Shareholders (Unaudited)
Corporate Dividends Received Deduction. For the fiscal year ended September 30, 2017, 0.01% of dividends distributed by Core Plus Bond Fund qualify for the dividends received deduction for corporate shareholders.
Qualified Dividend Income. For the fiscal year ended September 30, 2017, the Core Plus Bond Fund will designate up to the maximum amount allowable pursuant to the Internal Revenue Code as qualified dividend income eligible for reduced tax rates. These lower rates range from 0% to 20% depending on an individual’s tax bracket. If the Fund pays a distribution during calendar year 2017, complete information will be reported in conjunction with Form 1099-DIV.
63 |
Trustees and Officers Information
The tables below provide certain information regarding the trustees and officers of Natixis Funds Trust I (the “Trust”). Unless otherwise indicated, the address of all persons below is 888 Boylston Street, Suite 800, Boston, MA 02199-8197. The Fund’s Statement of Additional Information includes additional information about the trustees of the Trust and is available by calling Natixis Funds at 800-225-5478.
| | | | | | | | |
Name and Year of Birth | | Position(s) Held
with the Trust,
Length of Time
Served and Term of Office1 | | Principal
Occupation(s)
During Past 5 Years | | Number of
Portfolios in
Fund Complex
Overseen2
and Other
Directorships Held
During Past 5 Years | | Experience,
Qualifications,
Attributes, Skills
for Board Membership |
| | | |
| INDEPENDENT TRUSTEES | | | | | | |
| | | | |
Kenneth A. Drucker (1945) | | Chairperson of the Board of Trustees since January 2017 Trustee since 2008 Ex Officio member of Audit Committee, Contract Review Committee and Governance Committee | | Retired | | 53 None | | Significant experience on the Board and on the boards of other business organizations (including at investment companies); executive experience (including as treasurer of an aerospace, automotive, and metal manufacturing corporation) |
| | | | |
| Edmond J. English (1953) | | Trustee since 2013 Audit Committee Member | | Executive Chairman; formerly, Chief Executive Officer of Bob’s Discount Furniture (retail) | | 53 Director, Burlington Stores, Inc. (retail) | | Experience on the Board and significant experience on the boards of other business organizations (including retail companies and a bank); executive experience (including at a retail company) |
| 64
Trustees and Officers Information
| | | | | | | | |
Name and Year of Birth | | Position(s) Held
with the Trust,
Length of Time
Served and Term of Office1 | | Principal
Occupation(s)
During Past 5 Years | | Number of
Portfolios in
Fund Complex
Overseen2
and Other
Directorships Held
During Past 5 Years | | Experience,
Qualifications,
Attributes, Skills
for Board Membership |
| | | |
INDEPENDENT TRUSTEES continued | | | | | | |
| | | | |
Richard A. Goglia (1951) | | Trustee since 2015 Audit Committee Member | | Retired; formerly Vice President and Treasurer of Raytheon Company (defense) | | 53 None | | Experience on the Board and executive experience (including his role as vice president and treasurer of a defense company and experience at a financial services company) |
| | | | |
Wendell J. Knox (1948) | | Trustee since 2009 Contract Review Committee Member and Governance Committee Member | | Director of Abt Associates Inc. (research and consulting) | | 53 Director, Eastern Bank (bank); Director, The Hanover Insurance Group (property and casualty insurance) | | Significant experience on the Board and on the boards of other business organizations (including at a bank and at a property and casualty insurance firm); executive experience (including roles as president and chief executive officer of a research and consulting company) |
65 |
Trustees and Officers Information
| | | | | | | | |
Name and Year of Birth | | Position(s) Held
with the Trust,
Length of Time
Served and Term of Office1 | | Principal
Occupation(s)
During Past 5 Years | | Number of
Portfolios in
Fund Complex
Overseen2
and Other
Directorships Held
During Past 5 Years | | Experience,
Qualifications,
Attributes, Skills
for Board Membership |
| | | |
INDEPENDENT TRUSTEES continued | | | | | | |
| | | | |
| Martin T. Meehan (1956) | | Trustee since 2012 Contract Review Committee Member | | President, University of Massachusetts; formerly, Chancellor and faculty member, University of Massachusetts Lowell | | 53 None | | Significant experience on the Board and on the boards of other business organizations; experience as President of the University of Massachusetts; government experience (including as a member of the U.S. House of Representatives); academic experience |
| | | | |
Maureen B. Mitchell3 (1951) | | Trustee since 2017 Contract Review Committee Member | | Retired; formerly President, Global Sales and Marketing, GE Asset Management, Inc. (financial services) | | 53 None | | Experience on the Board; financial services industry and executive experience (including role as president of global sales and marketing at a financial services company) |
| 66
Trustees and Officers Information
| | | | | | | | |
Name and Year of Birth | | Position(s) Held
with the Trust,
Length of Time
Served and Term of Office1 | | Principal
Occupation(s)
During Past 5 Years | | Number of
Portfolios in
Fund Complex
Overseen2
and Other
Directorships Held
During Past 5 Years | | Experience,
Qualifications,
Attributes, Skills
for Board Membership |
| | | |
INDEPENDENT TRUSTEES continued | | | | | | |
| | | | |
Sandra O. Moose (1942) | | Trustee since 1982 Audit Committee Member and Governance Committee Member | | President, Strategic Advisory Services (management consulting) | | 53 Formerly, Director, AES Corporation (international power company); formerly, Director, Verizon Communications (telecommunications company) | | Significant experience on the Board and on the boards of other business organizations (including at a telecommunications company, an international power company and a specialty chemicals corporation); executive experience (including at a management consulting company) |
| | | | |
James P. Palermo (1955) | | Trustee since 2016 Contract Review Committee Member | | Founding Partner, Breton Capital Management, LLC (private equity); Partner, STEP Partners, LLC (private equity); formerly, Chief Executive Officer of Global Client Management of The Bank of New York Mellon Corporation | | 53 None | | Experience on the Board; financial services industry and executive experience (including roles as chief executive officer of client management and asset servicing for a banking and financial services company) |
67 |
Trustees and Officers Information
| | | | | | | | |
Name and Year of Birth | | Position(s) Held
with the Trust,
Length of Time
Served and Term of Office1 | | Principal
Occupation(s)
During Past 5 Years | | Number of
Portfolios in
Fund Complex
Overseen2
and Other
Directorships Held
During Past 5 Years | | Experience,
Qualifications,
Attributes, Skills
for Board Membership |
| | | |
INDEPENDENT TRUSTEES continued | | | | | | |
| | | | |
Erik R. Sirri (1958) | | Trustee since 2009 Chairperson of the Audit Committee | | Professor of Finance at Babson College | | 53 None | | Significant experience on the Board; experience as Director of the Division of Trading and Markets at the Securities and Exchange Commission; academic experience; training as an economist |
| | | | |
Peter J. Smail (1952) | | Trustee since 2009 Chairperson of the Contract Review Committee and Governance Committee Member | | Retired | | 53 None | | Significant experience on the Board; mutual fund industry and executive experience (including roles as president and chief executive officer for an investment adviser) |
| | | | |
Cynthia L. Walker (1956) | | Trustee since 2005 Chairperson of the Governance Committee and Audit Committee Member | | Deputy Dean for Finance and Administration, Yale University School of Medicine | | 53 None | | Significant experience on the Board; executive experience in a variety of academic organizations (including roles as dean for finance and administration) |
| 68
Trustees and Officers Information
| | | | | | | | |
Name and Year of Birth | | Position(s) Held
with the Trust,
Length of Time
Served and Term of Office1 | | Principal
Occupation(s)
During Past 5 Years | | Number of
Portfolios in
Fund Complex
Overseen2
and Other
Directorships Held
During Past 5 Years | | Experience,
Qualifications,
Attributes, Skills
for Board Membership |
| | | |
| INTERESTED TRUSTEES | | | | | | |
| | | | |
Kevin P. Charleston4 (1965) One Financial Center Boston, MA 02111 | | Trustee since 2015 | | President, Chief Executive Officer and Chairman of the Board of Directors; formerly, Chief Financial Officer, Loomis, Sayles & Company, L.P. | | 53 None | | Experience on the Board; continuing service as President, Chief Executive Officer and Chairman of the Board of Directors of Loomis, Sayles & Company, L.P. |
| | | | |
| David L. Giunta5 (1965) | | Trustee since 2011; President and Chief Executive Officer since 2008 | | President and Chief Executive Officer, Natixis Advisors, L.P., Natixis Distribution, L.P. and Natixis Distribution Corporation and Chairman of the Board of Natixis Distribution Corporation | | 53 None | | Significant experience on the Board; experience as President and Chief Executive Officer, Natixis Investment Managers, U.S. and Canada, and President and Chief Executive Officer of Natixis Distribution Corporation, Natixis Advisors, L.P. and Natixis Distribution, L.P. |
| 1 | Each trustee serves until retirement, resignation or removal from the Board. The current retirement age is 75. The position of Chairperson of the Board is appointed for a three-year term. |
| 2 | The trustees of the Trust serve as trustees of a fund complex that includes all series of the Natixis Funds Trust I, Natixis Funds Trust II, Natixis Funds Trust IV, and Gateway Trust (collectively, the “Natixis Funds Trusts”), Loomis Sayles Funds I and Loomis Sayles Funds II (collectively, the “Loomis Sayles Funds Trusts”) and Natixis ETF Trust (collectively, the “Fund Complex”). |
| 3 | Ms. Mitchell was appointed as a Trustee effective July 1, 2017. |
| 4 | Mr. Charleston is deemed an “interested person” of the Trusts because he holds the following positions with an affiliated person of the Trusts: President, Chief Executive Officer and Chairman of the Board of Directors of Loomis, Sayles & Company, L.P. |
| 5 | Mr. Giunta is deemed an “interested person” of the Trusts because he holds the following positions with an affiliated person of the Trusts: President and Chief Executive Officer, Natixis Advisors, L.P., Natixis Distribution, L.P. and Natixis Distribution Corporation and Chairman of the Board of Natixis Distribution Corporation. |
69 |
Trustees and Officers Information
| | | | | | |
Name and Year of Birth | | Position(s) Held with the Trust | | Term of Office1 and Length of Time Served | | Principal Occupation(s) During Past 5 Years2 |
| | |
| OFFICERS OF THE TRUST | | | | |
| | | |
Russell L. Kane (1969) | | Secretary, Clerk and Chief Legal Officer | | Since July 2016 | | Executive Vice President, General Counsel, Secretary and Clerk, Natixis Distribution Corporation, Natixis Advisors, L.P. and Natixis Distribution, L.P.; formerly, Chief Compliance Officer for Mutual Funds, Senior Vice President, Deputy General Counsel, Assistant Secretary and Assistant Clerk, Natixis Distribution Corporation, Natixis Advisors, L.P. and Natixis Distribution, L.P. |
| | | |
Michael C. Kardok (1959) | | Treasurer, Principal Financial and Accounting Officer | | Since October 2004 | | Senior Vice President, Natixis Advisors, L.P. and Natixis Distribution, L.P. |
| | | |
Rosa Licea-Mailloux (1976) | | Chief Compliance Officer, Assistant Secretary and Anti-Money Laundering Officer | | Since July 2016 | | Senior Vice President, Deputy General Counsel, Assistant Secretary and Assistant Clerk, Natixis Distribution Corporation, Natixis Advisors, L.P. and Natixis Distribution, L.P.; formerly, Associate General Counsel, Natixis Distribution, L.P. |
| 1 | Each officer of the Trust serves for an indefinite term in accordance with the Trust’s current by-laws until the date his or her successor is elected and qualified, or until he or she sooner dies, retires, is removed or becomes disqualified. |
| 2 | Each person listed above, except as noted, holds the same position(s) with the Fund Complex. Previous positions during the past five years with Natixis Distribution, L.P., Natixis Advisors, L.P. or Loomis, Sayles & Company, L.P. are omitted, if not materially different from a trustee’s or officer’s current position with such entity. |
| 70
Item 2. Code of Ethics.
The Registrant has adopted a code of ethics that applies to the Registrant’s principal executive officer, principal financial officer and persons performing similar functions. There have been no amendments or waivers of the Registrant’s code of ethics during the period.
Item 3. Audit Committee Financial Expert.
The Board of Trustees of the Registrant has established an audit committee Mr. Edmond J. English, Mr. Richard A. Goglia, Ms. Sandra O. Moose, Mr. Erik R. Sirri and Ms. Cynthia L. Walker are members of the audit committee and have been designated as “audit committee financial experts” by the Board of Trustees. Each of these individuals is also an Independent Trustee of the Registrant.
Item 4. Principal Accountant Fees and Services.
Fees billed by the Principal Accountant for services rendered to the Registrant.
The table below sets forth fees billed by the principal accountant, PricewaterhouseCoopers LLP, for the past two fiscal years for professional services rendered in connection with a) the audit of the Registrant’s annual financial statements and services provided in connection with regulatory filings; b) audit-related services (including services that are reasonably related to the performance of the audit of the Registrant’s financial statements and but not reported under “Audit Fees”); c) tax compliance, tax advice and tax planning and d) all other fees billed for professional services rendered by the principal accountant to the Registrant, other than the services reported as a part of (a) through (c) of this Item.
| | | | | | | | | | | | | | | | | | | | | | | | | | | | | | | | |
| | | Audit fees | | | Audit-related fees1 | | | Tax fees2 | | | All other fees | |
| | | 10/1/15-
9/30/16 | | | 10/1/16-
9/30/17 | | | 10/1/15-
9/30/16 | | | 10/1/16-
9/30/17 | | | 10/1/15-
9/30/16 | | | 10/1/16-
9/30/17 | | | 10/1/15-
9/30/16 | | | 10/1/16-
9/30/17 | |
Loomis Sayles Core Plus Bond Fund | | $ | 43,333 | | | $ | 43,753 | | | $ | 950 | | | $ | 2,337 | | | $ | 8,024 | | | $ | 8,024 | | | $ | — | | | $ | — | |
| | 1. | Audit-related fees consist of: |
2016 & 2017 - performance of agreed-upon procedures related to the Registrant’s deferred compensation plan.
2017 – Prospectus Consent.
2016 & 2017 – review of Registrant’s tax returns.
Aggregate fees billed to the Registrant for non-audit services during 2016 and 2017 were $8,974 and $10,361, respectively.
Fees billed by the Principal Accountant for services rendered to the Adviser and Control Affiliates.
The following table sets forth the fees billed by the Registrant’s principal accountant for non-audit services rendered to Loomis, Sayles & Company, L.P. and entities controlling, controlled by or under common control with Loomis, Sayles & Company, L.P. (“Control Affiliates”) that provide ongoing services to the Registrant, for engagements that related directly to the operations and financial reporting of the Registrant for the last two fiscal years.
| | | | | | | | | | | | | | | | | | | | | | | | |
| | | Audit-related fees | | | Tax fees | | | All other fees | |
| | | 10/1/15-
9/30/16 | | | 10/1/16-
9/30/17 | | | 10/1/15-
9/30/16 | | | 10/1/16-
9/30/17 | | | 10/1/15-
9/30/16 | | | 10/1/16-
9/30/17 | |
Control Affiliates | | $ | — | | | $ | — | | | $ | — | | | $ | — | | | $ | — | | | $ | — | |
The following table sets forth the aggregate fees billed by the Registrant’s principal accountant for non-audit services rendered to Loomis, Sayles & Company, L.P. and Control Affiliates that provide ongoing services to the Registrant, for the last two fiscal years, including the fees disclosed in the table above.
| | | | | | | | |
| | | Aggregate Non-Audit Fees | |
| | | 10/1/15-
9/30/16 | | | 10/1/16-
9/30/17 | |
Control Affiliates | | $ | 119,120 | | | $ | 77,290 | |
None of the services described above were approved pursuant to (c)(7)(i)(C) of Regulation S-X.
Audit Committee Pre Approval Policies.
Annually, the Registrant’s Audit Committee reviews the audit, audit-related, tax and other non-audit services together with the projected fees, for services proposed to be rendered to the Trust and/or other entities for which pre-approval is required during the upcoming year. Any subsequent revisions to already pre-approved services or fees (including fee increases) and requests for pre-approval of new services would be presented for consideration quarterly as needed.
If, in the opinion of management, a proposed engagement by the Registrant’s independent accountants needs to commence before the next regularly scheduled Audit Committee meeting, any member of the Audit Committee who is an Independent Trustee of the Registrant is authorized to pre-approve the engagement, but only for engagements to provide audit, audit related and tax services. This approval is subject to review of the full Audit Committee at its next quarterly meeting. All other engagements require the approval of all the members of the Audit Committee.
Item 5. Audit Committee of Listed Registrants.
Not applicable.
Item 6. Schedule of Investments.
Included as part of the Report to Shareholders filed as Item 1 herewith.
Item 7. Disclosure of Proxy Voting Policies and Procedures for Closed-End Management Investment Companies.
Not applicable.
Item 8. Portfolio Managers of Closed-End Management Investment Companies
Not applicable.
Item 9. Purchases of Equity Securities by Closed-End Management Investment Companies and Affiliated Purchasers.
Not applicable.
Item 10. Submission of Matters to a Vote of Securities Holders.
There were no material changes to the procedures by which shareholders may recommend nominees to the Registrant’s Board of Trustees.
Item 11. Controls and Procedures.
The Registrant’s principal executive officer and principal financial officer have concluded that the Registrant’s disclosure controls and procedures are sufficient to ensure that information required to be disclosed by the Registrant in this Form N-CSR was recorded, processed, summarized and reported within the time periods specified in the Securities and Exchange Commission’s rules and forms, based upon such officers’ evaluation of these controls and procedures as of a date within 90 days of the filing date of the report.
There were no changes in the Registrant’s internal control over financial reporting that occurred during the Registrant’s last fiscal quarter of the period covered by the report that has materially affected, or is reasonably likely to materially affect, the Registrant’s internal control over financial reporting.
Item 12. Exhibits.
| | | | |
| (a) | | (1) | | Code of Ethics required by Item 2 hereof, filed herewith as Exhibit (a)(1). |
| (a) | | (2) | | Certifications of Principal Executive Officer and Principal Financial Officer pursuant to Rule 30a-2(a) under the Investment Company Act of 1940 (17 CFR 270.30a-2(a)), filed herewith as Exhibits (a)(2)(1) and (a)(2)(2), respectively. |
| (a) | | (3) | | Not applicable. |
| (b) | | | | Certification of Principal Executive Officer and Principal Financial Officer pursuant to Section 906 of Sarbanes-Oxley Act of 2002 are filed herewith as Exhibit (b). |
SIGNATURES
Pursuant to the requirements of the Securities Exchange Act of 1934 and the Investment Company Act of 1940, the Registrant has duly caused this report to be signed on its behalf by the undersigned, thereunto duly authorized.
| | |
| Natixis Funds Trust I |
| |
| By: | | /s/ David L. Giunta |
| |
| Name: | | David L. Giunta |
| Title: | | President and Chief Executive Officer |
| Date: | | November 28, 2018 |
Pursuant to the requirements of the Securities Exchange Act of 1934 and the Investment Company Act of 1940, this report has been signed by the following persons on behalf of the Registrant and in the capacities and on the dates indicated.
| | |
| |
| By: | | /s/ David L. Giunta |
| |
| Name: | | David L. Giunta |
| Title: | | President and Chief Executive Officer |
| Date: | | November 28, 2018 |
| |
| By: | | /s/ Michael C. Kardok |
| |
| Name: | | Michael C. Kardok |
| Title: | | Treasurer |
| Date: | | November 28, 2018 |