UNITED STATES
SECURITIES AND EXCHANGE COMMISSION
Washington, D.C. 20549
FORM N-CSR
CERTIFIED SHAREHOLDER REPORT OF REGISTERED
MANAGEMENT INVESTMENT COMPANIES
Investment Company Act file number: 811-04323
Natixis Funds Trust I
(Exact name of Registrant as specified in charter)
888 Boylston Street, Suite 800, Boston, Massachusetts 02199-8197
(Address of principal executive offices) (Zip code)
Russell L. Kane, Esq.
Natixis Distribution, L.P.
888 Boylston Street, Suite 800
Boston, Massachusetts 02199-8197
(Name and address of agent for service)
Registrant’s telephone number, including area code: (617) 449-2822
Date of fiscal year end: December 31
Date of reporting period: December 31, 2017
| Item 1. | Reports to Stockholders. |
The Registrant’s annual report transmitted to shareholders pursuant to Rule 30e-1 under the Investment Company Act of 1940 is as follows:
ANNUAL REPORT
December 31, 2017

McDonnell Intermediate Municipal Bond Fund
Natixis Oakmark Fund
Natixis Oakmark International Fund
Vaughan Nelson Small Cap Value Fund
Vaughan Nelson Value Opportunity Fund

TABLE OF CONTENTS
Portfolio Review page 1
Portfolio of Investments page 30
Financial Statements page 53
Notes to Financial Statements page 83
MCDONNELL INTERMEDIATE MUNICIPAL BOND FUND
| | |
| Managers | | Symbols |
| Dawn Mangerson | | Class A MIMAX |
| James Grabovac, CFA® | | Class C MIMCX |
| Lawrence Jones | | Class Y MIMYX |
| Steve Wlodarski, CFA® | | |
| McDonnell Investment Management, LLC | | |
Investment Goal
The Fund seeks a high level of federal tax-exempt current income, consistent with the preservation of capital.
Market Conditions
Capital markets reacted to the surprisingly swift passage of new tax legislation which was introduced, passed, reconciled, passed again, and signed into law all within a narrow two-month timeframe. As a consequence, rates rose across much of the yield curve and risk markets continued to reach new all-time highs with the S&P 500® tacking on another 6% during the fourth quarter, swelling returns to more than 21% for the full year.
Rate markets finished the year in retreat, but 10-year Treasury yields were confined to a remarkably narrow range, spending most of the year within a 40 basis point (bps) range (60 bps at its widest). The dominant trends of yield curve flattening and spread compression continued, regardless of market direction. For the full year, the Treasury curve, as measured by the spread between 2 and 10-year Treasuries, flattened by 72 bps while the municipal curve flattened by 68 bps.
The market narrative of steady growth and contained inflation provided a benign backdrop for fixed income investors throughout 2017. Investors continued to reach for yield by extending further on the yield curve and lower in credit quality in an effort to bolster portfolio income in a persistently low yield environment. While this narrative may remain in place as we enter 2018, the backdrop will continue to evolve as the economy marches toward its 9th year of growth following the Great Recession trough of June 2009.
Passage of the tax plan alters the landscape for corporations, investors, and state and local issuers in several potentially significant ways. Corporations received the bulk of the largesse with a dramatic reduction in rates from 35% to 21%. Tax law changes will now limit the deductibility of interest paid by corporations to 30% of income, based on EBITDA (earnings before interest, taxes, depreciation and amortization). This will impact more highly levered corporations and may result in a deceleration of issuance for those borrowers as treasurers recalibrate efforts to manage their cost of capital more efficiently. The legislation significantly affects municipal issuers as it prohibits the use of tax-exempt borrowing to refinance outstanding debt through a technique known as advance refunding. This will reduce issuer refinancing flexibility, increase the cost of capital, and likely result in a reduction of new issue supply available to investors by as much as 25% in certain markets.
1 |
Performance Results
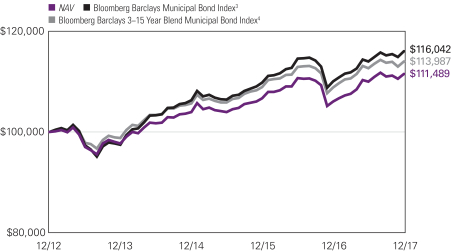
For the 12 months ended December 31, 2017, Class Y shares of the McDonnell Intermediate Municipal Bond Fund returned 5.13% at net asset value. The Fund underperformed its benchmark, the Bloomberg Barclays Municipal Bond Index, which returned 5.45%.
Explanation of Fund Performance
Prompted by unexpected proposed tax legislation, municipal new issue supply surged during the fourth quarter, exceeding the previous year’s pace by nearly 40% and driving annual issuance to a near record. Shareholder flows into municipal funds were consistently positive throughout most of the year and are expected to remain firm. From an asset class perspective, municipal valuations increased versus Treasuries across the curve, and yields five years and longer declined. Quality spreads also tightened sharply and long, lower-quality components of the market generated the strongest relative returns.
The greatest negative impacts on Fund performance were an underweight to the 20+ year portion of the yield curve, slightly short duration posture, and underweight to the state general obligation debt of New Jersey and Illinois, which significantly outperformed the general market. Positive contributors to performance included an overweight to the revenue sector, specifically transportation and higher education, and an underweight to the general obligation sector. Furthermore, the Fund’s significant overweight to single-A rated credits enhanced performance and largely offset the underweight to the BBB sector.
Outlook
Global economic growth has experienced a coordinated uplift which looks set to continue going into 2018. Domestically, growth appears likely to have comfortably topped the prior year’s pace on the back of stronger investment and improved net exports, aided by a weaker dollar. But geopolitical challenges remain daunting as 2018 unfolds. The recent capital market environment has been characterized by five key elements: moderate economic growth, rising risk market valuations, tightening monetary policy, a flattening yield curve, and ultra-low volatility. We expect that these conditions can peacefully coexist over the near term, perhaps well into the year. But maintaining this delicate balance long-term, with a restive domestic and geopolitical environment as a backdrop, is less likely. We believe the odds favor a disruption to the status quo as we move forward. We remain largely positive about credit and spread market exposures; our emphasis is on sound underlying credit fundamentals as we approach the ninth year of the economic cycle.
| 2
MCDONNELL INTERMEDIATE MUNICIPAL BOND FUND
Hypothetical Growth of $100,000 Investment in Class Y Shares5
December 31, 2012 (inception) through December 31, 2017
3 |
Average Annual Total Returns — December 31, 20175
| | | | | | | | | | | | | | | | | | | | |
| | | | | |
| | | | | | | | | | | | Expense Ratios6 | |
| | | 1 Year | | | 5 Years | | | Life of Fund | | | Gross | | | Net | |
| | | | | | |
Class Y (Inception 12/31/12)1 | | | | | | | | | | | | | | | | | | | | |
NAV | | | 5.13 | % | | | 2.20 | % | | | 2.20 | % | | | 0.63 | % | | | 0.45 | % |
| | | | | | |
Class A (Inception 12/31/12)1 | | | | | | | | | | | | | | | | | | | | |
NAV | | | 4.77 | | | | 1.88 | | | | 1.88 | | | | 0.88 | | | | 0.70 | |
With 3.00% Maximum Sales Charge | | | 1.58 | | | | 1.25 | | | | 1.25 | | | | | | | | | |
| | | | | | |
Class C (Inception 12/31/12)1 | | | | | | | | | | | | | | | | | | | | |
NAV | | | 3.98 | | | | 1.15 | | | | 1.15 | | | | 1.63 | | | | 1.45 | |
With CDSC2 | | | 2.98 | | | | 1.15 | | | | 1.15 | | | | | | | | | |
| | | | | | |
Comparative Performance | | | | | | | | | | | | | | | | | | | | |
Bloomberg Barclays Municipal Bond Index3 | | | 5.45 | | | | 3.02 | | | | 3.02 | | | | | | | | | |
Bloomberg Barclays 3-15 Year Blend Municipal Bond Index4 | | | 4.76 | | | | 2.65 | | | | 2.65 | | | | | | | | | |
Performance data shown represents past performance and is no guarantee of, and not necessarily indicative of, future results. Total return and value will vary, and you may have a gain or loss when shares are sold. Current performance may be lower or higher than quoted. For most recent month-end performance, visit im.natixis.com/performance. Performance for other share classes will be greater or less than shown based on differences in fees and sales charges. You may not invest directly in an index. Performance for periods less than one year is cumulative, not annualized. Returns reflect changes in share price and reinvestment of dividends and capital gains, if any. The table(s) do not reflect taxes shareholders might owe on any fund distributions or when they redeem their shares.
| 1 | December 31, 2012 represents the date shares were first registered for public sale under the Securities Act of 1933. November 16, 2012 represents commencement of operations for accounting and financial reporting purposes only. |
| 2 | Performance for Class C shares assumes a 1.00% contingent deferred sales charge (“CDSC”) applied when you sell shares within one year of purchase. |
| 3 | Bloomberg Barclays Municipal Bond Index is a market value — weighted index of investment-grade municipal bonds with maturities of one year or more. Effective May 22, 2017, the Bloomberg Barclays Municipal Bond Index replaced the Bloomberg Barclays 3-15 Year Blend Municipal Bond Index as the Fund’s primary benchmark because the Fund believes the Bloomberg Barclays Municipal Bond Index, an index which covers the U.S. dollar-denominated long-term tax exempt bond market, is a more appropriate comparison to the Fund’s investment strategies. |
| 4 | Bloomberg Barclays 3-15 Year Blend Municipal Bond Index tracks the performance of municipal bonds issued after December 31, 1990 with remaining maturities between 2 and 17 years and at least $5 million in principal amount outstanding. |
| 5 | Fund performance has been increased by fee waivers and/or expense reimbursements, if any, without which performance would have been lower. |
| 6 | Expense ratios are as shown in the Fund’s prospectus in effect as of the date of this report. The expense ratios for the current reporting period can be found in the Financial Highlights section of this report under Ratios to Average Net Assets. Net expenses reflect contractual expense caps set to expire on 4/30/18. When a Fund’s expenses are below the cap, gross and net expense ratios will be the same. See Note 6 of the Notes to Financial Statements for more information about the Fund’s expense caps. |
| 4
NATIXIS OAKMARK FUND
| | |
| Managers | | Symbols |
| William C. Nygren, CFA® | | Class A NEFOX |
| Kevin G. Grant, CFA® | | Class C NECOX |
| M. Colin Hudson, CFA® | | Class N NOANX |
| Michael J. Mangan, CFA® | | Class Y NEOYX |
| Harris Associates L.P. | | |
Investment Goal
The Fund seeks long-term capital appreciation.
Market Conditions
Key US indexes reached record high levels repeatedly during the year. Over the course of 2017, the gross domestic product expanded to its highest level in three years, employment statistics remained strong, and consumer confidence rose to a nearly 17-year high. As was widely expected, economic improvements prompted the Federal Reserve to raise key interest rates for the third time in a year at its December meeting, and the board projects more increases through 2018. Meanwhile, inflation remained moderate, which may have emboldened consumers to spend, as holiday retail sales grew at the fastest rate in six years.
The Republican administration has now been in place for nearly one year, and investors remain optimistic that some of the pending initiatives, such as large-scale infrastructure spending, will promote additional business growth. The new corporate tax plan was welcomed by investors who anticipate that its benefits to businesses will flow through to shareholders. Likewise, a bill to ease regulations on banks is working its way through Congress. This bill would allow banks to use more capital for lending rather than for reserves, which investors believe will be good for the growth of financial firms.
Amid these positive developments, there are still some significant uncertainties, such as the pending vote to approve the federal budget and the tumultuous relationship between the US and North Korea. However, we have observed that investors have become less unnerved by macro and geopolitical events, seemingly separating real business and economic factors from outside noise. We believe this investor resiliency worked to propel market rallies in the US and globally.
Performance Results
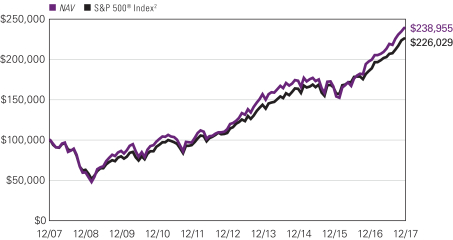
For the 12 months ended December 31, 2017, Class Y shares of Natixis Oakmark Fund returned 21.05% at net asset value. The Fund underperformed its benchmark, the S&P 500® Index, which returned 21.83%.
Explanation of Fund Performance
As value investors with an emphasis on individual stock selection, our sector weights are a byproduct of our bottom-up process. On an absolute-return basis, shares in the consumer
5 |
staples sector gained the most value, while holdings in the energy sector posted the only negative return for calendar 2017.
The leading contributors to Fund performance for the year were Caterpillar and Fiat Chrysler. Caterpillar delivered positive earnings reports throughout 2017. In its first quarter, the company’s revenue and cash flow both exceeded our expectations. Caterpillar’s business mix, abnormally low period costs and cost absorption on building inventory levels worked to expand margins, especially in the construction industries and resource industries segments. Caterpillar’s second quarter earnings per share of $1.49 far outpaced market expectations of $1.26, and revenue increased about $1 billion from last year, surpassing forecasts by roughly 3%. We were especially impressed that construction industry segment margins continue to expand and reached an all-time record for the period, despite sales remaining below normalized levels. Similar to results over the past few quarters, Caterpillar’s third quarter earnings per share ($1.95) handily beat market projections ($1.27), and revenues exceeded investors’ expectations by nearly 7%. Caterpillar held an investor day in September and highlighted its new corporate strategy. The main focus is achieving economic value-added growth through improved operational efficiency, higher revenue from services, expanded product offerings, and improved resource allocation. While these objectives seemed familiar, we like that the company has now implemented a greater emphasis on accountability, organizational acceptance, and a sense of urgency to optimize business performance.
Fiat Chrysler’s share price soared higher during the reporting period on speculation that the company was going to be sold. Headlines abounded in the third quarter regarding Fiat as an acquisition target for a Chinese original equipment manufacturer and on rumors that Great Wall Motors was interested in buying Jeep. However, we are unaware of any formal acquisition offers thus far and believe Fiat remains committed to its 2018 plan. Additionally, we believe the company is showing continued strong operating performance and impressive profitability improvement. In our view, CEO Sergio Marchionne is focused on maximizing per share value for the benefit of shareholders. Furthermore, we believe Fiat has one of the best management teams in the business with a strong track record of allocating capital efficiently.
General Electric (GE) and Apache were the largest detractors from fund performance for the calendar year. GE issued second-quarter earnings that were in line with expectations. However, the vague and downbeat nature of management’s earnings call concerned investors and caused share price weakness. In the fourth quarter, GE’s share price reacted negatively to 1) third-quarter results that fell short of market expectations, 2) several analysts’ downgrades and 3) news of CFO Jeffrey Bornstein’s departure. We believe Bornstein’s departure indicates that newly appointed CEO John Flannery is quickly establishing a strong culture of accountability and that “business as usual” will no longer be tolerated. Newly appointed CFO Jamie Miller has held multiple positions at GE, most recently as head of GE Transportation. In mid-November, Flannery announced a “reset” during which he established a new lower base for the company’s earnings by cutting 2018 earnings guidance and its dividend by 50%. We expect Flannery to reduce costs aggressively, which should improve earnings. We like that GE’s business model includes
| 6
NATIXIS OAKMARK FUND
manufacturing and selling original equipment, as well as offering long-duration service contracts for that equipment, which provides ongoing revenue streams from its client base. GE has been a very frustrating holding, as business fundamentals have lagged our expectations. However, we continue to remain shareholders because we believe the stock has declined more than warranted by the fundamentals. Apache’s share price reacted negatively to management’s 2017 production guidance that was below market expectations despite higher capital spending. During the second quarter, oil production was lower than estimated primarily due to weak production in the Permian Basin, which declined despite a meaningful increase in capital allocation. However, Apache conducted a presentation to update investors on its progress in the Alpine High region (part of its Permian Basin operations) and to update fiscal second-half guidance in October. Management adjusted their expectations for the Alpine High up to 5,000 potential future well locations from its previous 3,000. However, this positive news was tempered by management’s reduced 2017 production guidance. The company now forecasts lower production in both the third and fourth quarters partly due to “secondary effects” from Hurricane Harvey (delayed equipment from flooding at suppliers). Investors largely focused on the lowered production guidance, which pressured Apache’s share price. Later in the reporting period, we appreciated positive results from the Permian Basin as part of the company’s third-quarter earnings report, with a similar trajectory expected for the fourth quarter. Overall, we continue to believe the valuation for Apache remains attractive, offering a compelling reason to own.
Outlook
Although share prices of companies march higher in the short term, our perception of the intrinsic value of a business is measured over the long term. We endeavor to own stocks that are trading at the largest current discount to fair value in all market environments. In our estimation, these stocks provide the most attractive investment opportunities for our investment thesis, as patience and fortitude allow for these companies to fully recognize their upside potential.
7 |
Hypothetical Growth of $100,000 Investment in Class Y Shares3
December 31, 2007 through December 31, 2017
See notes to chart on page 9.
Top Ten Holdings as of December 31, 2017
| | | | | | |
| Security name | | % of
net assets | |
| 1 | | Citigroup, Inc. | | | 3.46 | % |
| 2 | | Alphabet, Inc., Class A | | | 3.41 | |
| 3 | | Bank of America Corp. | | | 2.75 | |
| 4 | | Apple, Inc. | | | 2.56 | |
| 5 | | Capital One Financial Corp. | | | 2.55 | |
| 6 | | Ally Financial, Inc. | | | 2.54 | |
| 7 | | American International Group, Inc. | | | 2.47 | |
| 8 | | Parker Hannifin Corp. | | | 2.46 | |
| 9 | | Caterpillar, Inc. | | | 2.43 | |
| 10 | | MasterCard, Inc., Class A | | | 2.38 | |
The portfolio is actively managed and holdings are subject to change. There is no guarantee the Fund continues to invest in the securities referenced. The holdings listed exclude any temporary cash investments.
| 8
NATIXIS OAKMARK FUND
Average Annual Total Returns — December 31, 20173
| | | | | | | | | | | | | | | | | | | | | | | | |
| | | | | | | | | | | | | | | Expense Ratios4 | |
| | | 1 Year | | | 5 Years | | | 10 Years | | | Life of
Class N | | | Gross | | | Net | |
| | | | | | | |
| Class Y (Inception 11/18/98) | | | | | | | | | | | | | | | | | | | | | | | | |
| NAV | | | 21.05 | % | | | 16.07 | % | | | 9.10 | % | | | — | % | | | 0.92 | % | | | 0.92 | % |
| | | | | | | |
| Class A (Inception 5/6/31) | | | | | | | | | | | | | | | | | | | | | | | | |
| NAV | | | 20.75 | | | | 15.77 | | | | 8.80 | | | | — | | | | 1.18 | | | | 1.18 | |
| With 5.75% Maximum Sales Charge | | | 13.82 | | | | 14.41 | | | | 8.16 | | | | — | | | | | | | | | |
| | | | | | | |
| Class C (Inception 5/1/95) | | | | | | | | | | | | | | | | | | | | | | | | |
| NAV | | | 19.85 | | | | 14.91 | | | | 7.99 | | | | — | | | | 1.93 | | | | 1.93 | |
| With CDSC1 | | | 18.85 | | | | 14.91 | | | | 7.99 | | | | — | | | | | | | | | |
| | | | | | | |
| Class N (Inception 5/1/17) | | | | | | | | | | | | | | | | | | | | | | | | |
| NAV | | | — | | | | — | | | | — | | | | 15.46 | | | | 0.81 | | | | 0.81 | |
| | | | | | | |
| Comparative Performance | | | | | | | | | | | | | | | | | | | | | | | | |
| S&P 500® Index2 | | | 21.83 | | | | 15.79 | | | | 8.50 | | | | 13.50 | | | | | | | | | |
Performance data shown represents past performance and is no guarantee of, and not necessarily indicative of, future results. Total return and value will vary, and you may have a gain or loss when shares are sold. Current performance may be lower or higher than quoted. For most recent month-end performance, visit im.natixis.com/performance. Performance for other share classes will be greater or less than shown based on differences in fees and sales charges. You may not invest directly in an index. Performance for periods less than one year is cumulative, not annualized. Returns reflect changes in share price and reinvestment of dividends and capital gains, if any. The table(s) do not reflect taxes shareholders might owe on any fund distributions or when they redeem their shares.
| 1 | Performance for Class C shares assumes a 1.00% contingent deferred sales charge (“CDSC”) applied when you sell shares within one year of purchase. |
| 2 | S&P 500® Index is a widely recognized measure of U.S. stock market performance. It is an unmanaged index of 500 common stocks chosen for market size, liquidity, and industry group representation, among other factors. It also measures the performance of the large cap segment of the US equities market. |
| 3 | Fund performance has been increased by fee waivers and/or expense reimbursements, if any, without which performance would have been lower. |
| 4 | Expense ratios are as shown in the Fund’s prospectus in effect as of the date of this report. The expense ratios for the current reporting period can be found in the Financial Highlights section of this report under Ratios to Average Net Assets. Net expenses reflect contractual expense caps set to expire on 4/30/18. When a Fund’s expenses are below the cap, gross and net expense ratios will be the same. See Note 6 of the Notes to Financial Statements for more information about the Fund’s expense caps. |
9 |
NATIXIS OAKMARK INTERNATIONAL FUND
| | |
| Managers | | Symbols |
| David G. Herro, CFA® | | Class A NOIAX |
| Michael L. Manelli, CFA® | | Class C NOICX |
| Harris Associates L.P. | | Class N NIONX |
| | Class Y NOIYX |
Investment Goal
The Fund seeks long-term capital appreciation.
Market Conditions
A confluence of positive economic news, including low volatility, paved the way for growth in stock markets around the globe. During the fourth quarter, the Cboe® Volatility Index® (the VIX®) reached an all-time low closing. As was widely expected, economic improvements in the US prompted the Federal Reserve to raise key interest rates for the third time in 2017 at its December meeting. In addition, Congress passed a new tax bill that, among other things, lowers the corporate tax rate from 35% to 21%. In anticipation of some level of tax relief, the Federal Reserve increased its forecast for gross domestic product to reach 2.5% in 2018, up from the 2.1% forecasted in September. That being said, continued low inflation prevented the Federal Reserve from raising its outlook for any more than three rate hikes in 2018.
In Japan, unemployment continued to fall, while core consumer prices increased 0.9% in November from the year-ago period. The Bank of Japan indicated it would continue its monetary easing policy into 2018 and also opted to keep short-term interest rates at -0.1% in an effort to stoke inflation toward its central bank’s longstanding goal of 2%. The European Central Bank also left interest rates unchanged in December and suggested that trend would continue for the foreseeable future.
Meanwhile, West Texas Intermediate crude oil prices exceeded $60 per barrel in December for the first time since 2015 on a continued climb that persisted throughout the fourth quarter. Higher gasoline prices served as the fuel for a 0.4% increase in the US-based Consumer Price Index (CPI) in November, with increased rent and car prices also contributing to the higher CPI reading. In addition, copper prices exceeded $7,300 per ton on the London Metal Exchange in December to reach a level not seen since January 2014, as pollution concerns in China forced producers to trim output.
Performance Results
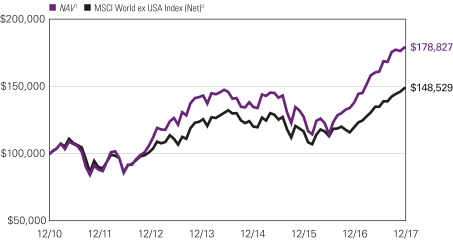
For the 12 months ended December 31, 2017, Class Y shares of Natixis Oakmark International Fund returned 29.78% at net asset value. The Fund outperformed its benchmark, the MSCI World ex USA Index (Net), which returned 24.21%.
Explanation of Fund Performance
Geographically, our average weightings for the year were 79% in Europe, 7% in Japan and 3% in Australia. The remaining positions are in Indonesia, the United States, China,
| 10
NATIXIS OAKMARK INTERNATIONAL FUND
Mexico, India, South Korea, Hong Kong, Taiwan and Israel. As value investors with an emphasis on individual stock selection, our country and sector weights are a byproduct of our bottom-up process.
On an absolute-return basis, shares in the information technology sector produced the best collective return. None of the invested sectors lost value during the year.
The top contributors to the yearly return were Glencore and CNH Industrial. Glencore’s fundamentals have strengthened over the past 12 months, benefiting from management’s significant efforts to aggressively reduce debt and capital expenditures as well as sell non-core assets. Glencore’s first half earnings results were largely in line with our expectations and showed a significant improvement with a 58% increase in earnings before interest, taxes, depreciation, and amortization (EBITDA) and a 334% increase in earnings before interest and taxes (EBIT) year-over-year. Notably, the industrial business showed dramatic improvement thanks to the combination of higher commodity prices and continued cost control measures. Later, in conjunction with Yancoal, Glencore announced the acquisition of the Hunter Valley Operations coal assets in Australia. This transaction will boost Glencore’s production of high-quality thermal coal and more importantly, there should be significant operational synergies. Glencore also announced an agreement to purchase a portion of Peruvian zinc producer Volcan Compañía Minera for $531 million. The asset has a mine life of more than 20 years and comes with significant development options. Furthermore, the acquisition offers promising cost-cutting opportunities. Glencore has controlled assets near the Volcan site with similar geologic profiles, but was able to produce for less than half of Volcan’s costs, so we find the deal to be strategically attractive. Additionally, we like that the company’s diversification across a number of attractive commodities positions makes Glencore more resilient to shocks in any one market.
CNH Industrial’s quarterly earnings reports have shown ongoing improvement over the past 12 months. The company delivered a positive first quarter earnings report with both revenue and earnings that exceeded market estimates. Performance in the industrial business improved, as earnings increased 34% year-over-year, driven by a 77% improvement in the agriculture equipment segment. In addition, Standard & Poor’s upgraded CNH Industrial’s long-term corporate credit rating, which indicates an improved outlook for the company. The stock price also reacted positively to the company’s third quarter earnings report released in October as results exceeded consensus estimates. Furthermore, management raised its full-year earnings and revenue guidance. This strong result was primarily driven by CNH’s core agricultural equipment segment, where revenue increased organically by over 9% and operating profit increased by over 34%, compared to the previous year. Later in the reporting period, CNH was awarded an order to supply 200 Urbanway Natural Power buses to the state-owned public transportation operator for Paris, France. CNH’s IVECO Bus division is a leading provider of natural gas buses in Europe, with roughly 6,000 currently operating across the region. This new order represents one portion of a Europe-wide collaborative program covering 2017 to 2021. We remain optimistic that CNH’s improving trends will continue.
11 |
The largest detractors from return were H&M Class B and WPP. Early in the year, as we had anticipated, H&M’s higher-than-normal first-quarter inventory levels led to increased markdowns and lower margins. While the company has started to see an improvement in a number of markets, including China, its performance in the US and Central/Southern Europe remained weak. H&M’s share price declined again in the second quarter, as its fiscal first half results were mixed. Sales were still tracking behind plan (increasing only 5% in local currency), while the inventory position remained high (growing by 22% year-over-year). H&M also delivered weak fourth quarter results in December, which proved disappointing to investors. The company indicated that the weakness is in the H&M brick-and-mortar stores, as the other brands and H&M online are doing well. However, significant investments and changes have been made in H&M’s brand management, logistics, purchasing and technology. The company is also launching more concepts and has said it will further optimize the physical store footprint with fewer openings and more closures. Overall, we believe H&M will be successful in returning to profitable growth. We also like that the H&M brand will now be on Alibaba’s TMall in China as of spring 2018. While the short-term outlook is weak, we find that H&M is trading at a large discount to the company’s true worth.
WPP’s fiscal first half results fell short of market forecasts. The shortfall was driven by lower than projected like-for-like sales across segments. Profit before tax and earnings per share were also less than investors expected. Some of the factors that negatively influenced WPP’s performance were account losses during the Mediapalooza event, exposure to developed market multinationals that have reduced advertising spending, and digital revenues that are growing more slowly than those at internet giants in the US and China. Although management is expecting business to gradually improve in the second half of the year, the company lowered its full year net sales organic growth guidance to a range of zero to +1% from the prior 2% growth prediction. However, this adjustment did not surprise us, as our growth estimates were closer to management’s revised outlook. We met with management in December regarding the digital business and came away reassured that the segment is performing relatively well in a challenging operating environment. In addition, we find the digital business has a solid outlook for 2018. Furthermore, the company’s founder and CEO Sir Martin Sorrell’s net worth is driven by his share ownership in WPP. Subsequently, he has a vested interest in growing shareholder value. Along with Sorrell’s ongoing focus on expanding operating margins, he has effectively anticipated changes, such as the move to digital advertising and the increasing importance of business in emerging markets, adding to our confidence in this investment.
Outlook
Although market prices of companies march higher in the short term, our perception of the intrinsic value of a business is measured over the long term. We endeavor to own stocks that are trading at the largest current discount to fair value in all market environments. In our estimation, these stocks provide the most attractive investment opportunities for our investment thesis, as patience and fortitude allow for these companies to fully recognize their upside potential.
| 12
NATIXIS OAKMARK INTERNATIONAL FUND
Hypothetical Growth of $100,000 Investment in Class Y Shares4
December 15, 2010 (inception) through December 31, 2017
Top Ten Holdings as of December 31, 2017
| | | | | | |
| Security name | | % of
net assets | |
| 1 | | Lloyds Banking Group PLC | | | 5.09 | % |
| 2 | | Daimler AG, (Registered) | | | 4.87 | |
| 3 | | Glencore PLC | | | 4.66 | |
| 4 | | BNP Paribas S.A. | | | 4.57 | �� |
| 5 | | Bayerische Motoren Werke AG | | | 4.23 | |
| 6 | | Credit Suisse Group AG, (Registered) | | | 3.92 | |
| 7 | | Intesa Sanpaolo SpA | | | 3.75 | |
| 8 | | Hennes & Mauritz AB, B Shares | | | 3.75 | |
| 9 | | Toyota Motor Corp. | | | 3.45 | |
| 10 | | Allianz SE, (Registered) | | | 3.35 | |
The portfolio is actively managed and holdings are subject to change. There is no guarantee the Fund continues to invest in the securities referenced. The holdings listed exclude any temporary cash investments.
13 |
Average Annual Total Returns — December 31, 20174
| | | | | | | | | | | | | | | | | | | | | | | | |
| | | | | | |
| | | | | | | | | | | | | | | Expense Ratios5 | |
| | | 1 Year | | | 5 Years | | | Life of Class | | | Gross | | | Net | |
| | | | | | | |
| Class Y (Inception 5/1/17) | | | | | | | | | | | Class A/C | | | | Class Y/N | | | | | | | | | |
| NAV1 | | | 29.78 | % | | | 9.85 | % | | | — | % | | | 12.79 | % | | | 1.09 | % | | | 1.09 | % |
| | | | | | | |
| Class A (Inception 12/15/10) | | | | | | | | | | | | | | | | | | | | | | | | |
| NAV | | | 29.56 | | | | 9.82 | | | | 8.58 | | | | — | | | | 1.34 | | | | 1.34 | |
| With 5.75% Maximum Sales Charge | | | 22.12 | | | | 8.52 | | | | 7.67 | | | | — | | | | | | | | | |
| | | | | | | |
| Class C (Inception 12/15/10) | | | | | | | | | | | | | | | | | | | | | | | | |
| NAV | | | 28.55 | | | | 8.99 | | | | 7.77 | | | | — | | | | 2.09 | | | | 2.09 | |
| With CDSC2 | | | 27.55 | | | | 8.99 | | | | 7.77 | | | | — | | | | | | | | | |
| | | | | | | |
| Class N (Inception 5/1/17) | | | | | | | | | | | | | | | | | | | | | | | | |
| NAV | | | — | | | | — | | | | — | | | | 12.96 | | | | 0.97 | | | | 0.97 | |
| | | | | | | |
| Comparative Performance | | | | | | | | | | | | | | | | | | | | | | | | |
| MSCI World ex USA Index (Net)3 | | | 24.21 | | | | 7.46 | | | | 5.78 | | | | 13.57 | | | | | | | | | |
Performance data shown represents past performance and is no guarantee of, and not necessarily indicative of, future results. Total return and value will vary, and you may have a gain or loss when shares are sold. Current performance may be lower or higher than quoted. For most recent month-end performance, visit im.natixis.com/performance. Performance for other share classes will be greater or less than shown based on differences in fees and sales charges. You may not invest directly in an index. Performance for periods less than one year is cumulative, not annualized. Returns reflect changes in share price and reinvestment of dividends and capital gains, if any. The table(s) do not reflect taxes shareholders might owe on any fund distributions or when they redeem their shares.
| 1 | Prior to the inception of Class Y shares (5/1/2017), performance is that of Class A shares and reflects the higher net expenses of that share class. |
| 2 | Performance for Class C shares assumes a 1.00% contingent deferred sales charge (“CDSC”) applied when you sell shares within one year of purchase. |
| 3 | MSCI World ex USA Index (Net) is an unmanaged index that is designed to measure the equity market performance of developed markets, excluding the United States. |
| 4 | Fund performance has been increased by fee waivers and/or expense reimbursements, if any, without which performance would have been lower. |
| 5 | Expense ratios are as shown in the Funds prospectus in effect as of the date of this report. The expense ratios for the current reporting period can be found in the Financial Highlights section of this report under Ratios to Average Net Assets. Net expenses reflect contractual expense caps set to expire on 4/30/18. When a Funds expenses are below the cap, gross and net expense ratios will be the same. See Note 6 of the Notes to Financial Statements for more information about the Funds expense caps. |
| 14
VAUGHAN NELSON SMALL CAP VALUE FUND
| | |
| Managers | | Symbols |
| Dennis G. Alff, CFA® | | Class A NEFJX |
| Chad D. Fargason | | Class C NEJCX |
| Chris D. Wallis, CFA® | | Class N VSCNX |
| Scott J. Weber, CFA® | | Class Y NEJYX |
| Vaughan Nelson Investment Management, L.P. |
Effective July 31, 2009, the fund was closed to new investors.
Investment Goal
The Fund seeks capital appreciation.
Market Conditions
US equity markets rallied materially in reaction to Donald Trump winning the presidency as investors embraced Trump’s platform of corporate tax reform, broad regulatory relief, and infrastructure spending. During the year, the Federal Reserve continued raising interest rates. Although interest rates should increase at a measured pace, the risks are heightened compared to prior rate hike cycles in light of current equity valuations and the leverage that remains in both private and public sectors.
In order to support current valuations and to expect further market gains, the credit environment must remain benign while companies increase capital expenditures to boost productivity and drive sustained earnings growth. We continue to position the portfolio for a very modest growth environment with a balanced view of capital preservation and capital growth. While there is much debate as to whether corporate tax reform is “priced in” to the market, it is our opinion that corporate tax reform was necessary to justify current market valuations and provide some downside support should economic growth begin to slow or corporate credit costs start to rise.
Performance Results
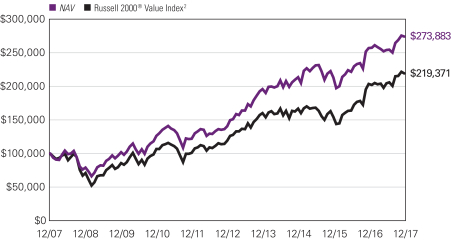
For the 12 months ended December 31, 2017, Class Y shares of Vaughan Nelson Small Cap Value Fund returned 6.60% at net asset value. The Fund underperformed its benchmark, the Russell 2000® Value Index, which returned 7.84%.
Explanation of Fund Performance
Small-cap value stocks lagged the broad market for the year. The Fund underperformed the benchmark primarily due to stock selection within the consumer discretionary, energy, and healthcare sectors. The Fund was positioned less cyclically than the index during the year, as rich valuations made us more cautious on the market, especially with business and credit cycles that are quite mature. The information technology, financials, materials, and industrial sectors were the biggest contributors to absolute performance.
Within the consumer discretionary sector, positions in Vista Outdoor and Wide Open West detracted the most from results. Vista Outdoor suffered from a challenging retail
15 |
environment that forced several of its large customers to close their doors or file for bankruptcy. This led to excess inventory and discounting in the supply chain, which negatively impacted Vista’s results. Wide Open West, a large cable operator in the Midwest and Southeastern US, reported mixed results in its first two quarters as a public company. Following its IPO in May of 2017, subscriber losses were higher than expected.
The energy sector also detracted from performance as oil prices were weak during the first half of the year, tempering production growth, while service costs continued to rise. Laredo Petroleum, Oasis Petroleum, and Callon Petroleum detracted the most from results.
The healthcare sector detracted from performance, primarily due to stock selection and our lack of exposure to the biotech industry. Envision Healthcare, an ambulatory surgery center and physician services provider, struggled during the year as utilization was weaker than expected following the merger with Amsurg late in the prior year. Albany Molecular Research, a contract research and manufacturing organization serving the pharmaceutical industry, was negatively impacted by customer delays and acquisition integration issues. Positively, VWR was a strong contributor for the year as it was acquired by Avantor at a large premium.
The information technology sector contributed the most to absolute and relative return for the year, due primarily to stock selection. Silicon Laboratories and Integrated Device Technology benefited from the strong demand for semiconductors as the Internet of Things continues to drive increased connectivity across multiple platforms including mobile, automotive, and industrial. Virtusa, an IT consulting and outsourcing services provider, continues to profit from companies seeking ways to boost efficiency and control costs through innovative technology solutions.
The Fund’s financial holdings also performed well for the year, especially on a relative basis. First American Financial, a title insurance company, continued to benefit from a recovery in the housing market, higher fees as real estate prices rose, and higher interest rates on the cash balances it holds in escrow. FirstCash, a pawn shop operator, performed well during the year as its Latin American businesses had strong loan growth, its balance sheet improved, and the integration of the Cash America acquisition remained on track. Insurance broker Brown and Brown benefited from stronger organic growth, higher interest rates, and increased claims volume following this year’s hurricane season.
The materials sector benefited from resumption in global growth and from a weaker dollar. Graphic Packaging and Multi Packaging Solutions were strong performers as the paper and packaging industry recovered in 2017 and was able to push through price increases. Also, Graphic Packaging partnered with International Paper, combining their consumer businesses, which will likely create significant synergies. Multi Packaging Solutions was acquired by WestRock at the beginning of the year at a large premium.
The Fund’s industrials holdings performed well during the year, and since the Fund was materially overweight the sector, relative return was also strong. American Woodmark, manufacturer of kitchen cabinets, benefited from a robust new home construction and remodel environment. The company also announced the transformational acquisition of
| 16
VAUGHAN NELSON SMALL CAP VALUE FUND
RSI, a leading manufacturer of in-stock and value-oriented cabinets, which will be immediately accretive to earnings. Insperity, a human resources services provider, performed well during the year as worksite employee growth was strong, and the recently passed Tax Cuts and Jobs Act is seen as tailwind for growth going forward. Littelfuse, a manufacturer of fuses and circuit protection components, continues to benefit from the increased complexity of electrical platforms in industries such as automotive. The company’s circuit protection devices are the crucial safeguard to ensure failsafe performance in many electrical devices.
Consumer staples was one of the worst performing sectors for the year. Although Hostess Brands detracted from performance, the Fund’s relative return in the consumer staples sector was positive as we were underweight the group.
Outlook
Capital markets remain well supported by improving economic data, low interest rates, liquidity injections by foreign central banks, and corporate tax reform. However, we must acknowledge that margins and valuations for equities are at or near all-time highs and the business and credit cycles are quite mature. Should future earnings be dampened by slower economic growth or accelerating input costs, we would expect volatility to increase and equity markets to experience a correction.
The Federal Reserve is expected to continue raising rates in 2018 and began shrinking its balance sheet (“quantitative tightening”) in October 2017. Economic growth should continue at a modest pace and support the current market environment provided the Fed continues to raise rates in a manner that does not tighten liquidity conditions or dampen economic activity in key sectors such as autos or construction. However, we do not expect the transition from monetary stimulus to fiscal stimulus to be flawless, and would anticipate market volatility to increase from today’s exceptionally low levels.
As the nature of the market continues to change, there are still individual stocks that will perform well over the medium term. Our outlook remains balanced, stock-specific, and not reflective of opportunities in specific industries, regions of the world, or broader market indices.
17 |
Hypothetical Growth of $100,000 Investment in Class Y Shares3
December 31, 2007 through December 31, 2017
See notes to chart on page 19.
Top Ten Holdings as of December 31, 2017
| | | | | | |
| Security name | | % of
net assets | |
| 1 | | First American Financial Corp. | | | 2.15 | % |
| 2 | | Chemical Financial Corp. | | | 2.09 | |
| 3 | | First Financial Bancorp | | | 2.03 | |
| 4 | | First Merchants Corp. | | | 1.97 | |
| 5 | | Union Bankshares Corp. | | | 1.94 | |
| 6 | | Jack in the Box, Inc. | | | 1.93 | |
| 7 | | FirstCash, Inc. | | | 1.89 | |
| 8 | | Berry Global Group, Inc. | | | 1.85 | |
| 9 | | Brandywine Realty Trust | | | 1.73 | |
| 10 | | Reliance Steel & Aluminum Co. | | | 1.70 | |
The portfolio is actively managed and holdings are subject to change. There is no guarantee the Fund continues to invest in the securities referenced. The holdings listed exclude any temporary cash investments.
| 18
VAUGHAN NELSON SMALL CAP VALUE FUND
Average Annual Total Returns — December 31, 20173
| | | | | | | | | | | | | | | | | | | | | | | | |
| | | | | | | | | | | | | | | Expense Ratios4 | |
| | | 1 Year | | | 5 Years | | | 10 Years | | | Life of
Class N | | | Gross | | | Net | |
| | | | | | | |
Class Y (Inception 8/31/06) | | | | | | | | | | | | | | | | | | | | | | | | |
NAV | | | 6.60 | % | | | 14.32 | % | | | 10.60 | % | | | — | % | | | 1.35 | % | | | 1.35 | % |
| | | | | | | |
Class A (Inception 12/31/96) | | | | | | | | | | | | | | | | | | | | | | | | |
NAV | | | 6.28 | | | | 14.02 | | | | 10.31 | | | | — | | | | 1.60 | | | | 1.60 | |
With 5.75% Maximum Sales Charge | | | 0.15 | | | | 12.67 | | | | 9.66 | | | | — | | | | | | | | | |
| | | | | | | |
Class C (Inception 12/31/96) | | | | | | | | | | | | | | | | | | | | | | | | |
NAV | | | 5.50 | | | | 13.16 | | | | 9.48 | | | | — | | | | 2.35 | | | | 2.35 | |
With CDSC1 | | | 4.62 | | | | 13.16 | | | | 9.48 | | | | — | | | | | | | | | |
| | | | | | | |
Class N (Inception 5/1/17) | | | | | | | | | | | | | | | | | | | | | | | | |
NAV | | | — | | | | — | | | | — | | | | 7.17 | | | | 1.26 | | | | 1.26 | |
| | | | | | | |
Comparative Performance | | | | | | | | | | | | | | | | | | | | | | | | |
Russell 2000® Value Index2 | | | 7.84 | | | | 13.01 | | | | 8.17 | | | | 7.10 | | | | | | | | | |
Performance data shown represents past performance and is no guarantee of, and not necessarily indicative of, future results. Total return and value will vary, and you may have a gain or loss when shares are sold. Current performance may be lower or higher than quoted. For most recent month-end performance, visit im.natixis.com/performance. Performance for other share classes will be greater or less than shown based on differences in fees and sales charges. You may not invest directly in an index. Performance for periods less than one year is cumulative, not annualized. Returns reflect changes in share price and reinvestment of dividends and capital gains, if any. The table(s) do not reflect taxes shareholders might owe on any fund distributions or when they redeem their shares.
| 1 | Performance for Class C shares assumes a 1.00% contingent deferred sales charge (“CDSC”) applied when you sell shares within one year of purchase. |
| 2 | Russell 2000® Value Index is an unmanaged index that measures the performance of the small-cap value segment of the U.S. equity universe. It includes those Russell 2000® companies with lower price-to-book ratios and lower forecasted growth values. |
| 3 | Fund performance has been increased by fee waivers and/or expense reimbursements, if any, without which performance would have been lower. |
| 4 | Expense ratios are as shown in the Fund’s prospectus in effect as of the date of this report. The expense ratios for the current reporting period can be found in the Financial Highlights section of this report under Ratios to Average Net Assets. Net expenses reflect contractual expense caps set to expire on 4/30/18. When a Fund’s expenses are below the cap, gross and net expense ratios will be the same. See Note 6 of the Notes to Financial Statements for more information about the Fund’s expense caps. |
19 |
VAUGHAN NELSON VALUE OPPORTUNITY FUND
| | |
| Managers | | Symbols |
| Dennis G. Alff, CFA® | | Class A VNVAX |
| Chad D. Fargason | | Class C VNVCX |
| Chris D. Wallis, CFA® | | Class N VNVNX |
| Scott J. Weber, CFA® | | Class Y VNVYX |
| Vaughan Nelson Investment Management, L.P. |
Investment Goal
The Fund seeks long-term capital appreciation.
Market Conditions
US equity markets rallied materially in reaction to Donald Trump winning the presidency as investors embraced Trump’s platform of corporate tax reform, broad regulatory relief, and infrastructure spending. During the year, the Federal Reserve continued raising interest rates. Although interest rates should increase at a measured pace, the risks are heightened compared to prior rate hike cycles in light of current equity valuations and the leverage that remains in both private and public sectors.
In order to support current valuations and to expect further market gains, the credit environment must remain benign while companies increase capital expenditures to boost productivity and drive sustained earnings growth. We continue to position the portfolio for a very modest growth environment with a balanced view of capital preservation and capital growth. While there is much debate as to whether corporate tax reform is “priced in” to the market, it is our opinion that corporate tax reform was necessary to justify current market valuations and provide some downside support should economic growth begin to slow or corporate credit costs start to rise.
Performance Results
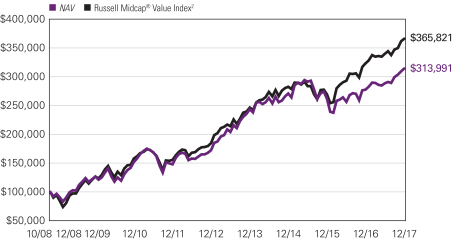
For the 12 months ended December 31, 2017, Class Y shares of Vaughan Nelson Value Opportunity Fund returned 13.19% at net asset value. The Fund underperformed its benchmark, the Russell Midcap® Value Index, which returned 13.34%.
Explanation of Fund Performance
The Fund performed well for the year but underperformed the benchmark. Energy was the only sector to detract from absolute performance; however, stock selection in the healthcare, industrials, consumer discretionary, and financials sectors contributed to the fund lagging the benchmark. Stock selection was strong in the materials and REITs sectors, which aided relative performance. Information technology, financials, materials, consumer discretionary, industrials and REITs were the biggest contributors to absolute performance.
The energy sector hampered performance, as oil prices were weak for most of the year, tempering production growth and the demand for energy services. QEP Resources and Forum Energy detracted the most from results.
| 20
VAUGHAN NELSON VALUE OPPORTUNITY FUND
The healthcare sector was challenging as proposed changes to the Affordable Care Act and concerns about drug pricing. While the Fund had its share of strong healthcare stocks, the performance of Endo International, a generics and branded pharmaceutical company, and Envision Healthcare, an ambulatory surgery center provider, offset the gains made in other holdings such as Centene and Catalent.
The industrials sector performed well during the year, but on a relative basis the Fund lagged the benchmark due to stock selection. Newell Brands and Laureate Education were the two largest detractors. Newell Brands, a consumer products company, had a difficult year as top line growth was softer than expected. The ongoing shift from brick-and-mortar to online sales has created a challenging retail environment, which led to inventory builds as some customers were forced to close their doors. Laureate Education performed poorly due to softer enrollment growth in Mexico and in the US online businesses. However, the Fund’s other higher education holding, Grand Canyon Education, more than offset Laureate’s poor performance.
Consumer discretionary was one of the best performing sectors for the year, but while the Fund was overweight the sector, its holdings weighed on relative performance. Signet Jewelers and Interpublic Group detracted the most from returns. Signet Jewelers suffered from sluggish retail and e-commerce traffic, leading the company to lower guidance several times during the year. Interpublic, an advertising agency, performed poorly due to weak industry fundamentals and the shares were sold.
The financials sector was also a major contributor to absolute returns. The Fund was overweight financials, but a few of its holdings lagged the benchmark in 2017. Chemical Financial, which appreciated over 50% in 2016, was flat for 2017 as the market digested the prior year’s advance. PacWest Bank, a California-based regional bank, was down modestly for the year due to concerns about its healthcare loan portfolio and related reserves. PacWest has reduced its exposure to the healthcare industry and should be a beneficiary of higher rates.
Information technology was the best performing sector in the Russell Midcap® Value Index for the year and the Fund was materially overweight technology stocks relative to the Index. This led to strong relative performance with RingCentral, Micron, and Global Payments contributing the most. RingCentral, a provider of communications solutions, benefited from the secular trends of cloud, mobile, and remote office locations that are increasingly pushing businesses toward SaaS communication providers like RingCentral. Semiconductor stocks performed well in 2017 as the strong demand for connectivity solutions across mobile, automotive, and industrial platforms continued, and semiconductor manufacturer Micron benefited from this trend.
The materials sector was also one of the top contributors to absolute and relative performance. The strong relative return was driven by the Fund’s significant overweight to the sector and by good stock selection. Constellium and Avery Dennison added the most to performance. Constellium, a specialty metals manufacturer, benefited from strong demand in the automotive channel, improving its balance sheet, and hiring new management. Avery Dennison, a manufacturer of labels and packaging materials,
21 |
performed well throughout the year as organic growth accelerated, margins expanded, and the company benefited from a weaker US dollar.
The Fund’s real estate holdings, New Residential and CyrusOne, also performed well for the year and outpaced the real estate sector. New Residential, a mortgage REIT, benefited from book value growth as its portfolio is positioned for higher interest rates. CyrusOne, a data center REIT, performed well as the insatiable demand for data storage solutions in the US and international growth lifted the shares. The Fund was underweight the real estate sector, which lagged the market, aiding relative performance.
Outlook
Capital markets remain well supported by improving economic data, low interest rates, liquidity injections by foreign central banks, and corporate tax reform. However, we must acknowledge that margins and valuations for equities are at or near all-time highs and the business and credit cycles are quite mature. Should future earnings be dampened by slower economic growth or accelerating input costs, we would expect volatility to increase and equity markets to experience a correction.
The Federal Reserve is expected to continue raising rates in 2018 and began shrinking its balance (“quantitative tightening”) in October 2017. Economic growth should continue at a modest pace and support the current market environment provided the Fed continues to raise rates in a manner that does not tighten liquidity conditions or dampen economic activity in key sectors such as autos or construction. However, we do not expect the transition from monetary stimulus to fiscal stimulus to be flawless, and would anticipate market volatility to increase from today’s exceptionally low levels.
As the nature of the market continues to change, there are still individual stocks that will perform well over the medium term. Our outlook remains balanced, stock-specific, and not reflective of opportunities in specific industries, regions of the world, or broader market indices.
| 22
VAUGHAN NELSON VALUE OPPORTUNITY FUND
Hypothetical Growth of $100,000 Investment in Class Y Shares3
October 31, 2008 (inception) through December 31, 2017
Top Ten Holdings as of December 31, 2017
| | | | | | |
| Security name | | % of
net assets | |
| 1 | | New Residential Investment Corp. | | | 2.61 | % |
| 2 | | Mohawk Industries, Inc. | | | 2.61 | |
| 3 | | WPX Energy, Inc. | | | 2.60 | |
| 4 | | Bank of NT Butterfield & Son Ltd. (The) | | | 2.39 | |
| 5 | | Fidelity National Information Services, Inc. | | | 2.33 | |
| 6 | | Ares Capital Corp. | | | 2.31 | |
| 7 | | Continental Resources, Inc. | | | 2.23 | |
| 8 | | Atlantica Yield PLC | | | 2.22 | |
| 9 | | Extended Stay America, Inc. | | | 2.15 | |
| 10 | | Nexstar Media Group, Inc., Class A | | | 2.11 | |
The portfolio is actively managed and holdings are subject to change. There is no guarantee the Fund continues to invest in the securities referenced. The holdings listed exclude any temporary cash investments.
23 |
Average Annual Total Returns — December 31, 20173
| | | | | | | | | | | | | | | | | | | | | | | | |
| | | | | | |
| | | | | | | | | | | | | | | Expense Ratios4 | |
| | | 1 Year | | | 5 Years | | | Life of Class | | | Gross | | | Net | |
| | | | | | | |
| Class Y (Inception 10/31/08) | | | | | | | | | | | Class A/C/Y | | | | Class N | | | | | | | | | |
| NAV | | | 13.19 | % | | | 12.80 | % | | | 13.29 | % | | | — | % | | | 1.23 | % | | | 1.23 | % |
| | | | | | | |
| Class A (Inception 10/31/08) | | | | | | | | | | | | | | | | | | | | | | | | |
| NAV | | | 12.93 | | | | 12.52 | | | | 13.01 | | | | — | | | | 1.48 | | | | 1.48 | |
| With 5.75% Maximum Sales Charge | | | 6.45 | | | | 11.19 | | | | 12.28 | | | | — | | | | | | | | | |
| | | | | | | |
| Class C (Inception 10/31/08) | | | | | | | | | | | | | | | | | | | | | | | | |
| NAV | | | 12.11 | | | | 11.68 | | | | 12.17 | | | | — | | | | 2.23 | | | | 2.23 | |
| With CDSC1 | | | 11.11 | | | | 11.68 | | | | 12.17 | | | | — | | | | | | | | | |
| | | | | | | |
| Class N (Inception 5/1/13) | | | | | | | | | | | | | | | | | | | | | | | | |
| NAV | | | 13.31 | | | | — | | | | — | | | | 10.79 | | | | 1.13 | | | | 1.13 | |
| | | | | | | |
| Comparative Performance | | | | | | | | | | | | | | | | | | | | | | | | |
| Russell Midcap® Value Index2 | | | 13.34 | | | | 14.68 | | | | 15.21 | | | | 12.59 | | | | | | | | | |
Performance data shown represents past performance and is no guarantee of, and not necessarily indicative of, future results. Total return and value will vary, and you may have a gain or loss when shares are sold. Current performance may be lower or higher than quoted. For most recent month-end performance, visit im.natixis.com/performance. Performance for other share classes will be greater or less than shown based on differences in fees and sales charges. You may not invest directly in an index. Performance for periods less than one year is cumulative, not annualized. Returns reflect changes in share price and reinvestment of dividends and capital gains, if any. The table(s) do not reflect taxes shareholders might owe on any fund distributions or when they redeem their shares.
| 1 | Performance for Class C shares assumes a 1.00% contingent deferred sales charge (“CDSC”) applied when you sell shares within one year of purchase. |
| 2 | Russell Midcap® Value Index is an unmanaged index that measures the performance of the mid-cap value segment of the U.S. equity universe. It includes those Russell Midcap® Index companies with lower price-to-book ratios and lower forecasted growth values. |
| 3 | Fund performance has been increased by fee waivers and/or expense reimbursements, if any, without which performance would have been lower. |
| 4 | Expense ratios are as shown in the Fund’s prospectus in effect as of the date of this report. The expense ratios for the current reporting period can be found in the Financial Highlights section of this report under Ratios to Average Net Assets. Net expenses reflect contractual expense caps set to expire on 4/30/18. When a Fund’s expenses are below the cap, gross and net expense ratios will be the same. See Note 6 of the Notes to Financial Statements for more information about the Fund’s expense caps. |
| 24
ADDITIONAL INFORMATION
The views expressed in this report reflect those of the portfolio managers as of the dates indicated. The managers’ views are subject to change at any time without notice based on changes in market or other conditions. References to specific securities or industries should not be regarded as investment advice. Because the Funds are actively managed, there is no assurance that they will continue to invest in the securities or industries mentioned.
All investing involves risk, including the risk of loss. There is no assurance that any investment will meet its performance objectives or that losses will be avoided.
ADDITIONAL INDEX INFORMATION
This document may contain references to third party copyrights, indexes, and trademarks, each of which is the property of its respective owner. Such owner is not affiliated with Natixis Investment Managers or any of its related or affiliated companies (collectively “Natixis Affiliates”) and does not sponsor, endorse or participate in the provision of any Natixis Affiliates services, funds or other financial products.
The index information contained herein is derived from third parties and is provided on an “as is” basis. The user of this information assumes the entire risk of use of this information. Each of the third party entities involved in compiling, computing or creating index information disclaims all warranties (including, without limitation, any warranties of originality, accuracy, completeness, timeliness, non-infringement, merchantability and fitness for a particular purpose) with respect to such information.
PROXY VOTING INFORMATION
A description of the Natixis Funds proxy voting policies and procedures is available without charge, upon request, by calling Natixis Funds at 800-225-5478; on the Natixis Funds’ website at im.natixis.com; and on the Securities and Exchange Commission’s (“SEC’s”) website at www.sec.gov. Information regarding how the Natixis Funds voted proxies relating to portfolio securities during the most recent 12-month period ended June 30 is available from the Natixis Funds’ website and the SEC’s website.
QUARTERLY PORTFOLIO SCHEDULES
The Natixis Funds file complete schedules of portfolio holdings with the SEC for the first and third quarters of each fiscal year on Form N-Q. The Funds’ Forms N-Q are available on the SEC’s website at www.sec.gov and may be reviewed and copied at the SEC’s Public Reference Room in Washington, DC. Information on the operation of the Public Reference Room may be obtained by calling 800-SEC-0330.
25 |
UNDERSTANDING FUND EXPENSES
As a mutual fund shareholder, you incur different costs: transaction costs, including sales charges (loads) on purchases and contingent deferred sales charges on redemptions, and ongoing costs, including management fees, distribution and/or service fees (12b-1 fees), and other fund expenses. Certain exemptions may apply. These costs are described in more detail in the Funds’ prospectus. The following examples are intended to help you understand the ongoing costs of investing in the Funds and help you compare these with the ongoing costs of investing in other mutual funds.
The first line in the table of each class of Fund shares shows the actual account values and actual Fund expenses you would have paid on a $1,000 investment in the Fund from July 1, 2017 through December 31, 2017. To estimate the expenses you paid over the period, simply divide your account value by $1,000 (for example $8,600 account value divided by $1,000 = 8.60) and multiply the result by the number in the Expenses Paid During Period column as shown for your class.
The second line in the table for each class of fund shares provides information about hypothetical account values and hypothetical expenses based on the Fund’s actual expense ratios and an assumed rate of return of 5% per year before expenses, which is not the Fund’s actual return. The hypothetical account values and expenses may not be used to estimate the actual ending account balance or expenses you paid on your investment for the period. You may use this information to compare the ongoing costs of investing in the Fund and other funds. To do so, compare this 5% hypothetical example with the 5% hypothetical examples that appear in the shareholder reports of the other funds.
Please note that the expenses shown reflect ongoing costs only, and do not include any transaction costs, such as sales charges. Therefore, the second line in the table of each fund is useful in comparing ongoing costs only, and will not help you determine the relative costs of owning different funds. If transaction costs were included, total costs would be higher.
| 26
| | | | | | | | | | | | |
MCDONNELL INTERMEDIATE
MUNICIPAL BOND FUND | | BEGINNING ACCOUNT VALUE 7/1/2017 | | | ENDING ACCOUNT VALUE 12/31/2017 | | | EXPENSES PAID DURING PERIOD* 7/1/2017 – 12/31/2017 | |
Class A | | | | | | | | | | | | |
Actual | | | $1,000.00 | | | | $1,011.80 | | | | $3.55 | |
Hypothetical (5% return before expenses) | | | $1,000.00 | | | | $1,021.68 | | | | $3.57 | |
Class C | | | | | | | | | | | | |
Actual | | | $1,000.00 | | | | $1,008.90 | | | | $7.34 | |
Hypothetical (5% return before expenses) | | | $1,000.00 | | | | $1,017.90 | | | | $7.38 | |
Class Y | | | | | | | | | | | | |
Actual | | | $1,000.00 | | | | $1,014.00 | | | | $2.28 | |
| Hypothetical (5% return before expenses) | | | $1,000.00 | | | | $1,022.94 | | | | $2.29 | |
| * | Expenses are equal to the Fund’s annualized expense ratio (after waiver/reimbursement): 0.70%, 1.45% and 0.45% for Class A, C and Y, respectively, multiplied by the average account value over the period, multiplied by the number of days in the most recent fiscal half-year (184), divided by 365 (to reflect the half-year period). |
| | | | | | | | | | | | |
| NATIXIS OAKMARK FUND | | BEGINNING
ACCOUNT VALUE
7/1/2017 | | | ENDING
ACCOUNT VALUE
12/31/2017 | | | EXPENSES PAID
DURING PERIOD*
7/1/2017 – 12/31/2017 | |
Class A | | | | | | | | | | | | |
Actual | | | $1,000.00 | | | | $1,118.50 | | | | $6.19 | |
Hypothetical (5% return before expenses) | | | $1,000.00 | | | | $1,019.36 | | | | $5.90 | |
Class C | | | | | | | | | | | | |
Actual | | | $1,000.00 | | | | $1,113.90 | | | | $10.18 | |
Hypothetical (5% return before expenses) | | | $1,000.00 | | | | $1,015.58 | | | | $9.70 | |
Class N | | | | | | | | | | | | |
Actual | | | $1,000.00 | | | | $1,120.70 | | | | $3.74 | |
Hypothetical (5% return before expenses) | | | $1,000.00 | | | | $1,021.68 | | | | $3.57 | |
Class Y | | | | | | | | | | | | |
Actual | | | $1,000.00 | | | | $1,119.70 | | | | $4.86 | |
Hypothetical (5% return before expenses) | | | $1,000.00 | | | | $1,020.62 | | | | $4.63 | |
| * | Expenses are equal to the Fund’s annualized expense ratio (after waiver/reimbursement): 1.16%, 1.91%, 0.70% and 0.91% for Class A, C, N and Y, respectively, multiplied by the average account value over the period, multiplied by the number of days in the most recent fiscal half-year (184), divided by 365 (to reflect the half-year period). |
27 |
| | | | | | | | | | | | |
NATIXIS OAKMARK INTERNATIONAL
FUND | | BEGINNING
ACCOUNT VALUE
7/1/2017 | | | ENDING
ACCOUNT VALUE
12/31/2017 | | | EXPENSES PAID
DURING PERIOD*
7/1/2017 – 12/31/2017 | |
Class A | | | | | | | | | | | | |
Actual | | | $1,000.00 | | | | $1,110.10 | | | | $6.97 | |
Hypothetical (5% return before expenses) | | | $1,000.00 | | | | $1,018.60 | | | | $6.67 | |
Class C | | | | | | | | | | | | |
Actual | | | $1,000.00 | | | | $1,105.30 | | | | $10.93 | |
Hypothetical (5% return before expenses) | | | $1,000.00 | | | | $1,014.82 | | | | $10.46 | |
Class N | | | | | | | | | | | | |
Actual | | | $1,000.00 | | | | $1,112.90 | | | | $4.74 | |
Hypothetical (5% return before expenses) | | | $1,000.00 | | | | $1,020.72 | | | | $4.53 | |
Class Y | | | | | | | | | | | | |
Actual | | | $1,000.00 | | | | $1,111.20 | | | | $5.69 | |
Hypothetical (5% return before expenses) | | | $1,000.00 | | | | $1,019.81 | | | | $5.45 | |
| * | Expenses are equal to the Fund’s annualized expense ratio (after waiver/reimbursement): 1.31%, 2.06%, 0.89% and 1.07% for Class A, C, N and Y, respectively, multiplied by the average account value over the period, multiplied by the number of days in the most recent fiscal half-year (184), divided by 365 (to reflect the half-year period). |
| | | | | | | | | | | | |
VAUGHAN NELSON SMALL CAP VALUE
FUND | | BEGINNING ACCOUNT VALUE
7/1/2017 | | | ENDING ACCOUNT VALUE
12/31/2017 | | | EXPENSES PAID DURING PERIOD*
7/1/2017 – 12/31/2017 | |
| Class A | | | | | | | | | | | | |
| Actual | | | $1,000.00 | | | | $1,077.70 | | | | $7.12 | |
| Hypothetical (5% return before expenses) | | | $1,000.00 | | | | $1,018.35 | | | | $6.92 | |
| Class C | | | | | | | | | | | | |
| Actual | | | $1,000.00 | | | | $1,073.20 | | | | $11.03 | |
| Hypothetical (5% return before expenses) | | | $1,000.00 | | | | $1,014.57 | | | | $10.71 | |
| Class N | | | | | | | | | | | | |
| Actual | | | $1,000.00 | | | | $1,080.00 | | | | $4.77 | |
| Hypothetical (5% return before expenses) | | | $1,000.00 | | | | $1,020.62 | | | | $4.63 | |
| Class Y | | | | | | | | | | | | |
| Actual | | | $1,000.00 | | | | $1,078.90 | | | | $5.82 | |
| Hypothetical (5% return before expenses) | | | $1,000.00 | | | | $1,019.61 | | | | $5.65 | |
| * | Expenses are equal to the Fund’s annualized expense ratio (after waiver/reimbursement): 1.36%, 2.11%, 0.91% and 1.11% for Class A, C, N and Y, respectively, multiplied by the average account value over the period, multiplied by the number of days in the most recent fiscal half-year (184), divided by 365 (to reflect the half-year period). |
| 28
| | | | | | | | | | | | |
VAUGHAN NELSON VALUE
OPPORTUNITY FUND | | BEGINNING
ACCOUNT VALUE
7/1/2017 | | | ENDING
ACCOUNT VALUE
12/31/2017 | | | EXPENSES PAID
DURING PERIOD*
7/1/2017 – 12/31/2017 | |
| Class A | | | | | | | | | | | | |
| Actual | | | $1,000.00 | | | | $1,087.40 | | | | $6.42 | |
| Hypothetical (5% return before expenses) | | | $1,000.00 | | | | $1,019.06 | | | | $6.21 | |
| Class C | | | | | | | | | | | | |
| Actual | | | $1,000.00 | | | | $1,083.40 | | | | $10.35 | |
| Hypothetical (5% return before expenses) | | | $1,000.00 | | | | $1,015.28 | | | | $10.01 | |
| Class N | | | | | | | | | | | | |
| Actual | | | $1,000.00 | | | | $1,089.00 | | | | $4.69 | |
| Hypothetical (5% return before expenses) | | | $1,000.00 | | | | $1,020.72 | | | | $4.53 | |
| Class Y | | | | | | | | | | | | |
| Actual | | | $1,000.00 | | | | $1,088.40 | | | | $5.11 | |
| Hypothetical (5% return before expenses) | | | $1,000.00 | | | | $1,020.32 | | | | $4.94 | |
| * | Expenses are equal to the Fund’s annualized expense ratio: 1.22%, 1.97%, 0.89% and 0.97% for Class A, C, N and Y, respectively, multiplied by the average account value over the period, multiplied by the number of days in the most recent fiscal half-year (184), divided by 365 (to reflect the half-year period). |
29 |
Portfolio of Investments – as of December 31, 2017
McDonnell Intermediate Municipal Bond Fund
| | | | | | | | |
Principal
Amount | | | Description | | Value (†) | |
| | Bonds and Notes — 93.7% of Net Assets | |
| | Municipals — 93.7% | |
| | | | Alabama — 1.4% | | | | |
| $ | 500,000 | | | UAB Medicine Finance Authority Revenue, UAB Medicine Obligated Group, Series B-2, 3.500%, 9/01/2035 | | $ | 505,465 | |
| | | | | | | | |
| | | | California — 14.7% | | | | |
| | 380,000 | | | Bay Area Water Supply & Conservation Agency Revenue, Series A, 5.000%, 10/01/2024 | | | 442,863 | |
| | 1,000,000 | | | California Municipal Finance Authority Revenue, University of La Verne, Series A, 3.750%, 6/01/2037 | | | 1,057,710 | |
| | 485,000 | | | California School Finance Authority Revenue, Aspire Public Schools Obligated Group, Refunding, 5.000%, 8/01/2027 | | | 550,082 | |
| | 250,000 | | | California Statewide Communities Development Authority Revenue, Beverly Community Hospital Association, 4.000%, 11/01/2032 | | | 260,473 | |
| | 700,000 | | | Garden Grove Unified School District, 2010 Election, GO, Series C, 5.000%, 8/01/2035 | | | 804,720 | |
| | 640,000 | | | Madera Unified School District, Capital Appreciation 2016 Election, GO, 4.500%, 8/01/2029 | | | 449,254 | |
| | 1,000,000 | | | Norman Y. Mineta San Jose International Airport Revenue, Refunding, Series A, AMT, (BAM Insured), 4.000%, 3/01/2042 | | | 1,054,920 | |
| | 760,000 | | | San Gorgonio Memorial Health Care District, GO, Refunding, 5.000%, 8/01/2024 | | | 890,150 | |
| | | | | | | | |
| | | | | | | 5,510,172 | |
| | | | | | | | |
| | | | Colorado — 8.9% | | | | |
| | 1,000,000 | | | Adams & Weld Counties School District No. 27J Brighton, GO, (State Aid Withholding), 5.000%, 12/01/2028 | | | 1,205,490 | |
| | 260,000 | | | Colorado Springs Utilities System Revenue, Series B-2, 5.000%, 11/15/2033 | | | 299,546 | |
| | 400,000 | | | Colorado State Health Facilities Authority Revenue, Craig Hospital Project, 5.000%, 12/01/2028 | | | 445,184 | |
| | 400,000 | | | Denver City & County School District No. 1, GO, Prerefunded 12/01/2022@100, Series B, (State Aid Withholding), 5.000%, 12/01/2026 | | | 459,088 | |
| | 250,000 | | | Denver City & County, Airport System Revenue, Series A, AMT, 5.000%, 11/15/2030 | | | 300,947 | |
| | 500,000 | | | Regional Transportation District Sales Tax Revenue, Fastracks Project, Refunding, Series A, 5.000%, 11/01/2028 | | | 628,180 | |
| | | | | | | | |
| | | | | | | 3,338,435 | |
| | | | | | | | |
| | | | Florida — 15.1% | | | | |
| | 265,000 | | | Broward County FL Airport System Revenue, AMT, 5.000%, 10/01/2026 | | | 320,907 | |
| | 245,000 | | | City of Cape Coral FL Utility Improvement Assessment, Various Areas, Water & Sewer Revenue, (AGM Insured), 3.000%, 9/01/2027 | | | 249,324 | |
| | 100,000 | | | City of Cape Coral FL Utility Improvement Assessment, Various Areas, Water & Sewer Revenue, (AGM Insured), 3.000%, 9/01/2028 | | | 99,816 | |
| | 500,000 | | | Fernandina Beach Utility System Revenue, Refunding, Series A, 5.000%, 9/01/2027 | | | 567,000 | |
| | 400,000 | | | Orlando & Orange County Expressway Authority Revenue, Refunding, 5.000%, 7/01/2023 | | | 453,728 | |
| | 1,000,000 | | | Orlando & Orange County Expressway Authority, Refunding, (AGM Insured), 5.000%, 7/01/2024 | | | 1,133,400 | |
See accompanying notes to financial statements.
| 30
Portfolio of Investments – as of December 31, 2017
McDonnell Intermediate Municipal Bond Fund – (continued)
| | | | | | | | |
Principal
Amount | | | Description | | Value (†) | |
| | | | Florida — continued | | | | |
| $ | 1,000,000 | | | Osceola County Sales Tax Revenue, Refunding, Series A, 5.000%, 10/01/2033 | | $ | 1,174,220 | |
| | 600,000 | | | Sarasota County Infrastructure Sales Surtax Revenue, Refunding, 5.000%, 10/01/2022 | | | 687,804 | |
| | 400,000 | | | Sarasota County Utility System Revenue, 5.000%, 10/01/2023 | | | 471,220 | |
| | 400,000 | | | Volusia County Educational Facility Authority Revenue, Embry-Riddle Aeronautical University, Inc., Series B, 5.000%, 10/15/2025 | | | 471,736 | |
| | | | | | | | |
| | | | | | | 5,629,155 | |
| | | | | | | | |
| | | | Georgia — 0.8% | | | | |
| | 250,000 | | | Savannah Hospital Authority Revenue, St. Joseph’s/Candler Health System Obligated Group, Series A, 5.500%, 7/01/2027 | | | 293,285 | |
| | | | | | | | |
| | | | Illinois — 3.4% | | | | |
| | 540,000 | | | Chicago Midway International Airport Revenue, Second Lien, Refunding, Series A, AMT, 5.000%, 1/01/2031 | | | 614,077 | |
| | 500,000 | | | Illinois Finance Authority Revenue, Loyola University Chicago, Series B, 5.000%, 7/01/2020 | | | 536,700 | |
| | 100,000 | | | Illinois Finance Authority Revenue, Loyola University Chicago, Series B, 5.000%, 7/01/2021 | | | 109,828 | |
| | | | | | | | |
| | | | | | | 1,260,605 | |
| | | | | | | | |
| | | | Iowa — 2.4% | | | | |
| | 335,000 | | | Xenia Rural Water District Revenue, Capital Loan Notes, Refunding, 5.000%, 12/01/2022 | | | 376,440 | |
| | 450,000 | | | Xenia Rural Water District Revenue, Capital Loan Notes, Refunding, 5.000%, 12/01/2023 | | | 513,580 | |
| | | | | | | | |
| | | | | | | 890,020 | |
| | | | | | | | |
| | | | Kansas — 2.1% | | | | |
| | 720,000 | | | Sedgwick County Unified School District No. 265 Goddard, GO, Refunding, Series B, 4.000%, 10/01/2022 | | | 789,646 | |
| | | | | | | | |
| | | | Louisiana — 1.4% | | | | |
| | 200,000 | | | New Orleans Aviation Board, General Airport Revenue, North Terminal Project, Series B, AMT, 5.000%, 1/01/2035 | | | 233,214 | |
| | 250,000 | | | New Orleans Aviation Board, General Airport Revenue, North Terminal Project, Series B, AMT, 5.000%, 1/01/2036 | | | 291,088 | |
| | | | | | | | |
| | | | | | | 524,302 | |
| | | | | | | | |
| | | | Massachusetts — 1.2% | | | | |
| | 400,000 | | | Massachusetts State Development Finance Agency Revenue, Emerson College, Series A, 5.000%, 1/01/2023 | | | 454,728 | |
| | | | | | | | |
| | | | Missouri — 2.2% | | | | |
| | 700,000 | | | Missouri Joint Municipal Electric Utility Commission Power Project Revenue, Refunding, 5.000%, 1/01/2024 | | | 810,362 | |
| | | | | | | | |
| | | | Nebraska — 3.1% | | | | |
| | 1,000,000 | | | Metropolitan Utilities District of Omaha Revenue, System Improvements, Refunding, 5.000%, 12/01/2022 | | | 1,144,690 | |
| | | | | | | | |
See accompanying notes to financial statements.
31 |
Portfolio of Investments – as of December 31, 2017
McDonnell Intermediate Municipal Bond Fund – (continued)
| | | | | | | | |
Principal
Amount | | | Description | | Value (†) | |
| | | | Nevada — 1.6% | | | | |
| $ | 500,000 | | | City of Henderson, GO, Various Purpose, Refunding, 5.000%, 6/01/2026 | | $ | 591,480 | |
| | | | | | | | |
| | | | New Jersey — 3.9% | | | | |
| | 265,000 | | | New Jersey Health Care Facilities Financing Authority Revenue, Refunding, Virtual Health, Inc., 5.000%, 7/01/2023 | | | 306,875 | |
| | 500,000 | | | New Jersey State Turnpike Authority Revenue, Series A, 5.000%, 1/01/2032 | | | 581,010 | |
| | 500,000 | | | Rutgers The State University of New Jersey, Refunding, Series J, 5.000%, 5/01/2024 | | | 577,900 | |
| | | | | | | | |
| | | | | | | 1,465,785 | |
| | | | | | | | |
| | | | New Mexico — 1.6% | | | | |
| | 500,000 | | | New Mexico Hospital Equipment Loan Council Revenue, Presbyterian Healthcare Services Obligated Group, Refunding, 5.000%, 8/01/2031 | | | 583,915 | |
| | | | | | | | |
| | | | New York — 5.6% | | | | |
| | 1,000,000 | | | New York State Transportation Development Corp. Special Facility Revenue, LaGuardia Airport Terminal B Redevelopment Project, AMT, (AGM Insured), Series A, 4.000%, 7/01/2037 | | | 1,054,380 | |
| | 1,000,000 | | | Suffolk County, NY, GO, Series C, 5.000%, 5/01/2019 | | | 1,041,770 | |
| | | | | | | | |
| | | | | | | 2,096,150 | |
| | | | | | | | |
| | | | Ohio — 3.8% | | | | |
| | 250,000 | | | American Municipal Power, Inc. Revenue, Meldahl Hydroelectric Project, Green Bond, Series A, 5.000%, 2/15/2022 | | | 279,178 | |
| | 500,000 | | | Columbus, GO, Various Purpose, Series A, 5.000%, 8/15/2023 | | | 585,390 | |
| | 500,000 | | | Hamilton County Hospital Facilities Revenue, UC Health Obligated Group, 5.000%, 2/01/2024 | | | 574,320 | |
| | | | | | | | |
| | | | | | | 1,438,888 | |
| | | | | | | | |
| | | | Pennsylvania — 0.8% | | | | |
| | 285,000 | | | Delaware River Joint Toll Bridge Commission Revenue, Refunding, Series A, 4.000%, 7/01/2027 | | | 306,840 | |
| | | | | | | | |
| | | | Rhode Island — 1.6% | | | | |
| | 500,000 | | | Rhode Island Clean Water Finance Agency Pollution Control Agency Revolving Fund-Pooled Loan, Series A, 5.000%, 10/01/2024 | | | 586,635 | |
| | | | | | | | |
| | | | South Dakota — 1.6% | | | | |
| | 500,000 | | | South Dakota Health & Educational Facilities Authority, Regional Health System Obligated Group, 5.000%, 9/01/2028 | | | 603,625 | |
| | | | | | | | |
| | | | Tennessee — 3.5% | | | | |
| | 500,000 | | | Metropolitan Government Nashville & Davidson County Health & Educational Facilities Board Revenue, Vanderbilt University Medical Center Obligated Group, Series A, 5.000%, 7/01/2030 | | | 584,290 | |
| | 615,000 | | | Metropolitan Nashville Airport Authority (The) Revenue, Series B, AMT, 5.000%, 7/01/2023 | | | 706,407 | |
| | | | | | | | |
| | | | | | | 1,290,697 | |
| | | | | | | | |
See accompanying notes to financial statements.
| 32
Portfolio of Investments – as of December 31, 2017
McDonnell Intermediate Municipal Bond Fund – (continued)
| | | | | | | | |
Principal
Amount | | | Description | | Value (†) | |
| | | | Texas — 2.3% | | | | |
| $ | 350,000 | | | State of Texas Water Financial Assistance, GO, Series B, 5.000%, 8/01/2022 | | $ | 389,795 | |
| | 400,000 | | | Tarrant County Cultural Education Facilities Finance Corp. Revenue, Methodist Hospitals of Dallas, 5.000%, 10/01/2024 | | | 465,720 | |
| | | | | | | | |
| | | | | | | 855,515 | |
| | | | | | | | |
| | | | Utah — 0.7% | | | | |
| | 250,000 | | | Utah State Transit Authority Sales Tax Revenue, Refunding, 5.000%, 6/15/2024 | | | 281,210 | |
| | | | | | | | |
| | | | Washington — 9.3% | | | | |
| | 1,140,000 | | | Grant County Public Utility District No. 2, Refunding, Priest Rapids Hydroelectric Project, Series B, AMT, 5.000%, 1/01/2025 | | | 1,341,848 | |
| | 500,000 | | | King County Public Hospital District No. 2, GO, Evergreen Healthcare, Series B, 5.000%, 12/01/2032 | | | 578,875 | |
| | 500,000 | | | Port of Seattle Revenue, AMT, 5.000%, 7/01/2029 | | | 558,355 | |
| | 400,000 | | | Port of Seattle Special Facility Revenue, Refunding, AMT, SEATAC Fuel Facility LLC, 5.000%, 6/01/2020 | | | 427,616 | |
| | 500,000 | | | Snohomish County School District No. 15 Edmonds, GO, 5.000%, 12/01/2031 | | | 580,680 | |
| | | | | | | | |
| | | | | | | 3,487,374 | |
| | | | | | | | |
| | | | Wisconsin — 0.7% | | | | |
| | 225,000 | | | Wisconsin Health & Educational Facilities Authority Revenue, Aspirus, Inc. Obligated Group, Refunding, Series A, 5.000%, 8/15/2031 | | | 260,188 | |
| | | | | | | | |
| | | | Total Bonds and Notes
(Identified Cost $33,762,997) | | | 34,999,167 | |
| | | | | | | | |
| | | | | | | | |
| Shares | | | | | | |
| | Exchange-Traded Funds — 1.4% | |
| | 5,000 | | | SPDR® Nuveen S&P High Yield Municipal Bond ETF | | | 278,300 | |
| | 10,000 | | | VanEck Vectors® Short High-Yield Municipal Index ETF | | | 241,900 | |
| | | | | | | | |
| | | | Total Exchange-Traded Funds
(Identified Cost $532,053) | | | 520,200 | |
| | | | | | | | |
| | | | | | | | |
Principal
Amount | | | | | | |
| | Short-Term Investments — 5.3% | |
| $ | 1,996,061 | | | Tri-Party Repurchase Agreement with Fixed Income Clearing Corporation, dated 12/29/2017 at 0.540% to be repurchased at $1,996,181 on 1/02/2018 collateralized by $2,025,000 U.S. Treasury Note, 2.250% due 1/31/2024 valued at $2,036,115 including accrued interest (Note 2 of Notes to Financial Statements)
(Identified Cost $1,996,061) | | | 1,996,061 | |
| | | | | | | | |
| | | | | | | | |
| | | | Total Investments — 100.4%
(Identified Cost $36,291,111) | | | 37,515,428 | |
| | | | Other assets less liabilities — (0.4)% | | | (156,746 | ) |
| | | | | | | | |
| | | | Net Assets — 100.0% | | $ | 37,358,682 | |
| | | | | | | | |
See accompanying notes to financial statements.
33 |
Portfolio of Investments – as of December 31, 2017
McDonnell Intermediate Municipal Bond Fund – (continued)
| | | | | | | | |
| | | | | | | | |
| | (†) | | | See Note 2 of Notes to Financial Statements. | |
| | | | | | | | |
| | AGM | | | Assured Guaranty Municipal Corporation | |
| | AMT | | | Alternative Minimum Tax | |
| | BAM | | | Build America Mutual | | | | |
| | ETF | | | Exchange-Traded Fund | | | | |
| | GO | | | General Obligation | | | | |
| | SPDR | | | Standard & Poor’s Depositary Receipt | | | | |
Holdings Summary at December 31, 2017
| | | | |
Medical | | | 13.2 | % |
Airport | | | 12.3 | |
Water | | | 12.1 | |
School District | | | 11.4 | |
General Obligation | | | 10.9 | |
General | | | 8.8 | |
Higher Education | | | 8.5 | |
Transportation | | | 7.7 | |
Utilities | | | 4.4 | |
Power | | | 2.9 | |
Education | | | 1.5 | |
Exchange-Traded Funds | | | 1.4 | |
Short-Term Investments | | | 5.3 | |
| | | | |
Total Investments | | | 100.4 | |
Other assets less liabilities | | | (0.4 | ) |
| | | | |
Net Assets | | | 100.0 | % |
| | | | |
See accompanying notes to financial statements.
| 34
Portfolio of Investments – as of December 31, 2017
Natixis Oakmark Fund
| | | | | | | | |
| Shares | | | Description | | Value (†) | |
| | Common Stocks — 94.4% of Net Assets | |
| | | | Air Freight & Logistics — 1.8% | | | | |
| | 22,265 | | | FedEx Corp. | | $ | 5,556,008 | |
| | | | | | | | |
| | | | Airlines — 0.5% | | | | |
| | 31,916 | | | American Airlines Group, Inc. | | | 1,660,589 | |
| | | | | | | | |
| | | | Auto Components — 1.1% | | | | |
| | 34,400 | | | Aptiv PLC | | | 2,918,152 | |
| | 11,466 | | | Delphi Technologies PLC(a) | | | 601,621 | |
| | | | | | | | |
| | | | | | | 3,519,773 | |
| | | | | | | | |
| | | | Automobiles — 4.4% | | | | |
| | 364,300 | | | Fiat Chrysler Automobiles NV | | | 6,499,112 | |
| | 109,000 | | | General Motors Co. | | | 4,467,910 | |
| | 54,600 | | | Harley-Davidson, Inc. | | | 2,778,048 | |
| | | | | | | | |
| | | | | | | 13,745,070 | |
| | | | | | | | |
| | | | Banks — 8.8% | | | | |
| | 294,500 | | | Bank of America Corp. | | | 8,693,640 | |
| | 147,100 | | | Citigroup, Inc. | | | 10,945,711 | |
| | 13,300 | | | JPMorgan Chase & Co. | | | 1,422,302 | |
| | 113,645 | | | Wells Fargo & Co. | | | 6,894,842 | |
| | | | | | | | |
| | | | | | | 27,956,495 | |
| | | | | | | | |
| | | | Beverages — 2.3% | | | | |
| | 49,470 | | | Diageo PLC, Sponsored ADR | | | 7,224,104 | |
| | | | | | | | |
| | | | Capital Markets — 6.5% | | | | |
| | 100,400 | | | Bank of New York Mellon Corp. (The) | | | 5,407,544 | |
| | 17,540 | | | Goldman Sachs Group, Inc. (The) | | | 4,468,490 | |
| | 23,945 | | | Moody’s Corp. | | | 3,534,522 | |
| | 74,000 | | | State Street Corp. | | | 7,223,140 | |
| | | | | | | | |
| | | | | | | 20,633,696 | |
| | | | | | | | |
| | | | Consumer Finance — 5.1% | | | | |
| | 275,100 | | | Ally Financial, Inc. | | | 8,021,916 | |
| | 80,765 | | | Capital One Financial Corp. | | | 8,042,579 | |
| | | | | | | | |
| | | | | | | 16,064,495 | |
| | | | | | | | |
| | | | Electronic Equipment, Instruments & Components — 2.4% | | | | |
| | 79,000 | | | TE Connectivity Ltd. | | | 7,508,160 | |
| | | | | | | | |
| | | | Energy Equipment & Services — 1.0% | | | | |
| | 86,100 | | | National Oilwell Varco, Inc. | | | 3,101,322 | |
| | | | | | | | |
| | | | Food & Staples Retailing — 1.0% | | | | |
| | 43,400 | | | CVS Health Corp. | | | 3,146,500 | |
| | | | | | | | |
| | | | Food Products — 2.0% | | | | |
| | 72,990 | | | Nestle S.A., Sponsored ADR | | | 6,274,950 | |
| | | | | | | | |
| | | | Health Care Equipment & Supplies — 3.0% | | | | |
| | 84,700 | | | Baxter International, Inc. | | | 5,475,008 | |
| | 51,230 | | | Medtronic PLC | | | 4,136,822 | |
| | | | | | | | |
| | | | | | | 9,611,830 | |
| | | | | | | | |
See accompanying notes to financial statements.
35 |
Portfolio of Investments – as of December 31, 2017
Natixis Oakmark Fund – (continued)
| | | | | | | | |
| Shares | | | Description | | Value (†) | |
| | | | Health Care Providers & Services — 3.6% | | | | |
| | 69,400 | | | HCA Healthcare, Inc.(a) | | $ | 6,096,096 | |
| | 24,095 | | | UnitedHealth Group, Inc. | | | 5,311,984 | |
| | | | | | | | |
| | | | | | | 11,408,080 | |
| | | | | | | | |
| | | | Hotels, Restaurants & Leisure — 1.6% | | | | |
| | 150,400 | | | MGM Resorts International | | | 5,021,856 | |
| | | | | | | | |
| | | | Household Durables — 0.6% | | | | |
| | 12,140 | | | Whirlpool Corp. | | | 2,047,290 | |
| | | | | | | | |
| | | | Industrial Conglomerates — 1.8% | | | | |
| | 320,800 | | | General Electric Co. | | | 5,597,960 | |
| | | | | | | | |
| | | | Insurance — 6.1% | | | | |
| | 67,000 | | | Aflac, Inc. | | | 5,881,260 | |
| | 131,045 | | | American International Group, Inc. | | | 7,807,661 | |
| | 41,375 | | | Aon PLC | | | 5,544,250 | |
| | | | | | | | |
| | | | | | | 19,233,171 | |
| | | | | | | | |
| | | | Internet & Direct Marketing Retail — 4.0% | | | | |
| | 195,500 | | | Liberty Interactive Corp./QVC Group, Class A(a) | | | 4,774,110 | |
| | 24,800 | | | Netflix, Inc.(a) | | | 4,760,608 | |
| | 1,760 | | | Priceline Group, Inc. (The)(a) | | | 3,058,422 | |
| | | | | | | | |
| | | | | | | 12,593,140 | |
| | | | | | | | |
| | | | Internet Software & Services — 3.4% | | | | |
| | 10,240 | | | Alphabet, Inc., Class A(a) | | | 10,786,816 | |
| | | | | | | | |
| | | | IT Services — 6.5% | | | | |
| | 53,400 | | | Automatic Data Processing, Inc. | | | 6,257,946 | |
| | 49,775 | | | MasterCard, Inc., Class A | | | 7,533,944 | |
| | 59,600 | | | Visa, Inc., Class A | | | 6,795,592 | |
| | | | | | | | |
| | | | | | | 20,587,482 | |
| | | | | | | | |
| | | | Machinery — 6.3% | | | | |
| | 48,810 | | | Caterpillar, Inc. | | | 7,691,480 | |
| | 25,100 | | | Cummins, Inc. | | | 4,433,664 | |
| | 39,020 | | | Parker Hannifin Corp. | | | 7,787,611 | |
| | | | | | | | |
| | | | | | | 19,912,755 | |
| | | | | | | | |
| | | | Media — 5.5% | | | | |
| | 19,300 | | | Charter Communications, Inc., Class A(a) | | | 6,484,028 | |
| | 167,600 | | | Comcast Corp., Class A | | | 6,712,380 | |
| | 262,800 | | | News Corp., Class A | | | 4,259,988 | |
| | | | | | | | |
| | | | | | | 17,456,396 | |
| | | | | | | | |
| | | | Oil, Gas & Consumable Fuels — 3.6% | | | | |
| | 81,000 | | | Anadarko Petroleum Corp. | | | 4,344,840 | |
| | 137,000 | | | Apache Corp. | | | 5,784,140 | |
| | 315,100 | | | Chesapeake Energy Corp.(a) | | | 1,247,796 | |
| | | | | | | | |
| | | | | | | 11,376,776 | |
| | | | | | | | |
| | | | Personal Products — 1.9% | | | | |
| | 109,575 | | | Unilever PLC, Sponsored ADR | | | 6,063,881 | |
| | | | | | | | |
See accompanying notes to financial statements.
| 36
Portfolio of Investments – as of December 31, 2017
Natixis Oakmark Fund – (continued)
| | | | | | | | |
| Shares | | | Description | | Value (†) | |
| | | | Semiconductors & Semiconductor Equipment — 4.5% | | | | |
| | 162,700 | | | Intel Corp. | | $ | 7,510,232 | |
| | 65,600 | | | Texas Instruments, Inc. | | | 6,851,264 | |
| | | | | | | | |
| | | | | | | 14,361,496 | |
| | | | | | | | |
| | | | Software — 2.1% | | | | |
| | 139,200 | | | Oracle Corp. | | | 6,581,376 | |
| | | | | | | | |
| | | | Specialty Retail — 0.4% | | | | |
| | 26,130 | | | AutoNation, Inc.(a) | | | 1,341,253 | |
| | | | | | | | |
| | | | Technology Hardware, Storage & Peripherals — 2.6% | | | | |
| | 47,750 | | | Apple, Inc. | | | 8,080,733 | |
| | | | | | | | |
| | | | Total Common Stocks
(Identified Cost $218,617,091) | | | 298,453,453 | |
| | | | | | | | |
| | | | | | | | |
Principal
Amount | | | | | | |
| | Short-Term Investments — 5.6% | |
| $ | 17,572,534 | | | Tri-Party Repurchase Agreement with Fixed Income Clearing Corporation, dated 12/29/2017 at 0.540% to be repurchased at $17,573,588 on 1/02/2018 collateralized by $17,830,000 U.S. Treasury Note, 2.250% due 1/31/2024 valued at $17,927,869 including accrued interest (Note 2 of Notes to Financial Statements) (Identified Cost $17,572,534) | | | 17,572,534 | |
| | | | | | | | |
| | | | | | | | |
| | | | Total Investments — 100.0%
(Identified Cost $236,189,625) | | | 316,025,987 | |
| | | | Other assets less liabilities — (0.0)% | | | (6,337 | ) |
| | | | | | | | |
| | | | Net Assets — 100.0% | | $ | 316,019,650 | |
| | | | | | | | |
| | | | | | | | |
| | (†) | | | See Note 2 of Notes to Financial Statements. | | | | |
| | (a) | | | Non-income producing security. | | | | |
| | | | | | | | |
| | ADR | | | An American Depositary Receipt is a certificate issued by a custodian bank representing the right to receive securities of the foreign issuer described. The values of ADRs may be significantly influenced by trading on exchanges not located in the United States. | |
See accompanying notes to financial statements.
37 |
Portfolio of Investments – as of December 31, 2017
Natixis Oakmark Fund – (continued)
Industry Summary at December 31, 2017
| | | | |
Banks | | | 8.8 | % |
Capital Markets | | | 6.5 | |
IT Services | | | 6.5 | |
Machinery | | | 6.3 | |
Insurance | | | 6.1 | |
Media | | | 5.5 | |
Consumer Finance | | | 5.1 | |
Semiconductors & Semiconductor Equipment | | | 4.5 | |
Automobiles | | | 4.4 | |
Internet & Direct Marketing Retail | | | 4.0 | |
Health Care Providers & Services | | | 3.6 | |
Oil, Gas & Consumable Fuels | | | 3.6 | |
Internet Software & Services | | | 3.4 | |
Health Care Equipment & Supplies | | | 3.0 | |
Technology Hardware, Storage & Peripherals | | | 2.6 | |
Electronic Equipment, Instruments & Components | | | 2.4 | |
Beverages | | | 2.3 | |
Software | | | 2.1 | |
Food Products | | | 2.0 | |
Other Investments, less than 2% each | | | 11.7 | |
Short-Term Investments | | | 5.6 | |
| | | | |
Total Investments | | | 100.0 | |
Other assets less liabilities | | | (0.0 | ) |
| | | | |
Net Assets | | | 100.0 | % |
| | | | |
See accompanying notes to financial statements.
| 38
Portfolio of Investments – as of December 31, 2017
Natixis Oakmark International Fund
| | | | | | | | |
Shares | | | Description | | Value (†) | |
| | Common Stocks — 94.9% of Net Assets | |
| | | | Australia — 2.9% | | | | |
| | 5,075,168 | | | AMP Ltd. | | $ | 20,485,936 | |
| | 929,254 | | | Orica Ltd. | | | 13,064,376 | |
| | | | | | | | |
| | | | | | | 33,550,312 | |
| | | | | | | | |
| | | | China — 1.1% | | | | |
| | 52,870 | | | Baidu, Inc., Sponsored ADR(a) | | | 12,382,683 | |
| | | | | | | | |
| | | | France — 14.0% | | | | |
| | 700,000 | | | BNP Paribas S.A.(b) | | | 52,071,999 | |
| | 553,600 | | | Bureau Veritas S.A. | | | 15,120,315 | |
| | 156,065 | | | Danone | | | 13,076,812 | |
| | 2,380 | | | Kering | | | 1,120,330 | |
| | 80,690 | | | Pernod-Ricard S.A. | | | 12,761,513 | |
| | 351,967 | | | Publicis Groupe S.A. | | | 23,858,854 | |
| | 164,900 | | | Safran S.A. | | | 17,008,699 | |
| | 25,100 | | | Sanofi | | | 2,160,908 | |
| | 300,800 | | | Valeo S.A. | | | 22,406,824 | |
| | | | | | | | |
| | | | | | | 159,586,254 | |
| | | | | | | | |
| | | | Germany — 14.8% | | | | |
| | 167,000 | | | Allianz SE, (Registered) | | | 38,217,564 | |
| | 465,100 | | | Bayerische Motoren Werke AG | | | 48,222,548 | |
| | 101,850 | | | Continental AG | | | 27,385,410 | |
| | 656,500 | | | Daimler AG, (Registered) | | | 55,513,924 | |
| | | | | | | | |
| | | | | | | 169,339,446 | |
| | | | | | | | |
| | | | India — 1.1% | | | | |
| | 747,600 | | | Infosys Ltd., Sponsored ADR | | | 12,126,072 | |
| | | | | | | | |
| | | | Indonesia — 1.8% | | | | |
| | 34,324,000 | | | Bank Mandiri Persero Tbk PT | | | 20,211,894 | |
| | | | | | | | |
| | | | Italy — 3.7% | | | | |
| | 12,898,800 | | | Intesa Sanpaolo SpA | | | 42,796,357 | |
| | | | | | | | |
| | | | Japan — 4.7% | | | | |
| | 32,100 | | | Komatsu Ltd. | | | 1,160,085 | |
| | 329,300 | | | Olympus Corp. | | | 12,597,363 | |
| | 617,000 | | | Toyota Motor Corp. | | | 39,321,380 | |
| | | | | | | | |
| | | | | | | 53,078,828 | |
| | | | | | | | |
| | | | Korea — 0.1% | | | | |
| | 640 | | | Samsung Electronics Co. Ltd. | | | 1,520,583 | |
| | | | | | | | |
| | | | Mexico — 1.3% | | | | |
| | 796,100 | | | Grupo Televisa SAB, Sponsored ADR | | | 14,863,187 | |
| | | | | | | | |
| | | | Netherlands — 3.7% | | | | |
| | 50,731 | | | Akzo Nobel NV | | | 4,451,397 | |
| | 60,530 | | | ASML Holding NV | | | 10,523,638 | |
| | 336,782 | | | EXOR NV | | | 20,645,451 | |
| | 183,839 | | | Koninklijke Philips NV | | | 6,941,509 | |
| | | | | | | | |
| | | | | | | 42,561,995 | |
| | | | | | | | |
See accompanying notes to financial statements.
39 |
Portfolio of Investments – as of December 31, 2017
Natixis Oakmark International Fund – (continued)
| | | | | | | | |
Shares | | | Description | | Value (†) | |
| | | | Sweden — 5.6% | | | | |
| | 2,065,300 | | | Hennes & Mauritz AB, B Shares | | $ | 42,718,336 | |
| | 705,300 | | | SKF AB, B Shares | | | 15,668,774 | |
| | 272,500 | | | Volvo AB, B Shares | | | 5,074,461 | |
| | | | | | | | |
| | | | | | | 63,461,571 | |
| | | | | | | | |
| | | | Switzerland — 14.8% | | | | |
| | 192,100 | | | Cie Financiere Richemont S.A., (Registered) | | | 17,398,079 | |
| | 2,505,436 | | | Credit Suisse Group AG, (Registered)(b) | | | 44,686,228 | |
| | 10,138,900 | | | Glencore PLC(b) | | | 53,066,620 | |
| | 56,750 | | | Kuehne & Nagel International AG | | | 10,040,165 | |
| | 522,395 | | | LafargeHolcim Ltd., (Registered) | | | 29,422,236 | |
| | 35,800 | | | Nestle S.A., (Registered) | | | 3,077,950 | |
| | 26,805 | | | Swatch Group AG (The) | | | 10,914,403 | |
| | | | | | | | |
| | | | | | | 168,605,681 | |
| | | | | | | | |
| | | | Taiwan — 0.3% | | | | |
| | 392,000 | | | Taiwan Semiconductor Manufacturing Co. Ltd. | | | 3,001,572 | |
| | | | | | | | |
| | | | United Kingdom — 23.1% | | | | |
| | 417,800 | | | Ashtead Group PLC | | | 11,206,011 | |
| | 2,764,800 | | | CNH Industrial NV | | | 36,988,952 | |
| | 431,900 | | | Diageo PLC | | | 15,831,025 | |
| | 676,531 | | | Experian PLC | | | 14,912,570 | |
| | 47,000 | | | Ferguson PLC | | | 3,372,904 | |
| | 2,568,000 | | | G4S PLC | | | 9,242,457 | |
| | 273,400 | | | Liberty Global PLC, Class A(a) | | | 9,798,656 | |
| | 615,600 | | | Liberty Global PLC, Series C(a) | | | 20,831,904 | |
| | 63,233,100 | | | Lloyds Banking Group PLC | | | 57,983,610 | |
| | 1,260,004 | | | Meggitt PLC | | | 8,181,654 | |
| | 6,041,100 | | | Royal Bank of Scotland Group PLC(a) | | | 22,652,848 | |
| | 446,989 | | | Schroders PLC | | | 21,158,781 | |
| | 100 | | | Schroders PLC, (Non Voting) | | | 3,376 | |
| | 340,800 | | | Smiths Group PLC | | | 6,839,682 | |
| | 1,344,400 | | | WPP PLC | | | 24,287,587 | |
| | | | | | | | |
| | | | | | | 263,292,017 | |
| | | | | | | | |
| | | | United States — 1.9% | | | | |
| | 145,492 | | | Willis Towers Watson PLC | | | 21,924,189 | |
| | | | | | | | |
| | | | Total Common Stocks
(Identified Cost $924,694,347) | | | 1,082,302,641 | |
| | | | | | | | |
See accompanying notes to financial statements.
| 40
Portfolio of Investments – as of December 31, 2017
Natixis Oakmark International Fund – (continued)
| | | | | | | | |
Principal
Amount | | | Description | | Value (†) | |
| | Short-Term Investments — 5.2% | |
| $ | 58,993,933 | | | Tri-Party Repurchase Agreement with Fixed Income Clearing Corporation, dated 12/29/2017 at 0.540% to be repurchased at $58,997,472 on 1/02/2018 collateralized by $59,850,000 U.S. Treasury Note, 2.250% due 1/31/2024 valued at $60,178,517 including accrued interest (Note 2 of Notes to Financial Statements) (Identified Cost $58,993,933) | | $ | 58,993,933 | |
| | | | | | | | |
| | | | | | | | |
| | | | Total Investments — 100.1%
(Identified Cost $983,688,280) | | | 1,141,296,574 | |
| | | | Other assets less liabilities — (0.1)% | | | (1,311,101 | ) |
| | | | | | | | |
| | | | Net Assets — 100.0% | | $ | 1,139,985,473 | |
| | | | | | | | |
| | | | | | | | |
| | (†) | | | See Note 2 of Notes to Financial Statements. | | | | |
| | (a) | | | Non-income producing security. | | | | |
| | (b) | | | Security (or a portion thereof) has been designated to cover the Fund’s obligations under open derivative contracts. | |
| | | | | | | | |
| | ADR | | | An American Depositary Receipt is a certificate issued by a custodian bank representing the right to receive securities of the foreign issuer described. The values of ADRs may be significantly influenced by trading on exchanges not located in the United States. | |
| | | | | | | | |
| | CHF | | | Swiss Franc | | | | |
At December 31, 2017, the Fund had the following open forward foreign currency contracts:
| | | | | | | | | | | | | | | | | | | | | | | | | | |
| Counterparty | | Delivery
Date | | | Currency
Bought/
Sold (B/S) | | | Units
of
Currency | | | In
Exchange
for
| | | Notional
Value | | | Unrealized
Appreciation
(Depreciation) | |
| State Street Bank and Trust Company | | | 3/21/2018 | | | CHF | | | S | | | | 15,751,000 | | | $ | 16,592,068 | | | $ | 16,253,269 | | | $ | 338,799 | |
| | | | | | | | | | | | | | | | | | | | | | | | | | |
See accompanying notes to financial statements.
41 |
Portfolio of Investments – as of December 31, 2017
Natixis Oakmark International Fund – (continued)
Industry Summary at December 31, 2017
| | | | |
Banks | | | 17.2 | % |
Automobiles | | | 12.6 | |
Media | | | 8.2 | |
Capital Markets | | | 5.8 | |
Insurance | | | 5.2 | |
Machinery | | | 5.1 | |
Metals & Mining | | | 4.6 | |
Auto Components | | | 4.4 | |
Specialty Retail | | | 3.8 | |
Diversified Financial Services | | | 3.6 | |
Professional Services | | | 2.6 | |
Textiles, Apparel & Luxury Goods | | | 2.6 | |
Construction Materials | | | 2.6 | |
Beverages | | | 2.5 | |
Aerospace & Defense | | | 2.2 | |
Other Investments, less than 2% each | | | 11.9 | |
Short-Term Investments | | | 5.2 | |
| | | | |
Total Investments | | | 100.1 | |
Other assets less liabilities (including forward foreign currency contracts) | | | (0.1 | ) |
| | | | |
Net Assets | | | 100.0 | % |
| | | | |
Currency Exposure Summary at December 31, 2017
| | | | |
Euro | | | 39.4 | % |
British Pound | | | 21.8 | |
United States Dollar | | | 13.3 | |
Swiss Franc | | | 10.2 | |
Swedish Krona | | | 5.6 | |
Japanese Yen | | | 4.7 | |
Australian Dollar | | | 2.9 | |
Other, less than 2% each | | | 2.2 | |
| | | | |
Total Investments | | | 100.1 | |
Other assets less liabilities (including forward foreign currency contracts) | | | (0.1 | ) |
| | | | |
Net Assets | | | 100.0 | % |
| | | | |
See accompanying notes to financial statements.
| 42
Portfolio of Investments – as of December 31, 2017
Vaughan Nelson Small Cap Value Fund
| | | | | | | | |
| Shares | | | Description | | Value (†) | |
| | Common Stocks — 96.4% of Net Assets | | | | |
| | | | Aerospace & Defense — 2.4% | | | | |
| | 55,725 | | | AAR Corp. | | $ | 2,189,435 | |
| | 20,175 | | | Curtiss-Wright Corp. | | | 2,458,324 | |
| | 26,225 | | | Moog, Inc., Class A(a) | | | 2,277,641 | |
| | | | | | | | |
| | | | | | | 6,925,400 | |
| | | | | | | | |
| | | | Auto Components — 0.5% | | | | |
| | 10,700 | | | Cooper-Standard Holdings, Inc.(a) | | | 1,310,750 | |
| | | | | | | | |
| | | | Banks — 16.8% | | | | |
| | 111,875 | | | Chemical Financial Corp. | | | 5,981,956 | |
| | 33,425 | | | Community Trust Bancorp, Inc. | | | 1,574,318 | |
| | 223,800 | | | F.N.B. Corp. | | | 3,092,916 | |
| | 221,150 | | | First Financial Bancorp | | | 5,827,302 | |
| | 134,275 | | | First Merchants Corp. | | | 5,647,606 | |
| | 210,050 | | | Investors Bancorp, Inc. | | | 2,915,494 | |
| | 63,700 | | | Lakeland Financial Corp. | | | 3,088,813 | |
| | 100,950 | | | Pacific Premier Bancorp, Inc.(a) | | | 4,038,000 | |
| | 73,172 | | | Pinnacle Financial Partners, Inc. | | | 4,851,304 | |
| | 23,375 | | | Prosperity Bancshares, Inc. | | | 1,637,886 | |
| | 153,500 | | | Union Bankshares Corp. | | | 5,552,095 | |
| | 138,225 | | | United Community Banks, Inc. | | | 3,889,652 | |
| | | | | | | | |
| | | | | | | 48,097,342 | |
| | | | | | | | |
| | | | Building Products — 2.9% | | | | |
| | 21,725 | | | American Woodmark Corp.(a) | | | 2,829,681 | |
| | 48,300 | | | Masonite International Corp.(a) | | | 3,581,445 | |
| | 33,875 | | | Simpson Manufacturing Co., Inc. | | | 1,944,764 | |
| | | | | | | | |
| | | | | | | 8,355,890 | |
| | | | | | | | |
| | | | Capital Markets — 0.9% | | | | |
| | 43,700 | | | LPL Financial Holdings, Inc. | | | 2,497,018 | |
| | | | | | | | |
| | | | Chemicals — 1.4% | | | | |
| | 40,675 | | | Minerals Technologies, Inc. | | | 2,800,474 | |
| | 61,375 | | | Tronox Ltd., Class A | | | 1,258,801 | |
| | | | | | | | |
| | | | | | | 4,059,275 | |
| | | | | | | | |
| | | | Commercial Services & Supplies — 5.9% | | | | |
| | 105,700 | | | ABM Industries, Inc. | | | 3,987,004 | |
| | 56,225 | | | Brink’s Co. (The) | | | 4,424,907 | |
| | 24,525 | | | Casella Waste Systems, Inc., Class A(a) | | | 564,566 | |
| | 76,100 | | | KAR Auction Services, Inc. | | | 3,843,811 | |
| | 55,075 | | | Multi-Color Corp. | | | 4,122,364 | |
| | | | | | | | |
| | | | | | | 16,942,652 | |
| | | | | | | | |
| | | | Construction Materials — 1.1% | | | | |
| | 99,466 | | | Summit Materials, Inc., Class A(a) | | | 3,127,209 | |
| | | | | | | | |
| | | | Consumer Finance — 1.9% | | | | |
| | 80,375 | | | FirstCash, Inc. | | | 5,421,294 | |
| | | | | | | | |
See accompanying notes to financial statements.
43 |
Portfolio of Investments – as of December 31, 2017
Vaughan Nelson Small Cap Value Fund – (continued)
| | | | | | | | |
| Shares | | | Description | | Value (†) | |
| | | | Containers & Packaging — 3.5% | | | | |
| | 90,150 | | | Berry Global Group, Inc.(a) | | $ | 5,289,100 | |
| | 311,750 | | | Graphic Packaging Holding Co. | | | 4,816,538 | |
| | | | | | | | |
| | | | | | | 10,105,638 | |
| | | | | | | | |
| | | | Electronic Equipment, Instruments & Components — 4.4% | | | | |
| | 77,900 | | | Fabrinet(a) | | | 2,235,730 | |
| | 23,075 | | | Littelfuse, Inc. | | | 4,564,697 | |
| | 42,175 | | | Plexus Corp.(a) | | | 2,560,866 | |
| | 32,700 | | | Zebra Technologies Corp., Class A(a) | | | 3,394,260 | |
| | | | | | | | |
| | | | | | | 12,755,553 | |
| | | | | | | | |
| | | | Energy Equipment & Services — 1.3% | | | | |
| | 158,900 | | | Forum Energy Technologies, Inc.(a) | | | 2,470,895 | |
| | 34,600 | | | U.S. Silica Holdings, Inc. | | | 1,126,576 | |
| | | | | | | | |
| | | | | | | 3,597,471 | |
| | | | | | | | |
| | | | Gas Utilities — 1.6% | | | | |
| | 62,475 | | | Spire, Inc. | | | 4,694,996 | |
| | | | | | | | |
| | | | Health Care Equipment & Supplies — 2.1% | | | | |
| | 41,600 | | | Integra LifeSciences Holdings Corp.(a) | | | 1,990,976 | |
| | 50,500 | | | LivaNova PLC(a) | | | 4,035,960 | |
| | | | | | | | |
| | | | | | | 6,026,936 | |
| | | | | | | | |
| | | | Health Care Providers & Services — 1.7% | | | | |
| | 66,400 | | | AMN Healthcare Services, Inc.(a) | | | 3,270,200 | |
| | 43,425 | | | Envision Healthcare Corp.(a) | | | 1,500,768 | |
| | | | | | | | |
| | | | | | | 4,770,968 | |
| | | | | | | | |
| | | | Health Care Technology — 0.8% | | | | |
| | 69,175 | | | Cotiviti Holdings, Inc.(a) | | | 2,228,127 | |
| | | | | | | | |
| | | | Hotels, Restaurants & Leisure — 4.4% | | | | |
| | 64,125 | | | Dunkin’ Brands Group, Inc. | | | 4,134,139 | |
| | 84,975 | | | Eldorado Resorts, Inc.(a) | | | 2,816,921 | |
| | 56,275 | | | Jack in the Box, Inc. | | | 5,521,140 | |
| | | | | | | | |
| | | | | | | 12,472,200 | |
| | | | | | | | |
| | | | Insurance — 3.8% | | | | |
| | 90,925 | | | Brown & Brown, Inc. | | | 4,679,001 | |
| | 109,675 | | | First American Financial Corp. | | | 6,146,187 | |
| | | | | | | | |
| | | | | | | 10,825,188 | |
| | | | | | | | |
| | | | Internet Software & Services — 0.5% | | | | |
| | 71,125 | | | CommerceHub, Inc., Series A(a) | | | 1,564,039 | |
| | | | | | | | |
| | | | IT Services — 4.2% | | | | |
| | 103,900 | | | Booz Allen Hamilton Holding Corp. | | | 3,961,707 | |
| | 24,550 | | | CACI International, Inc., Class A(a) | | | 3,249,192 | |
| | 124,775 | | | Presidio, Inc.(a) | | | 2,391,937 | |
| | 53,450 | | | Virtusa Corp.(a) | | | 2,356,076 | |
| | | | | | | | |
| | | | | | | 11,958,912 | |
| | | | | | | | |
See accompanying notes to financial statements.
| 44
Portfolio of Investments – as of December 31, 2017
Vaughan Nelson Small Cap Value Fund – (continued)
| | | | | | | | |
| Shares | | | Description | | Value (†) | |
| | | | Life Sciences Tools & Services — 1.3% | | | | |
| | 39,575 | | | PRA Health Sciences, Inc.(a) | | $ | 3,604,095 | |
| | | | | | | | |
| | | | Machinery — 4.1% | | | | |
| | 36,975 | | | Albany International Corp., Class A | | | 2,272,114 | |
| | 70,400 | | | Franklin Electric Co., Inc. | | | 3,231,360 | |
| | 56,825 | | | Hillenbrand, Inc. | | | 2,540,077 | |
| | 62,800 | | | Meritor, Inc.(a) | | | 1,473,288 | |
| | 68,350 | | | REV Group, Inc. | | | 2,223,426 | |
| | | | | | | | |
| | | | | | | 11,740,265 | |
| | | | | | | | |
| | | | Media — 4.7% | | | | |
| | 6,000 | | | Cable One, Inc. | | | 4,220,100 | |
| | 60,400 | | | Nexstar Media Group, Inc., Class A | | | 4,723,280 | |
| | 172,625 | | | TEGNA, Inc. | | | 2,430,560 | |
| | 202,475 | | | WideOpenWest, Inc.(a) | | | 2,140,161 | |
| | | | | | | | |
| | | | | | | 13,514,101 | |
| | | | | | | | |
| | | | Metals & Mining — 1.7% | | | | |
| | 56,825 | | | Reliance Steel & Aluminum Co. | | | 4,875,017 | |
| | | | | | | | |
| | | | Multi-Utilities — 2.4% | | | | |
| | 56,325 | | | NorthWestern Corp. | | | 3,362,603 | |
| | 55,025 | | | Vectren Corp. | | | 3,577,725 | |
| | | | | | | | |
| | | | | | | 6,940,328 | |
| | | | | | | | |
| | | | Oil, Gas & Consumable Fuels — 3.8% | | | | |
| | 381,000 | | | Callon Petroleum Co.(a) | | | 4,629,150 | |
| | 304,425 | | | Laredo Petroleum, Inc.(a) | | | 3,229,949 | |
| | 155,875 | | | Oasis Petroleum, Inc.(a) | | | 1,310,909 | |
| | 120,550 | | | Ring Energy, Inc.(a) | | | 1,675,645 | |
| | | | | | | | |
| | | | | | | 10,845,653 | |
| | | | | | | | |
| | | | Professional Services — 1.5% | | | | |
| | 74,000 | | | Insperity, Inc. | | | 4,243,900 | |
| | | | | | | | |
| | | | REITs – Diversified — 1.6% | | | | |
| | 106,700 | | | CoreCivic, Inc. | | | 2,400,750 | |
| | 95,975 | | | GEO Group, Inc. (The) | | | 2,265,010 | |
| | | | | | | | |
| | | | | | | 4,665,760 | |
| | | | | | | | |
| | | | REITs – Office Property — 1.7% | | | | |
| | 273,075 | | | Brandywine Realty Trust | | | 4,967,234 | |
| | | | | | | | |
| | | | REITs – Storage — 1.1% | | | | |
| | 118,675 | | | National Storage Affiliates Trust | | | 3,235,081 | |
| | | | | | | | |
| | | | Road & Rail — 1.5% | | | | |
| | 53,325 | | | Genesee & Wyoming, Inc., Class A(a) | | | 4,198,277 | |
| | | | | | | | |
| | | | Semiconductors & Semiconductor Equipment — 4.7% | | | | |
| | 145,600 | | | Integrated Device Technology, Inc.(a) | | | 4,328,688 | |
| | 142,100 | | | MaxLinear, Inc., Class A(a) | | | 3,754,282 | |
| | 14,275 | | | MKS Instruments, Inc. | | | 1,348,987 | |
| | 46,200 | | | Silicon Laboratories, Inc.(a) | | | 4,079,460 | |
| | | | | | | | |
| | | | | | | 13,511,417 | |
| | | | | | | | |
See accompanying notes to financial statements.
45 |
Portfolio of Investments – as of December 31, 2017
Vaughan Nelson Small Cap Value Fund – (continued)
| | | | | | | | |
| Shares | | | Description | | Value (†) | |
| | | | Software — 0.7% | | | | |
| | 40,050 | | | Manhattan Associates, Inc.(a) | | $ | 1,984,077 | |
| | | | | | | | |
| | | | Technology Hardware, Storage & Peripherals — 0.6% | | | | |
| | 54,200 | | | NCR Corp.(a) | | | 1,842,258 | |
| | | | | | | | |
| | | | Thrifts & Mortgage Finance — 2.5% | | | | |
| | 55,250 | | | Essent Group Ltd.(a) | | | 2,398,955 | |
| | 163,775 | | | MGIC Investment Corp.(a) | | | 2,310,865 | |
| | 112,700 | | | Radian Group, Inc. | | | 2,322,747 | |
| | | | | | | | |
| | | | | | | 7,032,567 | |
| | | | | | | | |
| | | | Trading Companies & Distributors — 0.4% | | | | |
| | 30,125 | | | GMS, Inc.(a) | | | 1,133,905 | |
| | | | | | | | |
| | | | Total Common Stocks
(Identified Cost $239,133,579) | | | 276,070,793 | |
| | | | | | | | |
| | | | | | | | |
| | Exchange-Traded Funds — 1.4% | | | | |
| | 30,925 | | | iShares® Russell 2000 Value Index ETF
(Identified Cost $3,887,015) | | | 3,888,819 | |
| | | | | | | | |
| | | | | | | | |
| | Closed-End Investment Companies — 1.2% | | | | |
| | 228,525 | | | TCP Capital Corp.
(Identified Cost $3,733,874) | | | 3,491,862 | |
| | | | | | | | |
| | | | | | | | |
Principal
Amount | | | | | | |
| | Short-Term Investments — 1.5% | | | | |
| $ | 4,286,387 | | | Tri-Party Repurchase Agreement with Fixed Income Clearing Corporation, dated 12/29/2017 at 0.540% to be repurchased at $4,286,644 on 1/02/2018 collateralized by $4,350,000 U.S. Treasury Note, 2.250% due 1/31/2024 valued at $4,373,877 including accrued interest (Note 2 of Notes to Financial Statements) (Identified Cost $4,286,387) | | | 4,286,387 | |
| | | | | | | | |
| | | | | | | | |
| | | | Total Investments — 100.5%
(Identified Cost $251,040,855) | | | 287,737,861 | |
| | | | Other assets less liabilities — (0.5)% | | | (1,289,799 | ) |
| | | | | | | | |
| | | | Net Assets — 100.0% | | $ | 286,448,062 | |
| | | | | | | | |
| | | | | | | | |
| | (†) | | | See Note 2 of Notes to Financial Statements. | | | | |
| | (a) | | | Non-income producing security. | | | | |
| | | | | | | | |
| | ETF | | | Exchange-Traded Fund | | | | |
| | REITs | | | Real Estate Investment Trusts | | | | |
See accompanying notes to financial statements.
| 46
Portfolio of Investments – as of December 31, 2017
Vaughan Nelson Small Cap Value Fund – (continued)
Industry Summary at December 31, 2017
| | | | |
Banks | | | 16.8 | % |
Commercial Services & Supplies | | | 5.9 | |
Media | | | 4.7 | |
Semiconductors & Semiconductor Equipment | | | 4.7 | |
Electronic Equipment, Instruments & Components | | | 4.4 | |
Hotels, Restaurants & Leisure | | | 4.4 | |
IT Services | | | 4.2 | |
Machinery | | | 4.1 | |
Oil, Gas & Consumable Fuels | | | 3.8 | |
Insurance | | | 3.8 | |
Containers & Packaging | | | 3.5 | |
Building Products | | | 2.9 | |
Thrifts & Mortgage Finance | | | 2.5 | |
Multi-Utilities | | | 2.4 | |
Aerospace & Defense | | | 2.4 | |
Health Care Equipment & Supplies | | | 2.1 | |
Capital Markets | | | 2.1 | |
Other Investments, less than 2% each | | | 24.3 | |
Short-Term Investments | | | 1.5 | |
| | | | |
Total Investments | | | 100.5 | |
Other assets less liabilities | | | (0.5 | ) |
| | | | |
Net Assets | | | 100.0 | % |
| | | | |
See accompanying notes to financial statements.
47 |
Portfolio of Investments – as of December 31, 2017
Vaughan Nelson Value Opportunity Fund
| | | | | | | | |
| Shares | | | Description | | Value (†) | |
| | Common Stocks — 96.4% of Net Assets | |
| | | | Banks — 6.7% | | | | |
| | 674,575 | | | Bank of NT Butterfield & Son Ltd. (The) | | $ | 24,480,326 | |
| | 298,325 | | | Chemical Financial Corp. | | | 15,951,438 | |
| | 870,300 | | | Huntington Bancshares, Inc. | | | 12,671,568 | |
| | 306,875 | | | PacWest Bancorp | | | 15,466,500 | |
| | | | | | | | |
| | | | | | | 68,569,832 | |
| | | | | | | | |
| | | | Building Products — 1.0% | | | | |
| | 134,300 | | | Masonite International Corp.(a) | | | 9,958,345 | |
| | | | | | | | |
| | | | Capital Markets — 3.1% | | | | |
| | 175,775 | | | Nasdaq, Inc. | | | 13,504,793 | |
| | 248,875 | | | SEI Investments Co. | | | 17,884,158 | |
| | | | | | | | |
| | | | | | | 31,388,951 | |
| | | | | | | | |
| | | | Chemicals — 1.9% | | | | |
| | 459,850 | | | PolyOne Corp. | | | 20,003,475 | |
| | | | | | | | |
| | | | Commercial Services & Supplies — 1.7% | | | | |
| | 348,675 | | | KAR Auction Services, Inc. | | | 17,611,574 | |
| | | | | | | | |
| | | | Communications Equipment — 1.6% | | | | |
| | 432,300 | | | CommScope Holding Co., Inc.(a) | | | 16,353,909 | |
| | | | | | | | |
| | | | Consumer Finance — 1.8% | | | | |
| | 476,000 | | | Synchrony Financial | | | 18,378,360 | |
| | | | | | | | |
| | | | Containers & Packaging — 4.4% | | | | |
| | 155,825 | | | Avery Dennison Corp. | | | 17,898,059 | |
| | 341,075 | | | Crown Holdings, Inc.(a) | | | 19,185,469 | |
| | 64,600 | | | Packaging Corp. of America | | | 7,787,530 | |
| | | | | | | | |
| | | | | | | 44,871,058 | |
| | | | | | | | |
| | | | Diversified Consumer Services — 3.0% | | | | |
| | 107,350 | | | Grand Canyon Education, Inc.(a) | | | 9,611,046 | |
| | 827,525 | | | Laureate Education, Inc.(a) | | | 11,221,239 | |
| | 204,275 | | | ServiceMaster Global Holdings, Inc.(a) | | | 10,473,179 | |
| | | | | | | | |
| | | | | | | 31,305,464 | |
| | | | | | | | |
| | | | Electrical Equipment — 1.5% | | | | |
| | 111,150 | | | Hubbell, Inc. | | | 15,043,041 | |
| | | | | | | | |
| | | | Energy Equipment & Services — 2.2% | | | | |
| | 237,525 | | | Baker Hughes, a GE Co. | | | 7,515,291 | |
| | 939,650 | | | Forum Energy Technologies, Inc.(a) | | | 14,611,558 | |
| | | | | | | | |
| | | | | | | 22,126,849 | |
| | | | | | | | |
| | | | Health Care Providers & Services — 2.8% | | | | |
| | 201,425 | | | Centene Corp.(a) | | | 20,319,754 | |
| | 251,775 | | | Envision Healthcare Corp.(a) | | | 8,701,344 | |
| | | | | | | | |
| | | | | | | 29,021,098 | |
| | | | | | | | |
| | | | Hotels, Restaurants & Leisure — 6.0% | | | | |
| | 473,150 | | | Aramark | | | 20,222,431 | |
| | 1,157,225 | | | Extended Stay America, Inc. | | | 21,987,275 | |
See accompanying notes to financial statements.
| 48
Portfolio of Investments – as of December 31, 2017
Vaughan Nelson Value Opportunity Fund – (continued)
| | | | | | | | |
| Shares | | | Description | | Value (†) | |
| | | | Hotels, Restaurants & Leisure — continued | | | | |
| | 291,675 | | | Six Flags Entertainment Corp. | | $ | 19,416,805 | |
| | | | | | | | |
| | | | | | | 61,626,511 | |
| | | | | | | | |
| | | | Household Durables — 3.8% | | | | |
| | 96,900 | | | Mohawk Industries, Inc.(a) | | | 26,734,710 | |
| | 388,885 | | | Newell Brands, Inc. | | | 12,016,546 | |
| | | | | | | | |
| | | | | | | 38,751,256 | |
| | | | | | | | |
| | | | Independent Power & Renewable Electricity Producers — 2.2% | | | | |
| | 1,068,850 | | | Atlantica Yield PLC | | | 22,670,309 | |
| | | | | | | | |
| | | | Insurance — 7.7% | | | | |
| | 224,225 | | | Arthur J. Gallagher & Co. | | | 14,188,958 | |
| | 310,675 | | | Athene Holding Ltd., Class A(a) | | | 16,065,004 | |
| | 315,425 | | | First American Financial Corp. | | | 17,676,417 | |
| | 219,475 | | | Hartford Financial Services Group, Inc. (The) | | | 12,352,053 | |
| | 120,650 | | | Reinsurance Group of America, Inc. | | | 18,812,955 | |
| | | | | | | | |
| | | | | | | 79,095,387 | |
| | | | | | | | |
| | | | IT Services — 8.2% | | | | |
| | 63,650 | | | Alliance Data Systems Corp. | | | 16,134,002 | |
| | 128,275 | | | CACI International, Inc., Class A(a) | | | 16,977,196 | |
| | 253,675 | | | Fidelity National Information Services, Inc. | | | 23,868,281 | |
| | 64,600 | | | Fiserv, Inc.(a) | | | 8,470,998 | |
| | 180,525 | | | Global Payments, Inc. | | | 18,095,826 | |
| | | | | | | | |
| | | | | | | 83,546,303 | |
| | | | | | | | |
| | | | Leisure Products — 1.2% | | | | |
| | 217,575 | | | Brunswick Corp. | | | 12,014,492 | |
| | | | | | | | |
| | | | Life Sciences Tools & Services — 0.9% | | | | |
| | 94,287 | | | IQVIA Holdings, Inc.(a) | | | 9,230,697 | |
| | | | | | | | |
| | | | Machinery — 8.8% | | | | |
| | 147,275 | | | Middleby Corp. (The)(a) | | | 19,874,761 | |
| | 1,000,450 | | | Milacron Holdings Corp.(a) | | | 19,148,613 | |
| | 126,375 | | | Oshkosh Corp. | | | 11,486,224 | |
| | 249,875 | | | Pentair PLC | | | 17,646,173 | |
| | 123,525 | | | Snap-on, Inc. | | | 21,530,407 | |
| | | | | | | | |
| | | | | | | 89,686,178 | |
| | | | | | | | |
| | | | Media — 2.1% | | | | |
| | 276,475 | | | Nexstar Media Group, Inc., Class A | | | 21,620,345 | |
| | | | | | | | |
| | | | Metals & Mining — 3.2% | | | | |
| | 1,495,450 | | | Constellium NV, Class A(a) | | | 16,674,267 | |
| | 193,825 | | | Reliance Steel & Aluminum Co. | | | 16,628,247 | |
| | | | | | | | |
| | | | | | | 33,302,514 | |
| | | | | | | | |
| | | | Oil, Gas & Consumable Fuels — 6.2% | | | | |
| | 431,350 | | | Continental Resources, Inc.(a) | | | 22,848,610 | |
| | 1,433,700 | | | QEP Resources, Inc.(a) | | | 13,720,509 | |
| | 1,893,550 | | | WPX Energy, Inc.(a) | | | 26,642,248 | |
| | | | | | | | |
| | | | | | | 63,211,367 | |
| | | | | | | | |
See accompanying notes to financial statements.
49 |
Portfolio of Investments – as of December 31, 2017
Vaughan Nelson Value Opportunity Fund – (continued)
| | | | | | | | |
| Shares | | | Description | | Value (†) | |
| | | | REITs – Diversified — 2.6% | | | | |
| | 1,496,400 | | | New Residential Investment Corp. | | $ | 26,755,632 | |
| | | | | | | | |
| | | | REITs – Warehouse/Industrials — 1.3% | | | | |
| | 220,425 | | | CyrusOne, Inc. | | | 13,121,900 | |
| | | | | | | | |
| | | | Semiconductors & Semiconductor Equipment — 1.4% | | | | |
| | 163,425 | | | Analog Devices, Inc. | | | 14,549,728 | |
| | | | | | | | |
| | | | Software — 2.5% | | | | |
| | 150,125 | | | Check Point Software Technologies Ltd.(a) | | | 15,555,952 | |
| | 206,175 | | | RingCentral, Inc., Class A(a) | | | 9,978,870 | |
| | | | | | | | |
| | | | | | | 25,534,822 | |
| | | | | | | | |
| | | | Specialty Retail — 0.7% | | | | |
| | 122,575 | | | Signet Jewelers Ltd. | | | 6,931,616 | |
| | | | | | | | |
| | | | Technology Hardware, Storage & Peripherals — 1.9% | | | | |
| | 563,400 | | | NCR Corp.(a) | | | 19,149,966 | |
| | | | | | | | |
| | | | Textiles, Apparel & Luxury Goods — 1.2% | | | | |
| | 90,250 | | | PVH Corp. | | | 12,383,203 | |
| | | | | | | | |
| | | | Thrifts & Mortgage Finance — 1.4% | | | | |
| | 112,100 | | | Essent Group Ltd.(a) | | | 4,867,382 | |
| | 343,025 | | | MGIC Investment Corp.(a) | | | 4,840,083 | |
| | 234,325 | | | Radian Group, Inc. | | | 4,829,438 | |
| | | | | | | | |
| | | | | | | 14,536,903 | |
| | | | | | | | |
| | | | Trading Companies & Distributors — 1.4% | | | | |
| | 350,575 | | | HD Supply Holdings, Inc.(a) | | | 14,033,517 | |
| | | | | | | | |
| | | | Total Common Stocks
(Identified Cost $853,221,781) | | | 986,384,602 | |
| | | | | | | | |
| | | | | | | | |
| | Closed-End Investment Companies — 2.3% | | | | |
| | 1,506,850 | | | Ares Capital Corp.
(Identified Cost $23,117,860) | | | 23,687,682 | |
| | | | | | | | |
| | | | | | | | |
Principal
Amount | | | | | | |
| | Short-Term Investments — 1.4% | | | | |
| $ | 14,129,526 | | | Tri-Party Repurchase Agreement with Fixed Income Clearing Corporation, dated 12/29/2017 at 0.540% to be repurchased at $14,130,373 on 1/02/2018 collateralized by $14,335,000 U.S. Treasury Note, 2.250% due 1/31/2024 valued at $14,413,685 including accrued interest (Note 2 of Notes to Financial Statements) (Identified Cost $14,129,526) | | | 14,129,526 | |
| | | | | | | | |
| | | | | | | | |
| | | | Total Investments — 100.1%
(Identified Cost $890,469,167) | | | 1,024,201,810 | |
| | | | Other assets less liabilities — (0.1)% | | | (948,020 | ) |
| | | | | | | | |
| | | | Net Assets — 100.0% | | $ | 1,023,253,790 | |
| | | | | | | | |
See accompanying notes to financial statements.
| 50
Portfolio of Investments – as of December 31, 2017
Vaughan Nelson Value Opportunity Fund – (continued)
| | | | | | | | |
| | | | | | | | |
| | (†) | | | See Note 2 of Notes to Financial Statements. | | | | |
| | (a) | | | Non-income producing security. | | | | |
| | | | | | | | |
| | REITs | | | Real Estate Investment Trusts | | | | |
Industry Summary at December 31, 2017
| | | | |
Machinery | | | 8.8 | % |
IT Services | | | 8.2 | |
Insurance | | | 7.7 | |
Banks | | | 6.7 | |
Oil, Gas & Consumable Fuels | | | 6.2 | |
Hotels, Restaurants & Leisure | | | 6.0 | |
Containers & Packaging | | | 4.4 | |
Household Durables | | | 3.8 | |
Metals & Mining | | | 3.2 | |
Capital Markets | | | 3.1 | |
Diversified Consumer Services | | | 3.0 | |
Health Care Providers & Services | | | 2.8 | |
REITs – Diversified | | | 2.6 | |
Software | | | 2.5 | |
Closed-End Investment Companies | | | 2.3 | |
Independent Power & Renewable Electricity Producers | | | 2.2 | |
Energy Equipment & Services | | | 2.2 | |
Media | | | 2.1 | |
Other Investments, less than 2% each | | | 20.9 | |
Short-Term Investments | | | 1.4 | |
| | | | |
Total Investments | | | 100.1 | |
Other assets less liabilities | | | (0.1 | ) |
| | | | |
Net Assets | | | 100.0 | % |
| | | | |
See accompanying notes to financial statements.
51 |
This Page Intentionally Left Blank
| 52
Statements of Assets and Liabilities
December 31, 2017
| | | | | | | | | | | | |
| | | McDonnell
Intermediate
Municipal
Bond Fund | | | Natixis
Oakmark
Fund | | | Natixis
Oakmark
International
Fund | |
ASSETS | | | | | | | | | | | | |
Investments at cost | | $ | 36,291,111 | | | $ | 236,189,625 | | | $ | 983,688,280 | |
Net unrealized appreciation | | | 1,224,317 | | | | 79,836,362 | | | | 157,608,294 | |
| | | | | | | | | | | | |
Investments at value | | | 37,515,428 | | | | 316,025,987 | | | | 1,141,296,574 | |
Foreign currency at value (identified cost $0, $0 and $812, respectively) | | | — | | | | — | | | | 812 | |
Receivable for Fund shares sold | | | 17,829 | | | | 1,141,450 | | | | 3,112,969 | |
Receivable from investment adviser (Note 6) | | | 2,353 | | | | — | | | | — | |
Receivable for securities sold | | | — | | | | 63,385 | | | | 1,573,559 | |
Dividends and interest receivable | | | 450,753 | | | | 152,260 | | | | 79,766 | |
Unrealized appreciation on forward foreign currency contracts (Note 2) | | | — | | | | — | | | | 338,799 | |
Tax reclaims receivable | | | — | | | | 84,017 | | | | 1,086,666 | |
Prepaid expenses (Note 8) | | | 47 | | | | 248 | | | | 784 | |
| | | | | | | | | | | | |
TOTAL ASSETS | | | 37,986,410 | | | | 317,467,347 | | | | 1,147,489,929 | |
| | | | | | | | | | | | |
LIABILITIES | | | | | | | | | | | | |
Payable for securities purchased | | | 450,790 | | | | 345,728 | | | | 4,324,885 | |
Payable for Fund shares redeemed | | | 22,007 | | | | 299,925 | | | | 2,019,959 | |
Distributions payable | | | 48,672 | | | | — | | | | — | |
Management fees payable (Note 6) | | | — | | | | 181,915 | | | | 808,137 | |
Deferred Trustees’ fees (Note 6) | | | 45,315 | | | | 513,775 | | | | 93,602 | |
Administrative fees payable (Note 6) | | | 1,414 | | | | 11,578 | | | | 42,443 | |
Payable to distributor (Note 6d) | | | 118 | | | | 1,704 | | | | 12,095 | |
Other accounts payable and accrued expenses | | | 59,412 | | | | 93,072 | | | | 203,335 | |
| | | | | | | | | | | | |
TOTAL LIABILITIES | | | 627,728 | | | | 1,447,697 | | | | 7,504,456 | |
| | | | | | | | | | | | |
NET ASSETS | | $ | 37,358,682 | | | $ | 316,019,650 | | | $ | 1,139,985,473 | |
| | | | | | | | | | | | |
NET ASSETS CONSIST OF: | | | | | | | | | | | | |
Paid-in capital | | $ | 36,819,130 | | | $ | 231,687,033 | | | $ | 1,051,519,346 | |
Distributions in excess of net investment income | | | (23,503 | ) | | | (512,990 | ) | | | (719,613 | ) |
Accumulated net realized gain (loss) on investments, forward foreign currency contracts and foreign currency transactions | | | (661,262 | ) | | | 5,009,245 | | | | (68,808,308 | ) |
Net unrealized appreciation on investments and foreign currency translations | | | 1,224,317 | | | | 79,836,362 | | | | 157,994,048 | |
| | | | | | | | | | | | |
NET ASSETS | | $ | 37,358,682 | | | $ | 316,019,650 | | | $ | 1,139,985,473 | |
| | | | | | | | | | | | |
See accompanying notes to financial statements.
53 |
Statements of Assets and Liabilities (continued)
December 31, 2017
| | | | | | | | | | | | |
| | | McDonnell
Intermediate
Municipal
Bond Fund | | | Natixis
Oakmark
Fund | | | Natixis
Oakmark
International
Fund | |
COMPUTATION OF NET ASSET VALUE AND OFFERING PRICE: | | | | | | | | | | | | |
Class A shares: | | | | | | | | | | | | |
Net assets | | $ | 6,003,505 | | | $ | 203,792,351 | | | $ | 603,988,210 | |
| | | | | | | | | | | | |
Shares of beneficial interest | | | 590,120 | | | | 8,245,427 | | | | 38,764,719 | |
| | | | | | | | | | | | |
Net asset value and redemption price per share | | $ | 10.17 | | | $ | 24.72 | | | $ | 15.58 | |
| | | | | | | | | | | | |
Offering price per share (100/[100-maximum sales charge] of net asset value) (Note 1) | | $ | 10.48 | | | $ | 26.23 | | | $ | 16.53 | |
| | | | | | | | | | | | |
Class C shares: (redemption price per share is equal to net asset value less any applicable contingent deferred sales charge) (Note 1) | | | | | | | | | | | | |
Net assets | | $ | 2,395,287 | | | $ | 62,271,586 | | | $ | 363,017,925 | |
| | | | | | | | | | | | |
Shares of beneficial interest | | | 235,370 | | | | 2,885,773 | | | | 23,719,871 | |
| | | | | | | | | | | | |
Net asset value and offering price per share | | $ | 10.18 | | | $ | 21.58 | | | $ | 15.30 | |
| | | | | | | | | | | | |
Class N shares: | | | | | | | | | | | | |
Net assets | | $ | — | | | $ | 1,156 | | | $ | 1,130 | |
| | | | | | | | | | | | |
Shares of beneficial interest | | | — | | | | 45 | | | | 73 | |
| | | | | | | | | | | | |
Net asset value, offering and redemption price per share | | $ | — | | | $ | 25.91 | * | | $ | 15.58 | * |
| | | | | | | | | | | | |
Class Y shares: | | | | | | | | | | | | |
Net assets | | $ | 28,959,890 | | | $ | 49,954,557 | | | $ | 172,978,208 | |
| | | | | | | | | | | | |
Shares of beneficial interest | | | 2,842,871 | | | | 1,928,940 | | | | 11,113,885 | |
| | | | | | | | | | | | |
Net asset value, offering and redemption price per share | | $ | 10.19 | | | $ | 25.90 | | | $ | 15.56 | |
| | | | | | | | | | | | |
| * | Net asset value calculations have been determined utilizing fractional share and penny amounts. |
See accompanying notes to financial statements.
| 54
Statements of Assets and Liabilities (continued)
December 31, 2017
| | | | | | | | |
| | | Vaughan Nelson
Small Cap
Value Fund | | | Vaughan Nelson
Value
Opportunity
Fund | |
ASSETS | |
Investments at cost | | $ | 251,040,855 | | | $ | 890,469,167 | |
Net unrealized appreciation | | | 36,697,006 | | | | 133,732,643 | |
| | | | | | | | |
Investments at value | | | 287,737,861 | | | | 1,024,201,810 | |
Receivable for Fund shares sold | | | 182,585 | | | | 1,479,666 | |
Receivable for securities sold | | | 2,885,907 | | | | — | |
Dividends and interest receivable | | | 229,187 | | | | 1,320,536 | |
Prepaid expenses (Note 8) | | | 285 | | | | 1,022 | |
| | | | | | | | |
TOTAL ASSETS | | | 291,035,825 | | | | 1,027,003,034 | |
| | | | | | | | |
LIABILITIES | | | | | | | | |
Payable for securities purchased | | | 3,106,275 | | | | 1,238,492 | |
Payable for Fund shares redeemed | | | 918,278 | | | | 1,539,231 | |
Management fees payable (Note 6) | | | 227,001 | | | | 693,765 | |
Deferred Trustees’ fees (Note 6) | | | 238,904 | | | | 125,989 | |
Administrative fees payable (Note 6) | | | 10,885 | | | | 38,777 | |
Payable to distributor (Note 6d) | | | 2,129 | | | | 10,003 | |
Other accounts payable and accrued expenses | | | 84,291 | | | | 102,987 | |
| | | | | | | | |
TOTAL LIABILITIES | | | 4,587,763 | | | | 3,749,244 | |
| | | | | | | | |
NET ASSETS | | $ | 286,448,062 | | | $ | 1,023,253,790 | |
| | | | | | | | |
NET ASSETS CONSIST OF: | |
Paid-in capital | | $ | 244,045,525 | | | $ | 886,308,799 | |
Distributions in excess of net investment income | | | (195,110 | ) | | | (105,127 | ) |
Accumulated net realized gain on investments | | | 5,900,641 | | | | 3,317,475 | |
Net unrealized appreciation on investments | | | 36,697,006 | | | | 133,732,643 | |
| | | | | | | | |
NET ASSETS | | $ | 286,448,062 | | | $ | 1,023,253,790 | |
| | | | | | | | |
See accompanying notes to financial statements.
55 |
Statements of Assets and Liabilities (continued)
December 31, 2017
| | | | | | | | |
| | | Vaughan Nelson
Small Cap
Value Fund | | | Vaughan Nelson
Value
Opportunity
Fund | |
COMPUTATION OF NET ASSET VALUE AND OFFERING PRICE: | | | | | | | | |
Class A shares: | | | | | | | | |
Net assets | | $ | 93,751,413 | | | $ | 67,185,585 | |
| | | | | | | | |
Shares of beneficial interest | | | 5,010,655 | | | | 2,966,454 | |
| | | | | | | | |
Net asset value and redemption price per share | | $ | 18.71 | | | $ | 22.65 | |
| | | | | | | | |
Offering price per share (100/[100-maximum sales charge] of net asset value) (Note 1) | | $ | 19.85 | | | $ | 24.03 | |
| | | | | | | | |
Class C shares: (redemption price per share is equal to net asset value less any applicable contingent deferred sales charge) (Note 1) | | | | | | | | |
Net assets | | $ | 15,755,572 | | | $ | 47,558,772 | |
| | | | | | | | |
Shares of beneficial interest | | | 1,350,055 | | | | 2,212,097 | |
| | | | | | | | |
Net asset value and offering price per share | | $ | 11.67 | | | $ | 21.50 | |
| | | | | | | | |
Class N shares: | | | | | | | | |
Net assets | | $ | 1,073 | | | $ | 134,205,150 | |
| | | | | | | | |
Shares of beneficial interest | | | 55 | | | | 5,867,209 | |
| | | | | | | | |
Net asset value, offering and redemption price per share | | $ | 19.37 | * | | $ | 22.87 | |
| | | | | | | | |
Class Y shares: | |
Net assets | | $ | 176,940,004 | | | $ | 774,304,283 | |
| | | | | | | | |
Shares of beneficial interest | | | 9,136,294 | | | | 33,820,893 | |
| | | | | | | | |
Net asset value, offering and redemption price per share | | $ | 19.37 | | | $ | 22.89 | |
| | | | | | | | |
| * | Net asset value calculations have been determined utilizing fractional share and penny amounts. |
See accompanying notes to financial statements.
| 56
Statements of Operations
For the Year Ended December 31, 2017
| | | | | | | | | | | | |
| | | McDonnell
Intermediate
Municipal
Bond Fund | | | Natixis
Oakmark
Fund | | | Natixis
Oakmark
International
Fund | |
INVESTMENT INCOME | |
Dividends | | $ | 7,505 | | | $ | 4,620,708 | | | $ | 23,567,079 | |
Non-cash dividends (Note 2b) | | | — | | | | — | | | | 2,858,507 | |
Interest | | | 1,155,276 | | | | 42,450 | | | | 141,499 | |
Less net foreign taxes withheld | | | — | | | | — | | | | (2,495,491 | ) |
| | | | | | | | | | | | |
| | | 1,162,781 | | | | 4,663,158 | | | | 24,071,594 | |
| | | | | | | | | | | | |
Expenses | |
Management fees (Note 6) | | | 182,612 | | | | 1,931,901 | | | | 8,209,610 | |
Service and distribution fees (Note 6) | | | 42,412 | | | | 1,053,353 | | | | 4,560,422 | |
Administrative fees (Note 6) | | | 20,348 | | | | 125,161 | | | | 429,971 | |
Trustees’ fees and expenses (Note 6) | | | 22,179 | | | | 96,870 | | | | 52,440 | |
Transfer agent fees and expenses (Notes 6 and 7) | | | 16,981 | | | | 267,760 | | | | 955,846 | |
Audit and tax services fees | | | 53,177 | | | | 41,726 | | | | 43,086 | |
Custodian fees and expenses | | | 5,786 | | | | 11,021 | | | | 350,083 | |
Legal fees | | | 1,119 | | | | 5,979 | | | | 19,422 | |
Registration fees | | | 63,475 | | | | 87,150 | | | | 127,524 | |
Shareholder reporting expenses | | | 3,675 | | | | 36,013 | | | | 129,770 | |
Miscellaneous expenses (Note 8) | | | 10,190 | | | | 16,391 | | | | 51,183 | |
| | | | | | | | | | | | |
Total expenses | | | 421,954 | | | | 3,673,325 | | | | 14,929,357 | |
Less waiver and/or expense reimbursement (Note 6) | | | (174,060 | ) | | | (93 | ) | | | (174 | ) |
| | | | | | | | | | | | |
Net expenses | | | 247,894 | | | | 3,673,232 | | | | 14,929,183 | |
| | | | | | | | | | | | |
Net investment income | | | 914,887 | | | | 989,926 | | | | 9,142,411 | |
| | | | | | | | | | | | |
NET REALIZED AND UNREALIZED GAIN (LOSS) ON INVESTMENTS, FORWARD FOREIGN CURRENCY CONTRACTS AND FOREIGN CURRENCY TRANSACTIONS | | | | | | | | | | | | |
Net realized gain on: | |
Investments | | | 97,698 | | | | 13,670,587 | | | | 72,190,342 | |
Forward foreign currency contracts (Note 2d) | | | — | | | | — | | | | 811,579 | |
Foreign currency transactions (Note 2c) | | | — | | | | — | | | | 85,200 | |
Net change in unrealized appreciation (depreciation) on: | |
Investments | | | 1,414,558 | | | | 38,589,712 | | | | 155,829,253 | |
Forward foreign currency contracts (Note 2d) | | | — | | | | — | | | | (1,137,918 | ) |
Foreign currency translations (Note 2c) | | | — | | | | — | | | | 190,024 | |
| | | | | | | | | | | | |
Net realized and unrealized gain on investments, forward foreign currency contracts and foreign currency transactions | | | 1,512,256 | | | | 52,260,299 | | | | 227,968,480 | |
| | | | | | | | | | | | |
NET INCREASE IN NET ASSETS RESULTING FROM OPERATIONS | | $ | 2,427,143 | | | $ | 53,250,225 | | | $ | 237,110,891 | |
| | | | | | | | | | | | |
See accompanying notes to financial statements.
57 |
Statements of Operations (continued)
For the Year Ended December 31, 2017
| | | | | | | | |
| | | Vaughan Nelson
Small Cap
Value Fund | | | Vaughan Nelson
Value
Opportunity
Fund | |
INVESTMENT INCOME | | | | | | | | |
Dividends | | $ | 4,092,685 | | | $ | 21,739,769 | (a) |
Interest | | | 34,918 | | | | 43,749 | |
| | | | | | | | |
| | | 4,127,603 | | | | 21,783,518 | |
| | | | | | | | |
Expenses | | | | | | | | |
Management fees (Note 6) | | | 2,776,415 | | | | 8,663,668 | |
Service and distribution fees (Note 6) | | | 425,597 | | | | 742,786 | |
Administrative fees (Note 6) | | | 137,407 | | | | 482,459 | |
Trustees’ fees and expenses (Note 6) | | | 59,451 | | | | 58,719 | |
Transfer agent fees and expenses (Notes 6 and 7) | | | 247,782 | | | | 840,880 | |
Audit and tax services fees | | | 41,756 | | | | 42,656 | |
Custodian fees and expenses | | | 24,275 | | | | 42,134 | |
Legal fees | | | 6,898 | | | | 24,507 | |
Registration fees | | | 78,492 | | | | 96,141 | |
Shareholder reporting expenses | | | 48,295 | | | | 117,414 | |
Miscellaneous expenses (Note 8) | | | 17,228 | | | | 45,831 | |
| | | | | | | | |
Total expenses | | | 3,863,596 | | | | 11,157,195 | |
Less waiver and/or expense reimbursement (Note 6) | | | (93 | ) | | | — | |
| | | | | | | | |
Net expenses | | | 3,863,503 | | | | 11,157,195 | |
| | | | | | | | |
Net investment income | | | 264,100 | | | | 10,626,323 | |
| | | | | | | | |
NET REALIZED AND UNREALIZED GAIN (LOSS) ON INVESTMENTS | | | | | | | | |
Net realized gain on: | | | | | | | | |
Investments | | | 29,836,014 | | | | 64,998,167 | |
Net change in unrealized appreciation (depreciation) on: | | | | | | | | |
Investments | | | (11,434,967 | ) | | | 55,298,171 | |
| | | | | | | | |
Net realized and unrealized gain on investments | | | 18,401,047 | | | | 120,296,338 | |
| | | | | | | | |
NET INCREASE IN NET ASSETS RESULTING FROM OPERATIONS | | $ | 18,665,147 | | | $ | 130,922,661 | |
| | | | | | | | |
| (a) | Includes non-recurring dividends of $3,998,313 for Vaughan Nelson Value Opportunity Fund. |
See accompanying notes to financial statements.
| 58
Statements of Changes in Net Assets
| | | | | | | | |
| | | McDonnell Intermediate
Municipal Bond Fund | |
| | | Year Ended
December 31,
2017 | | | Year Ended
December 31,
2016 | |
FROM OPERATIONS: | |
Net investment income | | $ | 914,887 | | | $ | 1,255,518 | |
Net realized gain (loss) on investments | | | 97,698 | | | | (382,050 | ) |
Net change in unrealized appreciation (depreciation) on investments | | | 1,414,558 | | | | (1,492,330 | ) |
| | | | | | | | |
Net increase (decrease) in net assets resulting from operations | | | 2,427,143 | | | | (618,862 | ) |
| | | | | | | | |
FROM DISTRIBUTIONS TO SHAREHOLDERS: | |
Net investment income | | | | | | | | |
Class A | | | (99,522 | ) | | | (136,816 | ) |
Class C | | | (32,160 | ) | | | (25,208 | ) |
Class Y | | | (783,205 | ) | | | (1,093,491 | ) |
| | | | | | | | |
Total distributions | | | (914,887 | ) | | | (1,255,515 | ) |
| | | | | | | | |
NET DECREASE IN NET ASSETS FROM CAPITAL SHARE TRANSACTIONS (NOTE 11) | | | (22,821,654 | ) | | | (18,953,089 | ) |
| | | | | | | | |
Net decrease in net assets | | | (21,309,398 | ) | | | (20,827,466 | ) |
NET ASSETS | |
Beginning of the year | | | 58,668,080 | | | | 79,495,546 | |
| | | | | | | | |
End of the year | | $ | 37,358,682 | | | $ | 58,668,080 | |
| | | | | | | | |
DISTRIBUTIONS IN EXCESS OF NET INVESTMENT INCOME | | $ | (23,503 | ) | | $ | (23,502 | ) |
| | | | | | | | |
See accompanying notes to financial statements.
59 |
Statements of Changes in Net Assets (continued)
| | | | | | | | |
| | | Natixis Oakmark Fund | |
| | | Year Ended
December 31,
2017 | | | Year Ended
December 31,
2016 | |
FROM OPERATIONS: | |
Net investment income | | $ | 989,926 | | | $ | 1,539,968 | |
Net realized gain on investments | | | 13,670,587 | | | | 6,222,168 | |
Net change in unrealized appreciation (depreciation) on investments | | | 38,589,712 | | | | 29,078,941 | |
| | | | | | | | |
Net increase in net assets resulting from operations | | | 53,250,225 | | | | 36,841,077 | |
| | | | | | | | |
FROM DISTRIBUTIONS TO SHAREHOLDERS: | |
Net investment income | |
Class A | | | (769,107 | ) | | | (1,258,918 | ) |
Class C | | | (3,958 | ) | | | (41,500 | ) |
Class N(a) | | | (7 | ) | | | — | |
Class Y | | | (287,219 | ) | | | (236,527 | ) |
Net realized capital gains | |
Class A | | | (7,535,312 | ) | | | (5,328,126 | ) |
Class C | | | (2,714,690 | ) | | | (2,180,741 | ) |
Class N(a) | | | (27 | ) | | | — | |
Class Y | | | (1,614,232 | ) | | | (565,289 | ) |
| | | | | | | | |
Total distributions | | | (12,924,552 | ) | | | (9,611,101 | ) |
| | | | | | | | |
NET INCREASE (DECREASE) IN NET ASSETS FROM CAPITAL SHARE TRANSACTIONS (NOTE 11) | | | 20,495,702 | | | | (38,299,982 | ) |
| | | | | | | | |
Net increase (decrease) in net assets | | | 60,821,375 | | | | (11,070,006 | ) |
NET ASSETS | |
Beginning of the year | | | 255,198,275 | | | | 266,268,281 | |
| | | | | | | | |
End of the year | | $ | 316,019,650 | | | $ | 255,198,275 | |
| | | | | | | | |
DISTRIBUTIONS IN EXCESS OF NET INVESTMENT INCOME | | $ | (512,990 | ) | | $ | (427,557 | ) |
| | | | | | | | |
| (a) | From commencement of Class operations on May 1, 2017 through December 31, 2017. |
See accompanying notes to financial statements.
| 60
Statements of Changes in Net Assets (continued)
| | | | | | | | |
| | | Natixis Oakmark
International Fund | |
| | | Year Ended
December 31,
2017 | | | Year Ended
December 31,
2016 | |
FROM OPERATIONS: | |
Net investment income | | $ | 9,142,411 | | | $ | 11,533,880 | |
Net realized gain (loss) on investments, forward foreign currency contracts and foreign currency transactions | | | 73,087,121 | | | | (132,927,173 | ) |
Net change in unrealized appreciation (depreciation) on investments and foreign currency translations | | | 154,881,359 | | | | 171,238,190 | |
| | | | | | | | |
Net increase in net assets resulting from operations | | | 237,110,891 | | | | 49,844,897 | |
| | | | | | | | |
FROM DISTRIBUTIONS TO SHAREHOLDERS: | |
Net investment income | | | | | | | | |
Class A | | | (6,211,826 | ) | | | (9,085,209 | ) |
Class C | | | (1,761,751 | ) | | | (2,323,459 | ) |
Class N(a) | | | (15 | ) | | | — | |
Class Y(a) | | | (2,269,896 | ) | | | — | |
Net realized capital gains | | | | | | | | |
Class A | | | — | | | | (2,775,676 | ) |
Class C | | | — | | | | (1,263,983 | ) |
| | | | | | | | |
Total distributions | | | (10,243,488 | ) | | | (15,448,327 | ) |
| | | | | | | | |
NET INCREASE (DECREASE) IN NET ASSETS FROM CAPITAL SHARE TRANSACTIONS (NOTE 11) | | | 124,756,585 | | | | (310,799,653 | ) |
| | | | | | | | |
Net increase (decrease) in net assets | | | 351,623,988 | | | | (276,403,083 | ) |
NET ASSETS | |
Beginning of the year | | | 788,361,485 | | | | 1,064,764,568 | |
| | | | | | | | |
End of the year | | $ | 1,139,985,473 | | | $ | 788,361,485 | |
| | | | | | | | |
DISTRIBUTIONS IN EXCESS OF NET INVESTMENT INCOME | | $ | (719,613 | ) | | $ | (531,405 | ) |
| | | | | | | | |
| (a) | From commencement of Class operations on May 1, 2017 through December 31, 2017. |
See accompanying notes to financial statements.
61 |
Statements of Changes in Net Assets (continued)
| | | | | | | | |
| | | Vaughan Nelson
Small Cap Value Fund | |
| | | Year Ended
December 31,
2017 | | | Year Ended
December 31,
2016 | |
FROM OPERATIONS: | |
Net investment income | | $ | 264,100 | | | $ | 638,070 | |
Net realized gain on investments | | | 29,836,014 | | | | 30,916,492 | |
Net change in unrealized appreciation (depreciation) on investments | | | (11,434,967 | ) | | | 24,284,297 | |
| | | | | | | | |
Net increase in net assets resulting from operations | | | 18,665,147 | | | | 55,838,859 | |
| | | | | | | | |
FROM DISTRIBUTIONS TO SHAREHOLDERS: | |
Net investment income | | | | | | | | |
Class A | | | (8,822 | ) | | | (69,535 | ) |
Class C | | | (1,998 | ) | | | — | |
Class N(a) | | | (1 | ) | | | — | |
Class Y | | | (93,925 | ) | | | (533,444 | ) |
Net realized capital gains | | | | | | | | |
Class A | | | (11,097,924 | ) | | | (7,594,180 | ) |
Class C | | | (2,931,431 | ) | | | (2,160,752 | ) |
Class N(a) | | | (81 | ) | | | — | |
Class Y | | | (20,768,158 | ) | | | (13,003,298 | ) |
| | | | | | | | |
Total distributions | | | (34,902,340 | ) | | | (23,361,209 | ) |
| | | | | | | | |
NET DECREASE IN NET ASSETS FROM CAPITAL SHARE TRANSACTIONS (NOTE 11) | | | (7,286,538 | ) | | | (26,130,394 | ) |
| | | | | | | | |
Net increase (decrease) in net assets | | | (23,523,731 | ) | | | 6,347,256 | |
NET ASSETS | |
Beginning of the year | | | 309,971,793 | | | | 303,624,537 | |
| | | | | | | | |
End of the year | | $ | 286,448,062 | | | $ | 309,971,793 | |
| | | | | | | | |
DISTRIBUTIONS IN EXCESS OF NET INVESTMENT INCOME | | $ | (195,110 | ) | | $ | (237,134 | ) |
| | | | | | | | |
| (a) | From commencement of Class operations on May 1, 2017 through December 31, 2017. |
See accompanying notes to financial statements.
| 62
Statements of Changes in Net Assets (continued)
| | | | | | | | |
| | | Vaughan Nelson
Value Opportunity Fund | |
| | | Year Ended
December 31,
2017 | | | Year Ended
December 31,
2016 | |
FROM OPERATIONS: | |
Net investment income | | $ | 10,626,323 | | | $ | 7,419,520 | |
Net realized gain (loss) on investments | | | 64,998,167 | | | | (46,134,274 | ) |
Net change in unrealized appreciation (depreciation) on investments | | | 55,298,171 | | | | 116,689,577 | |
| | | | | | | | |
Net increase in net assets resulting from operations | | | 130,922,661 | | | | 77,974,823 | |
| | | | | | | | |
FROM DISTRIBUTIONS TO SHAREHOLDERS: | |
Net investment income | | | | | | | | |
Class A | | | (533,727 | ) | | | (208,980 | ) |
Class C | | | — | | | | (4,215 | ) |
Class N | | | (1,534,603 | ) | | | (1,086,141 | ) |
Class Y | | | (8,225,980 | ) | | | (5,786,437 | ) |
Net realized capital gains | | | | | | | | |
Class A | | | (1,090,532 | ) | | | (4,375,048 | ) |
Class C | | | (814,625 | ) | | | (2,641,165 | ) |
Class N | | | (2,128,036 | ) | | | (1,943,672 | ) |
Class Y | | | (12,407,105 | ) | | | (32,526,948 | ) |
| | | | | | | | |
Total distributions | | | (26,734,608 | ) | | | (48,572,606 | ) |
| | | | | | | | |
NET DECREASE IN NET ASSETS FROM CAPITAL SHARE TRANSACTIONS (NOTE 11) | | | (289,302,758 | ) | | | (251,794,180 | ) |
| | | | | | | | |
Net decrease in net assets | | | (185,114,705 | ) | | | (222,391,963 | ) |
NET ASSETS | |
Beginning of the year | | | 1,208,368,495 | | | | 1,430,760,458 | |
| | | | | | | | |
End of the year | | $ | 1,023,253,790 | | | $ | 1,208,368,495 | |
| | | | | | | | |
DISTRIBUTIONS IN EXCESS OF NET INVESTMENT INCOME | | $ | (105,127 | ) | | $ | (101,257 | ) |
| | | | | | | | |
See accompanying notes to financial statements.
63 |
Financial Highlights
For a share outstanding throughout each period.
| | | | | | | | | | | | | | | | | | | | |
| | |
McDonnell Intermediate Municipal Bond Fund—Class A | |
| | | Year Ended
December 31,
2017 | | | Year Ended
December 31,
2016 | | | Year Ended
December 31,
2015 | | | Year Ended
December 31,
2014 | | | Year Ended
December 31,
2013 | |
Net asset value, beginning of the period | | $ | 9.89 | | | $ | 10.09 | | | $ | 10.00 | | | $ | 9.54 | | | $ | 9.89 | |
| | | | | | | | | | | | | | | | | | | | |
INCOME (LOSS) FROM INVESTMENT OPERATIONS: | | | | | | | | | | | | | | | | | | | | |
Net investment income(a) | | | 0.19 | | | | 0.12 | | | | 0.13 | | | | 0.11 | | | | 0.09 | |
Net realized and unrealized gain (loss) | | | 0.28 | | | | (0.20 | ) | | | 0.10 | | | | 0.47 | | | | (0.35 | ) |
| | | | | | | | | | | | | | | | | | | | |
Total from Investment Operations | | | 0.47 | | | | (0.08 | ) | | | 0.23 | | | | 0.58 | | | | (0.26 | ) |
| | | | | | | | | | | | | | | | | | | | |
LESS DISTRIBUTIONS FROM: | | | | | | | | | | | | | | | | | | | | |
Net investment income | | | (0.19 | ) | | | (0.12 | ) | | | (0.14 | ) | | | (0.12 | ) | | | (0.09 | ) |
| | | | | | | | | | | | | | | | | | | | |
Net asset value, end of the period | | $ | 10.17 | | | $ | 9.89 | | | $ | 10.09 | | | $ | 10.00 | | | $ | 9.54 | |
| | | | | | | | | | | | | | | | | | | | |
Total return(b)(c) | | | 4.77 | % | | | (0.79 | )% | | | 2.28 | % | | | 6.08 | % | | | (2.66 | )% |
RATIOS TO AVERAGE NET ASSETS: | | | | | | | | | | | | | | | | | | | | |
Net assets, end of the period (000’s) | | $ | 6,004 | | | $ | 5,474 | | | $ | 6,427 | | | $ | 2,399 | | | $ | 1,047 | |
Net expenses(d) | | | 0.70 | % | | | 0.70 | % | | | 0.74 | %(e) | | | 0.80 | % | | | 0.80 | % |
Gross expenses | | | 1.10 | % | | | 0.88 | % | | | 1.12 | % | | | 1.26 | % | | | 1.37 | % |
Net investment income | | | 1.87 | % | | | 1.19 | % | | | 1.27 | % | | | 1.15 | % | | | 0.90 | % |
Portfolio turnover rate | | | 34 | % | | | 48 | % | | | 20 | % | | | 10 | % | | | 37 | % |
| (a) | Per share net investment income has been calculated using the average shares outstanding during the period. |
| (b) | Had certain expenses not been waived/reimbursed during the period, total returns would have been lower. |
| (c) | A sales charge for Class A shares is not reflected in total return calculations. |
| (d) | The investment adviser agreed to waive its fees and/or reimburse a portion of the Fund’s expenses during the period. Without this waiver/reimbursement, expenses would have been higher. |
| (e) | Effective July 1, 2015, the expense limit decreased from 0.80% to 0.70%. |
See accompanying notes to financial statements.
| 64
Financial Highlights (continued)
For a share outstanding throughout each period.
| | | | | | | | | | | | | | | | | | | | |
| | |
McDonnell Intermediate Municipal Bond Fund—Class C | |
| | | Year Ended
December 31,
2017 | | | Year Ended
December 31,
2016 | | | Year Ended
December 31,
2015 | | | Year Ended
December 31,
2014 | | | Year Ended
December 31,
2013 | |
Net asset value, beginning of the period | | $ | 9.90 | | | $ | 10.09 | | | $ | 9.99 | | | $ | 9.54 | | | $ | 9.89 | |
| | | | | | | | | | | | | | | | | | | | |
INCOME (LOSS) FROM INVESTMENT OPERATIONS: | | | | | | | | | | | | | | | | | | | | |
Net investment income(a) | | | 0.11 | | | | 0.04 | | | | 0.05 | | | | 0.04 | | | | 0.01 | |
Net realized and unrealized gain (loss) | | | 0.28 | | | | (0.18 | ) | | | 0.11 | | | | 0.45 | | | | (0.34 | ) |
| | | | | | | | | | | | | | | | | | | | |
Total from Investment Operations | | | 0.39 | | | | (0.14 | ) | | | 0.16 | | | | 0.49 | | | | (0.33 | ) |
| | | | | | | | | | | | | | | | | | | | |
LESS DISTRIBUTIONS FROM: | | | | | | | | | | | | | | | | | | | | |
Net investment income | | | (0.11 | ) | | | (0.05 | ) | | | (0.06 | ) | | | (0.04 | ) | | | (0.02 | ) |
| | | | | | | | | | | | | | | | | | | | |
Net asset value, end of the period | | $ | 10.18 | | | $ | 9.90 | | | $ | 10.09 | | | $ | 9.99 | | | $ | 9.54 | |
| | | | | | | | | | | | | | | | | | | | |
Total return(b)(c) | | | 3.98 | % | | | (1.44 | )% | | | 1.63 | % | | | 5.18 | % | | | (3.35 | )% |
RATIOS TO AVERAGE NET ASSETS: | | | | | | | | | | | | | | | | | | | | |
Net assets, end of the period (000’s) | | $ | 2,395 | | | $ | 4,015 | | | $ | 6,355 | | | $ | 2,223 | | | $ | 55 | |
Net expenses(d) | | | 1.45 | % | | | 1.45 | % | | | 1.49 | %(e) | | | 1.55 | % | | | 1.55 | % |
Gross expenses | | | 1.83 | % | | | 1.63 | % | | | 1.88 | % | | | 2.04 | % | | | 2.08 | % |
Net investment income | | | 1.10 | % | | | 0.44 | % | | | 0.52 | % | | | 0.41 | % | | | 0.14 | % |
Portfolio turnover rate | | | 34 | % | | | 48 | % | | | 20 | % | | | 10 | % | | | 37 | % |
| (a) | Per share net investment income has been calculated using the average shares outstanding during the period. |
| (b) | Had certain expenses not been waived/reimbursed during the period, total returns would have been lower. |
| (c) | A contingent deferred sales charge for Class C shares is not reflected in total return calculations. |
| (d) | The investment adviser agreed to waive its fees and/or reimburse a portion of the Fund’s expenses during the period. Without this waiver/reimbursement, expenses would have been higher. |
| (e) | Effective July 1, 2015, the expense limit decreased from 1.55% to 1.45%. |
See accompanying notes to financial statements.
65 |
Financial Highlights (continued)
For a share outstanding throughout each period.
| | | | | | | | | | | | | | | | | | | | |
| | |
McDonnell Intermediate Municipal Bond Fund—Class Y | |
| | | Year Ended
December 31,
2017 | | | Year Ended
December 31,
2016 | | | Year Ended
December 31,
2015 | | | Year Ended
December 31,
2014 | | | Year Ended
December 31,
2013 | |
Net asset value, beginning of the period | | $ | 9.90 | | | $ | 10.10 | | | $ | 10.00 | | | $ | 9.54 | | | $ | 9.88 | |
| | | | | | | | | | | | | | | | | | | | |
INCOME (LOSS) FROM INVESTMENT OPERATIONS: | | | | | | | | | | | | | | | | | | | | |
Net investment income(a) | | | 0.21 | | | | 0.15 | | | | 0.15 | | | | 0.14 | | | | 0.11 | |
Net realized and unrealized gain (loss) | | | 0.29 | | | | (0.20 | ) | | | 0.11 | | | | 0.46 | | | | (0.34 | ) |
| | | | | | | | | | | | | | | | | | | | |
Total from Investment Operations | | | 0.50 | | | | (0.05 | ) | | | 0.26 | | | | 0.60 | | | | (0.23 | ) |
| | | | | | | | | | | | | | | | | | | | |
LESS DISTRIBUTIONS FROM: | | | | | | | | | | | | | | | | | | | | |
Net investment income | | | (0.21 | ) | | | (0.15 | ) | | | (0.16 | ) | | | (0.14 | ) | | | (0.11 | ) |
| | | | | | | | | | | | | | | | | | | | |
Net asset value, end of the period | | $ | 10.19 | | | $ | 9.90 | | | $ | 10.10 | | | $ | 10.00 | | | $ | 9.54 | |
| | | | | | | | | | | | | | | | | | | | |
Total return(b) | | | 5.13 | % | | | (0.55 | )% | | | 2.63 | % | | | 6.36 | % | | | (2.31 | )% |
RATIOS TO AVERAGE NET ASSETS: | | | | | | | | | | | | | | | | | | | | |
Net assets, end of the period (000’s) | | $ | 28,960 | | | $ | 49,179 | | | $ | 66,713 | | | $ | 28,314 | | | $ | 21,704 | |
Net expenses(c) | | | 0.45 | % | | | 0.45 | % | | | 0.49 | %(d) | | | 0.55 | % | | | 0.55 | % |
Gross expenses | | | 0.83 | % | | | 0.63 | % | | | 0.85 | % | | | 1.02 | % | | | 1.04 | % |
Net investment income | | | 2.09 | % | | | 1.44 | % | | | 1.48 | % | | | 1.46 | % | | | 1.13 | % |
Portfolio turnover rate | | | 34 | % | | | 48 | % | | | 20 | % | | | 10 | % | | | 37 | % |
| (a) | Per share net investment income has been calculated using the average shares outstanding during the period. |
| (b) | Had certain expenses not been waived/reimbursed during the period, total returns would have been lower. |
| (c) | The investment adviser agreed to waive its fees and/or reimburse a portion of the Fund’s expenses during the period. Without this waiver/reimbursement, expenses would have been higher. |
| (d) | Effective July 1, 2015, the expense limit decreased from 0.55% to 0.45%. |
See accompanying notes to financial statements.
| 66
Financial Highlights (continued)
For a share outstanding throughout each period.
| | | | | | | | | | | | | | | | | | | | |
| | |
Natixis Oakmark Fund—Class A | |
| | | Year Ended
December 31,
2017 | | | Year Ended
December 31,
2016 | | | Year Ended
December 31,
2015 | | | Year Ended
December 31,
2014 | | | Year Ended
December 31,
2013 | |
Net asset value, beginning of the period | | $ | 21.37 | | | $ | 18.79 | | | $ | 20.43 | | | $ | 21.40 | | | $ | 16.09 | |
| | | | | | | | | | | | | | | | | | | | |
INCOME (LOSS) FROM INVESTMENT OPERATIONS: | | | | | | | | | | | | | | | | | | | | |
Net investment income(a) | | | 0.11 | | | | 0.16 | | | | 0.14 | | | | 0.10 | | | | 0.06 | |
Net realized and unrealized gain (loss) | | | 4.28 | | | | 3.20 | | | | (1.02 | ) | | | 2.11 | | | | 6.03 | |
| | | | | | | | | | | | | | | | | | | | |
Total from Investment Operations | | | 4.39 | | | | 3.36 | | | | (0.88 | ) | | | 2.21 | | | | 6.09 | |
| | | | | | | | | | | | | | | | | | | | |
LESS DISTRIBUTIONS FROM: | | | | | | | | | | | | | | | | | | | | |
Net investment income | | | (0.10 | ) | | | (0.16 | ) | | | (0.13 | ) | | | (0.07 | ) | | | (0.07 | ) |
Net realized capital gains | | | (0.94 | ) | | | (0.62 | ) | | | (0.63 | ) | | | (3.11 | ) | | | (0.71 | ) |
| | | | | | | | | | | | | | | | | | | | |
Total Distributions | | | (1.04 | ) | | | (0.78 | ) | | | (0.76 | ) | | | (3.18 | ) | | | (0.78 | ) |
| | | | | | | | | | | | | | | | | | | | |
Net asset value, end of the period | | $ | 24.72 | | | $ | 21.37 | | | $ | 18.79 | | | $ | 20.43 | | | $ | 21.40 | |
| | | | | | | | | | | | | | | | | | | | |
Total return(b) | | | 20.75 | % | | | 18.37 | % | | | (4.41 | )% | | | 10.43 | % | | | 37.82 | % |
RATIOS TO AVERAGE NET ASSETS: | | | | | | | | | | | | | | | | | | | | |
Net assets, end of the period (000’s) | | $ | 203,792 | | | $ | 173,036 | | | $ | 173,925 | | | $ | 195,061 | | | $ | 145,270 | |
Net expenses | | | 1.18 | % | | | 1.18 | % | | | 1.14 | % | | | 1.22 | % | | | 1.30 | %(c) |
Gross expenses | | | 1.18 | % | | | 1.18 | % | | | 1.14 | % | | | 1.22 | % | | | 1.30 | %(c) |
Net investment income | | | 0.48 | % | | | 0.82 | % | | | 0.68 | % | | | 0.44 | % | | | 0.33 | % |
Portfolio turnover rate | | | 16 | % | | | 16 | % | | | 23 | % | | | 64 | %(d) | | | 29 | % |
| (a) | Per share net investment income has been calculated using the average shares outstanding during the period. |
| (b) | A sales charge for Class A shares is not reflected in total return calculations. |
| (c) | Includes fee/expense recovery of less than 0.01%. |
| (d) | The variation in the Fund’s turnover rate from 2013 to 2014 was primarily due to a change in the portfolio management team. |
See accompanying notes to financial statements.
67 |
Financial Highlights (continued)
For a share outstanding throughout each period.
| | | | | | | | | | | | | | | | | | | | |
| | |
Natixis Oakmark Fund—Class C | |
| | | Year Ended
December 31,
2017 | | | Year Ended
December 31,
2016 | | | Year Ended
December 31,
2015 | | | Year Ended
December 31,
2014 | | | Year Ended
December 31,
2013 | |
Net asset value, beginning of the period | | $ | 18.83 | | | $ | 16.65 | | | $ | 18.19 | | | $ | 19.48 | | | $ | 14.75 | |
| | | | | | | | | | | | | | | | | | | | |
INCOME (LOSS) FROM INVESTMENT OPERATIONS: | | | | | | | | | | | | | | | | | | | | |
Net investment income (loss)(a) | | | (0.05 | ) | | | 0.01 | | | | (0.01 | ) | | | (0.06 | ) | | | (0.07 | ) |
Net realized and unrealized gain (loss) | | | 3.74 | | | | 2.80 | | | | (0.90 | ) | | | 1.90 | | | | 5.51 | |
| | | | | | | | | | | | | | | | | | | | |
Total from Investment Operations | | | 3.69 | | | | 2.81 | | | | (0.91 | ) | | | 1.84 | | | | 5.44 | |
| | | | | | | | | | | | | | | | | | | | |
LESS DISTRIBUTIONS FROM: | | | | | | | | | | | | | | | | | | | | |
Net investment income | | | (0.00 | )(b) | | | (0.01 | ) | | | (0.00 | )(b) | | | (0.02 | ) | | | — | |
Net realized capital gains | | | (0.94 | ) | | | (0.62 | ) | | | (0.63 | ) | | | (3.11 | ) | | | (0.71 | ) |
| | | | | | | | | | | | | | | | �� | | | | |
Total Distributions | | | (0.94 | ) | | | (0.63 | ) | | | (0.63 | ) | | | (3.13 | ) | | | (0.71 | ) |
| | | | | | | | | | | | | | | | | | | | |
Net asset value, end of the period | | $ | 21.58 | | | $ | 18.83 | | | $ | 16.65 | | | $ | 18.19 | | | $ | 19.48 | |
| | | | | | | | | | | | | | | | | | | | |
Total return(c) | | | 19.85 | % | | | 17.45 | % | | | (5.07 | )% | | | 9.55 | % | | | 36.88 | % |
RATIOS TO AVERAGE NET ASSETS: | | | | | | | | | | | | | | | | | | | | |
Net assets, end of the period (000’s) | | $ | 62,272 | | | $ | 55,910 | | | $ | 70,616 | | | $ | 62,941 | | | $ | 8,425 | |
Net expenses | | | 1.93 | % | | | 1.93 | % | | | 1.89 | % | | | 1.97 | % | | | 2.05 | %(d) |
Gross expenses | | | 1.93 | % | | | 1.93 | % | | | 1.89 | % | | | 1.97 | % | | | 2.05 | %(d) |
Net investment income (loss) | | | (0.27 | )% | | | 0.09 | % | | | (0.07 | )% | | | (0.30 | )% | | | (0.42 | )% |
Portfolio turnover rate | | | 16 | % | | | 16 | % | | | 23 | % | | | 64 | %(e) | | | 29 | % |
| (a) | Per share net investment income (loss) has been calculated using the average shares outstanding during the period. |
| (b) | Amount rounds to less than $0.01 per share. |
| (c) | A contingent deferred sales charge for Class C shares is not reflected in total return calculations. |
| (d) | Includes fee/expense recovery of less than 0.01%. |
| (e) | The variation in the Fund’s turnover rate from 2013 to 2014 was primarily due to a change in the portfolio management team. |
See accompanying notes to financial statements.
| 68
Financial Highlights (continued)
For a share outstanding throughout each period.
| | | | |
| | |
Natixis Oakmark
Fund—Class N | |
| | | Period Ended
December 31,
2017* | |
Net asset value, beginning of the period | | $ | 23.13 | |
| | | | |
INCOME (LOSS) FROM INVESTMENT OPERATIONS: | | | | |
Net investment income(a) | | | 0.14 | |
Net realized and unrealized gain (loss) | | | 3.44 | |
| | | | |
Total from Investment Operations | | | 3.58 | |
| | | | |
LESS DISTRIBUTIONS FROM: | | | | |
Net investment income | | | (0.17 | ) |
Net realized capital gains | | | (0.63 | ) |
| | | | |
Total Distributions | | | (0.80 | ) |
| | | | |
Net asset value, end of the period | | $ | 25.91 | |
| | | | |
Total return(b)(c) | | | 15.46 | % |
RATIOS TO AVERAGE NET ASSETS: | | | | |
Net assets, end of the period (000’s) | | $ | 1 | |
Net expenses(d)(e) | | | 0.75 | % |
Gross expenses(d) | | | 13.79 | % |
Net investment income(d) | | | 0.84 | % |
Portfolio turnover rate(f) | | | 16 | % |
| * | From commencement of Class operations on May 1, 2017 through December 31, 2017. |
| (a) | Per share net investment income has been calculated using the average shares outstanding during the period. |
| (b) | Had certain expenses not been waived/reimbursed during the period, total returns would have been lower. |
| (c) | Periods less than one year are not annualized. |
| (d) | Computed on an annualized basis for periods less than one year. |
| (e) | The investment adviser agreed to waive its fees and/or reimburse a portion of the Fund’s expenses during the period. Without this waiver/reimbursement, expenses would have been higher. |
| (f) | Represents the Fund’s portfolio turnover rate for the year ended December 31, 2017. |
See accompanying notes to financial statements.
69 |
Financial Highlights (continued)
For a share outstanding throughout each period.
| | | | | | | | | | | | | | | | | | | | |
| | |
Natixis Oakmark Fund—Class Y | |
| | | Year Ended
December 31,
2017 | | | Year Ended
December 31,
2016 | | | Year Ended
December 31,
2015 | | | Year Ended
December 31,
2014 | | | Year Ended
December 31,
2013 | |
Net asset value, beginning of the period | | $ | 22.34 | | | $ | 19.60 | | | $ | 21.28 | | | $ | 22.16 | | | $ | 16.63 | |
| | | | | | | | | | | | | | | | | | | | |
INCOME (LOSS) FROM INVESTMENT OPERATIONS: | | | | | | | | | | | | | | | | | | | | |
Net investment income(a) | | | 0.17 | | | | 0.21 | | | | 0.19 | | | | 0.15 | | | | 0.11 | |
Net realized and unrealized gain (loss) | | | 4.48 | | | | 3.36 | | | | (1.06 | ) | | | 2.20 | | | | 6.24 | |
| | | | | | | | | | | | | | | | | | | | |
Total from Investment Operations | | | 4.65 | | | | 3.57 | | | | (0.87 | ) | | | 2.35 | | | | 6.35 | |
| | | | | | | | | | | | | | | | | | | | |
LESS DISTRIBUTIONS FROM: | | | | | | | | | | | | | | | | | | | | |
Net investment income | | | (0.15 | ) | | | (0.21 | ) | | | (0.18 | ) | | | (0.12 | ) | | | (0.11 | ) |
Net realized capital gains | | | (0.94 | ) | | | (0.62 | ) | | | (0.63 | ) | | | (3.11 | ) | | | (0.71 | ) |
| | | | | | | | | | | | | | | | | | | | |
Total Distributions | | | (1.09 | ) | | | (0.83 | ) | | | (0.81 | ) | | | (3.23 | ) | | | (0.82 | ) |
| | | | | | | | | | | | | | | | | | | | |
Net asset value, end of the period | | $ | 25.90 | | | $ | 22.34 | | | $ | 19.60 | | | $ | 21.28 | | | $ | 22.16 | |
| | | | | | | | | | | | | | | | | | | | |
Total return | | | 21.05 | % | | | 18.69 | % | | | (4.18 | )% | | | 10.70 | % | | | 38.21 | % |
RATIOS TO AVERAGE NET ASSETS: | | | | | | | | | | | | | | | | | | | | |
Net assets, end of the period (000’s) | | $ | 49,955 | | | $ | 26,252 | | | $ | 21,696 | | | $ | 26,694 | | | $ | 14,176 | |
Net expenses | | | 0.93 | % | | | 0.92 | % | | | 0.89 | % | | | 0.97 | % | | | 1.05 | %(b) |
Gross expenses | | | 0.93 | % | | | 0.92 | % | | | 0.89 | % | | | 0.97 | % | | | 1.05 | %(b) |
Net investment income | | | 0.71 | % | | | 1.05 | % | | | 0.92 | % | | | 0.67 | % | | | 0.54 | % |
Portfolio turnover rate | | | 16 | % | | | 16 | % | | | 23 | % | | | 64 | %(c) | | | 29 | % |
| (a) | Per share net investment income has been calculated using the average shares outstanding during the period. |
| (b) | Includes fee/expense recovery of less than 0.01%. |
| (c) | The variation in the Fund’s turnover rate from 2013 to 2014 was primarily due to a change in the portfolio management team. |
See accompanying notes to financial statements.
| 70
Financial Highlights (continued)
For a share outstanding throughout each period.
| | | | | | | | | | | | | | | | | | | | |
| | |
Natixis Oakmark International Fund—Class A | |
| | | Year Ended
December 31,
2017 | | | Year Ended
December 31,
2016 | | | Year Ended
December 31,
2015 | | | Year Ended
December 31,
2014 | | | Year Ended
December 31,
2013 | |
Net asset value, beginning of the period | | $ | 12.15 | | | $ | 11.47 | | | $ | 12.44 | | | $ | 13.74 | | | $ | 10.94 | |
| | | | | | | | | | | | | | | | | | | | |
INCOME (LOSS) FROM INVESTMENT OPERATIONS: | | | | | | | | | | | | | | | | | | | | |
Net investment income(a) | | | 0.18 | | | | 0.17 | | | | 0.15 | | | | 0.18 | | | | 0.07 | |
Net realized and unrealized gain (loss) | | | 3.41 | | | | 0.76 | | | | (0.80 | ) | | | (1.01 | ) | | | 2.99 | |
| | | | | | | | | | | | | | | | | | | | |
Total from Investment Operations | | | 3.59 | | | | 0.93 | | | | (0.65 | ) | | | (0.83 | ) | | | 3.06 | |
| | | | | | | | | | | | | | | | | | | | |
LESS DISTRIBUTIONS FROM: | | | | | | | | | | | | | | | | | | | | |
Net investment income | | | (0.16 | ) | | | (0.21 | ) | | | (0.20 | ) | | | (0.25 | ) | | | (0.08 | ) |
Net realized capital gains | | | — | | | | (0.04 | ) | | | (0.12 | ) | | | (0.22 | ) | | | (0.18 | ) |
| | | | | | | | | | | | | | | | | | | | |
Total Distributions | | | (0.16 | ) | | | (0.25 | ) | | | (0.32 | ) | | | (0.47 | ) | | | (0.26 | ) |
| | | | | | | | | | | | | | | | | | | | |
Net asset value, end of the period | | $ | 15.58 | | | $ | 12.15 | | | $ | 11.47 | | | $ | 12.44 | | | $ | 13.74 | |
| | | | | | | | | | | | | | | | | | | | |
Total return(b) | | | 29.56 | % | | | 8.19 | % | | | (5.35 | )% | | | (6.05 | )% | | | 28.13 | % |
RATIOS TO AVERAGE NET ASSETS: | | | | | | | | | | | | | | | | | | | | |
Net assets, end of the period (000’s) | | $ | 603,988 | | | $ | 533,112 | | | $ | 722,805 | | | $ | 617,383 | | | $ | 314,579 | |
Net expenses | | | 1.32 | % | | | 1.34 | % | | | 1.31 | % | | | 1.31 | % | | | 1.44 | %(c) |
Gross expenses | | | 1.32 | % | | | 1.34 | % | | | 1.31 | % | | | 1.31 | % | | | 1.44 | %(c) |
Net investment income | | | 1.28 | % | | | 1.54 | % | | | 1.17 | % | | | 1.34 | % | | | 0.52 | % |
Portfolio turnover rate | | | 40 | % | | | 41 | % | | | 51 | % | | | 31 | % | | | 20 | % |
| (a) | Per share net investment income has been calculated using the average shares outstanding during the period. |
| (b) | A sales charge for Class A shares is not reflected in total return calculations. |
| (c) | Includes fee/expense recovery of 0.05%. |
See accompanying notes to financial statements.
71 |
Financial Highlights (continued)
For a share outstanding throughout each period.
| | | | | | | | | | | | | | | | | | | | |
| | |
Natixis Oakmark International Fund—Class C | |
| | | Year Ended
December 31,
2017 | | | Year Ended
December 31,
2016 | | | Year Ended
December 31,
2015 | | | Year Ended
December 31,
2014 | | | Year Ended
December 31,
2013 | |
Net asset value, beginning of the period | | $ | 11.96 | | | $ | 11.29 | | | $ | 12.25 | | | $ | 13.53 | | | $ | 10.82 | |
| | | | | | | | | | | | | | | | | | | | |
INCOME (LOSS) FROM INVESTMENT OPERATIONS: | | | | | | | | | | | | | | | | | | | | |
Net investment income (loss)(a) | | | 0.06 | | | | 0.08 | | | | 0.05 | | | | 0.08 | | | | (0.02 | ) |
Net realized and unrealized gain (loss) | | | 3.35 | | | | 0.74 | | | | (0.78 | ) | | | (0.98 | ) | | | 2.94 | |
| | | | | | | | | | | | | | | | | | | | |
Total from Investment Operations | | | 3.41 | | | | 0.82 | | | | (0.73 | ) | | | (0.90 | ) | | | 2.92 | |
| | | | | | | | | | | | | | | | | | | | |
LESS DISTRIBUTIONS FROM: | | | | | | | | | | | | | | | | | | | | |
Net investment income | | | (0.07 | ) | | | (0.11 | ) | | | (0.11 | ) | | | (0.16 | ) | | | (0.03 | ) |
Net realized capital gains | | | — | | | | (0.04 | ) | | | (0.12 | ) | | | (0.22 | ) | | | (0.18 | ) |
| | | | | | | | | | | | | | | | | | | | |
Total Distributions | | | (0.07 | ) | | | (0.15 | ) | | | (0.23 | ) | | | (0.38 | ) | | | (0.21 | ) |
| | | | | | | | | | | | | | | | | | | | |
Net asset value, end of the period | | $ | 15.30 | | | $ | 11.96 | | | $ | 11.29 | | | $ | 12.25 | | | $ | 13.53 | |
| | | | | | | | | | | | | | | | | | | | |
Total return(b) | | | 28.55 | % | | | 7.36 | % | | | (6.08 | )% | | | (6.67 | )% | | | 27.13 | % |
RATIOS TO AVERAGE NET ASSETS: | | | | | | | | | | | | | | | | | | | | |
Net assets, end of the period (000’s) | | $ | 363,018 | | | $ | 255,249 | | | $ | 341,959 | | | $ | 327,319 | | | $ | 237,250 | |
Net expenses | | | 2.07 | % | | | 2.09 | % | | | 2.06 | % | | | 2.05 | % | | | 2.19 | %(c) |
Gross expenses | | | 2.07 | % | | | 2.09 | % | | | 2.06 | % | | | 2.05 | % | | | 2.19 | %(c) |
Net investment income (loss) | | | 0.42 | % | | | 0.73 | % | | | 0.39 | % | | | 0.61 | % | | | (0.14 | )% |
Portfolio turnover rate | | | 40 | % | | | 41 | % | | | 51 | % | | | 31 | % | | | 20 | % |
| (a) | Per share net investment income (loss) has been calculated using the average shares outstanding during the period. |
| (b) | A contingent deferred sales charge for Class C shares is not reflected in total return calculations. |
| (c) | Includes fee/expense recovery of 0.04%. |
See accompanying notes to financial statements.
| 72
Financial Highlights (continued)
For a share outstanding throughout each period.
| | | | |
| | | Natixis Oakmark
International
Fund—Class N | |
| | | Period Ended
December 31,
2017* | |
Net asset value, beginning of the period | | $ | 13.98 | |
| | | | |
INCOME (LOSS) FROM INVESTMENT OPERATIONS: | | | | |
Net investment income(a) | | | 0.15 | |
Net realized and unrealized gain (loss) | | | 1.66 | |
| | | | |
Total from Investment Operations | | | 1.81 | |
| | | | |
LESS DISTRIBUTIONS FROM: | | | | |
Net investment income | | | (0.21 | ) |
| | | | |
Net asset value, end of the period | | $ | 15.58 | |
| | | | |
Total return(b)(c) | | | 12.96 | % |
RATIOS TO AVERAGE NET ASSETS: | | | | |
Net assets, end of the period (000’s) | | $ | 1 | |
Net expenses(d)(e) | | | 0.92 | % |
Gross expenses(d) | | | 25.21 | % |
Net investment income(d) | | | 1.54 | % |
Portfolio turnover rate(f) | | | 40 | % |
| * | From commencement of Class operations on May 1, 2017 through December 31, 2017. |
| (a) | Per share net investment income has been calculated using the average shares outstanding during the period. |
| (b) | Had certain expenses not been waived/reimbursed during the period, total returns would have been lower. |
| (c) | Periods less than one year are not annualized. |
| (d) | Computed on an annualized basis for periods less than one year. |
| (e) | The investment adviser agreed to waive its fees and/or reimburse a portion of the Fund’s expenses during the period. Without this waiver/reimbursement, expenses would have been higher. |
| (f) | Represents the Fund’s portfolio turnover rate for the year ended December 31, 2017. |
See accompanying notes to financial statements.
73 |
Financial Highlights (continued)
For a share outstanding throughout each period.
| | | | |
| | | Natixis Oakmark
International
Fund—Class Y | |
| | | Period Ended
December 31,
2017* | |
Net asset value, beginning of the period | | $ | 13.98 | |
| | | | |
INCOME (LOSS) FROM INVESTMENT OPERATIONS: | | | | |
Net investment income(a) | | | 0.00 | (b) |
Net realized and unrealized gain (loss) | | | 1.79 | |
| | | | |
Total from Investment Operations | | | 1.79 | |
| | | | |
LESS DISTRIBUTIONS FROM: | | | | |
Net investment income | | | (0.21 | ) |
| | | | |
Net asset value, end of the period | | $ | 15.56 | |
| | | | |
Total return(c) | | | 12.79 | % |
RATIOS TO AVERAGE NET ASSETS: | | | | |
Net assets, end of the period (000’s) | | $ | 172,978 | |
Net expenses(d) | | | 1.07 | % |
Gross expenses(d) | | | 1.07 | % |
Net investment income(d) | | | 0.03 | % |
Portfolio turnover rate(e) | | | 40 | % |
| * | From commencement of Class operations on May 1, 2017 through December 31, 2017. |
| (a) | Per share net investment income has been calculated using the average shares outstanding during the period. |
| (b) | Amount rounds to less than $0.01 per share. |
| (c) | Periods less than one year are not annualized. |
| (d) | Computed on an annualized basis for periods less than one year. |
| (e) | Represents the Fund’s portfolio turnover rate for the year ended December 31, 2017. |
See accompanying notes to financial statements.
| 74
Financial Highlights (continued)
For a share outstanding throughout each period.
| | | | | | | | | | | | | | | | | | | | |
| | |
Vaughan Nelson Small Cap Value Fund—Class A | |
| | | Year Ended
December 31,
2017 | | | Year Ended
December 31,
2016 | | | Year Ended
December 31,
2015 | | | Year Ended
December 31,
2014 | | | Year Ended
December 31,
2013 | |
Net asset value, beginning of the period | | $ | 19.79 | | | $ | 17.74 | | | $ | 20.65 | | | $ | 22.34 | | | $ | 18.97 | |
| | | | | | | | | | | | | | | | | | | | |
INCOME (LOSS) FROM INVESTMENT OPERATIONS: | | | | | | | | | | | | | | | | | | | | |
Net investment income (loss)(a) | | | (0.01 | ) | | | 0.02 | | | | 0.06 | (b) | | | (0.06 | ) | | | 0.07 | (c) |
Net realized and unrealized gain (loss) | | | 1.21 | | | | 3.49 | | | | (0.07 | ) | | | 1.95 | | | | 7.14 | |
| | | | | | | | | | | | | | | | | | | | |
Total from Investment Operations | | | 1.20 | | | | 3.51 | | | | (0.01 | ) | | | 1.89 | | | | 7.21 | |
| | | | | | | | | | | | | | | | | | | | |
LESS DISTRIBUTIONS FROM: | | | | | | | | | | | | | | | | | | | | |
Net investment income | | | (0.00 | )(d) | | | (0.01 | ) | | | (0.04 | ) | | | — | | | | (0.06 | ) |
Net realized capital gains | | | (2.28 | ) | | | (1.45 | ) | | | (2.86 | ) | | | (3.58 | ) | | | (3.78 | ) |
| | | | | | | | | | | | | | | | | | | | |
Total Distributions | | | (2.28 | ) | | | (1.46 | ) | | | (2.90 | ) | | | (3.58 | ) | | | (3.84 | ) |
| | | | | | | | | | | | | | | | | | | | |
Net asset value, end of the period | | $ | 18.71 | | | $ | 19.79 | | | $ | 17.74 | | | $ | 20.65 | | | $ | 22.34 | |
| | | | | | | | | | | | | | | | | | | | |
Total return(e) | | | 6.28 | % | | | 20.24 | % | | | (0.29 | )%(b) | | | 8.79 | % | | | 39.01 | %(c) |
RATIOS TO AVERAGE NET ASSETS: | | | | | | | | | | | | | | | | | | | | |
Net assets, end of the period (000’s) | | $ | 93,751 | | | $ | 106,447 | | | $ | 103,092 | | | $ | 125,201 | | | $ | 152,792 | |
Net expenses | | | 1.36 | % | | | 1.35 | % | | | 1.35 | % | | | 1.37 | % | | | 1.39 | %(f) |
Gross expenses | | | 1.36 | % | | | 1.35 | % | | | 1.35 | % | | | 1.37 | % | | | 1.39 | %(f) |
Net investment income (loss) | | | (0.03 | )% | | | 0.11 | % | | | 0.26 | %(b) | | | (0.27 | )% | | | 0.33 | %(c) |
Portfolio turnover rate | | | 92 | % | | | 74 | % | | | 62 | % | | | 58 | % | | | 58 | % |
| (a) | Per share net investment income (loss) has been calculated using the average shares outstanding during the period. |
| (b) | Includes non-recurring dividends. Without these dividends, net investment loss per share would have been $(0.04), total return would have been (0.77)% and the ratio of net investment loss to average net assets would have been (0.20)%. |
| (c) | Includes a non-recurring dividend. Without this dividend, net investment income per share would have been $0.00, total return would have been 38.63% and the ratio of net investment income to average net assets would have been 0.02%. |
| (d) | Amount rounds to less than $0.01 per share. |
| (e) | A sales charge for Class A shares is not reflected in total return calculations. |
| (f) | Includes interest expense of less than 0.01%. |
See accompanying notes to financial statements.
75 |
Financial Highlights (continued)
For a share outstanding throughout each period.
| | | | | | | | | | | | | | | | | | | | |
| | |
Vaughan Nelson Small Cap Value Fund—Class C | |
| | | Year Ended
December 31,
2017 | | | Year Ended
December 31,
2016 | | | Year Ended
December 31,
2015 | | | Year Ended
December 31,
2014 | | | Year Ended
December 31,
2013 | |
Net asset value, beginning of the period | | $ | 13.26 | | | $ | 12.39 | | | $ | 15.36 | | | $ | 17.61 | | | $ | 15.64 | |
| | | | | | | | | | | | | | | | | | | | |
INCOME (LOSS) FROM INVESTMENT OPERATIONS: | | | | | | | | | | | | | | | | | | | | |
Net investment loss(a) | | | (0.10 | ) | | | (0.08 | ) | | | (0.08 | )(b) | | | (0.18 | ) | | | (0.07 | )(c) |
Net realized and unrealized gain (loss) | | | 0.79 | | | | 2.40 | | | | (0.03 | ) | | | 1.51 | | | | 5.83 | |
| | | | | | | | | | | | | | | | | | | | |
Total from Investment Operations | | | 0.69 | | | | 2.32 | | | | (0.11 | ) | | | 1.33 | | | | 5.76 | |
| | | | | | | | | | | | | | | | | | | | |
LESS DISTRIBUTIONS FROM: | | | | | | | | | | | | | | | | | | | | |
Net investment income | | | (0.00 | )(d) | | | — | | | | — | | | | — | | | | (0.01 | ) |
Net realized capital gains | | | (2.28 | ) | | | (1.45 | ) | | | (2.86 | ) | | | (3.58 | ) | | | (3.78 | ) |
| | | | | | | | | | | | | | | | | | | | |
Total Distributions | | | (2.28 | ) | | | (1.45 | ) | | | (2.86 | ) | | | (3.58 | ) | | | (3.79 | ) |
| | | | | | | | | | | | | | | | | | | | |
Net asset value, end of the period | | $ | 11.67 | | | $ | 13.26 | | | $ | 12.39 | | | $ | 15.36 | | | $ | 17.61 | |
| | | | | | | | | | | | | | | | | | | | |
Total return(e) | | | 5.50 | % | | | 19.32 | % | | | (1.02 | )%(b) | | | 7.94 | % | | | 37.99 | %(c) |
RATIOS TO AVERAGE NET ASSETS: | | | | | | | | | | | | | | | | | | | | |
Net assets, end of the period (000’s) | | $ | 15,756 | | | $ | 20,379 | | | $ | 21,188 | | | $ | 27,292 | | | $ | 31,476 | |
Net expenses | | | 2.11 | % | | | 2.10 | % | | | 2.10 | % | | | 2.12 | % | | | 2.14 | %(f) |
Gross expenses | | | 2.11 | % | | | 2.10 | % | | | 2.10 | % | | | 2.12 | % | | | 2.14 | %(f) |
Net investment loss | | | (0.79 | )% | | | (0.64 | )% | | | (0.48 | )%(b) | | | (1.02 | )% | | | (0.40 | )%(c) |
Portfolio turnover rate | | | 92 | % | | | 74 | % | | | 62 | % | | | 58 | % | | | 58 | % |
| (a) | Per share net investment loss has been calculated using the average shares outstanding during the period. |
| (b) | Includes non-recurring dividends. Without these dividends, net investment loss per share would have been $(0.15), total return would have been (1.48)% and the ratio of net investment loss to average net assets would have been (0.96)%. |
| (c) | Includes a non-recurring dividend. Without this dividend, net investment loss per share would have been $(0.13), total return would have been 37.59% and the ratio of net investment income loss to average net assets would have been (0.73)%. |
| (d) | Amount rounds to less than $0.01 per share. |
| (e) | A contingent deferred sales charge for Class C shares is not reflected in total return calculations. |
| (f) | Includes interest expense of less than 0.01%. |
See accompanying notes to financial statements.
| 76
Financial Highlights (continued)
For a share outstanding throughout each period.
| | | | |
| | | Vaughan Nelson
Small Cap Value
Fund—Class N | |
| | | Period Ended
December 31,
2017* | |
Net asset value, beginning of the period | | $ | 19.55 | |
| | | | |
INCOME (LOSS) FROM INVESTMENT OPERATIONS: | | | | |
Net investment income(a) | | | 0.07 | |
Net realized and unrealized gain (loss) | | | 1.35 | |
| | | | |
Total from Investment Operations | | | 1.42 | |
| | | | |
LESS DISTRIBUTIONS FROM: | | | | |
Net investment income | | | (0.02 | ) |
Net realized capital gains | | | (1.58 | ) |
| | | | |
Total Distributions | | | (1.60 | ) |
| | | | |
Net asset value, end of the period | | $ | 19.37 | |
| | | | |
Total return(b)(c) | | | 7.17 | % |
RATIOS TO AVERAGE NET ASSETS: | | | | |
Net assets, end of the period (000’s) | | $ | 1 | |
Net expenses(d)(e) | | | 0.96 | % |
Gross expenses(d) | | | 14.68 | % |
Net investment income(d) | | | 0.56 | % |
Portfolio turnover rate(f) | | | 92 | % |
| * | From commencement of Class operations on May 1, 2017 through December 31, 2017. |
| (a) | Per share net investment income has been calculated using the average shares outstanding during the period. |
| (b) | Had certain expenses not been waived/reimbursed during the period, total returns would have been lower. |
| (c) | Periods less than one year are not annualized. |
| (d) | Computed on an annualized basis for periods less than one year. |
| (e) | The investment adviser agreed to waive its fees and/or reimburse a portion of the Fund’s expenses during the period. Without this waiver/reimbursement, expenses would have been higher. |
| (f) | Represents the Fund’s portfolio turnover rate for the year ended December 31, 2017. |
See accompanying notes to financial statements.
77 |
Financial Highlights (continued)
For a share outstanding throughout each period.
| | | | | | | | | | | | | | | | | | | | |
| | |
Vaughan Nelson Small Cap Value Fund—Class Y | |
| | | Year Ended
December 31,
2017 | | | Year Ended
December 31,
2016 | | | Year Ended
December 31,
2015 | | | Year Ended
December 31,
2014 | | | Year Ended
December 31,
2013 | |
Net asset value, beginning of the period | | $ | 20.36 | | | $ | 18.21 | | | $ | 21.13 | | | $ | 22.73 | | | $ | 19.24 | |
| | | | | | | | | | | | | | | | | | | | |
INCOME (LOSS) FROM INVESTMENT OPERATIONS: | | | | | | | | | | | | | | | | | | | | |
Net investment income (loss)(a) | | | 0.05 | | | | 0.07 | | | | 0.11 | (b) | | | (0.00 | )(c) | | | 0.13 | (d) |
Net realized and unrealized gain (loss) | | | 1.25 | | | | 3.59 | | | | (0.07 | ) | | | 1.98 | | | | 7.26 | |
| | | | | | | | | | | | | | | | | | | | |
Total from Investment Operations | | | 1.30 | | | | 3.66 | | | | 0.04 | | | | 1.98 | | | | 7.39 | |
| | | | | | | | | | | | | | | | | | | | |
LESS DISTRIBUTIONS FROM: | | | | | | | | | | | | | | | | | | | | |
Net investment income | | | (0.01 | ) | | | (0.06 | ) | | | (0.10 | ) | | | — | | | | (0.12 | ) |
Net realized capital gains | | | (2.28 | ) | | | (1.45 | ) | | | (2.86 | ) | | | (3.58 | ) | | | (3.78 | ) |
| | | | | | | | | | | | | | | | | | | | |
Total Distributions | | | (2.29 | ) | | | (1.51 | ) | | | (2.96 | ) | | | (3.58 | ) | | | (3.90 | ) |
| | | | | | | | | | | | | | | | | | | | |
Net asset value, end of the period | | $ | 19.37 | | | $ | 20.36 | | | $ | 18.21 | | | $ | 21.13 | | | $ | 22.73 | |
| | | | | | | | | | | | | | | | | | | | |
Total return | | | 6.60 | % | | | 20.53 | % | | | (0.05 | )%(b) | | | 9.04 | % | | | 39.43 | %(d) |
RATIOS TO AVERAGE NET ASSETS: | | | | | | | | | | | | | | | | | | | | |
Net assets, end of the period (000’s) | | $ | 176,940 | | | $ | 183,145 | | | $ | 179,322 | | | $ | 176,905 | | | $ | 163,836 | |
Net expenses | | | 1.11 | % | | | 1.10 | % | | | 1.10 | % | | | 1.12 | % | | | 1.14 | %(e) |
Gross expenses | | | 1.11 | % | | | 1.10 | % | | | 1.10 | % | | | 1.12 | % | | | 1.14 | %(e) |
Net investment income (loss) | | | 0.23 | % | | | 0.36 | % | | | 0.50 | %(b) | | | (0.01 | )% | | | 0.59 | %(d) |
Portfolio turnover rate | | | 92 | % | | | 74 | % | | | 62 | % | | | 58 | % | | | 58 | % |
| (a) | Per share net investment income (loss) has been calculated using the average shares outstanding during the period. |
| (b) | Includes non-recurring dividends. Without these dividends, net investment income per share would have been $0.02, total return would have been (0.53)% and the ratio of net investment income to average net assets would have been 0.07%. |
| (c) | Amount rounds to less than $0.01 per share. |
| (d) | Includes a non-recurring dividend. Without this dividend, net investment income per share would have been $0.06, total return would have been 39.06% and the ratio of net investment income to average net assets would have been 0.27%. |
| (e) | Includes interest expense of less than 0.01%. |
See accompanying notes to financial statements.
| 78
Financial Highlights (continued)
For a share outstanding throughout each period.
| | | | | | | | | | | | | | | | | | | | |
| | |
Vaughan Nelson Value Opportunity Fund—Class A | |
| | | Year Ended
December 31,
2017 | | | Year Ended
December 31,
2016 | | | Year Ended
December 31,
2015 | | | Year Ended
December 31,
2014 | | | Year Ended
December 31,
2013 | |
Net asset value, beginning of the period | | $ | 20.55 | | | $ | 20.04 | | | $ | 21.29 | | | $ | 20.63 | | | $ | 15.49 | |
| | | | | | | | | | | | | | | | | | | | |
INCOME (LOSS) FROM INVESTMENT OPERATIONS: | | | | | | | | | | | | | | | | | | | | |
Net investment income (loss)(a) | | | 0.17 | (b) | | | 0.07 | | | | 0.03 | (c) | | | (0.08 | ) | | | (0.03 | ) |
Net realized and unrealized gain (loss) | | | 2.48 | | | | 1.05 | | | | (0.79 | ) | | | 2.31 | | | | 6.36 | |
| | | | | | | | | | | | | | | | | | | | |
Total from Investment Operations | | | 2.65 | | | | 1.12 | | | | (0.76 | ) | | | 2.23 | | | | 6.33 | |
| | | | | | | | | | | | | | | | | | | | |
LESS DISTRIBUTIONS FROM: | | | | | | | | | | | | | | | | | | | | |
Net investment income | | | (0.18 | ) | | | (0.05 | ) | | | (0.02 | ) | | | — | | | | — | |
Net realized capital gains | | | (0.37 | ) | | | (0.56 | ) | | | (0.47 | ) | | | (1.57 | ) | | | (1.19 | ) |
| | | | | | | | | | | | | | | | | | | | |
Total Distributions | | | (0.55 | ) | | | (0.61 | ) | | | (0.49 | ) | | | (1.57 | ) | | | (1.19 | ) |
| | | | | | | | | | | | | | | | | | | | |
Net asset value, end of the period | | $ | 22.65 | | | $ | 20.55 | | | $ | 20.04 | | | $ | 21.29 | | | $ | 20.63 | |
| | | | | | | | | | | | | | | | | | | | |
Total return(d) | | | 12.93 | %(b) | | | 5.85 | % | | | (3.66 | )%(c) | | | 10.92 | % | | | 41.22 | % |
RATIOS TO AVERAGE NET ASSETS: | | | | | | | | | | | | | | | | | | | | |
Net assets, end of the period (000’s) | | $ | 67,186 | | | $ | 87,536 | | | $ | 142,833 | | | $ | 73,237 | | | $ | 67,716 | |
Net expenses | | | 1.22 | % | | | 1.23 | % | | | 1.23 | % | | | 1.25 | % | | | 1.27 | % |
Gross expenses | | | 1.22 | % | | | 1.23 | % | | | 1.23 | % | | | 1.25 | % | | | 1.27 | % |
Net investment income (loss) | | | 0.77 | %(b) | | | 0.35 | % | | | 0.16 | %(c) | | | (0.37 | )% | | | (0.13 | )% |
Portfolio turnover rate | | | 42 | % | | | 57 | % | | | 32 | % | | | 58 | % | | | 39 | % |
| (a) | Per share net investment income (loss) has been calculated using the average shares outstanding during the period. |
| (b) | Includes a non-recurring dividend. Without this dividend, net investment income per share would have been $0.09, total return would have been 12.53% and the ratio of net investment income to average net assets would have been 0.41%. |
| (c) | Includes a non-recurring dividend. Without this dividend, net investment loss per share would have been $(0.01), total return would have been (3.94)% and the ratio of net investment loss to average net assets would have been (0.04)%. |
| (d) | A sales charge for Class A shares is not reflected in total return calculations. |
See accompanying notes to financial statements.
79 |
Financial Highlights (continued)
For a share outstanding throughout each period.
| | | | | | | | | | | | | | | | | | | | |
| | |
Vaughan Nelson Value Opportunity Fund—Class C | |
| | | Year Ended
December 31,
2017 | | | Year Ended
December 31,
2016 | | | Year Ended
December 31,
2015 | | | Year Ended
December 31,
2014 | | | Year Ended
December 31,
2013 | |
Net asset value, beginning of the period | | $ | 19.51 | | | $ | 19.16 | | | $ | 20.51 | | | $ | 20.07 | | | $ | 15.21 | |
| | | | | | | | | | | | | | | | | | | | |
INCOME (LOSS) FROM INVESTMENT OPERATIONS: | | | | | | | | | | | | | | | | | | | | |
Net investment income (loss)(a) | | | 0.00 | (b)(c) | | | (0.07 | ) | | | (0.13 | )(d) | | | (0.23 | ) | | | (0.17 | ) |
Net realized and unrealized gain (loss) | | | 2.36 | | | | 0.98 | | | | (0.75 | ) | | | 2.24 | | | | 6.22 | |
| | | | | | | | | | | | | | | | | | | | |
Total from Investment Operations | | | 2.36 | | | | 0.91 | | | | (0.88 | ) | | | 2.01 | | | | 6.05 | |
| | | | | | | | | | | | | | | | | | | | |
LESS DISTRIBUTIONS FROM: | | | | | | | | | | | | | | | | | | | | |
Net investment income | | | — | | | | (0.00 | )(b) | | | — | | | | — | | | | — | |
Net realized capital gains | | | (0.37 | ) | | | (0.56 | ) | | | (0.47 | ) | | | (1.57 | ) | | | (1.19 | ) |
| | | | | | | | | | | | | | | | | | | | |
Total Distributions | | | (0.37 | ) | | | (0.56 | ) | | | (0.47 | ) | | | (1.57 | ) | | | (1.19 | ) |
| | | | | | | | | | | | | | | | | | | | |
Net asset value, end of the period | | $ | 21.50 | | | $ | 19.51 | | | $ | 19.16 | | | $ | 20.51 | | | $ | 20.07 | |
| | | | | | | | | | | | | | | | | | | | |
Total return(e) | | | 12.11 | %(c) | | | 5.03 | % | | | (4.39 | )%(d) | | | 10.12 | % | | | 40.13 | % |
RATIOS TO AVERAGE NET ASSETS: | | | | | | | | | | | | | | | | | | | | |
Net assets, end of the period (000’s) | | $ | 47,559 | | | $ | 68,923 | | | $ | 89,284 | | | $ | 35,894 | | | $ | 21,005 | |
Net expenses | | | 1.97 | % | | | 1.98 | % | | | 1.98 | % | | | 2.00 | % | | | 2.02 | % |
Gross expenses | | | 1.97 | % | | | 1.98 | % | | | 1.98 | % | | | 2.00 | % | | | 2.02 | % |
Net investment income (loss) | | | 0.00 | %(c)(f) | | | (0.38 | )% | | | (0.61 | )%(d) | | | (1.10 | )% | | | (0.89 | )% |
Portfolio turnover rate | | | 42 | % | | | 57 | % | | | 32 | % | | | 58 | % | | | 39 | % |
| (a) | Per share net investment income (loss) has been calculated using the average shares outstanding during the period. |
| (b) | Amount rounds to less than $0.01 per share. |
| (c) | Includes a non-recurring dividend. Without this dividend, net investment loss per share would have been $(0.07), total return would have been 11.70% and the ratio of net investment loss to average net assets would have been (0.35)%. |
| (d) | Includes a non-recurring dividend. Without this dividend, net investment loss per share would have been $(0.16), total return would have been (4.68)% and the ratio of net investment loss to average net assets would have been (0.77)%. |
| (e) | A contingent deferred sales charge for Class C shares is not reflected in total return calculations. |
| (f) | Amount rounds to less than 0.01%. |
See accompanying notes to financial statements.
| 80
Financial Highlights (continued)
For a share outstanding throughout each period.
| | | | | | | | | | | | | | | | | | | | |
| | |
Vaughan Nelson Value Opportunity Fund—Class N | |
| | | Year Ended
December 31,
2017 | | | Year Ended
December 31,
2016 | | | Year Ended
December 31,
2015 | | | Year Ended
December 31,
2014 | | | Year Ended
December 31,
2013* | |
Net asset value, beginning of the period | | $ | 20.75 | | | $ | 20.26 | | | $ | 21.50 | | | $ | 20.76 | | | $ | 17.53 | |
| | | | | | | | | | | | | | | | | | | | |
INCOME (LOSS) FROM INVESTMENT OPERATIONS: | | | | | | | | | | | | | | | | | | | | |
Net investment income (loss)(a) | | | 0.25 | (b) | | | 0.16 | | | | 0.11 | (c) | | | (0.00 | )(d) | | | (0.04 | ) |
Net realized and unrealized gain (loss) | | | 2.51 | | | | 1.04 | | | | (0.81 | ) | | | 2.31 | | | | 4.35 | |
| | | | | | | | | | | | | | | | | | | | |
Total from Investment Operations | | | 2.76 | | | | 1.20 | | | | (0.70 | ) | | | 2.31 | | | | 4.31 | |
| | | | | | | | | | | | | | | | | | | | |
LESS DISTRIBUTIONS FROM: | | | | | | | | | | | | | | | | | | | | |
Net investment income | | | (0.27 | ) | | | (0.15 | ) | | | (0.07 | ) | | | — | | | | (0.02 | ) |
Net realized capital gains | | | (0.37 | ) | | | (0.56 | ) | | | (0.47 | ) | | | (1.57 | ) | | | (1.06 | ) |
| | | | | | | | | | | | | | | | | | | | |
Total Distributions | | | (0.64 | ) | | | (0.71 | ) | | | (0.54 | ) | | | (1.57 | ) | | | (1.08 | ) |
| | | | | | | | | | | | | | | | | | | | |
Net asset value, end of the period | | $ | 22.87 | | | $ | 20.75 | | | $ | 20.26 | | | $ | 21.50 | | | $ | 20.76 | |
| | | | | | | | | | | | | | | | | | | | |
Total return | | | 13.31 | %(b) | | | 6.21 | % | | | (3.35 | )%(c) | | | 11.24 | % | | | 24.70 | %(e)(f) |
RATIOS TO AVERAGE NET ASSETS: | | | | | | | | | | | | | | | | | | | | |
Net assets, end of the period (000’s) | | $ | 134,205 | | | $ | 148,365 | | | $ | 65,010 | | | $ | 12,024 | | | $ | 1 | |
Net expenses | | | 0.88 | % | | | 0.88 | % | | | 0.89 | % | | | 0.91 | %(g) | | | 1.03 | %(h)(i) |
Gross expenses | | | 0.88 | % | | | 0.88 | % | | | 0.89 | % | | | 0.91 | %(g) | | | 2.07 | %(h) |
Net investment income (loss) | | | 1.16 | %(b) | | | 0.78 | % | | | 0.50 | %(c) | | | (0.00 | )%(j) | | | (0.33 | )%(h) |
Portfolio turnover rate | | | 42 | % | | | 57 | % | | | 32 | % | | | 58 | % | | | 39 | % |
| * | From commencement of operations on May 1, 2013 through December 31, 2013. |
| (a) | Per share net investment income (loss) has been calculated using the average shares outstanding during the period. |
| (b) | Includes a non-recurring dividend. Without this dividend, net investment income per share would have been $0.17, total return would have been 12.92% and the ratio of net investment income to average net assets would have been 0.76%. |
| (c) | Includes a non-recurring dividend. Without this dividend, net investment income per share would have been $0.08, total return would have been (3.59)% and the ratio of net investment income to average net assets would have been 0.35%. |
| (d) | Amount rounds to less than $0.01 per share. |
| (e) | Had certain expenses not been waived/reimbursed during the period, total returns would have been lower. |
| (f) | Periods less than one year are not annualized. |
| (g) | Includes fee/expense recovery of less than 0.01%. |
| (h) | Computed on an annualized basis for periods less than one year. |
| (i) | The investment adviser agreed to waive its fees and/or reimburse a portion of the Fund’s expenses during the period. Without this waiver/reimbursement, expenses would have been higher. |
| (j) | Amount rounds to less than 0.01%. |
See accompanying notes to financial statements.
81 |
Financial Highlights (continued)
For a share outstanding throughout each period.
| | | | | | | | | | | | | | | | | | | | |
| | |
Vaughan Nelson Value Opportunity Fund—Class Y | |
| | | Year Ended
December 31,
2017 | | | Year Ended
December 31,
2016 | | | Year Ended
December 31,
2015 | | | Year Ended
December 31,
2014 | | | Year Ended
December 31,
2013 | |
Net asset value, beginning of the period | | $ | 20.77 | | | $ | 20.27 | | | $ | 21.52 | | | $ | 20.78 | | | $ | 15.57 | |
| | | | | | | | | | | | | | | | | | | | |
INCOME (LOSS) FROM INVESTMENT OPERATIONS: | | | | | | | | | | | | | | | | | | | | |
Net investment income (loss)(a) | | | 0.23 | (b) | | | 0.12 | | | | 0.09 | (c) | | | (0.02 | ) | | | 0.02 | |
Net realized and unrealized gain (loss) | | | 2.51 | | | | 1.07 | | | | (0.82 | ) | | | 2.33 | | | | 6.39 | |
| | | | | | | | | | | | | | | | | | | | |
Total from Investment Operations | | | 2.74 | | | | 1.19 | | | | (0.73 | ) | | | 2.31 | | | | 6.41 | |
| | | | | | | | | | | | | | | | | | | | |
LESS DISTRIBUTIONS FROM: | | | | | | | | | | | | | | | | | | | | |
Net investment income | | | (0.25 | ) | | | (0.13 | ) | | | (0.05 | ) | | | — | | | | (0.01 | ) |
Net realized capital gains | | | (0.37 | ) | | | (0.56 | ) | | | (0.47 | ) | | | (1.57 | ) | | | (1.19 | ) |
| | | | | | | | | | | | | | | | | | | | |
Total Distributions | | | (0.62 | ) | | | (0.69 | ) | | | (0.52 | ) | | | (1.57 | ) | | | (1.20 | ) |
| | | | | | | | | | | | | | | | | | | | |
Net asset value, end of the period | | $ | 22.89 | | | $ | 20.77 | | | $ | 20.27 | | | $ | 21.52 | | | $ | 20.78 | |
| | | | | | | | | | | | | | | | | | | | |
Total return | | | 13.19 | %(b) | | | 6.14 | % | | | (3.47 | )%(c) | | | 11.23 | % | | | 41.52 | % |
RATIOS TO AVERAGE NET ASSETS: | | | | | | | | | | | | | | | | | | | | |
Net assets, end of the period (000’s) | | $ | 774,304 | | | $ | 903,545 | | | $ | 1,133,634 | | | $ | 656,071 | | | $ | 360,820 | |
Net expenses | | | 0.97 | % | | | 0.98 | % | | | 0.98 | % | | | 1.00 | % | | | 1.02 | % |
Gross expenses | | | 0.97 | % | | | 0.98 | % | | | 0.98 | % | | | 1.00 | % | | | 1.02 | % |
Net investment income (loss) | | | 1.04 | %(b) | | | 0.62 | % | | | 0.39 | %(c) | | | (0.10 | )% | | | 0.12 | % |
Portfolio turnover rate | | | 42 | % | | | 57 | % | | | 32 | % | | | 58 | % | | | 39 | % |
| (a) | Per share net investment income (loss) has been calculated using the average shares outstanding during the period. |
| (b) | Includes a non-recurring dividend. Without this dividend, net investment income per share would have been $0.15, total return would have been 12.80% and the ratio of net investment income to average net assets would have been 0.67%. |
| (c) | Includes a non-recurring dividend. Without this dividend, net investment income per share would have been $0.05, total return would have been (3.70)% and the ratio of net investment income to average net assets would have been 0.20%. |
See accompanying notes to financial statements.
| 82
Notes to Financial Statements
December 31, 2017
1. Organization. Natixis Funds Trust I and Natixis Funds Trust II (the “Trusts” and each a “Trust”) are each organized as a Massachusetts business trust. Each Trust is registered under the Investment Company Act of 1940, as amended (the “1940 Act”), as an open-end management investment company. Each Declaration of Trust permits the Board of Trustees to authorize the issuance of an unlimited number of shares of the Trust in multiple series. The financial statements for certain funds of the Trusts are presented in separate reports. The following funds (individually, a “Fund” and collectively, the “Funds”) are included in this report:
Natixis Funds Trust I:
Natixis Oakmark International Fund
Vaughan Nelson Small Cap Value Fund (the “Small Cap Value Fund”)
Natixis Funds Trust II:
McDonnell Intermediate Municipal Bond Fund (the “Intermediate Municipal Bond Fund”)
Natixis Oakmark Fund
Vaughan Nelson Value Opportunity Fund (the “Value Opportunity Fund”)
Each Fund is a diversified investment company.
Each Fund offers Class A shares, Class C shares and Class Y shares (effective May 1, 2017 for Natixis Oakmark International Fund). Natixis Oakmark Fund, Natixis Oakmark International Fund, Small Cap Value Fund and Value Opportunity Fund also offer Class N shares (effective May 1, 2017 for Natixis Oakmark Fund, Natixis Oakmark International Fund and Small Cap Value Fund). Class T shares of the Funds are not currently available for purchase. As of the close of business on January 11, 2016, Class B shares of Natixis Oakmark Fund and Small Cap Value Fund were converted into Class A shares and are no longer offered.
Effective July 31, 2009, the Small Cap Value Fund was closed to new investors. The Fund, in its sole discretion, may permit an investor in another Vaughan Nelson-managed fund or product that follows the same investment strategy as the Fund to transfer assets from that fund or product into the Fund.
Class A shares are sold with a maximum front-end sales charge of 3.00% for Intermediate Municipal Bond Fund and 5.75% for Natixis Oakmark Fund, Natixis Oakmark International Fund, Small Cap Value Fund and Value Opportunity Fund. Class C shares do not pay a front-end sales charge, pay higher Rule 12b-1 fees than Class A shares and may be subject to a contingent deferred sales charge (“CDSC”) of 1.00% if those shares are redeemed within one year of acquisition, except for reinvested distributions. Class N and Class Y shares do not pay a front-end sales charge, a CDSC or Rule 12b-1 fees. Class N shares are offered with an initial minimum investment of $1,000,000. Class Y shares are offered with an initial minimum investment of $100,000. Certain categories of investors are exempted from the minimum investment amounts for Class N and Class Y as outlined in the relevant Fund’s prospectus.
83 |
Notes to Financial Statements (continued)
December 31, 2017
Most expenses can be directly attributed to a Fund. Expenses which cannot be directly attributed to a Fund are generally apportioned based on the relative net assets of each of the funds in Natixis Funds Trust I, Natixis Funds Trust II, Natixis Funds Trust IV and Gateway Trust (“Natixis Funds Trusts”), Loomis Sayles Funds I and Loomis Sayles Funds II (“Loomis Sayles Funds Trusts”) and Natixis ETF Trust. Expenses of a Fund are borne pro rata by the holders of each class of shares, except that each class bears expenses unique to the class (such as the Rule 12b-1 fees applicable to Class A and Class C) and transfer agent fees for each Fund are borne collectively for Class A, Class C and Class Y and individually for Class N. In addition, each class votes as a class only with respect to its own Rule 12b-1 Plan. Shares of each class would receive their pro rata share of the net assets of a Fund if the Fund were liquidated. The Trustees approve separate distributions from net investment income on each class of shares.
2. Significant Accounting Policies. The following is a summary of significant accounting policies consistently followed by each Fund in the preparation of its financial statements. The Funds’ financial statements follow the accounting and reporting guidelines provided for investment companies and are prepared in accordance with accounting principles generally accepted in the United States of America which require the use of management estimates that affect the reported amounts and disclosures in the financial statements. Actual results could differ from those estimates. Management has evaluated the events and transactions subsequent to year-end through the date the financial statements were issued and has determined that there were no material events that would require disclosure in the Funds’ financial statements.
a. Valuation. Fund securities and other investments are valued at market value based on market quotations obtained or determined by independent pricing services recommended by the adviser or subadviser and approved by the Board of Trustees. Fund securities and other investments for which market quotations are not readily available are valued at fair value as determined in good faith by the adviser or subadviser pursuant to procedures approved by the Board of Trustees, as described below. Market value is determined as follows:
Listed equity securities (including shares of closed-end investment companies and exchange-traded funds) are valued at the last sale price quoted on the exchange where they are traded most extensively or, if there is no reported sale during the day, the closing bid quotation as reported by an independent pricing service. Securities traded on the NASDAQ Global Select Market, NASDAQ Global Market and NASDAQ Capital Market are valued at the NASDAQ Official Closing Price (“NOCP”), or if lacking an NOCP, at the most recent bid quotations on the applicable NASDAQ Market. Unlisted equity securities (except unlisted preferred equity securities) are valued at the last sale price quoted in the market where they are traded most extensively or, if there is no reported sale during the day, the closing bid quotation as reported by an
| 84
Notes to Financial Statements (continued)
December 31, 2017
independent pricing service. If there is no last sale price or closing bid quotation available, unlisted equity securities will be valued using evaluated bids furnished by an independent pricing service, if available. In some foreign markets, an official close price and a last sale price may be available from the foreign exchange or market. In those cases, the official close price is used. Debt securities and unlisted preferred equity securities are valued based on evaluated bids furnished to the Funds by an independent pricing service or bid prices obtained from broker-dealers. Broker-dealer bid prices may be used to value debt and unlisted equity securities where an independent pricing service is unable to price a security or where an independent pricing service does not provide a reliable price for the security. Forward foreign currency contracts are valued utilizing interpolated rates determined based on information provided by an independent pricing service.
Fund securities and other investments for which market quotations are not readily available are valued at fair value as determined in good faith by the adviser pursuant to procedures approved by the Board of Trustees. The Funds may also value securities and other investments at fair value in other circumstances such as when extraordinary events occur after the close of a foreign market but prior to the close of the New York Stock Exchange (“NYSE”). This may include situations relating to a single issuer (such as a declaration of bankruptcy or a delisting of the issuer’s security from the primary market on which it has traded) as well as events affecting the securities markets in general (such as market disruptions or closings and significant fluctuations in U.S. and/or foreign markets). When fair valuing its securities or other investments, the Funds may, among other things, use modeling tools or other processes that may take into account factors such as securities or other market activity and/or significant events that occur after the close of the foreign market and before the time the Fund’s net asset value (“NAV”) is calculated. Fair value pricing may require subjective determinations about the value of a security, and fair values used to determine a Fund’s NAV may differ from quoted or published prices, or from prices that are used by others, for the same securities. In addition, the use of fair value pricing may not always result in adjustments to the prices of securities held by a Fund.
As of December 31, 2017, securities held by the Funds’ were fair valued as follows:
| | | | | | | | |
Fund | | Equity securities1 | | | Percentage of Net Assets | |
Natixis Oakmark International Fund | | $ | 990,375,950 | | | | 86.9 | % |
| 1 | Certain foreign equity securities were fair valued pursuant to procedures approved by the Board of Trustees as events occurring after the close of the foreign market were believed to materially affect the value of those securities. |
b. Investment Transactions and Related Investment Income. Investment transactions are accounted for on a trade date plus one day basis for daily NAV calculation. However, for financial reporting purposes, investment transactions are reported on
85 |
Notes to Financial Statements (continued)
December 31, 2017
trade date. Dividend income, including income reinvested, is recorded on ex-dividend date, or in the case of certain foreign securities, as soon as a Fund is notified, and interest income is recorded on an accrual basis. Dividends reinvested are reflected as non-cash dividends on the Statements of Operations. Interest income is increased by the accretion of discount and decreased by the amortization of premium, if applicable. Distributions received from investments in securities that represent a return of capital or capital gain are recorded as a reduction of cost of investments or as a realized gain, respectively. The calendar year-end amounts of ordinary income, capital gains, and return of capital included in distributions received from the Funds’ investments in real estate investment trusts (“REITs”) are reported to the Funds after the end of the fiscal year; accordingly, the Funds estimate these amounts for accounting purposes until the characterization of REIT distributions is reported to the Funds after the end of the fiscal year. Estimates are based on the most recent REIT distribution information available. In determining net gain or loss on securities sold, the cost of securities has been determined on an identified cost basis. Investment income, non-class specific expenses and realized and unrealized gains and losses are allocated on a pro rata basis to each class based on the relative net assets of each class to the total net assets of the Fund.
c. Foreign Currency Translation. The books and records of the Funds are maintained in U.S. dollars. The values of securities, currencies and other assets and liabilities denominated in currencies other than U.S. dollars are translated into U.S. dollars based upon foreign exchange rates prevailing at the end of the period. Purchases and sales of investment securities, income and expenses are translated into U.S. dollars on the respective dates of such transactions.
Net realized foreign exchange gains or losses arise from sales of foreign currency, changes in exchange rates between the trade and settlement dates on securities transactions and the difference between the amounts of dividends, interest and foreign withholding taxes recorded on the Fund’s books and the U.S. dollar equivalent of the amounts actually received or paid. Net unrealized foreign exchange gains or losses arise from changes in the value of assets and liabilities, other than investment securities, as of the end of the fiscal period, resulting from changes in exchange rates. Net realized foreign exchange gains or losses and the net change in unrealized foreign exchange gains or losses are disclosed in the Statements of Operations. For federal income tax purposes, net realized foreign exchange gains or losses are characterized as ordinary income, and may, if the Funds have net losses, reduce the amount of income available to be distributed by the Funds.
The values of investment securities are presented at the foreign exchange rates prevailing at the end of the period for financial reporting purposes. Net realized and unrealized gains or losses on investments reported in the Statements of Operations reflect gains or losses resulting from changes in exchange rates and fluctuations which arise due to changes in market prices of investment securities.
| 86
Notes to Financial Statements (continued)
December 31, 2017
The Funds may use foreign currency exchange contracts to facilitate transactions in foreign-denominated investments. Losses may arise from changes in the value of the foreign currency or if the counterparties do not perform under the contracts’ terms.
d. Forward Foreign Currency Contracts. Certain Funds may enter into forward foreign currency contracts, including forward foreign cross currency contracts, to acquire exposure to foreign currencies or to hedge the Fund’s investments against currency fluctuation. A contract can also be used to offset a previous contract. These contracts involve market risk in excess of the unrealized gain or loss reflected in the Funds’ Statements of Assets and Liabilities. The U.S. dollar value of the currencies a Fund has committed to buy or sell represents the aggregate exposure to each currency a Fund has acquired or hedged through currency contracts outstanding at period end. Gains or losses are recorded for financial statement purposes as unrealized until settlement date. Contracts are traded over-the-counter directly with a counterparty. Risks may arise upon entering into these contracts from the potential inability of counterparties to meet the terms of their contracts and from unanticipated movements in the value of a foreign currency relative to the U.S. dollar. Certain contracts may require the movement of cash and/or securities as collateral for the Fund’s or counterparty’s net obligations under the contracts.
e. Federal and Foreign Income Taxes. The Trusts treat each Fund as a separate entity for federal income tax purposes. Each Fund intends to meet the requirements of the Internal Revenue Code of 1986, as amended, applicable to regulated investment companies, and to distribute to its shareholders substantially all of its net investment income and any net realized capital gains at least annually. Management has performed an analysis of each Fund’s tax positions for the open tax years as of December 31, 2017, and has concluded that no provisions for income tax are required. The Funds’ federal tax returns for the prior three fiscal years remain subject to examination by the Internal Revenue Service. Management is not aware of any events that are reasonably possible to occur in the next twelve months that would result in the amounts of any unrecognized tax benefits significantly increasing or decreasing for the Funds. However, management’s conclusions regarding tax positions taken may be subject to review and adjustment at a later date based on factors including, but not limited to, new tax laws and accounting regulations and interpretations thereof.
A Fund may be subject to foreign withholding taxes on investment income and taxes on capital gains on investments that are accrued and paid based upon the Fund’s understanding of the tax rules and regulations that exist in the countries in which the Fund invests. Foreign withholding taxes on dividend and interest income are reflected on the Statements of Operations as a reduction of investment income, net of amounts eligible to be reclaimed. Dividends and interest receivable on the Statements of Assets and Liabilities are net of foreign withholding taxes. Foreign withholding taxes where reclaims have been or will be filed are reflected on the Statements of Assets and
87 |
Notes to Financial Statements (continued)
December 31, 2017
Liabilities as tax reclaims receivable. Capital gains taxes paid are included in net realized gain (loss) on investments in the Statements of Operations. Accrued but unpaid capital gains taxes are reflected as foreign taxes payable on the Statements of Assets and Liabilities, if applicable, and reduce unrealized gains on investments. In the event that realized gains on investments are subsequently offset by realized losses, taxes paid on realized gains may be returned to a Fund. Such amounts, if applicable, are reflected as foreign tax rebates receivable on the Statements of Assets and Liabilities and are recorded as a realized gain when received.
f. Dividends and Distributions to Shareholders. Dividends and distributions are recorded on ex-dividend date. The timing and characterization of certain income and capital gain distributions are determined in accordance with federal tax regulations, which may differ from accounting principles generally accepted in the United States of America. Permanent differences are primarily due to differing treatments for book and tax purposes of items such as distributions in excess of income and/or capital gain, return of capital and capital gain distributions received and foreign currency gains and losses. Permanent book and tax basis differences relating to shareholder distributions, net investment income and net realized gains will result in reclassifications to capital accounts reported on the Statements of Assets and Liabilities. Temporary differences between book and tax distributable earnings are primarily due to deferred Trustees’ fees, wash sales, forward foreign currency contracts mark-to-market and return of capital distributions received. Amounts of income and capital gain available to be distributed on a tax basis are determined annually, and at other times during the Funds’ fiscal year as may be necessary to avoid knowingly declaring and paying a return of capital distribution. Distributions from net investment income and short-term capital gains are considered to be distributed from ordinary income for tax purposes.
The tax characterization of distributions is determined on an annual basis. The tax character of distributions paid to shareholders during the years ended December 31, 2017 and 2016 were as follows:
| | | | | | | | | | | | | | | | |
| | | 2017 Distributions Paid From: | |
Fund | | Ordinary Income | | | Tax Exempt Income | | | Long-Term Capital Gains | | | Total | |
Intermediate Municipal Bond Fund | | $ | 5,473 | | | $ | 909,414 | | | $ | — | | | $ | 914,887 | |
Natixis Oakmark Fund | | | 1,117,535 | | | | — | | | | 11,807,017 | | | | 12,924,552 | |
Natixis Oakmark International Fund | | | 10,227,398 | | | | — | | | | — | | | | 10,227,398 | |
Small Cap Value Fund | | | 3,400,416 | | | | — | | | | 31,501,924 | | | | 34,902,340 | |
Value Opportunity Fund | | | 10,294,310 | | | | — | | | | 16,440,298 | | | | 26,734,608 | |
| 88
Notes to Financial Statements (continued)
December 31, 2017
| | | | | | | | | | | | | | | | |
| | | 2016 Distributions Paid From: | |
Fund | | Ordinary Income | | | Tax Exempt Income | | | Long-Term Capital Gains | | | Total | |
Intermediate Municipal Bond Fund | | $ | — | | | $ | 1,255,515 | | | $ | — | | | $ | 1,255,515 | |
Natixis Oakmark Fund | | | 1,798,205 | | | | — | | | | 7,812,896 | | | | 9,611,101 | |
Natixis Oakmark International Fund | | | 15,448,327 | | | | — | | | | — | | | | 15,448,327 | |
Small Cap Value Fund | | | 2,299,100 | | | | — | | | | 21,062,109 | | | | 23,361,209 | |
Value Opportunity Fund | | | 7,189,189 | | | | — | | | | 41,383,417 | | | | 48,572,606 | |
Differences between these amounts and those reported in the Statements of Changes in Net Assets are primarily attributable to different book and tax treatment for short-term capital gains.
As of December 31, 2017, the components of distributable earnings on a tax basis were as follows:
| | | | | | | | | | | | | | | | | | | | |
| | | Intermediate Municipal Bond Fund | | | Natixis Oakmark Fund | | | Natixis Oakmark International Fund | | | Small Cap Value Fund | | | Value Opportunity Fund | |
Undistributed ordinary income | | $ | — | | | $ | 216,454 | | | $ | — | | | $ | 1,494,478 | | | $ | 20,862 | |
Undistributed tax exempt income | | | 21,812 | | | | — | | | | — | | | | — | | | | — | |
Undistributed long-term capital gains | | | — | | | | 5,260,888 | | | | — | | | | 5,793,001 | | | | 13,084,412 | |
| | | | | | | | | | | | | | | | | | | | |
Total undistributed earnings | | | 21,812 | | | | 5,477,342 | | | | — | | | | 7,287,479 | | | | 13,105,274 | |
| | | | | | | | | | | | | | | | | | | | |
Capital loss carryforward: | | | | | | | | | | | | | | | | | |
Short-term: | | | | | | | | | | | | | | | | | | | | |
No expiration date | | | (661,262 | ) | | | — | | | | (9,965,690 | ) | | | — | | | | — | |
Long-term: | | | | | | | | | | | | | | | | | | | | |
No expiration date | | | — | | | | — | | | | (37,884,825 | ) | | | — | | | | — | |
| | | | | | | | | | | | | | | | | | | | |
Total capital loss carryforward | | | (661,262 | ) | | | — | | | | (47,850,515 | ) | | | — | | | | — | |
| | | | | | | | | | | | | | | | | | | | |
89 |
Notes to Financial Statements (continued)
December 31, 2017
| | | | | | | | | | | | | | | | | | | | |
| | | Intermediate Municipal Bond Fund | | | Natixis Oakmark Fund | | | Natixis Oakmark International Fund | | | Small Cap Value Fund | | | Value Opportunity Fund | |
Late-year ordinary and post-October capital loss deferrals* | | $ | — | | | $ | — | | | $ | (287,626 | ) | | $ | — | | | $ | — | |
| | | | | | | | | | | | | | | | | | | | |
Unrealized appreciation | | | 1,224,317 | | | | 79,369,050 | | | | 136,697,870 | | | | 35,353,962 | | | | 123,965,706 | |
| | | | | | | | | | | | | | | | | | | | |
Total accumulated earnings | | $ | 584,867 | | | $ | 84,846,392 | | | $ | 88,559,729 | | | $ | 42,641,441 | | | $ | 137,070,980 | |
| | | | | | | | | | | | | | | | | | | | |
Capital loss carryforward utilized in the current year | | $ | 97,698 | | | $ | — | | | $ | 64,949,893 | | | $ | — | | | $ | 30,427,421 | |
| | | | | | | | | | | | | | | | | | | | |
| * | Under current tax law, capital losses, foreign currency losses, and losses on passive foreign investment companies and contingent payment debt instruments after October 31 or December 31, as applicable, may be deferred and treated as occurring on the first day of the following taxable year. |
As of December 31, 2017, the cost of investments (including derivatives, if applicable) and unrealized appreciation (depreciation) on a federal tax basis were as follows:
| | | | | | | | | | | | | | | | | | | | |
| | | Intermediate Municipal Bond Fund | | | Natixis Oakmark Fund | | | Natixis Oakmark International Fund | | | Small Cap Value Fund | | | Value Opportunity Fund | |
Federal tax cost | | $ | 36,291,111 | | | $ | 236,656,937 | | | $ | 1,004,646,073 | | | $ | 252,383,899 | | | $ | 900,236,104 | |
| | | | | | | | | | | | | | | | | | | | |
Gross tax appreciation | | | 1,279,160 | | | | 88,265,455 | | | | 160,148,278 | | | | 40,305,724 | | | | 162,918,280 | |
Gross tax depreciation | | | (54,843 | ) | | | (8,896,405 | ) | | | (23,504,023 | ) | | | (4,951,762 | ) | | | (38,952,574 | ) |
| | | | | | | | | | | | | | | | | | | | |
Net tax appreciation | | $ | 1,224,317 | | | $ | 79,369,050 | | | $ | 136,644,255 | | | $ | 35,353,962 | | | $ | 123,965,706 | |
| | | | | | | | | | | | | | | | | | | | |
Differences between these amounts and those reported in the components of distributable earnings are primarily attributable to foreign currency mark-to-market.
g. Repurchase Agreements. Each Fund may enter into repurchase agreements, under the terms of a Master Repurchase Agreement, under which each Fund acquires securities as collateral and agrees to resell the securities at an agreed upon time and at an agreed upon price. It is each Fund’s policy that the market value of the collateral
| 90
Notes to Financial Statements (continued)
December 31, 2017
for repurchase agreements be at least equal to 102% of the repurchase price, including interest. Certain repurchase agreements are tri-party arrangements whereby the collateral is held in a segregated account for the benefit of the Fund and on behalf of the counterparty. Repurchase agreements could involve certain risks in the event of default or insolvency of the counterparty, including possible delays or restrictions upon a Fund’s ability to dispose of the underlying securities. As of December 31, 2017, each Fund, as applicable, had investments in repurchase agreements for which the value of the related collateral exceeded the value of the repurchase agreement. The gross value of repurchase agreements is included in the Statements of Assets and Liabilities for financial reporting purposes.
h. Securities Lending. Certain Funds have entered into an agreement with State Street Bank and Trust Company (“State Street Bank”), as agent of the Funds, to lend securities to certain designated borrowers. The loans are collateralized with cash or securities in an amount equal to at least 105% or 102% of the market value (including accrued interest) of the loaned international or domestic securities, respectively, when the loan is initiated. Thereafter, the value of the collateral must remain at least 102% of the market value (including accrued interest) of loaned securities for U.S. equities and U.S. corporate debt; at least 105% of the market value (including accrued interest) of loaned securities for non-U.S. equities; and at least 100% of the market value (including accrued interest) of loaned securities for U.S. Government securities, sovereign debt issued by non-U.S. Governments and non-U.S. corporate debt. In the event that the market value of the collateral falls below the required percentages described above, the borrower will deliver additional collateral on the next business day. As with other extensions of credit, the Funds may bear the risk of loss with respect to the investment of the collateral. The Funds invest cash collateral in short-term investments, a portion of the income from which is remitted to the borrowers and the remainder allocated between the Funds and State Street Bank as lending agent.
For the year ended December 31, 2017, none of the Funds had loaned securities under this agreement.
i. Indemnifications. Under the Trusts’ organizational documents, their officers and Trustees are indemnified against certain liabilities arising out of the performance of their duties to the Funds. Additionally, in the normal course of business, the Funds enter into contracts with service providers that contain general indemnification clauses. The Funds’ maximum exposure under these arrangements is unknown as this would involve future claims that may be made against the Funds that have not yet occurred. However, based on experience, the Funds expect the risk of loss to be remote.
91 |
Notes to Financial Statements (continued)
December 31, 2017
3. Fair Value Measurements. In accordance with accounting standards related to fair value measurements and disclosures, the Funds have categorized the inputs utilized in determining the value of each Fund’s assets or liabilities. These inputs are summarized in the three broad levels listed below:
| | • | | Level 1 – quoted prices in active markets for identical assets or liabilities; |
| | • | | Level 2 – prices determined using other significant inputs that are observable either directly, or indirectly through corroboration with observable market data (which could include quoted prices for similar assets or liabilities, interest rates, credit risk, etc.); and |
| | • | | Level 3 – prices determined using significant unobservable inputs when quoted prices or observable inputs are unavailable such as when there is little or no market activity for an asset or liability (unobservable inputs reflect each Fund’s own assumptions in determining the fair value of assets or liabilities and would be based on the best information available). |
The inputs or methodology used for valuing securities are not necessarily an indication of the risk associated with investing in those securities.
The following is a summary of the inputs used to value the Funds’ investments as of December 31, 2017, at value:
Intermediate Municipal Bond Fund
Asset Valuation Inputs
| | | | | | | | | | | | | | | | |
Description | | Level 1 | | | Level 2 | | | Level 3 | | | Total | |
Bonds and Notes(a) | | $ | — | | | $ | 34,999,167 | | | $ | — | | | $ | 34,999,167 | |
Exchange-Traded Funds | | | 520,200 | | | | — | | | | — | | | | 520,200 | |
Short-Term Investments | | | — | | | | 1,996,061 | | | | — | | | | 1,996,061 | |
| | | | | | | | | | | | | | | | |
Total | | $ | 520,200 | | | $ | 36,995,228 | | | $ | — | | | $ | 37,515,428 | |
| | | | | | | | | | | | | | | | |
| (a) | Details of the major categories of the Fund’s investments are reflected within the Portfolio of Investments. |
For the year ended December 31, 2017, there were no transfers among Levels 1, 2 and 3.
Natixis Oakmark Fund
Asset Valuation Inputs
| | | | | | | | | | | | | | | | |
Description | | Level 1 | | | Level 2 | | | Level 3 | | | Total | |
Common Stocks(a) | | $ | 298,453,453 | | | $ | — | | | $ | — | | | $ | 298,453,453 | |
Short-Term Investments | | | — | | | | 17,572,534 | | | | — | | | | 17,572,534 | |
| | | | | | | | | | | | | | | | |
Total | | $ | 298,453,453 | | | $ | 17,572,534 | | | $ | — | | | $ | 316,025,987 | |
| | | | | | | | | | | | | | | | |
| (a) | Details of the major categories of the Fund’s investments are reflected within the Portfolio of Investments. |
| 92
Notes to Financial Statements (continued)
December 31, 2017
For the year ended December 31, 2017, there were no transfers among Levels 1, 2 and 3.
Natixis Oakmark International Fund
Asset Valuation Inputs
| | | | | | | | | | | | | | | | |
Description | | Level 1 | | | Level 2 | | | Level 3 | | | Total | |
Common Stocks | | | | | | | | | | | | | | | | |
Australia | | $ | — | | | $ | 33,550,312 | | | $ | — | | | $ | 33,550,312 | |
France | | | — | | | | 159,586,254 | | | | — | | | | 159,586,254 | |
Germany | | | — | | | | 169,339,446 | | | | — | | | | 169,339,446 | |
Indonesia | | | — | | | | 20,211,894 | | | | — | | | | 20,211,894 | |
Italy | | | — | | | | 42,796,357 | | | | — | | | | 42,796,357 | |
Japan | | | — | | | | 53,078,828 | | | | — | | | | 53,078,828 | |
Korea | | | — | | | | 1,520,583 | | | | — | | | | 1,520,583 | |
Netherlands | | | — | | | | 42,561,995 | | | | — | | | | 42,561,995 | |
Sweden | | | — | | | | 63,461,571 | | | | — | | | | 63,461,571 | |
Switzerland | | | — | | | | 168,605,681 | | | | — | | | | 168,605,681 | |
Taiwan | | | — | | | | 3,001,572 | | | | — | | | | 3,001,572 | |
United Kingdom | | | 30,630,560 | | | | 232,661,457 | | | | — | | | | 263,292,017 | |
All Other Common Stocks(a) | | | 61,296,131 | | | | — | | | | — | | | | 61,296,131 | |
| | | | | | | | | | | | | | | | |
Total Common Stocks | | | 91,926,691 | | | | 990,375,950 | | | | — | | | | 1,082,302,641 | |
| | | | | | | | | | | | | | | | |
Short-Term Investments | | | — | | | | 58,993,933 | | | | — | | | | 58,993,933 | |
Forward Foreign Currency Contracts (unrealized appreciation) | | | — | | | | 338,799 | | | | — | | | | 338,799 | |
| | | | | | | | | | | | | | | | |
Total | | $ | 91,926,691 | | | $ | 1,049,708,682 | | | $ | — | | | $ | 1,141,635,373 | |
| | | | | | | | | | | | | | | | |
| (a) | Details of the major categories of the Fund’s investments are reflected within the Portfolio of Investments. |
For the year ended December 31, 2017, there were no transfers among Levels 1, 2 and 3.
Small Cap Value Fund
Asset Valuation Inputs
| | | | | | | | | | | | | | | | |
Description | | Level 1 | | | Level 2 | | | Level 3 | | | Total | |
Common Stocks(a) | | $ | 276,070,793 | | | $ | — | | | $ | — | | | $ | 276,070,793 | |
Exchange-Traded Funds | | | 3,888,819 | | | | — | | | | — | | | | 3,888,819 | |
Closed-End Investment Companies | | | 3,491,862 | | | | — | | | | — | | | | 3,491,862 | |
Short-Term Investments | | | — | | | | 4,286,387 | | | | — | | | | 4,286,387 | |
| | | | | | | | | | | | | | | | |
Total | | $ | 283,451,474 | | | $ | 4,286,387 | | | $ | — | | | $ | 287,737,861 | |
| | | | | | | | | | | | | | | | |
| (a) | Details of the major categories of the Fund’s investments are reflected within the Portfolio of Investments. |
93 |
Notes to Financial Statements (continued)
December 31, 2017
For the year ended December 31, 2017, there were no transfers among Levels 1, 2 and 3.
Value Opportunity Fund
Asset Valuation Inputs
| | | | | | | | | | | | | | | | |
Description | | Level 1 | | | Level 2 | | | Level 3 | | | Total | |
Common Stocks(a) | | $ | 986,384,602 | | | $ | — | | | $ | — | | | $ | 986,384,602 | |
Closed-End Investment Companies | | | 23,687,682 | | | | — | | | | — | | | | 23,687,682 | |
Short-Term Investments | | | — | | | | 14,129,526 | | | | — | | | | 14,129,526 | |
| | | | | | | | | | | | | | | | |
Total | | $ | 1,010,072,284 | | | $ | 14,129,526 | | | $ | — | | | $ | 1,024,201,810 | |
| | | | | | | | | | | | | | | | |
| (a) | Details of the major categories of the Fund’s investments are reflected within the Portfolio of Investments. |
For the year ended December 31, 2017, there were no transfers among Levels 1, 2 and 3.
4. Derivatives. Derivative instruments are defined as financial instruments whose value and performance are based on the value and performance of an underlying asset, reference rate or index. Derivative instruments that Natixis Oakmark International Fund used during the period include forward foreign currency contracts.
The Fund is subject to the risk that changes in foreign currency exchange rates will have an unfavorable effect on the value of Fund assets denominated in foreign currencies. The Fund may enter into forward foreign currency contracts for hedging purposes to protect the value of the Fund’s holdings of foreign securities. During the year ended December 31, 2017, the Fund engaged in forward foreign currency transactions for hedging purposes.
The following is a summary of derivative instruments for Natixis Oakmark International Fund as of December 31, 2017, as reflected within the Statements of Assets and Liabilities:
| | | | |
Assets | | Unrealized
appreciation on
forward foreign
currency contracts | |
Over-the-counter asset derivatives | | | | |
Foreign exchange contracts | | $ | 338,799 | |
| 94
Notes to Financial Statements (continued)
December 31, 2017
Transactions in derivative instruments for Natixis Oakmark International Fund during the year ended December 31, 2017, as reflected within the Statements of Operations were as follows:
| | |
Net Realized Gain (Loss) on: | | Forward foreign currency contracts |
| Foreign exchange contracts | | $811,579 |
| |
Net Change in Unrealized Appreciation (Depreciation) on: | | Forward foreign currency contracts |
| Foreign exchange contracts | | $(1,137,918) |
As the Fund values its derivatives at fair value and recognizes changes in fair value through the Statements of Operations, it does not qualify for hedge accounting under authoritative guidance for derivative instruments. The Fund’s investments in derivatives may represent an economic hedge; however, they are considered to be non-hedge transactions for the purpose of these disclosures.
The volume of forward foreign currency contract activity, as a percentage of net assets, for Natixis Oakmark International Fund, based on gross month-end notional amounts outstanding during the period, including long and short positions at absolute value, was as follows for the year ended December 31, 2017:
| | | | |
Natixis Oakmark International Fund | | Forwards | |
Average Notional Amount Outstanding | | | 1.98 | % |
Highest Notional Amount Outstanding | | | 4.28 | % |
Lowest Notional Amount Outstanding | | | 1.05 | % |
Notional Amount Outstanding as of December 31, 2017 | | | 1.43 | % |
Notional amounts outstanding at the end of the prior period are included in the average notional amount outstanding.
Unrealized gain and/or loss on open forwards is recorded in the Statements of Assets and Liabilities. The aggregate notional values of forward contracts are not recorded in the Statements of Assets and Liabilities, and therefore are not included in the Fund’s net assets.
The Fund enters into over-the-counter derivatives, including forward foreign currency contracts, pursuant to an International Swaps and Derivatives Association, Inc. (“ISDA”) agreement between the Fund and its counterparty. ISDA agreements typically contain master netting provisions in the event of a default or other termination event. Master netting provisions allow the Fund and the counterparty, in the event of a default or other termination event, to offset amounts owed by each related to derivative
95 |
Notes to Financial Statements (continued)
December 31, 2017
contracts to one net amount payable by either the Fund or the counterparty. For financial reporting purposes, the Fund does not offset derivative assets and liabilities on the Statements of Assets and Liabilities.
As of December 31, 2017, gross amounts of derivative assets and liabilities not offset in the Statement of Assets and Liabilities and the related net amounts after taking into account master netting arrangements, by counterparty, are as follows:
Natixis Oakmark International Fund
| | | | | | | | | | | | |
Counterparty | | Gross Amounts of
Assets | | | Offset
Amount | | | Net
Amount | |
State Street Bank and Trust Company | | $ | 338,799 | | | $ | — | | | $ | 338,799 | |
Counterparty risk is managed based on policies and procedures established by each Fund’s adviser. Such policies and procedures may include, but are not limited to, minimum counterparty credit rating requirements and monitoring of counterparty credit default swap spreads. Based on balances reflected on the Fund’s Statement of Assets and Liabilities, the following table shows (i) the maximum amount of loss due to credit risk that, based on the gross fair value of the financial instrument, the Fund would incur if parties to the relevant financial instruments failed completely to perform according to the terms of the contracts and ii) the amount of loss that the Fund would incur after taking into account master netting provisions pursuant to ISDA agreements, as of December 31, 2017:
| | | | | | | | |
Fund | | Maximum Amount of
Loss - Gross | | | Maximum Amount of
Loss - Net | |
Natixis Oakmark International Fund | | $ | 338,799 | | | $ | 338,799 | |
5. Purchases and Sales of Securities. For the year ended December 31, 2017, purchases and sales of securities (excluding short-term investments and U.S. Government/Agency securities and including paydowns) were as follows:
| | | | | | | | |
Fund | | Purchases | | | Sales | |
Intermediate Municipal Bond Fund | | $ | 14,661,631 | | | $ | 39,144,321 | |
Natixis Oakmark Fund | | | 52,835,002 | | | | 44,080,632 | |
Natixis Oakmark International Fund | | | 453,014,258 | | | | 371,564,712 | |
Small Cap Value Fund | | | 274,335,770 | | | | 306,635,356 | |
Value Opportunity Fund | | | 445,224,794 | | | | 769,126,959 | |
6. Management Fees and Other Transactions with Affiliates.
a. Management Fees. Natixis Advisors, L.P. (“Natixis Advisors”), serves as investment adviser to each Fund. Under the terms of the management agreements, each Fund pays
| 96
Notes to Financial Statements (continued)
December 31, 2017
a management fee at the following annual rates, calculated daily and payable monthly, based on each Fund’s average daily net assets:
| | | | | | | | | | | | | | | | | | | | | | | | |
| | | Percentage of Average Daily Net Assets | |
Fund | | First $200 million | | | Next $300 million | | | Next $500 million | | | Next $500 million | | | Next $500 million | | | Over $2 billion | |
Intermediate Municipal Bond Fund | | | 0.40 | % | | | 0.40 | % | | | 0.40 | % | | | 0.40 | % | | | 0.40 | % | | | 0.40 | % |
Natixis Oakmark Fund | | | 0.70 | % | | | 0.65 | % | | | 0.60 | % | | | 0.60 | % | | | 0.60 | % | | | 0.60 | % |
Natixis Oakmark International Fund | | | 0.85 | % | | | 0.85 | % | | | 0.85 | % | | | 0.85 | % | | | 0.85 | % | | | 0.85 | % |
Small Cap Value Fund | | | 0.90 | % | | | 0.90 | % | | | 0.90 | % | | | 0.90 | % | | | 0.90 | % | | | 0.90 | % |
Value Opportunity Fund | | | 0.80 | % | | | 0.80 | % | | | 0.80 | % | | | 0.80 | % | | | 0.75 | % | | | 0.75 | % |
Natixis Advisors has entered into subadvisory agreements for each Fund as listed below.
| | |
Intermediate Municipal Bond Fund | | McDonnell Investment Management, LLC (“McDonnell”) |
Natixis Oakmark Fund | | Harris Associates L.P. (“Harris”) |
Natixis Oakmark International Fund | | Harris |
Small Cap Value Fund | | Vaughan Nelson Investment Management, L.P. (“Vaughan Nelson”) |
Value Opportunity Fund | | Vaughan Nelson |
Under the terms of the subadvisory agreements, each Fund has agreed to pay its respective subadviser a subadvisory fee at the following annual rates, calculated daily and payable monthly, based on each Fund’s average daily net assets:
| | | | | | | | | | | | | | |
| | | | | Percentage of Average
Daily Net Assets | |
Fund | | Subadviser | | First $200 million | | | Next $1.3 billion | | | Over $1.5 billion | |
Intermediate Municipal Bond Fund | | McDonnell | | | 0.20 | % | | | 0.20 | % | | | 0.20 | % |
Natixis Oakmark Fund | | Harris | | | 0.52 | % | | | 0.50 | % | | | 0.50 | % |
Natixis Oakmark International Fund | | Harris | | | 0.60 | % | | | 0.60 | % | | | 0.60 | % |
Small Cap Value Fund | | Vaughan Nelson | | | 0.55 | % | | | 0.55 | % | | | 0.55 | % |
Value Opportunity Fund | | Vaughan Nelson | | | 0.50 | % | | | 0.50 | % | | | 0.47 | % |
97 |
Notes to Financial Statements (continued)
December 31, 2017
Natixis Advisors has given binding undertakings to the Funds to waive management fees and/or reimburse certain expenses to limit the Funds’ operating expenses, exclusive of acquired fund fees and expenses, brokerage expenses, interest expense, substitute dividend expenses on securities sold short, taxes, organizational and extraordinary expenses, such as litigation and indemnification expenses. These undertakings are in effect until April 30, 2018, may be terminated before then only with the consent of the Funds’ Board of Trustees, and are reevaluated on an annual basis. Management fees payable, as reflected on the Statements of Assets and Liabilities, is net of waivers and/or expense reimbursements, if any, pursuant to these undertakings. Waivers/reimbursements that exceed management fees payable are reflected on the Statements of Assets and Liabilities as receivable from investment adviser.
For the year ended December 31, 2017 the expense limits as a percentage of average daily net assets under the expense limitation agreements were as follows:
| | | | | | | | | | | | | | | | |
| | | Expense Limit as a Percentage of
Average Daily Net Assets | |
Fund | | Class A | | | Class C | | | Class N | | | Class Y | |
Intermediate Municipal Bond Fund | | | 0.70 | % | | | 1.45 | % | | | — | | | | 0.45 | % |
Natixis Oakmark Fund | | | 1.30 | % | | | 2.05 | % | | | 1.00 | % | | | 1.05 | % |
Natixis Oakmark International Fund | | | 1.45 | % | | | 2.20 | % | | | 1.15 | % | | | 1.20 | % |
Small Cap Value Fund | | | 1.45 | % | | | 2.20 | % | | | 1.15 | % | | | 1.20 | % |
Value Opportunity Fund | | | 1.40 | % | | | 2.15 | % | | | 1.10 | % | | | 1.15 | % |
Natixis Advisors shall be permitted to recover expenses it has borne under the expense limitation agreements (whether through waiver of its management fees or otherwise) on a class by class basis in later periods to the extent the annual operating expenses of a class fall below a class’ expense limits, provided, however, that a class is not obligated to pay such waived/reimbursed fees or expenses more than one year after the end of the fiscal year in which the fees or expenses were waived/reimbursed.
For the year ended December 31, 2017, the management fees and waivers of management fees for each Fund were as follows:
| | | | | | | | | | | | | | | | | | | | |
Fund | | Gross Management
Fees | | | Contractual Waivers of Management Fees1 | | | Net Management Fees | | | Percentage of Average Daily Net Assets | |
| | | | | Gross | | | Net | |
Intermediate Municipal Bond Fund | | $ | 182,612 | | | $ | 174,060 | | | $ | 8,552 | | | | 0.40 | % | | | 0.02 | % |
Natixis Oakmark Fund | | | 1,931,901 | | | | — | | | | 1,931,901 | | | | 0.69 | % | | | 0.69 | % |
Natixis Oakmark International Fund | | | 8,209,610 | | | | — | | | | 8,209,610 | | | | 0.85 | % | | | 0.85 | % |
Small Cap Value Fund | | | 2,776,415 | | | | — | | | | 2,776,415 | | | | 0.90 | % | | | 0.90 | % |
Value Opportunity Fund | | | 8,663,668 | | | | — | | | | 8,663,668 | | | | 0.80 | % | | | 0.80 | % |
| 1 | Management fee waivers are subject to possible recovery until December 31, 2018. |
| 98
Notes to Financial Statements (continued)
December 31, 2017
No expenses were recovered during the year ended December 31, 2017 under the terms of the expense limitation agreement.
Certain officers and directors of Natixis Advisors and its affiliates are also officers or Trustees of the Funds. Natixis Advisors, McDonnell, Harris and Vaughan Nelson are subsidiaries of Natixis Investment Managers, L.P. (“Natixis”), which is part of Natixis Investment Managers, an international asset management group based in Paris, France.
b. Service and Distribution Fees. Natixis Distribution, L.P. (“Natixis Distribution”), which is a wholly-owned subsidiary of Natixis, has entered into a distribution agreement with the Trusts. Pursuant to this agreement, Natixis Distribution serves as principal underwriter of the Funds of the Trusts.
Pursuant to Rule 12b-1 under the 1940 Act, the Trusts have adopted a Service Plan relating to each Fund’s Class A shares (the “Class A Plans”) and a Distribution and Service Plan relating to each Fund’s Class C shares (the “Class C Plans”).
Under the Class A Plans, each Fund pays Natixis Distribution a monthly service fee at an annual rate not to exceed 0.25% of the average daily net assets attributable to the Funds’ Class A shares, as reimbursement for expenses incurred by Natixis Distribution in providing personal services to investors in Class A shares and/or the maintenance of shareholder accounts.
Under the Class C Plans, each Fund pays (or paid) Natixis Distribution a monthly service fee at an annual rate not to exceed 0.25% of the average daily net assets attributable to the Funds’ Class C shares, as compensation for services provided by Natixis Distribution in providing personal services to investors in Class C shares and/or the maintenance of shareholder accounts.
Also under the Class C Plans, each Fund pays (or paid) Natixis Distribution a monthly distribution fee at an annual rate of 0.75% of the average daily net assets attributable to the Funds’ Class C shares, as compensation for services provided by Natixis Distribution in connection with the marketing or sale of Class C shares.
For the year ended December 31, 2017, the service and distribution fees for each Fund were as follows:
| | | | | | | | | | | | |
| | | Service Fees | | | Distribution Fees | |
Fund | | Class A | | | Class C | | | Class C | |
Intermediate Municipal Bond Fund | | $ | 13,300 | | | $ | 7,278 | | | $ | 21,834 | |
Natixis Oakmark Fund | | | 461,458 | | | | 147,974 | | | | 443,921 | |
Natixis Oakmark International Fund | | | 1,532,273 | | | | 757,037 | | | | 2,271,112 | |
Small Cap Value Fund | | | 248,096 | | | | 44,375 | | | | 133,126 | |
Value Opportunity Fund | | | 186,275 | | | | 139,128 | | | | 417,383 | |
99 |
Notes to Financial Statements (continued)
December 31, 2017
c. Administrative Fees. Natixis Advisors provides certain administrative services for the Funds and contracts with State Street Bank to serve as sub-administrator. Pursuant to an agreement among Natixis Funds Trusts, Loomis Sayles Funds Trusts, Natixis ETF Trust and Natixis Advisors, each Fund pays Natixis Advisors monthly its pro rata portion of fees equal to an annual rate of 0.0575% of the first $15 billion of the average daily net assets of the Natixis Funds Trusts, Loomis Sayles Funds Trusts and Natixis ETF Trust, 0.0500% of the next $15 billion, 0.0400% of the next $30 billion, 0.0350% of the next $30 billion and 0.0325% of such assets in excess of $90 billion, subject to an annual aggregate minimum fee for the Natixis Funds Trusts, Loomis Sayles Funds Trusts and Natixis ETF Trust of $10 million, which is reevaluated on an annual basis.
For the year ended December 31, 2017, the administrative fees for each Fund were as follows:
| | | | |
Fund | | Administrative Fees | |
Intermediate Municipal Bond Fund | | $ | 20,348 | |
Natixis Oakmark Fund | | | 125,161 | |
Natixis Oakmark International Fund | | | 429,971 | |
Small Cap Value Fund | | | 137,407 | |
Value Opportunity Fund | | | 482,459 | |
d. Sub-Transfer Agent Fees. Natixis Distribution has entered into agreements, which include servicing agreements, with financial intermediaries that provide recordkeeping, processing, shareholder communications and other services to customers of the intermediaries that hold positions in the Funds and has agreed to compensate the intermediaries for providing those services. Intermediaries transact with the Funds primarily through the use of omnibus accounts on behalf of their customers who hold positions in the Funds. These services would have been provided by the Funds’ transfer agent and other service providers if the shareholders’ accounts were maintained directly at the Funds’ transfer agent. Accordingly, the Funds have agreed to reimburse Natixis Distribution for all or a portion of the servicing fees paid to these intermediaries. The reimbursement amounts (sub-transfer agent fees) paid to Natixis Distribution are subject to a current per-account equivalent fee limit approved by the Funds’ Board of Trustees, which is based on fees for similar services paid to the Funds’ transfer agent and other service providers. Class N shares do not bear such expenses.
| 100
Notes to Financial Statements (continued)
December 31, 2017
For the year ended December 31, 2017, the sub-transfer agent fees (which are reflected in transfer agent fees and expenses in the Statements of Operations) for each Fund were as follows:
| | | | |
Fund | | Sub-Transfer Agent Fees | |
Intermediate Municipal Bond Fund | | $ | 10,272 | |
Natixis Oakmark Fund | | | 133,417 | |
Natixis Oakmark International Fund | | | 897,538 | |
Small Cap Value Fund | | | 175,013 | |
Value Opportunity Fund | | | 758,093 | |
As of December 31, 2017, the Funds owe Natixis Distribution the following reimbursements for sub-transfer agent fees (which are reflected in the Statements of Assets and Liabilities as payable to distributor):
| | | | |
Fund | | Reimbursements of Sub-Transfer Agent Fees | |
Intermediate Municipal Bond Fund | | $ | 118 | |
Natixis Oakmark Fund | | | 1,704 | |
Natixis Oakmark International Fund | | | 12,095 | |
Small Cap Value Fund | | | 2,129 | |
Value Opportunity Fund | | | 10,003 | |
Sub-transfer agent fees attributable to Class A, Class C and Class Y are allocated on a pro rata basis to each class based on the relative net assets of each class to the total net assets of those classes.
e. Commissions. Commissions (including CDSCs) on Fund shares retained by Natixis Distribution during the year ended December 31, 2017, were as follows:
| | | | |
Fund | | Commissions | |
Intermediate Municipal Bond Fund | | $ | 1,361 | |
Natixis Oakmark Fund | | | 38,592 | |
Natixis Oakmark International Fund | | | 227,914 | |
Small Cap Value Fund | | | 2,061 | |
Value Opportunity Fund | | | 8,590 | |
f. Trustees Fees and Expenses. The Trusts do not pay any compensation directly to their officers or Trustees who are directors, officers or employees of Natixis Advisors, Natixis Distribution, Natixis or their affiliates. The Chairperson of the Board of Trustees receives a retainer fee at the annual rate of $325,000. The Chairperson does not receive any meeting attendance fees for Board of Trustees meetings or committee meetings that he attends. Each Independent Trustee (other than the Chairperson) receives, in
101 |
Notes to Financial Statements (continued)
December 31, 2017
the aggregate, a retainer fee at the annual rate of $155,000. Each Independent Trustee also receives a meeting attendance fee of $10,000 for each meeting of the Board of Trustees that he or she attends in person and $5,000 for each meeting of the Board of Trustees that he or she attends telephonically. In addition, the chairperson of the Contract Review Committee and the chairperson of the Audit Committee each receive an additional retainer fee at the annual rate of $17,500. The chairperson of the Governance Committee receives an additional retainer fee at the annual rate of $10,000. Each Contract Review Committee member is compensated $6,000 for each Committee meeting that he or she attends in person and $3,000 for each meeting that he or she attends telephonically. Each Audit Committee member is compensated $6,000 for each Committee meeting that he or she attends in person and $3,000 for each meeting that he or she attends telephonically. These fees are allocated among the funds in the Natixis Funds Trusts and Loomis Sayles Funds Trusts based on a formula that takes into account, among other factors, the relative net assets of each fund. Trustees are reimbursed for travel expenses in connection with attendance at meetings.
Effective January 1, 2018, the Chairperson of the Board will receive a retainer fee at the annual rate of $340,000, each Independent Trustee (other than the Chairperson) will receive, in the aggregate, a retainer fee at the annual rate of $170,000, the chairperson of the Contract Review Committee and Audit Committee each will receive an additional retainer fee at the annual rate of $20,000 and the chairperson of the Governance Committee will receive an additional retainer fee at the annual of $12,000. All other Trustee fees will remain unchanged.
A deferred compensation plan (the “Plan”) is available to the Trustees on a voluntary basis. Deferred amounts remain in the Funds until distributed in accordance with the provisions of the Plan. The value of a participating Trustee’s deferral account is based on theoretical investments of deferred amounts, on the normal payment dates, in certain funds of the Natixis Funds Trusts and Loomis Sayles Funds Trusts as designated by the participating Trustees. Changes in the value of participants’ deferral accounts are allocated pro rata among the funds in the Natixis Funds Trusts, Loomis Sayles Funds Trusts and Natixis ETF Trust, and are normally reflected as Trustees’ fees and expenses in the Statements of Operations. The portions of the accrued obligations allocated to the Funds under the Plan are reflected as Deferred Trustees’ fees in the Statements of Assets and Liabilities.
g. Payment by Affiliates. During the year ended December 31, 2017, Vaughan Nelson reimbursed Small Cap Value Fund $1,678 in connection with a trading error.
h. Affiliated Ownership. As of December 31, 2017, Natixis US and affiliates held shares of Natixis Oakmark Fund, Natixis Oakmark International Fund, and Small Cap Value Fund, each representing less than 0.01% of the Funds’ net assets. Investment activities of affiliated shareholders could have material impacts on the Funds.
| 102
Notes to Financial Statements (continued)
December 31, 2017
i. Reimbursement of Transfer Agent Fees and Expenses. Natixis Advisors has given a binding contractual undertaking to Natixis Oakmark Fund, Natixis Oakmark International Fund and Small Cap Value Fund to reimburse any and all transfer agency expenses for the Funds’ Class N shares. This undertaking is in effect through April 30, 2018 and is not subject to recovery under the expense limitation agreement described above.
For the year ended December 31, 2017, Natixis Advisors reimbursed the Funds for transfer agency expenses as follows:
| | | | |
Fund | | Reimbursement of Transfer Agency Expenses Class N | |
Natixis Oakmark Fund | | $ | 93 | |
Natixis Oakmark International Fund | | | 174 | |
Small Cap Value Fund | | | 93 | |
7. Class-Specific Transfer Agent Fees and Expenses. Transfer agent fees and expenses for Natixis Oakmark Fund, Natixis Oakmark International Fund, Small Cap Value Fund and Value Opportunity Fund attributable to Class A, Class C and Class Y are allocated on a pro rata basis to each class based on the relative net assets of each class to the total net assets of those classes. Transfer agent fees and expenses attributable to Class N are allocated to Class N.
Intermediate Municipal Bond Fund allocates transfer agent fees and expenses on a pro rata basis based on the relative net assets of each class to the total net assets of those classes.
For the year ended December 31, 2017, Value Opportunity Fund incurred the following class-specific transfer agent fees and expenses (including sub-transfer agent fees, where applicable):
| | | | | | | | | | | | | | | | |
| | | Transfer Agent Fees and Expenses | |
Fund | | Class A | | | Class C | | | Class N | | | Class Y | |
Value Opportunity Fund | | $ | 66,597 | | | $ | 49,740 | | | $ | 990 | | | $ | 723,553 | |
For the period from May 1, 2017, commencement of Class N operations, through December 31, 2017, Natixis Oakmark Fund, Natixis Oakmark International Fund and Small Cap Value Fund incurred the following class-specific transfer agent fees and expenses (including sub-transfer agent fees, where applicable):
| | | | | | | | | | | | | | | | |
| | | Transfer Agent Fees and Expenses | |
Fund | | Class A | | | Class C | | | Class N | | | Class Y | |
Natixis Oakmark Fund | | $ | 115,828 | | | $ | 36,605 | | | $ | 93 | | | $ | 25,624 | |
Natixis Oakmark International Fund | | | 403,861 | | | | 202,851 | | | | 174 | | | | 47,246 | |
Small Cap Value Fund | | | 50,814 | | | | 8,922 | | | | 93 | | | | 101,726 | |
103 |
Notes to Financial Statements (continued)
December 31, 2017
8. Line of Credit. Each Fund, together with certain other funds of Natixis Funds Trusts and Loomis Sayles Funds Trusts, entered into a 364-day, $400,000,000 syndicated, committed, unsecured line of credit with Citibank, N.A. to be used for temporary or emergency purposes only. Any one Fund may borrow up to the full $400,000,000 under the line of credit (as long as all borrowings by all Funds in the aggregate do not exceed the $400,000,000 limit at any time) subject to each Fund’s investment restrictions. Interest is charged to the Funds at a rate equal to the greater of the eurodollar or the federal funds rate plus 1.00%. In addition, a commitment fee of 0.15% per annum, payable on the last business day of each month, is accrued and apportioned among the participating funds based on their average daily unused portion of the line of credit. The Funds paid an arrangement fee, an upfront fee, and other fees in connection with the new line of credit agreement, which are being amortized over a period of 364 days and are reflected as miscellaneous expenses on the Statements of Operations. The unamortized balance is reflected as prepaid expenses on the Statements of Assets and Liabilities.
Prior to April 13, 2017, the commitment fee was 0.10% per annum based on the average daily unused portion of the line of credit.
For the period ended December 31, 2017, none of the Funds had borrowings under these agreements.
9. Concentration of Risk. The Natixis Oakmark International Fund’s investments in foreign securities are subject to foreign currency fluctuations, higher volatility than U.S. securities, varying degrees of regulation and limited liquidity. Greater political, economic, credit and information risks are also associated with foreign securities.
10. Concentration of Ownership. From time to time, a Fund may have a concentration of one or more accounts constituting a significant percentage of shares outstanding. Investment activities by holders of such accounts could have material impacts on the Funds. As of December 31, 2017, based on management’s evaluation of the shareholder account base, the Funds had accounts representing controlling ownership of more than 5% of the Funds’ total outstanding shares. The number of such accounts, based on accounts that represent more than 5% of an individual class of shares, and the aggregate percentage of net assets represented by such holdings were as follows:
| | | | | | | | |
Fund | | Number of 5% Non-Affiliated Account Holders | | | Percentage of Ownership | |
Natixis Oakmark International Fund | | | 1 | | | | 6.77 | % |
Small Cap Value Fund | | | 2 | | | | 23.27 | % |
Value Opportunity Fund | | | 2 | | | | 21.87 | % |
Omnibus shareholder accounts for which Natixis Advisors understands that the intermediary has discretion over the underlying shareholder accounts or investment
| 104
Notes to Financial Statements (continued)
December 31, 2017
models where a shareholder account may be invested for a non-discretionary customer are included in the table above. For other omnibus accounts, the Funds do not have information on the individual shareholder accounts underlying the omnibus accounts; therefore, there could be other 5% shareholders in addition to those disclosed in the table above.
11. Capital Shares. Each Fund may issue an unlimited number of shares of beneficial interest, without par value. Transactions in capital shares were as follows:
| | | | | | | | | | | | | | | | |
| |
| Year Ended
December 31, 2017 |
| |
| Year Ended
December 31, 2016 |
|
Intermediate Municipal Bond Fund | | | Shares | | | | Amount | | | | Shares | | | | Amount | |
| Class A | | | | | | | | | | | | | | | | |
Issued from the sale of shares | | | 229,798 | | | $ | 2,338,481 | | | | 909,992 | | | $ | 9,258,255 | |
Issued in connection with the reinvestment of distributions | | | 8,554 | | | | 86,576 | | | | 9,036 | | | | 92,223 | |
Redeemed | | | (201,533 | ) | | | (2,035,102 | ) | | | (1,002,724 | ) | | | (10,157,813 | ) |
| | | | | | | | | | | | | | | | |
Net change | | | 36,819 | | | $ | 389,955 | | | | (83,696 | ) | | $ | (807,335 | ) |
| | | | | | | | | | | | | | | | |
| Class C | | | | | | | | | | | | | | | | |
Issued from the sale of shares | | | 37,992 | | | $ | 384,316 | | | | 254,574 | | | $ | 2,604,454 | |
Issued in connection with the reinvestment of distributions | | | 1,041 | | | | 10,527 | | | | 877 | | | | 8,930 | |
Redeemed | | | (209,349 | ) | | | (2,113,286 | ) | | | (479,533 | ) | | | (4,860,648 | ) |
| | | | | | | | | | | | | | | | |
Net change | | | (170,316 | ) | | $ | (1,718,443 | ) | | | (224,082 | ) | | $ | (2,247,264 | ) |
| | | | | | | | | | | | | | | | |
| Class Y | | | | | | | | | | | | | | | | |
Issued from the sale of shares | | | 1,561,548 | | | $ | 15,699,674 | | | | 4,274,591 | | | $ | 43,902,428 | |
Issued in connection with the reinvestment of distributions | | | 16,163 | | | | 163,646 | | | | 14,948 | | | | 152,317 | |
Redeemed | | | (3,700,092 | ) | | | (37,356,486 | ) | | | (5,930,187 | ) | | | (59,953,235 | ) |
| | | | | | | | | | | | | | | | |
Net change | | | (2,122,381 | ) | | $ | (21,493,166 | ) | | | (1,640,648 | ) | | $ | (15,898,490 | ) |
| | | | | | | | | | | | | | | | |
Increase (decrease) from capital share transactions | | | (2,255,878 | ) | | $ | (22,821,654 | ) | | | (1,948,426 | ) | | $ | (18,953,089 | ) |
| | | | | | | | | | | | | | | | |
105 |
Notes to Financial Statements (continued)
December 31, 2017
11. Capital Shares (continued).
| | | | | | | | | | | | | | | | |
| |
| Year Ended
December 31, 2017 |
| |
| Year Ended
December 31, 2016 |
|
Natixis Oakmark Fund | | | Shares | | | | Amount | | | | Shares | | | | Amount | |
| Class A | | | | | | | | | | | | | | | | |
Issued from the sale of shares | | | 1,097,333 | | | $ | 25,510,597 | | | | 1,253,674 | | | $ | 23,788,547 | |
Issued in connection with the reinvestment of distributions | | | 319,749 | | | | 7,630,446 | | | | 310,173 | | | | 5,971,567 | |
Redeemed | | | (1,269,544 | ) | | | (29,162,674 | ) | | | (2,722,428 | ) | | | (50,444,998 | ) |
| | | | | | | | | | | | | | | | |
Net change | | | 147,538 | | | $ | 3,978,369 | | | | (1,158,581 | ) | | $ | (20,684,884 | ) |
| | | | | | | | | | | | | | | | |
| Class B(a) | | | | | | | | | | | | | | | | |
Issued from the sale of shares | | | — | | | $ | — | | | | — | | | $ | — | |
Issued in connection with the reinvestment of distributions | | | — | | | | — | | | | — | | | | — | |
Redeemed | | | — | | | | — | | | | (1,891 | ) | | | (29,216 | ) |
| | | | | | | | | | | | | | | | |
Net change | | | — | | | $ | — | | | | (1,891 | ) | | $ | (29,216 | ) |
| | | | | | | | | | | | | | | | |
| Class C | | | | | | | | | | | | | | | | |
Issued from the sale of shares | | | 745,200 | | | $ | 14,845,455 | | | | 806,782 | | | $ | 13,902,509 | |
Issued in connection with the reinvestment of distributions | | | 103,719 | | | | 2,154,363 | | | | 89,633 | | | | 1,486,762 | |
Redeemed | | | (932,134 | ) | | | (18,618,843 | ) | | | (2,169,451 | ) | | | (36,029,587 | ) |
| | | | | | | | | | | | | | | | |
Net change | | | (83,215 | ) | | $ | (1,619,025 | ) | | | (1,273,036 | ) | | $ | (20,640,316 | ) |
| | | | | | | | | | | | | | | | |
| Class N(b) | | | | | | | | | | | | | | | | |
Issued from the sale of shares | | | 43 | | | $ | 1,001 | | | | — | | | $ | — | |
Issued in connection with the reinvestment of distributions | | | 2 | | | | 35 | | | | — | | | | — | |
| | | | | | | | | | | | | | | | |
Net change | | | 45 | | | $ | 1,036 | | | | — | | | $ | — | |
| | | | | | | | | | | | | | | | |
| Class Y | | | | | | | | | | | | | | | | |
Issued from the sale of shares | | | 1,112,569 | | | $ | 26,658,228 | | | | 920,373 | | | $ | 19,279,606 | |
Issued in connection with the reinvestment of distributions | | | 56,023 | | | | 1,413,926 | | | | 31,858 | | | | 655,095 | |
Redeemed | | | (414,820 | ) | | | (9,936,832 | ) | | | (883,863 | ) | | | (16,880,267 | ) |
| | | | | | | | | | | | | | | | |
Net change | | | 753,772 | | | $ | 18,135,322 | | | | 68,368 | | | $ | 3,054,434 | |
| | | | | | | | | | | | | | | | |
Increase (decrease) from capital share transactions | | | 818,140 | | | $ | 20,495,702 | | | | (2,365,140 | ) | | $ | (38,299,982 | ) |
| | | | | | | | | | | | | | | | |
| (a) | On January 11, 2016, Class B shares were converted into Class A shares. See Note 1 of Notes to Financial Statements. |
| (b) | From commencement of Class operations on May 1, 2017 through December 31, 2017. |
| 106
Notes to Financial Statements (continued)
December 31, 2017
11. Capital Shares (continued).
| | | | | | | | | | | | | | | | |
| |
| Year Ended
December 31, 2017 |
| |
| Year Ended
December 31, 2016 |
|
Natixis Oakmark International Fund | | | Shares | | | | Amount | | | | Shares | | | | Amount | |
| Class A | | | | | | | | | | | | | | | | |
Issued from the sale of shares | | | 17,257,564 | | | $ | 244,429,519 | | | | 17,316,910 | | | $ | 189,288,241 | |
Issued in connection with the reinvestment of distributions | | | 358,244 | | | | 5,570,701 | | | | 958,477 | | | | 11,230,103 | |
Redeemed | | | (22,730,001 | ) | | | (331,480,871 | ) | | | (37,402,741 | ) | | | (413,700,664 | ) |
| | | | | | | | | | | | | | | | |
Net change | | | (5,114,193 | ) | | $ | (81,480,651 | ) | | | (19,127,354 | ) | | $ | (213,182,320 | ) |
| | | | | | | | | | | | | | | | |
| Class C | | | | | | | | | | | | | | | | |
Issued from the sale of shares | | | 8,154,803 | | | $ | 116,119,552 | | | | 2,591,697 | | | $ | 28,122,303 | |
Issued in connection with the reinvestment of distributions | | | 92,603 | | | | 1,414,038 | | | | 233,485 | | | | 2,645,525 | |
Redeemed | | | (5,871,161 | ) | | | (80,942,584 | ) | | | (11,772,884 | ) | | | (128,385,161 | ) |
| | | | | | | | | | | | | | | | |
Net change | | | 2,376,245 | | | $ | 36,591,006 | | | | (8,947,702 | ) | | $ | (97,617,333 | ) |
| | | | | | | | | | | | | | | | |
| Class N(a) | | | | | | | | | | | | | | | | |
Issued from the sale of shares | | | 72 | | | $ | 1,001 | | | | — | | | $ | — | |
Issued in connection with the reinvestment of distributions | | | 1 | | | | 15 | | | | — | | | | — | |
| | | | | | | | | | | | | | | | |
Net change | | | 73 | | | $ | 1,016 | | | | — | | | $ | — | |
| | | | | | | | | | | | | | | | |
| Class Y(a) | | | | | | | | | | | | | | | | |
Issued from the sale of shares | | | 11,434,503 | | | $ | 174,563,797 | | | | — | | | $ | — | |
Issued in connection with the reinvestment of distributions | | | 145,443 | | | | 2,258,734 | | | | — | | | | — | |
Redeemed | | | (466,061 | ) | | | (7,177,317 | ) | | | — | | | | — | |
| | | | | | | | | | | | | | | | |
Net change | | | 11,113,885 | | | $ | 169,645,214 | | | | — | | | $ | — | |
| | | | | | | | | | | | | | | | |
Increase (decrease) from capital share transactions | | | 8,376,010 | | | $ | 124,756,585 | | | | (28,075,056 | ) | | $ | (310,799,653 | ) |
| | | | | | | | | | | | | | | | |
| (a) | From commencement of Class operations on May 1, 2017 through December 31, 2017. |
107 |
Notes to Financial Statements (continued)
December 31, 2017
11. Capital Shares (continued).
| | | | | | | | | | | | | | | | |
| |
| Year Ended
December 31, 2017 |
| |
| Year Ended
December 31, 2016 |
|
Small Cap Value Fund | | | Shares | | | | Amount | | | | Shares | | | | Amount | |
| Class A | | | | | | | | | | | | | | | | |
Issued from the sale of shares | | | 528,606 | | | $ | 10,288,324 | | | | 636,491 | | | $ | 11,812,924 | |
Issued in connection with the reinvestment of distributions | | | 524,190 | | | | 9,889,735 | | | | 353,938 | | | | 6,758,819 | |
Redeemed | | | (1,421,549 | ) | | | (27,416,197 | ) | | | (1,423,762 | ) | | | (25,938,444 | ) |
| | | | | | | | | | | | | | | | |
Net change | | | (368,753 | ) | | $ | (7,238,138 | ) | | | (433,333 | ) | | $ | (7,366,701 | ) |
| | | | | | | | | | | | | | | | |
| Class B(a) | | | | | | | | | | | | | | | | |
Issued from the sale of shares | | | — | | | $ | — | | | | — | | | $ | — | |
Issued in connection with the reinvestment of distributions | | | — | | | | — | | | | — | | | | — | |
Redeemed | | | — | | | | — | | | | (1,791 | ) | | | (20,887 | ) |
| | | | | | | | | | | | | | | | |
Net change | | | — | | | $ | — | | | | (1,791 | ) | | $ | (20,887 | ) |
| | | | | | | | | | | | | | | | |
| Class C | | | | | | | | | | | | | | | | |
Issued from the sale of shares | | | 55,927 | | | $ | 696,634 | | | | 53,331 | | | $ | 672,153 | |
Issued in connection with the reinvestment of distributions | | | 216,985 | | | | 2,595,862 | | | | 137,010 | | | | 1,766,472 | |
Redeemed | | | (459,714 | ) | | | (5,852,124 | ) | | | (364,140 | ) | | | (4,604,493 | ) |
| | | | | | | | | | | | | | | | |
Net change | | | (186,802 | ) | | $ | (2,559,628 | ) | | | (173,799 | ) | | $ | (2,165,868 | ) |
| | | | | | | | | | | | | | | | |
| Class N(b) | | | | | | | | | | | | | | | | |
Issued from the sale of shares | | | 51 | | | $ | 1,001 | | | | — | | | $ | — | |
Issued in connection with the reinvestment of distributions | | | 4 | | | | 82 | | | | — | | | | — | |
| | | | | | | | | | | | | | | | |
Net change | | | 55 | | | $ | 1,083 | | | | — | | | $ | — | |
| | | | | | | | | | | | | | | | |
| Class Y | | | | | | | | | | | | | | | | |
Issued from the sale of shares | | | 2,498,754 | | | $ | 49,774,371 | | | | 1,398,050 | | | $ | 25,550,473 | |
Issued in connection with the reinvestment of distributions | | | 1,011,202 | | | | 19,723,081 | | | | 591,961 | | | | 11,610,546 | |
Redeemed | | | (3,367,033 | ) | | | (66,987,307 | ) | | | (2,844,796 | ) | | | (53,737,957 | ) |
| | | | | | | | | | | | | | | | |
Net change | | | 142,923 | | | $ | 2,510,145 | | | | (854,785 | ) | | $ | (16,576,938 | ) |
| | | | | | | | | | | | | | | | |
Increase (decrease) from capital share transactions | | | (412,577 | ) | | $ | (7,286,538 | ) | | | (1,463,708 | ) | | $ | (26,130,394 | ) |
| | | | | | | | | | | | | | | | |
| (a) | On January 11, 2016, Class B shares were converted into Class A shares. See Note 1 of Notes to Financial Statements. |
| (b) | From commencement of Class operations on May 1, 2017 through December 31, 2017. |
| 108
Notes to Financial Statements (continued)
December 31, 2017
11. Capital Shares (continued).
| | | | | | | | | | | | | | | | |
| |
| Year Ended
December 31, 2017 |
| |
| Year Ended
December 31, 2016 |
|
Value Opportunity Fund | | | Shares | | | | Amount | | | | Shares | | | | Amount | |
| Class A | | | | | | | | | | | | | | | | |
Issued from the sale of shares | | | 507,412 | | | $ | 10,847,723 | | | | 2,179,717 | | | $ | 40,891,195 | |
Issued in connection with the reinvestment of distributions | | | 53,873 | | | | 1,220,217 | | | | 212,252 | | | | 4,019,870 | |
Redeemed | | | (1,855,342 | ) | | | (39,766,540 | ) | | | (5,260,596 | ) | | | (102,702,359 | ) |
| | | | | | | | | | | | | | | | |
Net change | | | (1,294,057 | ) | | $ | (27,698,600 | ) | | | (2,868,627 | ) | | $ | (57,791,294 | ) |
| | | | | | | | | | | | | | | | |
| Class C | | | | | | | | | | | | | | | | |
Issued from the sale of shares | | | 126,549 | | | $ | 2,575,468 | | | | 585,856 | | | $ | 10,632,845 | |
Issued in connection with the reinvestment of distributions | | | 32,929 | | | | 708,304 | | | | 116,224 | | | | 2,089,713 | |
Redeemed | | | (1,479,508 | ) | | | (29,990,166 | ) | | | (1,830,738 | ) | | | (34,208,799 | ) |
| | | | | | | | | | | | | | | | |
Net change | | | (1,320,030 | ) | | $ | (26,706,394 | ) | | | (1,128,658 | ) | | $ | (21,486,241 | ) |
| | | | | | | | | | | | | | | | |
| Class N | | | | | | | | | | | | | | | | |
Issued from the sale of shares | | | 1,429,409 | | | $ | 30,969,311 | | | | 5,270,883 | | | $ | 105,086,789 | |
Issued in connection with the reinvestment of distributions | | | 160,150 | | | | 3,662,639 | | | | 153,597 | | | | 3,029,813 | |
Redeemed | | | (2,872,239 | ) | | | (62,808,162 | ) | | | (1,483,482 | ) | | | (29,622,654 | ) |
| | | | | | | | | | | | | | | | |
Net change | | | (1,282,680 | ) | | $ | (28,176,212 | ) | | | 3,940,998 | | | $ | 78,493,948 | |
| | | | | | | | | | | | | | | | |
| Class Y | | | | | | | | | | | | | | | | |
Issued from the sale of shares | | | 7,066,393 | | | $ | 154,672,829 | | | | 16,682,481 | | | $ | 321,963,213 | |
Issued in connection with the reinvestment of distributions | | | 854,159 | | | | 19,560,236 | | | | 1,675,760 | | | | 32,458,565 | |
Redeemed | | | (17,603,866 | ) | | | (380,954,617 | ) | | | (30,771,971 | ) | | | (605,432,371 | ) |
| | | | | | | | | | | | | | | | |
Net change | | | (9,683,314 | ) | | $ | (206,721,552 | ) | | | (12,413,730 | ) | | $ | (251,010,593 | ) |
| | | | | | | | | | | | | | | | |
Increase (decrease) from capital share transactions | | | (13,580,081 | ) | | $ | (289,302,758 | ) | | | (12,470,017 | ) | | $ | (251,794,180 | ) |
| | | | | | | | | | | | | | | | |
109 |
Report of Independent Registered Public Accounting Firm
To the Board of Trustees of Natixis Funds Trust I and Natixis Funds Trust II and Shareholders of Natixis Oakmark International Fund, Vaughan Nelson Small Cap Value Fund, Natixis Oakmark Fund, Vaughan Nelson Value Opportunity Fund, and McDonnell Intermediate Municipal Bond Fund:
Opinions on the Financial Statements
We have audited the accompanying statements of assets and liabilities, including the portfolios of investments, of Natixis Oakmark International Fund and Vaughan Nelson Small Cap Value Fund (two of the funds constituting the Natixis Funds Trust I), and Natixis Oakmark Fund, Vaughan Nelson Value Opportunity Fund, and McDonnell Intermediate Municipal Bond Fund (three of the funds constituting the Natixis Funds Trust II) (hereafter collectively referred to as the “Funds”) as of December 31, 2017, the related statements of operations for the year ended December 31, 2017, the statements of changes in net assets for each of the two years in the period ended December 31, 2017, including the related notes, and the financial highlights for each of periods indicated (collectively referred to as the “financial statements”). In our opinion, the financial statements present fairly, in all material respects, the financial position of each of the Funds as of December 31, 2017, the results of each of their operations for the year then ended, the changes in each of their net assets for each of the two years in the period ended December 31, 2017 and each of the financial highlights for each of the periods indicated in conformity with accounting principles generally accepted in the United States of America.
Basis for Opinions
These financial statements are the responsibility of the Funds’ management. Our responsibility is to express an opinion on the Funds’ financial statements based on our audits. We are a public accounting firm registered with the Public Company Accounting Oversight Board (United States) (“PCAOB”) and are required to be independent with respect to the Funds in accordance with the U.S. federal securities laws and the applicable rules and regulations of the Securities and Exchange Commission and the PCAOB.
We conducted our audits of these financial statements in accordance with the standards of the PCAOB. Those standards require that we plan and perform the audit to obtain reasonable assurance about whether the financial statements are free of material misstatement, whether due to error or fraud.
Our audits included performing procedures to assess the risks of material misstatement of the financial statements, whether due to error or fraud, and performing procedures that respond to those risks. Such procedures included examining, on a test basis, evidence regarding the amounts and disclosures in the financial statements. Our
| 110
Report of Independent Registered Public Accounting Firm
audits also included evaluating the accounting principles used and significant estimates made by management, as well as evaluating the overall presentation of the financial statements. Our procedures included confirmation of securities owned as of December 31, 2017 by correspondence with the custodian, and brokers; when replies were not received from brokers, we performed other auditing procedures. We believe that our audits provide a reasonable basis for our opinions.
/s/ PricewaterhouseCoopers LLP
Boston, Massachusetts
February 22, 2018
We have served as the auditor of one or more investment companies in the Natixis Investment Company Complex since at least 1995. We have not determined the specific year we began serving as auditor.
111 |
2017 U.S. Tax Distribution Information to Shareholders (Unaudited)
Corporate Dividends Received Deduction. For the fiscal year ended December 31, 2017, a percentage of dividends distributed by the Funds listed below qualify for the dividends received deduction for corporate shareholders. These percentages are as follows:
| | | | |
Fund | | Qualifying Percentage | |
Natixis Oakmark Fund | | | 100.00 | % |
Small Cap Value Fund | | | 84.35 | % |
Value Opportunity Fund | | | 100.00 | % |
Capital Gains Distributions. Pursuant to Internal Revenue Section 852(b), the following Funds paid distributions, which have been designated as capital gains distributions for the fiscal year ended December 31, 2017.
| | | | |
Fund | | Amount | |
Natixis Oakmark Fund | | $ | 11,807,017 | |
Small Cap Value Fund | | | 31,501,924 | |
Value Opportunity Fund | | | 16,440,298 | |
Qualified Dividend Income. For the fiscal year ended December 31, 2017, a percentage of the ordinary income dividends paid by the Funds are considered qualified dividend income eligible for reduced tax rates. These lower rates range from 0% to 20% depending on an individual’s tax bracket. If the Funds paid a distribution during calendar year 2017, complete information will be reported in conjunction with Form 1099-DIV. These percentages are noted below:
| | | | |
Fund | | Qualifying Percentage | |
Natixis Oakmark Fund | | | 100.00 | % |
Natixis Oakmark International Fund | | | 100.00 | % |
Small Cap Value Fund | | | 90.36 | % |
Value Opportunity Fund | | | 100.00 | % |
Foreign Tax Credit. For the year ended December 31, 2017, the Fund intends to pass through foreign tax credits and have derived gross income from sources within foreign countries amounting to:
| | | | | | | | |
Fund | | Foreign Tax Credit Pass-Through | | | Foreign Source Income | |
Natixis Oakmark International Fund | | $ | 2,316,287 | | | $ | 26,425,586 | |
Exempt Interest Dividends
During the year ended December 31, 2017, Intermediate Municipal Bond paid dividends to shareholders from net investment income, of which 99.41% are designated as exempt interest dividends for federal tax purposes. However, state and local taxes differ from state to state and a portion of the dividends may be subject to the individual Alternative Minimum Tax, so it is suggested that you consult your own tax adviser.
| 112
Additional Information
Special Meeting of Shareholders. (Unaudited)
A special meeting of shareholders of the Trusts was held on December 4, 2017 to consider a proposal to elect thirteen Trustees to the Board of Trustees. The proposal was approved by shareholders of the Trusts. The results of the shareholder vote were as follows:
| | | | | | | | |
Nominee | | Voted “For”* | | | Withheld* | |
Kevin P. Charleston | | | 370,772,225.201 | | | | 2,295,844.378 | |
Kenneth A. Drucker | | | 370,283,839.168 | | | | 2,784,230.411 | |
Edmond J. English | | | 370,659,753.916 | | | | 2,408,315.663 | |
David L. Giunta | | | 370,784,195.912 | | | | 2,283,873.667 | |
Richard A. Goglia | | | 370,460,463.208 | | | | 2,607,606.371 | |
Wendell J. Knox | | | 370,534,122.392 | | | | 2,533,947.187 | |
Martin T. Meehan | | | 370,538,829.643 | | | | 2,529,239.936 | |
Maureen B. Mitchell | | | 370,919,944.816 | | | | 2,148,124.763 | |
Sandra O. Moose** | | | 370,426,616.935 | | | | 2,641,452.644 | |
James P. Palermo | | | 370,643,215.858 | | | | 2,424,853.721 | |
Erik R. Sirri | | | 370,711,200.752 | | | | 2,356,868.827 | |
Peter J. Smail | | | 370,588,393.592 | | | | 2,479,675.987 | |
Cynthia L. Walker | | | 370,711,120.477 | | | | 2,356,949.102 | |
| * | Trust-wide voting results. |
| ** | Ms. Moose retired as a Trustee effective January 1, 2018. |
| | | | | | | | |
Nominee | | Voted “For”* | | | Withheld* | |
Kevin P. Charleston | | | 869,803,137.844 | | | | 5,278,477.797 | |
Kenneth A. Drucker | | | 869,573,100.272 | | | | 5,508,515.369 | |
Edmond J. English | | | 869,760,094.572 | | | | 5,321,521.069 | |
David L. Giunta | | | 869,722,105.493 | | | | 5,359,510.148 | |
Richard A. Goglia | | | 869,845,876.582 | | | | 5,235,739.059 | |
Wendell J. Knox | | | 869,633,400.572 | | | | 5,448,215.069 | |
Martin T. Meehan | | | 869,982,234.293 | | | | 5,099,381.348 | |
Maureen B. Mitchell | | | 869,672,122.531 | | | | 5,409,493.110 | |
Sandra O. Moose** | | | 868,954,166.321 | | | | 6,127,449.320 | |
James P. Palermo | | | 870,130,688.893 | | | | 4,950,926.748 | |
Erik R. Sirri | | | 869,769,012.873 | | | | 5,312,602.768 | |
Peter J. Smail | | | 869,714,774.773 | | | | 5,366,840.868 | |
Cynthia L. Walker | | | 869,589,551.601 | | | | 5,492,064.040 | |
| * | Trust-wide voting results. |
| ** | Ms. Moose retired as a Trustee effective January 1, 2018. |
113 |
Trustee and Officer Information
The tables below provide certain information regarding the trustees and officers of Natixis Funds Trust I and Natixis Funds Trust II, (the “Trusts”). Unless otherwise indicated, the address of all persons below is 888 Boylston Street, Suite 800, Boston, MA 02199-8197. The Funds’ Statements of Additional Information include additional information about the trustees of the Trusts and are available by calling Natixis Funds at 800-225-5478.
| | | | | | | | |
Name and Year of Birth | | Position(s) Held with the Trusts, Length of Time Served and Term of Office1 | | Principal Occupation(s) During Past 5 Years | | Number of Portfolios in Fund Complex Overseen2 and Other Directorships Held During Past 5 Years | | Experience, Qualifications, Attributes, Skills for Board Membership |
| | | |
| INDEPENDENT TRUSTEES | | | | | | |
| | | | |
Kenneth A. Drucker (1945) | | Chairperson of the Board of Trustees since January 2017 Trustee since 2008 Ex Officio member of Audit Committee, Contract Review Committee and Governance Committee | | Retired | | 54 None | | Significant experience on the Board and on the boards of other business organizations (including at investment companies); executive experience (including as treasurer of an aerospace, automotive, and metal manufacturing corporation) |
| | | | |
Edmond J. English
(1953) | | Trustee since 2013 Audit Committee Member and Governance Committee Member | | Executive Chairman; formerly, Chief Executive Officer of Bob’s Discount Furniture (retail) | | 54 Director, Burlington Stores, Inc. (retail) | | Significant experience on the Board and significant experience on the boards of other business organizations (including retail companies and a bank); executive experience (including at a retail company) |
| 114
Trustee and Officer Information
| | | | | | | | |
Name and Year of Birth | | Position(s) Held with the Trusts, Length of Time Served and Term of Office1 | | Principal Occupation(s) During Past 5 Years | | Number of Portfolios in Fund Complex Overseen2 and Other Directorships Held During Past 5 Years | | Experience, Qualifications, Attributes, Skills for Board Membership |
| | | |
INDEPENDENT TRUSTEES continued | | | | | | |
| | | | |
Richard A. Goglia (1951) | | Trustee since 2015 Audit Committee Member | | Retired; formerly Vice President and Treasurer of Raytheon Company (defense) | | 54 None | | Experience on the Board and executive experience (including his role as vice president and treasurer of a defense company and experience at a financial services company) |
| | | | |
Wendell J. Knox (1948) | | Trustee since 2009 Contract Review Committee Member and Governance Committee Member | | Director of Abt Associates Inc. (research and consulting) | | 54 Director, Eastern Bank (bank); Director, The Hanover Insurance Group (property and casualty insurance) | | Significant experience on the Board and on the boards of other business organizations (including at a bank and at a property and casualty insurance firm); executive experience (including roles as president and chief executive officer of a research and consulting company) |
115 |
Trustee and Officer Information
| | | | | | | | |
Name and Year of Birth | | Position(s) Held with the Trusts, Length of Time Served and Term of Office1 | | Principal Occupation(s) During Past 5 Years | | Number of Portfolios in Fund Complex Overseen2 and Other Directorships Held During Past 5 Years | | Experience, Qualifications, Attributes, Skills for Board Membership |
| | | |
INDEPENDENT TRUSTEES continued | | | | | | |
| | | | |
| Martin T. Meehan (1956) | | Trustee since 2012 Audit Committee Member | | President, University of Massachusetts; formerly, Chancellor and faculty member, University of Massachusetts Lowell | | 54 None | | Significant experience on the Board and on the boards of other business organizations; experience as President of the University of Massachusetts; government experience (including as a member of the U.S. House of Representatives); academic experience |
| | | | |
Maureen B. Mitchell3 (1951) | | Trustee since 2017 Contract Review Committee Member | | Retired; formerly President, Global Sales and Marketing, GE Asset Management, Inc. (financial services) | | 54 None | | Experience on the Board; financial services industry and executive experience (including role as president of global sales and marketing at a financial services company) |
| 116
Trustee and Officer Information
| | | | | | | | |
Name and Year of Birth | | Position(s) Held with the Trusts, Length of Time Served and Term of Office1 | | Principal Occupation(s) During Past 5 Years | | Number of Portfolios in Fund Complex Overseen2 and Other Directorships Held During Past 5 Years | | Experience, Qualifications, Attributes, Skills for Board Membership |
| | | |
INDEPENDENT TRUSTEES continued | | | | | | |
| | | | |
James P. Palermo (1955) | | Trustee since 2016 Contract Review Committee Member | | Founding Partner, Breton Capital Management, LLC (private equity); Partner, STEP Partners, LLC (private equity); formerly, Chief Executive Officer of Global Client Management of The Bank of New York Mellon Corporation | | 54 None | | Experience on the Board; financial services industry and executive experience (including roles as chief executive officer of client management and asset servicing for a banking and financial services company) |
| | | | |
Erik R. Sirri (1958) | | Trustee since 2009 Chairperson of the Audit Committee | | Professor of Finance at Babson College | | 54 None | | Significant experience on the Board; experience as Director of the Division of Trading and Markets at the Securities and Exchange Commission; academic experience; training as an economist |
| | | | |
Peter J. Smail (1952) | | Trustee since 2009 Chairperson of the Contract Review Committee and Governance Committee Member | | Retired | | 54 None | | Significant experience on the Board; mutual fund industry and executive experience (including roles as president and chief executive officer for an investment adviser) |
117 |
Trustee and Officer Information
| | | | | | | | |
Name and Year of Birth | | Position(s) Held with the Trusts, Length of Time Served and Term of Office1 | | Principal Occupation(s) During Past 5 Years | | Number of Portfolios in Fund Complex Overseen2 and Other Directorships Held During Past 5 Years | | Experience, Qualifications, Attributes, Skills for Board Membership |
| | | |
INDEPENDENT TRUSTEES continued | | | | | | |
| | | | |
Cynthia L. Walker (1956) | | Trustee since 2005 Chairperson of the Governance Committee and Audit Committee Member | | Deputy Dean for Finance and Administration, Yale University School of Medicine | | 54 None | | Significant experience on the Board; executive experience in a variety of academic organizations (including roles as dean for finance and administration) |
|
| INTERESTED TRUSTEES |
| | | | |
Kevin P. Charleston4 (1965) One Financial Center Boston, MA 02111 | | Trustee since 2015 | | President, Chief Executive Officer and Chairman of the Board of Directors; formerly, Chief Financial Officer, Loomis, Sayles & Company, L.P. | | 54 None | | Experience on the Board; continuing service as President, Chief Executive Officer and Chairman of the Board of Directors of Loomis, Sayles & Company, L.P. |
| | | | |
David L. Giunta5 (1965) | | Trustee since 2011 President and Chief Executive Officer of Natixis Funds Trust I and Natixis Funds Trust II since 2008 | | President and Chief Executive Officer, Natixis Advisors, L.P., Natixis Distribution, L.P., Natixis Distribution Corporation and Chairman of the Board of Natixis Distribution Corporation. | | 54 None | | Significant experience on the Board; experience as President and Chief Executive Officer, Natixis Advisors, L.P., Natixis Distribution, L.P., Natixis Distribution Corporation and Chairman of the Board of Natixis Distribution Corporation. |
| 118
Trustee and Officer Information
| 1 | Each trustee serves until retirement, resignation or removal from the Board. The current retirement age is 75. The position of Chairperson of the Board is appointed for a three-year term. |
| 2 | The trustees of the Trusts serve as trustees of a fund complex that includes all series of the Natixis Funds Trust I, Natixis Funds Trust II, Natixis Funds Trust IV and Gateway Trust (collectively, the “Natixis Funds Trusts”), Loomis Sayles Funds I and Loomis Sayles Funds II (collectively, the “Loomis Sayles Funds Trusts”) and Natixis ETF Trust (collectively, the “Fund Complex”). |
| 3 | Ms. Mitchell was appointed as a Trustee effective July 1, 2017. |
| 4 | Mr. Charleston is deemed an “interested person” of the Trusts because he holds the following positions with an affiliated person of the Trusts: President, Chief Executive Officer and Chairman of the Board of Directors of Loomis, Sayles & Company, L.P. |
| 5 | Mr. Giunta is deemed an “interested person” of the Trusts because he holds the following positions with an affiliated person of the Trusts: President and Chief Executive Officer, Natixis Advisors, L.P., Natixis Distribution, L.P., Natixis Distribution Corporation and Chairman of the Board of Natixis Distribution Corporation. |
119 |
Trustee and Officer Information
| | | | | | |
Name and Year of Birth | | Position(s) Held with the Trusts | | Term of Office1 and Length of Time Served | | Principal Occupation(s) During Past 5 Years2 |
|
| OFFICERS OF THE TRUSTS |
| | | |
Russell L. Kane (1969) | | Secretary, Clerk and Chief Legal Officer | | Since July 2016 | | Executive Vice President, General Counsel, Secretary and Clerk, Natixis Distribution Corporation, Natixis Advisors, L.P. and Natixis Distribution, L.P.; formerly, Chief Compliance Officer for Mutual Funds, Senior Vice President, Deputy General Counsel, Assistant Secretary and Assistant Clerk, Natixis Distribution Corporation, Natixis Advisors, L.P. and Natixis Distribution, L.P. |
| | | |
Michael C. Kardok (1959) | | Treasurer, Principal Financial and Accounting Officer | | Since October 2004 | | Senior Vice President, Natixis Advisors, L.P. and Natixis Distribution, L.P. |
| | | |
Rosa Licea-Mailloux (1976) | | Chief Compliance Officer, Assistant Secretary and Anti-Money Laundering Officer | | Since July 2016 | | Senior Vice President, Deputy General Counsel, Assistant Secretary and Assistant Clerk, Natixis Distribution Corporation, Natixis Advisors, L.P. and Natixis Distribution, L.P.; formerly, Associate General Counsel, Natixis Distribution, L.P. |
| 1 | Each officer of the Trusts serves for an indefinite term in accordance with the Trusts’ current by-laws until the date his or her successor is elected and qualified, or until he or she sooner dies, retires, is removed or becomes disqualified. |
| 2 | Each person listed above, except as noted, holds the same position(s) with the Fund Complex. Previous positions during the past five years with Natixis Distribution, L.P., Natixis Advisors, L.P. or Loomis, Sayles & Company, L.P. are omitted, if not materially different from an officer’s current position with such entity. |
| 120
ANNUAL REPORT
December 31, 2017

Gateway Fund
Gateway Equity Call Premium Fund
Mirova Global Green Bond Fund
Mirova Global Sustainable Equity Fund

TABLE OF CONTENTS
Portfolio Review page 1
Portfolio of Investments page 23
Financial Statements page 53
Notes to Financial Statements page 78
GATEWAY FUND
| | |
| Managers | | Symbols |
| Daniel M. Ashcraft, CFA® | | Class A GATEX |
| Michael T. Buckius, CFA® | | Class C GTECX |
| Paul R. Stewart, CFA® | | Class N GTENX |
| Kenneth H. Toft, CFA® | | Class Y GTEYX |
| Gateway Investment Advisers, LLC |
Investment Goal
The fund seeks to capture the majority of returns associated with equity market investments, while exposing investors to less risk than other equity investments.
Management Discussion
The S&P 500® Index returned 21.83% in 2017 with the equity market exhibiting very low volatility throughout the year. In fact, for the first time in its history, the total return of the S&P 500® Index was positive in each month of the calendar year. The market shrugged off a contentious domestic political environment, three major hurricanes, escalating rhetoric between the Trump administration and North Korea, and tightening monetary policy conditions. Actions by the Federal Reserve (the Fed) included three rate hikes and a move toward shrinking the size of its balance sheet after nearly a decade of supporting capital markets with asset purchases. Contributors to the market’s upward momentum included a globally synchronized economic expansion and strong earnings growth for US corporations. The US economy expanded at a 3.2% rate in the third quarter of 2017 and the Fed expects that, once aggregate statistics are compiled, economic growth for 2017 will come in at 2.5%. Trailing 12-month growth in aggregate operating earnings for S&P 500® Index companies came in at nearly 17% as of September 30, and analysts estimate that, once companies report fourth quarter earnings in early 2018, earnings for calendar year 2017 will have grown nearly 18%.
The equity market exhibited historically low volatility in 2017. Realized volatility for the year (as measured by the annualized standard deviation of daily returns for the S&P 500® Index) was just 6.78%, the lowest reading since 1964. Moreover, the largest peak-to-trough decline experienced by the S&P 500® Index for 2017 was a loss of just 2.58% from March 1 through April 13. Implied volatility, as measured by the CBOE Volatility Index® (the VIX®), averaged 11.09 in 2017, well below its long-term average of 19.39 and the lowest annual average in the history of the statistic, which began in 1990. The VIX® also set new all-time records for an intra-day low of 8.56 on November 24, and a closing low of 9.14 on November 3. The VIX® closed below 10 on 52 days in 2017. Prior to 2017, it had closed below 10 just nine times in its history.
Performance Results
For the 12 months ended December 31, 2017, Class Y shares of Gateway Fund returned 9.93% at net asset value. The Fund’s primary benchmark, the S&P 500® Index, returned
1 |
21.83% for the same period, while its secondary benchmark, the Bloomberg Barclays U.S. Aggregate Bond Index, returned 3.54%.
Explanation of Fund Performance
The Fund invests in a broadly diversified portfolio of common stocks, while also selling index call options and purchasing index put options. The Fund seeks to generate returns by creating cash flow through writing at-the-money index call options against the full value of its underlying equity portfolio. This index call option writing activity exchanges market price appreciation for less variable option premiums and is an important source of the Fund’s return. The Fund uses some of the cash flow from index call option writing to purchase out-of-the-money index put options to mitigate sudden and severe price declines in the equity portfolio. An index option is described as being at-the-money when the price of the underlying index is the same as the option’s strike price. Additionally, an index put option is described as being out-of-the-money when the price of the underlying index is above the put option’s strike price. It is the net premium-to-earn from selling index call options less the price of protective index put options that is a significant factor in determining how much participation the Fund will have in a rising market and how much downside protection is delivered in a declining market. Long term, the combination of the diversified stock portfolio, steady cash flow from the sale of index call options and downside protection from index put options is intended to provide the Fund with the majority of the returns associated with equity market investments while exposing investors to less risk.
The Fund underperformed its primary benchmark for the year, as expected during a period when the equity market advanced at an above-average rate with well below-average volatility. Throughout 2017, the Fund’s two-part option strategy delivered equity market participation during market advances and protection during market declines. Like the S&P 500® Index, the total return of the Fund was positive in each month of the year. In addition, the Fund had two months of outperformance over the course of the year, but underperformed the S&P 500® Index in each of the four quarters. Equity market declines in 2017 were brief, shallow and infrequent, but the Fund delivered downside protection during the market’s largest peak-to-trough decline for the year. Specifically, from March 1 through April 13, the Fund declined 0.49%, delivering 209 basis points (bps) of downside protection relative to the loss of 2.58% for the S&P 500® Index.
The Fund’s equity portfolio returned 22.80% for the year, a performance differential of positive 97 bps versus the S&P 500® Index, which contributed to its return. Consistent with its investment objective, the measured risk of the Fund was low relative to the US equity market, as its standard deviation for 2017 was 3.07% versus 6.78% for the S&P 500® Index.
Outlook
2017 was a continuation of a multi-year period of above-average equity market returns with below-average volatility. Recent fundamental drivers of low volatility include a positive market backdrop featuring expanding global economic growth and strong corporate earnings as well as low correlation across individual stocks. This positive backdrop has
| 2
GATEWAY FUND
helped propel the stock market higher and rising equity markets tend to have lower volatility levels than falling equity markets. While the economy seems to be on increasingly sound footing, it remains to be seen how long these beneficial trends will persist. Volatility is a cyclical phenomenon and the current low phase of the cycle will come to an end at some point. A return to persistently elevated volatility may happen gradually, as the forces keeping volatility low erode, or it could happen suddenly through an external shock to the system. As always, Gateway will avoid incorporating forecasts into its investment approach, and will not attempt to anticipate how events will unfold.
Gateway’s investment philosophy maintains that the US equity market is the most reliable source of attractive long-term returns, despite its high volatility and tendency to periodically deliver significant losses over shorter periods of time. Gateway’s investment philosophy also holds that consistency is the key to long-term investment success and that generating cash flow, rather than seeking to forecast the rise and fall of the market, can be a lower-risk means of participating in equity markets. By staying true to its philosophy and continuing to manage the Gateway Fund consistently with the firm’s historical approach, Gateway will continue to assist investors in managing risk while pursuing long-term return in this positive, yet uncertain, environment.
Hypothetical Growth of $100,000 Investment in Class Y Shares5
December 31, 2007 through December 31, 2017
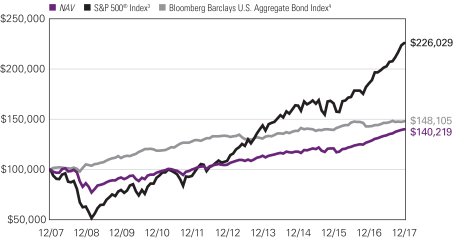
See notes to chart on page 5.
3 |
Top Ten Holdings as of December 31, 2017
| | | | | | |
| Security name | | % of
net assets | |
| 1. | | Apple, Inc. | | | 3.87 | % |
| 2. | | Microsoft Corp. | | | 2.98 | |
| 3. | | Alphabet, Inc., Class C | | | 2.16 | |
| 4. | | Amazon.com, Inc. | | | 2.09 | |
| 5. | | Facebook, Inc., Class A | | | 2.03 | |
| 6. | | Berkshire Hathaway, Inc., Class B | | | 2.00 | |
| 7. | | JPMorgan Chase & Co. | | | 1.89 | |
| 8. | | Johnson & Johnson | | | 1.70 | |
| 9. | | Exxon Mobil Corp. | | | 1.66 | |
| 10. | | Bank of America Corp. | | | 1.35 | |
The portfolio is actively managed and holdings are subject to change. There is no guarantee the Fund continues to invest in the securities referenced. The holdings listed exclude any temporary cash investments.
| 4
GATEWAY FUND
Average Annual Total Returns — December 31, 20175
| | | | | | | | | | | | | | | | | | | | | | | | |
| | | | | | | | | | | | | | | Expense Ratios6 | |
| | | 1 Year | | | 5 Years | | | 10 Years | | | Life of
Class N | | | Gross | | | Net | |
| | | | | | | |
| Class Y (Inception 2/19/08)1 | | | | | | | | | | | | | | | | | | | | | | | | |
| NAV | | | 9.93 | % | | | 6.01 | % | | | 3.44 | % | | | — | % | | | 0.77% | | | | 0.70% | |
| | | | | | | |
| Class A (Inception 12/07/77)1 | | | | | | | | | | | | | | | | | | | | | | | | |
| NAV | | | 9.66 | | | | 5.75 | | | | 3.19 | | | | — | | | | 1.02 | | | | 0.94 | |
| With 5.75% Maximum Sales Charge | | | 3.36 | | | | 4.51 | | | | 2.58 | | | | — | | | | | | | | | |
| | | | | | | |
| Class C (Inception 2/19/08)1 | | | | | | | | | | | | | | | | | | | | | | | | |
| NAV | | | 8.85 | | | | 4.96 | | | | 2.42 | | | | — | | | | 1.77 | | | | 1.70 | |
| With CDSC2 | | | 7.85 | | | | 4.96 | | | | 2.42 | | | | — | | | | | | | | | |
| | | | | | | |
| Class N (Inception 5/1/17) | | | | | | | | | | | | | | | | | | | | | | | | |
| NAV | | | — | | | | — | | | | — | | | | 5.93 | | | | 0.70 | | | | 0.65 | |
| | | | | | | |
| Comparative Performance | | | | | | | | | | | | | | | | | | | | | | | | |
| S&P 500® Index3 | | | 21.83 | | | | 15.79 | | | | 8.50 | | | | 13.50 | | | | | | | | | |
| Bloomberg Barclays U.S. Aggregate Bond Index4 | | | 3.54 | | | | 2.10 | | | | 4.01 | | | | 2.14 | | | | | | | | | |
Performance data shown represents past performance and is no guarantee of, and not necessarily indicative of, future results. Total return and value will vary, and you may have a gain or loss when shares are sold. Current performance may be lower or higher than quoted. For more recent month-end performance, visit im.natixis.com/performance. Performance for other share classes will be greater or less than shown based on differences in fees and sales charges. You may not invest directly in an index. Performance for periods less than one year is cumulative, not annualized. Returns reflect changes in share price and reinvestment of dividends and capital gains, if any. The table(s) do not reflect taxes shareholders might owe on any fund distributions or when they redeem their shares.
| 1 | As of the close of business on February 15, 2008, the Fund acquired the assets and liabilities of Gateway Fund (the “Predecessor Fund”), a series of The Gateway Trust, an Ohio business trust. The Fund is the successor to the Predecessor Fund. Prior to 2/15/08 performance of Class A shares is that of the Predecessor Fund, restated to reflect the sales load of Class A shares. Prior to the inception of Class C shares (2/19/08), performance is that of the Predecessor Fund, restated to reflect the higher net expenses and sales loads of Class C shares. Prior to the inception of Class Y shares (2/19/08), performance is that of the Predecessor Fund. |
| 2 | Performance for Class C shares assumes a 1% contingent deferred sales charge (“CDSC”) applied when you sell shares within one year of purchase. |
| 3 | S&P 500® Index is a widely recognized measure of U.S. stock market performance. It is an unmanaged index of 500 common stocks chosen for market size, liquidity, and industry group representation, among other factors. It also measures the performance of the large cap segment of the US equities market. |
| 4 | Bloomberg Barclays U.S. Aggregate Bond Index is an unmanaged index that covers the U.S.-dollar denominated, investment-grade, fixed-rate, taxable bond market of SEC-registered securities. The index includes bonds from the Treasury, government-related, corporate, mortgage-backed securities, asset-backed securities, and collateralized mortgage-backed securities sectors. |
| 5 | Fund performance has been increased by fee waivers and/or expense reimbursements, if any, without which performance would have been lower. |
| 6 | Expense ratios are as shown in the Fund’s prospectus in effect as of the date of this report. The expense ratios for the current reporting period can be found in the Financial Highlights section of this report under Ratios to Average Net Assets. Net expenses reflect contractual expense caps set to expire on 4/30/18. When a Fund’s expenses are below the cap, gross and net expense ratios will be the same. See Note 6 of the Notes to Financial Statements for more information about the Fund’s expense caps. |
5 |
GATEWAY EQUITY CALL PREMIUM FUND
| | |
| Managers | | Symbols |
| Daniel M. Ashcraft, CFA® | | Class A GCPAX |
| Michael T. Buckius, CFA® | | Class C GCPCX |
| Kenneth H. Toft, CFA® | | Class N GCPNX |
| Gateway Investment Advisers, LLC | | Class Y GCPYX |
Investment Goal
The Fund seeks total return with less risk than U.S. equity markets.
Management Discussion
The S&P 500® Index returned 21.83% in 2017 with the equity market exhibiting very low volatility throughout the year. In fact, for the first time in its history, the total return of the S&P 500® Index was positive in each month of the calendar year. The market shrugged off a contentious domestic political environment, three major hurricanes, escalating rhetoric between the Trump administration and North Korea, and tightening monetary policy conditions. Actions by the Federal Reserve (the Fed) included three rate hikes and a move toward shrinking the size of its balance sheet after nearly a decade of supporting capital markets with asset purchases. Contributors to the market’s upward momentum included a globally synchronized economic expansion and strong earnings growth for US corporations. The US economy expanded at a 3.2% rate in the third quarter of 2017 and the Fed expects that, once aggregate statistics are compiled, economic growth for 2017 will come in at 2.5%. Trailing 12-month growth in aggregate operating earnings for S&P 500® Index companies came in at nearly 17% as of September 30, and analysts estimate that, once companies report fourth quarter earnings in early 2018, earnings for calendar year 2017 will have grown nearly 18%.
The equity market exhibited historically low volatility in 2017. Realized volatility for the year (as measured by the annualized standard deviation of daily returns for the S&P 500® Index) was just 6.78%, the lowest reading since 1964. Moreover, the largest peak-to-trough decline experienced by the S&P 500® Index for 2017 was a loss of just 2.58% from March 1 through April 13. Implied volatility, as measured by the CBOE Volatility Index® (the VIX®), averaged 11.09 in 2017, well below its long-term average of 19.39 and the lowest annual average in the history of the statistic, which began in 1990. The VIX® also set new all-time records for an intra-day low, 8.56 on November 24, and a closing low of 9.14 on November 3. The VIX® closed below 10 on 52 days in 2017. Prior to 2017, it had closed below 10 just nine times in its history.
Performance Results
For the 12 months ended December 31, 2017, Class Y shares of Gateway Equity Call Premium Fund returned 12.21% at net asset value. The Fund underperformed its primary benchmark, the CBOE S&P 500 BuyWrite Index (BXMSM), which returned 13.00%, and its secondary benchmark S&P 500® Index, which returned 21.83% for the same period.
| 6
GATEWAY EQUITY CALL PREMIUM FUND
Explanation of Fund Performance
The Fund invests in a diversified stock portfolio designed to support its index option-based risk management strategy as efficiently as possible while seeking to enhance the Fund’s after-tax total return. The Fund seeks to generate returns by writing at- and near-the-money index call options against the full value of its underlying equity portfolio. The steady cash flow from call option writing is intended to be an important source of the Fund’s return, although it reduces the Fund’s ability to profit from increases in the value of its equity portfolio. The index call options written by the Fund often have similar characteristics to the index call option present in the BXMSM at any given time. However, unlike the BXMSM, the Fund employs an active strategy that gives its management team discretion to diversify expiration dates and strike prices across a portfolio of index call options, and to opportunistically pursue attractive call premiums while maintaining a relatively consistent risk profile.
Despite outperforming its benchmark in eight months of the year, the Fund’s total return was less than the BXMSM in 2017 primarily due to relative performance in January, when it underperformed by 93 basis points (bps), and May, when it underperformed by 99 bps. The Fund’s underperformance in January was primarily due to the BXM’sSM index call option having a higher strike price than the weighted-average strike price of the Fund’s index call option portfolio at the beginning of the month, which resulted in the BXMSM having more market exposure and, therefore, more participation in the market’s advance over the first two weeks of the year. The Fund’s underperformance in May was primarily due to the weighted-average strike price of the Fund’s index call option portfolio being higher than the strike price of the BXM’sSM index call option during a brief market pullback that occurred mid-month. The lower strike price of the BXM’sSM index call option resulted in less market exposure and, therefore, less participation in the market decline. In the eight months that the Fund outperformed its benchmark, the active management of its diversified portfolio of written index call options added value over the single-option, hold-to-expiration approach of the BXMSM. The active management of the Fund allowed it to generate higher cash flow during periods of relatively elevated implied volatility and maintain a more consistent amount of market exposure as the equity market advanced.
The Fund’s equity portfolio returned 21.76% for the year, a performance differential of negative 7 bps versus the S&P 500® Index. Though collecting premiums from writing index call options generally allows the Fund to generate a positive return when the S&P 500® Index advances, call option positions that expire or are closed out when the Index is well above the option’s strike price may generate realized losses. Thus, call option positions detracted from the Fund’s return all four quarters of the year. Fund expenses and losses on index call options detracted approximately 9.55 percentage points from overall return for the year. Consistent with its investment objective, the measured risk of the Fund was lower than that of the US equity market and similar to the Fund’s benchmark, as its standard deviation for 2017 was 3.80%, versus 6.78% and 3.75% for the S&P 500® Index and the BXMSM, respectively.
7 |
Outlook
2017 was a continuation of a multi-year period of above-average equity market returns with below-average volatility. Recent fundamental drivers of low volatility include a positive market backdrop featuring expanding global economic growth and strong corporate earnings as well as low correlation across individual stocks. This positive backdrop has helped propel the stock market higher and rising equity markets tend to have lower volatility levels than falling equity markets. While the economy seems to be on increasingly sound footing, it remains to be seen how long these beneficial trends will persist. Volatility is a cyclical phenomenon and the current low phase of the cycle will come to an end at some point. A return to persistently elevated volatility may happen gradually, as the forces keeping volatility low erode, or it could happen suddenly through an external shock to the system. As always, Gateway will avoid incorporating forecasts into its investment approach, and will not attempt to anticipate how events will unfold.
Gateway’s investment philosophy maintains that the US equity market is the most reliable source of attractive long-term returns, despite its high volatility and tendency to periodically deliver significant losses over shorter periods of time. Gateway’s investment philosophy also holds that consistency is the key to long-term investment success and that generating cash flow, rather than seeking to forecast the rise and fall of the market, can be a lower-risk means of participating in equity markets. By staying true to its philosophy and continuing to manage the Gateway Equity Call Premium Fund consistently with the firm’s historical approach, Gateway will continue to assist investors in managing risk while pursuing long-term return in this positive, yet uncertain, environment.
Hypothetical Growth of $100,000 Investment in Class Y Shares4
September 30, 2014 (inception) through December 31, 2017
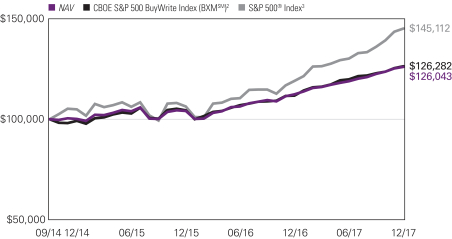
See notes to chart on page 10.
| 8
GATEWAY EQUITY CALL PREMIUM FUND
Top Ten Holdings as of December 31, 2017
| | | | | | |
| Security name | | % of
net assets | |
| 1. | | Apple, Inc. | | | 3.95 | % |
| 2. | | Microsoft Corp. | | | 2.99 | |
| 3. | | Amazon.com, Inc. | | | 2.11 | |
| 4. | | Facebook, Inc. | | | 2.02 | |
| 5. | | JPMorgan Chase & Co. | | | 1.94 | |
| 6. | | Berkshire Hathaway, Inc., Class B | | | 1.91 | |
| 7. | | Exxon Mobil Corp. | | | 1.76 | |
| 8. | | Johnson & Johnson | | | 1.76 | |
| 9. | | Alphabet, Inc., Class A | | | 1.58 | |
| 10. | | Bank of America Corp. | | | 1.45 | |
The portfolio is actively managed and holdings are subject to change. There is no guarantee the Fund continues to invest in the securities referenced. The holdings listed exclude any temporary cash investments.
9 |
Average Annual Total Returns — December 31, 20174
| | | | | | | | | | | | | | | | | | | | |
| | | | | |
| | | | | | | | | | | | Expense Ratios5 | |
| | | 1 Year | | | Life of Class | | | Gross | | | Net | |
| | | | | | |
| Class Y (Inception 9/30/14) | | | | | | | Class A/C/Y | | | | Class N | | | | | | | | | |
| NAV | | | 12.21 | % | | | 7.38 | % | | | — | % | | | 1.06 | % | | | 0.95 | % |
| | | | | | |
| Class A (Inception 9/30/14) | | | | | | | | | | | | | | | | | | | | |
| NAV | | | 11.80 | | | | 7.09 | | | | — | | | | 1.31 | | | | 1.20 | |
| With 5.75% Maximum Sales Charge | | | 5.41 | | | | 5.16 | | | | — | | | | | | | | | |
| | | | | | |
| Class C (Inception 9/30/14) | | | | | | | | | | | | | | | | | | | | |
| NAV | | | 10.95 | | | | 6.32 | | | | — | | | | 1.98 | | | | 1.95 | |
| With CDSC1 | | | 9.95 | | | | 6.32 | | | | — | | | | | | | | | |
| | | | | | |
| Class N (Inception 5/1/17) | | | | | | | | | | | | | | | | | | | | |
| NAV | | | — | | | | — | | | | 7.50 | | | | 1.00 | | | | 0.90 | |
| | | | | | |
| Comparative Performance | | | | | | | | | | | | | | | | | | | | |
| CBOE S&P 500 BuyWrite Index (BXMSM)2 | | | 13.00 | | | | 7.44 | | | | 7.58 | | | | | | | | | |
| S&P 500® Index3 | | | 21.83 | | | | 12.13 | | | | 13.50 | | | | | | | | | |
Performance data shown represents past performance and is no guarantee of, and not necessarily indicative of, future results. Total return and value will vary, and you may have a gain or loss when shares are sold. Current performance may be lower or higher than quoted. For most recent month-end performance, visit im.natixis.com/performance. Performance for other share classes will be greater or less than shown based on differences in fees and sales charges. You may not invest directly in an index. Performance for periods less than one year is cumulative, not annualized. Returns reflect changes in share price and reinvestment of dividends and capital gains, if any. The table(s) do not reflect taxes shareholders might owe on any fund distributions or when they redeem their shares.
| 1 | Performance for Class C shares assumes a 1% contingent deferred sales charge (“CDSC”) applied when you sell shares within one year of purchase. |
| 2 | The CBOE S&P 500 BuyWrite Index (BXMSM) is a benchmark index designed to track the performance of a hypothetical buy-write strategy on the S&P 500® Index. The BXM is a passive total return index based on (1) buying an S&P 500 stock index portfolio, and (2) “writing” (or selling) the near-term S&P 500® Index (SPXSM) “covered” call option, generally on the third Friday of each month. The SPX call written will have about one month remaining to expiration, with an exercise price just above the prevailing index level (i.e., slightly out of the money). The SPX call is held until expiration and cash settled, at which time a new one-month, near-the-money call is written. |
| 3 | S&P 500® Index is a widely recognized measure of U.S. stock market performance. It is an unmanaged index of 500 common stocks chosen for market size, liquidity, and industry group representation, among other factors. It also measures the performance of the large cap segment of the US equities market. |
| 4 | Fund performance has been increased by fee waivers and/or expense reimbursements, if any, without which performance would have been lower. |
| 5 | Expense ratios are as shown in the Fund’s prospectus in effect as of the date of this report. The expense ratios for the current reporting period can be found in the Financial Highlights section of this report under Ratios to Average Net Assets. Net expenses reflect contractual expense caps set to expire on 4/30/18. When a Fund’s expenses are below the cap, gross and net expense ratios will be the same. See Note 6 of the Notes to Financial Statements for more information about the Fund’s expense caps. |
| 10
MIROVA GLOBAL GREEN BOND FUND
| | |
| Managers | | Symbols |
| Christopher Wigley | | Class A MGGAX |
| Marc Briand | | Class N MGGNX |
| Natixis Asset Management U.S., LLC | | Class Y MGGYX |
Investment Goal
The Fund seeks to provide total return, through a combination of capital appreciation and current income, by investing in green bonds.
Market Conditions
2017 turned out to be a solid year for fixed income. The US 10-year Treasury yield opened at 2.45% and ranged between 2.63% and 2.04% before closing almost unchanged at 2.41%. After a cautious market start to the year, the key theme throughout most of 2017 was the lack of policy success by the Trump administration. Government bond yields fell as the expected policy stimulus did not arrive and geopolitical tensions increased, particularly in North Korea. When tax reform was eventually delivered at year-end, market attention then turned to the question as to how this would be funded. It appeared that the US Treasury market would have to take the strain, with the result that the national debt would inevitably increase, so putting pressure on US treasury yields. Although the US 10 year US Treasury note yield increased at the end of the year, corporate bonds by comparison had a good year in total with credit spreads opening at the high of 130 basis points (bps) and closing 1 bp off the low at 99 bps (minus 31 bps). Although central banks wanted to remove accommodation, they were very wary of removing it too quickly, so quantitative easing programs, particularly in Europe, provided investors with reassurance. Sustainability was also a key feature of the year as Millennials prioritized personal values alongside financial returns and subjects like gender equality and sexual harassment (the #MeToo movement) became hot topics in Q4.
Performance Results
The Mirova Global Green Bond Fund was launched on February 28, 2017. For the ten months ended December 31, 2017, Class Y shares of Mirova Global Green Bond Fund returned 1.66% at net asset value. The Fund underperformed its benchmark, the Bloomberg Barclays MSCI Green Bond Index, which returned 3.02% over the same period.
Explanation of Fund Performance
Security selection is at the heart of the investment process and was the largest positive contributor to performance relative to the benchmark. Duration and term structure were the largest detractors — primarily due to less exposure to US 30-year bonds. Asset allocation contributed +1 bp, although less exposure to sovereign green bonds at the beginning of the year detracted from performance while higher exposure to quasi-governments instead contributed to performance. The team took a cautious view on France
11 |
across all funds approaching the French elections, yet the largest green bond and very long dated French Green OAT rallied soon after launch in January as prospects for a Macron victory dispelled fears of an extreme National Front government.
Security selection contributed to performance in 2017. The poorest performing security was IFC 2.125% 2026. Anglian Water and IFC also contributed negatively. The best performing green bond was EIB 0.5% 2037. Enel 0.5% 2024 and the Province of Ontario also contributed positively. Generally, in such a low volatility environment, the best performing securities were those that benefited most from central bank programs — particularly long dated issues and credit.
Outlook
Our investment thesis is built around the conviction that our society is going through four major transitions: demographics, environmental, technological, and governance, and that each of those transitions will have huge consequences for how our economy is organized. Our ability as a society and an economy to deal with those transitions at a sustainable pace will be the key to success. We believe that these subjects will become increasingly important drivers of investment returns in 2018 and beyond. This has positive and negative implications. Owning the broad market means also owning stocks and bonds negatively exposed to these transitions. Investors will need to be cognizant of these transitions as they build their portfolios. We expect rates on longer-term debt instruments to trend higher in both the US and Europe in 2018, albeit in a continued low inflation scenario. We also expect central banks to continue to increase short-term interest rates (not expected for the European Central Bank in 2018) and reduce their bond repurchase programs. This increased demand that will only be partly offset by higher demand for income generating assets by the retiring Baby Boomer generation.
A major factor currently challenging the markets is the geopolitical risks such as North Korea, Catalonia and any number of small regions in the European Union that may prefer independence. Inflation may rise if the decreased investment in the oil sector eventually sends oil prices up. Finally, the International Monetary Fund has recently increased its forecasts for economic growth in 2017 and 2018, but these developments are often subject to surprises.
We are conservative in our estimates and hold that green bond issuance amounted to $60 billion in 2017. We believe that an additional $50 to $70 billion of green bonds will be issued in 2018. We expect significant issuance in corporate green bonds and probably sovereign green bonds, too. As the market becomes increasingly popular with issuers, a key attraction for investors may be green bonds’ unique impact.
| 12
MIROVA GLOBAL GREEN BOND FUND
Hypothetical Growth of $100,000 Investment in Class Y Shares2
February 28, 2017 (inception) through December 31, 2017
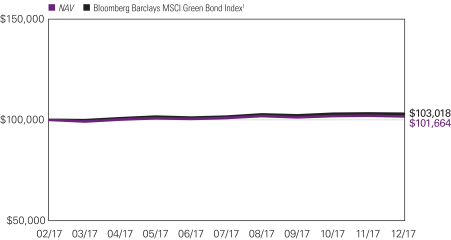
13 |
Total Returns — December 31, 20172
| | | | | | | | | | | | |
| | | |
| | | | | | Expense Ratios3 | |
| | | Life of Fund | | | Gross | | | Net | |
| | | | |
| Class Y (Inception 2/28/17) | | | | | | | | | | | | |
| NAV | | | 1.66 | % | | | 1.20 | % | | | 0.70 | % |
| | | | |
| Class A (Inception 2/28/17) | | | | | | | | | | | | |
| NAV | | | 1.46 | | | | 1.45 | | | | 0.95 | |
| With 4.25% Maximum Sales Charge | | | -2.81 | | | | | | | | | |
| | | | |
| Class N (Inception 2/28/17) | | | | | | | | | | | | |
| NAV | | | 1.77 | | | | 1.11 | | | | 0.65 | |
| | | | |
| Comparative Performance | | | | | | | | | | | | |
| Bloomberg Barclays MSCI Green Bond Index1 | | | 3.02 | | | | | | | | | |
Performance data shown represents past performance and is no guarantee of, and not necessarily indicative of, future results. Total return and value will vary, and you may have a gain or loss when shares are sold. Current performance may be lower or higher than quoted. For most recent month-end performance, visit im.natixis.com/performance. Performance for other share classes will be greater or less than shown based on differences in fees and sales charges. You may not invest directly in an index. Performance for periods less than one year is cumulative, not annualized. Returns reflect changes in share price and reinvestment of dividends and capital gains, if any. The table(s) do not reflect taxes shareholders might owe on any fund distributions or when they redeem their shares.
| 1 | The Bloomberg Barclays MSCI Green Bond Index provides a broad-based measure of global fixed-income securities issued to fund projects with direct environmental benefits according to MSCI ESG Research’s green bond criteria. The green bonds are primarily investment-grade, or may be classified by other sources when bond ratings are not available. The Index may include green bonds from the corporate, securitized, Treasury, or government-related sectors. |
| 2 | Fund performance has been increased by fee waivers and/or expense reimbursements, if any, without which performance would have been lower. |
| 3 | Expense ratios are as shown in the Fund’s prospectus in effect as of the date of this report. The expense ratios for the current reporting period can be found in the Financial Highlights section of this report under Ratios to Average Net Assets. Net expenses reflect contractual expense caps set to expire on 4/30/18. When a Fund’s expenses are below the cap, gross and net expense ratios will be the same. See Note 6 of the Notes to Financial Statements for more information about the Fund’s expense caps. |
| 14
MIROVA GLOBAL SUSTAINABLE EQUITY FUND
| | |
| Managers | | Symbols |
| Jens Peers, CFA® | | Class A ESGMX |
| Suzanne Senellart | | Class C ESGCX |
| Hua Cheng, CFA®, PhD | | Class N ESGNX |
| Natixis Asset Management U.S., LLC | | Class Y ESGYX |
Investment Goal
The Fund seeks long-term capital appreciation.
Market Conditions
2017 turned out to be an excellent year for global equity investors. Stable and accelerating economic growth in all major parts of the world, combined with low interest rates, provided the almost perfect backdrop for earnings growth and share price performance. After a more sentiment-driven outperformance by traditional energy-related companies in 2016, primarily at the expense of technology stocks, 2017 saw the complete opposite.
Geopolitical tensions rose during the year, relating primarily to North Korea, Iran and Saudi Arabia. Social and governance issues like gender equality and sexual harassment (the #MeToo movement) and fair tax treatment also became hot topics near the end of the year.
Performance Results
For the 12 months ended December 31, 2017, Class Y Shares of the Mirova Global Sustainable Equity Fund returned 30.75% at net asset value. The Fund outperformed its benchmark, the MSCI World Index (Net), which returned 22.40% over the same period. It is important to note that there are material differences between the Fund and this benchmark.
Explanation of Fund Performance
While the majority of the outperformance can be attributed to individual stocks in the portfolio, the Fund also benefited from its sector selection relative to the benchmark. Most notably, the Fund’s significant overexposure to technology and a lack of exposure to traditional energy companies aided relative returns. Those choices are the result of the investment process, which aims to identify companies whose products and services contribute positively and sustainably to the demographic, environmental, technological and ethical (governance-related) evolution of the world.
Stock selection was the biggest contributor, however, as many companies in the portfolio benefited from better-than-anticipated earnings announcements and/or increased earnings growth expectations. This was notably the case in the tech sector with Tencent and Facebook in the social media area. We also had strong performance in the consumption theme, with Amazon.com confirming its leadership position in the growing e-retail business. The company acquired Whole Foods, which has put pressure on share prices of traditional retailers. We also saw a strong rebound of Illumina and Novo Nordisk after
15 |
their 2016 underperformance. The drive towards natural ingredients pushed share prices higher for Christian Hansen and Novozymes. And finally, as the car manufacturing sector is accelerating the focus on the production of autonomous and electric cars, share prices of Aptiv (the autonomous vehicle division of Delphi) and BYD (a Chinese electric car manufacturer) posted strong returns. On the negative side, United Natural Foods, Acuity Brands, Raffles Medical Group and Alexion Pharmaceuticals were the most significant detractors from performance. The Fund sold out of its positions in United Natural Foods and Alexion Pharmaceuticals during the period.
Outlook
The combination of low interest rates, proactive central policies, accelerating economic growth, and low inflation has provided an almost perfect scenario for equity investors, which we expect to continue in 2018. There is one major difference, however. Interest rates are likely to rise. As higher rates are driven by the anticipation of a more robust global economic recovery, we believe this is on balance still good news for expected 2018 equity returns. Geopolitical risk remains the biggest risk for global markets. In Europe, national elections may intensify the debate around a further break-up of the European Union.
We believe that sustainability will become a more important driver of investment returns in 2018. Recent evidence includes the #MeToo movement and the announcement by Facebook that it will start booking revenues in the countries where they are generated, which should lead to higher tax income for the countries involved.
For 2018, we see good investment opportunities in energy efficiency and renewables, driven by higher oil prices and technological progress. We also expect the providers of industrial water solutions to do well as capex investments are expected to accelerate in 2018. For the technology sector, we believe some investors are underestimating the need for our economy to integrate high-tech solutions in order to be able to compete over the long run. Healthcare stocks finally may also benefit from more attractive valuations after a challenging 2017.
| 16
MIROVA GLOBAL SUSTAINABLE EQUITY FUND
Hypothetical Growth of $100,000 Investment in Class Y Shares3
March 31, 2016 (inception) through December 31, 2017
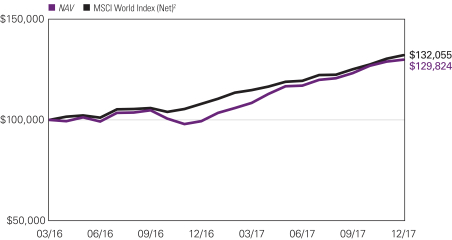
Top Ten Holdings as of December 31, 2017
| | | | | | |
| Security name | | % of
net assets | |
| 1 | | Alphabet, Inc., Class A | | | 4.82 | % |
| 2 | | MasterCard, Inc., Class A | | | 4.80 | |
| 3 | | Thermo Fisher Scientific, Inc. | | | 3.81 | |
| 4 | | Microsoft Corp. | | | 3.77 | |
| 5 | | Novo Nordisk AS, Class B | | | 3.60 | |
| 6 | | KBC Groep NV | | | 3.44 | |
| 7 | | Essilor International Cie Generale d’Optique S.A. | | | 3.24 | |
| 8 | | Ecolab, Inc. | | | 3.23 | |
| 9 | | Facebook, Inc., Class A | | | 3.18 | |
| 10 | | Danaher Corp. | | | 3.18 | |
The portfolio is actively managed and holdings are subject to change. There is no guarantee the Fund continues to invest in the securities referenced. The holdings listed exclude any temporary cash investments.
17 |
Average Annual Total Returns — December 31, 20173
| | | | | | | | | | | | | | | | | | | | |
| | | | | |
| | | | | | | | | | | | Expense Ratios4 | |
| | | 1 Year | | | Life of Class | | | Gross | | | Net | |
| | | | | | |
| Class Y (Inception 3/31/16) | | | | | | | Class A/C/Y | | | | Class N | | | | | | | | | |
| NAV | | | 30.75 | % | | | 16.05 | % | | | — | % | | | 1.21 | % | | | 1.05 | % |
| | | | | | |
| Class A (Inception 3/31/16) | | | | | | | | | | | | | | | | | | | | |
| NAV | | | 30.44 | | | | 15.80 | | | | — | | | | 1.72 | | | | 1.30 | |
| With 5.75% Maximum Sales Charge | | | 22.99 | | | | 11.95 | | | | — | | | | | | | | | |
| | | | | | |
| Class C (Inception 3/31/16) | | | | | | | | | | | | | | | | | | | | |
| NAV | | | 29.40 | | | | 14.92 | | | | — | | | | 2.20 | | | | 2.05 | |
| With CDSC1 | | | 28.40 | | | | 14.92 | | | | — | | | | | | | | | |
| | | | | | |
| Class N (Inception 5/1/17) | | | | | | | | | | | | | | | | | | | | |
| NAV | | | | | | | — | | | | 14.81 | | | | 1.20 | | | | 1.00 | |
| | | | | | |
| Comparative Performance | | | | | | | | | | | | | | | | | | | | |
| MSCI World Index (Net)2 | | | 22.40 | | | | 17.20 | | | | 13.13 | | | | | | | | | |
Performance data shown represents past performance and is no guarantee of, and not necessarily indicative of, future results. Total return and value will vary, and you may have a gain or loss when shares are sold. Current performance may be lower or higher than quoted. For most recent month-end performance, visit im.natixis.com/performance. Performance for other share classes will be greater or less than shown based on differences in fees and sales charges. You may not invest directly in an index. Performance for periods less than one year is cumulative, not annualized. Returns reflect changes in share price and reinvestment of dividends and capital gains, if any. The table(s) do not reflect taxes shareholders might owe on any fund distributions or when they redeem their shares.
| 1 | Performance for Class C shares assumes a 1.00% contingent deferred sales charge (“CDSC”) applied when you sell shares within one year of purchase. |
| 2 | MSCI World Index (Net) is an unmanaged index that is designed to measure the equity market performance of developed markets. It is composed of common stocks of companies representative of the market structure of developed market countries in North America, Europe, and the Asia/Pacific Region. The index is calculated without dividends, with net or with gross dividends reinvested, in both U.S. dollars and local currencies. You may not invest directly in an index. |
| 3 | Fund performance has been increased by fee waivers and/or expense reimbursements, if any, without which performance would have been lower. |
| 4 | Expense ratios are as shown in the Fund’s prospectus in effect as of the date of this report. The expense ratios for the current reporting period can be found in the Financial Highlights section of this report under Ratios to Average Net Assets. Net expenses reflect contractual expense caps set to expire on 4/30/18. When a Fund’s expenses are below the cap, gross and net expense ratios will be the same. See Note 6 of the Notes to Financial Statements for more information about the Fund’s expense caps. |
| 18
ADDITIONAL INFORMATION
The views expressed in this report reflect those of the portfolio managers as of the dates indicated. The managers’ views are subject to change at any time without notice based on changes in market or other conditions. References to specific securities or industries should not be regarded as investment advice. Because the Funds are actively managed, there is no assurance that they will continue to invest in the securities or industries mentioned.
All investing involves risk, including the risk of loss. There is no assurance that any investment will meet its performance objectives or that losses will be avoided.
ADDITIONAL INDEX INFORMATION
This document may contain references to third party copyrights, indexes, and trademarks, each of which is the property of its respective owner. Such owner is not affiliated with Natixis Investment Managers or any of its related or affiliated companies (collectively “Natixis Affiliates”) and does not sponsor, endorse or participate in the provision of any Natixis Affiliates services, funds or other financial products.
The index information contained herein is derived form third parties and is provided on an “as is” basis. The user of this information assumes the entire risk of use of this information. Each of the third party entities involved in compiling, computing or creating index information, disclaims all warranties (including, without limitation, any warranties of originality, accuracy, completeness, timeliness, non-infringement, merchantability and fitness for a particular purpose) with respect to such information.
PROXY VOTING INFORMATION
A description of Natixis Funds’ proxy voting policies and procedures is available without charge, upon request, by calling Natixis Funds at 800-225-5478; on Natixis Funds’ website at im.natixis.com; and on the Securities and Exchange Commission’s (SEC) website at www.sec.gov. Information regarding how Natixis Funds voted proxies relating to portfolio securities during the most recent 12-month period ended June 30 is available on Natixis Funds’ website and the SEC’s website.
QUARTERLY PORTFOLIO SCHEDULES
Natixis Funds file a complete schedule of portfolio holdings with the SEC for the first and third quarters of each fiscal year on Form N-Q. The Funds’ Forms N-Q are available on the SEC’s website at www.sec.gov and may be reviewed and copied at the SEC’s Public Reference Room in Washington, DC. Information on the operation of the Public Reference Room may be obtained by calling 800-SEC-0330.
19 |
UNDERSTANDING FUND EXPENSES
As a mutual fund shareholder, you incur different types of costs: transaction costs, including sales charges (loads) on purchases, contingent deferred sales charges on redemptions, and ongoing costs, including management fees, distribution and/or service fees (12b-1 fees), and other fund expenses. Certain exemptions may apply. These costs are described in more detail in the Fund’s prospectus. The following examples are intended to help you understand the ongoing costs of investing in the Fund and help you compare these with the ongoing costs of investing in other mutual funds.
The first line in the table for each class shows the actual account values and actual Fund expenses you would have paid on a $1,000 investment in the Fund from July 1, 2017 through December 31, 2017. To estimate the expenses you paid over the period, simply divide your account value by $1,000 (for example, $8,600 account value divided by $1,000 = 8.60) and multiply the result by the number in the Expenses Paid During Period column as shown for your Class.
The second line for the table of each class provides information about hypothetical account values and hypothetical expenses based on the Fund’s actual expense ratios and an assumed rate of return of 5% per year before expenses, which is not the Fund’s actual return. The hypothetical account values and expenses may not be used to estimate the actual ending account balance or expenses you paid on your investment for the period. You may use this information to compare the ongoing costs of investing in the Fund and other funds. To do so, compare this 5% hypothetical example with the 5% hypothetical examples that appear in the shareholder reports of the other funds.
Please note that the expenses shown reflect ongoing costs only, and do not include any transaction costs, such as sales charges. Therefore, the second line in the table of each Fund is useful in comparing ongoing costs only, and will not help you determine the relative costs of owning different funds. If transaction costs were included, total costs would be higher.
| 20
| | | | | | | | | | | | |
| GATEWAY FUND | | BEGINNING
ACCOUNT VALUE
7/1/2017 | | | ENDING
ACCOUNT VALUE
12/31/2017 | | | EXPENSES PAID
DURING PERIOD*
7/1/2017 – 12/31/2017 | |
| Class A | | | | | | | | | | | | |
| Actual | | | $1,000.00 | | | | $1,044.90 | | | | $4.85 | |
| Hypothetical (5% return before expenses) | | | $1,000.00 | | | | $1,020.47 | | | | $4.79 | |
| Class C | | | | | | | | | | | | |
| Actual | | | $1,000.00 | | | | $1,041.20 | | | | $8.75 | |
| Hypothetical (5% return before expenses) | | | $1,000.00 | | | | $1,016.64 | | | | $8.64 | |
| Class N | | | | | | | | | | | | |
| Actual | | | $1,000.00 | | | | $1,046.80 | | | | $3.35 | |
| Hypothetical (5% return before expenses) | | | $1,000.00 | | | | $1,021.93 | | | | $3.31 | |
| Class Y | | | | | | | | | | | | |
| Actual | | | $1,000.00 | | | | $1,046.50 | | | | $3.61 | |
| Hypothetical (5% return before expenses) | | | $1,000.00 | | | | $1,021.68 | | | | $3.57 | |
| * | Expenses are equal to the Fund’s annualized expense ratio (after waiver/reimbursement): 0.94%, 1.70%, 0.65% and 0.70% for Class A, C, N and Y, respectively, multiplied by the average account value over the period, multiplied by the number of days in the most recent fiscal half-year (184), divided by 365 (to reflect the half-year period). |
| | | | | | | | | | | | |
| GATEWAY EQUITY CALL PREMIUM FUND | | BEGINNING
ACCOUNT VALUE
7/1/2017 | | | ENDING
ACCOUNT VALUE
12/31/2017 | | | EXPENSES PAID
DURING PERIOD*
7/1/2017 – 12/31/2017 | |
| Class A | | | | | | | | | | | | |
| Actual | | | $1,000.00 | | | | $1,057.70 | | | | $6.22 | |
| Hypothetical (5% return before expenses) | | | $1,000.00 | | | | $1,019.16 | | | | $6.11 | |
| Class C | | | | | | | | | | | | |
| Actual | | | $1,000.00 | | | | $1,053.60 | | | | $10.09 | |
| Hypothetical (5% return before expenses) | | | $1,000.00 | | | | $1,015.38 | | | | $9.91 | |
| Class N | | | | | | | | | | | | |
| Actual | | | $1,000.00 | | | | $1,059.80 | | | | $4.67 | |
| Hypothetical (5% return before expenses) | | | $1,000.00 | | | | $1,020.67 | | | | $4.58 | |
| Class Y | | | | | | | | | | | | |
| Actual | | | $1,000.00 | | | | $1,060.50 | | | | $4.93 | |
| Hypothetical (5% return before expenses) | | | $1,000.00 | | | | $1,020.42 | | | | $4.84 | |
| * | Expenses are equal to the Fund’s annualized expense ratio (after waiver/reimbursement): 1.20%, 1.95%, 0.90% and 0.95% for Class A, C, N and Y, respectively, multiplied by the average account value over the period, multiplied by the number of days in the most recent fiscal half-year (184), divided by 365 (to reflect the half-year period). |
21 |
| | | | | | | | | | | | |
| MIROVA GLOBAL GREEN BOND FUND | | BEGINNING
ACCOUNT VALUE
7/1/2017 | | | ENDING
ACCOUNT VALUE
12/31/2017 | | | EXPENSES PAID
DURING PERIOD*
7/1/2017 – 12/31/2017 | |
| Class A | | | | | | | | | | | | |
| Actual | | | $1,000.00 | | | | $1,011.60 | | | | $4.87 | |
| Hypothetical (5% return before expenses) | | | $1,000.00 | | | | $1,020.37 | | | | $4.89 | |
| Class N | | | | | | | | | | | | |
| Actual | | | $1,000.00 | | | | $1,012.70 | | | | $3.35 | |
| Hypothetical (5% return before expenses) | | | $1,000.00 | | | | $1,021.88 | | | | $3.36 | |
| Class Y | | | | | | | | | | | | |
| Actual | | | $1,000.00 | | | | $1,012.60 | | | | $3.60 | |
| Hypothetical (5% return before expenses) | | | $1,000.00 | | | | $1,021.63 | | | | $3.62 | |
| * | Expenses are equal to the Fund’s annualized expense ratio (after waiver/reimbursement): 0.96%, 0.66% and 0.71% for Class A, N and Y, respectively, multiplied by the average account value over the period, multiplied by the number of days in the most recent fiscal half-year (184), divided by 365 (to reflect the half-year period). |
| | | | | | | | | | | | |
MIROVA GLOBAL SUSTAINABLE EQUITY
FUND | | BEGINNING
ACCOUNT VALUE
7/1/2017 | | | ENDING
ACCOUNT VALUE
12/31/2017 | | | EXPENSES PAID
DURING PERIOD*
7/1/2017 – 12/31/2017 | |
| Class A | | | | | | | | | | | | |
| Actual | | | $1,000.00 | | | | $1,109.50 | | | | $6.86 | |
| Hypothetical (5% return before expenses) | | | $1,000.00 | | | | $1,018.70 | | | | $6.56 | |
| Class C | | | | | | | | | | | | |
| Actual | | | $1,000.00 | | | | $1,104.50 | | | | $10.82 | |
| Hypothetical (5% return before expenses) | | | $1,000.00 | | | | $1,014.92 | | | | $10.36 | |
| Class N | | | | | | | | | | | | |
| Actual | | | $1,000.00 | | | | $1,110.70 | | | | $5.32 | |
| Hypothetical (5% return before expenses) | | | $1,000.00 | | | | $1,020.16 | | | | $5.09 | |
| Class Y | | | | | | | | | | | | |
| Actual | | | $1,000.00 | | | | $1,110.30 | | | | $5.48 | |
| Hypothetical (5% return before expenses) | | | $1,000.00 | | | | $1,020.01 | | | | $5.24 | |
| * | Expenses are equal to the Fund’s annualized expense ratio (after waiver/reimbursement): 1.29%, 2.04%, 1.00% and 1.03% for Class A, C, N and Y, respectively, multiplied by the average account value over the period, multiplied by the number of days in the most recent fiscal half-year (184), divided by 365 (to reflect the half-year period). |
| 22
Portfolio of Investments – as of December 31, 2017
Gateway Fund
| | | | | | | | |
| Shares | | | Description | | Value (†) | |
| | Common Stocks — 98.9% of Net Assets | | | | |
| | | | Aerospace & Defense — 2.3% | | | | |
| | 252,587 | | | Boeing Co. (The)(a) | | $ | 74,490,432 | |
| | 57,682 | | | Huntington Ingalls Industries, Inc.(a) | | | 13,595,648 | |
| | 244,519 | | | Raytheon Co.(a) | | | 45,932,894 | |
| | 48,716 | | | TransDigm Group, Inc.(a) | | | 13,378,388 | |
| | 400,197 | | | United Technologies Corp.(a) | | | 51,053,131 | |
| | | | | | | | |
| | | | | | | 198,450,493 | |
| | | | | | | | |
| | | | Air Freight & Logistics — 0.7% | | | | |
| | 460,816 | | | United Parcel Service, Inc., Class B(a) | | | 54,906,226 | |
| | | | | | | | |
| | | | Airlines — 0.5% | | | | |
| | 107,742 | | | Alaska Air Group, Inc.(a) | | | 7,920,114 | |
| | 330,509 | | | American Airlines Group, Inc.(a) | | | 17,196,383 | |
| | 266,319 | | | JetBlue Airways Corp.(a)(b) | | | 5,949,567 | |
| | 224,458 | | | United Continental Holdings, Inc.(a)(b) | | | 15,128,469 | |
| | | | | | | | |
| | | | | | | 46,194,533 | |
| | | | | | | | |
| | | | Auto Components — 0.1% | | | | |
| | 41,540 | | | Adient PLC(a) | | | 3,269,198 | |
| | 45,405 | | | Autoliv, Inc.(a) | | | 5,770,067 | |
| | 86,236 | | | Cooper Tire & Rubber Co.(a) | | | 3,048,443 | |
| | | | | | | | |
| | | | | | | 12,087,708 | |
| | | | | | | | |
| | | | Automobiles — 0.4% | | | | |
| | 2,457,532 | | | Ford Motor Co.(a) | | | 30,694,575 | |
| | 19,598 | | | Tesla, Inc.(a)(b) | | | 6,101,837 | |
| | | | | | | | |
| | | | | | | 36,796,412 | |
| | | | | | | | |
| | | | Banks — 6.7% | | | | |
| | 293,956 | | | Associated Banc-Corp(a) | | | 7,466,482 | |
| | 3,902,378 | | | Bank of America Corp.(a) | | | 115,198,199 | |
| | 1,157,194 | | | Citigroup, Inc.(a) | | | 86,106,806 | |
| | 1,209,783 | | | Huntington Bancshares, Inc.(a) | | | 17,614,440 | |
| | 1,507,689 | | | JPMorgan Chase & Co.(a) | | | 161,232,262 | |
| | 332,605 | | | Old National Bancorp(a) | | | 5,803,957 | |
| | 80,811 | | | Signature Bank(a)(b) | | | 11,092,118 | |
| | 37,348 | | | SVB Financial Group(a)(b) | | | 8,730,842 | |
| | 917,756 | | | U.S. Bancorp(a) | | | 49,173,366 | |
| | 1,820,443 | | | Wells Fargo & Co.(a) | | | 110,446,277 | |
| | | | | | | | |
| | | | | | | 572,864,749 | |
| | | | | | | | |
| | | | Beverages — 2.2% | | | | |
| | 1,807,834 | | | Coca-Cola Co. (The)(a) | | | 82,943,424 | |
| | 241,521 | | | Monster Beverage Corp.(a)(b) | | | 15,285,864 | |
| | 740,648 | | | PepsiCo, Inc.(a) | | | 88,818,508 | |
| | | | | | | | |
| | | | | | | 187,047,796 | |
| | | | | | | | |
| | | | Biotechnology — 3.3% | | | | |
| | 638,345 | | | AbbVie, Inc.(a) | | | 61,734,345 | |
| | 125,445 | | | Alexion Pharmaceuticals, Inc.(a)(b) | | | 15,001,967 | |
See accompanying notes to financial statements.
23 |
Portfolio of Investments – as of December 31, 2017
Gateway Fund – (continued)
| | | | | | | | |
| Shares | | | Description | | Value (†) | |
| | | | Biotechnology — continued | | | | |
| | 293,674 | | | Amgen, Inc.(a) | | $ | 51,069,909 | |
| | 102,495 | | | Biogen, Inc.(a)(b) | | | 32,651,832 | |
| | 101,415 | | | Bioverativ, Inc.(a)(b) | | | 5,468,297 | |
| | 364,871 | | | Celgene Corp.(a)(b) | | | 38,077,938 | |
| | 560,813 | | | Gilead Sciences, Inc.(a) | | | 40,176,643 | |
| | 59,112 | | | Seattle Genetics, Inc.(a)(b) | | | 3,162,492 | |
| | 60,249 | | | Shire PLC, Sponsored ADR(a) | | | 9,345,825 | |
| | 25,386 | | | TESARO, Inc.(a)(b) | | | 2,103,738 | |
| | 119,292 | | | Vertex Pharmaceuticals, Inc.(a)(b) | | | 17,877,099 | |
| | | | | | | | |
| | | | | | | 276,670,085 | |
| | | | | | | | |
| | | | Building Products — 0.5% | | | | |
| | 235,129 | | | Fortune Brands Home & Security, Inc.(a) | | | 16,092,229 | |
| | 458,586 | | | Johnson Controls International PLC(a) | | | 17,476,712 | |
| | 39,485 | | | Lennox International, Inc.(a) | | | 8,223,146 | |
| | | | | | | | |
| | | | | | | 41,792,087 | |
| | | | | | | | |
| | | | Capital Markets — 2.4% | | | | |
| | 69,674 | | | Affiliated Managers Group, Inc.(a) | | | 14,300,589 | |
| | 618,850 | | | Charles Schwab Corp. (The)(a) | | | 31,790,325 | |
| | 162,155 | | | CME Group, Inc.(a) | | | 23,682,738 | |
| | 109,983 | | | Eaton Vance Corp.(a) | | | 6,201,941 | |
| | 183,787 | | | Goldman Sachs Group, Inc. (The)(a) | | | 46,821,576 | |
| | 383,781 | | | Intercontinental Exchange, Inc.(a) | | | 27,079,587 | |
| | 74,008 | | | Legg Mason, Inc.(a) | | | 3,106,856 | |
| | 711,425 | | | Morgan Stanley(a) | | | 37,328,470 | |
| | 68,462 | | | MSCI, Inc.(a) | | | 8,663,181 | |
| | 130,982 | | | TD Ameritrade Holding Corp.(a) | | | 6,697,110 | |
| | 67,751 | | | Waddell & Reed Financial, Inc., Class A(a) | | | 1,513,557 | |
| | | | | | | | |
| | | | | | | 207,185,930 | |
| | | | | | | | |
| | | | Chemicals — 2.2% | | | | |
| | 17,782 | | | AdvanSix, Inc.(a)(b) | | | 748,089 | |
| | 121,378 | | | Ashland Global Holdings, Inc.(a) | | | 8,642,114 | |
| | 74,757 | | | Celanese Corp., Series A(a) | | | 8,004,979 | |
| | 34,610 | | | Chemours Co. (The)(a) | | | 1,732,577 | |
| | 1,012,345 | | | DowDuPont, Inc.(a) | | | 72,099,211 | |
| | 168,176 | | | Eastman Chemical Co.(a) | | | 15,579,825 | |
| | 36,897 | | | Ingevity Corp.(a)(b) | | | 2,600,132 | |
| | 220,028 | | | LyondellBasell Industries NV, Class A(a) | | | 24,273,489 | |
| | 283,899 | | | Monsanto Co.(a) | | | 33,153,725 | |
| | 88,197 | | | Olin Corp.(a) | | | 3,138,049 | |
| | 163,753 | | | RPM International, Inc.(a) | | | 8,583,932 | |
| | 236,738 | | | Valvoline, Inc.(a) | | | 5,932,654 | |
| | | | | | | | |
| | | | | | | 184,488,776 | |
| | | | | | | | |
| | | | Commercial Services & Supplies — 0.4% | | | | |
| | 100,997 | | | Waste Connections, Inc.(a) | | | 7,164,727 | |
| | 317,652 | | | Waste Management, Inc.(a) | | | 27,413,368 | |
| | | | | | | | |
| | | | | | | 34,578,095 | |
| | | | | | | | |
See accompanying notes to financial statements.
| 24
Portfolio of Investments – as of December 31, 2017
Gateway Fund – (continued)
| | | | | | | | |
| Shares | | | Description | | Value (†) | |
| | | | Communications Equipment — 1.2% | | | | |
| | 24,941 | | | Arista Networks, Inc.(a)(b) | | $ | 5,875,601 | |
| | 2,061,144 | | | Cisco Systems, Inc.(a) | | | 78,941,815 | |
| | 115,934 | | | Motorola Solutions, Inc.(a) | | | 10,473,478 | |
| | 40,643 | | | Palo Alto Networks, Inc.(a)(b) | | | 5,890,796 | |
| | | | | | | | |
| | | | | | | 101,181,690 | |
| | | | | | | | |
| | | | Consumer Finance — 0.8% | | | | |
| | 148,984 | | | Ally Financial, Inc.(a) | | | 4,344,373 | |
| | 457,367 | | | American Express Co.(a) | | | 45,421,117 | |
| | 273,240 | | | Discover Financial Services(a) | | | 21,017,621 | |
| | | | | | | | |
| | | | | | | 70,783,111 | |
| | | | | | | | |
| | | | Containers & Packaging — 0.4% | | | | |
| | 97,938 | | | Avery Dennison Corp.(a) | | | 11,249,159 | |
| | 123,706 | | | Sonoco Products Co.(a) | | | 6,573,737 | |
| | 216,203 | | | WestRock Co.(a) | | | 13,666,191 | |
| | | | | | | | |
| | | | | | | 31,489,087 | |
| | | | | | | | |
| | | | Distributors — 0.2% | | | | |
| | 139,130 | | | Genuine Parts Co.(a) | | | 13,218,741 | |
| | | | | | | | |
| | | | Diversified Financial Services — 2.0% | | | | |
| | 858,376 | | | Berkshire Hathaway, Inc., Class B(a)(b) | | | 170,147,291 | |
| | | | | | | | |
| | | | Diversified Telecommunication Services — 2.0% | | | | |
| | 2,301,503 | | | AT&T, Inc.(a) | | | 89,482,437 | |
| | 1,532,583 | | | Verizon Communications, Inc.(a) | | | 81,119,618 | |
| | | | | | | | |
| | | | | | | 170,602,055 | |
| | | | | | | | |
| | | | Electric Utilities — 1.6% | | | | |
| | 561,463 | | | Alliant Energy Corp.(a) | | | 23,923,938 | |
| | 666,189 | | | American Electric Power Co., Inc.(a) | | | 49,011,525 | |
| | 562,484 | | | Duke Energy Corp.(a) | | | 47,310,529 | |
| | 87,627 | | | Hawaiian Electric Industries, Inc.(a) | | | 3,167,716 | |
| | 194,039 | | | OGE Energy Corp.(a) | | | 6,385,824 | |
| | 135,917 | | | Westar Energy, Inc.(a) | | | 7,176,418 | |
| | | | | | | | |
| | | | | | | 136,975,950 | |
| | | | | | | | |
| | | | Electrical Equipment — 0.6% | | | | |
| | 229,541 | | | Eaton Corp. PLC(a) | | | 18,136,034 | |
| | 341,749 | | | Emerson Electric Co.(a) | | | 23,816,488 | |
| | 36,487 | | | Hubbell, Inc.(a) | | | 4,938,151 | |
| | | | | | | | |
| | | | | | | 46,890,673 | |
| | | | | | | | |
| | | | Electronic Equipment, Instruments & Components — 0.4% | | | | |
| | 608,036 | | | Corning, Inc.(a) | | | 19,451,071 | |
| | 166,894 | | | TE Connectivity Ltd.(a) | | | 15,861,606 | |
| | | | | | | | |
| | | | | | | 35,312,677 | |
| | | | | | | | |
| | | | Energy Equipment & Services — 1.0% | | | | |
| | 284,698 | | | Baker Hughes, a GE Co.(a) | | | 9,007,845 | |
| | 502,817 | | | Halliburton Co.(a) | | | 24,572,667 | |
See accompanying notes to financial statements.
25 |
Portfolio of Investments – as of December 31, 2017
Gateway Fund – (continued)
| | | | | | | | |
| Shares | | | Description | | Value (†) | |
| | | | Energy Equipment & Services — continued | | | | |
| | 309,938 | | | Patterson-UTI Energy, Inc.(a) | | $ | 7,131,673 | |
| | 688,977 | | | Schlumberger Ltd.(a) | | | 46,430,160 | |
| | | | | | | | |
| | | | | | | 87,142,345 | |
| | | | | | | | |
| | | | Food & Staples Retailing — 1.7% | | | | |
| | 515,345 | | | CVS Health Corp.(a) | | | 37,362,512 | |
| | 638,444 | | | Wal-Mart Stores, Inc.(a) | | | 63,046,345 | |
| | 596,129 | | | Walgreens Boots Alliance, Inc.(a) | | | 43,290,888 | |
| | | | | | | | |
| | | | | | | 143,699,745 | |
| | | | | | | | |
| | | | Food Products — 1.2% | | | | |
| | 85,855 | | | Bunge Ltd.(a) | | | 5,759,153 | |
| | 509,574 | | | Conagra Brands, Inc.(a) | | | 19,195,653 | |
| | 66,489 | | | Ingredion, Inc.(a) | | | 9,295,162 | |
| | 313,483 | | | Kraft Heinz Co. (The)(a) | | | 24,376,438 | |
| | 100,507 | | | Lamb Weston Holdings, Inc.(a) | | | 5,673,620 | |
| | 840,182 | | | Mondelez International, Inc., Class A(a) | | | 35,959,790 | |
| | | | | | | | |
| | | | | | | 100,259,816 | |
| | | | | | | | |
| | | | Gas Utilities — 0.1% | | | | |
| | 90,899 | | | National Fuel Gas Co.(a) | | | 4,991,264 | |
| | 3,539 | | | ONE Gas, Inc.(a) | | | 259,267 | |
| | 31,811 | | | WGL Holdings, Inc.(a) | | | 2,730,656 | |
| | | | | | | | |
| | | | | | | 7,981,187 | |
| | | | | | | | |
| | | | Health Care Equipment & Supplies — 2.6% | | | | |
| | 681,320 | | | Abbott Laboratories(a) | | | 38,882,932 | |
| | 50,299 | | | Align Technology, Inc.(a)(b) | | | 11,175,935 | |
| | 344,421 | | | Baxter International, Inc.(a) | | | 22,263,373 | |
| | 882,143 | | | Boston Scientific Corp.(a)(b) | | | 21,868,325 | |
| | 415,791 | | | Hologic, Inc.(a)(b) | | | 17,775,065 | |
| | 67,471 | | | Intuitive Surgical, Inc.(a)(b) | | | 24,622,867 | |
| | 861,635 | | | Medtronic PLC(a) | | | 69,577,026 | |
| | 106,088 | | | ResMed, Inc.(a) | | | 8,984,593 | |
| | 27,536 | | | Teleflex, Inc.(a) | | | 6,851,508 | |
| | | | | | | | |
| | | | | | | 222,001,624 | |
| | | | | | | | |
| | | | Health Care Providers & Services — 2.8% | | | | |
| | 231,278 | | | Aetna, Inc.(a) | | | 41,720,238 | |
| | 151,540 | | | Anthem, Inc.(a) | | | 34,098,015 | |
| | 320,125 | | | Express Scripts Holding Co.(a)(b) | | | 23,894,130 | |
| | 213,130 | | | HCA Healthcare, Inc.(a)(b) | | | 18,721,339 | |
| | 164,011 | | | Patterson Cos., Inc.(a) | | | 5,925,718 | |
| | 131,195 | | | Quest Diagnostics, Inc.(a) | | | 12,921,396 | |
| | 435,594 | | | UnitedHealth Group, Inc.(a) | | | 96,031,053 | |
| | 71,900 | | | Universal Health Services, Inc., Class B(a) | | | 8,149,865 | |
| | | | | | | | |
| | | | | | | 241,461,754 | |
| | | | | | | | |
| | | | Health Care Technology — 0.1% | | | | |
| | 70,651 | | | Veeva Systems, Inc., Class A(a)(b) | | | 3,905,587 | |
| | | | | | | | |
See accompanying notes to financial statements.
| 26
Portfolio of Investments – as of December 31, 2017
Gateway Fund – (continued)
| | | | | | | | |
| Shares | | | Description | | Value (†) | |
| | | | Hotels, Restaurants & Leisure — 1.7% | | | | |
| | 41,062 | | | Domino’s Pizza, Inc.(a) | | $ | 7,759,076 | |
| | 49,280 | | | Hilton Grand Vacations, Inc.(a)(b) | | | 2,067,296 | |
| | 208,226 | | | Hilton Worldwide Holdings, Inc.(a) | | | 16,628,928 | |
| | 59,763 | | | Las Vegas Sands Corp.(a) | | | 4,152,931 | |
| | 421,778 | | | McDonald’s Corp.(a) | | | 72,596,429 | |
| | 81,428 | | | Melco Resorts & Entertainment Ltd., Sponsored ADR(a) | | | 2,364,669 | |
| | 389,665 | | | MGM Resorts International(a) | | | 13,010,914 | |
| | 163,392 | | | Norwegian Cruise Line Holdings Ltd.(a)(b) | | | 8,700,624 | |
| | 85,273 | | | Restaurant Brands International, Inc.(a) | | | 5,242,584 | |
| | 39,919 | | | Vail Resorts, Inc.(a) | | | 8,481,590 | |
| | 401,168 | | | Wendy’s Co. (The)(a) | | | 6,587,179 | |
| | | | | | | | |
| | | | | | | 147,592,220 | |
| | | | | | | | |
| | | | Household Durables — 0.5% | | | | |
| | 119,472 | | | Leggett & Platt, Inc.(a) | | | 5,702,398 | |
| | 292,194 | | | Newell Brands, Inc.(a) | | | 9,028,795 | |
| | 2,654 | | | NVR, Inc.(a)(b) | | | 9,310,816 | |
| | 225,136 | | | Toll Brothers, Inc.(a) | | | 10,811,031 | |
| | 27,819 | | | Tupperware Brands Corp.(a) | | | 1,744,251 | |
| | 52,559 | | | Whirlpool Corp.(a) | | | 8,863,550 | |
| | | | | | | | |
| | | | | | | 45,460,841 | |
| | | | | | | | |
| | | | Household Products — 1.8% | | | | |
| | 303,835 | | | Church & Dwight Co., Inc.(a) | | | 15,243,402 | |
| | 529,385 | | | Colgate-Palmolive Co.(a) | | | 39,942,098 | |
| | 1,061,719 | | | Procter & Gamble Co. (The)(a) | | | 97,550,742 | |
| | | | | | | | |
| | | | | | | 152,736,242 | |
| | | | | | | | |
| | | | Industrial Conglomerates — 2.3% | | | | |
| | 298,014 | | | 3M Co.(a) | | | 70,143,555 | |
| | 3,582,568 | | | General Electric Co.(a) | | | 62,515,812 | |
| | 429,021 | | | Honeywell International, Inc.(a) | | | 65,794,660 | |
| | | | | | | | |
| | | | | | | 198,454,027 | |
| | | | | | | | |
| | | | Insurance — 2.4% | | | | |
| | 286,249 | | | Aflac, Inc.(a) | | | 25,126,937 | |
| | 266,008 | | | Allstate Corp. (The)(a) | | | 27,853,698 | |
| | 149,909 | | | American Financial Group, Inc.(a) | | | 16,271,123 | |
| | 484,166 | | | American International Group, Inc.(a) | | | 28,846,610 | |
| | 180,061 | | | Aon PLC(a) | | | 24,128,174 | |
| | 161,374 | | | Arch Capital Group Ltd.(a)(b) | | | 14,647,918 | |
| | 296,125 | | | Arthur J. Gallagher & Co.(a) | | | 18,738,790 | |
| | 121,715 | | | FNF Group(a) | | | 4,776,097 | |
| | 184,878 | | | Lincoln National Corp.(a) | | | 14,211,572 | |
| | 232,774 | | | Principal Financial Group, Inc.(a) | | | 16,424,533 | |
| | 289,406 | | | XL Group Ltd.(a) | | | 10,175,515 | |
| | | | | | | | |
| | | | | | | 201,200,967 | |
| | | | | | | | |
| | | | Internet & Direct Marketing Retail — 2.9% | | | | |
| | 152,347 | | | Amazon.com, Inc.(a)(b) | | | 178,165,246 | |
| | 173,587 | | | Netflix, Inc.(a)(b) | | | 33,321,761 | |
See accompanying notes to financial statements.
27 |
Portfolio of Investments – as of December 31, 2017
Gateway Fund – (continued)
| | | | | | | | |
| Shares | | | Description | | Value (†) | |
| | | | Internet & Direct Marketing Retail — continued | | | | |
| | 22,234 | | | Priceline Group, Inc. (The)(a)(b) | | $ | 38,636,911 | |
| | | | | | | | |
| | | | | | | 250,123,918 | |
| | | | | | | | |
| | | | Internet Software & Services — 5.3% | | | | |
| | 56,348 | | | Alphabet, Inc., Class A(a)(b) | | | 59,356,983 | |
| | 175,632 | | | Alphabet, Inc., Class C(a)(b) | | | 183,781,325 | |
| | 21,160 | | | Baidu, Inc., Sponsored ADR(a)(b) | | | 4,955,884 | |
| | 462,511 | | | eBay, Inc.(a)(b) | | | 17,455,165 | |
| | 980,213 | | | Facebook, Inc., Class A(a)(b) | | | 172,968,386 | |
| | 10,552 | | | MercadoLibre, Inc.(a) | | | 3,320,292 | |
| | 64,694 | | | VeriSign, Inc.(a)(b) | | | 7,403,581 | |
| | 73,612 | | | Zillow Group, Inc., Class C(a)(b) | | | 3,012,203 | |
| | | | | | | | |
| | | | | | | 452,253,819 | |
| | | | | | | | |
| | | | IT Services — 3.5% | | | | |
| | 208,601 | | | Automatic Data Processing, Inc.(a) | | | 24,445,951 | |
| | 27,909 | | | Black Knight, Inc.(a)(b) | | | 1,232,183 | |
| | 46,488 | | | Broadridge Financial Solutions, Inc.(a) | | | 4,210,883 | |
| | 271,803 | | | Cognizant Technology Solutions Corp., Class A(a) | | | 19,303,449 | |
| | 257,142 | | | Fidelity National Information Services, Inc.(a) | | | 24,194,491 | |
| | 33,577 | | | FleetCor Technologies, Inc.(a)(b) | | | 6,461,222 | |
| | 389,246 | | | International Business Machines Corp.(a) | | | 59,718,121 | |
| | 205,924 | | | Paychex, Inc.(a) | | | 14,019,306 | |
| | 469,932 | | | PayPal Holdings, Inc.(a)(b) | | | 34,596,394 | |
| | 866,216 | | | Visa, Inc., Class A(a) | | | 98,765,948 | |
| | 461,834 | | | Western Union Co. (The)(a) | | | 8,779,464 | |
| | | | | | | | |
| | | | | | | 295,727,412 | |
| | | | | | | | |
| | | | Leisure Products — 0.1% | | | | |
| | 405,813 | | | Mattel, Inc.(a) | | | 6,241,404 | |
| | 38,286 | | | Polaris Industries, Inc.(a) | | | 4,747,081 | |
| | | | | | | | |
| | | | | | | 10,988,485 | |
| | | | | | | | |
| | | | Life Sciences Tools & Services — 0.2% | | | | |
| | 85,067 | | | Illumina, Inc.(a)(b) | | | 18,586,289 | |
| | | | | | | | |
| | | | Machinery — 1.9% | | | | |
| | 286,542 | | | Caterpillar, Inc.(a) | | | 45,153,288 | |
| | 116,361 | | | Cummins, Inc.(a) | | | 20,554,007 | |
| | 165,641 | | | Deere & Co.(a) | | | 25,924,473 | |
| | 108,472 | | | Parker Hannifin Corp.(a) | | | 21,648,842 | |
| | 180,965 | | | Pentair PLC(a) | | | 12,779,748 | |
| | 65,179 | | | Snap-on, Inc.(a) | | | 11,360,700 | |
| | 143,487 | | | Stanley Black & Decker, Inc.(a) | | | 24,348,309 | |
| | 71,757 | | | Timken Co. (The)(a) | | | 3,526,857 | |
| | | | | | | | |
| | | | | | | 165,296,224 | |
| | | | | | | | |
| | | | Media — 2.7% | | | | |
| | 1,918,640 | | | Comcast Corp., Class A(a) | | | 76,841,532 | |
| | 103,860 | | | Liberty Broadband Corp., Class C(a)(b) | | | 8,844,718 | |
| | 216,605 | | | Liberty Global PLC, Series C(a)(b) | | | 7,329,913 | |
See accompanying notes to financial statements.
| 28
Portfolio of Investments – as of December 31, 2017
Gateway Fund – (continued)
| | | | | | | | |
| Shares | | | Description | | Value (†) | |
| | | | Media — continued | | | | |
| | 83,437 | | | Liberty Global PLC LiLAC, Series C(a)(b) | | $ | 1,659,562 | |
| | 205,665 | | | News Corp., Class B(a) | | | 3,414,039 | |
| | 182,648 | | | Omnicom Group, Inc.(a) | | | 13,302,254 | |
| | 2,585,279 | | | Sirius XM Holdings, Inc.(a) | | | 13,857,095 | |
| | 360,723 | | | Time Warner, Inc.(a) | | | 32,995,333 | |
| | 62,209 | | | Time, Inc.(a) | | | 1,147,756 | |
| | 683,388 | | | Walt Disney Co. (The)(a) | | | 73,471,044 | |
| | | | | | | | |
| | | | | | | 232,863,246 | |
| | | | | | | | |
| | | | Metals & Mining — 0.2% | | | | |
| | 184,421 | | | Southern Copper Corp.(a) | | | 8,750,776 | |
| | 164,761 | | | Steel Dynamics, Inc.(a) | | | 7,106,142 | |
| | 65,675 | | | Worthington Industries, Inc.(a) | | | 2,893,641 | |
| | | | | | | | |
| | | | | | | 18,750,559 | |
| | | | | | | | |
| | | | Multi-Utilities — 1.4% | | | | |
| | 401,532 | | | Ameren Corp.(a) | | | 23,686,373 | |
| | 609,976 | | | CenterPoint Energy, Inc.(a) | | | 17,298,919 | |
| | 253,530 | | | Consolidated Edison, Inc.(a) | | | 21,537,374 | |
| | 484,927 | | | Public Service Enterprise Group, Inc.(a) | | | 24,973,740 | |
| | 462,704 | | | WEC Energy Group, Inc.(a) | | | 30,737,427 | |
| | | | | | | | |
| | | | | | | 118,233,833 | |
| | | | | | | | |
| | | | Multiline Retail — 0.4% | | | | |
| | 130,497 | | | Nordstrom, Inc.(a) | | | 6,182,948 | |
| | 398,543 | | | Target Corp.(a) | | | 26,004,931 | |
| | | | | | | | |
| | | | | | | 32,187,879 | |
| | | | | | | | |
| | | | Oil, Gas & Consumable Fuels — 4.9% | | | | |
| | 126,723 | | | Cheniere Energy, Inc.(a)(b) | | | 6,822,766 | |
| | 795,965 | | | Chevron Corp.(a) | | | 99,646,858 | |
| | 140,197 | | | Concho Resources, Inc.(a)(b) | | | 21,060,393 | |
| | 779,769 | | | ConocoPhillips(a) | | | 42,801,521 | |
| | 260,757 | | | Continental Resources, Inc.(a)(b) | | | 13,812,298 | |
| | 1,696,701 | | | Exxon Mobil Corp.(a) | | | 141,912,072 | |
| | 470,790 | | | Gulfport Energy Corp.(a)(b) | | | 6,007,281 | |
| | 67,828 | | | HollyFrontier Corp.(a) | | | 3,474,150 | |
| | 482,514 | | | Occidental Petroleum Corp.(a) | | | 35,541,981 | |
| | 245,897 | | | ONEOK, Inc.(a) | | | 13,143,195 | |
| | 335,749 | | | Phillips 66(a) | | | 33,961,011 | |
| | | | | | | | |
| | | | | | | 418,183,526 | |
| | | | | | | | |
| | | | Personal Products — 0.0% | | | | |
| | 37,688 | | | Herbalife Ltd.(a)(b) | | | 2,552,231 | |
| | | | | | | | |
| | | | Pharmaceuticals — 4.7% | | | | |
| | 180,342 | | | Allergan PLC(a) | | | 29,500,344 | |
| | 652,140 | | | Bristol-Myers Squibb Co.(a) | | | 39,963,139 | |
| | 407,447 | | | Eli Lilly & Co.(a) | | | 34,412,974 | |
| | 52,362 | | | Jazz Pharmaceuticals PLC(a)(b) | | | 7,050,543 | |
| | 1,037,295 | | | Johnson & Johnson(a) | | | 144,930,857 | |
See accompanying notes to financial statements.
29 |
Portfolio of Investments – as of December 31, 2017
Gateway Fund – (continued)
| | | | | | | | |
| Shares | | | Description | | Value (†) | |
| | | | Pharmaceuticals — continued | | | | |
| | 1,082,791 | | | Merck & Co., Inc.(a) | | $ | 60,928,650 | |
| | 2,324,677 | | | Pfizer, Inc.(a) | | | 84,199,801 | |
| | | | | | | | |
| | | | | | | 400,986,308 | |
| | | | | | | | |
| | | | Professional Services – 0.4% | | | | |
| | 53,481 | | | Dun & Bradstreet Corp. (The)(a) | | | 6,332,685 | |
| | 38,349 | | | ManpowerGroup, Inc.(a) | | | 4,836,193 | |
| | 195,964 | | | Verisk Analytics, Inc.(a)(b) | | | 18,812,544 | |
| | | | | | | | |
| | | | | | | 29,981,422 | |
| | | | | | | | |
| | | | REITs – Apartments — 0.5% | | | | |
| | 192,021 | | | Camden Property Trust(a) | | | 17,677,453 | |
| | 617,097 | | | UDR, Inc.(a) | | | 23,770,577 | |
| | | | | | | | |
| | | | | | | 41,448,030 | |
| | | | | | | | |
| | | | REITs – Diversified — 0.6% | | | | |
| | 194,326 | | | Digital Realty Trust, Inc.(a) | | | 22,133,731 | |
| | 664,704 | | | Duke Realty Corp.(a) | | | 18,086,596 | |
| | 67,913 | | | SBA Communications Corp.(a)(b) | | | 11,094,268 | |
| | | | | | | | |
| | | | | | | 51,314,595 | |
| | | | | | | | |
| | | | REITs – Health Care — 0.4% | | | | |
| | 260,504 | | | Healthcare Realty Trust, Inc.(a) | | | 8,367,388 | |
| | 206,117 | | | Sabra Health Care REIT, Inc.(a) | | | 3,868,816 | |
| | 265,800 | | | Senior Housing Properties Trust(a) | | | 5,090,070 | |
| | 322,756 | | | Ventas, Inc.(a) | | | 19,368,588 | |
| | | | | | | | |
| | | | | | | 36,694,862 | |
| | | | | | | | |
| | | | REITs – Hotels — 0.0% | | | | |
| | 104,126 | | | Park Hotels & Resorts, Inc.(a) | | | 2,993,623 | |
| | | | | | | | |
| | | | REITs – Mortgage — 0.3% | | | | |
| | 644,819 | | | AGNC Investment Corp.(a) | | | 13,018,895 | |
| | 1,234,994 | | | Annaly Capital Management, Inc.(a) | | | 14,684,079 | |
| | | | | | | | |
| | | | | | | 27,702,974 | |
| | | | | | | | |
| | | | REITs – Office Property — 0.3% | | | | |
| | 193,780 | | | Kilroy Realty Corp.(a) | | | 14,465,677 | |
| | 306,600 | | | Mack-Cali Realty Corp.(a) | | | 6,610,296 | |
| | | | | | | | |
| | | | | | | 21,075,973 | |
| | | | | | | | |
| | | | REITs – Shopping Centers — 0.3% | | | | |
| | 354,094 | | | Regency Centers Corp.(a) | | | 24,496,223 | |
| | | | | | | | |
| | | | REITs – Storage — 0.2% | | | | |
| | 178,201 | | | Extra Space Storage, Inc.(a) | | | 15,583,677 | |
| | | | | | | | |
| | | | REITs – Warehouse/Industrials — 0.1% | | | | |
| | 271,168 | | | Liberty Property Trust(a) | | | 11,662,936 | |
| | | | | | | | |
| | | | Road & Rail — 0.9% | | | | |
| | 146,168 | | | Avis Budget Group, Inc.(a)(b) | | | 6,413,852 | |
| | 70,499 | | | Canadian Pacific Railway Ltd.(a) | | | 12,884,397 | |
| | 640,894 | | | CSX Corp.(a) | | | 35,255,579 | |
See accompanying notes to financial statements.
| 30
Portfolio of Investments – as of December 31, 2017
Gateway Fund – (continued)
| | | | | | | | |
| Shares | | | Description | | Value (†) | |
| | | | Road & Rail — continued | | | | |
| | 167,459 | | | Hertz Global Holdings, Inc.(a)(b) | | $ | 3,700,844 | |
| | 110,440 | | | Old Dominion Freight Line, Inc.(a) | | | 14,528,382 | |
| | | | | | | | |
| | | | | | | 72,783,054 | |
| | | | | | | | |
| | | | Semiconductors & Semiconductor Equipment — 3.9% | | | | |
| | 577,731 | | | Advanced Micro Devices, Inc.(a)(b) | | | 5,939,075 | |
| | 203,038 | | | Analog Devices, Inc.(a) | | | 18,076,473 | |
| | 653,399 | | | Applied Materials, Inc.(a) | | | 33,401,757 | |
| | 1,911,267 | | | Intel Corp.(a) | | | 88,224,085 | |
| | 250,237 | | | Microchip Technology, Inc.(a) | | | 21,990,827 | |
| | 249,568 | | | NVIDIA Corp.(a) | | | 48,291,408 | |
| | 636,434 | | | QUALCOMM, Inc.(a) | | | 40,744,505 | |
| | 156,838 | | | Skyworks Solutions, Inc.(a) | | | 14,891,768 | |
| | 267,055 | | | Teradyne, Inc.(a) | | | 11,181,593 | |
| | 507,114 | | | Texas Instruments, Inc.(a) | | | 52,962,986 | |
| | | | | | | | |
| | | | | | | 335,704,477 | |
| | | | | | | | |
| | | | Software — 5.5% | | | | |
| | 386,332 | | | Activision Blizzard, Inc.(a) | | | 24,462,542 | |
| | 249,935 | | | Adobe Systems, Inc.(a)(b) | | | 43,798,610 | |
| | 87,631 | | | ANSYS, Inc.(a)(b) | | | 12,933,459 | |
| | 383,459 | | | Cadence Design Systems, Inc.(a)(b) | | | 16,036,255 | |
| | 44,865 | | | Dell Technologies, Inc., Class V(a)(b) | | | 3,646,627 | |
| | 2,970,402 | | | Microsoft Corp.(a) | | | 254,088,187 | |
| | 367,409 | | | Nuance Communications, Inc.(a)(b) | | | 6,007,137 | |
| | 1,305,002 | | | Oracle Corp.(a) | | | 61,700,495 | |
| | 114,165 | | | PTC, Inc.(a)(b) | | | 6,937,807 | |
| | 41,728 | | | ServiceNow, Inc.(a)(b) | | | 5,440,914 | |
| | 352,491 | | | Symantec Corp.(a) | | | 9,890,898 | |
| | 41,972 | | | Take-Two Interactive Software, Inc.(a)(b) | | | 4,607,686 | |
| | 76,950 | | | VMware, Inc., Class A(a)(b) | | | 9,643,374 | |
| | 63,603 | | | Workday, Inc., Class A(a)(b) | | | 6,470,969 | |
| | | | | | | | |
| | | | | | | 465,664,960 | |
| | | | | | | | |
| | | | Specialty Retail — 2.4% | | | | |
| | 354,976 | | | American Eagle Outfitters, Inc.(a) | | | 6,673,549 | |
| | 102,590 | | | Foot Locker, Inc.(a) | | | 4,809,419 | |
| | 178,688 | | | Gap, Inc. (The)(a) | | | 6,086,113 | |
| | 520,757 | | | Home Depot, Inc. (The)(a) | | | 98,699,074 | |
| | 119,254 | | | L Brands, Inc.(a) | | | 7,181,476 | |
| | 472,528 | | | Lowe’s Cos., Inc.(a) | | | 43,916,753 | |
| | 104,508 | | | Tiffany & Co.(a) | | | 10,863,607 | |
| | 375,970 | | | TJX Cos., Inc. (The)(a) | | | 28,746,666 | |
| | | | | | | | |
| | | | | | | 206,976,657 | |
| | | | | | | | |
| | | | Technology Hardware, Storage & Peripherals — 3.9% | | | | |
| | 1,950,861 | | | Apple, Inc.(a) | | | 330,144,207 | |
| | | | | | | | |
| | | | Textiles, Apparel & Luxury Goods — 0.4% | | | | |
| | 110,021 | | | Lululemon Athletica, Inc.(a)(b) | | | 8,646,550 | |
| | 212,485 | | | Michael Kors Holdings Ltd.(a)(b) | | | 13,375,931 | |
See accompanying notes to financial statements.
31 |
Portfolio of Investments – as of December 31, 2017
Gateway Fund – (continued)
| | | | | | | | |
| Shares | | | Description | | Value (†) | |
| | | | Textiles, Apparel & Luxury Goods — continued | | | | |
| | 681,244 | | | Under Armour, Inc., Class A(a)(b) | | $ | 9,830,351 | |
| | 108,010 | | | Under Armour, Inc., Class C(a)(b) | | | 1,438,693 | |
| | | | | | | | |
| | | | | | | 33,291,525 | |
| | | | | | | | |
| | | | Tobacco — 1.3% | | | | |
| | 721,540 | | | Altria Group, Inc.(a) | | | 51,525,172 | |
| | 576,065 | | | Philip Morris International, Inc.(a) | | | 60,861,267 | |
| | 76,584 | | | Vector Group Ltd.(a) | | | 1,713,950 | |
| | | | | | | | |
| | | | | | | 114,100,389 | |
| | | | | | | | |
| | | | Trading Companies & Distributors — 0.1% | | | | |
| | 59,515 | | | GATX Corp.(a) | | | 3,699,452 | |
| | | | | | | | |
| | | | Wireless Telecommunication Services — 0.1% | | | | |
| | 187,217 | | | Sprint Corp.(a)(b) | | | 1,102,708 | |
| | 71,226 | | | T-Mobile US, Inc.(a)(b) | | | 4,523,563 | |
| | | | | | | | |
| | | | | | | 5,626,271 | |
| | | | | | | | |
| | | | Total Common Stocks
(Identified Cost $5,943,193,154) | | | 8,429,239,556 | |
| | | | | | | | |
| | | | | | | | |
| | | | Total Purchased Options — 0.1%
(Identified Cost $37,415,868) (see detail below) | | | 13,136,125 | |
| | | | | | | | |
| | | | | | | | |
Principal
Amount | | | | | | |
| | Short-Term Investments — 2.6% | | | | |
| $ | 218,118,211 | | | Tri-Party Repurchase Agreement with Fixed Income Clearing Corporation, dated 12/29/2017 at 0.540% to be repurchased at $218,131,298 on 1/02/2018 collateralized by $8,480,000 Federal Home Loan Bank, 1.000% due 4/27/2018 valued at $8,502,896; $70,185,000 Federal Home Loan Bank, 1.250% due 7/27/2018 valued at $70,448,194; $23,860,000 Federal Agricultural Mortgage Corporation, 1.120% due 8/01/2018 valued at $23,910,201; $54,970,000 Federal Home Loan Discount Note, 0.000% due 5/04/2018 valued at $54,694,875; $25,000,000 Federal Home Loan Mortgage Corp., 1.050% due 6/29/2018 valued at $24,934,500; $10,630,000 U.S. Treasury Note, 1.000% due 8/15/2018 valued at $10,626,152; $30,565,000 U.S. Treasury Note, 1.375% due 6/30/2023 valued at $29,368,747 including accrued interest (Note 2 of Notes to Financial Statements) (Identified Cost $218,118,211) | | | 218,118,211 | |
| | | | | | | | |
| | | | | | | | |
| | | | Total Investments — 101.6%
(Identified Cost $6,198,727,233) | | | 8,660,493,892 | |
| | | | Other assets less liabilities — (1.6)% | | | (135,428,160 | ) |
| | | | | | | | |
| | | | Net Assets — 100.0% | | $ | 8,525,065,732 | |
| | | | | | | | |
See accompanying notes to financial statements.
| 32
Portfolio of Investments – as of December 31, 2017
Gateway Fund – (continued)
| | | | | | | | | | | | | | | | | | | | | | | | |
| Purchased Options — 0.1% | |
| | | | | | | | | | | | | | | | | | | | | | | | |
| Description | | Expiration
Date | | | Exercise
Price | | | Contracts | | | Notional
Amount | | | Cost | | | Value (†) | |
| Index Options — 0.1% | |
| S&P 500® Index, Put | | | 01/19/2018 | | | | 2,375 | | | | 5,225 | | | $ | 1,396,961,225 | | | $ | 5,447,063 | | | $ | 600,875 | |
| S&P 500® Index, Put | | | 01/19/2018 | | | | 2,400 | | | | 3,662 | | | | 979,075,982 | | | | 3,927,495 | | | | 494,370 | |
| S&P 500® Index, Put | | | 02/16/2018 | | | | 2,325 | | | | 3,061 | | | | 818,392,021 | | | | 3,573,718 | | | | 795,860 | |
| S&P 500® Index, Put | | | 02/16/2018 | | | | 2,350 | | | | 3,661 | | | | 978,808,621 | | | | 6,049,802 | | | | 1,098,300 | |
| S&P 500® Index, Put | | | 02/16/2018 | | | | 2,375 | | | | 4,544 | | | | 1,214,888,384 | | | | 5,305,120 | | | | 1,590,400 | |
| S&P 500® Index, Put | | | 02/16/2018 | | | | 2,400 | | | | 3,674 | | | | 982,284,314 | | | | 3,903,625 | | | | 1,469,600 | |
| S&P 500® Index, Put | | | 03/16/2018 | | | | 2,400 | | | | 3,691 | | | | 986,829,451 | | | | 4,659,887 | | | | 3,321,900 | |
| S&P 500® Index, Put | | | 03/16/2018 | | | | 2,425 | | | | 3,691 | | | | 986,829,451 | | | | 4,549,158 | | | | 3,764,820 | |
| | | | | | | | | | | | | | | | | | | | | | | | |
| Total | | | | | | | | | | | | | | | | | | $ | 37,415,868 | | | $ | 13,136,125 | |
| | | | | | | | | | | | | | | | | | | | | | | | |
| | | | | | | | | | | | | | | | | | | | | | | | |
| Written Options — (1.8%) | |
| | | | | | | | | | | | | | | | | | | | | | | | |
| Description | | Expiration
Date | | | Exercise
Price | | | Contracts | | | Notional
Amount | | | Premiums
(Received) | | | Value (†) | |
| Index Options — (1.8%) | |
| S&P 500® Index, Call | | | 01/05/2018 | | | | 2,650 | | | | (3,415 | ) | | $ | (913,037,815 | ) | | $ | (7,162,962 | ) | | $ | (10,142,550 | ) |
| S&P 500® Index, Call | | | 01/19/2018 | | | | 2,600 | | | | (3,481 | ) | | | (930,683,641 | ) | | | (10,737,144 | ) | | | (28,874,895 | ) |
| S&P 500® Index, Call | | | 01/19/2018 | | | | 2,650 | | | | (3,534 | ) | | | (944,853,774 | ) | | | (15,540,765 | ) | | | (13,729,590 | ) |
| S&P 500® Index, Call | | | 01/26/2018 | | | | 2,700 | | | | (3,508 | ) | | | (937,902,388 | ) | | | (5,253,230 | ) | | | (3,613,240 | ) |
| S&P 500® Index, Call | | | 02/16/2018 | | | | 2,600 | | | | (3,605 | ) | | | (963,836,405 | ) | | | (19,457,987 | ) | | | (33,111,925 | ) |
| S&P 500® Index, Call | | | 02/16/2018 | | | | 2,625 | | | | (3,560 | ) | | | (951,805,160 | ) | | | (19,571,100 | ) | | | (25,151,400 | ) |
| S&P 500® Index, Call | | | 02/16/2018 | | | | 2,650 | | | | (3,252 | ) | | | (869,457,972 | ) | | | (14,951,070 | ) | | | (16,568,940 | ) |
| S&P 500® Index, Call | | | 02/16/2018 | | | | 2,675 | | | | (3,293 | ) | | | (880,419,773 | ) | | | (11,846,568 | ) | | | (10,949,225 | ) |
| S&P 500® Index, Call | | | 03/16/2018 | | | | 2,700 | | | | (3,561 | ) | | | (952,072,521 | ) | | | (16,015,598 | ) | | | (11,056,905 | ) |
| | | | | | | | | | | | | | | | | | | | | | | | |
| Total | | | | | | | | | | | | | | | | | | $ | (120,536,424 | ) | | $ | (153,198,670 | ) |
| | | | | | | | | | | | | | | | | | | | | | | | |
| | | | |
| | | | |
| | (†) | | | See Note 2 of Notes to Financial Statements. |
| | (a) | | | Security (or a portion thereof) has been pledged as collateral for open derivative contracts. |
| | (b) | | | Non-income producing security. |
| | | | |
| | ADR | | | An American Depositary Receipt is a certificate issued by a custodian bank representing the right to receive securities of the foreign issuer described. The values of ADRs may be significantly influenced by trading on exchanges not located in the United States. |
| | REITs | | | Real Estate Investment Trusts |
See accompanying notes to financial statements.
33 |
Portfolio of Investments – as of December 31, 2017
Gateway Fund – (continued)
Industry Summary at December 31, 2017
| | | | |
Banks | | | 6.7 | % |
Software | | | 5.5 | |
Internet Software & Services | | | 5.3 | |
Oil, Gas & Consumable Fuels | | | 4.9 | |
Pharmaceuticals | | | 4.7 | |
Semiconductors & Semiconductor Equipment | | | 3.9 | |
Technology Hardware, Storage & Peripherals | | | 3.9 | |
IT Services | | | 3.5 | |
Biotechnology | | | 3.3 | |
Internet & Direct Marketing Retail | | | 2.9 | |
Health Care Providers & Services | | | 2.8 | |
Media | | | 2.7 | |
Health Care Equipment & Supplies | | | 2.6 | |
Capital Markets | | | 2.4 | |
Specialty Retail | | | 2.4 | |
Insurance | | | 2.4 | |
Industrial Conglomerates | | | 2.3 | |
Aerospace & Defense | | | 2.3 | |
Beverages | | | 2.2 | |
Chemicals | | | 2.2 | |
Diversified Telecommunication Services | | | 2.0 | |
Diversified Financial Services | | | 2.0 | |
Other Investments, less than 2% each | | | 26.1 | |
Short-Term Investments | | | 2.6 | |
| | | | |
Total Investments | | | 101.6 | |
Other assets less liabilities (including open written options) | | | (1.6 | ) |
| | | | |
Net Assets | | | 100.0 | % |
| | | | |
See accompanying notes to financial statements.
| 34
Portfolio of Investments – as of December 31, 2017
Gateway Equity Call Premium Fund
| | | | | | | | |
| Shares | | | Description | | Value (†) | |
| | Common Stocks — 99.3% of Net Assets | | | | |
| | | | Aerospace & Defense — 2.4% | | | | |
| | 2,472 | | | Boeing Co. (The)(a) | | $ | 729,018 | |
| | 302 | | | Huntington Ingalls Industries, Inc.(a) | | | 71,181 | |
| | 890 | | | KLX, Inc.(b) | | | 60,742 | |
| | 1,513 | | | Lockheed Martin Corp.(a) | | | 485,749 | |
| | 1,077 | | | Rockwell Collins, Inc.(a) | | | 146,063 | |
| | 3,684 | | | United Technologies Corp.(a) | | | 469,968 | |
| | | | | | | | |
| | | | | | | 1,962,721 | |
| | | | | | | | |
| | | | Air Freight & Logistics — 0.9% | | | | |
| | 1,291 | | | FedEx Corp.(a) | | | 322,156 | |
| | 3,376 | | | United Parcel Service, Inc., Class B(a) | | | 402,251 | |
| | | | | | | | |
| | | | | | | 724,407 | |
| | | | | | | | |
| | | | Airlines — 0.5% | | | | |
| | 655 | | | Alaska Air Group, Inc.(a) | | | 48,149 | |
| | 4,098 | | | Delta Air Lines, Inc.(a) | | | 229,488 | |
| | 426 | | | JetBlue Airways Corp.(b) | | | 9,517 | |
| | 1,724 | | | United Continental Holdings, Inc.(a)(b) | | | 116,197 | |
| | | | | | | | |
| | | | | | | 403,351 | |
| | | | | | | | |
| | | | Auto Components — 0.2% | | | | |
| | 623 | | | Adient PLC(a) | | | 49,030 | |
| | 622 | | | Lear Corp.(a) | | | 109,883 | |
| | | | | | | | |
| | | | | | | 158,913 | |
| | | | | | | | |
| | | | Automobiles — 0.4% | | | | |
| | 8,162 | | | General Motors Co.(a) | | | 334,560 | |
| | | | | | | | |
| | | | Banks — 6.6% | | | | |
| | 39,800 | | | Bank of America Corp.(a) | | | 1,174,896 | |
| | 11,576 | | | Citigroup, Inc.(a) | | | 861,370 | |
| | 1,574 | | | Comerica, Inc.(a) | | | 136,639 | |
| | 302 | | | East West Bancorp, Inc.(a) | | | 18,371 | |
| | 5,380 | | | Fifth Third Bancorp(a) | | | 163,229 | |
| | 462 | | | First Republic Bank(a) | | | 40,028 | |
| | 8,896 | | | Huntington Bancshares, Inc.(a) | | | 129,526 | |
| | 14,726 | | | JPMorgan Chase & Co.(a) | | | 1,574,798 | |
| | 144 | | | Signature Bank(b) | | | 19,765 | |
| | 2,717 | | | SunTrust Banks, Inc.(a) | | | 175,491 | |
| | 126 | | | SVB Financial Group(a)(b) | | | 29,455 | |
| | 17,106 | | | Wells Fargo & Co.(a) | | | 1,037,821 | |
| | | | | | | | |
| | | | | | | 5,361,389 | |
| | | | | | | | |
| | | | Beverages — 2.0% | | | | |
| | 17,615 | | | Coca-Cola Co. (The)(a) | | | 808,176 | |
| | 6,683 | | | PepsiCo, Inc.(a) | | | 801,426 | |
| | | | | | | | |
| | | | | | | 1,609,602 | |
| | | | | | | | |
| | | | Biotechnology — 3.0% | | | | |
| | 6,360 | | | AbbVie, Inc.(a) | | | 615,076 | |
See accompanying notes to financial statements.
35 |
Portfolio of Investments – as of December 31, 2017
Gateway Equity Call Premium Fund – (continued)
| | | | | | | | |
| Shares | | | Description | | Value (†) | |
| | | | Biotechnology — continued | | | | |
| | 982 | | | Alexion Pharmaceuticals, Inc.(a)(b) | | $ | 117,437 | |
| | 160 | | | Alkermes PLC(b) | | | 8,757 | |
| | 309 | | | Alnylam Pharmaceuticals, Inc.(a)(b) | | | 39,258 | |
| | 2,912 | | | Amgen, Inc.(a) | | | 506,397 | |
| | 895 | | | Biogen, Inc.(a)(b) | | | 285,120 | |
| | 264 | | | BioMarin Pharmaceutical, Inc.(a)(b) | | | 23,541 | |
| | 356 | | | Bioverativ, Inc.(b) | | | 19,196 | |
| | 3,338 | | | Celgene Corp.(a)(b) | | | 348,354 | |
| | 5,294 | | | Gilead Sciences, Inc.(a) | | | 379,262 | |
| | 903 | | | Incyte Corp.(a)(b) | | | 85,523 | |
| | | | | | | | |
| | | | | | | 2,427,921 | |
| | | | | | | | |
| | | | Building Products — 0.7% | | | | |
| | 1,956 | | | A.O. Smith Corp.(a) | | | 119,864 | |
| | 2,300 | | | Fortune Brands Home & Security, Inc.(a) | | | 157,412 | |
| | 5,286 | | | Johnson Controls International PLC(a) | | | 201,449 | |
| | 402 | | | Lennox International, Inc.(a) | | | 83,721 | |
| | | | | | | | |
| | | | | | | 562,446 | |
| | | | | | | | |
| | | | Capital Markets — 2.2% | | | | |
| | 5,475 | | | Bank of New York Mellon Corp. (The)(a) | | | 294,884 | |
| | 640 | | | BlackRock, Inc.(a) | | | 328,774 | |
| | 1,875 | | | Goldman Sachs Group, Inc. (The)(a) | | | 477,675 | |
| | 8,070 | | | Morgan Stanley(a) | | | 423,433 | |
| | 396 | | | MSCI, Inc.(a) | | | 50,110 | |
| | 1,130 | | | Raymond James Financial, Inc.(a) | | | 100,909 | |
| | 361 | | | SEI Investments Co. | | | 25,941 | |
| | 1,022 | | | TD Ameritrade Holding Corp.(a) | | | 52,255 | |
| | | | | | | | |
| | | | | | | 1,753,981 | |
| | | | | | | | |
| | | | Chemicals — 2.1% | | | | |
| | 536 | | | AdvanSix, Inc.(a)(b) | | | 22,549 | |
| | 726 | | | Agrium, Inc.(a) | | | 83,490 | |
| | 1,697 | | | Air Products & Chemicals, Inc.(a) | | | 278,444 | |
| | 899 | | | Albemarle Corp.(a) | | | 114,973 | |
| | 943 | | | Ashland Global Holdings, Inc.(a) | | | 67,142 | |
| | 700 | | | Celanese Corp., Series A(a) | | | 74,956 | |
| | 2,358 | | | Huntsman Corp.(a) | | | 78,498 | |
| | 547 | | | International Flavors & Fragrances, Inc.(a) | | | 83,478 | |
| | 2,380 | | | Monsanto Co.(a) | | | 277,936 | |
| | 1,978 | | | PPG Industries, Inc.(a) | | | 231,070 | |
| | 2,500 | | | Praxair, Inc.(a) | | | 386,700 | |
| | 1,748 | | | Valvoline, Inc.(a) | | | 43,805 | |
| | | | | | | | |
| | | | | | | 1,743,041 | |
| | | | | | | | |
| | | | Commercial Services & Supplies — 0.4% | | | | |
| | 810 | | | Waste Connections, Inc.(a) | | | 57,461 | |
| | 2,825 | | | Waste Management, Inc.(a) | | | 243,798 | |
| | | | | | | | |
| | | | | | | 301,259 | |
| | | | | | | | |
See accompanying notes to financial statements.
| 36
Portfolio of Investments – as of December 31, 2017
Gateway Equity Call Premium Fund – (continued)
| | | | | | | | |
| Shares | | | Description | | Value (†) | |
| | | | Communications Equipment — 1.2% | | | | |
| | 264 | | | Arista Networks, Inc.(a)(b) | | $ | 62,193 | |
| | 959 | | | ARRIS International PLC(b) | | | 24,637 | |
| | 21,317 | | | Cisco Systems, Inc.(a) | | | 816,441 | |
| | 213 | | | Palo Alto Networks, Inc.(b) | | | 30,872 | |
| | | | | | | | |
| | | | | | | 934,143 | |
| | | | | | | | |
| | | | Construction & Engineering — 0.0% | | | | |
| | 781 | | | Chicago Bridge & Iron Co.(a) | | | 12,605 | |
| | | | | | | | |
| | | | Consumer Finance — 1.2% | | | | |
| | 2,148 | | | Ally Financial, Inc.(a) | | | 62,636 | |
| | 4,605 | | | American Express Co.(a) | | | 457,322 | |
| | 2,896 | | | Capital One Financial Corp.(a) | | | 288,384 | |
| | 4,364 | | | Synchrony Financial(a) | | | 168,494 | |
| | | | | | | | |
| | | | | | | 976,836 | |
| | | | | | | | |
| | | | Containers & Packaging — 0.4% | | | | |
| | 1,051 | | | Crown Holdings, Inc.(a)(b) | | | 59,119 | |
| | 3,203 | | | International Paper Co.(a) | | | 185,582 | |
| | 866 | | | Packaging Corp. of America(a) | | | 104,396 | |
| | | | | | | | |
| | | | | | | 349,097 | |
| | | | | | | | |
| | | | Diversified Financial Services — 1.9% | | | | |
| | 7,811 | | | Berkshire Hathaway, Inc., Class B(a)(b) | | | 1,548,296 | |
| | | | | | | | |
| | | | Diversified Telecommunication Services — 2.1% | | | | |
| | 22,795 | | | AT&T, Inc.(a) | | | 886,270 | |
| | 15,242 | | | Verizon Communications, Inc.(a) | | | 806,759 | |
| | | | | | | | |
| | | | | | | 1,693,029 | |
| | | | | | | | |
| | | | Electric Utilities — 2.0% | | | | |
| | 4,965 | | | Alliant Energy Corp.(a) | | | 211,559 | |
| | 6,907 | | | American Electric Power Co., Inc.(a) | | | 508,148 | |
| | 3,640 | | | OGE Energy Corp.(a) | | | 119,792 | |
| | 4,101 | | | PG&E Corp.(a) | | | 183,848 | |
| | 7,227 | | | PPL Corp.(a) | | | 223,676 | |
| | 6,090 | | | Southern Co. (The)(a) | | | 292,868 | |
| | 982 | | | Westar Energy, Inc.(a) | | | 51,849 | |
| | | | | | | | |
| | | | | | | 1,591,740 | |
| | | | | | | | |
| | | | Electrical Equipment — 0.4% | | | | |
| | 372 | | | Acuity Brands, Inc.(a) | | | 65,472 | |
| | 4,281 | | | Emerson Electric Co.(a) | | | 298,343 | |
| | | | | | | | |
| | | | | | | 363,815 | |
| | | | | | | | |
| | | | Electronic Equipment, Instruments & Components — 0.3% | | | | |
| | 1,039 | | | Arrow Electronics, Inc.(a)(b) | | | 83,546 | |
| | 768 | | | Avnet, Inc. | | | 30,428 | |
| | 5,103 | | | Flex Ltd.(a)(b) | | | 91,803 | |
| | | | | | | | |
| | | | | | | 205,777 | |
| | | | | | | | |
See accompanying notes to financial statements.
37 |
Portfolio of Investments – as of December 31, 2017
Gateway Equity Call Premium Fund – (continued)
| | | | | | | | |
| Shares | | | Description | | Value (†) | |
| | | | Energy Equipment & Services — 0.9% | | | | |
| | 3,986 | | | National Oilwell Varco, Inc.(a) | | $ | 143,576 | |
| | 2,188 | | | Oceaneering International, Inc.(a) | | | 46,254 | |
| | 7,485 | | | Schlumberger Ltd.(a) | | | 504,414 | |
| | | | | | | | |
| | | | | | | 694,244 | |
| | | | | | | | |
| | | | Food & Staples Retailing — 2.1% | | | | |
| | 2,038 | | | Costco Wholesale Corp.(a) | | | 379,313 | |
| | 4,256 | | | CVS Health Corp.(a) | | | 308,560 | |
| | 2,480 | | | Sysco Corp.(a) | | | 150,610 | |
| | 5,708 | | | Wal-Mart Stores, Inc.(a) | | | 563,665 | |
| | 4,078 | | | Walgreens Boots Alliance, Inc.(a) | | | 296,144 | |
| | | | | | | | |
| | | | | | | 1,698,292 | |
| | | | | | | | |
| | | | Food Products — 1.0% | | | | |
| | 782 | | | Hain Celestial Group, Inc. (The)(a)(b) | | | 33,149 | |
| | 457 | | | Ingredion, Inc.(a) | | | 63,889 | |
| | 3,247 | | | Kellogg Co.(a) | | | 220,731 | |
| | 8,549 | | | Mondelez International, Inc., Class A(a) | | | 365,897 | |
| | 830 | | | Post Holdings, Inc.(a)(b) | | | 65,761 | |
| | 611 | | | TreeHouse Foods, Inc.(a)(b) | | | 30,220 | |
| | | | | | | | |
| | | | | | | 779,647 | |
| | | | | | | | |
| | | | Gas Utilities — 0.1% | | | | |
| | 1,158 | | | UGI Corp.(a) | | | 54,368 | |
| | | | | | | | |
| | | | Health Care Equipment & Supplies — 2.4% | | | | |
| | 8,240 | | | Abbott Laboratories(a) | | | 470,257 | |
| | 682 | | | Align Technology, Inc.(a)(b) | | | 151,533 | |
| | 591 | | | Cooper Cos., Inc. (The)(a) | | | 128,767 | |
| | 1,472 | | | DENTSPLY SIRONA, Inc.(a) | | | 96,902 | |
| | 2,991 | | | Hologic, Inc.(a)(b) | | | 127,865 | |
| | 797 | | | IDEXX Laboratories, Inc.(a)(b) | | | 124,635 | |
| | 7,283 | | | Medtronic PLC(a) | | | 588,102 | |
| | 1,317 | | | ResMed, Inc.(a) | | | 111,537 | |
| | 745 | | | STERIS PLC(a) | | | 65,165 | |
| | 341 | | | Teleflex, Inc.(a) | | | 84,848 | |
| | | | | | | | |
| | | | | | | 1,949,611 | |
| | | | | | | | |
| | | | Health Care Providers & Services — 2.8% | | | | |
| | 1,943 | | | Anthem, Inc.(a) | | | 437,194 | |
| | 1,510 | | | Centene Corp.(a)(b) | | | 152,329 | |
| | 3,644 | | | Express Scripts Holding Co.(a)(b) | | | 271,988 | |
| | 1,311 | | | McKesson Corp.(a) | | | 204,450 | |
| | 1,426 | | | MEDNAX, Inc.(a)(b) | | | 76,205 | |
| | 4,760 | | | UnitedHealth Group, Inc.(a) | | | 1,049,390 | |
| | 487 | | | WellCare Health Plans, Inc.(a)(b) | | | 97,941 | |
| | | | | | | | |
| | | | | | | 2,289,497 | |
| | | | | | | | |
| | | | Health Care Technology — 0.1% | | | | |
| | 827 | | | Veeva Systems, Inc., Class A(a)(b) | | | 45,717 | |
| | | | | | | | |
See accompanying notes to financial statements.
| 38
Portfolio of Investments – as of December 31, 2017
Gateway Equity Call Premium Fund – (continued)
| | | | | | | | |
| Shares | | | Description | | Value (†) | |
| | | | Hotels, Restaurants & Leisure — 1.8% | | | | |
| | 116 | | | Domino’s Pizza, Inc. | | $ | 21,919 | |
| | 505 | | | Hilton Grand Vacations, Inc.(a)(b) | | | 21,185 | |
| | 2,123 | | | Hilton Worldwide Holdings, Inc.(a) | | | 169,543 | |
| | 682 | | | Las Vegas Sands Corp.(a) | | | 47,392 | |
| | 3,389 | | | McDonald’s Corp.(a) | | | 583,315 | |
| | 4,179 | | | MGM Resorts International(a) | | | 139,537 | |
| | 5,125 | | | Starbucks Corp.(a) | | | 294,329 | |
| | 380 | | | Yum China Holdings, Inc.(a) | | | 15,207 | |
| | 2,266 | | | Yum! Brands, Inc.(a) | | | 184,928 | |
| | | | | | | | |
| | | | | | | 1,477,355 | |
| | | | | | | | |
| | | | Household Durables — 0.4% | | | | |
| | 1,794 | | | Leggett & Platt, Inc.(a) | | | 85,628 | |
| | 3,322 | | | Newell Brands, Inc.(a) | | | 102,650 | |
| | 3,420 | | | Toll Brothers, Inc.(a) | | | 164,228 | |
| | | | | | | | |
| | | | | | | 352,506 | |
| | | | | | | | |
| | | | Household Products — 1.8% | | | | |
| | 2,140 | | | Church & Dwight Co., Inc.(a) | | | 107,364 | |
| | 865 | | | Clorox Co. (The)(a) | | | 128,660 | |
| | 1,774 | | | Kimberly-Clark Corp.(a) | | | 214,051 | |
| | 10,794 | | | Procter & Gamble Co. (The)(a) | | | 991,752 | |
| | | | | | | | |
| | | | | | | 1,441,827 | |
| | | | | | | | |
| | | | Industrial Conglomerates — 2.4% | | | | |
| | 2,941 | | | 3M Co.(a) | | | 692,223 | |
| | 36,349 | | | General Electric Co.(a) | | | 634,290 | |
| | 3,822 | | | Honeywell International, Inc.(a) | | | 586,142 | |
| | | | | | | | |
| | | | | | | 1,912,655 | |
| | | | | | | | |
| | | | Insurance — 2.1% | | | | |
| | 1,397 | | | American Financial Group, Inc.(a) | | | 151,631 | |
| | 930 | | | Arch Capital Group Ltd.(a)(b) | | | 84,416 | |
| | 3,084 | | | Chubb Ltd.(a) | | | 450,665 | |
| | 1,157 | | | Cincinnati Financial Corp.(a) | | | 86,740 | |
| | 2,118 | | | Lincoln National Corp.(a) | | | 162,811 | |
| | 3,756 | | | Prudential Financial, Inc.(a) | | | 431,865 | |
| | 486 | | | Reinsurance Group of America, Inc.(a) | | | 75,782 | |
| | 692 | | | RenaissanceRe Holdings Ltd.(a) | | | 86,908 | |
| | 996 | | | Willis Towers Watson PLC(a) | | | 150,087 | |
| | | | | | | | |
| | | | | | | 1,680,905 | |
| | | | | | | | |
| | | | Internet & Direct Marketing Retail — 3.0% | | | | |
| | 1,464 | | | Amazon.com, Inc.(a)(b) | | | 1,712,104 | |
| | 47 | | | Liberty Expedia Holdings, Inc., Series A(a)(b) | | | 2,084 | |
| | 1,552 | | | Liberty Interactive Corp./QVC Group, Class A(a)(b) | | | 37,900 | |
| | 628 | | | Liberty Ventures, Series A(a)(b) | | | 34,063 | |
| | 1,666 | | | Netflix, Inc.(a)(b) | | | 319,805 | |
| | 202 | | | Priceline Group, Inc. (The)(a)(b) | | | 351,023 | |
| | | | | | | | |
| | | | | | | 2,456,979 | |
| | | | | | | | |
See accompanying notes to financial statements.
39 |
Portfolio of Investments – as of December 31, 2017
Gateway Equity Call Premium Fund – (continued)
| | | | | | | | |
| Shares | | | Description | | Value (†) | |
| | | | Internet Software & Services — 5.0% | | | | |
| | 358 | | | Alibaba Group Holding Ltd., Sponsored ADR(a)(b) | | $ | 61,730 | |
| | 1,215 | | | Alphabet, Inc., Class A(a)(b) | | | 1,279,881 | |
| | 1,001 | | | Alphabet, Inc., Class C(a)(b) | | | 1,047,446 | |
| | 9,251 | | | Facebook, Inc., Class A(a)(b) | | | 1,632,432 | |
| | | | | | | | |
| | | | | | | 4,021,489 | |
| | | | | | | | |
| | | | IT Services — 3.8% | | | | |
| | 2,566 | | | Accenture PLC, Class A(a) | | | 392,829 | |
| | 12 | | | Amdocs Ltd. | | | 786 | |
| | 1,500 | | | DXC Technology Co.(a) | | | 142,350 | |
| | 223 | | | FleetCor Technologies, Inc.(a)(b) | | | 42,912 | |
| | 532 | | | Gartner, Inc.(a)(b) | | | 65,516 | |
| | 1,053 | | | Global Payments, Inc.(a) | | | 105,553 | |
| | 3,640 | | | International Business Machines Corp.(a) | | | 558,449 | |
| | 4,463 | | | MasterCard, Inc., Class A(a) | | | 675,519 | |
| | 1,751 | | | Paychex, Inc.(a) | | | 119,208 | |
| | 8,712 | | | Visa, Inc., Class A(a) | | | 993,342 | |
| | | | | | | | |
| | | | | | | 3,096,464 | |
| | | | | | | | |
| | | | Leisure Products — 0.1% | | | | |
| | 590 | | | Brunswick Corp.(a) | | | 32,580 | |
| | 260 | | | Polaris Industries, Inc.(a) | | | 32,237 | |
| | | | | | | | |
| | | | | | | 64,817 | |
| | | | | | | | |
| | | | Life Sciences Tools & Services — 0.6% | | | | |
| | 639 | | | Illumina, Inc.(a)(b) | | | 139,615 | |
| | 1,846 | | | Thermo Fisher Scientific, Inc.(a) | | | 350,519 | |
| | | | | | | | |
| | | | | | | 490,134 | |
| | | | | | | | |
| | | | Machinery — 1.4% | | | | |
| | 897 | | | AGCO Corp.(a) | | | 64,073 | |
| | 3,318 | | | Caterpillar, Inc.(a) | | | 522,850 | |
| | 1,271 | | | Cummins, Inc.(a) | | | 224,509 | |
| | 1,398 | | | IDEX Corp.(a) | | | 184,494 | |
| | 426 | | | WABCO Holdings, Inc.(a)(b) | | | 61,131 | |
| | 674 | | | Wabtec Corp.(a) | | | 54,884 | |
| | | | | | | | |
| | | | | | | 1,111,941 | |
| | | | | | | | |
| | | | Media — 2.8% | | | | |
| | 984 | | | AMC Networks, Inc., Class A(a)(b) | | | 53,215 | |
| | 19,368 | | | Comcast Corp., Class A(a) | | | 775,688 | |
| | 18,692 | | | Sirius XM Holdings, Inc.(a) | | | 100,189 | |
| | 3,373 | | | Time Warner, Inc.(a) | | | 308,528 | |
| | 8,044 | | | Twenty-First Century Fox, Inc., Class A(a) | | | 277,759 | |
| | 6,709 | | | Walt Disney Co. (The)(a) | | | 721,285 | |
| | | | | | | | |
| | | | | | | 2,236,664 | |
| | | | | | | | |
| | | | Metals & Mining — 0.2% | | | | |
| | 6,251 | | | Barrick Gold Corp.(a) | | | 90,452 | |
| | 2,173 | | | Steel Dynamics, Inc.(a) | | | 93,721 | |
| | | | | | | | |
| | | | | | | 184,173 | |
| | | | | | | | |
See accompanying notes to financial statements.
| 40
Portfolio of Investments – as of December 31, 2017
Gateway Equity Call Premium Fund – (continued)
| | | | | | | | |
| Shares | | | Description | | Value (†) | |
| | | | Multi-Utilities — 0.4% | | | | |
| | 6,757 | | | Public Service Enterprise Group, Inc.(a) | | $ | 347,985 | |
| | | | | | | | |
| | | | Multiline Retail — 0.1% | | | | |
| | 2,043 | | | Nordstrom, Inc.(a) | | | 96,797 | |
| | | | | | | | |
| | | | Oil, Gas & Consumable Fuels — 5.4% | | | | |
| | 1,641 | | | Cheniere Energy, Inc.(a)(b) | | | 88,352 | |
| | 8,217 | | | Chevron Corp.(a) | | | 1,028,686 | |
| | 1,828 | | | Concho Resources, Inc.(a)(b) | | | 274,602 | |
| | 662 | | | Enbridge, Inc. | | | 25,891 | |
| | 7,263 | | | Encana Corp.(a) | | | 96,816 | |
| | 1,435 | | | Energen Corp.(a)(b) | | | 82,613 | |
| | 17,072 | | | Exxon Mobil Corp.(a) | | | 1,427,902 | |
| | 1,306 | | | HollyFrontier Corp.(a) | | | 66,893 | |
| | 5,828 | | | Noble Energy, Inc.(a) | | | 169,828 | |
| | 5,134 | | | Occidental Petroleum Corp.(a) | | | 378,171 | |
| | 3,420 | | | Phillips 66(a) | | | 345,933 | |
| | 1,392 | | | Pioneer Natural Resources Co.(a) | | | 240,607 | |
| | 1,113 | | | Whiting Petroleum Corp.(a)(b) | | | 29,472 | |
| | 7,085 | | | WPX Energy, Inc.(a)(b) | | | 99,686 | |
| | | | | | | | |
| | | | | | | 4,355,452 | |
| | | | | | | | |
| | | | Pharmaceuticals — 4.8% | | | | |
| | 1,391 | | | Allergan PLC(a) | | | 227,540 | |
| | 6,590 | | | Bristol-Myers Squibb Co.(a) | | | 403,835 | |
| | 3,965 | | | Eli Lilly & Co.(a) | | | 334,884 | |
| | 240 | | | Jazz Pharmaceuticals PLC(a)(b) | | | 32,316 | |
| | 10,190 | | | Johnson & Johnson(a) | | | 1,423,747 | |
| | 10,679 | | | Merck & Co., Inc.(a) | | | 600,907 | |
| | 23,721 | | | Pfizer, Inc.(a) | | | 859,175 | |
| | | | | | | | |
| | | | | | | 3,882,404 | |
| | | | | | | | |
| | | | Professional Services — 0.2% | | | | |
| | 310 | | | ManpowerGroup, Inc.(a) | | | 39,094 | |
| | 1,353 | | | Verisk Analytics, Inc.(a)(b) | | | 129,888 | |
| | | | | | | | |
| | | | | | | 168,982 | |
| | | | | | | | |
| | | | Real Estate Management & Development — 0.0% | | | | |
| | 221 | | | Jones Lang LaSalle, Inc.(a) | | | 32,914 | |
| | | | | | | | |
| | | | REITs – Apartments — 0.7% | | | | |
| | 890 | | | American Campus Communities, Inc.(a) | | | 36,517 | |
| | 1,156 | | | Camden Property Trust(a) | | | 106,421 | |
| | 539 | | | Essex Property Trust, Inc.(a) | | | 130,098 | |
| | 1,221 | | | Mid-America Apartment Communities, Inc.(a) | | | 122,784 | |
| | 3,908 | | | UDR, Inc.(a) | | | 150,536 | |
| | | | | | | | |
| | | | | | | 546,356 | |
| | | | | | | | |
| | | | REITs – Diversified — 1.0% | | | | |
| | 2,597 | | | Crown Castle International Corp.(a) | | | 288,293 | |
| | 1,790 | | | Digital Realty Trust, Inc.(a) | | | 203,881 | |
See accompanying notes to financial statements.
41 |
Portfolio of Investments – as of December 31, 2017
Gateway Equity Call Premium Fund – (continued)
| | | | | | | | |
| Shares | | | Description | | Value (†) | |
| | | | REITs – Diversified — continued | | | | |
| | 6,373 | | | Duke Realty Corp.(a) | | $ | 173,409 | |
| | 771 | | | SBA Communications Corp.(a)(b) | | | 125,951 | |
| | | | | | | | |
| | | | | | | 791,534 | |
| | | | | | | | |
| | | | REITs – Hotels — 0.0% | | | | |
| | 906 | | | Park Hotels & Resorts, Inc.(a) | | | 26,048 | |
| | | | | | | | |
| | | | REITs – Mortgage — 0.2% | | | | |
| | 3,823 | | | AGNC Investment Corp.(a) | | | 77,187 | |
| | 8,270 | | | Annaly Capital Management, Inc.(a) | | | 98,330 | |
| | | | | | | | |
| | | | | | | 175,517 | |
| | | | | | | | |
| | | | REITs – Office Property — 0.2% | | | | |
| | 1,019 | | | Kilroy Realty Corp.(a) | | | 76,069 | |
| | 1,154 | | | SL Green Realty Corp.(a) | | | 116,473 | |
| | | | | | | | |
| | | | | | | 192,542 | |
| | | | | | | | |
| | | | REITs – Shopping Centers — 0.2% | | | | |
| | 6,173 | | | DDR Corp.(a) | | | 55,310 | |
| | 1,796 | | | Regency Centers Corp.(a) | | | 124,247 | |
| | | | | | | | |
| | | | | | | 179,557 | |
| | | | | | | | |
| | | | REITs – Single Tenant — 0.3% | | | | |
| | 1,882 | | | National Retail Properties, Inc.(a) | | | 81,170 | |
| | 2,937 | | | Realty Income Corp.(a) | | | 167,468 | |
| | | | | | | | |
| | | | | | | 248,638 | |
| | | | | | | | |
| | | | REITs – Storage — 0.2% | | | | |
| | 1,517 | | | Extra Space Storage, Inc.(a) | | | 132,662 | |
| | | | | | | | |
| | | | Road & Rail — 0.9% | | | | |
| | 1,536 | | | Norfolk Southern Corp.(a) | | | 222,566 | |
| | 252 | | | Old Dominion Freight Line, Inc.(a) | | | 33,151 | |
| | 3,613 | | | Union Pacific Corp.(a) | | | 484,503 | |
| | | | | | | | |
| | | | | | | 740,220 | |
| | | | | | | | |
| | | | Semiconductors & Semiconductor Equipment — 3.8% | | | | |
| | 8,059 | | | Applied Materials, Inc.(a) | | | 411,976 | |
| | 19,255 | | | Intel Corp.(a) | | | 888,811 | |
| | 2,963 | | | Maxim Integrated Products, Inc.(a) | | | 154,906 | |
| | 2,607 | | | NVIDIA Corp.(a) | | | 504,454 | |
| | 663 | | | NXP Semiconductors NV(a)(b) | | | 77,631 | |
| | 6,229 | | | QUALCOMM, Inc.(a) | | | 398,780 | |
| | 5,955 | | | Texas Instruments, Inc.(a) | | | 621,940 | |
| | 981 | | | Versum Materials, Inc.(a) | | | 37,131 | |
| | | | | | | | |
| | | | | | | 3,095,629 | |
| | | | | | | | |
| | | | Software — 5.6% | | | | |
| | 3,733 | | | Activision Blizzard, Inc.(a) | | | 236,374 | |
| | 2,543 | | | Adobe Systems, Inc.(a)(b) | | | 445,635 | |
| | 560 | | | ANSYS, Inc.(a)(b) | | | 82,650 | |
| | 1,739 | | | Cadence Design Systems, Inc.(a)(b) | | | 72,725 | |
See accompanying notes to financial statements.
| 42
Portfolio of Investments – as of December 31, 2017
Gateway Equity Call Premium Fund – (continued)
| | | | | | | | |
| Shares | | | Description | | Value (†) | |
| | | | Software — continued | | | | |
| | 569 | | | CDK Global, Inc.(a) | | $ | 40,558 | |
| | 384 | | | Check Point Software Technologies Ltd.(a)(b) | | | 39,790 | |
| | 387 | | | Dell Technologies, Inc., Class V(a)(b) | | | 31,455 | |
| | 342 | | | Fortinet, Inc.(a)(b) | | | 14,942 | |
| | 28,324 | | | Microsoft Corp.(a) | | | 2,422,835 | |
| | 12,346 | | | Oracle Corp.(a) | | | 583,719 | |
| | 3,192 | | | salesforce.com, inc.(a)(b) | | | 326,318 | |
| | 373 | | | ServiceNow, Inc.(a)(b) | | | 48,636 | |
| | 1,052 | | | Synopsys, Inc.(a)(b) | | | 89,673 | |
| | 597 | | | Take-Two Interactive Software, Inc.(a)(b) | | | 65,539 | |
| | 87 | | | Ultimate Software Group, Inc. (The)(b) | | | 18,986 | |
| | | | | | | | |
| | | | | | | 4,519,835 | |
| | | | | | | | |
| | | | Specialty Retail — 2.6% | | | | |
| | 796 | | | Advance Auto Parts, Inc.(a) | | | 79,353 | |
| | 961 | | | Dick’s Sporting Goods, Inc.(a) | | | 27,619 | |
| | 1,982 | | | Foot Locker, Inc.(a) | | | 92,916 | |
| | 5,394 | | | Home Depot, Inc. (The)(a) | | | 1,022,325 | |
| | 5,076 | | | Lowe’s Cos., Inc.(a) | | | 471,764 | |
| | 582 | | | Signet Jewelers Ltd.(a) | | | 32,912 | |
| | 4,135 | | | TJX Cos., Inc. (The)(a) | | | 316,162 | |
| | 424 | | | Ulta Beauty, Inc.(a)(b) | | | 94,832 | |
| | 187 | | | Williams-Sonoma, Inc. | | | 9,668 | |
| | | | | | | | |
| | | | | | | 2,147,551 | |
| | | | | | | | |
| | | | Technology Hardware, Storage & Peripherals — 4.4% | | | | |
| | 18,914 | | | Apple, Inc.(a) | | | 3,200,816 | |
| | 8,231 | | | Hewlett Packard Enterprise Co.(a) | | | 118,197 | |
| | 10,336 | | | HP, Inc.(a) | | | 217,160 | |
| | | | | | | | |
| | | | | | | 3,536,173 | |
| | | | | | | | |
| | | | Textiles, Apparel & Luxury Goods — 0.7% | | | | |
| | 388 | | | Carter’s, Inc.(a) | | | 45,586 | |
| | 3,829 | | | Hanesbrands, Inc.(a) | | | 80,064 | |
| | 462 | | | Lululemon Athletica, Inc.(a)(b) | | | 36,309 | |
| | 6,287 | | | NIKE, Inc., Class B(a) | | | 393,252 | |
| | 1,029 | | | Skechers U.S.A., Inc., Class A(a)(b) | | | 38,937 | |
| | | | | | | | |
| | | | | | | 594,148 | |
| | | | | | | | |
| | | | Thrifts & Mortgage Finance — 0.0% | | | | |
| | 244 | | | New York Community Bancorp, Inc.(a) | | | 3,177 | |
| | | | | | | | |
| | | | Tobacco — 1.6% | | | | |
| | 8,847 | | | Altria Group, Inc.(a) | | | 631,764 | |
| | 6,523 | | | Philip Morris International, Inc.(a) | | | 689,155 | |
| | | | | | | | |
| | | | | | | 1,320,919 | |
| | | | | | | | |
| | | | Water Utilities — 0.3% | | | | |
| | 2,388 | | | American Water Works Co., Inc.(a) | | | 218,478 | |
| | | | | | | | |
See accompanying notes to financial statements.
43 |
Portfolio of Investments – as of December 31, 2017
Gateway Equity Call Premium Fund – (continued)
| | | | | | | | |
| Shares | | | Description | | Value (†) | |
| | | | Wireless Telecommunication Services — 0.0% | | | | |
| | 1,342 | | | Sprint Corp.(b) | | $ | 7,904 | |
| | | | | | | | |
| | | | Total Common Stocks
(Identified Cost $57,819,939) | | | 80,419,636 | |
| | | | | | | | |
| | | | | | | | |
Principal
Amount | | | | | | |
| | Short-Term Investments — 2.7% | |
| $ | 2,219,220 | | | Tri-Party Repurchase Agreement with Fixed Income Clearing Corporation, dated 12/29/2017 at 0.540% to be repurchased at $2,219,353 on 1/02/2018 collateralized by $2,255,000 U.S. Treasury Note, 2.250% due 1/31/2024 valued at $2,267,378 including accrued interest (Note 2 of Notes to Financial Statements) (Identified Cost $2,219,220) | | | 2,219,220 | |
| | | | | | | | |
| | | | | | | | |
| | | | Total Investments — 102.0%
(Identified Cost $60,039,159) | | | 82,638,856 | |
| | | | Other assets less liabilities — (2.0)% | | | (1,650,167 | ) |
| | | | | | | | |
| | | | Net Assets — 100.0% | | $ | 80,988,689 | |
| | | | | | | | |
| | | | | | | | | | | | | | | | | | | | | | | | |
| Written Options — (1.8%) | | | | | | | | | | | | | | | | | |
| | | | | | | | | | | | | | | | | | | | | | | | |
| Description | | Expiration
Date | | | Exercise
Price | | | Contracts | | | Notional
Amount | | | Premiums
(Received) | | | Value (†) | |
| Index Options — (1.8%) | | | | | | | | | | | | | | | | | | | | | |
| S&P 500® Index, Call | | | 01/05/2018 | | | | 2,650 | | | | (35 | ) | | $ | (9,357,635 | ) | | $ | (73,412 | ) | | $ | (103,950 | ) |
| S&P 500® Index, Call | | | 01/19/2018 | | | | 2,600 | | | | (32 | ) | | | (8,555,552 | ) | | | (98,704 | ) | | | (265,440 | ) |
| S&P 500® Index, Call | | | 01/19/2018 | | | | 2,650 | | | | (33 | ) | | | (8,822,913 | ) | | | (145,117 | ) | | | (128,205 | ) |
| S&P 500® Index, Call | | | 01/26/2018 | | | | 2,700 | | | | (32 | ) | | | (8,555,552 | ) | | | (47,920 | ) | | | (32,960 | ) |
| S&P 500® Index, Call | | | 02/16/2018 | | | | 2,600 | | | | (33 | ) | | | (8,822,913 | ) | | | (178,118 | ) | | | (303,105 | ) |
| S&P 500® Index, Call | | | 02/16/2018 | | | | 2,625 | | | | (33 | ) | | | (8,822,913 | ) | | | (181,418 | ) | | | (233,145 | ) |
| S&P 500® Index, Call | | | 02/16/2018 | | | | 2,650 | | | | (32 | ) | | | (8,555,552 | ) | | | (147,120 | ) | | | (163,040 | ) |
| S&P 500® Index, Call | | | 02/16/2018 | | | | 2,675 | | | | (32 | ) | | | (8,555,552 | ) | | | (115,120 | ) | | | (106,400 | ) |
| S&P 500® Index, Call | | | 03/16/2018 | | | | 2,700 | | | | (35 | ) | | | (9,357,635 | ) | | | (157,413 | ) | | | (108,675 | ) |
| | | | | | | | | | | | | | | | | | | | | | | | |
| Total | | | | | | | | | | | | | | | | | | $ | (1,144,342 | ) | | $ | (1,444,920 | ) |
| | | | | | | | | | | | | | | | | | | | | | | | |
| | | | |
| | | | |
| | (†) | | | See Note 2 of Notes to Financial Statements. |
| | (a) | | | Security (or a portion thereof) has been pledged as collateral for open derivative contracts. |
| | (b) | | | Non-income producing security. |
| | | | |
| | ADR | | | An American Depositary Receipt is a certificate issued by a custodian bank representing the right to receive securities of the foreign issuer described. The values of ADRs may be significantly influenced by trading on exchanges not located in the United States. |
| | REITs | | | Real Estate Investment Trusts |
See accompanying notes to financial statements.
| 44
Portfolio of Investments – as of December 31, 2017
Gateway Equity Call Premium Fund – (continued)
Industry Summary at December 31, 2017
| | | | |
Banks | | | 6.6 | % |
Software | | | 5.6 | |
Oil, Gas & Consumable Fuels | | | 5.4 | |
Internet Software & Services | | | 5.0 | |
Pharmaceuticals | | | 4.8 | |
Technology Hardware, Storage & Peripherals | | | 4.4 | |
IT Services | | | 3.8 | |
Semiconductors & Semiconductor Equipment | | | 3.8 | |
Internet & Direct Marketing Retail | | | 3.0 | |
Biotechnology | | | 3.0 | |
Health Care Providers & Services | | | 2.8 | |
Media | | | 2.8 | |
Specialty Retail | | | 2.6 | |
Aerospace & Defense | | | 2.4 | |
Health Care Equipment & Supplies | | | 2.4 | |
Industrial Conglomerates | | | 2.4 | |
Capital Markets | | | 2.2 | |
Chemicals | | | 2.1 | |
Food & Staples Retailing | | | 2.1 | |
Diversified Telecommunication Services | | | 2.1 | |
Insurance | | | 2.1 | |
Beverages | | | 2.0 | |
Electric Utilities | | | 2.0 | |
Other Investments, less than 2% each | | | 23.9 | |
Short-Term Investments | | | 2.7 | |
| | | | |
Total Investments | | | 102.0 | |
Other assets less liabilities (including open written options) | | | (2.0 | ) |
| | | | |
Net Assets | | | 100.0 | % |
| | | | |
See accompanying notes to financial statements.
45 |
Portfolio of Investments – as of December 31, 2017
Mirova Global Green Bond Fund
| | | | | | | | |
Principal
Amount (‡) | | | Description | | Value (†) | |
| | Bonds and Notes — 94.2% of Net Assets | | | | |
| | | | Australia — 1.8% | | | | |
| | 400,000 | | | National Australia Bank Ltd., GMTN, 0.350%, 9/07/2022, (EUR)(a) | | $ | 478,330 | |
| | | | | | | | |
| | | | Austria — 1.5% | | | | |
| | 300,000 | | | Verbund AG, 1.500%, 11/20/2024, (EUR)(a) | | | 376,665 | |
| | | | | | | | |
| | | | Canada — 3.0% | | | | |
| | 1,000,000 | | | Province of Ontario Canada, 1.950%, 1/27/2023, (CAD)(a) | | | 783,325 | |
| | | | | | | | |
| | | | Finland — 0.7% | | | | |
| | 200,000 | | | Municipality Finance PLC, REGS, 1.375%, 9/21/2021(a) | | | 193,070 | |
| | | | | | | | |
| | | | France — 14.0% | | | | |
| | 100,000 | | | Agence Francaise de Developpement, EMTN, 1.375%, 9/17/2024, (EUR)(a) | | | 127,565 | |
| | 400,000 | | | Electricite de France S.A., EMTN, 1.000%, 10/13/2026, (EUR)(a) | | | 469,945 | |
| | 100,000 | | | Engie S.A., EMTN, 1.500%, 3/27/2028, (EUR) | | | 123,384 | |
| | 1,350,000 | | | France Government Bond OAT, 1.750%, 6/25/2039, (EUR)(a) | | | 1,706,582 | |
| | 300,000 | | | ICADE, 1.500%, 9/13/2027, (EUR) | | | 361,616 | |
| | 100,000 | | | SNCF Reseau, EMTN, 1.000%, 11/09/2031, (EUR)(a) | | | 115,768 | |
| | 200,000 | | | SNCF Reseau, EMTN, 1.875%, 3/30/2034, (EUR)(a) | | | 255,309 | |
| | 400,000 | | | Unibail-Rodamco SE, EMTN, 1.000%, 3/14/2025, (EUR)(a) | | | 485,861 | |
| | | | | | | | |
| | | | | | | 3,646,030 | |
| | | | | | | | |
| | | | Germany — 8.9% | | | | |
| | 100,000 | | | Berlin Hyp AG, 0.500%, 9/26/2023, (EUR)(a) | | | 119,356 | |
| | 100,000 | | | Deutsche Kreditbank AG, Series 100, 0.625%, 6/08/2021, (EUR)(a) | | | 121,600 | |
| | 1,000,000 | | | Kreditanstalt fuer Wiederaufbau, 1.750%, 10/15/2019(a) | | | 995,236 | |
| | 800,000 | | | Kreditanstalt fuer Wiederaufbau, 2.000%, 9/29/2022(a) | | | 787,086 | |
| | 370,000 | | | Kreditanstalt fuer Wiederaufbau, MTN, 2.400%, 7/02/2020, (AUD)(a) | | | 289,517 | |
| | | | | | | | |
| | | | | | | 2,312,795 | |
| | | | | | | | |
| | | | Italy — 5.0% | | | | |
| | 700,000 | | | Hera SpA, EMTN, 2.375%, 7/04/2024, (EUR)(a) | | | 924,035 | |
| | 300,000 | | | Intesa Sanpaolo SpA, EMTN, 0.875%, 6/27/2022, (EUR)(a) | | | 364,096 | |
| | | | | | | | |
| | | | | | | 1,288,131 | |
| | | | | | | | |
| | | | Japan — 3.2% | | | | |
| | 300,000 | | | Mizuho Financial Group, Inc., EMTN, 0.956%, 10/16/2024, (EUR) | | | 359,685 | |
| | 400,000 | | | Sumitomo Mitsui Financial Group, Inc., EMTN, 0.934%, 10/11/2024, (EUR) | | | 479,145 | |
| | | | | | | | |
| | | | | | | 838,830 | |
| | | | | | | | |
| | | | Netherlands — 12.7% | | | | |
| | 800,000 | | | Enel Finance International NV, EMTN, 1.000%, 9/16/2024, (EUR)(a) | | | 973,185 | |
| | 600,000 | | | Iberdrola International BV, EMTN, 1.125%, 4/21/2026, (EUR)(a) | | | 721,331 | |
| | 100,000 | | | Iberdrola International BV, EMTN, 2.500%, 10/24/2022, (EUR)(a) | | | 131,914 | |
| | 100,000 | | | Nederlandse Waterschapsbank NV, EMTN, 1.000%, 9/03/2025, (EUR) | | | 125,778 | |
| | 200,000 | | | TenneT Holding BV, EMTN, 1.250%, 10/24/2033, (EUR)(a) | | | 230,149 | |
| | 300,000 | | | TenneT Holding BV, EMTN, 1.375%, 6/26/2029, (EUR)(a) | | | 364,107 | |
| | 400,000 | | | TenneT Holding BV, EMTN, 1.750%, 6/04/2027, (EUR)(a) | | | 511,004 | |
| | 200,000 | | | TenneT Holding BV, EMTN, 1.875%, 6/13/2036, (EUR) | | | 246,016 | |
| | | | | | | | |
| | | | | | | 3,303,484 | |
| | | | | | | | |
See accompanying notes to financial statements.
| 46
Portfolio of Investments – as of December 31, 2017
Mirova Global Green Bond Fund – (continued)
| | | | | | | | |
Principal
Amount (‡) | | | Description | | Value (†) | |
| | | | Norway — 4.5% | | | | |
| $ | 1,200,000 | | | Kommunalbanken AS, MTN, 1.375%, 10/26/2020(a) | | $ | 1,173,180 | |
| | | | | | | | |
| | | | Spain — 1.9% | | | | |
| | 400,000 | | | Adif - Alta Velocidad, 0.800%, 7/05/2023, (EUR) | | | 481,088 | |
| | | | | | | | |
| | | | Supranationals — 14.4% | | | | |
| | 100,000 | | | Asian Development Bank, GMTN, 2.375%, 8/10/2027 | | | 98,293 | |
| | 100,000 | | | European Investment Bank, 1.500%, 11/15/2047, (EUR)(a) | | | 123,351 | |
| | 400,000 | | | European Investment Bank, 2.125%, 4/13/2026(a) | | | 386,213 | |
| | 200,000 | | | European Investment Bank, 2.375%, 5/24/2027(a) | | | 196,379 | |
| | 700,000 | | | European Investment Bank, 2.500%, 10/15/2024(a) | | | 699,420 | |
| | 600,000 | | | European Investment Bank, EMTN, 0.500%, 11/13/2037, (EUR)(a) | | | 639,641 | |
| | 100,000 | | | European Investment Bank, EMTN, 1.250%, 11/13/2026, (EUR) | | | 128,471 | |
| | 200,000 | | | International Bank for Reconstruction & Development, Series GDIF, 2.125%, 3/03/2025(a) | | | 195,265 | |
| | 600,000 | | | International Finance Corp., GMTN, 2.000%, 10/24/2022 | | | 591,499 | |
| | 700,000 | | | International Finance Corp., GMTN, 2.125%, 4/07/2026(a) | | | 678,163 | |
| | | | | | | | |
| | | | | | | 3,736,695 | |
| | | | | | | | |
| | | | Sweden — 5.4% | | | | |
| | 1,400,000 | | | Svensk Exportkredit AB, GMTN, 1.875%, 6/23/2020(a) | | | 1,390,797 | |
| | | | | | | | |
| | | | United Kingdom — 6.4% | | | | |
| | 500,000 | | | Anglian Water Services Financing PLC, EMTN, 1.625%, 8/10/2025, (GBP) | | | 665,107 | |
| | 600,000 | | | SSE PLC, EMTN, 0.875%, 9/06/2025, (EUR) | | | 711,413 | |
| | 200,000 | | | Transport for London, EMTN, 2.125%, 4/24/2025, (GBP)(a) | | | 281,836 | |
| | | | | | | | |
| | | | | | | 1,658,356 | |
| | | | | | | | |
| | | | United States — 10.8% | | | | |
| | 900,000 | | | Apple, Inc., 2.850%, 2/23/2023(a) | | | 912,192 | |
| | 300,000 | | | Apple, Inc., 3.000%, 6/20/2027 | | | 298,684 | |
| | 400,000 | | | Digital Realty Trust LP, 3.950%, 7/01/2022(a) | | | 417,866 | |
| | 200,000 | | | Southern Power Co., 4.150%, 12/01/2025(a) | | | 210,766 | |
| | 800,000 | | | Southern Power Co., Series 2016, 1.000%, 6/20/2022, (EUR)(a) | | | 976,068 | |
| | | | | | | | |
| | | | | | | 2,815,576 | |
| | | | | | | | |
| | | | Total Bonds and Notes
(Identified Cost $23,125,734) | | | 24,476,352 | |
| | | | | | | | |
| | | | | | | | |
| | Short-Term Investments — 2.8% | | | | |
| | 743,602 | | | Tri-Party Repurchase Agreement with Fixed Income Clearing Corporation, dated 12/29/2017 at 0.540% to be repurchased at $743,647 on 1/02/2018 collateralized by $755,000 U.S. Treasury Note, 2.250% due 1/31/2024 valued at $759,144 including accrued interest (Note 2 of Notes to Financial Statements) (Identified Cost $743,602) | | | 743,602 | |
| | | | | | | | |
| | | | | | | | |
| | | | Total Investments — 97.0%
(Identified Cost $23,869,336) | | | 25,219,954 | |
| | | | Other assets less liabilities — 3.0% | | | 768,046 | |
| | | | | | | | |
| | | | Net Assets — 100.0% | | $ | 25,988,000 | |
| | | | | | | | |
See accompanying notes to financial statements.
47 |
Portfolio of Investments – as of December 31, 2017
Mirova Global Green Bond Fund – (continued)
| | | | | | | | |
| | | | | | | | |
| | (‡) | | | Principal Amount stated in U.S. dollars unless otherwise noted. | |
| | (†) | | | See Note 2 of Notes to Financial Statements. | |
| | (a) | | | Security (or a portion thereof) has been designated to cover the Fund’s obligations under open derivative contracts. | |
| | | | | | | | |
| | EMTN | | | Euro Medium Term Note | | | | |
| | GMTN | | | Global Medium Term Note | | | | |
| | MTN | | | Medium Term Note | | | | |
| | | | | | | | |
| | AUD | | | Australian Dollar | | | | |
| | CAD | | | Canadian Dollar | | | | |
| | EUR | | | Euro | | | | |
| | GBP | | | British Pound | | | | |
At December 31, 2017, open long futures contracts were as follows:
| | | | | | | | | | | | | | | | | | | | |
| Financial Futures | | Expiration
Date | | | Contracts | | | Notional
Amount | | | Value | | | Unrealized
Appreciation
(Depreciation) | |
10 Year U.S. Treasury Note | | | 3/20/2018 | | | | 5 | | | $ | 621,854 | | | $ | 620,234 | | | $ | (1,620 | ) |
Euro-Buxl® 30 Year Bond | | | 3/08/2018 | | | | 1 | | | | 201,240 | | | | 196,607 | | | | (4,633 | ) |
German Euro BOBL | | | 3/08/2018 | | | | 6 | | | | 951,096 | | | | 947,473 | | | | (3,623 | ) |
| | | | | | | | | | | | | | | | | | | | |
Total | | | | | | | | | | | | | | | | | | $ | (9,876 | ) |
| | | | | | | | | | | | | | | | | | | | |
At December 31, 2017, open short futures contracts were as follows:
| | | | | | | | | | | | | | | | | | | | |
| Financial Futures | | Expiration
Date | | | Contracts | | | Notional
Amount | | | Value | | | Unrealized
Appreciation
(Depreciation) | |
Australian Dollar | | | 3/19/2018 | | | | 6 | | | $ | 459,222 | | | $ | 468,660 | | | $ | (9,438 | ) |
British Pound | | | 3/19/2018 | | | | 12 | | | | 1,009,915 | | | | 1,016,775 | | | | (6,860 | ) |
Canadian Dollar | | | 3/20/2018 | | | | 10 | | | | 780,071 | | | | 799,000 | | | | (18,929 | ) |
Euro | | | 3/19/2018 | | | | 90 | | | | 13,388,459 | | | | 13,584,938 | | | | (196,479 | ) |
German Euro Bund | | | 3/08/2018 | | | | 4 | | | | 784,071 | | | | 775,967 | | | | 8,104 | |
UK Long Gilt | | | 3/27/2018 | | | | 2 | | | | 334,078 | | | | 337,970 | | | | (3,892 | ) |
| | | | | | | | | | | | | | | | | | | | |
Total | | | | | | | | | | | | | | | | | | $ | (227,494 | ) |
| | | | | | | | | | | | | | | | | | | | |
See accompanying notes to financial statements.
| 48
Portfolio of Investments – as of December 31, 2017
Mirova Global Green Bond Fund – (continued)
Industry Summary at December 31, 2017
| | | | |
Utility – Electric | | | 18.1 | % |
Bank | | | 15.8 | |
Supra-National | | | 14.4 | |
Industrial | | | 13.4 | |
Financial | | | 10.3 | |
Government Agency | | | 8.3 | |
Government National | | | 6.5 | |
Government Regional | | | 3.7 | |
Special Purpose | | | 2.6 | |
Transportation – Rail | | | 1.1 | |
Short-Term Investments | | | 2.8 | |
| | | | |
Total Investments | | | 97.0 | |
Other assets less liabilities (including futures contracts) | | | 3.0 | |
| | | | |
Net Assets | | | 100.0 | % |
| | | | |
Currency Exposure Summary at December 31, 2017
| | | | |
Euro | | | 51.1 | % |
United States Dollar | | | 38.1 | |
British Pound | | | 3.7 | |
Canadian Dollar | | | 3.0 | |
Other, less than 2% each | | | 1.1 | |
| | | | |
Total Investments | | | 97.0 | |
Other assets less liabilities (including futures contracts) | | | 3.0 | |
| | | | |
Net Assets | | | 100.0 | % |
| | | | |
See accompanying notes to financial statements.
49 |
Portfolio of Investments – as of December 31, 2017
Mirova Global Sustainable Equity Fund
| | | | | | | | |
| Shares | | | Description | | Value (†) | |
| | Common Stocks — 96.2% of Net Assets | | | | |
| | | | Belgium — 3.4% | | | | |
| | 27,353 | | | KBC Groep NV | | $ | 2,330,841 | |
| | | | | | | | |
| | | | China — 0.9% | | | | |
| | 66,000 | | | BYD Co. Ltd. | | | 573,375 | |
| | | | | | | | |
| | | | Denmark — 7.5% | | | | |
| | 8,800 | | | Chr. Hansen Holding AS | | | 825,021 | |
| | 5,826 | | | Coloplast AS, Series B | | | 463,170 | |
| | 45,389 | | | Novo Nordisk AS, Class B | | | 2,439,000 | |
| | 10,116 | | | Novozymes AS | | | 577,495 | |
| | 11,569 | | | Vestas Wind Systems AS | | | 799,421 | |
| | | | | | | | |
| | | | | | | 5,104,107 | |
| | | | | | | | |
| | | | France — 4.7% | | | | |
| | 15,921 | | | Essilor International Cie Generale d’Optique S.A. | | | 2,192,982 | |
| | 13,492 | | | Valeo S.A. | | | 1,005,029 | |
| | | | | | | | |
| | | | | | | 3,198,011 | |
| | | | | | | | |
| | | | Germany — 5.4% | | | | |
| | 2,920 | | | Allianz SE, (Registered) | | | 668,235 | |
| | 33,274 | | | Deutsche Telekom AG | | | 588,165 | |
| | 8,800 | | | Fresenius SE & Co. KGaA | | | 684,391 | |
| | 20,055 | | | Symrise AG | | | 1,719,494 | |
| | | | | | | | |
| | | | | | | 3,660,285 | |
| | | | | | | | |
| | | | Hong Kong — 4.9% | | | | |
| | 137,737 | | | AIA Group Ltd. | | | 1,171,542 | |
| | 41,400 | | | Tencent Holdings Ltd. | | | 2,142,777 | |
| | | | | | | | |
| | | | | | | 3,314,319 | |
| | | | | | | | |
| | | | Ireland — 2.5% | | | | |
| | 21,500 | | | Eaton Corp. PLC | | | 1,698,715 | |
| | | | | | | | |
| | | | Japan — 5.8% | | | | |
| | 11,100 | | | Rinnai Corp. | | | 1,004,285 | |
| | 66,000 | | | Sekisui House Ltd. | | | 1,190,551 | |
| | 26,700 | | | Toyota Motor Corp. | | | 1,701,590 | |
| | | | | | | | |
| | | | | | | 3,896,426 | |
| | | | | | | | |
| | | | Netherlands — 3.2% | | | | |
| | 5,132 | | | ASML Holding NV | | | 892,240 | |
| | 22,892 | | | Unilever NV | | | 1,288,887 | |
| | | | | | | | |
| | | | | | | 2,181,127 | |
| | | | | | | | |
| | | | Singapore — 1.4% | | | | |
| | 1,138,700 | | | Raffles Medical Group Ltd. | | | 953,564 | |
| | | | | | | | |
| | | | Switzerland — 2.4% | | | | |
| | 11,471 | | | Cie Financiere Richemont S.A., (Registered) | | | 1,038,904 | |
| | 1,300 | | | Geberit AG, (Registered) | | | 572,216 | |
| | | | | | | | |
| | | | | | | 1,611,120 | |
| | | | | | | | |
See accompanying notes to financial statements.
| 50
Portfolio of Investments – as of December 31, 2017
Mirova Global Sustainable Equity Fund – (continued)
| | | | | | | | |
| Shares | | | Description | | Value (†) | |
| | | | United Kingdom — 6.7% | | | | |
| | 15,700 | | | Aptiv PLC | | $ | 1,331,831 | |
| | 5,233 | | | Delphi Technologies PLC(a) | | | 274,576 | |
| | 341,943 | | | Legal & General Group PLC | | | 1,258,891 | |
| | 65,345 | | | Prudential PLC | | | 1,673,507 | |
| | | | | | | | |
| | | | | | | 4,538,805 | |
| | | | | | | | |
| | | | United States — 47.4% | | | | |
| | 21,400 | | | A.O. Smith Corp. | | | 1,311,392 | |
| | 7,500 | | | Acuity Brands, Inc. | | | 1,320,000 | |
| | 3,101 | | | Alphabet, Inc., Class A(a) | | | 3,266,594 | |
| | 1,400 | | | Amazon.com, Inc.(a) | | | 1,637,258 | |
| | 10,174 | | | American Water Works Co., Inc. | | | 930,819 | |
| | 23,187 | | | Danaher Corp. | | | 2,152,217 | |
| | 16,300 | | | Ecolab, Inc. | | | 2,187,134 | |
| | 9,500 | | | Ellie Mae, Inc.(a) | | | 849,300 | |
| | 12,200 | | | Facebook, Inc., Class A(a) | | | 2,152,812 | |
| | 8,400 | | | Gilead Sciences, Inc. | | | 601,776 | |
| | 1,500 | | | Illumina, Inc.(a) | | | 327,735 | |
| | 4,100 | | | International Flavors & Fragrances, Inc. | | | 625,701 | |
| | 21,500 | | | MasterCard, Inc., Class A | | | 3,254,240 | |
| | 29,863 | | | Microsoft Corp. | | | 2,554,481 | |
| | 6,296 | | | NextEra Energy, Inc. | | | 983,372 | |
| | 8,000 | | | Roper Technologies, Inc. | | | 2,072,000 | |
| | 6,500 | | | Signature Bank(a) | | | 892,190 | |
| | 13,600 | | | Thermo Fisher Scientific, Inc. | | | 2,582,368 | |
| | 15,400 | | | Visa, Inc., Class A | | | 1,755,908 | |
| | 8,600 | | | Watts Water Technologies, Inc., Series A | | | 653,170 | |
| | | | | | | | |
| | | | | | | 32,110,467 | |
| | | | | | | | |
| | | | Total Common Stocks (Identified Cost $52,177,099) | | | 65,171,162 | |
| | | | | | | | |
| | | | | | | | |
Principal
Amount | | | | | | |
| | Short-Term Investments — 3.0% | | | | |
| $ | 2,045,485 | | | Tri-Party Repurchase Agreement with Fixed Income Clearing Corporation, dated 12/29/2017 at 0.540% to be repurchased at $2,045,607 on 1/02/2018 collateralized by $2,080,000 U.S. Treasury Note, 2.250% due 1/31/2024 valued at $2,091,417 including accrued interest (Note 2 of Notes to Financial Statements) (Identified Cost $2,045,485) | | | 2,045,485 | |
| | | | | | | | |
| | | | | | | | |
| | | | Total Investments — 99.2%
(Identified Cost $54,222,584) | | | 67,216,647 | |
| | | | Other assets less liabilities — 0.8% | | | 568,508 | |
| | | | | | | | |
| | | | Net Assets — 100.0% | | $ | 67,785,155 | |
| | | | | | | | |
| | | | | | | | |
| | (†) | | | See Note 2 of Notes to Financial Statements. | | | | |
| | (a) | | | Non-income producing security. | | | | |
See accompanying notes to financial statements.
51 |
Portfolio of Investments – as of December 31, 2017
Mirova Global Sustainable Equity Fund – (continued)
Industry Summary at December 31, 2017
| | | | |
Internet Software & Services | | | 11.2 | % |
Chemicals | | | 8.6 | |
IT Services | | | 7.4 | |
Health Care Equipment & Supplies | | | 7.1 | |
Insurance | | | 7.0 | |
Electrical Equipment | | | 5.6 | |
Software | | | 5.1 | |
Banks | | | 4.7 | |
Life Sciences Tools & Services | | | 4.3 | |
Auto Components | | | 3.9 | |
Pharmaceuticals | | | 3.6 | |
Automobiles | | | 3.4 | |
Household Durables | | | 3.3 | |
Industrial Conglomerates | | | 3.1 | |
Building Products | | | 2.8 | |
Health Care Providers & Services | | | 2.4 | |
Internet & Direct Marketing Retail | | | 2.4 | |
Other Investments, less than 2% each | | | 10.3 | |
Short-Term Investments | | | 3.0 | |
| | | | |
Total Investments | | | 99.2 | |
Other assets less liabilities | | | 0.8 | |
| | | | |
Net Assets | | | 100.0 | % |
| | | | |
Currency Exposure Summary at December 31, 2017
| | | | |
United States Dollar | | | 55.3 | % |
Euro | | | 16.7 | |
Danish Krone | | | 7.5 | |
Japanese Yen | | | 5.8 | |
Hong Kong Dollar | | | 5.8 | |
British Pound | | | 4.3 | |
Swiss Franc | | | 2.4 | |
Singapore Dollar | | | 1.4 | |
| | | | |
Total Investments | | | 99.2 | |
Other assets less liabilities | | | 0.8 | |
| | | | |
Net Assets | | | 100.0 | % |
| | | | |
See accompanying notes to financial statements.
| 52
Statements of Assets and Liabilities
December 31, 2017
| | | | | | | | | | | | |
| | | Gateway
Fund | | | Gateway Equity
Call Premium
Fund | | | Mirova Global
Green Bond
Fund | |
ASSETS | | | | | | | | | | | | |
Investments at cost | | $ | 6,198,727,233 | | | $ | 60,039,159 | | | $ | 23,869,336 | |
Net unrealized appreciation | | | 2,461,766,659 | | | | 22,599,697 | | | | 1,350,618 | |
| | | | | | | | | | | | |
Investments at value | | | 8,660,493,892 | | | | 82,638,856 | | | | 25,219,954 | |
Due from brokers (Note 2) | | | — | | | | — | | | | 489,623 | |
Foreign currency at value (identified cost $0, $0 and $783,044, respectively) | | | — | | | | — | | | | 798,889 | |
Receivable for Fund shares sold | | | 17,948,740 | | | | 89,074 | | | | 409 | |
Receivable for securities sold | | | 180,822,216 | | | | 47,920 | | | | 254,512 | |
Dividends and interest receivable | | | 8,469,846 | | | | 82,817 | | | | 133,897 | |
Unrealized appreciation on futures contracts (Note 2) | | | — | | | | — | | | | 8,104 | |
Prepaid expenses (Note 8) | | | 7,235 | | | | 72 | | | | 32 | |
| | | | | | | | | | | | |
TOTAL ASSETS | | | 8,867,741,929 | | | | 82,858,739 | | | | 26,905,420 | |
| | | | | | | | | | | | |
LIABILITIES | | | | | | | | | | | | |
Options written, at value (premiums received $120,536,424, $1,144,342 and $0, respectively) (Note 2) | | | 153,198,670 | | | | 1,444,920 | | | | — | |
Payable for securities purchased | | | 174,953,209 | | | | — | | | | 604,948 | |
Payable for Fund shares redeemed | | | 8,949,823 | | | | — | | | | — | |
Payable to custodian bank (Note 9) | | | — | | | | 278,480 | | | | — | |
Unrealized depreciation on futures contracts (Note 2) | | | — | | | | — | | | | 245,474 | |
Management fees payable (Note 6) | | | 4,065,403 | | | | 38,444 | | | | 4,469 | |
Deferred Trustees’ fees (Note 6) | | | 651,812 | | | | 29,596 | | | | 3,563 | |
Administrative fees payable (Note 6) | | | 321,733 | | | | 3,105 | | | | 992 | |
Payable to distributor (Note 6d) | | | 60,343 | | | | 485 | | | | — | |
Other accounts payable and accrued expenses | | | 475,204 | | | | 75,020 | | | | 57,974 | |
| | | | | | | | | | | | |
TOTAL LIABILITIES | | | 342,676,197 | | | | 1,870,050 | | | | 917,420 | |
| | | | | | | | | | | | |
NET ASSETS | | $ | 8,525,065,732 | | | $ | 80,988,689 | | | $ | 25,988,000 | |
| | | | | | | | | | | | |
NET ASSETS CONSIST OF: | | | | | | | | | | | | |
Paid-in capital | | $ | 6,382,336,003 | | | $ | 67,647,197 | | | $ | 26,051,162 | |
Undistributed (Distributions in excess of) net investment income | | | 7,177,681 | | | | (29,596 | ) | | | 194,112 | |
Accumulated net realized loss on investments, futures contracts, options written and foreign currency transactions | | | (293,552,395 | ) | | | (8,928,031 | ) | | | (1,379,910 | ) |
Net unrealized appreciation on investments, futures contracts, options written and foreign currency translations | | | 2,429,104,443 | | | | 22,299,119 | | | | 1,122,636 | |
| | | | | | | | | | | | |
NET ASSETS | | $ | 8,525,065,732 | | | $ | 80,988,689 | | | $ | 25,988,000 | |
| | | | | | | | | | | | |
See accompanying notes to financial statements.
53 |
Statements of Assets and Liabilities (continued)
December 31, 2017
| | | | | | | | | | | | |
| | | Gateway
Fund | | | Gateway Equity
Call Premium
Fund | | | Mirova Global
Green Bond
Fund | |
COMPUTATION OF NET ASSET VALUE AND OFFERING PRICE: | | | | | | | | | | | | |
Class A shares: | | | | | | | | | | | | |
Net assets | | $ | 1,669,272,309 | | | $ | 7,085,038 | | | $ | 139,397 | |
| | | | | | | | | | | | |
Shares of beneficial interest | | | 49,870,908 | | | | 586,425 | | | | 14,000 | |
| | | | | | | | | | | | |
Net asset value and redemption price per share | | $ | 33.47 | | | $ | 12.08 | | | $ | 9.96 | |
| | | | | | | | | | | | |
Offering price per share (100/[100-maximum sales charge] of net asset value) (Note 1) | | $ | 35.51 | | | $ | 12.82 | | | $ | 10.40 | |
| | | | | | | | | | | | |
Class C shares: (redemption price per share is equal to net asset value less any applicable contingent deferred sales charge) (Note 1) | | | | | | | | | | | | |
Net assets | | $ | 336,890,619 | | | $ | 647,536 | | | $ | — | |
| | | | | | | | | | | | |
Shares of beneficial interest | | | 10,111,353 | | | | 53,716 | | | | — | |
| | | | | | | | | | | | |
Net asset value and offering price per share | | $ | 33.32 | | | $ | 12.05 | | | $ | — | |
| | | | | | | | | | | | |
Class N shares: | | | | | | | | | | | | |
Net assets | | $ | 126,262,459 | | | $ | 1,076 | | | $ | 25,805,485 | |
| | | | | | | | | | | | |
Shares of beneficial interest | | | 3,773,222 | | | | 89 | | | | 2,586,809 | |
| | | | | | | | | | | | |
Net asset value, offering and redemption price per share | | $ | 33.46 | | | $ | 12.09 | | | $ | 9.98 | |
| | | | | | | | | | | | |
Class Y shares: | | | | | | | | | | | | |
Net assets | | $ | 6,392,640,345 | | | $ | 73,255,039 | | | $ | 43,118 | |
| | | | | | | | | | | | |
Shares of beneficial interest | | | 191,065,099 | | | | 6,061,039 | | | | 4,327 | |
| | | | | | | | | | | | |
Net asset value, offering and redemption price per share | | $ | 33.46 | | | $ | 12.09 | | | $ | 9.97 | * |
| | | | | | | | | | | | |
| * | Net asset value calculations have been determined utilizing fractional share and penny amounts. |
See accompanying notes to financial statements.
| 54
Statements of Assets and Liabilities (continued)
December 31, 2017
| | | | |
| | | Mirova Global
Sustainable
Equity Fund | |
ASSETS | | | | |
Investments at cost | | $ | 54,222,584 | |
Net unrealized appreciation | | | 12,994,063 | |
| | | | |
Investments at value | | | 67,216,647 | |
Foreign currency at value (identified cost $27,120) | | | 27,166 | |
Receivable for Fund shares sold | | | 596,496 | |
Receivable for securities sold | | | 660,072 | |
Dividends and interest receivable | | | 14,890 | |
Tax reclaims receivable | | | 32,159 | |
Prepaid expenses (Note 8) | | | 64 | |
| | | | |
TOTAL ASSETS | | | 68,547,494 | |
| | | | |
LIABILITIES | | | | |
Payable for Fund shares redeemed | | | 108 | |
Payable to custodian bank (Note 9) | | | 660,072 | |
Management fees payable (Note 6) | | | 37,913 | |
Deferred Trustees’ fees (Note 6) | | | 10,665 | |
Administrative fees payable (Note 6) | | | 2,518 | |
Payable to distributor (Note 6d) | | | 345 | |
Other accounts payable and accrued expenses | | | 50,718 | |
| | | | |
TOTAL LIABILITIES | | | 762,339 | |
| | | | |
NET ASSETS | | $ | 67,785,155 | |
| | | | |
NET ASSETS CONSIST OF: | | | | |
Paid-in capital | | $ | 54,303,201 | |
Distributions in excess of net investment income | | | (11,666 | ) |
Accumulated net realized gain on investments and foreign currency transactions | | | 497,802 | |
Net unrealized appreciation on investments and foreign currency translations | | | 12,995,818 | |
| | | | |
NET ASSETS | | $ | 67,785,155 | |
| | | | |
See accompanying notes to financial statements.
55 |
Statements of Assets and Liabilities (continued)
December 31, 2017
| | | | |
| | | Mirova Global
Sustainable
Equity Fund | |
COMPUTATION OF NET ASSET VALUE AND OFFERING PRICE: | | | | |
Class A shares: | | | | |
Net assets | | $ | 3,260,460 | |
| | | | |
Shares of beneficial interest | | | 255,354 | |
| | | | |
Net asset value and redemption price per share | | $ | 12.77 | |
| | | | |
Offering price per share (100/[100-maximum sales charge] of net asset value) (Note 1) | | $ | 13.55 | |
| | | | |
Class C shares: (redemption price per share is equal to net asset value less any applicable contingent deferred sales charge) (Note 1) | | | | |
Net assets | | $ | 1,164,399 | |
| | | | |
Shares of beneficial interest | | | 92,179 | |
| | | | |
Net asset value and offering price per share | | $ | 12.63 | |
| | | | |
Class N shares: | | | | |
Net assets | | $ | 1,149 | |
| | | | |
Shares of beneficial interest | | | 90 | |
| | | | |
Net asset value, offering and redemption price per share | | $ | 12.81 | * |
| | | | |
Class Y shares: | | | | |
Net assets | | $ | 63,359,147 | |
| | | | |
Shares of beneficial interest | | | 4,945,138 | |
| | | | |
Net asset value, offering and redemption price per share | | $ | 12.81 | |
| | | | |
| * | Net asset value calculations have been determined utilizing fractional share and penny amounts. |
See accompanying notes to financial statements.
| 56
Statements of Operations
For the Year Ended December 31, 2017
| | | | | | | | | | | | |
| | | Gateway
Fund | | | Gateway Equity
Call Premium
Fund | | | Mirova Global
Green Bond
Fund(a) | |
INVESTMENT INCOME | | | | | | | | | | | | |
Interest | | $ | 434,678 | | | $ | 3,894 | | | $ | 303,844 | |
Dividends | | | 171,654,582 | | | | 1,612,889 | | | | — | |
Less net foreign taxes withheld | | | (28,109 | ) | | | (867 | ) | | | (391 | ) |
| | | | | | | | | | | | |
| | | 172,061,151 | | | | 1,615,916 | | | | 303,453 | |
| | | | | | | | | | | | |
Expenses | | | | | | | | | | | | |
Management fees (Note 6) | | | 50,695,230 | | | | 512,391 | | | | 117,442 | |
Service and distribution fees (Note 6) | | | 7,812,527 | | | | 27,911 | | | | 75 | |
Administrative fees (Note 6) | | | 3,577,170 | | | | 35,101 | | | | 9,509 | |
Trustees’ fees and expenses (Note 6) | | | 302,828 | | | | 20,740 | | | | 14,490 | |
Transfer agent fees and expenses (Notes 6 and 7) | | | 5,705,737 | | | | 41,423 | | | | 1,610 | |
Audit and tax services fees | | | 52,474 | | | | 51,158 | | | | 41,961 | |
Custodian fees and expenses | | | 376,656 | | | | 54,432 | | | | 10,881 | |
Interest expense (Note 12) | | | — | | | | — | | | | 3,688 | |
Legal fees | | | 185,534 | | | | 1,693 | | | | 466 | |
Registration fees | | | 233,900 | | | | 93,238 | | | | 14,545 | |
Shareholder reporting expenses | | | 552,422 | | | | 4,909 | | | | 10,641 | |
Miscellaneous expenses (Note 8) | | | 228,169 | | | | 11,519 | | | | 13,861 | |
| | | | | | | | | | | | |
Total expenses | | | 69,722,647 | | | | 854,515 | | | | 239,169 | |
Less waiver and/or expense reimbursement (Note 6) | | | (5,872,615 | ) | | | (77,467 | ) | | | (96,593 | ) |
| | | | | | | | | | | | |
Net expenses | | | 63,850,032 | | | | 777,048 | | | | 142,576 | |
| | | | | | | | | | | | |
Net investment income | | | 108,211,119 | | | | 838,868 | | | | 160,877 | |
| | | | | | | | | | | | |
NET REALIZED AND UNREALIZED GAIN (LOSS) ON INVESTMENTS, FUTURES CONTRACTS, OPTIONS WRITTEN AND FOREIGN CURRENCY TRANSACTIONS | | | | | | | | | | | | |
Net realized gain (loss) on: | | | | | | | | | | | | |
Investments | | | 1,459,689,798 | | | | 1,830,668 | | | | 513,342 | |
Futures contracts | | | — | | | | — | | | | (1,381,457 | ) |
Options written | | | (562,013,864 | ) | | | (5,634,939 | ) | | | — | |
Foreign currency transactions (Note 2c) | | | 848 | | | | 22 | | | | 18,906 | |
Net change in unrealized appreciation (depreciation) on: | | | | | | | | | |
Investments | | | (234,657,166 | ) | | | 12,105,725 | | | | 1,350,618 | |
Futures contracts | | | — | | | | — | | | | (237,370 | ) |
Options written | | | (20,438,813 | ) | | | (159,664 | ) | | | — | |
Foreign currency translations (Note 2c) | | | (152 | ) | | | — | | | | 9,388 | |
| | | | | | | | | | | | |
Net realized and unrealized gain on investments, futures contracts, options written and foreign currency transactions | | | 642,580,651 | | | | 8,141,812 | | | | 273,427 | |
| | | | | | | | | | | | |
NET INCREASE IN NET ASSETS RESULTING FROM OPERATIONS | | $ | 750,791,770 | | | $ | 8,980,680 | | | $ | 434,304 | |
| | | | | | | | | | | | |
| (a) | From commencement of operations on February 28, 2017 through December 31, 2017. |
See accompanying notes to financial statements.
57 |
Statements of Operations (continued)
For the Year Ended December 31, 2017
| | | | |
| | | Mirova Global
Sustainable
Equity Fund | |
INVESTMENT INCOME | | | | |
Dividends | | $ | 834,421 | |
Interest | | | 7,420 | |
Less net foreign taxes withheld | | | (62,110 | ) |
| | | | |
| | | 779,731 | |
| | | | |
Expenses | | | | |
Management fees (Note 6) | | | 480,229 | |
Service and distribution fees (Note 6) | | | 5,223 | |
Administrative fees (Note 6) | | | 26,726 | |
Trustees’ fees and expenses (Note 6) | | | 17,606 | |
Transfer agent fees and expenses (Notes 6 and 7) | | | 15,944 | |
Audit and tax services fees | | | 43,532 | |
Custodian fees and expenses | | | 23,640 | |
Legal fees | | | 1,260 | |
Registration fees | | | 72,904 | |
Shareholder reporting expenses | | | 2,604 | |
Miscellaneous expenses (Note 8) | | | 13,700 | |
| | | | |
Total expenses | | | 703,368 | |
Less waiver and/or expense reimbursement (Note 6) | | | (73,419 | ) |
| | | | |
Net expenses | | | 629,949 | |
| | | | |
Net investment income | | | 149,782 | |
| | | | |
NET REALIZED AND UNREALIZED GAIN ON INVESTMENTS AND FOREIGN CURRENCY TRANSACTIONS | | | | |
Net realized gain on: | | | | |
Investments | | | 1,193,195 | |
Foreign currency transactions (Note 2c) | | | 4,104 | |
Net change in unrealized appreciation (depreciation) on: | | | | |
Investments | | | 14,325,525 | |
Foreign currency translations (Note 2c) | | | 2,912 | |
| | | | |
Net realized and unrealized gain on investments and foreign currency transactions | | | 15,525,736 | |
| | | | |
NET INCREASE IN NET ASSETS RESULTING FROM OPERATIONS | | $ | 15,675,518 | |
| | | | |
See accompanying notes to financial statements.
| 58
Statements of Changes in Net Assets
| | | | | | | | |
| | |
Gateway Fund | |
| | | Year Ended
December 31,
2017 | | | Year Ended
December 31,
2016 | |
FROM OPERATIONS: | | | | | | | | |
Net investment income | | $ | 108,211,119 | | | $ | 125,507,407 | |
Net realized gain on investments, options written and foreign currency transactions | | | 897,676,782 | | | | 322,163,349 | |
Net change in unrealized appreciation (depreciation) on investments, options written and foreign currency translations | | | (255,096,131 | ) | | | (11,608,461 | ) |
| | | | | | | | |
Net increase in net assets resulting from operations | | | 750,791,770 | | | | 436,062,295 | |
| | | | | | | | |
FROM DISTRIBUTIONS TO SHAREHOLDERS: | | | | | | | | |
Net investment income | | | | | | | | |
Class A | | | (18,006,320 | ) | | | (25,053,905 | ) |
Class C | | | (1,226,639 | ) | | | (2,443,921 | ) |
Class N(a) | | | (688,888 | ) | | | — | |
Class Y | | | (76,225,048 | ) | | | (97,909,866 | ) |
| | | | | | | | |
Total distributions | | | (96,146,895 | ) | | | (125,407,692 | ) |
| | | | | | | | |
NET INCREASE (DECREASE) IN NET ASSETS FROM CAPITAL SHARE TRANSACTIONS (NOTE 14) | | | 198,252,858 | | | | (902,825,602 | ) |
| | | | | | | | |
Net increase (decrease) in net assets | | | 852,897,733 | | | | (592,170,999 | ) |
NET ASSETS | | | | | | | | |
Beginning of the year | | | 7,672,167,999 | | | | 8,264,338,998 | |
| | | | | | | | |
End of the year | | $ | 8,525,065,732 | | | $ | 7,672,167,999 | |
| | | | | | | | |
UNDISTRIBUTED NET INVESTMENT INCOME | | $ | 7,177,681 | | | $ | 2,341,759 | |
| | | | | | | | |
| (a) | From commencement of Class operations on May 1, 2017 through December 31, 2017. |
See accompanying notes to financial statements.
59 |
Statements of Changes in Net Assets (continued)
| | | | | | | | |
| | | Gateway Equity Call
Premium Fund | |
| | | Year Ended
December 31,
2017 | | | Year Ended
December 31,
2016 | |
FROM OPERATIONS: | | | | | | | | |
Net investment income | | $ | 838,868 | | | $ | 804,901 | |
Net realized loss on investments, options written and foreign currency transactions | | | (3,804,249 | ) | | | (3,388,474 | ) |
Net change in unrealized appreciation (depreciation) on investments and options written | | | 11,946,061 | | | | 8,047,271 | |
| | | | | | | | |
Net increase in net assets resulting from operations | | | 8,980,680 | | | | 5,463,698 | |
| | | | | | | | |
FROM DISTRIBUTIONS TO SHAREHOLDERS: | | | | | | | | |
Net investment income | | | | | | | | |
Class A | | | (68,042 | ) | | | (57,801 | ) |
Class C | | | (534 | ) | | | (1,192 | ) |
Class N(a) | | | (9 | ) | | | — | |
Class Y | | | (756,852 | ) | | | (719,110 | ) |
| | | | | | | | |
Total distributions | | | (825,437 | ) | | | (778,103 | ) |
| | | | | | | | |
NET INCREASE IN NET ASSETS FROM CAPITAL SHARE TRANSACTIONS (NOTE 14) | | | 2,223,758 | | | | 11,698,686 | |
| | | | | | | | |
Net increase in net assets | | | 10,379,001 | | | | 16,384,281 | |
NET ASSETS | | | | | | | | |
Beginning of the year | | | 70,609,688 | | | | 54,225,407 | |
| | | | | | | | |
End of the year | | $ | 80,988,689 | | | $ | 70,609,688 | |
| | | | | | | | |
DISTRIBUTIONS IN EXCESS OF NET INVESTMENT INCOME | | $ | (29,596 | ) | | $ | (21,052 | ) |
| | | | | | | | |
| (a) | From commencement of Class operations on May 1, 2017 through December 31, 2017. |
See accompanying notes to financial statements.
| 60
Statements of Changes in Net Assets (continued)
| | | | |
| | | Mirova Global Green
Bond Fund | |
| | | Period Ended
December 31,
2017(a) | |
FROM OPERATIONS: | | | | |
Net investment income | | $ | 160,877 | |
Net realized loss on investments, futures contracts and foreign currency transactions | | | (849,209 | ) |
Net change in unrealized appreciation (depreciation) on investments, futures contracts and foreign currency translations | | | 1,122,636 | |
| | | | |
Net increase in net assets resulting from operations | | | 434,304 | |
| | | | |
FROM DISTRIBUTIONS TO SHAREHOLDERS: | | | | |
Net investment income | | | | |
Class A | | | (1,938 | ) |
Class N | | | (501,290 | ) |
Class Y | | | (675 | ) |
| | | | |
Total distributions | | | (503,903 | ) |
| | | | |
NET INCREASE IN NET ASSETS FROM CAPITAL SHARE TRANSACTIONS (NOTE 14) | | | 26,057,599 | |
| | | | |
Net increase in net assets | | | 25,988,000 | |
NET ASSETS | | | | |
Beginning of the year | | | — | |
| | | | |
End of the year | | $ | 25,988,000 | |
| | | | |
UNDISTRIBUTED NET INVESTMENT INCOME | | $ | 194,112 | |
| | | | |
| (a) | From commencement of operations on February 28, 2017 through December 31, 2017. |
See accompanying notes to financial statements.
61 |
Statements of Changes in Net Assets (continued)
| | | | | | | | |
| | | Mirova Global Sustainable
Equity Fund | |
| | | Year Ended
December 31,
2017 | | | Period Ended
December 31,
2016(a) | |
FROM OPERATIONS: | | | | | | | | |
Net investment income | | $ | 149,782 | | | $ | 92,791 | |
Net realized gain (loss) on investments and foreign currency transactions | | | 1,197,299 | | | | (110,685 | ) |
Net change in unrealized appreciation (depreciation) on investments and foreign currency translations | | | 14,328,437 | | | | (1,332,619 | ) |
| | | | | | | | |
Net increase (decrease) in net assets resulting from operations | | | 15,675,518 | | | | (1,350,513 | ) |
| | | | | | | | |
FROM DISTRIBUTIONS TO SHAREHOLDERS: | | | | | | | | |
Net investment income | | | | | | | | |
Class A | | | (6,999 | ) | | | (24 | ) |
Class N(b) | | | (3 | ) | | | — | |
Class Y | | | (148,952 | ) | | | (43,472 | ) |
Net realized capital gains | | | | | | | | |
Class A | | | (29,257 | ) | | | (81 | ) |
Class C | | | (10,251 | ) | | | (60 | ) |
Class N(b) | | | (10 | ) | | | — | |
Class Y | | | (563,786 | ) | | | (56,464 | ) |
| | | | | | | | |
Total distributions | | | (759,258 | ) | | | (100,101 | ) |
| | | | | | | | |
NET INCREASE IN NET ASSETS FROM CAPITAL SHARE TRANSACTIONS (NOTE 14) | | | 3,152,882 | | | | 51,166,627 | |
| | | | | | | | |
Net increase in net assets | | | 18,069,142 | | | | 49,716,013 | |
NET ASSETS | | | | | | | | |
Beginning of the year | | | 49,716,013 | | | | — | |
| | | | | | | | |
End of the year | | $ | 67,785,155 | | | $ | 49,716,013 | |
| | | | | | | | |
DISTRIBUTIONS IN EXCESS OF NET INVESTMENT INCOME | | $ | (11,666 | ) | | $ | (9,340 | ) |
| | | | | | | | |
| (a) | From commencement of operations on March 31, 2016 through December 31, 2016. |
| (b) | From commencement of Class operations on May 1, 2017 through December 31, 2017. |
See accompanying notes to financial statements.
| 62
Financial Highlights
For a share outstanding throughout each period.
| | | | | | | | | | | | | | | | | | | | |
| | |
Gateway Fund—Class A | |
| | | Year Ended
December 31,
2017 | | | Year Ended
December 31,
2016 | | | Year Ended
December 31,
2015 | | | Year Ended
December 31,
2014 | | | Year Ended
December 31,
2013 | |
Net asset value, beginning of the period | | $ | 30.84 | | | $ | 29.72 | | | $ | 29.58 | | | $ | 29.00 | | | $ | 27.13 | |
| | | | | | | | | | | | | | | | | | | | |
INCOME (LOSS) FROM INVESTMENT OPERATIONS: | | | | | | | | | | | | | | | | | | | | |
Net investment income(a) | | | 0.39 | | | | 0.41 | | | | 0.57 | (b) | | | 0.39 | | | | 0.43 | |
Net realized and unrealized gain (loss) | | | 2.58 | | | | 1.13 | | | | 0.12 | | | | 0.57 | | | | 1.82 | |
| | | | | | | | | | | | | | | | | | | | |
Total from Investment Operations | | | 2.97 | | | | 1.54 | | | | 0.69 | | | | 0.96 | | | | 2.25 | |
| | | | | | | | | | | | | | | | | | | | |
LESS DISTRIBUTIONS FROM: | | | | | | | | | | | | | | | | | | | | |
Net investment income | | | (0.34 | ) | | | (0.42 | ) | | | (0.55 | ) | | | (0.38 | ) | | | (0.38 | ) |
| | | | | | | | | | | | | | | | | | | | |
Net asset value, end of the period | | $ | 33.47 | | | $ | 30.84 | | | $ | 29.72 | | | $ | 29.58 | | | $ | 29.00 | |
| | | | | | | | | | | | | | | | | | | | |
Total return(c)(d) | | | 9.66 | % | | | 5.23 | % | | | 2.34 | % | | | 3.33 | % | | | 8.39 | % |
RATIOS TO AVERAGE NET ASSETS: | | | | | | | | | | | | | | | | | | | | |
Net assets, end of the period (000’s) | | $ | 1,669,272 | | | $ | 1,755,576 | | | $ | 1,864,118 | | | $ | 1,976,457 | | | $ | 2,351,788 | |
Net expenses(e) | | | 0.94 | % | | | 0.94 | % | | | 0.94 | % | | | 0.94 | % | | | 0.94 | % |
Gross expenses | | | 1.02 | % | | | 1.02 | % | | | 1.01 | % | | | 1.02 | % | | | 1.03 | % |
Net investment income | | | 1.20 | % | | | 1.39 | % | | | 1.91 | %(b) | | | 1.33 | % | | | 1.51 | % |
Portfolio turnover rate | | | 34 | % | | | 14 | % | | | 10 | % | | | 13 | % | | | 10 | % |
| (a) | Per share net investment income has been calculated using the average shares outstanding during the period. |
| (b) | Includes a non-recurring dividend. Without this dividend, net investment income per share would have been $0.37, and the ratio of net investment income to average net assets would have been 1.24%. |
| (c) | Had certain expenses not been waived/reimbursed during the period, total returns would have been lower. |
| (d) | A sales charge for Class A shares is not reflected in total return calculations. |
| (e) | The investment adviser agreed to waive its fees and/or reimburse a portion of the Fund’s expenses during the period. Without this waiver/reimbursement, expenses would have been higher. |
See accompanying notes to financial statements.
63 |
Financial Highlights (continued)
For a share outstanding throughout each period.
| | | | | | | | | | | | | | | | | | | | |
| | |
Gateway Fund—Class C | |
| | | Year Ended
December 31,
2017 | | | Year Ended
December 31,
2016 | | | Year Ended
December 31,
2015 | | | Year Ended
December 31,
2014 | | | Year Ended
December 31,
2013 | |
Net asset value, beginning of the period | | $ | 30.72 | | | $ | 29.61 | | | $ | 29.48 | | | $ | 28.90 | | | $ | 27.04 | |
| | | | | | | | | | | | | | | | | | | | |
INCOME (LOSS) FROM INVESTMENT OPERATIONS: | | | | | | | | | | | | | | | | | | | | |
Net investment income(a) | | | 0.14 | | | | 0.19 | | | | 0.34 | (b) | | | 0.17 | | | | 0.21 | |
Net realized and unrealized gain (loss) | | | 2.57 | | | | 1.11 | | | | 0.12 | | | | 0.57 | | | | 1.82 | |
| | | | | | | | | | | | | | | | | | | | |
Total from Investment Operations | | | 2.71 | | | | 1.30 | | | | 0.46 | | | | 0.74 | | | | 2.03 | |
| | | | | | | | | | | | | | | | | | | | |
LESS DISTRIBUTIONS FROM: | | | | | | | | | | | | | | | | | | | | |
Net investment income | | | (0.11 | ) | | | (0.19 | ) | | | (0.33 | ) | | | (0.16 | ) | | | (0.17 | ) |
| | | | | | | | | | | | | | | | | | | | |
Net asset value, end of the period | | $ | 33.32 | | | $ | 30.72 | | | $ | 29.61 | | | $ | 29.48 | | | $ | 28.90 | |
| | | | | | | | | | | | | | | | | | | | |
Total return(c)(d) | | | 8.85 | % | | | 4.42 | % | | | 1.54 | % | | | 2.58 | % | | | 7.58 | % |
RATIOS TO AVERAGE NET ASSETS: | | | | | | | | | | | | | | | | | | | | |
Net assets, end of the period (000’s) | | $ | 336,891 | | | $ | 366,584 | | | $ | 387,235 | | | $ | 353,339 | | | $ | 331,465 | |
Net expenses(e) | | | 1.70 | % | | | 1.70 | % | | | 1.70 | % | | | 1.70 | % | | | 1.70 | % |
Gross expenses | | | 1.77 | % | | | 1.77 | % | | | 1.76 | % | | | 1.77 | % | | | 1.78 | % |
Net investment income | | | 0.44 | % | | | 0.63 | % | | | 1.15 | %(b) | | | 0.57 | % | | | 0.75 | % |
Portfolio turnover rate | | | 34 | % | | | 14 | % | | | 10 | % | | | 13 | % | | | 10 | % |
| (a) | Per share net investment income has been calculated using the average shares outstanding during the period. |
| (b) | Includes a non-recurring dividend. Without this dividend, net investment income per share would have been $0.15, and the ratio of net investment income to average net assets would have been 0.51%. |
| (c) | Had certain expenses not been waived/reimbursed during the period, total returns would have been lower. |
| (d) | A contingent deferred sales charge for Class C shares is not reflected in total return calculations. |
| (e) | The investment adviser agreed to waive its fees and/or reimburse a portion of the Fund’s expenses during the period. Without this waiver/reimbursement, expenses would have been higher. |
See accompanying notes to financial statements.
| 64
Financial Highlights (continued)
For a share outstanding throughout each period.
| | | | |
| | |
Gateway Fund—Class N | |
| | | Period Ended
December 31,
2017* | |
Net asset value, beginning of the period | | $ | 31.89 | |
| | | | |
INCOME (LOSS) FROM INVESTMENT OPERATIONS: | | | | |
Net investment income(a) | | | 0.32 | |
Net realized and unrealized gain (loss) | | | 1.56 | |
| | | | |
Total from Investment Operations | | | 1.88 | |
| | | | |
LESS DISTRIBUTIONS FROM: | | | | |
Net investment income | | | (0.31 | ) |
| | | | |
Net asset value, end of the period | | $ | 33.46 | |
| | | | |
Total return(b)(c) | | | 5.93 | % |
RATIOS TO AVERAGE NET ASSETS: | | | | |
Net assets, end of the period (000’s) | | $ | 126,262 | |
Net expenses(d)(e) | | | 0.65 | % |
Gross expenses(e) | | | 0.74 | % |
Net investment income(e) | | | 1.42 | % |
Portfolio turnover rate(f) | | | 34 | % |
| * | From commencement of Class operations on May 1, 2017 through December 31, 2017. |
| (a) | Per share net investment income has been calculated using the average shares outstanding during the period. |
| (b) | Had certain expenses not been waived/reimbursed during the period, total returns would have been lower. |
| (c) | Periods less than one year are not annualized. |
| (d) | The investment adviser agreed to waive its fees and/or reimburse a portion of the Fund’s expenses during the period. Without this waiver/reimbursement, expenses would have been higher. |
| (e) | Computed on an annualized basis for periods less than one year. |
| (f) | Represents the Fund’s portfolio turnover rate for the year ended December 31, 2017. |
See accompanying notes to financial statements.
65 |
Financial Highlights (continued)
For a share outstanding throughout each period.
| | | | | | | | | | | | | | | | | | | | |
| | |
Gateway Fund—Class Y | |
| | | Year Ended
December 31,
2017
| | | Year Ended
December 31,
2016
| | | Year Ended
December 31,
2015
| | | Year Ended
December 31,
2014
| | | Year Ended
December 31,
2013
| |
Net asset value, beginning of the period | | $ | 30.83 | | | $ | 29.71 | | | $ | 29.57 | | | $ | 28.99 | | | $ | 27.12 | |
| | | | | | | | | | | | | | | | | | | | |
INCOME (LOSS) FROM INVESTMENT OPERATIONS: | | | | | | | | | | | | | | | | | | | | |
Net investment income(a) | | | 0.47 | | | | 0.49 | | | | 0.64 | (b) | | | 0.46 | | | | 0.50 | |
Net realized and unrealized gain (loss) | | | 2.58 | | | | 1.12 | | | | 0.12 | | | | 0.57 | | | | 1.82 | |
| | | | | | | | | | | | | | | | | | | | |
Total from Investment Operations | | | 3.05 | | | | 1.61 | | | | 0.76 | | | | 1.03 | | | | 2.32 | |
| | | | | | | | | | | | | | | | | | | | |
LESS DISTRIBUTIONS FROM: | | | | | | | | | | | | | | | | | | | | |
Net investment income | | | (0.42 | ) | | | (0.49 | ) | | | (0.62 | ) | | | (0.45 | ) | | | (0.45 | ) |
| | | | | | | | | | | | | | | | | | | | |
Net asset value, end of the period | | $ | 33.46 | | | $ | 30.83 | | | $ | 29.71 | | | $ | 29.57 | | | $ | 28.99 | |
| | | | | | | | | | | | | | | | | | | | |
Total return(c) | | | 9.93 | % | | | 5.48 | % | | | 2.59 | % | | | 3.58 | % | | | 8.65 | % |
RATIOS TO AVERAGE NET ASSETS: | | | | | | | | | | | | | | | | | | | | |
Net assets, end of the period (000’s) | | $ | 6,392,640 | | | $ | 5,550,008 | | | $ | 6,012,987 | | | $ | 5,814,900 | | | $ | 5,520,003 | |
Net expenses(d) | | | 0.70 | % | | | 0.70 | % | | | 0.70 | % | | | 0.70 | % | | | 0.70 | % |
Gross expenses | | | 0.77 | % | | | 0.77 | % | | | 0.76 | % | | | 0.77 | % | | | 0.78 | % |
Net investment income | | | 1.44 | % | | | 1.63 | % | | | 2.16 | %(b) | | | 1.57 | % | | | 1.76 | % |
Portfolio turnover rate | | | 34 | % | | | 14 | % | | | 10 | % | | | 13 | % | | | 10 | % |
| (a) | Per share net investment income has been calculated using the average shares outstanding during the period. |
| (b) | Includes a non-recurring dividend. Without this dividend, net investment income per share would have been $0.45, and the ratio of net investment income to average net assets would have been 1.51%. |
| (c) | Had certain expenses not been waived/reimbursed during the period, total returns would have been lower. |
| (d) | The investment adviser agreed to waive its fees and/or reimburse a portion of the Fund’s expenses during the period. Without this waiver/reimbursement, expenses would have been higher. |
See accompanying notes to financial statements.
| 66
Financial Highlights (continued)
For a share outstanding throughout each period.
| | | | | | | | | | | | | | | | |
| | |
Gateway Equity Call Premium Fund—Class A | |
| | | Year Ended
December 31,
2017
| | | Year Ended
December 31,
2016
| | | Year Ended
December 31,
2015
| | | Period Ended
December 31,
2014*
| |
Net asset value, beginning of the period | | $ | 10.89 | | | $ | 10.22 | | | $ | 9.96 | | | $ | 10.00 | |
| | | | | | | | | | | | | | | | |
INCOME (LOSS) FROM INVESTMENT OPERATIONS: | | | | | | | | | | | | | | | | |
Net investment income(a) | | | 0.10 | | | | 0.11 | | | | 0.15 | (b) | | | 0.02 | |
Net realized and unrealized gain (loss) | | | 1.18 | | | | 0.66 | | | | 0.24 | | | | (0.02 | ) |
| | | | | | | | | | | | | | | | |
Total from Investment Operations | | | 1.28 | | | | 0.77 | | | | 0.39 | | | | 0.00 | (c) |
| | | | | | | | | | | | | | | | |
LESS DISTRIBUTIONS FROM: | | | | | | | | | | | | | | | | |
Net investment income | | | (0.09 | ) | | | (0.10 | ) | | | (0.13 | ) | | | (0.04 | ) |
| | | | | | | | | | | | | | | | |
Net asset value, end of the period | | $ | 12.08 | | | $ | 10.89 | | | $ | 10.22 | | | $ | 9.96 | |
| | | | | | | | | | | | | | | | |
Total return(d)(e) | | | 11.80 | % | | | 7.58 | % | | | 3.90 | % | | | 0.00 | %(f) |
RATIOS TO AVERAGE NET ASSETS: | | | | | | | | | | | | | | | | |
Net assets, end of the period (000’s) | | $ | 7,085 | | | $ | 6,507 | | | $ | 3,855 | | | $ | 96 | |
Net expenses(g) | | | 1.20 | % | | | 1.20 | % | | | 1.20 | % | | | 1.20 | %(h) |
Gross expenses | | | 1.30 | % | | | 1.31 | % | | | 1.70 | % | | | 3.69 | %(h) |
Net investment income | | | 0.85 | % | | | 1.02 | % | | | 1.47 | %(b) | | | 0.84 | %(h) |
Portfolio turnover rate | | | 19 | % | | | 24 | % | | | 38 | % | | | 7 | % |
| * | From commencement of operations on September 30, 2014 through December 31, 2014. |
| (a) | Per share net investment income has been calculated using the average shares outstanding during the period. |
| (b) | Includes a non-recurring dividend. Without this dividend, net investment income per share would have been $0.10 and the ratio of net investment income to average net assets would have been 0.98%. |
| (c) | Amount rounds to less than $0.01 per share. |
| (d) | A sales charge for Class A shares is not reflected in total return calculations. |
| (e) | Had certain expenses not been waived/reimbursed during the period, total returns would have been lower. |
| (f) | Periods less than one year are not annualized. |
| (g) | The investment adviser agreed to waive its fees and/or reimburse a portion of the Fund’s expenses during the period. Without this waiver/reimbursement, expenses would have been higher. |
| (h) | Computed on an annualized basis for periods less than one year. |
See accompanying notes to financial statements.
67 |
Financial Highlights (continued)
For a share outstanding throughout each period.
| | | | | | | | | | | | | | | | |
| | |
Gateway Equity Call Premium Fund—Class C | |
| | | Year Ended
December 31,
2017 | | | Year Ended
December 31,
2016 | | | Year Ended
December 31,
2015 | | | Period Ended
December 31,
2014* | |
Net asset value, beginning of the period | | $ | 10.87 | | | $ | 10.22 | | | $ | 9.97 | | | $ | 10.00 | |
| | | | | | | | | | | | | | | | |
INCOME (LOSS) FROM INVESTMENT OPERATIONS: | | | | | | | | | | | | | | | | |
Net investment income(a) | | | 0.01 | | | | 0.02 | | | | 0.09 | (b) | | | 0.00 | (c) |
Net realized and unrealized gain (loss) | | | 1.18 | | | | 0.68 | | | | 0.22 | | | | (0.01 | ) |
| | | | | | | | | | | | | | | | |
Total from Investment Operations | | | 1.19 | | | | 0.70 | | | | 0.31 | | | | (0.01 | ) |
| | | | | | | | | | | | | | | | |
LESS DISTRIBUTIONS FROM: | | | | | | | | | | | | | | | | |
Net investment income | | | (0.01 | ) | | | (0.05 | ) | | | (0.06 | ) | | | (0.02 | ) |
| | | | | | | | | | | | | | | | |
Net asset value, end of the period | | $ | 12.05 | | | $ | 10.87 | | | $ | 10.22 | | | $ | 9.97 | |
| | | | | | | | | | | | | | | | |
Total return(d)(e) | | | 10.95 | % | | | 6.85 | % | | | 3.07 | % | | | (0.12 | )%(f) |
RATIOS TO AVERAGE NET ASSETS: | | | | | | | | | | | | | | | | |
Net assets, end of the period (000’s) | | $ | 648 | | | $ | 524 | | | $ | 37 | | | $ | 1 | |
Net expenses(g) | | | 1.95 | % | | | 1.95 | % | | | 1.95 | % | | | 1.95 | %(h) |
Gross expenses | | | 2.05 | % | | | 1.98 | % | | | 2.40 | % | | | 4.37 | %(h) |
Net investment income | | | 0.10 | % | | | 0.23 | % | | | 0.85 | %(b) | | | 0.01 | %(h) |
Portfolio turnover rate | | | 19 | % | | | 24 | % | | | 38 | % | | | 7 | % |
| * | From commencement of operations on September 30, 2014 through December 31, 2014. |
| (a) | Per share net investment income has been calculated using the average shares outstanding during the period. |
| (b) | Includes a non-recurring dividend. Without this dividend, net investment income per share would have been $0.07 and the ratio of net investment income to average net assets would have been 0.72%. |
| (c) | Amount rounds to less than $0.01 per share. |
| (d) | A contingent deferred sales charge for Class C shares is not reflected in total return calculations. |
| (e) | Had certain expenses not been waived/reimbursed during the period, total returns would have been lower. |
| (f) | Periods less than one year are not annualized. |
| (g) | The investment adviser agreed to waive its fees and/or reimburse a portion of the Fund’s expenses during the period. Without this waiver/reimbursement, expenses would have been higher. |
| (h) | Computed on an annualized basis for periods less than one year. |
See accompanying notes to financial statements.
| 68
Financial Highlights (continued)
For a share outstanding throughout each period.
| | | | |
| | | Gateway Equity
Call Premium
Fund—Class N | |
| | | Period Ended
December 31,
2017* | |
Net asset value, beginning of the period | | $ | 11.34 | |
| | | | |
INCOME (LOSS) FROM INVESTMENT OPERATIONS: | | | | |
Net investment income(a) | | | 0.10 | |
Net realized and unrealized gain (loss) | | | 0.75 | |
| | | | |
Total from Investment Operations | | | 0.85 | |
| | | | |
LESS DISTRIBUTIONS FROM: | | | | |
Net investment income | | | (0.10 | ) |
| | | | |
Net asset value, end of the period | | $ | 12.09 | |
| | | | |
Total return(b)(c) | | | 7.50 | % |
RATIOS TO AVERAGE NET ASSETS: | | | | |
Net assets, end of the period (000’s) | | $ | 1 | |
Net expenses(d)(e) | | | 0.90 | % |
Gross expenses(e) | | | 14.26 | % |
Net investment income(e) | | | 1.22 | % |
Portfolio turnover rate(f) | | | 19 | % |
| * | From commencement of Class operations on May 1, 2017 through December 31, 2017. |
| (a) | Per share net investment income has been calculated using the average shares outstanding during the period. |
| (b) | Had certain expenses not been waived/reimbursed during the period, total returns would have been lower. |
| (c) | Periods less than one year are not annualized. |
| (d) | The investment adviser agreed to waive its fees and/or reimburse a portion of the Fund’s expenses during the period. Without this waiver/reimbursement, expenses would have been higher. |
| (e) | Computed on an annualized basis for periods less than one year. |
| (f) | Represents the Fund’s portfolio turnover rate for the year ended December 31, 2017. |
See accompanying notes to financial statements.
69 |
Financial Highlights (continued)
For a share outstanding throughout each period.
| | | | | | | | | | | | | | | | |
| | |
Gateway Equity Call Premium Fund—Class Y | |
| | | Year Ended
December 31,
2017 | | | Year Ended
December 31,
2016 | | | Year Ended
December 31,
2015 | | | Period Ended
December 31,
2014* | |
Net asset value, beginning of the period | | $ | 10.89 | | | $ | 10.22 | | | $ | 9.97 | | | $ | 10.00 | |
| | | | | | | | | | | | | | | | |
INCOME (LOSS) FROM INVESTMENT OPERATIONS: | | | | | | | | | | | | | | | | |
Net investment income(a) | | | 0.13 | | | | 0.13 | | | | 0.16 | (b) | | | 0.02 | |
Net realized and unrealized gain (loss) | | | 1.19 | | | | 0.67 | | | | 0.24 | | | | (0.01 | ) |
| | | | | | | | | | | | | | | | |
Total from Investment Operations | | | 1.32 | | | | 0.80 | | | | 0.40 | | | | 0.01 | |
| | | | | | | | | | | | | | | | |
LESS DISTRIBUTIONS FROM: | | | | | | | | | | | | | | | | |
Net investment income | | | (0.12 | ) | | | (0.13 | ) | | | (0.15 | ) | | | (0.04 | ) |
| | | | | | | | | | | | | | | | |
Net asset value, end of the period | | $ | 12.09 | | | $ | 10.89 | | | $ | 10.22 | | | $ | 9.97 | |
| | | | | | | | | | | | | | | | |
Total return(c) | | | 12.21 | % | | | 7.83 | % | | | 4.03 | % | | | 0.13 | %(d) |
RATIOS TO AVERAGE NET ASSETS: | | | | | | | | | | | | | | | | |
Net assets, end of the period (000’s) | | $ | 73,255 | | | $ | 63,578 | | | $ | 50,334 | | | $ | 20,815 | |
Net expenses(e) | | | 0.95 | % | | | 0.95 | % | | | 0.95 | % | | | 0.95 | %(f) |
Gross expenses | | | 1.05 | % | | | 1.06 | % | | | 1.45 | % | | | 3.54 | %(f) |
Net investment income | | | 1.10 | % | | | 1.27 | % | | | 1.59 | %(b) | | | 0.99 | %(f) |
Portfolio turnover rate | | | 19 | % | | | 24 | % | | | 38 | % | | | 7 | % |
| * | From commencement of operations on September 30, 2014 through December 31, 2014. |
| (a) | Per share net investment income has been calculated using the average shares outstanding during the period. |
| (b) | Includes a non-recurring dividend. Without this dividend, net investment income per share would have been $0.12 and the ratio of net investment income to average net assets would have been 1.20%. |
| (c) | Had certain expenses not been waived/reimbursed during the period, total returns would have been lower. |
| (d) | Periods less than one year are not annualized. |
| (e) | The investment adviser agreed to waive its fees and/or reimburse a portion of the Fund’s expenses during the period. Without this waiver/reimbursement, expenses would have been higher. |
| (f) | Computed on an annualized basis for periods less than one year. |
See accompanying notes to financial statements.
| 70
Financial Highlights (continued)
For a share outstanding throughout each period.
| | | | |
| | | Mirova Global
Green
Bond—Class A | |
| | | Period Ended
December 31,
2017* | |
Net asset value, beginning of the period | | $ | 10.00 | |
| | | | |
INCOME (LOSS) FROM INVESTMENT OPERATIONS: | | | | |
Net investment income(a) | | | 0.04 | |
Net realized and unrealized gain (loss) | | | 0.11 | |
| | | | |
Total from Investment Operations | | | 0.15 | |
| | | | |
LESS DISTRIBUTIONS FROM: | | | | |
Net investment income | | | (0.19 | ) |
| | | | |
Net asset value, end of the period | | $ | 9.96 | |
| | | | |
Total return(b)(c)(d) | | | 1.46 | % |
RATIOS TO AVERAGE NET ASSETS: | | | | |
Net assets, end of the period (000’s) | | $ | 139 | |
Net expenses(e)(f) | | | 0.96 | %(g) |
Gross expenses(f) | | | 5.23 | %(g) |
Net investment income(f) | | | 0.49 | % |
Portfolio turnover rate | | | 46 | % |
| * | From commencement of operations on February 28, 2017 through December 31, 2017. |
| (a) | Per share net investment income has been calculated using the average shares outstanding during the period. |
| (b) | A sales charge for Class A shares is not reflected in total return calculations. |
| (c) | Had certain expenses not been waived/reimbursed during the period, total returns would have been lower. |
| (d) | Periods less than one year are not annualized. |
| (e) | The investment adviser agreed to waive its fees and/or reimburse a portion of the Fund’s expenses during the period. Without this waiver/reimbursement, expenses would have been higher. |
| (f) | Computed on an annualized basis for periods less than one year. |
| (g) | Includes interest expense. Without this expense the ratio of net expenses would have been 0.95% and the ratio of gross expenses would have been 5.22%. |
See accompanying notes to financial statements.
71 |
Financial Highlights (continued)
For a share outstanding throughout each period.
| | | | |
| | | Mirova Global
Green
Bond—Class N | |
| | | Period Ended
December 31,
2017* | |
Net asset value, beginning of the period | | $ | 10.00 | |
| | | | |
INCOME (LOSS) FROM INVESTMENT OPERATIONS: | | | | |
Net investment income(a) | | | 0.06 | |
Net realized and unrealized gain (loss) | | | 0.12 | |
| | | | |
Total from Investment Operations | | | 0.18 | |
| | | | |
LESS DISTRIBUTIONS FROM: | | | | |
Net investment income | | | (0.20 | ) |
| | | | |
Net asset value, end of the period | | $ | 9.98 | |
| | | | |
Total return(b)(c) | | | 1.77 | % |
RATIOS TO AVERAGE NET ASSETS: | | | | |
Net assets, end of the period (000’s) | | $ | 25,805 | |
Net expenses(d)(e) | | | 0.67 | %(f) |
Gross expenses(e) | | | 1.11 | %(f) |
Net investment income(e) | | | 0.75 | % |
Portfolio turnover rate | | | 46 | % |
| * | From commencement of operations on February 28, 2017 through December 31, 2017. |
| (a) | Per share net investment income has been calculated using the average shares outstanding during the period. |
| (b) | Had certain expenses not been waived/reimbursed during the period, total returns would have been lower. |
| (c) | Periods less than one year are not annualized. |
| (d) | The investment adviser agreed to waive its fees and/or reimburse a portion of the Fund’s expenses during the period. Without this waiver/reimbursement, expenses would have been higher. |
| (e) | Computed on an annualized basis for periods less than one year. |
| (f) | Includes interest expense. Without this expense the ratio of net expenses would have been 0.65% and the ratio of gross expenses would have been 1.10%. |
See accompanying notes to financial statements.
| 72
Financial Highlights (continued)
For a share outstanding throughout each period.
| | | | |
| | | Mirova Global
Green
Bond—Class Y | |
| | | Period Ended
December 31,
2017* | |
Net asset value, beginning of the period | | $ | 10.00 | |
| | | | |
INCOME (LOSS) FROM INVESTMENT OPERATIONS: | | | | |
Net investment income(a) | | | 0.06 | |
Net realized and unrealized gain (loss) | | | 0.11 | |
| | | | |
Total from Investment Operations | | | 0.17 | |
| | | | |
LESS DISTRIBUTIONS FROM: | | | | |
Net investment income | | | (0.20 | ) |
| | | | |
Net asset value, end of the period | | $ | 9.97 | |
| | | | |
Total return(b)(c) | | | 1.66 | % |
RATIOS TO AVERAGE NET ASSETS: | | | | |
Net assets, end of the period (000’s) | | $ | 43 | |
Net expenses(d)(e) | | | 0.71 | %(f) |
Gross expenses(e) | | | 3.62 | %(f) |
Net investment income(e) | | | 0.71 | % |
Portfolio turnover rate | | | 46 | % |
| * | From commencement of operations on February 28, 2017 through December 31, 2017. |
| (a) | Per share net investment income has been calculated using the average shares outstanding during the period. |
| (b) | Had certain expenses not been waived/reimbursed during the period, total returns would have been lower. |
| (c) | Periods less than one year are not annualized. |
| (d) | The investment adviser agreed to waive its fees and/or reimburse a portion of the Fund’s expenses during the period. Without this waiver/reimbursement, expenses would have been higher. |
| (e) | Computed on an annualized basis for periods less than one year. |
| (f) | Includes interest expense. Without this expense the ratio of net expenses would have been 0.70% and the ratio of gross expenses would have been 3.62%. |
See accompanying notes to financial statements.
73 |
Financial Highlights (continued)
For a share outstanding throughout each period.
| | | | | | | | |
| | |
Mirova Global Sustainable
Equity Fund—Class A | |
| | | Year Ended
December 31,
2017 | | | Period Ended
December 31,
2016* | |
Net asset value, beginning of the period | | $ | 9.90 | | | $ | 10.00 | |
| | | | | | | | |
INCOME (LOSS) FROM INVESTMENT OPERATIONS: | | | | | | | | |
Net investment income (loss)(a) | | | (0.04 | ) | | | 0.02 | |
Net realized and unrealized gain (loss) | | | 3.06 | | | | (0.11 | ) |
| | | | | | | | |
Total from Investment Operations | | | 3.02 | | | | (0.09 | ) |
| | | | | | | | |
LESS DISTRIBUTIONS FROM: | | | | | | | | |
Net investment income | | | (0.03 | ) | | | (0.00 | )(b) |
Net realized capital gains | | | (0.12 | ) | | | (0.01 | ) |
| | | | | | | | |
Total Distributions | | | (0.15 | ) | | | (0.01 | ) |
| | | | | | | | |
Net asset value, end of the period | | $ | 12.77 | | | $ | 9.90 | |
| | | | | | | | |
Total return(c)(d) | | | 30.44 | % | | | (0.85 | )%(e) |
RATIOS TO AVERAGE NET ASSETS: | | | | | | | | |
Net assets, end of the period (000’s) | | $ | 3,260 | | | $ | 71 | |
Net expenses(f) | | | 1.29 | % | | | 1.30 | %(g) |
Gross expenses | | | 1.43 | % | | | 1.72 | %(g) |
Net investment income (loss) | | | (0.36 | )% | | | 0.23 | %(g) |
Portfolio turnover rate | | | 20 | % | | | 20 | % |
| * | From commencement of operations on March 31, 2016 through December 31, 2016. |
| (a) | Per share net investment income has been calculated using the average shares outstanding during the period. |
| (b) | Amount rounds to less than $0.01 per share. |
| (c) | A sales charge for Class A shares is not reflected in total return calculations. |
| (d) | Had certain expenses not been waived/reimbursed during the period, total returns would have been lower. |
| (e) | Periods less than one year are not annualized. |
| (f) | The investment adviser agreed to waive its fees and/or reimburse a portion of the Fund’s expenses during the period. Without this waiver/reimbursement, expenses would have been higher. |
| (g) | Computed on an annualized basis for periods less than one year. |
See accompanying notes to financial statements.
| 74
Financial Highlights (continued)
For a share outstanding throughout each period.
| | | | | | | | |
| | |
Mirova Global Sustainable
Equity Fund—Class C | |
| | | Year Ended
December 31,
2017 | | | Period Ended
December 31,
2016* | |
Net asset value, beginning of the period | | $ | 9.85 | | | $ | 10.00 | |
| | | | | | | | |
INCOME (LOSS) FROM INVESTMENT OPERATIONS: | | | | | | | | |
Net investment loss(a) | | | (0.12 | ) | | | (0.06 | ) |
Net realized and unrealized gain (loss) | | | 3.02 | | | | (0.08 | ) |
| | | | | | | | |
Total from Investment Operations | | | 2.90 | | | | (0.14 | ) |
| | | | | | | | |
LESS DISTRIBUTIONS FROM: | | | | | | | | |
Net realized capital gains | | | (0.12 | ) | | | (0.01 | ) |
| | | | | | | | |
Net asset value, end of the period | | $ | 12.63 | | | $ | 9.85 | |
| | | | | | | | |
Total return(b)(c) | | | 29.40 | % | | | (1.39 | )%(d) |
RATIOS TO AVERAGE NET ASSETS: | | | | | | | | |
Net assets, end of the period (000’s) | | $ | 1,164 | | | $ | 52 | |
Net expenses(e) | | | 2.04 | % | | | 2.05 | %(f) |
Gross expenses | | | 2.18 | % | | | 2.20 | %(f) |
Net investment loss | | | (1.02 | )% | | | (0.77 | )%(f) |
Portfolio turnover rate | | | 20 | % | | | 20 | % |
| * | From commencement of operations on March 31, 2016 through December 31, 2016. |
| (a) | Per share net investment income has been calculated using the average shares outstanding during the period. |
| (b) | A contingent deferred sales charge for Class C shares is not reflected in total return calculations. |
| (c) | Had certain expenses not been waived/reimbursed during the period, total returns would have been lower. |
| (d) | Periods less than one year are not annualized. |
| (e) | The investment adviser agreed to waive its fees and/or reimburse a portion of the Fund’s expenses during the period. Without this waiver/reimbursement, expenses would have been higher. |
| (f) | Computed on an annualized basis for periods less than one year. |
See accompanying notes to financial statements.
75 |
Financial Highlights (continued)
For a share outstanding throughout each period.
| | | | |
| | |
Mirova Global Sustainable
Equity Fund—Class N | |
| | | Period Ended
December 31,
2017* | |
Net asset value, beginning of the period | | $ | 11.29 | |
| | | | |
INCOME (LOSS) FROM INVESTMENT OPERATIONS: | | | | |
Net investment income(a) | | | 0.02 | |
Net realized and unrealized gain (loss) | | | 1.66 | |
| | | | |
Total from Investment Operations | | | 1.68 | |
| | | | |
LESS DISTRIBUTIONS FROM: | | | | |
Net investment income | | | (0.04 | ) |
Net realized capital gains | | | (0.12 | ) |
| | | | |
Total Distributions | | | (0.16 | ) |
| | | | |
Net asset value, end of the period | | $ | 12.81 | |
| | | | |
Total return(b)(c) | | | 14.81 | % |
RATIOS TO AVERAGE NET ASSETS: | | | | |
Net assets, end of the period (000’s) | | $ | 1 | |
Net expenses(d)(e) | | | 1.00 | % |
Gross expenses(e) | | | 14.30 | % |
Net investment income(e) | | | 0.29 | % |
Portfolio turnover rate(f) | | | 20 | % |
| * | From commencement of Class operations on May 1, 2017 through December 31, 2017. |
| (a) | Per share net investment income has been calculated using the average shares outstanding during the period. |
| (b) | Had certain expenses not been waived/reimbursed during the period, total returns would have been lower. |
| (c) | Periods less than one year are not annualized. |
| (d) | The investment adviser agreed to waive its fees and/or reimburse a portion of the Fund’s expenses during the period. Without this waiver/reimbursement, expenses would have been higher. |
| (e) | Computed on an annualized basis for periods less than one year. |
| (f) | Represents the Fund’s portfolio turnover rate for the year ended December 31, 2017. |
See accompanying notes to financial statements.
| 76
Financial Highlights (continued)
For a share outstanding throughout each period.
| | | | | | | | |
| | |
Mirova Global Sustainable
Equity Fund—Class Y | |
| | | Year Ended
December 31,
2017 | | | Period Ended
December 31,
2016* | |
Net asset value, beginning of the period | | $ | 9.91 | | | $ | 10.00 | |
| | | | | | | | |
INCOME (LOSS) FROM INVESTMENT OPERATIONS: | | | | | | | | |
Net investment income(a) | | | 0.03 | | | | 0.03 | |
Net realized and unrealized gain (loss) | | | 3.02 | | | | (0.10 | ) |
| | | | | | | | |
Total from Investment Operations | | | 3.05 | | | | (0.07 | ) |
| | | | | | | | |
LESS DISTRIBUTIONS FROM: | | | | | | | | |
Net investment income | | | (0.03 | ) | | | (0.01 | ) |
Net realized capital gains | | | (0.12 | ) | | | (0.01 | ) |
| | | | | | | | |
Total Distributions | | | (0.15 | ) | | | (0.02 | ) |
| | | | | | | | |
Net asset value, end of the period | | $ | 12.81 | | | $ | 9.91 | |
| | | | | | | | |
Total return(b) | | | 30.75 | % | | | (0.70 | )%(c) |
RATIOS TO AVERAGE NET ASSETS: | | | | | | | | |
Net assets, end of the period (000’s) | | $ | 63,359 | | | $ | 49,593 | |
Net expenses(d) | | | 1.04 | % | | | 1.05 | %(e) |
Gross expenses | | | 1.16 | % | | | 1.21 | %(e) |
Net investment income | | | 0.26 | % | | | 0.35 | %(e) |
Portfolio turnover rate | | | 20 | % | | | 20 | % |
| * | From commencement of operations on March 31, 2016 through December 31, 2016. |
| (a) | Per share net investment income has been calculated using the average shares outstanding during the period. |
| (b) | Had certain expenses not been waived/reimbursed during the period, total returns would have been lower. |
| (c) | Periods less than one year are not annualized. |
| (d) | The investment adviser agreed to waive its fees and/or reimburse a portion of the Fund’s expenses during the period. Without this waiver/reimbursement, expenses would have been higher. |
| (e) | Computed on an annualized basis for periods less than one year. |
See accompanying notes to financial statements.
77 |
Notes to Financial Statements
December 31, 2017
1. Organization. Gateway Trust and Natixis Funds Trust I (the “Trusts” and each a “Trust”) are each organized as a Massachusetts business trust. Each Trust is registered under the Investment Company Act of 1940, as amended (the “1940 Act”), as an open-end management investment company. Each Declaration of Trust permits the Board of Trustees to authorize the issuance of an unlimited number of shares of the Trust in multiple series. The financial statements for certain funds of the Trusts are presented in separate reports. The following funds (individually, a “Fund” and collectively, the “Funds”) are included in this report:
Gateway Trust:
Gateway Fund
Gateway Equity Call Premium Fund
Natixis Funds Trust I:
Mirova Global Green Bond Fund (the “Global Green Bond Fund”)
Mirova Global Sustainable Equity Fund (the “Global Sustainable Equity Fund”)
Global Green Bond Fund commenced operations on February 28, 2017 via contributions to the Fund by Natixis Investment Managers L.P. (“Natixis”) and Natixis Sustainable Future Funds of $21,210,000 and $3,790,000, respectively. Natixis Sustainable Future Funds is a series of ten affiliated mutual funds that commenced operations on February 28, 2017 via contribution to the Funds by Natixis.
Each Fund is a diversified investment company, except for the Global Green Bond Fund which is a non-diversified investment company.
Each Fund offers Class A, Class N (effective May 1, 2017 for Gateway Fund, Gateway Equity Call Premium Fund and Global Sustainable Equity Fund) and Class Y shares. Gateway Fund, Gateway Equity Call Premium Fund and Global Sustainable Equity Fund also offer Class C shares. Class T shares of Gateway Fund, Gateway Equity Call Premium Fund and Global Sustainable Equity Fund are not are not currently available for purchase.
Class A shares are sold with a maximum front-end sales charge of 5.75% for Gateway Fund, Gateway Equity Call Premium Fund and Global Sustainable Equity Fund and 4.25% for Global Green Bond Fund. Class C shares do not pay a front-end sales charge, do not convert to any other class of shares, pay higher Rule 12b-1 fees than Class A shares and may be subject to a contingent deferred sales charge (“CDSC”) of 1.00% if those shares are redeemed within one year of acquisition, except for reinvested distributions. Class N and Class Y shares do not pay a front-end sales charge, a CDSC or Rule 12b-1 fees. Class N shares are offered with an initial minimum investment of $1,000,000. Class Y shares are offered with an initial minimum investment of $100,000. Certain categories of investors are exempted from the minimum investment amounts for Class N and Class Y as outlined in the relevant Funds’ prospectus.
| 78
Notes to Financial Statements (continued)
December 31, 2017
Most expenses can be directly attributed to a Fund. Expenses which cannot be directly attributed to a Fund are generally apportioned based on the relative net assets of each of the funds in Natixis Funds Trust I, Natixis Funds Trust II, Natixis Funds Trust IV and Gateway Trust (“Natixis Funds Trusts”), Loomis Sayles Funds I and Loomis Sayles Funds II (“Loomis Sayles Funds Trusts”) and Natixis ETF Trust. Expenses of the Fund are borne pro rata by the holders of each class of shares, except that each class bears expenses unique to that class (such as the Rule 12b-1 fees applicable to Class A and Class C), and transfer agent fees are borne collectively for Class A, Class C and Class Y, and individually for Class N. In addition, each class votes as a class only with respect to its own Rule 12b-1 Plan. Shares of each class would receive their pro rata share of the net assets of the Fund if the Fund were liquidated. The Trustees approve separate distributions from net investment income on each class of shares.
2. Significant Accounting Policies. The following is a summary of significant accounting policies consistently followed by each Fund in the preparation of its financial statements. The Funds’ financial statements follow the accounting and reporting guidelines provided for investment companies and are prepared in accordance with accounting principles generally accepted in the United States of America which require the use of management estimates that affect the reported amounts and disclosures in the financial statements. Actual results could differ from those estimates. Management has evaluated the events and transactions subsequent to year-end through the date the financial statements were issued and has determined that there were no material events that would require disclosure in the Funds’ financial statements.
a. Valuation. Fund securities and other investments are valued at market value based on market quotations obtained or determined by independent pricing services recommended by the adviser or subadviser and approved by the Board of Trustees. Fund securities and other investments for which market quotations are not readily available are valued at fair value as determined in good faith by the adviser or subadviser pursuant to procedures approved by the Board of Trustees, as described below. Market value is determined as follows:
Listed equity securities (including shares of closed-end investment companies and exchange-traded funds) are valued at the last sale price quoted on the exchange where they are traded most extensively or, if there is no reported sale during the day, the closing bid quotation as reported by an independent pricing service. Securities traded on the NASDAQ Global Select Market, NASDAQ Global Market and NASDAQ Capital Market are valued at the NASDAQ Official Closing Price (“NOCP”), or if lacking an NOCP, at the most recent bid quotations on the applicable NASDAQ Market. Unlisted equity securities (except unlisted preferred equity securities) are valued at the last sale price quoted in the market where they are traded most extensively or, if there is no reported sale during the day, the closing bid quotation as reported by an
79 |
Notes to Financial Statements (continued)
December 31, 2017
independent pricing service. If there is no last sale price or closing bid quotation available, unlisted equity securities will be valued using evaluated bids furnished by an independent pricing service, if available. In some foreign markets, an official close price and a last sale price may be available from the foreign exchange or market. In those cases, the official close price is used. Debt securities and unlisted preferred equity securities are valued based on evaluated bids furnished to the Fund by an independent pricing service or bid prices obtained from broker-dealers. Broker-dealer bid prices may be used to value debt and unlisted equity securities where an independent pricing service is unable to price a security or where an independent pricing service does not provide a reliable price for the security. Futures contracts are valued at the most recent settlement price on the exchange on which the adviser believes that, over time, they are traded most extensively. Option contracts on domestic indices are valued at the average of the closing bid and ask quotations as of the close of trading on the Chicago Board Options Exchange (“CBOE”).
Fund securities and other investments for which market quotations are not readily available are valued at fair value as determined in good faith by the adviser pursuant to procedures approved by the Board of Trustees. On the last business day of the month, the Funds will fair value S&P 500® Index options using the closing rotation values published by the CBOE. The Funds may also value securities and other investments at fair value in other circumstances such as when extraordinary events occur after the close of a foreign market but prior to the close of the New York Stock Exchange (“NYSE”). This may include situations relating to a single issuer (such as a declaration of bankruptcy or a delisting of the issuer’s security from the primary market on which it has traded) as well as events affecting the securities markets in general (such as market disruptions or closings and significant fluctuations in U.S. and/or foreign markets). When fair valuing its securities or other investments, the Funds may, among other things, use modeling tools or other processes that may take into account factors such as securities or other market activity and/or significant events that occur after the close of the foreign market and before the time the Fund’s net asset value (“NAV”) is calculated. Fair value pricing may require subjective determinations about the value of a security, and fair values used to determine a Fund’s NAV may differ from quoted or published prices, or from prices that are used by others, for the same securities. In addition, the use of fair value pricing may not always result in adjustments to the prices of securities held by a Fund.
As of December 31, 2017 securities held by the Funds were fair valued as follows:
| | | | | | | | |
Fund | | Equity securities1 | | | Percentage of Net Assets | |
Global Sustainable Equity Fund | | $ | 28,802,009 | | | | 42.5 | % |
| 1 | Certain foreign equity securities were fair valued pursuant to procedures approved by the Board of Trustees as events occurring after the close of the foreign market were believed to materially affect the value of those securities. |
| 80
Notes to Financial Statements (continued)
December 31, 2017
As of December 31, 2017 purchased and written options held by the Funds were fair valued using the closing rotation values published by the CBOE as follows:
| | | | | | | | | | | | | | | | |
Fund | | Purchased Options | | | Percentage of Net Assets | | | Written Options | | | Percentage of Net Assets | |
Gateway Fund | | $ | 13,136,125 | | | | 0.1 | % | | $ | 153,198,670 | | | | 1.8 | % |
Gateway Equity Call Premium Fund | | | — | | | | — | | | | 1,444,920 | | | | 1.8 | % |
b. Investment Transactions and Related Investment Income. Investment transactions are accounted for on a trade date plus one day basis for daily NAV calculation. However, for financial reporting purposes, investment transactions are reported on trade date. Dividend income is recorded on ex-dividend date, or in the case of certain foreign securities, as soon as a Fund is notified, and interest income is recorded on an accrual basis. Interest income is increased by the accretion of discount and decreased by the amortization of premium, if applicable. In determining net gain or loss on securities sold, the cost of securities has been determined on an identified cost basis. Investment income, non-class specific expenses and realized and unrealized gains and losses are allocated on a pro rata basis to each class based on the relative net assets of each class to the total net assets of the Fund.
c. Foreign Currency Translation. The books and records of the Funds are maintained in U.S. dollars. The values of securities, currencies and other assets and liabilities denominated in currencies other than U.S. dollars are translated into U.S. dollars based upon foreign exchange rates prevailing at the end of the period. Purchases and sales of investment securities, income and expenses are translated into U.S. dollars on the respective dates of such transactions.
Net realized foreign exchange gains or losses arise from sales of foreign currency, changes in exchange rates between the trade and settlement dates on securities transactions and the difference between the amounts of dividends, interest and foreign withholding taxes recorded on the Fund’s books and the U.S. dollar equivalent of the amounts actually received or paid. Net unrealized foreign exchange gains or losses arise from changes in the value of assets and liabilities, other than investment securities, as of the end of the fiscal period, resulting from changes in exchange rates. Net realized foreign exchange gains or losses and the net change in unrealized foreign exchange gains or losses are disclosed in the Statements of Operations. For federal income tax purposes, net realized foreign exchange gains or losses are characterized as ordinary income, and may, if the Funds have net losses, reduce the amount of income available to be distributed by the Funds.
The values of investment securities are presented at the foreign exchange rates prevailing at the end of the period for financial reporting purposes. Net realized and unrealized gains or losses on investments reported in the Statements of Operations
81 |
Notes to Financial Statements (continued)
December 31, 2017
reflect gains or losses resulting from changes in exchange rates and fluctuations which arise due to changes in market prices of investment securities. For federal income tax purposes, a portion of the net realized gain or loss on investments arising from changes in exchange rates, which is reflected in the Statements of Operations, may be characterized as ordinary income and may, if the Funds have net losses, reduce the amount of income available to be distributed by the Funds.
The Funds may use foreign currency exchange contracts to facilitate transactions in foreign-denominated investments. Losses may arise from changes in the value of the foreign currency or if the counterparties do not perform under the contracts’ terms.
d. Futures Contracts. Certain Funds may enter into futures contracts. Futures contracts are agreements between two parties to buy and sell a particular instrument or index for a specified price on a specified future date.
When a Fund enters into a futures contract, it is required to deposit with (or for the benefit of) its broker an amount of cash or short-term high-quality securities as “initial margin.” As the value of the contract changes, the value of the futures contract position increases or declines. Subsequent payments, known as “variation margin,” are made or received by a Fund, depending on the price fluctuations in the fair value of the contract and the value of cash or securities on deposit with the broker. The aggregate principal amounts of the contracts are not recorded in the financial statements. Fluctuations in the value of the contracts are recorded in the Statements of Assets and Liabilities as an asset (liability) and in the Statements of Operations as unrealized appreciation (depreciation) until the contracts are closed, when they are recorded as realized gains (losses). Realized gain or loss on a futures position is equal to the difference between the value of the contract at the time it was opened and the value at the time it was closed, minus brokerage commissions. When a Fund enters into a futures contract certain risks may arise, such as illiquidity in the futures market, which may limit a Fund’s ability to close out a futures contract prior to settlement date, and unanticipated movements in the value of securities or interest rates.
Futures contracts are exchange-traded. Exchange-traded futures contracts are standardized and are settled through a clearing house with fulfillment supported by the credit of the exchange. Therefore, counterparty credit risks to the Funds are reduced; however, in the event that a counterparty enters into bankruptcy, a Fund’s claim against initial/variation margin on deposit with the counterparty may be subject to terms of a final settlement in bankruptcy court.
e. Option Contracts. Gateway Fund’s and Gateway Equity Call Premium Fund’s investment strategies make use of exchange-traded options. Exchange-traded options are standardized contracts and are settled through a clearing house with fulfillment supported by the credit of the exchange. Therefore, counterparty credit risks to a Fund are reduced.
| 82
Notes to Financial Statements (continued)
December 31, 2017
When a Fund writes an index call option, an amount equal to the net premium received (the premium less commission) is recorded as a liability and is subsequently adjusted to the current value until the option expires or a Fund enters into a closing purchase transaction. When an index call option expires or a Fund enters into a closing purchase transaction, the difference between the net premium received and any amount paid at expiration or on effecting a closing purchase transaction, including commission, is treated as a realized gain or, if the net premium received is less than the amount paid, as a realized loss. A Fund, as writer of an index call option, bears the risk of an unfavorable change in the market value of the index underlying the written option.
When a Fund purchases an index put option, it pays a premium and the index put option is subsequently marked-to-market to reflect current value until the option expires or a Fund enters into a closing sale transaction. Premiums paid for purchasing index put options which expire are treated as realized losses. When a Fund enters into a closing sale transaction, the difference between the premium paid and the proceeds of the closing sale transaction is treated as a realized gain or loss. The risk associated with purchasing index put options is limited to the premium paid.
f. Due from Brokers. Transactions and positions in certain futures contracts are maintained and cleared by registered U.S. broker/dealers pursuant to customer agreements between a Fund and the various broker/dealers. The due from brokers balance in the Statement of Assets and Liabilities for Global Green Bond Fund represents cash pledged as collateral for futures contracts. In certain circumstances the Fund’s use of cash held at brokers is restricted by regulation or broker mandated limits.
g. Federal and Foreign Income Taxes. The Trusts treat each Fund as a separate entity for federal income tax purposes. Each Fund intends to meet the requirements of the Internal Revenue Code of 1986, as amended, applicable to regulated investment companies, and to distribute to its shareholders substantially all of its net investment income and any net realized capital gains at least annually. Management has performed an analysis of each Fund’s tax positions for the open tax years as of December 31, 2017, as applicable, and has concluded that no provisions for income tax are required. The Funds’ federal tax returns for the prior three fiscal years, where applicable, remain subject to examination by the Internal Revenue Service. Management is not aware of any events that are reasonably possible to occur in the next twelve months that would result in the amounts of any unrecognized tax benefits significantly increasing or decreasing for the Funds. However, management’s conclusions regarding tax positions taken may be subject to review and adjustment at a later date based on factors including, but not limited to, new tax laws and accounting regulations and interpretations thereof.
A Fund may be subject to foreign withholding taxes on investment income and taxes on capital gains on investments that are accrued and paid based upon the Fund’s
83 |
Notes to Financial Statements (continued)
December 31, 2017
understanding of the tax rules and regulations that exist in the countries in which the Fund invests. Foreign withholding taxes on dividend and interest income are reflected on the Statements of Operations as a reduction of investment income, net of amounts eligible to be reclaimed. Dividends and interest receivable on the Statements of Assets and Liabilities are net of foreign withholding taxes. Foreign withholding taxes where reclaims have been or will be filed are reflected on the Statements of Assets and Liabilities as tax reclaims receivable. Capital gains taxes paid are included in net realized gain (loss) on investments in the Statements of Operations. Accrued but unpaid capital gains taxes are reflected as foreign taxes payable on the Statements of Assets and Liabilities, if applicable, and reduce unrealized gains on investments. In the event that realized gains on investments are subsequently offset by realized losses, taxes paid on realized gains may be returned to a Fund. Such amounts, if applicable, are reflected as foreign tax rebates receivable on the Statements of Assets and Liabilities and are recorded as a realized gain when received.
h. Dividends and Distributions to Shareholders. Dividends and distributions are recorded on ex-dividend date. The timing and characterization of certain income and capital gain distributions are determined in accordance with federal tax regulations, which may differ from accounting principles generally accepted in the United States of America. Permanent differences are primarily due to differing treatments for book and tax purposes of items such as foreign currency gains and losses, premium amortization, non-deductible expenses, return of capital and capital gain distributions received, distribution re-designations and distributions in excess of income and/or capital gain. Permanent book and tax basis differences relating to shareholder distributions, net investment income and net realized gains will result in reclassifications to capital accounts reported on the Statements of Assets and Liabilities. Temporary differences between book and tax distributable earnings are primarily due to wash sales, premium amortization, futures contract mark-to-market, return of capital distributions received, deferred trustees’ fees and option contract mark-to-market. Amounts of income and capital gain available to be distributed on a tax basis are determined annually, and at other times during the Funds’ fiscal year as may be necessary to avoid knowingly declaring and paying a return of capital distribution. Distributions from net investment income and short-term capital gains are considered to be distributed from ordinary income for tax purposes.
| 84
Notes to Financial Statements (continued)
December 31, 2017
The tax characterization of distributions is determined on an annual basis. The tax character of distributions paid to shareholders during the years ended December 31, 2017 and 2016 was as follows:
| | | | | | | | | | | | | | | | | | | | | | | | |
| | | 2017 Distributions Paid From: | | | 2016 Distributions Paid From: | |
Fund | | Ordinary Income | | | Long-Term Capital Gains | | | Total | | | Ordinary Income | | | Long-Term Capital Gains | | | Total | |
Gateway Fund | | $ | 96,146,895 | | | $ | — | | | $ | 96,146,895 | | | $ | 125,407,692 | | | $ | — | | | $ | 125,407,692 | |
Gateway Equity Call Premium Fund | | | 825,437 | | | | — | | | | 825,437 | | | | 778,103 | | | | — | | | | 778,103 | |
Global Green Bond Fund | | | 503,903 | | | | — | | | | 503,903 | | | | — | | | | — | | | | — | |
Global Sustainable Equity Fund | | | 270,696 | | | | 488,562 | | | | 759,258 | | | | 100,101 | | | | — | | | | 100,101 | |
Differences between these amounts and those reported in the Statements of Changes in Net Assets are primarily attributable to different book and tax treatment for short-term capital gains.
As of December 31, 2017, the components of distributable earnings on a tax basis were as follows:
| | | | | | | | | | | | | | | | |
| | | Gateway Fund | | | Gateway Equity Call Premium Fund | | | Global Green Bond Fund | | | Global Sustainable Equity Fund | |
Undistributed ordinary income | | $ | 7,829,492 | | | $ | — | | | $ | 197,675 | | | $ | — | |
Undistributed long-term capital gains | | | — | | | | — | | | | — | | | | 494,882 | |
| | | | | | | | | | | | | | | | |
Total undistributed earnings | | | 7,829,492 | | | | — | | | | 197,675 | | | | 494,882 | |
| | | | | | | | | | | | | | | | |
Capital loss carryforward: | | | | | | | | | | | | | | | | |
Short-term: | | | | | | | | | | | | | | | | |
Expires: | | | | | | | | | | | | | | | | |
December 31, 2018 | | | (359,753,704 | ) | | | — | | | | — | | | | — | |
No expiration date | | | — | | | | (4,993,709 | ) | | | (607,978 | ) | | | — | |
Long-term: | | | | | | | | | | | | | | | | |
No expiration date | | | — | | | | (4,236,211 | ) | | | (971,466 | ) | | | — | |
| | | | | | | | | | | | | | | | |
Total capital loss carryforward | | $ | (359,753,704 | ) | | $ | (9,229,920 | ) | | $ | (1,579,444 | ) | | $ | — | |
| | | | | | | | | | | | | | | | |
85 |
Notes to Financial Statements (continued)
December 31, 2017
| | | | | | | | | | | | | | | | |
| | | Gateway Fund | | | Gateway Equity Call Premium Fund | | | Global Green Bond Fund | | | Global Sustainable Equity Fund | |
Late-year ordinary and post-October capital loss deferrals* | | $ | — | | | $ | — | | | $ | — | | | $ | (1,001 | ) |
| | | | | | | | | | | | | | | | |
Unrealized appreciation | | | 2,495,305,753 | | | | 22,601,008 | | | | 1,322,170 | | | | 12,998,738 | |
| | | | | | | | | | | | | | | | |
Total accumulated earnings (losses) | | $ | 2,143,381,541 | | | $ | 13,371,088 | | | $ | (59,599 | ) | | $ | 13,492,619 | |
| | | | | | | | | | | | | | | | |
| * | Under current tax law, capital losses, foreign currency losses, and losses on passive foreign investment companies and contingent payment debt instruments after October 31 or December 31, as applicable, may be deferred and treated as occurring on the first day of the following taxable year. |
Capital losses may be utilized to offset future capital gains until expiration. The Regulated Investment Company Modernization Act of 2010 (the “Act”) allows capital loss carryforwards to be carried forward indefinitely. Rules in effect previously limited the carryforward period to eight years. Capital loss carryforwards generated in taxable years beginning after the effective date of the Act must be fully used before capital loss carryforwards generated in years prior to the effective date of the Act; therefore, under certain circumstances, capital loss carryforwards available as of the report date may expire unused.
As of December 31, 2017, the cost of investments (including derivatives, if applicable) and unrealized appreciation (depreciation) on a federal tax basis were as follows:
| | | | | | | | | | | | | | | | |
| | | Gateway Fund | | | Gateway Equity Call Premium Fund | | | Global Green Bond Fund | | | Global Sustainable Equity Fund | |
Federal tax cost | | $ | 6,152,052,044 | | | $ | 60,037,849 | | | $ | 23,907,172 | | | $ | 54,219,664 | |
| | | | | | | | | | | | | | | | |
Gross tax appreciation | | $ | 2,638,614,383 | | | $ | 23,560,784 | | | $ | 1,360,640 | | | $ | 13,561,508 | |
Gross tax depreciation | | | (143,308,660 | ) | | | (959,776 | ) | | | (47,858 | ) | | | (564,525 | ) |
| | | | | | | | | | | | | | | | |
Net tax appreciation | | $ | 2,495,305,723 | | | $ | 22,601,008 | | | $ | 1,312,782 | | | $ | 12,996,983 | |
| | | | | | | | | | | | | | | | |
Differences between these amounts and those reported in the components of distributable earnings are primarily attributable to foreign currency mark-to-market.
i. Repurchase Agreements. Each Fund may enter into repurchase agreements, under the terms of a Master Repurchase Agreement, under which each Fund acquires securities as collateral and agrees to resell the securities at an agreed upon time and at an agreed upon price. It is each Fund’s policy that the market value of the collateral for repurchase agreements be at least equal to 102% of the repurchase price, including
| 86
Notes to Financial Statements (continued)
December 31, 2017
interest. Certain repurchase agreements are tri-party arrangements whereby the collateral is held in a segregated account for the benefit of the Fund and on behalf of the counterparty. Repurchase agreements could involve certain risks in the event of default or insolvency of the counterparty, including possible delays or restrictions upon a Fund’s ability to dispose of the underlying securities. As of December 31, 2017, each Fund, as applicable, had investments in repurchase agreements for which the value of the related collateral exceeded the value of the repurchase agreement. The gross value of repurchase agreements is included in the Statements of Assets and Liabilities for financial reporting purposes.
j. Indemnifications. Under the Trusts’ organizational documents, its officers and Trustees are indemnified against certain liabilities arising out of the performance of their duties to the Funds. Additionally, in the normal course of business, the Funds enter into contracts with service providers that contain general indemnification clauses. The Funds’ maximum exposure under these arrangements is unknown as this would involve future claims that may be made against the Funds that have not yet occurred. However, based on experience, the Funds expect the risk of loss to be remote.
3. Fair Value Measurements. In accordance with accounting standards related to fair value measurements and disclosures, the Funds have categorized the inputs utilized in determining the value of each Fund’s assets or liabilities. These inputs are summarized in the three broad levels listed below:
| | • | | Level 1 – quoted prices in active markets for identical assets or liabilities; |
| | • | | Level 2 – prices determined using other significant inputs that are observable either directly, or indirectly through corroboration with observable market data (which could include quoted prices for similar assets or liabilities, interest rates, credit risk, etc.); and |
| | • | | Level 3 – prices determined using significant unobservable inputs when quoted prices or observable inputs are unavailable such as when there is little or no market activity for an asset or liability (unobservable inputs reflect each Fund’s own assumptions in determining the fair value of assets or liabilities and would be based on the best information available). |
The inputs or methodology used for valuing securities are not necessarily an indication of the risk associated with investing in those securities.
87 |
Notes to Financial Statements (continued)
December 31, 2017
The following is a summary of the inputs used to value the Funds’ investments as of December 31, 2017, at value:
Gateway Fund
Asset Valuation Inputs
| | | | | | | | | | | | | | | | |
Description | | Level 1 | | | Level 2 | | | Level 3 | | | Total | |
Common Stocks(a) | | $ | 8,429,239,556 | | | $ | — | | | $ | — | | | $ | 8,429,239,556 | |
Purchased Options | | | — | | | | 13,136,125 | | | | — | | | | 13,136,125 | |
Short-Term Investments | | | — | | | | 218,118,211 | | | | — | | | | 218,118,211 | |
| | | | | | | | | | | | | | | | |
Total | | $ | 8,429,239,556 | | | $ | 231,254,336 | | | $ | — | | | $ | 8,660,493,892 | |
| | | | | | | | | | | | | | | | |
|
| Liability Valuation Inputs | |
Description | | Level 1 | | | Level 2 | | | Level 3 | | | Total | |
Written Options | | $ | — | | | $ | (153,198,670 | ) | | $ | — | | | $ | (153,198,670 | ) |
| | | | | | | | | | | | | | | | |
| (a) | Details of the major categories of the Fund’s investments are reflected within the Portfolio of Investments. |
For the year ended December 31, 2017, there were no transfers among Levels 1, 2 and 3.
Gateway Equity Call Premium Fund
Asset Valuation Inputs
| | | | | | | | | | | | | | | | |
Description | | Level 1 | | | Level 2 | | | Level 3 | | | Total | |
Common Stocks(a) | | $ | 80,419,636 | | | $ | — | | | $ | — | | | $ | 80,419,636 | |
Short-Term Investments | | | — | | | | 2,219,220 | | | | — | | | | 2,219,220 | |
| | | | | | | | | | | | | | | | |
Total | | $ | 80,419,636 | | | $ | 2,219,220 | | | $ | — | | | $ | 82,638,856 | |
| | | | | | | | | | | | | | | | |
|
| Liability Valuation Inputs | |
Description | | Level 1 | | | Level 2 | | | Level 3 | | | Total | |
Written Options | | $ | — | | | $ | (1,444,920 | ) | | $ | — | | | $ | (1,444,920 | ) |
| | | | | | | | | | | | | | | | |
| (a) | Details of the major categories of the Fund’s investments are reflected within the Portfolio of Investments. |
For the year ended December 31, 2017, there were no transfers among Levels 1, 2 and 3.
| 88
Notes to Financial Statements (continued)
December 31, 2017
Global Green Bond Fund
Asset Valuation Inputs
| | | | | | | | | | | | | | | | |
Description | | Level 1 | | | Level 2 | | | Level 3 | | | Total | |
Bonds and Notes(a) | | $ | — | | | $ | 24,476,352 | | | $ | — | | | $ | 24,476,352 | |
Short-Term Investments | | | — | | | | 743,602 | | | | — | | | | 743,602 | |
Futures Contracts (unrealized appreciation) | | | 8,104 | | | | — | | | | — | | | | 8,104 | |
| | | | | | | | | | | | | | | | |
Total | | $ | 8,104 | | | $ | 25,219,954 | | | $ | — | | | $ | 25,228,058 | |
| | | | | | | | | | | | | | | | |
| | | | |
| Liability Valuation Inputs | | | | | | | | | | | | | | | | |
Description | | Level 1 | | | Level 2 | | | Level 3 | | | Total | |
Futures Contracts (unrealized depreciation) | | $ | (245,474 | ) | | $ | — | | | $ | — | | | $ | (245,474 | ) |
| | | | | | | | | | | | | | | | |
| (a) | Details of the major categories of the Fund’s investments are reflected within the Portfolio of Investments. |
For the year ended December 31, 2017, there were no transfers among Levels 1, 2 and 3.
Global Sustainable Equity Fund
Asset Valuation Inputs
| | | | | | | | | | | | | | | | |
Description | | Level 1 | | | Level 2 | | | Level 3 | | | Total | |
Common Stocks | | | | | | | | | | | | | | | | |
Belgium | | $ | — | | | $ | 2,330,841 | | | $ | — | | | $ | 2,330,841 | |
China | | | — | | | | 573,375 | | | | — | | | | 573,375 | |
Denmark | | | — | | | | 5,104,107 | | | | — | | | | 5,104,107 | |
France | | | — | | | | 3,198,011 | | | | — | | | | 3,198,011 | |
Germany | | | — | | | | 3,660,285 | | | | — | | | | 3,660,285 | |
Hong Kong | | | — | | | | 3,314,319 | | | | — | | | | 3,314,319 | |
Japan | | | — | | | | 3,896,426 | | | | — | | | | 3,896,426 | |
Netherlands | | | — | | | | 2,181,127 | | | | — | | | | 2,181,127 | |
Switzerland | | | — | | | | 1,611,120 | | | | — | | | | 1,611,120 | |
United Kingdom | | | 1,606,407 | | | | 2,932,398 | | | | — | | | | 4,538,805 | |
All Other Common Stocks(a) | | | 34,762,746 | | | | — | | | | — | | | | 34,762,746 | |
| | | | | | | | | | | | | | | | |
Total Common Stocks | | | 36,369,153 | | | | 28,802,009 | | | | — | | | | 65,171,162 | |
| | | | | | | | | | | | | | | | |
Short-Term Investments | | | — | | | | 2,045,485 | | | | — | | | | 2,045,485 | |
| | | | | | | | | | | | | | | | |
Total | | $ | 36,369,153 | | | $ | 30,847,494 | | | $ | — | | | $ | 67,216,647 | |
| | | | | | | | | | | | | | | | |
| (a) | Details of the major categories of the Fund’s investments are reflected within the Portfolio of Investments. |
89 |
Notes to Financial Statements (continued)
December 31, 2017
For the year ended December 31, 2017, there were no transfers among Levels 1, 2 and 3.
4. Derivatives. Derivative instruments are defined as financial instruments whose value and performance are based on the value and performance of an underlying asset, reference rate or index. Derivative instruments that the Funds used during the period include futures contracts, written index call options and purchased index put options.
Gateway Fund and Gateway Equity Call Premium Fund seek to capture the majority of the returns associated with equity market investments, while exposing investors to less risk than other equity investments. To meet this investment goal, the Funds invest in a broadly diversified portfolio of common stocks, while also writing index call options. Writing index call options can reduce the Fund’s volatility, provide a steady cash flow and be an important source of the Fund’s return, although it also may reduce the Funds’ ability to profit from increases in the value of its equity portfolio. The Gateway Fund also buys index put options, which can protect the Fund from a significant market decline that may occur over a short period of time. The value of an index put option generally increases as the prices of stocks constituting the index decrease and decreases as those stocks increase in price. The combination of the diversified stock portfolio, the steady cash flow from writing of index call options and the downside protection from purchased index put options is intended to provide the Funds with the majority of the returns associated with equity market investments while exposing investors to less risk than other equity investments. During the year ended December 31, 2017, Gateway Fund used written index call options and purchased index put options and Gateway Equity Call Premium Fund used written index call options in accordance with this objective.
Global Green Bond Fund seeks to provide total return, through a combination of capital appreciation and current income, by investing in green bonds. The Fund pursues its objective by primarily investing in fixed-income securities. In connection with its principal investment strategies, the Fund may also invest in futures, forwards and foreign currency transactions for hedging and investment purposes and to manage duration. During the period ended December 31, 2017, the Fund used futures contracts to gain yield curve exposure, manage duration and for currency hedging purposes in accordance with its objective.
The following is a summary of derivative instruments for Gateway Fund as of December 31, 2017, as reflected within the Statements of Assets and Liabilities:
| | | | |
Assets | | Investments at value1 | |
Exchange-traded asset derivatives | | | | |
Equity contracts | | $ | 13,136,125 | |
| 90
Notes to Financial Statements (continued)
December 31, 2017
| | | | |
Liabilities | | Options written at value | |
Exchange-traded liability derivatives | | | | |
Equity contracts | | $ | (153,198,670 | ) |
| 1 | Represents purchased options, at value. |
Transactions in derivative instruments for Gateway Fund during the year ended December 31, 2017, as reflected within the Statements of Operations were as follows:
| | | | | | | | |
Net Realized Gain (Loss) on: | | Investments2 | | | Options written | |
Equity contracts | | $ | (235,567,627 | ) | | $ | (562,013,864 | ) |
| | |
Net Change in Unrealized Appreciation (Depreciation) on: | | Investments2 | | | Options written | |
Equity contracts | | $ | (3,827,388 | ) | | $ | (20,438,813 | ) |
| 2 | Represents realized loss and change in unrealized appreciation (depreciation), respectively, for purchased options during the period. |
The following is a summary of derivative instruments for Gateway Equity Call Premium Fund as of December 31, 2017, as reflected within the Statements of Assets and Liabilities:
| | | | |
Liabilities | | Options written at value | |
Exchange-traded liability derivatives | | | | |
Equity contracts | | $ | (1,444,920 | ) |
Transactions in derivative instruments for Gateway Equity Call Premium Fund during the year ended December 31, 2017, as reflected within the Statements of Operations were as follows:
| | | | |
Net Realized Gain (Loss) on: | | Options written | |
Equity contracts | | $ | (5,634,939 | ) |
| |
Net Change in Unrealized Appreciation (Depreciation) on: | | Options written | |
Equity contracts | | $ | (159,664 | ) |
The following is a summary of derivative instruments for Global Green Bond Fund as of December 31, 2017, as reflected within the Statements of Assets and Liabilities:
| | | | |
Assets | | Unrealized appreciation on futures contracts | |
Exchange-traded asset derivatives | | | | |
Interest rate contracts | | $ | 8,104 | |
91 |
Notes to Financial Statements (continued)
December 31, 2017
| | | | |
Liabilities | | Unrealized depreciation on futures contracts | |
Exchange-traded liability derivatives | | | | |
Interest rate contracts | | $ | (13,768 | ) |
Foreign exchange contracts | | | (231,706 | ) |
| | | | |
Total exchange-traded liability derivatives | | $ | (245,474 | ) |
| | | | |
Transactions in derivative instruments for Global Green Bond Fund during the period ended December 31, 2017, as reflected within the Statements of Operations were as follows:
| | | | |
Net Realized Gain (Loss) on: | | Futures contracts | |
Interest rate contracts | | $ | (71,749 | ) |
Foreign exchange contracts | | | (1,309,708 | ) |
| | | | |
Total | | $ | (1,381,457 | ) |
| | | | |
| |
Net Change in Unrealized Appreciation (Depreciation) on: | | Futures contracts | |
Interest rate contracts | | $ | (5,664 | ) |
Foreign exchange contracts | | | (231,706 | ) |
| | | | |
Total | | $ | (237,370 | ) |
| | | | |
As the Fund values its derivatives at fair value and recognizes changes in fair value through the Statements of Operations, it does not qualify for hedge accounting under authoritative guidance for derivative instruments. The Fund’s investments in derivatives may represent an economic hedge; however, they are considered to be non-hedge transactions for the purpose of these disclosures.
The volume of option contract activity as a percentage of investments in common stocks, for Gateway Fund based on month-end notional amounts outstanding during the period, at absolute value, was as follows for the year ended December 31, 2017:
| | | | | | | | |
Gateway Fund | | Call Options Written* | | | Put Options Purchased* | |
Average Notional Amount Outstanding | | | 98.99 | % | | | 98.99 | % |
Highest Notional Amount Outstanding | | | 99.08 | % | | | 99.08 | % |
Lowest Notional Amount Outstanding | | | 98.85 | % | | | 98.85 | % |
Notional Amount Outstanding as of December 31, 2017 | | | 98.99 | % | | | 98.99 | % |
| 92
Notes to Financial Statements (continued)
December 31, 2017
The volume of option contract activity as a percentage of investments in common stocks for Gateway Equity Call Premium Fund, based on month-end notional amounts outstanding during the period, at absolute value, was as follows for the year ended December 31, 2017:
| | | | |
Gateway Equity Call Premium Fund | | Call Options
Written* | |
Average Notional Amount Outstanding | | | 98.97 | % |
Highest Notional Amount Outstanding | | | 99.20 | % |
Lowest Notional Amount Outstanding | | | 98.69 | % |
Notional Amount Outstanding as of December 31, 2017 | | | 98.74 | % |
| * | Notional amounts outstanding are determined by multiplying option contracts by the contract multiplier by the price of the option’s underlying index, the S&P 500® Index. |
The volume of futures contract activity as a percentage of net assets, for Global Green Bond Fund based on month-end notional amounts outstanding during the period, at absolute value, was as follows for the period ended December 31, 2017:
| | |
Global Green Bond Fund | | Futures |
| Average Notional Amount Outstanding | | 75.68% |
| Highest Notional Amount Outstanding | | 84.70% |
| Lowest Notional Amount Outstanding | | 62.16% |
| Notional Amount Outstanding as of December 31, 2017 | | 72.14% |
Notional amounts outstanding at the end of the prior period are included in the averages above.
Counterparty risk is managed based on policies and procedures established by the Fund’s adviser. Such policies and procedures may include, but are not limited to, minimum counterparty credit rating requirements, monitoring of counterparty credit default swap spreads and posting of collateral. With exchange-traded derivatives, there is minimal counterparty credit risk to the Fund because the exchange’s clearinghouse, as counterparty to these instruments, stands between the buyer and the seller of the contract. Credit risk still exists in exchange-traded derivatives with respect to initial and variation margin that is held in a broker’s customer accounts. While brokers are required to segregate customer margin from their own assets, in the event that a broker becomes insolvent or goes into bankruptcy and at that time there is a shortfall in the aggregate amount of margin held by the broker for all its clients, U.S. bankruptcy laws will typically allocate that shortfall on a pro rata basis across all of the broker’s customers, potentially resulting in losses to the Fund. The following table shows the maximum amount of loss due to credit risk that, based on the gross fair value of the financial instrument, the Fund would incur if parties to the relevant financial instruments failed completely to perform according to the terms of the
93 |
Notes to Financial Statements (continued)
December 31, 2017
contracts and the collateral or other security, if any, for the amount due proved to be of no value to the Fund, as of December 31, 2017:
| | | | | | | | |
Fund | | Maximum Amount of Loss - Gross | | | Maximum Amount of Loss - Net | |
Global Green Bond Fund | | $ | 542,765 | | | $ | 542,765 | |
5. Purchases and Sales of Securities. For the year ended (period ended for Global Green Bond Fund) December 31, 2017, purchases and sales of securities (excluding short-term investments and U.S. Government/Agency securities and option contracts and including paydowns) were as follows:
| | | | | | | | |
Fund | | Purchases | | | Sales | |
Gateway Fund | | $ | 2,702,274,365 | | | $ | 3,184,009,390 | |
Gateway Equity Call Premium Fund | | | 15,153,529 | | | | 17,888,018 | |
Global Green Bond Fund | | | 33,292,042 | | | | 10,656,181 | |
Global Sustainable Equity Fund | | | 14,415,988 | | | | 11,510,933 | |
6. Management Fees and Other Transactions with Affiliates.
a. Management Fees. Gateway Investment Advisers, LLC (“Gateway Advisers”) serves as investment adviser to the Gateway Fund and Gateway Equity Call Premium Fund. Gateway Advisers is a subsidiary of Natixis, which is part of Natixis Investment Managers, an international asset management group based in Paris, France. Under the terms of the management agreements, each Fund pays a management fee at the following annual rates, calculated daily and payable monthly, based on each Fund’s average daily net assets:
| | | | | | | | | | | | |
| | | Percentage of
Average
Daily Net Assets | |
Fund | | First $5 billion | | | Next $5 billion | | | Over $10 billion | |
Gateway Fund | | | 0.65 | % | | | 0.60 | % | | | 0.58 | % |
Gateway Equity Call Premium Fund | | | 0.65 | % | | | 0.65 | % | | | 0.65 | % |
Natixis Asset Management U.S., LLC (“Natixis AM US”) serves as investment adviser to the Global Green Bond Fund and Global Sustainable Equity Fund. Under the terms of the management agreements, each Fund pays a management fee at the following annual rates, calculated daily and payable monthly, based on each Fund’s average daily net assets:
| | | | |
Fund | | Percentage of Average Daily Net Assets | |
Global Green Bond Fund | | | 0.55 | % |
Global Sustainable Equity Fund | | | 0.80 | % |
| 94
Notes to Financial Statements (continued)
December 31, 2017
Gateway Advisers and Natixis AM US have given binding undertakings to the Funds to waive management fees and/or reimburse certain expenses to limit the Funds’ operating expenses, exclusive of acquired fund fees and expenses, brokerage expenses, interest expense, taxes, organizational and extraordinary expenses such as litigation and indemnification expenses. These undertakings are in effect until April 30, 2018, may be terminated before then only with the consent of the Funds’ Board of Trustees, and are reevaluated on an annual basis. Management fees payable, as reflected on the Statements of Assets and Liabilities, is net of waivers and/or expense reimbursements, if any, pursuant to these undertakings. Waivers/reimbursements that exceed management fees payable are reflected on the Statements of Assets and Liabilities as receivable from investment adviser.
For the year ended (period ended for Class N and Global Green Bond Fund) December 31, 2017, the expense limits as a percentage of average daily net assets under the expense limitation agreement were as follows:
| | | | | | | | | | | | | | | | |
| | | Expense Limit as a Percentage of
Average Daily Net Assets | |
Fund | | Class A | | | Class C | | | Class N | | | Class Y | |
Gateway Fund | | | 0.94 | % | | | 1.70 | % | | | 0.65 | % | | | 0.70 | % |
Gateway Equity Call Premium Fund | | | 1.20 | % | | | 1.95 | % | | | 0.90 | % | | | 0.95 | % |
Global Green Bond Fund | | | 0.95 | % | | | — | | | | 0.65 | % | | | 0.70 | % |
Global Sustainable Equity Fund | | | 1.30 | % | | | 2.05 | % | | | 1.00 | % | | | 1.05 | % |
Gateway Advisers and Natixis AM US shall be permitted to recover expenses they have borne under the expense limitation agreement (whether through waiver of its management fee or otherwise) on a class by class basis in later periods to the extent the annual operating expenses of a class fall below a class’ expense limits, provided, however, that a class is not obligated to pay such waived/reimbursed fees or expenses more than one year after the end of the fiscal year in which the fees or expenses were waived/reimbursed.
For the year ended (period ended for Global Green Bond Fund) December 31, 2017, the management fees and waiver of management fees for each Fund were as follows:
| | | | | | | | | | | | | | | | | | | | | | | | |
Fund | | Gross
Management
Fees | | | Contractual
Waivers of
Management
Fees1 | | | Voluntary
Waivers of
Management
Fees2 | | | Net
Management
Fees | | | Percentage of
Average
Daily
Net Assets | |
| | | | | | Gross | | | Net | |
Gateway Fund | | $ | 50,695,230 | | | $ | 5,686,948 | | | $ | — | | | $ | 45,008,282 | | | | 0.63 | % | | | 0.56 | % |
Gateway Equity Call Premium Fund | | | 512,391 | | | | 77,375 | | | | — | | | | 435,016 | | | | 0.65 | % | | | 0.55 | % |
95 |
Notes to Financial Statements (continued)
December 31, 2017
| | | | | | | | | | | | | | | | | | | | | | | | |
Fund | | Gross
Management
Fees | | | Contractual
Waivers of
Management
Fees1 | | | Voluntary
Waivers of
Management
Fees2 | | | Net
Management
Fees | | | Percentage of
Average
Daily
Net Assets | |
| | | | | | Gross | | | Net | |
Global Green Bond Fund | | $ | 117,442 | | | $ | 95,290 | | | $ | — | | | $ | 22,152 | | | | 0.55 | % | | | 0.10 | % |
Global Sustainable Equity Fund | | | 480,229 | | | | 65,673 | | | | 7,651 | | | | 406,905 | | | | 0.80 | % | | | 0.68 | % |
| 1 | Management fee waiver is subject to possible recovery until December 31, 2018. |
| 2 | Voluntary management fee waivers are not subject to recovery under the expense limitation agreement described above. |
For the year ended (period ended for Global Green Bond Fund) December 31, 2017, class-specific expenses have been reimbursed as follows:
| | | | | | | | | | | | | | | | | | | | |
| | | Reimbursement | |
Fund | | Class A | | | Class C | | | Class N | | | Class Y | | | Total | |
Gateway Fund | | $ | 173,713 | | | $ | — | | | $ | — | | | $ | — | | | $ | 173,713 | |
Global Green Bond Fund | | | 1,148 | | | | — | | | | — | | | | 155 | | | | 1,303 | |
No expenses were recovered during the year ended (period ended for Global Green Bond Fund) December 31, 2017 under the terms of the expense limitation agreement.
b. Service and Distribution Fees. Natixis Distribution, L.P. (“Natixis Distribution”), which is a wholly-owned subsidiary of Natixis, has entered into a distribution agreement with the Trust. Pursuant to this agreement, Natixis Distribution serves as principal underwriter of the Fund.
Pursuant to Rule 12b-1 under the 1940 Act, the Trust has adopted a Service Plan relating to each Fund’s Class A shares (the “Class A Plan”) and a Distribution and Service Plan relating to each Fund’s Class C shares (the “Class C Plan”).
Under the Class A Plan, each Fund pays Natixis Distribution a monthly service fee at an annual rate not to exceed 0.25% of the average daily net assets attributable to the Fund’s Class A shares, as reimbursement for expenses incurred by Natixis Distribution in providing personal services to investors in Class A shares and/or the maintenance of shareholder accounts.
Under the Class C Plan, if applicable, each Fund pays Natixis Distribution a monthly service fee at an annual rate not to exceed 0.25% of the average daily net assets attributable to the Fund’s Class C shares, as compensation for services provided by Natixis Distribution in providing personal services to investors in Class C shares and/or the maintenance of shareholder accounts.
| 96
Notes to Financial Statements (continued)
December 31, 2017
Also under the Class C Plan, if applicable, each Fund pays Natixis Distribution a monthly distribution fee at an annual rate of 0.75% of the average daily net assets attributable to the Fund’s Class C shares, as compensation for services provided by Natixis Distribution in connection with the marketing or sale of Class C shares.
For the year ended (period ended for Global Green Bond Fund) December 31, 2017, the service and distribution fees for each Fund were as follows:
| | | | | | | | | | | | |
| | | Service Fees | | | Distribution Fees | |
Fund | | Class A | | | Class C | | | Class C | |
Gateway Fund | | $ | 4,342,820 | | | $ | 867,427 | | | $ | 2,602,280 | |
Gateway Equity Call Premium Fund | | | 21,868 | | | | 1,511 | | | | 4,532 | |
Global Green Bond Fund | | | 75 | | | | — | | | | — | |
Global Sustainable Equity Fund | | | 1,682 | | | | 885 | | | | 2,656 | |
c. Administrative Fees. Natixis Advisors, L.P. (“Natixis Advisors”) provides certain administrative services for the Funds and contracts with State Street Bank and Trust Company (“State Street Bank”) to serve as sub-administrator. Pursuant to an agreement among Natixis Funds Trusts, Loomis Sayles Funds Trusts, Natixis ETF Trust and Natixis Advisors, the Fund pays Natixis Advisors monthly its pro rata portion of fees equal to an annual rate of 0.0575% of the first $15 billion of the average daily net assets of the Natixis Funds Trusts, Loomis Sayles Funds Trusts and Natixis ETF Trust, 0.0500% of the next $15 billion, 0.0400% of the next $30 billion, 0.0350% of the next $30 billion and 0.0325% of such assets in excess of $90 billion, subject to an annual aggregate minimum fee for the Natixis Funds Trusts, Loomis Sayles Funds Trusts and Natixis ETF Trust of $10 million, which is reevaluated on an annual basis.
For the year ended (period ended for Global Green Bond Fund) December 31, 2017, the administrative fees for each Fund were as follows:
| | | | |
Fund | | Administrative Fees | |
Gateway Fund | | $ | 3,577,170 | |
Gateway Equity Call Premium Fund | | | 35,101 | |
Global Green Bond Fund | | | 9,509 | |
Global Sustainable Equity Fund | | | 26,726 | |
d. Sub-Transfer Agent Fees. Natixis Distribution has entered into agreements, which include servicing agreements, with financial intermediaries that provide recordkeeping, processing, shareholder communications and other services to customers of the intermediaries that hold positions in the Funds and has agreed to compensate the intermediaries for providing those services. Intermediaries transact with the Funds primarily through the use of omnibus accounts on behalf of their customers who hold positions in the Funds. These services would have been provided by the Funds’ transfer agent and other service providers if the shareholders’ accounts were maintained directly
97 |
Notes to Financial Statements (continued)
December 31, 2017
at the Funds’ transfer agent. Accordingly, the Funds have agreed to reimburse Natixis Distribution for all or a portion of the servicing fees paid to these intermediaries. The reimbursement amounts (sub-transfer agent fees) paid to Natixis Distribution are subject to a current per-account equivalent fee limit approved by the Funds’ Board of Trustees, which is based on fees for similar services paid to the Funds’ transfer agent and other service providers. Class N shares do not bear such expenses.
For the year ended (period ended Global Green Bond Fund) December 31, 2017, the sub-transfer agent fees (which are reflected in transfer agent fees and expenses in the Statements of Operations) for each Fund were as follows:
| | | | |
Fund | | Sub-Transfer Agent Fees | |
Gateway Fund | | $ | 4,956,035 | |
Gateway Equity Call Premium Fund | | | 32,990 | |
Global Green Bond Fund | | | 21 | |
Global Sustainable Equity Fund | | | 11,922 | |
As of December 31, 2017, the Funds owe Natixis Distribution the following reimbursements for sub-transfer agent fees (which are reflected in the Statements of Assets and Liabilities as payable to distributor):
| | | | |
Fund | | Reimbursements of Sub-Transfer Agent Fees | |
Gateway Fund | | $ | 60,343 | |
Gateway Equity Call Premium Fund | | | 485 | |
Global Sustainable Equity Fund | | | 345 | |
Sub-transfer agent fees attributable to Class A, Class C and Class Y are allocated on a pro rata basis to each class based on the relative net assets of each class to the total net assets of those classes.
e. Commissions. Commissions (including CDSCs) on Fund shares retained by Natixis Distribution during the year ended December 31, 2017, were as follows:
| | | | |
Fund | | Commissions | |
Gateway Fund | | $ | 207,905 | |
Gateway Equity Call Premium Fund | | | 2,921 | |
Global Sustainable Equity Fund | | | 3,164 | |
f. Trustees Fees and Expenses. The Trusts do not pay any compensation directly to its officers or Trustees who are directors, officers or employees of Natixis Advisors, Natixis Distribution, Natixis or their affiliates. The Chairperson of the Board of Trustees receives a retainer fee at the annual rate of $325,000. The Chairperson does not receive
| 98
Notes to Financial Statements (continued)
December 31, 2017
any meeting attendance fees for Board of Trustees meetings or committee meetings that he attends. Each Independent Trustee (other than the Chairperson) receives, in the aggregate, a retainer fee at the annual rate of $155,000. Each Independent Trustee also receives a meeting attendance fee of $10,000 for each meeting of the Board of Trustees that he or she attends in person and $5,000 for each meeting of the Board of Trustees that he or she attends telephonically. In addition, the chairperson of the Contract Review Committee and the chairperson of the Audit Committee each receive an additional retainer fee at the annual rate of $17,500. The chairperson of the Governance Committee receives an additional retainer fee at the annual rate of $10,000. Each Contract Review Committee member is compensated $6,000 for each Committee meeting that he or she attends in person and $3,000 for each meeting that he or she attends telephonically. Each Audit Committee member is compensated $6,000 for each Committee meeting that he or she attends in person and $3,000 for each meeting that he or she attends telephonically. These fees are allocated among the funds in the Natixis Funds Trusts, Loomis Sayles Funds Trusts and Natixis ETF Trust based on a formula that takes into account, among other factors, the relative net assets of each fund. Trustees are reimbursed for travel expenses in connection with attendance at meetings.
Effective January 1, 2018, the Chairperson of the Board will receive a retainer fee at the annual rate of $340,000, each Independent Trustee (other than the Chairperson) will receive, in the aggregate, a retainer fee at the annual rate of $170,000, the chairperson of the Contract Review Committee and Audit Committee each will receive an additional retainer fee at the annual rate of $20,000 and the chairperson of the Governance Committee will receive an additional retainer fee at the annual rate of $12,000. All other Trustee fees will remain unchanged.
A deferred compensation plan (the “Plan”) is available to the Trustees on a voluntary basis. Deferred amounts remain in the Fund until distributed in accordance with the provisions of the Plan. The value of a participating Trustee’s deferral account is based on theoretical investments of deferred amounts, on the normal payment dates, in certain funds of the Natixis Funds Trusts, Loomis Sayles Funds Trusts, and Natixis ETF Trust as designated by the participating Trustees. Changes in the value of participants’ deferral accounts are allocated pro rata among the funds in the Natixis Funds Trusts, Loomis Sayles Funds Trusts and Natixis ETF Trust, and are normally reflected as Trustees’ fees and expenses in the Statements of Operations. The portions of the accrued obligations allocated to the Fund under the Plan are reflected as Deferred Trustees’ fees in the Statements of Assets and Liabilities.
g. Payment by Affiliates. During the period ended December 31, 2017, Natixis AM US reimbursed Global Green Bond Fund $125 in connection with a trading error.
99 |
Notes to Financial Statements (continued)
December 31, 2017
h. Affiliated Ownership. As of December 31, 2017, the percentage of each Fund’s net assets owned by affiliates is as follows:
| | |
Gateway Equity Call Premium Fund | | Percentage of Net Assets |
Natixis Advisors | | less than 0.01% |
| | | | |
Global Green Bond Fund | | Percentage of Net Assets | |
Natixis Sustainable Future 2015 Fund | | | 4.62 | % |
Natixis Sustainable Future 2020 Fund | | | 4.15 | % |
Natixis Sustainable Future 2025 Fund | | | 2.66 | % |
Natixis Sustainable Future 2030 Fund | | | 1.68 | % |
Natixis Sustainable Future 2035 Fund | | | 1.19 | % |
Natixis Sustainable Future 2040 Fund | | | 0.67 | % |
Natixis Sustainable Future 2045 Fund | | | 0.41 | % |
Natixis Sustainable Future 2050 Fund | | | 0.28 | % |
Natixis Sustainable Future 2055 Fund | | | 0.30 | % |
Natixis Sustainable Future 2060 Fund | | | 0.31 | % |
Natixis and affiliates | | | 83.07 | % |
| | | | |
| | | 99.34 | % |
| | |
Global Sustainable Equity Fund | | Percentage of Net Assets |
Natixis Advisors | | less than 0.01% |
Natixis and affiliates | | 49.29% |
Investment activities of affiliated shareholders could have material impacts on the Fund.
i. Reimbursement of Transfer Agent Fees and Expenses. Natixis Advisors has given a binding contractual undertaking to Gateway Fund, Gateway Equity Call Premium Fund and Global Sustainable Equity Fund to reimburse any and all transfer agency expenses for the Funds’ Class N shares. This undertaking is in effect through April 30, 2018 and is not subject to recovery under the expense limitation agreement described above.
For the period May 1, 2017 through December 31, 2017, Natixis Advisors reimbursed the Funds for transfer agency expenses as follows:
| | | | |
Fund | | Reimbursements of Transfer Agency Expenses Class N | |
Gateway Fund | | $ | 11,954 | |
Gateway Equity Call Premium Fund | | | 92 | |
Global Sustainable Equity Fund | | | 95 | |
| 100
Notes to Financial Statements (continued)
December 31, 2017
7. Class-Specific Transfer Agent Fees and Expenses. Transfer agent fees and expenses attributable to Class A, Class C, and Class Y are allocated on a pro rata basis to each class based on the relative net assets of each class to the total net assets of those classes. Transfer agent fees and expenses attributable to Class N are allocated to Class N.
For the period from May 1, 2017 (February 28, 2017 for Global Green Bond Fund), commencement of Class N operations, through December 31, 2017, the Funds incurred the following class-specific transfer agent fees and expenses (including sub-transfer agent fees, where applicable):
| | | | | | | | | | | | | | | | |
| | | Transfer Agent Fees and Expenses | |
Fund | | Class A | | | Class C | | | Class N | | | Class Y | |
Gateway Fund | | $ | 794,720 | | | $ | 158,237 | | | $ | 11,954 | | | $ | 2,805,281 | |
Gateway Equity Call Premium Fund | | | 3,273 | | | | 204 | | | | 92 | | | | 23,451 | |
Global Green Bond Fund | | | 1,186 | | | | — | | | | 262 | | | | 164 | |
Global Sustainable Equity Fund | | | 303 | | | | 150 | | | | 95 | | | | 13,177 | |
8. Line of Credit. Each Fund, together with certain other funds of Natixis Funds Trusts and Loomis Sayles Funds Trusts, entered into a 364-day, $400,000,000 syndicated, committed, unsecured line of credit with Citibank, N.A. to be used for temporary or emergency purposes only. Any one Fund may borrow up to the full $400,000,000 under the line of credit (as long as all borrowings by all Funds in the aggregate do not exceed the $400,000,000 limit at any time) subject to each Fund’s investment restrictions. Interest is charged to the Funds at a rate equal to the greater of the eurodollar or the federal funds rate plus 1.00%. In addition, a commitment fee of 0.15% per annum, payable on the last business day of each month, is accrued and apportioned among the participating funds based on their average daily unused portion of the line of credit. The Funds paid an arrangement fee, an upfront fee, and other fees in connection with the new line of credit agreement, which are being amortized over a period of 364 days and are reflected as miscellaneous expenses on the Statements of Operations. The unamortized balance is reflected as prepaid expenses on the Statements of Assets and Liabilities.
Prior to April 13, 2017, the commitment fee was 0.10% per annum based on the average daily unused portion of the line of credit.
For the year ended December 31, 2017, none of the Funds had borrowings under these agreements.
9. Payable to Custodian Bank. The Funds’ custodian bank, State Street Bank, provides overdraft protection to the Funds in the event of a cash shortfall. Cash overdrafts bear
101 |
Notes to Financial Statements (continued)
December 31, 2017
interest at a rate per annum equal to the Federal Funds rate plus 2.00%. At December 31, 2017, the Funds had payables to the custodian bank in connection with these overdrafts as follows:
| | | | |
| | | Payable to Custodian Bank | |
Gateway Equity Call Premium Fund | | $ | 278,480 | |
Global Sustainable Equity Fund | | | 660,072 | |
10. Broker Commission Recapture. The Gateway Fund has entered into agreements with certain brokers whereby the brokers will rebate a portion of brokerage commissions. All amounts rebated by the brokers are returned to the Fund under such agreements and are included in realized gains in the Statements of Operations.
For the year ended December 31, 2017, the Fund had no amounts rebated under these agreements.
11. Concentration of Risk. The Global Sustainable Equity Fund and Global Green Bond Fund’s investments in foreign securities are subject to foreign currency fluctuations, higher volatility than U.S. securities, varying degrees of regulation and limited liquidity. Greater political, economic, credit and information risks are also associated with foreign securities.
12. Interest Expense. The Funds may incur interest expense on net cash and foreign currency debit balances, if any, for accounts held at brokers. Interest expense incurred for the year ended December 31, 2017 is reflected on the Statements of Operations.
13. Concentration of Ownership. From time to time, a Fund may have a concentration of one or more accounts constituting a significant percentage of shares outstanding. Investment activities by holders of such accounts could have material impacts on the Funds. As of December 31, 2017, based on management’s evaluation of the shareholder account base, the Funds had accounts representing controlling ownership of more than 5% of the Funds’ total outstanding shares. The number of such accounts, based on accounts that represent more than 5% of an individual class of shares, and the aggregate percentage of net assets represented by such holdings were as follows:
| | | | | | | | | | | | | | | | |
Fund | | Number of 5% Non-Affiliated Account Holders | | | Percentage of Non-Affiliated Ownership | | | Percentage of Affiliated Ownership (Note 6h) | | | Total Percentage of Ownership | |
Gateway Equity Call Premium Fund | | | 2 | | | | 75.22 | % | | | — | | | | 75.22 | % |
Global Green Bond Fund | | | — | | | | — | | | | 99.34 | % | | | 99.34 | % |
Global Sustainable Equity Fund | | | — | | | | — | | | | 49.29 | % | | | 49.29 | % |
| 102
Notes to Financial Statements (continued)
December 31, 2017
Omnibus shareholder accounts for which Natixis Advisors understands that the intermediary has discretion over the underlying shareholder accounts or investment models where a shareholder account may be invested for a non-discretionary customer are included in the table above. For other omnibus accounts, the Funds do not have information on the individual shareholder accounts underlying the omnibus accounts; therefore, there could be other 5% shareholders in addition to those disclosed in the table above.
14. Capital Shares. Each Fund may issue an unlimited number of shares of beneficial interest, without par value. Transactions in capital shares were as follows:
| | | | | | | | | | | | | | | | |
| |
| Year Ended
December 31, 2017 |
| |
| Year Ended
December 31, 2016 |
|
Gateway Fund | | | Shares | | | | Amount | | | | Shares | | | | Amount | |
| Class A | | | | | | | | | | | | | | | | |
Issued from the sale of shares | | | 11,877,615 | | | $ | 380,305,952 | | | | 16,559,714 | | | $ | 491,042,327 | |
Issued in connection with the reinvestment of distributions | | | 501,051 | | | | 16,214,649 | | | | 754,687 | | | | 22,679,772 | |
Redeemed | | | (19,432,242 | ) | | | (625,661,265 | ) | | | (23,117,116 | ) | | | (687,596,539 | ) |
| | | | | | | | | | | | | | | | |
Net change | | | (7,053,576 | ) | | $ | (229,140,664 | ) | | | (5,802,715 | ) | | $ | (173,874,440 | ) |
| | | | | | | | | | | | | | | | |
| Class C | | | | | | | | | | | | | | | | |
Issued from the sale of shares | | | 1,324,365 | | | $ | 42,461,524 | | | | 1,841,324 | | | $ | 54,446,816 | |
Issued in connection with the reinvestment of distributions | | | 30,037 | | | | 965,515 | | | | 61,318 | | | | 1,830,016 | |
Redeemed | | | (3,175,268 | ) | | | (101,409,398 | ) | | | (3,049,870 | ) | | | (90,760,674 | ) |
| | | | | | | | | | | | | | | | |
Net change | | | (1,820,866 | ) | | $ | (57,982,359 | ) | | | (1,147,228 | ) | | $ | (34,483,842 | ) |
| | | | | | | | | | | | | | | | |
| Class N(a) | | | | | | | | | | | | | | | | |
Issued from the sale of shares | | | 3,986,733 | | | $ | 131,101,034 | | | | — | | | $ | — | |
Issued in connection with the reinvestment of distributions | | | 1,728 | | | | 57,339 | | | | — | | | | — | |
Redeemed | | | (215,239 | ) | | | (7,124,210 | ) | | | — | | | | — | |
| | | | | | | | | | | | | | | | |
Net change | | | 3,773,222 | | | $ | 124,034,163 | | | | — | | | $ | — | |
| | | | | | | | | | | | | | | | |
| Class Y | | | | | | | | | | | | | | | | |
Issued from the sale of shares | | | 62,338,029 | | | $ | 2,010,865,299 | | | | 69,770,111 | | | $ | 2,073,132,056 | |
Issued in connection with the reinvestment of distributions | | | 1,918,062 | | | | 62,178,172 | | | | 2,272,929 | | | | 68,355,689 | |
Redeemed | | | (53,219,787 | ) | | | (1,711,701,753 | ) | | | (94,427,074 | ) | | | (2,835,955,065 | ) |
| | | | | | | | | | | | | | | | |
Net change | | | 11,036,304 | | | $ | 361,341,718 | | | | (22,384,034 | ) | | $ | (694,467,320 | ) |
| | | | | | | | | | | | | | | | |
Increase (decrease) from capital share transactions | | | 5,935,084 | | | $ | 198,252,858 | | | | (29,333,977 | ) | | $ | (902,825,602 | ) |
| | | | | | | | | | | | | | | | |
| (a) | From commencement of Class operations on May 1, 2017 through December 31, 2017. |
103 |
Notes to Financial Statements (continued)
December 31, 2017
14. Capital Shares (continued).
| | | | | | | | | | | | | | | | |
| |
| Year Ended
December 31, 2017 |
| |
| Year Ended
December 31, 2016 |
|
Gateway Equity Call Premium Fund | | | Shares | | | | Amount | | | | Shares | | | | Amount | |
| Class A | | | | | | | | | | | | | | | | |
Issued from the sale of shares | | | 535,418 | | | $ | 6,158,261 | | | | 592,010 | | | $ | 6,121,622 | |
Issued in connection with the reinvestment of distributions | | | 5,824 | | | | 67,504 | | | | 5,121 | | | | 53,868 | |
Redeemed | | | (552,465 | ) | | | (6,565,662 | ) | | | (376,732 | ) | | | (3,971,403 | ) |
| | | | | | | | | | | | | | | | |
Net change | | | (11,223 | ) | | $ | (339,897 | ) | | | 220,399 | | | $ | 2,204,087 | |
| | | | | | | | | | | | | | | | |
| Class C | | | | | | | | | | | | | | | | |
Issued from the sale of shares | | | 10,471 | | | $ | 117,776 | | | | 45,956 | | | $ | 492,236 | |
Issued in connection with the reinvestment of distributions | | | 47 | | | | 533 | | | | 111 | | | | 1,192 | |
Redeemed | | | (5,052 | ) | | | (57,315 | ) | | | (1,416 | ) | | | (14,955 | ) |
| | | | | | | | | | | | | | | | |
Net change | | | 5,466 | | | $ | 60,994 | | | | 44,651 | | | $ | 478,473 | |
| | | | | | | | | | | | | | | | |
| Class N(a) | | | | | | | | | | | | | | | | |
Issued from the sale of shares | | | 88 | | | $ | 1,001 | | | | — | | | $ | — | |
Issued in connection with the reinvestment of distributions | | | 1 | | | | 9 | | | | — | | | | — | |
| | | | | | | | | | | | | | | | |
Net change | | | 89 | | | $ | 1,010 | | | | — | | | $ | — | |
| | | | | | | | | | | | | | | | |
| Class Y | | | | | | | | | | | | | | | | |
Issued from the sale of shares | | | 1,249,514 | | | $ | 14,264,592 | | | | 1,581,610 | | | $ | 15,844,856 | |
Issued in connection with the reinvestment of distributions | | | 33,652 | | | | 391,063 | | | | 39,283 | | | | 412,824 | |
Redeemed | | | (1,058,760 | ) | | | (12,154,004 | ) | | | (708,332 | ) | | | (7,241,554 | ) |
| | | | | | | | | | | | | | | | |
Net change | | | 224,406 | | | $ | 2,501,651 | | | | 912,561 | | | $ | 9,016,126 | |
| | | | | | | | | | | | | | | | |
Increase (decrease) from capital share transactions | | | 218,738 | | | $ | 2,223,758 | | | | 1,177,611 | | | $ | 11,698,686 | |
| | | | | | | | | | | | | | | | |
| (a) | From commencement of Class operations on May 1, 2017 through December 31, 2017. |
| 104
Notes to Financial Statements (continued)
December 31, 2017
14. Capital Shares (continued).
| | | | | | | | |
| |
| Period Ended
December 31, 2017(a) |
|
Global Green Bond Fund | | | Shares | | | | Amount | |
| Class A | | | | | | | | |
Issued from the sale of shares | | | 14,126 | | | $ | 142,758 | |
Issued in connection with the reinvestment of distributions | | | 194 | | | | 1,938 | |
Redeemed | | | (320 | ) | | | (3,259 | ) |
| | | | | | | | |
Net change | | | 14,000 | | | $ | 141,437 | |
| | | | | | | | |
| Class N | | | | | | | | |
Issued from the sale of shares | | | 2,537,209 | | | $ | 25,376,096 | |
Issued in connection with the reinvestment of distributions | | | 50,115 | | | | 501,290 | |
Redeemed | | | (515 | ) | | | (5,155 | ) |
| | | | | | | | |
Net change | | | 2,586,809 | | | $ | 25,872,231 | |
| | | | | | | | |
| Class Y | | | | | | | | |
Issued from the sale of shares | | | 4,283 | | | $ | 43,491 | |
Issued in connection with the reinvestment of distributions | | | 68 | | | | 675 | |
Redeemed | | | (24 | ) | | | (235 | ) |
| | | | | | | | |
Net change | | | 4,327 | | | $ | 43,931 | |
| | | | | | | | |
Increase (decrease) from capital share transactions | | | 2,605,136 | | | $ | 26,057,599 | |
| | | | | | | | |
| (a) | From commencement of operations on February 28, 2017 through December 31, 2017. |
105 |
Notes to Financial Statements (continued)
December 31, 2017
14. Capital Shares (continued).
| | | | | | | | | | | | | | | | |
| |
| Year Ended
December 31, 2017 |
| |
| Period Ended
December 31, 2016(a) |
|
Global Sustainable Equity Fund | | | Shares | | | | Amount | | | | Shares | | | | Amount | |
| Class A | | | | | | | | | | | | | | | | |
Issued from the sale of shares | | | 267,864 | | | $ | 3,326,306 | | | | 7,436 | | | $ | 74,105 | |
Issued in connection with the reinvestment of distributions | | | 2,443 | | | | 31,197 | | | | 3 | | | | 30 | |
Redeemed | | | (22,091 | ) | | | (265,777 | ) | | | (301 | ) | | | (3,007 | ) |
| | | | | | | | | | | | | | | | |
Net change | | | 248,216 | | | $ | 3,091,726 | | | | 7,138 | | | $ | 71,128 | |
| | | | | | | | | | | | | | | | |
| Class C | | | | | | | | | | | | | | | | |
Issued from the sale of shares | | | 86,492 | | | $ | 1,050,944 | | | | 5,318 | | | $ | 52,970 | |
Issued in connection with the reinvestment of distributions | | | 372 | | | | 4,700 | | | | 6 | | | | 60 | |
Redeemed | | | (6 | ) | | | (80 | ) | | | (3 | ) | | | (33 | ) |
| | | | | | | | | | | | | | | | |
Net change | | | 86,858 | | | $ | 1,055,564 | | | | 5,321 | | | $ | 52,997 | |
| | | | | | | | | | | | | | | | |
| Class N(b) | | | | | | | | | | | | | | | | |
Issued from the sale of shares | | | 89 | | | $ | 1,001 | | | | — | | | $ | — | |
Issued in connection with the reinvestment of distributions | | | 1 | | | | 13 | | | | — | | | | — | |
| | | | | | | | | | | | | | | | |
Net change | | | 90 | | | $ | 1,014 | | | | — | | | $ | — | |
| | | | | | | | | | | | | | | | |
| Class Y | | | | | | | | | | | | | | | | |
Issued from the sale of shares | | | 2,401,416 | | | $ | 29,617,275 | | | | 4,997,044 | | | $ | 50,979,075 | |
Issued in connection with the reinvestment of distributions | | | 47,449 | | | | 607,824 | | | | 9,961 | | | | 99,208 | |
Redeemed | | | (2,507,120 | ) | | | (31,220,521 | ) | | | (3,612 | ) | | | (35,781 | ) |
| | | | | | | | | | | | | | | | |
Net change | | | (58,255 | ) | | $ | (995,422 | ) | | | 5,003,393 | | | $ | 51,042,502 | |
| | | | | | | | | | | | | | | | |
Increase (decrease) from capital share transactions | | | 276,909 | | | $ | 3,152,882 | | | | 5,015,852 | | | $ | 51,166,627 | |
| | | | | | | | | | | | | | | | |
| (a) | From commencement of operations on March 31, 2016 through December 31, 2016. |
| (b) | From commencement of Class operations on May 1, 2017 through December 31, 2017. |
| 106
Report of Independent Registered Public Accounting Firm
To the Board of Trustees of Natixis Funds Trust I and Gateway Trust and Shareholders of Mirova Global Sustainable Equity Fund, Mirova Global Green Bond Fund, Gateway Fund, and Gateway Equity Call Premium Fund
Opinions on the Financial Statements
We have audited the accompanying statements of assets and liabilities, including the portfolios of investments, of Mirova Global Sustainable Equity Fund and Mirova Global Green Bond Fund (two of the funds constituting the Natixis Funds Trust I), and Gateway Fund and Gateway Equity Call Premium Fund (constituting the Gateway Trust) (hereafter collectively referred to as the “Funds”) as of December 31, 2017, the related statements of operations for the year ended December 31, 2017 and for Mirova Global Green Bond Fund for the period February 28, 2017 (commencement of operations) through December 31, 2017 and the statements of changes in net assets for each of the two years in the period ended December 31, 2017 and for Mirova Global Green Bond Fund for the period February 28, 2017 (commencement of operations) through December 31, 2017, including the related notes, and each of the financial highlights for each of the periods indicated therein, (collectively referred to as the “financial statements”). In our opinion, the financial statements present fairly, in all material respects, the financial position of each of the Funds as of December 31, 2017, the results of each of their operations for the year ended December 31, 2017 and for Mirova Global Green Bond Fund for the period February 28, 2017 (commencement of operations) through December 31, 2017 and the changes in each of their net assets for each of the two years in the period ended December 31, 2017 and for Mirova Global Green Bond Fund for the period February 28, 2017 (commencement of operations) through December 31, 2017 and each of the financial highlights for each of the periods indicated therein in conformity with accounting principles generally accepted in the United States of America.
Basis for Opinions
These financial statements are the responsibility of the Funds’ management. Our responsibility is to express an opinion on the Funds’ financial statements based on our audits. We are a public accounting firm registered with the Public Company Accounting Oversight Board (United States) (“PCAOB”) and are required to be independent with respect to the Funds in accordance with the U.S. federal securities laws and the applicable rules and regulations of the Securities and Exchange Commission and the PCAOB.
We conducted our audits of these financial statements in accordance with the standards of the PCAOB. Those standards require that we plan and perform the audit to obtain reasonable assurance about whether the financial statements are free of material misstatement, whether due to error or fraud.
107 |
Report of Independent Registered Public Accounting Firm
Our audits included performing procedures to assess the risks of material misstatement of the financial statements, whether due to error or fraud, and performing procedures that respond to those risks. Such procedures included examining, on a test basis, evidence regarding the amounts and disclosures in the financial statements. Our audits also included evaluating the accounting principles used and significant estimates made by management, as well as evaluating the overall presentation of the financial statements. Our procedures included confirmation of securities owned as of December 31, 2017 by correspondence with the custodian, and brokers; when replies were not received from brokers, we performed other auditing procedures. We believe that our audits provide a reasonable basis for our opinions.
/s/ PricewaterhouseCoopers LLP
Boston, Massachusetts
February 22, 2018
We have served as the auditor of one or more investment companies in the Natixis Investment Company Complex since at least 1995. We have not determined the specific year we began serving as auditor.
| 108
2017 U.S. Tax Distribution Information to Shareholders (Unaudited)
Qualified Dividend Income. For the fiscal year ended December 31, 2017, a percentage of the ordinary income dividends paid by the Funds are considered qualified dividend income eligible for reduced tax rates. These lower rates range from 0% to 20% depending on an individual’s tax bracket. If the Funds paid a distribution during calendar year 2017, complete information will be reported in conjunction with Form 1099-DIV. These percentages are noted below:
| | | | |
Fund | | Qualifying Percentage | |
Gateway Fund | | | 100.00 | % |
Gateway Equity Call Premium Fund | | | 100.00 | % |
Global Sustainable Equity Fund | | | 100.00 | % |
Corporate Dividends Received Deduction. For the fiscal year ended December 31, 2017, a percentage of dividends distributed by the Funds listed below qualify for the dividends received deduction for corporate shareholders. These percentages are as follows:
| | | | |
Fund | | Qualifying Percentage | |
Gateway Fund | | | 100.00 | % |
Gateway Equity Call Premium Fund | | | 100.00 | % |
Global Sustainable Equity Fund | | | 81.73 | % |
Capital Gains Distributions. Pursuant to Internal Revenue Section 852(b), the following Funds paid distributions, which have been designated as capital gains distributions for the fiscal year ended December 31, 2017.
| | | | |
Fund | | Amount | |
Global Sustainable Equity Fund | | $ | 488,562 | |
109 |
Additional Information
Special Meeting of Shareholders. (Unaudited)
A special meeting of shareholders of the Trust was held on December 4, 2017 to consider a proposal to elect thirteen Trustees to the Board of Trustees. The proposal was approved by shareholders of the Trust. The results of the shareholder vote were as follows:
| | | | | | | | |
Nominee | | Voted “For”* | | | Withheld* | |
Kevin P. Charleston | | | 233,890,693.096 | | | | 6,209,538.246 | |
Kenneth A. Drucker | | | 233,707,978.096 | | | | 6,392,253.246 | |
Edmond J. English | | | 233,858,499.131 | | | | 6,241,732.211 | |
David L. Giunta | | | 233,857,367.196 | | | | 6,242,864.146 | |
Richard A. Goglia | | | 233,817,239.203 | | | | 6,282,992.139 | |
Wendell J. Knox | | | 233,762,076.619 | | | | 6,338,154.723 | |
Martin T. Meehan | | | 233,773,892.231 | | | | 6,326,339.111 | |
Maureen B. Mitchell | | | 233,865,538.888 | | | | 6,234,692.454 | |
Sandra O. Moose** | | | 233,586,124.726 | | | | 6,514,106.616 | |
James P. Palermo | | | 233,873,514.619 | | | | 6,226,716.723 | |
Erik R. Sirri | | | 233,815,725.203 | | | | 6,284,506.139 | |
Peter J. Smail | | | 233,855,335.619 | | | | 6,244,895.723 | |
Cynthia L. Walker | | | 233,850,990.781 | | | | 6,249,240.561 | |
| | | | | | | | |
Nominee | | Voted “For”* | | | Withheld* | |
Kevin P. Charleston | | | 370,772,225.201 | | | | 2,295,844.378 | |
Kenneth A. Drucker | | | 370,283,839.168 | | | | 2,784,230.411 | |
Edmond J. English | | | 370,659,753.916 | | | | 2,408,315.663 | |
David L. Giunta | | | 370,784,195.912 | | | | 2,283,873.667 | |
Richard A. Goglia | | | 370,460,463.208 | | | | 2,607,606.371 | |
Wendell J. Knox | | | 370,534,122.392 | | | | 2,533,947.187 | |
Martin T. Meehan | | | 370,538,829.643 | | | | 2,529,239.936 | |
Maureen B. Mitchell | | | 370,919,944.816 | | | | 2,148,124.763 | |
Sandra O. Moose** | | | 370,426,616.935 | | | | 2,641,452.644 | |
James P. Palermo | | | 370,643,215.858 | | | | 2,424,853.721 | |
Erik R. Sirri | | | 370,711,200.752 | | | | 2,356,868.827 | |
Peter J. Smail | | | 370,588,393.592 | | | | 2,479,675.987 | |
Cynthia L. Walker | | | 370,711,120.477 | | | | 2,356,949.102 | |
| * | Trust-wide voting results. |
| ** | Ms. Moose retired as a Trustees effective January 1, 2018. |
| 110
Trustee and Officer Information
The tables below provide certain information regarding the trustees and officers of Natixis Funds Trust I and Gateway Trust (the “Trusts”). Unless otherwise indicated, the address of all persons below is 888 Boylston Street, Suite 800, Boston, MA 02199-8197. The Funds’ Statements of Additional Information include additional information about the trustees of the Trusts and are available by calling Natixis Funds at 800-225-5478.
| | | | | | | | |
Name and Year of Birth | | Position(s) Held with the Trusts, Length of Time Served and Term of Office1 | | Principal Occupation(s) During Past 5 Years | | Number of Portfolios in Fund Complex Overseen2 and Other Directorships Held During Past 5 Years | | Experience, Qualifications, Attributes, Skills for Board Membership |
|
| INDEPENDENT TRUSTEES |
| | | | |
Kenneth A. Drucker (1945) | | Chairperson of the Board of Trustees since January 2017 Trustee since 2008 Ex Officio member of Audit Committee, Contract Review Committee and Governance Committee | | Retired | | 54 None | | Significant experience on the Board and on the boards of other business organizations (including at investment companies); executive experience (including as treasurer of an aerospace, automotive, and metal manufacturing corporation) |
| | | | |
Edmond J. English (1953) | | Trustee since 2013 Audit Committee Member and Governance Committee Member | | Executive Chairman; formerly, Chief Executive Officer of Bob’s Discount Furniture (retail) | | 54 Director, Burlington Stores, Inc. (retail) | | Significant experience on the Board and significant experience on the boards of other business organizations (including retail companies and a bank); executive experience (including at a retail company) |
111 |
Trustee and Officer Information
| | | | | | | | |
Name and Year of Birth | | Position(s) Held with the Trusts, Length of Time Served and Term of Office1 | | Principal Occupation(s) During Past 5 Years | | Number of Portfolios in Fund Complex Overseen2 and Other Directorships Held During Past 5 Years | | Experience, Qualifications, Attributes, Skills for Board Membership |
| | | |
INDEPENDENT TRUSTEES continued | | | | | | |
| | | | |
Richard A. Goglia (1951) | | Trustee since 2015 Audit Committee Member | | Retired; formerly Vice President and Treasurer of Raytheon Company (defense) | | 54 None | | Experience on the Board and executive experience (including his role as vice president and treasurer of a defense company and experience at a financial services company) |
| | | | |
Wendell J. Knox (1948) | | Trustee since 2009 Contract Review Committee Member and Governance Committee Member | | Director of Abt Associates Inc. (research and consulting) | | 54 Director, Eastern Bank (bank); Director, The Hanover Insurance Group (property and casualty insurance) | | Significant experience on the Board and on the boards of other business organizations (including at a bank and at a property and casualty insurance firm); executive experience (including roles as president and chief executive officer of a research and consulting company) |
| 112
Trustee and Officer Information
| | | | | | | | |
Name and Year of Birth | | Position(s) Held with the Trusts, Length of Time Served and Term of Office1 | | Principal Occupation(s) During Past 5 Years | | Number of Portfolios in Fund Complex Overseen2 and Other Directorships Held During Past 5 Years | | Experience, Qualifications, Attributes, Skills for Board Membership |
| | | |
INDEPENDENT TRUSTEES continued | | | | | | |
| | | | |
Martin T. Meehan (1956) | | Trustee since 2012 Audit Committee Member | | President, University of Massachusetts; formerly, Chancellor and faculty member, University of Massachusetts Lowell | | 54 None | | Significant experience on the Board and on the boards of other business organizations; experience as President of the University of Massachusetts; government experience (including as a member of the U.S. House of Representatives); academic experience |
| | | | |
Maureen B. Mitchell3 (1951) | | Trustee since 2017 Contract Review Committee Member | | Retired; formerly President, Global Sales and Marketing, GE Asset Management, Inc. (financial services) | | 54 None | | Experience on the Board; financial services industry and executive experience (including role as president of global sales and marketing at a financial services company) |
113 |
Trustee and Officer Information
| | | | | | | | |
Name and Year of Birth | | Position(s) Held with the Trusts, Length of Time Served and Term of Office1 | | Principal Occupation(s) During Past 5 Years | | Number of Portfolios in Fund Complex Overseen2 and Other Directorships Held During Past 5 Years | | Experience, Qualifications, Attributes, Skills for Board Membership |
| | | |
INDEPENDENT TRUSTEES continued | | | | | | |
| | | | |
James P. Palermo (1955) | | Trustee since 2016 Contract Review Committee Member | | Founding Partner, Breton Capital Management, LLC (private equity); Partner, STEP Partners, LLC (private equity); formerly, Chief Executive Officer of Global Client Management of The Bank of New York Mellon Corporation | | 54 None | | Experience on the Board; financial services industry and executive experience (including roles as chief executive officer of client management and asset servicing for a banking and financial services company) |
| | | | |
Erik R. Sirri (1958) | | Trustee since 2009 Chairperson of the Audit Committee | | Professor of Finance at Babson College | | 54 None | | Significant experience on the Board; experience as Director of the Division of Trading and Markets at the Securities and Exchange Commission; academic experience; training as an economist |
| | | | |
Peter J. Smail (1952) | | Trustee since 2009 Chairperson of the Contract Review Committee and Governance Committee Member | | Retired | | 54 None | | Significant experience on the Board; mutual fund industry and executive experience (including roles as president and chief executive officer for an investment adviser) |
| 114
Trustee and Officer Information
| | | | | | | | |
Name and Year of Birth | | Position(s) Held with the Trusts, Length of Time Served and Term of Office1 | | Principal Occupation(s) During Past 5 Years | | Number of Portfolios in Fund Complex Overseen2 and Other Directorships Held During Past 5 Years | | Experience, Qualifications, Attributes, Skills for Board Membership |
| | | |
INDEPENDENT TRUSTEES continued | | | | | | |
| | | | |
Cynthia L. Walker (1956) | | Trustee since 2005 for Natixis Funds Trust I and since 2007 for Gateway Trust Chairperson of the Governance Committee and Audit Committee Member | | Deputy Dean for Finance and Administration, Yale University School of Medicine | | 54 None | | Significant experience on the Board; executive experience in a variety of academic organizations (including roles as dean for finance and administration) |
|
| INTERESTED TRUSTEES |
| | | | |
Kevin P. Charleston4 (1965) One Financial Center Boston, MA 02111 | | Trustee since 2015 | | President, Chief Executive Officer and Chairman of the Board of Directors; formerly, Chief Financial Officer, Loomis, Sayles & Company, L.P. | | 54 None | | Experience on the Board; continuing service as President, Chief Executive Officer and Chairman of the Board of Directors of Loomis, Sayles & Company, L.P. |
| | | | |
David L. Giunta5 (1965) | | Trustee since 2011 President and Chief Executive Officer since 2008 | | President and Chief Executive Officer, Natixis Advisors, L.P., Natixis Distribution, L.P., Natixis Distribution Corporation and Chairman of the Board of Natixis Distribution Corporation. | | 54 None | | Significant experience on the Board; experience as President and Chief Executive Officer, Natixis Advisors, L.P., Natixis Distribution, L.P., Natixis Distribution Corporation and Chairman of the Board of Natixis Distribution Corporation. |
115 |
Trustee and Officer Information
| 1 | Each trustee serves until retirement, resignation or removal from the Board. The current retirement age is 75. The position of Chairperson of the Board is appointed for a three-year term. |
| 2 | The trustees of the Trusts serve as trustees of a fund complex that includes all series of the Natixis Funds Trust I, Natixis Funds Trust II, Natixis Funds Trust IV and Gateway Trust (collectively, the “Natixis Funds Trusts”), Loomis Sayles Funds I and Loomis Sayles Funds II (collectively, the “Loomis Sayles Funds Trusts”) and Natixis ETF Trust (collectively, the “Fund Complex”). |
| 3 | Ms. Mitchell was appointed as a Trustee effective July 1, 2017. |
| 4 | Mr. Charleston is deemed an “interested person” of the Trusts because he holds the following positions with an affiliated person of the Trusts: President, Chief Executive Officer and Chairman of the Board of Directors of Loomis, Sayles & Company, L.P. |
| 5 | Mr. Giunta is deemed an “interested person” of the Trusts because he holds the following positions with an affiliated person of the Trusts: President and Chief Executive Officer, Natixis Advisors, L.P., Natixis Distribution, L.P., Natixis Distribution Corporation and Chairman of the Board of Natixis Distribution Corporation. |
| 116
Trustee and Officer Information
| | | | | | |
Name and Year of Birth | | Position(s) Held with the Trusts | | Term of Office1 and Length of Time Served | | Principal Occupation(s) During Past 5 Years2 |
| | |
| OFFICERS OF THE TRUSTS | | | | |
| | | |
Russell L. Kane
(1969) | | Secretary, Clerk and Chief Legal Officer | | Since July 2016 | | Executive Vice President, General Counsel, Secretary and Clerk, Natixis Distribution Corporation, Natixis Advisors, L.P. and Natixis Distribution, L.P.; formerly, Chief Compliance Officer for Mutual Funds, Senior Vice President, Deputy General Counsel, Assistant Secretary and Assistant Clerk, Natixis Distribution Corporation, Natixis Advisors, L.P. and Natixis Distribution, L.P. |
| | | |
Michael C. Kardok
(1959) | | Treasurer, Principal Financial and Accounting Officer | | Since October 2004 for Natixis Funds Trust I and since May 2007 for Gateway Trust | | Senior Vice President, Natixis Advisors, L.P. and Natixis Distribution, L.P. |
| | | |
Rosa Licea-Mailloux
(1976) | | Chief Compliance Officer, Assistant Secretary and Anti-Money Laundering Officer | | Since July 2016 | | Senior Vice President, Deputy General Counsel, Assistant Secretary and Assistant Clerk, Natixis Distribution Corporation, Natixis Advisors, L.P. and Natixis Distribution, L.P.; formerly, Associate General Counsel, Natixis Distribution, L.P. |
| 1 | Each officer of the Trusts serves for an indefinite term in accordance with the Trusts’ current by-laws until the date his or her successor is elected and qualified, or until he or she sooner dies, retires, is removed or becomes disqualified. |
| 2 | Each person listed above, except as noted, holds the same position(s) with the Fund Complex. Previous positions during the past five years with Natixis Distribution, L.P., Natixis Advisors, L.P. or Loomis, Sayles & Company, L.P. are omitted, if not materially different from an officer’s current position with such entity. |
117 |
ANNUAL REPORT
December 31, 2017

Loomis Sayles Multi-Asset Income Fund
Loomis Sayles Strategic Alpha Fund
Natixis U.S. Equity Opportunities Fund

TABLE OF CONTENTS
Portfolio Review page 1
Portfolio of Investments page 23
Financial Statements page 71
Notes to Financial Statements page 89
LOOMIS SAYLES MULTI-ASSET INCOME FUND
| | |
| Managers | | Symbols |
| Thomas Fahey | | Class A IIDPX |
| Kevin P. Kearns | | Class C CIDPX |
| Maura T. Murphy, CFA® | | Class N LMINX |
| Loomis, Sayles & Company, L.P. | | Class Y YIDPX |
Investment Goal
The Fund seeks current income with a secondary objective of capital appreciation.
Market Conditions
Risk assets rallied during the 12-month period, fueled by improving fundamentals across the globe. Performance was broadly positive across many asset classes, led by US and global equities. Fixed income performance was also strong as domestic and global credit, US bank loans, sovereign bonds and local-currency emerging market bonds earned positive total returns.
Despite some tense political and social headlines, global equity markets took their cue from the economy and performed well during the period. Strong corporate earnings, stable low interest rates, benign inflation and robust consumer confidence led markets to new record highs on a monthly basis. Anticipation and realization of meaningful US corporate tax reform also provided support.
The US dollar trended lower for much of the year, and as a result, many developed and emerging markets generated strong gains. Emerging market countries continued to benefit from improving corporate health and economic growth.
High yield credit was a leading asset class throughout the period, benefiting from the “risk-on” environment and the search for yield. The rebound in corporate profits around the globe provided an additional tailwind to the sector.
Portfolio Review
For the 12 months ended December 31, 2017, Class Y shares of the Loomis Sayles Multi-Asset Income Fund returned 12.77%. The Fund outperformed its benchmark, the Bloomberg Barclays U.S. Aggregate Bond Index, which returned 3.54%.
Explanation of Fund Performance
The Fund’s allocation to US equities, which were supported by generally positive macroeconomic data, strong corporate earnings and stable low interest rates, contributed to performance during the period. Robust quarterly results from individual companies and US dollar weakness provided additional tailwinds as US equities recorded new highs. Sentiment was undimmed by increased political uncertainty as tensions rose on the Korean Peninsula and the US administration failed to realize its policy goals for most of the year. Technology, consumer cyclical and consumer non-cyclical names added the most to return.
1 |
Global equities also posted substantial gains during the period, as economic growth improved around the world, supported by stable expansion and benign inflation. Improved investor sentiment and growth supported higher valuations in the euro zone. In Asia, improved economic conditions and currency stability helped equity markets post solid returns. The Fund’s global equity holdings in the banking, consumer cyclical and technology sectors were among the leading contributors to performance. In addition, European preferred securities in the banking space, which have delivered outstanding returns since the Brexit vote in 2016, continued to add value during the period.
Emerging market exposure also boosted performance during the period. Ongoing geopolitical uncertainty continued to generate volatility in certain pockets, leading investors to trim risk positions and lock in profits ahead of the year-end. However, the sector benefited for much of the period from the weakening US dollar, a rebound in corporate profits and improving GDP growth. Exposure to the energy, financial and consumer non-cyclical segments had the greatest positive impact on the Fund’s performance.
High yield corporate bonds also bolstered return as spreads (the difference in yield between non-Treasury and Treasury securities of similar maturity) tightened during the period, despite brief periods of volatility driven by concerns about the impact of US tax reform on high yield companies, the late stage of the credit cycle1 and speculation about Federal Reserve (Fed) policy. Nonetheless, risk appetite remained strong during most of the period. While high yield fundamentals remain supportive given the prospect of tax and economic reforms in the US, weaker mutual fund flows into the asset class may be indicating investor uneasiness. Within the Fund’s high yield allocation, individual energy, communications and banking names were the strongest contributors to return.
The Fund’s exposure to master limited partnerships (MLPs), expressed through exchange-traded funds (ETFs) and exchange-traded notes (ETNs), detracted from performance even as energy prices rallied during the period. The Fund exited these positions in August; the MLP market continued to underperform until very late in the fourth quarter when valuations began to appear more attractive and clarity around the US administration’s tax plan emerged. Additionally, investor confidence was negatively impacted when several large partnerships openly talked about cutting distributions to unitholders.
Outlook
There is a great deal of debate about what the neutral federal funds rate should be (the rate that would neither stimulate nor restrain economic growth). Given this uncertainty, we believe the Fed ought to be wary of hiking rates too quickly, which could cause a low and flattening US yield curve (the yield curve depicts the relationship among bond yields across the maturity spectrum). We expect three rate hikes in 2018. The recent curve flattening probably has much to do with the Treasury’s recent refunding announcement, which stated its intention to issue more securities in the belly, or middle, of the curve, but it is also consistent with the notion that the current federal funds rate may not be far from a neutral setting.
| 1 | A credit cycle is a cyclical pattern that follows credit availability and corporate health. |
| 2
LOOMIS SAYLES MULTI-ASSET INCOME FUND
Our bottom-up analysis points to increased stability in 2018, as the credit cycle has been extended and commodity-centric industries are now in or on the brink of recovery. The outlook for synchronized global growth and rising global profits are key themes that we expect will support credit assets in 2018. US tax reform, while largely priced, should also provide support.
Growth in emerging markets has picked up and is expected to continue improving. While inflation trends are mixed, emerging market economies have been strengthening. The improvement in global trade has had positive implications for the more open economies within the asset class. Additionally, the tailwind from the stabilization in commodities is expected to carry into 2018. Meanwhile, European fundamentals improved throughout 2017 and remain notably better than US fundamentals. We remain cautious about the potential for corporate releveraging but are not overly concerned at this point due to the improving global growth outlook.
During periods in which the US dollar appreciates relative to foreign currencies, funds that hold non-US-dollar-denominated bonds may realize currency losses in connection with the maturity or sale of certain bonds. These losses impact a fund’s ordinary income distributions (to the extent that losses are not offset by realized currency gains within the fund’s fiscal year). A recognized currency loss, in accordance with federal tax rules, decreases the amount of ordinary income a fund has available to distribute, even though these bonds continue to generate coupon income.
Fund officers have analyzed the fund’s current portfolio of investments, schedule of maturities and the corresponding amounts of unrealized currency losses that may become realized in the fiscal year ending on December 31, 2018. Based on this analysis, fund officers believe that realized currency losses may have less of an impact on this fund’s distributions in the 2018 fiscal year. This analysis is based on certain assumptions, including but not limited to the level of foreign currency exchange rates, security prices, interest rates, fund advisers’ ability to manage realized currency losses and the net asset level of the fund. Changes to these assumptions could materially impact the analysis and the amounts of future fund distributions. Fund officers will continue to monitor on a regular basis and take the necessary actions required to manage the fund’s distributions to address realized currency losses while seeking to avoid a return of capital distribution.
3 |
Hypothetical Growth of $100,000 Investment in Class Y Shares1,4,5
December 31, 2007 through December 31, 2017
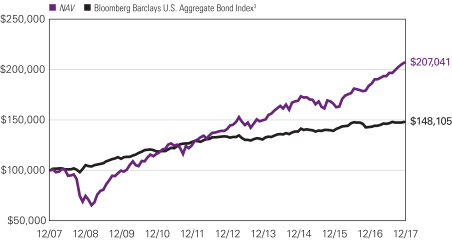
See notes to chart on page 5.
Top Ten Holdings as of December 31, 2017
| | | | | | |
| | | Security name | | % of
net assets | |
| 1 | | SPDR® Blackstone / GSO Senior Loan ETF | | | 2.84 | % |
| 2 | | JPMorgan Chase & Co. | | | 2.03 | |
| 3 | | UnitedHealth Group, Inc. | | | 1.57 | |
| 4 | | Automatic Data Processing, Inc. | | | 1.47 | |
| 5 | | Gol LuxCo S.A., 1st Lien Term Loan, 6.500%, 8/31/2020 | | | 1.46 | |
| 6 | | Apple, Inc. | | | 1.42 | |
| 7 | | Delta Air Lines, Inc. | | | 1.36 | |
| 8 | | United Technologies Corp. | | | 1.34 | |
| 9 | | Accor S.A. | | | 1.29 | |
| 10 | | Daimler AG | | | 1.27 | |
The portfolio is actively managed and holdings are subject to change. There is no guarantee the Fund continues to invest in the securities referenced. The holdings listed exclude any temporary cash investments.
| 4
LOOMIS SAYLES MULTI-ASSET INCOME FUND
Average Annual Total Returns — December 31, 20174,5
| | | | | | | | | | | | | | | | | | | | | | | | |
| | | | | | | | | | | | | | | Expense Ratios6 | |
| | | 1 Year | | | 5 Years | | | 10 Years | | | Life of
Class N | | | Gross | | | Net | |
| | | | | | | |
| Class Y (Inception 12/3/12)1 | | | | | | | | | | | | | | | | | | | | | | | | |
| NAV | | | 12.77 | % | | | 7.94 | % | | | 7.54 | % | | | — | % | | | 0.97 | % | | | 0.83 | % |
| | | | | | | |
| Class A (Inception 11/17/05) | | | | | | | | | | | | | | | | | | | | | | | | |
| NAV | | | 12.41 | | | | 7.75 | | | | 7.45 | | | | — | | | | 1.22 | | | | 1.08 | |
| With 4.25% Maximum Sales Charge | | | 7.62 | | | | 6.81 | | | | 6.98 | | | | — | | | | | | | | | |
| | | | | | | |
| Class C (Inception 11/17/05) | | | | | | | | | | | | | | | | | | | | | | | | |
| NAV | | | 11.70 | | | | 6.95 | | | | 6.65 | | | | — | | | | 1.97 | | | | 1.83 | |
| With CDSC2 | | | 10.70 | | | | 6.95 | | | | 6.65 | | | | — | | | | | | | | | |
| | | | | | | |
| Class N (Inception 8/31/15) | | | | | | | | | | | | | | | | | | | | | | | | |
| NAV | | | 12.83 | | | | — | | | | — | | | | 10.81 | | | | 13.66 | | | | 0.78 | |
| | | | | | | |
| Comparative Performance | | | | | | | | | | | | | | | | | | | | | | | | |
| Bloomberg Barclays U.S. Aggregate Bond Index3 | | | 3.54 | | | | 2.10 | | | | 4.01 | | | | 2.69 | | | | | | | | | |
Performance data shown represents past performance and is no guarantee of, and not necessarily indicative of, future results. Total return and value will vary, and you may have a gain or loss when shares are sold. Current performance may be lower or higher than quoted. For most recent month-end performance, visit im.natixis.com/performance. Performance for other share classes will be greater or less than shown based on differences in fees and sales charges. You may not invest directly in an index. Performance for periods less than one year is cumulative, not annualized. Returns reflect changes in share price and reinvestment of dividends and capital gains, if any. The table(s) do not reflect taxes shareholders might owe on any fund distributions or when they redeem their shares.
| 1 | Prior to the inception of Class Y shares (12/3/2012), performance is that of Class A shares and reflects the higher net expenses of that share class. |
| 2 | Class C share performance assumes a 1.00% contingent deferred sales charge (“CDSC”) applied when you sell shares within one year of purchase. |
| 3 | The Bloomberg Barclays U.S. Aggregate Bond Index is an unmanaged index that covers the U.S.-dollar denominated, investment grade, fixed-rate, taxable bond market of SEC-registered securities. The index includes bonds from the Treasury, government-related, corporate, mortgage-backed securities, asset-backed securities, and collateralized mortgage-backed securities sectors. |
| 4 | Fund performance has been increased by fee waivers and/or expense reimbursements, if any, without which performance would have been lower. |
| 5 | Prior to the stock market close August 31, 2015, the Fund had multiple subadvisers. The performance results shown above for the periods prior to the stock market close August 31, 2015 reflect results achieved by those subadvisers using different investment strategies. |
| 6 | Expense ratios are as shown in the Fund’s prospectus in effect as of the date of this report. The expense ratios for the current reporting period can be found in the Financial Highlights section of this report under Ratios to Average Net Assets. Net expenses reflect contractual expense caps set to expire on 4/30/18. When a Fund’s expenses are below the cap, gross and net expense ratios will be the same. See Note 6 of the Notes to Financial Statements for more information about the Fund’s expense caps. |
5 |
LOOMIS SAYLES STRATEGIC ALPHA FUND
| | |
| Managers | | Symbols |
| Matthew J. Eagan, CFA® | | Class A LABAX |
| Kevin P. Kearns | | Class C LABCX |
| Todd P. Vandam, CFA® | | Class N LASNX |
| Loomis, Sayles & Company, L.P. | | Class Y LASYX |
Investment Goal
The Fund seeks to provide an attractive absolute total return, complemented by prudent investment management designed to manage risks and protect investor capital. The secondary goal of the Fund is to achieve these returns with relatively low volatility.
Market Conditions
Risk assets rallied during the period, fueled by improving fundamentals across the globe. Performance was broadly positive across many asset classes, led by US and global equities. Fixed income performance was also strong as domestic and global credit, US bank loans, sovereign bonds and local-currency emerging market bonds earned positive total returns.
High yield credit was a leading asset class throughout the period, benefiting from the “risk-on” environment and the search for yield. Improving corporate profits around the globe provided an additional tailwind to the sector.
The US dollar trended lower for much of the year, and as a result, many developed and emerging markets generated strong gains. Emerging market countries continued to benefit from improving corporate health and economic growth.
Portfolio Review
For the 12 months ended December 31, 2017, Class Y Shares of the Loomis Sayles Strategic Alpha Fund returned 3.38% at net asset value. The Fund outperformed its benchmark, the 3-month London Interbank Offered Rate (LIBOR), which returned 1.10%. The Fund follows an absolute return strategy and is not managed to an index.
Explanation of Fund Performance
Exposure to securitized assets, particularly commercial mortgage-backed securities (CMBS) and non-agency residential mortgage-backed securities (RMBS), contributed to performance as fundamentals remained stable. Positive sentiment supported spread tightening and all securitized sectors posted positive returns during the period (spread represents the yield differential between non-Treasury and Treasury securities of similar maturity).
High yield corporate bonds aided the Fund’s return as spreads tightened during the period, despite brief bouts of volatility driven by concerns about the impact of US tax reform on high yield companies, the late stage of the credit cycle1 and speculation about Federal Reserve (Fed) policy. Nonetheless, risk appetite remained strong during most of the period.
| 1 | A credit cycle is a cyclical pattern that follows credit availability and corporate health. |
| 6
LOOMIS SAYLES STRATEGIC ALPHA FUND
While high yield fundamentals remain supportive given the prospect of tax and economic reforms in the US, weaker mutual fund flows into the asset class may be indicating investor uneasiness. Within the Fund’s high yield allocation, individual energy, consumer non-cyclical and capital goods names contributed to performance the most.
Investment grade corporate bonds boosted the Fund’s performance as spreads tightened, ending the period at their narrowest level in several years. The “risk-on” tone remained in place for most of the period as solid economic numbers, stronger oil prices and further clarity around tax reform provided support. The segment’s positive contributions were led by energy and communications names.
Emerging market exposure also bolstered return during the period. Ongoing geopolitical uncertainty continued to generate volatility in certain pockets, leading investors to trim risk positions and lock in profits ahead of the year-end. However, the sector benefited for much of the period from the weakening US dollar, a rebound in corporate profits and improving GDP growth. Exposure to the energy, capital goods and consumer non-cyclical segments led the contributions within the space.
Among detractors, currency positioning, which included the use of currency forwards, weighed on performance. The US dollar weakened versus most developed market currencies during much of the period as investors focused on accelerating growth outside the US, most notably in the euro area and emerging markets, and a string of weak US inflation readings. As a result, short positions in the euro, Canadian dollar and Taiwan dollar hampered return.
The Fund’s risk management tools, primarily the use of equity index futures and options and interest rate futures, detracted from return. Most of the decline can be attributed to short positions in the S&P 500® Index, the Russell 2000® Index and an equity financial exchange-traded fund (ETF), as equity markets rallied during the period. Furthermore, various positions in US interest rate futures weighed on performance as we sought to hedge the impact of movements in the yield curve (the yield curve depicts the relationship among bond yields across the maturity spectrum). We continue to use these tools in seeking to limit the Fund’s downside exposure.
Outlook
There is a great deal of debate about what the neutral federal funds rate should be (the rate that would neither stimulate nor restrain economic growth). Given this uncertainty, we believe the Fed ought to be wary of hiking rates too quickly, which could cause a low and flattening US yield curve. We expect three rate hikes in 2018. The recent curve flattening probably has much to do with the Treasury’s recent refunding announcement, which stated its intention to issue more securities in the belly, or middle, of the curve, but it is also consistent with the notion that the current federal funds rate may not be far from a neutral setting.
Our bottom-up analysis points to increased stability in 2018, as the credit cycle has been extended and commodity-centric industries are now in or on the brink of recovery. The outlook for synchronized global growth and rising global profits are key themes that we
7 |
expect will support credit assets in 2018. US tax reform, while largely priced, should also provide support.
Growth in emerging markets has picked up and is expected to continue improving. While inflation trends are mixed, emerging market economies have been strengthening. The improvement in global trade has had positive implications for the more open economies within the asset class. Additionally, the tailwind from the stabilization in commodities is expected to carry into 2018. Meanwhile, European fundamentals improved throughout 2017 and remain notably better than US fundamentals. We remain cautious about the potential for corporate releveraging but are not overly concerned at this point due to the improving global growth outlook.
During periods in which the US dollar appreciates relative to foreign currencies, funds that hold non-US-dollar-denominated bonds may realize currency losses in connection with the maturity or sale of certain bonds. These losses impact a fund’s ordinary income distributions (to the extent that losses are not offset by realized currency gains within the fund’s fiscal year). A recognized currency loss, in accordance with federal tax rules, decreases the amount of ordinary income a fund has available to distribute, even though these bonds continue to generate coupon income.
Fund officers have analyzed the fund’s current portfolio of investments, schedule of maturities and the corresponding amounts of unrealized currency losses that may become realized in the fiscal year ending on December 31, 2018. Based on this analysis, fund officers believe that realized currency losses may have less of an impact on this fund’s distributions in the 2018 fiscal year. This analysis is based on certain assumptions, including but not limited to the level of foreign currency exchange rates, security prices, interest rates, fund advisers’ ability to manage realized currency losses and the net asset level of the fund. Changes to these assumptions could materially impact the analysis and the amounts of future fund distributions. Fund officers will continue to monitor on a regular basis and take the necessary actions required to manage the fund’s distributions to address realized currency losses while seeking to avoid a return of capital distribution.
| 8
LOOMIS SAYLES STRATEGIC ALPHA FUND
Hypothetical Growth of $100,000 Investment in Class Y Shares4
December 15, 2010 (inception) through December 31, 2017
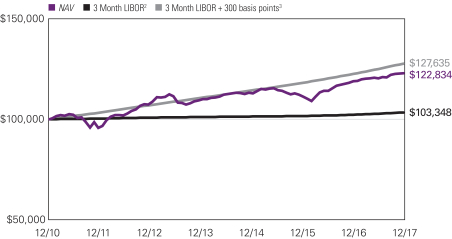
9 |
Average Annual Total Returns — December 31, 20174
| | | | | | | | | | | | | | | | | | | | | | | | |
| | | | | |
| | | | | | | | | | | | Expense Ratios5 | |
| | | 1 Year6 | | | 5 Years | | | Life of Class | | | Gross | | | Net | |
| | | | | | | |
| Class Y (Inception 12/15/10) | | | | | | | | | | | Class A/C/Y | | | | Class N | | | | | | | | | |
| NAV | | | 3.38 | % | | | 2.47 | % | | | 2.97 | % | | | — | % | | | 0.75 | % | | | 0.75 | % |
| | | | | | | |
| Class A (Inception 12/15/10) | | | | | | | | | | | | | | | | | | | | | | | | |
| NAV | | | 3.11 | | | | 2.20 | | | | 2.72 | | | | — | | | | 1.00 | | | | 1.00 | |
| With 4.25% Maximum Sales Charge | | | -1.29 | | | | 1.32 | | | | 2.09 | | | | — | | | | | | | | | |
| | | | | | | |
| Class C (Inception 12/15/10) | | | | | | | | | | | | | | | | | | | | | | | | |
| NAV | | | 2.42 | | | | 1.44 | | | | 1.93 | | | | — | | | | 1.75 | | | | 1.75 | |
| With CDSC1 | | | 1.42 | | | | 1.44 | | | | 1.93 | | | | — | | | | | | | | | |
| | | | | | | |
| Class N (Inception 5/1/17) | | | | | | | | | | | | | | | | | | | | | | | | |
| NAV | | | — | | | | — | | | | — | | | | 2.01 | | | | 0.68 | | | | 0.68 | |
| | | | | | | |
| Comparative Performance | | | | | | | | | | | | | | | | | | | | | | | | |
| 3-Month LIBOR2 | | | 1.10 | | | | 0.50 | | | | 0.47 | | | | 0.78 | | | | | | | | | |
| 3-Month LIBOR + 300 basis points3 | | | 4.18 | | | | 3.56 | | | | 3.52 | | | | 2.82 | | | | | | | | | |
Performance data shown represents past performance and is no guarantee of, and not necessarily indicative of, future results. Total return and value will vary, and you may have a gain or loss when shares are sold. Current performance may be lower or higher than quoted. For most recent month-end performance, visit im.natixis.com/performance. Performance for other share classes will be greater or less than shown based on differences in fees and sales charges. You may not invest directly in an index. Performance for periods less than one year is cumulative, not annualized. Returns reflect changes in share price and reinvestment of dividends and capital gains, if any. The table(s) do not reflect taxes shareholders might owe on any fund distributions or when they redeem their shares.
| 1 | Performance for Class C shares assumes a 1% contingent deferred sales charge (“CDSC”) applied when you sell shares within one year of purchase. |
| 2 | 3-Month LIBOR, or the London Interbank Offered Rate, represents the average rate at which a leading bank, for a given currency (in this case U.S. dollars), can obtain unsecured funding, and is representative of short-term interest rates. |
| 3 | 3-Month LIBOR +300 basis points is created by adding 3.00% to the annual return of 3-Month LIBOR. The calculation is performed on a monthly basis and is subject to the effects of compounding. |
| 4 | Fund performance has been increased by fee waivers and/or expense reimbursements, if any, without which performance would have been lower. |
| 5 | Expense ratios are as shown in the Fund’s prospectus in effect as of the date of this report. The expense ratios for the current reporting period can be found in the Financial Highlights section of this report under Ratios to Average Net Assets. Net expenses reflect contractual expense caps set to expire on 4/30/19. When a Fund’s expenses are below the cap, gross and net expense ratios will be the same. See Note 6 of the Notes to Financial Statements for more information about the Fund’s expense caps. |
| 6 | Generally accepted accounting principles require adjustments to be made to the net assets of the Fund for financial reporting purposes only, and as such, the total returns reflected above are different from the total returns reported in the financial highlights. The returns presented in the table above are what an investor would have actually experienced. |
| 10
NATIXIS U.S. EQUITY OPPORTUNITIES FUND
| | |
| Managers | | Symbols |
| Large Cap Value Segment | | Class A NEFSX |
| Harris Associates L.P. | | Class C NECCX |
| All Cap Growth Segment | | Class N NESNX |
| Loomis, Sayles & Company, L.P. | | Class Y NESYX |
Investment Goal
The Fund seeks long-term growth of capital.
Market Conditions
The market and economic environment entered the year on an uncertain note, with the inauguration of president-elect Donald Trump looming, but ended the year on a surprisingly strong note. Eight years after the end of the Great Recession, the economy finally found its footing as the stock markets registered new highs. These market gains were surprisingly broad-based, with markets in both developed and emerging markets notching significant gains. Those gains were bolstered by a trend of widespread gross domestic product (GDP) growth. Even countries that have struggled, such as those in southern Europe, are participating in the gains. Trade growth is rebounding as energy prices firm up.
Unemployment continued to trend downwards in the US. Wages have lagged. However, a tax cut passed just before the end of the year sparked optimism that lower taxes, coupled with a shortage of workers in many industries, will change that equation heading into 2018. The Federal Reserve Board expressed confidence in the economic recovery, planning several interest rate increases in the coming year. The dollar slid during the year, benefiting US exporters after years of increases. The euro rallied against the dollar, reflecting improvement in the euro zone’s economic outlook.
Performance Results
For the 12 months ended December 31, 2017, Class Y shares of Natixis U.S. Equity Opportunities Fund returned 26.60% at net asset value. The Fund outperformed its primary benchmark, the S&P 500® Index, which returned 21.83%. The Fund also outperformed its secondary benchmark, the Russell 1000® Index, which returned 21.69%.
Explanation of Fund Performance
Each of the portfolio’s segments uses a distinct investment style, providing shareholders with exposure to a variety of different stocks:
| · | | The Harris Associates L.P. Large Cap Value segment invests primarily in the common stocks of larger-capitalization companies that Harris Associates believes are trading at a substantial discount to the company’s “true business value.” |
| · | | The Loomis, Sayles & Company, L.P. All Cap Growth segment invests in equity securities, including common stocks, preferred stocks, convertible securities and warrants. This segment may invest in companies of any size. |
11 |
Both segments contributed positively to the overall return of the Fund during the year.
Harris Associates Large Cap Value Segment
As value investors with an emphasis on individual stock selection, our sector weights are a byproduct of our bottom-up process. On an absolute-return basis, shares in the information technology sector gained the most value, while holdings in the energy sector posted the only negative return for calendar 2017.
The largest contributor to Fund performance for the year was Caterpillar. The company delivered positive earnings reports throughout 2017. In its first quarter, the company’s revenue and cash flow both exceeded our expectations. Caterpillar’s business mix, abnormally low period costs and cost absorption on building inventory levels worked to expand margins, especially in the construction industries and resource industries segments. Caterpillar’s second quarter earnings per share of $1.49 far outpaced market expectations of $1.26, and revenue increased about $1 billion from last year, surpassing forecasts by roughly 3%. We were especially impressed that construction industry segment margins continue to expand and reached an all-time record for the period, despite sales remaining below normalized levels. Similar to results over the past few quarters, Caterpillar’s third quarter earnings per share ($1.95) handily beat market projections ($1.27), and revenues exceeded investors’ expectations by nearly 7%. Caterpillar held an investor day in September and highlighted its new corporate strategy. The main focus of this strategy is achieving economic value-added growth through improved operational efficiency, higher revenue from services, expanded product offerings and improved resource allocation. While these objectives seemed familiar, we like that the company has now implemented a greater emphasis on accountability, organizational acceptance and a sense of urgency to optimize business performance.
General Electric (GE) was the largest detractor from Fund performance in the calendar year. The company issued second-quarter earnings that were in line with expectations. However, the vague and downbeat nature of management’s earnings call concerned investors and caused share price weakness. In the fourth quarter, GE’s share price reacted negatively to 1) third quarter results that fell short of market expectations, 2) several analysts’ downgrades and 3) news of CFO Jeffrey Bornstein’s departure. We believe Bornstein’s departure indicates that newly appointed CEO John Flannery is quickly establishing a strong culture of accountability and that “business as usual” will no longer be tolerated. Newly appointed CFO Jamie Miller has held multiple positions at GE, most recently as head of GE Transportation. In mid-November, Flannery announced a “reset” during which he established a new lower base for the company’s earnings by cutting 2018 earnings guidance and its dividend by 50%. We expect Flannery to reduce costs aggressively, which should improve earnings. We like that GE’s business model includes manufacturing and selling original equipment, as well as offering long-duration service contracts for that equipment, which provides ongoing revenue streams from its client base. GE has been a very frustrating holding, as business fundamentals have lagged our expectations. However, we continue to remain shareholders because we believe the stock has declined more than warranted by the fundamentals.
| 12
NATIXIS U.S. EQUITY OPPORTUNITIES FUND
Loomis, Sayles & Company All Cap Growth Segment
For the period, the All Cap Growth segment posted a positive absolute return. We are an active manager with a long-term, private equity approach to investing. Through our proprietary bottom-up research framework, we look to invest in those few high-quality businesses with sustainable competitive advantages and profitable growth when they trade at a significant discount to intrinsic value (our estimate of the true worth of a business, which we define as the present value of all expected future net cash flows to the company). Our holdings in the information technology, consumer discretionary, healthcare, consumer staples, financials and industrials sectors contributed to results. Our holdings in the energy and materials sectors detracted from the segment’s performance.
Alibaba Group, Amazon, and Facebook were among the largest contributors during the period. Alibaba Group is a leading commerce and consumer-engagement platform provider in China. The company operates several increasingly connected businesses across commerce, technology, advertising, digital media and entertainment, logistics, payments, and local services. The company’s core commerce segment represents approximately 85% of total revenues and operates marketplaces that bring together both retail and wholesale buyers and sellers. These include two leading marketplace sites in China: Taobao, a consumer-to-consumer and small business retail marketplace, and Tmall, its business-to-consumer platform. Alibaba’s strong and sustainable competitive advantages include the power of its platform, network and business ecosystem, its scale, and brand strength. The company’s businesses collectively form a powerful ecosystem, providing Alibaba with unique insights that facilitate e-commerce and enable merchants and brands to engage with customers across the entire consumer lifecycle via an unparalleled platform that would be difficult to replicate. As more buyers come to the sites, more sellers want to come and vice versa. This virtuous cycle is a competitive advantage called a network effect. Alibaba’s scale serves to strengthen the power of its network and ecosystem. We estimate over 70% of China’s e-commerce transactions take place through Taobao and Tmall. Alibaba’s brand is nearly synonymous with e-commerce in China because its founding and success coincided with the rise of the country’s e-commerce industry.
Alibaba reported fundamentally strong results during the period, and revenue growth accelerated to the fastest rate since the initial public offering (IPO) for what is now a much larger company. Benefiting from strong customer engagement and innovation, Alibaba’s gross merchandise volume (GMV) increased at a higher rate than the growth in China’s retail sector. During its June investor day presentation, Alibaba issued revenue growth guidance of 45% to 49% for fiscal year 2018, well above consensus expectations that were closer to 30%. Monthly mobile active users recently totaled 549 million, a number almost 70% greater than the population of the United States, and per-user monetization improved as growing consumer engagement allows delivery of more personalized content which, in turn, improves e-commerce monetization. The long-term structural expansion of internet users and online shopping are drivers of secular growth for Alibaba in China, where because of a lack of traditional retail infrastructure, e-commerce is expanding consumption rather than simply replacing offline spending. Alibaba continues to execute well on its business model, allowing it to expand its already dominant market position and to invest to
13 |
strengthen its competitive advantages. The total addressable retail market in China today is estimated at over $4.8 trillion and e-commerce makes up about 16% or approximately $750 billion. Over our long-term investment horizon, we estimate the e-commerce market can approach 30% of the total retail market in China. We believe the current market price embeds expectations for key revenue and cash flow growth drivers that are well below our long-term assumptions.
Online retailer Amazon offers millions of products — sold by Amazon or by third parties — with the value proposition to consumers of selection, price, and convenience. Amazon’s enterprise IT business, Amazon Web Services (AWS), offers a suite of secure, on-demand cloud-computing services, with a value proposition to clients of speed, agility and savings. In both of its core markets, Amazon possesses strong and sustainable competitive advantages that would be difficult for competitors to replicate. In e-commerce these include its brand, scale, network advantage, technology platform, and logistics and distribution systems. The AWS business benefits from its massive scale, which allows it to pass along cost savings while continuing to innovate. The company reported healthy fundamentals and strong growth in revenue during the period. With GMV growing, we estimate, well above our estimate of growth in the teens for US e-commerce and low single-digit growth in global retail sales, the company continued to take market share. AWS also posted impressive revenue growth, exceeding an $18 billion annual run rate, that was many multiples higher than our estimate of single-digit growth in overall enterprise IT spending. Under the thoughtful leadership of founder Jeff Bezos, Amazon continued rapid investment in key areas that capitalize on its strength, focusing on businesses with high, durable growth prospects and strong financial returns. Investments year to date included global fulfillment capability, AWS geographic coverage, the acquisition of organic grocer Whole Foods, Prime Video, and investments in Japan, India, China and Mexico. With an increasing shift to higher-margin product categories such as third-party sales, AWS, and advertising, gross margins expanded during the period. The company also generated strong levels of operating and free cash flow. Amazon is one of the best-positioned companies in e-commerce and enterprise IT — each addressing large, underpenetrated markets — where secular growth is still in its early stages. We believe the current share price shows a lack of appreciation for Amazon’s significant long-term growth opportunities and the sustainability of its business model.
Social media company Facebook provides an online platform that allows people to connect, share and interact with friends and communities. With a user base that grew 18% year over year to 2.1 billion, representing approximately two-thirds of the world’s internet users outside of China, Facebook is one of very few platforms where advertisers can reach consumers at such scale. User data, coupled with the scale and frequency of engagement, allows Facebook an unprecedented ability to specifically target direct marketing. Demonstrating the strength of its platform, network effect, and the virtuous cycle between users and advertising partners, the company reported robust revenue growth throughout the period, and advertising revenue per user grew strongly, reflecting improved monetization in all regions. Growing at more than twice the rate of its online competitors, by our estimates, and many multiples faster than traditional advertisers, Facebook continued to gain market
| 14
NATIXIS U.S. EQUITY OPPORTUNITIES FUND
share. Facebook’s strong financial model adds to the quality of its business. Free cash flow generation remained robust during the period, with an impressive conversion rate of revenue to free cash flow in excess of 40%. The global structural shift from traditional advertising to online advertising is the secular growth driver for Facebook. Online advertising accounts for about 20% of the $900 billion annual spending in global advertising and marketing, having more than doubled in the last five years. We believe a large gap remains between time spent online by consumers and the current level of online advertising. Capturing about 15% of the online advertising market, which represents a low single-digit percentage of the annual global advertising expenditure, we believe Facebook is well positioned for strong, sustained growth over our investment time horizon. We believe the expectations embedded in Facebook’s current share price show a lack of appreciation for the company’s growth opportunities and the sustainability of its business model. We believe the shares of Facebook, Alibaba and Amazon each trade at a significant discount to our estimate of intrinsic value and offer compelling reward-to-risk opportunities.
Schlumberger, Qualcomm and Under Armour were among the largest detractors during the period.
Schlumberger is the world’s leading supplier of technology, equipment, integrated project management, and information solutions to the international oil and gas exploration and production industry. Over its 90-year history, Schlumberger has built a brand and reputation for delivering consistent service and product excellence across the spectrum of exploration, drilling, and production. Only a few companies can compete with the scope of Schlumberger’s integrated suite of products and services, and even fewer can compete with the scale and depth of its technology and service execution. The company reported global sales that were lower compared with the year-ago period. In markets outside of North America, which accounted for approximately 75% of revenue, the company continued to experience low demand for its oilfield services given the lower oil price environment. However, Schlumberger reported improved results in North America during the period, with strong growth in regional rig count as well as in hydraulic fracturing revenue, where the company redeployed idle capacity to accommodate growing well completion activity. While the company’s margins were lower compared to the year-ago period, Schlumberger has maintained exemplary margins and cash flow for this point in the cycle, and continued to invest to strengthen its ability to offer integrated solutions to clients. Schlumberger generated $2.3 billion of free cash flow over the past twelve months and ended the period with $12.2 billion in net debt, and cash and investments of $4.9 billion. We believe these results highlight the company’s high-quality characteristics, its strong execution, and its proactive management of costs and resources. Increasing consumption in emerging markets and the need to replace naturally depleting reservoirs create long-term secular growth in the demand for oil and the need to extract hydrocarbons from harsher environments. Oilfield services like those Schlumberger provides are key to accessing difficult-to-reach resources. Thanks to its superior products and services and its competitive advantages, we believe Schlumberger is well positioned to weather the current environment and capitalize on the growth in oilfield services as the market supply-demand normalizes.
15 |
Qualcomm designs, manufactures, and markets digital telecommunication integrated circuits (chipsets) and services, and is the global market share leader in 3G and 4G integrated circuits. As the pioneer of 3G and 4G technology, the company’s primary competitive advantage is its cumulative intellectual property (IP) which took decades to build and very strong engineering skill in designing and manufacturing the basebands and modems used in wireless devices. This advantage is very difficult to replicate. Qualcomm operates essentially as a monopoly given its extensive portfolio of IP that is the globally accepted standard for 3G and 4G wireless technologies. Although the company reported revenues that were in line with or better than consensus expectations, a lawsuit filed in early 2017 by Apple alleging unfair practices resulted in a substantial near-term decline in royalty revenues and associated segment margins, which led to a decline in share value. Shares rebounded sharply in November on an unsolicited bid from Broadcom to acquire Qualcomm for $70 per share, which was unanimously rejected by Qualcomm’s Board of Directors on the grounds that it substantially undervalues the company relative to its leadership position and growth prospects in mobile technology. Challenges to Qualcomm’s business model and royalty rates are not new. Over the last two decades, Qualcomm has successfully defended its business model numerous times, establishing a body of legal precedent in a variety of jurisdictions around the world, most recently in China. In our view, Apple’s challenges to Qualcomm’s business model are no different from previous challenges, except for Apple’s aggressiveness in its pursuit. This is not necessarily indicative that Apple has a strong case. We believe the decades-long industry practice that has been repeatedly validated, and is backed by regulations around the world, is not likely to be overturned. Additionally, we believe the proposed offer from Broadcom, while highlighting the value of Qualcomm’s IP, undervalues Qualcomm’s business, assigning little value to the company’s royalty model, which we believe will remain intact. We like the long-term positioning of Qualcomm as a stand-alone company to benefit from the long-term secular growth in mobile devices.
We initiated a new position in Under Armour during the period. Through its focus on innovation and performance-centric sports apparel, footwear, and accessories, Under Armour has grown to be the third-leading global brand in sportswear, after Nike and Adidas. We believe a key competitive advantage for Under Armour is its brand. Strong in North America and with growing international recognition, Under Armour is a brand for which consumers are willing to pay a premium. The company also has the scale to compete globally through marketing, distribution, buying power and industry influence. Led by its founder Kevin Plank, over our investment horizon we believe the company can grow well in excess of the mid-single-digit growth in the underlying $300 billion global sportswear market, driven largely by international expansion opportunities and growth in its footwear business. We also expect operating profits will grow faster than revenues, driving long-term operating profit growth, and estimate that free cash flow growth will improve as currently elevated capital investments normalize over time. We believe the market price embeds expectations that the industry downturn that began in 2015 will persist, and thereby is embedding growth and profitability assumptions for the business that are substantially below our estimates for the company’s long-term growth. We believe the shares of Under Armour, Schlumberger and Qualcomm are selling at a significant discount to our estimates of intrinsic value and offer compelling reward-to-risk opportunities.
| 16
NATIXIS U.S. EQUITY OPPORTUNITIES FUND
Hypothetical Growth of $100,000 Investment in Class Y Shares4
December 31, 2007 through December 31, 2017
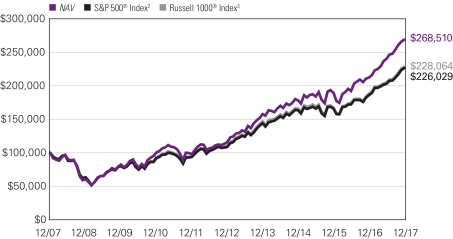
Top Ten Holdings as of December 31, 2017
| | | | | | |
| | | Security name | | % of
net assets | |
| 1 | | Oracle Corp. | | | 3.70 | % |
| 2 | | Visa, Inc., Class A | | | 3.66 | |
| 3 | | Alphabet, Inc., Class A | | | 3.61 | |
| 4 | | Alibaba Group Holding Ltd., Sponsored ADR | | | 3.57 | |
| 5 | | Facebook, Inc., Class A | | | 3.14 | |
| 6 | | Amazon.com, Inc. | | | 3.10 | |
| 7 | | Monster Beverage Corp. | | | 2.63 | |
| 8 | | Citigroup, Inc. | | | 2.52 | |
| 9 | | Cisco Systems, Inc. | | | 2.27 | |
| 10 | | Autodesk, Inc. | | | 2.13 | |
The portfolio is actively managed and holdings are subject to change. There is no guarantee the Fund continues to invest in the securities referenced. The holdings listed exclude any temporary cash investments.
17 |
Average Annual Total Returns — December 31, 20174
| | | | | | | | | | | | | | | | | | | | | | | | |
| | | | | | | | | | | | | | | Expense Ratios5 | |
| | | 1 Year | | | 5 Years | | | 10 Years | | | Life of
Class N | | | Gross | | | Net | |
| | | | | | | |
| Class Y (Inception 11/15/94) | | | | | | | | | | | | | | | | | | | | | | | | |
| NAV | | | 26.60 | % | | | 18.34 | % | | | 10.37 | % | | | — | % | | | 0.93 | % | | | 0.93 | % |
| | | | | | | |
| Class A (Inception 7/7/94) | | | | | | | | | | | | | | | | | | | | | | | | |
| NAV | | | 26.28 | | | | 18.05 | | | | 10.10 | | | | — | | | | 1.18 | | | | 1.18 | |
| With 5.75% Maximum Sales Charge | | | 19.01 | | | | 16.66 | | | | 9.45 | | | | — | | | | | | | | | |
| | | | | | | |
| Class C (Inception 7/7/94) | | | | | | | | | | | | | | | | | | | | | | | | |
| NAV | | | 25.35 | | | | 17.16 | | | | 9.27 | | | | — | | | | 1.93 | | | | 1.93 | |
| With CDSC1 | | | 24.35 | | | | 17.16 | | | | 9.27 | | | | — | | | | | | | | | |
| | | | | | | |
| Class N (Inception 5/1/17) | | | | | | | | | | | | | | | | | | | | | | | | |
| NAV | | | — | | | | — | | | | — | | | | 16.78 | | | | 0.84 | | | | 0.84 | |
| | | | | | | |
| Comparative Performance | | | | | | | | | | | | | | | | | | | | | | | | |
| S&P 500® Index2 | | | 21.83 | | | | 15.79 | | | | 8.50 | | | | 13.50 | | | | | | | | | |
| Russell 1000® Index3 | | | 21.69 | | | | 15.71 | | | | 8.59 | | | | 13.35 | | | | | | | | | |
Performance data shown represents past performance and is no guarantee of, and not necessarily indicative of, future results. Total return and value will vary, and you may have a gain or loss when shares are sold. Current performance may be lower or higher than quoted. For most recent month-end performance, visit im.natixis.com/performance. Performance for other share classes will be greater or less than shown based on differences in fees and sales charges. You may not invest directly in an index. Performance for periods less than one year is cumulative, not annualized. Returns reflect changes in share price and reinvestment of dividends and capital gains, if any. The table(s) do not reflect taxes shareholders might owe on any fund distributions or when they redeem their shares.
| 1 | Performance for Class C shares assumes a 1.00% contingent deferred sales charge (“CDSC”) applied when you sell shares within one year of purchase. |
| 2 | S&P 500® Index is a widely recognized measure of U.S. stock market performance. It is an unmanaged index of 500 common stocks chosen for market size, liquidity, and industry group representation, among other factors. |
| 3 | Russell 1000® Index measures the performance of the large-cap segment of the U.S. equity universe. It is a subset of the Russell 3000® Index and includes approximately 1000 of the largest securities based on a combination of their market cap and current index membership. The Russell 1000® Index represents approximately 92% of the U.S. market and is constructed to provide a comprehensive and unbiased barometer for the large-cap segment and is completely reconstituted annually to ensure new and growing equities are reflected. |
| 4 | Fund performance has been increased by fee waivers and/or expense reimbursements, if any, without which performance would have been lower. |
| 5 | Expense ratios are as shown in the Fund’s prospectus in effect as of the date of this report. The expense ratios for the current reporting period can be found in the Financial Highlights section of this report under Ratios to Average Net Assets. Net expenses reflect contractual expense caps set to expire on 4/30/19. When a Fund’s expenses are below the cap, gross and net expense ratios will be the same. See Note 6 of the Notes to Financial Statements for more information about the Fund’s expense caps. |
| 18
ADDITIONAL INFORMATION
The views expressed in this report reflect those of the portfolio managers as of the dates indicated. The managers’ views are subject to change at any time without notice based on changes in market or other conditions. References to specific securities or industries should not be regarded as investment advice. Because the Funds are actively managed, there is no assurance that they will continue to invest in the securities or industries mentioned.
All investing involves risk, including the risk of loss. There is no assurance that any investment will meet its performance objectives or that losses will be avoided.
ADDITIONAL INDEX INFORMATION
This document may contain references to third party copyrights, indexes, and trademarks, each of which is the property of its respective owner. Such owner is not affiliated with Natixis Investment Managers or any of its related or affiliated companies (collectively “Natixis affiliates”) and does not sponsor, endorse or participate in the provision of any Natixis affiliates services, funds or other financial products.
The index information contained herein is derived from third parties and is provided on an “as is” basis. The user of this information assumes the entire risk of use of this information. Each of the third party entities involved in compiling, computing or creating index information, disclaims all warranties (including, without limitation, any warranties of originality, accuracy, completeness, timeliness, non-infringement, merchantability and fitness for a particular purpose) with respect to such information.
PROXY VOTING INFORMATION
A description of the Natixis Funds’ proxy voting policies and procedures is available without charge, upon request, by calling Natixis Funds at 800-225-5478; on Natixis Funds’ website at im.natixis.com; and on the Securities and Exchange Commission’s (SEC) website at www.sec.gov. Information regarding how Natixis Funds voted proxies relating to portfolio securities during the most recent 12-month period ended June 30 is available from Natixis Funds’ website and the SEC’s website.
QUARTERLY PORTFOLIO SCHEDULES
Natixis Funds file a complete schedule of portfolio holdings with the SEC for the first and third quarters of each fiscal year on Form N-Q. The Funds’ Forms N-Q are available on the SEC’s website at www.sec.gov and may be reviewed and copied at the SEC’s Public Reference Room in Washington, DC. Information on the operation of the Public Reference Room may be obtained by calling 800-SEC-0330.
19 |
UNDERSTANDING FUND EXPENSES
As a mutual fund shareholder, you incur different costs: transaction costs, including sales charges (loads) on purchases and contingent deferred sales charges on redemptions, and ongoing costs, including management fees, distribution and/or service fees (12b-1 fees), and other fund expenses. Certain exemptions may apply. These costs are described in more detail in the Funds’ prospectus. The following examples are intended to help you understand the ongoing costs of investing in the Funds and help you compare these with the ongoing costs of investing in other mutual funds.
The first line in the table of each class of Fund shares shows the actual account values and actual Fund expenses you would have paid on a $1,000 investment in the Fund from July 1, 2017 through December 31, 2017. To estimate the expenses you paid over the period, simply divide your account value by $1,000 (for example $8,600 account value divided by $1,000 = 8.60) and multiply the result by the number in the Expenses Paid During Period column as shown for your class.
The second line in the table for each class of Fund shares provides information about hypothetical account values and hypothetical expenses based on the Fund’s actual expense ratios and an assumed rate of return of 5% per year before expenses, which is not the Fund’s actual return. The hypothetical account values and expenses may not be used to estimate the actual ending account balance or expenses you paid on your investment for the period. You may use this information to compare the ongoing costs of investing in the Fund and other funds. To do so, compare this 5% hypothetical example with the 5% hypothetical examples that appear in the shareholder reports of the other funds.
Please note that the expenses shown reflect ongoing costs only, and do not include any transaction costs, such as sales charges. Therefore, the second line in the table of each Fund is useful in comparing ongoing costs only, and will not help you determine the relative costs of owning different funds. If transaction costs were included, total costs would be higher.
| 20
| | | | | | | | | | | | |
LOOMIS SAYLES MULTI-ASSET INCOME
FUND | | BEGINNING
ACCOUNT VALUE
7/1/2017 | | | ENDING
ACCOUNT VALUE
12/31/2017 | | | EXPENSES PAID
DURING PERIOD*
7/1/2017 – 12/31/2017 | |
Class A | | | | | | | | | | | | |
Actual | | | $1,000.00 | | | | $1,066.90 | | | | $4.95 | |
Hypothetical (5% return before expenses) | | | $1,000.00 | | | | $1,020.42 | | | | $4.84 | |
Class C | | | | | | | | | | | | |
Actual | | | $1,000.00 | | | | $1,063.00 | | | | $8.84 | |
Hypothetical (5% return before expenses) | | | $1,000.00 | | | | $1,016.64 | | | | $8.64 | |
Class N | | | | | | | | | | | | |
Actual | | | $1,000.00 | | | | $1,068.10 | | | | $3.39 | |
Hypothetical (5% return before expenses) | | | $1,000.00 | | | | $1,021.93 | | | | $3.31 | |
Class Y | | | | | | | | | | | | |
Actual | | | $1,000.00 | | | | $1,068.60 | | | | $3.65 | |
Hypothetical (5% return before expenses) | | | $1,000.00 | | | | $1,021.68 | | | | $3.57 | |
| * | Expenses are equal to the Fund’s annualized expense ratio (after waiver/reimbursement): 0.95%, 1.70%, 0.65% and 0.70% for Class A, C, N and Y, respectively, multiplied by the average account value over the period, multiplied by the number of days in the most recent fiscal half-year (184), divided by 365 (to reflect the half-year period). |
| | | | | | | | | | | | |
LOOMIS SAYLES STRATEGIC ALPHA
FUND | | BEGINNING
ACCOUNT VALUE
7/1/2017 | | | ENDING
ACCOUNT VALUE
12/31/2017** | | | EXPENSES PAID
DURING PERIOD*
7/1/2017 – 12/31/2017** | |
Class A | | | | | | | | | | | | |
Actual | | | $1,000.00 | | | | $1,020.20 | | | | $5.09 | |
Hypothetical (5% return before expenses) | | | $1,000.00 | | | | $1,020.16 | | | | $5.09 | |
Class C | | | | | | | | | | | | |
Actual | | | $1,000.00 | | | | $1,016.20 | | | | $8.89 | |
Hypothetical (5% return before expenses) | | | $1,000.00 | | | | $1,016.38 | | | | $8.89 | |
Class N | | | | | | | | | | | | |
Actual | | | $1,000.00 | | | | $1,021.80 | | | | $3.57 | |
Hypothetical (5% return before expenses) | | | $1,000.00 | | | | $1,021.68 | | | | $3.57 | |
Class Y | | | | | | | | | | | | |
Actual | | | $1,000.00 | | | | $1,021.50 | | | | $3.82 | |
Hypothetical (5% return before expenses) | | | $1,000.00 | | | | $1,021.43 | | | | $3.82 | |
| * | Expenses are equal to the Fund’s annualized expense ratio (after waiver/reimbursement): 1.00%, 1.75%, 0.70% and 0.75% for Class A, C, N and Y, respectively, multiplied by the average account value over the period, multiplied by the number of days in the most recent fiscal half-year (184), divided by 365 (to reflect the half-year period). |
| ** | Generally accepted accounting principles require adjustments to be made to the net assets of the Fund at period end for financial reporting purposes. Amounts expressed in the table include the effect of such adjustments. |
21 |
| | | | | | | | | | | | |
NATIXIS U.S. EQUITY OPPORTUNITIES
FUND | | BEGINNING
ACCOUNT VALUE
7/1/2017 | | | ENDING
ACCOUNT VALUE
12/31/2017 | | | EXPENSES PAID
DURING PERIOD*
7/1/2017 – 12/31/2017 | |
Class A | | | | | | | | | | | | |
Actual | | | $1,000.00 | | | | $1,116.20 | | | | $6.24 | |
Hypothetical (5% return before expenses) | | | $1,000.00 | | | | $1,019.31 | | | | $5.96 | |
Class C | | | | | | | | | | | | |
Actual | | | $1,000.00 | | | | $1,112.30 | | | | $10.22 | |
Hypothetical (5% return before expenses) | | | $1,000.00 | | | | $1,015.53 | | | | $9.75 | |
Class N | | | | | | | | | | | | |
Actual | | | $1,000.00 | | | | $1,118.80 | | | | $3.90 | |
Hypothetical (5% return before expenses) | | | $1,000.00 | | | | $1,021.53 | | | | $3.72 | |
Class Y | | | | | | | | | | | | |
Actual | | | $1,000.00 | | | | $1,117.70 | | | | $4.91 | |
Hypothetical (5% return before expenses) | | | $1,000.00 | | | | $1,020.57 | | | | $4.69 | |
| * | Expenses are equal to the Fund’s annualized expense ratio (after waiver/reimbursement): 1.17%, 1.92%, 0.73% and 0.92% for Class A, C, N and Y, respectively, multiplied by the average account value over the period, multiplied by the number of days in the most recent fiscal half-year (184), divided by 365 (to reflect the half-year period). |
| 22
Portfolio of Investments – as of December 31, 2017
Loomis Sayles Multi-Asset Income Fund
| | | | | | | | |
Shares | | | Description | | Value (†) | |
| | Common Stocks — 65.0% of Net Assets | | | | |
| | | | Aerospace & Defense — 2.7% | | | | |
| | 144,882 | | | BAE Systems PLC | | $ | 1,119,406 | |
| | 2,498 | | | Boeing Co. (The) | | | 736,685 | |
| | 884 | | | Raytheon Co. | | | 166,060 | |
| | 15,167 | | | United Technologies Corp. | | | 1,934,854 | |
| | | | | | | | |
| | | | | | | 3,957,005 | |
| | | | | | | | |
| | | | Air Freight & Logistics — 0.4% | | | | |
| | 9,461 | | | bpost S.A. | | | 287,939 | |
| | 1,167 | | | FedEx Corp. | | | 291,213 | |
| | | | | | | | |
| | | | | | | 579,152 | |
| | | | | | | | |
| | | | Airlines — 2.1% | | | | |
| | 35,007 | | | Delta Air Lines, Inc. | | | 1,960,392 | |
| | 20,956 | | | Deutsche Lufthansa AG | | | 769,581 | |
| | 7,900 | | | Japan Airlines Co. Ltd. | | | 308,652 | |
| | | | | | | | |
| | | | | | | 3,038,625 | |
| | | | | | | | |
| | | | Auto Components — 0.1% | | | | |
| | 2,592 | | | Aptiv PLC | | | 219,879 | |
| | | | | | | | |
| | | | Automobiles — 3.4% | | | | |
| | 13,587 | | | Bayerische Motoren Werke AG | | | 1,408,729 | |
| | 21,655 | | | Daimler AG, (Registered) | | | 1,831,156 | |
| | 7,565 | | | General Motors Co. | | | 310,089 | |
| | 13,715 | | | Renault S.A. | | | 1,376,685 | |
| | | | | | | | |
| | | | | | | 4,926,659 | |
| | | | | | | | |
| | | | Banks — 6.6% | | | | |
| | 51,602 | | | Bank of America Corp. | | | 1,523,291 | |
| | 14,110 | | | BB&T Corp. | | | 701,549 | |
| | 57,500 | | | BOC Hong Kong Holdings Ltd. | | | 290,592 | |
| | 3,100 | | | Canadian Imperial Bank of Commerce | | | 302,207 | |
| | 15,144 | | | Citigroup, Inc. | | | 1,126,865 | |
| | 42,106 | | | Credit Agricole S.A. | | | 695,256 | |
| | 27,443 | | | JPMorgan Chase & Co. | | | 2,934,755 | |
| | 5,800 | | | National Bank of Canada | | | 289,400 | |
| | 7,771 | | | PacWest Bancorp | | | 391,658 | |
| | 3,739 | | | PNC Financial Services Group, Inc. (The) | | | 539,500 | |
| | 11,423 | | | Wells Fargo & Co. | | | 693,034 | |
| | | | | | | | |
| | | | | | | 9,488,107 | |
| | | | | | | | |
| | | | Beverages — 1.2% | | | | |
| | 3,962 | | | Coca-Cola Co. (The) | | | 181,777 | |
| | 1,077 | | | Constellation Brands, Inc., Class A | | | 246,170 | |
| | 12,200 | | | Kirin Holdings Co. Ltd. | | | 307,457 | |
| | 7,416 | | | PepsiCo, Inc. | | | 889,327 | |
| | 1,087 | | | Royal Unibrew AS | | | 65,105 | |
| | | | | | | | |
| | | | | | | 1,689,836 | |
| | | | | | | | |
See accompanying notes to financial statements.
23 |
Portfolio of Investments – as of December 31, 2017
Loomis Sayles Multi-Asset Income Fund – (continued)
| | | | | | | | |
Shares | | | Description | | Value (†) | |
| | | | Biotechnology — 0.3% | | | | |
| | 3,085 | | | AbbVie, Inc. | | $ | 298,351 | |
| | 437 | | | Amgen, Inc. | | | 75,994 | |
| | | | | | | | |
| | | | | | | 374,345 | |
| | | | | | | | |
| | | | Capital Markets — 1.4% | | | | |
| | 11,550 | | | 3i Group PLC | | | 142,193 | |
| | 16,963 | | | BGC Partners, Inc., Class A | | | 256,311 | |
| | 9,578 | | | IG Group Holdings PLC | | | 92,735 | |
| | 821 | | | Lazard Ltd., Class A | | | 43,103 | |
| | 27,686 | | | Morgan Stanley | | | 1,452,684 | |
| | | | | | | | |
| | | | | | | 1,987,026 | |
| | | | | | | | |
| | | | Chemicals — 1.7% | | | | |
| | 8,985 | | | Covestro AG | | | 925,153 | |
| | 5,406 | | | DowDuPont, Inc. | | | 385,015 | |
| | 9,920 | | | Huntsman Corp. | | | 330,237 | |
| | 2,763 | | | LyondellBasell Industries NV, Class A | | | 304,814 | |
| | 2,999 | | | Monsanto Co. | | | 350,223 | |
| | 7,500 | | | Tosoh Corp. | | | 169,202 | |
| | | | | | | | |
| | | | | | | 2,464,644 | |
| | | | | | | | |
| | | | Commercial Services & Supplies — 0.2% | | | | |
| | 3,525 | | | Waste Management, Inc. | | | 304,207 | |
| | | | | | | | |
| | | | Communications Equipment — 0.8% | | | | |
| | 28,795 | | | Cisco Systems, Inc. | | | 1,102,848 | |
| | | | | | | | |
| | | | Construction & Engineering — 0.7% | | | | |
| | 7,534 | | | ACS Actividades de Construccion y Servicios S.A. | | | 294,305 | |
| | 28,000 | | | Kajima Corp. | | | 269,021 | |
| | 32,106 | | | Peab AB | | | 276,232 | |
| | 5,000 | | | Taisei Corp. | | | 248,655 | |
| | | | | | | | |
| | | | | | | 1,088,213 | |
| | | | | | | | |
| | | | Containers & Packaging — 0.2% | | | | |
| | 4,376 | | | WestRock Co. | | | 276,607 | |
| | | | | | | | |
| | | | Distributors — 0.2% | | | | |
| | 11,500 | | | Canon Marketing Japan, Inc. | | | 310,409 | |
| | | | | | | | |
| | | | Diversified Consumer Services — 0.2% | | | | |
| | 1,900 | | | Benesse Holdings, Inc. | | | 66,849 | |
| | 11,028 | | | H&R Block, Inc. | | | 289,154 | |
| | | | | | | | |
| | | | | | | 356,003 | |
| | | | | | | | |
| | | | Diversified Telecommunication Services — 2.6% | | | | |
| | 46,429 | | | AT&T, Inc. | | | 1,805,160 | |
| | 27,131 | | | CenturyLink, Inc. | | | 452,545 | |
| | 15,551 | | | Spark New Zealand Ltd. | | | 40,006 | |
| | 27,371 | | | Verizon Communications, Inc. | | | 1,448,747 | |
| | | | | | | | |
| | | | | | | 3,746,458 | |
| | | | | | | | |
See accompanying notes to financial statements.
| 24
Portfolio of Investments – as of December 31, 2017
Loomis Sayles Multi-Asset Income Fund – (continued)
| | | | | | | | |
Shares | | | Description | | Value (†) | |
| | | | Electric Utilities — 2.0% | | | | |
| | 2,427 | | | American Electric Power Co., Inc. | | $ | 178,554 | |
| | 31,500 | | | CK Infrastructure Holdings Ltd. | | | 270,306 | |
| | 7,500 | | | CLP Holdings Ltd. | | | 76,749 | |
| | 2,384 | | | Entergy Corp. | | | 194,034 | |
| | 14,390 | | | Exelon Corp. | | | 567,110 | |
| | 8,480 | | | FirstEnergy Corp. | | | 259,658 | |
| | 314,500 | | | HK Electric Investments & HK Electric Investments Ltd., 144A | | | 287,817 | |
| | 73,665 | | | Mercury NZ Ltd. | | | 175,935 | |
| | 4,536 | | | NextEra Energy, Inc. | | | 708,478 | |
| | 7,844 | | | PPL Corp. | | | 242,772 | |
| | | | | | | | |
| | | | | | | 2,961,413 | |
| | | | | | | | |
| | | | Electrical Equipment — 0.2% | | | | |
| | 3,427 | | | Vestas Wind Systems AS | | | 236,807 | |
| | | | | | | | |
| | | | Electronic Equipment, Instruments & Components — 0.1% | | | | |
| | 18,000 | | | Hitachi Ltd. | | | 139,648 | |
| | | | | | | | |
| | | | Energy Equipment & Services — 2.1% | | | | |
| | 31,524 | | | Halliburton Co. | | | 1,540,578 | |
| | 22,457 | | | Schlumberger Ltd. | | | 1,513,377 | |
| | | | | | | | |
| | | | | | | 3,053,955 | |
| | | | | | | | |
| | | | Food & Staples Retailing — 0.7% | | | | |
| | 1,313 | | | Costco Wholesale Corp. | | | 244,376 | |
| | 3,424 | | | CVS Health Corp. | | | 248,240 | |
| | 2,766 | | | Wal-Mart Stores, Inc. | | | 273,142 | |
| | 2,825 | | | Walgreens Boots Alliance, Inc. | | | 205,152 | |
| | | | | | | | |
| | | | | | | 970,910 | |
| | | | | | | | |
| | | | Food Products — 1.7% | | | | |
| | 2,455 | | | J.M. Smucker Co. (The) | | | 305,009 | |
| | 2,034 | | | Kellogg Co. | | | 138,272 | |
| | 38,939 | | | Mondelez International, Inc., Class A | | | 1,666,589 | |
| | 258,000 | | | WH Group Ltd., 144A | | | 290,774 | |
| | | | | | | | |
| | | | | | | 2,400,644 | |
| | | | | | | | |
| | | | Health Care Equipment & Supplies — 0.5% | | | | |
| | 8,349 | | | Medtronic PLC | | | 674,182 | |
| | | | | | | | |
| | | | Health Care Providers & Services — 1.9% | | | | |
| | 2,817 | | | AmerisourceBergen Corp. | | | 258,657 | |
| | 2,406 | | | Quest Diagnostics, Inc. | | | 236,967 | |
| | 10,289 | | | UnitedHealth Group, Inc. | | | 2,268,313 | |
| | | | | | | | |
| | | | | | | 2,763,937 | |
| | | | | | | | |
| | | | Hotels, Restaurants & Leisure — 3.1% | | | | |
| | 36,161 | | | Accor S.A. | | | 1,861,565 | |
| | 2,877 | | | Darden Restaurants, Inc. | | | 276,250 | |
| | 289,100 | | | Genting Singapore PLC | | | 282,346 | |
| | 9,439 | | | Hilton Worldwide Holdings, Inc. | | | 753,799 | |
| | 4,156 | | | Las Vegas Sands Corp. | | | 288,800 | |
See accompanying notes to financial statements.
25 |
Portfolio of Investments – as of December 31, 2017
Loomis Sayles Multi-Asset Income Fund – (continued)
| | | | | | | | |
Shares | | | Description | | Value (†) | |
| | | | Hotels, Restaurants & Leisure — continued | | | | |
| | 4,163 | | | McDonald’s Corp. | | $ | 716,536 | |
| | 15,527 | | | TUI AG | | | 321,677 | |
| | | | | | | | |
| | | | | | | 4,500,973 | |
| | | | | | | | |
| | | | Household Durables — 0.6% | | | | |
| | 5,029 | | | Barratt Developments PLC | | | 43,871 | |
| | 5,735 | | | Berkeley Group Holdings PLC | | | 324,405 | |
| | 19,200 | | | Haseko Corp. | | | 297,566 | |
| | 57,049 | | | Taylor Wimpey PLC | | | 158,722 | |
| | | | | | | | |
| | | | | | | 824,564 | |
| | | | | | | | |
| | | | Household Products — 0.5% | | | | |
| | 7,730 | | | Procter & Gamble Co. (The) | | | 710,232 | |
| | | | | | | | |
| | | | Independent Power & Renewable Electricity Producers — 0.3% | | | | |
| | 26,835 | | | AES Corp. (The) | | | 290,623 | |
| | 98,724 | | | Meridian Energy Ltd. | | | 204,761 | |
| | | | | | | | |
| | | | | | | 495,384 | |
| | | | | | | | |
| | | | Industrial Conglomerates — 1.9% | | | | |
| | 4,674 | | | Honeywell International, Inc. | | | 716,805 | |
| | 4,600 | | | Jardine Matheson Holdings Ltd. | | | 279,093 | |
| | 12,344 | | | Siemens AG, (Registered) | | | 1,709,121 | |
| | | | | | | | |
| | | | | | | 2,705,019 | |
| | | | | | | | |
| | | | Insurance — 0.9% | | | | |
| | 4,397 | | | Chubb Ltd. | | | 642,534 | |
| | 46,206 | | | Legal & General Group PLC | | | 170,111 | |
| | 8,485 | | | MetLife, Inc. | | | 429,001 | |
| | | | | | | | |
| | | | | | | 1,241,646 | |
| | | | | | | | |
| | | | IT Services — 1.6% | | | | |
| | 1,732 | | | Accenture PLC, Class A | | | 265,152 | |
| | 18,075 | | | Automatic Data Processing, Inc. | | | 2,118,209 | |
| | | | | | | | |
| | | | | | | 2,383,361 | |
| | | | | | | | |
| | | | Machinery — 1.6% | | | | |
| | 994 | | | Allison Transmission Holdings, Inc. | | | 42,812 | |
| | 2,043 | | | Caterpillar, Inc. | | | 321,936 | |
| | 7,614 | | | Cummins, Inc. | | | 1,344,937 | |
| | 4,261 | | | Dover Corp. | | | 430,318 | |
| | 2,289 | | | Fortive Corp. | | | 165,609 | |
| | | | | | | | |
| | | | | | | 2,305,612 | |
| | | | | | | | |
| | | | Media — 1.4% | | | | |
| | 19,278 | | | Comcast Corp., Class A | | | 772,084 | |
| | 12,094 | | | Walt Disney Co. (The) | | | 1,300,226 | |
| | | | | | | | |
| | | | | | | 2,072,310 | |
| | | | | | | | |
| | | | Multi-Utilities — 0.2% | | | | |
| | 9,138 | | | CenterPoint Energy, Inc. | | | 259,154 | |
| | | | | | | | |
See accompanying notes to financial statements.
| 26
Portfolio of Investments – as of December 31, 2017
Loomis Sayles Multi-Asset Income Fund – (continued)
| | | | | | | | |
Shares | | | Description | | Value (†) | |
| | | | Oil, Gas & Consumable Fuels — 3.8% | | | | |
| | 4,192 | | | Anadarko Petroleum Corp. | | $ | 224,859 | |
| | 9,878 | | | Canadian Natural Resources Ltd. | | | 352,842 | |
| | 8,084 | | | Chevron Corp. | | | 1,012,036 | |
| | 29,512 | | | Encana Corp. | | | 393,395 | |
| | 2,169 | | | EQT Corp. | | | 123,460 | |
| | 6,210 | | | Exxon Mobil Corp. | | | 519,404 | |
| | 3,763 | | | Marathon Petroleum Corp. | | | 248,283 | |
| | 1,575 | | | OMV AG | | | 99,656 | |
| | 1,972 | | | PDC Energy, Inc.(a) | | | 101,637 | |
| | 57,624 | | | Snam SpA | | | 282,212 | |
| | 25,318 | | | Total S.A. | | | 1,397,551 | |
| | 5,368 | | | Valero Energy Corp. | | | 493,373 | |
| | 6,013 | | | Williams Cos., Inc. (The) | | | 183,336 | |
| | | | | | | | |
| | | | | | | 5,432,044 | |
| | | | | | | | |
| | | | Paper & Forest Products — 0.2% | | | | |
| | 8,500 | | | Norbord, Inc. | | | 287,729 | |
| | | | | | | | |
| | | | Personal Products — 0.4% | | | | |
| | 2,556 | | | Estee Lauder Cos., Inc. (The), Class A | | | 325,225 | |
| | 8,000 | | | Pola Orbis Holdings, Inc. | | | 280,326 | |
| | | | | | | | |
| | | | | | | 605,551 | |
| | | | | | | | |
| | | | Pharmaceuticals — 2.3% | | | | |
| | 2,322 | | | Allergan PLC | | | 379,833 | |
| | 12,397 | | | Bristol-Myers Squibb Co. | | | 759,688 | |
| | 5,122 | | | Eli Lilly & Co. | | | 432,604 | |
| | 39,868 | | | Pfizer, Inc. | | | 1,444,019 | |
| | 4,614 | | | Zoetis, Inc. | | | 332,393 | |
| | | | | | | | |
| | | | | | | 3,348,537 | |
| | | | | | | | |
| | | | REITs – Diversified — 0.2% | | | | |
| | 16,393 | | | New Residential Investment Corp. | | | 293,107 | |
| | | | | | | | |
| | | | Road & Rail — 0.7% | | | | |
| | 18,833 | | | CSX Corp. | | | 1,036,003 | |
| | | | | | | | |
| | | | Semiconductors & Semiconductor Equipment — 3.6% | | | | |
| | 8,360 | | | Analog Devices, Inc. | | | 744,291 | |
| | 341 | | | Broadcom Ltd. | | | 87,603 | |
| | 70,417 | | | Cypress Semiconductor Corp. | | | 1,073,155 | |
| | 831 | | | Intel Corp. | | | 38,359 | |
| | 229 | | | Lam Research Corp. | | | 42,152 | |
| | 23,799 | | | Qualcomm, Inc. | | | 1,523,612 | |
| | 32,077 | | | Teradyne, Inc. | | | 1,343,064 | |
| | 1,600 | | | Tokyo Electron Ltd. | | | 288,623 | |
| | | | | | | | |
| | | | | | | 5,140,859 | |
| | | | | | | | |
| | | | Software — 2.0% | | | | |
| | 12,636 | | | Microsoft Corp. | | | 1,080,883 | |
| | 37,089 | | | Oracle Corp. | | | 1,753,568 | |
| | | | | | | | |
| | | | | | | 2,834,451 | |
| | | | | | | | |
See accompanying notes to financial statements.
27 |
Portfolio of Investments – as of December 31, 2017
Loomis Sayles Multi-Asset Income Fund – (continued)
| | | | | | | | |
Shares | | | Description | | Value (†) | |
| | | | Specialty Retail — 1.9% | | | | |
| | 4,626 | | | Best Buy Co., Inc. | | $ | 316,742 | |
| | 888 | | | Home Depot, Inc. (The) | | | 168,303 | |
| | 12,717 | | | Lowe’s Cos., Inc. | | | 1,181,918 | |
| | 22,887 | | | Penske Automotive Group, Inc. | | | 1,095,143 | |
| | 300 | | | Shimamura Co. Ltd. | | | 32,958 | |
| | | | | | | | |
| | | | | | | 2,795,064 | |
| | | | | | | | |
| | | | Technology Hardware, Storage & Peripherals — 1.8% | | | | |
| | 12,149 | | | Apple, Inc. | | | 2,055,975 | |
| | 7,500 | | | Canon, Inc. | | | 279,436 | |
| | 13,442 | | | HP, Inc. | | | 282,416 | |
| | 519 | | | Western Digital Corp. | | | 41,276 | |
| | | | | | | | |
| | | | | | | 2,659,103 | |
| | | | | | | | |
| | | | Textiles, Apparel & Luxury Goods — 0.0% | | | | |
| | 624 | | | Ralph Lauren Corp. | | | 64,703 | |
| | | | | | | | |
| | | | Thrifts & Mortgage Finance — 0.2% | | | | |
| | 8,400 | | | Genworth MI Canada, Inc. | | | 290,692 | |
| | | | | | | | |
| | | | Tobacco — 1.3% | | | | |
| | 15,585 | | | Altria Group, Inc. | | | 1,112,925 | |
| | 6,937 | | | Imperial Brands PLC | | | 295,895 | |
| | 8,800 | | | Japan Tobacco, Inc. | | | 283,387 | |
| | 2,418 | | | Philip Morris International, Inc. | | | 255,462 | |
| | | | | | | | |
| | | | | | | 1,947,669 | |
| | | | | | | | |
| | | | Trading Companies & Distributors — 0.4% | | | | |
| | 11,600 | | | ITOCHU Corp. | | | 216,241 | |
| | 18,700 | | | Sumitomo Corp. | | | 317,185 | |
| | | | | | | | |
| | | | | | | 533,426 | |
| | | | | | | | |
| | | | Transportation Infrastructure — 0.1% | | | | |
| | 5,526 | | | Societa Iniziative Autostradali e Servizi S.p.A. | | | 102,903 | |
| | | | | | | | |
| | | | Total Common Stocks
(Identified Cost $87,516,701) | | | 93,981,615 | |
| | | | | | | | |
| | | | | | | | |
Principal
Amount (‡) | | | | | | |
| | Bonds and Notes — 23.4% | | | | |
| | Non-Convertible Bonds — 23.0% | | | | |
| | | | Banking — 4.3% | | | | |
| $ | 625,000 | | | Ally Financial, Inc., 5.750%, 11/20/2025 | | | 681,250 | |
| | 610,000 | | | Australia & New Zealand Banking Group Ltd., (fixed rate to 6/15/2026, variable rate thereafter), 6.750%, 144A(b) | | | 693,875 | |
| | 6,100,000 | | | Banco Hipotecario S.A., Argentina Deposit Rates Badlar Private Banks + 4.000%, 25.938%, 11/07/2022, 144A, (ARS)(c) | | | 326,003 | |
| | 2,320,000 | | | Banco Macro S.A., 17.500%, 5/08/2022, 144A, (ARS) | | | 119,581 | |
| | 210,000 | | | Credit Agricole S.A., (fixed rate to 1/23/2024, variable rate thereafter), 7.875%, 144A(b) | | | 237,563 | |
| | 625,000 | | | Credit Suisse AG, 6.500%, 8/08/2023, 144A | | | 699,375 | |
| | 580,000 | | | Credit Suisse Group AG, (fixed rate to 12/11/2023, variable rate thereafter), 7.500%, 144A(b) | | | 662,592 | |
See accompanying notes to financial statements.
| 28
Portfolio of Investments – as of December 31, 2017
Loomis Sayles Multi-Asset Income Fund – (continued)
| | | | | | | | |
Principal
Amount (‡) | | | Description | | Value (†) | |
| | | | Banking — continued | | | | |
| $ | 600,000 | | | Deutsche Bank AG, (fixed rate to 4/30/2025, variable rate thereafter), 7.500%(b) | | $ | 633,900 | |
| | 550,000 | | | Dresdner Funding Trust I, 8.151%, 6/30/2031, 144A | | | 728,545 | |
| | 715,000 | | | Itau Unibanco Holding S.A., (fixed rate to 12/12/2022, variable rate thereafter), 6.125%(b) | | | 722,229 | |
| | 690,000 | | | Lloyds Banking Group PLC, (fixed rate to 11/07/2027, variable rate thereafter), 3.574%, 11/07/2028 | | | 683,509 | |
| | | | | | | | |
| | | | | | | 6,188,422 | |
| | | | | | | | |
| | | | Building Materials — 0.5% | | | | |
| | 715,000 | | | Martin Marietta Materials, Inc., 3.500%, 12/15/2027 | | | 709,664 | |
| | | | | | | | |
| | | | Cable Satellite — 1.0% | | | | |
| | 625,000 | | | CCO Holdings LLC/CCO Holdings Capital Corp., 5.125%, 5/01/2027, 144A | | | 615,625 | |
| | 830,000 | | | DISH DBS Corp., 7.750%, 7/01/2026 | | | 872,537 | |
| | | | | | | | |
| | | | | | | 1,488,162 | |
| | | | | | | | |
| | | | Chemicals — 0.4% | | | | |
| | 650,000 | | | Hercules LLC, 6.500%, 6/30/2029(d)(e) | | | 656,500 | |
| | | | | | | | |
| | | | Electric — 0.4% | | | | |
| | 180,000 | | | IPALCO Enterprises, Inc., 3.700%, 9/01/2024, 144A | | | 179,836 | |
| | 435,000 | | | NRG Energy, Inc., 7.250%, 5/15/2026 | | | 473,602 | |
| | | | | | | | |
| | | | | | | 653,438 | |
| | | | | | | | |
| | | | Finance Companies — 0.2% | | | | |
| | 295,000 | | | Cia Latinoamericana de Infraestructura & Servicios S.A., 9.500%, 7/20/2023, 144A | | | 315,004 | |
| | | | | | | | |
| | | | Food & Beverage — 0.5% | | | | |
| | 635,000 | | | Marfrig Holdings Europe BV, 8.000%, 6/08/2023, 144A | | | 661,772 | |
| | | | | | | | |
| | | | Government Owned – No Guarantee — 3.8% | | | | |
| | 580,000 | | | Banco do Brasil S.A., 4.625%, 1/15/2025, 144A | | | 573,231 | |
| | 1,310,000 | | | Banco do Brasil S.A., (fixed rate to 4/15/2024, variable rate thereafter), 6.250%, 144A(b) | | | 1,203,562 | |
| | 1,000,000 | | | Petrobras Global Finance BV, 5.999%, 1/27/2028, 144A | | | 1,002,500 | |
| | 1,150,000 | | | Petrobras Global Finance BV, 8.750%, 5/23/2026 | | | 1,374,250 | |
| | 595,000 | | | YPF S.A., 6.950%, 7/21/2027, 144A | | | 631,593 | |
| | 715,000 | | | YPF S.A., 7.000%, 12/15/2047, 144A | | | 708,565 | |
| | | | | | | | |
| | | | | | | 5,493,701 | |
| | | | | | | | |
| | | | Independent Energy — 1.5% | | | | |
| | 110,000 | | | Concho Resources, Inc., 4.875%, 10/01/2047 | | | 119,617 | |
| | 300,000 | | | Gulfport Energy Corp., 6.375%, 1/15/2026, 144A | | | 300,750 | |
| | 540,000 | | | MEG Energy Corp., 6.375%, 1/30/2023, 144A | | | 459,000 | |
| | 170,000 | | | MEG Energy Corp., 7.000%, 3/31/2024, 144A | | | 143,438 | |
| | 595,000 | | | SM Energy Co., 5.625%, 6/01/2025 | | | 577,150 | |
| | 75,000 | | | SM Energy Co., 6.750%, 9/15/2026 | | | 77,250 | |
| | 450,000 | | | Whiting Petroleum Corp., 6.625%, 1/15/2026, 144A | | | 459,000 | |
| | | | | | | | |
| | | | | | | 2,136,205 | |
| | | | | | | | |
See accompanying notes to financial statements.
29 |
Portfolio of Investments – as of December 31, 2017
Loomis Sayles Multi-Asset Income Fund – (continued)
| | | | | | | | |
Principal
Amount (‡) | | | Description | | Value (†) | |
| | | | Local Authorities — 0.5% | | | | |
| $ | 660,000 | | | Provincia de Buenos Aires, 7.875%, 6/15/2027, 144A | | $ | 732,481 | |
| | | | | | | | |
| | | | Media Entertainment — 0.2% | | | | |
| | 270,000 | | | Discovery Communications LLC, 3.950%, 3/20/2028 | | | 268,557 | |
| | | | | | | | |
| | | | Metals & Mining — 0.5% | | | | |
| | 625,000 | | | First Quantum Minerals Ltd., 7.500%, 4/01/2025, 144A | | | 678,125 | |
| | | | | | | | |
| | | | Midstream — 1.2% | | | | |
| | 640,000 | | | AmeriGas Partners LP/AmeriGas Finance Corp., 5.875%, 8/20/2026 | | | 659,200 | |
| | 1,020,000 | | | Plains All American Pipeline LP, Series B, (fixed rate to 11/15/2022, variable rate thereafter), 6.125%(b) | | | 1,018,470 | |
| | | | | | | | |
| | | | | | | 1,677,670 | |
| | | | | | | | |
| | | | Non-Agency Commercial Mortgage-Backed Securities — 0.3% | | | | |
| | 370,000 | | | Commercial Mortgage Trust, Series 2016-SAVA, Class C, 1-month LIBOR + 3.000%, 4.432%, 10/15/2034, 144A(c) | | | 370,904 | |
| | | | | | | | |
| | | | Oil Field Services — 1.1% | | | | |
| | 220,000 | | | Baker Hughes a GE Co. LLC/Baker Hughes Co-Obligor, Inc., 4.080%, 12/15/2047, 144A | | | 223,754 | |
| | 870,000 | | | Transocean, Inc., 6.800%, 3/15/2038 | | | 698,175 | |
| | 625,000 | | | Transocean, Inc., 8.375%, 12/15/2021 | | | 675,000 | |
| | | | | | | | |
| | | | | | | 1,596,929 | |
| | | | | | | | |
| | | | Packaging — 0.4% | | | | |
| | 540,000 | | | ARD Finance S.A., PIK, 7.125%, 9/15/2023(f) | | | 564,300 | |
| | | | | | | | |
| | | | Sovereigns — 1.5% | | | | |
| | 280,000 | | | Panama Government International Bond, 4.500%, 5/15/2047 | | | 301,420 | |
| | 1,250,000 | | | Republic of Argentina, 6.875%, 1/26/2027 | | | 1,365,625 | |
| | 485,000 | | | Republic of Argentina, 7.500%, 4/22/2026 | | | 549,093 | |
| | | | | | | | |
| | | | | | | 2,216,138 | |
| | | | | | | | |
| | | | Technology — 0.6% | | | | |
| | 410,000 | | | Dell International LLC/EMC Corp., 8.100%, 7/15/2036, 144A | | | 517,744 | |
| | 290,000 | | | Dell International LLC/EMC Corp., 8.350%, 7/15/2046, 144A | | | 373,678 | |
| | | | | | | | |
| | | | | | | 891,422 | |
| | | | | | | | |
| | | | Treasuries — 3.0% | | | | |
| | 2,000(††) | | | Brazil Notas do Tesouro Nacional, Series F, 10.000%, 1/01/2023, (BRL) | | | 579,199 | |
| | 4,400(††) | | | Brazil Notas do Tesouro Nacional, Series F, 10.000%, 1/01/2027, (BRL) | | | 1,244,156 | |
| | 8,651,000,000 | | | Indonesia Treasury Bond, 7.000%, 5/15/2027, (IDR) | | | 670,885 | |
| | 142,800(†††) | | | Mexican Fixed Rate Bonds, Series M-20, 7.500%, 6/03/2027, (MXN) | | | 717,867 | |
| | 5,375,000 | | | Republic of Uruguay, 8.500%, 3/15/2028, 144A, (UYU) | | | 186,126 | |
| | 2,782,700,000 | | | Titulos de Tesoreria, Series B, 7.000%, 5/04/2022, (COP) | | | 976,675 | |
| | | | | | | | |
| | | | | | | 4,374,908 | |
| | | | | | | | |
| | | | Utility Other — 0.3% | | | | |
| | 460,000 | | | ACWA Power Management and Investments One Ltd., 5.950%, 12/15/2039, 144A | | | 470,902 | |
| | | | | | | | |
See accompanying notes to financial statements.
| 30
Portfolio of Investments – as of December 31, 2017
Loomis Sayles Multi-Asset Income Fund – (continued)
| | | | | | | | |
Principal
Amount (‡) | | | Description | | Value (†) | |
| | | | Wirelines — 0.8% | | | | |
| $ | 835,000 | | | CenturyLink, Inc., Series U, 7.650%, 3/15/2042 | | $ | 735,844 | |
| | 385,000 | | | Cincinnati Bell, Inc., 7.000%, 7/15/2024, 144A | | | 382,112 | |
| | | | | | | | |
| | | | | | | 1,117,956 | |
| | | | | | | | |
| | | | Total Non-Convertible Bonds
(Identified Cost $32,138,284) | | | 33,263,160 | |
| | | | | | | | |
| | | | | | | | |
| | Convertible Bonds — 0.4% | |
| | | | Cable Satellite — 0.3% | | | | |
| | 400,000 | | | DISH Network Corp., 3.375%, 8/15/2026 | | | 435,250 | |
| | | | | | | | |
| | | | Midstream — 0.0% | | | | |
| | 25,000 | | | Whiting Petroleum Corp., 1.250%, 4/01/2020 | | | 23,000 | |
| | | | | | | | |
| | | | Technology — 0.1% | | | | |
| | 65,000 | | | Nuance Communications, Inc., 1.250%, 4/01/2025, 144A | | | 66,381 | |
| | | | | | | | |
| | | | Total Convertible Bonds
(Identified Cost $536,027) | | | 524,631 | |
| | | | | | | | |
| | | | | | | | |
| | | | Total Bonds and Notes
(Identified Cost $32,674,311) | | | 33,787,791 | |
| | | | | | | | |
| | | | | | | | |
| | Senior Loans — 5.6% | |
| | | | Airlines — 1.5% | | | | |
| | 2,063,636 | | | Gol LuxCo S.A., 1st Lien Term Loan, 6.500%, 8/31/2020 | | | 2,110,068 | |
| | | | | | | | |
| | | | Chemicals — 0.4% | | | | |
| | 335,775 | | | ASP Chromaflo Dutch I BV, Term Loan B2, 1-month LIBOR + 4.000%, 5.569%, 11/18/2023(c) | | | 337,034 | |
| | 258,225 | | | ASP Chromaflo Intermediate Holdings, Inc., Term Loan B1, 1-month LIBOR + 4.000%, 5.569%, 11/18/2023(c) | | | 259,193 | |
| | | | | | | | |
| | | | | | | 596,227 | |
| | | | | | | | |
| | | | Electric — 0.7% | | | | |
| | 962,026 | | | Dynegy, Inc., 2017 Term Loan C2, 1-month LIBOR + 2.750%, 4.251%, 2/07/2024(c) | | | 966,038 | |
| | | | | | | | |
| | | | Financial Other — 1.4% | | | | |
| | 876,106 | | | Russell Investment Group, Term Loan B, 3-month LIBOR + 4.250%, 5.943%, 6/01/2023(c) | | | 880,758 | |
| | 1,162,266 | | | Wall Street Systems Delaware, Inc., 2017 Term Loan B, 1-month LIBOR + 3.000%, 4.569%, 11/21/2024(c) | | | 1,163,428 | |
| | | | Independent Energy — 0.4% | | | | |
| | 392,811 | | | Chesapeake Energy Corp., Term Loan, 3-month LIBOR + 7.500%, 8.954%, 8/23/2021(c) | | | 417,558 | |
| | 147,998 | | | MEG Energy Corp., 2017 Term Loan B, 3-month LIBOR + 3.500%, 5.200%, 12/31/2023(c) | | | 148,039 | |
| | | | | | | | |
| | | | | | | 565,597 | |
| | | | | | | | |
See accompanying notes to financial statements.
31 |
Portfolio of Investments – as of December 31, 2017
Loomis Sayles Multi-Asset Income Fund – (continued)
| | | | | | | | |
Principal
Amount (‡) | | | Description | | Value (†) | |
| | | | Lodging — 0.5% | | | | |
| $ | 764,225 | | | Hilton Worldwide Finance LLC, Term Loan B2, 1-month LIBOR + 2.000%, 3.552%, 10/25/2023(c) | | $ | 767,756 | |
| | | | | | | | |
| | | | Retailers — 0.7% | | | | |
| | 1,114,912 | | | Staples, Inc., 2017 Term Loan B, 3-month LIBOR + 4.000%, 5.488%, 9/12/2024(c) | | | 1,092,056 | |
| | | | | | | | |
| | | | Total Senior Loans
(Identified Cost $8,073,683) | | | 8,141,928 | |
| | | | | | | | |
| | | | | | | | |
| Shares | | | | | | |
| | Exchange-Traded Funds — 2.9% | |
| | 86,860 | | | SPDR® Blackstone/GSO Senior Loan ETF (Identified Cost $4,129,368) | | | 4,098,055 | |
| | | | | | | | |
| | | | | | | | |
| | Preferred Stocks — 0.4% | | | | |
| | | | Midstream — 0.4% | | | | |
| | 932 | | | Chesapeake Energy Corp., 5.750% (Identified Cost $631,845) | | | 535,318 | |
| | | | | | | | |
| | | | | | | | |
Principal
Amount (‡) | | | | | | |
| | Short-Term Investments — 2.9% | | | | |
| $ | 4,228,481 | | | Tri-Party Repurchase Agreement with Fixed Income Clearing Corporation, dated 12/29/2017 at 0.540% to be repurchased at $4,228,735 on 1/02/2018 collateralized by $4,300,000 Federal Home Loan Bank, 1.250% due 7/27/2018 valued at $4,316,125 (Note 2 of Notes to Financial Statements) (Identified Cost $4,228,481) | | | 4,228,481 | |
| | | | | | | | |
| | | | | | | | |
| | | | Total Investments — 100.2%
(Identified Cost $137,254,389) | | | 144,773,188 | |
| | | | Other assets less liabilities — (0.2)% | | | (232,359 | ) |
| | | | | | | | |
| | | | Net Assets — 100.0% | | $ | 144,540,829 | |
| | | | | | | | |
| | | | | | | | |
| | (‡) | | | Principal Amount stated in U.S. dollars unless otherwise noted. | |
| | (†) | | | See Note 2 of Notes to Financial Statements. | |
| | (††) | | | Amount shown represents units. One unit represents a principal amount of 1,000. | |
| | (†††) | | | Amount shown represents units. One unit represents a principal amount of 100. | |
| | (a) | | | Non-income producing security. | |
| | (b) | | | Perpetual bond with no specified maturity date. | |
| | (c) | | | Variable rate security. Rate as of December 31, 2017 is disclosed. | |
| | (d) | | | Illiquid security. (Unaudited) | |
| | (e) | | | Securities classified as fair valued pursuant to the Fund’s pricing policies and procedures. At December 31, 2017, the value of these securities amounted to $656,500 or 0.5% of net assets. See Note 2 of Notes to Financial Statements. | |
| | (f) | | | Payment-in-kind security for which the issuer has the option at each interest payment date of making interest payments in cash or additional principal. For the period ended December 31, 2017, interest payments were made in cash. | |
See accompanying notes to financial statements.
| 32
Portfolio of Investments – as of December 31, 2017
Loomis Sayles Multi-Asset Income Fund – (continued)
| | | | | | | | |
| | | | | | | | |
| | 144A | | | All or a portion of these securities are exempt from registration under Rule 144A of the Securities Act of 1933. These securities may be resold in transactions exempt from registration, normally to qualified institutional buyers. At December 31, 2017, the value of Rule 144A holdings amounted to $15,302,208 or 10.6% of net assets. | |
| | ETF | | | Exchange-Traded Fund | | | | |
| | LIBOR | | | London Interbank Offered Rate | | | | |
| | PIK | | | Payment-in-Kind | | | | |
| | REITs | | | Real Estate Investment Trusts | | | | |
| | | | | | | | |
| | ARS | | | Argentine Peso | | | | |
| | BRL | | | Brazilian Real | | | | |
| | COP | | | Colombian Peso | | | | |
| | IDR | | | Indonesian Rupiah | | | | |
| | MXN | | | Mexican Peso | | | | |
| | UYU | | | Uruguayan Peso | | | | |
Industry Summary at December 31, 2017
| | | | |
Banks | | | 6.6 | % |
Banking | | | 4.3 | |
Government Owned – No Guarantee | | | 3.8 | |
Oil, Gas & Consumable Fuels | | | 3.8 | |
Airlines | | | 3.6 | |
Semiconductors & Semiconductor Equipment | | | 3.6 | |
Automobiles | | | 3.4 | |
Hotels, Restaurants & Leisure | | | 3.1 | |
Treasuries | | | 3.0 | |
Exchange-Traded Funds | | | 2.9 | |
Aerospace & Defense | | | 2.7 | |
Diversified Telecommunication Services | | | 2.6 | |
Chemicals | | | 2.5 | |
Pharmaceuticals | | | 2.3 | |
Energy Equipment & Services | | | 2.1 | |
Electric Utilities | | | 2.0 | |
Software | | | 2.0 | |
Other Investments, less than 2% each | | | 43.0 | |
Short-Term Investments | | | 2.9 | |
| | | | |
Total Investments | | | 100.2 | |
Other assets less liabilities | | | (0.2 | ) |
| | | | |
Net Assets | | | 100.0 | % |
| | | | |
See accompanying notes to financial statements.
33 |
Portfolio of Investments – as of December 31, 2017
Loomis Sayles Strategic Alpha Fund
| | | | | | | | |
Principal
Amount (‡) | | | Description | | Value (†) | |
| | Bonds and Notes — 73.8% of Net Assets | | | | |
| | Non-Convertible Bonds — 70.8% | | | | |
| | | | ABS Car Loan — 4.9% | | | | |
| $ | 2,003,858 | | | Ally Auto Receivables Trust, Series 2016-3, Class A3, 1.440%, 8/17/2020(a) | | $ | 1,998,455 | |
| | 1,455,000 | | | AmeriCredit Automobile Receivables Trust, Series 2015-4, Class D, 3.720%, 12/08/2021(a) | | | 1,475,981 | |
| | 295,000 | | | AmeriCredit Automobile Receivables Trust, Series 2016-2, Class D, 3.650%, 5/09/2022(a) | | | 300,130 | |
| | 595,320 | | | CIG Auto Receivables Trust, Series 2017-1A, Class A, 2.710%, 5/15/2023, 144A(a) | | | 594,348 | |
| | 600,000 | | | CPS Auto Receivables Trust, Series 2014-D, Class C, 4.350%, 11/16/2020, 144A(a) | | | 614,643 | |
| | 3,065,000 | | | CPS Auto Receivables Trust, Series 2016-B, Class E, 8.140%, 5/15/2023, 144A(a) | | | 3,284,386 | |
| | 815,000 | | | CPS Auto Trust, Series 2017-D, Class D, 3.730%, 9/15/2023, 144A(a) | | | 808,990 | |
| | 2,175,000 | | | Drive Auto Receivables Trust, Series 2016-CA, Class C, 3.020%, 11/15/2021, 144A(a) | | | 2,191,428 | |
| | 655,000 | | | DT Auto Owner Trust, Series 2014-3A, Class D, 4.470%, 11/15/2021, 144A(a) | | | 662,969 | |
| | 1,070,000 | | | DT Auto Owner Trust, Series 2015-2A, Class D, 4.250%, 2/15/2022, 144A(a) | | | 1,088,015 | |
| | 4,075,000 | | | DT Auto Owner Trust, Series 2016-1A, Class D, 4.660%, 12/15/2022, 144A(a) | | | 4,149,158 | |
| | 3,045,000 | | | DT Auto Owner Trust, Series 2016-2A, Class D, 5.430%, 11/15/2022, 144A(a) | | | 3,133,260 | |
| | 270,000 | | | First Investors Auto Owner Trust, Series 2014-1A, Class D, 3.280%, 4/15/2021, 144A(a) | | | 270,693 | |
| | 440,000 | | | First Investors Auto Owner Trust, Series 2014-2A, Class D, 3.470%, 2/15/2021, 144A(a) | | | 443,167 | |
| | 345,000 | | | First Investors Auto Owner Trust, Series 2015-1A, Class D, 3.590%, 1/18/2022, 144A(a) | | | 346,430 | |
| | 1,710,000 | | | First Investors Auto Owner Trust, Series 2015-2A, Class D, 4.220%, 12/15/2021, 144A(a) | | | 1,736,292 | |
| | 220,000 | | | First Investors Auto Owner Trust, Series 2016-2A, Class D, 3.350%, 11/15/2022, 144A(a) | | | 218,001 | |
| | 605,000 | | | Flagship Credit Auto Trust, Series 2015-1, Class C, 3.760%, 6/15/2021, 144A(a) | | | 612,960 | |
| | 650,000 | | | Flagship Credit Auto Trust, Series 2016-3, Class D, 3.890%, 11/15/2022, 144A(a) | | | 655,883 | |
| | 190,402 | | | Ford Credit Auto Owner Trust, Series 2014-C, Class A3, 1.060%, 5/15/2019(a) | | | 190,297 | |
| | 649,841 | | | Ford Credit Auto Owner Trust, Series 2015-A, Class A3, 1.280%, 9/15/2019(a) | | | 649,171 | |
| | 647,492 | | | Ford Credit Auto Owner Trust, Series 2015-B, Class A3, 1.160%, 11/15/2019(a) | | | 646,208 | |
| | 1,853,408 | | | Ford Credit Auto Owner Trust, Series 2015-C, Class A3, 1.410%, 2/15/2020(a) | | | 1,850,031 | |
| | 86,345 | | | Ford Credit Auto Owner Trust, Series 2016-B, Class A2B, 1-month LIBOR + 0.310%, 1.787%, 3/15/2019(a)(b) | | | 86,358 | |
See accompanying notes to financial statements.
| 34
Portfolio of Investments – as of December 31, 2017
Loomis Sayles Strategic Alpha Fund – (continued)
| | | | | | | | |
Principal
Amount (‡) | | | Description | | Value (†) | |
| | | | ABS Car Loan — continued | | | | |
| $ | 2,902,804 | | | Ford Credit Auto Owner Trust, Series 2017-A, Class A2B, 1-month LIBOR + 0.120%, 1.597%,
12/15/2019(a)(b) | | $ | 2,903,243 | |
| | 1,362,000 | | | Hertz Vehicle Financing II LP, Series 2017-2A, Class A, 3.290%, 10/25/2023, 144A(a) | | | 1,364,429 | |
| | 14,214 | | | Honda Auto Receivables Owner Trust, Series 2014-4, Class A3, 0.990%, 9/17/2018(a) | | | 14,211 | |
| | 1,028,421 | | | Honda Auto Receivables Owner Trust, Series 2015-3, Class A3, 1.270%, 4/18/2019(a) | | | 1,027,270 | |
| | 2,081,031 | | | Honda Auto Receivables Owner Trust, Series 2016-2, Class A3, 1.390%, 4/15/2020(a) | | | 2,074,164 | |
| | 1,290,000 | | | Honda Auto Receivables Owner Trust, Series 2017-1, Class A3, 1.720%, 7/21/2021(a) | | | 1,281,633 | |
| | 3,045,000 | | | NextGear Floorplan Master Owner Trust, Series 2017-1A, Class A1, 1-month LIBOR + 0.850%, 2.327%, 4/18/2022, 144A(a)(b) | | | 3,065,019 | |
| | 815,000 | | | NextGear Floorplan Master Owner Trust, Series 2017-2A, Class A1, 1-month LIBOR + 0.680%, 2.157%, 10/17/2022, 144A(a)(b) | | | 816,453 | |
| | 970,000 | | | Nissan Auto Receivables Owner Trust, Series 2016-C, Class A3, 1.180%, 1/15/2021(a) | | | 960,016 | |
| | 870,428 | | | Nissan Auto Receivables Owner Trust, Series 2017-A, Class A2B, 1-month LIBOR + 0.060%, 1.537%, 1/15/2020(a)(b) | | | 870,261 | |
| | 1,525,000 | | | Nissan Auto Receivables Owner Trust, Series 2017-A, Class A3, 1.740%, 8/16/2021(a) | | | 1,515,723 | |
| | 3,045,000 | | | Prestige Auto Receivables Trust, Series 2016-1A, Class D, 5.150%, 11/15/2021, 144A(a) | | | 3,126,315 | |
| | 1,261,399 | | | Toyota Auto Receivables Owner Trust, Series 2015-C, Class A3, 1.340%, 6/17/2019(a) | | | 1,259,842 | |
| | 795,000 | | | Toyota Auto Receivables Owner Trust, Series 2016-C, Class A3, 1.140%, 8/17/2020(a) | | | 789,639 | |
| | 880,183 | | | Toyota Auto Receivables Owner Trust, Series 2016-D, Class A2B, 1-month LIBOR + 0.130%, 1.607%, 5/15/2019(a)(b) | | | 880,358 | |
| | 2,940,000 | | | Toyota Auto Receivables Owner Trust, Series 2017-B, Class A2B, 1-month LIBOR + 0.060%, 1.537%, 1/15/2020(a)(b) | | | 2,939,998 | |
| | 1,345,000 | | | USAA Auto Owner Trust, Series 2016-1, Class A3, 1.200%, 6/15/2020(a) | | | 1,339,841 | |
| | 1,296,074 | | | Veros Automobile Receivables Trust, Series 2017-1, Class A, 2.840%, 4/17/2023, 144A(a) | | | 1,293,589 | |
| | 595,000 | | | Westlake Automobile Receivables Trust, Series 2017-1A, Class D, 3.460%, 10/17/2022, 144A(a) | | | 597,505 | |
| | | | | | | | |
| | | | | | | 56,126,763 | |
| | | | | | | | |
| | | | ABS Credit Card — 4.5% | | | | |
| | 3,145,000 | | | American Express Credit Account Master Trust, Series 2013-1, Class A, 1-month LIBOR + 0.420%, 1.897%, 2/16/2021(a)(b) | | | 3,150,960 | |
| | 2,765,000 | | | American Express Issuance Trust II, Series 2013-2, Class A, 1-month LIBOR + 0.430%, 1.907%,
8/15/2019(a)(b) | | | 2,772,047 | |
| | 2,050,000 | | | BA Credit Card Trust, Series 2014-A1, Class A, 1-month LIBOR + 0.380%, 1.857%, 6/15/2021(a)(b) | | | 2,055,726 | |
| | 995,000 | | | Bank of America Credit Card Trust, Series 2016-A1, Class A, 1-month LIBOR + 0.390%, 1.867%,
10/15/2021(a)(b) | | | 998,547 | |
See accompanying notes to financial statements.
35 |
Portfolio of Investments – as of December 31, 2017
Loomis Sayles Strategic Alpha Fund – (continued)
| | | | | | | | |
Principal
Amount (‡) | | | Description | | Value (†) | |
| | | | ABS Credit Card — continued | | | | |
| $ | 4,385,000 | | | Bank of America Credit Card Trust, Series 2017-A1, Class A1, 1.950%, 8/15/2022(a) | | $ | 4,365,388 | |
| | 3,600,000 | | | Capital One Multi-Asset Execution Trust, Series 2015-A7, Class A7, 1.450%, 8/16/2021(a) | | | 3,587,902 | |
| | 2,585,000 | | | Capital One Multi-Asset Execution Trust, Series 2017-A1, Class A1, 2.000%, 1/17/2023(a) | | | 2,569,067 | |
| | 3,560,000 | | | Chase Issuance Trust, Series 2015-A1, Class A1, 1-month LIBOR + 0.320%, 1.797%, 2/18/2020(a)(b) | | | 3,561,313 | |
| | 3,500,000 | | | Chase Issuance Trust, Series 2015-A4, Class A4, 1.840%, 4/15/2022(a) | | | 3,473,822 | |
| | 3,120,000 | | | Chase Issuance Trust, Series 2016-A2, Class A, 1.370%, 6/15/2021(a) | | | 3,090,061 | |
| | 5,825,000 | | | Citibank Credit Card Issuance Trust, Series 2013-A7, Class A7, 1-month LIBOR + 0.430%, 1.862%,
9/10/2020(a)(b) | | | 5,839,448 | |
| | 3,045,000 | | | Citibank Credit Card Issuance Trust, Series 2014-A8, Class A8, 1.730%, 4/09/2020(a) | | | 3,045,000 | |
| | 5,800,000 | | | Citibank Credit Card Issuance Trust, Series 2016-A1, Class A1, 1.750%, 11/19/2021(a) | | | 5,760,872 | |
| | 5,520,000 | | | Citibank Credit Card Issuance Trust, Series 2017-A8, Class A8, 1.860%, 8/08/2022(a) | | | 5,468,310 | |
| | 2,405,000 | | | Discover Card Execution Note Trust, Series 2013-A1, Class A1, 1-month LIBOR + 0.300%, 1.777%,
8/17/2020(a)(b) | | | 2,405,810 | |
| | | | | | | | |
| | | | | | | 52,144,273 | |
| | | | | | | | |
| | | | ABS Home Equity — 12.7% | | | | |
| | 565,848 | | | Adjustable Rate Mortgage Trust, Series 2004-4, Class 3A1, 3.539%, 3/25/2035(a)(c) | | | 554,304 | |
| | 1,197,502 | | | Adjustable Rate Mortgage Trust, Series 2005-1, Class 3A1, 3.335%, 5/25/2035(a)(c) | | | 1,208,216 | |
| | 1,986,242 | | | Ajax Mortgage Loan Trust, Series 2016-B, Class A, 4.000%, 9/25/2065, 144A(a)(c) | | | 1,983,566 | |
| | 1,327,184 | | | Ajax Mortgage Loan Trust, Series 2016-C, Class A, 4.000%, 10/25/2057, 144A(a)(c) | | | 1,336,578 | |
| | 409,194 | | | Ajax Mortgage Loan Trust, Series 2017-A, Class A, 3.470%, 4/25/2057, 144A(a)(c) | | | 409,809 | |
| | 1,615,000 | | | Ajax Mortgage Loan Trust, Series 2017-B, Class A, 3.163%, 9/25/2056, 144A(a)(c)(d) | | | 1,614,995 | |
| | 490,719 | | | Alternative Loan Trust, Series 2003-9T1, Class A7, 5.500%, 7/25/2033(a) | | | 499,174 | |
| | 499,657 | | | Alternative Loan Trust, Series 2004-16CB, Class 1A1, 5.500%, 7/25/2034(a) | | | 512,954 | |
| | 557,851 | | | Alternative Loan Trust, Series 2004-16CB, Class 3A1, 5.500%, 8/25/2034(a) | | | 571,752 | |
| | 370,818 | | | Alternative Loan Trust, Series 2004-28CB, Class 5A1, 5.750%, 1/25/2035(a) | | | 371,139 | |
| | 1,112,319 | | | Alternative Loan Trust, Series 2005-J1, Class 2A1, 5.500%, 2/25/2025(a) | | | 1,130,161 | |
| | 300,000 | | | American Homes 4 Rent, Series 2014-SFR2, Class D, 5.149%, 10/17/2036, 144A(a) | | | 324,027 | |
| | 2,170,000 | | | American Homes 4 Rent, Series 2014-SFR2, Class E, 6.231%, 10/17/2036, 144A(a) | | | 2,422,081 | |
| | 1,200,000 | | | American Homes 4 Rent, Series 2014-SFR3, Class E, 6.418%, 12/17/2036, 144A(a) | | | 1,351,674 | |
| | 708,541 | | | Banc of America Alternative Loan Trust, Series 2003-8, Class 1CB1, 5.500%, 10/25/2033(a) | | | 722,471 | |
See accompanying notes to financial statements.
| 36
Portfolio of Investments – as of December 31, 2017
Loomis Sayles Strategic Alpha Fund – (continued)
| | | | | | | | |
Principal
Amount (‡) | | | Description | | Value (†) | |
| | | | ABS Home Equity — continued | | | | |
| $ | 1,381,350 | | | Banc of America Funding Trust, Series 2004-B, Class 4A2, 3.487%, 11/20/2034(a)(c) | | $ | 1,368,339 | |
| | 397,138 | | | Banc of America Funding Trust, Series 2005-5, Class 1A1, 5.500%, 9/25/2035(a) | | | 415,685 | |
| | 826,405 | | | Banc of America Funding Trust, Series 2005-7, Class 3A1, 5.750%, 11/25/2035(a) | | | 868,406 | |
| | 639,905 | | | Banc of America Funding Trust, Series 2007-4, Class 5A1, 5.500%, 11/25/2034(a) | | | 653,532 | |
| | 1,544,468 | | | Banc of America Mortgage Trust, Series 2005-I, Class 4A1, 3.389%, 10/25/2035(a)(c) | | | 1,516,561 | |
| | 1,218,749 | | | Bayview Opportunity Master Fund IIIa Trust, Series 2017-RN7, Class A1, 3.105%, 9/28/2032, 144A(a)(c) | | | 1,216,305 | |
| | 2,175,000 | | | Bayview Opportunity Master Fund IIIa Trust, Series 2017-RN8, Class A1, 3.352%, 11/28/2032, 144A(a)(c) | | | 2,170,892 | |
| | 218,232 | | | Bayview Opportunity Master Fund IIIb Trust, Series 2017-RN2, Class A1, 3.475%, 4/28/2032, 144A(a)(c) | | | 218,809 | |
| | 328,904 | | | Bayview Opportunity Master Fund IIIb Trust, Series 2017-RN3, Class A1, 3.228%, 5/28/2032, 144A(a)(c) | | | 328,304 | |
| | 606,142 | | | Bayview Opportunity Master Fund IVb Trust, Series 2017-NPL1, Class A1, 3.598%, 1/28/2032, 144A(a)(c) | | | 606,872 | |
| | 1,724,079 | | | Bayview Opportunity Master Fund IVb Trust, Series 2017-NPL2, Class A1, 2.981%, 10/28/2032, 144A(a)(c) | | | 1,719,078 | |
| | 767,064 | | | BCAP LLC Trust, Series 2007-AA2, Class 22A1, 6.000%, 3/25/2022(a) | | | 761,215 | |
| | 5,778 | | | CAM Mortgage Trust, Series 2016-1, Class A, 4.000%, 1/15/2056, 144A(a)(c) | | | 5,780 | |
| | 2,055,000 | | | CAM Mortgage Trust, Series 2016-1, Class M, 5.000%, 1/15/2056, 144A(a)(c) | | | 2,023,594 | |
| | 591,106 | | | CHL Mortgage Pass-Through Trust, Series 2004-12, Class 8A1, 3.740%, 8/25/2034(a)(c) | | | 581,382 | |
| | 729,828 | | | CHL Mortgage Pass-Through Trust, Series 2005-21, Class A17, 5.500%, 10/25/2035(a) | | | 692,425 | |
| | 1,829,495 | | | Citigroup Mortgage Loan Trust, Inc., Series 2005-3, Class 2A3, 3.494%, 8/25/2035(a)(c) | | | 1,826,908 | |
| | 2,200,000 | | | Colony American Finance Ltd., Series 2015-1, Class D, 5.649%, 10/15/2047, 144A(a) | | | 2,319,968 | |
| | 1,065,000 | | | Colony American Finance Ltd., Series 2016-1, Class C, 4.638%, 6/15/2048, 144A(a)(c) | | | 1,074,321 | |
| | 2,105,000 | | | Colony American Homes, Series 2014-1A, Class E, 1-month LIBOR + 2.800%, 4.277%, 5/17/2031, 144A(a)(b) | | | 2,117,023 | |
| | 288,666 | | | Colony American Homes, Series 2014-2A, Class E, 1-month LIBOR + 3.200%, 4.677%, 7/17/2031, 144A(a)(b) | | | 290,086 | |
| | 3,190,000 | | | Colony American Homes, Series 2015-1A, Class D, 1-month LIBOR + 2.150%, 3.582%, 7/17/2032, 144A(a)(b) | | | 3,195,316 | |
| | 2,545,000 | | | Colony American Homes, Series 2015-1A, Class F, 1-month LIBOR + 3.650%, 5.082%, 7/17/2032, 144A(a)(b) | | | 2,557,417 | |
| | 705,737 | | | Countrywide Alternative Loan Trust, Series 2003-22CB, Class 1A1, 5.750%, 12/25/2033(a) | | | 723,667 | |
See accompanying notes to financial statements.
37 |
Portfolio of Investments – as of December 31, 2017
Loomis Sayles Strategic Alpha Fund – (continued)
| | | | | | | | |
Principal
Amount (‡) | | | Description | | Value (†) | |
| | | | ABS Home Equity — continued | | | | |
| $ | 611,988 | | | Countrywide Alternative Loan Trust, Series 2004-14T2, Class A11, 5.500%, 8/25/2034(a) | | $ | 637,212 | |
| | 1,142,276 | | | Countrywide Alternative Loan Trust, Series 2004-J10, Class 2CB1, 6.000%, 9/25/2034(a) | | | 1,182,295 | |
| | 612,026 | | | Countrywide Alternative Loan Trust, Series 2004-J3, Class 1A1, 5.500%, 4/25/2034(a) | | | 620,990 | |
| | 471 | | | Countrywide Alternative Loan Trust, Series 2004-J7, Class 1A5, 5.039%, 8/25/2034(a)(c)(d)(e) | | | 468 | |
| | 733,067 | | | Countrywide Alternative Loan Trust, Series 2005-14, Class 2A1, 1-month LIBOR + 0.210%, 1.762%, 5/25/2035(a)(b) | | | 696,891 | |
| | 92,354 | | | Countrywide Home Loan Mortgage Pass Through Trust, Series 2004-HYB4, Class 2A1, 3.492%, 9/20/2034(a)(c) | | | 89,672 | |
| | 600,299 | | | Credit Suisse First Boston Mortgage Securities Corp., Series 2003-AR26, Class 7A1, 3.538%, 11/25/2033(a)(c) | | | 604,975 | |
| | 390,908 | | | Credit Suisse First Boston Mortgage Securities Corp., Series 2003-AR28, Class 4A1, 3.613%, 12/25/2033(a)(c) | | | 392,491 | |
| | 243,105 | | | CSFB Mortgage-Backed Pass-Through Certificates, Series 2003-27, Class 4A4, 5.750%, 11/25/2033(a) | | | 250,620 | |
| | 869,060 | | | Deutsche Mortgage Securities, Inc., Series 2004-4, Class 7AR1, 1-month LIBOR + 0.350%, 1.902%, 6/25/2034(a)(b) | | | 817,859 | |
| | 694,370 | | | DSLA Mortgage Loan Trust, Series 2005-AR5, Class 2A1A, 1-month LIBOR + 0.330%, 1.825%, 9/19/2045(a)(b) | | | 573,387 | |
| | 1,829,171 | | | Dukinfield 2 PLC, Series 2, Class A, GBP 3-month LIBOR + 1.250%, 1.763%, 12/20/2052, (GBP)(a)(b) | | | 2,501,629 | |
| | 667,276 | | | Eurosail PLC, Series 2007-2X, Class A3C, GBP 3-month LIBOR + 0.150%, 0.670%, 3/13/2045, (GBP)(a)(b) | | | 881,152 | |
| | 1,698,242 | | | Freddie Mac Structured Agency Credit Risk Debt Notes, Series 2014-DN1, Class M2, 1-month LIBOR + 2.200%, 3.752%, 2/25/2024(a)(b) | | | 1,749,576 | |
| | 1,063,896 | | | Freddie Mac Structured Agency Credit Risk Debt Notes, Series 2014-DN2, Class M2, 1-month LIBOR + 1.650%, 3.202%, 4/25/2024(a)(b) | | | 1,080,176 | |
| | 2,585,000 | | | Freddie Mac Structured Agency Credit Risk Debt Notes, Series 2015-DNA1, Class M2, 1-month LIBOR + 1.850%, 3.402%, 10/25/2027(a)(b) | | | 2,648,404 | |
| | 1,382,657 | | | GCAT LLC, Series 2017-2, Class A1, 3.500%, 4/25/2047, 144A(a)(c) | | | 1,384,164 | |
| | 819,776 | | | GCAT LLC, Series 2017-3, Class A1, 3.352%, 4/25/2047, 144A(a)(c) | | | 820,288 | |
| | 165,076 | | | GCAT LLC, Series 2017-4, Class A1, 3.228%, 5/25/2022, 144A(a)(c) | | | 165,117 | |
| | 546,243 | | | GCAT LLC, Series 2017-5, Class A1, 3.228%, 7/25/2047, 144A(a)(c) | | | 546,571 | |
| | 382,713 | | | GMAC Mortgage Corp. Loan Trust, Series 2005-AR4, Class 3A1, 3.997%, 7/19/2035(a)(c) | | | 369,237 | |
| | 290,058 | | | GSR Mortgage Loan Trust, Series 2005-AR4, Class 4A1, 3.696%, 7/25/2035(a)(c) | | | 285,055 | |
| | 2,602,095 | | | IndyMac Index Mortgage Loan Trust, Series 2004-AR12, Class A1, 1-month LIBOR + 0.780%, 2.332%, 12/25/2034(a)(b) | | | 2,393,651 | |
| | 3,445,156 | | | IndyMac Index Mortgage Loan Trust, Series 2004-AR6, Class 4A, 3.671%, 10/25/2034(a)(c) | | | 3,507,205 | |
| | 841,795 | | | IndyMac Index Mortgage Loan Trust, Series 2004-AR7, Class A5, 1-month LIBOR + 1.220%, 2.772%, 9/25/2034(a)(b) | | | 766,150 | |
| | 1,573,684 | | | IndyMac Index Mortgage Loan Trust, Series 2005-16IP, Class A1, 1-month LIBOR + 0.640%, 2.192%, 7/25/2045(a)(b) | | | 1,515,337 | |
See accompanying notes to financial statements.
| 38
Portfolio of Investments – as of December 31, 2017
Loomis Sayles Strategic Alpha Fund – (continued)
| | | | | | | | |
Principal
Amount (‡) | | | Description | | Value (†) | |
| | | | ABS Home Equity — continued | | | | |
| $ | 3,534,578 | | | IndyMac Index Mortgage Loan Trust, Series 2006-AR2, Class 2A1, 1-month LIBOR + 0.210%, 1.762%, 2/25/2046(a)(b) | | $ | 3,071,580 | |
| | 2,985,000 | | | Invitation Homes Trust, Series 2015-SFR1, Class E, 1-month LIBOR + 4.200%, 5.660%, 3/17/2032, 144A(a)(b) | | | 3,024,818 | |
| | 1,765,000 | | | Invitation Homes Trust, Series 2015-SFR3, Class E, 1-month LIBOR + 3.750%, 5.210%, 8/17/2032, 144A(a)(b) | | | 1,791,501 | |
| | 514,156 | | | JPMorgan Mortgage Trust, Series 2003-A2, Class 3A1, 3.104%, 11/25/2033(a)(c) | | | 494,169 | |
| | 1,719,778 | | | JPMorgan Mortgage Trust, Series 2004-S1, Class 2A1, 6.000%, 9/25/2034(a) | | | 1,736,854 | |
| | 1,328,739 | | | JPMorgan Mortgage Trust, Series 2005-A2, Class 3A2, 3.468%, 4/25/2035(a)(c) | | | 1,323,027 | |
| | 323,605 | | | JPMorgan Mortgage Trust, Series 2005-A3, Class 4A1, 3.664%, 6/25/2035(a)(c) | | | 326,986 | |
| | 1,124,330 | | | JPMorgan Mortgage Trust, Series 2006-A1, Class 1A2, 3.643%, 2/25/2036(a)(c) | | | 1,044,266 | |
| | 573,809 | | | Lehman XS Trust, Series 2005-7N, Class 3A1, 1-month LIBOR + 0.280%, 1.832%, 12/25/2035(a)(b) | | | 488,929 | |
| | 3 | | | Lehman XS Trust, Series 2006-12N, Class A2A1, 1-month LIBOR + 0.150%, 1.702%, 8/25/2046(b)(d)(e) | | | 3 | |
| | 680,344 | | | Lehman XS Trust, Series 2006-2N, Class 1A1, 1-month LIBOR + 0.260%, 1.812%, 2/25/2046(a)(b) | | | 599,803 | |
| | 535,522 | | | Ludgate Funding PLC, Series 2007-1, Class A2B, 3-month EURIBOR + 0.160%, 0.000%, 1/01/2061,
(EUR)(a)(b) | | | 623,855 | |
| | 1,983,025 | | | Ludgate Funding PLC, Series 2008-W1X, Class A1, GBP 3-month LIBOR + 0.600%, 0.936%, 1/01/2061,
(GBP)(a)(b) | | | 2,620,925 | |
| | 360,755 | | | MASTR Adjustable Rate Mortgages Trust, Series 2004-4, Class 5A1, 3.650%, 5/25/2034(a)(c) | | | 356,778 | |
| | 1,425,320 | | | MASTR Adjustable Rate Mortgages Trust, Series 2004-7, Class 3A1, 3.308%, 7/25/2034(a)(c) | | | 1,392,772 | |
| | 331,643 | | | MASTR Adjustable Rate Mortgages Trust, Series 2006-2, Class 1A1, 3.707%, 4/25/2036(a)(c) | | | 329,726 | |
| | 459,988 | | | MASTR Alternative Loan Trust, Series 2003-9, Class 4A1, 5.250%, 11/25/2033(a) | | | 475,307 | |
| | 531,505 | | | MASTR Alternative Loan Trust, Series 2004-5, Class 1A1, 5.500%, 6/25/2034(a) | | | 544,474 | |
| | 638,440 | | | MASTR Alternative Loan Trust, Series 2004-5, Class 2A1, 6.000%, 6/25/2034(a) | | | 661,071 | |
| | 1,680,841 | | | MASTR Alternative Loan Trust, Series 2004-8, Class 2A1, 6.000%, 9/25/2034(a) | | | 1,785,269 | |
| | 179,525 | | | MLCC Mortgage Investors, Inc., Series 2006-2, Class 2A, 3.184%, 5/25/2036(a)(c) | | | 181,189 | |
| | 652,584 | | | Morgan Stanley Mortgage Loan Trust, Series 2005-7, Class 4A2, 5.500%, 11/25/2035(a) | | | 621,129 | |
| | 1,216,417 | | | Morgan Stanley Mortgage Loan Trust, Series 2005-7, Class 7A5, 5.500%, 11/25/2035(a) | | | 1,252,075 | |
| | 775,189 | | | Newgate Funding PLC, Series 2007-3X, Class A2B, 3-month EURIBOR + 0.600%, 0.271%, 12/15/2050, (EUR)(a)(b) | | | 921,595 | |
See accompanying notes to financial statements.
39 |
Portfolio of Investments – as of December 31, 2017
Loomis Sayles Strategic Alpha Fund – (continued)
| | | | | | | | |
Principal
Amount (‡) | | | Description | | Value (†) | |
| | | | ABS Home Equity — continued | | | | |
| $ | 314,880 | | | NYMT Residential LLC, Series 2016-RP1A, Class A, 4.000%, 3/25/2021, 144A(a)(c) | | $ | 315,325 | |
| | 1,238,905 | | | Oak Hill Advisors Residential Loan Trust, Series 2017-NPL1, Class A1, 3.000%, 6/25/2057, 144A(a)(c) | | | 1,237,120 | |
| | 2,572,422 | | | Oak Hill Advisors Residential Loan Trust, Series 2017-NPL2, Class A1, 3.000%, 7/25/2057, 144A(a)(c) | | | 2,569,166 | |
| | 3,110,000 | | | Oak Hill Advisors Residential Loan Trust, Series 2017-NPL2, Class A2, 4.875%, 7/25/2057, 144A(a)(c) | | | 3,093,012 | |
| | 576,377 | | | OWS Structured Asset Trust, Series 2016-NPL1, Class A1, 3.750%, 7/25/2056, 144A(a)(c) | | | 580,764 | |
| | 4,126,960 | | | Preston Ridge Partners Mortgage LLC, Series 2017-2A, Class A1, 3.500%, 9/25/2022, 144A(a)(c) | | | 4,115,009 | |
| | 1,165,000 | | | Preston Ridge Partners Mortgage LLC, Series 2017-2A, Class A2, 5.000%, 9/25/2022, 144A(a)(c) | | | 1,133,729 | |
| | 1,422,132 | | | Preston Ridge Partners Mortgage LLC, Series 2017-3A, Class A1, 3.470%, 11/25/2022, 144A(a)(c) | | | 1,417,150 | |
| | 405,000 | | | Preston Ridge Partners Mortgage LLC, Series 2017-3A, Class A2, 5.000%, 11/25/2022, 144A(a)(c) | | | 392,960 | |
| | 3,899,291 | | | RCO Mortgage LLC, Series 2017-1, Class A1, 3.375%, 8/25/2022, 144A(a)(c) | | | 3,902,064 | |
| | 981,625 | | | Residential Accredit Loans, Inc. Trust, Series 2006-QO4, Class 2A1, 1-month LIBOR + 0.190%, 1.742%, 4/25/2046(a)(b) | | | 923,697 | |
| | 1,478,381 | | | Residential Asset Securitization Trust, Series 2005-A8CB, Class A9, 5.375%, 7/25/2035(a) | | | 1,309,503 | |
| | 474,009 | | | Residential Funding Mortgage Securities, Series 2006-S1, Class 1A3, 5.750%, 1/25/2036(a) | | | 473,494 | |
| | 2,295,313 | | | Residential Funding Mortgage Securities, Series 2006-SA2, Class 3A1, 4.599%, 8/25/2036(a)(c) | | | 2,140,035 | |
| | 245,621 | | | RMAC PLC, Series 2005-NS3X, Class A2C, 3-month EURIBOR + 0.360%, 0.034%, 6/12/2043, (EUR)(a)(b) | | | 288,942 | |
| | 434,018 | | | RMAC Securities No. 1 PLC, Series 2006-NS1X, Class A2C, 3-month EURIBOR + 0.150%, 0.000%, 6/12/2044, (EUR)(a)(b) | | | 502,607 | |
| | 335,250 | | | RMAC Securities No. 1 PLC, Series 2007-NS1X, Class A2A, GBP 3-month LIBOR + 0.150%, 0.673%, 6/12/2044, (GBP)(a)(b) | | | 436,168 | |
| | 1,819,000 | | | Starwood Waypoint Homes, Series 2015-1A, Class E, 1-month LIBOR + 3.000%, 4.432%, 7/17/2032,
144A(a)(b) | | | 1,833,998 | |
| | 695,237 | | | Structured Adjustable Rate Mortgage Loan Trust, Series 2004-6, Class 1A, 3.361%, 6/25/2034(a)(c) | | | 686,155 | |
| | 3,655,095 | | | Structured Adjustable Rate Mortgage Loan Trust, Series 2005-14, Class A1, 1-month LIBOR + 0.310%, 1.862%, 7/25/2035(a)(b) | | | 2,927,997 | |
| | 632,238 | | | Structured Asset Securities Corp. Mortgage Pass Through Certificates, Series 2004-20, Class 8A7, 5.750%, 11/25/2034(a) | | | 639,315 | |
| | 356,271 | | | Structured Asset Securities Corp. Trust, Series 2005-1, Class 7A7, 5.500%, 2/25/2035(a) | | | 361,406 | |
| | 1,200,000 | | | Towd Point Mortgage Funding PLC, Series 2016-GR1X, Class B, GBP 3-month LIBOR + 1.400%, 1.791%, 7/20/2046, (GBP)(a)(b) | | | 1,633,601 | |
| | 674,381 | | | VOLT LIV LLC, Series 2017-NPL1, Class A1, 3.500%, 2/25/2047, 144A(a)(c) | | | 675,355 | |
| | 2,400,000 | | | VOLT LIV LLC, Series 2017-NPL1, Class A2, 6.000%, 2/25/2047, 144A(a)(c) | | | 2,408,305 | |
| | 930,099 | | | VOLT LV LLC, Series 2017-NPL2, Class A1, 3.500%, 3/25/2047, 144A(a)(c) | | | 933,499 | |
See accompanying notes to financial statements.
| 40
Portfolio of Investments – as of December 31, 2017
Loomis Sayles Strategic Alpha Fund – (continued)
| | | | | | | | |
Principal
Amount (‡) | | | Description | | Value (†) | |
| | | | ABS Home Equity — continued | | | | |
| $ | 2,084,585 | | | VOLT LVI LLC, Series 2017-NPL3, Class A1, 3.500%, 3/25/2047, 144A(a)(c) | | $ | 2,093,521 | |
| | 2,840,000 | | | VOLT LVI LLC, Series 2017-NPL3, Class A2, 5.875%, 3/25/2047, 144A(a)(c) | | | 2,848,011 | |
| | 502,296 | | | VOLT LVII LLC, Series 2017-NPL4, Class A1, 3.375%, 4/25/2047, 144A(a)(c) | | | 504,280 | |
| | 1,207,678 | | | VOLT LXI LLC, Series 2017-NPL8, Class A1, 3.125%, 6/25/2047, 144A(a)(c) | | | 1,208,172 | |
| | 1,190,000 | | | VOLT LXIII LLC, Series 2017-NP10, Class A1, 3.000%, 10/25/2047, 144A(a)(c) | | | 1,188,207 | |
| | 1,125,000 | | | VOLT XL LLC, Series 2015-NP14, Class A2, 4.875%, 11/27/2045, 144A(a)(c) | | | 1,122,177 | |
| | 2,133,996 | | | Wells Fargo Mortgage Backed Securities Trust, Series 2004-I, Class 2A1, 3.442%, 7/25/2034(a)(c) | | | 2,164,046 | |
| | 320,562 | | | Wells Fargo Mortgage Backed Securities Trust, Series 2004-O, Class A1, 3.554%, 8/25/2034(a)(c) | | | 328,504 | |
| | 174,733 | | | Wells Fargo Mortgage Backed Securities Trust, Series 2005-11, Class 2A3, 5.500%, 11/25/2035(a) | | | 180,615 | |
| | 807,936 | | | Wells Fargo Mortgage Backed Securities Trust, Series 2005-16, Class A18, 6.000%, 1/25/2036(a) | | | 813,298 | |
| | 436,532 | | | Wells Fargo Mortgage Backed Securities Trust, Series 2005-AR10, Class 2A4, 3.473%, 5/01/2035(a)(c) | | | 447,317 | |
| | 542,376 | | | Wells Fargo Mortgage Backed Securities Trust, Series 2005-AR12, Class 2A5, 3.451%, 6/25/2035(a)(c) | | | 549,162 | |
| | | | | | | | |
| | | | | | | 146,791,145 | |
| | | | | | | | |
| | | | ABS Other — 4.4% | | | | |
| | 878,140 | | | AASET Trust, Series 2017-1A, Class A, 3.967%, 5/16/2042, 144A(a) | | | 881,218 | |
| | 3,612,022 | | | AIM Aviation Finance Ltd., Series 2015-1A, Class B1, 5.072%, 2/15/2040, 144A(a)(c) | | | 3,535,033 | |
| | 1,108,378 | | | AIM Aviation Finance Ltd., Series 2015-1A, Class C1, 4.750%, 2/15/2040, 144A(a) | | | 1,023,800 | |
| | 350,000 | | | Ascentium Equipment Receivables Trust, Series 2017-2A, Class C, 2.870%, 8/10/2022, 144A(a) | | | 347,386 | |
| | 1,168,958 | | | Blackbird Capital Aircraft Lease Securitization Ltd., Series 2016-1A, Class A, 4.213%, 12/16/2041, 144A(a)(c) | | | 1,211,037 | |
| | 1,333,932 | | | Blackbird Capital Aircraft Lease Securitization Ltd., Series 2016-1A, Class B, 5.682%, 12/16/2041, 144A(a)(c) | | | 1,336,273 | |
| | 1,233,854 | | | CLUB Credit Trust, Series 2017-P1, Class A, 2.420%, 9/15/2023, 144A(a) | | | 1,233,222 | |
| | 1,064,174 | | | Diamond Resorts Owner Trust, Series 2017-1A, Class C, 6.070%, 10/22/2029, 144A(a) | | | 1,056,669 | |
| | 2,069,787 | | | GCA2014 Holdings Ltd., Series 2014-1, Class C, 6.000%, 1/05/2030, 144A(d)(e)(f)(s) | | | 1,459,200 | |
| | 820,999 | | | GCA2014 Holdings Ltd., Series 2014-1, Class D, 7.500%, 1/05/2030, 144A(d)(e)(f)(s) | | | 236,612 | |
| | 3,410,000 | | | GCA2014 Holdings Ltd., Series 2014-1, Class E, Zero Coupon, 1/05/2030, 144A(d)(e)(f)(g)(s) | | | — | |
| | 1,317,885 | | | Global Container Assets Ltd., Series 2015-1A, Class B, 4.500%, 2/05/2030, 144A(f)(h) | | | 1,265,396 | |
| | 8,818 | | | OneMain Financial Issuance Trust, Series 2014-2A, Class A, 2.470%, 9/18/2024, 144A(a) | | | 8,820 | |
| | 745,000 | | | OneMain Financial Issuance Trust, Series 2014-2A, Class B, 3.020%, 9/18/2024, 144A(a) | | | 745,332 | |
See accompanying notes to financial statements.
41 |
Portfolio of Investments – as of December 31, 2017
Loomis Sayles Strategic Alpha Fund – (continued)
| | | | | | | | |
Principal
Amount (‡) | | | Description | | Value (†) | |
| | | | ABS Other — continued | | | | |
| $ | 6,475,000 | | | OneMain Financial Issuance Trust, Series 2014-2A, Class D, 5.310%, 9/18/2024, 144A(a) | | $ | 6,536,630 | |
| | 1,265,000 | | | OneMain Financial Issuance Trust, Series 2015-1A, Class A, 3.190%, 3/18/2026, 144A(a) | | | 1,271,467 | |
| | 3,120,000 | | | OneMain Financial Issuance Trust, Series 2015-3A, Class B, 4.160%, 11/20/2028, 144A(a) | | | 3,175,446 | |
| | 3,100,000 | | | OneMain Financial Issuance Trust, Series 2016-1A, Class C, 6.000%, 2/20/2029, 144A(a) | | | 3,202,566 | |
| | 2,685,000 | | | OneMain Financial Issuance Trust, Series 2016-2A, Class B, 5.940%, 3/20/2028, 144A(a) | | | 2,752,247 | |
| | 3,583,526 | | | Shenton Aircraft Investment I Ltd., Series 2015-1A, Class A, 4.750%, 10/15/2042, 144A(a) | | | 3,711,130 | |
| | 390,513 | | | Sierra Timeshare Receivables Funding LLC, Series 2013-1A, Class A, 1.590%, 11/20/2029, 144A(a) | | | 390,303 | |
| | 757,468 | | | Sierra Timeshare Receivables Funding LLC, Series 2013-3A, Class A, 2.200%, 10/20/2030, 144A(a) | | | 756,165 | |
| | 809,907 | | | SpringCastle America Funding LLC, Series 2016-AA, Class A, 3.050%, 4/25/2029, 144A(a) | | | 814,930 | |
| | 3,155,000 | | | Sprite Ltd., Series 2017-1, Class B, 5.750%, 12/15/2037, 144A(a) | | | 3,099,966 | |
| | 2,195,083 | | | TAL Advantage V LLC, Series 2013-2A, Class A, 3.550%, 11/20/2038, 144A(a) | | | 2,189,789 | |
| | 1,710,000 | | | Tidewater Sales Finance Master Trust, Series 2017-AA, Class A, 4.550%, 4/15/2021, 144A(f)(h) | | | 1,703,148 | |
| | 1,296,648 | | | Wave LLC, Series 2017-1A, Class B, 5.682%, 11/15/2042, 144A(a)(d) | | | 1,296,633 | |
| | 5,700,000 | | | Working Capital Solutions Funding LLC, 1-month LIBOR + 6.950%, 7.711%, 8/31/2018, 144A(b)(d)(e)(f)(s) | | | 5,700,000 | |
| | | | | | | | |
| | | | | | | 50,940,418 | |
| | | | | | | | |
| | | | ABS Student Loan — 0.8% | | | | |
| | 1,352,000 | | | SLM Private Credit Student Loan Trust, Series 2003-A, Class A3, 28-day ARS, 4.010%, 6/15/2032(a)(b)(d) | | | 1,351,459 | |
| | 3,550,000 | | | SLM Private Credit Student Loan Trust, Series 2003-B, Class A3, 28-day ARS, 4.040%, 3/15/2033(a)(b)(d) | | | 3,548,580 | |
| | 1,350,000 | | | SMB Private Education Loan Trust, Series 2017-B, Class A2B, 1-month LIBOR + 0.750%, 2.101%, 10/15/2035, 144A(a)(b) | | | 1,354,961 | |
| | 191,901 | | | SoFi Professional Loan Program LLC, Series 2014-B, Class A1, 1-month LIBOR + 1.250%, 2.802%, 8/25/2032, 144A(a)(b) | | | 194,169 | |
| | 966,821 | | | SoFi Professional Loan Program LLC, Series 2015-A, Class A1, 1-month LIBOR + 1.200%, 2.529%, 3/25/2033, 144A(a)(b) | | | 984,238 | |
| | 2,049,512 | | | SoFi Professional Loan Program LLC, Series 2016-A, Class B, 3.570%, 1/26/2038, 144A(a) | | | 2,041,088 | |
| | | | | | | | |
| | | | | | | 9,474,495 | |
| | | | | | | | |
| | | | ABS Whole Business — 0.4% | | | | |
| | 3,099,425 | | | Coinstar Funding LLC, Series 2017-1A, Class A2, 5.216%, 4/25/2047, 144A(a) | | | 3,218,603 | |
| | 957,600 | | | Five Guys Funding LLC, Series 2017-1A, Class A2, 4.600%, 7/25/2047, 144A(a) | | | 982,618 | |
| | | | | | | | |
| | | | | | | 4,201,221 | |
| | | | | | | | |
See accompanying notes to financial statements.
| 42
Portfolio of Investments – as of December 31, 2017
Loomis Sayles Strategic Alpha Fund – (continued)
| | | | | | | | |
Principal
Amount (‡) | | | Description | | Value (†) | |
| | | | Aerospace & Defense — 0.6% | | | | |
| $ | 1,135,000 | | | Embraer Netherlands Finance BV, 5.050%, 6/15/2025(a) | | $ | 1,203,100 | |
| | 1,605,000 | | | Embraer Netherlands Finance BV, 5.400%, 2/01/2027(a) | | | 1,733,400 | |
| | 1,195,000 | | | Embraer Overseas Ltd., 5.696%, 9/16/2023, 144A(a) | | | 1,305,537 | |
| | 2,550,000 | | | Leonardo U.S. Holdings, Inc., 6.250%, 1/15/2040, 144A(a) | | | 2,975,799 | |
| | | | | | | | |
| | | | | | | 7,217,836 | |
| | | | | | | | |
| | | | Airlines — 1.4% | | | | |
| | 7,301,380 | | | Air Canada Pass Through Trust, Series 2015-2, Class B, 5.000%, 6/15/2025, 144A(a) | | | 7,646,662 | |
| | 3,150,000 | | | American Airlines Pass Through Certificates, Series 2017-1B, Class B, 4.950%, 8/15/2026(a) | | | 3,301,515 | |
| | 4,973,237 | | | Latam Airlines Pass Through Trust, Series 2015-1, Class B, 4.500%, 8/15/2025(a) | | | 4,911,072 | |
| | | | | | | | |
| | | | | | | 15,859,249 | |
| | | | | | | | |
| | | | Automotive — 2.8% | | | | |
| | 5,875,000 | | | American Honda Finance Corp., MTN, 3-month LIBOR + 0.280%, 1.716%, 11/19/2018(a)(b) | | | 5,883,460 | |
| | 6,045,000 | | | BMW U.S. Capital LLC, 3-month LIBOR + 0.380%, 1.727%, 4/06/2020, 144A(a)(b) | | | 6,071,930 | |
| | 5,785,000 | | | BMW U.S. Capital LLC, 3-month LIBOR + 0.410%, 1.999%, 9/13/2019, 144A(a)(b) | | | 5,817,229 | |
| | 5,980,000 | | | Ford Motor Credit Co. LLC, 3-month LIBOR + 1.000%, 2.350%, 1/09/2020(a)(b) | | | 6,039,213 | |
| | 5,955,000 | | | Nissan Motor Acceptance Corp., 3-month LIBOR + 0.580%, 1.939%, 1/13/2020, 144A(a)(b) | | | 5,984,921 | |
| | 2,955,000 | | | Toyota Motor Credit Corp., MTN, 3-month LIBOR + 0.440%, 1.794%, 10/18/2019(a)(b) | | | 2,965,729 | |
| | | | | | | | |
| | | | | | | 32,762,482 | |
| | | | | | | | |
| | | | Banking — 2.6% | | | | |
| | 44,895,000 | | | Banco Hipotecario S.A., Argentina Deposit Rates Badlar Private Banks + 2.500%, 23.708%, 1/12/2020, 144A, (ARS)(a)(b) | | | 2,327,037 | |
| | 44,570,000 | | | Banco Hipotecario S.A., Argentina Deposit Rates Badlar Private Banks + 4.000%, 25.938%, 11/07/2022, 144A, (ARS)(a)(b) | | | 2,375,067 | |
| | 21,970,000 | | | Banco Macro S.A., 17.500%, 5/08/2022, 144A, (ARS)(a) | | | 1,132,413 | |
| | 46,000,000 | | | Banco Supervielle S.A., Argentina Deposit Rates Badlar Private Banks + 4.500%, 26.500%, 8/09/2020, 144A, (ARS)(a)(b) | | | 2,462,176 | |
| | 6,240,000 | | | JPMorgan Chase & Co., 3-month LIBOR + 0.680%, 2.161%, 6/01/2021(a)(b) | | | 6,273,072 | |
| | 5,800,000 | | | JPMorgan Chase Bank NA, 3-month LIBOR + 0.590%, 2.265%, 9/23/2019(a)(b) | | | 5,840,866 | |
| | 6,000,000 | | | Sumitomo Mitsui Banking Corp., Series 2FRN, 3-month LIBOR + 0.540%, 1.896%, 1/11/2019(a)(b) | | | 6,018,313 | |
| | 3,000,000 | | | Toronto-Dominion Bank (The), MTN, 3-month LIBOR + 0.420%, 1.774%, 1/18/2019(a)(b) | | | 3,007,171 | |
| | | | | | | | |
| | | | | | | 29,436,115 | |
| | | | | | | | |
| | | | Building Materials — 0.3% | | | | |
| | 2,755,000 | | | Cemex SAB de CV, 6.125%, 5/05/2025, 144A(a) | | | 2,939,585 | |
| | | | | | | | |
See accompanying notes to financial statements.
43 |
Portfolio of Investments – as of December 31, 2017
Loomis Sayles Strategic Alpha Fund – (continued)
| | | | | | | | |
Principal
Amount (‡) | | | Description | | Value (†) | |
| | | | Cable Satellite — 1.3% | | | | |
| $ | 2,865,000 | | | Cox Communications, Inc., 4.500%, 6/30/2043, 144A(a) | | $ | 2,688,331 | |
| | 1,575,000 | | | Cox Communications, Inc., 4.700%, 12/15/2042, 144A(a) | | | 1,521,422 | |
| | 1,740,000 | | | DISH DBS Corp., 5.875%, 11/15/2024(a) | | | 1,694,325 | |
| | 1,475,000 | | | DISH DBS Corp., 7.750%, 7/01/2026(a) | | | 1,550,594 | |
| | 5,800,000 | | | Telenet Finance Luxembourg Notes S.a.r.l., 5.500%, 3/01/2028, 144A(a) | | | 5,804,930 | |
| | 2,065,000 | | | Time Warner Cable LLC, 4.500%, 9/15/2042(a) | | | 1,937,416 | |
| | | | | | | | |
| | | | | | | 15,197,018 | |
| | | | | | | | |
| | | | Chemicals — 0.3% | | | | |
| | 2,230,000 | | | Braskem Netherlands Finance BV, 3.500%, 1/10/2023, 144A(a) | | | 2,189,860 | |
| | 1,490,000 | | | Mexichem SAB de CV, 4.000%, 10/04/2027, 144A(a) | | | 1,475,100 | |
| | | | | | | | |
| | | | | | | 3,664,960 | |
| | | | | | | | |
| | | | Collateralized Mortgage Obligations — 0.3% | | | | |
| | 1,590,149 | | �� | GMACM Mortgage Loan Trust, Series 2005-AR1, Class 3A, 3.889%, 3/18/2035(a)(c) | | | 1,604,833 | |
| | 53,628,953 | | | Government National Mortgage Association, Series 2012-135, Class IO, 0.603%, 1/16/2053(a)(c)(i) | | | 1,883,251 | |
| | | | | | | | |
| | | | | | | 3,488,084 | |
| | | | | | | | |
| | | | Construction Machinery — 0.3% | | | | |
| | 3,050,000 | | | Caterpillar Financial Services Corp., GMTN, 3-month LIBOR + 0.290%, 1.777%, 9/04/2020(a)(b) | | | 3,052,845 | |
| | | | | | | | |
| | | | Diversified Manufacturing — 0.5% | | | | |
| | 5,915,000 | | | United Technologies Corp., 3-month LIBOR + 0.350%, 1.727%, 11/01/2019(a)(b) | | | 5,935,288 | |
| | | | | | | | |
| | | | Electric — 1.2% | | | | |
| | 9,400,000,000 | | | Empresas Public Medellin de Medellin ESP, 8.375%, 11/08/2027, 144A, (COP)(a) | | | 3,258,491 | |
| | 8,840,000 | | | Enel SpA, (fixed rate to 9/24/2023, variable rate thereafter), 8.750%, 9/24/2073, 144A(a) | | | 10,983,700 | |
| | | | | | | | |
| | | | | | | 14,242,191 | |
| | | | | | | | |
| | | | Finance Companies — 0.5% | | | | |
| | 6,100,000 | | | USAA Capital Corp., 3-month LIBOR + 0.230%, 1.607%, 2/01/2019, 144A(a)(b) | | | 6,102,379 | |
| | | | | | | | |
| | | | Financial Other — 0.8% | | | | |
| | 2,815,000 | | | Icahn Enterprises LP/Icahn Enterprises Finance Corp., 6.375%, 12/15/2025, 144A(a) | | | 2,815,281 | |
| | 6,780,000 | | | Rialto Holdings LLC/Rialto Corp., 7.000%, 12/01/2018, 144A(a) | | | 6,796,950 | |
| | | | | | | | |
| | | | | | | 9,612,231 | |
| | | | | | | | |
| | | | Food & Beverage — 2.1% | | | | |
| | 3,850,000 | | | BRF GmbH, 4.350%, 9/29/2026, 144A(a) | | | 3,732,613 | |
| | 10,800,000 | | | BRF S.A., 7.750%, 5/22/2018, 144A, (BRL)(a) | | | 3,231,437 | |
| | 1,680,000 | | | Cosan Luxembourg S.A., 7.000%, 1/20/2027, 144A(a) | | | 1,813,594 | |
| | 2,300,000 | | | Cosan Luxembourg S.A., 9.500%, 3/14/2018, 144A, (BRL)(a) | | | 682,976 | |
| | 6,235,000 | | | Grupo Bimbo SAB de CV, 4.700%, 11/10/2047, 144A(a) | | | 6,290,866 | |
| | 2,300,000 | | | JBS USA LUX S.A./JBS USA Finance, Inc., 5.750%, 6/15/2025, 144A(a) | | | 2,213,750 | |
See accompanying notes to financial statements.
| 44
Portfolio of Investments – as of December 31, 2017
Loomis Sayles Strategic Alpha Fund – (continued)
| | | | | | | | |
Principal
Amount (‡) | | | Description | | Value (†) | |
| | | | Food & Beverage — continued | | | | |
| $ | 2,695,000 | | | JBS USA LUX S.A./JBS USA Finance, Inc., 7.250%, 6/01/2021, 144A(a) | | $ | 2,738,794 | |
| | 2,900,000 | | | PepsiCo, Inc., 3-month LIBOR + 0.270%, 1.606%, 10/04/2019(a)(b) | | | 2,912,078 | |
| | | | | | | | |
| | | | | | | 23,616,108 | |
| | | | | | | | |
| | | | Government Owned – No Guarantee — 2.9% | | | | |
| | 18,670,000,000 | | | Financiera de Desarrollo Territorial S.A. Findeter, 7.875%, 8/12/2024, 144A, (COP)(a) | | | 6,364,143 | |
| | 2,820,000 | | | Petrobras Global Finance BV, 5.299%, 1/27/2025, 144A(a) | | | 2,828,460 | |
| | 4,640,000 | | | Petrobras Global Finance BV, 5.625%, 5/20/2043(a) | | | 4,146,490 | |
| | 9,050,000 | | | Petrobras Global Finance BV, 5.999%, 1/27/2028, 144A(a) | | | 9,072,625 | |
| | 2,045,000 | | | Petrobras Global Finance BV, 7.250%, 3/17/2044(a) | | | 2,126,800 | |
| | 700,000(††) | | | Petroleos Mexicanos, 7.650%, 11/24/2021, 144A, (MXN)(a) | | | 3,390,581 | |
| | 3,525,000 | | | YPF S.A., 6.950%, 7/21/2027, 144A(a) | | | 3,741,787 | |
| | 1,930,000 | | | YPF S.A., Argentina Deposit Rates Badlar Private Banks + 4.000%, 25.458%, 7/07/2020, 144A(a)(b) | | | 1,786,598 | |
| | | | | | | | |
| | | | | | | 33,457,484 | |
| | | | | | | | |
| | | | Healthcare — 0.8% | | | | |
| | 2,850,000 | | | Grifols S.A., 3.200%, 5/01/2025, 144A, (EUR)(a) | | | 3,470,967 | |
| | 2,340,000 | | | Polaris Intermediate Corp., PIK, 8.500%, 12/01/2022, 144A(a)(j) | | | 2,427,750 | |
| | 2,800,000 | | | Quintiles IMS, Inc., 3.250%, 3/15/2025, 144A, (EUR)(a) | | | 3,470,511 | |
| | | | | | | | |
| | | | | | | 9,369,228 | |
| | | | | | | | |
| | | | Independent Energy — 1.8% | | | | |
| | 2,965,000 | | | Bellatrix Exploration Ltd., 8.500%, 5/15/2020, 144A(a) | | | 2,801,925 | |
| | 1,095,000 | | | California Resources Corp., 8.000%, 12/15/2022, 144A(a) | | | 903,375 | |
| | 3,080,000 | | | Gulfport Energy Corp., 6.375%, 5/15/2025(a) | | | 3,095,400 | |
| | 3,018,000 | | | Halcon Resources Corp., 6.750%, 2/15/2025, 144A(a) | | | 3,138,720 | |
| | 1,265,000 | | | MEG Energy Corp., 6.375%, 1/30/2023, 144A(a) | | | 1,075,250 | |
| | 2,055,000 | | | MEG Energy Corp., 7.000%, 3/31/2024, 144A(a) | | | 1,733,906 | |
| | 7,460,000 | | | OGX Austria GmbH, 8.375%, 4/01/2022, 144A(d)(e)(f)(k) | | | — | |
| | 4,420,000 | | | OGX Austria GmbH, 8.500%, 6/01/2018, 144A(d)(e)(f)(k) | | | — | |
| | 3,100,000 | | | SRC Energy, Inc., 6.250%, 12/01/2025, 144A(a) | | | 3,169,750 | |
| | 3,265,000 | | | Vine Oil & Gas LP/Vine Oil & Gas Finance Corp., 8.750%, 4/15/2023, 144A(a) | | | 3,167,050 | |
| | 1,190,000 | | | Whiting Petroleum Corp., 6.625%, 1/15/2026, 144A(a) | | | 1,213,800 | |
| | | | | | | | |
| | | | | | | 20,299,176 | |
| | | | | | | | |
| | | | Integrated Energy — 1.1% | | | | |
| | 1,225,000 | | | BP Capital Markets PLC, 3-month LIBOR + 0.425%, 1.838%, 2/13/2018(a)(b) | | | 1,225,293 | |
| | 3,040,000 | | | Cenovus Energy, Inc., 5.400%, 6/15/2047(a) | | | 3,199,094 | |
| | 950,000 | | | Geopark Ltd., 6.500%, 9/21/2024, 144A(a) | | | 975,118 | |
| | 1,135,000 | | | Infraestructura Energetica Nova, S.A.B. de C.V., 4.875%, 1/14/2048, 144A(a) | | | 1,091,019 | |
| | 5,795,000 | | | Shell International Finance BV, 3-month LIBOR + 0.350%, 1.899%, 9/12/2019(a)(b) | | | 5,819,323 | |
| | | | | | | | |
| | | | | | | 12,309,847 | |
| | | | | | | | |
| | | | Leisure — 0.1% | | | | |
| | 1,570,000 | | | Constellation Merger Sub, Inc., 8.500%, 9/15/2025, 144A(a) | | | 1,530,750 | |
| | | | | | | | |
See accompanying notes to financial statements.
45 |
Portfolio of Investments – as of December 31, 2017
Loomis Sayles Strategic Alpha Fund – (continued)
| | | | | | | | |
Principal
Amount (‡) | | | Description | | Value (†) | |
| | | | Life Insurance — 0.5% | | | | |
| $ | 5,785,000 | | | Metropolitan Life Global Funding I, 3-month LIBOR + 0.340%, 1.914%, 9/14/2018, 144A(a)(b) | | $ | 5,794,603 | |
| | | | | | | | |
| | | | Local Authorities — 1.6% | | | | |
| | 2,900,000 | | | Provincia de Buenos Aires, 5.750%, 6/15/2019, 144A(a) | | | 3,004,400 | |
| | 2,280,000 | | | Provincia de Buenos Aires, 6.500%, 2/15/2023, 144A(a) | | | 2,449,062 | |
| | 2,015,000 | | | Provincia de Buenos Aires, 7.875%, 6/15/2027, 144A(a) | | | 2,236,288 | |
| | 200,805,000 | | | Provincia de Buenos Aires, Argentina Deposit Rates Badlar Private Banks + 3.830%, 26.955%, 5/31/2022, (ARS)(a)(b) | | | 11,137,265 | |
| | | | | | | | |
| | | | | | | 18,827,015 | |
| | | | | | | | |
| | | | Media Entertainment — 0.5% | | | | |
| | 4,735,000 | | | Clear Channel Worldwide Holdings, Inc., 7.625%, 3/15/2020(a) | | | 4,640,300 | |
| | 27,290,000 | | | Grupo Televisa SAB, EMTN, 7.250%, 5/14/2043, (MXN)(a) | | | 1,051,643 | |
| | | | | | | | |
| | | | | | | 5,691,943 | |
| | | | | | | | |
| | | | Metals & Mining — 0.6% | | | | |
| | 3,100,000 | | | Gerdau Trade, Inc., 4.875%, 10/24/2027, 144A(a) | | | 3,084,903 | |
| | 1,335,000 | | | Stillwater Mining Co., 6.125%, 6/27/2022, 144A(a) | | | 1,355,399 | |
| | 1,900,000 | | | Vale Overseas Ltd., 6.250%, 8/10/2026(a) | | | 2,201,150 | |
| | | | | | | | |
| | | | | | | 6,641,452 | |
| | | | | | | | |
| | | | Midstream — 2.1% | | | | |
| | 5,465,000 | | | EnLink Midstream Partners LP, Series C, (fixed rate to 12/15/2022, variable rate thereafter), 6.000%(a)(l) | | | 5,231,643 | |
| | 2,690,000 | | | NGL Energy Partners LP/NGL Energy Finance Corp., 5.125%, 7/15/2019(a) | | | 2,739,819 | |
| | 2,275,000 | | | NGL Energy Partners LP/NGL Energy Finance Corp., 6.125%, 3/01/2025(a) | | | 2,218,125 | |
| | 150,000 | | | NGL Energy Partners LP/NGL Energy Finance Corp., 6.875%, 10/15/2021(a) | | | 153,000 | |
| | 3,725,000 | | | NGL Energy Partners LP/NGL Energy Finance Corp., 7.500%, 11/01/2023(a) | | | 3,846,062 | |
| | 580,000 | | | NGPL PipeCo LLC, 4.375%, 8/15/2022, 144A(a) | | | 589,788 | |
| | 970,000 | | | NGPL PipeCo LLC, 4.875%, 8/15/2027, 144A(a) | | | 1,006,375 | |
| | 1,160,000 | | | NGPL PipeCo LLC, 7.768%, 12/15/2037, 144A(a) | | | 1,429,700 | |
| | 800,000 | | | Tennessee Gas Pipeline Co. LLC, 7.000%, 3/15/2027(a) | | | 951,947 | |
| | 6,005,000 | | | TransCanada Trust, (fixed rate to 3/15/2027, variable rate thereafter), 5.300%, 3/15/2077(a) | | | 6,192,656 | |
| | | | | | | | |
| | | | | | | 24,359,115 | |
| | | | | | | | |
| | | | Natural Gas — 0.2% | | | | |
| | 1,825,000 | | | Infraestructura Energetica Nova, S.A.B. de C.V., 3.750%, 1/14/2028, 144A(a) | | | 1,800,363 | |
| | | | | | | | |
| | | | Non-Agency Commercial Mortgage-Backed Securities — 3.6% | | | | |
| | 4,565,000 | | | CFCRE Commercial Mortgage Trust, Series 2011-C1, Class D, 6.079%, 4/15/2044, 144A(a)(c) | | | 4,703,743 | |
| | 1,900,000 | | | Commercial Mortgage Trust, Series 2016-SAVA, Class C, 1-month LIBOR + 3.000%, 4.432%, 10/15/2034, 144A(a)(b) | | | 1,904,641 | |
| | 3,700,000 | | | Credit Suisse Mortgage Capital Certificates, Series 2015-TOWN, Class A, 1-month LIBOR + 1.250%, 2.727%, 3/15/2028, 144A(a)(b) | | | 3,699,995 | |
| | 3,635,000 | | | Credit Suisse Mortgage Trust, Series 2014-USA, Class E, 4.373%, 9/15/2037, 144A(a) | | | 3,242,547 | |
See accompanying notes to financial statements.
| 46
Portfolio of Investments – as of December 31, 2017
Loomis Sayles Strategic Alpha Fund – (continued)
| | | | | | | | |
Principal
Amount (‡) | | | Description | | Value (†) | |
| | | | Non-Agency Commercial Mortgage-Backed Securities — continued | |
| $ | 2,552,340 | | | DBUBS Mortgage Trust, Series 2011-LC1A, Class E, 5.698%, 11/10/2046, 144A(a)(c) | | $ | 2,663,881 | |
| | 1,208,938 | | | GS Mortgage Securities Trust, Series 2007-GG10, Class AM, 5.814%, 8/10/2045(a)(c) | | | 1,230,879 | |
| | 464,694 | | | JPMorgan Chase Commercial Mortgage Securities Trust, Series 2007-LDPX, Class AM, 5.464%,
1/15/2049(a)(c) | | | 465,955 | |
| | 3,090,000 | | | JPMorgan Chase Commercial Mortgage Securities Trust, Series 2015-SGP, Class D, 1-month LIBOR + 4.500%, 5.977%, 7/15/2036, 144A(a)(b) | | | 3,120,835 | |
| | 1,570,000 | | | Morgan Stanley Capital I Trust, Series 2011-C2, Class D, 5.483%, 6/15/2044, 144A(a)(c) | | | 1,563,489 | |
| | 2,125,000 | | | Morgan Stanley Capital I Trust, Series 2011-C2, Class E, 5.483%, 6/15/2044, 144A(a)(c) | | | 2,013,883 | |
| | 6,014,271 | | | Motel 6 Trust, Series 2017-M6MZ, Class M, 1-month LIBOR + 6.927%, 8.404%, 8/15/2019, 144A(a)(b) | | | 6,104,404 | |
| | 2,280,000 | | | SCG Trust, Series 2013-SRP1, Class B, 1-month LIBOR + 2.500%, 3.977%, 11/15/2026, 144A(a)(b) | | | 2,217,102 | |
| | 2,200,000 | | | SCG Trust, Series 2013-SRP1, Class C, 1-month LIBOR + 3.250%, 4.727%, 11/15/2026, 144A(a)(b) | | | 2,106,605 | |
| | 3,165,000 | | | SCG Trust, Series 2013-SRP1, Class D, 1-month LIBOR + 3.344%, 4.821%, 11/15/2026, 144A(a)(b) | | | 2,930,427 | |
| | 2,587,500 | | | WFRBS Commercial Mortgage Trust, Series 2011-C2, Class D, 5.653%, 2/15/2044, 144A(a)(c) | | | 2,606,911 | |
| | 655,000 | | | WFRBS Commercial Mortgage Trust, Series 2012-C7, Class E, 4.826%, 6/15/2045, 144A(a)(c)(d) | | | 542,412 | |
| | | | | | | | |
| | | | | | | 41,117,709 | |
| | | | | | | | |
| | | | Paper — 0.6% | | | | |
| | 2,275,000 | | | Celulosa Arauco y Constitucion S.A., 5.500%, 11/02/2047, 144A(a) | | | 2,366,000 | |
| | 2,660,000 | | | Fibria Overseas Finance Ltd., 4.000%, 1/14/2025(a) | | | 2,633,400 | |
| | 1,915,000 | | | Suzano Austria GmbH, 5.750%, 7/14/2026, 144A(a) | | | 2,078,924 | |
| | | | | | | | |
| | | | | | | 7,078,324 | |
| | | | | | | | |
| | | | Pharmaceuticals — 0.3% | | | | |
| | 1,500,000 | | | Teva Pharmaceutical Finance Netherlands III BV, 4.100%, 10/01/2046(a) | | | 1,142,256 | |
| | 2,070,000 | | | Valeant Pharmaceuticals International, Inc., 5.500%, 3/01/2023, 144A(a) | | | 1,894,050 | |
| | | | | | | | |
| | | | | | | 3,036,306 | |
| | | | | | | | |
| | | | Property & Casualty Insurance — 0.9% | | | | |
| | 2,890,000 | | | Ardonagh Midco 3 PLC, 8.375%, 7/15/2023, 144A, (GBP)(a) | | | 3,957,733 | |
| | 600,000 | | | Ardonagh Midco 3 PLC, 8.625%, 7/15/2023, 144A(a) | | | 622,080 | |
| | 6,000,000 | | | Berkshire Hathaway Finance Corp., 3-month LIBOR + 0.320%, 1.670%, 1/10/2020(a)(b) | | | 6,026,386 | |
| | | | | | | | |
| | | | | | | 10,606,199 | |
| | | | | | | | |
| | | | Retailers — 0.6% | | | | |
| | 2,915,000 | | | Alimentation Couche-Tard, Inc., 3-month LIBOR + 0.500%, 2.074%, 12/13/2019, 144A(a)(b) | | | 2,916,775 | |
| | 4,080,000 | | | Cencosud S.A., 4.375%, 7/17/2027, 144A(a) | | | 4,033,080 | |
| | | | | | | | |
| | | | | | | 6,949,855 | |
| | | | | | | | |
See accompanying notes to financial statements.
47 |
Portfolio of Investments – as of December 31, 2017
Loomis Sayles Strategic Alpha Fund – (continued)
| | | | | | | | |
Principal
Amount (‡) | | | Description | | Value (†) | |
| | | | Sovereigns — 0.1% | | | | |
| | 29,460,000 | | | Argentina Politica Monetaria, Argentina Central Bank 7-day Repo Reference Rate, 28.750%, 6/21/2020,
(ARS)(a)(b) | | $ | 1,678,809 | |
| | | | | | | | |
| | | | Technology — 2.7% | | | | |
| | 6,045,000 | | | Apple, Inc., 3-month LIBOR + 0.070%, 1.483%, 5/11/2020(a)(b) | | | 6,038,028 | |
| | 6,955,000 | | | Cisco Systems, Inc., 3-month LIBOR + 0.340%, 1.966%, 9/20/2019(a)(b) | | | 6,996,054 | |
| | 11,255,000 | | | Dell International LLC/EMC Corp., 6.020%, 6/15/2026, 144A(a) | | | 12,409,971 | |
| | 6,000,000 | | | International Business Machines Corp., 3-month LIBOR + 0.230%, 1.605%, 1/27/2020(a)(b) | | | 6,027,611 | |
| | | | | | | | |
| | | | | | | 31,471,664 | |
| | | | | | | | |
| | | | Treasuries — 7.0% | | | | |
| | 51,470,000 | | | Malaysia Government Bond, Series 0517, 3.441%, 2/15/2021, (MYR)(a) | | | 12,755,835 | |
| | 1,115,000(††) | | | Mexican Fixed Rate Bonds, Series M, 5.750%, 3/05/2026, (MXN)(a) | | | 5,012,666 | |
| | 127,920,000 | | | Poland Government International Bond, Series 0727, 2.500%, 7/25/2027, (PLN)(a) | | | 34,380,657 | |
| | 284,840,000 | | | South Africa Government International Bond, 8.750%, 1/31/2044, (ZAR)(a) | | | 20,724,427 | |
| | 100,300,000 | | | South Africa Government International Bond, 8.750%, 2/28/2048, (ZAR)(a) | | | 7,350,334 | |
| | | | | | | | |
| | | | | | | 80,223,919 | |
| | | | | | | | |
| | | | Wirelines — 0.1% | | | | |
| | 10,085,000 | | | Oi S.A., 9.750%, 9/15/2016, 144A, (BRL)(a)(k) | | | 889,290 | |
| | | | | | | | |
| | | | Total Non-Convertible Bonds
(Identified Cost $826,803,746) | | | 815,937,737 | |
| | | | | | | | |
| | | | | | | | |
| | Convertible Bonds — 3.0% | | | | |
| | | | Building Materials — 0.1% | | | | |
| | 715,000 | | | Tutor Perini Corp., 2.875%, 6/15/2021(a) | | | 788,287 | |
| | | | | | | | |
| | | | Cable Satellite — 0.4% | | | | |
| | 2,060,000 | | | DISH Network Corp., 2.375%, 3/15/2024, 144A(a) | | | 1,978,888 | |
| | 2,705,000 | | | DISH Network Corp., 3.375%, 8/15/2026(a) | | | 2,943,378 | |
| | | | | | | | |
| | | | | | | 4,922,266 | |
| | | | | | | | |
| | | | Consumer Cyclical Services — 0.2% | | | | |
| | 2,995,000 | | | Macquarie Infrastructure Corp., 2.000%, 10/01/2023(a) | | | 2,860,225 | |
| | | | | | | | |
| | | | Diversified Operations — 0.1% | | | | |
| | 775,000 | | | RWT Holdings, Inc., 5.625%, 11/15/2019(a) | | | 780,813 | |
| | | | | | | | |
| | | | Healthcare — 0.1% | | | | |
| | 615,000 | | | Evolent Health, Inc., 2.000%, 12/01/2021(a) | | | 576,562 | |
| | 220,000 | | | Insulet Corp., 1.375%, 11/15/2024, 144A(a) | | | 222,888 | |
| | 890,000 | | | Teladoc, Inc., 3.000%, 12/15/2022, 144A(a) | | | 1,000,694 | |
| | | | | | | | |
| | | | | | | 1,800,144 | |
| | | | | | | | |
| | | | Leisure — 0.1% | | | | |
| | 650,000 | | | Rovi Corp., 0.500%, 3/01/2020(a) | | | 616,954 | |
| | | | | | | | |
| | | | Media Entertainment — 0.1% | | | | |
| | 575,000 | | | Liberty Media Corp., 2.250%, 9/30/2046(a) | | | 598,719 | |
| | | | | | | | |
See accompanying notes to financial statements.
| 48
Portfolio of Investments – as of December 31, 2017
Loomis Sayles Strategic Alpha Fund – (continued)
| | | | | | | | |
Principal
Amount (‡) | | | Description | | Value (†) | |
| | | | Midstream — 0.2% | | | | |
| $ | 1,280,000 | | | Chesapeake Energy Corp., 5.500%, 9/15/2026, 144A(a) | | $ | 1,165,600 | |
| | 385,000 | | | SM Energy Co., 1.500%, 7/01/2021(a) | | | 376,578 | |
| | 1,075,000 | | | Whiting Petroleum Corp., 1.250%, 4/01/2020(a) | | | 989,000 | |
| | | | | | | | |
| | | | | | | 2,531,178 | |
| | | | | | | | |
| | | | Oil Field Services — 0.2% | | | | |
| | 970,000 | | | Hercules Capital, Inc., 4.375%, 2/01/2022, 144A(a) | | | 997,281 | |
| | 1,760,000 | | | Nabors Industries, Inc., 0.750%, 1/15/2024, 144A(a) | | | 1,348,600 | |
| | | | | | | | |
| | | | | | | 2,345,881 | |
| | | | | | | | |
| | | | Pharmaceuticals — 0.7% | | | | |
| | 1,605,000 | | | BioMarin Pharmaceutical, Inc., 0.599%, 8/01/2024(a) | | | 1,598,981 | |
| | 1,010,000 | | | BioMarin Pharmaceutical, Inc., 1.500%, 10/15/2020(a) | | | 1,196,219 | |
| | 245,000 | | | Flexion Therapeutics, Inc., 3.375%, 5/01/2024, 144A(a) | | | 297,522 | |
| | 1,550,000 | | | Horizon Pharma Investment Ltd., 2.500%, 3/15/2022(a) | | | 1,441,500 | |
| | 2,000,000 | | | Intercept Pharmaceuticals, Inc., 3.250%, 7/01/2023(a) | | | 1,590,000 | |
| | 2,045,000 | | | Neurocrine Biosciences, Inc., 2.250%, 5/15/2024, 144A(a) | | | 2,611,209 | |
| | | | | | | | |
| | | | | | | 8,735,431 | |
| | | | | | | | |
| | | | Railroads — 0.2% | | | | |
| | 910,000 | | | Echo Global Logistics, Inc., 2.500%, 5/01/2020(a) | | | 939,575 | |
| | 1,385,000 | | | Greenbrier Cos., Inc. (The), 2.875%, 2/01/2024, 144A(a) | | | 1,649,881 | |
| | | | | | | | |
| | | | | | | 2,589,456 | |
| | | | | | | | |
| | | | REITs – Mortgage — 0.2% | | | | |
| | 2,090,000 | | | iStar, Inc., 3.125%, 9/15/2022, 144A(a) | | | 2,079,550 | |
| | | | | | | | |
| | | | Technology — 0.4% | | | | |
| | 3,250,000 | | | Finisar Corp., 0.500%, 12/15/2036(a) | | | 3,022,500 | |
| | 1,500,000 | | | Verint Systems, Inc., 1.500%, 6/01/2021(a) | | | 1,456,875 | |
| | | | | | | | |
| | | | | | | 4,479,375 | |
| | | | | | | | |
| | | | Total Convertible Bonds
(Identified Cost $34,988,848) | | | 35,128,279 | |
| | | | | | | | |
| | | | | | | | |
| | | | Total Bonds and Notes
(Identified Cost $861,792,594) | | | 851,066,016 | |
| | | | | | | | |
| | | | | | | | |
| | Senior Loans — 10.5% | | | | |
| | | | Aerospace & Defense — 0.4% | | | | |
| | 1,014,303 | | | Engility Corp., Term Loan B2, 1-month LIBOR + 3.250%, 4.819%, 8/12/2023(b) | | | 1,023,179 | |
| | 2,374,194 | | | TransDigm, Inc., 2017 Extended Term Loan F, LIBOR + 2.750%, 4.362%, 6/09/2023(o) | | | 2,376,829 | |
| | 332,176 | | | TransDigm, Inc., 2017 Term Loan E, 1-month LIBOR + 2.750%, 4.319%, 5/14/2022(b) | | | 332,973 | |
| | 666,650 | | | TransDigm, Inc., 2017 Term Loan G, LIBOR + 3.000%, 4.665%, 8/22/2024(o) | | | 669,430 | |
| | | | | | | | |
| | | | | | | 4,402,411 | |
| | | | | | | | |
See accompanying notes to financial statements.
49 |
Portfolio of Investments – as of December 31, 2017
Loomis Sayles Strategic Alpha Fund – (continued)
| | | | | | | | |
Principal
Amount (‡) | | | Description | | Value (†) | |
| | | | Automotive — 0.3% | | | | |
| $ | 730,000 | | | Belron S.A., USD Term Loan B, 3-month LIBOR + 2.500%, 3.892%, 11/07/2024(b) | | $ | 736,847 | |
| | 2,770,133 | | | Truck Hero, Inc., 1st Lien Term Loan, 3-month LIBOR + 4.000%, 5.642%, 4/21/2024(b) | | | 2,769,274 | |
| | | | | | | | |
| | | | | | | 3,506,121 | |
| | | | | | | | |
| | | | Building Materials — 0.5% | | | | |
| | 1,584,030 | | | HD Supply, Inc., Term Loan B4, 3-month LIBOR + 2.500%, 4.193%, 10/17/2023(b) | | | 1,595,245 | |
| | 717,401 | | | Ply Gem Industries, Inc., Term Loan, 3-month LIBOR + 3.000%, 4.693%, 2/01/2021(b) | | | 721,885 | |
| | 3,546,438 | | | Quikrete Holdings, Inc., 2016 1st Lien Term Loan, 1-month LIBOR + 2.750%, 4.319%, 11/15/2023(b) | | | 3,550,871 | |
| | | | | | | | |
| | | | | | | 5,868,001 | |
| | | | | | | | |
| | | | Cable Satellite — 1.0% | | | | |
| | 1,620,000 | | | Altice Financing SA, USD 2017 1st Lien Term Loan, 3-month LIBOR + 2.750%, 4.112%, 1/05/2026(b) | | | 1,584,360 | |
| | 281,296 | | | Altice U.S. Finance I Corp., 2017 Term Loan, 1-month LIBOR + 2.250%, 3.819%, 7/28/2025(b) | | | 279,949 | |
| | 203,465 | | | CSC Holdings LLC, 2017 1st Lien Term Loan, 1-month LIBOR + 2.250%, 3.741%, 7/17/2025(b) | | | 202,511 | |
| | 4,350,409 | | | Unitymedia Finance LLC, Term Loan B, 1-month LIBOR + 2.250%, 3.727%, 9/30/2025(b) | | | 4,352,062 | |
| | 2,575,000 | | | Virgin Media Bristol LLC, 2017 USD Term Loan, 3-month LIBOR + 2.500%, 3.977%, 1/15/2026(b) | | | 2,573,403 | |
| | 3,090,760 | | | Ziggo Secured Finance Partnership, USD Term Loan E, 1-month LIBOR + 2.500%, 3.977%, 4/15/2025(b) | | | 3,063,716 | |
| | | | | | | | |
| | | | | | | 12,056,001 | |
| | | | | | | | |
| | | | Chemicals — 0.1% | | | | |
| | 750,920 | | | Axalta Coating Systems US Holdings, Inc., USD Term Loan, 3-month LIBOR + 2.000%, 3.693%, 6/01/2024(b) | | | 753,300 | |
| | | | | | | | |
| | | | Consumer Products — 0.8% | | | | |
| | 3,694,390 | | | Serta Simmons Bedding LLC, 1st Lien Term Loan, 3-month LIBOR + 3.500%, 4.848%, 11/08/2023(n) | | | 3,372,165 | |
| | 5,500,000 | | | Weight Watchers International, Inc., 2017 Term Loan B, 1-month LIBOR + 4.750%, 6.230%,
11/29/2024(b) | | | 5,522,935 | |
| | | | | | | | |
| | | | | | | 8,895,100 | |
| | | | | | | | |
| | | | Diversified Manufacturing — 0.1% | | | | |
| | 126,325 | | | Engineered Machinery Holdings, Inc., 1st Lien Delayed Draw Term Loan, 3-month LIBOR + 3.250%, 4.943%, 7/19/2024(b) | | | 126,325 | |
| | 971,729 | | | Engineered Machinery Holdings, Inc., USD 1st Lien Term Loan, 3-month LIBOR + 3.250%, 4.943%,
7/19/2024(b) | | | 971,729 | |
| | | | | | | | |
| | | | | | | 1,098,054 | |
| | | | | | | | |
| | | | Electric — 0.3% | | | | |
| | 4,201,878 | | | AES Corp., 2017 Term Loan B, 3-month LIBOR + 2.000%, 3.454%, 5/24/2022(b) | | | 4,208,895 | |
| | | | | | | | |
See accompanying notes to financial statements.
| 50
Portfolio of Investments – as of December 31, 2017
Loomis Sayles Strategic Alpha Fund – (continued)
| | | | | | | | |
Principal
Amount (‡) | | | Description | | Value (†) | |
| | | | Environmental — 0.1% | | | | |
| $ | 745,563 | | | GFL Environmental, Inc., USD Term Loan B, 3-month LIBOR + 2.750%, 4.443%, 9/29/2023(b) | | $ | 747,740 | |
| | 209,592 | | | USS Ultimate Holdings, Inc., 1st Lien Term Loan, 1-month LIBOR + 3.750%, 5.319%, 8/25/2024(b) | | | 210,728 | |
| | | | | | | | |
| | | | | | | 958,468 | |
| | | | | | | | |
| | | | Food & Beverage — 0.4% | | | | |
| | 1,935,000 | | | Aramark Services, Inc., 2017 Term Loan B1, 1-month LIBOR + 2.000%, 3.569%, 3/11/2025(b) | | | 1,944,075 | |
| | 1,437,775 | | | Post Holdings, Inc., 2017 Series A Incremental Term Loan, 1-month LIBOR + 2.250%, 3.820%,
5/24/2024(b) | | | 1,442,146 | |
| | 1,400,000 | | | UTZ Quality Foods LLC, 1st Lien Term Loan, 1-month LIBOR + 3.500%, 5.011%, 11/21/2024(b) | | | 1,409,632 | |
| | | | | | | | |
| | | | | | | 4,795,853 | |
| | | | | | | | |
| | | | Health Insurance — 0.2% | | | | |
| | 1,780,481 | | | Sedgwick Claims Management Services, Inc., 1st Lien Term Loan, 3/01/2021(m) | | | 1,778,807 | |
| | 1,005,000 | | | Sedgwick Claims Management Services, Inc., 2017 1st Lien Term Loan, 2/26/2021(m) | | | 1,001,865 | |
| | | | | | | | |
| | | | | | | 2,780,672 | |
| | | | | | | | |
| | | | Healthcare — 0.8% | | | | |
| | 895,950 | | | Envision Healthcare Corp., 2016 Term Loan B, 1-month LIBOR + 3.000%, 4.570%, 12/01/2023(b) | | | 897,814 | |
| | 1,137,150 | | | Quintiles IMS, Inc., 2017 Term Loan B2, 3-month LIBOR + 2.000%, 3.693%, 1/17/2025(b) | | | 1,141,210 | |
| | 2,937,638 | | | Surgery Center Holdings, Inc., 2017 Term Loan B, 1-month LIBOR + 3.250%, 4.820%, 9/02/2024(b) | | | 2,903,355 | |
| | 4,327,554 | | | Team Health Holdings, Inc., 1st Lien Term Loan, 1-month LIBOR + 2.750%, 4.319%, 2/06/2024(b) | | | 4,211,272 | |
| | | | | | | | |
| | | | | | | 9,153,651 | |
| | | | | | | | |
| | | | Independent Energy — 0.1% | | | | |
| | 811,000 | | | California Resources Corp., 2017 1st Lien Term Loan, 12/31/2022(m) | | | 806,945 | |
| | | | | | | | |
| | | | Internet & Data — 0.1% | | | | |
| | 1,351,613 | | | NeuStar, Inc., Term Loan B2, 3-month LIBOR + 3.750%, 5.147%, 8/08/2024(b) | | | 1,362,425 | |
| | | | | | | | |
| | | | Leisure — 0.1% | | | | |
| | 307,675 | | | AMC Entertainment, Inc., New Term Loan B, 1-month LIBOR + 2.250%, 3.727%, 12/15/2023(b) | | | 307,420 | |
| | 1,189,811 | | | ClubCorp Club Operations, Inc., 2017 Term Loan B, 3-month LIBOR + 3.250%, 4.943%, 9/18/2024(b) | | | 1,193,713 | |
| | | | | | | | |
| | | | | | | 1,501,133 | |
| | | | | | | | |
| | | | Media Entertainment — 0.3% | | | | |
| | 1,497,452 | | | Camelot UK Holdco Ltd., 2017 Repriced Term Loan, 1-month LIBOR + 3.250%, 4.819%, 10/03/2023(b) | | | 1,505,479 | |
See accompanying notes to financial statements.
51 |
Portfolio of Investments – as of December 31, 2017
Loomis Sayles Strategic Alpha Fund – (continued)
| | | | | | | | |
Principal
Amount (‡) | | | Description | | Value (†) | |
| | | | Media Entertainment — continued | | | | |
| $ | 1,011,415 | | | CBS Radio, Inc., 2017 Term Loan B, 3-month LIBOR + 2.750%, 4.172%, 11/17/2024(b) | | $ | 1,016,047 | |
| | 619,286 | | | Donnelley Financial Solutions, Inc., 2017 Term Loan B, 1-month LIBOR + 3.000%, 4.552%, 10/02/2023(b) | | | 621,998 | |
| | | | | | | | |
| | | | | | | 3,143,524 | |
| | | | | | | | |
| | | | Midstream — 0.1% | | | | |
| | 1,696,475 | | | BCP Raptor LLC, Term Loan B, 3-month LIBOR + 4.250%, 5.729%, 6/24/2024(b) | | | 1,701,785 | |
| | | | | | | | |
| | | | Natural Gas — 0.1% | | | | |
| | 943,745 | | | Southcross Energy Partners LP, 1st Lien Term Loan, 3-month LIBOR + 4.250%, 5.943%, 8/04/2021(b) | | | 926,050 | |
| | | | | | | | |
| | | | Packaging — 0.6% | | | | |
| | 3,019,825 | | | BWAY Holding Co., 2017 Term Loan B, 3-month LIBOR + 3.250%, 4.599%, 4/03/2024(b) | | | 3,030,606 | |
| | 3,092,250 | | | Klockner-Pentaplast of America, Inc., USD 2017 Term Loan B2, 3-month LIBOR + 4.250%, 5.943%,
6/30/2022(b) | | | 3,119,307 | |
| | 503,738 | | | Plastipak Packaging, Inc., Term Loan B, 1-month LIBOR + 2.750%, 4.450%, 10/14/2024(b) | | | 506,382 | |
| | | | | | | | |
| | | | | | | 6,656,295 | |
| | | | | | | | |
| | | | Pharmaceuticals — 0.2% | | | | |
| | 1,943,090 | | | Change Healthcare Holdings, Inc., 2017 Term Loan B, 1-month LIBOR + 2.750%, 4.319%, 3/01/2024(b) | | | 1,945,771 | |
| | | | | | | | |
| | | | Property & Casualty Insurance — 0.4% | | | | |
| | 1,465,657 | | | Hyperion Insurance Group Ltd., 2017 Repriced Term Loan, 1-month LIBOR + 3.500%, 5.063%, 12/13/2024(b) | | | 1,465,657 | |
| | 3,258,897 | | | USI, Inc., 2017 Repriced Term Loan, 3-month LIBOR + 3.000%, 4.693%, 5/16/2024(b) | | | 3,252,119 | |
| | | | | | | | |
| | | | | | | 4,717,776 | |
| | | | | | | | |
| | | | Restaurants — 0.3% | | | | |
| | 3,627,530 | | | 1011778 B.C. Unlimited Liability Co., Term Loan B3, LIBOR + 2.250%, 3.868%, 2/16/2024(o) | | | 3,625,571 | |
| | | | | | | | |
| | | | Retailers — 0.5% | | | | |
| | 2,992,500 | | | Bass Pro Group LLC, Term Loan B, 1-month LIBOR + 5.000%, 6.569%, 9/25/2024(b) | | | 2,981,278 | |
| | 1,050,000 | | | Hanesbrands, Inc., 2017 Term Loan B, 3-month LIBOR + 1.750%, 3.227%, 12/15/2024(b) | | | 1,053,287 | |
| | 1,333,279 | | | Harbor Freight Tools USA, Inc., 2016 Term Loan B, 1-month LIBOR + 3.250%, 4.819%, 8/18/2023(b) | | | 1,341,305 | |
| | | | | | | | |
| | | | | | | 5,375,870 | |
| | | | | | | | |
| | | | Technology — 1.4% | | | | |
| | 1,860,338 | | | Almonde, Inc., USD 1st Lien Term Loan, 3-month LIBOR + 3.500%, 4.979%, 6/13/2024(b) | | | 1,864,858 | |
| | 748,432 | | | Cavium, Inc., 2017 Term Loan B, 1-month LIBOR + 2.250%, 3.819%, 8/16/2022(b) | | | 749,367 | |
See accompanying notes to financial statements.
| 52
Portfolio of Investments – as of December 31, 2017
Loomis Sayles Strategic Alpha Fund – (continued)
| | | | | | | | |
Principal
Amount (‡) | | | Description | | Value (†) | |
| | | | Technology — continued | | | | |
| $ | 3,055,000 | | | Dell, Inc., 2017 Term Loan A2, 1-month LIBOR + 1.750%, 3.320%, 9/07/2021(b) | | $ | 3,053,289 | |
| | 471,405 | | | First Data Corp., 2022 USD Term Loan, 1-month LIBOR + 2.250%, 3.802%, 7/08/2022(b) | | | 471,664 | |
| | 100,101 | | | MA FinanceCo. LLC, USD Term Loan B3, 1-month LIBOR + 2.750%, 4.319%, 6/21/2024(b) | | | 100,101 | |
| | 2,977,538 | | | McAfee LLC, 2017 USD Term Loan B, 3-month LIBOR + 4.500%, 6.069%, 9/30/2024(b) | | | 2,965,836 | |
| | 982,587 | | | Rackspace Hosting, Inc., 2017 1st Lien Term Loan, LIBOR + 3.000%, 4.385%, 11/03/2023(o) | | | 981,497 | |
| | 676,009 | | | Seattle Spinco, Inc., USD Term Loan B3, 3-month LIBOR + 2.750%, 4.319%, 6/21/2024(b) | | | 676,009 | |
| | 4,950,543 | | | Veritas Bermuda Ltd., USD Repriced Term Loan B, 3-month LIBOR + 4.500%, 6.193%, 1/27/2023(b) | | | 4,958,811 | |
| | | | | | | | |
| | | | | | | 15,821,432 | |
| | | | | | | | |
| | | | Transportation Services — 0.4% | | | | |
| | 4,236,052 | | | Uber Technologies, Term Loan B, 3-month LIBOR + 4.000%, 5.552%, 7/13/2023(b) | | | 4,256,173 | |
| | | | | | | | |
| | | | Wireless — 0.7% | | | | |
| | 625,680 | | | GTT Communications, Inc., 2017 Add on Term Loan B, 1-month LIBOR + 3.250%, 4.875%, 1/09/2024(b) | | | 628,808 | |
| | 3,177,955 | | | Radiate Holdco LLC, 1st Lien Term Loan, 2/01/2024(m) | | | 3,151,292 | |
| | 2,803,813 | | | Sprint Communications, Inc., 1st Lien Term Loan B, 1-month LIBOR + 2.500%, 4.125%, 2/02/2024(b) | | | 2,801,710 | |
| | 1,631,579 | | | UPC Financing Partnership, USD Term Loan AR, 1-month LIBOR + 2.500%, 3.977%, 1/15/2026(b) | | | 1,630,225 | |
| | | | | | | | |
| | | | | | | 8,212,035 | |
| | | | | | | | |
| | | | Wirelines — 0.2% | | | | |
| | 1,155,662 | | | Consolidated Communications, Inc., 2016 Term Loan B, 1-month LIBOR + 3.000%, 4.570%, 10/04/2023(b) | | | 1,134,571 | |
| | 1,304,804 | | | Zayo Group LLC, 2017 Incremental Term Loan, 1-month LIBOR + 2.250%, 3.802%, 1/19/2024(b) | | | 1,308,784 | |
| | | | | | | | |
| | | | | | | 2,443,355 | |
| | | | | | | | |
| | | | Total Senior Loans
(Identified Cost $120,878,707) | | | 120,972,667 | |
| | | | | | | | |
| | | | | | | | |
| | Loan Participations — 0.7% | | | | |
| | | | ABS Other — 0.7% | | | | |
| | 6,268,912 | | | Harbour Aircraft Investments Ltd., Series 2017-1, Class C, 8.000%, 11/15/2037(a)(d) | | | 6,255,296 | |
| | 1,690,943 | | | Rise Ltd., Term Loan A, 4.750%, 2/15/2039(a)(c)(d) | | | 1,682,489 | |
| | | | | | | | |
| | | | Total Loan Participations
(Identified Cost $7,957,722) | | | 7,937,785 | |
| | | | | | | | |
See accompanying notes to financial statements.
53 |
Portfolio of Investments – as of December 31, 2017
Loomis Sayles Strategic Alpha Fund – (continued)
| | | | | | | | |
Shares | | | Description | | Value (†) | |
| | Preferred Stocks — 0.8% | | | | |
| | Convertible Preferred Stocks — 0.4% | | | | |
| | | | Food & Beverage — 0.3% | | | | |
| | 32,272 | | | Bunge Ltd., 4.875%(a) | | $ | 3,358,305 | |
| | | | | | | | |
| | | | Midstream — 0.1% | | | | |
| | 1,714 | | | Chesapeake Energy Corp., 5.750%(a) | | | 984,479 | |
| | | | | | | | |
| | | | Total Convertible Preferred Stocks
(Identified Cost $4,135,098) | | | 4,342,784 | |
| | | | | | | | |
| | | | | | | | |
| | Non-Convertible Preferred Stock — 0.4% | | | | |
| | | | Cable Satellite — 0.4% | | | | |
| | 4,040,000 | | | NBCUniversal Enterprise, Inc., 5.250%, 144A(a)
(Identified Cost $4,040,000) | | | 4,292,500 | |
| | | | | | | | |
| | | | Total Preferred Stocks
(Identified Cost $8,175,098) | | | 8,635,284 | |
| | | | | | | | |
| | | | | | | | |
| | Common Stocks — 5.6% | | | | |
| | | | Aerospace & Defense — 0.2% | | | | |
| | 3,103 | | | Boeing Co. (The) | | | 915,106 | |
| | 897 | | | Raytheon Co. | | | 168,501 | |
| | 8,093 | | | United Technologies Corp. | | | 1,032,424 | |
| | | | | | | | |
| | | | | | | 2,116,031 | |
| | | | | | | | |
| | | | Air Freight & Logistics — 0.0% | | | | |
| | 1,295 | | | FedEx Corp. | | | 323,154 | |
| | | | | | | | |
| | | | Airlines — 0.0% | | | | |
| | 7,581 | | | Delta Air Lines, Inc. | | | 424,536 | |
| | | | | | | | |
| | | | Auto Components — 0.0% | | | | |
| | 4,683 | | | Aptiv PLC | | | 397,259 | |
| | | | | | | | |
| | | | Automobiles — 0.0% | | | | |
| | 10,620 | | | General Motors Co. | | | 435,314 | |
| | | | | | | | |
| | | | Banks — 0.4% | | | | |
| | 17,481 | | | BB&T Corp. | | | 869,155 | |
| | 16,585 | | | JPMorgan Chase & Co. | | | 1,773,600 | |
| | 6,902 | | | PacWest Bancorp | | | 347,861 | |
| | 5,047 | | | PNC Financial Services Group, Inc. (The) | | | 728,232 | |
| | 13,208 | | | Wells Fargo & Co. | | | 801,329 | |
| | | | | | | | |
| | | | | | | 4,520,177 | |
| | | | | | | | |
| | | | Beverages — 0.1% | | | | |
| | 1,816 | | | Constellation Brands, Inc., Class A | | | 415,083 | |
| | 9,589 | | | PepsiCo, Inc. | | | 1,149,913 | |
| | | | | | | | |
| | | | | | | 1,564,996 | |
| | | | | | | | |
| | | | Chemicals — 0.1% | | | | |
| | 6,459 | | | DowDuPont, Inc. | | | 460,010 | |
See accompanying notes to financial statements.
| 54
Portfolio of Investments – as of December 31, 2017
Loomis Sayles Strategic Alpha Fund – (continued)
| | | | | | | | |
Shares | | | Description | | Value (†) | |
| | | | Chemicals — continued | | | | |
| | 10,298 | | | Huntsman Corp. | | $ | 342,820 | |
| | 4,247 | | | Monsanto Co. | | | 495,965 | |
| | | | | | | | |
| | | | | | | 1,298,795 | |
| | | | | | | | |
| | | | Containers & Packaging — 0.0% | | | | |
| | 4,724 | | | WestRock Co. | | | 298,604 | |
| | | | | | | | |
| | | | Diversified Telecommunication Services — 0.4% | | | | |
| | 8,830 | | | AT&T, Inc. | | | 343,311 | |
| | 226,618 | | | CenturyLink, Inc. | | | 3,779,988 | |
| | | | | | | | |
| | | | | | | 4,123,299 | |
| | | | | | | | |
| | | | Electric Utilities — 0.2% | | | | |
| | 2,871 | | | American Electric Power Co., Inc. | | | 211,220 | |
| | 17,808 | | | Exelon Corp. | | | 701,813 | |
| | 5,505 | | | NextEra Energy, Inc. | | | 859,826 | |
| | | | | | | | |
| | | | | | | 1,772,859 | |
| | | | | | | | |
| | | | Food & Staples Retailing — 0.0% | | | | |
| | 1,451 | | | Costco Wholesale Corp. | | | 270,060 | |
| | | | | | | | |
| | | | Food Products — 0.1% | | | | |
| | 15,338 | | | Mondelez International, Inc., Class A | | | 656,466 | |
| | | | | | | | |
| | | | Health Care Equipment & Supplies — 0.1% | | | | |
| | 8,768 | | | Medtronic PLC | | | 708,016 | |
| | | | | | | | |
| | | | Health Care Providers & Services — 0.1% | | | | |
| | 3,778 | | | UnitedHealth Group, Inc. | | | 832,898 | |
| | | | | | | | |
| | | | Hotels, Restaurants & Leisure — 0.2% | | | | |
| | 12,595 | | | Hilton Worldwide Holdings, Inc. | | | 1,005,837 | |
| | 5,599 | | | McDonald’s Corp. | | | 963,700 | |
| | | | | | | | |
| | | | | | | 1,969,537 | |
| | | | | | | | |
| | | | Household Products — 0.1% | | | | |
| | 9,896 | | | Procter & Gamble Co. (The) | | | 909,244 | |
| | | | | | | | |
| | | | Industrial Conglomerates — 0.1% | | | | |
| | 5,757 | | | Honeywell International, Inc. | | | 882,894 | |
| | | | | | | | |
| | | | Insurance — 0.1% | | | | |
| | 5,366 | | | Chubb Ltd. | | | 784,134 | |
| | 9,863 | | | MetLife, Inc. | | | 498,673 | |
| | | | | | | | |
| | | | | | | 1,282,807 | |
| | | | | | | | |
| | | | IT Services — 0.1% | | | | |
| | 6,734 | | | Automatic Data Processing, Inc. | | | 789,157 | |
| | | | | | | | |
| | | | Machinery — 0.1% | | | | |
| | 5,590 | | | Dover Corp. | | | 564,534 | |
| | 2,381 | | | Fortive Corp. | | | 172,265 | |
| | | | | | | | |
| | | | | | | 736,799 | |
| | | | | | | | |
See accompanying notes to financial statements.
55 |
Portfolio of Investments – as of December 31, 2017
Loomis Sayles Strategic Alpha Fund – (continued)
| | | | | | | | |
Shares | | | Description | | Value (†) | |
| | | | Media — 0.1% | | | | |
| | 22,231 | | | Comcast Corp., Class A | | $ | 890,352 | |
| | 5,175 | | | Walt Disney Co. (The) | | | 556,364 | |
| | | | | | | | |
| | | | | | | 1,446,716 | |
| | | | | | | | |
| | | | Oil, Gas & Consumable Fuels — 2.0% | | | | |
| | 55,595 | | | Anadarko Petroleum Corp. | | | 2,982,116 | |
| | 9,950 | | | Canadian Natural Resources Ltd. | | | 355,572 | |
| | 16,575 | | | Canadian Natural Resources Ltd. | | | 592,059 | |
| | 4,162 | | | Chevron Corp. | | | 521,041 | |
| | 188,463 | | | Dommo Energia S.A., Sponsored ADR, | | | 45,231 | |
| | 102,407 | | | Encana Corp. | | | 1,365,085 | |
| | 1,986 | | | EQT Corp. | | | 113,043 | |
| | 8,215 | | | Exxon Mobil Corp. | | | 687,102 | |
| | 186,324 | | | Jagged Peak Energy, Inc.(g) | | | 2,940,193 | |
| | 84,906 | | | Parsley Energy, Inc., Class A(g) | | | 2,499,633 | |
| | 52,222 | | | PDC Energy, Inc.(g) | | | 2,691,522 | |
| | 1,826 | | | Valero Energy Corp. | | | 167,828 | |
| | 293,231 | | | Whiting Petroleum Corp.(g) | | | 7,764,757 | |
| | 7,552 | | | Williams Cos., Inc. (The) | | | 230,260 | |
| | | | | | | | |
| | | | | | | 22,955,442 | |
| | | | | | | | |
| | | | Personal Products — 0.0% | | | | |
| | 2,207 | | | Estee Lauder Cos., Inc. (The), Class A | | | 280,819 | |
| | | | | | | | |
| | | | Pharmaceuticals — 0.4% | | | | |
| | 11,641 | | | Allergan PLC | | | 1,904,235 | |
| | 9,804 | | | Bristol-Myers Squibb Co. | | | 600,789 | |
| | 7,398 | | | Eli Lilly & Co. | | | 624,835 | |
| | 40,414 | | | Pfizer, Inc. | | | 1,463,795 | |
| | 4,681 | | | Zoetis, Inc. | | | 337,219 | |
| | | | | | | | |
| | | | | | | 4,930,873 | |
| | | | | | | | |
| | | | Road & Rail — 0.0% | | | | |
| | 7,878 | | | CSX Corp. | | | 433,369 | |
| | | | | | | | |
| | | | Semiconductors & Semiconductor Equipment — 0.2% | | | | |
| | 35,965 | | | Cypress Semiconductor Corp. | | | 548,107 | |
| | 14,324 | | | QUALCOMM, Inc. | | | 917,022 | |
| | 19,412 | | | Teradyne, Inc. | | | 812,780 | |
| | | | | | | | |
| | | | | | | 2,277,909 | |
| | | | | | | | |
| | | | Software — 0.2% | | | | |
| | 14,762 | | | Microsoft Corp. | | | 1,262,742 | |
| | 25,286 | | | Oracle Corp. | | | 1,195,522 | |
| | | | | | | | |
| | | | | | | 2,458,264 | |
| | | | | | | | |
| | | | Specialty Retail — 0.0% | | | | |
| | 602 | | | Home Depot, Inc. (The) | | | 114,097 | |
| | | | | | | | |
| | | | Technology Hardware, Storage & Peripherals — 0.2% | | | | |
| | 15,401 | | | Apple, Inc. | | | 2,606,311 | |
| | | | | | | | |
See accompanying notes to financial statements.
| 56
Portfolio of Investments – as of December 31, 2017
Loomis Sayles Strategic Alpha Fund – (continued)
| | | | | | | | |
Shares | | | Description | | Value (†) | |
| | | | Tobacco — 0.1% | | | | |
| | 14,595 | | | Altria Group, Inc. | | $ | 1,042,229 | |
| | | | | | | | |
| | | | Total Common Stocks
(Identified Cost $64,581,564) | | | 64,858,931 | |
| | | | | | | | |
| | | | | | | | |
| | Exchange-Traded Funds — 0.7% | | | | |
| | 30,500 | | | PowerShares QQQ Trust | | | 4,750,680 | |
| | 128,943 | | | Financial Select Sector SPDR® Fund | | | 3,598,799 | |
| | | | | | | | |
| | | | Total Exchange-Traded Funds
(Identified Cost $7,798,873) | | | 8,349,479 | |
| | | | | | | | |
| | | | | | | | |
| | Other Investments — 1.3% | | | | |
| | | | Aircraft ABS — 1.3% | | | | |
| | 58,545 | | | Aergen LLC(d)(e)(f)(s) | | | 5,498,915 | |
| | 900 | | | ECAF I Blocker Ltd.(d)(e)(f)(s) | | | 8,912,709 | |
| | | | | | | | |
| | | | Total Aircraft ABS
(Identified Cost $14,854,500) | | | 14,411,624 | |
| | | | | | | | |
| | | | | | | | |
| | | | Total Purchased Options — 0.1%
(Identified Cost $2,252,968) (see detail below) | | | 1,563,389 | |
| | | | | | | | |
| | | | | | | | |
Principal
Amount (‡) | | | | | | |
| | Short-Term Investments — 4.3% | | | | |
| $ | 32,251,359 | | | Tri-Party Repurchase Agreement with Fixed Income Clearing Corporation, dated 12/29/2017 at 0.540% to be repurchased at $32,253,294 on 1/02/2018 collateralized by $32,530,000 U.S. Treasury Note, 2.250% due 1/31/2024 valued at $32,708,557; $195,000 Federal Home Loan Bank, 1.250% due 7/27/2018 valued at $195,371 including accrued interest (Note 2 of Notes to Financial Statements) | | | 32,251,359 | |
| | 5,400,000 | | | U.S. Treasury Bills, 1.116%, 01/11/2018(p)(q) | | | 5,398,410 | |
| | 11,685,000 | | | U.S. Treasury Bills, 1.416%, 05/31/2018(a)(p) | | | 11,614,753 | |
| | | | | | | | |
| | | | Total Short-Term Investments (Identified Cost $49,265,743) | | | 49,264,522 | |
| | | | | | | | |
| | | | | | | | |
| | | | Total Investments — 97.8% (Identified Cost $1,137,557,769) | | | 1,127,059,697 | |
| | | | Other assets less liabilities — 2.2% | | | 25,537,404 | |
| | | | | | | | |
| | | | Net Assets — 100.0% | | $ | 1,152,597,101 | |
| | | | | | | | |
See accompanying notes to financial statements.
57 |
Portfolio of Investments – as of December 31, 2017
Loomis Sayles Strategic Alpha Fund – (continued)
| | | | | | | | | | | | | | | | | | | | | | |
| Purchased Options — 0.1% | |
| | | | | | | | | | | | | | | | | | | | | | |
| Description | | Expiration
Date | | Exercise
Price | | | Shares/Units of
currency (†††) | | | Notional
Amount | | | Cost | | | Value (†) | |
Options on Securities — 0.1% | |
| CenturyLink, Inc., Put(g) | | 01/19/2018 | | | 18 | | | | 146,800 | | | $ | 2,448,624 | | | $ | 119,336 | | | $ | 161,480 | |
| Comcast Corp., Call(g) | | 01/19/2018 | | | 36 | | | | 135,000 | | | | 5,406,750 | | | | 317,198 | | | | 509,625 | |
| Financial Select Sector SPDR® Fund, Put(g) | | 01/19/2018 | | | 27 | | | | 128,900 | | | | 3,597,599 | | | | 73,552 | | | | 14,179 | |
| iShares® MSCI Emerging Markets ETF, Call(g) | | 02/16/2018 | | | 47 | | | | 374,700 | | | | 17,655,864 | | | | 237,153 | | | | 412,170 | |
| iShares® Russell 2000 ETF, Put(g) | | 01/19/2018 | | | 151 | | | | 69,600 | | | | 10,611,216 | | | | 245,891 | | | | 92,220 | |
| PowerShares QQQ ETF Trust Series 1, Put(g) | | 01/19/2018 | | | 155 | | | | 30,500 | | | | 4,750,680 | | | | 56,819 | | | | 48,953 | |
| SPDR® S&P® Retail ETF, Put(g) | | 01/19/2018 | | | 42 | | | | 167,500 | | | | 7,567,650 | | | | 261,788 | | | | 25,125 | |
| | | | | | | | | | | | | | | | | | | | | | |
| | | | | | | | | | | | | | | | | 1,311,737 | | | | 1,263,752 | |
| | | | | | | | | | | | | | | | | | | | | | |
Over-the-Counter Options on Currency — 0.0% | |
| PHP Put(g)(r) | | 05/18/2018 | | | 51 | | | | 37,450,000 | | | | 38,301,477 | | | | 941,231 | | | | 299,637 | |
| | | | | | | | | | | | | | | | | | | | | | |
| Total | | | | | | | | | | | | | | | | $ | 2,252,968 | | | $ | 1,563,389 | |
| | | | | | | | | | | | | | | | | | | | | | |
| | | | | | | | | | | | | | | | | | | | | | |
| Written Options — (0.0%) | |
| | | | | | | | | | | | | | | | | | | | | | |
| Description | | Expiration
Date | | Exercise
Price | | | Shares | | | Notional
Amount | | | Premiums
(Received) | | | Value (†) | |
Options on Securities — (0.0%) | |
| Apple, Inc., Call | | 01/19/2018 | | | 180 | | | | (7,700 | ) | | $ | (1,303,071 | ) | | $ | (29,853 | ) | | $ | (1,848 | ) |
| CenturyLink, Inc., Call | | 04/20/2018 | | | 21 | | | | (195,700 | ) | | | (3,264,276 | ) | | | (85,536 | ) | | | (58,710 | ) |
| Comcast Corp., Call | | 01/19/2018 | | | 41 | | | | (135,000 | ) | | | (5,406,750 | ) | | | (56,710 | ) | | | (45,900 | ) |
| iShares® MSCI Emerging Markets ETF, Call | | 02/16/2018 | | | 49 | | | | (374,700 | ) | | | (17,655,864 | ) | | | (41,997 | ) | | | (108,663 | ) |
| iShares® Russell 2000 ETF, Put | | 01/19/2018 | | | 144 | | | | (69,600 | ) | | | (10,611,216 | ) | | | (90,275 | ) | | | (20,532 | ) |
| SPDR® S&P® Retail ETF, Put | | 01/19/2018 | | | 39 | | | | (167,500 | ) | | | (7,567,650 | ) | | | (76,560 | ) | | | (5,863 | ) |
| | | | | | | | | | | | | | | | | | | | | | |
| Total | | | | | | | | | | | | | | | | $ | (380,931 | ) | | $ | (241,516 | ) |
| | | | | | | | | | | | | | | | | | | | | | |
| | | | | | | | |
| | | | | | | | |
| | (‡) | | | Principal Amount stated in U.S. dollars unless otherwise noted. | |
| | (†) | | | See Note 2 of Notes to Financial Statements. | |
| | (††) | | | Amount shown represents units. One unit represents a principal amount of 100. | |
| | (†††) | | | Options on securities are expressed as shares. Options on currency are expressed as units of currency. | |
| | (a) | | | Security (or a portion thereof) has been designated to cover the Fund’s obligations under open derivative contracts. | |
| | (b) | | | Variable rate security. Rate as of December 31, 2017 is disclosed. | |
See accompanying notes to financial statements.
| 58
Portfolio of Investments – as of December 31, 2017
Loomis Sayles Strategic Alpha Fund – (continued)
| | | | | | | | |
| | | | | | | | |
| | (c) | | | Variable rate security. The interest rate adjusts periodically based on; (i) changes in current interest rates and/or prepayments on underlying pools of assets, if applicable, (ii) reference to a base lending rate plus or minus a margin, and/or (iii) reference to a base lending rate adjusted by a multiplier and/or subject to certain floors or caps. Rate as of December 31, 2017 is disclosed. | |
| | (d) | | | Level 3 security. Value has been determined using significant unobservable inputs. See Note 3 of Notes to Financial Statements. | |
| | (e) | | | Fair valued by the Fund’s adviser. At December 31, 2017, the value of these securities amounted to $21,807,907 or 1.9% of net assets. | |
| | (f) | | | Illiquid security. (Unaudited) | |
| | (g) | | | Non-income producing security. | |
| | (h) | | | Securities classified as fair valued pursuant to the Fund’s pricing policies and procedures. At December 31, 2017, the value of these securities amounted to $2,968,544 or 0.3% of net assets. See Note 2 of Notes to Financial Statements. | |
| | (i) | | | Security represents right to receive monthly interest payments on an underlying pool of mortgages. Principal shown is the outstanding par amount of the pool held as of the end of the period. | |
| | (j) | | | Payment-in-kind security for which the issuer has the option at each interest payment date of making interest payments in cash or additional principal. For the period ended December 31, 2017, interest payments were made in cash. | |
| | (k) | | | The issuer is in default with respect to interest and/or principal payments. Income is not being accrued. | |
| | (l) | | | Perpetual bond with no specified maturity date. | |
| | (m) | | | Position is unsettled. Contract rate was not determined at December 31, 2017 and does not take effect until settlement date. Maturity date is not finalized until settlement date. | |
| | (n) | | | Variable rate security. Rate shown represents the weighted average rate of underlying contracts at December 31, 2017. | |
| | (o) | | | Variable rate security. Rate shown represents the weighted average rate of underlying contracts at December 31, 2017. Interest rates on contracts are primarily redetermined either weekly, monthly or quarterly by reference to the indicated base lending rate and spread and the reset period. | |
| | (p) | | | Interest rate represents discount rate at time of purchase; not a coupon rate. | |
| | (q) | | | Security (or a portion thereof) has been pledged as collateral for open derivative contracts. | |
| | (r) | | | Counterparty is Bank of America, N.A. | |
| | (s) | | | Securities subject to restriction on resale. At December 31, 2017, the restricted securities held by the Fund are as follows: | |
| | | | | | | | | | | | | | |
| | | | | | | | | | | | | | |
| | | Acquisition
Date | | Cost | | | Value | | | % of
Net Assets | |
| Aergen LLC | | March 6, 2017 | | $ | 5,854,500 | | | $ | 5,498,915 | | | | 0.5% | |
| ECAF I Blocker Ltd. | | June 18, 2015 | | | 9,000,000 | | | | 8,912,709 | | | | 0.8% | |
| GCA2014 Holdings Ltd., Series 2014-1, Class C | | December 18, 2014 | | | 2,069,787 | | | | 1,459,200 | | | | 0.1% | |
| GCA2014 Holdings Ltd., Series 2014-1, Class D | | December 18, 2014 | | | 820,999 | | | | 236,612 | | | | Less than 0.1% | |
| GCA2014 Holdings Ltd., Series 2014-1, Class E | | December 18, 2014 | | | 2,657,606 | | | | — | | | | 0.0% | |
| Working Capital Solutions Funding LLC | | December 29, 2016 | | | 5,700,000 | | | | 5,700,000 | | | | 0.5% | |
See accompanying notes to financial statements.
59 |
Portfolio of Investments – as of December 31, 2017
Loomis Sayles Strategic Alpha Fund – (continued)
| | | | | | | | |
| | | | | | | | |
| | 144A | | | All or a portion of these securities are exempt from registration under Rule 144A of the Securities Act of 1933. These securities may be resold in transactions exempt from registration, normally to qualified institutional buyers. At December 31, 2017, the value of Rule 144A holdings amounted to $435,097,993 or 37.7% of net assets. | |
| | ABS | | | Asset-Backed Securities | |
| | ADR | | | An American Depositary Receipt is a certificate issued by a custodian bank representing the right to receive securities of the foreign issuer described. The values of ADRs may be significantly influenced by trading on exchanges not located in the United States. | |
| | ARS | | | Auction Rate Security | | | | |
| | CDOR | | | Canadian Dollar Offered Rate | | | | |
| | EMTN | | | Euro Medium Term Note | | | | |
| | ETF | | | Exchange-Traded Fund | | | | |
| | | | | | | | |
| | EURIBOR | | | Euro Interbank Offered Rate | | | | |
| | GMTN | | | Global Medium Term Note | | | | |
| | LIBOR | | | London Interbank Offered Rate | | | | |
| | MTN | | | Medium Term Note | | | | |
| | PIK | | | Payment-in-Kind | | | | |
| | SLM | | | Sallie Mae | | | | |
| | | | | | | | |
| | ARS | | | Argentine Peso | | | | |
| | AUD | | | Australian Dollar | | | | |
| | BRL | | | Brazilian Real | | | | |
| | CAD | | | Canadian Dollar | | | | |
| | CHF | | | Swiss Franc | | | | |
| | CLP | | | Chilean Peso | | | | |
| | CNY | | | Chinese Yuan Renminbi | | | | |
| | COP | | | Colombian Peso | | | | |
| | CZK | | | Czech Koruna | | | | |
| | EUR | | | Euro | | | | |
| | GBP | | | British Pound | | | | |
| | HUF | | | Hungarian Forint | | | | |
| | IDR | | | Indonesian Rupiah | | | | |
| | INR | | | Indian Rupee | | | | |
| | JPY | | | Japanese Yen | | | | |
| | KRW | | | South Korean Won | | | | |
| | MXN | | | Mexican Peso | | | | |
| | MYR | | | Malaysian Ringgit | | | | |
| | NOK | | | Norwegian Krone | | | | |
| | NZD | | | New Zealand Dollar | | | | |
| | PEN | | | Peruvian Sol | | | | |
| | PHP | | | Philippine Peso | | | | |
| | PLN | | | Polish Zloty | | | | |
| | RUB | | | New Russian Ruble | | | | |
| | SEK | | | Swedish Krona | | | | |
| | TRY | | | Turkish Lira | | | | |
| | USD | | | U.S. Dollar | | | | |
| | ZAR | | | South African Rand | | | | |
See accompanying notes to financial statements.
| 60
Portfolio of Investments – as of December 31, 2017
Loomis Sayles Strategic Alpha Fund – (continued)
At December 31, 2017, the Fund had the following open bilateral credit default swap agreements:
| | | | | | | | | | | | | | | | | | | | | | | | |
| Buy Protection | | | | | | | | | | | | | | | | | | | | | | | | |
| Counterparty | | Reference
Obligation | | (Pay)/
Receive
Fixed Rate1 | | Expiration
Date | | | Notional
Value(‡) | | | Unamortized
Up Front
Premium
Paid/
(Received) | | | Market
Value | | | Unrealized
Appreciation
(Depreciation) | |
| Barclays Capital, Inc. | | Enel SpA | | (1.00%) | | | 12/20/2022 | | | | 4,900,000 | EUR | | $ | (82,113 | ) | | $ | (128,118 | ) | | $ | (46,005 | ) |
| Bank of America, N.A. | | CDX.EM Series 28, 5-Year | | (1.00%) | | | 12/20/2022 | | | | 1,200,000 | | | | 48,727 | | | | 10,792 | | | | (37,935 | ) |
| Bank of America, N.A. | | Republic of Turkey | | (1.00%) | | | 12/20/2022 | | | | 4,977,376 | | | | 242,299 | | | | 146,360 | | | | (95,939 | ) |
| Goldman Sachs & Co. | | CDX.EM Series 28, 5-Year | | (1.00%) | | | 12/20/2022 | | | | 14,693,450 | | | | 596,640 | | | | 132,145 | | | | (464,495 | ) |
| JPMorgan Chase Bank N.A. | | Enel SpA | | (1.00%) | | | 12/20/2022 | | | | 5,500,000 | EUR | | | (94,770 | ) | | | (143,806 | ) | | | (49,036 | ) |
| JPMorgan Chase Bank N.A. | | Teva Pharmaceutical Finance Co. BV | | (1.00%) | | | 12/20/2022 | | | | 500,000 | | | | 56,741 | | | | 37,475 | | | | (19,266 | ) |
| JPMorgan Chase Bank N.A. | | Teva Pharmaceutical Finance Co. BV | | (1.00%) | | | 12/20/2022 | | | | 750,000 | | | | 82,394 | | | | 56,213 | | | | (26,181 | ) |
| Morgan Stanley Capital Services, Inc. | | Markit iTraxx Asia ex-Japan Index Series 25, 5-Year | | (1.00%) | | | 12/20/2022 | | | | 7,580,000 | | | | (72,157 | ) | | | (115,641 | ) | | | (43,484 | ) |
| Morgan Stanley Capital Services, Inc. | | Republic of Turkey | | (1.00%) | | | 12/20/2022 | | | | 797,624 | | | | 38,828 | | | | 23,454 | | | | (15,374 | ) |
| Morgan Stanley Capital Services, Inc. | | Republic of Turkey | | (1.00%) | | | 12/20/2022 | | | | 6,500,000 | | | | 233,969 | | | | 191,132 | | | | (42,837 | ) |
| Morgan Stanley Capital Services, Inc. | | United Mexican States | | (1.00%) | | | 12/20/2022 | | | | 11,400,000 | | | | 31,613 | | | | 31,604 | | | | (9 | ) |
| | | | | | | | | | | | | | | | | | | | | | | | |
| Total | | | | | | | | | | | | | | | | | | $ | 241,610 | | | $ | (840,561 | ) |
| | | | | | | | | | | | | | | | | | | | | | | | |
See accompanying notes to financial statements.
61 |
Portfolio of Investments – as of December 31, 2017
Loomis Sayles Strategic Alpha Fund – (continued)
At December 31, 2017, the Fund had the following open centrally cleared interest rate swap agreements:
| | | | | | | | | | | | | | | | | | | | | | | | |
Notional
Value | | Currency | | | Expiration
Date | | | Fund Pays2 | | | Fund Receives2 | | | Market
Value | | | Unrealized
Appreciation
(Depreciation)3 | |
| 19,195,200 | | | USD | | | | 7/18/2026 | | | | 1.410% | | | | 3-month LIBOR | | | $ | 1,450,225 | | | $ | 1,450,225 | |
| 16,700,000 | | | CAD | | | | 9/14/2027 | | | | 2.351% | | | | 3-month CDOR | | | | 39,777 | | | | 39,441 | |
| 39,700,000 | | | CAD | | | | 9/15/2027 | | | | 2.365% | | | | 3-month CDOR | | | | 56,088 | | | | 55,277 | |
| 39,700,000 | | | CAD | | | | 9/15/2027 | | | | 2.360% | | | | 3-month CDOR | | | | 70,032 | | | | 69,225 | |
| 39,700,000 | | | CAD | | | | 9/18/2027 | | | | 2.386% | | | | 3-month CDOR | | | | (1,447 | ) | | | (2,275 | ) |
| 30,950,000 | | | CAD | | | | 9/19/2027 | | | | 2.363% | | | | 3-month CDOR | | | | 50,088 | | | | 49,451 | |
| 41,000,000 | | | CAD | | | | 9/14/2021 | | | | 3-month CDOR | | | | 2.095% | | | | (109,137 | ) | | | (108,590 | ) |
| 97,600,000 | | | CAD | | | | 9/15/2021 | | | | 3-month CDOR | | | | 2.115% | | | | (205,591 | ) | | | (204,248 | ) |
| 97,600,000 | | | CAD | | | | 9/15/2021 | | | | 3-month CDOR | | | | 2.110% | | | | (219,496 | ) | | | (218,163 | ) |
| 97,600,000 | | | CAD | | | | 9/18/2021 | | | | 3-month CDOR | | | | 2.120% | | | | (193,780 | ) | | | (192,425 | ) |
| 76,460,000 | | | CAD | | | | 9/19/2021 | | | | 3-month CDOR | | | | 2.070% | | | | (261,224 | ) | | | (260,223 | ) |
| | | | | | | | | | | | | | | | | | | | | | | | |
Total | | | $ | 675,535 | | | $ | 677,695 | |
| | | | | | | | | | | | | | | | | | | | | | | | |
| (‡) | Notional value stated in U.S. dollars unless otherwise noted. |
| 1 | Payments are made semiannually. |
| 2 | Payments are made quarterly. |
| 3 | Differences between unrealized appreciation (depreciation) and market value, if any, are due to interest booked as part of the initial trades. |
At December 31, 2017, the Fund had the following open forward foreign currency contracts:
| | | | | | | | | | | | | | | | | | | | | | | | | | |
| Counterparty | | Delivery
Date | | | Currency
Bought/
Sold (B/S) | | | | | Units
of
Currency | | | In Exchange for | | | Notional
Value | | | Unrealized
Appreciation
(Depreciation) | |
| Bank of America, N.A. | | | 1/31/2018 | | | ARS | | | S | | | | 14,540,000 | | | $ | 772,172 | | | $ | 769,109 | | | $ | 3,063 | |
| Bank of America, N.A. | | | 2/02/2018 | | | BRL | | | S | | | | 23,300,000 | | | | 6,990,489 | | | | 7,000,611 | | | | (10,122 | ) |
| Bank of America, N.A. | | | 1/11/2018 | | | GBP | | | S | | | | 2,730,000 | | | | 3,682,374 | | | | 3,686,824 | | | | (4,450 | ) |
| Bank of America, N.A. | | | 1/16/2018 | | | EUR | | | S | | | | 2,850,000 | | | | 3,371,935 | | | | 3,422,165 | | | | (50,230 | ) |
| Bank of America, N.A. | | | 1/31/2018 | | | EUR | | | S | | | | 44,875,000 | | | | 53,558,313 | | | | 53,930,173 | | | | (371,860 | ) |
| Bank of America, N.A. | | | 1/29/2018 | | | MXN | | | S | | | | 92,400,000 | | | | 4,707,801 | | | | 4,677,214 | | | | 30,587 | |
| Bank of America, N.A. | | | 1/16/2018 | | | RUB | | | B | | | | 20,385,000 | | | | 344,167 | | | | 353,431 | | | | 9,264 | |
| Bank of America, N.A. | | | 1/22/2018 | | | RUB | | | B | | | | 16,485,000 | | | | 284,666 | | | | 285,637 | | | | 971 | |
| Bank of America, N.A. | | | 1/16/2018 | | | RUB | | | S | | | | 20,385,000 | | | | 346,330 | | | | 353,431 | | | | (7,101 | ) |
| Bank of America, N.A. | | | 1/22/2018 | | | RUB | | | S | | | | 16,485,000 | | | | 279,833 | | | | 285,637 | | | | (5,804 | ) |
| Bank of America, N.A. | | | 1/16/2018 | | | PEN | | | B | | | | 2,965,000 | | | | 915,830 | | | | 913,887 | | | | (1,943 | ) |
| Bank of America, N.A. | | | 1/17/2018 | | | PEN | | | B | | | | 3,710,000 | | | | 1,145,910 | | | | 1,143,468 | | | | (2,442 | ) |
| Bank of America, N.A. | | | 1/16/2018 | | | PEN | | | S | | | | 2,965,000 | | | | 900,532 | | | | 913,887 | | | | (13,355 | ) |
| Bank of America, N.A. | | | 1/17/2018 | | | PEN | | | S | | | | 3,710,000 | | | | 1,141,382 | | | | 1,143,468 | | | | (2,086 | ) |
| Bank of America, N.A. | | | 5/21/2018 | | | PHP | | | B | | | | 1,845,925,000 | | | | 36,230,127 | | | | 36,743,102 | | | | 512,975 | |
| Bank of America, N.A. | | | 1/17/2018 | | | CHF | | | B | | | | 505,000 | | | | 512,878 | | | | 518,708 | | | | 5,830 | |
| Bank of America, N.A. | | | 1/17/2018 | | | CHF | | | S | | | | 1,030,000 | | | | 1,043,632 | | | | 1,057,960 | | | | (14,328 | ) |
| Bank of America, N.A. | | | 1/16/2018 | | | TRY | | | B | | | | 880,000 | | | | 227,402 | | | | 231,183 | | | | 3,781 | |
| BNP Paribas S.A. | | | 1/31/2018 | | | CAD | | | S | | | | 745,000 | | | | 589,469 | | | | 592,945 | | | | (3,476 | ) |
| BNP Paribas S.A. | | | 1/31/2018 | | | JPY | | | S | | | | 181,395,000 | | | | 1,606,189 | | | | 1,611,946 | | | | (5,757 | ) |
See accompanying notes to financial statements.
| 62
Portfolio of Investments – as of December 31, 2017
Loomis Sayles Strategic Alpha Fund – (continued)
| | | | | | | | | | | | | | | | | | | | | | | | | | |
| Counterparty | | Delivery
Date | | | Currency
Bought/
Sold (B/S) | | | | | Units
of
Currency | | | In Exchange for | | | Notional
Value | | | Unrealized
Appreciation
(Depreciation) | |
| BNP Paribas S.A. | | | 2/01/2018 | | | JPY | | | S | | | | 76,670,000 | | | $ | 678,931 | | | $ | 681,352 | | | $ | (2,421 | ) |
| BNP Paribas S.A. | | | 1/31/2018 | | | NOK | | | S | | | | 3,325,000 | | | | 402,396 | | | | 405,288 | | | | (2,892 | ) |
| Citibank N.A. | | | 1/16/2018 | | | EUR | | | B | | | | 1,990,000 | | | | 2,354,568 | | | | 2,389,512 | | | | 34,944 | |
| Citibank N.A. | | | 1/23/2018 | | | NZD | | | B | | | | 410,000 | | | | 287,393 | | | | 290,497 | | | | 3,104 | |
| Citibank N.A. | | | 1/23/2018 | | | NZD | | | S | | | | 410,000 | | | | 289,378 | | | | 290,497 | | | | (1,119 | ) |
| Credit Suisse International | | | 1/30/2018 | | | COP | | | S | | | | 18,400,000,000 | | | | 6,116,920 | | | | 6,149,924 | | | | (33,004 | ) |
| Deutsche Bank AG | | | 1/16/2018 | | | AUD | | | B | | | | 355,000 | | | | 273,058 | | | | 276,988 | | | | 3,930 | |
| Deutsche Bank AG | | | 1/16/2018 | | | AUD | | | S | | | | 355,000 | | | | 267,308 | | | | 276,988 | | | | (9,680 | ) |
| Deutsche Bank AG | | | 1/22/2018 | | | GBP | | | S | | | | 5,095,000 | | | | 6,852,469 | | | | 6,883,199 | | | | (30,730 | ) |
| Deutsche Bank AG | | | 1/29/2018 | | | EUR | | | S | | | | 2,000,000 | | | | 2,381,076 | | | | 2,403,299 | | | | (22,223 | ) |
| Deutsche Bank AG | | | 1/30/2018 | | | EUR | | | S | | | | 2,800,000 | | | | 3,324,536 | | | | 3,364,811 | | | | (40,275 | ) |
| Deutsche Bank AG | | | 1/16/2018 | | | ZAR | | | B | | | | 3,130,000 | | | | 228,884 | | | | 252,476 | | | | 23,592 | |
| Deutsche Bank AG | | | 1/31/2018 | | | KRW | | | B | | | | 497,065,000 | | | | 462,688 | | | | 464,526 | | | | 1,838 | |
| Deutsche Bank AG | | | 1/16/2018 | | | CHF | | | S | | | | 2,285,000 | | | | 2,313,877 | | | | 2,346,863 | | | | (32,986 | ) |
| Deutsche Bank AG | | | 1/22/2018 | | | CNY | | | B | | | | 7,610,000 | | | | 1,149,200 | | | | 1,167,430 | | | | 18,230 | |
| Deutsche Bank AG | | | 1/23/2018 | | | CNY | | | B | | | | 12,445,000 | | | | 1,897,104 | | | | 1,909,050 | | | | 11,946 | |
| Deutsche Bank AG | | | 1/23/2018 | | | CNY | | | S | | | | 12,445,000 | | | | 1,879,342 | | | | 1,909,050 | | | | (29,708 | ) |
| Goldman Sachs & Co. | | | 1/16/2018 | | | ARS | | | B | | | | 15,850,000 | | | | 902,620 | | | | 845,108 | | | | (57,512 | ) |
| Goldman Sachs & Co. | | | 1/16/2018 | | | CZK | | | B | | | | 5,050,000 | | | | 233,613 | | | | 237,333 | | | | 3,720 | |
| Goldman Sachs & Co. | | | 1/16/2018 | | | CZK | | | S | | | | 13,720,000 | | | | 636,275 | | | | 644,793 | | | | (8,518 | ) |
| Goldman Sachs & Co. | | | 1/22/2018 | | | CZK | | | S | | | | 4,935,000 | | | | 230,285 | | | | 232,002 | | | | (1,717 | ) |
| Goldman Sachs & Co. | | | 1/31/2018 | | | INR | | | B | | | | 46,100,000 | | | | 716,952 | | | | 720,044 | | | | 3,092 | |
| Goldman Sachs & Co. | | | 1/17/2018 | | | SEK | | | B | | | | 3,660,000 | | | | 443,265 | | | | 446,540 | | | | 3,275 | |
| Goldman Sachs & Co. | | | 1/17/2018 | | | SEK | | | S | | | | 6,975,000 | | | | 823,005 | | | | 850,988 | | | | (27,983 | ) |
| HSBC Bank USA | | | 1/16/2018 | | | SEK | | | B | | | | 3,585,000 | | | | 423,159 | | | | 437,364 | | | | 14,205 | |
| HSBC Bank USA | | | 1/16/2018 | | | SEK | | | S | | | | 3,585,000 | | | | 426,933 | | | | 437,364 | | | | (10,431 | ) |
| Morgan Stanley Capital Services, Inc. | | | 1/02/2018 | | | BRL | | | B | | | | 40,300,000 | | | | 12,210,271 | | | | 12,149,166 | | | | (61,105 | ) |
| Morgan Stanley Capital Services, Inc. | | | 1/19/2018 | | | BRL | | | B | | | | 380,000 | | | | 115,064 | | | | 114,352 | | | | (712 | ) |
| Morgan Stanley Capital Services, Inc. | | | 1/02/2018 | | | BRL | | | S | | | | 40,300,000 | | | | 12,479,677 | | | | 12,149,166 | | | | 330,511 | |
| Morgan Stanley Capital Services, Inc. | | | 1/19/2018 | | | BRL | | | S | | | | 755,000 | | | | 226,522 | | | | 227,200 | | | | (678 | ) |
| Morgan Stanley Capital Services, Inc. | | | 2/02/2018 | | | BRL | | | S | | | | 40,300,000 | | | | 12,162,550 | | | | 12,108,354 | | | | 54,196 | |
| Morgan Stanley Capital Services, Inc. | | | 1/18/2018 | | | GBP | | | S | | | | 1,225,000 | | | | 1,648,096 | | | | 1,654,723 | | | | (6,627 | ) |
| Morgan Stanley Capital Services, Inc. | | | 1/16/2018 | | | CLP | | | B | | | | 150,405,000 | | | | 236,226 | | | | 244,402 | | | | 8,176 | |
| Morgan Stanley Capital Services, Inc. | | | 1/16/2018 | | | CLP | | | S | | | | 150,405,000 | | | | 229,626 | | | | 244,402 | | | | (14,776 | ) |
| Morgan Stanley Capital Services, Inc. | | | 1/16/2018 | | | COP | | | B | | | | 690,940,000 | | | | 232,405 | | | | 231,235 | | | | (1,170 | ) |
| Morgan Stanley Capital Services, Inc. | | | 1/22/2018 | | | COP | | | B | | | | 792,080,000 | | | | 266,335 | | | | 264,937 | | | | (1,398 | ) |
See accompanying notes to financial statements.
63 |
Portfolio of Investments – as of December 31, 2017
Loomis Sayles Strategic Alpha Fund – (continued)
| | | | | | | | | | | | | | | | | | | | | | | | | | |
| Counterparty | | Delivery
Date | | | Currency
Bought/
Sold (B/S) | | | | | Units
of
Currency | | | In Exchange for | | | Notional
Value | | | Unrealized
Appreciation
(Depreciation) | |
| Morgan Stanley Capital Services, Inc. | | | 1/16/2018 | | | COP | | | S | | | | 690,940,000 | | | $ | 227,208 | | | $ | 231,235 | | | $ | (4,027 | ) |
| Morgan Stanley Capital Services, Inc. | | | 1/12/2018 | | | EUR | | | S | | | | 10,050,000 | | | | 11,843,775 | | | | 12,064,885 | | | | (221,110 | ) |
| Morgan Stanley Capital Services, Inc. | | | 1/18/2018 | | | HUF | | | B | | | | 61,270,000 | | | | 232,654 | | | | 236,778 | | | | 4,124 | |
| Morgan Stanley Capital Services, Inc. | | | 1/18/2018 | | | HUF | | | S | | | | 61,270,000 | | | | 229,210 | | | | 236,778 | | | | (7,568 | ) |
| Morgan Stanley Capital Services, Inc. | | | 1/18/2018 | | | INR | | | B | | | | 14,780,000 | | | | 228,297 | | | | 231,167 | | | | 2,870 | |
| Morgan Stanley Capital Services, Inc. | | | 1/16/2018 | | | IDR | | | B | | | | 3,636,725,000 | | | | 267,275 | | | | 267,744 | | | | 469 | |
| Morgan Stanley Capital Services, Inc. | | | 1/16/2018 | | | IDR | | | S | | | | 3,636,725,000 | | | | 267,899 | | | | 267,744 | | | | 155 | |
| Morgan Stanley Capital Services, Inc. | | | 1/16/2018 | | | JPY | | | B | | | | 104,395,000 | | | | 931,017 | | | | 927,022 | | | | (3,995 | ) |
| Morgan Stanley Capital Services, Inc. | | | 1/16/2018 | | | JPY | | | S | | | | 104,395,000 | | | | 922,148 | | | | 927,022 | | | | (4,874 | ) |
| Morgan Stanley Capital Services, Inc. | | | 1/22/2018 | | | MYR | | | B | | | | 2,345,000 | | | | 575,177 | | | | 579,030 | | | | 3,853 | |
| Morgan Stanley Capital Services, Inc. | | | 1/22/2018 | | | MYR | | | S | | | | 2,345,000 | | | | 575,037 | | | | 579,031 | | | | (3,994 | ) |
| Morgan Stanley Capital Services, Inc. | | | 1/08/2018 | | | MXN | | | B | | | | 236,150,000 | | | | 12,599,505 | | | | 11,998,839 | | | | (600,666 | ) |
| Morgan Stanley Capital Services, Inc. | | | 1/18/2018 | | | MXN | | | S | | | | 4,325,000 | | | | 225,127 | | | | 219,358 | | | | 5,769 | |
| Morgan Stanley Capital Services, Inc. | | | 1/31/2018 | | | RUB | | | B | | | | 25,280,000 | | | | 436,412 | | | | 437,624 | | | | 1,212 | |
| Morgan Stanley Capital Services, Inc. | | | 1/16/2018 | | | NZD | | | B | | | | 395,000 | | | | 275,997 | | | | 279,895 | | | | 3,898 | |
| Morgan Stanley Capital Services, Inc. | | | 1/16/2018 | | | NZD | | | S | | | | 395,000 | | | | 272,926 | | | | 279,895 | | | | (6,969 | ) |
| Morgan Stanley Capital Services, Inc. | | | 1/31/2018 | | | NOK | | | B | | | | 154,915,000 | | | | 18,756,546 | | | | 18,882,781 | | | | 126,235 | |
| Morgan Stanley Capital Services, Inc. | | | 1/16/2018 | | | PHP | | | B | | | | 13,445,000 | | | | 267,031 | | | | 269,182 | | | | 2,151 | |
| Morgan Stanley Capital Services, Inc. | | | 1/22/2018 | | | PHP | | | B | | | | 37,975,000 | | | | 753,248 | | | | 760,102 | | | | 6,854 | |
| Morgan Stanley Capital Services, Inc. | | | 1/22/2018 | | | PHP | | | B | | | | 8,840,000 | | | | 177,474 | | | | 176,940 | | | | (534 | ) |
| Morgan Stanley Capital Services, Inc. | | | 1/16/2018 | | | PHP | | | S | | | | 13,445,000 | | | | 266,618 | | | | 269,182 | | | | (2,564 | ) |
| Morgan Stanley Capital Services, Inc. | | | 1/16/2018 | | | PLN | | | B | | | | 1,235,000 | | | | 349,716 | | | | 354,791 | | | | 5,075 | |
| Morgan Stanley Capital Services, Inc. | | | 1/08/2018 | | | PLN | | | S | | | | 120,345,000 | | | | 33,942,503 | | | | 34,572,530 | | | | (630,027 | ) |
| Morgan Stanley Capital Services, Inc. | | | 1/16/2018 | | | PLN | | | S | | | | 1,235,000 | | | | 346,657 | | | | 354,791 | | | | (8,134 | ) |
See accompanying notes to financial statements.
| 64
Portfolio of Investments – as of December 31, 2017
Loomis Sayles Strategic Alpha Fund – (continued)
| | | | | | | | | | | | | | | | | | | | | | | | | | |
| Counterparty | | Delivery
Date | | | Currency
Bought/
Sold (B/S) | | | | | Units
of
Currency | | | In Exchange for | | | Notional
Value | | | Unrealized
Appreciation
(Depreciation) | |
| Morgan Stanley Capital Services, Inc. | | | 1/29/2018 | | | ZAR | | | S | | | | 361,810,000 | | | $ | 28,322,669 | | | $ | 29,127,658 | | | $ | (804,989 | ) |
| Morgan Stanley Capital Services, Inc. | | | 1/16/2018 | | | KRW | | | S | | | | 2,634,450,000 | | | | 2,419,146 | | | | 2,461,660 | | | | (42,514 | ) |
| Morgan Stanley Capital Services, Inc. | | | 1/29/2018 | | | SEK | | | B | | | | 161,100,000 | | | | 19,211,620 | | | | 19,668,988 | | | | 457,368 | |
| Morgan Stanley Capital Services, Inc. | | | 1/18/2018 | | | CHF | | | B | | | | 460,000 | | | | 467,965 | | | | 472,520 | | | | 4,555 | |
| Morgan Stanley Capital Services, Inc. | | | 1/18/2018 | | | CHF | | | S | | | | 460,000 | | | | 465,906 | | | | 472,520 | | | | (6,614 | ) |
| UBS AG | | | 1/16/2018 | | | CAD | | | B | | | | 635,000 | | | | 494,441 | | | | 505,306 | | | | 10,865 | |
| UBS AG | | | 1/16/2018 | | | CAD | | | S | | | | 635,000 | | | | 494,350 | | | | 505,306 | | | | (10,956 | ) |
| UBS AG | | | 1/26/2018 | | | CLP | | | B | | | | 140,940,000 | | | | 227,030 | | | | 229,022 | | | | 1,992 | |
| UBS AG | | | 1/16/2018 | | | HUF | | | B | | | | 153,120,000 | | | | 589,150 | | | | 591,674 | | | | 2,524 | |
| UBS AG | | | 1/17/2018 | | | HUF | | | B | | | | 91,870,000 | | | | 347,377 | | | | 355,014 | | | | 7,637 | |
| UBS AG | | | 1/16/2018 | | | HUF | | | S | | | | 153,120,000 | | | | 574,343 | | | | 591,674 | | | | (17,331 | ) |
| UBS AG | | | 1/17/2018 | | | HUF | | | S | | | | 91,870,000 | | | | 344,614 | | | | 355,014 | | | | (10,400 | ) |
| UBS AG | | | 1/16/2018 | | | INR | | | B | | | | 155,225,000 | | | | 2,404,353 | | | | 2,428,317 | | | | 23,964 | |
| UBS AG | | | 1/17/2018 | | | INR | | | B | | | | 32,805,000 | | | | 508,132 | | | | 513,142 | | | | 5,010 | |
| UBS AG | | | 1/22/2018 | | | JPY | | | S | | | | 25,620,000 | | | | 226,889 | | | | 227,570 | | | | (681 | ) |
| | | | | | | | | | | | | | | | | | | | | | | | | | |
| Total | | | $ | (1,520,756 | ) |
| | | | | | | | | | | | | | | | | | | | | | | | | | |
At December 31, 2017, the Fund had the following open forward cross currency contracts:
| | | | | | | | | | | | | | | | | | | | | | | | | | |
| Counterparty | | Settlement
Date | | | Deliver/Units
of Currency | | | Receive/Units
of Currency | | | Notional
Value | | | Unrealized
Appreciation
(Depreciation) | |
| Deutsche Bank AG | | | 1/08/2018 | | | EUR | | | 10,120,000 | | | | MXN | | | | 224,989,864 | | | $ | 11,431,789 | | | $ | (714,300 | ) |
| Deutsche Bank AG | | | 1/08/2018 | | | EUR | | | 395,000 | | | | MXN | | | | 9,175,604 | | | | 466,215 | | | | (7,867 | ) |
| UBS AG | | | 1/05/2018 | | | EUR | | | 10,120,000 | | | | GBP | | | | 8,917,440 | | | | 12,040,628 | | | | (103,292 | ) |
| UBS AG | | | 1/05/2018 | | | EUR | | | 395,000 | | | | GBP | | | | 350,590 | | | | 473,379 | | | | (618 | ) |
| | | | | | | | | | | | | | | | | | | | | | | | | | |
| Total | | | $ | (826,077 | ) |
| | | | | | | | | | | | | | | | | | | | | | | | | | |
At December 31, 2017, open long futures contracts were as follows:
| | | | | | | | | | | | | | | | | | | | |
| Financial Futures | | Expiration
Date | | | Contracts | | | Notional
Amount | | | Value | | | Unrealized
Appreciation
(Depreciation) | |
10 Year U.S. Treasury Note | | | 3/20/2018 | | | | 31 | | | $ | 3,837,257 | | | $ | 3,845,453 | | | $ | 8,196 | |
2 Year U.S. Treasury Note | | | 3/29/2018 | | | | 662 | | | | 141,752,882 | | | | 141,740,407 | | | | (12,475 | ) |
CBOE SPX Volatility Index | | | 1/17/2018 | | | | 95 | | | | 1,109,556 | | | | 1,090,125 | | | | (19,431 | ) |
| | | | | | | | | | | | | | | | | | | | |
Total | | | $ | (23,710 | ) |
| | | | | | | | | | | | | | | | | | | | |
See accompanying notes to financial statements.
65 |
Portfolio of Investments – as of December 31, 2017
Loomis Sayles Strategic Alpha Fund – (continued)
At December 31, 2017, open short futures contracts were as follows:
| | | | | | | | | | | | | | | | | | | | |
| Financial Futures | | Expiration
Date | | | Contracts | | | Notional
Amount | | | Value | | | Unrealized
Appreciation
(Depreciation) | |
E-mini S&P 500® | | | 3/16/2018 | | | | 211 | | | $ | 28,108,384 | | | $ | 28,231,800 | | | $ | (123,416 | ) |
German Euro Bund | | | 3/08/2018 | | | | 168 | | | | 32,838,256 | | | | 32,590,595 | | | | 247,661 | |
UK Long Gilt | | | 3/27/2018 | | | | 216 | | | | 36,275,841 | | | | 36,500,733 | | | | (224,892 | ) |
Ultra 10 Year U.S. Treasury Note | | | 3/20/2018 | | | | 245 | | | | 32,491,362 | | | | 32,722,813 | | | | (231,451 | ) |
Ultra Long U.S. Treasury Bond | | | 3/20/2018 | | | | 190 | | | | 31,808,952 | | | | 31,854,687 | | | | (45,735 | ) |
| | | | | | | | | | | | | | | | | | | | |
Total | | | | | | | | | | | | | | | | | | $ | (377,833 | ) |
| | | | | | | | | | | | | | | | | | | | |
Industry Summary at December 31, 2017
| | | | |
ABS Home Equity | | | 12.7 | % |
Treasuries | | | 7.0 | |
ABS Other | | | 5.1 | |
ABS Car Loan | | | 4.9 | |
ABS Credit Card | | | 4.5 | |
Technology | | | 4.5 | |
Non-Agency Commercial Mortgage-Backed Securities | | | 3.6 | |
Cable Satellite | | | 3.1 | |
Automotive | | | 3.1 | |
Government Owned – No Guarantee | | | 2.9 | |
Food & Beverage | | | 2.8 | |
Banking | | | 2.6 | |
Midstream | | | 2.5 | |
Oil, Gas & Consumable Fuels | | | 2.0 | |
Other Investments, less than 2% each | | | 32.2 | |
Short-Term Investments | | | 4.3 | |
| | | | |
Total Investments | | | 97.8 | |
Other assets less liabilities (including open written options, swap agreements, forward foreign currency and futures contracts) | | | 2.2 | |
| | | | |
Net Assets | | | 100.0 | % |
| | | | |
See accompanying notes to financial statements.
| 66
Portfolio of Investments – as of December 31, 2017
Natixis U.S. Equity Opportunities Fund
| | | | | | | | |
| Shares | | | Description | | Value (†) | |
| | Common Stocks — 97.4% of Net Assets | | | | |
| | | | Air Freight & Logistics — 2.7% | | | | |
| | 310,972 | | | Expeditors International of Washington, Inc. | | $ | 20,116,779 | |
| | 54,731 | | | United Parcel Service, Inc., Class B | | | 6,521,198 | |
| | | | | | | | |
| | | | | | | 26,637,977 | |
| | | | | | | | |
| | | | Automobiles — 2.5% | | | | |
| | 836,700 | | | Fiat Chrysler Automobiles NV | | | 14,926,728 | |
| | 248,400 | | | General Motors Co. | | | 10,181,916 | |
| | | | | | | | |
| | | | | | | 25,108,644 | |
| | | | | | | | |
| | | | Banks — 6.2% | | | | |
| | 664,770 | | | Bank of America Corp. | | | 19,624,010 | |
| | 331,500 | | | Citigroup, Inc. | | | 24,666,915 | |
| | 287,000 | | | Wells Fargo & Co. | | | 17,412,290 | |
| | | | | | | | |
| | | | | | | 61,703,215 | |
| | | | | | | | |
| | | | Beverages — 5.4% | | | | |
| | 202,155 | | | Coca-Cola Co. (The) | | | 9,274,871 | |
| | 109,510 | | | Diageo PLC, Sponsored ADR | | | 15,991,745 | |
| | 452,805 | | | Monster Beverage Corp.(a) | | | 28,658,029 | |
| | | | | | | | |
| | | | | | | 53,924,645 | |
| | | | | | | | |
| | | | Biotechnology — 1.9% | | | | |
| | 35,412 | | | Amgen, Inc. | | | 6,158,147 | |
| | 33,077 | | | Regeneron Pharmaceuticals, Inc.(a) | | | 12,435,629 | |
| | | | | | | | |
| | | | | | | 18,593,776 | |
| | | | | | | | |
| | | | Capital Markets — 4.0% | | | | |
| | 50,111 | | | FactSet Research Systems, Inc. | | | 9,659,396 | |
| | 87,039 | | | MSCI, Inc. | | | 11,013,915 | |
| | 276,797 | | | SEI Investments Co. | | | 19,890,633 | |
| | | | | | | | |
| | | | | | | 40,563,944 | |
| | | | | | | | |
| | | | Communications Equipment — 2.4% | | | | |
| | 633,793 | | | Cisco Systems, Inc. | | | 24,274,272 | |
| | | | | | | | |
| | | | Consumer Finance — 2.5% | | | | |
| | 68,959 | | | American Express Co. | | | 6,848,318 | |
| | 183,500 | | | Capital One Financial Corp. | | | 18,272,930 | |
| | | | | | | | |
| | | | | | | 25,121,248 | |
| | | | | | | | |
| | | | Energy Equipment & Services — 2.3% | | | | |
| | 199,800 | | | National Oilwell Varco, Inc. | | | 7,196,796 | |
| | 242,742 | | | Schlumberger Ltd. | | | 16,358,383 | |
| | | | | | | | |
| | | | | | | 23,555,179 | |
| | | | | | | | |
| | | | Food Products — 2.6% | | | | |
| | 746,181 | | | Danone S.A., Sponsored ADR | | | 12,513,455 | |
| | 160,850 | | | Nestle S.A., Sponsored ADR | | | 13,828,275 | |
| | | | | | | | |
| | | | | | | 26,341,730 | |
| | | | | | | | |
See accompanying notes to financial statements.
67 |
Portfolio of Investments – as of December 31, 2017
Natixis U.S. Equity Opportunities Fund – (continued)
| | | | | | | | |
| Shares | | | Description | | Value (†) | |
| | | | Health Care Equipment & Supplies — 2.8% | | | | |
| | 187,220 | | | Baxter International, Inc. | | $ | 12,101,901 | |
| | 139,597 | | | Varian Medical Systems, Inc.(a) | | | 15,516,206 | |
| | | | | | | | |
| | | | | | | 27,618,107 | |
| | | | | | | | |
| | | | Health Care Providers & Services — 1.4% | | | | |
| | 159,700 | | | HCA Healthcare, Inc.(a) | | | 14,028,048 | |
| | | | | | | | |
| | | | Health Care Technology — 0.9% | | | | |
| | 133,144 | | | Cerner Corp.(a) | | | 8,972,574 | |
| | | | | | | | |
| | | | Hotels, Restaurants & Leisure — 2.4% | | | | |
| | 403,345 | | | Yum China Holdings, Inc. | | | 16,141,867 | |
| | 100,629 | | | Yum! Brands, Inc. | | | 8,212,333 | |
| | | | | | | | |
| | | | | | | 24,354,200 | |
| | | | | | | | |
| | | | Household Products — 0.9% | | | | |
| | 99,856 | | | Procter & Gamble Co. (The) | | | 9,174,769 | |
| | | | | | | | |
| | | | Industrial Conglomerates — 1.3% | | | | |
| | 732,550 | | | General Electric Co. | | | 12,782,997 | |
| | | | | | | | |
| | | | Insurance — 4.4% | | | | |
| | 150,495 | | | Aflac, Inc. | | | 13,210,451 | |
| | 300,555 | | | American International Group, Inc. | | | 17,907,067 | |
| | 94,170 | | | Aon PLC | | | 12,618,780 | |
| | | | | | | | |
| | | | | | | 43,736,298 | |
| | | | | | | | |
| | | | Internet & Direct Marketing Retail — 5.8% | | | | |
| | 31,209 | | | Amazon.com, Inc.(a) | | | 36,497,989 | |
| | 440,200 | | | Liberty Interactive Corp./QVC Group, Class A(a) | | | 10,749,684 | |
| | 56,500 | | | Netflix, Inc.(a) | | | 10,845,740 | |
| | | | | | | | |
| | | | | | | 58,093,413 | |
| | | | | | | | |
| | | | Internet Software & Services — 11.3% | | | | |
| | 187,918 | | | Alibaba Group Holding Ltd., Sponsored ADR(a) | | | 32,402,701 | |
| | 35,256 | | | Alphabet, Inc., Class A(a) | | | 37,138,670 | |
| | 12,001 | | | Alphabet, Inc., Class C(a) | | | 12,557,846 | |
| | 178,614 | | | Facebook, Inc., Class A(a) | | | 31,518,227 | |
| | | | | | | | |
| | | | | | | 113,617,444 | |
| | | | | | | | |
| | | | IT Services — 5.9% | | | | |
| | 41,174 | | | Automatic Data Processing, Inc. | | | 4,825,181 | |
| | 111,200 | | | MasterCard, Inc., Class A | | | 16,831,232 | |
| | 329,179 | | | Visa, Inc., Class A | | | 37,532,990 | |
| | | | | | | | |
| | | | | | | 59,189,403 | |
| | | | | | | | |
| | | | Machinery — 3.3% | | | | |
| | 110,915 | | | Caterpillar, Inc. | | | 17,477,986 | |
| | 99,014 | | | Deere & Co. | | | 15,496,681 | |
| | | | | | | | |
| | | | | | | 32,974,667 | |
| | | | | | | | |
| | | | Media — 3.0% | | | | |
| | 43,300 | | | Charter Communications, Inc., Class A(a) | | | 14,547,068 | |
| | 380,700 | | | Comcast Corp., Class A | | | 15,247,035 | |
| | | | | | | | |
| | | | | | | 29,794,103 | |
| | | | | | | | |
See accompanying notes to financial statements.
| 68
Portfolio of Investments – as of December 31, 2017
Natixis U.S. Equity Opportunities Fund – (continued)
| | | | | | | | |
| Shares | | | Description | | Value (†) | |
| | | | Metals & Mining — 0.3% | | | | |
| | 41,243 | | | Compass Minerals International, Inc. | | $ | 2,979,807 | |
| | | | | | | | |
| | | | Oil, Gas & Consumable Fuels — 2.3% | | | | |
| | 185,200 | | | Anadarko Petroleum Corp. | | | 9,934,128 | |
| | 314,700 | | | Apache Corp. | | | 13,286,634 | |
| | | | | | | | |
| | | | | | | 23,220,762 | |
| | | | | | | | |
| | | | Personal Products — 1.3% | | | | |
| | 241,800 | | | Unilever PLC, Sponsored ADR | | | 13,381,212 | |
| | | | | | | | |
| | | | Pharmaceuticals — 2.7% | | | | |
| | 57,321 | | | Merck & Co., Inc. | | | 3,225,452 | |
| | 85,179 | | | Novartis AG, Sponsored ADR | | | 7,151,629 | |
| | 306,967 | | | Novo Nordisk AS, Sponsored ADR | | | 16,474,919 | |
| | | | | | | | |
| | | | | | | 26,852,000 | |
| | | | | | | | |
| | | | Semiconductors & Semiconductor Equipment — 5.0% | | | | |
| | 27,949 | | | Analog Devices, Inc. | | | 2,488,299 | |
| | 358,830 | | | Intel Corp. | | | 16,563,593 | |
| | 239,051 | | | QUALCOMM, Inc. | | | 15,304,045 | |
| | 151,565 | | | Texas Instruments, Inc. | | | 15,829,449 | |
| | | | | | | | |
| | | | | | | 50,185,386 | |
| | | | | | | | |
| | | | Software — 7.0% | | | | |
| | 177,173 | | | Autodesk, Inc.(a) | | | 18,573,046 | |
| | 120,414 | | | Microsoft Corp. | | | 10,300,213 | |
| | 864,538 | | | Oracle Corp. | | | 40,875,357 | |
| | | | | | | | |
| | | | | | | 69,748,616 | |
| | | | | | | | |
| | | | Technology Hardware, Storage & Peripherals — 1.9% | | | | |
| | 110,755 | | | Apple, Inc. | | | 18,743,069 | |
| | | | | | | | |
| | | | Textiles, Apparel & Luxury Goods — 1.0% | | | | |
| | 717,383 | | | Under Armour, Inc., Class A(a) | | | 10,351,837 | |
| | | | | | | | |
| | | | Total Common Stocks
(Identified Cost $697,905,372) | | | 975,623,342 | |
| | | | | | | | |
| | | | | | | | |
Principal
Amount | | | | | | |
| | Short-Term Investments — 2.4% | |
| $ | 23,840,036 | | | Tri-Party Repurchase Agreement with Fixed Income Clearing Corporation, dated 12/29/2017 at 0.540% to be repurchased at $23,841,466 on 1/02/2018 collateralized by $24,190,000 U.S. Treasury Note, 2.250% due 1/31/2024 valued at $24,322,779 including accrued interest (Note 2 of Notes to Financial Statements) (Identified Cost $23,840,036) | | | 23,840,036 | |
| | | | | | | | |
| | | | | | | | |
| | | | Total Investments — 99.8% (Identified Cost $721,745,408) | | | 999,463,378 | |
| | | | Other assets less liabilities — 0.2% | | | 2,491,774 | |
| | | | | | | | |
| | | | Net Assets — 100.0% | | $ | 1,001,955,152 | |
| | | | | | | | |
See accompanying notes to financial statements.
69 |
Portfolio of Investments – as of December 31, 2017
Natixis U.S. Equity Opportunities Fund – (continued)
| | | | | | | | |
| | | | | | | | |
| | (†) | | | See Note 2 of Notes to Financial Statements. | | | | |
| | (a) | | | Non-income producing security. | | | | |
| | | | | | | | |
| | ADR | | | An American Depositary Receipt is a certificate issued by a custodian bank representing the right to receive securities of the foreign issuer described. The values of ADRs may be significantly influenced by trading on exchanges not located in the United States. | |
Industry Summary at December 31, 2017
| | | | |
Internet Software & Services | | | 11.3 | % |
Software | | | 7.0 | |
Banks | | | 6.2 | |
IT Services | | | 5.9 | |
Internet & Direct Marketing Retail | | | 5.8 | |
Beverages | | | 5.4 | |
Semiconductors & Semiconductor Equipment | | | 5.0 | |
Insurance | | | 4.4 | |
Capital Markets | | | 4.0 | |
Machinery | | | 3.3 | |
Media | | | 3.0 | |
Health Care Equipment & Supplies | | | 2.8 | |
Pharmaceuticals | | | 2.7 | |
Air Freight & Logistics | | | 2.7 | |
Food Products | | | 2.6 | |
Consumer Finance | | | 2.5 | |
Automobiles | | | 2.5 | |
Hotels, Restaurants & Leisure | | | 2.4 | |
Communications Equipment | | | 2.4 | |
Energy Equipment & Services | | | 2.3 | |
Oil, Gas & Consumable Fuels | | | 2.3 | |
Other Investments, less than 2% each | | | 10.9 | |
Short-Term Investments | | | 2.4 | |
| | | | |
Total Investments | | | 99.8 | |
Other assets less liabilities | | | 0.2 | |
| | | | |
Net Assets | | | 100.0 | % |
| | | | |
See accompanying notes to financial statements.
| 70
Statements of Assets and Liabilities
December 31, 2017
| | | | | | | | | | | | |
| | | Loomis Sayles
Multi-Asset
Income Fund | | | Loomis Sayles
Strategic
Alpha Fund | | | Natixis U.S.
Equity
Opportunities
Fund | |
ASSETS | | | | | | | | | | | | |
Investments at cost | | $ | 137,254,389 | | | $ | 1,137,557,769 | | | $ | 721,745,408 | |
Net unrealized appreciation (depreciation) | | | 7,518,799 | | | | (10,498,072 | ) | | | 277,717,970 | |
| | | | | | | | | | | | |
Investments at value | | | 144,773,188 | | | | 1,127,059,697 | | | | 999,463,378 | |
Cash | | | 223 | | | | 6,590,737 | | | | 3,427 | |
Due from brokers (Note 2) | | | — | | | | 15,634,673 | | | | — | |
Foreign currency at value (identified cost $20,944, $6,913,529 and $0, respectively) | | | 21,020 | | | | 6,979,747 | | | | — | |
Receivable for Fund shares sold | | | 43,268 | | | | 8,560,419 | | | | 2,036,849 | |
Receivable for securities sold | | | 1,876 | | | | 254,190,500 | | | | 2,032,802 | |
Collateral received for open forward foreign currency contracts, options or swap agreements (Notes 2 and 4) | | | — | | | | 1,260,000 | | | | — | |
Dividends and interest receivable | | | 857,077 | | | | 7,085,184 | | | | 464,157 | |
Unrealized appreciation on forward foreign currency contracts (Note 2) | | | — | | | | 1,757,810 | | | | — | |
Tax reclaims receivable | | | 6,095 | | | | 43,953 | | | | 129,889 | |
Receivable for variation margin on futures contracts (Note 2) | | | — | | | | 247,715 | | | | — | |
Receivable for variation margin on centrally cleared swap agreements (Note 2) | | | — | | | | 249,772 | | | | — | |
Unamortized upfront premiums paid on bilateral swap agreements (Note 2) | | | — | | | | 1,331,211 | | | | — | |
Prepaid expenses (Note 8) | | | 123 | | | | 1,131 | | | | 766 | |
| | | | | | | | | | | | |
TOTAL ASSETS | | | 145,702,870 | | | | 1,430,992,549 | | | | 1,004,131,268 | |
| | | | | | | | | | | | |
LIABILITIES | | | | | | | | | | | | |
Options written, at value (premiums received $0, $380,931 and $0, respectively) (Note 2) | | | — | | | | 241,516 | | | | — | |
Payable for securities purchased | | | 735,362 | | | | 268,424,024 | | | | — | |
Unrealized depreciation on bilateral swap agreements (Note 2) | | | — | | | | 840,561 | | | | — | |
Payable for Fund shares redeemed | | | 155,411 | | | | 2,286,072 | | | | 799,943 | |
Unrealized depreciation on forward foreign currency contracts (Note 2) | | | — | | | | 4,104,643 | | | | — | |
Unamortized upfront premiums received on bilateral swap agreements (Note 2) | | | — | | | | 249,040 | | | | — | |
Foreign taxes payable (Note 2) | | | 6,202 | | | | — | | | | — | |
Due to brokers (Note 2) | | | — | | | | 1,260,000 | | | | — | |
Fees payable on swap agreements (Note 2) | | | — | | | | 20,252 | | | | — | |
Management fees payable (Note 6) | | | 53,268 | | | | 576,830 | | | | 641,270 | |
Deferred Trustees’ fees (Note 6) | | | 118,863 | | | | 116,447 | | | | 534,108 | |
Administrative fees payable (Note 6) | | | 5,324 | | | | 43,711 | | | | 37,954 | |
Payable to distributor (Note 6d) | | | 922 | | | | 8,361 | | | | 5,054 | |
Other accounts payable and accrued expenses | | | 86,689 | | | | 223,991 | | | | 157,787 | |
| | | | | | | | | | | | |
TOTAL LIABILITIES | | | 1,162,041 | | | | 278,395,448 | | | | 2,176,116 | |
| | | | | | | | | | | | |
NET ASSETS | | $ | 144,540,829 | | | $ | 1,152,597,101 | | | $ | 1,001,955,152 | |
| | | | | | | | | | | | |
See accompanying notes to financial statements.
71 |
Statements of Assets and Liabilities (continued)
December 31, 2017
| | | | | | | | | | | | |
| | | Loomis Sayles
Multi-Asset
Income Fund | | | Loomis Sayles
Strategic
Alpha Fund | | | Natixis U.S.
Equity
Opportunities
Fund | |
NET ASSETS CONSIST OF: | | | | | | | | | | | | |
Paid-in capital | | $ | 135,040,393 | | | $ | 1,222,472,922 | | | $ | 703,693,345 | |
Distributions in excess of net investment income | | | (160,386 | ) | | | (4,984,069 | ) | | | (534,108 | ) |
Accumulated net realized gain (loss) on investments, futures contracts, options written, swap agreements, forward foreign currency contracts and foreign currency transactions | | | 2,147,995 | | | | (52,008,689 | ) | | | 21,077,945 | |
Net unrealized appreciation (depreciation) on investments, futures contracts, options written, swap agreements, forward foreign currency contracts and foreign currency translations | | | 7,512,827 | | | | (12,883,063 | ) | | | 277,717,970 | |
| | | | | | | | | | | | |
NET ASSETS | | $ | 144,540,829 | | | $ | 1,152,597,101 | | | $ | 1,001,955,152 | |
| | | | | | | | | | | | |
COMPUTATION OF NET ASSET VALUE AND OFFERING PRICE: | | | | | | | | | | | | |
Class A shares: | | | | | | | | | | | | |
Net assets | | $ | 54,753,793 | | | $ | 28,019,509 | | | $ | 604,330,368 | |
| | | | | | | | | | | | |
Shares of beneficial interest | | | 3,946,366 | | | | 2,824,897 | | | | 16,377,956 | |
| | | | | | | | | | | | |
Net asset value and redemption price per share | | $ | 13.87 | | | $ | 9.92 | | | $ | 36.90 | |
| | | | | | | | | | | | |
Offering price per share (100/[100-maximum sales charge] of net asset value) (Note 1) | | $ | 14.49 | | | $ | 10.36 | | | $ | 39.15 | |
| | | | | | | | | | | | |
Class C shares: (redemption price per share is equal to net asset value less any applicable contingent deferred sales charge) (Note 1) | | | | | | | | | | | | |
Net assets | | $ | 36,814,290 | | | $ | 33,758,778 | | | $ | 112,615,143 | |
| | | | | | | | | | | | |
Shares of beneficial interest | | | 2,664,795 | | | | 3,418,497 | | | | 4,377,177 | |
| | | | | | | | | | | | |
Net asset value and offering price per share | | $ | 13.82 | | | $ | 9.88 | | | $ | 25.73 | |
| | | | | | | | | | | | |
Class N shares: | | | | | | | | | | | | |
Net assets | | $ | 35,038 | | | $ | 59,281,622 | | | $ | 1,169 | |
| | | | | | | | | | | | |
Shares of beneficial interest | | | 2,540 | | | | 5,990,973 | | | | 27 | |
| | | | | | | | | | | | |
Net asset value, offering and redemption price per share | | $ | 13.79 | | | $ | 9.90 | | | $ | 42.63 | * |
| | | | | | | | | | | | |
Class Y shares: | | | | | | | | | | | | |
Net assets | | $ | 52,937,708 | | | $ | 1,031,537,192 | | | $ | 285,008,472 | |
| | | | | | | | | | | | |
Shares of beneficial interest | | | 3,837,177 | | | | 104,245,823 | | | | 6,689,226 | |
| | | | | | | | | | | | |
Net asset value, offering and redemption price per share | | $ | 13.80 | | | $ | 9.90 | | | $ | 42.61 | |
| | | | | | | | | | | | |
| * | Net asset value calculations have been determined utilizing fractional share and penny amounts. |
See accompanying notes to financial statements.
| 72
Statements of Operations
For the Year Ended December 31, 2017
| | | | | | | | | | | | |
| | | Loomis Sayles
Multi-Asset
Income Fund | | | Loomis Sayles
Strategic
Alpha Fund | | | Natixis U.S.
Equity
Opportunities
Fund | |
INVESTMENT INCOME | | | | | | | | | | | | |
Dividends | | $ | 2,249,785 | | | $ | 3,358,077 | | | $ | 12,047,247 | |
Interest | | | 3,546,399 | | | | 49,340,034 | | | | 110,693 | |
Less net foreign taxes withheld | | | (54,559 | ) | | | (15,525 | ) | | | (190,038 | ) |
| | | | | | | | | | | | |
| | | 5,741,625 | | | | 52,682,586 | | | | 11,967,902 | |
| | | | | | | | | | | | |
Expenses | | | | | | | | | | | | |
Management fees (Note 6) | | | 732,509 | | | | 7,897,678 | | | | 6,770,989 | |
Service and distribution fees (Note 6) | | | 565,473 | | | | 554,301 | | | | 2,325,722 | |
Administrative fees (Note 6) | | | 59,310 | | | | 541,351 | | | | 390,154 | |
Trustees’ fees and expenses (Note 6) | | | 36,380 | | | | 61,127 | | | | 119,819 | |
Transfer agent fees and expenses (Note 6 and 7) | | | 90,434 | | | | 745,662 | | | | 724,475 | |
Audit and tax services fees | | | 49,091 | | | | 83,774 | | | | 42,748 | |
Custodian fees and expenses | | | 90,079 | | | | 201,529 | | | | 36,840 | |
Legal fees | | | 2,883 | | | | 26,755 | | | | 18,293 | |
Registration fees | | | 75,164 | | | | 97,020 | | | | 113,121 | |
Shareholder reporting expenses | | | 17,009 | | | | 145,740 | | | | 134,297 | |
Miscellaneous expenses (Note 8) | | | 17,336 | | | | 50,479 | | | | 31,925 | |
| | | | | | | | | | | | |
Total expenses | | | 1,735,668 | | | | 10,405,416 | | | | 10,708,383 | |
Less waiver and/or expense reimbursement (Note 6) | | | (237,473 | ) | | | (88,946 | ) | | | (92 | ) |
| | | | | | | | | | | | |
Net expenses | | | 1,498,195 | | | | 10,316,470 | | | | 10,708,291 | |
| | | | | | | | | | | | |
Net investment income | | | 4,243,430 | | | | 42,366,116 | | | | 1,259,611 | |
| | | | | | | | | | | | |
NET REALIZED AND UNREALIZED GAIN (LOSS) ON INVESTMENTS, FUTURES CONTRACTS, OPTIONS WRITTEN, SWAP AGREEMENTS, FORWARD FOREIGN CURRENCY CONTRACTS AND FOREIGN CURRENCY TRANSACTIONS | | | | | | | | | | | | |
Net realized gain (loss) on: | | | | | | | | | | | | |
Investments | | | 8,721,265 | | | | 14,059,494 | | | | 52,738,987 | |
Futures contracts | | | — | | | | (6,244,952 | ) | | | — | |
Options written | | | — | | | | (2,054,629 | ) | | | — | |
Swap agreements | | | — | | | | (5,747,745 | ) | | | — | |
Forward foreign currency contracts (Note 2d) | | | (74,337 | ) | | | (8,712,048 | ) | | | — | |
Foreign currency transactions (Note 2c) | | | (21,342 | ) | | | 553,958 | | | | — | |
Net change in unrealized appreciation (depreciation) on: | | | | | | | | | | | | |
Investments | | | 2,552,471 | | | | 10,284,555 | | | | 148,227,693 | |
Futures contracts | | | — | | | | (561,501 | ) | | | — | |
Options written | | | — | | | | 139,415 | | | | — | |
Swap agreements | | | — | | | | 1,923,124 | | | | — | |
Forward foreign currency contracts (Note 2d) | | | — | | | | (5,587,068 | ) | | | — | |
Foreign currency translations (Note 2c) | | | (459 | ) | | | 282,587 | | | | — | |
| | | | | | | | | | | | |
Net realized and unrealized gain (loss) on investments, futures contracts, options written, swap agreements, forward foreign currency contracts and foreign currency transactions | | | 11,177,598 | | | | (1,664,810 | ) | | | 200,966,680 | |
| | | | | | | | | | | | |
NET INCREASE IN NET ASSETS RESULTING FROM OPERATIONS | | $ | 15,421,028 | | | $ | 40,701,306 | | | $ | 202,226,291 | |
| | | | | | | | | | | | |
See accompanying notes to financial statements.
73 |
Statements of Changes in Net Assets
| | | | | | | | |
| | | Loomis Sayles Multi-Asset
Income Fund | |
| | | Year Ended
December 31,
2017 | | | Year Ended
December 31,
2016 | |
FROM OPERATIONS: | |
Net investment income | | $ | 4,243,430 | | | $ | 4,062,634 | |
Net realized gain on investments, forward foreign currency contracts and foreign currency transactions | | | 8,625,586 | | | | 3,661,490 | |
Net change in unrealized appreciation (depreciation) on investments and foreign currency translations | | | 2,552,012 | | | | 2,916,632 | |
| | | | | | | | |
Net increase in net assets resulting from operations | | | 15,421,028 | | | | 10,640,756 | |
| | | | | | | | |
FROM DISTRIBUTIONS TO SHAREHOLDERS: | |
Net investment income | | | | | | | | |
Class A | | | (2,006,749 | ) | | | (1,712,251 | ) |
Class C | | | (1,027,055 | ) | | | (1,054,549 | ) |
Class N | | | (1,118 | ) | | | (36 | ) |
Class Y | | | (1,113,225 | ) | | | (466,918 | ) |
Net realized capital gains | | | | | | | | |
Class A | | | (2,053,174 | ) | | | (2,049,190 | ) |
Class C | | | (1,374,969 | ) | | | (1,689,864 | ) |
Class N | | | (1,304 | ) | | | (41 | ) |
Class Y | | | (1,984,434 | ) | | | (730,396 | ) |
| | | | | | | | |
Total distributions | | | (9,562,028 | ) | | | (7,703,245 | ) |
| | | | | | | | |
NET INCREASE (DECREASE) IN NET ASSETS FROM CAPITAL SHARE TRANSACTIONS (NOTE 12) | | | 14,908,519 | | | | (1,482,318 | ) |
| | | | | | | | |
Net increase in net assets | | | 20,767,519 | | | | 1,455,193 | |
NET ASSETS | |
Beginning of the year | | | 123,773,310 | | | | 122,318,117 | |
| | | | | | | | |
End of the year | | $ | 144,540,829 | | | $ | 123,773,310 | |
| | | | | | | | |
DISTRIBUTIONS IN EXCESS OF NET INVESTMENT INCOME | | $ | (179,118 | ) | | $ | (459,511 | ) |
| | | | | | | | |
See accompanying notes to financial statements.
| 74
Statements of Changes in Net Assets (continued)
| | | | | | | | |
| | | Loomis Sayles Strategic
Alpha Fund | |
| | | Year Ended
December 31,
2017 | | | Year Ended
December 31,
2016 | |
FROM OPERATIONS: | | | | | | | | |
Net investment income | | $ | 42,366,116 | | | $ | 40,432,517 | |
Net realized loss on investments, futures contracts, options written, swap agreements, forward foreign currency contracts and foreign currency transactions | | | (8,145,922 | ) | | | (20,628,896 | ) |
Net change in unrealized appreciation (depreciation) on investments, futures contracts, options written, swap agreements and foreign currency translations | | | 6,481,112 | | | | 56,823,237 | |
| | | | | | | | |
Net increase in net assets resulting from operations | | | 40,701,306 | | | | 76,626,858 | |
| | | | | | | | |
FROM DISTRIBUTIONS TO SHAREHOLDERS: | | | | | | | | |
Net investment income | | | | | | | | |
Class A | | | (1,506,001 | ) | | | (1,492,404 | ) |
Class C | | | (713,500 | ) | | | (703,920 | ) |
Class N(a) | | | (744,780 | ) | | | — | |
Class Y | | | (31,576,383 | ) | | | (25,810,102 | ) |
| | | | | | | | |
Total distributions | | | (34,540,664 | ) | | | (28,006,426 | ) |
| | | | | | | | |
NET DECREASE IN NET ASSETS FROM CAPITAL SHARE TRANSACTIONS (NOTE 12) | | | (50,510,564 | ) | | | (213,904,671 | ) |
| | | | | | | | |
Net decrease in net assets | | | (44,349,922 | ) | | | (165,284,239 | ) |
NET ASSETS | | | | | | | | |
Beginning of the year | | | 1,196,947,023 | | | | 1,362,231,262 | |
| | | | | | | | |
End of the year | | $ | 1,152,597,101 | | | $ | 1,196,947,023 | |
| | | | | | | | |
DISTRIBUTIONS IN EXCESS OF NET INVESTMENT INCOME | | $ | (4,984,069 | ) | | $ | (1,669,570 | ) |
| | | | | | | | |
| (a) | From commencement of Class operations on May 1, 2017 through December 31, 2017. |
See accompanying notes to financial statements.
75 |
Statements of Changes in Net Assets (continued)
| | | | | | | | |
| | | Natixis U.S. Equity
Opportunities Fund | |
| | | Year Ended
December 31,
2017 | | | Year Ended
December 31,
2016 | |
FROM OPERATIONS: | | | | | | | | |
Net investment income | | $ | 1,259,611 | | | $ | 2,160,900 | |
Net realized gain on investments | | | 52,738,987 | | | | 7,563,829 | |
Net change in unrealized appreciation (depreciation) on investments | | | 148,227,693 | | | | 56,605,558 | |
| | | | | | | | |
Net increase in net assets resulting from operations | | | 202,226,291 | | | | 66,330,287 | |
| | | | | | | | |
FROM DISTRIBUTIONS TO SHAREHOLDERS: | | | | | | | | |
Net investment income | | | | | | | | |
Class A | | | (901,914 | ) | | | (1,829,987 | ) |
Class C | | | (6,490 | ) | | | (75,717 | ) |
Class N(a) | | | (4 | ) | | | — | |
Class Y | | | (920,407 | ) | | | (689,276 | ) |
Net realized capital gains | | | | | | | | |
Class A | | | (20,020,012 | ) | | | (6,990,778 | ) |
Class C | | | (5,199,648 | ) | | | (1,442,071 | ) |
Class N(a) | | | (31 | ) | | | — | |
Class Y | | | (8,004,252 | ) | | | (1,298,700 | ) |
| | | | | | | | |
Total distributions | | | (35,052,758 | ) | | | (12,326,529 | ) |
| | | | | | | | |
NET INCREASE IN NET ASSETS FROM CAPITAL SHARE TRANSACTIONS (NOTE 12) | | | 146,345,807 | | | | 79,688,302 | |
| | | | | | | | |
Net increase in net assets | | | 313,519,340 | | | | 133,692,060 | |
NET ASSETS | | | | | | | | |
Beginning of the year | | | 688,435,812 | | | | 554,743,752 | |
| | | | | | | | |
End of the year | | $ | 1,001,955,152 | | | $ | 688,435,812 | |
| | | | | | | | |
DISTRIBUTIONS IN EXCESS OF NET INVESTMENT INCOME | | $ | (534,108 | ) | | $ | (484,437 | ) |
| | | | | | | | |
| (a) | From commencement of Class operations on May 1, 2017 through December 31, 2017. |
See accompanying notes to financial statements.
| 76
Financial Highlights
For a share outstanding throughout each period.
| | | | | | | | | | | | | | | | | | | | |
| | |
Loomis Sayles Multi-Asset Income Fund—Class A | |
| | | Year Ended
December 31,
2017
| | | Year Ended
December 31,
2016
| | | Year Ended
December 31,
2015
| | | Year Ended
December 31,
2014
| | | Year Ended
December 31,
2013
| |
Net asset value, beginning of the period | | $ | 13.24 | | | $ | 12.85 | | | $ | 13.45 | | | $ | 12.21 | | | $ | 11.83 | |
| | | | | | | | | | | | | | | | | | | | |
INCOME (LOSS) FROM INVESTMENT OPERATIONS: | | | | | | | | | | | | | | | | | | | | |
Net investment income(a) | | | 0.47 | | | | 0.49 | | | | 0.32 | | | | 0.32 | | | | 0.29 | |
Net realized and unrealized gain (loss) | | | 1.15 | | | | 0.80 | | | | (0.58 | ) | | | 1.26 | | | | 0.40 | |
| | | | | | | | | | | | | | | | | | | | |
Total from Investment Operations | | | 1.62 | | | | 1.29 | | | | (0.26 | ) | | | 1.58 | | | | 0.69 | |
| | | | | | | | | | | | | | | | | | | | |
LESS DISTRIBUTIONS FROM: | | | | | | | | | | | | | | | | | | | | |
Net investment income | | | (0.45 | ) | | | (0.40 | ) | | | (0.34 | ) | | | (0.34 | ) | | | (0.31 | ) |
Net realized capital gains | | | (0.54 | ) | | | (0.50 | ) | | | — | | | | — | | | | — | |
| | | | | | | | | | | | | | | | | | | | |
Total Distributions | | | (0.99 | ) | | | (0.90 | ) | | | (0.34 | ) | | | (0.34 | ) | | | (0.31 | ) |
| | | | | | | | | | | | | | | | | | | | |
Net asset value, end of the period | | $ | 13.87 | | | $ | 13.24 | | | $ | 12.85 | | | $ | 13.45 | | | $ | 12.21 | |
| | | | | | | | | | | | | | | | | | | | |
Total return(b) | | | 12.41 | %(c) | | | 10.14 | %(c) | | | (1.96 | )%(c) | | | 13.08 | % | | | 5.84 | % |
RATIOS TO AVERAGE NET ASSETS: | | | | | | | | | | | | | | | | | | | | |
Net assets, end of the period (000’s) | | $ | 54,754 | | | $ | 57,320 | | | $ | 63,254 | | | $ | 110,874 | | | $ | 79,039 | |
Net expenses | | | 0.95 | %(d) | | | 0.95 | %(d) | | | 1.04 | %(d)(e) | | | 1.06 | % | | | 1.09 | % |
Gross expenses | | | 1.13 | % | | | 1.09 | % | | | 1.11 | % | | | 1.06 | % | | | 1.09 | % |
Net investment income | | | 3.37 | % | | | 3.70 | % | | | 2.40 | % | | | 2.46 | % | | | 2.34 | % |
Portfolio turnover rate | | | 221 | % | | | 341 | %(f) | | | 93 | %(g) | | | 41 | % | | | 41 | % |
| (a) | Per share net investment income has been calculated using the average shares outstanding during the period. |
| (b) | A sales charge for Class A shares is not reflected in total return calculations. |
| (c) | Had certain expenses not been waived/reimbursed during the period, total returns would have been lower. |
| (d) | The investment adviser agreed to waive its fees and/or reimburse a portion of the Fund’s expenses during the period. Without this waiver/reimbursement, expenses would have been higher. |
| (e) | Effective September 1, 2015, the expense limit decreased from 1.25% to 0.95%. |
| (f) | The variation in the Fund’s turnover rate from 2015 to 2016 was primarily due to a repositioning of the portfolio as well as sales of additional securities as a result of a change in investment strategy in 2015. |
| (g) | The variation in the Fund’s turnover rate from 2014 to 2015 was primarily due to a change in the investment strategy and management structure of the Fund. |
See accompanying notes to financial statements.
77 |
Financial Highlights (continued)
For a share outstanding throughout each period.
| | | | | | | | | | | | | | | | | | | | |
| | |
Loomis Sayles Multi-Asset Income Fund—Class C | |
| | | Year Ended
December 31,
2017
| | | Year Ended
December 31,
2016
| | | Year Ended
December 31,
2015
| | | Year Ended
December 31,
2014
| | | Year Ended
December 31,
2013
| |
Net asset value, beginning of the period | | $ | 13.18 | | | $ | 12.80 | | | $ | 13.41 | | | $ | 12.17 | | | $ | 11.80 | |
| | | | | | | | | | | | | | | | | | | | |
INCOME (LOSS) FROM INVESTMENT OPERATIONS: | | | | | | | | | | | | | | | | | | | | |
Net investment income(a) | | | 0.36 | | | | 0.39 | | | | 0.24 | | | | 0.22 | | | | 0.19 | |
Net realized and unrealized gain (loss) | | | 1.16 | | | | 0.79 | | | | (0.60 | ) | | | 1.27 | | | | 0.39 | |
| | | | | | | | | | | | | | | | | | | | |
Total from Investment Operations | | | 1.52 | | | | 1.18 | | | | (0.36 | ) | | | 1.49 | | | | 0.58 | |
| | | | | | | | | | | | | | | | | | | | |
LESS DISTRIBUTIONS FROM: | | | | | | | | | | | | | | | | | | | | |
Net investment income | | | (0.34 | ) | | | (0.30 | ) | | | (0.25 | ) | | | (0.25 | ) | | | (0.21 | ) |
Net realized capital gains | | | (0.54 | ) | | | (0.50 | ) | | | — | | | | — | | | | — | |
| | | | | | | | | | | | | | | | | | | | |
Total Distributions | | | (0.88 | ) | | | (0.80 | ) | | | (0.25 | ) | | | (0.25 | ) | | | (0.21 | ) |
| | | | | | | | | | | | | | | | | | | | |
Net asset value, end of the period | | $ | 13.82 | | | $ | 13.18 | | | $ | 12.80 | | | $ | 13.41 | | | $ | 12.17 | |
| | | | | | | | | | | | | | | | | | | | |
Total return(b) | | | 11.70 | %(c) | | | 9.27 | %(c) | | | (2.73 | )%(c) | | | 12.28 | % | | | 4.98 | % |
RATIOS TO AVERAGE NET ASSETS: | | | | | | | | | | | | | | | | | | | | |
Net assets, end of the period (000’s) | | $ | 36,814 | | | $ | 46,351 | | | $ | 47,791 | | | $ | 53,074 | | | $ | 48,512 | |
Net expenses | | | 1.70 | %(d) | | | 1.70 | %(d) | | | 1.80 | %(d)(e) | | | 1.81 | % | | | 1.84 | % |
Gross expenses | | | 1.88 | % | | | 1.84 | % | | | 1.87 | % | | | 1.81 | % | | | 1.84 | % |
Net investment income | | | 2.65 | % | | | 2.96 | % | | | 1.78 | % | | | 1.70 | % | | | 1.59 | % |
Portfolio turnover rate | | | 221 | % | | | 341 | %(f) | | | 93 | %(g) | | | 41 | % | | | 41 | % |
| (a) | Per share net investment income has been calculated using the average shares outstanding during the period. |
| (b) | A contingent deferred sales charge for Class C shares is not reflected in total return calculations. |
| (c) | Had certain expenses not been waived/reimbursed during the period, total returns would have been lower. |
| (d) | The investment adviser agreed to waive its fees and/or reimburse a portion of the Fund’s expenses during the period. Without this waiver/reimbursement, expenses would have been higher. |
| (e) | Effective September 1, 2015, the expense limit decreased from 2.00% to 1.70%. |
| (f) | The variation in the Fund’s turnover rate from 2015 to 2016 was primarily due to a repositioning of the portfolio as well as sales of additional securities as a result of a change in investment strategy in 2015. |
| (g) | The variation in the Fund’s turnover rate from 2014 to 2015 was primarily due to a change in the investment strategy and management structure of the Fund. |
See accompanying notes to financial statements.
| 78
Financial Highlights (continued)
For a share outstanding throughout each period.
| | | | | | | | | | | | |
| | |
Loomis Sayles Multi-Asset Income Fund—Class N | |
| | | Year Ended
December 31,
2017
| | | Year Ended
December 31,
2016
| | | Period Ended
December 31,
2015*
| |
Net asset value, beginning of the period | | $ | 13.16 | | | $ | 12.77 | | | $ | 12.70 | |
| | | | | | | | | | | | |
INCOME (LOSS) FROM INVESTMENT OPERATIONS: | |
Net investment income(a) | | | 0.51 | | | | 0.53 | | | | 0.14 | |
Net realized and unrealized gain (loss) | | | 1.15 | | | | 0.80 | | | | 0.10 | |
| | | | | | | | | | | | |
Total from Investment Operations | | | 1.66 | | | | 1.33 | | | | 0.24 | |
| | | | | | | | | | | | |
LESS DISTRIBUTIONS FROM: | |
Net investment income | | | (0.49 | ) | | | (0.44 | ) | | | (0.17 | ) |
Net realized capital gains | | | (0.54 | ) | | | (0.50 | ) | | | — | |
| | | | | | | | | | | | |
Total Distributions | | | (1.03 | ) | | | (0.94 | ) | | | (0.17 | ) |
| | | | | | | | | | | | |
Net asset value, end of the period | | $ | 13.79 | | | $ | 13.16 | | | $ | 12.77 | |
| | | | | | | | | | | | |
Total return(b) | | | 12.83 | % | | | 10.53 | % | | | 1.91 | %(c) |
RATIOS TO AVERAGE NET ASSETS: | |
Net assets, end of the period (000’s) | | $ | 35 | | | $ | 1 | | | $ | 1 | |
Net expenses(d) | | | 0.65 | % | | | 0.65 | % | | | 0.65 | %(e) |
Gross expenses | | | 1.35 | % | | | 13.53 | % | | | 13.66 | %(e) |
Net investment income | | | 3.71 | % | | | 4.02 | % | | | 3.22 | %(e) |
Portfolio turnover rate | | | 221 | % | | | 341 | %(f) | | | 93 | % |
| * | From commencement of Class operations on August 31, 2015 through December 31, 2015 for Class N shares. |
| (a) | Per share net investment income has been calculated using the average shares outstanding during the period. |
| (b) | Had certain expenses not been waived/reimbursed during the period, total returns would have been lower. |
| (c) | Periods less than one year are not annualized. |
| (d) | The investment adviser agreed to waive its fees and/or reimburse a portion of the Fund’s expenses during the period. Without this waiver/reimbursement, expenses would have been higher. |
| (e) | Computed on an annualized basis for periods less than one year. |
| (f) | The variation in the Fund’s turnover rate from 2015 to 2016 was primarily due to a repositioning of the portfolio as well as sales of additional securities as a result of a change in investment strategy in 2015. |
See accompanying notes to financial statements.
79 |
Financial Highlights (continued)
For a share outstanding throughout each period.
| | | | | | | | | | | | | | | | | | | | |
| | |
Loomis Sayles Multi-Asset Income Fund—Class Y | |
| | | Year Ended
December 31,
2017
| | | Year Ended
December 31,
2016
| | | Year Ended
December 31,
2015
| | | Year Ended
December 31,
2014
| | | Year Ended
December 31,
2013
| |
Net asset value, beginning of the period | | $ | 13.17 | | | $ | 12.79 | | | $ | 13.39 | | | $ | 12.19 | | | $ | 11.83 | |
| | | | | | | | | | | | | | | | | | | | |
INCOME (LOSS) FROM INVESTMENT OPERATIONS: | | | | | | | | | | | | | | | | | | | | |
Net investment income(a) | | | 0.49 | | | | 0.53 | | | | 0.36 | | | | 0.38 | | | | 0.33 | |
Net realized and unrealized gain (loss) | | | 1.16 | | | | 0.78 | | | | (0.59 | ) | | | 1.19 | | | | 0.37 | |
| | | | | | | | | | | | | | | | | | | | |
Total from Investment Operations | | | 1.65 | | | | 1.31 | | | | (0.23 | ) | | | 1.57 | | | | 0.70 | |
| | | | | | | | | | | | | | | | | | | | |
LESS DISTRIBUTIONS FROM: | | | | | | | | | | | | | | | | | | | | |
Net investment income | | | (0.48 | ) | | | (0.43 | ) | | | (0.37 | ) | | | (0.37 | ) | | | (0.34 | ) |
Net realized capital gains | | | (0.54 | ) | | | (0.50 | ) | | | — | | | | — | | | | — | |
| | | | | | | | | | | | | | | | | | | | |
Total Distributions | | | (1.02 | ) | | | (0.93 | ) | | | (0.37 | ) | | | (0.37 | ) | | | (0.34 | ) |
| | | | | | | | | | | | | | | | | | | | |
Net asset value, end of the period | | $ | 13.80 | | | $ | 13.17 | | | $ | 12.79 | | | $ | 13.39 | | | $ | 12.19 | |
| | | | | | | | | | | | | | | | | | | | |
Total return | | | 12.77 | %(b) | | | 10.38 | %(b) | | | (1.72 | )%(b) | | | 13.05 | % | | | 5.93 | % |
RATIOS TO AVERAGE NET ASSETS: | | | | | | | | | | | | | | | | | | | | |
Net assets, end of the period (000’s) | | $ | 52,938 | | | $ | 20,101 | | | $ | 11,272 | | | $ | 14,428 | | | $ | 628 | |
Net expenses | | | 0.70 | %(c) | | | 0.70 | %(c) | | | 0.80 | %(c)(d) | | | 0.82 | % | | | 0.83 | % |
Gross expenses | | | 0.88 | % | | | 0.84 | % | | | 0.86 | % | | | 0.82 | % | | | 0.83 | % |
Net investment income | | | 3.53 | % | | | 4.00 | % | | | 2.73 | % | | | 2.92 | % | | | 2.71 | % |
Portfolio turnover rate | | | 221 | % | | | 341 | %(e) | | | 93 | %(f) | | | 41 | % | | | 41 | % |
| (a) | Per share net investment income has been calculated using the average shares outstanding during the period. |
| (b) | Had certain expenses not been waived/reimbursed during the period, total returns would have been lower. |
| (c) | The investment adviser agreed to waive its fees and/or reimburse a portion of the Fund’s expenses during the period. Without this waiver/reimbursement, expenses would have been higher. |
| (d) | Effective September 1, 2015, the expense limit decreased from 1.00% to 0.70%. |
| (e) | The variation in the Fund’s turnover rate from 2015 to 2016 was primarily due to a repositioning of the portfolio as well as sales of additional securities as a result of a change in investment strategy in 2015. |
| (f) | The variation in the Fund’s turnover rate from 2014 to 2015 was primarily due to a change in the investment strategy and management structure of the Fund. |
See accompanying notes to financial statements.
| 80
Financial Highlights (continued)
For a share outstanding throughout each period.
| | | | | | | | | | | | | | | | | | | | |
| | |
Loomis Sayles Strategic Alpha Fund—Class A | |
| | | Year Ended
December 31,
2017
| | | Year Ended
December 31,
2016
| | | Year Ended
December 31,
2015
| | | Year Ended
December 31,
2014
| | | Year Ended
December 31,
2013
| |
Net asset value, beginning of the period | | $ | 9.86 | | | $ | 9.45 | | | $ | 9.96 | | | $ | 10.06 | | | $ | 10.20 | |
| | | | | | | | | | | | | | | | | | | | |
INCOME (LOSS) FROM INVESTMENT OPERATIONS: | | | | | | | | | | | | | | | | | | | | |
Net investment income(a) | | | 0.32 | | | | 0.30 | | | | 0.26 | | | | 0.29 | (b) | | | 0.37 | |
Net realized and unrealized gain (loss) | | | (0.01 | ) | | | 0.31 | | | | (0.42 | ) | | | (0.07 | ) | | | (0.28 | ) |
| | | | | | | | | | | | | | | | | | | | |
Total from Investment Operations | | | 0.31 | | | | 0.61 | | | | (0.16 | ) | | | 0.22 | | | | 0.09 | |
| | | | | | | | | | | | | | | | | | | | |
LESS DISTRIBUTIONS FROM: | | | | | | | | | | | | | | | | | | | | |
Net investment income | | | (0.25 | ) | | | (0.20 | ) | | | (0.35 | ) | | | (0.32 | ) | | | (0.23 | ) |
| | | | | | | | | | | | | | | | | | | | |
Net asset value, end of the period | | $ | 9.92 | | | $ | 9.86 | | | $ | 9.45 | | | $ | 9.96 | | | $ | 10.06 | |
| | | | | | | | | | | | | | | | | | | | |
Total return(c) | | | 3.22 | %(d)(h) | | | 6.57 | % | | | (1.68 | )% | | | 2.24 | %(b) | | | 0.96 | % |
RATIOS TO AVERAGE NET ASSETS: | | | | | | | | | | | | | | | | | | | | |
Net assets, end of the period (000’s) | | $ | 28,020 | | | $ | 67,746 | | | $ | 116,055 | | | $ | 104,056 | | | $ | 177,339 | |
Net expenses | | | 1.05 | %(e)(f) | | | 1.10 | % | | | 1.10 | % | | | 1.10 | % | | | 1.11 | % |
Gross expenses | | | 1.06 | % | | | 1.10 | % | | | 1.10 | % | | | 1.10 | % | | | 1.11 | % |
Net investment income | | | 3.26 | % | | | 3.14 | % | | | 2.66 | % | | | 2.90 | %(b) | | | 3.68 | % |
Portfolio turnover rate | | | 178 | %(g) | | | 72 | % | | | 72 | % | | | 87 | % | | | 115 | % |
| (a) | Per share net investment income has been calculated using the average shares outstanding during the period. |
| (b) | Includes a non-recurring dividend. Without this dividend, net investment income per share would have been $0.28, total return would have been 2.14% and the ratio of net investment income to average net assets would have been 2.81%. |
| (c) | A sales charge for Class A shares is not reflected in total return calculations. |
| (d) | Had certain expenses not been waived/reimbursed during the period, total returns would have been lower. |
| (e) | The investment adviser agreed to waive its fees and/or reimburse a portion of the Fund’s expenses during the period. Without this waiver/reimbursement, expenses would have been higher. |
| (f) | Effective July 1, 2017, the expense limit decreased from 1.30% to 1.00%. |
| (g) | The variation in the Fund’s turnover rate from 2016 to 2017 was primarily due to a repositioning of the portfolio. |
| (h) | Generally accepted accounting principles require adjustments to be made to the net assets of the Fund at period end for financial reporting purposes only, and as such, the total returns based on the adjusted net asset values per share may differ from the total returns reported in the average annual total return table. |
See accompanying notes to financial statements.
81 |
Financial Highlights (continued)
For a share outstanding throughout each period.
| | | | | | | | | | | | | | | | | | | | |
| | |
Loomis Sayles Strategic Alpha Fund—Class C | |
| | | Year Ended
December 31,
2017
| | | Year Ended
December 31,
2016
| | | Year Ended
December 31,
2015
| | | Year Ended
December 31,
2014
| | | Year Ended
December 31,
2013
| |
Net asset value, beginning of the period | | $ | 9.82 | | | $ | 9.42 | | | $ | 9.93 | | | $ | 10.03 | | | $ | 10.16 | |
| | | | | | | | | | | | | | | | | | | | |
INCOME (LOSS) FROM INVESTMENT OPERATIONS: | | | | | | | | | | | | | | | | | | | | |
Net investment income(a) | | | 0.25 | | | | 0.23 | | | | 0.19 | | | | 0.21 | (b) | | | 0.30 | |
Net realized and unrealized gain (loss) | | | 0.00 | (c)(d) | | | 0.30 | | | | (0.43 | ) | | | (0.06 | ) | | | (0.28 | ) |
| | | | | | | | | | | | | | | | | | | | |
Total from Investment Operations | | | 0.25 | | | | 0.53 | | | | (0.24 | ) | | | 0.15 | | | | 0.02 | |
| | | | | | | | | | | | | | | | | | | | |
LESS DISTRIBUTIONS FROM: | | | | | | | | | | | | | | | | | | | | |
Net investment income | | | (0.19 | ) | | | (0.13 | ) | | | (0.27 | ) | | | (0.25 | ) | | | (0.15 | ) |
| | | | | | | | | | | | | | | | | | | | |
Net asset value, end of the period | | $ | 9.88 | | | $ | 9.82 | | | $ | 9.42 | | | $ | 9.93 | | | $ | 10.03 | |
| | | | | | | | | | | | | | | | | | | | |
Total return(e) | | | 2.53 | %(h) | | | 5.70 | % | | | (2.44 | )% | | | 1.47 | %(b) | | | 0.22 | % |
RATIOS TO AVERAGE NET ASSETS: | | | | | | | | | | | | | | | | | | | | |
Net assets, end of the period (000’s) | | $ | 33,759 | | | $ | 45,674 | | | $ | 62,453 | | | $ | 71,215 | | | $ | 91,694 | |
Net expenses | | | 1.81 | %(f) | | | 1.85 | % | | | 1.85 | % | | | 1.85 | % | | | 1.86 | % |
Gross expenses | | | 1.81 | % | | | 1.85 | % | | | 1.85 | % | | | 1.85 | % | | | 1.86 | % |
Net investment income | | | 2.52 | % | | | 2.40 | % | | | 1.91 | % | | | 2.13 | %(b) | | | 2.96 | % |
Portfolio turnover rate | | | 178 | %(g) | | | 72 | % | | | 72 | % | | | 87 | % | | | 115 | % |
| (a) | Per share net investment income has been calculated using the average shares outstanding during the period. |
| (b) | Includes a non-recurring dividend. Without this dividend, net investment income per share would have been $0.21, total return would have been 1.37% and the ratio of net investment income to average net assets would have been 2.05%. |
| (c) | Amount rounds to less than $0.01 per share. |
| (d) | The amount shown for a share outstanding does not correspond with the aggregate realized and unrealized gain (loss) on investments for the period due to the timing of sales and redemptions of fund shares in relation to fluctuating market values of investments of the Fund. |
| (e) | A contingent deferred sales charge for Class C shares is not reflected in total return calculations. |
| (f) | Effective July 1, 2017, the expense limit decreased from 2.05% to 1.75%. |
| (g) | The variation in the Fund’s turnover rate from 2016 to 2017 was primarily due to a repositioning of the portfolio. |
| (h) | Generally accepted accounting principles require adjustments to be made to the net assets of the Fund at period end for financial reporting purposes only, and as such, the total returns based on the adjusted net asset values per share may differ from the total returns reported in the average annual total return table. |
See accompanying notes to financial statements.
| 82
Financial Highlights (continued)
For a share outstanding throughout each period.
| | | | |
| | | Loomis Sayles
Strategic Alpha
Fund—Class N | |
| | | Period Ended
December 31,
2017*
| |
Net asset value, beginning of the period | | $ | 9.90 | |
| | | | |
INCOME (LOSS) FROM INVESTMENT OPERATIONS: | |
Net investment income(a) | | | 0.25 | |
Net realized and unrealized gain (loss) | | | (0.04 | ) |
| | | | |
Total from Investment Operations | | | 0.21 | |
| | | | |
LESS DISTRIBUTIONS FROM: | |
Net investment income | | | (0.21 | ) |
| | | | |
Net asset value, end of the period | | $ | 9.90 | |
| | | | |
Total return(b)(c) | | | 2.11 | %(h) |
RATIOS TO AVERAGE NET ASSETS: | |
Net assets, end of the period (000’s) | | $ | 59,282 | |
Net expenses(d)(e)(f) | | | 0.70 | % |
Gross expenses(d) | | | 0.72 | % |
Net investment income(d) | | | 3.83 | % |
Portfolio turnover rate(g) | | | 178 | % |
| * | From commencement of Class operations on May 1, 2017 through December 31, 2017. |
| (a) | Per share net investment income has been calculated using the average shares outstanding during the period. |
| (b) | Had certain expenses not been waived/reimbursed during the period, total returns would have been lower. |
| (c) | Periods less than one year are not annualized. |
| (d) | Computed on an annualized basis for periods less than one year. |
| (e) | The investment adviser agreed to waive its fees and/or reimburse a portion of the Fund’s expenses during the period. Without this waiver/reimbursement, expenses would have been higher. |
| (f) | Effective July 1, 2017, the expense limit decreased from 1.00% to 0.70%. |
| (g) | Represents the Fund’s portfolio turnover rate for the year ended December 31, 2017. |
| (h) | Generally accepted accounting principles require adjustments to be made to the net assets of the Fund at period end for financial reporting purposes only, and as such, the total returns based on the adjusted net asset values per share may differ from the total returns reported in the average annual total return table. |
See accompanying notes to financial statements.
83 |
Financial Highlights (continued)
For a share outstanding throughout each period.
| | | | | | | | | | | | | | | | | | | | |
| | |
Loomis Sayles Strategic Alpha Fund—Class Y | |
| | | Year Ended
December 31,
2017
| | | Year Ended
December 31,
2016
| | | Year Ended
December 31,
2015
| | | Year Ended
December 31,
2014
| | | Year Ended
December 31,
2013
| |
Net asset value, beginning of the period | | $ | 9.85 | | | $ | 9.44 | | | $ | 9.95 | | | $ | 10.05 | | | $ | 10.19 | |
| | | | | | | | | | | | | | | | | | | | |
INCOME (LOSS) FROM INVESTMENT OPERATIONS: | | | | | | | | | | | | | | | | | | | | |
Net investment income(a) | | | 0.35 | | | | 0.32 | | | | 0.29 | | | | 0.31 | (b) | | | 0.40 | |
Net realized and unrealized gain (loss) | | | (0.01 | ) | | | 0.32 | | | | (0.43 | ) | | | (0.06 | ) | | | (0.29 | ) |
| | | | | | | | | | | | | | | | | | | | |
Total from Investment Operations | | | 0.34 | | | | 0.64 | | | | (0.14 | ) | | | 0.25 | | | | 0.11 | |
| | | | | | | | | | | | | | | | | | | | |
LESS DISTRIBUTIONS FROM: | | | | | | | | | | | | | | | | | | | | |
Net investment income | | | (0.29 | ) | | | (0.23 | ) | | | (0.37 | ) | | | (0.35 | ) | | | (0.25 | ) |
| | | | | | | | | | | | | | | | | | | | |
Net asset value, end of the period | | $ | 9.90 | | | $ | 9.85 | | | $ | 9.44 | | | $ | 9.95 | | | $ | 10.05 | |
| | | | | | | | | | | | | | | | | | | | |
Total return | | | 3.48 | %(c)(g) | | | 6.86 | % | | | (1.43 | )% | | | 2.52 | %(b) | | | 1.19 | % |
RATIOS TO AVERAGE NET ASSETS: | | | | | | | | | | | | | | | | | | | | |
Net assets, end of the period (000’s) | | $ | 1,031,537 | | | $ | 1,083,527 | | | $ | 1,183,723 | | | $ | 1,188,605 | | | $ | 970,539 | |
Net expenses | | | 0.80 | %(d)(e) | | | 0.85 | % | | | 0.85 | % | | | 0.85 | % | | | 0.86 | % |
Gross expenses | | | 0.81 | % | | | 0.85 | % | | | 0.85 | % | | | 0.85 | % | | | 0.86 | % |
Net investment income | | | 3.53 | % | | | 3.39 | % | | | 2.91 | % | | | 3.10 | %(b) | | | 3.92 | % |
Portfolio turnover rate | | | 178 | %(f) | | | 72 | % | | | 72 | % | | | 87 | % | | | 115 | % |
| (a) | Per share net investment income has been calculated using the average shares outstanding during the period. |
| (b) | Includes a non-recurring dividend. Without this dividend, net investment income per share would have been $0.31, total return would have been 2.42% and the ratio of net investment income to average net assets would have been 3.03%. |
| (c) | Had certain expenses not been waived/reimbursed during the period, total returns would have been lower. |
| (d) | The investment adviser agreed to waive its fees and/or reimburse a portion of the Fund’s expenses during the period. Without this waiver/reimbursement, expenses would have been higher. |
| (e) | Effective July 1, 2017, the expense limit decreased from 1.05% to 0.75%. |
| (f) | The variation in the Fund’s turnover rate from 2016 to 2017 was primarily due to a repositioning of the portfolio. |
| (g) | Generally accepted accounting principles require adjustments to be made to the net assets of the Fund at period end for financial reporting purposes only, and as such, the total returns based on the adjusted net asset values per share may differ from the total returns reported in the average annual total return table. |
See accompanying notes to financial statements.
| 84
Financial Highlights (continued)
For a share outstanding throughout each period.
| | | | | | | | | | | | | | | | | | | | |
| | |
Natixis U.S. Equity Opportunities Fund—Class A | |
| | | Year Ended
December 31,
2017
| | | Year Ended
December 31,
2016
| | | Year Ended
December 31,
2015
| | | Year Ended
December 31,
2014
| | | Year Ended
December 31,
2013
| |
Net asset value, beginning of the period | | $ | 30.27 | | | $ | 27.60 | | | $ | 27.40 | | | $ | 33.07 | | | $ | 26.35 | |
| | | | | | | | | | | | | | | | | | | | |
INCOME (LOSS) FROM INVESTMENT OPERATIONS: | | | | | | | | | | | | | | | | | | | | |
Net investment income (loss)(a) | | | 0.06 | | | | 0.12 | | | | 0.06 | | | | 0.02 | | | | (0.04 | ) |
Net realized and unrealized gain (loss) | | | 7.88 | | | | 3.12 | | | | 1.55 | | | | 4.31 | | | | 9.34 | |
| | | | | | | | | | | | | | | | | | | | |
Total from Investment Operations | | | 7.94 | | | | 3.24 | | | | 1.61 | | | | 4.33 | | | | 9.30 | |
| | | | | | | | | | | | | | | | | | | | |
LESS DISTRIBUTIONS FROM: | | | | | | | | | | | | | | | | | | | | |
Net investment income | | | (0.06 | ) | | | (0.12 | ) | | | — | | | | — | | | | — | |
Net realized capital gains | | | (1.25 | ) | | | (0.45 | ) | | | (1.41 | ) | | | (10.00 | ) | | | (2.58 | ) |
| | | | | | | | | | | | | | | | | | | | |
Total Distributions | | | (1.31 | ) | | | (0.57 | ) | | | (1.41 | ) | | | (10.00 | ) | | | (2.58 | ) |
| | | | | | | | | | | | | | | | | | | | |
Net asset value, end of the period | | $ | 36.90 | | | $ | 30.27 | | | $ | 27.60 | | | $ | 27.40 | | | $ | 33.07 | |
| | | | | | | | | | | | | | | | | | | | |
Total return(b) | | | 26.28 | % | | | 11.86 | % | | | 5.86 | % | | | 12.94 | % | | | 35.75 | %(c) |
RATIOS TO AVERAGE NET ASSETS: | | | | | | | | | | | | | | | | | | | | |
Net assets, end of the period (000’s) | | $ | 604,330 | | | $ | 472,436 | | | $ | 422,069 | | | $ | 400,678 | | | $ | 371,102 | |
Net expenses | | | 1.21 | %(d) | | | 1.23 | %(e) | | | 1.25 | %(f) | | | 1.29 | %(g) | | | 1.30 | %(h) |
Gross expenses | | | 1.21 | % | | | 1.23 | %(e) | | | 1.25 | % | | | 1.29 | %(g) | | | 1.32 | % |
Net investment income (loss) | | | 0.16 | % | | | 0.42 | % | | | 0.21 | % | | | 0.07 | % | | | (0.12 | )% |
Portfolio turnover rate | | | 17 | % | | | 17 | % | | | 20 | % | | | 93 | %(i) | | | 50 | % |
| (a) | Per share net investment income (loss) has been calculated using the average shares outstanding during the period. |
| (b) | A sales charge for Class A shares is not reflected in total return calculations. |
| (c) | Had certain expenses not been waived/reimbursed during the period, total returns would have been lower. |
| (d) | Effective July 1, 2017, the expense limit decreased from 1.25% to 1.20%. |
| (e) | Includes fee/expense recovery of less than 0.01%. |
| (f) | Effective July 1, 2015, the expense limit decreased from 1.30% to 1.25%. |
| (g) | Includes fee/expense recovery of 0.02%. |
| (h) | The investment adviser agreed to waive its fees and/or reimburse a portion of the Fund’s expenses during the period. Without this waiver/reimbursement, expenses would have been higher. |
| (i) | The variation in the Fund’s turnover rate from 2013 to 2014 was primarily due to the change in the structure of the Fund from four segments to two segments. |
See accompanying notes to financial statements.
85 |
Financial Highlights (continued)
For a share outstanding throughout each period.
| | | | | | | | | | | | | | | | | | | | |
| | |
Natixis U.S. Equity Opportunities Fund—Class C | |
| | | Year Ended
December 31,
2017
| | | Year Ended
December 31,
2016
| | | Year Ended
December 31,
2015
| | | Year Ended
December 31,
2014
| | | Year Ended
December 31,
2013
| |
Net asset value, beginning of the period | | $ | 21.54 | | | $ | 19.86 | | | $ | 20.24 | | | $ | 26.92 | | | $ | 21.99 | |
| | | | | | | | | | | | | | | | | | | | |
INCOME (LOSS) FROM INVESTMENT OPERATIONS: | | | | | | | | | | | | | | | | | | | | |
Net investment loss(a) | | | (0.14 | ) | | | (0.07 | ) | | | (0.11 | ) | | | (0.19 | ) | | | (0.22 | ) |
Net realized and unrealized gain (loss) | | | 5.58 | | | | 2.22 | | | | 1.14 | | | | 3.51 | | | | 7.73 | |
| | | | | | | | | | | | | | | | | | | | |
Total from Investment Operations | | | 5.44 | | | | 2.15 | | | | 1.03 | | | | 3.32 | | | | 7.51 | |
| | | | | | | | | | | | | | | | | | | | |
LESS DISTRIBUTIONS FROM: | | | | | | | | | | | | | | | | | | | | |
Net investment income | | | (0.00 | )(b) | | | (0.02 | ) | | | — | | | | — | | | | — | |
Net realized capital gains | | | (1.25 | ) | | | (0.45 | ) | | | (1.41 | ) | | | (10.00 | ) | | | (2.58 | ) |
| | | | | | | | | | | | | | | | | | | | |
Total Distributions | | | (1.25 | ) | | | (0.47 | ) | | | (1.41 | ) | | | (10.00 | ) | | | (2.58 | ) |
| | | | | | | | | | | | | | | | | | | | |
Net asset value, end of the period | | $ | 25.73 | | | $ | 21.54 | | | $ | 19.86 | | | $ | 20.24 | | | $ | 26.92 | |
| | | | | | | | | | | | | | | | | | | | |
Total return(c) | | | 25.35 | % | | | 11.02 | % | | | 5.06 | % | | | 12.12 | % | | | 34.69 | %(d) |
RATIOS TO AVERAGE NET ASSETS: | | | | | | | | | | | | | | | | | | | | |
Net assets, end of the period (000’s) | | $ | 112,615 | | | $ | 72,768 | | | $ | 61,864 | | | $ | 53,925 | | | $ | 44,150 | |
Net expenses | | | 1.96 | %(e) | | | 1.98 | %(f) | | | 2.00 | %(g) | | | 2.04 | %(h) | | | 2.05 | %(i) |
Gross expenses | | | 1.96 | % | | | 1.98 | %(f) | | | 2.00 | % | | | 2.04 | %(h) | | | 2.07 | % |
Net investment loss | | | (0.59 | )% | | | (0.33 | )% | | | (0.54 | )% | | | (0.68 | )% | | | (0.86 | )% |
Portfolio turnover rate | | | 17 | % | | | 17 | % | | | 20 | % | | | 93 | %(j) | | | 50 | % |
| (a) | Per share net investment loss has been calculated using the average shares outstanding during the period. |
| (b) | Amount rounds to less than $0.01 per share. |
| (c) | A contingent deferred sales charge for Class C shares is not reflected in total return calculations. |
| (d) | Had certain expenses not been waived/reimbursed during the period, total returns would have been lower. |
| (e) | Effective July 1, 2017, the expense limit decreased from 2.00% to 1.95%. |
| (f) | Includes fee/expense recovery of less than 0.01%. |
| (g) | Effective July 1, 2015, the expense limit decreased from 2.05% to 2.00%. |
| (h) | Includes fee/expense recovery of 0.01%. |
| (i) | The investment adviser agreed to waive its fees and/or reimburse a portion of the Fund’s expenses during the period. Without this waiver/reimbursement, expenses would have been higher. |
| (j) | The variation in the Fund’s turnover rate from 2013 to 2014 was primarily due to the change in the structure of the Fund from four segments to two segments. |
See accompanying notes to financial statements.
| 86
Financial Highlights (continued)
For a share outstanding throughout each period.
| | | | |
| | | Natixis U.S. Equity
Opportunities
Fund—Class N | |
| | | Period Ended
December 31,
2017*
| |
Net asset value, beginning of the period | | $ | 37.62 | |
| | | | |
INCOME (LOSS) FROM INVESTMENT OPERATIONS: | |
Net investment income(a) | | | 0.12 | |
Net realized and unrealized gain (loss) | | | 6.20 | |
| | | | |
Total from Investment Operations | | | 6.32 | |
| | | | |
LESS DISTRIBUTIONS FROM: | |
Net investment income | | | (0.16 | ) |
Net realized capital gains | | | (1.15 | ) |
| | | | |
Total Distributions | | | (1.31 | ) |
| | | | |
Net asset value, end of the period | | $ | 42.63 | |
| | | | |
Total return(b)(c) | | | 16.78 | % |
RATIOS TO AVERAGE NET ASSETS: | |
Net assets, end of the period (000’s) | | $ | 1 | |
Net expenses(d)(e)(f) | | | 0.78 | % |
Gross expenses(f) | | | 13.41 | % |
Net investment income(f) | | | 0.44 | % |
Portfolio turnover rate(g) | | | 17 | % |
| * | From commencement of Class operations on May 1, 2017 through December 31, 2017. |
| (a) | Per share net investment income (loss) has been calculated using the average shares outstanding during the period. |
| (b) | Had certain expenses not been waived/reimbursed during the period, total returns would have been lower. |
| (c) | Periods less than one year are not annualized. |
| (d) | Effective July 1, 2017, the expense limit decreased from 0.95% to 0.90%. |
| (e) | The investment adviser agreed to waive its fees and/or reimburse a portion of the Fund’s expenses during the period. Without this waiver/reimbursement, expenses would have been higher. |
| (f) | Computed on an annualized basis for periods less than one year. |
| (g) | Represents the Fund’s portfolio turnover rate for the year ended December 31, 2017. |
See accompanying notes to financial statements.
87 |
Financial Highlights (continued)
For a share outstanding throughout each period.
| | | | | | | | | | | | | | | | | | | | |
| | |
Natixis U.S. Equity Opportunities Fund—Class Y | |
| | | Year Ended
December 31,
2017
| | | Year Ended
December 31,
2016
| | | Year Ended
December 31,
2015
| | | Year Ended
December 31,
2014
| | | Year Ended
December 31,
2013
| |
Net asset value, beginning of the period | | $ | 34.77 | | | $ | 31.61 | | | $ | 31.18 | | | $ | 36.32 | | | $ | 28.68 | |
| | | | | | | | | | | | | | | | | | | | |
INCOME (LOSS) FROM INVESTMENT OPERATIONS: | | | | | | | | | | | | | | | | | | | | |
Net investment income(a) | | | 0.16 | | | | 0.21 | | | | 0.15 | | | | 0.12 | | | | 0.05 | |
Net realized and unrealized gain (loss) | | | 9.07 | | | | 3.59 | | | | 1.76 | | | | 4.74 | | | | 10.17 | |
| | | | | | | | | | | | | | | | | | | | |
Total from Investment Operations | | | 9.23 | | | | 3.80 | | | | 1.91 | | | | 4.86 | | | | 10.22 | |
| | | | | | | | | | | | | | | | | | | | |
LESS DISTRIBUTIONS FROM: | | | | | | | | | | | | | | | | | | | | |
Net investment income | | | (0.14 | ) | | | (0.19 | ) | | | (0.07 | ) | | | — | | | | — | |
Net realized capital gains | | | (1.25 | ) | | | (0.45 | ) | | | (1.41 | ) | | | (10.00 | ) | | | (2.58 | ) |
| | | | | | | | | | | | | | | | | | | | |
Total Distributions | | | (1.39 | ) | | | (0.64 | ) | | | (1.48 | ) | | | (10.00 | ) | | | (2.58 | ) |
| | | | | | | | | | | | | | | | | | | | |
Net asset value, end of the period | | $ | 42.61 | | | $ | 34.77 | | | $ | 31.61 | | | $ | 31.18 | | | $ | 36.32 | |
| | | | | | | | | | | | | | | | | | | | |
Total return | | | 26.60 | % | | | 12.13 | % | | | 6.11 | % | | | 13.25 | % | | | 36.06 | %(b) |
RATIOS TO AVERAGE NET ASSETS: | | | | | | | | | | | | | | | | | | | | |
Net assets, end of the period (000’s) | | $ | 285,008 | | | $ | 143,231 | | | $ | 70,643 | | | $ | 37,636 | | | $ | 24,661 | |
Net expenses | | | 0.95 | %(c) | | | 0.98 | %(d) | | | 1.00 | %(f) | | | 1.05 | %(e) | | | 1.05 | %(g) |
Gross expenses | | | 0.95 | % | | | 0.98 | %(d) | | | 1.00 | % | | | 1.05 | %(e) | | | 1.07 | % |
Net investment income | | | 0.40 | % | | | 0.63 | % | | | 0.46 | % | | | 0.32 | % | | | 0.13 | % |
Portfolio turnover rate | | | 17 | % | | | 17 | % | | | 20 | % | | | 93 | %(h) | | | 50 | % |
| (a) | Per share net investment income has been calculated using the average shares outstanding during the period. |
| (b) | Had certain expenses not been waived/reimbursed during the period, total returns would have been lower. |
| (c) | Effective July 1, 2017, the expense limit decreased from 1.00% to 0.95%. |
| (d) | Includes fee/expense recovery of less than 0.01%. |
| (e) | Includes fee/expense recovery of 0.01%. |
| (f) | Effective July 1, 2015, the expense limit decreased from 1.05% to 1.00%. |
| (g) | The investment adviser agreed to waive its fees and/or reimburse a portion of the Fund’s expenses during the period. Without this waiver/reimbursement, expenses would have been higher. |
| (h) | The variation in the Fund’s turnover rate from 2013 to 2014 was primarily due to the change in the structure of the Fund from four segments to two segments. |
See accompanying notes to financial statements.
| 88
Notes to Financial Statements
December 31, 2017
1. Organization. Natixis Funds Trust I and Natixis Funds Trust II (the “Trusts” and each a “Trust”) are each organized as a Massachusetts business trust. Each Trust is registered under the Investment Company Act of 1940, as amended (the “1940 Act”), as an open-end management investment company. Each Declaration of Trust permits the Board of Trustees to authorize the issuance of an unlimited number of shares of the Trust in multiple series. The financial statements for certain funds of the Trusts are presented in separate reports. The following funds (individually, a “Fund” and collectively, the “Funds”) are included in this report:
Natixis Funds Trust I:
Loomis Sayles Multi-Asset Income Fund (the “Multi-Asset Income Fund”)
Natixis U.S. Equity Opportunities Fund (the “U.S. Equity Opportunities Fund”)
Natixis Funds Trust II:
Loomis Sayles Strategic Alpha Fund (the “Strategic Alpha Fund”)
Each Fund is a diversified investment company, except for the Strategic Alpha Fund, which is a non-diversified investment company.
Each Fund offers Class A, Class C, Class N (effective May 1, 2017 for U.S. Equity Opportunities Fund and Strategic Alpha Fund) and Class Y shares. Class T shares of the Funds are not currently available for purchase. As of the close of business on January 11, 2016, Class B shares of U.S. Equity Opportunities Fund were converted into Class A shares and are no longer offered.
Class A shares are sold with a maximum front-end sales charge of 4.25% for Multi-Asset Income Fund and Strategic Alpha Fund and 5.75% for U.S. Equity Opportunities Fund. Class C shares do not pay a front-end sales charge, pay higher ongoing Rule 12b-1 fees than Class A shares and may be subject to a CDSC of 1.00% if those shares are redeemed within one year of acquisition, except for reinvested distributions. Class N and Class Y shares do not pay a front-end sales charge, a CDSC or Rule 12b-1 fees. Class N shares are offered with an initial minimum investment of $1,000,000. Class Y shares are offered with an initial minimum investment of $100,000. Certain categories of investors are exempted from the minimum investment amounts for Class N and Class Y as outlined in the relevant Funds’ prospectus.
Most expenses can be directly attributed to a Fund. Expenses which cannot be directly attributed to a Fund are generally apportioned based on the relative net assets of each of the funds in Natixis Funds Trust I, Natixis Funds Trust II, Natixis Funds Trust IV and Gateway Trust (“Natixis Funds Trusts”), Loomis Sayles Funds I and Loomis Sayles Funds II (“Loomis Sayles Funds Trusts”), and Natixis ETF Trust. Expenses of a Fund are borne pro rata by the holders of each class of shares, except that each class bears expenses unique to that class (such as the Rule 12b-1 fee applicable to Class A and Class C) and transfer agent fees are borne collectively for Class A, Class C and Class Y, and individually for Class N. In addition, each class votes as a class only with respect
89 |
Notes to Financial Statements (continued)
December 31, 2017
to its own Rule 12b-1 Plan. Shares of each class would receive their pro rata share of the net assets of a Fund if the Fund were liquidated. The Trustees approve separate distributions from net investment income on each class of shares.
2. Significant Accounting Policies. The following is a summary of significant accounting policies consistently followed by each Fund in the preparation of its financial statements. The Funds’ financial statements follow the accounting and reporting guidelines provided for investment companies and are prepared in accordance with accounting principles generally accepted in the United States of America which require the use of management estimates that affect the reported amounts and disclosures in the financial statements. Actual results could differ from those estimates. Management has evaluated the events and transactions subsequent to year-end through the date the financial statements were issued and has determined that there were no material events that would require disclosure in the Funds’ financial statements.
a. Valuation. Fund securities and other investments are valued at market value based on market quotations obtained or determined by independent pricing services recommended by the adviser or subadviser and approved by the Board of Trustees. Fund securities and other investments for which market quotations are not readily available are valued at fair value as determined in good faith by the adviser or subadviser pursuant to procedures approved by the Board of Trustees, as described below. Market value is determined as follows:
Listed equity securities (including shares of closed-end investment companies and exchange-traded funds) are valued at the last sale price quoted on the exchange where they are traded most extensively or, if there is no reported sale during the day, the closing bid quotation as reported by an independent pricing service. Securities traded on the NASDAQ Global Select Market, NASDAQ Global Market and NASDAQ Capital Market are valued at the NASDAQ Official Closing Price (“NOCP”), or if lacking an NOCP, at the most recent bid quotations on the applicable NASDAQ Market. Unlisted equity securities (except unlisted preferred equity securities) are valued at the last sale price quoted in the market where they are traded most extensively or, if there is no reported sale during the day, the closing bid quotation as reported by an independent pricing service. If there is no last sale price or closing bid quotation available, unlisted equity securities will be valued using evaluated bids furnished by an independent pricing service, if available. In some foreign markets, an official close price and a last sale price may be available from the foreign exchange or market. In those cases, the official close price is used. Debt securities and unlisted preferred equity securities are valued based on evaluated bids furnished to the Fund by an independent pricing service or bid prices obtained from broker-dealers. Senior loans are valued at bid prices supplied by an independent pricing service, if available. Broker-dealer bid prices may be used to value debt and unlisted equity securities and senior loans where an independent pricing service is unable to price a security or
| 90
Notes to Financial Statements (continued)
December 31, 2017
where an independent pricing service does not provide a reliable price for the security. Forward foreign currency contracts are valued utilizing interpolated rates determined based on information provided by an independent pricing service. Futures contracts are valued at the most recent settlement price on the exchange on which the adviser believes that, over time, they are traded most extensively. Centrally cleared swap agreements are valued at settlement prices of the clearinghouse on which the contracts were traded or prices obtained from broker-dealers. Bilateral credit default swaps are valued based on mid prices (between the bid price and the ask price) supplied by an independent pricing service. Bilateral interest rate swaps are valued based on prices supplied by an independent pricing source. Domestic exchange-traded single name equity option contracts are valued at the mean of the National Best Bid and Offer quotations. Options on futures contracts are valued using the current settlement price on the exchange on which, over time, they are traded most extensively. Option contracts on domestic indices are valued at the average of the closing bid and ask quotations as of the close of trading on the Chicago Board Options Exchange (“CBOE”). Option contracts on foreign indices are priced at the most recent settlement price. Other exchange-traded options are valued at the average of the closing bid and ask quotations on the exchange on which, over time, they are traded most extensively. Over-the-counter (“OTC”) currency options and swaptions are valued at mid prices (between the bid and the ask price) supplied by an independent pricing service, if available. Other OTC option contracts (including currency options and swaptions not priced through an independent pricing service) are valued based on quotations obtained from broker-dealers.
Fund securities and other investments for which market quotations are not readily available are valued at fair value as determined in good faith by the adviser pursuant to procedures approved by the Board of Trustees. The Funds may also value securities and other investments at fair value in other circumstances such as when extraordinary events occur after the close of a foreign market but prior to the close of the New York Stock Exchange (“NYSE”). This may include situations relating to a single issuer (such as a declaration of bankruptcy or a delisting of the issuer’s security from the primary market on which it has traded) as well as events affecting the securities markets in general (such as market disruptions or closings and significant fluctuations in U.S. and/or foreign markets). When fair valuing its securities or other investments, the Funds may, among other things, use modeling tools or other processes that may take into account factors such as securities or other market activity and/or significant events that occur after the close of the foreign market and before the time the Fund’s net asset value (“NAV”) is calculated. Fair value pricing may require subjective determinations about the value of a security, and fair values used to determine a Fund’s NAV may differ from quoted or published prices, or from prices that are used by others, for the same securities. In addition, the use of fair value pricing may not always result in adjustments to the prices of securities held by a Fund.
91 |
Notes to Financial Statements (continued)
December 31, 2017
As of December 31, 2017, securities and other investments of the funds included in net assets were fair valued as follows:
| | | | | | | | | | | | | | | | | | | | | | | | |
Fund | | Equity
securities1 | | | Percentage
of
Net
Assets | | | Securities
classified as fair
valued | | | Percentage
of
Net
Assets | | | Securities
fair
valued by
the Fund’s
adviser | | | Percentage
of Net
Assets | |
Multi-Asset Income Fund | | $ | 21,619,555 | | | | 15.0 | % | | $ | 656,500 | | | | 0.5 | % | | $ | — | | | | — | % |
Strategic Alpha Fund | | $ | — | | | | — | % | | $ | 2,968,544 | | | | 0.3 | % | | $ | 21,807,907 | | | | 1.9 | % |
| 1 | Certain foreign equity securities were fair valued pursuant to procedures approved by the Board of Trustees as events occurring after the close of the foreign market were believed to materially affect the value of those securities |
b. Investment Transactions and Related Investment Income. Investment transactions are accounted for on a trade date plus one day basis for daily NAV calculation. However, for financial reporting purposes, investment transactions are reported on trade date. Dividend income is recorded on ex-dividend date, or in the case of certain foreign securities, as soon as a Fund is notified, and interest income is recorded on an accrual basis. Interest income is increased by the accretion of discount and decreased by the amortization of premium, if applicable. Periodic principal adjustments for inflation-protected securities are recorded to interest income. Negative principal adjustments (in the event of deflation) are recorded as reductions of interest income to the extent of interest income earned, not to exceed the amount of positive principal adjustments on a cumulative basis. Distributions received from investments in securities that represent a return of capital or capital gain are recorded as a reduction of cost of the investments or as a realized gain, respectively. The calendar year-end amounts of ordinary income, capital gains, and return of capital included in distributions received from the Funds’ investments in real estate investment trusts (“REITs”) are reported to the Funds after the end of the fiscal year; accordingly, the Funds estimate these amounts for accounting purposes until the characterization of REIT distributions is reported to the Funds after the end of the fiscal year. Estimates are based on the most recent REIT distribution information available. In determining net gain or loss on securities sold, the cost of securities has been determined on an identified cost basis. Investment income, non-class specific expenses and realized and unrealized gains and losses are allocated on a pro rata basis to each class based on the relative net assets of each class to the total net assets of the Fund.
c. Foreign Currency Translation. The books and records of the Funds are maintained in U.S. dollars. The values of securities, currencies and other assets and liabilities denominated in currencies other than U.S. dollars are translated into U.S. dollars based
| 92
Notes to Financial Statements (continued)
December 31, 2017
upon foreign exchange rates prevailing at the end of the period. Purchases and sales of investment securities, income and expenses are translated into U.S. dollars on the respective dates of such transactions.
Net realized foreign exchange gains or losses arise from sales of foreign currency, changes in exchange rates between the trade and settlement dates on securities transactions and the difference between the amounts of dividends, interest and foreign withholding taxes recorded on the Fund’s books and the U.S. dollar equivalent of the amounts actually received or paid. Net unrealized foreign exchange gains or losses arise from changes in the value of assets and liabilities, other than investment securities, as of the end of the fiscal period, resulting from changes in exchange rates. Net realized foreign exchange gains or losses and the net change in unrealized foreign exchange gains or losses are disclosed in the Statements of Operations. For federal income tax purposes, net realized foreign exchange gains or losses are characterized as ordinary income, and may, if the Funds have net losses, reduce the amount of income available to be distributed by the Funds.
The values of investment securities are presented at the foreign exchange rates prevailing at the end of the period for financial reporting purposes. Net realized and unrealized gains or losses on investments reported in the Statements of Operations reflect gains or losses resulting from changes in exchange rates and fluctuations which arise due to changes in market prices of investment securities. For federal income tax purposes, a portion of the net realized gain or loss on investments arising from changes in exchange rates, which is reflected in the Statements of Operations, may be characterized as ordinary income and may, if the Funds have net losses, reduce the amount of income available to be distributed by the Funds.
For the year ended December 31, 2017, the amount of income available to be distributed has been reduced by the following amounts as a result of losses arising from changes in exchange rates:
| | | | |
Multi-Asset Income Fund | | $ | 39,247 | |
Strategic Alpha Fund | | $ | 17,803,420 | |
The Funds may use foreign currency exchange contracts to facilitate transactions in foreign-denominated investments. Losses may arise from changes in the value of the foreign currency or if the counterparties do not perform under the contracts’ terms.
d. Forward Foreign Currency Contracts. The Funds may enter into forward foreign currency contracts, including forward foreign cross currency contracts, to acquire exposure to foreign currencies or to hedge the Fund’s investments against currency fluctuation. A contract can also be used to offset a previous contract. These contracts involve market risk in excess of the unrealized gain or loss reflected in the Funds’ Statements of Assets and Liabilities. The U.S. dollar value of the currencies a Fund has committed to buy or sell represents the aggregate exposure to each currency a Fund has acquired or hedged through currency contracts outstanding at period end. Gains
93 |
Notes to Financial Statements (continued)
December 31, 2017
or losses are recorded for financial statement purposes as unrealized until settlement date. Contracts are traded over-the-counter directly with a counterparty. Risks may arise upon entering into these contracts from the potential inability of counterparties to meet the terms of their contracts and from unanticipated movements in the value of a foreign currency relative to the U.S. dollar. Certain contracts may require the movement of cash and/or securities as collateral for the Fund’s or counterparty’s net obligations under the contracts.
e. Futures Contracts. The Funds may enter into futures contracts. Futures contracts are agreements between two parties to buy and sell a particular instrument or index for a specified price on a specified future date.
When a Fund enters into a futures contract, it is required to deposit with (or for the benefit of) its broker an amount of cash or short-term high-quality securities as “initial margin.” As the value of the contract changes, the value of the futures contract position increases or declines. Subsequent payments, known as “variation margin,” are made or received by a Fund, depending on the price fluctuations in the fair value of the contract and the value of cash or securities on deposit with the broker. The aggregate principal amounts of the contracts are not recorded in the financial statements. Fluctuations in the value of the contracts are recorded in the Statements of Assets and Liabilities as an asset (liability) and in the Statements of Operations as unrealized appreciation (depreciation) until the contracts are closed, when they are recorded as realized gains (losses). Realized gain or loss on a futures position is equal to the difference between the value of the contract at the time it was opened and the value at the time it was closed, minus brokerage commissions. When a Fund enters into a futures contract certain risks may arise, such as illiquidity in the futures market, which may limit a Fund’s ability to close out a futures contract prior to settlement date, and unanticipated movements in the value of securities or interest rates.
Futures contracts are exchange-traded. Exchange-traded futures contracts are standardized and are settled through a clearing house with fulfillment supported by the credit of the exchange. Therefore, counterparty credit risks to the Funds are reduced; however, in the event that a counterparty enters into bankruptcy, a Fund’s claim against initial/variation margin on deposit with the counterparty may be subject to terms of a final settlement in bankruptcy court.
f. Option Contracts. The Funds may enter into option contracts. When a Fund purchases an option, it pays a premium and the option is subsequently marked-to-market to reflect current value. Premiums paid for purchasing options which expire are treated as realized losses. Premiums paid for purchasing options which are exercised are added to the cost or deducted from the proceeds on the underlying instrument to determine the realized gain or loss. If the Fund enters into a closing sale transaction, the difference between the premium paid and the proceeds of the closing sale transaction is treated as a realized gain or loss. The risk associated with purchasing options is limited to the premium paid.
| 94
Notes to Financial Statements (continued)
December 31, 2017
When a Fund writes an option, an amount equal to the net premium received (the premium less commission) is recorded as a liability and is subsequently adjusted to the current value. Net premiums received for written options which expire are treated as realized gains. Net premiums received for written options which are exercised are deducted from the cost or added to the proceeds on the underlying instrument to determine the realized gain or loss. If the Fund enters into a closing purchase transaction, the difference between the net premium received and any amount paid on effecting a closing purchase transaction, including commissions, is treated as a realized gain or, if the net premium received is less than the amount paid, as a realized loss. The Fund, as writer of a written option, bears the risk of an unfavorable change in the market value of the instrument or index underlying the written option.
Exchange-traded options contracts are standardized and are settled through a clearing house with fulfillment supported by the credit of the exchange. Therefore, counterparty credit risks to the Funds are reduced. OTC options are subject to the risk that the counterparty is unable or unwilling to meet its obligations under the option.
g. Swaptions. The Funds may enter into interest rate swaptions. An interest rate swaption gives the holder the right, but not the obligation, to enter into or cancel an interest rate swap agreement at a future date. Interest rate swaptions may be either purchased or written. The buyer of an interest rate swaption may purchase either the right to receive a fixed rate in the underlying swap (known as a “receiver swaption”) or to pay a fixed rate (known as a “payer swaption”), based on the notional amount of the swap agreement, in exchange for a floating rate. The notional amounts of swaptions are not recorded in the financial statements.
When a Fund purchases an interest rate swaption, it pays a premium and the swaption is subsequently marked-to-market to reflect current value. Premiums paid for purchasing interest rate swaptions which expire are treated as realized losses. Premiums paid for purchasing interest rate swaptions which are exercised are added to the cost or deducted from the proceeds on the underlying swap to determine the realized gain or loss. If a Fund enters into a closing sale transaction, the difference between the premium paid and the proceeds of the closing sale transaction is treated as a realized gain or loss. The risk associated with purchasing interest rate swaptions is limited to the premium paid.
When a Fund writes an interest rate swaption, an amount equal to the premium received is recorded as a liability and is subsequently adjusted to the current value. Premiums received for written interest rate swaptions which expire are treated as realized gains. Premiums received for written interest rate swaptions which are exercised are deducted from the cost or added to the proceeds on the underlying swap to determine the realized gain or loss. If a Fund enters into a closing purchase transaction, the difference between the premium received and any amount paid on effecting a closing purchase transaction, including commission, is treated as a realized
95 |
Notes to Financial Statements (continued)
December 31, 2017
gain or, if the premium received is less than the amount paid, as a realized loss. A Fund, as writer of a written interest rate swaption, bears the risk of an unfavorable change in the market value of the swap underlying the written interest rate swaption.
OTC interest rate swaptions are subject to the risk that the counterparty is unable or unwilling to meet its obligations under the swaption.
There were no swaptions held by the Funds as of December 31, 2017
h. Swap Agreements. The Funds may enter into credit default and interest rate swaps. A credit default swap is an agreement between two parties (the “protection buyer” and “protection seller”) to exchange the credit risk of an issuer (“reference obligation”) for a specified time period. The reference obligation may be one or more debt securities or an index of such securities. The Funds may be either the protection buyer or the protection seller. As a protection buyer, the Funds have the ability to hedge the downside risk of an issuer or group of issuers. As a protection seller, the Funds have the ability to gain exposure to an issuer or group of issuers whose bonds are unavailable or in short supply in the cash bond market, as well as realize additional income in the form of fees paid by the protection buyer. The protection buyer is obligated to pay the protection seller a stream of payments (“fees”) over the term of the contract, provided that no credit event, such as a default or a downgrade in credit rating, occurs on the reference obligation. The Funds may also pay or receive upfront premiums. If a credit event occurs, the protection seller must pay the protection buyer the difference between the agreed upon notional value and market value of the reference obligation. Market value in this case is determined by a facilitated auction whereby a minimum number of allowable broker bids, together with a specified valuation method, are used to calculate the value. The maximum potential amount of undiscounted future payments that a Fund as the protection seller could be required to make under a credit default swap agreement would be an amount equal to the notional amount of the agreement.
Implied credit spreads, represented in absolute terms, are disclosed in the Portfolio of Investments for those agreements for which the Fund is the protection seller. Implied credit spreads serve as an indicator of the current status of the payment/performance risk and represent the likelihood or risk of default for the credit derivative. The implied credit spread of a particular reference entity reflects the cost of buying/selling protection and may include upfront payments required to be made to enter into the agreement. Wider credit spreads represent a deterioration of the reference entity’s credit soundness and a greater likelihood or risk of default or other credit event occurring as defined under the terms of the agreement.
An interest rate swap is an agreement with another party to receive or pay interest (e.g., an exchange of fixed rate payments for floating rate payments) to protect themselves from interest rate fluctuations. This type of swap is an agreement that
| 96
Notes to Financial Statements (continued)
December 31, 2017
obligates two parties to exchange a series of cash flows at specified intervals based upon or calculated by reference to a specified interest rate(s) for a specified notional amount. The payment flows are usually netted against each other, with the difference being paid by one party to the other.
The notional amounts of swap agreements are not recorded in the financial statements. Swap agreements are valued daily, and fluctuations in value are recorded in the Statements of Operations as change in unrealized appreciation (depreciation) on swap agreements. Fees are accrued in accordance with the terms of the agreement and are recorded in the Statements of Assets and Liabilities as fees receivable or payable. When received or paid, fees are recorded in the Statements of Operations as realized gain or loss. Upfront premiums paid or received by the Funds are recorded on the Statements of Assets and Liabilities as an asset or liability, respectively, and are amortized or accreted over the term of the agreement and recorded as realized gain or loss. Payments made or received by the Funds as a result of a credit event or termination of the agreement are recorded as realized gain or loss.
Swap agreements are privately negotiated in the OTC market and may be entered into as a bilateral contract or centrally cleared (“centrally cleared swaps”). Bilateral swap agreements are traded between counterparties and, as such, are subject to the risk that a party to the agreement will not be able to meet its obligations. In a centrally cleared swap, immediately following execution of the swap agreement, the swap agreement is novated to a central counterparty (the “CCP”) and the Funds face the CCP through a broker. Upon entering into a centrally cleared swap, the Funds are required to deposit initial margin with the broker in the form of cash or securities in an amount that varies depending on the size and risk profile of the particular swap. Subsequent payments, known as “variation margin,” are made or received by the Funds based on the daily change in the value of the centrally cleared swap agreement. For centrally cleared swaps, the Funds’ counterparty credit risk is reduced as the CCP stands between the Funds and the counterparty. The Funds cover their net obligations under outstanding swap agreements by segregating or earmarking cash or securities.
i. Due to/from Brokers. Transactions and positions in certain options, swaptions, futures, forward foreign currency contracts and swap agreements are maintained and cleared by registered U.S. broker/dealers pursuant to customer agreements between the Funds and the various broker/dealers. The due from brokers balance in the Statements of Assets and Liabilities for Strategic Alpha Fund represents cash pledged as collateral for forward foreign currency contracts, options and bilateral swap agreements and as initial margin for futures contracts and centrally cleared swap agreements. The due to brokers balance in the Statements of Assets and Liabilities for Strategic Alpha Fund represents cash received as collateral for forward foreign currency contracts, options and bilateral swap agreements. In certain circumstances the Funds’ use of cash, securities and/or foreign currency held at brokers is restricted by regulation or broker mandated limits.
97 |
Notes to Financial Statements (continued)
December 31, 2017
j. Federal and Foreign Income Taxes. The Trusts treat each Fund as a separate entity for federal income tax purposes. Each Fund intends to meet the requirements of the Internal Revenue Code of 1986, as amended, applicable to regulated investment companies, and to distribute to its shareholders substantially all of its net investment income and any net realized capital gains at least annually. Management has performed an analysis of each Fund’s tax positions for the open tax years as of December 31, 2017 and has concluded that no provisions for income tax are required. The Funds’ federal tax returns for the prior three fiscal years remain subject to examination by the Internal Revenue Service. Management is not aware of any events that are reasonably possible to occur in the next twelve months that would result in the amounts of any unrecognized tax benefits significantly increasing or decreasing for the Funds. However, management’s conclusions regarding tax positions taken may be subject to review and adjustment at a later date based on factors including, but not limited to, new tax laws and accounting regulations and interpretations thereof.
A Fund may be subject to foreign withholding taxes on investment income and taxes on capital gains on investments that are accrued and paid based upon the Fund’s understanding of the tax rules and regulations that exist in the countries in which the Fund invests. Foreign withholding taxes on dividend and interest income are reflected on the Statements of Operations as a reduction of investment income, net of amounts eligible to be reclaimed. Dividends and interest receivable on the Statements of Assets and Liabilities are net of foreign withholding taxes. Foreign withholding taxes where reclaims have been or will be filed are reflected on the Statements of Assets and Liabilities as tax reclaims receivable. Capital gains taxes paid are included in net realized gain (loss) on investments in the Statements of Operations. Accrued but unpaid capital gains taxes are reflected as foreign taxes payable on the Statements of Assets and Liabilities, if applicable, and reduce unrealized gains on investments. In the event that realized gains on investments are subsequently offset by realized losses, taxes paid on realized gains may be returned to a Fund. Such amounts, if applicable, are reflected as foreign tax rebates receivable on the Statements of Assets and Liabilities and are recorded as a realized gain when received.
k. Dividends and Distributions to Shareholders. Dividends and distributions are recorded on ex-dividend date. The timing and characterization of certain income and capital gain distributions are determined in accordance with federal tax regulations, which may differ from accounting principles generally accepted in the United States of America. Permanent differences are primarily due to differing treatments for book and tax purposes of items such as paydown gains and losses, return of capital and capital gain distributions received, swap adjustments, passive foreign investment company adjustments, wash sales, corporate actions, foreign currency gains and losses, convertible bond adjustments, contingent payment debt instruments, distributions in excess of income and/or capital gain, distribution redesignations and premium amortization. Permanent book and tax basis differences relating to shareholder
| 98
Notes to Financial Statements (continued)
December 31, 2017
distributions, net investment income and net realized gains will result in reclassifications to capital accounts reported on the Statements of Assets and Liabilities. Temporary differences between book and tax distributable earnings are primarily due to deferred Trustees’ fees, premium amortization, defaulted and/or non-income producing securities, swap adjustments, wash sales, return of capital distributions received, convertible bond adjustments, passive foreign investment company adjustments, forward foreign currency contract mark-to-market, straddle loss deferrals and futures contracts mark-to-market. Amounts of income and capital gain available to be distributed on a tax basis are determined annually, and at other times during the Funds’ fiscal year as may be necessary to avoid knowingly declaring and paying a return of capital distribution. Distributions from net investment income and short-term capital gains are considered to be distributed from ordinary income for tax purposes.
The tax characterization of distributions is determined on an annual basis. The tax character of distributions paid to shareholders during the year ended December 31, 2017 and 2016, respectively, were as follows:
| | | | | | | | | | | | | | | | | | | | | | | | |
| | | 2017 Distributions Paid From: | | | 2016 Distributions Paid From: | |
Fund | | Ordinary
Income | | | Long-Term
Capital
Gains | | | Total | | | Ordinary
Income | | | Long-Term
Capital
Gains | | | Total | |
Multi-Asset Income Fund | | $ | 6,743,242 | | | $ | 2,818,786 | | | $ | 9,562,028 | | | $ | 3,154,985 | | | $ | 4,548,260 | | | $ | 7,703,245 | |
Strategic Alpha Fund | | | 34,540,664 | | | | — | | | | 34,540,664 | | | | 28,006,426 | | | | — | | | | 28,006,426 | |
U.S. Equity Opportunities Fund | | | 5,656,689 | | | | 29,396,069 | | | | 35,052,758 | | | | 2,594,980 | | | | 9,731,549 | | | | 12,326,529 | |
Differences between these amounts and those reported in the Statements of Changes in Net Assets are primarily attributable to different book and tax treatment for short-term capital gains.
As of December 31, 2017, the components of distributable earnings on a tax basis were as follows:
| | | | | | | | | | | | |
| | | Multi-Asset
Income Fund | | | Strategic
Alpha
Fund | | | U.S. Equity
Opportunities
Fund | |
Undistributed ordinary income | | $ | 1,801,267 | | | $ | — | | | $ | 1,695,171 | |
Undistributed long-term capital gains | | | 703,706 | | | | — | | | | 20,172,987 | |
| | | | | | | | | | | | |
Total undistributed earnings | | | 2,504,973 | | | | — | | | | 21,868,158 | |
| | | | | | | | | | | | |
99 |
Notes to Financial Statements (continued)
December 31, 2017
| | | | | | | | | | | | |
| | | Multi-Asset
Income Fund | | | Strategic
Alpha Fund | | | U.S. Equity
Opportunities
Fund | |
Capital loss carryforward: | | | | | | | | | | | | |
Short-term: | | | | | | | | | | | | |
No expiration date | | $ | — | | | $ | (38,802,029 | ) | | $ | — | |
Long-term: | | | | | | | | | | | | |
No expiration date | | | — | | | | (13,571,266 | ) | | | — | |
| | | | | | | | | | | | |
Total capital loss carryforward | | | — | | | | (52,373,295 | ) | | | — | |
| | | | | | | | | | | | |
Late-year ordinary and post-October capital loss deferrals* | | | — | | | | (7,073,237 | ) | | | — | |
| | | | | | | | | | | | |
Unrealized appreciation (depreciation) | | | 7,114,326 | | | | (9,594,815 | ) | | | 276,927,757 | |
| | | | | | | | | | | | |
Total accumulated earnings (losses) | | $ | 9,619,299 | | | $ | (69,041,347 | ) | | $ | 298,795,915 | |
| | | | | | | | | | | | |
Capital loss carryforward utilized in the current year | | $ | — | | | $ | 2,877,339 | | | $ | — | |
| | | | | | | | | | | | |
| * | Under current tax law, capital losses, foreign currency losses, and losses on passive foreign investment companies and contingent payment debt instruments after October 31 or December 31, as applicable, may be deferred and treated as occurring on the first day of the following taxable year. As of December 31, 2017, Strategic Alpha Fund is deferring foreign currency losses. |
As of December 31, 2017, unrealized appreciation (depreciation) as a component of distributable earnings was as follows:
| | | | | | | | | | | | |
| | | Multi-Asset
Income Fund | | | Strategic
Alpha Fund | | | U.S. Equity
Opportunities
Fund | |
Unrealized appreciation (depreciation) | | | | | | | | | | | | |
Investments | | $ | 7,260,520 | | | $ | (2,496,327 | ) | | $ | 276,927,757 | |
Foreign currency translations | | | (146,194 | ) | | | (7,098,488 | ) | | | — | |
| | | | | | | | | | | | |
Total unrealized appreciation (depreciation) | | $ | 7,114,326 | | | $ | (9,594,815 | ) | | $ | 276,927,757 | |
| | | | | | | | | | | | |
As of December 31, 2017, the tax cost of investments (including derivatives, if applicable) and unrealized appreciation (depreciation) on a federal tax basis were as follows:
| | | | | | | | | | | | |
| | | Multi-Asset
Income Fund | | | Strategic
Alpha Fund | | | U.S. Equity
Opportunities
Fund | |
Federal tax cost | | $ | 137,652,890 | | | $ | 1,138,607,198 | | | $ | 722,535,621 | |
| | | | | | | | | | | | |
Gross tax appreciation | | $ | 8,603,804 | | | $ | 33,791,742 | | | $ | 294,705,985 | |
Gross tax depreciation | | | (1,483,595 | ) | | | (43,586,395 | ) | | | (17,778,228 | ) |
| | | | | | | | | | | | |
Net tax appreciation | | $ | 7,120,209 | | | $ | (9,794,653 | ) | | $ | 276,927,757 | |
| | | | | | | | | | | | |
| 100
Notes to Financial Statements (continued)
December 31, 2017
Differences between these amounts and those reported in the components of distributable earnings are primarily attributable to foreign currency mark-to-market.
l. Loan Participations. Strategic Alpha Fund may invest in loans to corporate, governmental or other borrowers. The Fund’s investments in loans may be in the form of participations in loans or assignments of all or a portion of loans. A loan is often administered by a bank or other financial institution that acts as agent for all holders. The agent administers the terms of the loan, as specified in the loan agreement. When investing in a loan participation, (i) a Fund has the right to receive payments of principal, interest and any fees to which it is entitled only from the party from whom the Fund has purchased the participation and only upon receipt by that party of payments from the borrower and (ii) a Fund generally has no right to enforce compliance by the borrower with the terms of the loan agreement or to vote on matters arising under the loan agreement. Thus, a Fund may be subject to credit risk both of the party from whom it purchased the loan participation and the borrower and the Fund may have minimal control over the terms of any loan modification. When a Fund purchases assignments from lenders, it acquires direct rights against the borrower on the loan. Loan agreements and participations outstanding at the end of the period, if any, are listed in each applicable Fund’s Schedule of Investments.
m. Repurchase Agreements. Each Fund may enter into repurchase agreements, under the terms of a Master Repurchase Agreement, under which each Fund acquires securities as collateral and agrees to resell the securities at an agreed upon time and at an agreed upon price. It is each Fund’s policy that the market value of the collateral for repurchase agreements be at least equal to 102% of the repurchase price, including interest. Certain repurchase agreements are tri-party arrangements whereby the collateral is held in a segregated account for the benefit of the Fund and on behalf of the counterparty. Repurchase agreements could involve certain risks in the event of default or insolvency of the counterparty, including possible delays or restrictions upon a Fund’s ability to dispose of the underlying securities. As of December 31, 2017, each Fund, as applicable, had investments in repurchase agreements for which the value of the related collateral exceeded the value of the repurchase agreement. The gross value of repurchase agreements is included in the Statements of Assets and Liabilities for financial reporting purposes.
n. When-Issued and Delayed Delivery Transactions. The Funds may enter into when-issued or delayed delivery transactions. When-issued refers to transactions made conditionally because a security, although authorized, has not been issued. Delayed delivery refers to transactions for which delivery or payment will occur at a later date, beyond the normal settlement period. The price of when-issued and delayed delivery securities and the date when the securities will be delivered and paid for are fixed at the time the transaction is negotiated. The security and the obligation to pay for it are recorded by the Funds at the time the commitment is entered into. The value of the
101 |
Notes to Financial Statements (continued)
December 31, 2017
security may vary with market fluctuations during the time before the Funds take delivery of the security. No interest accrues to the Funds until the transaction settles.
Delayed delivery transactions include those designated as To Be Announced (“TBAs”) in the Portfolios of Investments. For TBAs, the actual security that will be delivered to fulfill the transaction is not designated at the time of the trade. The security is “to be announced” 48 hours prior to the established trade settlement date. Certain transactions require the Funds or counterparty to post cash and/or securities as collateral for the net mark-to-market exposure to the other party. The Funds cover their net obligations under outstanding delayed delivery commitments by segregating or earmarking cash or securities at the custodian.
Purchases of when-issued or delayed delivery securities may have a similar effect on the Funds’ NAV as if the Funds’ had created a degree of leverage in the portfolio. Risks may arise upon entering into such transactions from the potential inability of counterparties to meet their obligations under the transactions. Additionally, losses may arise due to changes in the value of the underlying securities.
There were no when-issued or delayed delivery securities held by the Funds as of December 31, 2017.
o. Stripped Securities. Each Fund may invest in stripped securities, which are usually structured with two or more classes that receive different proportions of the interest and principal distribution on a pool of U.S. or foreign government securities or mortgage assets. In some cases, one class will receive all of the interest (the interest-only or “IO” class), while the other class will receive all of the principal (the principal-only or “PO” class). Stripped securities commonly have greater market volatility than other types of fixed-income securities. In the case of stripped mortgage securities, if the underlying mortgage assets experience greater than anticipated prepayments of principal, a Fund may fail to recoup fully its investments in IOs.
p. Securities Lending. The Funds have entered into an agreement with State Street Bank and Trust Company (“State Street Bank”), as agent of the Funds, to lend securities to certain designated borrowers. The loans are collateralized with cash or securities in an amount equal to at least 105% or 102% of the market value (including accrued interest) of the loaned international or domestic securities, respectively, when the loan is initiated. Thereafter, the value of the collateral must remain at least 102% of the market value (including accrued interest) of loaned securities for U.S. equities and U.S. corporate debt; at least 105% of the market value (including accrued interest) of loaned securities for non-U.S. equities; and at least 100% of the market value (including accrued interest) of loaned securities for U.S. Government securities, sovereign debt issued by non-U.S. Governments and non-U.S. corporate debt. In the event that the market value of the collateral falls below the required percentages described above, the borrower will deliver additional collateral on the next business day. As with other
| 102
Notes to Financial Statements (continued)
December 31, 2017
extensions of credit, the Funds may bear the risk of loss with respect to the investment of the collateral. The Funds invest cash collateral in short-term investments, a portion of the income from which is remitted to the borrowers and the remainder allocated between the Funds and State Street Bank as lending agent.
For the year ended December 31, 2017, the Funds did not loan securities under this agreement.
q. Indemnifications. Under the Trusts’ organizational documents, its officers and Trustees are indemnified against certain liabilities arising out of the performance of their duties to the Funds. Additionally, in the normal course of business, the Funds enter into contracts with service providers that contain general indemnification clauses. The Funds’ maximum exposure under these arrangements is unknown as this would involve future claims that may be made against the Funds that have not yet occurred. However, based on experience, the Funds expect the risk of loss to be remote.
3. Fair Value Measurements. In accordance with accounting standards related to fair value measurements and disclosures, the Funds have categorized the inputs utilized in determining the value of each Fund’s assets or liabilities. These inputs are summarized in the three broad levels listed below:
| | • | | Level 1 – quoted prices in active markets for identical assets or liabilities; |
| | • | | Level 2 – prices determined using other significant inputs that are observable either directly, or indirectly through corroboration with observable market data (which could include quoted prices for similar assets or liabilities, interest rates, credit risk, etc.); and |
| | • | | Level 3 – prices determined using significant unobservable inputs when quoted prices or observable inputs are unavailable such as when there is little or no market activity for an asset or liability (unobservable inputs reflect each Fund’s own assumptions in determining the fair value of assets or liabilities and would be based on the best information available). |
The inputs or methodology used for valuing securities are not necessarily an indication of the risk associated with investing in those securities.
The Fund’s pricing policies and procedures are recommended by the adviser and approved by the Board of Trustees. Debt securities are valued based on evaluated bids furnished to the Fund by an independent pricing service. Broker-dealer bid prices may be used if an independent pricing service either is unable to price a security or does not provide a reliable price for a security. Broker-dealer bid prices for which the Fund does not have knowledge of the inputs used by the broker-dealer are categorized in Level 3. All security prices, including those obtained from an independent pricing service and broker-dealer bid prices, are reviewed on a daily basis by the adviser, subject to oversight by Fund management and the Board of Trustees. If the adviser, in
103 |
Notes to Financial Statements (continued)
December 31, 2017
good faith, believes that the price provided by an independent pricing service is unreliable, broker-dealer bid prices may be used until the price provided by the independent pricing service is considered to be reliable. Reliability of all security prices, including those obtained from an independent pricing service and broker-dealer bid prices, is tested in a variety of ways, including comparison to recent transaction prices and daily fluctuations, amongst other validation procedures in place. Securities for which market quotations are not readily available are valued at fair value as determined in good faith by the Fund’s adviser pursuant to procedures approved by the Board of Trustees. Fair valued securities may be categorized in Level 3.
The following is a summary of the inputs used to value the Funds’ investments as of December 31, 2017, at value:
Multi-Asset Income Fund
Asset Valuation Inputs
| | | | | | | | | | | | | | | | |
Description | | Level 1 | | | Level 2 | | | Level 3 | | | Total | |
Common Stocks | | | | | | | | | | | | | | | | |
Aerospace & Defense | | $ | 2,837,599 | | | $ | 1,119,406 | | | $ | — | | | $ | 3,957,005 | |
Air Freight & Logistics | | | 291,213 | | | | 287,939 | | | | — | | | | 579,152 | |
Airlines | | | 1,960,392 | | | | 1,078,233 | | | | — | | | | 3,038,625 | |
Automobiles | | | 310,089 | | | | 4,616,570 | | | | — | | | | 4,926,659 | |
Banks | | | 8,502,259 | | | | 985,848 | | | | — | | | | 9,488,107 | |
Beverages | | | 1,317,274 | | | | 372,562 | | | | — | | | | 1,689,836 | |
Capital Markets | | | 1,752,098 | | | | 234,928 | | | | — | | | | 1,987,026 | |
Chemicals | | | 1,370,289 | | | | 1,094,355 | | | | — | | | | 2,464,644 | |
Construction & Engineering | | | — | | | | 1,088,213 | | | | — | | | | 1,088,213 | |
Distributors | | | — | | | | 310,409 | | | | — | | | | 310,409 | |
Diversified Consumer Services | | | 289,154 | | | | 66,849 | | | | — | | | | 356,003 | |
Electric Utilities | | | 2,691,107 | | | | 270,306 | | | | — | | | | 2,961,413 | |
Electrical Equipment | | | — | | | | 236,807 | | | | — | | | | 236,807 | |
Electronic Equipment, Instruments & Components | | | — | | | | 139,648 | | | | — | | | | 139,648 | |
Food Products | | | 2,109,870 | | | | 290,774 | | | | — | | | | 2,400,644 | |
Hotels, Restaurants & Leisure | | | 2,035,385 | | | | 2,465,588 | | | | — | | | | 4,500,973 | |
Household Durables | | | — | | | | 824,564 | | | | — | | | | 824,564 | |
Independent Power & Renewable Electricity Producers | | | 290,623 | | | | 204,761 | | | | — | | | | 495,384 | |
Industrial Conglomerates | | | 716,805 | | | | 1,988,214 | | | | — | | | | 2,705,019 | |
Insurance | | | 1,071,535 | | | | 170,111 | | | | — | | | | 1,241,646 | |
Oil, Gas & Consumable Fuels | | | 3,652,625 | | | | 1,779,419 | | | | — | | | | 5,432,044 | |
Personal Products | | | 325,225 | | | | 280,326 | | | | — | | | | 605,551 | |
| 104
Notes to Financial Statements (continued)
December 31, 2017
Multi-Asset Income Fund (continued)
Asset Valuation Inputs (continued)
| | | | | | | | | | | | | | | | |
Description | | Level 1 | | | Level 2 | | | Level 3 | | | Total | |
Semiconductors & Semiconductor Equipment | | $ | 4,852,236 | | | $ | 288,623 | | | $ | — | | | $ | 5,140,859 | |
Specialty Retail | | | 2,762,106 | | | | 32,958 | | | | — | | | | 2,795,064 | |
Technology Hardware, Storage & Peripherals | | | 2,379,667 | | | | 279,436 | | | | — | | | | 2,659,103 | |
Tobacco | | | 1,368,387 | | | | 579,282 | | | | — | | | | 1,947,669 | |
Trading Companies & Distributors | | | — | | | | 533,426 | | | | — | | | | 533,426 | |
All Other Common Stocks(a) | | | 29,476,122 | | | | — | | | | — | | | | 29,476,122 | |
| | | | | | | | | | | | | | | | |
Total Common Stocks | | | 72,362,060 | | | | 21,619,555 | | | | — | | | | 93,981,615 | |
| | | | | | | | | | | | | | | | |
Bonds and Notes(a) | | | — | | | | 33,787,791 | | | | — | | | | 33,787,791 | |
Exchange-Traded Funds | | | 4,098,055 | | | | — | | | | — | | | | 4,098,055 | |
Preferred Stocks(a) | | | — | | | | 535,318 | | | | — | | | | 535,318 | |
Senior Loans(a) | | | — | | | | 8,141,928 | | | | — | | | | 8,141,928 | |
Short-Term Investments | | | — | | | | 4,228,481 | | | | — | | | | 4,228,481 | |
| | | | | | | | | | | | | | | | |
Total | | $ | 76,460,115 | | | $ | 68,313,073 | | | $ | — | | | $ | 144,773,188 | |
| | | | | | | | | | | | | | | | |
| (a) | Details of the major categories of the Fund’s investments are reflected within the Portfolio of Investments. |
Common stocks valued at $301,464 were transferred from Level 2 to Level 1 during the period ended December 31, 2017. At December 31, 2016, these securities were fair valued pursuant to procedures approved by the Board of Trustees as events occurring after the close of the foreign market were believed to materially affect the value of the securities. At December 31, 2017, these securities were valued at the market price in the foreign market in accordance with the Fund’s valuation policies.
All transfers are recognized as of the beginning of the reporting period.
105 |
Notes to Financial Statements (continued)
December 31, 2017
Strategic Alpha Fund
Asset Valuation Inputs
| | | | | | | | | | | | | | | | |
Description | | Level 1 | | | Level 2 | | | Level 3 | | | Total | |
Bonds and Notes | | | | | | | | | | | | | | | | |
Non-Convertible Bonds | | | | | | | | | | | | | | | | |
ABS Home Equity | | $ | — | | | $ | 145,175,679 | | | $ | 1,615,466 | (b) | | $ | 146,791,145 | |
ABS Other | | | — | | | | 42,247,973 | | | | 8,692,445 | (c)(d) | | | 50,940,418 | |
ABS Student Loan | | | — | | | | 4,574,456 | | | | 4,900,039 | (e) | | | 9,474,495 | |
Independent Energy | | | — | | | | 20,299,176 | | | | — | (d) | | | 20,299,176 | |
Non-Agency Commercial Mortgage-Backed Securities | | | — | | | | 40,575,297 | | | | 542,412 | (e) | | | 41,117,709 | |
All Other Non-Convertible Bonds(a) | | | — | | | | 547,314,794 | | | | — | | | | 547,314,794 | |
| | | | | | | | | | | | | | | | |
Total Non-Convertible Bonds | | | — | | | | 800,187,375 | | | | 15,750,362 | | | | 815,937,737 | |
| | | | | | | | | | | | | | | | |
Convertible Bonds(a) | | | — | | | | 35,128,279 | | | | — | | | | 35,128,279 | |
| | | | | | | | | | | | | | | | |
Total Bonds and Notes | | | — | | | | 835,315,654 | | | | 15,750,362 | | | | 851,066,016 | |
| | | | | | | | | | | | | | | | |
Senior Loans(a) | | | — | | | | 120,972,667 | | | | — | | | | 120,972,667 | |
Loan Participations(a) | | | — | | | | — | | | | 7,937,785 | (e) | | | 7,937,785 | |
Preferred Stocks(a) | | | — | | | | 8,635,284 | | | | — | | | | 8,635,284 | |
Common Stocks(a) | | | 64,858,931 | | | | — | | | | — | | | | 64,858,931 | |
Exchange-Traded Funds | | | 8,349,479 | | | | — | | | | — | | | | 8,349,479 | |
Other Investments(a) | | | — | | | | — | | | | 14,411,624 | (f) | | | 14,411,624 | |
Short-Term Investments | | | — | | | | 49,264,522 | | | | — | | | | 49,264,522 | |
Purchased Options | | | | | | | | | | | | | | | | |
Options on Securities | | | 1,263,752 | | | | — | | | | — | | | | 1,263,752 | |
Over-the-Counter Options on Currency | | | — | | | | 299,637 | | | | — | | | | 299,637 | |
| | | | | | | | | | | | | | | | |
Total Investments | | | 74,472,162 | | | | 1,014,487,764 | | | | 38,099,771 | | | | 1,127,059,697 | |
| | | | | | | | | | | | | | | | |
Centrally Cleared Interest Rate Swap Agreements (unrealized appreciation) | | | — | | | | 1,663,619 | | | | — | | | | 1,663,619 | |
Forward Foreign Currency Contracts (unrealized appreciation) | | | — | | | | 1,757,810 | | | | — | | | | 1,757,810 | |
Futures Contracts (unrealized appreciation) | | | 255,857 | | | | — | | | | — | | | | 255,857 | |
| | | | | | | | | | | | | | | | |
Total | | $ | 74,728,019 | | | $ | 1,017,909,193 | | | $ | 38,099,771 | | | $ | 1,130,736,983 | |
| | | | | | | | | | | | | | | | |
| 106
Notes to Financial Statements (continued)
December 31, 2017
Strategic Alpha Fund (continued)
Liability Valuation Inputs
| | | | | | | | | | | | | | | | |
Description | | Level 1 | | | Level 2 | | | Level 3 | | | Total | |
Written Options | | $ | (241,516 | ) | | $ | — | | | $ | — | | | $ | (241,516 | ) |
Bilateral Credit Default Swap Agreements (unrealized depreciation) | | | — | | | | (840,561 | ) | | | — | | | | (840,561 | ) |
Centrally Cleared Interest Rate Swap Agreements (unrealized depreciation) | | | — | | | | (985,924 | ) | | | — | | | | (985,924 | ) |
Forward Foreign Currency Contracts (unrealized depreciation) | | | — | | | | (4,104,643 | ) | | | — | | | | (4,104,643 | ) |
Futures Contracts (unrealized depreciation) | | | (657,400 | ) | | | — | | | | — | | | | (657,400 | ) |
| | | | | | | | | | | | | | | | |
Total | | $ | (898,916 | ) | | $ | (5,931,128 | ) | | $ | — | | | $ | (6,830,044 | ) |
| | | | | | | | | | | | | | | | |
| (a) | Details of the major categories of the Fund’s investments are reflected within the Portfolio of Investments. |
| (b) | Valued using broker-dealer bid prices ($1,614,995) or fair valued by the Fund’s adviser ($471). |
| (c) | Valued using broker-dealer bid prices ($1,296,633) or fair valued by the Fund’s adviser using broker dealer bid prices for which inputs are unobservable to the Fund ($7,159,200) or fair valued by the Fund’s adviser ($236,612). |
| (d) | Includes a security fair valued at zero using level 3 inputs. |
| (e) | Valued using broker-dealer bid prices. |
| (f) | Fair valued by the Fund’s adviser using broker dealer bid prices for which inputs are unobservable to the Fund ($8,912,709) or fair valued by the Fund’s adviser ($5,498,915). |
A preferred stock valued at $2,616,058 was transferred from Level 1 to Level 2 during the period ended December 31, 2017. At December 31, 2016, this security was valued at the last sale price in accordance with the Fund’s valuation policies. At December 31, 2017, this security was valued on the basis of evaluated bids furnished to the Fund by an independent pricing service as a market price was not available.
All transfers are recognized as of the beginning of the reporting period.
107 |
Notes to Financial Statements (continued)
December 31, 2017
The following is a reconciliation of Level 3 investments for which significant unobservable inputs were used to determine fair value as of December 31, 2016 and/or December 31, 2017:
Strategic Alpha Fund
Asset Valuation Inputs
| | | | | | | | | | | | | | | | | | | | |
Investments in Securities | | Balance as of
December 31,
2016 | | | Accrued
Discounts
(Premiums) | | | Realized
Gain
(Loss) | | | Change in
Unrealized
Appreciation
(Depreciation) | | | Purchases | |
Bonds and Notes | | | | | | | | | | | | | | | | | | | | |
Non-Convertible Bonds | | | | | | | | | | | | | | | | | | | | |
ABS Home Equity | | $ | 3,187,399 | | | $ | — | | | $ | 92,931 | | | $ | (13,792 | ) | | $ | 1,614,995 | |
ABS Other | | | 11,836,146 | | | | 10 | | | | 3,794 | | | | 4,577 | | | | 7,738,459 | |
ABS Student Loan | | | — | | | | — | | | | 135 | | | | 3,247 | | | | 5,004,657 | |
Banking | | | 2,704,314 | | | | — | | | | — | | | | — | | | | — | |
Government Owned - No Guarantee | | | 2,180,900 | | | | — | | | | — | | | | — | | | | — | |
Independent Energy | | | — | (a) | | | 360,978 | | | | — | | | | (360,978 | ) | | | — | |
Non-Agency Commercial Mortgage-Backed Securities | | | 3,349,021 | | | | — | | | | (10,484 | ) | | | 103,866 | | | | 2,067,057 | |
Senior Loans | | | | | | | | | | | | | | | | | | | | |
Wirelines | | | 1,165,800 | | | | (5 | ) | | | — | | | | (11,595 | ) | | | (1,154,200 | ) |
Loan Participations | | | 2,256,710 | | | | — | | | | (4,589 | ) | | | 42,190 | | | | — | |
Other Investments | | | | | | | | | | | | | | | | | | | | |
Aircraft ABS | | | 8,840,043 | | | | — | | | | — | | | | (282,919 | ) | | | 5,854,500 | |
| | | | | | | | | | | | | | | | | | | | |
Total | | $ | 35,520,333 | | | $ | 360,983 | | | $ | 81,787 | | | $ | (515,404 | ) | | $ | 21,125,468 | |
| | | | | | | | | | | | | | | | | | | | |
| 108
Notes to Financial Statements (continued)
December 31, 2017
Strategic Alpha Fund (continued)
Asset Valuation Inputs (continued)
| | | | | | | | | | | | | | | | | | | | |
Investments in
Securities | | Sales | | | Transfers
into Level 3 | | | Transfers
out of Level 3 | | | Balance as of
December 31,
2017 | | | Change in
Unrealized
Appreciation
(Depreciation)
from
Investments
Still Held at
December 31,
2017 | |
Bonds and Notes | | | | | | | | | | | | | | | | | | | | |
Non-Convertible Bonds | | | | | | | | | | | | | | | | | | | | |
ABS Home Equity | | $ | (792,971 | ) | | $ | — | | | $ | (2,473,096 | ) | | $ | 1,615,466 | | | $ | 9 | |
ABS Other | | | (557,511 | ) | | | — | | | | (4,077,734 | ) | | | 14,947,741 | | | | 8,702 | |
ABS Student Loan | | | (108,000 | ) | | | — | | | | — | | | | 4,900,039 | | | | 3,247 | |
Banking | | | — | | | | — | | | | (2,704,314 | ) | | | — | | | | — | |
Government Owned - No Guarantee | | | — | | | | — | | | | (2,180,900 | ) | | | — | | | | — | |
Independent Energy | | | — | | | | — | | | | — | | | | — | (a) | | | (360,978 | ) |
Non-Agency Commercial Mortgage-Backed Securities | | | (4,967,048 | ) | | | — | | | | — | | | | 542,412 | | | | 10,839 | |
Senior Loans | | | | | | | | | | | | | | | | | | | | |
Wirelines | | | — | | | | — | | | | — | | | | — | | | | — | |
Loan Participations | | | (611,822 | ) | | | — | | | | — | | | | 1,682,489 | | | | 25,365 | |
Other Investments | | | | | | | | | | | | | | | | | | | | |
Aircraft ABS | | | — | | | | — | | | | — | | | | 14,411,624 | | | | (282,919 | ) |
| | | | | | | | | | | | | | | | | | | | |
Total | | $ | (7,037,352 | ) | | $ | — | | | $ | (11,436,044 | ) | | $ | 38,099,771 | | | $ | (595,735 | ) |
| | | | | | | | | | | | | | | | | | | | |
Debt securities valued at $2,473,096 were transferred from Level 3 to Level 2 during the period ended December 31, 2017. At December 31, 2016, these securities were valued at fair value as determined in good faith by the Fund’s investment adviser as an independent pricing service did not provide a reliable price for the securities. At December 31, 2017, these securities were valued on the basis of evaluated bids furnished to the Fund by an independent pricing service in accordance with the Fund’s valuation policies.
109 |
Notes to Financial Statements (continued)
December 31, 2017
Debt securities valued at $8,962,948 were transferred from Level 3 to Level 2 during the period ended December 31, 2017. At December 31, 2016, these securities were valued using broker-dealer bid prices based on inputs unobservable to the Fund as an independent pricing service did not provide a reliable price for the securities. At December 31, 2017, these securities were valued on the basis of evaluated bids furnished to the Fund by an independent pricing service in accordance with the Fund’s valuation policies.
All transfers are recognized as of the beginning of the reporting period.
U.S. Equity Opportunities Fund
Asset Valuation Inputs
| | | | | | | | | | | | | | | | |
Description | | Level 1 | | | Level 2 | | | Level 3 | | | Total | |
Common Stocks(a) | | $ | 975,623,342 | | | $ | — | | | $ | — | | | $ | 975,623,342 | |
Short-Term Investments | | | — | | | | 23,840,036 | | | | — | | | | 23,840,036 | |
| | | | | | | | | | | | | | | | |
Total | | $ | 975,623,342 | | | $ | 23,840,036 | | | $ | — | | | $ | 999,463,378 | |
| | | | | | | | | | | | | | | | |
| (a) | Details of the major categories of the Fund’s investments are reflected within the Portfolio of Investments. |
For the year ended December 31, 2017, there were no transfers among Levels 1, 2 and 3.
4. Derivatives. Derivative instruments are defined as financial instruments whose value and performance are based on the value and performance of an underlying asset, reference rate or index. Derivative instruments that the Funds used during the period include forward foreign currency contracts, futures contracts, option contracts and swap agreements.
Multi-Asset Income Fund is subject to the risk that changes in foreign currency exchange rates will have an unfavorable effect on the value of Fund assets denominated in foreign currencies. The Fund may enter into forward foreign currency exchange contracts for hedging purposes to protect the value of the Fund’s holdings of foreign securities. During the year ended December 31, 2017, the Fund engaged in forward foreign currency for hedging purposes.
Strategic Alpha Fund seeks to achieve positive total returns over a full market cycle. The Fund pursues its objective by utilizing a flexible investment approach that allocates investments across a global range of investment opportunities related to credit, currencies and interest rates, while employing risk management techniques to mitigate downside risk. At times, the Fund expects to gain its investment exposure substantially through the use of derivatives, including forward foreign currency contracts, futures and option contracts, interest rate swaptions and swap agreements. During the year
| 110
Notes to Financial Statements (continued)
December 31, 2017
ended December 31, 2017, the Fund used futures, forward foreign currency, option contracts, interest rate swap agreements and credit default swap agreements (as a protection seller) to gain investment exposures in accordance with its objective.
Strategic Alpha Fund is subject to the risk that changes in interest rates will affect the value of the Fund’s investments in fixed-income securities. The Fund will be subject to increased interest rate risk to the extent that it invests in fixed-income securities with longer maturities or durations, as compared to investing in fixed-income securities with shorter maturities or durations. The Fund may use futures contracts, interest rate swap agreements and interest rate swaptions to hedge against changes in interest rates and to manage duration without having to buy or sell portfolio securities. During the year ended December 31, 2017, the Fund engaged in futures contracts for hedging purposes.
Strategic Alpha Fund is subject to the risk that changes in foreign currency exchange rates will have an unfavorable effect on the value of Fund assets denominated in foreign currencies. The Fund may enter into forward foreign currency exchange contracts and option contracts for hedging purposes to protect the value of the Fund’s holdings of foreign securities. During the year ended December 31, 2017, the Fund engaged in forward foreign currency and option contracts for hedging purposes.
Strategic Alpha Fund is subject to the risk that companies in which the Fund invests will fail financially or otherwise be unwilling or unable to meet their obligations to the Fund. The Fund may use credit default swaps, as a protection buyer, to hedge its credit exposure to issuers of bonds it holds without having to sell the bonds. During the year ended December 31, 2017, the Fund engaged in credit default swap transactions (as a protection buyer) to hedge its credit exposure.
Strategic Alpha Fund is subject to the risk of unpredictable declines in the value of individual equity securities and periods of below-average performance in individual securities or in the equity market as a whole. The Fund may use futures contracts, purchased put options and written call options to hedge against a decline in value of an equity security that it owns. The Fund may also write put options to offset the cost of options used for hedging purposes. During the year ended December 31, 2017, the Fund engaged in futures and option contracts for hedging purposes.
Transactions in derivative instruments for Multi-Asset Income Fund during the year ended December 31, 2017, as reflected within the Statements of Operations were as follows:
| | | | |
Net Realized Gain (Loss) on: | | Forward foreign currency contracts | |
Foreign exchange contracts | | $ | (74,337 | ) |
111 |
Notes to Financial Statements (continued)
December 31, 2017
The following is a summary of derivative instruments for Strategic Alpha Fund as of December 31, 2017, as reflected within the Statements of Assets and Liabilities:
| | | | | | | | | | | | | | | | | | | | |
Assets | | Investments
at value1 | | | Unrealized
appreciation
on forward
foreign
currency
contracts | | | Unrealized
appreciation on
futures contracts2 | | | Swap
agreements
at value3 | | | Total | |
Over-the-counter asset derivatives | | | | | | | | | | | | | | | | | | | | |
Foreign exchange contracts | | $ | 299,637 | | | $ | 1,757,810 | | | $ | — | | | $ | — | | | $ | 2,057,447 | |
Credit contracts | | | — | | | | — | | | | — | | | | 629,175 | | | | 629,175 | |
| | | | | | | | | | | | | | | | | | | | |
Total over-the-counter asset derivatives | | $ | 299,637 | | | $ | 1,757,810 | | | $ | — | | | $ | 629,175 | | | $ | 2,686,622 | |
| | | | | | | | | | | | | | | | | | | | |
Exchange-traded/cleared asset derivatives | | | | | | | | | | | | | | | | | | | | |
Interest rate contracts | | $ | — | | | $ | — | | | $ | 255,857 | | | $ | 1,666,210 | | | $ | 1,922,067 | |
Equity contracts | | | 1,263,752 | | | | — | | | | — | | | | — | | | | 1,263,752 | |
| | | | | | | | | | | | | | | | | | | | |
Total exchange-traded/cleared asset derivatives | | $ | 1,263,752 | | | $ | — | | | $ | 255,857 | | | $ | 1,666,210 | | | $ | 3,185,819 | |
| | | | | | | | | | | | | | | | | | | | |
Total asset derivatives | | $ | 1,563,389 | | | $ | 1,757,810 | | | $ | 255,857 | | | $ | 2,295,385 | | | $ | 5,872,441 | |
| | | | | | | | | | | | | | | | | | | | |
| | | | | |
Liabilities | | Options written
at value | | | Unrealized
depreciation
on forward
foreign
currency
contracts | | | Unrealized
depreciation on
futures contracts2 | | | Swap
agreements
at value3 | | | Total | |
Over-the-counter liability derivatives | | | | | | | | | | | | | | | | | | | | |
Foreign exchange contracts | | $ | — | | | $ | (4,104,643 | ) | | $ | — | | | $ | — | | | $ | (4,104,643 | ) |
Credit contracts | | | — | | | | — | | | | — | | | | (387,565 | ) | | | (387,565 | ) |
| | | | | | | | | | | | | | | | | | | | |
Total over-the-counter liability derivatives | | $ | — | | | $ | (4,104,643 | ) | | $ | — | | | $ | (387,565 | ) | | $ | (4,492,208 | ) |
| | | | | | | | | | | | | | | | | | | | |
Exchange-traded/cleared liability derivatives | | | | | | | | | | | | | | | | | | | | |
Interest rate contracts | | $ | — | | | $ | — | | | $ | (514,553 | ) | | $ | (990,675 | ) | | $ | (1,505,228 | ) |
Equity contracts | | | (241,516 | ) | | | — | | | | (142,847 | ) | | | — | | | | (384,363 | ) |
| | | | | | | | | | | | | | | | | | | | |
Total exchange-traded/cleared liability derivatives | | $ | (241,516 | ) | | $ | — | | | $ | (657,400 | ) | | $ | (990,675 | ) | | $ | (1,889,591 | ) |
| | | | | | | | | | | | | | | | | | | | |
Total liability derivatives | | $ | (241,516 | ) | | $ | (4,104,643 | ) | | $ | (657,400 | ) | | $ | (1,378,240 | ) | | $ | (6,381,799 | ) |
| | | | | | | | | | | | | | | | | | | | |
| 1 | Represents purchased options, at value. |
| 2 | Represents cumulative unrealized appreciation (depreciation) on futures contracts. Only the current day’s variation margin on futures contracts is reported within the Statements of Assets and Liabilities as receivable or payable for variation margin, as applicable. |
| 112
Notes to Financial Statements (continued)
December 31, 2017
| 3 | Represents swap agreements, at value. Market value of swap agreements is reported in the Portfolio of Investments along with the unamortized upfront premium paid (received), if any, and unrealized appreciation (depreciation) on each individual contract. Unrealized appreciation (depreciation) and upfront premiums paid (received) are reported within the Statements of Assets and Liabilities. |
Transactions in derivative instruments for Strategic Alpha Fund during the year ended December 31, 2017, as reflected in the Statements of Operations were as follows:
| | | | | | | | | | | | | | | | | | | | |
Net Realized Gain (Loss) on: | | Investments4 | | | Futures
contracts | | | Options
written | | | Swap
agreements | | | Forward foreign
currency
contracts | |
Interest rate contracts | | $ | — | | | $ | (1,635,594 | ) | | $ | — | | | $ | 146,764 | | | $ | — | |
Foreign exchange contracts | | | (2,754,610 | ) | | | — | | | | — | | | | — | | | | (8,712,048 | ) |
Credit contracts | | | — | | | | — | | | | — | | | | (5,894,509 | ) | | | — | |
Equity contracts | | | 1,020,919 | | | | (4,609,358 | ) | | | (2,054,629 | ) | | | — | | | | — | |
| | | | | | | | | | | | | | | | | | | | |
Total | | $ | (1,733,691 | ) | | $ | (6,244,952 | ) | | $ | (2,054,629 | ) | | $ | (5,747,745 | ) | | $ | (8,712,048 | ) |
| | | | | | | | | | | | | | | | | | | | |
| | | | | |
Net Change in Unrealized
Appreciation (Depreciation) on: | | Investments4 | | | Futures
contracts | | | Options
written | | | Swap
agreements | | | Forward foreign
currency
contracts | |
Interest rate contracts | | $ | — | | | $ | (587,502 | ) | | $ | — | | | $ | 914,133 | | | $ | — | |
Foreign exchange contracts | | | 107,365 | | | | — | | | | — | | | | — | | | | (5,587,068 | ) |
Credit contracts | | | — | | | | — | | | | — | | | | 1,008,991 | | | | — | |
Equity contracts | | | (47,985 | ) | | | 26,001 | | | | 139,415 | | | | — | | | | — | |
| | | | | | | | | | | | | | | | | | | | |
Total | | $ | 59,380 | | | $ | (561,501 | ) | | $ | 139,415 | | | $ | 1,923,124 | | | $ | (5,587,068 | ) |
| | | | | | | | | | | | | | | | | | | | |
| 4 | Represents realized gain/loss and change in unrealized appreciation (depreciation), respectively, for purchased options during the period. |
As the Fund values its derivatives at fair value and recognizes changes in fair value through the Statements of Operations, it does not qualify for hedge accounting under authoritative guidance for derivative instruments. The Fund’s investments in derivatives may represent an economic hedge; however, they are considered to be non-hedge transactions for the purpose of these disclosures.
The volume of forward foreign currency contract activity, as a percentage of net assets, for Multi-Asset Income Fund based on gross month-end or daily (as applicable) notional amounts outstanding during the period, including long and short positions at absolute value, was as follows for the year ended December 31, 2017:
| | | | |
Multi-Asset Income Fund | | Forwards | |
Average Notional Amount Outstanding | | | 0.31 | % |
Highest Notional Amount Outstanding | | | 4.06 | % |
Lowest Notional Amount Outstanding | | | 0.00 | % |
Notional Amount Outstanding as of December 31, 2017 | | | 0.00 | % |
Notional amounts outstanding at the end of the prior period are included in the average notional amount outstanding.
113 |
Notes to Financial Statements (continued)
December 31, 2017
The volume of forward foreign currency contract, futures contract and swap agreement activity, as a percentage of net assets for Strategic Alpha Fund, based on gross month-end notional amounts outstanding during the period, including long and short positions at absolute value, was as follows for the year ended December 31, 2017:
| | | | | | | | | | | | | | | | |
Strategic Alpha Fund | | Forwards | | | Futures | | | Credit Default Swaps | | | Interest Rate Swaps | |
Average Notional Amount Outstanding | | | 39.87 | % | | | 64.26 | % | | | 7.60 | % | | | 24.80 | % |
Highest Notional Amount Outstanding | | | 51.71 | % | | | 118.42 | % | | | 11.06 | % | | | 61.08 | % |
Lowest Notional Amount Outstanding | | | 33.59 | % | | | 20.78 | % | | | 5.28 | % | | | 3.94 | % |
Notional Amount Outstanding as of December 31, 2017 | | | 33.74 | % | | | 20.78 | % | | | 5.28 | % | | | 41.49 | % |
Notional amounts outstanding at the end of the prior period, if applicable, are included in the averages above.
Unrealized gain and/or loss on open forwards, futures and swaps is recorded in the Statements of Assets and Liabilities. The aggregate notional values of forward, futures and swap contracts are not recorded in the Statements of Assets and Liabilities, and therefore are not included in the Fund’s net assets.
The volume of option contract activity, as a percentage of net assets for Strategic Alpha Fund, based on the month-end market values of instruments underlying purchased and written options, at absolute value, was as follows for the year ended December 31, 2017:
| | | | | | | | | | | | | | | | |
Strategic Alpha Fund | | Call Options
Purchased* | | | Put Options Purchased* | | | Call Options Written* | | | Put Options Written* | |
Average Market Value of Underlying Instruments | | | 1.74 | % | | | 7.78 | % | | | 1.75 | % | | | 1.09 | % |
Highest Market Value of Underlying Instruments | | | 3.44 | % | | | 14.96 | % | | | 3.92 | % | | | 4.76 | % |
Lowest Market Value of Underlying Instruments | | | 0.00 | % | | | 0.63 | % | | | 0.00 | % | | | 0.00 | % |
Market Value of Underlying Instruments as of December 31, 2017 | | | 2.00 | % | | | 5.84 | % | | | 2.40 | % | | | 1.58 | % |
| * | Market value of underlying instruments is determined as follows: for securities by multiplying option shares by the price of the option’s underlying security, for currencies by multiplying par value by the strike price and dividing by the foreign currency exchange rate, for foreign indices by multiplying the number of contracts by the contract multiplier by the price of the underlying index and dividing by the foreign currency exchange rate and for futures by multiplying the number of contracts by the contract multiplier by the price of the underlying futures contract. |
| 114
Notes to Financial Statements (continued)
December 31, 2017
Over-the-counter derivatives, including forward foreign currency contracts, options and swap agreements, are entered into pursuant to International Swaps and Derivatives Association, Inc. (“ISDA”) agreements negotiated between the Funds and their counterparties. ISDA agreements typically contain, among other things, terms for the posting of collateral and master netting provisions in the event of a default or other termination event. Collateral is posted by a Fund or the counterparty to the extent of the net mark-to-market exposure to the other party of all open contracts under the agreement, subject to minimum transfer requirements. Master netting provisions allow the Funds and the counterparty, in the event of a default or other termination event, to offset amounts owed by each related to derivative contracts, including any posted collateral, to one net amount payable by either the Funds or the counterparty. The Funds’ ISDA agreements typically contain provisions that allow a counterparty to terminate open contracts early if the NAV of a Fund declines beyond a certain threshold. For financial reporting purposes, the Funds do not offset derivative assets and liabilities, and any related collateral received or pledged, on the Statements of Assets and Liabilities.
As of December 31, 2017, gross amounts of over-the-counter derivative assets and liabilities not offset in the Statements of Assets and Liabilities and the related net amounts after taking into account master netting arrangements, by counterparty, are as follows:
Strategic Alpha Fund
| | | | | | | | | | | | | | | | | | | | |
Counterparty | | Gross Amounts of
Assets | | | Offset
Amount | | | Net
Asset
Balance | | | Collateral
(Received)/
Pledged | | | Net
Amount | |
Bank of America, N.A. | | $ | 1,023,260 | | | $ | (483,721 | ) | | $ | 539,539 | | | $ | (539,539 | ) | | $ | — | |
Citibank N.A. | | | 38,048 | | | | (1,119 | ) | | | 36,929 | | | | — | | | | 36,929 | |
Deutsche Bank AG | | | 59,536 | | | | (59,536 | ) | | | — | | | | — | | | | — | |
Goldman Sachs & Co. | | | 142,232 | | | | (95,730 | ) | | | 46,502 | | | | (46,502 | ) | | | — | |
HSBC Bank USA | | | 14,205 | | | | (10,431 | ) | | | 3,774 | | | | — | | | | 3,774 | |
JPMorgan Chase Bank N.A. | | | 93,688 | | | | (93,688 | ) | | | — | | | | — | | | | — | |
Morgan Stanley Capital Services, Inc. | | | 1,263,661 | | | | (1,263,661 | ) | | | — | | | | — | | | | — | |
UBS AG | | | 51,992 | | | | (51,992 | ) | | | — | | | | — | | | | — | |
| | | | | | | | | | | | | | | | | | | | |
| | $ | 2,686,622 | | | $ | (2,059,878 | ) | | $ | 626,744 | | | $ | (586,041 | ) | | $ | 40,703 | |
| | | | | | | | | | | | | | | | | | | | |
115 |
Notes to Financial Statements (continued)
December 31, 2017
| | | | | | | | | | | | | | | | | | | | |
Counterparty | | Gross Amounts of
Liabilities | | | Offset
Amount | | | Net
Liability
Balance | | | Collateral
(Received)/
Pledged | | | Net
Amount | |
Bank of America, N.A. | | $ | (483,721 | ) | | $ | 483,721 | | | $ | — | | | $ | — | | | $ | — | |
Barclays Capital, Inc. | | | (128,118 | ) | | | — | | | | (128,118 | ) | | | — | | | | (128,118 | ) |
BNP Paribas S.A. | | | (14,546 | ) | | | — | | | | (14,546 | ) | | | — | | | | (14,546 | ) |
Citibank N.A. | | | (1,119 | ) | | | 1,119 | | | | — | | | | — | | | | — | |
Credit Suisse International | | | (33,004 | ) | | | — | | | | (33,004 | ) | | | — | | | | (33,004 | ) |
Deutsche Bank AG | | | (887,769 | ) | | | 59,536 | | | | (828,233 | ) | | | 790,000 | | | | (38,233 | ) |
Goldman Sachs & Co. | | | (95,730 | ) | | | 95,730 | | | | — | | | | — | | | | — | |
HSBC Bank USA | | | (10,431 | ) | | | 10,431 | | | | — | | | | — | | | | — | |
JPMorgan Chase Bank N.A. | | | (143,806 | ) | | | 93,688 | | | | (50,118 | ) | | | 50,118 | | | | — | |
Morgan Stanley Capital Services, Inc. | | | (2,550,686 | ) | | | 1,263,661 | | | | (1,287,025 | ) | | | 1,287,025 | | | | — | |
UBS AG | | | (143,278 | ) | | | 51,992 | | | | (91,286 | ) | | | — | | | | (91,286 | ) |
| | | | | | | | | | | | | | | | | | | | |
| | $ | (4,492,208 | ) | | $ | 2,059,878 | | | $ | (2,432,330 | ) | | $ | 2,127,143 | | | $ | (305,187 | ) |
| | | | | | | | | | | | | | | | | | | | |
The actual collateral received or pledged, if any, may exceed the amounts shown in the table due to overcollateralization. Timing differences may exist between when contracts under the ISDA agreements are marked-to-market and when collateral moves. The ISDA agreements include tri-party control agreements under which collateral is held for the benefit of the secured party at a third party custodian, State Street Bank.
Counterparty risk is managed based on policies and procedures established by each Fund’s adviser. Such policies and procedures may include, but are not limited to, minimum counterparty credit rating requirements, monitoring of counterparty credit default swap spreads and posting of collateral. A Fund’s risk of loss from counterparty credit risk on over-the-counter derivatives is generally limited to the Fund’s aggregated unrealized gains and the amount of any collateral pledged to the counterparty, which may be offset by any collateral posted to the Fund by the counterparty. ISDA master agreements can help to manage counterparty risk by specifying collateral posting arrangements at pre-arranged exposure levels. Under these ISDA agreements, collateral is routinely transferred if the total net exposure in respect of certain transactions, net of existing collateral already in place, exceeds a specified amount (typically $250,000, depending on the counterparty). With exchange-traded derivatives, there is minimal counterparty credit risk to the Fund because the exchange’s clearinghouse, as counterparty to these instruments, stands between the buyer and the seller of the contract. Credit risk still exists in exchange-traded derivatives with respect to initial and variation margin that is held in a broker’s customer accounts. While brokers are required to segregate customer margin from their own assets, in the
| 116
Notes to Financial Statements (continued)
December 31, 2017
event that a broker becomes insolvent or goes into bankruptcy and at that time there is a shortfall in the aggregate amount of margin held by the broker for all its clients, U.S. bankruptcy laws will typically allocate that shortfall on a pro rata basis across all of the broker’s customers, potentially resulting in losses to the Fund. Based on balances reflected on each Fund’s Statement of Assets and Liabilities, the following table shows (i) the maximum amount of loss due to credit risk that, based on the gross fair value of the financial instrument, the Fund would incur if parties (including OTC derivative counterparties and brokers holding margin for exchange-traded derivatives) to the relevant financial instruments failed completely to perform according to the terms of the contracts and the collateral or other security, if any, for the amount due proved to be of no value to the Fund, and (ii) the amount of loss that the Fund would incur after taking into account master netting provisions pursuant to ISDA agreements, as of December 31, 2017:
| | | | | | | | |
Fund | | Maximum Amount of Loss - Gross | | | Maximum Amount of Loss - Net | |
Strategic Alpha Fund | | $ | 24,217,189 | | | $ | 19,444,127 | |
These amounts include cash received as collateral of $1,260,000, which is recorded on the Statements of Assets and Liabilities.
5. Purchases and Sales of Securities. For the year ended December 31, 2017, purchases and sales of securities (excluding short-term investments and option/swaption contracts and including paydowns) were as follows:
| | | | | | | | | | | | | | | | |
| | | U.S. Government/Agency
Securities | | | Other Securities | |
Fund | | Purchases | | | Sales | | | Purchases | | | Sales | |
Multi-Asset Income Fund | | $ | 19,282,802 | | | $ | 18,913,669 | | | $ | 276,129,052 | | | $ | 266,855,168 | |
Strategic Alpha Fund | | | 1,133,506,029 | | | | 1,133,821,315 | | | | 898,599,486 | | | | 866,776,446 | |
U.S. Equity Opportunities Fund | | | — | | | | — | | | | 255,410,913 | | | | 139,149,712 | |
6. Management Fees and Other Transactions with Affiliates.
a. Management Fees. Natixis Advisors, L.P. (“Natixis Advisors”) serves as investment adviser to each Fund, except Strategic Alpha Fund. Under the terms of the management agreements, each Fund pays a management fee at the following annual rates, calculated daily and payable monthly, based on each Fund’s average daily net assets:
| | | | | | | | |
| | | Percentage of Average
Daily Net Assets | |
Fund | | First $1 billion | | | Over $1 billion | |
Multi-Asset Income Fund | | | 0.55 | % | | | 0.50 | % |
U.S. Equity Opportunities Fund | | | 0.75 | % | | | 0.75 | % |
117 |
Notes to Financial Statements (continued)
December 31, 2017
Prior to July 1, 2017, the U.S. Equity Opportunities Fund paid a management fee at the annual rate of 0.80% of the Fund’s average daily net assets, calculated daily and payable monthly.
Natixis Advisors has entered into subadvisory agreements for each Fund as listed below.
| | |
Multi-Asset Income Fund | | Loomis, Sayles & Company, L.P. (“Loomis Sayles”) |
U.S. Equity Opportunities Fund | | Harris Associates L.P. (“Harris”) |
| | Loomis Sayles |
Under the terms of the subadvisory agreements, each Fund has agreed to pay its respective subadviser(s) a subadvisory fee at the following annual rates, calculated daily and payable monthly, based on each Fund’s/Segment’s average daily net assets:
| | | | | | | | | | |
| | | | | Percentage of Average
Daily Net Assets | |
Fund | | Subadviser | | First $1 billion | | | Over $1 billion | |
Multi-Asset Income Fund | | Loomis Sayles | | | 0.325 | % | | | 0.30 | % |
U.S. Equity Opportunities Fund | | | | | | | | | | |
Large Cap Growth Segment | | Harris | | | 0.52 | % | | | 0.52 | % |
All Cap Growth Segment | | Loomis Sayles | | | 0.35 | % | | | 0.35 | % |
Payments to Natixis Advisors are reduced by the amounts of payments to the subadvisers, as calculated based on the table above.
Certain officers and directors of Natixis Advisors and its affiliates are also officers or Trustees of the Funds. Natixis Advisors, Loomis Sayles and Harris are subsidiaries of Natixis Investment Managers, L.P. (“Natixis”), which is part of Natixis Investment Managers, an international asset management group based in Paris, France.
Loomis Sayles is the investment adviser to Strategic Alpha Fund. Loomis Sayles’ general partner is indirectly owned by Natixis. Under the terms of the management agreement, the Fund pays a management fee at the annual rate of 0.60% of the first $1.25 billion and 0.55% in excess of $1.25 billion of the Fund’s average daily net assets, calculated daily and payable monthly.
Prior to July 1, 2017, Strategic Alpha Fund paid a management fee at the annual rate of 0.70% of the Fund’s average daily net assets, calculated daily and payable monthly.
Natixis Advisors and Loomis Sayles have given binding undertakings to the Funds to waive management fees and/or reimburse certain expenses to limit the Funds’ operating expenses, exclusive of acquired fund fees and expenses, brokerage expenses, interest expense, taxes, organizational and extraordinary expenses such as
| 118
Notes to Financial Statements (continued)
December 31, 2017
litigation and indemnification expenses. These undertakings are in effect until April 30, 2018 for Multi Asset Income Fund and April 30, 2019 for Strategic Alpha Fund and U.S. Equity Opportunities Fund, may be terminated before then only with the consent of the Funds’ Board of Trustees, and are reevaluated on an annual basis. Management fees payable, as reflected on the Statements of Assets and Liabilities, is net of waivers and/or expense reimbursements, if any, pursuant to these undertakings. Waivers/reimbursements that exceed management fees payable are reflected on the Statements of Assets and Liabilities as receivable from investment adviser.
For the year ended December 31, 2017, the expense limits as a percentage of average daily net assets under the expense limitation agreements were as follows:
| | | | | | | | | | | | | | | | |
| | | Expense Limit as a Percentage of
Average Daily Net Assets | |
Fund | | Class A | | | Class C | | | Class N | | | Class Y | |
Multi-Asset Income Fund | | | 0.95 | % | | | 1.70 | % | | | 0.65 | % | | | 0.70 | % |
Strategic Alpha Fund | | | 1.00 | % | | | 1.75 | % | | | 0.70 | % | | | 0.75 | % |
U.S. Equity Opportunities Fund | | | 1.20 | % | | | 1.95 | % | | | 0.90 | % | | | 0.95 | % |
Prior to July 1, 2017, the expense limits as a percentage of average daily net assets under the expense limitation agreements for Strategic Alpha Fund and U.S. Equity Opportunities Fund were as follows:
| | | | | | | | | | | | | | | | |
| | | Expense Limit as a Percentage of
Average Daily Net Assets | |
Fund | | Class A | | | Class C | | | Class N | | | Class Y | |
Strategic Alpha Fund | | | 1.30 | % | | | 2.05 | % | | | 1.00 | % | | | 1.05 | % |
U.S. Equity Opportunities Fund | | | 1.25 | % | | | 2.00 | % | | | 0.95 | % | | | 1.00 | % |
Natixis Advisors and Loomis Sayles shall be permitted to recover expenses they have borne under the expense limitation agreements (whether through waiver of its management fees or otherwise) on a class by class basis in later periods to the extent the annual operating expenses of a class fall below a class’ expense limits, provided, however, that a class is not obligated to pay such waived/reimbursed fees or expenses more than one year after the end of the fiscal year in which the fees or expenses were waived/reimbursed.
119 |
Notes to Financial Statements (continued)
December 31, 2017
For the year ended December 31, 2017, the management fees and waivers of management fees for each Fund were as follows:
| | | | | | | | | | | | | | | | | | | | |
Fund | | Gross
Management
Fees | | | Contractual
Waivers of
Management
Fees1 | | | Net
Management
Fees | | | Percentage of
Average Daily
Net Assets | |
| | | | | | Gross | | | | Net | |
Multi-Asset Income Fund | | $ | 732,509 | | | $ | 237,312 | | | $ | 495,197 | | | | 0.55 | % | | | 0.37 | % |
Strategic Alpha Fund | | | 7,897,678 | | | | 88,753 | | | | 7,808,925 | | | | 0.65 | % | | | 0.64 | % |
U.S. Equity Opportunities Fund | | | 6,770,989 | | | | — | | | | 6,770,989 | | | | 0.77 | % | | | 0.77 | % |
| 1 | Management fee waiver is subject to possible recovery until December 31, 2018, though actual recovery is unlikely. |
No expenses were recovered during the year ended December 31, 2017 under the terms of the expense limitation agreement.
b. Service and Distribution Fees. Natixis Distribution, L.P. (“Natixis Distribution”), which is a wholly-owned subsidiary of Natixis US, has entered into a distribution agreement with the Trusts. Pursuant to this agreement, Natixis Distribution serves as principal underwriter of the Funds of the Trusts.
Pursuant to Rule 12b-1 under the 1940 Act, the Trusts have adopted a Service Plan relating to each Fund’s Class A shares (the “Class A Plans”) and a Distribution and Service Plan relating to each Fund’s Class C shares (the “Class C Plans”).
Under the Class A Plans, each Fund pays Natixis Distribution a monthly service fee at an annual rate not to exceed 0.25% of the average daily net assets attributable to the Fund’s Class A shares, as reimbursement for expenses incurred by Natixis Distribution in providing personal services to investors in Class A shares and/or the maintenance of shareholder accounts.
Under the Class C Plans, each Fund pays Natixis Distribution a monthly service fee at an annual rate not to exceed 0.25% of the average daily net assets attributable to the Fund’s Class C shares, as compensation for services provided by Natixis Distribution in providing personal services to investors in Class C shares and/or the maintenance of shareholder accounts.
Also under the Class C Plans, each Fund pays Natixis Distribution a monthly distribution fee at the annual rate of 0.75% of the average daily net assets attributable to the Fund’s Class C shares, as compensation for services provided by Natixis Distribution in connection with the marketing or sale of Class C shares.
| 120
Notes to Financial Statements (continued)
December 31, 2017
For the year ended December 31, 2017, the service and distribution fees for each Fund were as follows:
| | | | | | | | | | | | |
| | | Service Fees | | | Distribution Fees | |
Fund | | Class A | | | Class C | | | Class C | |
Multi-Asset Income Fund | | $ | 155,810 | | | $ | 102,416 | | | $ | 307,247 | |
Strategic Alpha Fund | | | 167,083 | | | | 96,805 | | | | 290,413 | |
U.S. Equity Opportunities Fund | | | 1,385,153 | | | | 235,142 | | | | 705,427 | |
c. Administrative Fees. Natixis Advisors provides certain administrative services for the Funds and contracts with State Street Bank to serve as sub-administrator. Pursuant to an agreement among Natixis Funds Trusts, Loomis Sayles Funds Trusts, Natixis ETF Trust and Natixis Advisors, each Fund pays Natixis Advisors monthly its pro rata portion of fees equal to an annual rate of 0.0575% of the first $15 billion of the average daily net assets of the Natixis Funds Trusts, Loomis Sayles Funds Trusts and Natixis ETF Trust, 0.0500% of the next $15 billion, 0.0400% of the next $30 billion, 0.0350% of the next $30 billion and 0.0325% of such assets in excess of $90 billion, subject to an annual aggregate minimum fee for the Natixis Funds Trusts, Loomis Sayles Funds Trusts and Natixis ETF Trust of $10 million, which is reevaluated on an annual basis.
For the year ended December 31, 2017, the administrative fees for each Fund were as follows:
| | | | |
Fund | | Administrative
Fees | |
Multi-Asset Income Fund | | $ | 59,310 | |
Strategic Alpha Fund | | | 541,351 | |
U.S. Equity Opportunities Fund | | | 390,154 | |
d. Sub-Transfer Agent Fees. Natixis Distribution has entered into agreements, which include servicing agreements, with financial intermediaries that provide recordkeeping, processing, shareholder communications and other services to customers of the intermediaries that hold positions in the Funds and has agreed to compensate the intermediaries for providing those services. Intermediaries transact with the Funds primarily through the use of omnibus accounts on behalf of their customers who hold positions in the Funds. These services would have been provided by the Funds’ transfer agent and other service providers if the shareholders’ accounts were maintained directly at the Funds’ transfer agent. Accordingly, the Funds have agreed to reimburse Natixis Distribution for all or a portion of the servicing fees paid to these intermediaries. The reimbursement amounts (sub-transfer agent fees) paid to Natixis Distribution are subject to a current per-account equivalent fee limit approved by the Funds’ Board of Trustees, which is based on fees for similar services paid to the Funds’ transfer agent and other service providers. Class N shares do not bear such expenses.
121 |
Notes to Financial Statements (continued)
December 31, 2017
For the year ended December 31, 2017, the sub-transfer agent fees (which are reflected in transfer agent fees and expenses in the Statements of Operations) for each Fund were as follows:
| | | | |
Fund | | Sub-Transfer
Agent Fees | |
Multi-Asset Income Fund | | $ | 73,429 | |
Strategic Alpha Fund | | | 717,834 | |
U.S. Equity Opportunities Fund | | | 379,682 | |
As of December 31, 2017, the Funds owe Natixis Distribution the following reimbursements for sub-transfer agent fees (which are reflected in the Statements of Assets and Liabilities as payable to distributor):
| | | | |
Fund | | Reimbursements of
Sub-Transfer
Agent Fees | |
Multi-Asset Income Fund | | $ | 922 | |
Strategic Alpha Fund | | | 8,361 | |
U.S. Equity Opportunities Fund | | | 5,054 | |
Sub-transfer agent fees attributable to Class A, Class C and Class Y are allocated on a pro rata basis to each class based on the relative net assets of each class to the total net assets of those classes.
e. Commissions. Commissions (including CDSCs) on Fund shares retained by Natixis Distribution during the year ended December 31, 2017 were as follows:
| | | | |
Fund | | Commissions | |
Multi-Asset Income Fund | | $ | 10,745 | |
Strategic Alpha Fund | | | 5,513 | |
U.S. Equity Opportunities Fund | | | 76,942 | |
f. Trustees Fees and Expenses. The Trusts do not pay any compensation directly to their officers or Trustees who are directors, officers or employees of Natixis Advisors, Natixis Distribution, Natixis or their affiliates. The Chairperson of the Board of Trustees receives a retainer fee at the annual rate of $325,000. The Chairperson does not receive any meeting attendance fees for Board of Trustees meetings or committee meetings that he attends. Each Independent Trustee (other than the Chairperson) receives, in the aggregate, a retainer fee at the annual rate of $155,000. Each Independent Trustee also receives a meeting attendance fee of $10,000 for each meeting of the Board of Trustees that he or she attends in person and $5,000 for each meeting of the Board of Trustees that he or she attends telephonically. In addition, the chairperson of the Contract Review Committee and the chairperson of the Audit Committee each receive an additional retainer fee at the annual rate of $17,500. The chairperson of the Governance Committee
| 122
Notes to Financial Statements (continued)
December 31, 2017
receives an additional retainer fee at the annual rate of $10,000. Each Contract Review Committee member is compensated $6,000 for each Committee meeting that he or she attends in person and $3,000 for each meeting that he or she attends telephonically. Each Audit Committee member is compensated $6,000 for each Committee meeting that he or she attends in person and $3,000 for each meeting that he or she attends telephonically. These fees are allocated among the funds in the Natixis Funds Trusts, Loomis Sayles Funds Trusts and Natixis ETF Trust based on a formula that takes into account, among other factors, the relative net assets of each fund. Trustees are reimbursed for travel expenses in connection with attendance at meetings.
Effective January 1, 2018, the Chairperson of the Board will receive a retainer fee at the annual rate of $340,000, each Independent Trustee (other than the Chairperson) will receive, in the aggregate, a retainer fee at the annual rate of $170,000, the chairperson of the Contract Review Committee and Audit Committee each will receive an additional retainer fee at the annual rate of $20,000 and the chairperson of the Governance Committee will receive an additional retainer fee at the annual rate of $12,000. All other Trustee fees will remain unchanged.
A deferred compensation plan (the “Plan”) is available to the Trustees on a voluntary basis. Deferred amounts remain in the Funds until distributed in accordance with the provisions of the Plan. The value of a participating Trustee’s deferral account is based on theoretical investments of deferred amounts, on the normal payment dates, in certain funds of the Natixis Funds Trusts, Loomis Sayles Funds Trusts and Natixis ETF Trust as designated by the participating Trustees. Changes in the value of participants’ deferral accounts are allocated pro rata among the funds in the Natixis Funds Trusts, Loomis Sayles Funds Trusts and Natixis ETF Trust and are normally reflected as Trustees’ fees and expenses in the Statements of Operations. The portions of the accrued obligations allocated to the Funds under the Plan are reflected as Deferred Trustees’ fees in the Statements of Assets and Liabilities.
g. Reimbursement of Transfer Agent Fees and Expenses. Natixis Advisors has given a binding contractual undertaking to the Funds to reimburse any and all transfer agency expenses for the Funds’ Class N shares. This undertaking is in effect through April 30, 2018 and is not subject to recovery under the expense limitation agreement described above.
| | | | |
| | | Reimbursement of
Transfer Agent
Fees and Expenses | |
Fund | | Class N | |
Multi-Asset Income Fund | | $ | 161 | |
Strategic Alpha Fund | | | 193 | |
U.S. Equity Opportunities Fund | | | 92 | |
123 |
Notes to Financial Statements (continued)
December 31, 2017
h. Affiliated Ownership. As of December 31, 2017, the Loomis Sayles Employees’ Profit Sharing Retirement Plan held shares of Strategic Alpha Fund representing 0.17% of the Fund’s net assets. Natixis US and affiliates held shares of U.S. Equity Opportunities Fund representing less than 0.01% of the Fund’s net assets.
i. Payment by Affiliates. For the year ended December 31, 2017, Loomis Sayles reimbursed Multi-Asset Income Fund $677 and Strategic Alpha Fund $12,690 for losses incurred in connection with trading errors.
7. Class-Specific Transfer Agent Fees and Expenses. Transfer agent fees and expenses attributable to Class A, Class C, and Class Y are allocated on a pro rata basis to each class based on the relative net assets of each class to the total net assets of those classes. Transfer agent fees and expenses attributable to Class N are allocated to Class N.
For the year ended December 31, 2017, Multi-Asset Income Fund incurred the following class-specific transfer agent fees and expenses (including sub-transfer agent fees, where applicable):
| | | | | | | | | | | | | | | | |
| | | Transfer Agent Fees and Expenses | |
Fund | | Class A | | | Class C | | | Class N | | | Class Y | |
Multi-Asset Income Fund | | $ | 42,381 | | | $ | 27,965 | | | $ | 161 | | | $ | 19,927 | |
For the period from May 1, 2017, commencement of Class N operations, through December 31, 2017, Strategic Alpha Fund and U.S. Equity Opportunities Fund incurred the following class-specific transfer agent fees and expenses (including sub-transfer agent fees, where applicable):
| | | | | | | | | | | | | | | | |
| | | Transfer Agent Fees and Expenses | |
Fund | | Class A | | | Class C | | | Class N | | | Class Y | |
Strategic Alpha Fund | | $ | 27,072 | | | $ | 14,938 | | | $ | 193 | | | $ | 449,118 | |
U.S. Equity Opportunities | | | 317,930 | | | | 55,364 | | | | 92 | | | | 139,884 | |
8. Line of Credit. Each Fund, together with certain other funds of Natixis Funds Trusts and Loomis Sayles Funds Trusts, entered into a 364-day, $400,000,000 syndicated, committed, unsecured line of credit with Citibank, N.A. to be used for temporary or emergency purposes only. Any one Fund may borrow up to the full $400,000,000 under the line of credit (as long as all borrowings by all Funds in the aggregate do not exceed the $400,000,000 limit at any time) subject to each Fund’s investment restrictions. Interest is charged to the Funds at a rate equal to the greater of the eurodollar or the federal funds rate plus 1.00%. In addition, a commitment fee of 0.15% per annum, payable on the last business day of each month, is accrued and apportioned among the participating funds based on their average daily unused portion of the line of credit. The Funds paid an arrangement fee, an upfront fee, and other fees in connection with the new line of credit agreement, which are being amortized over a period of 364 days and are reflected as miscellaneous expenses on the Statements of Operations. The unamortized balance is reflected as prepaid expenses on the Statements of Assets and Liabilities.
| 124
Notes to Financial Statements (continued)
December 31, 2017
Prior to April 13, 2017, the commitment fee was 0.10% per annum based on the average daily unused portion of the line of credit.
For the year ended December 31, 2017, none of the Funds had borrowings under these agreements.
9. Brokerage Commission Recapture. Certain Funds have entered into agreements with certain brokers whereby the brokers will rebate a portion of brokerage commissions. All amounts rebated by the brokers are returned to the Funds under such agreements and are included in realized gains on investments in the Statements of Operations. For the year ended December 31, 2017, amounts rebated under these agreements were as follows:
| | | | |
Fund | | Rebates | |
Multi-Asset Income Fund | | $ | 2,908 | |
U.S. Equity Opportunities Fund | | | 10,828 | |
10. Concentration of Risk. Each Fund’s investments in foreign securities are subject to foreign currency fluctuations, higher volatility than U.S. securities, varying degrees of regulation and limited liquidity. Greater political, economic, credit and information risks are also associated with foreign securities.
Strategic Alpha Fund is non-diversified, which means it is not limited under the 1940 Act to a percentage of assets that it may invest in any one issuer. Because the Fund may invest in the securities of a limited number of issuers, an investment in the Fund may involve a higher degree of risk than would be present in a diversified portfolio.
11. Concentration of Ownership. From time to time, a Fund may have a concentration of one or more accounts constituting a significant percentage of shares outstanding. Investment activities by holders of such accounts could have material impacts on the Funds. As of December 31, 2017, based on management’s evaluation of the shareholder account base, the Fund had accounts representing controlling ownership of more than 5% of the Fund’s total outstanding shares. The number of such accounts, based on accounts that represent more than 5% of an individual class of shares, and the aggregate percentage of net assets represented by such holdings were as follows:
| | | | | | | | |
| | | Number of 5%
Non-Affiliated
Account Holders | | | Percentage of
Ownership | |
Strategic Alpha Fund | | | 3 | | | | 44.75 | % |
Omnibus shareholder accounts for which Natixis Advisors understands that the intermediary has discretion over the underlying shareholder accounts or investment models where a shareholder account may be invested for a non-discretionary customer are included in the table above. For other omnibus accounts, the Funds do
125 |
Notes to Financial Statements (continued)
December 31, 2017
not have information on the individual shareholder accounts underlying the omnibus accounts; therefore, there could be other 5% shareholders in addition to those disclosed in the table above.
12. Capital Shares. Each Fund may issue an unlimited number of shares of beneficial interest, without par value. Transactions in capital shares were as follows:
| | | | | | | | | | | | | | | | |
| |
| Year Ended
December 31, 2017 |
| |
| Year Ended
December 31, 2016 |
|
Multi-Asset Income Fund | | | Shares | | | | Amount | | | | Shares | | | | Amount | |
| Class A | | | | | | | | | | | | | | | | |
Issued from the sale of shares | | | 1,702,656 | | | $ | 23,493,500 | | | | 964,767 | | | $ | 12,838,875 | |
Issued in connection with the reinvestment of distributions | | | 233,713 | | | | 3,230,966 | | | | 229,840 | | | | 3,055,639 | |
Redeemed | | | (2,320,403 | ) | | | (32,491,498 | ) | | | (1,787,134 | ) | | | (23,410,657 | ) |
| | | | | | | | | | | | | | | | |
Net change | | | (384,034 | ) | | $ | (5,767,032 | ) | | | (592,527 | ) | | $ | (7,516,143 | ) |
| | | | | | | | | | | | | | | | |
| Class C | | | | | | | | | | | | | | | | |
Issued from the sale of shares | | | 319,241 | | | $ | 4,385,407 | | | | 507,201 | | | $ | 6,771,235 | |
Issued in connection with the reinvestment of distributions | | | 128,351 | | | | 1,767,902 | | | | 125,023 | | | | 1,656,083 | |
Redeemed | | | (1,298,794 | ) | | | (17,826,010 | ) | | | (849,899 | ) | | | (11,247,092 | ) |
| | | | | | | | | | | | | | | | |
Net change | | | (851,202 | ) | | $ | (11,672,701 | ) | | | (217,675 | ) | | $ | (2,819,774 | ) |
| | | | | | | | | | | | | | | | |
| Class N | | | | | | | | | | | | | | | | |
Issued from the sale of shares | | | 2,278 | | | $ | 30,680 | | | | — | | | $ | — | |
Issued in connection with the reinvestment of distributions | | | 176 | | | | 2,422 | | | | 6 | | | | 75 | |
| | | | | | | | | | | | | | | | |
Net change | | | 2,454 | | | $ | 33,102 | | | | 6 | | | $ | 75 | |
| | | | | | | | | | | | | | | | |
| Class Y | | | | | | | | | | | | | | | | |
Issued from the sale of shares | | | 2,592,244 | | | $ | 36,192,848 | | | | 1,218,325 | | | $ | 16,358,206 | |
Issued in connection with the reinvestment of distributions | | | 182,515 | | | | 2,511,877 | | | | 88,064 | | | | 1,165,946 | |
Redeemed | | | (464,288 | ) | | | (6,389,575 | ) | | | (661,295 | ) | | | (8,670,628 | ) |
| | | | | | | | | | | | | | | | |
Net change | | | 2,310,471 | | | $ | 32,315,150 | | | | 645,094 | | | $ | 8,853,524 | |
| | | | | | | | | | | | | | | | |
Increase (decrease) from capital share transactions | | | 1,077,689 | | | $ | 14,908,519 | | | | (165,102 | ) | | $ | (1,482,318 | ) |
| | | | | | | | | | | | | | | | |
| 126
Notes to Financial Statements (continued)
December 31, 2017
12. Capital Shares (continued).
| | | | | | | | | | | | | | | | |
| |
| Year Ended
December 31, 2017 |
| |
| Year Ended
December 31, 2016 |
|
Strategic Alpha Fund | | | Shares | | | | Amount | | | | Shares | | | | Amount | |
| Class A | | | | | | | | | | | | | | | | |
Issued from the sale of shares | | | 1,948,117 | | | $ | 19,283,141 | | | | 2,073,679 | | | $ | 19,966,508 | |
Issued in connection with the reinvestment of distributions | | | 105,767 | | | | 1,044,208 | | | | 102,020 | | | | 979,713 | |
Redeemed | | | (6,100,848 | ) | | | (60,665,342 | ) | | | (7,583,445 | ) | | | (71,672,383 | ) |
| | | | | | | | | | | | | | | | |
Net change | | | (4,046,964 | ) | | $ | (40,337,993 | ) | | | (5,407,746 | ) | | $ | (50,726,162 | ) |
| | | | | | | | | | | | | | | | |
| Class C | | | | | | | | | | | | | | | | |
Issued from the sale of shares | | | 316,552 | | | $ | 3,122,878 | | | | 285,547 | | | $ | 2,782,194 | |
Issued in connection with the reinvestment of distributions | | | 48,399 | | | | 475,946 | | | | 45,145 | | | | 430,682 | |
Redeemed | | | (1,595,852 | ) | | | (15,731,090 | ) | | | (2,312,367 | ) | | | (22,078,378 | ) |
| | | | | | | | | | | | | | | | |
Net change | | | (1,230,901 | ) | | $ | (12,132,266 | ) | | | (1,981,675 | ) | | $ | (18,865,502 | ) |
| | | | | | | | | | | | | | | | |
| Class N(a) | | | | | | | | | | | | | | | | |
Issued from the sale of shares | | | 5,928,692 | | | $ | 58,808,207 | | | | — | | | $ | — | |
Issued in connection with the reinvestment of distributions | | | 75,346 | | | | 744,780 | | | | — | | | | — | |
Redeemed | | | (13,065 | ) | | | (130,000 | ) | | | — | | | | — | |
| | | | | | | | | | | | | | | | |
Net change | | | 5,990,973 | | | $ | 59,422,987 | | | | — | | | $ | — | |
| | | | | | | | | | | | | | | | |
| Class Y | | | | | | | | | | | | | | | | |
Issued from the sale of shares | | | 34,490,858 | | | $ | 341,479,931 | | | | 28,064,358 | | | $ | 270,266,593 | |
Issued in connection with the reinvestment of distributions | | | 2,221,504 | | | | 21,892,730 | | | | 1,876,898 | | | | 18,017,506 | |
Redeemed | | | (42,506,371 | ) | | | (420,835,953 | ) | | | (45,303,829 | ) | | | (432,597,106 | ) |
| | | | | | | | | | | | | | | | |
Net change | | | (5,794,009 | ) | | $ | (57,463,292 | ) | | | (15,362,573 | ) | | $ | (144,313,007 | ) |
| | | | | | | | | | | | | | | | |
Increase (decrease) from capital share transactions | | | (5,080,901 | ) | | $ | (50,510,564 | ) | | | (22,751,994 | ) | | $ | (213,904,671 | ) |
| | | | | | | | | | | | | | | | |
| (a) | From commencement of Class operations on May 1, 2017 through December 31, 2017. |
127 |
Notes to Financial Statements (continued)
December 31, 2017
12. Capital Shares (continued).
| | | | | | | | | | | | | | | | |
| |
| Year Ended
December 31, 2017 |
| |
| Year Ended
December 31, 2016 |
|
U.S. Equity Opportunities Fund | | | Shares | | | | Amount | | | | Shares | | | | Amount | |
| Class A | | | | | | | | | | | | | | | | |
Issued from the sale of shares | | | 3,144,209 | | | $ | 104,303,464 | | | | 2,226,069 | | | $ | 61,833,280 | |
Issued in connection with the reinvestment of distributions | | | 540,145 | | | | 19,749,734 | | | | 292,665 | | | | 8,405,917 | |
Redeemed | | | (2,915,369 | ) | | | (99,731,079 | ) | | | (2,200,041 | ) | | | (61,873,204 | ) |
| | | | | | | | | | | | | | | | |
Net change | | | 768,985 | | | $ | 24,322,119 | | | | 318,693 | | | $ | 8,365,993 | |
| | | | | | | | | | | | | | | | |
| Class B(a) | | | | | | | | | | | | | | | | |
Issued from the sale of shares | | | — | | | $ | — | | | | — | | | $ | — | |
Issued in connection with the reinvestment of distributions | | | — | | | | — | | | | — | | | | — | |
Redeemed | | | — | | | | — | | | | (8,466 | ) | | | (156,331 | ) |
| | | | | | | | | | | | | | | | |
Net change | | | — | | | $ | — | | | | (8,466 | ) | | $ | (156,331 | ) |
| | | | | | | | | | | | | | | | |
| Class C | | | | | | | | | | | | | | | | |
Issued from the sale of shares | | | 1,565,056 | | | $ | 37,342,545 | | | | 737,164 | | | $ | 15,374,320 | |
Issued in connection with the reinvestment of distributions | | | 175,190 | | | | 4,480,476 | | | | 61,245 | | | | 1,243,880 | |
Redeemed | | | (741,641 | ) | | | (17,783,250 | ) | | | (534,495 | ) | | | (10,851,615 | ) |
| | | | | | | | | | | | | | | | |
Net change | | | 998,605 | | | $ | 24,039,771 | | | | 263,914 | | | $ | 5,766,585 | |
| | | | | | | | | | | | | | | | |
| Class N(b) | | | | | | | | | | | | | | | | |
Issued from the sale of shares | | | 26 | | | $ | 1,001 | | | | — | | | $ | — | |
Issued in connection with the reinvestment of distributions | | | 1 | | | | 35 | | | | — | | | | — | |
| | | | | | | | | | | | | | | | |
Net change | | | 27 | | | $ | 1,036 | | | | — | | | $ | — | |
| | | | | | | | | | | | | | | | |
| Class Y | | | | | | | | | | | | | | | | |
Issued from the sale of shares | | | 4,351,889 | | | $ | 168,730,051 | | | | 2,820,038 | | | $ | 95,090,135 | |
Issued in connection with the reinvestment of distributions | | | 179,584 | | | | 7,609,993 | | | | 48,742 | | | | 1,650,830 | |
Redeemed | | | (1,961,859 | ) | | | (78,357,163 | ) | | | (983,768 | ) | | | (31,028,910 | ) |
| | | | | | | | | | | | | | | | |
Net change | | | 2,569,614 | | | $ | 97,982,881 | | | | 1,885,012 | | | $ | 65,712,055 | |
| | | | | | | | | | | | | | | | |
Increase (decrease) from capital share transactions | | | 4,337,231 | | | $ | 146,345,807 | | | | 2,459,153 | | | $ | 79,688,302 | |
| | | | | | | | | | | | | | | | |
| (a) | On January 11, 2016, Class B shares were converted into Class A shares. See Note 1 of Notes to Financial Statements. |
| (b) | From commencement of Class operations on May 1, 2017 through December 31, 2017. |
| 128
Report of Independent Registered Public Accounting Firm
To the Board of Trustees of Natixis Funds Trust I and Natixis Funds Trust II and Shareholders of Loomis Sayles Multi-Asset Income Fund, Natixis U.S. Equity Opportunities Fund, and Loomis Sayles Strategic Alpha Fund:
Opinions on the Financial Statements
We have audited the accompanying statements of assets and liabilities, including the portfolios of investments, of Loomis Sayles Multi-Asset Income Fund and Natixis U.S. Equity Opportunities Fund (two of the funds constituting the Natixis Funds Trust I), and Loomis Sayles Strategic Alpha Fund (one of the funds constituting the Natixis Funds II) (hereafter collectively referred to as the “Funds”) as of December 31, 2017, the related statements of operations for the year ended December 31, 2017, the statements of changes in net assets for each of the two years in the periods ended December 31, 2017, including the related notes, and the financial highlights for each of the periods indicated therein (collectively referred to as the “financial statements”). In our opinion, the financial statements present fairly, in all material respects, the financial position of each of the Funds as of December 31, 2017, the results of each of their operations for the year then ended, the changes in each of their net assets for each of the two years in the periods ended December 31, 2017 and each of the financial highlights for each of the periods indicated therein in conformity with accounting principles generally accepted in the United States of America.
Basis for Opinions
These financial statements are the responsibility of the Funds’ management. Our responsibility is to express an opinion on the Funds’ financial statements based on our audits. We are a public accounting firm registered with the Public Company Accounting Oversight Board (United States) (“PCAOB”) and are required to be independent with respect to the Funds in accordance with the U.S. federal securities laws and the applicable rules and regulations of the Securities and Exchange Commission and the PCAOB.
We conducted our audits of these financial statements in accordance with the standards of the PCAOB. Those standards require that we plan and perform the audit to obtain reasonable assurance about whether the financial statements are free of material misstatement, whether due to error or fraud.
Our audits included performing procedures to assess the risks of material misstatement of the financial statements, whether due to error or fraud, and performing procedures that respond to those risks. Such procedures included examining, on a test basis, evidence regarding the amounts and disclosures in the financial statements. Our audits also included evaluating the accounting principles used and significant estimates made by management, as well as evaluating the overall presentation of the financial
129 |
Report of Independent Registered Public Accounting Firm
statements. Our procedures included confirmation of securities owned as of December 31, 2017 by correspondence with the custodian, and brokers; when replies were not received from brokers, we performed other auditing procedures. We believe that our audits provide a reasonable basis for our opinions.
/s/ PricewaterhouseCoopers LLP
Boston, Massachusetts
February 22, 2018
We have served as the auditor of one or more investment companies in the Natixis Investment Company Complex since at least 1995. We have not determined the specific year we began serving as auditor.
| 130
2017 U.S. Tax Distribution Information to Shareholders (Unaudited)
Corporate Dividends Received Deduction. For the fiscal year ended December 31, 2017, a percentage of dividends distributed by the Funds listed below qualify for the dividends received deduction for corporate shareholders. These percentages are as follows:
| | | | |
Fund | | Qualifying Percentage | |
Multi-Asset Income Fund | | | 15.58 | % |
Strategic Alpha Fund | | | 7.41 | % |
U.S. Equity Opportunities Fund | | | 100.00 | % |
Capital Gains Distributions. Pursuant to Internal Revenue Section 852(b), the following Funds paid distributions, which have been designated as capital gains distributions for the fiscal year ended December 31, 2017.
| | | | |
Fund | | Amount | |
Multi-Asset Income Fund | | $ | 2,833,637 | |
U.S. Equity Opportunities Fund | | | 29,396,069 | |
Qualified Dividend Income. For the fiscal year ended December 31, 2017, a percentage of the ordinary income dividends paid by the Fund are considered qualified dividend income eligible for reduced tax rates. These lower rates range from 0% to 20% depending on an individual’s tax bracket. If the Fund paid a distribution during calendar year 2017, complete information will be reported in conjunction with Form 1099-DIV. This percentage is noted below:
| | | | |
Fund | | Qualifying Percentage | |
Multi-Asset Income Fund | | | 25.53 | % |
Strategic Alpha Fund | | | 2.65 | % |
U.S. Equity Opportunities Fund | | | 100.00 | % |
131 |
Additional Information
Special Meeting of Shareholders. (Unaudited)
A special meeting of shareholders of the Trusts was held on December 4, 2017 to consider a proposal to elect thirteen Trustees to the Board of Trustees. The proposal was approved by shareholders of the Trusts. The results of the shareholder vote were as follows:
| | | | | | | | |
Nominee | | Voted “For”* | | | Withheld* | |
Kevin P. Charleston | | | 370,772,225.201 | | | | 2,295,844.378 | |
Kenneth A. Drucker | | | 370,283,839.168 | | | | 2,784,230.411 | |
Edmond J. English | | | 370,659,753.916 | | | | 2,408,315.663 | |
David L. Giunta | | | 370,784,195.912 | | | | 2,283,873.667 | |
Richard A. Goglia | | | 370,460,463.208 | | | | 2,607,606.371 | |
Wendell J. Knox | | | 370,534,122.392 | | | | 2,533,947.187 | |
Martin T. Meehan | | | 370,538,829.643 | | | | 2,529,239.936 | |
Maureen B. Mitchell | | | 370,919,944.816 | | | | 2,148,124.763 | |
Sandra O. Moose** | | | 370,426,616.935 | | | | 2,641,452.644 | |
James P. Palermo | | | 370,643,215.858 | | | | 2,424,853.721 | |
Erik R. Sirri | | | 370,711,200.752 | | | | 2,356,868.827 | |
Peter J. Smail | | | 370,588,393.592 | | | | 2,479,675.987 | |
Cynthia L. Walker | | | 370,711,120.477 | | | | 2,356,949.102 | |
| * | Trust-wide voting results. |
| ** | Ms. Moose retired as a Trustee effective January 1, 2018. |
| | | | | | | | |
Nominee | | Voted “For”* | | | Withheld* | |
Kevin P. Charleston | | | 869,803,137.844 | | | | 5,278,477.797 | |
Kenneth A. Drucker | | | 869,573,100.272 | | | | 5,508,515.369 | |
Edmond J. English | | | 869,760,094.572 | | | | 5,321,521.069 | |
David L. Giunta | | | 869,722,105.493 | | | | 5,359,510.148 | |
Richard A. Goglia | | | 869,845,876.582 | | | | 5,235,739.059 | |
Wendell J. Knox | | | 869,633,400.572 | | | | 5,448,215.069 | |
Martin T. Meehan | | | 869,982,234.293 | | | | 5,099,381.348 | |
Maureen B. Mitchell | | | 869,672,122.531 | | | | 5,409,493.110 | |
Sandra O. Moose** | | | 868,954,166.321 | | | | 6,127,449.320 | |
James P. Palermo | | | 870,130,688.893 | | | | 4,950,926.748 | |
Erik R. Sirri | | | 869,769,012.873 | | | | 5,312,602.768 | |
Peter J. Smail | | | 869,714,774.773 | | | | 5,366,840.868 | |
Cynthia L. Walker | | | 869,589,551.601 | | | | 5,492,064.040 | |
| * | Trust-wide voting results. |
| ** | Ms. Moose retired as a Trustee effective January 1, 2018. |
| 132
Trustee and Officer Information
The tables below provide certain information regarding the trustees and officers of Natixis Funds Trust I and Natixis Funds Trust II (the “Trusts”). Unless otherwise indicated, the address of all persons below is 888 Boylston Street, Suite 800, Boston, MA 02199-8197. The Fund’s Statements of Additional Information includes additional information about the trustees of the Trusts and are available by calling Natixis Funds at 800-225-5478.
| | | | | | | | |
Name and Year of Birth | | Position(s) Held with the Trusts, Length of Time Served and Term of Office1 | | Principal Occupation(s) During Past 5 Years | | Number of Portfolios in Fund Complex
Overseen2 and Other
Directorships Held
During Past 5 Years | | Experience, Qualifications, Attributes, Skills for Board Membership |
|
| INDEPENDENT TRUSTEES |
| | | | |
Kenneth A. Drucker (1945) | | Chairperson of the Board of Trustees since January 2017 Trustee since 2008 Ex Officio member of Audit Committee, Contract Review Committee and Governance Committee | | Retired | | 54 None | | Significant experience on the Board and on the boards of other business organizations (including at investment companies); executive experience (including as treasurer of an aerospace, automotive, and metal manufacturing corporation) |
| | | | |
Edmond J. English (1953) | | Trustee since 2013 Audit Committee Member and Governance Committee Member | | Executive Chairman; formerly, Chief Executive Officer of Bob’s Discount Furniture (retail) | | 54 Director, Burlington Stores, Inc. (retail) | | Significant experience on the Board and significant experience on the boards of other business organizations (including retail companies and a bank); executive experience (including at a retail company) |
133 |
Trustee and Officer Information
| | | | | | | | |
Name and Year of Birth | | Position(s) Held with the Trusts, Length of Time Served and Term of Office1 | | Principal Occupation(s) During Past 5 Years | | Number of Portfolios in Fund Complex Overseen2 and Other Directorships Held During Past 5 Years | | Experience, Qualifications, Attributes, Skills for Board Membership |
|
INDEPENDENT TRUSTEES continued |
| | | | |
Richard A. Goglia (1951) | | Trustee since 2015 Audit Committee Member | | Retired; formerly Vice President and Treasurer of Raytheon Company (defense) | | 54 None | | Experience on the Board and executive experience (including his role as vice president and treasurer of a defense company and experience at a financial services company) |
| | | | |
Wendell J. Knox (1948) | | Trustee since 2009 Contract Review Committee Member and Governance Committee Member | | Director of Abt Associates Inc. (research and consulting) | | 54 Director, Eastern Bank (bank); Director, The Hanover Insurance Group (property and casualty insurance) | | Significant experience on the Board and on the boards of other business organizations (including at a bank and at a property and casualty insurance firm); executive experience (including roles as president and chief executive officer of a research and consulting company) |
| 134
Trustee and Officer Information
| | | | | | | | |
Name and Year of Birth | | Position(s) Held with the Trusts, Length of Time Served and Term of Office1 | | Principal Occupation(s) During Past 5 Years | | Number of Portfolios in Fund Complex Overseen2 and Other Directorships Held During Past 5 Years | | Experience, Qualifications, Attributes, Skills for Board Membership |
|
INDEPENDENT TRUSTEES continued |
| | | | |
Martin T. Meehan (1956) | | Trustee since 2012 Audit Committee Member | | President, University of Massachusetts; formerly, Chancellor and faculty member, University of Massachusetts Lowell | | 54 None | | Significant experience on the Board and on the boards of other business organizations; experience as President of the University of Massachusetts; government experience (including as a member of the U.S. House of Representatives); academic experience |
| | | | |
Maureen B. Mitchell3 (1951) | | Trustee since 2017 Contract Review Committee Member | | Retired; formerly President, Global Sales and Marketing, GE Asset Management, Inc. (financial services) | | 54 None | | Experience on the Board; financial services industry and executive experience (including role as president of global sales and marketing at a financial services company) |
| | | | |
James P. Palermo (1955) | | Trustee since 2016 Contract Review Committee Member | | Founding Partner, Breton Capital Management, LLC (private equity); Partner, STEP Partners, LLC (private equity); formerly, Chief Executive Officer of Global Client Management of The Bank of New York Mellon Corporation | | 54 None | | Experience on the Board; financial services industry and executive experience (including roles as chief executive officer of client management and asset servicing for a banking and financial services company) |
135 |
Trustee and Officer Information
| | | | | | | | |
Name and Year of Birth | | Position(s) Held with the Trusts, Length of Time Served and Term of Office1 | | Principal Occupation(s) During Past 5 Years | | Number of Portfolios in Fund Complex Overseen2 and Other Directorships Held During Past 5 Years | | Experience, Qualifications, Attributes, Skills for Board Membership |
|
INDEPENDENT TRUSTEES continued |
| | | | |
Erik R. Sirri (1958) | | Trustee since 2009 Chairperson of the Audit Committee | | Professor of Finance at Babson College | | 54 None | | Significant experience on the Board; experience as Director of the Division of Trading and Markets at the Securities and Exchange Commission; academic experience; training as an economist |
| | | | |
Peter J. Smail (1952) | | Trustee since 2009 Chairperson of the Contract Review Committee and Governance Committee Member | | Retired | | 54 None | | Significant experience on the Board; mutual fund industry and executive experience (including roles as president and chief executive officer for an investment adviser) |
| | | | |
Cynthia L. Walker (1956) | | Trustee since 2005 Chairperson of the Governance Committee and Audit Committee Member | | Deputy Dean for Finance and Administration, Yale University School of Medicine | | 54 None | | Significant experience on the Board; executive experience in a variety of academic organizations (including roles as dean for finance and administration) |
| 136
Trustee and Officer Information
| | | | | | | | |
Name and Year of Birth | | Position(s) Held with the Trusts, Length of Time Served and Term of Office1 | | Principal Occupation(s) During Past 5 Years | | Number of Portfolios in Fund Complex Overseen2 and Other Directorships Held During Past 5 Years | | Experience, Qualifications, Attributes, Skills for Board Membership |
|
| INTERESTED TRUSTEES |
| | | | |
Kevin P. Charleston4 (1965) One Financial Center Boston, MA 02111 | | Trustee since 2015 | | President, Chief Executive Officer and Chairman of the Board of Directors; formerly, Chief Financial Officer, Loomis, Sayles & Company, L.P. | | 54 None | | Experience on the Board; continuing service as President, Chief Executive Officer and Chairman of the Board of Directors of Loomis, Sayles & Company, L.P. |
| | | | |
David L. Giunta5 (1965) | | Trustee since 2011 [President and Chief Executive since 2008; | | President and Chief Executive Officer, Natixis Advisors, L.P., Natixis Distribution, L.P., Natixis Distribution Corporation and Chairman of the Board of Natixis Distribution Corporation. | | 54 None | | Significant experience on the Board; experience as President and Chief Executive Officer, Natixis Advisors, L.P., Natixis Distribution, L.P., Natixis Distribution Corporation and Chairman of the Board of Natixis Distribution Corporation. |
| 1 | Each trustee serves until retirement, resignation or removal from the Board. The current retirement age is 75. The position of Chairperson of the Board is appointed for a three-year term. |
| 2 | The trustees of the Trusts serve as trustees of a fund complex that includes all series of the Natixis Funds Trust I, Natixis Funds Trust II, Natixis Funds Trust IV and Gateway Trust (collectively, the “Natixis Funds Trusts”), Loomis Sayles Funds I and Loomis Sayles Funds II (collectively, the “Loomis Sayles Funds Trusts”) and Natixis ETF Trust (collectively, the “Fund Complex”). |
| 3 | Ms. Mitchell was appointed as a Trustee effective July 1, 2017. |
| 4 | Mr. Charleston is deemed an “interested person” of the Trusts because he holds the following positions with an affiliated person of the Trusts: President, Chief Executive Officer and Chairman of the Board of Directors of Loomis, Sayles & Company, L.P. |
| 5 | Mr. Giunta is deemed an “interested person” of the Trusts because he holds the following positions with an affiliated person of the Trusts: President and Chief Executive Officer, Natixis Advisors, L.P., Natixis Distribution, L.P., Natixis Distribution Corporation and Chairman of the Board of Natixis Distribution Corporation. |
137 |
Trustee and Officer Information
| | | | | | |
Name and Year of Birth | | Position(s) Held with the [Trust/Trusts] | | Term of Office1 and Length of Time Served | | Principal Occupation(s) During Past 5 Years2 |
|
| OFFICERS OF THE [TRUST/TRUSTS] |
| | | |
Russell L. Kane (1969) | | Secretary, Clerk and Chief Legal Officer | | Since July 2016 | | Executive Vice President, General Counsel, Secretary and Clerk, Natixis Distribution Corporation, Natixis Advisors, L.P. and Natixis Distribution, L.P.; formerly, Chief Compliance Officer for Mutual Funds, Senior Vice President, Deputy General Counsel, Assistant Secretary and Assistant Clerk, Natixis Distribution Corporation, Natixis Advisors, L.P. and Natixis Distribution, L.P. |
| | | |
Michael C. Kardok (1959) | | Treasurer, Principal Financial and Accounting Officer | | Since October 2004 | | Senior Vice President, Natixis Advisors, L.P. and Natixis Distribution, L.P. |
| | | |
Rosa Licea-Mailloux (1976) | | Chief Compliance Officer, Assistant Secretary and Anti-Money Laundering Officer | | Since July 2016 | | Senior Vice President, Deputy General Counsel, Assistant Secretary and Assistant Clerk, Natixis Distribution Corporation, Natixis Advisors, L.P. and Natixis Distribution, L.P.; formerly, Associate General Counsel, Natixis Distribution, L.P. |
| 1 | Each officer of the Trusts serves for an indefinite term in accordance with the Trust’s current by-laws until the date his or her successor is elected and qualified, or until he or she sooner dies, retires, is removed or becomes disqualified. |
| 2 | Each person listed above, except as noted, holds the same position(s) with the Fund Complex. Previous positions during the past five years with Natixis Distribution, L.P., Natixis Advisors, L.P. or Loomis, Sayles & Company, L.P. are omitted, if not materially different from an officer’s current position with such entity. |
| 138
The Registrant has adopted a code of ethics that applies to the Registrant’s principal executive officer, principal financial officer and persons performing similar functions. There have been no amendments or waivers of the Registrant’s code of ethics during the period.
| Item 3. | Audit Committee Financial Expert. |
The Board of Trustees of the Registrant has established an audit committee. Mr. Edmond J. English, Mr. Richard A. Goglia, Mr. Martin T. Meehan, Mr. Erik R. Sirri and Ms. Cynthia L. Walker are members of the audit committee and have been designated as “audit committee financial experts” by the Board of Trustees. Each of these individuals is also an Independent Trustee of the Registrant.
| Item 4. | Principal Accountant Fees and Services. |
Fees billed by the Principal Accountant for services rendered to the Registrant.
The table below sets forth fees billed by the principal accountant, PricewaterhouseCoopers LLP, for the past two fiscal years for professional services rendered in connection with a) the audit of the Registrant’s annual financial statements and services provided in connection with regulatory filings; b) audit-related services (including services that are reasonably related to the performance of the audit of the Registrant’s financial statements but not reported under “Audit Fees”); c) tax compliance, tax advice and tax planning and d) all other fees billed for professional services rendered by the principal accountant to the Registrant, other than the services provided as reported as a part of (a) through (c) of this Item.
| | | | | | | | | | | | | | | | | | | | | | | | | | | | | | | | |
| | | Audit fees | | | Audit-related fees1 | | | Tax fees2 | | | All other fees | |
| | | 1/1/16-12/31/16 | | | 1/1/17-12/31/17 | | | 1/1/16-12/31/16 | | | 1/1/17-12/31/17 | | | 1/1/16-12/31/16 | | | 1/1/17-12/31/17 | | | 1/1/16-12/31/16 | | | 1/1/17-12/31/17 | |
Natixis Funds Trust I | | $ | 165,763 | | | $ | 207,981 | | | $ | 319 | | | $ | 6,602 | | | $ | 87,587 | | | $ | 105,568 | | | $ | — | | | $ | — | |
| 1. | Audit-related fees consist of: |
2016 & 2017– performance of agreed-upon procedures related to the Registrant’s deferred compensation plan.
2017 – Prospectus Consent
2016 & 2017– review of the Registrant’s tax returns and tax consulting services.
Aggregate fees billed to the Registrant for non-audit services during 2016 and 2017 were $87,906 and $112,170 respectively.
Fees billed by the Principal Accountant for services rendered to the Adviser and Control Affiliates.
The following table sets forth the fees billed by the Registrant’s principal accountant for non-audit services rendered to Loomis, Sayles & Company, L.P. (“Loomis”), Natixis Advisors, L.P. (“Natixis Advisors”), Natixis Asset Management U.S.,LLC (“NAM US”) and entities controlling, controlled by or under common control with NAM U.S. Loomis and Natixis Advisors (“Control Affiliates”) that provide ongoing services to the Registrant, for engagements that related directly to the operations and financial reporting of the Registrant for the last two fiscal years.
| | | | | | | | | | | | | | | | | | | | | | | | |
| | | Audit-related fees | | | Tax fees | | | All other fees | |
| | | 1/1/16-12/31/16 | | | 1/1/17-12/31/17 | | | 1/1/16-12/31/16 | | | 1/1/17-12/31/17 | | | 1/1/16-12/31/16 | | | 1/1/17-12/31/17 | |
Control Affiliates | | $ | — | | | $ | — | | | $ | — | | | $ | — | | | $ | — | | | $ | — | |
The following table sets forth the aggregate fees billed by the Registrant’s principal accountant for non-audit services rendered to NAM U.S, Loomis, Natixis Advisors and Control Affiliates that provide ongoing services to the Registrant, for the last two fiscal years, including the fees disclosed in the table above.
| | | | | | | | |
| | | Aggregate Non-Audit Fees | |
| | | 1/1/16-12/31/16 | | | 1/1/17-12/31/17 | |
Control Affiliates | | $ | 466,785 | | | $ | 210,798 | |
None of the services described above were approved pursuant to (c)(7)(i)(C) of Regulation S-X.
Audit Committee Pre-Approval Policies.
Annually, the Registrant’s Audit Committee reviews the audit, audit-related, tax and other non-audit services together with the projected fees, for services proposed to be rendered to the Trust and/or other entities for which pre-approval is required during the upcoming year. Any subsequent revisions to already pre-approved services or fees (including fee increases) and requests for pre-approval of new services would be presented for consideration quarterly as needed.
If, in the opinion of management, a proposed engagement by the Registrant’s independent accountants needs to commence before the next regularly scheduled Audit Committee meeting, any member of the Audit Committee who is an independent Board member is authorized to pre-approve the engagement, but only for engagements to provide audit, audit related and tax services. This approval is subject to review of the full Audit Committee at its next quarterly meeting. All other engagements require the approval of all the members of the Audit Committee.
| Item 5. | Audit Committee of Listed Registrants. |
Not applicable.
| Item 6. | Schedule of Investments. |
Included as part of the Report to Shareholders filed as Item 1 herewith.
Item 7. Disclosure of Proxy Voting Policies and Procedures for Closed-End Management Investment Companies.
Not applicable.
| Item 8. | Portfolio Managers of Closed-End Management Investment Companies. |
Not applicable.
Item 9. Purchases of Equity Securities by Closed-End Management Investment Companies and Affiliated Purchasers.
Not applicable.
| Item 10. | Submission of Matters to a Vote of Securities Holders. |
There were no material changes to the procedures by which shareholders may recommend nominees to the Registrant’s Board of Trustees.
| Item 11. | Controls and Procedures. |
The Registrant’s principal executive officer and principal financial officer have concluded that the Registrant’s disclosure controls and procedures are sufficient to ensure that information required to be disclosed by the Registrant in this Form N-CSR was recorded, processed, summarized and reported within the time periods specified in the Securities and Exchange Commission’s rules and forms, based upon such officers’ evaluation of these controls and procedures as of a date within 90 days of the filing date of the report.
There were no changes in the Registrant’s internal control over financial reporting that occurred during the Registrant’s last fiscal quarter of the period covered by this report that has materially affected, or is reasonably likely to materially affect, the Registrant’s internal control over financial reporting.
Item 12. Disclosure of Securities Lending Activities for Closed-End Management Investment Companies.
Not applicable.
| | |
(a)(1) | | Code of Ethics required by Item 2 hereof, filed herewith as Exhibit (a)(1). |
| |
(a)(2) | | Certifications of Principal Executive Officer and Principal Financial Officer pursuant to Rule 30a-2(a) under the Investment Company Act of 1940 [17 CFR 270.30a-2(a)], filed herewith as Exhibits (a)(2)(1)and (a)(2)(2), respectively. |
| |
(a)(3) | | Not applicable. |
| |
(b) | | Certifications of Principal Executive Officer and Principal Financial Officer pursuant to Section 906 of Sarbanes-Oxley Act of 2002 filed herewith as Exhibit (b). |
SIGNATURES
Pursuant to the requirements of the Securities Exchange Act of 1934 and the Investment Company Act of 1940, the Registrant has duly caused this report to be signed on its behalf by the undersigned, thereunto duly authorized.
| | |
| Natixis Funds Trust I |
| |
| By: | | /s/ David L. Giunta |
| Name: | | David L. Giunta |
| Title: | | President and Chief Executive Officer |
| Date: | | February 21, 2018 |
Pursuant to the requirements of the Securities Exchange Act of 1934 and the Investment Company Act of 1940, this report has been signed by the following persons on behalf of the Registrant and in the capacities and on the dates indicated.
| | |
| By: | | /s/ David L. Giunta |
| Name: | | David L. Giunta |
| Title: | | President and Chief Executive Officer |
| Date: | | February 21, 2018 |
| |
| By: | | /s/ Michael C. Kardok |
| Name: | | Michael C. Kardok |
| Title: | | Treasurer |
| Date: | | February 21, 2018 |