UNITED STATES
SECURITIES AND EXCHANGE COMMISSION
Washington, D.C. 20549
FORM N-CSR
CERTIFIED SHAREHOLDER REPORT OF REGISTERED
MANAGEMENT INVESTMENT COMPANIES
Investment Company Act file Number 811-4338
HERITAGE CAPITAL APPRECIATION TRUST
(Exact name of Registrant as Specified in Charter)
880 Carillon Parkway
St. Petersburg, FL 33716
(Address of Principal Executive Offices)
Registrant’s Telephone Number, including Area Code: (727) 573-3800
RICHARD K. RIESS, PRESIDENT
880 Carillon Parkway
St. Petersburg, FL 33716
(Name and Address of Agent for Service)
Copy to:
CLIFFORD J. ALEXANDER, ESQ.
Kirkpatrick & Lockhart LLP
1800 Massachusetts Avenue, NW
Washington, D.C. 20036
Date of fiscal year end: August 31
Date of reporting period: August 31, 2004
Item 1. Reports to Shareholders


September 15, 2004
Dear Fellow Shareholders:
With the fiscal year ended, it is a pleasure to report to you on the Heritage Capital Appreciation Trust (the “Fund”)(a). Over the past year the U.S. equity markets were volatile, with the major indices finishing in positive territory. The oil and gas, cyclicals, and Internet and online industries led the market, while semiconductors, broadcasting & cable, and biotechnology companies lagged. Stock prices steadily climbed over the first six months of 2003, as companies continued to report earnings growth that exceeded analysts’ expectations. Conversely, over the first six months of 2004, the returns were muted as investors grew increasingly concerned about rising oil prices, terrorism, and instability in Iraq. It is also important to note the sustained disparity in performance between growth and value styles. As growth investors, we are continuing to endure a market that is significantly favoring value over growth. For example, since the beginning of 2000 through August of this year, on a cumulative basis, the Russell 1000 Value Index outperformed the Russell 1000 Growth Index by 60%! While this certainly impacts our relative performance versus the broad market, we continue to have confidence in the high-quality growth businesses in the portfolio, which we believe have the financial strength to perform well in various market environments.
The table below presents the Fund’s Class A shares returns(b), as well as the returns of the Fund’s benchmark index, the Standard & Poor’s 500 Composite Stock Price Index (“S&P 500”), and the Russell 1000 Growth Index for various periods ended August 31, 2004. Performance numbers for Class A shares are shown with and without a front-end sales charge. Also, the performance data quoted represents past performance and the investment return and principal value of an investment will fluctuate so that an investor’s shares, when redeemed, may be worth more or less than the original cost. Please remember, past performance does not guarantee future results and current performance may be higher or lower than the performance data quoted. To obtain more current performance please visit the Heritage website at www.HeritageFunds.com.
| | | | | | | | | |
| | | Average Annual Returns(b)
| |
| | | 1-year
| | | 5-years
| | | 10-years
| |
Class A shares | | | | | | | | | |
With front-end sales charge | | -0.25 | % | | -0.53 | % | | +10.80 | % |
Without front-end sales charge | | +4.72 | % | | +0.44 | % | | +11.34 | % |
S&P 500 | | +11.46 | % | | -2.07 | % | | +10.69 | % |
Russell 1000 Growth Index | | +5.36 | % | | -7.35 | % | | +8.46 | % |
(a) The views expressed here are not meant as investment advice. Although some of the described portfolio holdings were viewed favorably as of the date of this letter, there is no guarantee the Fund will continue to hold these securities in the future. Please consider the investment objectives, risks, charges and expenses of any fund carefully before investing. Contact Heritage at (800) 421-4184 or your financial advisor for a prospectus, which contains this and other important information about the Fund. Read the prospectus carefully before you invest.
(b) All returns include the effect of reinvesting dividends. The 1-, 5- and 10-year periods are annualized returns. The S&P 500 is an unmanaged index of 500 widely held stocks that are considered representative of the U.S. stock market. The Russell 1000 Growth Index is constructed to provide a comprehensive and unbiased barometer of the large-cap growth market. The Russell 1000 Growth Index measures the performance of those Russell 1000® Index securities with higher price-to-book ratios and higher forecasted growth values, representative of U.S. securities exhibiting growth characteristics. Keep in mind that individuals cannot invest directly in any index, and index performance does not include transaction costs or other fees, which will affect actual investment performance.
The Fund’s results versus comparable managers continue to be favorable. For the overall period ended August 31, 2004, the Fund’s Class A shares were rated(c) 4-stars. This proprietary rating by Morningstar Inc.(d) reflects the risk-adjusted performance among its peer group of 995 large growth funds. The Fund was also rated(c) by Morningstar Inc. with 3-stars and 4-stars for the three- and five-year periods, respectively, and 5-stars for the 10-year period ended August 31, 2004, when compared to a universe of 995, 679 and 237 large growth funds, respectively.
We continue to manage based on the same style, principles, and discipline since the Fund’s inception. We constantly and rigorously research the companies we own and remain disciplined concerning our investment process. We believe that wealth is created through the long-term ownership of a growing business. High-quality growth businesses have strong franchises, favorable long-term prospects, and excellent management. We believe businesses with these characteristics perpetuate their growth by generating free cash flow. This is important because free cash flow allows a business to self-finance new growth opportunities, pay down debt, or return wealth to shareholders in the form of stock buybacks and dividends. Many of the businesses we own have strong free cash flow and flexible balance sheets that can allow the company to thrive in different market environments. Examples of companies in the Fund’s portfolio that recently announced stock buybacks include Microsoft Corp., Crown Castle Int’l Corp. and Clear Channel Communications Corp. Many of the holdings in the Fund exhibit high-quality characteristics. Out of the Fund’s 35 holdings at the end of the fiscal year, 33 are free cash flow positive, 11 are net-debt free, and 29 have authorized a share repurchase program.
Over the past fiscal year, the Fund’s technology holdings positively contributed to relative performance. We were also aided by strength in both the finance and utilities sectors. Conversely, our exposure to the media space weighed on the return. Our underweight position relative to the benchmark index in the energy sector also detracted from relative performance.
Technology
The Fund’s technology companies significantly outperformed the market and aided returns. QUALCOMM, Inc., eBay, Inc. and Yahoo, Inc. had strong performance during the period. During the period QUALCOMM announced that its earnings would be significantly higher than analysts’ estimates, attributable to soaring demand for cell phone chips. As the innovator of CDMA (code division multiple access) technology, the fastest growing wireless standard, QUALCOMM receives a royalty on the manufacturers’ selling price of every CDMA handset made. CDMA is now closing in on worldwide acceptance as the standard for 3G (third generation) networks. With an increasing number of consumers both in the U.S. and abroad using networks that are optimized for the Internet and data, we remain excited about the company’s long-term growth opportunity.
Freddie Mac and Fannie Mae
Fannie Mae and Freddie Mac were notable contributors to performance during this period. Freddie Mac has rebounded sharply this year, as investors were reassured when the company issued its 2003 financial statements
(c) These ratings are subject to change every month. Funds with at least three years of performance history are assigned ratings from the fund’s 3-, 5- and 10-year average annual returns (when available) and a risk factor that reflects fund performance relative to three-month Treasury bill monthly returns. Funds’ returns are adjusted for fees and sales loads. Ten percent of the funds in an investment category receive five stars, 22.5% receive four stars, 35% receive three stars, 22.5% receive two stars and the bottom 10% receive one star. Investment return and principal value will vary so that investors have a gain or loss when shares are sold. Funds are rated for up to three time periods (3-, 5-, and 10-years) and these ratings are combined to produce an overall rating. Ratings may vary among share classes and are based on past performance. Past performance does not guarantee future results.
(d) ©2004 Morningstar, Inc. All Rights Reserved. The information contained herein: (1) is proprietary to Morningstar and/or its content providers; (2) may not be copied or distributed; and (3) is not warranted to be accurate, complete or timely. Neither Morningstar nor its content providers are responsible for any damages or losses arising from any use of this information. Past performance is no guarantee of future results.
2
within the timeframe promised to regulators. We believe both companies are well positioned for higher interest rates, as they are adequately hedged and have proven historically to be able to consistently grow earnings in various environments. As far as legislation is concerned, the reform bill should be in limbo while the presidential election takes center stage. Despite the rhetoric from certain government officials, we believe that both political parties understand the strong role Fannie Mae and Freddie Mac play in supporting the housing market.
Crown Castle International Corp.
Within the utilities sector, Crown Castle’s stock continued to climb after a very strong performance in 2003. The company reported same-tower revenues were up year-over-year and subsequently raised 2004 guidance. Leasing levels also were positive, up considerably year over year due to wireless customer demand for better coverage and capacity. Additionally during the period, Crown Castle announced the sale of its United Kingdom operations to native company, National Grid Transco. We view this as a positive move for Crown Castle because it should strengthen the company’s balance sheet and position it to focus on the higher growth potential of the U.S. business, given the lower penetration of wireless services and the earlier stage of 3G deployments in the U.S. market. Crown Castle is the largest player in the international tower consolidation business and stands in the “sweet spot” of wireless beneficiaries. Demand for tower space stems from the proliferation of traditional wireless services such as cellular and PCS, but also include demand for new services including two-way paging, digital TV, digital radio, and picture messaging.
Media
The overall media industry continues to be a target-rich environment for companies that meet our investment criteria—strong brand names, dominant market share, recurring revenue, pricing power, predictable and sustainable growth, and free cash flow generation. Although the Fund’s media exposure has weighed negatively on returns in the short term, we believe that over the long run, companies with these characteristics will outperform the overall market.
The “media industry” is often perceived as a sector driven solely by general advertising growth. In reality, it is a collection of sub-sectors, each with differing growth opportunities. The Fund continues to own a very diverse set of media companies, ranging from companies with the majority of their revenue from advertising, such as Univision, to companies with zero percent exposure, such as EchoStar. Within the advertising-based media, we continue to invest in the share-gaining media, such as the Internet, cable networks, outdoor, and Hispanic markets. We believe that companies focused on these markets will be able to achieve superior growth in revenue and free cash flow. For example, Univision, the largest Hispanic media company, is poised to benefit from the expanding U.S. Hispanic population. Univision networks are 5% of total television viewing, yet only 2% of television ad dollars.
In addition to being positioned within the growth areas of media, the companies in the Fund’s portfolio maintain some of the strongest brands and dominant market shares. These characteristics are important because they translate into pricing power. In recent television upfront sales, where advertisers buy commercial spots for the upcoming television season, Univision and the cable networks of Viacom, Time Warner and Scripps were able to raise CPMs (cost per thousand impressions) by mid-single digits to low-double digits.
Media businesses operate at high cash flow margins, generally require little capital expenditures, and operating costs are largely fixed, so small increases in revenue can produce disproportionate increases in free cash flow. Companies can then return their free cash flow to shareholders through stock buybacks, as many companies have done recently. We agree with the Morgan Stanley research that states “the best-performing stocks over the next few years will be those that place increased emphasis on returning capital to shareholders on a consistent basis over the long-term.” In fact, several of the companies in the portfolio have been aggressively returning capital to shareholders. In April of 2004, Clear Channel added a stock buyback program and within three months, the company bought back 4% of the outstanding equity. Viacom has been forced to hold off on its share buyback until it spins off Blockbuster in early October, but with free cash flow of approximately $3 billion this year and
3
growing, and the best balance sheet in the media industry, the company has stated its intentions to aggressively buyback stock after the transaction. Comcast has purchased $750 million of stock year to date, and recently added another $1 billion to their share buyback plan. Westwood One has repurchased 4% of its outstanding equity year to date, and EchoStar has a $1 billion repurchase plan in place.
The current pessimism in the market toward media stocks has created some very compelling valuations. Viacom, Time Warner, Westwood One, Clear Channel and Comcast all trade at mid- to high-teen multiples of free cash flow, resulting in free cash flow yields greater than 5%. With double-digit growth in free cash per share and free cash multiples slightly above to in line with current market multiples, we believe that these companies offer an opportunity for attractive returns.
Energy
Our underweight position relative to the Fund’s benchmark in the energy sector detracted from returns. Typically, businesses in this sector do not have the pricing power and strong business franchise characteristics that we prefer. In addition, most of them have the existing trait or threat of rapid commoditization, thus we have been underweight these sectors historically. In the energy space, the recent run up in stocks has been primarily driven by a spike in oil prices. We believe that this is cyclical, and growth is not supported by long-term secular trends.
Summary
We remain confident in our ability to produce potentially positive excess returns. There are times when the market does not recognize the fundamental strength and intrinsic value of the businesses that we own. When this happens, we focus our research efforts on verifying our investment thesis for those businesses. If we detect that the fundamentals of the business have deteriorated, we will sell the position. The depth of our research and the years of experience working within the industries we cover allow us to maintain confidence in those businesses if we conclude that the fundamental outlook is still positive. Our level of understanding and conviction set us apart from other investors that are likely to panic and trade stocks when they are down. When the market eventually recognizes the value of these businesses, we believe the Fund will benefit. Over the past few months, we have seen this scenario occur with Microsoft, Freddie Mac, and Univision.
We continue to focus on the characteristics that we believe enable the businesses in the Fund to produce superior long-term growth. Our strategy of investing in industry leaders that are capitalizing on secular trends has given us confidence in the long-term sustainability of these franchises. While some investors attempt to forecast the market’s direction, which we contend is unpredictable, we concentrate our efforts on what we do know: businesses with strong business franchises, favorable long-term prospects, and excellent management are well positioned to generate superior returns over the long term. Please bear in mind that this Fund invests primarily in common stocks whose value may decrease in response to the activities of the company that issued the stock and general market and economic conditions. Please refer to the Fund’s prospectus for more information about these and other risks. Thank you for your continued support. We look forward to a long and prosperous relationship.
| | |
| |
Sincerely, | | Sincerely, |
| |

| |  |
| |
Herbert E. Ehlers | | Richard K. Riess |
| Managing Director/Partner | | President |
| Goldman, Sachs & Co. | | Heritage Capital Appreciation Trust |
| Chief Investment Officer | | |
| Growth Equity Strategy | | |
| Goldman Sachs Asset Management LP | | |
| Portfolio Manager | | |
| Heritage Capital Appreciation Trust | | |
4
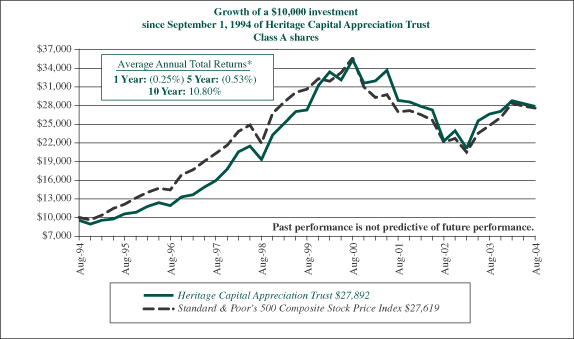
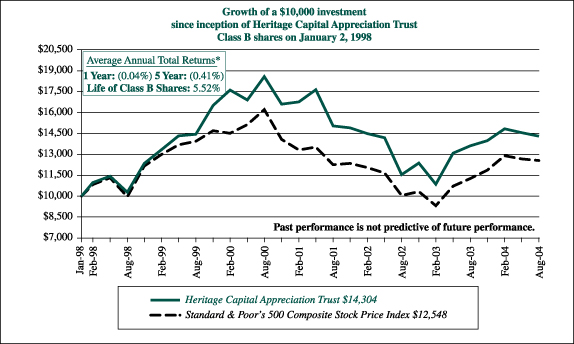
| * | Average annual returns for Heritage Capital Appreciation Trust Class A and B shares are calculated in conformance with Item 21 of Form N-1A, which assumes the maximum front-end sales charge of 4.75% for Class A shares, a contingent deferred sales charge for Class B shares (4% for the one year period, 1% for the five year period and 0% for the life of Class B shares) and reinvestment of dividends for Class A and B shares. Performance presented represents historical data. The investment return and principal value of an investment will fluctuate so that an investor’s shares, when redeemed, may be worth more or less than their original cost. The Fund’s past performance is not indicative of future performance and should be considered in light of the Fund’s investment policy and objectives, the characteristics and quality of its portfolio securities, and the periods selected. The graph and table do not reflect the deduction of taxes that a shareholder would pay on fund distributions or the redemption of fund shares. |
5
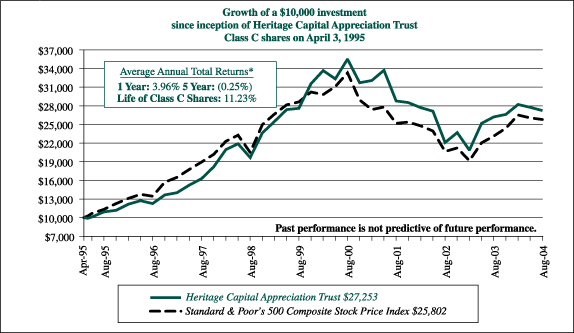
| * | Average annual returns for Heritage Capital Appreciation Trust Class C shares are calculated in conformance with Item 21 of Form N-1A, which assumes reinvestment of dividends for Class C shares. Performance presented represents historical data. The investment return and principal value of an investment will fluctuate so that an investor’s shares, when redeemed, may be worth more or less than their original cost. The Fund’s past performance is not indicative of future performance and should be considered in light of the Fund’s investment policy and objectives, the characteristics and quality of its portfolio securities, and the periods selected. The graph and table do not reflect the deduction of taxes that a shareholder would pay on fund distributions or the redemption of fund shares. |
6
Heritage Capital Appreciation Trust
Investment Portfolio
August 31, 2004
| | | | | |
Shares
| | | | Value
|
Common Stocks—98.8% (a)
| | | |
Advertising—2.8%
| | | |
| 301,850 | | Lamar Advertising Company* | | $ | 13,187,826 |
| | | | |
|
|
Beverages—2.9%
| | | |
| 271,000 | | PepsiCo, Inc. | | | 13,550,000 |
| | | | |
|
|
Broadcasting Services/Programs—3.4%
| | | |
| 473,300 | | Clear Channel Communications, Inc. | | | 15,860,283 |
| | | | |
|
|
Commercial Services—8.9%
| | | |
| 1,057,000 | | Cendant Corporation | | | 22,862,910 |
| 168,139 | | Moody’s Corporation | | | 11,527,610 |
| 255,110 | | Valassis Communications, Inc.* | | | 7,209,409 |
| | | | |
|
|
| | | | | | 41,599,929 |
| | | | |
|
|
Financial Services—10.6%
| | | |
| 972,949 | | Charles Schwab Corporation | | | 9,194,368 |
| 270,000 | | Fannie Mae | | | 20,101,500 |
| 305,000 | | Freddie Mac | | | 20,471,600 |
| | | | |
|
|
| | | | | | 49,767,468 |
| | | | |
|
|
Food—1.7%
| | | |
| 130,300 | | Wm. Wrigley Jr. Company | | | 8,082,509 |
| | | | |
|
|
Healthcare Products—1.7%
| | | |
| 131,000 | | Guidant Corporation | | | 7,833,800 |
| | | | |
|
|
Internet—6.2%
| | | |
| 177,000 | | eBay Inc.* | | | 15,317,580 |
| 18,000 | | Google Inc.* | | | 1,844,100 |
| 412,000 | | YAHOO! Inc.* | | | 11,746,120 |
| | | | |
|
|
| | | | | | 28,907,800 |
| | | | |
|
|
Lodging—5.0%
| | | |
| 483,000 | | Harrah’s Entertainment, Inc. | | | 23,275,770 |
| | | | |
|
|
Multimedia—11.7%
| | | |
| 1,035,490 | | Entravision Communications Corporation, Class “A”* | | | 8,387,469 |
| 218,420 | | McGraw-Hill Companies, Inc. | | | 16,540,947 |
| 552,000 | | Time Warner Inc.* | | | 9,025,200 |
| 618,159 | | Viacom, Inc., Class “B” | | | 20,590,876 |
| | | | |
|
|
| | | | | | 54,544,492 |
| | | | |
|
|
Pharmaceuticals—2.1%
| | | |
| 336,443 | | Caremark Rx, Inc.* | | | 9,655,914 |
| | | | |
|
|
REITS—2.5%
| | | |
| 165,000 | | General Growth Properties Inc. | | | 4,978,050 |
| 117,000 | | Simon Property Group, Inc. | | | 6,546,150 |
| | | | |
|
|
| | | | | | 11,524,200 |
| | | | |
|
|
Retail—3.0%
| | | |
| 292,000 | | Family Dollar Stores Inc. | | | 7,723,400 |
| 195,560 | | Petco Animal Supplies Inc.* | | | 6,476,947 |
| | | | |
|
|
| | | | | | 14,200,347 |
| | | | |
|
|
| | | | | | |
Shares
| | | | Value
| |
Common Stocks (continued)
| | | | |
Savings & Loans—1.2%
| | | | |
| 51,000 | | Golden West Financial Corporation | | | 5,519,730 | |
| | | | |
|
|
|
Software—7.2%
| | | | |
| 434,848 | | First Data Corporation | | | 18,372,328 | |
| 566,000 | | Microsoft Corporation | | | 15,451,800 | |
| | | | |
|
|
|
| | | | | | 33,824,128 | |
| | | | |
|
|
|
Telecommunications—13.4%
| | | | |
| 400,200 | | American Tower Corporation, Class “A”* | | | 5,958,978 | |
| 2,160,000 | | Crown Castle International Corporation* | | | 30,909,600 | |
| 680,000 | | QUALCOMM, Inc. | | | 25,874,000 | |
| | | | |
|
|
|
| | | | | | 62,742,578 | |
| | | | |
|
|
|
Television, Cable & Radio—14.5%
| | | | |
| 766,663 | | Cablevision Systems Corporation, Class “A”* | | | 14,198,599 | |
| 327,000 | | Comcast Corporation,
Class “A”* | | | 9,074,250 | |
| 547,000 | | Univision Communications, Inc., Class “A”* | | | 18,051,000 | |
| 888,025 | | Westwood One, Inc.* | | | 19,927,281 | |
| 236,000 | | XM Satellite Radio Holdings Inc., Class “A”* | | | 6,482,920 | |
| | | | |
|
|
|
| | | | | | 67,734,050 | |
| | | | |
|
|
|
| Total Common Stocks (cost $410,804,278) | | | 461,810,824 | |
| | | | |
|
|
|
Repurchase Agreement—1.5% (a)
| | | | |
Repurchase Agreement with State Street Bank and
Trust Company, dated August 31, 2004 @ 1.46%
to be repurchased at $6,778,275 on September 1,
2004, collateralized by $6,095,000 United States
Treasury Bonds, 6.0% due February 15, 2026,
(market value $6,939,201 including interest)
(cost $6,778,000) | | | 6,778,000 | |
| | | | |
|
|
|
Total Investment Portfolio
(cost $417,582,278) (b), 100.3% (a) | | | 468,588,824 | |
| Other Assets and Liabilities, net, (0.3%) (a) | | | (1,208,711 | ) |
| | | | |
|
|
|
| Net Assets, 100.0% | | $ | 467,380,113 | |
| | | | |
|
|
|
| * | Non-income producing security. |
| (a) | Percentages indicated are based on net assets. |
| (b) | The aggregate identified cost for federal income tax purposes is $420,683,353. Market value includes net unrealized appreciation of $47,905,471 which consists of aggregate gross unrealized appreciation for all securities in which there is an excess of market value over tax cost of $74,688,981 and aggregate gross unrealized depreciation for all securities in which there is an excess of tax cost over market value of $26,783,510. |
The accompanying notes are an integral part of the financial statements.
7
Heritage Capital Appreciation Trust
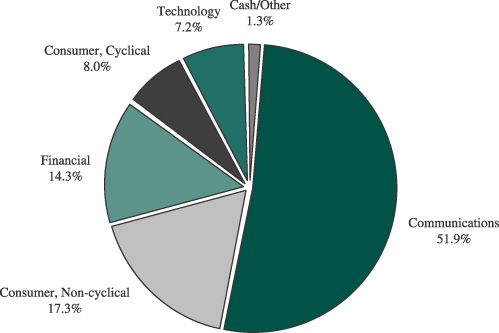
Portfolio Allocation
(unaudited)
Sector Allocation as of August 31, 2004 (% of net assets)
Beginning with the Fund’s fiscal quarter ending November 30, 2004, the Fund will file its complete schedule of portfolio holdings with the Securities Exchange Comission (“SEC”) for the first and third quarters of each fiscal year on Form N-Q; the Fund’s Forms N-Q will be available on the SEC’s website at http://www.sec.gov; and the Fund’s Forms N-Q may be reviewed and copied at the SEC’s Public Reference Room in Washington, DC. Information on the operation of the Public Reference Room may be obtained by calling 1-800-SEC-0330.
8
Heritage Capital Appreciation Trust
Understanding Your Fund’s Expenses
(unaudited)
Understanding Your Fund’s Expenses
As a mutual fund investor, you pay ongoing expenses, such as management fees, distribution fees and other expenses. Using the tables below, you can estimate how these expenses affect your investment and compare them with the expenses of other funds. Please note that the expenses shown in the table are meant to highlight your ongoing costs only and do not reflect one-time transaction expenses, such as sales charges (loads) or redemption fees. Therefore, if these transactional costs were included, your costs would have been higher. For more information, see your Fund’s prospectus or talk to your financial adviser.
Review Your Fund’s Actual Expenses
The table below shows the actual expenses you would have paid on a $1,000 investment in Heritage Capital Appreciation Trust on March 1, 2004 and held through August, 31, 2004. It also shows how much a $1,000 investment would be worth at the close of the period, assuming actual returns after ongoing expenses. This table is useful in comparing ongoing costs only, and will not help you determine the relative total costs of owning different funds. Simply divide your account value by $1,000 (for example, an $8,600 account value divided by $1,000 = 8.6), then multiply the result by the number in the line under the heading entitled “Expenses Paid During Period” to estimate the expenses you paid on your account during this period.
| | | | | | | | | |
Actual
| | Beginning
Account Value
March 1, 2004
| | Ending
Account Value
August 31, 2004
| | Expenses Paid
During Period*
|
Class A | | $ | 1,000 | | $ | 969 | | $ | 5.79 |
Class B | | $ | 1,000 | | $ | 965 | | $ | 9.54 |
Class C | | $ | 1,000 | | $ | 965 | | $ | 9.54 |
Hypothetical Example for Comparison Purposes
All mutual funds now follow guidelines to assist shareholders in comparing expenses between different funds. Per these guidelines, the table below shows your Fund’s expenses based on a $1,000 investment, assuming a hypothetical 5% annualized return (2.51% from March 1, 2004 to August, 31, 2004) before ongoing expenses invested at the beginning of the period and held for the entire period. Please note that you should not use this information to estimate your actual ending account balance and expenses paid during the period. You can use this information to compare the ongoing expenses (but not transaction expenses or total costs) of investing in the Fund with those of other funds. All mutual fund shareholder reports will provide this information to help you make this comparison.
| | | | | | | | | |
Hypothetical (5% return before expenses)
| | Beginning
Account Value
March 1, 2004
| | Ending
Account Value
August 31, 2004
| | Expenses Paid
During Period*
|
Class A | | $ | 1,000 | | $ | 1,019 | | $ | 5.94 |
Class B | | $ | 1,000 | | $ | 1,015 | | $ | 9.78 |
Class C | | $ | 1,000 | | $ | 1,015 | | $ | 9.78 |
| | * | Expenses are calculated using the Fund’s annualized expense ratios for Class A (1.17%), Class B (1.93%) and Class C (1.93%) shares, multiplied by the average account value for the period, then multiplying the result by the actual number of days in the period (184); and then dividing that result by the actual number of days in the fiscal year (366). |
9
Heritage Capital Appreciation Trust
Statement of Assets and Liabilities
August 31, 2004
| | | | | | | |
Assets | | | | | | | |
Investments, at value (identified cost $410,804,278) | | | | | $ | 461,810,824 | |
Repurchase agreement (identified cost $6,778,000) | | | | | | 6,778,000 | |
Cash | | | | | | 369 | |
Receivables: | | | | | | | |
Fund shares sold | | | | | | 682,683 | |
Dividends and interest | | | | | | 332,761 | |
Deferred state qualification expenses | | | | | | 23,431 | |
Prepaid insurance | | | | | | 6,763 | |
| | | | | |
|
|
|
Total assets | | | | | $ | 469,634,831 | |
| | | | | |
|
|
|
Liabilities | | | | | | | |
Payables: | | | | | | | |
Fund shares redeemed | | $ | 1,641,445 | | | | |
Accrued management fee | | | 292,885 | | | | |
Accrued distribution fee | | | 135,493 | | | | |
Accrued shareholder servicing fee | | | 97,871 | | | | |
Accrued fund accounting fee | | | 12,300 | | | | |
Other accrued expenses | | | 74,724 | | | | |
| | |
|
| | | | |
Total liabilities | | | | | | 2,254,718 | |
| | | | | |
|
|
|
Net assets, at market value | | | | | $ | 467,380,113 | |
| | | | | |
|
|
|
Net Assets | | | | | | | |
Net assets consist of: | | | | | | | |
Paid-in capital | | | | | $ | 448,139,941 | |
Accumulated net realized loss | | | | | | (31,766,374 | ) |
Net unrealized appreciation on investments | | | | | | 51,006,546 | |
| | | | | |
|
|
|
Net assets, at market value | | | | | $ | 467,380,113 | |
| | | | | |
|
|
|
Class A shares | | | | | | | |
Net asset value and redemption price per share ($320,555,011 divided by 14,029,296 shares of beneficial interest outstanding, no par value) | | | | | $ | 22.85 | |
| | | | | |
|
|
|
Maximum offering price per share (100/95.25 of $22.85 ) | | | | | $ | 23.99 | |
| | | | | |
|
|
|
Class B shares | | | | | | | |
Net asset value, offering price and redemption price per share ($35,715,897 divided by 1,678,273 shares of beneficial interest outstanding, no par value) | | | | | $ | 21.28 | |
| | | | | |
|
|
|
Class C shares | | | | | | | |
Net asset value, offering price and redemption price per share ($111,109,205 divided by 5,223,294 shares of beneficial interest outstanding, no par value) | | | | | $ | 21.27 | |
| | | | | |
|
|
|
The accompanying notes are an integral part of the financial statements.
10
Heritage Capital Appreciation Trust
Statement of Operations
For the Fiscal Year Ended August 31, 2004
| | | | | | | |
Investment Income | | | | | | | |
Income: | | | | | | | |
Dividends | | | | | $ | 3,419,511 | |
Interest | | | | | | 128,327 | |
| | | | | |
|
|
|
Total income | | | | | | 3,547,838 | |
Expenses: | | | | | | | |
Management fee | | $ | 3,328,543 | | | | |
Distribution fee (Class A) | | | 764,551 | | | | |
Distribution fee (Class B) | | | 381,645 | | | | |
Distribution fee (Class C) | | | 1,100,301 | | | | |
Shareholder servicing fees | | | 464,454 | | | | |
State qualification expenses | | | 90,524 | | | | |
Professional fees | | | 89,572 | | | | |
Fund accounting fee | | | 62,312 | | | | |
Reports to shareholders | | | 46,708 | | | | |
Custodian fee | | | 34,635 | | | | |
Trustees’ fees and expenses | | | 16,503 | | | | |
Federal registration expense | | | 8,501 | | | | |
Insurance | | | 7,870 | | | | |
Other | | | 3,826 | | | | |
| | |
|
| | | | |
Total expenses | | | | | | 6,399,945 | |
| | | | | |
|
|
|
Net investment loss | | | | | | (2,852,107 | ) |
| | | | | |
|
|
|
| | |
Realized and Unrealized Gain on Investments | | | | | | | |
Net realized gain from investment transactions | | | | | | 13,889,558 | |
Net unrealized appreciation of investments during the fiscal year | | | | | | 5,807,690 | |
| | | | | |
|
|
|
Net gain on investments | | | | | | 19,697,248 | |
| | | | | |
|
|
|
Net increase in net assets resulting from operations | | | | | $ | 16,845,141 | |
| | | | | |
|
|
|
Statements of Changes in Net Assets
| | | | | | | | |
| | | For the Fiscal Years Ended
| |
| | | August 31, 2004
| | | August 31, 2003
| |
Increase in net assets: | | | | | | | | |
Operations: | | | | | | | | |
Net investment loss | | $ | (2,852,107 | ) | | $ | (2,844,826 | ) |
Net realized gain (loss) from investment transactions | | | 13,889,558 | | | | (1,109,413 | ) |
Net unrealized appreciation of investments during the fiscal year | | | 5,807,690 | | | | 60,409,384 | |
| | |
|
|
| |
|
|
|
Net increase in net assets resulting from operations | | | 16,845,141 | | | | 56,455,145 | |
Increase in net assets from Fund share transactions | | | 69,648,471 | | | | 29,100,952 | |
| | |
|
|
| |
|
|
|
Increase in net assets | | | 86,493,612 | | | | 85,556,097 | |
Net assets, beginning of fiscal year | | | 380,886,501 | | | | 295,330,404 | |
| | |
|
|
| |
|
|
|
Net assets, end of fiscal year | | $ | 467,380,113 | | | $ | 380,886,501 | |
| | |
|
|
| |
|
|
|
The accompanying notes are an integral part of the financial statements.
11
Heritage Capital Appreciation Trust
Financial Highlights
The following table includes selected data for a share outstanding throughout each period and other performance information derived from the financial statements.
| | | | | | | | | | | | | | | | | | | | | | | | | | | | | | | | | | | | | | | | | | | | | | | | | | | | | | | | | | | | |
| | | Class A Shares
| | | Class B Shares
| | | Class C Shares
| |
| | |
For the Years Ended August 31
| | |
For the Years Ended August 31
| | |
For the Years Ended August 31
| |
| | | 2004
| | | 2003
| | | 2002
| | | 2001
| | | 2000
| | | 2004
| | | 2003
| | | 2002
| | | 2001
| | | 2000
| | | 2004
| | | 2003
| | | 2002
| | | 2001
| | | 2000
| |
Net asset value, beginning of fiscal year | | $ | 21.82 | | | $ | 18.26 | | | $ | 23.61 | | | $ | 32.41 | | | $ | 27.18 | | | $ | 20.47 | | | $ | 17.25 | | | $ | 22.47 | | | $ | 31.20 | | | $ | 26.40 | | | $ | 20.46 | | | $ | 17.25 | | | $ | 22.46 | | | $ | 31.19 | | | $ | 26.39 | |
| | |
|
|
| |
|
|
| |
|
|
| |
|
|
| |
|
|
| |
|
|
| |
|
|
| |
|
|
| |
|
|
| |
|
|
| |
|
|
| |
|
|
| |
|
|
| |
|
|
| |
|
|
|
Income from Investment Operations: | | | | | | | | | | | | | | | | | | | | | | | | | | | | | | | | | | | | | | | | | | | | | | | | | | | | | | | | | | | | |
Net investment loss | | | (0.08 | ) | | | (0.12 | ) | | | (0.17 | ) | | | (0.16 | ) | | | (0.16 | ) | | | (0.26 | ) | | | (0.24 | ) | | | (0.31 | ) | | | (0.29 | ) | | | (0.29 | ) | | | (0.24 | ) | | | (0.21 | ) | | | (0.30 | ) | | | (0.29 | ) | | | (0.29 | ) |
Net realized and unrealized gain (loss) on investments | | | 1.11 | | | | 3.68 | | | | (5.18 | ) | | | (5.44 | ) | | | 8.01 | | | | 1.07 | | | | 3.46 | | | | (4.91 | ) | | | (5.24 | ) | | | 7.71 | | | | 1.05 | | | | 3.42 | | | | (4.91 | ) | | | (5.24 | ) | | | 7.71 | |
| | |
|
|
| |
|
|
| |
|
|
| |
|
|
| |
|
|
| |
|
|
| |
|
|
| |
|
|
| |
|
|
| |
|
|
| |
|
|
| |
|
|
| |
|
|
| |
|
|
| |
|
|
|
Total from Investment Operations | | | 1.03 | | | | 3.56 | | | | (5.35 | ) | | | (5.60 | ) | | | 7.85 | | | | 0.81 | | | | 3.22 | | | | (5.22 | ) | | | (5.53 | ) | | | 7.42 | | | | 0.81 | | | | 3.21 | | | | (5.21 | ) | | | (5.53 | ) | | | 7.42 | |
| | |
|
|
| |
|
|
| |
|
|
| |
|
|
| |
|
|
| |
|
|
| |
|
|
| |
|
|
| |
|
|
| |
|
|
| |
|
|
| |
|
|
| |
|
|
| |
|
|
| |
|
|
|
Less Distributions: | | | | | | | | | | | | | | | | | | | | | | | | | | | | | | | | | | | | | | | | | | | | | | | | | | | | | | | | | | | | |
Distributions from net realized gains | | | — | | | | — | | | | — | | | | (3.20 | ) | | | (2.62 | ) | | | — | | | | — | | | | — | | | | (3.20 | ) | | | (2.62 | ) | | | — | | | | — | | | | — | | | | (3.20 | ) | | | (2.62 | ) |
| | |
|
|
| |
|
|
| |
|
|
| |
|
|
| |
|
|
| |
|
|
| |
|
|
| |
|
|
| |
|
|
| |
|
|
| |
|
|
| |
|
|
| |
|
|
| |
|
|
| |
|
|
|
Net asset value, end of fiscal year | | $ | 22.85 | | | $ | 21.82 | | | $ | 18.26 | | | $ | 23.61 | | | $ | 32.41 | | | $ | 21.28 | | | $ | 20.47 | | | $ | 17.25 | | | $ | 22.47 | | | $ | 31.20 | | | $ | 21.27 | | | $ | 20.46 | | | $ | 17.25 | | | $ | 22.46 | | | $ | 31.19 | |
| | |
|
|
| |
|
|
| |
|
|
| |
|
|
| |
|
|
| |
|
|
| |
|
|
| |
|
|
| |
|
|
| |
|
|
| |
|
|
| |
|
|
| |
|
|
| |
|
|
| |
|
|
|
Total Return (%) (a) | | | 4.72 | | | | 19.50 | | | | (22.66 | ) | | | (18.48 | ) | | | 29.55 | | | | 3.96 | | | | 18.67 | | | | (23.23 | ) | | | (19.01 | ) | | | 28.75 | | | | 3.96 | | | | 18.61 | | | | (23.20 | ) | | | (19.02 | ) | | | 28.76 | |
Ratios and Supplemental Data | | | | | | | | | | | | | | | | | | | | | | | | | | | | | | | | | | | | | | | | | | | | | | | | | | | | | | | | | | | | |
Expenses to average daily net assets (%) | | | 1.19 | | | | 1.26 | | | | 1.23 | | | | 1.22 | | | | 1.24 | | | | 1.94 | | | | 1.97 | | | | 1.93 | | | | 1.91 | | | | 1.90 | | | | 1.94 | | | | 1.97 | | | | 1.93 | | | | 1.91 | | | | 1.90 | |
Net investment loss to average daily net
assets (%) | | | (0.39 | ) | | | (0.66 | ) | | | (0.80 | ) | | | (0.68 | ) | | | (0.55 | ) | | | (1.15 | ) | | | (1.37 | ) | | | (1.50 | ) | | | (1.36 | ) | | | (1.21 | ) | | | (1.14 | ) | | | (1.37 | ) | | | (1.50 | ) | | | (1.37 | ) | | | (1.21 | ) |
Portfolio turnover rate (%) | | | 27 | | | | 22 | | | | 31 | | | | 28 | | | | 48 | | | | 27 | | | | 22 | | | | 31 | | | | 28 | | | | 48 | | | | 27 | | | | 22 | | | | 31 | | | | 28 | | | | 48 | |
Net assets, end of fiscal year ($ millions) | | | 321 | | | | 248 | | | | 197 | | | | 233 | | | | 244 | | | | 36 | | | | 37 | | | | 32 | | | | 42 | | | | 43 | | | | 111 | | | | 96 | | | | 67 | | | | 78 | | | | 74 | |
| (a) | These returns are calculated without the imposition of either front-end or contingent deferred sales charges. |
The accompanying notes are an integral part of the financial statements.
12
Heritage Capital Appreciation Trust
Notes to Financial Statements
| Note 1: | Significant Accounting Policies. Heritage Capital Appreciation Trust (the “Fund”) is organized as a Massachusetts business trust and is registered under the Investment Company Act of 1940, as amended, as a diversified, open-end management investment company. The Fund seeks to achieve capital appreciation over the long term by investing principally in equity securities. The Fund currently offers Class A and Class C shares to the public. Effective February 1, 2004, Class B shares were not available for direct purchase. Class B shares will continue to be available through exchanges and dividend reinvestments as described in the Fund’s prospectus. Class A shares are sold subject to a maximum sales charge of 4.75% of the amount invested payable at the time of purchase. Class A share investments greater than $1 million, where a maximum sales charge is waived, may be subject to a maximum contingent deferred sales charge of 1% upon redemptions made in less than 18 months of purchase. Class B shares were sold and are still subject to a 5% maximum contingent deferred sales charge (based on the lower of purchase price or redemption price), declining over a six-year period. Class C shares are sold subject to a contingent deferred sales charge of 1% of the lower of net asset value or purchase price payable upon any redemptions made in less than one year of purchase. The preparation of financial statements in accordance with accounting principles generally accepted in the United States of America requires management to make estimates and assumptions that affect the reported amounts and disclosures. Actual results could differ from those estimates. The following is a summary of significant accounting policies: |
Security Valuation: The Fund values investment securities at market value based on the last quoted sales price as reported by the principal securities exchange on which the security is traded. If the security is traded on the Nasdaq Stock Market, the official NASDAQ closing price is used. If no sale is reported, market value is based on the most recent quoted bid price. In the absence of a market quote, when prices are not reflective of market value, or when a significant event has been recognized with respect to a security, securities are valued using such methods as the Board of Trustees believes would reflect fair market value. Short-term investments having a maturity of 60 days or less are valued at amortized cost, which approximates market value.
Repurchase Agreements: The Fund enters into repurchase agreements whereby the Fund, through its custodian, receives delivery of the underlying securities, the market value of which at the time of purchase is required to be an amount equal to at least 100% of the resale price. Repurchase agreements involve the risk that the seller will fail to repurchase the security, as agreed. In that case, the Fund will bear the risk of market value fluctuations until the security can be sold and may encounter delays and incur costs in liquidating the security. In the event of bankruptcy or insolvency of the seller, delays and costs may be incurred.
Federal Income Taxes: The Fund is treated as a single corporate taxpayer as provided for in the Tax Reform Act of 1986, as amended. The Fund’s policy is to comply with the requirements of the Internal Revenue Code of 1986, as amended, which are applicable to regulated investment companies and to distribute substantially all of its taxable income to its shareholders. Accordingly, no provision has been made for federal income and excise taxes.
Distribution of Income and Gains: Distributions of net investment income are made annually. Net realized gains from investment transactions during any particular year in excess of available capital loss carryforwards, which, if not distributed, would be taxable to the Fund, will be distributed to shareholders in the following fiscal year. The Fund uses the identified cost method for determining realized gain or loss on investments for both financial and federal income tax reporting purposes.
13
Heritage Capital Appreciation Trust
Notes to Financial Statements
(continued)
Expenses: The Fund is charged for those expenses that are directly attributable to it, while other expenses are allocated proportionately among the Heritage mutual funds based upon methods approved by the Board of Trustees. Expenses that are directly attributable to a specific class of shares, such as distribution fees, are charged directly to that class. Other expenses of the Fund are allocated to each class of shares based upon their relative percentage of net assets.
Other: Investment security transactions are accounted for on a trade date basis. Dividend income and distributions to shareholders are recorded on the ex-dividend date. Interest income is recorded on the accrual basis.
In the normal course of business the Fund enters into contracts that contain a variety of representations and warranties, which provide general indemnifications. The Fund’s maximum exposure under these arrangements is unknown, as this would involve future claims that may be made against the Fund and/or its affiliates that have not yet occurred. However, based on experience, the Fund expects the risk of loss to be remote.
| Note 2: | Fund Shares. At August 31, 2004, there were an unlimited number of shares of beneficial interest of no par value authorized. |
Transactions in Class A, B and C shares of the Fund during the fiscal year ended August 31, 2004, were as follows:
| | | | | | | | | | | | | | | | | | | | | |
| | | Class A Shares
| | | Class B Shares
| | | Class C Shares
| |
| | | Shares
| | | Amount
| | | Shares
| | | Amount
| | | Shares
| | | Amount
| |
Shares sold | | 5,284,879 | | | $ | 120,996,652 | | | 175,571 | | | $ | 3,678,508 | | | 1,550,693 | | | $ | 32,903,919 | |
Shares redeemed | | (2,634,124 | ) | | | (60,066,397 | ) | | (289,273 | ) | | | (6,167,323 | ) | | (1,015,394 | ) | | | (21,696,888 | ) |
| | |
|
| |
|
|
| |
|
| |
|
|
| |
|
| |
|
|
|
Net increase (decrease) | | 2,650,755 | | | $ | 60,930,255 | | | (113,702 | ) | | $ | (2,488,815 | ) | | 535,299 | | | $ | 11,207,031 | |
| | | | | |
|
|
| | | | |
|
|
| | | | |
|
|
|
Shares outstanding: | | | | | | | | | | | | | | | | | | | | | |
Beginning of fiscal year | | 11,378,541 | | | | | | | 1,791,975 | | | | | | | 4,687,995 | | | | | |
| | |
|
| | | | | |
|
| | | | | |
|
| | | | |
End of fiscal year | | 14,029,296 | | | | | | | 1,678,273 | | | | | | | 5,223,294 | | | | | |
| | |
|
| | | | | |
|
| | | | | |
|
| | | | |
Transactions in Class A, B and C shares of the Fund during the fiscal year ended August 31, 2003, were as follows:
| | | | | | | | | | | | | | | | | | | | | |
| | | Class A Shares
| | | Class B Shares
| | | Class C Shares
| |
| | | Shares
| | | Amount
| | | Shares
| | | Amount
| | | Shares
| | | Amount
| |
Shares sold | | 4,646,873 | | | $ | 89,559,885 | | | 356,096 | | | $ | 6,589,412 | | | 2,729,811 | | | $ | 49,152,786 | |
Shares redeemed | | (4,065,889 | ) | | | (76,359,272 | ) | | (391,259 | ) | | | (6,860,527 | ) | | (1,908,256 | ) | | | (32,981,332 | ) |
| | |
|
| |
|
|
| |
|
| |
|
|
| |
|
| |
|
|
|
Net increase (decrease) | | 580,984 | | | $ | 13,200,613 | | | (35,163 | ) | | $ | (271,115 | ) | | 821,555 | | | $ | 16,171,454 | |
| | | | | |
|
|
| | | | |
|
|
| | | | |
|
|
|
Shares outstanding: | | | | | | | | | | | | | | | | | | | | | |
Beginning of fiscal year | | 10,797,557 | | | | | | | 1,827,138 | | | | | | | 3,866,440 | | | | | |
| | |
|
| | | | | |
|
| | | | | |
|
| | | | |
End of fiscal year | | 11,378,541 | | | | | | | 1,791,975 | | | | | | | 4,687,995 | | | | | |
| | |
|
| | | | | |
|
| | | | | |
|
| | | | |
14
Heritage Capital Appreciation Trust
Notes to Financial Statements
(continued)
| Note 3: | Purchases and Sales of Securities. For the fiscal year ended August 31, 2004, purchases and sales of investment securities (excluding repurchase agreements and short-term obligations) aggregated $181,917,317 and $114,236,051, respectively. |
| Note 4: | Management, Subadvisory, Distribution, Shareholder Servicing Agent, Fund Accounting and Trustees Fees. Under the Fund’s Investment Advisory and Administration Agreement with Heritage Asset Management, Inc. (the “Manager” or “Heritage”), the Fund agrees to pay to the Manager a fee equal to an annualized rate of 0.75% of the Fund’s average daily net assets, computed daily and payable monthly. The Manager has contractually agreed to waive its fees and, if necessary, reimburse the Fund to the extent that Class A annual operating expenses exceeded 1.60% of the Class A average daily net assets and to the extent that the Class B and Class C annual operating expenses each exceeded 2.10% of those classes’ average daily net assets for the fiscal year ended August 31, 2004. No fees were waived and no expenses were reimbursed for the period ended August 31, 2004. |
The Manager entered into a subadvisory agreement with Goldman Sachs Asset Management LP (the “Subadviser”) to provide to the Fund investment advice, portfolio management services (including the placement of brokerage orders) and certain compliance and other services for a fee payable, by the Manager, equal to 0.25% of the Fund’s average daily net assets, without regard to any reduction due to the imposition of expense limitations. Eagle Asset Management, Inc. (“Eagle”), a wholly owned subsidiary of Raymond James Financial, Inc. (“RJF”), serves as an additional subadviser to the Fund. However, the Manager currently has not allocated any assets of the Fund to Eagle.
Pursuant to the Class A Distribution Plan adopted in accordance with Rule 12b-1 of the Investment Company Act of 1940, as amended, the Fund was authorized to pay the Distributor a fee of up to 0.50% of the average daily net assets through December 31, 2003. Pursuant to the Fund’s prospectus, effective January 1, 2004, the Fund is authorized to pay the Distributor a fee of 0.25% of the average daily net assets. The Class B and Class C Distribution Plans provide for payments at an annual rate of up to 1.00% of the average daily net assets. Such fees are accrued daily and payable monthly. Class B shares will convert to Class A shares eight years after the end of the calendar month in which the shareholder’s order to purchase was accepted. The Manager, Distributor, Fund Accountant and Shareholder Servicing Agent are all wholly owned subsidiaries of RJF.
Raymond James & Associates, Inc. (the “Distributor” or “RJA”) has advised the Fund that it generated $349,056 in front-end sales charges for Class A shares, $93,951 in contingent deferred sales charges for Class B shares and $22,054 in contingent deferred sales charges for Class C shares for the period ended August 31, 2004. From these fees, the Distributor paid commissions to salespersons and incurred other distribution costs.
The Manager also is the Shareholder Servicing Agent and Fund Accountant for the Fund.
Trustees of the Fund also serve as Trustees for Heritage Cash Trust, Heritage Growth and Income Trust, Heritage Income Trust and Heritage Series Trust, investment companies that are also advised by the Manager (collectively referred to as the “Heritage Mutual Funds”). Each Trustee of the Heritage Mutual Funds who is not an employee of the Manager or an employee of an affiliate of the Manager receives an annual fee of $18,000 and an additional fee of $3,000 for each combined quarterly meeting of the Heritage Mutual Funds attended. In addition, each independent Trustee that serves on the Audit Committee or Compliance Committee will receive $500 for attendance at their respective meeting (in person or telephonic). The Lead Independent Trustee, the Audit Committee Chair, and the Compliance
15
Heritage Capital Appreciation Trust
Notes to Financial Statements
(continued)
Committee Chair each will receive an annual retainer of $2,500, in addition to meeting fees. Trustees’ fees and expenses are paid equally by each portfolio in the Heritage Mutual Funds.
| Note 5: | Federal Income Taxes. For the fiscal year ended August 31, 2004, to reflect reclassifications arising from permanent book/tax differences attributable to a net operating loss, the Fund increased (credited) accumulated net investment loss $2,852,107 and decreased (debited) paid in capital $2,852,107. As of August 31, 2004, the Fund had net tax basis capital loss carryforwards in the aggregate of $28,665,299. Capital loss carryforwards of $13,646,547 were utilized in the fiscal year ended August 31, 2004, capital loss carryforwards, $3,683,493 and $24,981,806 may be applied to any net taxable capital gain until their expiration date of 2010 and 2011, respectively. |
| | For income tax purposes, distributions paid during the fiscal years ended August 31, 2004 and 2003 were as follows: |
| | | | | | |
| Distributions paid from: | | 2004
| | 2003
|
Ordinary Income | | $ | 0 | | $ | 0 |
Long-Term Capital Gains | | $ | 0 | | $ | 0 |
| | As of August 31, 2004, the components of distributable earnings on a tax basis were as follows: |
| | | | | | |
Undistributed Ordinary Income | | $ | 0 | |
Accumulated Capital Losses | | $ | (28,665,299 | ) |
Tax Basis Net Unrealized Appreciation | | $ | 47,905,471 | |
| | The difference between book-basis and tax-basis unrealized appreciation/depreciation is attributable primarily to the tax deferral of losses on wash sales. |
16
Report of Independent Registered Certified Public Accounting Firm
To the Board of Trustees and
Shareholders of Heritage Capital Appreciation Trust
In our opinion, the accompanying statement of assets and liabilities, including the investment portfolio, and the related statements of operations and of changes in net assets and the financial highlights present fairly, in all material respects, the financial position of Heritage Capital Appreciation Trust (the “Fund”) at August 31, 2004, the results of its operations for the year then ended, the changes in its net assets for each of the two years in the period then ended and the financial highlights for each of the five years in the period then ended, in conformity with accounting principles generally accepted in the United States of America. These financial statements and financial highlights (hereafter referred to as “financial statements”) are the responsibility of the Fund’s management; our responsibility is to express an opinion on these financial statements based on our audits. We conducted our audits of these financial statements in accordance with the standards of the Public Company Accounting Oversight Board (United States). Those standards require that we plan and perform the audit to obtain reasonable assurance about whether the financial statements are free of material misstatement. An audit includes examining, on a test basis, evidence supporting the amounts and disclosures in the financial statements, assessing the accounting principles used and significant estimates made by management, and evaluating the overall financial statement presentation. We believe that our audits, which included confirmation of securities at August 31, 2004 by correspondence with the custodian, provide a reasonable basis for our opinion.

PricewaterhouseCoopers LLP
Tampa, Florida
October 8, 2004
17
Heritage Capital Appreciation Trust
Trustees and Officers
| | | | | | | | | | |
Name, Address and Age | | Position(s) Held with Fund | | Term of Office* and Length of Time Served | | Principal Occupation(s) During Past 5 years | | Number of Portfolios in Heritage Mutual Funds Complex Overseen by Trustee | | Other Directorships Held by Trustee |
| | | | | |
Affiliated Trustees **
| | | | | | | | | | |
| | | | | |
Thomas A. James 880 Carillon Parkway St. Petersburg, FL 33716 (62) | | Trustee
and
Chairman | | Since
inception
in 1985 | | Chairman of the Board since 1986; Chief Executive Officer of RJF since 1969; Chairman of the Board of RJA since 1986; Chairman of the Board of Eagle since 1984. | | 12 | | Outback
Steakhouse,
Inc. |
| | | | | |
Richard K. Riess 880 Carillon Parkway St. Petersburg, FL 33716 (55) | | President
and
Trustee | | Since
2000
Since
inception
in 1985 | | Executive Vice President and Managing Director for Asset Management of RJF since 1998; CEO of Eagle since 1996; CEO of Heritage since 2000; President of Eagle, 1995 to 2000. | | 12 | | N/A |
| | | | | |
Independent Trustees
| | | | | | | | | | |
| | | | | |
C. Andrew Graham 880 Carillon Parkway St. Petersburg, FL 33716 (64) | | Trustee | | Since
inception
in 1985 | | First Financial Advisors, LLC & Graham Financial Partners LLC (financial planning insurance and investment services) since 1999; Representative of NFP Securities, Inc. (broker-dealer) since 2002; Representative of Multi-Financial Securities Corp. (broker-dealer), 1996 to 2001; | | 12 | | N/A |
| | | | | |
William J. Meurer 880 Carillon Parkway St. Petersburg, FL 33716 (61) | | Trustee | | Since
2003 | | Private Financial Consultant since September 2000; Board of Directors of Tribridge Consulting, Inc. (business consulting services) since 2000; Board of Trustees, Baycare HealthCare and St. Joseph’s-Baptist Health Care since 2000; Advisory Board, Bisk Publishing, Inc. (distance learning provider) since 2000; Managing Partner, Central Florida of Arthur Andersen LLP, 1987 to 2000; Managing Partner, Florida Audit and Business Advisory Services of Arthur Andersen, 1997 to 2000. | | 12 | | Sykes
Enterprises,
Incorporated
(inbound
call
systems). |
18
Heritage Capital Appreciation Trust
Trustees and Officers
| | | | | | | | | | |
Name, Address and Age | | Position(s) Held with Fund | | Term of Office* and Length of Time Served | | Principal Occupation(s) During Past 5 years | | Number of Portfolios in Heritage Mutual Funds Complex Overseen by Trustee | | Other Directorships Held by Trustee |
| | | | | |
Independent Trustees (continued)
| | | | | | | | | | |
| | | | | |
James L. Pappas 880 Carillon Parkway St. Petersburg, FL 33716 (61) | | Trustee | | Since
1989 | | Lykes Professor of Banking and Finance since 1986 at University of South Florida; President, Graduate School of Banking since 1995; Trustee and Chairman of the Board, Tampa Museum of Art. | | 12 | | N/A |
| | | | | |
David M. Phillips 880 Carillon Parkway St. Petersburg, FL 33716 (65) | | Trustee | | Since
inception
in 1985 | | Chief Executive Officer of Evare LLC (information services); Chairman Emeritus of CCC Information Services, Inc.; Executive in Residence, University of North
Carolina – Wilmington,
2000 to 2003. | | 12 | | N/A |
| | | | | |
Eric Stattin 880 Carillon Parkway St. Petersburg, FL 33716 (71) | | Trustee | | Since
1987 | | Private Investor since 1988. | | 12 | | N/A |
| | | | | |
Deborah L. Talbot 880 Carillon Parkway St. Petersburg, FL 33716 (54) | | Trustee | | Since
2002 | | Consultant/Advisor; Member, Academy of Senior Professionals, Eckerd College since 1998; Member, Dean’s Advisory Board of Fogelman School of Business, University of Memphis,
1999-2000; | | 12 | | N/A |
| | | | | |
Officers
| | | | | | | | | | |
| | | | | |
K.C. Clark 880 Carillon Parkway St. Petersburg, FL 33716 (45) | | Executive
Vice
President
and
Principal
Executive
Officer,
Chief
Compliance
Officer | | Since
2000 Since
2004 | | Executive Vice President and Chief Operating Officer of Heritage since 2000; Senior Vice President – Operations and Administration of Heritage, 1998 to 2000; | | N/A | | N/A |
| | | | | |
Andrea N. Mullins 880 Carillon Parkway St. Petersburg, FL 33716 (37) | | Treasurer
and
Secretary | | Since
2003 Since
2004 | | Treasurer and Vice
President – Finance of Heritage since 2003; Vice President – Fund Accounting of Heritage, 1996 to 2003. | | N/A | | N/A |
19
Heritage Capital Appreciation Trust
Trustees and Officers
| | | | | | | | | | |
Name, Address
and Age | | Position(s)
Held with Fund | | Term of Office*
and Length of
Time Served | | Principal Occupation(s)
During Past 5 years | | Number of
Portfolios in
Heritage
Mutual
Funds
Complex
Overseen
by Trustee | | Other
Directorships
Held by Trustee |
| | | | | |
Officers (continued)
| | | | | | | | | | |
| | | | | |
Deborah A. Malina 880 Carillon Parkway
St. Petersburg, FL 33716
(38) | | Assistant
Secretary | | Since 2000 | | Compliance Administrator of Heritage since 2000; Assistant Supervisor of Operations, Heritage, from 1997 to 2000. | | N/A | | N/A |
The Trust’s Statement of Additional Information includes additional information about the Trustees and officers and is available, without charge, upon request, by calling (800) 421-4184.
| * | Trustees serve for the lifetime of the Trust or until they are removed, resign or retire. The Board has adopted a retirement policy that requires Trustees to retire at the age of 72 for those Trustees in office prior to August 2000, and at the age 70 for those Trustees who are elected to office after August 2000. Officers are elected annually for one year terms. |
| ** | Messrs. James and Riess are “interested” persons of the Trust as that term is defined by the Investment Company Act of 1940. Mr. James is affiliated with RJA and RJF. Mr. Riess is affiliated with Heritage and RJF. |
20
Item 2. Code of Ethics
As of the end of the period August 31, 2004, Heritage Capital Appreciation Trust has adopted a code of ethics, as defined in Item 2 of Form N-CSR, that applies to the Principal Executive Officer and Treasurer. Heritage Capital Appreciation Trust has not made any amendments to its code of ethics during the covered period. Heritage Capital Appreciation Trust has not granted any waivers from any provisions of the code of ethics during the covered period. A copy of this code of ethics is filed as an exhibit to this Form N-CSR.
Item 3. Audit Committee Financial Expert
The Board of Trustees of Heritage Capital Appreciation Trust has determined that William J. Meurer is an audit committee financial expert, as defined in Item 3 of Form N-CSR, serving on its audit committee. Mr. Meurer is independent for purposes of Item 3 of Form N-CSR.
Item 4. Principal Accountant Fees and Services
(a) Audit Fees
The aggregate fees billed by registrant’s independent public accountants, PricewaterhouseCoopers LLP (“PwC”) for each of the last two fiscal years for professional services rendered in connection with the audit of registrant’s annual financial statements or services that are normally provided by the accountant in connection with statutory and regulatory filings or engagements were $18,759 for the year ended August 31, 2003, and $21,084 for the year ended August 31, 2004.
(b) Audit-Related Fees
The aggregate fees PwC billed to registrant for each of the last two fiscal years for assurance and other services which are reasonably related to the performance of registrant’s audit and are not reported under Item 4(a) were $ and $0 for the years ended August 31, 2003 and August 31, 2004, respectively. The aggregate fees PwC billed to registrant’s investment adviser and any entity controlling, controlled by, or under common control with registrant’s investment adviser for assurance and other services directly related to the operations and financial reporting of registrant were $33,000 for the year ended August 31, 2003, and $34,000 for the year ended August 31, 2004.
(c) Tax Fees
The aggregate tax fees PwC billed to registrant for each of the last two fiscal years for tax compliance, tax advice, and tax planning services were $4,239 for the year ended August 31, 2003, and $2,791 for the year ended August 31, 2004. The aggregate tax fees PwC billed to registrant’s investment adviser and any entity controlling, controlled by, or under common control with registrant’s investment adviser for services directly related to the operations and financial reporting of registrant were $0 for the year ended August 31, 2004, and $0 for the year ended August 31, 2004.
(d) All Other Fees
For the fiscal years ended August 31, 2004 and 2003, registrant paid PwC no other fees. The aggregate fees PwC billed to registrant’s investment adviser and any entity controlling, controlled by, or under common control with registrant’s investment adviser for any other services directly related to the operations and financial reporting of registrant were $0 for the year ended August 31, 2003, and $0 for the year ended August 31, 2004.
(e) Registrant’s Audit Committee Charter provides that the audit committee (comprised of the Independent Trustees of registrant) is responsible for pre-approval of all auditing services performed for the registrant. The Audit Committee reports to the Board of Trustees (“Board”) regarding its approval of the engagement of the auditor and the proposed fees for the engagement, and the majority of the Board (including the members of the Board who are Independent Trustees) must approve the auditor at an in-person meeting. The Audit Committee also is responsible for pre-approval (subject to the de minimus exception for non-audit services described in the Securities Exchange Act of 1934, as amended, and applicable rule thereunder and not expecting to exceed $5,000) of all non-auditing services performed for the registrant or for any service affiliate of registrant. Registrant’s Audit Committee Charter also permits a designated member of the audit committee to pre-approve, between meetings, one or more non-audit service projects, subject to ratification by the Audit Committee at the next meeting of the Audit Committee. Registrant’s Audit Committee pre-approved all fees described above which PwC billed to registrant.
(f) Less than 50% of the hours billed by PwC for auditing services to registrant for the fiscal year ended August 31, 2004, were for work performed by persons other than full-time, permanent employees of PwC.
(g) The aggregate non-audit fees billed by PwC to registrant and to registrant’s investment adviser and any entity controlling, controlled by, or under common control with registrant’s investment adviser for the fiscal years ending August 31, 2003, and August 31, 2004, were $0 and $0.
(h) Registrant’s Audit Committee has considered the non-audit services provided to the registrant and registrant’s investment adviser and any entity controlling, controlled by, or under common control with registrant’s investment adviser as described above and determined that these services do not compromise PwC’s independence.
Item 5. Audit Committee of Listed Registrants
Not applicable to the registrant.
Item 6. Schedule of Investments
Included as part of report to shareholders under Item 1.
Item 7. Disclosure of Proxy Voting Policies and Procedures for Closed-End Management Investment Companies.
Not applicable to the registrant.
Item 8. Purchase of Equity Securities by Closed-End Management Investment Company and Affiliated Purchasers
Not applicable to the registrant.
Item 9. Submission of Matters to a Vote of Security Holders.
The Trust has adopted a Nominating Committee Charter, which sets forth procedures by which shareholders may recommend nominees to the Trust’s Board of Trustees. Shareholders submitting
recommendations for Independent Trustees should submit recommendations in writing to the attention of the Chairperson of the Nominating Committee of the Trust, and provide at least the following information regarding a candidate: (1) name; (2) date of birth; (3) education; (4) business, professional or other relevant experience and areas of expertise; (5) current business, professional or other relevant experience and areas of expertise; (6) current business and home addresses and contact information; (7) other board positions or prior experience; and (8) any knowledge and experience relating to investment companies and investment company governance .
Item 10. Controls and Procedures
| (a) | Based on an evaluation of the disclosure controls and procedures (as defined in Rule 30a-2(c) under the Act), the Principal Executive Officer and Treasurer of Heritage Capital Appreciation Trust have concluded that such disclosure controls and procedures are effective as of October 15, 2004. |
| (b) | There was no change in the internal controls over financial reporting (as defined in Rule 30a-3(d) under the Act) of Heritage Capital Appreciation Trust that occurred during the second half of its fiscal year that has materially affected or is reasonably likely to materially affect, its internal control over financial reporting. |
Item 11. Exhibits
(a)(1) Code of Ethics pursuant to Item 2 of Form N-CSR is filed and attached hereto as Exhibit 99.CODEETH.
(a)(2) The certification required by Rule 30a-2(a) of the Investment Company Act of 1940, as amended, and Section 302 of the Sarbanes-Oxley Act of 2002 is filed and attached hereto as Exhibit 99.CERT.
(b) The certification required by Rule 30a-2(b) of the Investment Company Act of 1940, as amended, and Section 906 of the Sarbanes-Oxley Act of 2002 is filed and attached hereto as Exhibit 99.906CERT.
SIGNATURES
Pursuant to the requirements of the Securities Exchange Act of 1934 and the Investment Company Act of 1940, the registrant has duly caused this report to be signed on its behalf by the undersigned, thereunto duly authorized.
| | |
| | | HERITAGE CAPITAL APPRECIATION TRUST |
Date: October 25, 2004 | | |
| |
| | | /s/ K.C. Clark
|
| | | K.C. Clark |
| | | Executive Vice President, |
| | | Principal Executive Officer and Chief Compliance Officer |
Pursuant to the requirements of the Securities Exchange Act of 1934 and the Investment Company Act of 1940, this report has been signed below by the following persons on behalf of the registrant and in the capacities and on the dates indicated.
Date: October 25, 2004
|
/s/ K.C. Clark
|
| K.C. Clark |
| Executive Vice President, |
Principal Executive Officer and Chief Compliance Officer |
Date: October 25, 2004
|
/s/ Andrea N. Mullins
|
| Andrea N. Mullins |
| Treasurer and Secretary |