UNITED STATES
SECURITIES AND EXCHANGE COMMISSION
Washington, D.C. 20549
FORM N-CSR
CERTIFIED SHAREHOLDER REPORT OF
REGISTERED MANAGEMENT INVESTMENT COMPANIES
Investment Company Act File Number: 811-4338
HERITAGE CAPITAL APPRECIATION TRUST
(Exact name of Registrant as Specified in Charter)
| | |
| 880 Carillon Parkway St. Petersburg, FL | | 33716 |
|
| (Address of Principal Executive Office) (Zip Code) | | (Zip code) |
RICHARD K. RIESS, PRESIDENT
880 Carillon Parkway St.
Petersburg, FL 33716
(Name and Address of Agent for Service)
Copy to:
CLIFFORD J. ALEXANDER, ESQ.
Kirkpatrick & Lockhart Nicholson Graham LLP
1800 Massachusetts Avenue, NW
Washington, D.C. 20036
Registrant’s Telephone Number, including Area Code: (727) 573-3800
Date of fiscal year end: August 31
Date of reporting period: February 28
Item 1. Reports to Shareholders


March 16, 2005
Dear Fellow Shareholders:
It is a pleasure to report to you on the Heritage Capital Appreciation Trust (the “Fund”)(a) for the six-month period ended February 28, 2005. Our strength and long-term success have been marked by creating value through long-term ownership of growing businesses. This has been evidenced by the source of our long-term outperformance: strong stock selection driven by in-depth fundamental analysis of a business, its value, and importantly, its sustainability into the future. This philosophy and process have served our clients well over our long history.
Throughout 2004, many companies held in the Fund’s portfolio have announced meaningful stock repurchases and dividend increases. This action in and of itself was not particularly surprising to us, as we have proclaimed, with consistency and conviction, that we have constructed portfolios composed of “high-quality” businesses. These businesses are characterized by sustainable earnings and cash flow growth, strong balance sheets, and are led by managements that have a history of allocating capital rationally. We believed it would only be a matter of time until these qualities and characteristics would again benefit the portfolio.
The table below presents the Fund’s Class A shares returns(b), as well as the returns of the Fund’s benchmark index, the Standard & Poor’s 500 Composite Stock Price Index (“S&P 500”), and the Russell 1000 Growth Index for various periods ended February 28, 2005. Performance numbers for Class A shares are shown with and without a front-end sales charge. Also, the performance data quoted represents past performance and the investment return and principal value of an investment will fluctuate so that an investor’s shares, when redeemed, may be worth more or less than the original cost. Please remember, past performance does not guarantee future results and current performance may be higher or lower than the performance data quoted. To obtain more current performance please visit the Heritage website at www.HeritageFunds.com.
| | | | | | | | | | | | |
| | | | | | Average Annual Returns(b)
| |
As of February 28, 2005
| | 6-month
| | | 1-year
| | | 5-years
| | | 10-years
| |
Class A shares | | | | | | | | | | | | |
With front-end sales charge | | +3.34 | % | | +0.10 | % | | -2.92 | % | | +11.68 | % |
Without front-end sales charge | | +8.49 | % | | +5.09 | % | | -1.97 | % | | +12.22 | % |
S&P 500 | | +9.99 | % | | +6.98 | % | | -0.98 | % | | +11.32 | % |
Russell 1000 Growth Index | | +7.67 | % | | +1.13 | % | | -9.71 | % | | +8.66 | % |
(a) The views expressed here are not meant as investment advice. Although some of the described portfolio holdings were viewed favorably as of the date of this letter, there is no guarantee the Fund will continue to hold these securities in the future. Please consider the investment objectives, risks, charges and expenses of any fund carefully before investing. Contact Heritage at (800) 421-4184 or your financial advisor for a prospectus, which contains this and other important information about the Fund. Read the prospectus carefully before you invest.
(b) All returns include the effect of reinvesting dividends. The 1-, 5- and 10-year periods are annualized returns. The S&P 500 is an unmanaged index of 500 widely held stocks that are considered representative of the U.S. stock market. The Russell 1000 Growth Index is constructed to provide a comprehensive and unbiased barometer of the large-cap growth market. The Russell 1000 Growth Index measures the performance of those Russell 1000® Index securities with higher price-to-book ratios and higher forecasted growth values, representative of U.S. securities exhibiting growth characteristics. Keep in mind that individuals cannot invest directly in any index, and index performance does not include transaction costs or other fees, which will affect actual investment performance.
The Fund’s results versus comparable managers continue to be favorable. For the overall period ended February 28, 2005, the Fund’s Class A shares were rated(c) 4-stars. This proprietary rating by Morningstar, Inc.(d) reflects the risk-adjusted performance among its peer group of 1,050 large growth funds. The Fund was also rated(c) by Morningstar, Inc. with 3-stars for the three-year period, 4-stars for the five-year period, and 5-stars for the ten-year period ended February 28, 2005, when compared to a universe of 1,050, 752, and 257 large-growth funds, respectively.
Portfolio Review
Detractors from Performance
The Fund’s holdings in Freddie Mac and Fannie Mae detracted from results during the month. We believe their shares have been weak due to legislation that Congress is considering that would strengthen the powers of its regulator, the Office of Federal Housing Enterprise Oversight (OFHEO). We feel the majority of the weakness can be traced to comments made by Federal Reserve Board Chairman Alan Greenspan, in which he said that the purpose of Freddie Mac and Fannie Mae’s large mortgage portfolios did not make sense and that the companies should shrink their portfolios over the next five to seven years. We think Mr. Greenspan’s comments go beyond what is currently being contemplated in Congress. We believe that with the exception of the Bush Administration, whose current position is not known, most influential policy makers are focused on strengthening OFHEO and not impairing the companies’ business models, such as Mr. Greenspan has suggested. Even in the unlikely event that Mr. Greenspan’s ideas about decreasing Freddie Mac and Fannie Mae’s portfolios were passed by Congress, we believe the firms are still trading slightly below their liquidation values.
Univision Communications, Inc.’s stock fell sharply in November 2004, after the company indicated fourth quarter 2004 revenues would come in below expectations due to a weak television network scatter business. The scatter market is where national advertisers make a national purchase for a short period of time to supplement their other advertising commitments on a specific network. The weakness was primarily due to several advertisers, particularly retailers, who were absent from the scatter market. The company has more exposure to the network scatter business than a traditional broadcast network because it does not sell out its entire television inventory. Univision is willing to run fewer minutes of commercials in order to maintain pricing power. Importantly, the businesses that represent 90% of Univision’s revenues remain strong. These businesses include the upfront advertising commitments on the network, the television station group, and the radio station group. Despite the pullback over the six-month period, at the beginning of March 2005, Univision’s stock rebounded sharply as the company reported that its first quarter television revenue is showing a strong growth trend, signaling a reversal from the scatter market weakness that pushed its stock down in November 2004.
Lamar Advertising is the largest independent outdoor advertising company in the U.S. Lamar’s stock was steady over most of the period, but pulled back at the end of February 2005 on the heels of its quarterly earnings report.
(c) These ratings are subject to change every month. Funds with at least three years of performance history are assigned ratings from the fund’s 3-, 5- and 10-year average annual returns (when available) and a risk factor that reflects fund performance relative to three-month Treasury bill monthly returns. Funds’ returns are adjusted for fees and sales loads. Ten percent of the funds in an investment category receive five stars, 22.5% receive four stars, 35% receive three stars, 22.5% receive two stars and the bottom 10% receive one star. Investment return and principal value will vary so that investors have a gain or loss when shares are sold. Funds are rated for up to three time periods (3-, 5-, and 10-years) and these ratings are combined to produce an overall rating. Ratings are objective, may vary among share classes and are based on a mathematical evaluation of past performance. Past performance does not guarantee future results.
(d) ©2005 Morningstar, Inc. All Rights Reserved. The information contained herein: (1) is proprietary to Morningstar and/or its content providers; (2) may not be copied or distributed; and (3) is not warranted to be accurate, complete or timely. Neither Morningstar nor its content providers are responsible for any damages or losses arising from any use of this information. Past performance is no guarantee of future results.
2
The company delivered in line fourth quarter revenue, but greater-than-expected expenses led to an Earnings Before Interest, Taxes, Depreciation, and Amortization (EBITDA) shortfall. Management indicated that this above-run rate expense growth was one time in nature, guided for moderating expenses in the first quarter and throughout 2005, and expects continued strong revenue growth similar to that of 2004.
QUALCOMM, Inc. is the innovator of Code Division Multiple Access (CDMA) technology and possesses an extensive portfolio of intellectual property rights spanning over 2,800 patents (both issued and pending) pertaining to CDMA and wireless technology. QUALCOMM’s stock performed well over most of the period, but was sold off by many investors in January 2005 after the company’s second quarter guidance disappointed Wall Street. QUALCOMM cited a smaller handset market and increased research and development (R&D) expenses as chief reasons for the adjustment. We maintain high confidence in the growth of the CDMA market and believe QUALCOMM’s stock is attractively valued. As such, we added to the portfolio’s position throughout 2004. We also believe that investing in R&D will allow the company to further distance itself from its competitors.
Top Contributors to Performance
Cablevision Systems Corp. was the biggest contributor to the Fund’s absolute performance over the past six-months. The stock recently rose sharply on the heels of its quarterly earnings report. The company booked a non-cash impairment charge on its satellite venture during the quarter, indicating that it may not continue to develop this particular business. We have recently trimmed the Fund’s position on the stock’s appreciation and have benefited from management’s ability to unlock value from its cable and programming assets.
Harrah’s Entertainment, Inc.’s stock benefited from a solid quarterly earnings report released in February 2005, which was driven by broad strength across the company’s geographically diverse set of gaming properties. Harrah’s is the only gaming business that has pursued a national brand for its casinos. The company owns and operates casinos in virtually every major gaming market in the country. Harrah’s seeks to drive shareholder value through same-store growth, acquisitions, and selective new building projects; while focusing on return-on-invested capital. This is in sharp contrast to Harrah’s major gaming industry competitors, which remain competitive by spending ever-escalating amounts of capital on lavish new projects with varying returns.
Crown Castle International Corp. is the world’s largest independent telecommunications tower consolidator. Crown owns and operates wireless communications tower sites as well as a major broadcast transmission grid. The company has benefited from its strategic position in the sweet spot of wireless beneficiaries. Demand for tower space stems from the proliferation of traditional wireless services such as cellular and PCS, but also includes demand for new services, such as, two-way paging, digital TV, digital radio, and picture messaging.
McGraw-Hill Companies, Inc. is a leading player in each of its three operating segments: Financial Services, McGraw-Hill Education, and Info-media. The financial services segment includes the Standard & Poor’s rating agency, which is considered by many the most reputed and dominant global credit rating agency. Along with Moody’s, these two agencies operate in an industry environment that can be characterized as quasi-monopolistic or a “partnership-monopoly.” Their long-term growth prospects are being driven by increasing international bond issuance and an ever-growing global market for new and complex structured financing vehicles.
Caremark Rx, Inc. is a leading pharmacy benefit management (PBM) company. PBMs plan and administer programs for reducing drug costs, primarily by designing drug formularies. Now that Caremark has closed its acquisition of Advanced PCS, it ranks as the largest PBM in terms of covered lives and the second largest in terms of prescriptions processed. The stock has performed well as the cost cutting trend in health care is expected to benefit the PBM industry over the long term.
3
Portfolio Changes
Over the past six months, we have added several businesses to the portfolio. The following are several examples:
Lowe’s Companies, Inc.
We initiated a position in Lowe’s Companies, Inc., which is the second largest home improvement retailer after Home Depot. We feel Lowe’s is poised to benefit from increased remodeling of an aging housing stock, as well as an increasing rate of home ownership. Lowe’s operates more efficiently than Home Depot and has consistently put up better numbers while being the industry’s low cost operator. This is because Lowe’s modeled its transition to big box retailing on Wal-Mart by building an extremely efficient distribution system.
Medco Health Solutions, Inc.
Medco Health Solutions, Inc. is the second largest pharmacy benefit manager (PBM) in terms of covered lives and prescriptions filled and holds a 15% market share in terms of total prescription volume. Medco takes advantage of the increasing secular trend of generic drug penetration, specialty distribution, and mail order growth unique to the PBM industry. Specifically, we believe Medco stands to benefit from the wave of many drugs going generic in 2005 and 2006. In addition, the company generates strong free cash flow and is net debt free.
Wal-Mart Stores, Inc.
Wal-Mart Stores, Inc. meets our criteria for a high-quality growth investment for several reasons. First, the company continues to dominate the U.S. discount store retailing arena. Wal-Mart maintains the leadership position by constantly improving its cost structure so that prices can be lowered. This effort increases revenues, leads to strong profit growth, and drives sales in a virtuous circle. Next, the company is applying the low cost structure to new initiatives, which include selling groceries and expanding internationally. Wal-Mart is already gaining market share in these budding areas, as consumers are attracted by the unique low price format. Despite its continued growth, we expect for Wal-Mart to generate approximately $2 to $4 billion in free cash flow in each of the next few years. As such, the company is financially flexible and could use the cash to buy back stock, make international acquisitions, and increase its dividend.
As high-quality growth business buyers, it has been difficult to demonstrate the value of our discipline in the recent market environment. Market trends have preferred energy, utilities, and cyclical stocks over the high-quality growth businesses in which we typically invest. However, we believe that our companies continue to look attractive relative to those that have led the market over the past few years. We believe that owning high-quality growth businesses over the long-term is the recipe for investment success.
Please bear in mind that this Fund invests primarily in common stock whose value may decrease in response to the activities of the company that issued the stock and general market and economic conditions. Also, since the fund normally will hold a focused portfolio of stocks, the increase or decrease of the value of a single stock may have a greater impact on the Fund’s total return. Please refer to the Fund’s prospectus for more information about these and other risks. We thank you for your continued investment in the Heritage Capital Appreciation Trust and look forward to a long and prosperous relationship.
| | |
| Sincerely, | | Sincerely, |
| |
 | |  |
| Herbert E. Ehlers | | Richard K. Riess President Heritage Capital Appreciation Trust |
| Managing Director/Partner | |
| Chief Investment Officer | |
| Goldman Sachs Asset Management, L.P. | | |
| Portfolio Manager | | |
| Heritage Capital Appreciation Trust | | |
4
Heritage Capital Appreciation Trust
Investment Portfolio
February 28, 2005
(unaudited)
| | | | | |
Shares
| | | | Value
|
Common Stocks—98.1% (a)
| | | |
Advertising—2.3%
| | | |
| 301,850 | | Lamar Advertising Company* | | $ | 11,859,686 |
| | | | |
|
|
Beverages—3.3%
| | | |
| 306,000 | | PepsiCo, Inc. | | | 16,481,160 |
| | | | |
|
|
Broadcasting Services/Programs—3.1%
| | | |
| 473,300 | | Clear Channel Communications, Inc. | | | 15,751,424 |
| | | | |
|
|
Commercial Services—8.7%
| | | |
| 1,057,000 | | Cendant Corporation | | | 23,380,840 |
| 134,139 | | Moody’s Corporation | | | 11,255,603 |
| 255,110 | | Valassis Communications, Inc.* | | | 9,543,665 |
| | | | |
|
|
| | | | | | 44,180,108 |
| | | | |
|
|
Electronics—0.7%
| | | |
| 151,155 | | Dolby Laboratories, Inc.,
Class “A”* | | | 3,488,657 |
| | | | |
|
|
Financial Services—9.6%
| | | |
| 972,949 | | Charles Schwab Corporation | | | 10,215,964 |
| 330,000 | | Fannie Mae | | | 19,291,800 |
| 305,000 | | Freddie Mac | | | 18,910,000 |
| | | | |
|
|
| | | | | | 48,417,764 |
| | | | |
|
|
Food—1.0%
| | | |
| 76,300 | | Wm. Wrigley Jr. Company | | | 5,078,528 |
| | | | |
|
|
Internet—6.2%
| | | |
| 400,000 | | eBay Inc.* | | | 17,136,000 |
| 447,000 | | YAHOO! Inc.* | | | 14,424,690 |
| | | | |
|
|
| | | | | | 31,560,690 |
| | | | |
|
|
Lodging—7.3%
| | | |
| 483,000 | | Harrah’s Entertainment, Inc. | | | 31,679,970 |
| 116,810 | | Las Vegas Sands Corporation* | | | 5,595,199 |
| | | | |
|
|
| | | | | | 37,275,169 |
| | | | |
|
|
Multimedia—13.0%
| | | |
| 1,425,735 | | Entravision Communications Corporation, Class “A”* | | | 11,691,027 |
| 44,655 | | Entravision Communications Corporation, Class “A”* | | | 366,171 |
| 247,420 | | McGraw-Hill Companies, Inc. | | | 22,725,527 |
| 552,000 | | Time Warner Inc.* | | | 9,510,960 |
| 618,159 | | Viacom, Inc., Class “B” | | | 21,573,750 |
| | | | |
|
|
| | | | | | 65,867,435 |
| | | | |
|
|
Pharmaceuticals—4.3%
| | | |
| 422,443 | | Caremark Rx, Inc.* | | | 16,171,118 |
| 120,000 | | Medco Health Solutions, Inc.* | | | 5,330,400 |
| | | | |
|
|
| | | | | | 21,501,518 |
| | | | |
|
|
| | | | | |
Shares
| | | | Value
|
Common Stocks (continued)
|
Retail—6.0%
| | | |
| 179,810 | | Lowe’s Companies Inc. | | | 10,569,232 |
| 277,160 | | Petco Animal Supplies Inc.* | | | 9,822,550 |
| 198,000 | | Wal-Mart Stores, Inc. | | | 10,218,780 |
| | | | |
|
|
| | | | | | 30,610,562 |
| | | | |
|
|
Savings & Loans—1.2%
| | | |
| 102,000 | | Golden West Financial Corporation | | | 6,312,780 |
| | | | |
|
|
Software—6.5%
| | | |
| 567,848 | | First Data Corporation | | | 23,293,125 |
| 390,000 | | Microsoft Corporation | | | 9,820,200 |
| | | | |
|
|
| | | | | | 33,113,325 |
| | | | |
|
|
Telecommunications—13.2%
| | | |
| 400,200 | | American Tower Corporation, Class “A”* | | | 7,335,667 |
| 2,160,000 | | Crown Castle International Corporation* | | | 35,294,400 |
| 680,000 | | QUALCOMM, Inc. | | | 24,554,800 |
| | | | |
|
|
| | | | | | 67,184,867 |
| | | | |
|
|
Television, Cable & Radio—11.7%
| | | |
| 825,663 | | Cablevision Systems Corporation, Class “A”* | | | 25,645,093 |
| 547,000 | | Univision Communications, Inc., Class “A”* | | | 14,435,330 |
| 888,025 | | Westwood One, Inc.* | | | 19,394,466 |
| | | | |
|
|
| | | | | | 59,474,889 |
| | | | |
|
|
| Total Common Stocks (cost $414,948,588) | | | 498,158,562 |
| | | | |
|
|
Repurchase Agreement—1.9% (a)
| | | |
Repurchase Agreement with State Street Bank and
Trust Company, dated February 28, 2005 @ 2.52%
to be repurchased at $9,406,658 on March 1, 2005,
collateralized by $7,955,000 United States
Treasury Bonds, 6.125% due August 15, 2029,
(market value $9,492,338 including interest)
(cost $9,406,000) | | | 9,406,000 |
| | | | |
|
|
Total Investment Portfolio
(cost $424,354,588) (b), 100.0% (a) | | | 507,564,562 |
| Other Assets and Liabilities, net, 0.0% (a) | | | 11,088 |
| | | | |
|
|
| Net Assets, 100.0% | | $ | 507,575,650 |
| | | | |
|
|
| * | Non-income producing security. |
| (a) | Percentages indicated are based on net assets. |
| (b) | The aggregate identified cost for federal income tax purposes is the same. Market value includes net unrealized appreciation of $83,209,974 which consists of aggregate gross unrealized appreciation for all securities in which there is an excess of market value over tax cost of $101,985,625 and aggregate gross unrealized depreciation for all securities in which there is an excess of tax cost over market value of $18,775,651. |
The accompanying notes are an integral part of the financial statements.
5
Heritage Capital Appreciation Trust
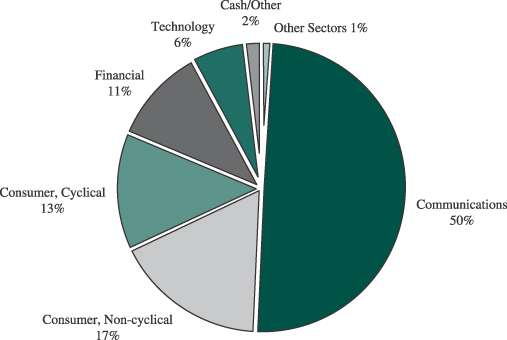
Portfolio Allocation
(unaudited)
Sector Allocation as of February 28, 2005 (% of net assets)
Beginning with the Fund’s fiscal quarter ended November 30, 2004, the Fund began filing its complete schedule of portfolio holdings with the Securities Exchange Commission (“SEC”) for the first and third quarters of each fiscal year on Form N-Q; the Fund’s Forms N-Q will be available on the SEC’s website at http://www.sec.gov; and the Fund’s Forms N-Q may be reviewed and copied at the SEC’s Public Reference Room in Washington, DC. Information on the operation of the Public Reference Room may be obtained by calling 1-800-SEC-0330.
6
Heritage Capital Appreciation Trust
Understanding Your Fund’s Expenses
(unaudited)
Understanding Your Fund’s Expenses
As a mutual fund investor, you pay ongoing expenses, such as management fees, distribution fees and other expenses. Using the tables below, you can estimate how these expenses affect your investment and compare them with the expenses of other funds. Please note that the expenses shown in the table are meant to highlight your ongoing costs only and do not reflect one-time transaction expenses, such as sales charges (loads) or redemption fees. Therefore, if these transactional costs were included, your costs would have been higher. For more information, see your Fund’s prospectus or talk to your financial adviser.
Review Your Fund’s Actual Expenses
The table below shows the actual expenses you would have paid on a $1,000 investment in Heritage Capital Appreciation Trust on September 1, 2004 and held through February 28, 2005. It also shows how much a $1,000 investment would be worth at the close of the period, assuming actual returns after ongoing expenses. This table is useful in comparing ongoing costs only, and will not help you determine the relative total costs of owning different funds. Simply divide your account value by $1,000 (for example, an $8,600 account value divided by $1,000 = 8.6), then multiply the result by the number in the line under the heading entitled “Expenses Paid During Period” to estimate the expenses you paid on your account during this period.
| | | | | | | | | |
Actual
| | Beginning
Account Value
September 1, 2004
| | Ending
Account Value
February 28, 2005
| | Expenses Paid
During Period*
|
Class A | | $ | 1,000 | | $ | 1,085 | | $ | 6.07 |
Class B | | $ | 1,000 | | $ | 1,080 | | $ | 9.93 |
Class C | | $ | 1,000 | | $ | 1,080 | | $ | 9.93 |
Hypothetical Example for Comparison Purposes
All mutual funds now follow guidelines to assist shareholders in comparing expenses between different funds. Per these guidelines, the table below shows your Fund’s expenses based on a $1,000 investment, assuming a hypothetical 5% annualized return before ongoing expenses invested at the beginning of the period and held for the entire period. Please note that you should not use this information to estimate your actual ending account balance and expenses paid during the period. You can use this information to compare the ongoing expenses (but not transaction expenses or total costs) of investing in the Fund with those of other funds. All mutual fund shareholder reports will provide this information to help you make this comparison.
| | | | | | | | | |
Hypothetical (5% return before expenses)
| | Beginning
Account Value
September 1, 2004
| | Ending
Account Value
February 28, 2005
| | Expenses Paid
During Period*
|
Class A | | $ | 1,000 | | $ | 1,019 | | $ | 5.88 |
Class B | | $ | 1,000 | | $ | 1,015 | | $ | 9.62 |
Class C | | $ | 1,000 | | $ | 1,015 | | $ | 9.62 |
| | * | Expenses are calculated using the Fund’s annualized expense ratios for Class A (1.17%), Class B (1.92%) and Class C (1.92%) shares, multiplied by the average account value for the period, then multiplying the result by the actual number of days in the period (181); and then dividing that result by the actual number of days in the fiscal year (365). |
7
Heritage Capital Appreciation Trust
Statement of Assets and Liabilities
February 28, 2005
(unaudited)
| | | | | | | |
Assets | | | | | | | |
Investments, at value (identified cost $414,948,588) | | | | | $ | 498,158,562 | |
Repurchase agreement (identified cost $9,406,000) | | | | | | 9,406,000 | |
Cash | | | | | | 34 | |
Receivables: | | | | | | | |
Investments sold | | | | | | 8,606,239 | |
Fund shares sold | | | | | | 1,779,763 | |
Dividends and interest | | | | | | 315,689 | |
Deferred state qualification expenses | | | | | | 24,100 | |
Prepaid insurance | | | | | | 989 | |
| | | | | |
|
|
|
Total assets | | | | | $ | 518,291,376 | |
| | | | | |
|
|
|
Liabilities | | | | | | | |
Payables: | | | | | | | |
Investments purchased | | $ | 8,842,750 | | | | |
Fund shares redeemed | | | 1,234,811 | | | | |
Accrued management fee | | | 295,163 | | | | |
Accrued distribution fee | | | 189,409 | | | | |
Accrued shareholder servicing fee | | | 84,477 | | | | |
Accrued fund accounting fee | | | 12,800 | | | | |
Other accrued expenses | | | 56,316 | | | | |
| | |
|
| | | | |
Total liabilities | | | | | | 10,715,726 | |
| | | | | |
|
|
|
Net assets, at market value | | | | | $ | 507,575,650 | |
| | | | | |
|
|
|
Net Assets | | | | | | | |
Net assets consist of: | | | | | | | |
Paid-in capital | | | | | $ | 449,100,072 | |
Undistributed net investment income | | | | | | 243,436 | |
Accumulated net realized loss | | | | | | (24,977,832 | ) |
Net unrealized appreciation on investments | | | | | | 83,209,974 | |
| | | | | |
|
|
|
Net assets, at market value | | | | | $ | 507,575,650 | |
| | | | | |
|
|
|
Class A shares | | | | | | | |
Net asset value and redemption price per share ($351,712,237 divided by 14,192,521 shares of beneficial interest outstanding, no par value) | | | | | $ | 24.78 | |
| | | | | |
|
|
|
Maximum offering price per share (100/95.25 of $24.78 ) | | | | | $ | 26.02 | |
| | | | | |
|
|
|
Class B shares | | | | | | | |
Net asset value, offering price and redemption price per share ($36,428,279 divided by 1,584,201 shares of beneficial interest outstanding, no par value) | | | | | $ | 22.99 | |
| | | | | |
|
|
|
Class C shares | | | | | | | |
Net asset value, offering price and redemption price per share ($119,435,134 divided by 5,196,297 shares of beneficial interest outstanding, no par value) | | | | | $ | 22.98 | |
| | | | | |
|
|
|
The accompanying notes are an integral part of the financial statements.
8
Heritage Capital Appreciation Trust
Statement of Operations
For the Six-Month Period Ended February 28, 2005
(unaudited)
| | | | | | |
Investment Income | | | | | | |
Income: | | | | | | |
Dividends | | | | | $ | 3,630,142 |
Interest | | | | | | 130,958 |
| | | | | |
|
|
Total income | | | | | | 3,761,100 |
Expenses: | | | | | | |
Management fee | | $ | 1,874,360 | | | |
Distribution fee (Class A) | | | 430,892 | | | |
Distribution fee (Class B) | | | 184,971 | | | |
Distribution fee (Class C) | | | 590,606 | | | |
Shareholder servicing fees | | | 221,857 | | | |
Professional fees | | | 66,099 | | | |
State qualification expenses | | | 44,499 | | | |
Fund accounting fee | | | 35,215 | | | |
Reports to shareholders | | | 34,418 | | | |
Custodian fee | | | 18,014 | | | |
Trustees’ fees and expenses | | | 9,672 | | | |
Insurance | | | 5,774 | | | |
Federal registration expense | | | 159 | | | |
Other | | | 1,128 | | | |
| | |
|
| | | |
Total expenses | | | | | | 3,517,664 |
| | | | | |
|
|
Net investment income | | | | | | 243,436 |
| | | | | |
|
|
| | |
Realized and Unrealized Gain on Investments | | | | | | |
Net realized gain from investment transactions | | | | | | 6,788,542 |
Net unrealized appreciation of investments during the period | | | | | | 32,203,428 |
| | | | | |
|
|
Net gain on investments | | | | | | 38,991,970 |
| | | | | |
|
|
Net increase in net assets resulting from operations | | | | | $ | 39,235,406 |
| | | | | |
|
|
Statements of Changes in Net Assets
| | | | | | | |
| | | For the Six-Month
Period Ended
February 28, 2005
(unaudited)
| | For the Fiscal
Year Ended
August 31, 2004
| |
Increase in net assets: | | | | | | | |
Operations: | | | | | | | |
Net investment income (loss) | | $ | 243,436 | | $ | (2,852,107 | ) |
Net realized gain from investment transactions | | | 6,788,542 | | | 13,889,558 | |
Net unrealized appreciation of investments during the period | | | 32,203,428 | | | 5,807,690 | |
| | |
|
| |
|
|
|
Net increase in net assets resulting from operations | | | 39,235,406 | | | 16,845,141 | |
Increase in net assets from Fund share transactions | | | 960,131 | | | 69,648,471 | |
| | |
|
| |
|
|
|
Increase in net assets | | | 40,195,537 | | | 86,493,612 | |
Net assets, beginning of period | | | 467,380,113 | | | 380,886,501 | |
| | |
|
| |
|
|
|
Net assets, end of period (including undistributed net investment income of
$243,436 for the period ended February 28, 2005) | | $ | 507,575,650 | | $ | 467,380,113 | |
| | |
|
| |
|
|
|
The accompanying notes are an integral part of the financial statements.
9
Heritage Capital Appreciation Trust
Financial Highlights
The following table includes selected data for a share outstanding throughout each period and other performance information derived from the financial statements.
| | | | | | | | | | | | | | | | | | | | | | | | | | | | | | | | | | | | | | | | | | | | | | | | | | | | | | | | | | | | | | | | | | | | | | | | |
| | | Class A Shares
| | | Class B Shares
| | | Class C Shares
| |
| | | For the
Six-Month
Period
Ended
February 28,
2005
(unaudited)
| | | For the Fiscal Years Ended August 31
| | | For the
Six-Month
Period
Ended
February 28,
2005
(unaudited)
| | | For the Fiscal Years Ended August 31
| | | For the
Six-Month
Period
Ended
February 28,
2005
(unaudited)
| | | For the Fiscal Years Ended August 31
| |
| | | | 2004
| | | 2003
| | | 2002
| | | 2001
| | | 2000
| | | | 2004
| | | 2003
| | | 2002
| | | 2001
| | | 2000
| | | | 2004
| | | 2003
| | | 2002
| | | 2001
| | | 2000
| |
Net asset value, beginning of period | | $ | 22.85 | | | $ | 21.82 | | | $ | 18.26 | | | $ | 23.61 | | | $ | 32.41 | | | $ | 27.18 | | | $ | 21.28 | | | $ | 20.47 | | | $ | 17.25 | | | $ | 22.47 | | | $ | 31.20 | | | $ | 26.40 | | | $ | 21.27 | | | $ | 20.46 | | | $ | 17.25 | | | $ | 22.46 | | | $ | 31.19 | | | $ | 26.39 | |
| | |
|
|
| |
|
|
| |
|
|
| |
|
|
| |
|
|
| |
|
|
| |
|
|
| |
|
|
| |
|
|
| |
|
|
| |
|
|
| |
|
|
| |
|
|
| |
|
|
| |
|
|
| |
|
|
| |
|
|
| |
|
|
|
Income from Investment Operations: | | | | | | | | | | | | | | | | | | | | | | | | | | | | | | | | | | | | | | | | | | | | | | | | | | | | | | | | | | | | | | | | | | | | | | | | |
Net investment income (loss) | | | 0.04 | | | | (0.08 | ) | | | (0.12 | ) | | | (0.17 | ) | | | (0.16 | ) | | | (0.16 | ) | | | (0.05 | ) | | | (0.26 | ) | | | (0.24 | ) | | | (0.31 | ) | | | (0.29 | ) | | | (0.29 | ) | | | (0.05 | ) | | | (0.24 | ) | | | (0.21 | ) | | | (0.30 | ) | | | (0.29 | ) | | | (0.29 | ) |
Net realized and unrealized gain on investments | | | 1.89 | | | | 1.11 | | | | 3.68 | | | | (5.18 | ) | | | (5.44 | ) | | | 8.01 | | | | 1.76 | | | | 1.07 | | | | 3.46 | | | | (4.91 | ) | | | (5.24 | ) | | | 7.71 | | | | 1.76 | | | | 1.05 | | | | 3.42 | | | | (4.91 | ) | | | (5.24 | ) | | | 7.71 | |
| | |
|
|
| |
|
|
| |
|
|
| |
|
|
| |
|
|
| |
|
|
| |
|
|
| |
|
|
| |
|
|
| |
|
|
| |
|
|
| |
|
|
| |
|
|
| |
|
|
| |
|
|
| |
|
|
| |
|
|
| |
|
|
|
Total from Investment Operations | | | 1.93 | | | | 1.03 | | | | 3.56 | | | | (5.35 | ) | | | (5.60 | ) | | | 7.85 | | | | 1.71 | | | | 0.81 | | | | 3.22 | | | | (5.22 | ) | | | (5.53 | ) | | | 7.42 | | | | 1.71 | | | | 0.81 | | | | 3.21 | | | | (5.21 | ) | | | (5.53 | ) | | | 7.42 | |
| | |
|
|
| |
|
|
| |
|
|
| |
|
|
| |
|
|
| |
|
|
| |
|
|
| |
|
|
| |
|
|
| |
|
|
| |
|
|
| |
|
|
| |
|
|
| |
|
|
| |
|
|
| |
|
|
| |
|
|
| |
|
|
|
Less Distributions: | | | | | | | | | | | | | | | | | | | | | | | | | | | | | | | | | | | | | | | | | | | | | | | | | | | | | | | | | | | | | | | | | | | | | | | | |
Distributions from net realized gains | | | — | | | | — | | | | — | | | | — | | | | (3.20 | ) | | | (2.62 | ) | | | — | | | | — | | | | — | | | | — | | | | (3.20 | ) | | | (2.62 | ) | | | — | | | | — | | | | — | | | | — | | | | (3.20 | ) | | | (2.62 | ) |
| | |
|
|
| |
|
|
| |
|
|
| |
|
|
| |
|
|
| |
|
|
| |
|
|
| |
|
|
| |
|
|
| |
|
|
| |
|
|
| |
|
|
| |
|
|
| |
|
|
| |
|
|
| |
|
|
| |
|
|
| |
|
|
|
Net asset value, end of period | | $ | 24.78 | | | $ | 22.85 | | | $ | 21.82 | | | $ | 18.26 | | | $ | 23.61 | | | $ | 32.41 | | | $ | 22.99 | | | $ | 21.28 | | | $ | 20.47 | | | $ | 17.25 | | | $ | 22.47 | | | $ | 31.20 | | | $ | 22.98 | | | $ | 21.27 | | | $ | 20.46 | | | $ | 17.25 | | | $ | 22.46 | | | $ | 31.19 | |
| | |
|
|
| |
|
|
| |
|
|
| |
|
|
| |
|
|
| |
|
|
| |
|
|
| |
|
|
| |
|
|
| |
|
|
| |
|
|
| |
|
|
| |
|
|
| |
|
|
| |
|
|
| |
|
|
| |
|
|
| |
|
|
|
Total Return (%) (a) | | | 8.49 | (b) | | | 4.72 | | | | 19.50 | | | | (22.66 | ) | | | (18.48 | ) | | | 29.55 | | | | 8.04 | (b) | | | 3.96 | | | | 18.67 | | | | (23.23 | ) | | | (19.01 | ) | | | 28.75 | | | | 8.04 | (b) | | | 3.96 | | | | 18.61 | | | | (23.20 | ) | | | (19.02 | ) | | | 28.76 | |
Ratios and Supplemental Data | | | | | | | | | | | | | | | | | | | | | | | | | | | | | | | | | | | | | | | | | | | | | | | | | | | | | | | | | | | | | | | | | | | | | | | | |
Expenses to
average daily net assets (%) | | | 1.17 | (c) | | | 1.19 | | | | 1.26 | | | | 1.23 | | | | 1.22 | | | | 1.24 | | | | 1.92 | (c) | | | 1.94 | | | | 1.97 | | | | 1.93 | | | | 1.91 | | | | 1.90 | | | | 1.92 | (c) | | | 1.94 | | | | 1.97 | | | | 1.93 | | | | 1.91 | | | | 1.90 | |
Net investment income (loss) to average daily net assets (%) | | | 0.33 | (c) | | | (0.39 | ) | | | (0.66 | ) | | | (0.80 | ) | | | (0.68 | ) | | | (0.55 | ) | | | (0.42 | )(c) | | | (1.15 | ) | | | (1.37 | ) | | | (1.50 | ) | | | (1.36 | ) | | | (1.21 | ) | | | (0.42 | )(c) | | | (1.14 | ) | | | (1.37 | ) | | | (1.50 | ) | | | (1.37 | ) | | | (1.21 | ) |
Portfolio turnover
rate (%) | | | 14 | | | | 27 | | | | 22 | | | | 31 | | | | 28 | | | | 48 | | | | 14 | | | | 27 | | | | 22 | | | | 31 | | | | 28 | | | | 48 | | | | 14 | | | | 27 | | | | 22 | | | | 31 | | | | 28 | | | | 48 | |
Net assets, end
of period
($ millions) | | | 352 | | | | 321 | | | | 248 | | | | 197 | | | | 233 | | | | 244 | | | | 36 | | | | 36 | | | | 37 | | | | 32 | | | | 42 | | | | 43 | | | | 119 | | | | 111 | | | | 96 | | | | 67 | | | | 78 | | | | 74 | |
| (a) | These returns are calculated without the imposition of either front-end or contingent deferred sales charges. |
The accompanying notes are an integral part of the financial statements.
10
Heritage Capital Appreciation Trust
Notes to Financial Statements
(unaudited)
| Note 1: | Significant Accounting Policies. Heritage Capital Appreciation Trust (the “Fund”) is organized as a Massachusetts business trust and is registered under the Investment Company Act of 1940, as amended, as a diversified, open-end management investment company. The Fund seeks to achieve capital appreciation over the long term by investing principally in common stock. The Fund currently offers Class A and Class C shares to the public. Effective February 1, 2004, Class B shares were not available for direct purchase. Class B shares will continue to be available through exchanges and dividend reinvestments as described in the Fund’s prospectus. Class A shares are sold subject to a maximum sales charge of 4.75% of the amount invested payable at the time of purchase. Class A share investments greater than $1 million, where a maximum sales charge is waived, may be subject to a maximum contingent deferred sales charge of 1% upon redemptions made in less than 18 months of purchase. Class B shares were sold and are still subject to a 5% maximum contingent deferred sales charge (based on the lower of purchase price or redemption price), declining over a six-year period. Class C shares are sold subject to a contingent deferred sales charge of 1% of the lower of net asset value or purchase price payable upon any redemptions made in less than one year of purchase. The preparation of financial statements in accordance with accounting principles generally accepted in the United States of America requires management to make estimates and assumptions that affect the reported amounts and disclosures. Actual results could differ from those estimates. The following is a summary of significant accounting policies: |
Security Valuation: The Fund values investment securities at market value based on the last quoted sales price as reported by the principal securities exchange on which the security is traded. If the security is traded on the Nasdaq Stock Market, the official NASDAQ closing price is used. If no sale is reported, market value is based on the most recent quoted bid price. In the absence of a market quote, when prices are not reflective of market value, or when a significant event has been recognized with respect to a security, securities are valued using such methods as the Board of Trustees believes would reflect fair market value. Short-term investments having a maturity of 60 days or less are valued at amortized cost, which approximates market value.
Repurchase Agreements: The Fund enters into repurchase agreements whereby the Fund, through its custodian, receives delivery of the underlying securities, the market value of which at the time of purchase is required to be an amount equal to at least 100% of the resale price. Repurchase agreements involve the risk that the seller will fail to repurchase the security, as agreed. In that case, the Fund will bear the risk of market value fluctuations until the security can be sold and may encounter delays and incur costs in liquidating the security. In the event of bankruptcy or insolvency of the seller, delays and costs may be incurred.
Federal Income Taxes: The Fund is treated as a single corporate taxpayer as provided for in the Tax Reform Act of 1986, as amended. The Fund’s policy is to comply with the requirements of the Internal Revenue Code of 1986, as amended, which are applicable to regulated investment companies and to distribute substantially all of its taxable income to its shareholders. Accordingly, no provision has been made for federal income and excise taxes.
Distribution of Income and Gains: Distributions of net investment income are made annually. Net realized gains from investment transactions during any particular year in excess of available capital loss carryforwards, which, if not distributed, would be taxable to the Fund, will be distributed to shareholders in the following fiscal year. The Fund uses the identified cost method for determining realized gain or loss on investments for both financial and federal income tax reporting purposes.
11
Heritage Capital Appreciation Trust
Notes to Financial Statements
(unaudited)
(continued)
Expenses: The Fund is charged for those expenses that are directly attributable to it, while other expenses are allocated proportionately among the Heritage mutual funds based upon methods approved by the Board of Trustees. Expenses that are directly attributable to a specific class of shares, such as distribution fees, are charged directly to that class. Other expenses of the Fund are allocated to each class of shares based upon their relative percentage of net assets.
Other: Investment security transactions are accounted for on a trade date basis. Dividend income and distributions to shareholders are recorded on the ex-dividend date. Interest income is recorded on the accrual basis.
In the normal course of business the Fund enters into contracts that contain a variety of representations and warranties, which provide general indemnifications. The Fund’s maximum exposure under these arrangements is unknown, as this would involve future claims that may be made against the Fund and/or its affiliates that have not yet occurred. However, based on experience, the Fund expects the risk of loss to be remote.
| Note 2: | Fund Shares. At February 28, 2005, there were an unlimited number of shares of beneficial interest of no par value authorized. |
Transactions in Class A, B and C shares of the Fund during the six-month period ended February 28, 2005, were as follows:
| | | | | | | | | | | | | | | | | | | | | |
| | | Class A Shares
| | | Class B Shares
| | | Class C Shares
| |
| | | Shares
| | | Amount
| | | Shares
| | | Amount
| | | Shares
| | | Amount
| |
Shares sold | | 3,058,919 | | | $ | 76,049,887 | | | 44,672 | | | $ | 1,030,701 | | | 630,556 | | | $ | 14,437,299 | |
Shares redeemed | | (2,895,694 | ) | | | (72,325,257 | ) | | (138,744 | ) | | | (3,175,435 | ) | | (657,553 | ) | | | (15,057,064 | ) |
| | |
|
| |
|
|
| |
|
| |
|
|
| |
|
| |
|
|
|
Net increase (decrease) | | 163,225 | | | $ | 3,724,630 | | | (94,072 | ) | | $ | (2,144,734 | ) | | (26,997 | ) | | $ | (619,765 | ) |
| | | | | |
|
|
| | | | |
|
|
| | | | |
|
|
|
Shares outstanding: | | | | | | | | | | | | | | | | | | | | | |
Beginning of period | | 14,029,296 | | | | | | | 1,678,273 | | | | | | | 5,223,294 | | | | | |
| | |
|
| | | | | |
|
| | | | | |
|
| | | | |
End of period | | 14,192,521 | | | | | | | 1,584,201 | | | | | | | 5,196,297 | | | | | |
| | |
|
| | | | | |
|
| | | | | |
|
| | | | |
Transactions in Class A, B and C shares of the Fund during the fiscal year ended August 31, 2004, were as follows:
| | | | | | | | | | | | | | | | | | | | | |
| | | Class A Shares
| | | Class B Shares
| | | Class C Shares
| |
| | | Shares
| | | Amount
| | | Shares
| | | Amount
| | | Shares
| | | Amount
| |
Shares sold | | 5,284,879 | | | $ | 120,996,652 | | | 175,571 | | | $ | 3,678,508 | | | 1,550,693 | | | $ | 32,903,919 | |
Shares redeemed | | (2,634,124 | ) | | | (60,066,397 | ) | | (289,273 | ) | | | (6,167,323 | ) | | (1,015,394 | ) | | | (21,696,888 | ) |
| | |
|
| |
|
|
| |
|
| |
|
|
| |
|
| |
|
|
|
Net increase
(decrease) | | 2,650,755 | | | $ | 60,930,255 | | | (113,702 | ) | | $ | (2,488,815 | ) | | 535,299 | | | $ | 11,207,031 | |
| | | | | |
|
|
| | | | |
|
|
| | | | |
|
|
|
Shares outstanding: | | | | | | | | | | | | | | | | | | | | | |
Beginning of fiscal year | | 11,378,541 | | | | | | | 1,791,975 | | | | | | | 4,687,995 | | | | | |
| | |
|
| | | | | |
|
| | | | | |
|
| | | | |
End of fiscal
year . . . | | 14,029,296 | | | | | | | 1,678,273 | | | | | | | 5,223,294 | | | | | |
| | |
|
| | | | | |
|
| | | | | |
|
| | | | |
12
Heritage Capital Appreciation Trust
Notes to Financial Statements
(unaudited)
(continued)
| Note 3: | Purchases and Sales of Securities. For the six-month period ended February 28, 2005, purchases and sales of investment securities (excluding repurchase agreements and short-term obligations) aggregated $67,741,952 and $70,385,906, respectively. |
| Note 4: | Management, Subadvisory, Distribution, Shareholder Servicing Agent, Fund Accounting and Trustees Fees. Under the Fund’s Investment Advisory and Administration Agreement with Heritage Asset Management, Inc. (the “Manager” or “Heritage”), the Fund agrees to pay to the Manager a fee equal to an annualized rate of 0.75% of the Fund’s average daily net assets, computed daily and payable monthly. The Manager has contractually agreed to waive its fees and, if necessary, reimburse the Fund to the extent that Class A annual operating expenses exceed 1.60% of the Class A average daily net assets and to the extent that the Class B and Class C annual operating expenses each exceed 2.10% of those classes’ average daily net assets for the fiscal year ending August 31, 2005. No fees were waived and no expenses were reimbursed for the six-month period ended February 28, 2005. |
The Manager entered into a subadvisory agreement with Goldman Sachs Asset Management LP (the “Subadviser”) to provide to the Fund investment advice, portfolio management services (including the placement of brokerage orders) and certain compliance and other services for an annualized fee payable by the Manager. Eagle Asset Management, Inc. (“Eagle”), a wholly owned subsidiary of Raymond James Financial, Inc. (“RJF”), serves as an additional subadviser to the Fund. However, the Manager currently has not allocated any assets of the Fund to Eagle.
Pursuant to the Fund’s prospectus, effective January 1, 2004, the Fund is authorized to pay the Distributor a fee of 0.25% of the average daily net assets. The Class B and Class C Distribution Plans provide for payments at an annual rate of up to 1.00% of the average daily net assets. Such fees are accrued daily and payable monthly. Class B shares will convert to Class A shares eight years after the end of the calendar month in which the shareholder’s order to purchase was accepted. The Manager, Distributor, Fund Accountant and Shareholder Servicing Agent are all wholly owned subsidiaries of RJF.
Raymond James & Associates, Inc. (the “Distributor” or “RJA”) has advised the Fund that it generated $128,628 in front-end sales charges and $92,340 in contingent deferred sales charges for Class A shares, $38,158 in contingent deferred sales charges for Class B shares and $9,372 in contingent deferred sales charges for Class C shares for the six-month period ended February 28, 2005. From these fees, the Distributor paid commissions to salespersons and incurred other distribution costs.
The Manager also is the Shareholder Servicing Agent and Fund Accountant for the Fund.
Trustees of the Fund also serve as Trustees for Heritage Cash Trust, Heritage Growth and Income Trust, Heritage Income Trust and Heritage Series Trust, investment companies that are also advised by the Manager (collectively referred to as the “Heritage Mutual Funds”). Each Trustee of the Heritage Mutual Funds who is not an employee of the Manager or an employee of an affiliate of the Manager receives an annual fee of $18,000 and an additional fee of $3,000 for each combined quarterly meeting of the Heritage Mutual Funds attended. In addition, each independent Trustee that serves on the Audit Committee or Compliance Committee will receive $500 for attendance at their respective meeting (in person or telephonic). The Lead Independent Trustee, the Audit Committee Chair, and the Compliance Committee Chair each will receive an annual retainer of $2,500, in addition to meeting fees. Trustees’ fees and expenses are paid equally by each portfolio in the Heritage Mutual Funds.
13
Heritage Capital Appreciation Trust
Notes to Financial Statements
(unaudited)
(continued)
| Note 5: | Federal Income Taxes. For the fiscal year ended August 31, 2004, to reflect reclassifications arising from permanent book/tax differences attributable to a net operating loss, the Fund increased (credited) accumulated net investment loss $2,852,107 and decreased (debited) paid in capital $2,852,107. As of August 31, 2004, the Fund had net tax basis capital loss carryforwards in the aggregate of $28,665,299. Capital loss carryforwards of $13,646,547 were utilized in the fiscal year ended August 31, 2004, capital loss carryforwards, $3,683,493 and $24,981,806 may be applied to any net taxable capital gain until their expiration date of 2010 and 2011, respectively. |
| | For income tax purposes, distributions paid during the fiscal years ended August 31, 2004 and 2003 were as follows: |
| | | | | | |
| Distributions paid from: | | 2004
| | 2003
|
Ordinary Income | | $ | 0 | | $ | 0 |
Long-Term Capital Gains | | $ | 0 | | $ | 0 |
| | As of August 31, 2004, the components of distributable earnings on a tax basis were as follows: |
| | | | | | |
Undistributed Ordinary Income | | $ | 0 | |
Accumulated Capital Losses | | $ | (28,665,299 | ) |
Tax Basis Net Unrealized Appreciation | | $ | 47,905,471 | |
| | The difference between book-basis and tax-basis unrealized appreciation/depreciation is attributable primarily to the tax deferral of losses on wash sales. |
14
Item 2. Code of Ethics
Not applicable to semi-annual reports.
Item 3. Audit Committee Financial Expert
Not applicable to semi-annual reports.
Item 4. Principal Accountant Fees and Services
Not applicable to semi-annual reports.
Item 5. Audit Committee of Listed Registrants
Not applicable to the registrant.
Item 6. Schedule of Investments
Included as part of report to shareholders under Item 1.
Item 7. Disclosure of Proxy Voting Policies and Procedures for Closed-end Management Investment Companies
Not applicable to the registrant.
Item 8. Portfolio Managers of Closed-End Management Investment Companies
Not applicable to the registrant.
Item 9. Purchases of Equity Securities by Closed-End Management Investment Company and Affiliated Purchasers
Not applicable to the registrant.
Item 10. Submission of Matters to a Vote of Security Holders
There have been no material changes to the Nominating Committee Charter, which sets forth procedures by which shareholders may recommend nominees to the Trust’s Board of Trustees, since the Trust last provided disclosure in response to this item.
Item 11. Controls and Procedures
| (a) | Based on an evaluation of the disclosure controls and procedures (as defined in Rule 30a-2(c) under the Act), the Principal Executive Officer and Principal Financial Officer of Heritage Capital Appreciation Trust have concluded that such disclosure controls and procedures are effective as of April 27, 2005. |
| (b) | There was no change in the internal controls over financial reporting (as defined in Rule 30a-3(d) of Heritage Capital Appreciation Trust that occurred during the first half of its fiscal year that has materially affected or is reasonably likely to materially affect, its internal control over financial reporting. |
Item 12. Exhibits
(a)(1) Not applicable to semi-annual reports.
(a)(2) The certifications required by Rule 30a-2(a) of the Investment Company Act of 1940, as amended, and Section 302 of the Sarbanes-Oxley Act of 2002 is filed and attached hereto as Exhibit 99.CERT.
(a)(3) Not applicable to the registrant.
(b) The certifications required by Rule 30a-2(b) of the Investment Company Act of 1940, as amended, and Section 906 of the Sarbanes-Oxley Act of 2002 is filed and attached hereto as Exhibit 99.906CERT.
SIGNATURES
Pursuant to the requirements of the Securities Exchange Act of 1934 and the Investment Company Act of 1940, the registrant has duly caused this report to be signed on its behalf by the undersigned, thereunto duly authorized.
| | | | |
| | | | | HERITAGE CAPITAL APPRECIATION TRUST |
| | |
| Date: April 27, 2005 | | | | |
| | |
| | | | | /s/ K.C. Clark
|
| | | | | K.C. Clark |
| | | | | Executive Vice President and Principal Executive Officer |
Pursuant to the requirements of the Securities Exchange Act of 1934 and the Investment Company Act of 1940, this report has been signed below by the following persons on behalf of the registrant and in the capacities and on the dates indicated.
Date: April 27, 2005
| | | | |
| | | | | |
| | |
| | | | | |
| | |
| | | | | /s/ K.C. Clark
|
| | | | | K.C. Clark |
| | | | | Executive Vice President and Principal Executive Officer |
Date: April 27, 2005
| | | | |
| | | | | |
| | |
| | | | | |
| | |
| | | | | /s/ Andrea N. Mullins
|
| | | | | Andrea N. Mullins |
| | | | | Principal Financial Officer and Treasurer |