UNITED STATES
SECURITIES AND EXCHANGE COMMISSION
Washington, D.C. 20549
FORM N-CSR
CERTIFIED SHAREHOLDER REPORT OF
REGISTERED MANAGEMENT INVESTMENT COMPANIES
Investment Company Act file Number: 811-04338
HERITAGE CAPITAL APPRECIATION TRUST
(Exact name of Registrant as Specified in Charter)
880 Carillon Parkway
St. Petersburg, FL 33716
(Address of Principal Executive Office) (Zip Code)
Registrant’s Telephone Number, including Area Code: (727) 573-3800
RICHARD K. RIESS, PRESIDENT
880 Carillon Parkway
St. Petersburg, FL 33716
(Name and Address of Agent for Service)
Copy to:
CLIFFORD J. ALEXANDER, ESQ.
Kirkpatrick & Lockhart Nicholson Graham LLP
1800 Massachusetts Avenue, NW
Washington, D.C. 20036
Date of fiscal year end: August 31
Date of reporting period: August 31, 2005
| Item 1. | Reports to Shareholders |


September 15, 2005
Dear Fellow Shareholders:
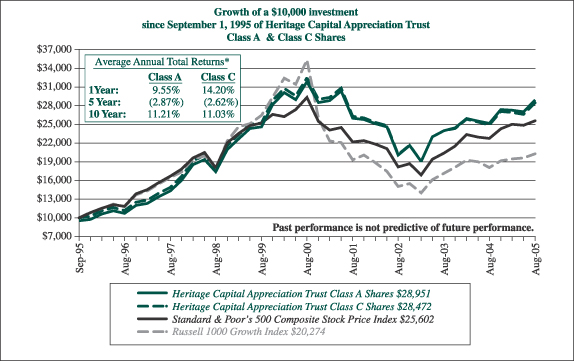
As shareholders of the Heritage Capital Appreciation Trust (the “Fund”)(a) we are pleased to report you on the performance of the Fund for the fiscal year ended August 31, 2005. The table below presents the Fund’s Class A shares returns(b), as well as the returns of the Fund’s benchmark index, the Standard & Poor’s 500 Composite Stock Price Index (“S&P 500”), and the Russell 1000 Growth Index for the various periods ended August 31, 2005. Performance numbers for Class A shares are shown with and without a front-end sales charge. Also, the performance data quoted represents past performance and the investment return and principal value of an investment will fluctuate so that an investor’s shares, when redeemed, may be worth more or less than their original cost. Please remember, past performance does not guarantee future results and current performance may be higher or lower than the performance data quoted. To obtain more current performance, please visit the Fund’s website at www.HeritageFunds.com.
| | | | | | | | | | | | |
| | | Average Annual Returns(b)
| |
As of August 31, 2005
| | 1-year
| | | 3-years
| | | 5-years
| | | 10-years
| |
Class A shares | | | | | | | | | | | | |
With front-end sales charge | | +9.55 | % | | +11.09 | % | | -2.87 | % | | +11.21 | % |
Without front-end sales charge | | +15.01 | % | | +12.90 | % | | -1.92 | % | | +11.75 | % |
S&P 500 | | +12.56 | % | | +12.03 | % | | -2.71 | % | | +9.85 | % |
Russell 1000 Growth Index | | +12.14 | % | | +10.46 | % | | -10.52 | % | | +7.33 | % |
The Fund’s results versus comparable funds continue to be favorable. For the period ended August 31, 2005, the Fund’s Class A shares’ overall star rating(c) was 4-stars. This proprietary rating by Morningstar, Inc.(d) reflects the risk-adjusted performance of the Fund among its peer group of 1,104 large growth funds. The Fund was also rated(c) by Morningstar, Inc.(d) with 3-stars for the three-year period, 4-stars for the five-year period, and 5-stars for the ten year period ended August 31, 2005, when compared to a universe of 1,104, 840, and 275 large-growth funds, respectively.
(a) The views expressed here are not meant as investment advice. Although some of the described portfolio holdings were viewed favorably as of the date of this letter, there is no guarantee the Fund will continue to hold these securities in the future. Please consider the investment objectives, risks, charges and expenses of any fund carefully before investing. Contact Heritage at (800) 421-4184 or your financial advisor for a prospectus, which contains this and other important information about the Fund. Read the prospectus carefully before you invest.
(b) All returns include the effect of reinvesting dividends. The 1-, 3-, 5- and 10-year periods are annualized returns. The S&P 500 is an unmanaged index of 500 widely held stocks that are considered representative of the U.S. stock market. The Russell 1000 Growth Index is constructed to provide a comprehensive and unbiased barometer of the large-cap growth market. The Russell 1000 Growth Index measures the performance of those Russell 1000® Index securities with higher price-to-book ratios and higher forecasted growth values, representative of U.S. securities exhibiting growth characteristics. Keep in mind that individuals cannot invest directly in any index, and index performance does not include transaction costs or other fees, which will affect actual investment performance.
(c) These ratings are subject to change every month. Funds with at least three years of performance history are assigned ratings on a scale from one to five stars from the fund’s 3-, 5- and 10-year average annual returns (when available) and a risk factor that reflects fund performance relative to three-month Treasury bill monthly returns. Funds’ returns are adjusted for fees and sales loads. Ten percent of the funds in an investment category receive five stars, 22.5% receive four stars, 35% receive three stars, 22.5% receive two stars and the bottom 10% receive one star. Investment return and principal value will vary so that investors have a gain or loss when shares are sold. Funds are rated for up to three time periods (3-, 5-, and 10-years) and these ratings are combined to produce an overall rating. Ratings are objective, may vary among share classes and are based on a mathematical evaluation of past performance. Past performance does not guarantee future results.
(d) ©2005 Morningstar, Inc. All Rights Reserved. The information contained herein: (1) is proprietary to Morningstar and/or its content providers; (2) may not be copied or distributed; and (3) is not warranted to be accurate, complete or timely. Neither Morningstar nor its content providers are responsible for any damages or losses arising from any use of this information. Past performance is no guarantee of future results.
Let’s talk about sustainability. The market is always looking for relative growth. Investors rotate in and out of sectors looking for the next hot growth area. Yesterday it was technology, today it is energy, and tomorrow some other sector will be in favor. But our approach favors sustainable earnings growth over relative growth. We seek a portfolio of companies showing steady low-to-mid-teens growth year in and year out. These are not always hot, but we believe it is earnings growth that should be rewarded and reflected in stock prices over time.
Next, let’s talk about the idea of per share value. Yes, we approach investing as if we are buying the business, but in order to implement our strategy in the public markets, we must buy shares. So the key component in creating wealth must be tied to the economic instrument we hold – the value of the equity share. We believe, as many of our companies’ managements do, that while there may be other places to spend their free cash flow, few currently offer as attractive potential return as repurchasing the companies’ own shares. This is a sign of financial discipline that we believe is underappreciated in today’s market, which is instead focused on the hot sectors that are in the headlines every day. The management teams of our companies seek to take advantage of the disinterest of the Street and buy up their shares at attractive prices. As of June 30, 2005, 24 out of 33 companies in the Fund’s portfolio have authorized a share repurchase program.
Portfolio Review
Top Contributors to Performance (in descending order from top contributor)
Crown Castle International Corporation’s stock was up as the company refinanced its balance sheet, turning its high-yield debt into lower-yielding debt, effectively decreasing its annual interest expense. Because this translates into a $50 million increase in free cash flow for the tower company, the market bid the stock up. We also own American Tower Corporation in the portfolio. The company is the largest independent owner and operator of wireless telecommunication towers in the United States, and shares a duopoly with Crown Castle. We believe the nature of the tower industry ensures transparency in revenue and earnings growth because these businesses are able to lock their wireless telephone and broadcast customers into long-term contracts.
Harrah’s Entertainment, Inc. was a top contributor to performance. Harrah’s stock benefited from a solid quarterly earnings report released at the beginning of this year, which was driven by broad strength across the company’s geographically diverse set of gaming properties. Harrah’s is the only gaming business that has pursued a national brand for its casinos. The company owns and operates casinos in virtually every major gaming market in the country.
Cablevision Systems Corporation contributed positively to performance over the past year. We sold out of the position in August. Cablevision’s stock soared in mid-June after the Dolan family announced that it intends to take the business private for approximately $8 billion. We trimmed the position after the announcement and then completely sold out of the remaining shares. Much like the move to take Cox Communications private last year, we believe that the Dolan’s proposal and the subsequent investor reaction are an affirmation that the market has undervalued the cable business. We believe that this move illustrated a closing of the valuation gap.
Caremark Rx, Inc. was up sharply over the past 12 months. The stock benefited from news that a pending investigation by the Justice Department is near settlement. Caremark reported strong first quarter results bolstered by the positive impact of a large contract that was recently won, as well as a significant increase in mail pharmacy revenues. Due to the company’s strong performance and its significant cash flow generation, the company increased its share repurchase program by $500 million.
McGraw-Hill Companies, Inc., which owns Standard & Poor’s (S&P), was notably strong over the period. Along with Moody’s Corporation, these businesses meet our investment criteria as they operate in an industry environment that can be characterized as quasi-monopolistic or a “partnership-monopoly” since most issuers tend to have at least two ratings, one from each agency. As a result, S&P and Moody’s rate approximately 90% of the debt issuance in the U.S. We believe their growth is sustainable because it is supported by favorable secular trends, such as the globalization of capitalism, deregulation, and financial innovation.
Detractors from Performance
eBay, Inc. was the biggest detractor from the Fund’s absolute performance over the past year. We sold out of the company during the period. Earlier in the year, eBay’s stock fell sharply on the heels of its quarterly earnings
2
report. While the company beat its earnings and revenue guidance, it fell slightly short of Wall Street’s higher expectations. The shortfall was attributed to the fact that eBay boosted its strategic investments during the quarter, primarily in its subsidiary Paypal and its China operations.
Fannie Mae and Freddie Mac weighed on the Fund’s performance. We sold out of Fannie Mae at the end of July. Recently, the Senate Banking Committee approved a bill that would require both Fannie Mae and Freddie Mac to shrink their mortgage portfolios. The companies’ stocks were weak on the news, as investors digested the implications of the Committee’s bill. It is important to note that it passed along party lines, which we believe makes it unlikely that the bill will move forward as there would have to be a compromise between Democrats and Republicans. We believe that the influential Democrats on the committee are staunchly opposed to portfolio limits. In our opinion, it is doubtful that a bill passing on such narrow lines would even make it to the Senate floor for discussion. If this holds true, it could take some headline pressure off of Freddie Mac and enable it to trade more on current fundamentals, which we think are compelling.
Univision Communications, Inc.’s stock underperformed over the period and pulled back sharply at the end of last year after the company indicated fourth quarter revenues would come in below expectations due to a weak television network scatter business. The scatter market is where national advertisers make a national purchase for a short period of time to supplement their other advertising commitments on a specific network. The weakness was primarily due to several advertisers, particularly retailers, who were absent from last year’s scatter market. The company has more exposure to the network scatter business than a traditional broadcast network because it does not sell out its entire television inventory. Univision is willing to run fewer minutes of commercials in order to maintain pricing power.
PETCO Animal Supplies, Inc. negatively impacted the Fund’s performance. In April, its shares tumbled after the company warned of a possible restatement and lowered fiscal year earnings estimates after it uncovered accounting errors. The stock rebounded slightly after management said it would make adjustments to reflect the correct accounting in its fourth-quarter results, instead of a formal restatement, which would require going back and showing the impact of the accounting change on prior periods. We sold out of the company during the period.
Portfolio Changes
Over the past year, we have added several businesses to the portfolio. The following are a few examples:
Fisher Scientific International, Inc.
Fisher Scientific is the world’s largest distributor and/or manufacturer of many consumable products serving the health care research industry. Over the past few years, Fisher has transformed its business model from a traditional health care-oriented distribution model with lower margins into a vertically integrated supplier and manufacturer with higher growth and margins. More than 80% of its revenues are from consumable products, which provide Fisher with a recurring revenue stream. We believe Fisher is positioned to benefit from several trends in the health care industry. The trend of large pharmaceutical companies to consolidate their number of suppliers should benefit Fisher, as we believe they have the largest product portfolio, most efficient distribution, and can provide the companies with a one-stop shop for all of their research and development (“R&D”) supply needs. Additionally, growth of R&D continues to be robust, as there is a perpetual effort to innovate and find new products to satisfy outstanding medical needs.
Suncor Energy, Inc.
Suncor is one of the fastest growing integrated oil companies, increasing production at a rate of over 10% a year. The oil sands companies are characterized as non-conventional oil companies, since they primarily mine tar sands to get their oil versus conventional oil companies that use a traditional well-based method. As a result, Suncor’s finding costs are relatively minimal, it is not subject to declines in the number of barrels that can be produced from a well, and it is not subject to exploration risk. While the conventional companies are dependent on an increasing oil price to grow earnings, we believe the oil sands companies’ earnings should grow substantially, assuming flat oil prices.
3
We believe Suncor has enduring and sustainable growth prospects. The oil sands producers will likely be some of the only producers to meaningfully grow production over the next decade. Suncor’s management has consistently improved its cost structure leading it to have the lowest capital cost structure in the oil sands industry. Oil sands players require minimal maintenance-capital expenditures, unlike conventional oil players that spend maintenance capital to stem production declines. Suncor’s key competitive advantages include oil sands production becoming increasingly more cost competitive, a favorable tax regime, and geographic proximity to the world’s largest market.
Target Corporation
We believe Target meets our criteria for a high quality growth company for a number of reasons. The company is a leader in the retail industry, and one of the best merchandisers in the business. Target continues to take market share and add to its existing store base, all while experiencing strong sales comparison momentum. Target serves a higher-end demographic than its main competitor, Wal-Mart, and consequently has customers who are less sensitive to inflation and increasing energy and medical costs. The company’s recent focus on its supply chain has helped double its distribution capacity, which should help drive growth. In addition, Target recently divested Mervyns and Marshall Field’s and received better-than-expected valuations for both of the sales. Target also has an attractive real estate strategy and currently owns 80% of its real estate. The company recently increased its share buyback plan and plans to purchase $3 billion of its own shares over the next 2 to 3 years.
We continue to believe that many of our companies’ stocks are trading at a discount to the intrinsic value of the business. To take advantage of this environment, many of these companies have recently announced plans to buy back stock. To us, it is a wise capital allocation decision to buy back existing assets when they are priced attractively. Such opportunities do not last forever, and that is why we have fully supported our company managements in buying as many shares as they reasonably can while the opportunity lasts. Eventually, we believe the market will recognize the true economic earnings power of these businesses and will afford the now materially higher earnings per share at a higher multiple.
Please bear in mind that this Fund invests primarily in common stock whose value may decrease in response to the activities of the company that issued the stock and general market and economic conditions. Also, since the Fund normally will hold a focused portfolio of stocks, the increase or decrease of the value of a single stock may have a greater impact on the Fund’s total return. Please refer to the Fund’s prospectus for more information about these and other risks.
In closing, we are pleased to report that, on August 16, 2005, the Fund’s trustees appointed Mr. Keith B. Jarrett as a new Trustee to the Heritage Capital Appreciation Trust. Mr. Jarrett’s background in financial information services and venture capital investing is a welcome addition to the Fund’s current Board.
We thank you for your continued investment in the Heritage Capital Appreciation Trust and look forward to a long and prosperous relationship.
| | |
Sincerely, | | Sincerely, |
| |

| | 
|
Herbert E. Ehlers | | David G. Shell, CFA |
Managing Director / Partner | | Managing Director / Partner |
Goldman, Sachs & Co. | | Goldman, Sachs & Co. |
Chief Investment Officer | | Chief Investment Officer |
Growth Strategy | | Growth Strategy |
Goldman Sachs Asset Management, L.P. | | Goldman Sachs Asset Management, L.P. |
Senior Portfolio Manager | | Senior Portfolio Manager |
Heritage Capital Appreciation Trust | | Heritage Capital Appreciation Trust |
4
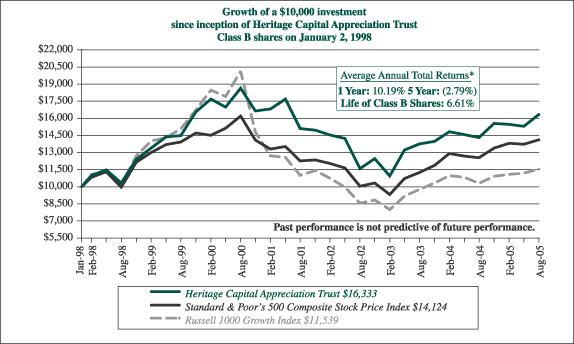
| * | Average annual returns for Heritage Capital Appreciation Trust Class A, B and C shares are calculated in conformance with Item 21 of Form N-1A, which assumes the maximum front-end sales charge of 4.75% for Class A shares, a contingent deferred sales charge for Class B shares (4% for the one year period, 1% for the five year period and 0% for the life of Class B shares) and reinvestment of dividends for Class A, B and C shares. Performance presented represents historical data. The investment return and principal value of an investment will fluctuate so that an investor’s shares, when redeemed, may be worth more or less than their original cost. The Fund’s past performance is not indicative of future performance and should be considered in light of the Fund’s investment policy and objectives, the characteristics and quality of its portfolio securities, and the periods selected. The graph and table do not reflect the deduction of taxes that a shareholder would pay on fund distributions or the redemption of fund shares. |
5
Heritage Capital Appreciation Trust
Investment Portfolio
August 31, 2005
| | | | | |
Shares
| | | | Value
|
Common Stocks—95.8% (a)
| | | |
Advertising—2.2%
| | | |
| 301,850 | | Lamar Advertising Company* | | $ | 12,140,407 |
| | | | |
|
|
Beverages—3.1%
| | | |
| 306,000 | | PepsiCo, Inc. | | | 16,784,100 |
| | | | |
|
|
Broadcasting Services/Programs—2.6%
|
| 420,300 | | Clear Channel Communications, Inc. | | | 13,995,990 |
| | | | |
|
|
Commercial Services—7.8%
| | | |
| 1,057,000 | | Cendant Corporation | | | 21,499,380 |
| 268,278 | | Moody’s Corporation | | | 13,175,133 |
| 200,000 | | Valassis Communications, Inc.* | | | 7,886,000 |
| | | | |
|
|
| | | | | | 42,560,513 |
| | | | |
|
|
Electronics—1.0%
| | | |
| 84,000 | | Fisher Scientific International Inc.* | | | 5,416,320 |
| | | | |
|
|
Financial Services—7.1%
| | | |
| 423,000 | | Freddie Mac | | | 25,540,740 |
| 972,949 | | The Charles Schwab Corporation | | | 13,164,000 |
| | | | |
|
|
| | | | | | 38,704,740 |
| | | | |
|
|
Food—1.0%
| | | |
| 76,300 | | Wm. Wrigley Jr. Company | | | 5,421,115 |
| | | | |
|
|
Healthcare Products—2.5%
| | | |
| 246,000 | | Stryker Corporation | | | 13,419,300 |
| | | | |
|
|
Internet—2.0%
| | | |
| 320,000 | | Yahoo! Inc.* | | | 10,668,800 |
| | | | |
|
|
Leisure Time—1.3%
| | | |
| 147,000 | | Carnival Corporation | | | 7,252,980 |
| | | | |
|
|
Lodging—6.1%
| | | |
| 483,000 | | Harrah’s Entertainment, Inc. | | | 33,597,480 |
| | | | |
|
|
Multimedia—10.7%
| | | |
| 1,625,740 | | Entravision Communications Corporation, Class “A”* | | | 13,233,525 |
| 542,840 | | The McGraw-Hill Companies, Inc. | | | 26,175,745 |
| 554,159 | | Viacom Inc., Class “B” | | | 18,835,864 |
| | | | |
|
|
| | | | | | 58,245,134 |
| | | | |
|
|
Oil & Gas—2.9%
| | | |
| 263,800 | | Suncor Energy Inc. | | | 15,632,788 |
| | | | |
|
|
Oil & Gas Services—5.0%
| | | |
| 318,500 | | Schlumberger Ltd. | | | 27,464,255 |
| | | | |
|
|
Pharmaceuticals—6.5%
| | | |
| 507,443 | | Caremark Rx, Inc.* | | | 23,712,811 |
| 240,000 | | Medco Health Solutions, Inc.* | | | 11,824,800 |
| | | | |
|
|
| | | | | | 35,537,611 |
| | | | |
|
|
| | | | | | |
Shares
| | | | Value
| |
Common Stocks (continued)
| | | | |
Retail—5.2%
| | | | |
| 304,810 | | Lowe’s Companies, Inc. | | $ | 19,602,331 | |
| 162,300 | | Target Corporation | | | 8,723,625 | |
| | | | |
|
|
|
| | | | | | 28,325,956 | |
| | | | |
|
|
|
Savings & Loans—1.1%
| | | | |
| 102,000 | | Golden West Financial Corporation | | | 6,220,980 | |
| | | | |
|
|
|
Software—4.8%
| | | | |
| 623,848 | | First Data Corporation | | | 25,920,884 | |
| | | | |
|
|
|
Telecommunications—15.8%
| | | | |
| 240,000 | | American Tower Corporation, Class “A”* | | | 5,721,600 | |
| 2,160,000 | | Crown Castle International Corporation* | | | 53,481,600 | |
| 680,000 | | QUALCOMM Inc. | | | 27,002,800 | |
| | | | |
|
|
|
| | | | | | 86,206,000 | |
| | | | |
|
|
|
Television, Cable & Radio—7.1%
| | | | |
| 773,000 | | Univision Communications Inc., Class “A”* | | | 20,793,700 | |
| 888,025 | | Westwood One, Inc. | | | 18,053,548 | |
| | | | |
|
|
|
| | | | | | 38,847,248 | |
| | | | |
|
|
|
| Total Common Stocks (cost $415,040,014) | | | 522,362,601 | |
| | | | |
|
|
|
Repurchase Agreement — 4.6% (a)
| | | | |
Repurchase Agreement with State Street Bank and
Trust Company, dated August 31, 2005 @ 3.40%
to be repurchased at $24,983,359 on September 1,
2005, collateralized by $25,840,000 United States
Treasury Notes, 3.625% due May 15, 2013,
(market value $25,501,201 including interest)
(cost $24,981,000) | | | 24,981,000 | |
| | | | |
|
|
|
Total Investment Portfolio
(cost $440,021,014) (b), 100.4% (a) | | | 547,343,601 | |
| Other Assets and Liabilities, net, (0.4%) (a) | | | (2,334,693 | ) |
| | | | |
|
|
|
| Net Assets, 100.0% | | $ | 545,008,908 | |
| | | | |
|
|
|
| * | Non-income producing security. |
| (a) | Percentages indicated are based on net assets. |
| (b) | The aggregate identified cost for federal income tax purposes is $442,645,299. Market value includes net unrealized appreciation of $104,698,302 which consists of aggregate gross unrealized appreciation for all securities in which there is an excess of market value over tax cost of $122,592,652 and aggregate gross unrealized depreciation for all securities in which there is an excess of tax cost over market value of $17,894,350. |
The accompanying notes are an integral part of the financial statements.
6
Heritage Capital Appreciation Trust
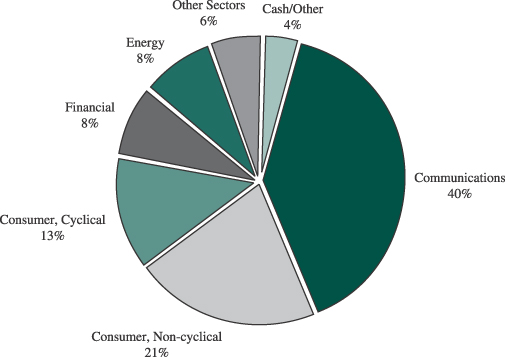
Portfolio Allocation
(unaudited)
Sector Allocation as of August 31, 2005 (% of net assets)
Beginning with the Fund’s fiscal quarter ended November 30, 2004, the Fund began filing its complete schedule of portfolio holdings with the Securities Exchange Commission (“SEC”) for the first and third quarters of each fiscal year on Form N-Q; the Fund’s Forms N-Q are available on the SEC’s website at http://www.sec.gov; and the Fund’s Forms N-Q may be reviewed and copied at the SEC’s Public Reference Room in Washington, DC. Information on the operation of the Public Reference Room may be obtained by calling 1-800-SEC-0330.
The accompanying notes are an integral part of the financial statements.
7
Heritage Capital Appreciation Trust
Understanding Your Fund’s Expenses
(unaudited)
Understanding Your Fund’s Expenses
As a mutual fund investor, you pay ongoing expenses, such as management fees, distribution fees and other expenses. Using the tables below, you can estimate how these expenses affect your investment and compare them with the expenses of other funds. Please note that the expenses shown in the table are meant to highlight your ongoing costs only and do not reflect one-time transaction expenses, such as sales charges (loads) or redemption fees. Therefore, if these transactional costs were included, your costs would have been higher. For more information, see your Fund’s prospectus or talk to your financial advisor.
Review Your Fund’s Actual Expenses
The table below shows the actual expenses you would have paid on a $1,000 investment in Heritage Capital Appreciation Trust on March 1, 2005 and held through August 31, 2005. It also shows how much a $1,000 investment would be worth at the close of the period, assuming actual returns after ongoing expenses. This table is useful in comparing ongoing costs only, and will not help you determine the relative total costs of owning different funds. Simply divide your account value by $1,000 (for example, an $8,600 account value divided by $1,000 = 8.6), then multiply the result by the number in the line under the heading entitled “Expenses Paid During Period” to estimate the expenses you paid on your account during this period.
| | | | | | | | | |
Actual
| | Beginning
Account Value
March 1, 2005
| | Ending
Account Value
August 31, 2005
| | Expenses Paid
During Period*
|
Class A | | $ | 1,000 | | $ | 1,061 | | $ | 6.11 |
Class B | | $ | 1,000 | | $ | 1,057 | | $ | 10.00 |
Class C | | $ | 1,000 | | $ | 1,057 | | $ | 10.00 |
Hypothetical Example for Comparison Purposes
All mutual funds now follow guidelines to assist shareholders in comparing expenses between different funds. Per these guidelines, the table below shows your Fund’s expenses based on a $1,000 investment, assuming a hypothetical 5% annualized return before ongoing expenses invested at the beginning of the period and held for the entire period. Please note that you should not use this information to estimate your actual ending account balance and expenses paid during the period. You can use this information to compare the ongoing expenses (but not transaction expenses or total costs) of investing in the Fund with those of other funds. All mutual fund shareholder reports will provide this information to help you make this comparison.
| | | | | | | | | |
Hypothetical (5% return before expenses)
| | Beginning
Account Value
March 1, 2005
| | Ending
Account Value
August 31, 2005
| | Expenses Paid
During Period*
|
Class A | | $ | 1,000 | | $ | 1,019 | | $ | 5.99 |
Class B | | $ | 1,000 | | $ | 1,015 | | $ | 9.79 |
Class C | | $ | 1,000 | | $ | 1,015 | | $ | 9.79 |
| | * | Expenses are calculated using the Fund’s annualized expense ratios for Class A (1.18%), Class B (1.93%) and Class C (1.93%) shares, multiplied by the average account value for the period, then multiplying the result by the actual number of days in the period (184); and then dividing that result by the actual number of days in the fiscal year (365). |
The accompanying notes are an integral part of the financial statements.
8
Heritage Capital Appreciation Trust
Statement of Assets and Liabilities
August 31, 2005
| | | | | | | |
Assets | | | | | | | |
Investments, at value (identified cost $415,040,014) | | | | | $ | 522,362,601 | |
Repurchase agreement (identified cost $24,981,000) | | | | | | 24,981,000 | |
Cash | | | | | | 437 | |
Receivables: | | | | | | | |
Fund shares sold | | | | | | 2,552,911 | |
Dividends and interest | | | | | | 385,635 | |
Deferred state qualification expenses | | | | | | 20,034 | |
Prepaid insurance | | | | | | 10,227 | |
| | | | | |
|
|
|
Total assets | | | | | $ | 550,312,845 | |
| | | | | |
|
|
|
Liabilities | | | | | | | |
Payables: | | | | | | | |
Fund shares redeemed | | $ | 4,562,458 | | | | |
Accrued management fee | | | 346,252 | | | | |
Accrued distribution fee | | | 213,496 | | | | |
Accrued shareholder servicing fee | | | 86,746 | | | | |
Accrued fund accounting fee | | | 9,814 | | | | |
Other accrued expenses | | | 85,171 | | | | |
| | |
|
| | | | |
Total liabilities | | | | | | 5,303,937 | |
| | | | | |
|
|
|
Net assets | | | | | $ | 545,008,908 | |
| | | | | |
|
|
|
Net Assets | | | | | | | |
Net assets consist of: | | | | | | | |
Paid-in capital | | | | | $ | 455,065,283 | |
Accumulated net realized loss | | | | | | (17,378,962 | ) |
Net unrealized appreciation on investments | | | | | | 107,322,587 | |
| | | | | |
|
|
|
Net assets | | | | | $ | 545,008,908 | |
| | | | | |
|
|
|
Class A shares | | | | | | | |
Net asset value and redemption price per share ($391,303,903 divided by 14,887,596 shares of beneficial interest outstanding, no par value) | | | | | $ | 26.28 | |
| | | | | |
|
|
|
Maximum offering price per share (100/95.25 of $26.28 ) | | | | | $ | 27.59 | |
| | | | | |
|
|
|
Class B shares | | | | | | | |
Net asset value, offering price and redemption price per share ($33,884,362 divided by 1,394,606 shares of beneficial interest outstanding, no par value) | | | | | $ | 24.30 | |
| | | | | |
|
|
|
Class C shares | | | | | | | |
Net asset value, offering price and redemption price per share ($119,820,643 divided by 4,933,756 shares of beneficial interest outstanding, no par value) | | | | | $ | 24.29 | |
| | | | | |
|
|
|
The accompanying notes are an integral part of the financial statements.
9
Heritage Capital Appreciation Trust
Statement of Operations
For the Fiscal Year Ended August 31, 2005
| | | | | | | |
Investment Income | | | | | | | |
Income: | | | | | | | |
Dividends | | | | | $ | 5,761,872 | |
Interest | | | | | | 289,167 | |
| | | | | |
|
|
|
Total income | | | | | | 6,051,039 | |
Expenses: | | | | | | | |
Management fee | | $ | 3,813,380 | | | | |
Distribution fee (Class A) | | | 887,131 | | | | |
Distribution fee (Class B) | | | 357,956 | | | | |
Distribution fee (Class C) | | | 1,178,027 | | | | |
Shareholder servicing fees | | | 484,299 | | | | |
Professional fees | | | 118,837 | | | | |
State qualification expenses | | | 74,255 | | | | |
Fund accounting fee | | | 70,983 | | | | |
Reports to shareholders | | | 56,262 | | | | |
Custodian fee | | | 37,141 | | | | |
Trustees’ fees and expenses | | | 21,860 | | | | |
Insurance | | | 14,144 | | | | |
Federal registration expense | | | 941 | | | | |
Other | | | 15,343 | | | | |
| | |
|
| | | | |
Total expenses | | | | | | 7,130,559 | |
| | | | | |
|
|
|
Net investment loss | | | | | | (1,079,520 | ) |
| | | | | |
|
|
|
| | |
Realized and Unrealized Gain on Investments | | | | | | | |
Net realized gain from investment transactions | | | | | | 14,387,412 | |
Net unrealized appreciation of investments during the fiscal year | | | | | | 56,316,041 | |
| | | | | |
|
|
|
Net gain on investments | | | | | | 70,703,453 | |
| | | | | |
|
|
|
Net increase in net assets resulting from operations | | | | | $ | 69,623,933 | |
| | | | | |
|
|
|
Statement of Changes in Net Assets
| | | | | | | | |
| | | For the Fiscal Years Ended
| |
| | | August 31, 2005
| | | August 31, 2004
| |
Increase in net assets: | | | | | | | | |
Operations: | | | | | | | | |
Net investment loss | | $ | (1,079,520 | ) | | $ | (2,852,107 | ) |
Net realized gain from investment transactions | | | 14,387,412 | | | | 13,889,558 | |
Net unrealized appreciation of investments during the fiscal year | | | 56,316,041 | | | | 5,807,690 | |
| | |
|
|
| |
|
|
|
Net increase in net assets resulting from operations | | | 69,623,933 | | | | 16,845,141 | |
Increase in net assets from Fund share transactions | | | 8,004,862 | | | | 69,648,471 | |
| | |
|
|
| |
|
|
|
Increase in net assets | | | 77,628,795 | | | | 86,493,612 | |
Net assets, beginning of fiscal year | | | 467,380,113 | | | | 380,886,501 | |
| | |
|
|
| |
|
|
|
Net assets, end of fiscal year | | $ | 545,008,908 | | | $ | 467,380,113 | |
| | |
|
|
| |
|
|
|
The accompanying notes are an integral part of the financial statements.
10
Heritage Capital Appreciation Trust
Financial Highlights
The following table includes selected data for a share outstanding throughout each period and other performance information derived from the financial statements.
| | | | | | | | | | | | | | | | | | | | | | | | | | | | | | | | | | | | | | | | | | | | | | | | | | | | | | | | | | | |
| | | Class A Shares
| | | Class B Shares
| | | Class C Shares
| |
| | | For the Years Ended August 31
| | | For the Fiscal Years Ended August 31
| | | For the Fiscal Years Ended August 31
| |
| | | 2005*
| | 2004
| | | 2003
| | | 2002
| | | 2001
| | | 2005*
| | | 2004
| | | 2003
| | | 2002
| | | 2001
| | | 2005*
| | | 2004
| | | 2003
| | | 2002
| | | 2001
| |
Net asset value, beginning of fiscal year | | $ | 22.85 | | $ | 21.82 | | | $ | 18.26 | | | $ | 23.61 | | | $ | 32.41 | | | $ | 21.28 | | | $ | 20.47 | | | $ | 17.25 | | | $ | 22.47 | | | $ | 31.20 | | | $ | 21.27 | | | $ | 20.46 | | | $ | 17.25 | | | $ | 22.46 | | | $ | 31.19 | |
| | |
|
| |
|
|
| |
|
|
| |
|
|
| |
|
|
| |
|
|
| |
|
|
| |
|
|
| |
|
|
| |
|
|
| |
|
|
| |
|
|
| |
|
|
| |
|
|
| |
|
|
|
Income from Investment Operations: | | | | | | | | | | | | | | | | | | | | | | | | | | | | | | | | | | | | | | | | | | | | | | | | | | | | | | | | | | | |
Net investment loss | | | — | | | (0.08 | ) | | | (0.12 | ) | | | (0.17 | ) | | | (0.16 | ) | | | (0.17 | ) | | | (0.26 | ) | | | (0.24 | ) | | | (0.31 | ) | | | (0.29 | ) | | | (0.17 | ) | | | (0.24 | ) | | | (0.21 | ) | | | (0.30 | ) | | | (0.29 | ) |
Net realized and unrealized gain (loss) on investments | | | 3.43 | | | 1.11 | | | | 3.68 | | | | (5.18 | ) | | | (5.44 | ) | | | 3.19 | | | | 1.07 | | | | 3.46 | | | | (4.91 | ) | | | (5.24 | ) | | | 3.19 | | | | 1.05 | | | | 3.42 | | | | (4.91 | ) | | | (5.24 | ) |
| | |
|
| |
|
|
| |
|
|
| |
|
|
| |
|
|
| |
|
|
| |
|
|
| |
|
|
| |
|
|
| |
|
|
| |
|
|
| |
|
|
| |
|
|
| |
|
|
| |
|
|
|
Total from Investment Operations | | | 3.43 | | | 1.03 | | | | 3.56 | | | | (5.35 | ) | | | (5.60 | ) | | | 3.02 | | | | 0.81 | | | | 3.22 | | | | (5.22 | ) | | | (5.53 | ) | | | 3.02 | | | | 0.81 | | | | 3.21 | | | | (5.21 | ) | | | (5.53 | ) |
| | |
|
| |
|
|
| |
|
|
| |
|
|
| |
|
|
| |
|
|
| |
|
|
| |
|
|
| |
|
|
| |
|
|
| |
|
|
| |
|
|
| |
|
|
| |
|
|
| |
|
|
|
Less Distributions: | | | | | | | | | | | | | | | | | | | | | | | | | | | | | | | | | | | | | | | | | | | | | | | | | | | | | | | | | | | |
Distributions from net realized gains | | | — | | | — | | | | — | | | | — | | | | (3.20 | ) | | | — | | | | — | | | | — | | | | — | | | | (3.20 | ) | | | — | | | | — | | | | — | | | | — | | | | (3.20 | ) |
| | |
|
| |
|
|
| |
|
|
| |
|
|
| |
|
|
| |
|
|
| |
|
|
| |
|
|
| |
|
|
| |
|
|
| |
|
|
| |
|
|
| |
|
|
| |
|
|
| |
|
|
|
Net asset value, end of fiscal year | | $ | 26.28 | | $ | 22.85 | | | $ | 21.82 | | | $ | 18.26 | | | $ | 23.61 | | | $ | 24.30 | | | $ | 21.28 | | | $ | 20.47 | | | $ | 17.25 | | | $ | 22.47 | | | $ | 24.29 | | | $ | 21.27 | | | $ | 20.46 | | | $ | 17.25 | | | $ | 22.46 | |
| | |
|
| |
|
|
| |
|
|
| |
|
|
| |
|
|
| |
|
|
| |
|
|
| |
|
|
| |
|
|
| |
|
|
| |
|
|
| |
|
|
| |
|
|
| |
|
|
| |
|
|
|
Total Return (%) (a) | | | 15.01 | | | 4.72 | | | | 19.50 | | | | (22.66 | ) | | | (18.48 | ) | | | 14.19 | | | | 3.96 | | | | 18.67 | | | | (23.23 | ) | | | (19.01 | ) | | | 14.20 | | | | 3.96 | | | | 18.61 | | | | (23.20 | ) | | | (19.02 | ) |
Ratios and Supplemental Data | | | | | | | | | | | | | | | | | | | | | | | | | | | | | | | | | | | | | | | | | | | | | | | | | | | | | | | | | | | |
Expenses to average daily net assets (%) | | | 1.18 | | | 1.19 | | | | 1.26 | | | | 1.23 | | | | 1.22 | | | | 1.93 | | | | 1.94 | | | | 1.97 | | | | 1.93 | | | | 1.91 | | | | 1.93 | | | | 1.94 | | | | 1.97 | | | | 1.93 | | | | 1.91 | |
Net investment income (loss) to average daily net assets (%) | | | 0.01 | | | (0.39 | ) | | | (0.66 | ) | | | (0.80 | ) | | | (0.68 | ) | | | (0.73 | ) | | | (1.15 | ) | | | (1.37 | ) | | | (1.50 | ) | | | (1.36 | ) | | | (0.73 | ) | | | (1.14 | ) | | | (1.37 | ) | | | (1.50 | ) | | | (1.37 | ) |
Portfolio turnover rate (%) | | | 42 | | | 27 | | | | 22 | | | | 31 | | | | 28 | | | | 42 | | | | 27 | | | | 22 | | | | 31 | | | | 28 | | | | 42 | | | | 27 | | | | 22 | | | | 31 | | | | 28 | |
Net assets, end of fiscal year ($ millions) | | | 391 | | | 321 | | | | 248 | | | | 197 | | | | 233 | | | | 34 | | | | 36 | | | | 37 | | | | 32 | | | | 42 | | | | 120 | | | | 111 | | | | 96 | | | | 67 | | | | 78 | |
| * | Per share amounts have been calculated using the monthly average share method. |
| (a) | These returns are calculated without the imposition of either front-end or contingent deferred sales charges. |
The accompanying notes are an integral part of the financial statements.
11
Heritage Capital Appreciation Trust
Notes to Financial Statements
| Note 1: | Significant Accounting Policies. Heritage Capital Appreciation Trust (the “Fund”) is organized as a Massachusetts business trust and is registered under the Investment Company Act of 1940, as amended, as a diversified, open-end management investment company. The Fund seeks to achieve capital appreciation over the long term by investing principally in common stock. The Fund currently offers Class A and Class C shares to the public. Class A shares are sold subject to a maximum sales charge of 4.75% of the amount invested payable at the time of purchase. Class A share investments greater than $1 million, where a maximum sales charge is waived, may be subject to a maximum contingent deferred sales charge of 1% upon redemptions made in less than 18 months of purchase. Effective February 1, 2004, Class B shares were not available for direct purchase. Class B shares will continue to be available through exchanges and dividend reinvestments as described in the Fund’s prospectus. Class B shares are still subject to a 5% maximum contingent deferred sales charge (based on the lower of purchase price or redemption price), declining over a six-year period. Class C shares are sold subject to a contingent deferred sales charge of 1% of the lower of net asset value or purchase price payable upon any redemptions made in less than one year of purchase. The preparation of financial statements in accordance with accounting principles generally accepted in the United States of America requires management to make estimates and assumptions that affect the reported amounts and disclosures. Actual results could differ from those estimates and those differences could be material. The following is a summary of significant accounting policies: |
Security Valuation: The Fund values investment securities at market value based on the last quoted sales price as reported by the principal securities exchange on which the security is traded. If the security is traded on the Nasdaq Stock Market, the official NASDAQ closing price is used. If no sale is reported, market value is based on the most recent quoted bid price. In the absence of a market quote, when prices are not reflective of market value, or when a significant event has been recognized with respect to a security, securities are valued using such methods as the Board of Trustees believes would reflect fair market value. Short-term investments having a maturity of 60 days or less are valued at amortized cost, which approximates market value.
Repurchase Agreements: The Fund enters into repurchase agreements whereby the Fund, through its custodian, receives delivery of the underlying securities, the market value of which is required to be in an amount of at least 100% of the resale price. Repurchase agreements involve the risk that the seller will fail to repurchase the security, as agreed. In that case, the Fund will bear the risk of market value fluctuations until the security can be sold and may encounter delays and incur costs in liquidating the security. In the event of bankruptcy or insolvency of the seller, delays and costs may be incurred.
Federal Income Taxes: The Fund is treated as a single corporate taxpayer as provided for in the Tax Reform Act of 1986, as amended. The Fund’s policy is to comply with the requirements of the Internal Revenue Code of 1986, as amended, which are applicable to regulated investment companies and to distribute substantially all of its taxable income to its shareholders. Accordingly, no provision has been made for federal income and excise taxes.
Distribution of Income and Gains: Distributions of net investment income are made annually. Net realized gains from investment transactions during any particular year in excess of available capital loss carryforwards, which, if not distributed, would be taxable to the Fund, will be distributed to shareholders in the following fiscal year. The Fund uses the identified cost method for determining realized gain or loss on investments for both financial and federal income tax reporting purposes.
12
Heritage Capital Appreciation Trust
Notes to Financial Statements
(continued)
Expenses: The Fund is charged for those expenses that are directly attributable to it, while other expenses are allocated proportionately among the Heritage mutual funds based upon methods approved by the Board of Trustees. Expenses that are directly attributable to a specific class of shares, such as distribution fees, are charged directly to that class. Other expenses of the Fund are allocated to each class of shares based upon their relative percentage of net assets.
Other: Investment security transactions are accounted for on a trade date basis. Dividend income and distributions to shareholders are recorded on the ex-dividend date. Interest income is recorded on the accrual basis.
In the normal course of business the Fund enters into contracts that contain a variety of representations and warranties, which provide general indemnifications. The Fund’s maximum exposure under these arrangements is unknown, as this would involve future claims that may be made against the Fund and/or its affiliates that have not yet occurred. However, based on experience, the Fund expects the risk of loss to be remote.
| Note 2: | Fund Shares. At August 31, 2005, there were an unlimited number of shares of beneficial interest of no par value authorized. |
Transactions in Class A, B and C shares of the Fund during the fiscal year ended August 31, 2005, were as follows:
| | | | | | | | | | | | | | | | | | | | | |
| | | Class A Shares
| | | Class B Shares
| | | Class C Shares
| |
| | | Shares
| | | Amount
| | | Shares
| | | Amount
| | | Shares
| | | Amount
| |
Shares sold | | 5,385,111 | | | $ | 134,143,321 | | | 72,931 | | | $ | 1,676,932 | | | 1,001,103 | | | $ | 22,958,467 | |
Shares redeemed | | (4,526,811 | ) | | | (112,988,671 | ) | | (356,598 | ) | | | (8,190,679 | ) | | (1,290,641 | ) | | | (29,594,508 | ) |
| | |
|
| |
|
|
| |
|
| |
|
|
| |
|
| |
|
|
|
Net increase (decrease) | | 858,300 | | | $ | 21,154,650 | | | (283,667 | ) | | $ | (6,513,747 | ) | | (289,538 | ) | | $ | (6,636,041 | ) |
| | | | | |
|
|
| | | | |
|
|
| | | | |
|
|
|
Shares outstanding: | | | | | | | | | | | | | | | | | | | | | |
Beginning of fiscal year | | 14,029,296 | | | | | | | 1,678,273 | | | | | | | 5,223,294 | | | | | |
| | |
|
| | | | | |
|
| | | | | |
|
| | | | |
End of fiscal year | | 14,887,596 | | | | | | | 1,394,606 | | | | | | | 4,933,756 | | | | | |
| | |
|
| | | | | |
|
| | | | | |
|
| | | | |
Transactions in Class A, B and C shares of the Fund during the fiscal year ended August 31, 2004, were as follows:
| | | | | | | | | | | | | | | | | | | | | |
| | | Class A Shares
| | | Class B Shares
| | | Class C Shares
| |
| | | Shares
| | | Amount
| | | Shares
| | | Amount
| | | Shares
| | | Amount
| |
Shares sold | | 5,284,879 | | | $ | 120,996,652 | | | 175,571 | | | $ | 3,678,508 | | | 1,550,693 | | | $ | 32,903,919 | |
Shares redeemed | | (2,634,124 | ) | | | (60,066,397 | ) | | (289,273 | ) | | | (6,167,323 | ) | | (1,015,394 | ) | | | (21,696,888 | ) |
| | |
|
| |
|
|
| |
|
| |
|
|
| |
|
| |
|
|
|
Net increase (decrease) | | 2,650,755 | | | $ | 60,930,255 | | | (113,702 | ) | | $ | (2,488,815 | ) | | 535,299 | | | $ | 11,207,031 | |
| | | | | |
|
|
| | | | |
|
|
| | | | |
|
|
|
Shares outstanding: | | | | | | | | | | | | | | | | | | | | | |
Beginning of fiscal year | | 11,378,541 | | | | | | | 1,791,975 | | | | | | | 4,687,995 | | | | | |
| | |
|
| | | | | |
|
| | | | | |
|
| | | | |
End of fiscal year | | 14,029,296 | | | | | | | 1,678,273 | | | | | | | 5,223,294 | | | | | |
| | |
|
| | | | | |
|
| | | | | |
|
| | | | |
A redemption fee of 2% of the value of shares sold is imposed on fund shares sold (by redemption or exchange to another Heritage mutual fund) within seven (7) calendar days of their acquisition by purchase or exchange. For the fiscal year ended August 31, 2005, the Fund received $12,122 in redemption fees to offset the costs and market impact associated with short-term money movements.
13
Heritage Capital Appreciation Trust
Notes to Financial Statements
(continued)
| Note 3: | Purchases and Sales of Securities. For the fiscal year ended August 31, 2005, purchases and sales of investment securities (excluding repurchase agreements and short-term obligations) aggregated $205,907,937 and $216,059,335, respectively. |
| Note 4: | Management, Subadvisory, Distribution, Shareholder Servicing Agent, Fund Accounting and Trustees Fees. Under the Fund’s Investment Advisory and Administration Agreement with Heritage Asset Management, Inc. (the “Manager” or “Heritage”), the Fund agrees to pay to the Manager a fee equal to an annualized rate of 0.75% of the Fund’s average daily net assets, computed daily and payable monthly. The Manager has contractually agreed to waive its fees and, if necessary, reimburse the Fund to the extent that Class A annual operating expenses exceeded 1.60% of the Class A average daily net assets and to the extent that the Class B and Class C annual operating expenses each exceeded 2.10% of those classes’ average daily net assets for the fiscal year ended August 31, 2005. No fees were waived and no expenses were reimbursed for the fiscal year ended August 31, 2005. |
The Manager entered into a subadvisory agreement with Goldman Sachs Asset Management LP (the “Subadviser”) to provide to the Fund investment advice, portfolio management services (including the placement of brokerage orders) and certain compliance and other services for an annualized fee payable by the Manager. Eagle Asset Management, Inc. (“Eagle”), a wholly owned subsidiary of Raymond James Financial, Inc. (“RJF”), serves as an additional subadviser to the Fund. However, the Manager currently has not allocated any assets of the Fund to Eagle.
Pursuant to the Fund’s prospectus, effective January 3, 2005, the Fund is authorized to pay the Distributor a fee of 0.25% of the average daily net assets. The Class B and Class C Distribution Plans provide for payments at an annual rate of up to 1.00% of the average daily net assets. Such fees are accrued daily and payable monthly. Class B shares will convert to Class A shares eight years after the end of the calendar month in which the shareholder’s order to purchase was accepted. The Manager, Distributor, Fund Accountant and Shareholder Servicing Agent are all wholly owned subsidiaries of RJF.
Raymond James & Associates, Inc. (the “Distributor” or “RJA”) has advised the Fund that it generated $215,677 in front-end sales charges and $92,598 in contingent deferred sales charges for Class A shares, $98,029 in contingent deferred sales charges for Class B shares and $16,732 in contingent deferred sales charges for Class C shares for the fiscal year ended August 31, 2005. From these fees, the Distributor paid commissions to salespersons and incurred other distribution costs. Agency brokerage commissions for security transactions during the same period aggregated $432,486 of which $1,400 was paid to the Distributor.
The Manager also is the Shareholder Servicing Agent and Fund Accountant for the Fund.
Trustees of the Fund also serve as Trustees for Heritage Cash Trust, Heritage Growth and Income Trust, Heritage Income Trust and Heritage Series Trust, investment companies that are also advised by the Manager (collectively referred to as the “Heritage Mutual Funds”). Each Trustee of the Heritage Mutual Funds who is not an employee of the Manager or an employee of an affiliate of the Manager receives an annual fee of $23,000 and an additional fee of $3,000 for each combined quarterly meeting of the Heritage Mutual Funds attended. In addition, each independent Trustee that serves on the Audit Committee or Compliance Committee will receive $500 for attendance at their respective meeting (in person or telephonic). The Lead Independent Trustee, the Audit Committee Chair, and the Compliance Committee Chair each will receive an annual retainer of $2,500, in addition to meeting fees. Trustees’ fees and expenses are paid equally by each portfolio in the Heritage Mutual Funds.
14
Heritage Capital Appreciation Trust
Notes to Financial Statements
(continued)
| Note 5: | Federal Income Taxes. For the fiscal year ended August 31, 2005, to reflect reclassifications arising from permanent book/tax differences attributable to a net operating loss, the Fund increased (credited) accumulated net investment loss and decreased (debited) paid in capital $1,079,520. As of August 31, 2005, the Fund had net tax basis capital loss carryforwards in the aggregate of $14,754,677 which may be applied to any net taxable capital gain until their expiration date of 2011. Capital loss carryforwards of $13,910,622 were utilized in the fiscal year ended August 31, 2005. |
| | As of August 31, 2005, the components of distributable earnings on a tax basis were as follows: |
| | | | | | |
Undistributed Ordinary Income | | $ | 0 | |
Accumulated Capital Losses | | $ | (14,754,677 | ) |
Tax Basis Net Unrealized Appreciation | | $ | 104,698,302 | |
| | The difference between book-basis and tax-basis unrealized appreciation/depreciation is attributable primarily to the tax deferral of losses on wash sales. |
15
Report of Independent Registered Certified Public Accounting Firm
To the Board of Trustees and
Shareholders of Heritage Capital Appreciation Trust
In our opinion, the accompanying statement of assets and liabilities, including the investment portfolio, and the related statements of operations and of changes in net assets and the financial highlights present fairly, in all material respects, the financial position of Heritage Capital Appreciation Trust (the “Fund”) at August 31, 2005, the results of its operations for the year then ended, the changes in its net assets for each of the two years in the period then ended and the financial highlights for each of the five years in the period then ended, in conformity with accounting principles generally accepted in the United States of America. These financial statements and financial highlights (hereafter referred to as “financial statements”) are the responsibility of the Fund’s management; our responsibility is to express an opinion on these financial statements based on our audits. We conducted our audits of these financial statements in accordance with the standards of the Public Company Accounting Oversight Board (United States). Those standards require that we plan and perform the audit to obtain reasonable assurance about whether the financial statements are free of material misstatement. An audit includes examining, on a test basis, evidence supporting the amounts and disclosures in the financial statements, assessing the accounting principles used and significant estimates made by management, and evaluating the overall financial statement presentation. We believe that our audits, which included confirmation of securities at August 31, 2005 by correspondence with the custodian, provide a reasonable basis for our opinion.

PricewaterhouseCoopers LLP
Tampa, Florida
October 17, 2005
16
Heritage Capital Appreciation Trust
Trustees and Officers
| | | | | | | | | | |
Name, Address and Age | | Position(s) Held with Fund | | Term of Office* and Length of Time Served | | Principal Occupation(s) During Past 5 years | | Number of Portfolios in Heritage Mutual Funds Complex Overseen by Trustee | | Other Directorships Held by Trustee |
| | | | | |
Affiliated Trustees **
| | | | | | | | | | |
| | | | | |
Thomas A. James 880 Carillon Parkway St. Petersburg, FL 33716 (63) | | Trustee
and
Chairman | | Since
inception
in 1985 | | Chairman of the Board since 1986; Chief Executive Officer of RJF since 1969; Chairman of the Board of RJA since 1986; Chairman of the Board of Eagle since 1984. | | 13 | | Outback
Steakhouse,
Inc. |
| | | | | |
Richard K. Riess 880 Carillon Parkway St. Petersburg, FL 33716 (56) | | President
and
Trustee | | Since
2000
Since
inception
in 1985 | | Executive Vice President and Managing Director for Asset Management of RJF since 1998; CEO of Eagle since 1996; CEO of Heritage since 2000. | | 13 | | N/A |
| | | | | |
Independent Trustees
| | | | | | | | | | |
| | | | | |
C. Andrew Graham 880 Carillon Parkway St. Petersburg, FL 33716 (65) | | Trustee | | Since
inception
in 1985 | | First Financial Advisors, LLC & Graham Financial Partners LLC (financial planning insurance and investment services) since 1999; Representative of NFP Securities, Inc. (broker-dealer) since 2002; Representative of Multi-Financial Securities Corp. (broker-dealer), 1996-2001. | | 13 | | N/A |
| | | | | |
Keith B. Jarrett 880 Carillon Parkway St. Petersburg, FL 33716 (57) | | Trustee | | Since
2005 | | President, KBJ, LLC (investment company) since 2001; Principal, Rockport Funding, LLC (specialty finance), and Ajax Partners (investment partnership) since 2003; Corporate Strategic Adviser, Vestmark, Inc. (software company) since 2003, Radianz America, Inc. (financial services information technology) since 2004, and Source Media, Inc. (specialty financial publishing) 1997- 2001; President and CEO, TF Ventures (information technology), 1998-2001. | | 13 | | Penn
Virginia
Resources |
17
Heritage Capital Appreciation Trust
Trustees and Officers
| | | | | | | | | | |
Name, Address and Age | | Position(s) Held with Fund | | Term of Office* and Length of Time Served | | Principal Occupation(s) During Past 5 years | | Number of Portfolios in Heritage Mutual Funds Complex Overseen by Trustee | | Other Directorships Held by Trustee |
| | | | | |
Independent Trustees (continued)
| | | | | | | | | | |
| | | | | |
William J. Meurer 880 Carillon Parkway St. Petersburg, FL 33716 (61) | | Trustee | | Since 2003 | | Private Financial Consultant since September 2000; Board of Directors, Tribridge Consulting, Inc. (business consulting services) since 2000 and Cerebit Security Application, Inc. since 2005; Board of Trustees, Baycare HealthCare and St. Joseph’s-Baptist Health Care since 2000 and BayCare Health Systems since 2004; Advisory Board, Bisk Publishing, Inc. (distance learning provider) since 2000 and Approva Corporation (risk management software) since 2005. | | 13 | | Sykes
Enterprises,
Incorporated
(inbound
call
systems). |
| | | | | |
James L. Pappas 880 Carillon Parkway St. Petersburg, FL 33716 (62) | | Trustee | | Since 1989 | | Lykes Professor of Banking and Finance, University of South Florida since 1986; President, Graduate School of Banking since 1995; Immediate Past Chairman of the Board, Tampa Museum of Art. | | 13 | | N/A |
| | | | | |
David M. Phillips 880 Carillon Parkway St. Petersburg, FL 33716 (66) | | Trustee | | Since inception in 1985 | | Chief Executive Officer, Evare LLC (information services) since 2003; Chairman Emeritus, CCC Information Services, Inc. 2000-2005; Executive in Residence, University of North
Carolina – Wilmington,
1999-2003. | | 13 | | N/A |
| | | | | |
Eric Stattin 880 Carillon Parkway St. Petersburg, FL 33716 (71) | | Trustee | | Since 1987 | | Private Investor since 1988. | | 13 | | N/A |
| | | | | |
Deborah L. Talbot 880 Carillon Parkway St. Petersburg, FL 33716 (54) | | Trustee | | Since 2002 | | Consultant/Advisor; Member, Academy of Senior Professionals, Eckerd College since 1998; Dean’s Advisory Board, College of Arts and Sciences, University of Memphis since 2002; Founder and Chairman of the Board, Creative Tampa Bay
since 2003. | | 13 | | N/A |
18
Heritage Capital Appreciation Trust
Trustees and Officers
| | | | | | | | | | |
Name, Address
and Age | | Position(s)
Held with Fund | | Term of Office*
and Length of
Time Served | | Principal Occupation(s)
During Past 5 years | | Number of
Portfolios in
Heritage
Mutual
Funds
Complex
Overseen
by Trustee | | Other
Directorships
Held by Trustee |
| | | | | |
Officers
| | | | | | | | | | |
| | | | | |
K.C. Clark 880 Carillon Parkway St. Petersburg, FL 33716 (46) | | Executive Vice
President and
Principal
Executive Officer,
Chief Compliance
Officer | | Since 2000 Since 2004 | | Executive Vice President and Chief Operating Officer of Heritage since 2000; Trustee and Chairman, University of West Florida since 2001 and 2005, respectively. | | N/A | | N/A |
| | | | | |
Andrea N. Mullins 880 Carillon Parkway St. Petersburg, FL 33716 (38) | | Treasurer and
Secretary,
Principal
Financial
Officer | | Since 2003 Since 2004 | | Treasurer and Vice
President – Finance of Heritage since 2003; Vice President – Fund Accounting of Heritage, 1996-2003. | | N/A | | N/A |
| | | | | |
Deborah A. Malina 880 Carillon Parkway
St. Petersburg, FL 33716
(39) | | Assistant Secretary | | Since 2000 | | Compliance Administrator of Heritage since 2000. | | N/A | | N/A |
The Trust’s Statement of Additional Information includes additional information about the Trustees and Officers and is available, without charge, upon request, by calling (800) 421-4184.
| * | Trustees serve for the lifetime of the Trust or until they are removed, resign or retire. The Board has adopted a retirement policy that requires Trustees to retire at the age of 72 for those Trustees in office prior to August 2000, and at the age 70 for those Trustees who are elected to office after August 2000. Officers are elected annually for one year terms. |
| ** | Messrs. James and Riess are “interested” persons of the Trust as that term is defined by the Investment Company Act of 1940. Mr. James is affiliated with RJA and RJF. Mr. Riess is affiliated with Heritage and RJF. |
19
Heritage Capital Appreciation Trust
Renewal of Investment Advisory and Subadvisory Agreements
(unaudited)
Overview. At a meeting held August 16, 2005, the Board of Trustees, including the independent Trustees (together, the “Board”), approved the renewal of the Fund’s investment advisory agreement with Heritage Asset Management, Inc. (“Heritage”) and the subadvisory agreement for the Fund with Goldman Sachs Asset Management, L.P. (“subadviser”) (together, the “Advisory Agreements”).
In reaching this decision, the Board took into consideration information furnished for the Board’s review and consideration throughout the year at regular Board meetings, as well as information specifically prepared in connection with the annual renewal process. The Board, acting directly or through its committees, has been provided with information and reports relevant to the annual renewal of the Fund’s Advisory Agreements, including: reports regarding the services and support provided to the Fund and its shareholders by Heritage and the subadviser; reports on the Fund’s performance and commentary on the reasons for the performance; presentations by Fund portfolio managers addressing, as applicable, Heritage’s and the subadviser’s investment philosophy, investment strategy, personnel and operation; compliance and audit reports concerning the Heritage Funds, Heritage and the subadviser, including responses to any issues raised therein; and information on relevant developments in the mutual fund industry and how the Heritage Funds and/or Heritage are responding to them. As part of the renewal process, the Board, with the assistance of independent legal counsel, requested and received additional reports containing information about the Fund, Heritage and the subadviser. The Board posed questions to various management personnel of Heritage regarding certain key aspects of the material submitted in support of the renewal.
With respect to the renewal of the Advisory Agreements, the Board considered all factors it believed relevant, including: (1) the nature, extent and quality of services provided to the Fund; (2) the investment performance of the Fund; (3) the costs of the services provided to the Fund and the profits realized or to be realized by Heritage, the subadviser and their respective affiliates from their relationship with the Fund; (4) the extent to which economies of scale have been realized as the Fund grows; (5) whether the level of fees reflects those economies of scale for the benefit of Fund investors; (6) comparisons of services and fees with contracts entered into by Heritage and the subadviser with other clients (such as pension funds and other institutional investors); and (7) any other benefits derived or anticipated to be derived by Heritage or the subadviser from its relationship with the Fund.
Provided below is an overview of the factors the Board considered at the August meeting. The Board did not identify any particular information that was most relevant to its consideration to renew the Advisory Agreements, and each Trustee may have afforded different weight to the various factors.
Nature, Extent and Quality of Services. The Board considered that Heritage and the subadviser are experienced in serving as an investment adviser for the Fund. Heritage oversees and monitors the performance and services provided by the Fund’s subadviser and is responsible for the selection of the Fund’s subadviser. Heritage provides investment management, administration, transfer agent and fund accounting services to the Fund. In addition, Heritage is responsible for the oversight of compliance with Fund policies and objectives, review of brokerage matters, oversight of Fund compliance with applicable law, and implementation of Board directives as they relate to the Fund. Heritage provides advisory services to one other non-investment company client. Finally, the Board noted that shareholders in the Fund have a broad range of investment choices available to them, including a wide choice among mutual funds offered by competitors to Heritage, and that the Fund’s shareholders, with the opportunity to review and weigh the disclosure provided by the Fund in its prospectus and other public disclosures, have chosen to invest in the Fund, managed by Heritage.
With respect to the subadviser, the subadviser is responsible for making investment decisions on behalf of the Fund and placing all orders for the purchase and sale of investments for the Fund with brokers or dealers. The
20
Heritage Capital Appreciation Trust
Renewal of Investment Advisory and Subadvisory Agreements
(unaudited)
(continued)
Board considered the average industry experience of the subadviser’s investment advisory team. In addition, the Board considered Heritage’s recommendation to continue to retain the subadviser.
The Board also considered information provided regarding: (1) the Heritage and subadviser personnel who provide services to the Fund; (2) the adequacy of Heritage’s and the subadviser’s compliance program and a certification to this effect; and (3) the financial information regarding Heritage and the subadviser.
Investment Performance. The Board considered the short-, intermediate- and long-term performance of the Fund relative to its primary benchmark and peer group. In this connection, the Board noted the following: (1) the Fund’s overall performance record was significantly better than its peer group; (2) the Fund’s 4-star Morningstar rating; (3) the Fund’s performance was significantly better than the performance of other accounts with similar objectives managed by the subadviser.
Costs, Profitability and Economies of Scale. The Board considered the fees payable under the Advisory Agreements. In this connection, the Board evaluated Heritage’s costs and profitability in providing services to the Fund. The Board noted that Heritage’s profit on the services it provided to the Fund are reasonable in light of the fact that Heritage provides services at a low cost to investors, manages the Fund’s assets, and provides a comprehensive compliance program for the Fund.
The Board also considered the Fund’s advisory and subadvisory fees in light of fees paid by comparable mutual funds. In this connection, the Board considered the management fee and the expense ratio for the Fund compared to the average management fee and expense ratio of its peer group, as discussed further below with respect to the Fund. The Board noted that the Fund’s expense ratio is substantially less than the average for similar mutual funds. With respect to the subadvisory agreement, the Board considered the subadviser’s representation that the fees it charges in connection with the Fund are lower than those charged to other institutional client’s with similar investment objectives and asset levels.
The Board considered that the Fund’s management fee structure provides for breakpoints, which is a reduction of the applicable advisory fee rate as assets increase. The Board noted that Heritage added a “breakpoint” to its advisory fees last year in order to pass on any economies of scale it realizes to shareholders.
The Board further considered that Heritage had committed to continue the contractual expense cap arrangement through the Fund’s 2006 fiscal year, which is subject to renewal by the Board and Heritage on an annual basis.
The Board also considered that the Fund’s expense ratio has dropped over the last several years due to increased economies of scale, and shareholders may realize such economies of scale, through: (1) reduced advisory and administration fees achieved when the Fund’s asset size reaches breakpoints in the fee schedules instituted by Heritage; (2) increased services to the Fund; (3) the waivers and/or reimbursements Heritage provides as a result of the contractual expense limitations on the Fund’s total operating expenses; or (4) fee or expense reductions that may result from the operation of the transfer agent agreement.
Benefits. In evaluating Heritage’s compensation, the Board considered other benefits that may be realized by Heritage and its affiliates from their relationship with the Fund. In this connection, the Board noted, among other things, that Heritage also serves as the transfer agent and fund accountant for the Fund, receiving compensation for acting in these capacities, and is responsible for, among other things, coordinating the Fund’s audits, financial statements and tax returns and managing expenses and budgeting for the Fund.
The Board also recognized that another affiliate of Heritage, Raymond James & Associates, Inc. (“RJA”), serves as the principal underwriter and distributor for the Fund, and as such, receives Rule 12b-1 payments from the
21
Heritage Capital Appreciation Trust
Renewal of Investment Advisory and Subadvisory Agreements
(unaudited)
(continued)
Fund to compensate them for providing service and distribution activities. The Board considered that these payments could lead to growth in the Fund’s assets and the corresponding benefits of that growth, including economies of scale and greater diversification. In addition, another affiliate of Heritage, Raymond James Financial Services, Inc. has entered into an agreement with RJA to sell fund shares and receives compensation from RJA.
Conclusions. Based on these considerations, the Board concluded with respect to the Fund that: (1) the Fund was reasonably likely to benefit from the nature, quality and extent of Heritage’s and the subadviser’s services; (2) the Fund’s performance was satisfactory in light of all the factors considered by the Board; (3) Heritage’s profits and fee rate payable under the Advisory Agreement were reasonable in the context of all the factors considered by the Board; (4) the subadviser’s fee rate was reasonable in the context of all the factors considered by the Board; and (5) the advisory fee structure provides Fund shareholders with reasonable benefits associated with economies of scale. Based on these conclusions and other factors, the Board determined in its business judgment to renew the Advisory Agreements.
22

As of the end of the period August 31, 2005, Heritage Capital Appreciation Trust has adopted a code of ethics, as defined in Item 2 of Form N-CSR, that applies to the Principal Executive Officer and Principal Financial Officer. Heritage Capital Appreciation Trust has not made any amendments to its code of ethics during the covered period. Heritage Capital Appreciation Trust has not granted any waivers from any provisions of the code of ethics during the covered period. A copy of this code of ethics is filed as an exhibit to this Form N-CSR.
| Item 3. | Audit Committee Financial Expert |
The Board of Trustees of Heritage Capital Appreciation Trust has determined that William J. Meurer is an audit committee financial expert, as defined in Item 3 of Form N-CSR, serving on its audit committee. Mr. Meurer is independent for purposes of Item 3 of Form N-CSR.
| Item 4. | Principal Accountant Fees and Services |
(a) Audit Fees
The aggregate fees billed by registrant’s independent public accountants, PricewaterhouseCoopers LLP (“PwC”) for each of the last two fiscal years for professional services rendered in connection with the audit of registrant’s annual financial statements or services that are normally provided by the accountant in connection with statutory and regulatory filings or engagements were $21,000 for the year ended August 31, 2004, and $24,000 for the year ended August 31, 2005.
(b) Audit-Related Fees
The aggregate fees PwC billed to registrant for each of the last two fiscal years for assurance and other services which are reasonably related to the performance of registrant’s audit and are not reported under Item 4(a) were $0 and $0 for the years ended August 31, 2004 and August 31, 2005, respectively. The aggregate fees PwC billed to registrant’s investment adviser and any entity controlling, controlled by, or under common control with registrant’s investment adviser for assurance and other services directly related to the operations and financial reporting of registrant were $34,000 for the year ended August 31, 2004, and $33,000 for the year ended August 31, 2005.
(c) Tax Fees
The aggregate tax fees PwC billed to registrant for each of the last two fiscal years for tax compliance, tax advice, and tax planning services were $3,000 for the year ended August 31, 2004, and $3,000 for the year ended August 31, 2005. The aggregate tax fees PwC billed to registrant’s investment adviser and any entity controlling, controlled by, or under common control with registrant’s investment adviser for services directly related to the operations and financial reporting of registrant were $0 for the year ended August 31, 2004, and $0 for the year ended August 31, 2005.
(d) All Other Fees
For the fiscal years ended August 31, 2004 and 2005, registrant paid PwC no other fees. The aggregate fees PwC billed to registrant’s investment adviser and any entity controlling, controlled by, or under common control with registrant’s investment adviser for any other services directly related to
the operations and financial reporting of registrant were $0 for the year ended August 31, 2004, and $0 for the year ended August 31, 2005.
(e) Registrant’s Audit Committee Charter provides that the audit committee (comprised of the Independent Trustees of registrant) is responsible for pre-approval of all auditing services performed for the registrant. The Audit Committee reports to the Board of Trustees (“Board”) regarding its approval of the engagement of the auditor and the proposed fees for the engagement, and the majority of the Board (including the members of the Board who are Independent Trustees) must approve the auditor at an in-person meeting. The Audit Committee also is responsible for pre-approval (subject to the de minimus exception for non-audit services described in the Securities Exchange Act of 1934, as amended, and applicable rule thereunder and not expecting to exceed $5,000) of all non-auditing services performed for the registrant or for any service affiliate of registrant. Registrant’s Audit Committee Charter also permits a designated member of the audit committee to pre-approve, between meetings, one or more non-audit service projects, subject to ratification by the Audit Committee at the next meeting of the Audit Committee. Registrant’s Audit Committee pre-approved all fees described above which PwC billed to registrant.
(f) Less than 50% of the hours billed by PwC for auditing services to registrant for the fiscal year ended August 31, 2004, were for work performed by persons other than full-time, permanent employees of PwC.
(g) The aggregate non-audit fees billed by PwC to registrant and to registrant’s investment adviser and any entity controlling, controlled by, or under common control with registrant’s investment adviser for the fiscal years ending August 31, 2004, and August 31, 2005, were $0 and $0.
(h) Registrant’s Audit Committee has considered the non-audit services provided to the registrant and registrant’s investment adviser and any entity controlling, controlled by, or under common control with registrant’s investment adviser as described above and determined that these services do not compromise PwC’s independence.
| Item 5. | Audit Committee of Listed Registrants |
Not applicable to the registrant.
| Item 6. | Schedule of Investments |
Included as part of report to shareholders under Item 1.
| Item 7. | Disclosure of Proxy Voting Policies and Procedures for Closed-end Management Investment Companies |
Not applicable to the registrant.
| Item 8. | Portfolio Managers of Closed-End Management Investment Companies |
Not applicable to the registrant.
| Item 9. | Purchases of Equity Securities by Closed-End Management Investment Company and Affiliated Purchasers |
Not applicable to the registrant.
| Item 10. | Submission of Matters to a Vote of Security Holders |
There have been no material changes to the Nominating Committee Charter, which sets forth procedures by which shareholders may recommend nominees to the Trust’s Board of Trustees, since the Trust last provided disclosure in response to this item.
| Item 11. | Controls and Procedures |
| (a) | Based on an evaluation of the disclosure controls and procedures (as defined in Rule 30a-2(c) under the Act), the Principal Executive Officer and Principal Financial Officer of Heritage Capital Appreciation Trust have concluded that such disclosure controls and procedures are effective as of October 28, 2005. |
| (b) | There was no change in the internal controls over financial reporting (as defined in Rule 30a-3(d) of Heritage Capital Appreciation Trust that occurred during the second fiscal quarter that has materially affected or is reasonably likely to materially affect, its internal control over financial reporting. |
(a)(1) Code of Ethics pursuant to Item 2 of Form N-CSR is filed and attached hereto as Exhibit 99.CODEETH.
(a)(2) The certifications required by Rule 30a-2(a) of the Investment Company Act of 1940, as amended, and Section 302 of the Sarbanes-Oxley Act of 2002 is filed and attached hereto as Exhibit 99.CERT.
(a)(3) Not applicable to the registrant.
(b) The certification required by Rule 30a-2(b) of the Investment Company Act of 1940, as amended, and Section 906 of the Sarbanes-Oxley Act of 2002 is filed and attached hereto as Exhibit 99.906CERT.
SIGNATURES
Pursuant to the requirements of the Securities Exchange Act of 1934 and the Investment Company Act of 1940, the registrant has duly caused this report to be signed on its behalf by the undersigned, thereunto duly authorized.
| | | | |
| | | | | HERITAGE CAPITAL APPRECIATION TRUST |
| | |
| Date: October 28, 2005 | | | | |
| | |
| | | | | /s/ K.C. Clark |
| | | | | K.C. Clark Executive Vice President and Principal Executive Officer |
Pursuant to the requirements of the Securities Exchange Act of 1934 and the Investment Company Act of 1940, this report has been signed below by the following persons on behalf of the registrant and in the capacities and on the dates indicated.
Date: October 28, 2005
| | | | |
| | | | | /s/ K.C. Clark |
| | | | | K.C. Clark Executive Vice President and Principal Executive Officer |
Date: October 28, 2005
| | | | |
| | | | | /s/ Andrea N. Mullins |
| | | | | Andrea N. Mullins Principal Financial Officer |