UNITED STATES
SECURITIES AND EXCHANGE COMMISSION
Washington, D.C. 20549
FORM N-CSR
CERTIFIED SHAREHOLDER REPORT OF REGISTERED
MANAGEMENT INVESTMENT COMPANIES
Investment Company Act file number | 811-4367 |
|
Columbia Funds Series Trust I |
(Exact name of registrant as specified in charter) |
|
One Financial Center, Boston, Massachusetts | | 02111 |
(Address of principal executive offices) | | (Zip code) |
|
James R. Bordewick, Jr., Esq. Columbia Management Advisors, LLC One Financial Center Boston, MA 02111 |
(Name and address of agent for service) |
|
Registrant’s telephone number, including area code: | 1-617-426-3750 | |
|
Date of fiscal year end: | May 31, 2008 | |
|
Date of reporting period: | May 31, 2008 | |
| | | | | | | | |
Form N-CSR is to be used by management investment companies to file reports with the Commission not later than 10 days after the transmission to stockholders of any report that is required to be transmitted to stockholders under Rule 30e-1 under the Investment Company Act of 1940 (17 CFR 270.30e-1). The Commission may use the information provided on Form N-CSR in its regulatory, disclosure review, inspection, and policymaking roles.
A registrant is required to disclose the information specified by Form N-CSR, and the Commission will make this information public. A registrant is not required to respond to the collection of information contained in Form N-CSR unless the Form displays a currently valid Office of Management and Budget (“OMB”) control number. Please direct comments concerning the accuracy of the information collection burden estimate and any suggestions for reducing the burden to Secretary, Securities and Exchange Commission, 450 Fifth Street, NW, Washington, DC 20549-0609. The OMB has reviewed this collection of information under the clearance requirements of 44 U.S.C. § 3507.
Item 1. Reports to Stockholders.
Columbia Management®
Annual Report
May 31, 2008
Columbia High Yield Opportunity Fund
| NOT FDIC INSURED | | May Lose Value | |
|
| NOT BANK ISSUED | | No Bank Guarantee | |
|
Table of Contents
| Economic Update | | | 1 | | |
|
| Fund Profile | | | 2 | | |
|
| Performance Information | | | 3 | | |
|
| Understanding Your Expenses | | | 4 | | |
|
| Portfolio Managers' Report | | | 5 | | |
|
| Investment Portfolio | | | 7 | | |
|
Statement of Assets and
Liabilities | | | 19 | | |
|
| Statement of Operations | | | 20 | | |
|
Statement of Changes in
Net Assets | | | 21 | | |
|
| Financial Highlights | | | 23 | | |
|
| Notes to Financial Statements | | | 27 | | |
|
| Report of Independent Registered Public Accounting Firm | | | 36 | | |
|
| Fund Governance | | | 37 | | |
|
Important Information About
This Report | | | 45 | | |
|
The views expressed in this report reflect the current views of the respective parties. These views are not guarantees of future performance and involve certain risks, uncertainties and assumptions that are difficult to predict so actual outcomes and results may differ significantly from the views expressed. These views are subject to change at any time based upon economic, market or other conditions and the respective parties disclaim any responsibility to update such views. These views may not be relied on as investment advice and, because investment decisions for a Columbia Fund are based on numerous factors, may not be relied on as an indication of trading intent on behalf of any particular Columbia Fund. References to specific securities should not be construed as a recommendation or investment advice.
President's Message

Dear Shareholder:
We are pleased to provide this financial report for your Columbia Fund. This document provides information that can help support your investment decision-making. Inside, the portfolio managers discuss the fund's investment strategies, performance, and how that performance compared to the broader market. It's been a challenging year for the financial markets, particularly as concerns over a weaker housing market and economic uncertainty make the news headlines daily. For a sense of how Columbia Management's investment professionals have responded to these issues, I encourage you to read the Economic Update and Portfolio Managers' Report. I believe these discussions reflect Columbia Management's investment management expertise as well as its commitment to market research and consistent investment performance.
We understand that many factors drove your decision to invest in Columbia Funds. Columbia Management's commitment is to honor that decision by providing investment solutions designed to exceed expectations. As we review the past year and look forward to those ahead, we hope you will consider how we might support your investment needs beyond the services we provide currently. Some of the many advantages we bring to the table as the fund's investment manager include:
g Broad and deep investment expertise, including dedicated portfolio management, research and trading
g Strategically positioned investment disciplines and processes
g Comprehensive compliance and risk management
g A team-driven culture that draws upon multiple sources to pursue consistent and superior performance
g A comprehensive array of investment solutions, including equity, fixed-income and cash strategies
Working for you, and with you
Team approach—Rather than rely on the talent or judgment of one individual, Columbia Management takes a team-oriented approach to investing. We draw from the diverse experiences and insights of our people—including portfolio managers, research analysts and traders—to bring multiple investment perspectives and deep expertise to all of our investment management activities.
Client focus—At Columbia Management, our philosophy and culture are anchored in focused solutions and personal service. We are committed to putting our clients' interests first and we understand the premium our clients place on reliability—whether it's related to service, investment performance or risk management. Columbia Management is committed to maintaining high standards of reliability on all counts.
While our asset management capabilities are multifaceted and our investment professionals are multitalented, ultimately, everything we do at Columbia Management has a single purpose: to help investors pursue their most important financial goals. We are honored that you've chosen to invest with us and look forward to providing the investment solutions and services necessary to sustain a lasting relationship.
Sincerely,

Christopher L. Wilson
President, Columbia Funds
Economic Update – Columbia High Yield Opportunity Fund
Although economic growth was strong at the beginning of the 12-month period that began June 1, 2007 and ended May 31, 2008, it slowed to a pace of less than 1.0% in 2008. The most severe housing downturn in decades continued to take a toll on growth. Inventories of homes for sale rose, home prices declined and tighter credit standards, the result of turmoil in the subprime mortgage market, made it more difficult for homebuyers to qualify for loans. Energy prices soared to record highs and food prices rose, raising concerns about inflation. Consumer confidence sank to a 16-year low, as measured by the Conference Board. Weakening business and job conditions further dimmed the outlook for consumers.
Consumer spending growth slowed during the period but remained more resilient than most economists expected even though job growth ground to a halt. Approximately 300,000 job losses were reported in the first five months of 2008, and the unemployment rate spiked to 5.5% in May, one full percentage point higher than it was at the beginning of the period. Manufacturing activity also slowed, but appeared to stabilize in May, one positive indicator that weakness might be contained. Federal tax rebates also began to arrive in May, raising hopes for a boost in consumer spending, which could help avert a recession.
In an effort to inspire confidence in the capital markets, loosen the reins on credit and shore up economic growth, the Federal Reserve Board (the Fed) brought a key short-term rate—the federal funds rate—down from 5.25% to 2.0% during the 12-month period. After seven rate cuts, the Fed acknowledged that downside risks to growth remained but also that uncertainty about the inflation outlook had continued to increase and that it would be necessary to continue to monitor inflation developments carefully.
Bonds delivered solid gains
The U.S. bond market seesawed during the 12-month period but delivered a solid gain as investors sought the relative safety of the highest quality sectors. After a weak start, bond prices generally rose and yields declined as economic growth slowed in 2007 and stock market volatility increased. Although the benchmark 10-year U.S. Treasury yield edged back above 4.0% in 2008, it remained well below where it started the period, at 4.9%. In this environment, the Lehman Brothers U.S. Aggregate Bond Index returned 6.89%. High-yield bonds did not perform well in 2007 but regained some ground in 2008. The Credit Suisse High Yield Index returned negative 1.23%. Municipal bonds generated solid returns during most of the period, but gave back some performance early in 2008 as industry-specific events threatened investor confidence. In February, yields on municipal bonds rose above yields on comparable maturity Treasuries—and prices f ell—in a difficult month for the sector. In this environment, the Lehman Brothers Municipal Bond Index returned 3.87% for the one-year period.1
Stocks retreat as economic storm clouds gather
Against a shifting economic backdrop, the U.S. stock market lost 6.70% for the 12-month period, as measured by the S&P 500 Index. Large- cap stocks held up better than small- and mid-cap stocks, as measured by their respective Russell indices.2 Growth stocks also held up better than value stocks by a significant margin. As the dollar fell to a record low against the euro and multi-year lows versus a number of other currencies, investors reaped somewhat better results from investments outside the U.S. The MSCI EAFE Index, a broad gauge of stock market performance in foreign developed markets, lost 2.53% (in U.S. dollars) for the period, as a weak second half wiped out solid gains that had been posted in first half of the 12-month period. Emerging stock markets, both collectively and individually, were the top performers. The MSCI Emerging Markets Index returned 22.00% (in U.S. dollars) as demand for exports as well as domestic infrastructure expansion continued.3
Past performance is no guarantee of future results.
1The Lehman Brothers Municipal Bond Index is considered representative of the broad market for investment grade, tax exempt bonds with a maturities of at least one year.
2The Russell 1000 Index measures the performance of 1,000 of the largest U.S. companies, based on market capitalization. The Russell Midcap Index measures the performance of the 800 smallest companies in the Russell 1000 Index, as ranked by total market capitalization. The Russell 2000 Index measures the performance of the 2,000 smallest of the 3,000 largest U.S. companies, based on market capitalization.
3The MSCI Emerging Markets Index is a widely accepted index composed of a sample of companies from 25 countries representing the global emerging stock markets.
Indices are not investments, do not incur fees or expenses and are not professionally managed. It is not possible to invest directly in an index. Securities in the fund may not match those in an index.
Summary
For the 12-month period ended May 31, 2008
g Despite volatility in many segments of the bond market, the Lehman Brothers U.S. Aggregate Bond Index delivered a solid return. High-yield bonds lost ground, as measured by the Credit Suisse High Yield Index.
Lehman
Index | | Credit Suisse
Index | |
|
 | |  | |
|
g The broad U.S. stock market, as measured by the S&P 500 Index, returned negative 6.70%. Global emerging stock markets outside the United States returned negative 2.53%, as measured (in U.S. dollars) by the MSCI EAFE Index. A declining dollar helped offset losses.
| S&P Index | | MSCI Index | |
|
 | |  | |
|
The Lehman Brothers U.S. Aggregate Bond Index is a market value-weighted index that tracks the daily price, coupon, pay-downs and total return performance of fixed-rate, publicly placed, dollar-denominated and non-convertible investment grade debt issues with at least $250 million par amount outstanding and with at least one year to final maturity.
The Credit Suisse High Yield Index is a broad-based index that tracks the performance of high-yield bonds.
The Standard & Poor's (S&P) 500 Index tracks the performance of 500 widely held, large-capitalization U.S. stocks.
The Morgan Stanley Capital International (MSCI) Europe, Australasia, Far East (EAFE) Index is a free float-adjusted market capitalization index that is designed to measure developed market equity performance, excluding the U.S. and Canada.
1
Fund Profile – Columbia High Yield Opportunity Fund
Performance data quoted represents past performance and current performance may be lower or higher. Past performance is no guarantee of future results. The investment return and principal value will fluctuate so that shares, when redeemed, may be worth more or less than the original cost. Please visit www.columbiafunds.com for daily and most recent month-end performance updates.
Summary
1-year return as of 05/31/08
| | | –5.03% | |
|
| |  | | | Class A shares
(without sales charge) | |
|
| | | –1.00% | |
|
| |  | | | JPMorgan Global
High Yield Index | |
|
| | | –1.23% | |
|
| |  | | | Credit Suisse
High Yield Index | |
|
Morningstar Style Box
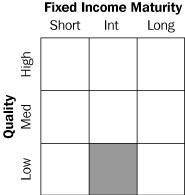
The Morningstar Style BoxTM reveals a fund's investment strategy. For fixed-income funds the vertical axis shows the average credit quality of the bonds owned, and the horizontal axis shows interest rate sensitivity as measured by a bond's duration (short, intermediate or long). All of these numbers are drawn from the data most recently provided by the fund and entered into Morningstar's database as of quarter-end. Although the data gathered is from reliable sources, Morningstar cannot guarantee its completeness and accuracy. Information shown is as of 12/31/07.
Summary
g For the 12-month period that ended May 31, 2008, the fund's Class A shares returned negative 5.03% without sales charge.
g Performance lagged the fund's benchmarks and peer group average.
g Underweights in strong BB-rated securities and in the casino and gaming industry contributed to the fund's relative underperformance.
Portfolio Management
Thomas A. LaPointe, CFA, has co-managed the fund since February 2003, and has been associated with the advisor or its predecessors or affiliate organizations since February 1999.
Kevin L. Cronk, CFA, has co-managed the fund since February 2003 and has been associated with the advisor or its predecessors or affiliate organizations since August 1999.
2
Performance Information – Columbia High Yield Opportunity Fund
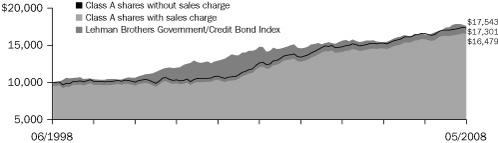
Growth of a $10,000 investment 06/01/98 – 05/31/08
The chart above shows the growth in value of a hypothetical $10,000 investment in Class A shares of Columbia High Yield Opportunity Fund during the stated time period, and does not reflect the deduction of taxes that a shareholder may pay on fund distributions or the redemption of fund shares. The Credit Suisse High Yield Index is a broad-based index that tracks the performance of high-yield bonds. The JPMorgan Global High Yield Index is designed to mirror the investable universe of the US dollar global high-yield corporate debt market, including domestic and international issues. Indices are not investments, do not incur fees or expenses and are not professionally managed. It is not possible to invest directly in an index. Securities in the fund may not match those in an index.
Performance of a $10,000 investment 06/01/98 – 05/31/08 ($)
| Sales charge | | without | | with | |
| Class A | | | 13,616 | | | | 12,969 | | |
| Class B | | | 12,631 | | | | 12,631 | | |
| Class C | | | 12,823 | | | | 12,823 | | |
| Class Z | | | 13,939 | | | | n/a | | |
Average annual total return as of 05/31/08 (%)
| Share class | | A | | B | | C | | Z | |
| Inception | | 10/21/71 | | 06/08/92 | | 01/15/96 | | 01/08/99 | |
| Sales charge | | without | | with | | without | | with | | without | | with | | without | |
| 1-year | | | –5.03 | | | | –9.54 | | | | –5.73 | | | | –10.14 | | | | –5.59 | | | | –6.48 | | | | –4.79 | | |
| 5-year | | | 7.16 | | | | 6.12 | | | | 6.37 | | | | 6.06 | | | | 6.52 | | | | 6.52 | | | | 7.43 | | |
| 10-year | | | 3.13 | | | | 2.63 | | | | 2.36 | | | | 2.36 | | | | 2.52 | | | | 2.52 | | | | 3.38 | | |
Average annual total return as of 06/30/08 (%)
| Share class | | A | | B | | C | | Z | |
| Sales charge | | without | | with | | without | | with | | without | | with | | without | |
| 1-year | | | –5.21 | | | | –9.71 | | | | –5.90 | | | | –10.30 | | | | –5.77 | | | | –6.65 | | | | –4.97 | | |
| 5-year | | | 6.08 | | | | 5.05 | | | | 5.29 | | | | 4.99 | | | | 5.45 | | | | 5.45 | | | | 6.34 | | |
| 10-year | | | 2.85 | | | | 2.35 | | | | 2.08 | | | | 2.08 | | | | 2.24 | | | | 2.24 | | | | 3.09 | | |
The "with sales charge" returns include the maximum initial sales charge of 4.75% for Class A shares, the applicable contingent deferred sales charge of 5.00% in the first year, declining to 1.00% in the sixth year and eliminated thereafter for Class B shares and 1.00% for Class C shares for the first year only. The "without sales charge" returns do not include the effect of sales charges. If they had, returns would be lower.
Performance results reflect any fee waivers or reimbursements of fund expenses by the investment advisor and/or any of its affiliates. Absent these fee waivers or expense reimbursement arrangements, performance results would have been lower.
All results shown assume reinvestment of distributions. Class Z shares are sold at net asset value with no distribution and service (Rule 12b-1) fees. Class Z shares have limited eligibility and the investment minimum requirements may vary. Please see the fund's prospectus for details. Performance for different share classes will vary based on differences in sales charges and fees associated with each class.
The tables do not reflect the deduction of taxes that a shareholder may pay on fund distributions or the redemption of fund shares.
The returns shown for the Fund's Class Z shares include the returns of the Fund's Class A shares for periods prior to January 8, 1999, the date on which the Fund's Class Z shares were first offered. The returns shown have been adjusted to reflect the fact that Class Z shares are sold without a sales charge. The returns shown have not been adjusted to reflect any differences in expenses between Class Z and Class A shares of the Fund. If differences in expenses had been reflected, the returns shown for periods prior to January 8, 1999 would have been higher.
Performance data quoted represents past performance and current performance may be lower or higher. Past performance is no guarantee of future results. The investment return and principal value will fluctuate so that shares, when redeemed, may be worth more or less than the original cost. Please visit www.columbiafunds.com for daily and most recent month-end performance updates.
Annual operating expense ratio (%)*
| Class A | | | 1.12 | | |
| Class B | | | 1.87 | | |
| Class C | | | 1.87 | | |
| Class Z | | | 0.87 | | |
* The annual operating expense ratio is as stated in the fund's prospectus that is current as of the date of this report. Differences in expense ratios disclosed elsewhere in this report may result from including fee waivers and reimbursements as well as different time periods used in calculating the ratios.
3
Understanding Your Expenses – Columbia High Yield Opportunity Fund
Estimating your actual expenses
To estimate the expenses that you paid over the period, first you will need your account balance at the end of the period:
g For shareholders who receive their account statements from Columbia Management Services, Inc., your account balance is available online at www.columbiafunds.com or by calling Shareholder Services at 800.345.6611.
g For shareholders who receive their account statements from their financial intermediary, contact your financial intermediary to obtain your account balance.
1. Divide your ending account balance by $1,000. For example, if an account balance was $8,600 at the end of the period, the result would be 8.6.
2. In the section of the table below titled "Expenses paid during the period," locate the amount for your share class. You will find this number in the column labeled "actual." Multiply this number by the result from step 1. Your answer is an estimate of the expenses you paid on your account during the period.
If the value of your account falls below the minimum initial investment requirement applicable to you, your account generally will be subject to a $20 annual fee. This fee is not included in the accompanying table. If you are subject to the fee, keep it in mind when you are estimating the ongoing expenses of investing in the fund and when comparing the expenses of this fund with other funds.
As a fund shareholder, you incur two types of costs. There are transaction costs, which generally include sales charges on purchases and may include redemption fees or exchange fees. There are also ongoing costs, which generally include investment advisory fees, distribution and service (Rule 12b-1) fees and other fund expenses. The information on this page is intended to help you understand the ongoing costs of investing in the fund and to compare these costs with the ongoing costs of investing in other mutual funds.
Analyzing your fund's expenses by share class
To illustrate these ongoing costs, we have provided an example and calculated the expenses paid by investors in each share class during the period. The information in the following table is based on an initial investment of $1,000, which is invested at the beginning of the reporting period and held for the entire period. Expense information is calculated two ways and each method provides you with different information. The amount listed in the "actual" column is calculated using the fund's actual operating expenses and total return for the period. The amount listed in the "hypothetical" column for each share class assumes that the return each year is 5% before expenses and is calculated based on the fund's actual operating expenses. You should not use the hypothetical account values and expenses to estimate either your actual account balance at the end of the period or the expenses you paid during this reporting period.
Compare with other funds
Since all mutual funds are required to include the same hypothetical calculations about expenses in shareholder reports, you can use this information to compare the ongoing cost of investing in the fund with other funds. To do so, compare the 5% hypothetical example with the 5% hypothetical examples that appear in the shareholder reports of other funds. As you compare hypothetical examples of other funds, it is important to note that hypothetical examples are meant to highlight the ongoing costs of investing in a fund and do not reflect any transaction costs, such as sales charges, redemption fees or exchange fees.
12/01/07 – 05/31/08
| | | Account value at the
beginning of the period ($) | | Account value at the
end of the period ($) | | Expenses paid
during the period ($) | | Fund's annualized
expense ratio (%) | |
| | | Actual | | Hypothetical | | Actual | | Hypothetical | | Actual | | Hypothetical | | Actual | |
| Class A | | | 1,000.00 | | | | 1,000.00 | | | | 992.50 | | | | 1,019.35 | | | | 5.63 | | | | 5.70 | | | | 1.13 | | |
| Class B | | | 1,000.00 | | | | 1,000.00 | | | | 988.90 | | | | 1,015.60 | | | | 9.35 | | | | 9.47 | | | | 1.88 | | |
| Class C | | | 1,000.00 | | | | 1,000.00 | | | | 989.50 | | | | 1,016.35 | | | | 8.60 | | | | 8.72 | | | | 1.73 | | |
| Class Z | | | 1,000.00 | | | | 1,000.00 | | | | 993.70 | | | | 1,020.60 | | | | 4.39 | | | | 4.45 | | | | 0.88 | | |
Expenses paid during the period are equal to the annualized expense ratio for the share class, multiplied by the average account value over the period, then multiplied by the number of days in the fund's most recent fiscal half-year and divided by 366.
Had the investment advisor and/or any of its affiliates not waived fees or reimbursed a portion of expenses, account value at the end of the period would have been reduced.
It is important to note that the expense amounts shown in the table are meant to highlight only ongoing costs of investing in the fund and do not reflect any transaction costs, such as sales charges, redemption fees or exchange fees. Therefore, the hypothetical examples provided may not help you determine the relative total costs of owning shares of different funds. If these transaction costs were included, your costs would have been higher.
4
Portfolio Managers' Report – Columbia High Yield Opportunity Fund
For the 12-month period that ended May 31, 2008, Class A shares of Columbia High Yield Opportunity Fund returned negative 5.03% without sales charge. The fund's benchmarks, the Credit Suisse High Yield Index and the JPMorgan Global High Yield Index, returned negative 1.23% and negative 1.00%, respectively.1 The average return of the fund's peer group, the Lipper High Current Yield Funds Classification, was negative 2.61% for the same period.2 An underweight in BB-rated securities early in the period, as well as an overweight in the casino and gaming industry, areas that were especially weak, contributed to underperformance. Some company-specific disappointments elsewhere in the portfolio also hurt returns.
Challenging time for high-yield sector
The financial markets became increasing volatile over the year, besieged by a slowing economy, sharply higher food and energy prices and a credit crisis, triggered by rising defaults in the subprime mortgage market. As liquidity tightened, investors became increasingly worried about the ability of companies to make their debt payments or borrow the money they needed to meet their capital requirements. Yields in higher-risk sectors rose to compensate investors for taking on added risk, and the difference between yields in the high-yield and Treasury sectors widened sharply in March shortly before the near-collapse of investment bank Bear Stearns Cos. Market stability improved late in the period, following the Federal Reserve's aggressive short-term interest rate cuts and its efforts to provide more liquidity to investment banks and broker/dealers. The yield difference between high-yield and Treasuries narrowed a bit, but ended th e period with six and one-half percentage points between them. Within the high-yield sector, the highest-risk, lowest-quality (CCC-rated) securities suffered the worst returns.
Lost ground from sector disappointments
During the first half of the period, the fund had less exposure to BB-rated bonds than its benchmarks and, we believe, less than its peers, which hurt performance in a volatile environment. However, we increased the fund's BB-rated holdings late in 2007 and reduced CCC-rated securities during the period. Above-average exposure to casino and gaming companies, which have historically performed well during economic slowdowns, also hampered returns. Many gaming companies increased their debt levels to expand operations in recent years. Investors became worried that some companies might not be able to make timely payments on their debt as consumer spending slowed. The fund also held a few names that suffered sharp downturns related to company-specific credit problems. Quebecor Media, a printing company, filed for bankruptcy as pricing pressure and overcapacity diminished the company's prospects. Univision, the leading Spanish languag e broadcaster in the United States, a recent leveraged buyout (LBO), lost ground even though company results exceeded expectations. The market for highly-levered LBOs, in general, and enterprise values for
1The Credit Suisse High Yield Index is a broad-based index that tracks the performance of high-yield bonds. The JPMorgan Global High Yield Index is designed to mirror the investable universe of the U.S. dollar global high-yield corporate debt market, including domestic and international issues. Indices are not investments, do not incur fees or expenses and are not professionally managed. It is not possible to invest directly in an index. Securities in the fund may not match those in an index.
2Lipper Inc., a widely respected data provider in the industry, calculates an average total return (assuming reinvestment of distributions) for mutual funds with investment objectives similar to those of the fund. Lipper makes no adjustment for the effect of sales loads.
Performance data quoted represents past performance and current performance may be lower or higher. Past performance is no guarantee of future results. The investment return and principal value will fluctuate so that shares, when redeemed, may be worth more or less than the original cost. Please visit www.columbiafunds.com for daily and most recent month-end performance updates.
Net asset value per share
as of 05/31/08 ($)
| Class A | | | 4.17 | | |
| Class B | | | 4.17 | | |
| Class C | | | 4.17 | | |
| Class Z | | | 4.17 | | |
Distributions declared per share
06/01/07 – 05/31/08 ($)
| Class A | | | 0.31 | | |
| Class B | | | 0.28 | | |
| Class C | | | 0.29 | | |
| Class Z | | | 0.32 | | |
Top 10 Issuers
as of 05/31/08 (%)
Texas Competitive
Electric Holdings Co. | | | 1.9 | | |
| Qwest Corp. | | | 1.6 | | |
| Intelsat Bermuda Ltd. | | | 1.6 | | |
| HCA, Inc. | | | 1.4 | | |
| GMAC LLC | | | 1.3 | | |
LVB Acquisition
Merger Sub, Inc. | | | 1.3 | | |
| Freeport – McMoRan | |
| Copper & Gold, Inc. | | | 1.0 | | |
| MGM Mirage | | | 1.0 | | |
| El Paso Corp | | | 0.9 | | |
| CSC Holdings, Inc. | | | 0.9 | | |
Holdings discussed
in this report as of 5/31/08 (%)
| Quebecor Media, Inc. | | | 0.6 | | |
| Freescale Semiconductor, Inc. | | | 0.9 | | |
Freeport-McMoRan
Copper & Gold, Inc. | | | 1.0 | | |
The fund is actively managed and the composition of its portfolio will change over time. Information provided is calculated as a percentage of net assets.
5
Portfolio Managers' Report (continued) – Columbia High Yield Opportunity Fund
Maturity breakdown
as of 05/31/08 (%)
| 0-1 year | | | 0.3 | | |
| 1-3 years | | | 2.5 | | |
| 3-5 years | | | 12.5 | | |
| 5-7 years | | | 32.6 | | |
| 7-10 years | | | 38.6 | | |
| 10-15 years | | | 1.1 | | |
| 15-20 years | | | 2.1 | | |
| 20-30 years | | | 3.3 | | |
| Other | | | 7.0 | | |
Portfolio structure
as of 05/31/08 (%)
| Corporate Fixed-Income | |
| Bonds & Notes | | | 91.2 | | |
| Municipal Bonds | | | 1.2 | | |
| Common Stocks | | | 0.3 | | |
| Other | | | 7.3 | | |
Quality breakdown
as of 05/31/08 (%)
| AAA* | | | 6.0 | | |
| BBB | | | 0.9 | | |
| BB | | | 23.1 | | |
| B | | | 45.9 | | |
| CCC | | | 20.0 | | |
| CC | | | 0.3 | | |
| Not Rated | | | 2.8 | | |
| Other | | | 1.0 | | |
The fund is actively managed and the composition of its portfolio will change over time. Portfolio structure, top 10 issuers, quality and maturity breakdowns are calculated as a percentage of net assets. Swaps are not included in the maturity breakdown. Ratings shown in the quality breakdown represent the rating assigned to a particular bond by one of the following nationally-recognized rating agencies: Standard & Poor's, a division of The McGraw-Hill Companies, Inc., Moody's Investors Service, Inc. or Fitch Ratings Ltd. Ratings are relative and subjective and are not absolute standards of quality. The fund's credit quality does not remove market risk.
*Repurchase agreement included.
30-day SEC yields
as of 05/31/08 (%)
| Class A | | | 7.76 | | |
| Class B | | | 7.41 | | |
| Class C | | | 7.56 | | |
| Class Z | | | 8.41 | | |
The 30-day SEC yields reflect the fund's earning power, net of expenses, expressed as an annualized percentage of the public offering price per share at the end of the period.
media companies, more specifically, have decreased. The Fund no longer owns any Univision bonds. In the technology sector, Freescale Semiconductor bonds disappointed. The company's wireless and automotive products have been underperformers due to a weak economy and other product-specific factors. A small stake in equities further hindered returns as the Standard & Poor's 500 Index3 returned a disappointing negative 6.70% for the year.
Gains from energy and utilities
Helping to offset some of these losses were returns from oil and gas issues, which benefited as energy prices rose and exploration and production companies reported record earnings. Utility bonds also did well, thanks to strong demand and tight capacity. The fund's top performers included Lyondell, a chemical company, whose bonds were tendered as the result of a merger and resulted in good returns for the fund, and Biomet, a health care and technology holding, which has done well as demand for its orthopedic products remains high. In the metals sector, the bonds of Freeport McMoRan, a copper and gold mining company, benefited from soaring commodity prices, and the company's performance has exceeded market expectations.
Managing risk
Early in 2007, we decided to sell home builders and reduce exposure of the fund to financials and retailers, which helped, as these sectors were among the worst performers in the market downturn. Throughout the year, the fund maintained below-average exposure to these and other high-risk industries, including airlines. During the period we also raised cash to 8.0% of the fund assets. Going forward, we plan to take advantage of buying opportunities among higher quality high-yield bonds that offer the potential for stable income and price appreciation. We believe the outlook for high-yield bonds should improve as economic growth picks up. In the meantime, we believe the sector has the potential to continue to provide high levels of income for investors willing to take on added risk.
Portfolio holdings and characteristics are subject to change periodically and may not be representative of current holdings and characteristics. The outlook for the fund may differ from that presented for other Columbia Funds.
Investing in fixed-income securities may involve certain risks, including the credit quality of individual issuers, possible prepayments, market or economic developments and yield and share price fluctuations due to changes in interest rates. When interest rates go up, bond prices typically drop, and vice versa.
Investing in high-yield or "junk" bonds offers the potential for higher income than investments in investment-grade bonds, but also has a higher degree of risk. Changes in economic conditions or other circumstances may adversely affect a high-yield bond issuer's ability to make timely principal and interest payments. Rising interest rates tend to lower the value of all bonds. International investing involves special risks, including foreign taxation, currency fluctuations, risks associated with possible differences in financial standards and other monetary and political risks.
3The Standard & Poor's (S&P) 500 Index tracks the performance of 500 widely held, large-capitalization U.S. stocks. Indices are not investments, do not incur fees or expenses and are not professionally managed. It is not possible to invest directly in an index. Securities in the fund may not match those in an index.
6
Investment Portfolio – Columbia High Yield Opportunity Fund
May 31, 2008
| Corporate Fixed-Income Bonds & Notes – 91.2% | |
| | | | | Par (a) | | Value ($) | |
| Basic Materials – 6.7% | |
| Chemicals – 2.7% | |
| Agricultural Chemicals – 0.6% | |
| Mosaic Co. | |
| 7.875% 12/01/16 (b) | | | | | 1,780,000 | | | | 1,931,300 | | |
| Terra Capital, Inc. | |
| 7.000% 02/01/17 | | | | | 315,000 | | | | 313,031 | | |
| | | 2,244,331 | | |
| Chemicals-Diversified – 1.5% | |
| Huntsman International LLC | |
| 6.875% 11/15/13 (b) | | EUR | | | 800,000 | | | | 1,249,267 | | |
| 7.875% 11/15/14 | | | | | 1,665,000 | | | | 1,781,550 | | |
| Ineos Group Holdings PLC | |
| 8.500% 02/15/16 (b) | | | | | 1,660,000 | | | | 1,290,650 | | |
| NOVA Chemicals Corp. | |
| 6.500% 01/15/12 | | | | | 1,500,000 | | | | 1,395,000 | | |
| | | 5,716,467 | | |
| Chemicals-Specialty – 0.6% | |
| Chemtura Corp. | |
| 6.875% 06/01/16 | | | | | 1,475,000 | | | | 1,371,750 | | |
| MacDermid, Inc. | |
| 9.500% 04/15/17 (b) | | | | | 1,015,000 | | | | 984,550 | | |
| | | 2,356,300 | | |
| Chemicals Total | | | 10,317,098 | | |
| Forest Products & Paper – 1.6% | |
| Paper & Related Products – 1.6% | |
| Abitibi-Consolidated, Inc. | |
| 8.375% 04/01/15 | | | | | 1,870,000 | | | | 818,125 | | |
| Domtar Corp. | |
| 7.125% 08/15/15 | | | | | 1,670,000 | | | | 1,594,850 | | |
| Georgia-Pacific Corp. | |
| 8.000% 01/15/24 | | | | | 1,645,000 | | | | 1,587,425 | | |
| NewPage Corp. | |
| 10.000% 05/01/12 (b) | | | | | 755,000 | | | | 804,075 | | |
| 12.000% 05/01/13 | | | | | 795,000 | | | | 840,712 | | |
| NewPage Holding Corp. | |
PIK,
9.986% 11/01/13 (c) | | | | | 560,000 | | | | 546,580 | | |
| | | | 6,191,767 | | |
| Forest Products & Paper Total | | | 6,191,767 | | |
| Iron/Steel – 0.5% | |
| Steel-Producers – 0.5% | |
| Steel Dynamics, Inc. | |
| 7.750% 04/15/16 (b) | | | | | 2,075,000 | | | | 2,080,188 | | |
| | | 2,080,188 | | |
| Iron/Steel Total | | | 2,080,188 | | |
| | | | | Par (a) | | Value ($) | |
| Metals & Mining – 1.9% | |
| Diversified Minerals – 0.6% | �� |
| FMG Finance Ltd. | |
| 10.625% 09/01/16 (b) | | | | | 2,120,000 | | | | 2,459,200 | | |
| | | 2,459,200 | | |
| Metal-Diversified – 1.0% | |
| Freeport-McMoRan Copper & Gold, Inc. | |
| 8.375% 04/01/17 | | | | | 3,600,000 | | | | 3,870,000 | | |
| | | 3,870,000 | | |
| Mining Services – 0.3% | |
| Noranda Aluminium Holding Corp. | |
PIK,
8.578% 11/15/14 (b)(c) | | | | | 1,365,000 | | | | 1,194,375 | | |
| | | 1,194,375 | | |
| Metals & Mining Total | | | 7,523,575 | | |
| Basic Materials Total | | | 26,112,628 | | |
| Communications – 18.3% | |
| Media – 6.7% | |
| Cable TV – 2.8% | |
| Atlantic Broadband Finance LLC | |
| 9.375% 01/15/14 | | | | | 900,000 | | | | 838,125 | | |
| Cablevision Systems Corp. | |
| 8.000% 04/15/12 | | | | | 1,540,000 | | | | 1,497,650 | | |
| Charter Communications Holdings I LLC | |
| 11.000% 10/01/15 | | | | | 1,120,000 | | | | 952,000 | | |
| Charter Communications Holdings II LLC | |
| 10.250% 09/15/10 | | | | | 730,000 | | | | 726,350 | | |
| CSC Holdings, Inc. | |
| 7.625% 04/01/11 | | | | | 2,170,000 | | | | 2,170,000 | | |
| DirecTV Holdings LLC | |
| 6.375% 06/15/15 | | | | | 2,090,000 | | | | 1,982,887 | | |
| EchoStar DBS Corp. | |
| 6.625% 10/01/14 | | | | | 1,935,000 | | | | 1,823,738 | | |
| 7.125% 02/01/16 | | | | | 1,000,000 | | | | 955,000 | | |
| | | 10,945,750 | | |
| Multimedia – 1.4% | |
| CanWest MediaWorks LP | |
| 9.250% 08/01/15 (b) | | | | | 1,730,000 | | | | 1,513,750 | | |
| Lamar Media Corp. | |
| 6.625% 08/15/15 | | | | | 1,900,000 | | | | 1,790,750 | | |
| Quebecor Media, Inc. | |
| 7.750% 03/15/16 | | | | | 2,205,000 | | | | 2,160,900 | | |
| | | 5,465,400 | | |
See Accompanying Notes to Financial Statements.
7
Columbia High Yield Opportunity Fund
May 31, 2008
| Corporate Fixed-Income Bonds & Notes (continued) | |
| | | | | Par (a) | | Value ($) | |
| Publishing-Books – 0.5% | |
| TL Acquisitions, Inc. | |
| 10.500% 01/15/15 (b) | | | | | 2,280,000 | | | | 2,074,800 | | |
| | | 2,074,800 | | |
| Publishing-Periodicals – 1.5% | |
| Dex Media, Inc. | |
(d) 11/15/13
(9.000% 11/15/08) | | | | | 1,230,000 | | | | 953,250 | | |
| Idearc, Inc. | |
| 8.000% 11/15/16 | | | | | 2,295,000 | | | | 1,640,925 | | |
| Penton Media, Inc. | |
| 7.899% 02/01/14 (c)(e) | | | | | 1,000,000 | | | | 700,000 | | |
| R.H. Donnelley Corp. | |
| 8.875% 01/15/16 | | | | | 1,620,000 | | | | 1,109,700 | | |
| 8.875% 10/15/17 (b) | | | | | 2,075,000 | | | | 1,390,250 | | |
| | | | 5,794,125 | | |
| Radio – 0.3% | |
| CMP Susquehanna Corp. | |
| 9.875% 05/15/14 | | | | | 1,405,000 | | | | 990,525 | | |
| | | 990,525 | | |
| Television – 0.2% | |
| Local TV Finance LLC | |
PIK,
9.250% 06/15/15 (b) | | | | | 930,000 | | | | 748,650 | | |
| | | 748,650 | | |
| Media Total | | | 26,019,250 | | |
| Telecommunication Services – 11.6% | |
| Cellular Telecommunications – 3.2% | |
| Cricket Communications, Inc. | |
| 9.375% 11/01/14 | | | | | 2,390,000 | | | | 2,306,350 | | |
| Digicel Group Ltd. | |
| 8.875% 01/15/15 (b) | | | | | 2,365,000 | | | | 2,169,887 | | |
| MetroPCS Wireless, Inc. | |
| 9.250% 11/01/14 | | | | | 2,535,000 | | | | 2,436,769 | | |
| Orascom Telecom Finance SCA | |
| 7.875% 02/08/14 (b) | | | | | 855,000 | | | | 818,663 | | |
| Rural Cellular Corp. | |
| 8.623% 11/01/12 (c) | | | | | 1,315,000 | | | | 1,338,012 | | |
| US Unwired, Inc. | |
| 10.000% 06/15/12 | | | | | 945,000 | | | | 919,013 | | |
| Wind Acquisition Financial SA | |
PIK,
9.984% 12/21/11 (c)(e) | | | | | 2,646,329 | | | | 2,541,264 | | |
| | | 12,529,958 | | |
| | | | | Par (a) | | Value ($) | |
| Satellite Telecommunications – 2.1% | |
| Inmarsat Finance II PLC | |
(d) 11/15/12
(10.375% 11/15/08) | | | | | 1,200,000 | | | | 1,200,000 | | |
| Inmarsat Finance PLC | |
| 7.625% 06/30/12 | | | | | 650,000 | | | | 663,000 | | |
| Intelsat Bermuda Ltd. | |
| 9.250% 06/15/16 | | | | | 715,000 | | | | 722,150 | | |
| 11.250% 06/15/16 | | | | | 3,910,000 | | | | 3,988,200 | | |
| Intelsat Intermediate Holdings Co., Ltd. | |
(d) 02/01/15
(9.250% 02/01/10) | | | | | 1,845,000 | | | | 1,559,025 | | |
| | | 8,132,375 | | |
| Telecommunication Equipment – 0.5% | |
| Lucent Technologies, Inc. | |
| 6.450% 03/15/29 | | | | | 2,405,000 | | | | 1,842,831 | | |
| | | 1,842,831 | | |
| Telecommunication Services – 1.8% | |
| Hellas Telecommunications Luxembourg II | |
| 8.463% 01/15/15 (b)(c) | | | | | 900,000 | | | | 693,000 | | |
| Nordic Telephone Co. Holdings ApS | |
| 8.250% 05/01/16 (b) | | EUR | | | 1,030,000 | | | | 1,530,313 | | |
| 8.875% 05/01/16 (b) | | | | | 1,250,000 | | | | 1,231,250 | | |
| Syniverse Technologies, Inc. | |
| 7.750% 08/15/13 | | | | | 790,000 | | | | 758,400 | | |
| Time Warner Telecom Holdings, Inc. | |
| 9.250% 02/15/14 | | | | | 1,500,000 | | | | 1,552,500 | | |
| West Corp. | |
| 11.000% 10/15/16 | | | | | 1,690,000 | | | | 1,495,650 | | |
| | | 7,261,113 | | |
| Telephone-Integrated – 4.0% | |
| Cincinnati Bell, Inc. | |
| 8.375% 01/15/14 | | | | | 1,500,000 | | | | 1,492,500 | | |
| Citizens Communications Co. | |
| 7.875% 01/15/27 | | | | | 2,145,000 | | | | 1,930,500 | | |
| Hawaiian Telcom Communications, Inc. | |
| 9.750% 05/01/13 | | | | | 1,000,000 | | | | 390,000 | | |
| Qwest Communications International, Inc. | |
| 7.500% 02/15/14 | | | | | 1,780,000 | | | | 1,744,400 | | |
| Qwest Corp. | |
| 7.500% 10/01/14 | | | | | 850,000 | | | | 845,750 | | |
| 7.500% 06/15/23 | | | | | 3,430,000 | | | | 3,164,175 | | |
| 8.875% 03/15/12 | | | | | 605,000 | | | | 633,738 | | |
| Virgin Media Finance PLC | |
| 8.750% 04/15/14 | | EUR | | | 690,000 | | | | 1,025,161 | | |
| 8.750% 04/15/14 | | | | | 680,000 | | | | 668,100 | | |
| 9.125% 08/15/16 | | | | | 1,000,000 | | | | 980,000 | | |
See Accompanying Notes to Financial Statements.
8
Columbia High Yield Opportunity Fund
May 31, 2008
| Corporate Fixed-Income Bonds & Notes (continued) | |
| | | | | Par (a) | | Value ($) | |
| Windstream Corp. | |
| 8.625% 08/01/16 | | | | | 2,540,000 | | | | 2,625,725 | | |
| | | | 15,500,049 | | |
| Telecommunication Services Total | | | 45,266,326 | | |
| Communications Total | | | 71,285,576 | | |
| Consumer Cyclical – 15.4% | |
| Apparel – 0.7% | |
| Apparel Manufacturers – 0.7% | |
| Levi Strauss & Co. | |
| 9.750% 01/15/15 | | | | | 2,710,000 | | | | 2,838,725 | | |
| | | 2,838,725 | | |
| Apparel Total | | | 2,838,725 | | |
| Auto Manufacturers – 1.2% | |
| Auto-Cars/Light Trucks – 1.2% | |
| Ford Motor Co. | |
| 7.450% 07/16/31 | | | | | 1,805,000 | | | | 1,249,963 | | |
| General Motors Corp. | |
| 8.375% 07/15/33 | | | | | 4,810,000 | | | | 3,294,850 | | |
| | | | 4,544,813 | | |
| Auto Manufacturers Total | | | 4,544,813 | | |
| Auto Parts & Equipment – 2.0% | |
| Auto/Truck Parts & Equipment-Original – 1.3% | |
| ArvinMeritor, Inc. | |
| 8.125% 09/15/15 | | | | | 1,090,000 | | | | 930,587 | | |
| Cooper-Standard Automotive, Inc. | |
| 7.000% 12/15/12 | | | | | 1,170,000 | | | | 1,053,000 | | |
| Hayes Lemmerz Finance Luxembourg SA | |
| 8.250% 06/15/15 (b) | | EUR | | | 1,290,000 | | | | 1,706,883 | | |
| TRW Automotive, Inc. | |
| 7.000% 03/15/14 (b) | | | | | 1,435,000 | | | | 1,356,075 | | |
| | | 5,046,545 | | |
| Auto/Truck Parts & Equipment-Replacement – 0.3% | |
| Commercial Vehicle Group, Inc. | |
| 8.000% 07/01/13 | | | | | 1,340,000 | | | | 1,162,450 | | |
| | | 1,162,450 | | |
| Rubber-Tires – 0.4% | |
| Goodyear Tire & Rubber Co. | |
| 8.625% 12/01/11 | | | | | 423,000 | | | | 446,265 | | |
| 9.000% 07/01/15 | | | | | 1,038,000 | | | | 1,113,255 | | |
| | | 1,559,520 | | |
| Auto Parts & Equipment Total | | | 7,768,515 | | |
| | | | | Par (a) | | Value ($) | |
| Distribution/Wholesale – 0.5% | |
| Buhrmann U.S., Inc. | |
| 7.875% 03/01/15 | | | | | 1,065,000 | | | | 1,007,756 | | |
| Nebraska Book Co., Inc. | |
| 8.625% 03/15/12 | | | | | 1,000,000 | | | | 860,000 | | |
| | | | 1,867,756 | | |
| Distribution/Wholesale Total | | | 1,867,756 | | |
| Entertainment – 1.3% | |
| Music – 0.8% | |
| Steinway Musical Instruments, Inc. | |
| 7.000% 03/01/14 (b) | | | | | 1,435,000 | | | | 1,320,200 | | |
| WMG Acquisition Corp. | |
| 7.375% 04/15/14 | | | | | 1,440,000 | | | | 1,180,800 | | |
| WMG Holdings Corp. | |
(d) 12/15/14
(9.500% 12/15/09) | | | | | 1,325,000 | | | | 795,000 | | |
| | | 3,296,000 | | |
| Resorts/Theme Parks – 0.5% | |
| Six Flags, Inc. | |
| 9.625% 06/01/14 | | | | | 1,555,000 | | | | 964,100 | | |
| Universal City Florida Holding | |
| 7.623% 05/01/10 (c) | | | | | 1,000,000 | | | | 982,500 | | |
| | | | 1,946,600 | | |
| Entertainment Total | | | 5,242,600 | | |
| Home Builders – 0.1% | |
| Building-Residential/Commercial – 0.1% | |
| KB Home | |
| 5.875% 01/15/15 | | | | | 435,000 | | | | 380,625 | | |
| | | 380,625 | | |
| Home Builders Total | | | 380,625 | | |
| Home Furnishings – 0.7% | |
| Sealy Mattress Co. | |
| 8.250% 06/15/14 | | | | | 1,625,000 | | | | 1,434,063 | | |
| Simmons Co. | |
| 8.204% 02/15/12 (e) | | | | | 1,700,000 | | | | 1,093,666 | | |
| | | 2,527,729 | | |
| Home Furnishings Total | | | 2,527,729 | | |
| Leisure Time – 0.4% | |
| Cruise Lines – 0.4% | |
| Royal Caribbean Cruises Ltd. | |
| 7.000% 06/15/13 | | | | | 1,475,000 | | | | 1,362,531 | | |
| | | 1,362,531 | | |
| Leisure Time Total | | | 1,362,531 | | |
See Accompanying Notes to Financial Statements.
9
Columbia High Yield Opportunity Fund
May 31, 2008
| Corporate Fixed-Income Bonds & Notes (continued) | |
| | | | | Par (a) | | Value ($) | |
| Lodging – 4.6% | |
| Casino Hotels – 3.5% | |
| Boyd Gaming Corp. | |
| 6.750% 04/15/14 | | | | | 500,000 | | | | 418,125 | | |
| 7.125% 02/01/16 | | | | | 1,000,000 | | | | 782,500 | | |
| Greektown Holdings LLC | |
| 10.750% 12/01/13 (b)(f) | | | | | 850,000 | | | | 586,500 | | |
| Harrah's Operating Co., Inc. | |
| 10.750% 02/01/16 (b) | | | | | 3,215,000 | | | | 2,789,013 | | |
| Jacobs Entertainment, Inc. | |
| 9.750% 06/15/14 | | | | | 1,225,000 | | | | 961,625 | | |
| Majestic Star LLC | |
| 9.750% 01/15/11 | | | | | 3,195,000 | | | | 1,038,375 | | |
| MGM Mirage | |
| 7.500% 06/01/16 | | | | | 4,350,000 | | | | 3,866,062 | | |
| Pinnacle Entertainment, Inc. | |
| 7.500% 06/15/15 (b) | | | | | 1,235,000 | | | | 1,018,875 | | |
| Snoqualmie Entertainment Authority | |
| 6.936% 02/01/14 (b)(c) | | | | | 280,000 | | | | 217,000 | | |
| 9.125% 02/01/15 (b) | | | | | 1,235,000 | | | | 950,950 | | |
| Station Casinos, Inc. | |
| 6.625% 03/15/18 | | | | | 1,985,000 | | | | 1,161,225 | | |
| | | 13,790,250 | | |
| Gambling (Non-Hotel) – 1.1% | |
| Mashantucket Western Pequot Tribe | |
| 8.500% 11/15/15 (b) | | | | | 2,580,000 | | | | 2,386,500 | | |
| Seminole Indian Tribe of Florida | |
| 7.804% 10/01/20 (b) | | | | | 2,000,000 | | | | 1,919,960 | | |
| | | 4,306,460 | | |
| Lodging Total | | | 18,096,710 | | |
| Retail – 3.5% | |
| Retail-Apparel/Shoe – 0.5% | |
| Hanesbrands, Inc. | |
| 8.204% 12/15/14 (c) | | | | | 935,000 | | | | 869,550 | | |
| Phillips-Van Heusen Corp. | |
| 7.250% 02/15/11 | | | | | 425,000 | | | | 429,250 | | |
| 8.125% 05/01/13 | | | | | 565,000 | | | | 581,950 | | |
| | | 1,880,750 | | |
| Retail-Automobiles – 0.9% | |
| AutoNation, Inc. | |
| 4.713% 04/15/13 (c) | | | | | 365,000 | | | | 322,569 | | |
| 7.000% 04/15/14 | | | | | 640,000 | | | | 605,600 | | |
| KAR Holdings, Inc. | |
| 10.000% 05/01/15 | | | | | 1,470,000 | | | | 1,337,700 | | |
| United Auto Group, Inc. | |
| 7.750% 12/15/16 | | | | | 1,450,000 | | | | 1,348,500 | | |
| | | 3,614,369 | | |
| | | | | Par (a) | | Value ($) | |
| Retail-Discount – 0.2% | |
| Dollar General Corp. | |
PIK,
11.875% 07/15/17 | | | | | 1,000,000 | | | | 920,000 | | |
| | | 920,000 | | |
| Retail-Drug Stores – 0.7% | |
| Rite Aid Corp. | |
| 8.625% 03/01/15 | | | | | 1,000,000 | | | | 780,000 | | |
| 9.375% 12/15/15 | | | | | 2,215,000 | | | | 1,727,700 | | |
| | | 2,507,700 | | |
| Retail-Major Department Stores – 0.3% | |
| Saks, Inc. | |
| 9.875% 10/01/11 | | | | | 1,000,000 | | | | 1,045,000 | | |
| | | 1,045,000 | | |
| Retail-Propane Distributors – 0.4% | |
| AmeriGas Partners LP | |
| 7.125% 05/20/16 | | | | | 1,220,000 | | | | 1,183,400 | | |
| 7.250% 05/20/15 | | | | | 420,000 | | | | 408,450 | | |
| | | 1,591,850 | | |
| Retail-Restaurants – 0.3% | |
| Landry's Restaurants, Inc. | |
| 9.500% 12/15/14 | | | | | 1,285,000 | | | | 1,265,725 | | |
| | | 1,265,725 | | |
| Retail-Video Rental – 0.2% | |
| Blockbuster, Inc. | |
| 9.000% 09/01/12 | | | | | 1,000,000 | | | | 832,500 | | |
| | | | 832,500 | | |
| Retail Total | | | 13,657,894 | | |
| Textiles – 0.4% | |
| Textile-Products – 0.4% | |
| INVISTA | |
| 9.250% 05/01/12 (b) | | | | | 1,520,000 | | | | 1,573,200 | | |
| | | 1,573,200 | | |
| Textiles Total | | | 1,573,200 | | |
| Consumer Cyclical Total | | | 59,861,098 | | |
| Consumer Non-Cyclical – 12.9% | |
| Agriculture – 0.2% | |
| Tobacco – 0.2% | |
| Reynolds American, Inc. | |
| 7.625% 06/01/16 | | | | | 740,000 | | | | 772,670 | | |
| | | 772,670 | | |
| Agriculture Total | | | 772,670 | | |
See Accompanying Notes to Financial Statements.
10
Columbia High Yield Opportunity Fund
May 31, 2008
| Corporate Fixed-Income Bonds & Notes (continued) | |
| | | | | Par (a) | | Value ($) | |
| Beverages – 0.5% | |
| Beverages-Non-Alcoholic – 0.2% | |
| Cott Beverages, Inc. | |
| 8.000% 12/15/11 | | | | | 860,000 | | | | 724,550 | | |
| | | 724,550 | | |
| Beverages-Wine/Spirits – 0.3% | |
| Constellation Brands, Inc. | |
| 8.125% 01/15/12 | | | | | 1,100,000 | | | | 1,113,750 | | |
| | | | 1,113,750 | | |
| Beverages Total | | | 1,838,300 | | |
| Biotechnology – 0.4% | |
| Medical-Biomedical/Gene – 0.4% | |
| Bio-Rad Laboratories, Inc. | |
| 7.500% 08/15/13 | | | | | 1,485,000 | | | | 1,499,850 | | |
| | | | 1,499,850 | | |
| Biotechnology Total | | | 1,499,850 | | |
| Commercial Services – 3.9% | |
| Commercial Services – 1.1% | |
| ARAMARK Corp. | |
| 8.500% 02/01/15 | | | | | 1,440,000 | | | | 1,474,200 | | |
| Iron Mountain, Inc. | |
| 7.750% 01/15/15 | | | | | 1,560,000 | | | | 1,591,200 | | |
| 8.625% 04/01/13 | | | | | 1,000,000 | | | | 1,015,000 | | |
| | | 4,080,400 | | |
| Commercial Services-Finance – 0.2% | |
| ACE Cash Express, Inc. | |
| 10.250% 10/01/14 (b) | | | | | 1,025,000 | | | | 794,375 | | |
| | | 794,375 | | |
| Funeral Services & Related Items – 0.6% | |
| Service Corp. International | |
| 6.750% 04/01/16 | | | | | 835,000 | | | | 795,338 | | |
| 7.000% 06/15/17 | | | | | 1,500,000 | | | | 1,455,000 | | |
| 7.375% 10/01/14 | | | | | 135,000 | | | | 135,675 | | |
| | | 2,386,013 | | |
| Private Corrections – 0.5% | |
| Corrections Corp. of America | |
| 6.250% 03/15/13 | | | | | 1,345,000 | | | | 1,324,825 | | |
| GEO Group, Inc. | |
| 8.250% 07/15/13 | | | | | 700,000 | | | | 717,500 | | |
| | | 2,042,325 | | |
| | | | | Par (a) | | Value ($) | |
| Rental Auto/Equipment – 1.3% | |
| Ashtead Holdings PLC | |
| 8.625% 08/01/15 (b) | | | | | 1,390,000 | | | | 1,209,300 | | |
| Hertz Corp. | |
| 8.875% 01/01/14 | | | | | 1,350,000 | | | | 1,343,250 | | |
| Rental Service Corp. | |
| 9.500% 12/01/14 | | | | | 1,800,000 | | | | 1,575,000 | | |
| United Rentals North America, Inc. | |
| 6.500% 02/15/12 | | | | | 965,000 | | | | 890,212 | | |
| | | 5,017,762 | | |
| Schools – 0.2% | |
| Knowledge Learning Corp. | |
| 7.750% 02/01/15 (b) | | | | | 1,000,000 | | | | 945,000 | | |
| | | | 945,000 | | |
| Commercial Services Total | | | 15,265,875 | | |
| Food – 2.0% | |
| Food-Dairy Products – 0.2% | |
| Dean Foods Co. | |
| 7.000% 06/01/16 | | | | | 1,025,000 | | | | 955,812 | | |
| | | 955,812 | | |
| Food-Meat Products – 0.3% | |
| Smithfield Foods, Inc. | |
| 7.750% 07/01/17 | | | | | 1,355,000 | | | | 1,334,675 | | |
| | | 1,334,675 | | |
| Food-Miscellaneous/Diversified – 1.5% | |
| Del Monte Corp. | |
| 6.750% 02/15/15 | | | | | 1,000,000 | | | | 967,500 | | |
| 8.625% 12/15/12 | | | | | 500,000 | | | | 512,500 | | |
| Dole Food Co., Inc. | |
| 8.625% 05/01/09 | | | | | 1,100,000 | | | | 1,078,000 | | |
| Pinnacle Foods Finance LLC | |
| 9.250% 04/01/15 | | | | | 2,055,000 | | | | 1,890,600 | | |
| Reddy Ice Holdings, Inc. | |
(d) 11/01/12
(10.500% 11/01/08) | | | | | 1,420,000 | | | | 1,192,800 | | |
| | | | 5,641,400 | | |
| Food Total | | | 7,931,887 | | |
| Healthcare Services – 3.4% | |
| Dialysis Centers – 0.5% | |
| DaVita, Inc. | |
| 7.250% 03/15/15 | | | | | 1,940,000 | | | | 1,896,350 | | |
| | | 1,896,350 | | |
See Accompanying Notes to Financial Statements.
11
Columbia High Yield Opportunity Fund
May 31, 2008
| Corporate Fixed-Income Bonds & Notes (continued) | |
| | | | | Par (a) | | Value ($) | |
| Medical-Hospitals – 2.7% | |
| Community Health Systems, Inc. | |
| 8.875% 07/15/15 | | | | | 1,855,000 | | | | 1,912,968 | | |
| HCA, Inc. | |
| 9.250% 11/15/16 | | | | | 1,555,000 | | | | 1,642,469 | | |
PIK,
9.625% 11/15/16 | | | | | 3,485,000 | | | | 3,676,675 | | |
| Tenet Healthcare Corp. | |
| 9.875% 07/01/14 | | | | | 3,235,000 | | | | 3,235,000 | | |
| | | 10,467,112 | | |
| Physician Practice Management – 0.2% | |
| U.S. Oncology Holdings, Inc. | |
PIK,
7.949% 03/15/12 (c) | | | | | 1,074,000 | | | | 875,310 | | |
| | | | 875,310 | | |
| Healthcare Services Total | | | 13,238,772 | | |
| Household Products/Wares – 0.8% | |
| Consumer Products-Miscellaneous – 0.8% | |
| American Greetings Corp. | |
| 7.375% 06/01/16 | | | | | 1,220,000 | | | | 1,216,950 | | |
| Jarden Corp. | |
| 7.500% 05/01/17 | | | | | 1,000,000 | | | | 892,500 | | |
| Jostens IH Corp. | |
| 7.625% 10/01/12 | | | | | 1,185,000 | | | | 1,183,519 | | |
| | | | 3,292,969 | | |
| Household Products/Wares Total | | | 3,292,969 | | |
| Pharmaceuticals – 1.7% | |
| Medical-Drugs – 1.0% | |
| Elan Finance PLC | |
| 8.875% 12/01/13 | | | | | 1,995,000 | | | | 1,995,000 | | |
| Warner Chilcott Corp. | |
| 8.750% 02/01/15 | | | | | 1,918,000 | | | | 1,965,950 | | |
| | | 3,960,950 | | |
| Pharmacy Services – 0.4% | |
| Omnicare, Inc. | |
| 6.750% 12/15/13 | | | | | 1,535,000 | | | | 1,439,063 | | |
| | | 1,439,063 | | |
| Vitamins & Nutrition Products – 0.3% | |
| NBTY, Inc. | |
| 7.125% 10/01/15 | | | | | 1,260,000 | | | | 1,209,600 | | |
| | | | 1,209,600 | | |
| Pharmaceuticals Total | | | 6,609,613 | | |
| Consumer Non-Cyclical Total | | | 50,449,936 | | |
| | | | | Par (a) | | Value ($) | |
| Energy – 9.4% | |
| Coal – 1.3% | |
| Arch Western Finance LLC | |
| 6.750% 07/01/13 | | | | | 1,645,000 | | | | 1,624,437 | | |
| Massey Energy Co. | |
| 6.875% 12/15/13 | | | | | 2,650,000 | | | | 2,610,250 | | |
| Peabody Energy Corp. | |
| 7.375% 11/01/16 | | | | | 735,000 | | | | 751,538 | | |
| | | | 4,986,225 | | |
| Coal Total | | | 4,986,225 | | |
| Energy-Alternate Sources – 0.3% | |
| VeraSun Energy Corp. | |
| 9.375% 06/01/17 | | | | | 1,285,000 | | | | 893,075 | | |
| | | | 893,075 | | |
| Energy-Alternate Sources Total | | | 893,075 | | |
| Oil & Gas – 5.6% | |
| Oil & Gas Drilling – 0.3% | |
| Pride International, Inc. | |
| 7.375% 07/15/14 | | | | | 960,000 | | | | 976,800 | | |
| | | 976,800 | | |
| Oil Companies-Exploration & Production – 4.6% | |
| Chesapeake Energy Corp. | |
| 6.375% 06/15/15 | | | | | 1,600,000 | | | | 1,532,000 | | |
| 7.500% 06/15/14 | | | | | 1,145,000 | | | | 1,152,156 | | |
| Cimarex Energy Co. | |
| 7.125% 05/01/17 | | | | | 1,120,000 | | | | 1,114,400 | | |
| Compton Petroleum Corp. | |
| 7.625% 12/01/13 | | | | | 1,840,000 | | | | 1,800,900 | | |
| KCS Energy, Inc. | |
| 7.125% 04/01/12 | | | | | 1,400,000 | | | | 1,365,000 | | |
| Newfield Exploration Co. | |
| 6.625% 04/15/16 | | | | | 1,135,000 | | | | 1,081,088 | | |
| OPTI Canada, Inc. | |
| 8.250% 12/15/14 | | | | | 1,750,000 | | | | 1,802,500 | | |
| PetroHawk Energy Corp. | |
| 7.875% 06/01/15 (b) | | | | | 1,215,000 | | | | 1,213,481 | | |
| 9.125% 07/15/13 | | | | | 340,000 | | | | 353,600 | | |
| Pioneer Natural Resources Co. | |
| 5.875% 07/15/16 | | | | | 1,450,000 | | | | 1,333,591 | | |
| Quicksilver Resources, Inc. | |
| 7.125% 04/01/16 | | | | | 1,780,000 | | | | 1,735,500 | | |
| Range Resources Corp. | |
| 7.500% 05/15/16 | | | | | 1,115,000 | | | | 1,137,300 | | |
| Southwestern Energy Co. | |
| 7.500% 02/01/18 (b) | | | | | 2,430,000 | | | | 2,455,039 | | |
| | | | 18,076,555 | | |
See Accompanying Notes to Financial Statements.
12
Columbia High Yield Opportunity Fund
May 31, 2008
| Corporate Fixed-Income Bonds & Notes (continued) | |
| | | | | Par (a) | | Value ($) | |
| Oil Refining & Marketing – 0.7% | |
| Tesoro Corp. | |
| 6.625% 11/01/15 | | | | | 1,745,000 | | | | 1,603,218 | | |
| United Refining Co. | |
| 10.500% 08/15/12 | | | | | 1,295,000 | | | | 1,236,725 | | |
| | | | 2,839,943 | | |
| Oil & Gas Total | | | 21,893,298 | | |
| Oil & Gas Services – 0.2% | |
| Seismic Data Collection – 0.2% | |
| Seitel, Inc. | |
| 9.750% 02/15/14 | | | | | 880,000 | | | | 796,400 | | |
| | | | 796,400 | | |
| Oil & Gas Services Total | | | 796,400 | | |
| Pipelines – 2.0% | |
| Atlas Pipeline Partners LP | |
| 8.125% 12/15/15 | | | | | 990,000 | | | | 1,022,175 | | |
| El Paso Corp. | |
| 6.875% 06/15/14 | | | | | 1,670,000 | | | | 1,675,812 | | |
| 7.250% 06/01/18 | | | | | 1,960,000 | | | | 1,967,350 | | |
| Kinder Morgan Finance Co. ULC | |
| 5.700% 01/05/16 | | | | | 990,000 | | | | 916,987 | | |
| MarkWest Energy Partners LP | |
| 6.875% 11/01/14 | | | | | 1,070,000 | | | | 1,040,575 | | |
| 8.500% 07/15/16 | | | | | 745,000 | | | | 777,594 | | |
| Williams Companies, Inc. | |
| 6.375% 10/01/10 (b) | | | | | 500,000 | | | | 512,500 | | |
| | | | 7,912,993 | | |
| Pipelines Total | | | 7,912,993 | | |
| Energy Total | | | 36,481,991 | | |
| Financials – 7.0% | |
| Diversified Financial Services – 5.3% | |
| Finance-Auto Loans – 2.2% | |
| Ford Motor Credit Co. | |
| 7.800% 06/01/12 | | | | | 2,595,000 | | | | 2,295,892 | | |
| 8.000% 12/15/16 | | | | | 1,385,000 | | | | 1,162,741 | | |
| GMAC LLC | |
| 6.875% 09/15/11 | | | | | 2,050,000 | | | | 1,728,337 | | |
| 8.000% 11/01/31 (g) | | | | | 4,565,000 | | | | 3,497,160 | | |
| | | 8,684,130 | | |
| Investment Management/Advisor Service – 1.8% | |
| LVB Acquisition Merger Sub, Inc. | |
| 11.625% 10/15/17 (b) | | | | | 2,460,000 | | | | 2,607,600 | | |
PIK,
10.375% 10/15/17 (b) | | | | | 2,170,000 | | | | 2,311,050 | | |
| | | | | Par (a) | | Value ($) | |
| Nuveen Investments, Inc. | |
| 10.500% 11/15/15 (b) | | | | | 2,240,000 | | | | 2,105,600 | | |
| | | 7,024,250 | | |
| Special Purpose Entity – 1.3% | |
| FireKeepers Development Authority | |
| 13.875% 05/01/15 (b) | | | | | 875,000 | | | | 877,188 | | |
| Goldman Sachs Capital II | |
| 5.793% 12/29/49 (c) | | | | | 1,925,000 | | | | 1,446,181 | | |
| Targeted Return Index Securities Trust (TRAIN), | |
| Series HY-1-2006, | | | | | | | | | | | |
| 7.117% 05/01/16 (b)(c) | | | | | 2,760,000 | | | | 2,725,610 | | |
| | | | 5,048,979 | | |
| Diversified Financial Services Total | | | 20,757,359 | | |
| Insurance – 1.0% | |
| Insurance Brokers – 0.4% | |
| HUB International Holdings, Inc. | |
| 10.250% 06/15/15 (b) | | | | | 1,335,000 | | | | 987,900 | | |
| USI Holdings Corp. | |
| 9.750% 05/15/15 (b) | | | | | 905,000 | | | | 733,050 | | |
| | | 1,720,950 | | |
| Property/Casualty Insurance – 0.6% | |
| Asurion Corp. | |
| 9.198% 07/02/15 | | | | | 756,638 | | | | 702,412 | | |
| 9.284% 07/02/15 (c)(e) | | | | | 783,362 | | | | 727,221 | | |
| Crum & Forster Holdings Corp. | |
| 7.750% 05/01/17 | | | | | 860,000 | | | | 821,300 | | |
| | | | 2,250,933 | | |
| Insurance Total | | | 3,971,883 | | |
| Real Estate Investment Trusts (REITs) – 0.7% | |
| REITS-Hotels – 0.5% | |
| Host Marriott LP | |
| 6.750% 06/01/16 | | | | | 1,840,000 | | | | 1,784,800 | | |
| | | 1,784,800 | | |
| REITS-Regional Malls – 0.2% | |
| Rouse Co. LP/TRC Co-Issuer, Inc. | |
| 6.750% 05/01/13 (b) | | | | | 920,000 | | | | 823,871 | | |
| | | | 823,871 | | |
| Real Estate Investment Trusts (REITs) Total | | | 2,608,671 | | |
| Financials Total | | | 27,337,913 | | |
| Industrials – 12.2% | |
| Aerospace & Defense – 0.8% | |
| Aerospace/Defense-Equipment – 0.4% | |
| DRS Technologies, Inc. | |
| 6.875% 11/01/13 | | | | | 1,685,000 | | | | 1,722,913 | | |
| | | | 1,722,913 | | |
See Accompanying Notes to Financial Statements.
13
Columbia High Yield Opportunity Fund
May 31, 2008
| Corporate Fixed-Income Bonds & Notes (continued) | |
| | | | | Par (a) | | Value ($) | |
| Electronics-Military – 0.4% | |
| L-3 Communications Corp. | |
| 6.375% 10/15/15 | | | | | 1,395,000 | | | | 1,344,431 | | |
| | | 1,344,431 | | |
| Aerospace & Defense Total | | | 3,067,344 | | |
| Electrical Components & Equipment – 0.7% | |
| Wire & Cable Products – 0.7% | |
| Belden, Inc. | |
| 7.000% 03/15/17 | | | | | 1,675,000 | | | | 1,633,125 | | |
| General Cable Corp. | |
| 5.073% 04/01/15 (c) | | | | | 635,000 | | | | 568,325 | | |
| 7.125% 04/01/17 | | | | | 635,000 | | | | 619,125 | | |
| | | 2,820,575 | | |
| Electrical Components & Equipment Total | | | 2,820,575 | | |
| Electronics – 0.7% | |
| Electronic Components-Miscellaneous – 0.7% | |
| Flextronics International Ltd. | |
| 6.250% 11/15/14 | | | | | 735,000 | | | | 701,925 | | |
| 7.394% 10/01/14 (b)(e) | | | | | 725,944 | | | | 672,103 | | |
| 7.396% 10/01/14 (b)(e) | | | | | 46,958 | | | | 43,475 | | |
| 7.455% 10/01/14 (b)(e) | | | | | 222,098 | | | | 205,626 | | |
| NXP BV/NXP Funding LLC | |
| 9.500% 10/15/15 | | | | | 1,160,000 | | | | 1,094,750 | | |
| | | 2,717,879 | | |
| Electronics Total | | | 2,717,879 | | |
| Engineering & Construction – 0.3% | |
| Building & Construction-Miscellaneous – 0.3% | |
| Esco Corp. | |
| 8.625% 12/15/13 (b) | | | | | 945,000 | | | | 949,725 | | |
| | | 949,725 | | |
| Engineering & Construction Total | | | 949,725 | | |
| Environmental Control – 1.2% | |
| Non-Hazardous Waste Disposal – 0.7% | |
| Allied Waste North America, Inc. | |
| 7.125% 05/15/16 | | | | | 900,000 | | | | 884,250 | | |
| 7.875% 04/15/13 | | | | | 1,940,000 | | | | 1,983,650 | | |
| | | 2,867,900 | | |
| Recycling – 0.5% | |
| Aleris International, Inc. | |
| 10.000% 12/15/16 | | | | | 1,245,000 | | | | 893,288 | | |
PIK,
9.000% 12/15/14 | | | | | 1,155,000 | | | | 944,212 | | |
| | | 1,837,500 | | |
| Environmental Control Total | | | 4,705,400 | | |
| | | | | Par (a) | | Value ($) | |
| Hand/Machine Tools – 0.2% | |
| Machinery-Electrical – 0.2% | |
| Baldor Electric Co. | |
| 8.625% 02/15/17 | | | | | 915,000 | | | | 933,300 | | |
| | | 933,300 | | |
| Hand/Machine Tools Total | | | 933,300 | | |
| Machinery-Construction & Mining – 0.6% | |
| Terex Corp. | |
| 8.000% 11/15/17 | | | | | 2,345,000 | | | | 2,397,762 | | |
| | | 2,397,762 | | |
| Machinery-Construction & Mining Total | | | 2,397,762 | | |
| Machinery-Diversified – 0.7% | |
| Machinery-General Industry – 0.4% | |
| Manitowoc Co., Inc. | |
| 7.125% 11/01/13 | | | | | 1,520,000 | | | | 1,466,800 | | |
| | | 1,466,800 | | |
| Machinery-Material Handling – 0.3% | |
| Columbus McKinnon Corp. | |
| 8.875% 11/01/13 | | | | | 1,190,000 | | | | 1,246,525 | | |
| | | 1,246,525 | | |
| Machinery-Diversified Total | | | 2,713,325 | | |
| Miscellaneous Manufacturing – 2.1% | |
| Diversified Manufacturing Operators – 1.6% | |
| Bombardier, Inc. | |
| 6.300% 05/01/14 (b) | | | | | 1,981,000 | | | | 1,941,380 | | |
| 8.000% 11/15/14 (b) | | | | | 1,000,000 | | | | 1,050,000 | | |
| Koppers Holdings, Inc. | |
(d) 11/15/14
(9.875% 11/15/09) | | | | | 1,400,000 | | | | 1,288,000 | | |
| Trinity Industries, Inc. | |
| 6.500% 03/15/14 | | | | | 1,836,000 | | | | 1,808,460 | | |
| | | 6,087,840 | | |
| Miscellaneous Manufacturing – 0.5% | |
| American Railcar Industries, Inc. | |
| 7.500% 03/01/14 | | | | | 1,175,000 | | | | 1,098,625 | | |
| TriMas Corp. | |
| 9.875% 06/15/12 | | | | | 1,161,000 | | | | 1,079,730 | | |
| | | 2,178,355 | | |
| Miscellaneous Manufacturing Total | | | 8,266,195 | | |
| Packaging & Containers – 2.5% | |
| Containers-Metal/Glass – 1.4% | |
| Crown Americas LLC & Crown Americas Capital Corp. | |
| 7.750% 11/15/15 | | | | | 2,210,000 | | | | 2,320,500 | | |
See Accompanying Notes to Financial Statements.
14
Columbia High Yield Opportunity Fund
May 31, 2008
| Corporate Fixed-Income Bonds & Notes (continued) | |
| | | | | Par (a) | | Value ($) | |
| Owens-Brockway Glass Container, Inc. | |
| 8.250% 05/15/13 | | | | | 1,470,000 | | | | 1,521,450 | | |
| Owens-Illinois, Inc. | |
| 7.500% 05/15/10 | | | | | 1,480,000 | | | | 1,509,600 | | |
| | | 5,351,550 | | |
| Containers-Paper/Plastic – 1.1% | |
| Berry Plastics Holding Corp. | |
| 10.250% 03/01/16 | | | | | 1,520,000 | | | | 1,216,000 | | |
| Jefferson Smurfit Corp. | |
| 8.250% 10/01/12 | | | | | 1,705,000 | | | | 1,568,600 | | |
| Solo Cup Co. | |
| 8.500% 02/15/14 | | | | | 1,875,000 | | | | 1,668,750 | | |
| | | 4,453,350 | | |
| Packaging & Containers Total | | | 9,804,900 | | |
| Transportation – 2.4% | |
| Transportation-Marine – 0.9% | |
| Navios Maritime Holdings, Inc. | |
| 9.500% 12/15/14 | | | | | 1,805,000 | | | | 1,859,150 | | |
| Ship Finance International Ltd. | |
| 8.500% 12/15/13 | | | | | 1,155,000 | | | | 1,183,875 | | |
| Stena AB | |
| 7.500% 11/01/13 | | | | | 695,000 | | | | 695,000 | | |
| | | 3,738,025 | | |
| Transportation-Railroad – 0.5% | |
| TFM SA de CV | |
| 9.375% 05/01/12 | | | | | 1,755,000 | | | | 1,833,975 | | |
| | | 1,833,975 | | |
| Transportation-Services – 0.8% | |
| CHC Helicopter Corp. | |
| 7.375% 05/01/14 | | | | | 2,070,000 | | | | 2,095,875 | | |
| PHI, Inc. | |
| 7.125% 04/15/13 | | | | | 1,085,000 | | | | 1,047,025 | | |
| | | 3,142,900 | | |
| Transportation-Trucks – 0.2% | |
| QDI LLC | |
| 9.000% 11/15/10 | | | | | 990,000 | | | | 693,000 | | |
| | | 693,000 | | |
| Transportation Total | | | 9,407,900 | | |
| Industrials Total | | | 47,784,305 | | |
| Technology – 2.0% | |
| Computers – 0.8% | |
| Computer Services – 0.8% | |
| Sungard Data Systems, Inc. | |
| 9.125% 08/15/13 | | | | | 3,020,000 | | | | 3,110,600 | | |
| | | 3,110,600 | | |
| Computers Total | | | 3,110,600 | | |
| | | | | Par (a) | | Value ($) | |
| Semiconductors – 1.2% | |
| Electronic Components-Semiconductors – 1.2% | |
| Amkor Technology, Inc. | |
| 9.250% 06/01/16 | | | | | 1,190,000 | | | | 1,181,075 | | |
| Freescale Semiconductor, Inc. | |
PIK,
9.125% 12/15/14 | | | | | 4,220,000 | | | | 3,618,650 | | |
| | | 4,799,725 | | |
| Semiconductors Total | | | 4,799,725 | | |
| Technology Total | | | 7,910,325 | | |
| Utilities – 7.3% | |
| Electric – 6.9% | |
| Electric-Generation – 2.0% | |
| AES Corp. | |
| 7.750% 03/01/14 | | | | | 1,460,000 | | | | 1,460,000 | | |
| 8.000% 10/15/17 | | | | | 855,000 | | | | 858,206 | | |
| Edison Mission Energy | |
| 7.000% 05/15/17 | | | | | 2,225,000 | | | | 2,174,938 | | |
| Intergen NV | |
| 9.000% 06/30/17 (b) | | | | | 3,225,000 | | | | 3,386,250 | | |
| | | 7,879,394 | | |
| Electric-Integrated – 2.2% | |
| CMS Energy Corp. | |
| 6.875% 12/15/15 | | | | | 1,200,000 | | | | 1,191,502 | | |
| Energy Future Holdings Corp. | |
| 10.875% 11/01/17 (b) | | | | | 1,970,000 | | | | 2,053,725 | | |
| Texas Competitive Electric Holdings Co., | |
PIK,
10.500% 11/01/16 (b) | | | | | 5,450,000 | | | | 5,504,500 | | |
| | | 8,749,727 | | |
| Independent Power Producer – 2.7% | |
| Dynegy Holdings, Inc. | |
| 7.125% 05/15/18 | | | | | 2,450,000 | | | | 2,260,125 | | |
| 7.750% 06/01/19 | | | | | 800,000 | | | | 758,000 | | |
| Mirant North America LLC | |
| 7.375% 12/31/13 | | | | | 1,225,000 | | | | 1,234,188 | | |
| NRG Energy, Inc. | |
| 7.250% 02/01/14 | | | | | 960,000 | | | | 940,800 | | |
| 7.375% 02/01/16 | | | | | 1,065,000 | | | | 1,038,375 | | |
| 7.375% 01/15/17 | | | | | 1,495,000 | | | | 1,461,362 | | |
| NSG Holdings LLC/NSG Holdings, Inc. | |
| 7.750% 12/15/25 (b) | | | | | 1,535,000 | | | | 1,515,812 | | |
| Reliant Energy, Inc. | |
| 7.875% 06/15/17 | | | | | 1,180,000 | | | | 1,185,900 | | |
| | | 10,394,562 | | |
| Electric Total | | | 27,023,683 | | |
See Accompanying Notes to Financial Statements.
15
Columbia High Yield Opportunity Fund
May 31, 2008
| Corporate Fixed-Income Bonds & Notes (continued) | |
| | | | | Par (a) | | Value ($) | |
| Independent Power Producers – 0.4% | |
| Electric-Integrated – 0.4% | |
| Mirant Americas Generation LLC | |
| 8.500% 10/01/21 | | | | | 1,575,000 | | | | 1,519,875 | | |
| | | 1,519,875 | | |
| Independent Power Producers Total | | | 1,519,875 | | |
| Utilities Total | | | 28,543,558 | | |
Total Corporate Fixed-Income Bonds & Notes
(Cost of $375,829,693) | | | 355,767,330 | | |
| Municipal Bonds – 1.2% | |
| California – 0.9% | |
| CA Cabazon Band Mission Indians | |
| 13.000% 10/01/11 | | | | | 3,250,000 | | | | 3,413,833 | | |
| California Total | | | 3,413,833 | | |
| Virginia – 0.3% | |
| VA Tobacco Settlement Financing Corp. | |
| Series 2007 A1, | | | | | | | | | | | |
| 6.706% 06/01/46 | | | | | 1,565,000 | | | | 1,351,847 | | |
| Virginia Total | | | 1,351,847 | | |
Total Municipal Bonds
(Cost of $4,156,557) | | | 4,765,680 | | |
| Common Stocks – 0.3% | |
| | | | | Shares | | | |
| Consumer Discretionary – 0.3% | |
| Hotels, Restaurants & Leisure – 0.1% | |
| Town Sports International | |
| Holdings, Inc. (i) | | | | | 31,000 | | | | 258,230 | | |
| Hotels, Restaurants & Leisure Total | | | 258,230 | | |
| Media – 0.2% | |
| Idearc, Inc. | | | | | 35,000 | | | | 140,700 | | |
| Spanish Broadcasting System (i) | | | | | 210,000 | | | | 296,100 | | |
| Warner Music Group Corp. | | | | | 35,000 | | | | 314,650 | | |
| Media Total | | | 751,450 | | |
| Consumer Discretionary Total | | | 1,009,680 | | |
| Industrials – 0.0% | |
| Commercial Services & Supplies – 0.0% | |
| Fairlane Management Corp. (h)(j) | | | | | 50,004 | | | | – | | |
| Commercial Services & Supplies Total | | | – | | |
| | | | | Shares | | Value ($) | |
| Road & Rail – 0.0% | |
| Quality Distribution, Inc. (i) | | | | | 13,439 | | | | 47,036 | | |
| Road & Rail Total | | | 47,036 | | |
| Industrials Total | | | 47,036 | | |
| Materials – 0.0% | |
| Metals & Mining – 0.0% | |
| Ormet Corp. (i) | | | | | 380 | | | | 2,892 | | |
| Metals & Mining Total | | | 2,892 | | |
| Materials Total | | | 2,892 | | |
Total Common Stocks
(Cost of $2,997,699) | | | 1,059,608 | | |
| Preferred Stock – 0.0% | |
| Communications – 0.0% | |
| Media – 0.0% | |
| PTV Inc. | |
Series A,
10.000% 01/10/23 | | | | | 18 | | | | 8 | | |
| Media Total | | | 8 | | |
| Communications Total | | | 8 | | |
Total Preferred Stock
(Cost of $-) | | | 8 | | |
| Warrants – 0.0% | |
| | | | | Units | | | |
| Communications – 0.0% | |
| Media – 0.0% | |
| Broadcast Services/Programs – 0.0% | |
| XM Satellite Radio Holdings, Inc. | |
| Expires 03/15/10 (b)(i) | | | | | 2,435 | | | | 3,653 | | |
| | | 3,653 | | |
| Media Total | | | 3,653 | | |
| Telecommunication Services – 0.0% | |
| Jazztel PLC | |
| Expires 07/15/10 (h)(j) | | | | | 1,435 | | | | – | | |
| | | – | | |
| Telecommunication Services Total | | | – | | |
| Communications Total | | | 3,653 | | |
See Accompanying Notes to Financial Statements.
16
Columbia High Yield Opportunity Fund
May 31, 2008
| Warrants (continued) | |
| | | | | Units | | Value ($) | |
| Consumer Non-Cyclical – 0.0% | |
| Food – 0.0% | |
| Food-Retail – 0.0% | |
| Pathmark Stores Inc. | |
| Expires 09/19/10 (h)(i) | | | | | 58,758 | | | | 4,705 | | |
| | | 4,705 | | |
| Food Total | | | 4,705 | | |
| Consumer Non-Cyclical Total | | | 4,705 | | |
Total Warrants
(Cost of $7,581,497) | | | 8,358 | | |
| Short-Term Obligation – 6.0% | |
| | | | | Par (a) | | | |
Repurchase agreement with
Fixed Income Clearing Corp.,
dated 05/30/08, due 06/02/08
at 2.130%, collateralized by a
U.S. Government Agency
Obligation maturing
07/17/13, market value
$23,797,069 (repurchase
pr oceeds $23,332,141) | | | | | 23,328,000 | | | | 23,328,000 | | |
Total Short-Term Obligation
(Cost of $23,328,000) | | | 23,328,000 | | |
Total Investments – 98.7%
(Cost of $413,893,446) (k) | | | 384,928,984 | | |
| Other Assets & Liabilities, Net – 1.3% | | | 5,100,623 | | |
| Net Assets – 100.0% | | | 390,029,607 | | |
Notes to Investment Portfolio:
(a) Principal amount is stated in U.S. dollars unless otherwise noted.
(b) Security exempt from registration pursuant to Rule 144A under the Securities Act of 1933. These securities may be resold in transactions exempt from registration, normally to qualified institutional buyers. At May 31, 2008, these securities, which are not illiquid except for those in the following table, amounted to $77,617,137, which represents 19.9% of net assets.
| Security | | Acquisition
Date | | Par/Units | | Cost | | Value | |
| Ace Cash | | | | | | | | | | | | |
| | |
| Express, Inc. | | | | | | | | | | | | |
| | |
| 10.250% 10/01/14 | | 09/26/06 - | | $ | 1,025,000 | | | $ | 1,034,225 | | | $ | 794,375 | | |
| | | 09/27/06 | | | | | | | | | | | | | |
Hayes Lemmerz
Finance Luxembourg SA
8.250% 06/15/15 | | 05/30/07 | | EUR | | 1,290,000 | | | 1,747,859 | | | | 1,706,883 | | |
Local TV Finance LLC
9.250% 06/15/15 | | 05/07/07 | | | 930,000 | | | | 933,182 | | | | 748,650 | | |
Orascom Telecom
Finance SCA
7.875% 02/08/14 | | 02/01/07 | | | 855,000 | | | | 855,000 | | | | 818,663 | | |
| Seminole Indian | | | | | | | | | | | | |
| | |
| Tribe of Florida | | | | | | | | | | | | |
| | |
| 7.804% 10/01/20 | | 09/26/07 - | | | 2,000,000 | | | | 2,028,200 | | | | 1,919,960 | | |
| | | 10/04/07 | | | | | | | | | | | | | |
XM Satellite Radio
Holdings, Inc.
Expires 03/15/10 | | 10/21/02 | | | 2,435 | | | | 300,101 | | | | 3,653 | | |
| | | | | | | $ | 5,992,184 | | |
(c) The interest rate shown on floating rate or variable rate securities reflects the rate at May 31, 2008.
(d) Step bond. This security is currently not paying coupon. Shown parenthetically is the next coupon rate to be paid and the date the security will begin accruing at this rate.
(e) Loan participation agreement.
(f) The issuer has filed for bankruptcy protection under Chapter 11, and is in default of certain debt covenants. Income is not being accrued. At May 31, 2008, the value of this security amounted to $586,500, which represents 0.2% of net assets.
(g) A portion of this security is pledged as collateral for credit default swaps. At May 31, 2008, the value of this security amounted to $1,340,642, which represents 0.3% of net assets.
(h) Represents fair value as determined in good faith under procedures approved by the Board of Trustees.
(i) Non-income producing
(j) Security has no value.
(k) Cost for federal income tax purposes is $414,711,338.
See Accompanying Notes to Financial Statements.
17
Columbia High Yield Opportunity Fund
May 31, 2008
Credit default swaps outstanding on May 31, 2008 are:
Swap
Counterparty | | Reference
Obligation | | Buy/Sell
Protection | |
Fixed Rate | | Expiration
Date | | Notional
Amount | | Net Unrealized
Depreciation | |
| Morgan Stanley | | | Ford Motor Co., | | | | | | | | | | | | | | | | | |
| | |
| | | | 7.45% 07/16/31 | | | Sell | | | 3.000 | % | | | 06/20/09 | | | $ | 1,750,000 | | | $ | (67,808 | ) | |
Forward foreign currency exchange contracts outstanding on May 31, 2008 are:
Forward Currency
Contracts to Sell | |
Value | | Aggregate
Face Value | | Settlement
Date | | Unrealized
Appreciation | |
| EUR | | $ | 2,478,305 | | | $ | 2,501,598 | | | 06/27/08 | | $ | 23,293 | | |
| EUR | | | 3,029,480 | | | | 3,044,174 | | | 06/30/08 | | | 14,694 | | |
| | | $ | 37,987 | | |
At May 31, 2008, the asset allocation of the Fund is as follows:
| Asset Allocation | | % of
Net Assets | |
| Corporate Fixed-Income Bonds & Notes | | | 91.2 | | |
| Municipal Bonds | | | 1.2 | | |
| Common Stocks | | | 0.3 | | |
| Preferred Stock | | | — | * | |
| Warrants | | | — | * | |
| | | | 92.7 | | |
| Short-Term Obligation | | | 6.0 | | |
| Other Assets & Liabilities, Net | | | 1.3 | | |
| | | | 100.0 | | |
* Rounds to less than 0.01%.
| Acronym | | Name | |
| | EUR | | | Euro | |
|
| | PIK | | | Payment-In-Kind | |
|
See Accompanying Notes to Financial Statements.
18
Statement of Assets and Liabilities – Columbia High Yield Opportunity Fund
May 31, 2008
| | | | | ($) | |
| Assets | | Investments, at cost | | | 413,893,446 | | |
| | | Investments, at value | | | 384,928,984 | | |
| | | Cash | | | 913,875 | | |
| | | Cash collateral for swap contracts | | | 9,995 | | |
| | | Unrealized appreciation on forward foreign currency exchange contracts | | | 37,987 | | |
| | | Receivable for: | | | | | |
| | | Fund shares sold | | | 765,761 | | |
| | | Interest | | | 8,340,756 | | |
| | | Expense reimbursement due from Investment Advisor | | | 19,549 | | |
| | | Trustees' deferred compensation plan | | | 63,180 | | |
| | | Other assets | | | 11,352 | | |
| | | Total Assets | | | 395,091,439 | | |
| Liabilities | | Unrealized depreciation on swap contracts | | | 67,808 | | |
| | | Payable for: | | | | | |
| | | Investments purchased | | | 2,194,946 | | |
| | | Fund shares repurchased | | | 808,933 | | |
| | | Distributions | | | 1,259,678 | | |
| | | Investment advisory fee | | | 203,006 | | |
| | | Transfer agent fee | | | 70,730 | | |
| | | Pricing and bookkeeping fees | | | 14,746 | | |
| | | Merger expense | | | 75,070 | | |
| | | Trustees' fees | | | 3,526 | | |
| | | Custody fee | | | 3,364 | | |
| | | Distribution and service fees | | | 108,912 | | |
| | | Chief compliance officer expenses | | | 103 | | |
| | | Trustees' deferred compensation plan | | | 63,180 | | |
| | | Other liabilities | | | 187,830 | | |
| | | Total Liabilities | | | 5,061,832 | | |
| | | Net Assets | | | 390,029,607 | | |
| Net Assets Consist of | | Paid-in capital | | | 815,684,947 | | |
| | | Overdistributed net investment income | | | (445,618 | ) | |
| | | Accumulated net realized loss | | | (396,215,436 | ) | |
| | | Net unrealized appreciation (depreciation) on: | | | | | |
| | | Investments | | | (28,964,462 | ) | |
| | | Foreign currency translations | | | 37,984 | | |
| | | Swap contracts | | | (67,808 | ) | |
| | | Net Assets | | | 390,029,607 | | |
| Class A | | Net assets | | | 205,330,154 | | |
| | | Shares outstanding | | | 49,255,827 | | |
| | | Net asset value per share | | | 4.17 | (a) | |
| | | Maximum sales charge | | | 4.75 | % | |
| | | Maximum offering price per share ($4.17/0.9525) | | | 4.38 | (b) | |
| Class B | | Net assets | | | 46,732,177 | | |
| | | Shares outstanding | | | 11,210,010 | | |
| | | Net asset value and offering price per share | | | 4.17 | (a) | |
| Class C | | Net assets | | | 15,202,013 | | |
| | | Shares outstanding | | | 3,646,709 | | |
| | | Net asset value and offering price per share | | | 4.17 | (a) | |
| Class Z | | Net assets | | | 122,765,263 | | |
| | | Shares outstanding | | | 29,450,167 | | |
| | | Net asset value, offering and redemption price per share | | | 4.17 | | |
(a) Redemption price per share is equal to net asset value less any applicable contingent deferred sales charge.
(b) On sales of $50,000 or more the offering price is reduced.
See Accompanying Notes to Financial Statements.
19
Statement of Operations – Columbia High Yield Opportunity Fund
For the Year Ended May 31, 2008
| | | | | ($) | |
| Investment Income | | Dividends | | | 114,068 | | |
| | | Interest | | | 30,294,430 | | |
| | | Total Investment Income | | | 30,408,498 | | |
| Expenses | | Investment advisory fee | | | 2,186,530 | | |
| | | Distribution fee: | | | | | |
| | | Class B | | | 477,680 | | |
| | | Class C | | | 130,557 | | |
| | | Service fee: | | | | | |
| | | Class A | | | 575,279 | | |
| | | Class B | | | 159,412 | | |
| | | Class C | | | 43,579 | | |
| | | Transfer agent fee | | | 516,797 | | |
| | | Pricing and bookkeeping fees | | | 123,138 | | |
| | | Trustees' fees | | | 35,437 | | |
| | | Custody fee | | | 18,488 | | |
| | | Merger expenses | | | 75,070 | | |
| | | Chief compliance officer expenses | | | 978 | | |
| | | Other expenses | | | 269,727 | | |
| | | Expenses before interest expense | | | 4,612,672 | | |
| | | Interest expense | | | 5,299 | | |
| | | Total Expenses | | | 4,617,971 | | |
| | | Fees and expenses waived or reimbursed by Investment Advisor | | | (19,549 | ) | |
| | | Fees waived by Distributor—Class C | | | (25,966 | ) | |
| | | Expense reductions | | | (12,252 | ) | |
| | | Net Expenses | | | 4,560,204 | | |
| | | Net Investment Income | | | 25,848,294 | | |
| Net Realized and Unrealized Gain (Loss) on Investments, Foreign Currency and Swap Contracts | |
| | | Net realized loss on: | | | | | |
| | | Investments | | | (13,512,757 | ) | |
| | | Foreign currency transactions | | | (765,558 | ) | |
| | | Swap contracts | | | (559,294 | ) | |
| | | Net realized loss | | | (14,837,609 | ) | |
| | | Net change in unrealized appreciation (depreciation) on: | | | | | |
| | | Investments | | | (28,033,203 | ) | |
| | | Foreign currency translations | | | 22,140 | | |
| | | Swap contracts | | | (7,758 | ) | |
| | | Net change in unrealized depreciation | | | (28,018,821 | ) | |
| | | Net Loss | | | (42,856,430 | ) | |
| | | Net Decrease Resulting from Operations | | | (17,008,136 | ) | |
See Accompanying Notes to Financial Statements.
20
Statement of Changes in Net Assets – Columbia High Yield Opportunity Fund
| | | | | Year Ended May 31, | |
| Increase (Decrease) in Net Assets | | | | 2008 ($) | | 2007 ($) | |
| Operations | | Net investment income | | | 25,848,294 | | | | 28,522,454 | | |
| | | Net realized gain (loss) on investments,
foreign currency transactions and swap contracts | | | (14,837,609 | ) | | | 4,095,745 | | |
| | | Net change in unrealized appreciation
(depreciation) on investments, foreign currency
translations and swap contracts | | | (28,018,821 | ) | | | 17,295,074 | | |
| | | Net Increase (Decrease) Resulting from Operations | | | (17,008,136 | ) | | | 49,913,273 | | |
| Distributions to Shareholders | | From net investment income: | | | | | | | | | |
| | | Class A | | | (16,611,706 | ) | | | (19,766,228 | ) | |
| | | Class B | | | (4,128,494 | ) | | | (7,472,305 | ) | |
| | | Class C | | | (1,155,259 | ) | | | (1,512,712 | ) | |
| | | Class Z | | | (3,948,285 | ) | | | (939,055 | ) | |
| | | Total Distributions to Shareholders | | | (25,843,744 | ) | | | (29,690,300 | ) | |
| Share Transactions | | Class A | | | | | | | | | |
| | | Subscriptions | | | 54,352,652 | | | | 67,069,977 | | |
| | | Distributions reinvested | | | 8,972,971 | | | | 9,857,418 | | |
| | | Redemptions | | | (99,550,216 | ) | | | (65,163,606 | ) | |
| | | Net Increase (Decrease) | | | (36,224,593 | ) | | | 11,763,789 | | |
| | | Class B | | | | | | | | | |
| | | Subscriptions | | | 2,244,545 | | | | 3,505,305 | | |
| | | Distributions reinvested | | | 2,195,896 | | | | 3,800,111 | | |
| | | Redemptions | | | (37,589,715 | ) | | | (58,815,624 | ) | |
| | | Net Decrease | | | (33,149,274 | ) | | | (51,510,208 | ) | |
| | | Class C | | | | | | | | | |
| | | Subscriptions | | | 1,248,070 | | | | 2,101,755 | | |
| | | Distributions reinvested | | | 669,392 | | | | 847,315 | | |
| | | Redemptions | | | (5,562,715 | ) | | | (5,939,859 | ) | |
| | | Net Decrease | | | (3,645,253 | ) | | | (2,990,789 | ) | |
| | | Class Z | | | | | | | | | |
| | | Subscriptions | | | 45,506,444 | | | | 19,596,687 | | |
| | | Proceeds received in connection with merger | | | 64,553,210 | | | | — | | |
| | | Distributions reinvested | | | 801,915 | | | | 599,655 | | |
| | | Redemptions | | | (14,982,007 | ) | | | (2,769,706 | ) | |
| | | Net Increase | | | 95,879,562 | | | | 17,426,636 | | |
| | | Net Increase (Decrease) from Share Transactions | | | 22,860,442 | | | | (25,310,572 | ) | |
| | | Total Decrease in Net Assets | | | (19,991,438 | ) | | | (5,087,599 | ) | |
| Net Assets | | Beginning of period | | | 410,021,045 | | | | 415,108,644 | | |
| | | End of period | | | 390,029,607 | | | | 410,021,045 | | |
| | | Overdistributed net investment income at end of period | | | (445,618 | ) | | | (439,691 | ) | |
See Accompanying Notes to Financial Statements.
21
Statement of Changes in Net Assets (continued) – Columbia High Yield Opportunity Fund
| | | | | Year Ended May 31, | |
| | | | | 2008 | | 2007 | |
| Changes in Shares | | Class A | | | | | | | | | |
| | | Subscriptions | | | 12,299,836 | | | | 14,781,112 | | |
| | | Issued for distributions reinvested | | | 2,077,408 | | | | 2,148,011 | | |
| | | Redemptions | | | (22,488,918 | ) | | | (14,211,150 | ) | |
| | | Net Increase (Decrease) | | | (8,111,674 | ) | | | 2,717,973 | | |
| | | Class B | | | | | | | | | |
| | | Subscriptions | | | 503,592 | | | | 763,602 | | |
| | | Issued for distributions reinvested | | | 506,374 | | | | 830,478 | | |
| | | Redemptions | | | (8,601,692 | ) | | | (12,847,202 | ) | |
| | | Net Decrease | | | (7,591,726 | ) | | | (11,253,122 | ) | |
| | | Class C | | | | | | | | | |
| | | Subscriptions | | | 285,522 | | | | 457,969 | | |
| | | Issued for distributions reinvested | | | 154,770 | | | | 184,764 | | |
| | | Redemptions | | | (1,275,290 | ) | | | (1,295,605 | ) | |
| | | Net Decrease | | | (834,998 | ) | | | (652,872 | ) | |
| | | Class Z | | | | | | | | | |
| | | Subscriptions | | | 10,621,856 | | | | 4,176,173 | | |
| | | Issued in connection with merger | | | 16,005,215 | | | | — | | |
| | | Issued for distributions reinvested | | | 187,362 | | | | 130,624 | | |
| | | Redemptions | | | (3,554,231 | ) | | | (605,621 | ) | |
| | | Net Increase | | | 23,260,202 | | | | 3,701,176 | | |
See Accompanying Notes to Financial Statements.
22
Financial Highlights – Columbia High Yield Opportunity Fund
Selected data for a share outstanding throughout each period is as follows:
| | | Year Ended May 31, | |
| Class A Shares | | 2008 | | 2007 | | 2006 | | 2005 | | 2004 | |
| Net Asset Value, Beginning of Period | | $ | 4.72 | | | $ | 4.50 | | | $ | 4.56 | | | $ | 4.54 | | | $ | 4.30 | | |
| Income from Investment Operations: | |
| Net investment income (a) | | | 0.31 | | | | 0.33 | | | | 0.33 | | | | 0.35 | | | | 0.35 | | |
Net realized and unrealized gain (loss) on investments,
foreign currency and swap contracts | | | (0.55 | ) | | | 0.23 | | | | (0.03 | ) | | | 0.05 | | | | 0.21 | | |
| Total from Investment Operations | | | (0.24 | ) | | | 0.56 | | | | 0.30 | | | | 0.40 | | | | 0.56 | | |
| Less Distributions to Shareholders: | |
| From net investment income | | | (0.31 | ) | | | (0.34 | ) | | | (0.36 | ) | | | (0.38 | ) | | | (0.32 | ) | |
| Net Asset Value, End of Period | | $ | 4.17 | | | $ | 4.72 | | | $ | 4.50 | | | $ | 4.56 | | | $ | 4.54 | | |
| Total return (b) | | | (5.03 | )%(c) | | | 12.98 | % | | | 6.70 | %(c) | | | 8.93 | %(d) | | | 13.30 | %(c) | |
| Ratios to Average Net Assets/Supplemental Data: | |
| Net expenses before interest expense (e) | | | 1.13 | % | | | 1.12 | % | | | 1.12 | % | | | 1.15 | % | | | 1.19 | % | |
| Interest expense | | | — | %(f) | | | — | %(f) | | | — | | | | — | | | | — | | |
| Net expenses (e) | | | 1.13 | % | | | 1.12 | % | | | 1.12 | % | | | 1.15 | % | | | 1.19 | % | |
| Waiver/Reimbursement | | | 0.01 | % | | | — | | | | 0.02 | % | | | — | | | | 0.01 | % | |
| Net investment income (e) | | | 7.23 | % | | | 7.19 | % | | | 7.28 | % | | | 7.55 | % | | | 7.65 | % | |
| Portfolio turnover rate | | | 50 | % | | | 75 | % | | | 61 | % | | | 67 | % | | | 75 | % | |
| Net assets, end of period (000's) | | $ | 205,330 | | | $ | 270,866 | | | $ | 245,713 | | | $ | 273,104 | | | $ | 325,658 | | |
(a) Per share data was calculated using the average shares outstanding during the period.
(b) Total return at net asset value assuming all distributions reinvested and no initial sales charge or contingent deferred sales charge.
(c) Had the investment advisor and/or any of its affiliates not waived fees or reimbursed a portion of expenses, total return would have been reduced.
(d) Total return includes a voluntary reimbursement by the investment advisor for a realized investment loss. This reimbursement had an impact of less than 0.01% on the Fund's total return.
(e) The benefits derived from expense reductions had an impact of less than 0.01%.
(f) Rounds to less than 0.01%.
See Accompanying Notes to Financial Statements.
23
Financial Highlights – Columbia High Yield Opportunity Fund
Selected data for a share outstanding throughout each period is as follows:
| | | Year Ended May 31, | |
| Class B Shares | | 2008 | | 2007 | | 2006 | | 2005 | | 2004 | |
| Net Asset Value, Beginning of Period | | $ | 4.72 | | | $ | 4.50 | | | $ | 4.56 | | | $ | 4.54 | | | $ | 4.30 | | |
| Income from Investment Operations: | |
| Net investment income (a) | | | 0.28 | | | | 0.29 | | | | 0.30 | | | | 0.32 | | | | 0.31 | | |
Net realized and unrealized gain (loss) on investments,
foreign currency and swap contracts | | | (0.55 | ) | | | 0.24 | | | | (0.04 | ) | | | 0.05 | | | | 0.22 | | |
| Total from Investment Operations | | | (0.27 | ) | | | 0.53 | | | | 0.26 | | | | 0.37 | | | | 0.53 | | |
| Less Distributions to Shareholders: | |
| From net investment income | | | (0.28 | ) | | | (0.31 | ) | | | (0.32 | ) | | | (0.35 | ) | | | (0.29 | ) | |
| Net Asset Value, End of Period | | $ | 4.17 | | | $ | 4.72 | | | $ | 4.50 | | | $ | 4.56 | | | $ | 4.54 | | |
| Total return (b) | | | (5.73 | )%(c) | | | 12.15 | % | | | 5.91 | %(c) | | | 8.13 | %(d) | | | 12.46 | %(c) | |
| Ratios to Average Net Assets/Supplemental Data: | |
| Net expenses before interest expense (e) | | | 1.88 | % | | | 1.87 | % | | | 1.87 | % | | | 1.90 | % | | | 1.94 | % | |
| Interest expense | | | — | %(f) | | | — | %(f) | | | — | | | | — | | | | — | | |
| Net expenses (e) | | | 1.88 | % | | | 1.87 | % | | | 1.87 | % | | | 1.90 | % | | | 1.94 | % | |
| Waiver/Reimbursement | | | 0.01 | % | | | — | | | | 0.02 | % | | | — | | | | 0.01 | % | |
| Net investment income (e) | | | 6.47 | % | | | 6.46 | % | | | 6.55 | % | | | 6.80 | % | | | 6.90 | % | |
| Portfolio turnover rate | | | 50 | % | | | 75 | % | | | 61 | % | | | 67 | % | | | 75 | % | |
| Net assets, end of period (000's) | | $ | 46,732 | | | $ | 88,774 | | | $ | 135,122 | | | $ | 194,460 | | | $ | 252,415 | | |
(a) Per share data was calculated using the average shares outstanding during the period.
(b) Total return at net asset value assuming all distributions reinvested and no contingent deferred sales charge.
(c) Had the investment advisor and/or any of its affiliates not waived fees or reimbursed a portion of expenses, total return would have been reduced.
(d) Total return includes a voluntary reimbursement by the investment advisor for a realized investment loss. This reimbursement had an impact of less than 0.01% on the Fund's total return.
(e) The benefits derived from expense reductions had an impact of less than 0.01%.
(f) Rounds to less than 0.01%.
See Accompanying Notes to Financial Statements.
24
Financial Highlights – Columbia High Yield Opportunity Fund
Selected data for a share outstanding throughout each period is as follows:
| | | Year Ended May 31, | |
| Class C Shares | | 2008 | | 2007 | | 2006 | | 2005 | | 2004 | |
| Net Asset Value, Beginning of Period | | $ | 4.72 | | | $ | 4.50 | | | $ | 4.56 | | | $ | 4.54 | | | $ | 4.30 | | |
| Income from Investment Operations: | |
| Net investment income (a) | | | 0.29 | | | | 0.30 | | | | 0.31 | | | | 0.33 | | | | 0.32 | | |
Net realized and unrealized gain (loss) on investments,
foreign currency and swap contracts | | | (0.55 | ) | | | 0.23 | | | | (0.04 | ) | | | 0.04 | | | | 0.21 | | |
| Total from Investment Operations | | | (0.26 | ) | | | 0.53 | | | | 0.27 | | | | 0.37 | | | | 0.53 | | |
| Less Distributions to Shareholders: | |
| From net investment income | | | (0.29 | ) | | | (0.31 | ) | | | (0.33 | ) | | | (0.35 | ) | | | (0.29 | ) | |
| Net Asset Value, End of Period | | $ | 4.17 | | | $ | 4.72 | | | $ | 4.50 | | | $ | 4.56 | | | $ | 4.54 | | |
| Total return (b)(c) | | | (5.59 | )% | | | 12.31 | % | | | 6.07 | % | | | 8.29 | %(d) | | | 12.63 | % | |
| Ratios to Average Net Assets/Supplemental Data: | |
| Net expenses before interest expense (e) | | | 1.73 | % | | | 1.72 | % | | | 1.72 | % | | | 1.75 | % | | | 1.79 | % | |
| Interest expense | | | — | %(f) | | | — | %(f) | | | — | | | | — | | | | — | | |
| Net expenses (e) | | | 1.73 | % | | | 1.72 | % | | | 1.72 | % | | | 1.75 | % | | | 1.79 | % | |
| Waiver/Reimbursement | | | 0.16 | % | | | 0.15 | % | | | 0.17 | % | | | 0.15 | % | | | 0.16 | % | |
| Net investment income (e) | | | 6.63 | % | | | 6.60 | % | | | 6.70 | % | | | 6.95 | % | | | 7.05 | % | |
| Portfolio turnover rate | | | 50 | % | | | 75 | % | | | 61 | % | | | 67 | % | | | 75 | % | |
| Net assets, end of period (000's) | | $ | 15,202 | | | $ | 21,161 | | | $ | 23,084 | | | $ | 30,366 | | | $ | 46,322 | | |
(a) Per share data was calculated using the average shares outstanding during the period.
(b) Total return at net asset value assuming all distributions reinvested and no contingent deferred sales charge.
(c) Had the investment advisor and/or any of its affiliates not waived fees or reimbursed a portion of expenses, total return would have been reduced.
(d) Total return includes a voluntary reimbursement by the investment advisor for a realized investment loss. This reimbursement had an impact of less than 0.01% on the Fund's total return.
(e) The benefits derived from expense reductions had an impact of less than 0.01%.
(f) Rounds to less than 0.01%.
See Accompanying Notes to Financial Statements.
25
Financial Highlights – Columbia High Yield Opportunity Fund
Selected data for a share outstanding throughout each period is as follows:
| | | Year Ended May 31, | |
| Class Z Shares | | 2008 | | 2007 | | 2006 | | 2005 | | 2004 | |
| Net Asset Value, Beginning of Period | | $ | 4.72 | | | $ | 4.50 | | | $ | 4.56 | | | $ | 4.54 | | | $ | 4.30 | | |
| Income from Investment Operations: | |
| Net investment income (a) | | | 0.31 | | | | 0.34 | | | | 0.34 | | | | 0.37 | | | | 0.36 | | |
Net realized and unrealized gain (loss) on investments,
foreign currency and swap contracts | | | (0.54 | ) | | | 0.23 | | | | (0.03 | ) | | | 0.04 | | | | 0.21 | | |
| Total from Investment Operations | | | (0.23 | ) | | | 0.57 | | | | 0.31 | | | | 0.41 | | | | 0.57 | | |
| Less Distributions to Shareholders: | |
| From net investment income | | | (0.32 | ) | | | (0.35 | ) | | | (0.37 | ) | | | (0.39 | ) | | | (0.33 | ) | |
| Net Asset Value, End of Period | | $ | 4.17 | | | $ | 4.72 | | | $ | 4.50 | | | $ | 4.56 | | | $ | 4.54 | | |
| Total return (b) | | | (4.79 | )%(c) | | | 13.26 | % | | | 6.97 | %(c) | | | 9.21 | %(d) | | | 13.58 | %(c) | |
| Ratios to Average Net Assets/Supplemental Data: | |
| Net expenses before interest expense (e) | | | 0.88 | % | | | 0.87 | % | | | 0.87 | % | | | 0.90 | % | | | 0.94 | % | |
| Interest expense | | | — | %(f) | | | — | %(f) | | | — | | | | — | | | | — | | |
| Net expenses (e) | | | 0.88 | % | | | 0.87 | % | | | 0.87 | % | | | 0.90 | % | | | 0.94 | % | |
| Waiver/Reimbursement | | | 0.01 | % | | | — | | | | 0.02 | % | | | — | | | | 0.01 | % | |
| Net investment income (e) | | | 7.47 | % | | | 7.44 | % | | | 7.53 | % | | | 7.80 | % | | | 7.92 | % | |
| Portfolio turnover rate | | | 50 | % | | | 75 | % | | | 61 | % | | | 67 | % | | | 75 | % | |
| Net assets, end of period (000's) | | $ | 122,766 | | | $ | 29,220 | | | $ | 11,190 | | | $ | 12,829 | | | $ | 14,194 | | |
(a) Per share data was calculated using the average shares outstanding during the period.
(b) Total return at net asset value assuming all distributions reinvested.
(c) Had the investment advisor and/or any of its affiliates not waived fees or reimbursed a portion of expenses, total return would have been reduced.
(d) Total return includes a voluntary reimbursement by the investment advisor for a realized investment loss. This reimbursement had an impact of less than 0.01% on the Fund's total return.
(e) The benefits derived from expense reductions had an impact of less than 0.01%.
(f) Rounds to less than 0.01%.
See Accompanying Notes to Financial Statements.
26
Notes to Financial Statements – Columbia High Yield Opportunity Fund
May 31, 2008
Note 1. Organization
Columbia High Yield Opportunity Fund (the "Fund"), a series of Columbia Funds Series Trust I (the "Trust"), is a diversified portfolio. The Trust is a Massachusetts business trust registered under the Investment Company Act of 1940, as amended (the "1940 Act"), as an open-end management investment company.
Investment Objective
The Fund seeks total return, consisting of current income and capital appreciation.
Fund Shares
The Trust may issue an unlimited number of shares, and the Fund offers four classes of shares: Class A, Class B, Class C and Class Z. Each share class has its own expense structure and sales charges, as applicable.
Class A shares are subject to a maximum front-end sales charge of 4.75% based on the amount of initial investment. Class A shares purchased without an initial sales charge in accounts aggregating $1 million to $50 million at the time of purchase are subject to a 1.00% contingent deferred sales charge ("CDSC") if the shares are sold within one year after purchase. Class B shares are subject to a maximum CDSC of 5.00% based upon the holding period after purchase. Class B shares will convert to Class A shares eight years after purchase. Class C shares are subject to a 1.00% CDSC on shares sold within one year after purchase. Class Z shares are offered continuously at net asset value. There are certain restrictions on the purchase of Class Z shares, as described in the Fund's prospectus.
Note 2. Significant Accounting Policies
The preparation of financial statements in accordance with accounting principles generally accepted in the United States of America ("GAAP") requires management to make certain estimates and assumptions that affect the reported amounts of assets and liabilities, the disclosure of contingent assets and liabilities at the date of the financial statements and the reported amounts of revenue and expenses during the reporting period. Actual results could differ from those estimates. The following is a summary of significant accounting policies consistently followed by the Fund in the preparation of its financial statements.
Security Valuation
Debt securities generally are valued by pricing services approved by the Trust's Board of Trustees, based upon market transactions for normal, institutional-size trading units of similar securities. The services may use various pricing techniques which take into account appropriate factors such as yield, quality, coupon rate, maturity, type of issue, trading characteristics and other data, as well as broker quotes. Debt securities for which quotations are readily available are valued at an over-the-counter or exchange bid quotation.
Certain debt securities, which tend to be more thinly traded and of lesser quality, are priced based on fundamental analysis of the financial condition of the issuer and the estimated value of any collateral. Valuations developed through pricing techniques may vary from the actual amounts realized upon sale of the securities, and the potential variation may be greater for those securities valued using fundamental analysis.
Equity securities are valued at the last sale price on the principal exchange on which they trade, except for securities traded on the NASDAQ, which are valued at the NASDAQ official close price. Unlisted securities or listed securities for which there were no sales during the day are valued at the closing bid price on such exchanges or over-the-counter markets.
Short-term debt obligations maturing within 60 days are valued at amortized cost, which approximates market value.
Forward foreign currency exchange contracts are valued at the prevailing forward exchange rate of the underlying currencies.
Credit default swaps are marked to market daily based upon quotations from market makers or pricing services. Quotations obtained from independent pricing services use information provided by market makers.
Foreign securities are generally valued at the last sale price on the foreign exchange or market on which they trade. If any foreign share prices are not readily available as a result of limited share activity, the securities are valued at the last sale price of the local shares in the principal market in which such securities are normally traded.
Generally, trading in foreign securities is substantially completed each day at various times prior to the close of the New York Stock Exchange ("NYSE"). The values of such
27
Columbia High Yield Opportunity Fund, May 31, 2008
securities used in computing the net asset value of the Fund's shares are determined as of such times. Foreign currency exchange rates are generally determined at 4:00 p.m. Eastern (U.S.) time. Occasionally events affecting the values of such foreign securities and such exchange rates may occur between the times at which they are determined and the close of the customary trading session of the NYSE, which would not be reflected in the computation of the Fund's net asset value. If events materially affecting the values of such foreign securities occur and it is determined that market quotations are not reliable, then these foreign securities will be valued at their fair value using procedures approved by the Board of Trustees.
Investments for which market quotations are not readily available, or that have quotations which management believes are not reliable, are valued at fair value as determined in good faith under consistently applied procedures established by and under the general supervision of the Board of Trustees. If a security is valued at a fair value, such value is likely to be different from the last quoted market price for the security.
In September 2006, Statement of Financial Accounting Standards No. 157, Fair Value Measurements ("SFAS 157"), was issued. SFAS 157 is effective for fiscal years beginning after November 15, 2007. SFAS 157 defines fair value, establishes a framework for measuring fair value and expands disclosures about fair value measurements. Management is evaluating the impact the application of SFAS 157 will have on the Fund's financial statement disclosures.
Security Transactions
Security transactions are accounted for on the trade date. Cost is determined and gains (losses) are based upon the specific identification method for both financial statement and federal income tax purposes.
In March 2008, Statement of Financial Accounting Standards No. 161 ("SFAS 161"), Disclosures about Derivative Instruments and Hedging Activities—an amendment of FASB Statement No. 133, was issued. SFAS 161 is effective for fiscal years beginning after November 15, 2008. SFAS 161 requires additional discussion about the reporting entity's derivative instruments and hedging activities, by providing for qualitative disclosures about the objectives and strategies for using derivatives, quantitative data about the fair value of and gains and losses on derivative contracts, and details of credit-risk-related contingent features in their hedged positions. Management is evaluating the impact the application of SFAS 161 will have on the Fund's financial statement disclosures.
Loan Participations and Commitments
The Fund may invest in loan participations. When the Fund purchases a loan participation, the Fund typically enters into a contractual relationship with the lender or third party selling such participation ("Selling Participant"), but not the borrower. However, the Fund assumes the credit risk of the borrower, Selling Participant and any other persons interpositioned between the Fund and the borrower. The Fund may not directly benefit from any collateral supporting the loan which it has purchased from the Selling Participant.
Forward Foreign Currency Exchange Contracts
Forward foreign currency exchange contracts are agreements to exchange one currency for another at a future date at a specified price. These contracts are used to minimize the exposure to foreign exchange rate fluctuations during the period between the trade and settlement date of the contract. The Fund may utilize forward foreign currency exchange contracts in connection with the settlement of purchases and sales of securities. The Fund may also enter into these contracts to hedge certain other foreign currency denominated assets. Contracts to buy generally are used to acquire exposure to foreign currencies, while contracts to sell are generally used to hedge the Fund's investments against currency fluctuations. Forward foreign currency exchange contracts are valued daily at the current exchange rate of the underlying currency, resulting in unrealized gains (losses) which become realized at the time the forward foreign currency exchange contracts are closed or mature. Realized and unrealized gains (losses) arising from such transactions are included in net realized and unrealized gains (losses) on foreign currency transactions. The use of forward foreign currency exchange contracts does not eliminate fluctuations in the prices of the Fund's portfolio securities. While the maximum potential loss from such contracts is the aggregate face value in U.S. dollars at the time the contract was opened, exposure is typically limited to the change in value of the contract (in U.S. dollars) over the period it remains open. The Fund could also be exposed to risk that counterparties of the contracts may be unable to fulfill the terms of the contracts.
28
Columbia High Yield Opportunity Fund, May 31, 2008
Repurchase Agreements
The Fund may engage in repurchase agreement transactions with institutions that Columbia Management Advisors, LLC ("Columbia"), the Fund's investment advisor, has determined are creditworthy. The Fund, through its custodian, receives delivery of the underlying securities collateralizing a repurchase agreement. Columbia is responsible for determining that the collateral is at least equal, at all times, to the value of the repurchase obligation including interest. A repurchase agreement transaction involves certain risks in the event of default or insolvency of the counterparty. These risks include possible delays in or restrictions on the Fund's ability to dispose of the underlying securities and a possible decline in the value of the underlying securities during the period while the Fund seeks to assert its rights.
Delayed Delivery Securities
The Fund may trade securities on other than normal settlement terms, including securities purchased or sold on a "when-issued" basis. This may increase the risk if the other party to the transaction fails to deliver and causes the Fund to subsequently invest at less advantageous prices. The Fund holds until the settlement date, in a segregated account, cash or liquid securities in an amount equal to the delayed delivery commitment.
Credit Default Swaps
The Fund may engage in credit default swap transactions for hedging purposes or to seek to increase total return. Credit default swaps are agreements in which one party pays fixed periodic payments to a counterparty in consideration for a guarantee from the counterparty to make a specific payment should a negative credit event take place. The Fund may receive an upfront premium as the protection seller or make an upfront premium as the protection buyer.
Credit default swaps are marked to market daily and any change is recorded as unrealized appreciation/depreciation on the Fund's Statement of Assets and Liabilities. Periodic payments and premiums received or made are amortized and recorded as realized gain or loss on the Statement of Operations, respectively. Gains or losses are realized as a result of a credit event or termination of the contract. Collateral, in the form of restricted cash or securities, may be required to be held in segregated accounts with the Fund's custodian in compliance with the terms of the swap contracts.
By entering into these agreements, the Fund could be exposed to risks in excess of the amounts recorded on the Statement of Assets and Liabilities. Risks include the possibility that there will be no liquid market for these agreements, or that the counterparty to an agreement will default on its obligation to perform.
Income Recognition
Interest income is recorded on the accrual basis. Premium and discount are amortized and accreted, respectively, on all debt securities, unless otherwise noted. Corporate actions and dividend income are recorded on the ex-date. The value of additional securities received as an income payment is recorded as income and as the cost basis of such securities.
Foreign Currency Transactions
The values of all assets and liabilities quoted in foreign currencies are translated into U.S. dollars at that day's exchange rates. Net realized and unrealized gains (losses) on foreign currency transactions include gains (losses) arising from the fluctuation in exchange rates between trade and settlement dates on securities transactions, gains (losses) arising from the disposition of foreign currency and currency gains (losses) between the accrual and payment dates on dividends, interest income and foreign withholding taxes.
For financial statement purposes, the Fund does not distinguish that portion of gains (losses) on investments which is due to changes in foreign exchange rates from that which is due to changes in market prices of the investments. Such fluctuations are included with the net realized and unrealized gains (losses) on investments on the Statement of Operations.
Determination of Class Net Asset Value
All income, expenses (other than class-specific expenses, as shown on the Statement of Operations) and realized and unrealized gains (losses) are allocated to each class of the Fund on a daily basis for purposes of determining the net asset value of each class. Income and expenses are allocated to each class based on the settled shares method, while realized and unrealized gains (losses) are allocated based on the relative net assets of each class.
29
Columbia High Yield Opportunity Fund, May 31, 2008
Federal Income Tax Status
The Fund intends to qualify each year as a "regulated investment company" under Subchapter M of the Internal Revenue Code, as amended, and will distribute substantially all of its tax exempt or taxable income, if any, for its tax year, and as such will not be subject to federal income taxes. In addition, the Fund intends to distribute in each calendar year substantially all of its net investment income, capital gains and certain other amounts, if any, such that the Fund should not be subject to federal excise tax. Therefore, no federal income or excise tax provision is recorded.
Expenses
General expenses of the Trust are allocated to the Fund and the other series of the Trust based upon relative net assets or other expense allocation methodologies determined by the nature of the expense. Expenses directly attributable to the Fund are charged to the Fund.
Distributions to Shareholders
Dividends from net investment income are declared daily and paid monthly. Net realized capital gains, if any, are distributed at least annually.
Indemnification
In the normal course of business, the Fund enters into contracts that contain a variety of representations and warranties and which provide general indemnities. The Fund's maximum exposure under these arrangements is unknown because this would involve future claims against the Fund. Also, under the Trust's organizational documents and by contract, the Trustees and officers of the Trust are indemnified against certain liabilities that may arise out of actions relating to their duties to the Trust. However, based on experience, the Fund expects the risk of loss due to these representations, warranties and indemnities to be minimal.
Note 3. Federal Tax Information
The timing and character of income and capital gain distributions are determined in accordance with income tax regulations, which may differ from GAAP. Reclassifications are made to the Fund's capital accounts for permanent tax differences to reflect income and gains available for distribution (or available capital loss carryforwards) under income tax regulations.
For the year ended May 31, 2008, permanent book and tax basis differences resulting primarily from differing treatments for post October loss deferral, paydowns, discount accretion/premium amortization on debt securities, Section 988 bond bifurcation and expired capital loss carryforwards were identified and reclassified among the components of the Fund's net assets as follows:
Overdistributed
Net Investment
Income | | Accumulated
Net Realized
Loss | | Paid-In Capital | |
| $ | (10,477 | ) | | $ | 20,556,577 | | | $ | (20,546,100 | ) | |
Net investment income and net realized gains (losses), as disclosed on the Statement of Operations, and net assets were not affected by this reclassification.
The tax character of distributions paid during the years ended May 31, 2008 and May 31, 2007 was as follows:
| | | May 31, | |
| Distributions paid from | | 2008 | | 2007 | |
| Ordinary Income* | | $ | 25,843,744 | | | $ | 29,690,300 | | |
| Long-Term Capital Gains | | | — | | | | — | | |
* For tax purposes short-term capital gains distributions, if any, are considered ordinary income distributions.
As of May 31, 2008, the components of distributable earnings on a tax basis were as follows:
Undistributed
Ordinary
Income | | Undistributed
Long-term
Capital Gains | | Net Unrealized
Depreciation* | |
| $ | 1,467,899 | | | $ | — | | | $ | (29,782,354 | ) | |
* The differences between book-basis and tax-basis net unrealized appreciation/depreciation are primarily due to deferral of losses from wash sales and discount accretion/premium amortization on debt securities.
30
Columbia High Yield Opportunity Fund, May 31, 2008
Unrealized appreciation and depreciation at May 31, 2008, based on cost of investments for federal income tax purposes, were:
| Unrealized appreciation | | $ | 5,244,519 | | |
| Unrealized depreciation | | | (35,026,873 | ) | |
| Net unrealized depreciation | | $ | (29,782,354 | ) | |
The following capital loss carryforwards, determined as of May 31, 2008, may be available to reduce taxable income arising from future net realized gains on investments, if any, to the extent permitted by the Internal Revenue Code:
| Year of Expiration | | Capital Loss
Carryforward | |
| | 2009 | | | $ | 161,251,744 | | |
| | 2010 | | | | 176,667,427 | | |
| | 2011 | | | | 21,122,366 | | |
| | 2012 | | | | 1,461,417 | | |
| | 2013 | | | | 3,855,569 | | |
| | 2014 | | | | 7,033,993 | | |
| | 2015 | | | | 6,703,180 | | |
| | 2016 | | | | 378,711 | | |
| | Total | | | $ | 378,474,407 | | |
Capital loss carryforwards of $37,575,496 expired during the year ended May 31, 2008.
The availability of a portion of the capital loss carryforwards acquired by the Fund as a result of its merger with High Yield Fund has been limited in certain years and has been excluded from the schedule of available loss carryforwards above.
Of the capital loss carryforwards attributable to the Fund, $870,077, expiring May 31, 2009, was obtained in the merger with Stein Roe High Yield Fund and $65,203,252 ($164,027 expiring May 31, 2009, $17,456,849 expiring May 31, 2010, $40,103,941 expiring May 31, 2011, $1,461,417 expiring May 31, 2012 and $6,017,018 expiring May 31, 2013) was obtained in the merger with High Yield Fund (see Note 10). Utilization of these losses could be subject to limitations imposed by the Internal Revenue Code.
Under current tax rules, certain currency and capital losses realized after October 31 may be deferred and treated as occurring on the first day of the following fiscal year. As of May 31, 2008, post-October capital losses of $17,581,422 attributed to security transactions were deferred to June 1, 2008.
The Fund adopted Financial Accounting Standards Board ("FASB") Interpretation No. 48, Accounting for Uncertainty in Income Taxes—an Interpretation of FASB Statement No. 109 ("FIN 48") effective November 30, 2007. FIN 48 requires management to determine whether a tax position of the Fund is more likely than not to be sustained upon examination by the applicable taxing authority, including resolution of any related appeals or litigation processes, based on the technical merits of the position. The tax benefit to be recognized is measured as the largest amount of benefit that is greater than fifty percent likely of being realized upon ul timate settlement. FIN 48 was applied to all existing tax positions upon initial adoption. Management has evaluated the known implications of FIN 48 on its computation of net assets for the Fund. As a result of this evaluation, management has concluded that FIN 48 did not have any effect on the Fund's financial statements and no cumulative effect adjustments were recorded. However, management's conclusions regarding FIN 48 may be subject to review and adjustment at a later date based on factors including, but not limited to, further implementation guidance from the FASB, new tax laws, regulations, and administrative interpretations (including relevant court decisions). The Fund's federal tax returns for the prior three fiscal years remain subject to examination by the Internal Revenue Service. The Fund is not aware of any tax positions for which it is reasonably possible that the total amounts of unrecognized tax benefits will significantly change in the next twelve months.
Note 4. Fees and Compensation Paid to Affiliates
Investment Advisory Fee
Columbia, an indirect, wholly owned subsidiary of Bank of America Corporation ("BOA"), provides investment advisory, administrative and other services to the Fund. Columbia
31
Columbia High Yield Opportunity Fund, May 31, 2008
receives a monthly investment advisory fee based on the Fund's average daily net assets at the following annual rates:
| Average Daily Net Assets | | Annual Fee Rate | |
| First $500 million | | | 0.60 | % | |
| $500 million to $1 billion | | | 0.55 | % | |
| $1 billion to $1.5 billion | | | 0.52 | % | |
| Over $1.5 billion | | | 0.49 | % | |
For the year ended May 31, 2008, the Fund's effective investment advisory fee rate was 0.60% of the Fund's average daily net assets.
Pricing and Bookkeeping Fees
The Fund has entered into a Financial Reporting Services Agreement (the "Financial Reporting Services Agreement") with State Street Bank & Trust Company ("State Street") and Columbia pursuant to which State Street provides financial reporting services to the Fund. The Fund has also entered into an Accounting Services Agreement (collectively with the Financial Reporting Services Agreement, the "State Street Agreements") with State Street and Columbia pursuant to which State Street provides accounting services to the Fund. Under the State Street Agreements, the Fund pays State Street an annual fee of $38,000 paid monthly plus an additional monthly fee based on an annualized percentage rate of average daily net assets of the Fund for the month. The aggregate fee will not exceed $140,000 per year (exclusive of out-of-pocket expenses and charges). The Fund also reimburses State Street for certain out-of-pocket expenses and charge s.
The Fund has entered into a Pricing and Bookkeeping Oversight and Services Agreement (the "Services Agreement") with Columbia. Under the Services Agreement, Columbia provides services related to Fund expenses and the requirements of the Sarbanes-Oxley Act of 2002, and provides oversight of the accounting and financial reporting services provided by State Street. Under the Services Agreement, the Fund reimburses Columbia for out-of-pocket expenses. Prior to January 1, 2008, the Fund also reimbursed Columbia for accounting oversight services, services related to Fund expenses and the requirements of the Sarbanes-Oxley Act of 2002.
For the year ended May 31, 2008, the amount charged to the Fund by affiliates included on the Statement of Operations under "Pricing and bookkeeping fees" aggregated $8,212.
Transfer Agent Fee
Columbia Management Services, Inc. (the "Transfer Agent"), an affiliate of Columbia and an indirect, wholly owned subsidiary of BOA, provides shareholder services to the Fund and has contracted with Boston Financial Data Services ("BFDS") to serve as sub-transfer agent. The Transfer Agent is entitled to receive a fee for its services, paid monthly, at the annual rate of $17.34 per open account plus reimbursement of certain sub-transfer agent fees paid by the Transfer Agent (exclusive of BFDS fees), calculated based on assets held in omnibus accounts and intended to recover the cost of payments to other parties (including affiliates of BOA) for services to those accounts. Prior to November 1, 2007, the annual rate was $17.00 per open account. The Transfer Agent pays the fees of BFDS for services as sub-transfer agent and is not entitled to reimbursement for such fees from the Fund. The Transfer Agent may also retain, as additiona l compensation for its services, fees for wire, telephone and redemption orders, IRA trustee agent fees and account transcript fees due to the Transfer Agent from shareholders of the Fund and credits (net of bank charges) earned with respect to balances in accounts the Transfer Agent maintains in connection with its services to the Fund. The Transfer Agent also receives reimbursement for certain out-of-pocket expenses.
An annual minimum account balance fee of $20 may apply to certain accounts with a value below the Fund's initial minimum investment requirements to reduce the impact of small accounts on transfer agent fees. These minimum account balance fees are recorded as part of expense reductions on the Statement of Operations. For the year ended May 31, 2008, these minimum account balance fees reduced total expenses by $8,572.
Underwriting Discounts, Service and Distribution Fees
Columbia Management Distributors, Inc. (the "Distributor"), an affiliate of Columbia and an indirect, wholly owned subsidiary of BOA, is the principal underwriter of the Fund.
32
Columbia High Yield Opportunity Fund, May 31, 2008
For the year ended May 31, 2008, the Distributor retained net underwriting discounts of $9,606 on sales of the Fund's Class A shares and received net CDSC fees of $106, $120,102 and $1,294 on Class A, Class B and Class C share redemptions, respectively.
The Fund has adopted Rule 12b-1 plans (the "Plans"), which require the payment of a monthly service fee to the Distributor equal to 0.25% annually of the average daily net assets attributable to Class A, Class B and Class C shares. The Plans also require the payment of a monthly distribution fee to the Distributor equal to 0.75% annually of the average daily net assets attributable to Class B and Class C shares only. The Distributor has voluntarily agreed to waive a portion of the Class C share distribution fee so that it will not exceed 0.60% annually of the average daily net assets attributable to Class C shares. This arrangement may be modified or terminated by the Distributor at any time.
The CDSC and the distribution fees are used principally as repayment to the Distributor for amounts paid by the Distributor to dealers who sold such shares.
Fee Waivers and Expense Reimbursements
Effective January 1, 2008, Columbia has contractually agreed to waive fees and/or reimburse the Fund for certain expenses through September 30, 2009, so that total expenses (exclusive of distribution and service fees, brokerage commissions, interest, taxes and extraordinary expenses, but inclusive of custodial charges relating to overdrafts, if any), after giving effect to any balance credits from the Fund's custodian, will not exceed 0.87% annually of the Fund's average daily net assets. There is no guarantee that this arrangement will continue after September 30, 2009.
Fees Paid to Officers and Trustees
All officers of the Fund are employees of Columbia or its affiliates and, with the exception of the Fund's Chief Compliance Officer, receive no compensation from the Fund. The Board of Trustees has appointed a Chief Compliance Officer to the Fund in accordance with federal securities regulations. The Fund, along with other affiliated funds, pays its pro-rata share of the expenses associated with the Chief Compliance Officer. The Fund's expenses for the Chief Compliance Officer will not exceed $15,000 per year.
The Trust's eligible Trustees may participate in a deferred compensation plan which may be terminated at any time. Obligations of the plan will be paid solely out of the Fund's assets.
Note 5. Custody Credits
The Fund has an agreement with its custodian bank under which custody fees may be reduced by balance credits. These credits are recorded as part of expense reductions on the Statement of Operations. The Fund could have invested a portion of the assets utilized in connection with the expense offset arrangement in an income-producing asset if it had not entered into such an agreement.
For the year ended May 31, 2008, these custody credits reduced total expenses by $3,680 for the Fund.
Note 6. Portfolio Information
For the year ended May 31, 2008, the cost of purchases and proceeds from sales of securities, excluding short-term obligations, were $172,226,400 and $219,366,524, respectively, of which $— and $2,652,834, respectively, were U.S. Government securities.
Note 7. Line of Credit
The Fund and other affiliated funds participate in a $350,000,000 committed, unsecured revolving line of credit and a $150,000,000 uncommitted, unsecured line of credit, both provided by State Street. Borrowings are available for short-term liquidity or temporary or emergency purposes.
Interest on the committed line of credit is charged to each participating fund based on the fund's borrowings at a rate per annum equal to the Federal Funds Rate plus 0.50%. In addition, a commitment fee based on the unused portion of the committed line of credit of 0.10% per annum is charged and apportioned among the participating funds based on their relative net assets. Effective September 17, 2007, interest on the uncommitted line of credit is charged to each participating fund based on the fund's borrowings at a rate per annum equal to the Federal Funds Rate plus 0.375%. Prior to September 17, 2007, interest on the uncommitted line of credit was charged to each participating fund based on the fund's borrowings at a rate per annum equal to the Federal Funds Rate plus 0.50%. State Street charges an annual operations agency fee of $40,000 for the committed line of credit and may
33
Columbia High Yield Opportunity Fund, May 31, 2008
charge an annual administration fee of $15,000 for the uncommitted line of credit. The commitment fee, the operations agency fee and the administration fee are accrued and apportioned among the participating funds pro rata based on their relative net assets.
For the year ended May 31, 2008, the average daily loan balance outstanding on days where borrowing existed was $18,500,000 at a weighted average interest rate of 5.16%.
Note 8. Shares of Beneficial Interest
As of May 31, 2008, the Fund had one shareholder that held 11.4% of the Fund's shares outstanding. These shares were beneficially owned by participant accounts over which BOA and/or any of its affiliates had either sole or joint investment discretion. Subscription and redemption activity of these accounts may have a significant effect on the operations of the Fund.
As of May 31, 2008, the Fund had two shareholders that held 17.8% of the Fund's shares outstanding. These shares were beneficially owned by participant accounts over which BOA and/or any of its affiliates did not have investment discretion. Subscription and redemption activity of these accounts may have a significant effect on the operations of the Fund.
Note 9. Significant Risks and Contingencies
Sector Focus Risk
The Fund may focus its investments in certain sectors, subjecting it to greater risk than a fund that is less focused.
High-Yield Securities Risk
Investing in high-yield securities may involve greater credit risk and considerations not typically associated with investing in U.S. Government bonds and other higher quality fixed income securities. These securities are non-investment grade securities, often referred to as "junk" bonds. Economic downturns may disrupt the high yield market and impair the ability of issuers to repay principal and interest. Also, an increase in interest rates would likely have an adverse impact on the value of such obligations. Moreover, high-yield securities may be less liquid to the extent that there is no established secondary market.
Foreign Securities
There are certain additional risks involved when investing in foreign securities. These risks may involve foreign currency exchange rate fluctuations, adverse political and economic developments and the possible prevention of currency exchange or other foreign governmental laws or restrictions. In addition, the liquidity of foreign securities may be more limited than that of domestic securities.
Legal Proceedings
On February 9, 2005, Columbia Management Advisors, Inc. (which has since merged into Banc of America Capital Management, LLC (now named Columbia Management Advisors, LLC)) ("Columbia") and Columbia Funds Distributor, Inc. (which has been renamed Columbia Management Distributors, Inc.) (the "Distributor") (collectively, the "Columbia Group") entered into an Assurance of Discontinuance with the New York Attorney General ("NYAG") (the "NYAG Settlement") and consented to the entry of a cease-and-desist order by the Securities and Exchange Commission ("SEC") (the "SEC Order") on matters relating to mutual fund trading.
Under the terms of the SEC Order, the Columbia Group agreed, among other things, to: pay $70 million in disgorgement and $70 million in civil money penalties; cease and desist from violations of the antifraud provisions and certain other provisions of the federal securities laws; maintain certain compliance and ethics oversight structures; retain an independent consultant to review the Columbia Group's applicable supervisory, compliance, control and other policies and procedures; and retain an independent distribution consultant (see below). The Columbia Funds have also voluntarily undertaken to implement certain governance measures designed to maintain the independence of their boards of trustees. The NYAG Settlement also, among other things, requires Columbia and its affiliates to reduce management fees for certain Columbia Funds (including the former Nations Funds) and other mutual funds collectively by $32 million per year f or five years, for a projected total of $160 million in management fee reductions.
Pursuant to the procedures set forth in the SEC Order, the $140 million in settlement amounts described above is being distributed in accordance with a distribution plan that was developed by an independent distribution consultant and approved by the SEC on April 6, 2007. Distributions under the distribution plan began in late June 2007.
A copy of the SEC Order is available on the SEC website at http://www.sec.gov. A copy of the NYAG Settlement is available as part of the Bank of America Corporation Form 8-K filing on February 10, 2005.
34
Columbia High Yield Opportunity Fund, May 31, 2008
In connection with the events described above, various parties have filed suit against certain funds, the Trustees of the Columbia Funds, FleetBoston Financial Corporation and its affiliated entities and/or Bank of America and its affiliated entities.
On February 20, 2004, the Judicial Panel on Multidistrict Litigation transferred these cases and cases against other mutual fund companies based on similar allegations to the United States District Court in Maryland for consolidated or coordinated pretrial proceedings (the "MDL"). Subsequently, additional related cases were transferred to the MDL. On September 29, 2004, the plaintiffs in the MDL filed amended and consolidated complaints. One of these amended complaints is a putative class action that includes claims under the federal securities laws and state common law, and that names Columbia, the Distributor, the Trustees of the Columbia Funds, Bank of America Corporation and others as defendants. Another of the amended complaints is a derivative action purportedly on behalf of the Columbia Funds that asserts claims under federal securities laws and state common law.
On February 25, 2005, Columbia and other defendants filed motions to dismiss the claims in the pending cases. On March 1, 2006, for reasons stated in the court's memoranda dated November 3, 2005, the United States District Court for the District of Maryland granted in part and denied in part the defendants' motions to dismiss. The court dismissed all of the class action claims pending against the Columbia Funds Trusts. As to Columbia and the Distributor, the claims under the Securities Act of 1933, the claims under Sections 34(b) and 36(a) of the Investment Company Act of 1940 ("ICA") and the state law claims were dismissed. The claims under Sections 10(b) and 20(a) of the Securities Exchange Act of 1934 and claims under Section 36(b) of the ICA were not dismissed.
On March 21, 2005, a purported class action was filed in Massachusetts state court alleging that certain conduct, including market timing, entitled Class B shareholders in certain Columbia funds to an exemption from contingent deferred sales charges upon early redemption ("the CDSC Lawsuit"). The CDSC Lawsuit was removed to federal court in Massachusetts and transferred to the MDL.
On September 14, 2007, the plaintiffs and the Columbia defendants named in the MDL, including the Columbia Funds, entered into a stipulation of settlement with respect to all Columbia-related claims in the MDL described above, including the CDSC Lawsuit. The settlement is subject to court approval.
In 2004, the Columbia Funds' adviser and distributor and certain affiliated entities and individuals were named as defendants in certain purported shareholder class and derivative actions making claims, including claims under the Investment Company and the Investment Advisers Acts of 1940 and state law. Certain Columbia Funds were named as nominal defendants. The suits allege, inter alia, that the fees and expenses paid by the funds are excessive and that the advisers and their affiliates inappropr iately used fund assets to distribute the funds and for other improper purposes. On March 2, 2005, the actions were consolidated in the Massachusetts federal court as In re Columbia Entities Litigation. The plaintiffs filed a consolidated amended complaint on June 9, 2005. On November 30, 2005, the judge dismissed all claims by plaintiffs and entered final judgment in favor of the defendants. The plaintiffs appealed to the United States Court of Appeals for the First Circuit on December 30, 2005. A stipulation and settlement agreement dated January 19, 2007 was filed in the First Circuit on February 14, 2007, with a joint stipulation of dismissal and motion for remand to obtain district court approval of the set tlement. That joint motion was granted and the appeal was dismissed. On March 6, 2007, the case was remanded to the District Court. The settlement, approved by the District Court on September 18, 2007, became effective October 19, 2007. Pursuant to the settlement, the funds' adviser and/or its affiliates made certain payments, including plaintiffs' attorneys' fees and costs of notice to class members.
Note 10. Business Combinations and Mergers
As of March 24, 2008, High Yield Fund, a series of Excelsior Funds Trust merged into Columbia High Yield Opportunity Fund. Columbia High Yield Opportunity Fund received a tax-free transfer of assets from High Yield Fund as follows:
Class Z Shares
Issued | | Net Assets
Received | | Unrealized
Appreciation* | |
| | 16,005,215 | | | $ | 64,553,210 | | | $ | 4,926,140 | | |
Net Assets
of Columbia
High Yield
Opportunity Fund
Prior to
Combination | | Net Assets
of High Yield
Fund
Immediately
Prior to
Combination | | Net Assets
of Columbia
High Yield
Opportunity Fund
Immediately
After
Combination | |
| $ | 376,627,791 | | | $ | 64,553,210 | | | $ | 441,181,001 | | |
* Unrealized appreciation is included in the Net Assets Received.
35
Report of Independent Registered Public Accounting Firm
Columbia High Yield Opportunity Fund
To the Trustees of Columbia Funds Series Trust I and the Shareholders of Columbia High Yield Opportunity Fund
In our opinion, the accompanying statement of assets and liabilities, including the investment portfolio, and the related statements of operations for the year then ended and of changes in net assets and the financial highlights present fairly, in all material respects, the financial position of Columbia High Yield Opportunity Fund (the "Fund") (a series of Columbia Funds Series Trust I) at May 31, 2008, the results of its operations, the changes in its net assets for each of the two years in the period then ended and the financial highlights for each of the five years in the period then ended, in conformity with accounting principles generally accepted in the United States of America. These financial statements and financial highlights (hereafter referred to as "financial statements") are the responsibility of the Fund's management. Our responsibility is to express an opinion on these financial statements based on our audits. W e conducted our audits of these financial statements in accordance with the standards of the Public Company Accounting Oversight Board (United States). Those standards require that we plan and perform the audit to obtain reasonable assurance about whether the financial statements are free of material misstatement. An audit includes examining, on a test basis, evidence supporting the amounts and disclosures in the financial statements, assessing the accounting principles used and significant estimates made by management, and evaluating the overall financial statement presentation.We believe that our audits, which included confirmation of securities at May 31, 2008 by correspondence with the custodian and brokers, provide a reasonable basis for our opinion.
PricewaterhouseCoopers LLP
Boston, Massachusetts
July 21, 2008
36
Fund Governance
The Trustees serve terms of indefinite duration. The names, addresses and ages of the Trustees and officers of the Funds in Columbia Funds Series Trust I, the year each was first elected or appointed to office, their principal business occupations during at least the last five years, the number of Funds overseen by each Trustee and other directorships they hold are shown below. Each officer listed below serves as an officer of each Fund in the Columbia Funds Complex.
Independent Trustees
Name, Address and Year of Birth,
Position with Funds, Year First
Elected or Appointed to Office1 | | Principal Occupation(s) During Past Five Years, Number of Portfolios in Columbia
Funds Complex Overseen by Trustee, Other Directorships Held | |
| John D. Collins (Born 1938) | |
|
c/o Columbia Management
Advisors, LLC
One Financial Center
Boston, MA 02111
Trustee2 (since 2007) | | Retired. Consultant, KPMG, LLP from July 1999 to June 2000; Partner, KPMG, LLP from March 1962 to June 1999. Oversees 83, Mrs. Fields Famous Brands LLC (consumer products); Suburban Propane Partners, L.P.; and Montpelier Re | |
|
| Rodman L. Drake (Born 1943) | |
|
c/o Columbia Management
Advisors, LLC
One Financial Center
Boston, MA 02111
Trustee2 (since 2007) | | Co-Founder of Baringo Capital LLC (private equity) since 2002; President, Continuation Investments Group, Inc. from 1997 to 2001. Oversees 83, Jackson Hewitt Tax Service Inc. (tax preparation services); Crystal Capital River Inc. (real estate investment trust); Student Loan Corporation (student loan provider); Celgene Corporation (global biotechnology company); Apex Silver Mines Ltd. (mining); and Hyperion Brookfield Total Return Fund Inc. and Hyperion Brookfield Strategic Mortgage Income Fund (exchange-traded funds) | |
|
| Douglas A. Hacker (Born 1955) | |
|
c/o Columbia Management
Advisors, LLC
One Financial Center
Boston, MA 02111
Trustee (since 1996) | | Independent business executive since May, 2006; Executive Vice President—Strategy of United Airlines (airline) from December, 2002 to May, 2006; President of UAL Loyalty Services (airline marketing company) from September, 2001 to December, 2002; Executive Vice President and Chief Financial Officer of United Airlines from July, 1999 to September, 2001. Oversees 80, Nash Finch Company (food distributor); Aircastle Limited (aircraft leasing) | |
|
| Janet Langford Kelly (Born 1957) | |
|
c/o Columbia Management
Advisors, LLC
One Financial Center
Boston, MA 02111
Trustee (since 1996) | | Senior Vice President, General Counsel and Corporate Secretary, ConocoPhillips (integrated energy company) since September, 2007; Deputy General Counsel—Corporate Legal Services, ConocoPhillips from August, 2006 to August, 2007; Partner, Zelle, Hofmann, Voelbel, Mason & Gette LLP (law firm) from March, 2005 to July, 2006; Adjunct Professor of Law, Northwestern University, from September, 2004 to June, 2006, Director, UAL Corporation (airline) from February, 2006 to July, 2006; Chief Administrative Officer and Senior Vice President, Kmart Holding Corporation (consumer goods), from September, 2003 to March, 2004; Executive Vice President—Corporate Development and Administration, General Counsel and Secretary, Kellogg Company (food manufacturer), from September, 1999 to August, 2003. Oversees 80, None | |
|
37
Fund Governance (continued)
Independent Trustees (continued)
Name, Address and Year of Birth,
Position with Funds, Year First
Elected or Appointed to Office1 | | Principal Occupation(s) During Past Five Years, Number of Portfolios in Columbia
Funds Complex Overseen by Trustee, Other Directorships Held | |
| Charles R. Nelson (Born 1942) | |
|
c/o Columbia Management
Advisors, LLC
One Financial Center
Boston, MA 02111
Trustee (since 1981) | | Professor of Economics, University of Washington, since January, 1976; Ford and Louisa Van Voorhis Professor of Political Economy, University of Washington, since September, 1993; Director, Institute for Economic Research, University of Washington from September, 2001 to June, 2003; Adjunct Professor of Statistics, University of Washington, since September, 1980; Associate Editor, Journal of Money Credit and Banking, since September, 1993; Consultant on econometric and statistical matters. Oversees 80, None | |
|
| John J. Neuhauser (Born 1943) | |
|
c/o Columbia Management
Advisors, LLC
One Financial Center
Boston, MA 02111
Trustee (since 1985) | | President, Saint Michael's College, since August, 2007; University Professor, Boston College from November, 2005 to August, 2007; Academic Vice President and Dean of Faculties, Boston College from August, 1999 to October, 2005. Oversees 80, Liberty All-Star Equity Fund and Liberty All-Star Growth Fund, Inc. (closed-end funds) | |
|
| Jonathan Piel (Born 1938) | |
|
c/o Columbia Management
Advisors, LLC
One Financial Center
Boston, MA 02111
Trustee2 (since 2007) | | Cable television producer and website designer; The Editor, Scientific American from 1984 to 1994 and Vice President from 1984 to 1994; Member, Advisory Board, Stone Age Institute, Bloomington, Indiana (research institute that explores the effect of technology on human evolution); Member, Board of Directors of the National Institute of Social Sciences, New York City; and Member, Board of Trustees of the William Alanson White Institute, New York City (institution for training psychoanalysts). 83, None | |
|
| Patrick J. Simpson (Born 1944) | |
|
c/o Columbia Management
Advisors, LLC
One Financial Center
Boston, MA 02111
Trustee (since 2000) | | Partner, Perkins Coie LLP (law firm). Oversees 80, None | |
|
| Thomas C. Theobald (Born 1937) | |
|
c/o Columbia Management
Advisors, LLC
One Financial Center
Boston, MA 02111
Trustee and Chairman of the Board
(since 1996) | | Partner and Senior Advisor, Chicago Growth Partners (private equity investing) since September, 2004; Managing Director, William Blair Capital Partners (private equity investing) from September, 1994 to September, 2004. Oversees 80, Anixter International (network support equipment distributor); Ventas, Inc. (real estate investment trust); Jones Lang LaSalle (real estate management services); Ambac Financial Group (financial guaranty insurance) | |
|
| Anne-Lee Verville (Born 1945) | |
|
c/o Columbia Management
Advisors, LLC
One Financial Center
Boston, MA 02111
Trustee (since 1998) | | Retired since 1997 (formerly General Manager, Global Education Industry, IBM Corporation (computer and technology) from 1994 to 1997, President—Application Systems Division (from 1991 to 1994), Chief Financial Officer—US Marketing & Services (from 1988 to 1991), and Chief Information Officer (from 1987 to 1988), IBM Corporation (computer and technology)). Oversees 80, None | |
|
38
Fund Governance (continued)
Interested Trustee
Name, Address and Year of Birth,
Position with Funds, Year First
Elected or Appointed to Office1 | | Principal Occupation(s) During Past Five Years, Number of Portfolios in Columbia
Funds Complex Overseen by Trustee, Other Directorships Held | |
| William E. Mayer (Born 1940) | |
|
c/o Columbia Management
Advisors, LLC
One Financial Center
Boston, MA 02111
Trustee3 (since 1994) | | Partner, Park Avenue Equity Partners (private equity) since February, 1999; Dean and Professor, College of Business, University of Maryland, 1992 to 1997. Oversees 80, Lee Enterprises (print media), WR Hambrecht + Co. (financial service provider); BlackRock Kelso Capital Corporation (investment company) | |
|
1 In December 2000, the boards of each of the former Liberty Funds and former Stein Roe Funds were combined into one board of trustees responsible for the oversight of both fund groups (collectively, the "Liberty Board"). In October 2003, the trustees on the Liberty Board were elected to the boards of the Columbia Funds (the "Columbia Board") and of the CMG Fund Trust (the "CMG Funds Board"); simultaneous with that election, Patrick J. Simpson who had been a director on the Columbia Board and trustee on the CMG Funds Board, was appointed to serve as trustee of the Liberty Board. The date shown is the earliest date on which a trustee/director was elected or appointed to the board of a Fund in the Columbia Funds Complex.
2 Messrs. Drake, Piel and Collins have served as directors/trustees of the Excelsior Funds since 1996, 1996 and 2005, respectively. The Excelsior Funds consisted of 27 portfolios managed by affiliates of Columbia Management Advisors, LLC. Effective December 12, 2007, the Board elected Messrs. Drake, Piel and Collins as Trustees of the Trust.
3 Mr. Mayer is an "interested person" (as defined in the Investment Company Act of 1940) by reason of his affiliation with WR Hambrecht + Co., a registered broker/dealer that may execute portfolio transactions for or engage in principal transactions with the Funds or other funds or accounts advised/managed by the Advisor or other Bank of America affiliates.
The Statement of Additional Information includes additional information about the Trustees of the Funds and is available, without charge, upon request by calling 1-800-426-3750.
39
Fund Governance (continued)
Officers
Name, Address and Year of Birth,
Position with Columbia Funds,
Year First Elected or Appointed
to Office | | Principal Occupation(s) During Past Five Years | |
| Christopher L. Wilson (Born 1957) | |
|
One Financial Center
Boston, MA 02111
President (since 2004) | | President—Columbia Funds, since October 2004; Managing Director—Columbia Management Advisors, LLC, since September 2005; Senior Vice President—Columbia Management Distributors, Inc., since January 2005; Director—Columbia Management Services, Inc., since January 2005; Director—Bank of America Global Liquidity Funds, plc and Banc of America Capital Management (Ireland), Limited, since May 2005; Director—FIM Funding, Inc., since January 2005; President and Chief Executive Officer—CDC IXIS AM Services, Inc. (investment management), from September 1998 through August 2004; and a senior officer or director of various other Bank of America-affiliated entities, including other registered and unregistered funds. | |
|
| James R. Bordewick, Jr. (Born 1959) | |
|
One Financial Center
Boston, MA 02111
Senior Vice President, Secretary
and Chief Legal Officer (since 2006) | | Associate General Counsel, Bank of America since April 2005; Senior Vice President and Associate General Counsel, MFS Investment Management (investment management) prior to April 2005. | |
|
| J. Kevin Connaughton (Born 1964) | |
|
One Financial Center
Boston, MA 02111
Senior Vice President and
Chief Financial Officer
(since 2000) | | Managing Director of Columbia Management Advisors, LLC since December 2004; Treasurer—Columbia Funds, October 2003—May 2008; Treasurer—the Liberty Funds, Stein Roe Funds and Liberty All-Star Funds, December 2000—December 2006; Senior Vice President—Columbia Management Advisors, LLC, April 2003—December 2004; President—Columbia Funds, Liberty Funds and Stein Roe Funds, February 2004 to October 2004; Treasurer—Galaxy Funds, September 2002 to December 2005; Treasurer, December 2002 to December 2004, and President, February 2004 to December 2004—Columbia Management Multi-Strategy Hedge Fund, LLC; and a senior officer of various other Bank of America-affiliated entities, including other registered and unregistered funds. | |
|
| Linda J. Wondrack (Born 1964) | |
|
One Financial Center
Boston, MA 02111
Senior Vice President,
Chief Compliance Officer
(since 2007) | | Director (Columbia Management Group, LLC and Investment Product Group Compliance), Bank of America since June 2005; Director of Corporate Compliance and Conflicts Officer, MFS Investment Management (investment management), August 2004 to May 2005; Managing Director, Deutsche Asset Management (investment management) prior to August 2004. | |
|
| Michael G. Clarke (Born 1969) | |
|
One Financial Center
Boston, MA 02111
Treasurer
(since 2008) | | Director of Fund Administration of the Advisor since January 2006; Managing Director of the Advisor, September 2004 to December 2005; Vice President Fund Administration June 2002 to September 2004. | |
|
40
Fund Governance (continued)
Officers (continued)
Name, Address and Year of Birth,
Position with Columbia Funds,
Year First Elected or Appointed
to Office | | Principal Occupation(s) During Past Five Years | |
| Jeffrey R. Coleman (Born 1969) | |
|
One Financial Center
Boston, MA 02111
Deputy Treasurer (since 2008) | | Director of Fund Administration of the Advisor since January 2006; Fund Controller of the Advisor from October 2004 to January 2006; Vice President of CDC IXIS Asset Management Services, Inc. (investment management) from August 2000 to September 2004. | |
|
| Joseph F. DiMaria (Born 1968) | |
|
One Financial Center
Boston, MA 02111
Deputy Treasurer (since 2006) | | Director of Fund Administration of the Advisor since January 2006; Head of Tax/Compliance and Assistant Treasurer from November 2004 to December 2005; Director of Trustee Administration (Sarbanes-Oxley) from May 2003 to October 2004; Senior Audit Manager, PricewaterhouseCoopers (independent registered public accounting firm) from July 2000 to April 2003. | |
|
| Barry S. Vallan (Born 1969) | |
|
One Financial Center
Boston, MA 02111
Controller (since 2006) | | Vice President—Fund Treasury of the Advisor since October 2004; Vice President—Trustee Reporting from April 2002 to October 2004. | |
|
41
This page intentionally left blank.
This page intentionally left blank.
This page intentionally left blank.
Important Information About This Report – Columbia High Yield Opportunity Fund
The fund mails one shareholder report to each shareholder address. If you would like more than one report, please call shareholder services at 1-800-345-6611 and additional reports will be sent to you. This report has been prepared for shareholders of Columbia High Yield Opportunity Fund.
A description of the policies and procedures that the fund uses to determine how to vote proxies and a copy of the fund's voting records are available (i) at www.columbiamanagement.com; (ii) on the Securities and Exchange Commission's website at www.sec.gov, and (iii) without charge, upon request, by calling 1-800-368-0346. Information regarding how the fund voted proxies relating to portfolio securities during the 12-month period ended June 30 is available from the SEC's website. Information regarding how the fund voted proxies relating to portfolio securities is also available from the fund's website, www.columbiamanagement.com.
The fund files a complete schedule of portfolio holdings with the SEC for the first and third quarters of each fiscal year on Form N-Q. The fund's Form N-Q is available on the SEC's website at www.sec.gov and may be reviewed and copied at the SEC's Public Reference Room in Washington, DC. Information on the operation of the Public Reference Room may be obtained by calling 1-800-SEC-0330.
Please read and consider the investment objectives, risks, charges and expenses for any fund carefully before investing. For a prospectus which contains this and other important information about the fund, contact your Columbia Management representative or financial advisor or go to www.columbiamanagement.com.
Columbia Management Group, LLC ("Columbia Management") is the investment management division of Bank of America Corporation. Columbia Management entities furnish investment management services and products for institutional and individual investors. Columbia Funds are distributed by Columbia Management Distributors, Inc., member of FINRA, SIPC, part of Columbia Management and an affiliate of Bank of America Corporation.
| Transfer Agent | |
|
Columbia Management Services, Inc.
P.O. Box 8081
Boston, MA 02266-8081
1-800-345-6611 | |
|
| Distributor | |
|
Columbia Management
Distributors, Inc.
One Financial Center
Boston, MA 02111 | |
|
| Investment Advisor | |
|
Columbia Management Advisors, LLC
100 Federal Street
Boston, MA 02110 | |
|
45
Columbia Management®
Columbia High Yield Opportunity Fund
Annual Report, May 31, 2008
PRSRT STD
U.S. Postage
PAID
Holliston, MA
Permit NO. 20
©2008 Columbia Management Distributors, Inc.
One Financial Center, Boston, MA 02111-2621
800-345-6611 www.columbiafunds.com
SHC-42/153468-0508 (07/08) 08/50379
Columbia Management®
Annual Report
May 31, 2008
Columbia Strategic Income Fund
| NOT FDIC INSURED | | May Lose Value | |
|
| NOT BANK ISSUED | | No Bank Guarantee | |
|
Table of contents
| Economic Update | | | 1 | | |
|
| Fund Profile | | | 2 | | |
|
| Performance Information | | | 3 | | |
|
| Understanding Your Expenses | | | 4 | | |
|
| Portfolio Managers' Report | | | 5 | | |
|
| Investment Portfolio | | | 7 | | |
|
Statement of Assets and
Liabilities | | | 21 | | |
|
| Statement of Operations | | | 22 | | |
|
Statement of Changes in
Net Assets | | | 23 | | |
|
| Financial Highlights | | | 25 | | |
|
| Notes to Financial Statements | | | 30 | | |
|
| Report of Independent Registered Public Accounting Firm | | | 40 | | |
|
| Fund Governance | | | 41 | | |
|
Important Information About
This Report | | | 49 | | |
|
The views expressed in this report reflect the current views of the respective parties. These views are not guarantees of future performance and involve certain risks, uncertainties and assumptions that are difficult to predict so actual outcomes and results may differ significantly from the views expressed. These views are subject to change at any time based upon economic, market or other conditions and the respective parties disclaim any responsibility to update such views. These views may not be relied on as investment advice and, because investment decisions for a Columbia Fund are based on numerous factors, may not be relied on as an indication of trading intent on behalf of any particular Columbia Fund. References to specific securities should not be construed as a recommendation or investment advice.
President's Message

Dear Shareholder:
We are pleased to provide this financial report for your Columbia Fund. This document provides information that can help support your investment decision-making. Inside, the portfolio managers discuss the fund's investment strategies, performance, and how that performance compared to the broader market. It's been a challenging year for the financial markets, particularly as concerns over a weaker housing market and economic uncertainty make the news headlines daily. For a sense of how Columbia Management's investment professionals have responded to these issues, I encourage you to read the Economic Update and Portfolio Managers' Report. I believe these discussions reflect Columbia Management's investment management expertise as well as its commitment to market research and consistent investment performance.
We understand that many factors drove your decision to invest in Columbia Funds. Columbia Management's commitment is to honor that decision by providing investment solutions designed to exceed expectations. As we review the past year and look forward to those ahead, we hope you will consider how we might support your investment needs beyond the services we provide currently. Some of the many advantages we bring to the table as the fund's investment manager include:
g Broad and deep investment expertise, including dedicated portfolio management, research and trading
g Strategically positioned investment disciplines and processes
g Comprehensive compliance and risk management
g A team-driven culture that draws upon multiple sources to pursue consistent and superior performance
g A comprehensive array of investment solutions, including equity, fixed-income and cash strategies
Working for you, and with you
Team approach—Rather than rely on the talent or judgment of one individual, Columbia Management takes a team-oriented approach to investing. We draw from the diverse experiences and insights of our people—including portfolio managers, research analysts and traders—to bring multiple investment perspectives and deep expertise to all of our investment management activities.
Client focus—At Columbia Management, our philosophy and culture are anchored in focused solutions and personal service. We are committed to putting our clients' interests first and we understand the premium our clients place on reliability—whether it's related to service, investment performance or risk management. Columbia Management is committed to maintaining high standards of reliability on all counts.
While our asset management capabilities are multifaceted and our investment professionals are multitalented, ultimately, everything we do at Columbia Management has a single purpose: to help investors pursue their most important financial goals. We are honored that you've chosen to invest with us and look forward to providing the investment solutions and services necessary to sustain a lasting relationship.
Sincerely,

Christopher L. Wilson
President, Columbia Funds
Economic Update – Columbia Strategic Income Fund
Although economic growth was strong at the beginning of the 12-month period that began June 1, 2007 and ended May 31, 2008, it slowed to a pace of less than 1.0% into 2008. The most severe housing downturn in decades continued to take a toll on growth. Inventories of homes for sale rose, home prices declined and tighter credit standards, the result of turmoil in the subprime mortgage market, made it more difficult for homebuyers to qualify for loans. Energy prices soared to record highs and food prices rose, raising concerns about inflation. Consumer confidence sank to a 16-year low, as measured by the Conference Board. Weakening business and job conditions further dimmed the outlook for consumers.
Consumer spending growth slowed during the period but remained more resilient than most economists expected even though job growth ground to a halt. Approximately 300,000 job losses were reported in the first five months of 2008, and the unemployment rate spiked to 5.5% in May, one full percentage point higher than it was at the beginning of the period. Manufacturing activity also slowed, but appeared to stabilize in May, one positive indicator that weakness might be contained. Federal tax rebates also began to arrive in May, raising hopes for a boost in consumer spending, which could help avert a recession.
In an effort to inspire confidence in the capital markets, loosen the reins on credit and shore up economic growth, the Federal Reserve Board (the Fed) brought a key short-term rate—the federal funds rate—down from 5.25% to 2.0% during the 12-month period. After seven rate cuts, the Fed acknowledged that downside risks to growth remained but also that uncertainty about the inflation outlook had continued to increase and that it would be necessary to continue to monitor inflation developments carefully.
Bonds delivered solid gains
The U.S. bond market seesawed during the 12-month period but delivered a solid gain as investors sought the relative safety of the highest quality sectors. After a weak start, bond prices generally rose and yields declined as economic growth slowed in 2007 and stock market volatility increased. Although the benchmark 10-year U.S. Treasury yield edged back above 4.0% in 2008, it remained well below where it started the period, at 4.9%. In this environment, the Lehman Brothers U.S. Aggregate Bond Index returned 6.89%. High-yield bonds did not perform well in 2007 but regained some ground in 2008. The Credit Suisse High Yield Index returned negative 1.23%. Municipal bonds generated solid returns during most of the period, but gave back some performance early in 2008 as industry-specific events threatened investor confidence. In February, yields on municipal bonds rose above yields on comparable maturity Treasuries—and prices f ell—in a difficult month for the sector. In this environment, the Lehman Brothers Municipal Bond Index returned 3.87% for the one-year period.1
Stocks retreat as economic storm clouds gather
Against a shifting economic backdrop, the U.S. stock market lost 6.70% for the 12-month period, as measured by the S&P 500 Index. Large-cap stocks held up better than small- and mid-cap stocks, as measured by their respective Russell indices.2 Growth stocks also held up better than value stocks by a significant margin. As the dollar fell to a record low against the euro and multi-year lows versus a number of other currencies, investors reaped somewhat better results from investments outside the U.S. The MSCI EAFE Index, a broad gauge of stock market performance in foreign developed markets, lost 2.53% (in U.S. dollars) for the period, as a weak second half wiped out solid gains that had been posted in first half of the 12-month period. Emerging stock markets, both collectively and individually, were the top performers. The MSCI Emerging Markets Index returned 22.00% (in U.S. dollars) as demand for exports as well as domestic infrastructure expansion continued.3
Past performance is no guarantee of future results.
1The Lehman Brothers Municipal Bond Index is considered representative of the broad market for investment grade, tax exempt bonds with maturities of at least one year.
2The Russell 1000 Index measures the performance of 1,000 of the largest U.S. companies, based on market capitalization. The Russell Midcap Index measures the performance of the 800 smallest companies in the Russell 1000 Index, as ranked by total market capitalization. The Russell 2000 Index measures the performance of the 2,000 smallest of the 3,000 largest U.S. companies, based on market capitalization.
3The MSCI Emerging Markets Index is a widely accepted index composed of a sample of companies from 25 countries representing the global emerging stock markets.
Indices are not investments, do not incur fees or expenses and are not professionally managed. It is not possible to invest directly in an index. Securities in the fund may not match those in an index.
Summary
For the 12-month period ended May 31, 2008
g Despite volatility in many segments of the bond market, the Lehman Brothers U.S. Aggregate Bond Index delivered a solid return. High-yield bonds lost ground, as measured by the Credit Suisse High Yield Index.
Lehman
Index | | Credit
Suisse Index | |
|
 | |  | |
|
g The broad U.S. stock market, as measured by the S&P 500 Index, returned negative 6.70%. Stock markets in developed countries outside the United States returned negative 2.53%, as measured (in U.S. dollars) by the MSCI EAFE Index. A declining dollar helped offset losses.
| S&P Index | | MSCI Index | |
|
 | |  | |
|
The Lehman Brothers U.S. Aggregate Bond Index is a market value-weighted index that tracks the daily price, coupon, pay-downs and total return performance of fixed-rate, publicly placed, dollar-denominated and non-convertible investment grade debt issues with at least $250 million par amount outstanding and with at least one year to final maturity.
The Credit Suisse High Yield Index is a broad-based index that tracks the performance of high-yield bonds.
The Standard & Poor's (S&P) 500 Index tracks the performance of 500 widely held, large-capitalization U.S. stocks.
The Morgan Stanley Capital International (MSCI) Europe, Australasia, Far East (EAFE) Index is a free float-adjusted market capitalization index that is designed to measure developed market equity performance, excluding the U.S. and Canada.
Indices are not investments, do not incur fees or expenses and are not professionally managed. It is not possible to invest directly in an index. Securities in the fund may not match those in an index.
1
Fund Profile – Columbia Strategic Income Fund
Performance data quoted represents past performance and current performance may be lower or higher. Past performance is no guarantee of future results. The investment return and principal value will fluctuate so that shares, when redeemed, may be worth more or less than the original cost. Please visit www.columbiafunds.com for daily and most recent month-end performance updates.
Summary
1-year return as of 05/31/08
| | | +4.47% | |
|
 | | Class A shares
(without sales charge) | |
|
| | | +6.90% | |
|
 | | Lehman Brothers
Government/Credit Bond Index | |
|
Morningstar Style Box
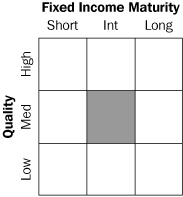
The Morningstar Style BoxTM reveals a fund's investment strategy. For fixed-income funds the vertical axis shows the average credit quality of the bonds owned, and the horizontal axis shows interest rate sensitivity as measured by a bond's duration (short, intermediate or long). All of these numbers are drawn from the data most recently provided by the fund and entered into Morningstar's database as of quarter-end. Although the data gathered is from reliable sources, Morningstar cannot guarantee its completeness and accuracy. Information shown is as of 12/31/07.
Summary
g For the 12-month period that ended May 31, 2008, the fund's Class A shares returned 4.47% without sales charge.
g The fund outperformed the average return of its peer group, the Lipper Multi-Sector Income Funds Classification,1 but trailed its benchmark, the Lehman Brothers Government/Credit Bond Index.2
g Exposure to developed market non-U.S. government bonds aided returns, while investments in the high-yield sector were detractors. An overweight in the U.S. government bond sector helped performance versus the average return of the Lipper peer group, while an underweight in U.S. Treasuries hampered returns relative to its benchmark.
Portfolio Management
Laura A. Ostrander has managed or co-managed Columbia Strategic Income Fund since September 2000, and has been associated with the advisor or its predecessors or affiliate organizations since December 1996.
Kevin L. Cronk, CFA has co-managed the fund since June 2005, and has been associated with the advisor or its predecessors or affiliate organizations since August 1999.
Thomas A. LaPointe, CFA has co-managed the fund since June 2005, and has been associated with the advisor or its predecessors or affiliate organizations since February 1999.
1Lipper Inc., a widely respected data provider in the industry, calculates an average total return (assuming reinvestment of distributions) for mutual funds with investment objectives similar to those of the fund. Lipper makes no adjustment for the effect of sales loads.
2The Lehman Brothers Government/Credit Bond Index tracks the performance of U.S. government and corporate bonds rated investment grade or better with maturities of at least one year. Indices are not investments, do not incur fees or expenses and are not professionally managed. It is not possible to invest directly in an index. Securities in the fund may not match those in an index.
2
Performance Information – Columbia Strategic Income Fund
Growth of a $10,000 investment 06/01/98 – 05/31/08 ($)
The chart above shows the growth in value of a hypothetical $10,000 investment in Class A shares of Columbia Strategic Income Fund during the stated time period, and does not reflect the deduction of taxes that a shareholder may pay on fund distributions or the redemption of fund shares. The Lehman Brothers Government/Credit Bond Index tracks the performance of US government and corporate bonds rated investment grade or better with maturities of at least one year. Indices are not investments, do not incur fees or expenses and are not professionally managed. It is not possible to invest directly in an index. Securities in the fund may not match those in an index.
Performance of a $10,000 investment 06/01/98 – 05/31/08 ($)
| Sales charge | | without | | with | |
| Class A | | | 17,301 | | | | 16,479 | | |
| Class B | | | 16,054 | | | | 16,054 | | |
| Class C | | | 16,291 | | | | 16,291 | | |
| Class J | | | 16,701 | | | | 16,200 | | |
| Class Z | | | 17,579 | | | | n/a | | |
Performance data quoted represents past performance and current performance may be lower or higher. Past performance is no guarantee of future results. The investment return and principal value will fluctuate so that shares, when redeemed, may be worth more or less than the original cost. Please visit www.columbiafunds.com for daily and most recent month-end performance updates.
Annual operating expense ratio (%)*
| Class A | | | 0.96 | | |
| Class B | | | 1.71 | | |
| Class C | | | 1.71 | | |
| Class J | | | 1.32 | | |
| Class Z | | | 0.72 | | |
* The annual operating expense ratio is as stated in the fund's prospectus that is current as of the date of this report. Differences in expense ratios disclosed elsewhere in this report may result from including fee waivers and reimbursements as well as different time periods used in calculating the ratios.
Average annual total return as of 05/31/08 (%)
| Share class | | A | | B | | C | | J | | Z | |
| Inception | | 04/21/77 | | 05/15/92 | | 07/01/97 | | 11/02/98 | | 01/29/99 | |
| Sales charge | | without | | with | | without | | with | | without | | with | | without | | with | | without | |
| 1-year | | | 4.47 | | | | –0.49 | | | | 3.86 | | | | –1.07 | | | | 3.84 | | | | 2.86 | | | | 4.09 | | | | 0.96 | | | | 4.77 | | |
| 5-year | | | 6.54 | | | | 5.51 | | | | 5.75 | | | | 5.44 | | | | 5.90 | | | | 5.90 | | | | 6.14 | | | | 5.50 | | | | 6.78 | | |
| 10-year | | | 5.63 | | | | 5.12 | | | | 4.85 | | | | 4.85 | | | | 5.00 | | | | 5.00 | | | | 5.26 | | | | 4.94 | | | | 5.80 | | |
Average annual total return as of 06/30/08 (%)
| Share class | | A | | B | | C | | J | | Z | |
| Sales charge | | without | | with | | without | | with | | without | | with | | without | | with | | without | |
| 1-year | | | 4.28 | | | | –0.67 | | | | 3.67 | | | | –1.25 | | | | 3.65 | | | | 2.67 | | | | 3.89 | | | | 0.77 | | | | 4.58 | | |
| 5-year | | | 6.15 | | | | 5.12 | | | | 5.36 | | | | 5.05 | | | | 5.51 | | | | 5.51 | | | | 5.75 | | | | 5.10 | | | | 6.38 | | |
| 10-year | | | 5.53 | | | | 5.02 | | | | 4.74 | | | | 4.74 | | | | 4.90 | | | | 4.90 | | | | 5.15 | | | | 4.83 | | | | 5.70 | | |
The "with sales charge" returns include the maximum initial sales charge of 4.75% for Class A shares and 3.00% for Class J shares, the applicable contingent deferred sales charge of 5.00% in the first year declining to 1.00% in the sixth year and eliminated thereafter for Class B shares and 1.00% for Class C shares for the first year only. The "without sales charge" returns do not include the effect of sales charges. If they had, returns would be lower.
Performance results reflect any fee waivers or reimbursements of fund expenses by the investment advisor and/or any of its affiliates. Absent these fee waivers or expense reimbursement arrangements, performance results would have been lower.
All results shown assume reinvestment of distributions. Class Z shares are sold at net asset value with no distribution and service (Rule 12b-1) fees. Class Z shares have limited eligibility and the investment minimum requirements may vary. Please see the fund's prospectus for details. Performance for different share classes will vary based on differences in sales charges and fees associated with each class.
The tables do not reflect the deduction of taxes that a shareholder may pay on fund distributions or the redemption of fund shares.
The returns shown for the Fund's Class J and Class Z shares include the returns of the Fund's Class A shares for periods prior to November 2, 1998 and January 29, 1999, respectively, the date on which the Fund's Class J and Class Z shares were first offered. The returns shown have been adjusted to reflect the fact that Class Z shares are sold without a sales charge. The returns shown have not been adjusted to reflect any differences in expenses between Class J or Class Z shares and Class A shares of the Fund. If differences in expenses had been reflected, the returns shown for Class J shares for periods prior to November 2, 1998 would have been lower and the returns shown for Class Z shares for periods prior to January 29, 1999 would have been higher.
3
Understanding Your Expenses – Columbia Strategic Income Fund
Estimating your actual expenses
To estimate the expenses that you paid over the period, first you will need your account balance at the end of the period:
g For shareholders who receive their account statements from Columbia Management Services, Inc., your account balance is available online at www.columbiafunds.com or by calling Shareholder Services at 800.345.6611.
g For shareholders who receive their account statements from their financial intermediary, contact your financial intermediary to obtain your account balance.
1. Divide your ending account balance by $1,000. For example, if an account balance was $8,600 at the end of the period, the result would be 8.6.
2. In the section of the table below titled "Expenses paid during the period," locate the amount for your share class. You will find this number in the column labeled "actual." Multiply this number by the result from step 1. Your answer is an estimate of the expenses you paid on your account during the period.
If the value of your account falls below the minimum initial investment requirement applicable to you, your account generally will be subject to a $20 annual fee. This fee is not included in the accompanying table. If you are subject to the fee, keep it in mind when you are estimating the ongoing expenses of investing in the fund and when comparing the expenses of this fund with other funds.
As a fund shareholder, you incur two types of costs. There are transaction costs, which generally include sales charges on purchases and may include redemption fees or exchange fees. There are also ongoing costs, which generally include investment advisory fees, distribution and service (Rule 12b-1) fees and other fund expenses. The information on this page is intended to help you understand the ongoing costs of investing in the fund and to compare these costs with the ongoing costs of investing in other mutual funds.
Analyzing your fund's expenses by share class
To illustrate these ongoing costs, we have provided an example and calculated the expenses paid by investors in each share class during the period. The information in the following table is based on an initial investment of $1,000, which is invested at the beginning of the reporting period and held for the entire period. Expense information is calculated two ways and each method provides you with different information. The amount listed in the "actual" column is calculated using the fund's actual operating expenses and total return for the period. The amount listed in the "hypothetical" column for each share class assumes that the return each year is 5% before expenses and is calculated based on the fund's actual operating expenses. You should not use the hypothetical account values and expenses to estimate either your actual account balance at the end of the period or the expenses you paid during this reporting period.
Compare with other funds
Since all mutual funds are required to include the same hypothetical calculations about expenses in shareholder reports, you can use this information to compare the ongoing cost of investing in the fund with other funds. To do so, compare the 5% hypothetical example with the 5% hypothetical examples that appear in the shareholder reports of other funds. As you compare hypothetical examples of other funds, it is important to note that hypothetical examples are meant to highlight the ongoing costs of investing in a fund and do not reflect any transaction costs, such as sales charges, redemption fees or exchange fees.
12/01/07 – 05/31/08
| | | Account value at the
beginning of the period ($) | | Account value at the
end of the period ($) | | Expenses paid
during the period ($) | | Fund's annualized
expense ratio (%) | |
| | | Actual | | Hypothetical | | Actual | | Hypothetical | | Actual | | Hypothetical | | Actual | |
| Class A | | | 1,000.00 | | | | 1,000.00 | | | | 1,017.00 | | | | 1,020.25 | | | | 4.79 | | | | 4.80 | | | | 0.95 | | |
| Class B | | | 1,000.00 | | | | 1,000.00 | | | | 1,014.90 | | | | 1,016.50 | | | | 8.56 | | | | 8.57 | | | | 1.70 | | |
| Class C | | | 1,000.00 | | | | 1,000.00 | | | | 1,013.90 | | | | 1,017.25 | | | | 7.80 | | | | 7.82 | | | | 1.55 | | |
| Class J | | | 1,000.00 | | | | 1,000.00 | | | | 1,015.10 | | | | 1,018.10 | | | | 6.95 | | | | 6.96 | | | | 1.38 | | |
| Class Z | | | 1,000.00 | | | | 1,000.00 | | | | 1,018.40 | | | | 1,021.50 | | | | 3.53 | | | | 3.54 | | | | 0.70 | | |
Expenses paid during the period are equal to the annualized expense ratio for the share class, multiplied by the average account value over the period, then multiplied by the number of days in the fund's most recent fiscal half-year and divided by 366.
Had the investment advisor and/or any of its affiliates not waived fees or reimbursed a portion of expenses for Class C shares, account value at the end of the period would have been reduced.
It is important to note that the expense amounts shown in the table are meant to highlight only ongoing costs of investing in the fund and do not reflect any transaction costs, such as sales charges, redemption fees or exchange fees. Therefore, the hypothetical examples provided may not help you determine the relative total costs of owning shares of different funds. If these transaction costs were included, your costs would have been higher.
4
Portfolio Managers' Report – Columbia Strategic Income Fund
For the 12-month period that ended May 31, 2008, Class A shares of Columbia Strategic Income Fund returned 4.47% without sales charge. This was higher than the 1.65% average return of the fund's peer group, the Lipper Multi-Sector Income Funds Classification.1 We believe that the fund benefited from having larger stakes than its peer group in developed market foreign and U.S. government bonds. Both sectors posted strong gains as volatility in the financial markets prompted an investor flight to quality. The fund trailed its benchmark, the Lehman Brothers Government/Credit Bond Index,2 which returned 6.90% for the period. A sizable stake in high-yield bonds, which are not represented in the index, and an underweight versus the index in U.S. Treasuries hampered relative returns.
Foreign exposure gave a strong boost to returns
About 34% of the fund's net assets were in foreign government bonds, which are not included in the fund's benchmark, but produced robust gains as global yields declined. Bonds denominated in foreign currencies from developed markets represented about two-thirds of the fund's foreign allocation and returned over 15% for the year. The fund also owned emerging market debt, which returned only about 5% as global liquidity declined and investors became more risk averse. Emerging market debt detracted from the fund's return versus the fund's benchmark. However, the fund's above-average currency exposure helped as the U.S. dollar lost value against most other currencies.
U.S. government bonds also delivered strong gains
As the subprime mortgage market's problems triggered credit concerns and U.S. economic growth slowed, investors headed to safe havens. Among the biggest beneficiaries were U.S. government bonds, whose yields fell sharply, bolstering bond prices and putting returns well ahead of other fixed-income sectors. The best performers were 10-year Treasuries, which gained 10.7% for the year. Two-year Treasuries returned 7.7%, buoyed by the Federal Reserve's aggressive cuts in short-term interest rates. The fund's government bond weight was higher than its peer group, which was positive. However, a lower stake than the fund's benchmark in U.S. Treasuries hampered returns relative to that index. The fund had approximately 18.5% of its net assets in U.S. government issues compared to 59% in the index.
High-yield bonds were weak performers
High-yield issues, which accounted for over 28% of net assets, detracted from performance, as weak economic conditions made investors more risk averse. Within this sector, bonds with the lowest credit quality ratings (CCC) were the worst performers, while those with the highest credit quality ratings held up better. An underweight in the highest credit quality rated securities, as well as some company-specific disappointments, hindered returns. An overweight relative to the benchmark in
1Lipper Inc., a widely respected data provider in the industry, calculates an average total return (assuming reinvestment of distributions) for mutual funds with investment objectives similar to those of the fund. Lipper makes no adjustment for the effect of sales loads.
2The Lehman Brothers Government/Credit Bond Index tracks the performance of U.S. government and corporate bonds rated investment grade or better with maturities of at least one year. Indices are not investments, do not incur fees or expenses and are not professionally managed. It is not possible to invest directly in an index. Securities in the fund may not match those in an index.
Performance data quoted represents past performance and current performance may be lower or higher. Past performance is no guarantee of future results. The investment return and principal value will fluctuate so that shares, when redeemed, may be worth more or less than the original cost. Please visit www.columbiafunds.com for daily and most recent month-end performance updates.
Net asset value per share
as of 05/31/08 ($)
| Class A | | | 5.91 | | |
| Class B | | | 5.91 | | |
| Class C | | | 5.91 | | |
| Class J | | | 5.89 | | |
| Class Z | | | 5.85 | | |
Distributions declared per share
06/01/07 – 05/31/08 ($)
| Class A | | | 0.36 | | |
| Class B | | | 0.31 | | |
| Class C | | | 0.32 | | |
| Class J | | | 0.34 | | |
| Class Z | | | 0.37 | | |
30-day SEC yields
as of 05/31/08 (%)
| Class A | | | 4.97 | | |
| Class B | | | 4.45 | | |
| Class C | | | 4.60 | | |
| Class J | | | 4.38 | | |
| Class Z | | | 5.46 | | |
The 30-day SEC yields reflect the fund's earning power, net of expenses, expressed as an annualized percentage of the public offering price per share at the end of the period.
5
Portfolio Managers' Report (continued) – Columbia Strategic Income Fund
Maturity breakdown
as of 05/31/08 (%)
| 0-1 year | | | 7.4 | | |
| 1-3 years | | | 11.2 | | |
| 3-5 years | | | 15.4 | | |
| 5-7 years | | | 23.9 | | |
| 7-10 years | | | 18.3 | | |
| 10-15 years | | | 3.9 | | |
| 15-20 years | | | 3.6 | | |
| 20-30 years | | | 10.0 | | |
| 30 years and over | | | 1.2 | | |
| Other | | | 5.1 | | |
Portfolio structure
as of 05/31/08 (%)
Corporate fixed-income
bonds & notes | | | 34.3 | | |
Foreign government
obligations | | | 33.9 | | |
U.S. government
obligations | | | 18.7 | | |
| Mortgage-backed securities | | | 6.0 | | |
| U.S. government agencies | | | 1.2 | | |
| Asset-backed securities | | | 1.1 | | |
| Municipal bonds | | | 0.3 | | |
Collateralized mortgage
obligations | | | 0.1 | | |
| Other | | | 4.4 | | |
Quality breakdown
as of 05/31/08 (%)
| AAA | | | 52.1 | | |
| AA | | | 0.1 | | |
| A | | | 3.6 | | |
| BBB | | | 7.1 | | |
| BB | | | 12.9 | | |
| B | | | 16.2 | | |
| CCC | | | 6.4 | | |
| CC | | | 0.1 | | |
| Not Rated | | | 0.8 | | |
| Other | | | 0.7 | | |
The fund is actively managed and the composition of its portfolio will change over time. Maturity breakdown, portfolio structure and quality breakdown are calculated as a percentage of total investments excluding securities lending collateral. Ratings shown in the quality breakdown represent the rating assigned to a particular bond by one of the following nationally recognized rating agencies: Standard & Poor's, a division of The McGraw-Hill Companies, Inc., Moody's Investors Service, Inc. or Fitch Ratings Ltd. Ratings are relative and subjective and are not absolute standards of quality. The fund's credit quality does not remove market risk.
the casino and gaming industry, which historically has performed well even during economic slowdowns, also hurt performance, reflecting investor concerns that slower consumer spending could result in loan defaults or late payments from companies with high debt levels. Among the better high-yield performers were energy and utility issues.
Slower global growth and more volatility is expected
Going forward, we think that U.S. financial markets could remain bumpy, as weak consumer spending, higher inflation expectations, deteriorating employment numbers and the housing slowdown continue to pressure economic growth. Volatility may result in periodic flights to quality, which would continue to help U.S. Treasuries. Major industrialized economies in Europe and Japan may see slowing economic growth, but we believe they have the potential to outpace U.S. growth in the near term. We do not expect yields on foreign government bonds to keep pace with yields on U.S. Treasuries in a declining interest rate environment, but we believe currencies should strengthen against the U.S. dollar. We believe that emerging market debt could be pressured by global liquidity concerns, while high-yield issues could be vulnerable to continued weakness in the economy. Until market conditions change, we plan to maintain the fund's positioning, w ith sizable stakes in U.S. Treasuries as well as the government bonds of foreign developed markets, denominated in their local currencies.
Portfolio holdings and characteristics are subject to change periodically and may not be representative of current holdings and characteristics. The outlook for the fund may differ from those presented for other Columbia Funds.
Investing in fixed-income securities may involve certain risks, including the credit quality of individual issuers, possible prepayments, market or economic developments and yield and share price fluctuations due to changes in interest rates. When interest rates go up, bond prices typically drop, and vice versa. Investing in foreign fixed-income markets carries additional risks associated with foreign political and economic developments and changes in currency exchange rates.
Investing in high-yield or "junk" bonds offers the potential for higher income than investments in investment-grade bonds, but also has a higher degree of risk. Changes in economic conditions or other circumstances may adversely affect a high-yield bond issuer's ability to make timely principal and interest payments. High-yield bonds issued by foreign entities have greater potential risks, including foreign taxation, currency fluctuations, risks associated with possible differences in financial standards and other monetary and political risks.
Investing in emerging markets may involve greater risks than investing in more developed countries. In addition, concentration of investments in a single region may result in greater volatility.
6
Investment Portfolio – Columbia Strategic Income Fund
May 31, 2008
Government & Agency Obligations – 53.4%
| | | Par ($)(a) | | Value ($) | |
| Foreign Government Obligations – 33.7% | |
| Aries Vermoegensverwaltungs GmbH | |
| 7.750% 10/25/09 (b) | | EUR | 2,750,000 | | | | 4,414,019 | | |
| 7.750% 10/25/09 | | EUR | 2,500,000 | | | | 4,012,745 | | |
| Corp. Andina de Fomento | |
| 6.375% 06/18/09 | | EUR | 4,350,000 | | | | 6,764,316 | | |
| European Investment Bank | |
| 0.751% 09/21/11 (c) | | JPY | 2,715,000,000 | | | | 25,750,418 | | |
| 1.250% 09/20/12 | | JPY | 1,135,000,000 | | | | 10,693,494 | | |
| 5.500% 12/07/11 | | GBP | 5,250,000 | | | | 10,373,623 | | |
| Export Development Canada | |
| 0.880% 09/22/08 | | JPY | 1,875,000,000 | | | | 17,793,700 | | |
| Federal Republic of Brazil | |
| 6.000% 01/17/17 | | | 6,850,000 | | | | 7,233,600 | | |
| 7.375% 02/03/15 | | EUR | 6,950,000 | | | | 11,846,130 | | |
| 8.750% 02/04/25 | | | 4,500,000 | | | | 5,805,000 | | |
| 11.000% 08/17/40 | | | 12,400,000 | | | | 16,870,200 | | |
| 12.500% 01/05/16 | | BRL | 7,685,000 | | | | 4,890,240 | | |
| Federal Republic of Germany | |
| 4.250% 07/04/14 | | EUR | 12,990,000 | | | | 20,105,109 | | |
| 5.000% 07/04/12 | | EUR | 6,585,000 | | | | 10,478,495 | | |
| 6.000% 06/20/16 | | EUR | 9,500,000 | | | | 16,313,449 | | |
| Government of Canada | |
| 4.000% 06/01/17 | | CAD | 4,695,000 | | | | 4,831,559 | | |
| 4.500% 06/01/15 | | CAD | 9,760,000 | | | | 10,425,204 | | |
| 5.000% 06/01/14 | | CAD | 9,640,000 | | | | 10,534,921 | | |
| 9.500% 06/01/10 | | CAD | 12,380,000 | | | | 14,016,961 | | |
| Government of New Zealand | |
| 6.000% 11/15/11 | | NZD | 6,300,000 | | | | 4,822,161 | | |
| Kingdom of Norway | |
| 5.500% 05/15/09 | | NOK | 100,170,000 | | | | 19,538,705 | | |
| 6.000% 05/16/11 | | NOK | 97,330,000 | | | | 19,419,086 | | |
| Kingdom of Sweden | |
| 5.000% 01/28/09 | | SEK | 112,860,000 | | | | 18,881,785 | | |
| 6.750% 05/05/14 | | SEK | 178,600,000 | | | | 33,323,983 | | |
| Kreditanstalt fuer Wiederaufbau | |
| 0.706% 08/08/11 (c) | | JPY | 1,170,000,000 | | | | 11,100,228 | | |
| New South Wales Treasury Corp. | |
| 5.500% 08/01/14 | | AUD | 11,000,000 | | | | 9,705,636 | | |
| Pemex Project Funding Master Trust | |
| 5.750% 03/01/18 (b) | | | 6,570,000 | | | | 6,537,150 | | |
| 5.750% 03/01/18 | | | 3,800,000 | | | | 3,781,000 | | |
| 6.625% 04/04/10 | | EUR | 3,025,000 | | | | 4,780,029 | | |
| Philippine Government International Bond | |
| 9.500% 02/02/30 | | | 4,300,000 | | | | 5,573,875 | | |
| Province of Quebec | |
| 4.500% 12/01/16 | | CAD | 8,710,000 | | | | 8,879,098 | | |
| 6.000% 10/01/12 | | CAD | 7,155,000 | | | | 7,813,539 | | |
| Queensland Treasury Corp. | |
| 6.000% 08/14/13 | | AUD | 19,495,000 | | | | 17,769,107 | | |
| Republic of Chile | |
| 7.125% 01/11/12 | | | 3,000,000 | | | | 3,253,080 | | |
| | | Par ($)(a) | | Value ($) | |
| Republic of Colombia | |
| 8.125% 05/21/24 | | | 8,525,000 | | | | 10,315,250 | | |
| 9.750% 04/09/11 | | | 3,313,650 | | | | 3,595,310 | | |
| Republic of France | |
| 4.000% 04/25/13 | | EUR | 16,290,000 | | | | 24,903,456 | | |
| 4.250% 10/25/17 | | EUR | 17,045,000 | | | | 25,874,934 | | |
| 4.750% 10/25/12 | | EUR | 15,400,000 | | | | 24,262,816 | | |
| Republic of Italy | |
| 4.250% 02/01/15 | | EUR | 7,765,000 | | | | 11,845,673 | | |
| Republic of Panama | |
| 6.700% 01/26/36 | | | 6,900,000 | | | | 7,210,500 | | |
| 8.875% 09/30/27 | | | 7,270,000 | | | | 9,160,200 | | |
| Republic of Peru | |
| 9.875% 02/06/15 | | | 8,700,000 | | | | 11,005,500 | | |
| Republic of Poland | |
| 4.750% 04/25/12 | | PLN | 9,300,000 | | | | 4,045,778 | | |
| 5.750% 03/24/10 | | PLN | 36,900,000 | | | | 16,795,419 | | |
| Republic of South Africa | |
| 6.500% 06/02/14 | | | 3,650,000 | | | | 3,805,125 | | |
| 13.000% 08/31/09 | | ZAR | 9,073,333 | | | | 1,207,600 | | |
| 13.000% 08/31/10 | | ZAR | 10,853,334 | | | | 1,468,367 | | |
| 13.000% 08/31/11 | | ZAR | 9,073,333 | | | | 1,248,592 | | |
| Republic of Venezuela | |
| 7.000% 03/16/15 | | EUR | 3,000,000 | | | | 3,941,398 | | |
| Russian Federation | |
| 7.500% 03/31/30 | | | 21,236,600 | | | | 24,179,993 | | |
| 11.000% 07/24/18 | | | 5,752,000 | | | | 8,223,462 | | |
| 12.750% 06/24/28 | | | 7,430,000 | | | | 13,355,425 | | |
| United Kingdom Treasury | |
| 5.000% 09/07/14 | | GBP | 3,510,000 | | | | 6,978,546 | | |
| 5.750% 12/07/09 | | GBP | 2,550,000 | | | | 5,104,839 | | |
| 8.000% 09/27/13 | | GBP | 3,280,000 | | | | 7,386,580 | | |
| 9.000% 07/12/11 | | GBP | 5,350,000 | | | | 11,773,114 | | |
| United Mexican States | |
| 6.050% 01/11/40 | | | 2,350,000 | | | | 2,314,750 | | |
| 6.750% 09/27/34 | | | 2,820,000 | | | | 3,082,824 | | |
| 8.125% 12/30/19 | | | 11,020,000 | | | | 13,571,130 | | |
| 8.375% 01/14/11 | | | 14,270,000 | | | | 15,754,080 | | |
| 11.375% 09/15/16 | | | 7,590,000 | | | | 10,701,900 | | |
| Foreign Government Obligations Total | | | 671,444,206 | | |
| U.S. Government Agencies – 1.2% | |
| Federal Home Loan Mortgage Corp. | |
| 5.125% 10/15/08 (d) | | | 1,280,000 | | | | 1,293,317 | | |
| 5.750% 03/15/09 (d) | | | 1,010,000 | | | | 1,034,195 | | |
| 6.750% 03/15/31 (d) | | | 406,000 | | | | 485,861 | | |
| Federal National Mortgage Association | |
| 3.250% 08/15/08 | | | 8,000,000 | | | | 8,013,512 | | |
| 4.375% 07/17/13 (d) | | | 3,003,000 | | | | 3,041,414 | | |
| 5.000% 09/15/08 (d) | | | 10,000,000 | | | | 10,082,710 | | |
| U.S. Government Agencies Total | | | 23,951,009 | | |
See Accompanying Notes to Financial Statements.
7
Columbia Strategic Income Fund, May 31, 2008
Government & Agency Obligations (continued)
| | | Par ($)(a) | | Value ($) | |
| U.S. Government Obligations – 18.5% | |
| U.S. Treasury Bonds | |
| 5.375% 02/15/31 (d) | | | 29,000,000 | | | | 31,621,339 | | |
| 7.500% 11/15/24 (d) | | | 18,400,000 | | | | 24,397,259 | | |
| 8.875% 02/15/19 (d) | | | 21,827,000 | | | | 30,334,422 | | |
| 10.625% 08/15/15 (d) | | | 29,415,000 | | | | 41,973,823 | | |
| 12.500% 08/15/14 (d) | | | 52,151,000 | | | | 58,152,433 | | |
| U.S. Treasury Notes | |
| 4.000% 09/30/09 (d) | | | 20,000,000 | | | | 20,409,380 | | |
| 4.250% 09/30/12 (d) | | | 40,000,000 | | | | 41,543,760 | | |
| 5.000% 02/15/11 (d) | | | 47,600,000 | | | | 50,303,537 | | |
| 5.125% 06/30/08 (d) | | | 10,000,000 | | | | 10,026,560 | | |
| 5.125% 05/15/16 (d) | | | 46,000,000 | | | | 49,759,074 | | |
| U.S. Treasury STRIPS | |
| (e) 11/15/08 (d) | | | 7,000,000 | | | | 6,935,005 | | |
| (e) 05/15/23 (d) P.O. | | | 4,550,000 | | | | 2,199,770 | | |
| (e) 11/15/13 (d) | | | 2,250,000 | | | | 1,849,230 | | |
| U.S. Government Obligations Total | | | 369,505,592 | | |
Total Government & Agency Obligations
(Cost of $1,026,195,295) | | | 1,064,900,807 | | |
| Corporate Fixed-Income Bonds & Notes – 34.0% | |
| Basic Materials – 2.7% | |
| Chemicals – 0.9% | |
| Agricultural Chemicals – 0.2% | |
| Mosaic Co. | |
| 7.875% 12/01/16 (b) | | | 3,105,000 | | | | 3,368,925 | | |
| Terra Capital, Inc. | |
| 7.000% 02/01/17 | | | 950,000 | | | | 944,063 | | |
| | | | 4,312,988 | | |
| Chemicals-Diversified – 0.5% | |
| Huntsman International LLC | |
| 6.875% 11/15/13 (b) | | EUR | 1,165,000 | | | | 1,819,245 | | |
| 7.875% 11/15/14 | | | 3,190,000 | | | | 3,413,300 | | |
| Ineos Group Holdings PLC | |
| 8.500% 02/15/16 (b) | | | 3,015,000 | | | | 2,344,162 | | |
| NOVA Chemicals Corp. | |
| 6.500% 01/15/12 | | | 3,195,000 | | | | 2,971,350 | | |
| | | | 10,548,057 | | |
| Chemicals-Specialty – 0.2% | |
| Chemtura Corp. | |
| 6.875% 06/01/16 | | | 2,560,000 | | | | 2,380,800 | | |
| MacDermid, Inc. | |
| 9.500% 04/15/17 (b) | | | 1,730,000 | | | | 1,678,100 | | |
| | | | 4,058,900 | | |
| Chemicals Total | | | 18,919,945 | | |
| | | Par ($)(a) | | Value ($) | |
| Forest Products & Paper – 0.6% | |
| Paper & Related Products – 0.6% | |
| Abitibi-Consolidated, Inc. | |
| 8.375% 04/01/15 | | | 3,900,000 | | | | 1,706,250 | | |
| Domtar Corp. | |
| 7.125% 08/15/15 | | | 3,080,000 | | | | 2,941,400 | | |
| Georgia-Pacific Corp. | |
| 8.000% 01/15/24 | | | 3,060,000 | | | | 2,952,900 | | |
| NewPage Corp. | |
| 10.000% 05/01/12 (b) | | | 1,370,000 | | | | 1,459,050 | | |
| 12.000% 05/01/13 | | | 1,305,000 | | | | 1,380,037 | | |
PIK,
9.986% 11/01/13 | | | 930,000 | | | | 910,238 | | |
| | | | 11,349,875 | | |
| Forest Products & Paper Total | | | 11,349,875 | | |
| Iron/Steel – 0.2% | |
| Steel-Producers – 0.2% | |
| Steel Dynamics, Inc. | |
| 7.750% 04/15/16 (b) | | | 3,605,000 | | | | 3,614,012 | | |
| | | | 3,614,012 | | |
| Iron/Steel Total | | | 3,614,012 | | |
| Metals & Mining – 1.0% | |
| Diversified Minerals – 0.2% | |
| FMG Finance Ltd. | |
| 10.625% 09/01/16 (b) | | | 3,670,000 | | | | 4,257,200 | | |
| | | | 4,257,200 | | |
| Metal-Diversified – 0.4% | |
| Freeport-McMoRan Copper & Gold, Inc. | |
| 8.375% 04/01/17 | | | 7,670,000 | | | | 8,245,250 | | |
| | | | 8,245,250 | | |
| Mining Services – 0.1% | |
| Noranda Aluminium Holding Corp. | |
PIK,
8.578% 11/15/14 (b)(c) | | | 2,255,000 | | | | 1,973,125 | | |
| | | | 1,973,125 | | |
| Non-Ferrous Metals – 0.3% | |
| Codelco, Inc. | |
| 5.500% 10/15/13 | | | 6,000,000 | | | | 6,101,700 | | |
| | | | 6,101,700 | | |
| Metals & Mining Total | | | 20,577,275 | | |
| Basic Materials Total | | | 54,461,107 | | |
See Accompanying Notes to Financial Statements.
8
Columbia Strategic Income Fund, May 31, 2008
Corporate Fixed-Income Bonds & Notes (continued)
| | | Par ($)(a) | | Value ($) | |
| Communications – 5.9% | |
| Media – 2.2% | |
| Cable TV – 0.9% | |
| Atlantic Broadband Finance LLC | |
| 9.375% 01/15/14 | | | 1,460,000 | | | | 1,359,625 | | |
| Cablevision Systems Corp. | |
| 8.000% 04/15/12 | | | 2,089,000 | | | | 2,031,553 | | |
| Charter Communications Holdings I LLC | |
| 11.000% 10/01/15 | | | 2,315,000 | | | | 1,967,750 | | |
| Charter Communications Holdings II LLC | |
| 10.250% 09/15/10 | | | 1,555,000 | | | | 1,547,225 | | |
| CSC Holdings, Inc. | |
| 7.625% 04/01/11 | | | 4,075,000 | | | | 4,075,000 | | |
| DirecTV Holdings LLC | |
| 6.375% 06/15/15 | | | 3,700,000 | | | | 3,510,375 | | |
| EchoStar DBS Corp. | |
| 6.625% 10/01/14 | | | 4,240,000 | | | | 3,996,200 | | |
| | | | 18,487,728 | | |
| Multimedia – 0.4% | |
| CanWest MediaWorks LP | |
| 9.250% 08/01/15 (b) | | | 3,130,000 | | | | 2,738,750 | | |
| Lamar Media Corp. | |
| 6.625% 08/15/15 | | | 3,330,000 | | | | 3,138,525 | | |
| Quebecor Media, Inc. | |
| 7.750% 03/15/16 | | | 3,765,000 | | | | 3,689,700 | | |
| | | | 9,566,975 | | |
| Publishing-Books – 0.2% | |
| TL Acquisitions, Inc. | |
| 10.500% 01/15/15 (b) | | | 4,040,000 | | | | 3,676,400 | | |
| | | | 3,676,400 | | |
| Publishing-Periodicals – 0.5% | |
| Dex Media, Inc. | |
(f) 11/15/13
(9.000% 11/15/08) | | | 1,775,000 | | | | 1,375,625 | | |
| Idearc, Inc. | |
| 8.000% 11/15/16 | | | 4,455,000 | | | | 3,185,325 | | |
| Penton Media, Inc. | |
| 7.899% 02/01/14 (g) | | | 1,000,000 | | | | 700,000 | | |
| R.H. Donnelley Corp. | |
| 8.875% 01/15/16 | | | 2,030,000 | | | | 1,390,550 | | |
| 8.875% 10/15/17 (b) | | | 4,595,000 | | | | 3,078,650 | | |
| | | | 9,730,150 | | |
| Radio – 0.1% | |
| CMP Susquehanna Corp. | |
| 9.875% 05/15/14 | | | 2,185,000 | | | | 1,540,425 | | |
| | | | 1,540,425 | | |
| | | Par ($)(a) | | Value ($) | |
| Television – 0.1% | |
| Local TV Finance LLC | |
PIK,
9.250% 06/15/15 (b) | | | 1,585,000 | | | | 1,275,925 | | |
| | | | 1,275,925 | | |
| Media Total | | | 44,277,603 | | |
| Telecommunication Services – 3.7% | |
| Cellular Telecommunications – 1.2% | |
| Cricket Communications, Inc. | |
| 9.375% 11/01/14 | | | 4,315,000 | | | | 4,163,975 | | |
| Digicel Group Ltd. | |
| 8.875% 01/15/15 (b) | | | 3,875,000 | | | | 3,555,313 | | |
| MetroPCS Wireless, Inc. | |
| 9.250% 11/01/14 | | | 4,225,000 | | | | 4,061,281 | | |
| Orascom Telecom Finance SCA | |
| 7.875% 02/08/14 (b) | | | 1,150,000 | | | | 1,101,125 | | |
| Rural Cellular Corp. | |
| 6.076% 06/01/13 (c) | | | 2,100,000 | | | | 2,121,000 | | |
| 8.623% 11/01/12 (c) | | | 1,845,000 | | | | 1,877,288 | | |
| US Unwired, Inc. | |
| 10.000% 06/15/12 | | | 2,540,000 | | | | 2,470,150 | | |
| Wind Acquisition Financial SA | |
PIK,
9.984% 12/21/11 (g) | | | 4,432,325 | | | | 4,257,580 | | |
| | | | 23,607,712 | | |
| Satellite Telecommunications – 0.6% | |
| Inmarsat Finance II PLC | |
(f) 11/15/12
(10.375% 11/15/08) | | | 2,855,000 | | | | 2,855,000 | | |
| Intelsat Bermuda Ltd. | |
| 9.250% 06/15/16 | | | 1,500,000 | | | | 1,515,000 | | |
| 11.250% 06/15/16 | | | 3,960,000 | | | | 4,039,200 | | |
| Intelsat Intermediate Holdings Co., Ltd. | |
(f) 02/01/15
(9.250% 02/01/10) | | | 4,310,000 | | | | 3,641,950 | | |
| | | | 12,051,150 | | |
| Telecommunication Equipment – 0.2% | |
| Lucent Technologies, Inc. | |
| 6.450% 03/15/29 | | | 4,510,000 | | | | 3,455,787 | | |
| | | | 3,455,787 | | |
| Telecommunication Services – 0.6% | |
| Hellas Telecommunications Luxembourg II | |
| 8.463% 01/15/15 (b)(c) | | | 1,385,000 | | | | 1,066,450 | | |
| Nordic Telephone Co. Holdings ApS | |
| 8.250% 05/01/16 (b) | | EUR | 1,285,000 | | | | 1,909,177 | | |
| 8.875% 05/01/16 (b) | | | 1,225,000 | | | | 1,206,625 | | |
| Syniverse Technologies, Inc. | |
| 7.750% 08/15/13 | | | 1,570,000 | | | | 1,507,200 | | |
See Accompanying Notes to Financial Statements.
9
Columbia Strategic Income Fund, May 31, 2008
Corporate Fixed-Income Bonds & Notes (continued)
| | | Par ($)(a) | | Value ($) | |
| Time Warner Telecom Holdings, Inc. | |
| 9.250% 02/15/14 | | | 2,815,000 | | | | 2,913,525 | | |
| West Corp. | |
| 11.000% 10/15/16 | | | 3,045,000 | | | | 2,694,825 | | |
| | | | 11,297,802 | | |
| Telephone-Integrated – 1.1% | |
| Citizens Communications Co. | |
| 7.875% 01/15/27 | | | 3,885,000 | | | | 3,496,500 | | |
| Qwest Communications International, Inc. | |
| 7.500% 02/15/14 | | | 2,610,000 | | | | 2,557,800 | | |
| Qwest Corp. | |
| 7.500% 10/01/14 | | | 1,340,000 | | | | 1,333,300 | | |
| 7.500% 06/15/23 | | | 3,585,000 | | | | 3,307,162 | | |
| 8.875% 03/15/12 | | | 2,775,000 | | | | 2,906,813 | | |
| Virgin Media Finance PLC | |
| 8.750% 04/15/14 | | EUR | 2,595,000 | | | | 3,855,497 | | |
| 8.750% 04/15/14 | | | 525,000 | | | | 515,813 | | |
| Windstream Corp. | |
| 8.625% 08/01/16 | | | 4,315,000 | | | | 4,460,631 | | |
| | | | 22,433,516 | | |
| Telecommunication Services Total | | | 72,845,967 | | |
| Communications Total | | | 117,123,570 | | |
| Consumer Cyclical – 4.9% | |
| Apparel – 0.2% | |
| Apparel Manufacturers – 0.2% | |
| Levi Strauss & Co. | |
| 9.750% 01/15/15 | | | 4,430,000 | | | | 4,640,425 | | |
| | | | 4,640,425 | | |
| Apparel Total | | | 4,640,425 | | |
| Auto Manufacturers – 0.4% | |
| Auto-Cars/Light Trucks – 0.4% | |
| Ford Motor Co. | |
| 7.450% 07/16/31 | | | 3,860,000 | | | | 2,673,050 | | |
| General Motors Corp. | |
| 8.375% 07/15/33 | | | 8,335,000 | | | | 5,709,475 | | |
| | | | 8,382,525 | | |
| Auto Manufacturers Total | | | 8,382,525 | | |
| Auto Parts & Equipment – 0.7% | |
| Auto/Truck Parts & Equipment-Original – 0.4% | |
| ArvinMeritor, Inc. | |
| 8.125% 09/15/15 | | | 1,880,000 | | | | 1,605,050 | | |
| Cooper-Standard Automotive, Inc. | |
| 7.000% 12/15/12 | | | 2,020,000 | | | | 1,818,000 | | |
| Hayes Lemmerz Finance Luxembourg SA | |
| 8.250% 06/15/15 | | EUR | 2,050,000 | | | | 2,712,488 | | |
| TRW Automotive, Inc. | |
| 7.000% 03/15/14 (b) | | | 2,535,000 | | | | 2,395,575 | | |
| | | | 8,531,113 | | |
| | | Par ($)(a) | | Value ($) | |
| Auto/Truck Parts & Equipment-Replacement – 0.1% | |
| Commercial Vehicle Group, Inc. | |
| 8.000% 07/01/13 | | | 2,380,000 | | | | 2,064,650 | | |
| | | | 2,064,650 | | |
| Rubber-Tires – 0.2% | |
| Goodyear Tire & Rubber Co. | |
| 8.625% 12/01/11 | | | 560,000 | | | | 590,800 | | |
| 9.000% 07/01/15 | | | 2,720,000 | | | | 2,917,200 | | |
| | | | 3,508,000 | | |
| Auto Parts & Equipment Total | | | 14,103,763 | | |
| Distribution/Wholesale – 0.1% | |
| Buhrmann U.S., Inc. | |
| 7.875% 03/01/15 | | | 1,610,000 | | | | 1,523,463 | | |
| | | | 1,523,463 | | |
| Distribution/Wholesale Total | | | 1,523,463 | | |
| Entertainment – 0.4% | |
| Music – 0.3% | |
| Steinway Musical Instruments, Inc. | |
| 7.000% 03/01/14 (b) | | | 2,355,000 | | | | 2,166,600 | | |
| WMG Acquisition Corp. | |
| 7.375% 04/15/14 | | | 2,465,000 | | | | 2,021,300 | | |
| WMG Holdings Corp. | |
(f) 12/15/14
(9.500% 12/15/09) | | | 2,280,000 | | | | 1,368,000 | | |
| | | | 5,555,900 | | |
| Resorts/Theme Parks – 0.1% | |
| Six Flags, Inc. | |
| 9.625% 06/01/14 | | | 2,550,000 | | | | 1,581,000 | | |
| | | | 1,581,000 | | |
| Entertainment Total | | | 7,136,900 | | |
| Home Builders – 0.1% | |
| Building-Residential/Commercial – 0.1% | |
| KB Home | |
| 5.875% 01/15/15 | | | 1,830,000 | | | | 1,601,250 | | |
| | | | 1,601,250 | | |
| Home Builders Total | | | 1,601,250 | | |
| Home Furnishings – 0.2% | |
| Sealy Mattress Co. | |
| 8.250% 06/15/14 | | | 1,645,000 | | | | 1,451,712 | | |
| Simmons Co. | |
| 8.204% 02/15/12 (g) | | | 2,300,000 | | | | 1,479,666 | | |
| | | | 2,931,378 | | |
| Home Furnishings Total | | | 2,931,378 | | |
See Accompanying Notes to Financial Statements.
10
Columbia Strategic Income Fund, May 31, 2008
Corporate Fixed-Income Bonds & Notes (continued)
| | | Par ($)(a) | | Value ($) | |
| Leisure Time – 0.2% | |
| Cruise Lines – 0.1% | |
| Royal Caribbean Cruises Ltd. | |
| 7.000% 06/15/13 | | | 3,090,000 | | | | 2,854,387 | | |
| | | | 2,854,387 | | |
| Recreational Centers – 0.1% | |
| Town Sports International, Inc. | |
(f) 02/01/14
(11.000% 02/01/09) | | | 1,703,000 | | | | 1,605,078 | | |
| | | | 1,605,078 | | |
| Leisure Time Total | | | 4,459,465 | | |
| Lodging – 1.5% | |
| Casino Hotels – 1.1% | |
| Boyd Gaming Corp. | |
| 6.750% 04/15/14 | | | 1,250,000 | | | | 1,045,313 | | |
| 7.125% 02/01/16 | | | 1,000,000 | | | | 782,500 | | |
| Greektown Holdings LLC | |
| 10.750% 12/01/13 (b)(h) | | | 1,505,000 | | | | 1,038,450 | | |
| Harrah's Operating Co., Inc. | |
| 10.750% 02/01/16 (b) | | | 5,335,000 | | | | 4,628,112 | | |
| Jacobs Entertainment, Inc. | |
| 9.750% 06/15/14 | | | 2,165,000 | | | | 1,699,525 | | |
| Majestic Star LLC | |
| 9.750% 01/15/11 | | | 2,740,000 | | | | 890,500 | | |
| MGM Mirage | |
| 7.500% 06/01/16 | | | 7,445,000 | | | | 6,616,744 | | |
| Pinnacle Entertainment, Inc. | |
| 7.500% 06/15/15 (b) | | | 2,100,000 | | | | 1,732,500 | | |
| Snoqualmie Entertainment Authority | |
| 6.936% 02/01/14 (b)(c) | | | 375,000 | | | | 290,625 | | |
| 9.125% 02/01/15 (b) | | | 2,235,000 | | | | 1,720,950 | | |
| Station Casinos, Inc. | |
| 6.625% 03/15/18 | | | 3,225,000 | | | | 1,886,625 | | |
| | | | 22,331,844 | | |
| Gambling (Non-Hotel) – 0.4% | |
| Mashantucket Western Pequot Tribe | |
| 8.500% 11/15/15 (b) | | | 4,545,000 | | | | 4,204,125 | | |
| Seminole Indian Tribe of Florida | |
| 7.804% 10/01/20 (b) | | | 3,215,000 | | | | 3,086,336 | | |
| | | | 7,290,461 | | |
| Lodging Total | | | 29,622,305 | | |
| Retail – 1.0% | |
| Retail-Apparel/Shoe – 0.2% | |
| Hanesbrands, Inc. | |
| 8.204% 12/15/14 (c) | | | 1,465,000 | | | | 1,362,450 | | |
| Phillips-Van Heusen Corp. | |
| 8.125% 05/01/13 | | | 1,370,000 | | | | 1,411,100 | | |
| 7.250% 02/15/11 | | | 1,620,000 | | | | 1,636,200 | | |
| | | | 4,409,750 | | |
| | | Par ($)(a) | | Value ($) | |
| Retail-Automobiles – 0.3% | |
| AutoNation, Inc. | |
| 4.713% 04/15/13 (c) | | | 450,000 | | | | 397,688 | | |
| 7.000% 04/15/14 | | | 1,245,000 | | | | 1,178,081 | | |
| KAR Holdings, Inc. | |
| 10.000% 05/01/15 | | | 2,415,000 | | | | 2,197,650 | | |
| United Auto Group, Inc. | |
| 7.750% 12/15/16 | | | 1,915,000 | | | | 1,780,950 | | |
| | | | 5,554,369 | | |
| Retail-Discount – 0.1% | |
| Dollar General Corp. | |
PIK,
11.875% 07/15/17 | | | 2,050,000 | | | | 1,886,000 | | |
| | | | 1,886,000 | | |
| Retail-Drug Stores – 0.2% | |
| Rite Aid Corp. | |
| 9.375% 12/15/15 | | | 4,125,000 | | | | 3,217,500 | | |
| | | | 3,217,500 | | |
| Retail-Major Department Stores – 0.0% | |
| Saks, Inc. | |
| 9.875% 10/01/11 | | | 690,000 | | | | 721,050 | | |
| | | | 721,050 | | |
| Retail-Propane Distributors – 0.1% | |
| AmeriGas Partners LP | |
| 7.125% 05/20/16 | | | 2,315,000 | | | | 2,245,550 | | |
| 7.250% 05/20/15 | | | 745,000 | | | | 724,512 | | |
| | | | 2,970,062 | | |
| Retail-Restaurants – 0.1% | |
| Landry's Restaurants, Inc. | |
| 9.500% 12/15/14 | | | 2,020,000 | | | | 1,989,700 | | |
| | | | 1,989,700 | | |
| Retail Total | | | 20,748,431 | | |
| Textiles – 0.1% | |
| Textile-Products – 0.1% | |
| INVISTA | |
| 9.250% 05/01/12 (b) | | | 2,595,000 | | | | 2,685,825 | | |
| | | | 2,685,825 | | |
| Textiles Total | | | 2,685,825 | | |
| Consumer Cyclical Total | | | 97,835,730 | | |
See Accompanying Notes to Financial Statements.
11
Columbia Strategic Income Fund, May 31, 2008
Corporate Fixed-Income Bonds & Notes (continued)
| | | Par ($)(a) | | Value ($) | |
| Consumer Non-Cyclical – 4.4% | |
| Agriculture – 0.1% | |
| Tobacco – 0.1% | |
| Reynolds American, Inc. | |
| 7.625% 06/01/16 | | | 2,030,000 | | | | 2,119,620 | | |
| | | | 2,119,620 | | |
| Agriculture Total | | | 2,119,620 | | |
| Beverages – 0.2% | |
| Beverages-Non-Alcoholic – 0.1% | |
| Cott Beverages, Inc. | |
| 8.000% 12/15/11 | | | 1,760,000 | | | | 1,482,800 | | |
| | | | 1,482,800 | | |
| Beverages-Wine/Spirits – 0.1% | |
| Constellation Brands, Inc. | |
| 8.125% 01/15/12 | | | 2,310,000 | | | | 2,338,875 | | |
| | | | 2,338,875 | | |
| Beverages Total | | | 3,821,675 | | |
| Biotechnology – 0.1% | |
| Medical-Biomedical/Gene – 0.1% | |
| Bio-Rad Laboratories, Inc. | |
| 7.500% 08/15/13 | | | 2,320,000 | | | | 2,343,200 | | |
| | | | 2,343,200 | | |
| Biotechnology Total | | | 2,343,200 | | |
| Commercial Services – 1.2% | |
| Commercial Services – 0.3% | |
| ARAMARK Corp. | |
| 8.500% 02/01/15 | | | 2,770,000 | | | | 2,835,787 | | |
| Iron Mountain, Inc. | |
| 7.750% 01/15/15 | | | 2,835,000 | | | | 2,891,700 | | |
| | | | 5,727,487 | | |
| Commercial Services-Finance – 0.1% | |
| ACE Cash Express, Inc. | |
| 10.250% 10/01/14 (b) | | | 1,550,000 | | | | 1,201,250 | | |
| | | | 1,201,250 | | |
| Funeral Services & Related Items – 0.1% | |
| Service Corp. International | |
| 6.750% 04/01/16 | | | 1,980,000 | | | | 1,885,950 | | |
| 7.375% 10/01/14 | | | 290,000 | | | | 291,450 | | |
| | | | 2,177,400 | | |
| | | Par ($)(a) | | Value ($) | |
| Private Corrections – 0.2% | |
| Corrections Corp. of America | |
| 6.250% 03/15/13 | | | 2,355,000 | | | | 2,319,675 | | |
| GEO Group, Inc. | |
| 8.250% 07/15/13 | | | 2,865,000 | | | | 2,936,625 | | |
| | | | 5,256,300 | | |
| Rental Auto/Equipment – 0.5% | |
| Ashtead Capital, Inc. | |
| 9.000% 08/15/16 (b) | | | 330,000 | | | | 293,700 | | |
| Ashtead Holdings PLC | |
| 8.625% 08/01/15 (b) | | | 2,805,000 | | | | 2,440,350 | | |
| Hertz Corp. | |
| 8.875% 01/01/14 | | | 2,615,000 | | | | 2,601,925 | | |
| Rental Service Corp. | |
| 9.500% 12/01/14 | | | 2,300,000 | | | | 2,012,500 | | |
| United Rentals North America, Inc. | |
| 6.500% 02/15/12 | | | 2,650,000 | | | | 2,444,625 | | |
| | | | 9,793,100 | | |
| Commercial Services Total | | | 24,155,537 | | |
| Food – 0.7% | |
| Food-Dairy Products – 0.1% | |
| Dean Foods Co. | |
| 7.000% 06/01/16 | | | 2,055,000 | | | | 1,916,288 | | |
| | | | 1,916,288 | | |
| Food-Meat Products – 0.2% | |
| Smithfield Foods, Inc. | |
| 7.750% 07/01/17 | | | 2,995,000 | | | | 2,950,075 | | |
| | | | 2,950,075 | | |
| Food-Miscellaneous/Diversified – 0.4% | |
| Del Monte Corp. | |
| 6.750% 02/15/15 | | | 1,645,000 | | | | 1,591,537 | | |
| Dole Food Co., Inc. | |
| 8.625% 05/01/09 | | | 2,192,000 | | | | 2,148,160 | | |
| Pinnacle Foods Finance LLC | |
| 9.250% 04/01/15 | | | 3,565,000 | | | | 3,279,800 | | |
| Reddy Ice Holdings, Inc. | |
(f) 11/01/12
(10.500% 11/01/08) | | | 1,875,000 | | | | 1,575,000 | | |
| | | | 8,594,497 | | |
| Food Total | | | 13,460,860 | | |
| Healthcare Services – 1.2% | |
| Dialysis Centers – 0.2% | |
| DaVita, Inc. | |
| 7.250% 03/15/15 | | | 3,635,000 | | | | 3,553,213 | | |
| | | | 3,553,213 | | |
See Accompanying Notes to Financial Statements.
12
Columbia Strategic Income Fund, May 31, 2008
Corporate Fixed-Income Bonds & Notes (continued)
| | | Par ($)(a) | | Value ($) | |
| Medical-Hospitals – 0.9% | |
| Community Health Systems, Inc. | |
| 8.875% 07/15/15 | | | 3,350,000 | | | | 3,454,687 | | |
| HCA, Inc. | |
| 9.250% 11/15/16 | | | 2,655,000 | | | | 2,804,344 | | |
PIK,
9.625% 11/15/16 | | | 5,825,000 | | | | 6,145,375 | | |
| Tenet Healthcare Corp. | |
| 9.875% 07/01/14 | | | 5,600,000 | | | | 5,600,000 | | |
| | | | 18,004,406 | | |
| Physician Practice Management – 0.1% | |
| U.S. Oncology Holdings, Inc. | |
PIK,
7.949% 03/15/12 (c) | | | 1,749,000 | | | | 1,425,435 | | |
| | | | 1,425,435 | | |
| Healthcare Services Total | | | 22,983,054 | | |
| Household Products/Wares – 0.3% | |
| Consumer Products-Miscellaneous – 0.3% | |
| American Greetings Corp. | |
| 7.375% 06/01/16 | | | 2,365,000 | | | | 2,359,087 | | |
| Jarden Corp. | |
| 7.500% 05/01/17 | | | 2,565,000 | | | | 2,289,263 | | |
| Jostens IH Corp. | |
| 7.625% 10/01/12 | | | 2,250,000 | | | | 2,247,188 | | |
| | | | 6,895,538 | | |
| Household Products/Wares Total | | | 6,895,538 | | |
| Pharmaceuticals – 0.6% | |
| Medical-Drugs – 0.4% | |
| Elan Finance PLC | |
| 8.875% 12/01/13 | | | 4,000,000 | | | | 4,000,000 | | |
| Warner Chilcott Corp. | |
| 8.750% 02/01/15 | | | 3,465,000 | | | | 3,551,625 | | |
| | | | 7,551,625 | | |
| Pharmacy Services – 0.1% | |
| Omnicare, Inc. | |
| 6.750% 12/15/13 | | | 2,830,000 | | | | 2,653,125 | | |
| | | | 2,653,125 | | |
| Vitamins & Nutrition Products – 0.1% | |
| NBTY, Inc. | |
| 7.125% 10/01/15 | | | 1,520,000 | | | | 1,459,200 | | |
| | | | 1,459,200 | | |
| Pharmaceuticals Total | | | 11,663,950 | | |
| Consumer Non-Cyclical Total | | | 87,443,434 | | |
| | | Par ($)(a) | | Value ($) | |
| Energy – 4.7% | |
| Coal – 0.4% | |
| Arch Western Finance LLC | |
| 6.750% 07/01/13 | | | 2,975,000 | | | | 2,937,813 | | |
| Massey Energy Co. | |
| 6.875% 12/15/13 | | | 4,415,000 | | | | 4,348,775 | | |
| Peabody Energy Corp. | |
| 7.375% 11/01/16 | | | 1,060,000 | | | | 1,083,850 | | |
| | | | 8,370,438 | | |
| Coal Total | | | 8,370,438 | | |
| Energy-Alternate Sources – 0.1% | |
| VeraSun Energy Corp. | |
| 9.375% 06/01/17 | | | 2,045,000 | | | | 1,421,275 | | |
| | | | 1,421,275 | | |
| Energy-Alternate Sources Total | | | 1,421,275 | | |
| Oil & Gas – 2.6% | |
| Oil & Gas Drilling – 0.1% | |
| Pride International, Inc. | |
| 7.375% 07/15/14 | | | 1,530,000 | | | | 1,556,775 | | |
| | | | 1,556,775 | | |
| Oil Companies-Exploration & Production – 2.0% | |
| Chesapeake Energy Corp. | |
| 7.500% 06/15/14 | | | 2,195,000 | | | | 2,208,719 | | |
| 6.375% 06/15/15 | | | 2,210,000 | | | | 2,116,075 | | |
| Cimarex Energy Co. | |
| 7.125% 05/01/17 | | | 2,225,000 | | | | 2,213,875 | | |
| Compton Petroleum Corp. | |
| 7.625% 12/01/13 | | | 3,005,000 | | | | 2,941,144 | | |
| KCS Energy, Inc. | |
| 7.125% 04/01/12 | | | 2,455,000 | | | | 2,393,625 | | |
| Newfield Exploration Co. | |
| 6.625% 04/15/16 | | | 2,035,000 | | | | 1,938,338 | | |
| OPTI Canada, Inc. | |
| 8.250% 12/15/14 | | | 3,225,000 | | | | 3,321,750 | | |
| PEMEX Finance Ltd. | |
| 9.150% 11/15/18 | | | 2,485,000 | | | | 2,963,362 | | |
| 10.610% 08/15/17 | | | 1,650,000 | | | | 2,095,500 | | |
| PetroHawk Energy Corp. | |
| 9.125% 07/15/13 | | | 650,000 | | | | 676,000 | | |
| 7.875% 06/01/15 (b) | | | 2,075,000 | | | | 2,072,406 | | |
| Pioneer Natural Resources Co. | |
| 5.875% 07/15/16 | | | 2,680,000 | | | | 2,464,844 | | |
| Quicksilver Resources, Inc. | |
| 7.125% 04/01/16 | | | 2,950,000 | | | | 2,876,250 | | |
See Accompanying Notes to Financial Statements.
13
Columbia Strategic Income Fund, May 31, 2008
Corporate Fixed-Income Bonds & Notes (continued)
| | | Par ($)(a) | | Value ($) | |
| Range Resources Corp. | |
| 7.500% 05/15/16 | | | 2,180,000 | | | | 2,223,600 | | |
| Ras Laffan Liquefied Natural Gas Co., Ltd. III | |
| 5.832% 09/30/16 (b) | | | 4,200,000 | | | | 4,057,452 | | |
| Southwestern Energy Co. | |
| 7.500% 02/01/18 (b) | | | 3,980,000 | | | | 4,021,010 | | |
| XTO Energy, Inc. | |
| 7.500% 04/15/12 | | | 340,000 | | | | 364,924 | | |
| | | | 40,948,874 | | |
| Oil Refining & Marketing – 0.2% | |
| Tesoro Corp. | |
| 6.625% 11/01/15 | | | 2,950,000 | | | | 2,710,313 | | |
| United Refining Co. | |
| 10.500% 08/15/12 | | | 2,215,000 | | | | 2,115,325 | | |
| | | | 4,825,638 | | |
| Oil-Field Services – 0.3% | |
| Gazprom International SA | |
| 7.201% 02/01/20 | | | 4,978,254 | | | | 5,102,710 | | |
| | | | 5,102,710 | | |
| Oil & Gas Total | | | 52,433,997 | | |
| Oil & Gas Services – 0.1% | |
| Seismic Data Collection – 0.1% | |
| Seitel, Inc. | |
| 9.750% 02/15/14 | | | 1,530,000 | | | | 1,384,650 | | |
| | | | 1,384,650 | | |
| Oil & Gas Services Total | | | 1,384,650 | | |
| Oil, Gas & Consumable Fuels – 0.4% | |
| Oil Company-Integrated – 0.4% | |
| Petrobras International Finance Co. | |
| 6.125% 10/06/16 | | | 8,150,000 | | | | 8,333,375 | | |
| | | | 8,333,375 | | |
| Oil, Gas & Consumable Fuels Total | | | 8,333,375 | | |
| Pipelines – 1.1% | |
| Atlas Pipeline Partners LP | |
| 8.125% 12/15/15 | | | 2,030,000 | | | | 2,095,975 | | |
| Colorado Interstate Gas Co. | |
| 6.800% 11/15/15 | | | 790,000 | | | | 815,663 | | |
| El Paso Corp. | |
| 6.875% 06/15/14 | | | 2,970,000 | | | | 2,980,336 | | |
| 7.250% 06/01/18 | | | 3,470,000 | | | | 3,483,012 | | |
| Kinder Morgan Finance Co. ULC | |
| 5.700% 01/05/16 | | | 2,600,000 | | | | 2,408,250 | | |
| MarkWest Energy Partners LP | |
| 6.875% 11/01/14 | | | 1,885,000 | | | | 1,833,162 | | |
| 8.500% 07/15/16 | | | 1,265,000 | | | | 1,320,344 | | |
| | | Par ($)(a) | | Value ($) | |
| Williams Companies, Inc. | |
| 6.375% 10/01/10 (b) | | | 4,670,000 | | | | 4,786,750 | | |
| 7.750% 06/15/31 | | | 1,340,000 | | | | 1,427,100 | | |
| | | | 21,150,592 | | |
| Pipelines Total | | | 21,150,592 | | |
| Energy Total | | | 93,094,327 | | |
| Financials – 3.9% | |
| Banks – 0.1% | |
| Commercial Banks-Southern US – 0.0% | |
| First Union National Bank | |
| 5.800% 12/01/08 | | | 382,000 | | | | 385,473 | | |
| | | | 385,473 | | |
| Super-Regional Banks-US – 0.1% | |
| Bank One Corp. | |
| 6.000% 08/01/08 | | | 623,000 | | | | 625,255 | | |
| | | | 625,255 | | |
| Banks Total | | | 1,010,728 | | |
| Commercial Banks – 0.7% | |
| Special Purpose Banks – 0.7% | |
| Instituto de Credito Oficial | |
| 0.800% 09/28/09 | | JPY | 1,380,000,000 | | | | 13,048,449 | | |
| | | | 13,048,449 | | |
| Commercial Banks Total | | | 13,048,449 | | |
| Diversified Financial Services – 2.5% | |
| Finance-Auto Loans – 0.8% | |
| Ford Motor Credit Co. | |
| 7.800% 06/01/12 | | | 5,725,000 | | | | 5,065,119 | | |
| 8.000% 12/15/16 | | | 2,630,000 | | | | 2,207,948 | | |
| GMAC LLC | |
| 6.875% 09/15/11 | | | 4,605,000 | | | | 3,882,434 | | |
| 8.000% 11/01/31 | | | 5,975,000 | | | | 4,577,334 | | |
| | | | 15,732,835 | | |
| Finance-Consumer Loans – 0.3% | |
| SLM Corp. | |
| 6.500% 06/15/10 | | NZD | 7,865,000 | | | | 5,438,444 | | |
| | | | 5,438,444 | | |
| Investment Management/Advisor Service – 0.6% | |
| LVB Acquisition Merger Sub, Inc. | |
| 11.625% 10/15/17 (b) | | | 4,365,000 | | | | 4,626,900 | | |
PIK,
10.375% 10/15/17 (b) | | | 3,610,000 | | | | 3,844,650 | | |
| Nuveen Investments, Inc. | |
| 10.500% 11/15/15 (b) | | | 3,865,000 | | | | 3,633,100 | | |
| | | | 12,104,650 | | |
See Accompanying Notes to Financial Statements.
14
Columbia Strategic Income Fund, May 31, 2008
Corporate Fixed-Income Bonds & Notes (continued)
| | | Par ($)(a) | | Value ($) | |
| Special Purpose Entity – 0.8% | |
| CDX North America High Yield | |
| 8.875% 06/29/13 (b) | | | 14,000,000 | | | | 13,370,000 | | |
| FireKeepers Development Authority | |
| 13.875% 05/01/15 (b) | | | 1,400,000 | | | | 1,403,500 | | |
| Goldman Sachs Capital II | |
| 5.793% 12/29/49 | | | 3,030,000 | | | | 2,276,327 | | |
| | | | 17,049,827 | | |
| Diversified Financial Services Total | | | 50,325,756 | | |
| Insurance – 0.4% | |
| Insurance Brokers – 0.1% | |
| HUB International Holdings, Inc. | |
| 10.250% 06/15/15 (b) | | | 2,205,000 | | | | 1,631,700 | | |
| USI Holdings Corp. | |
| 9.750% 05/15/15 (b) | | | 1,485,000 | | | | 1,202,850 | | |
| | | | 2,834,550 | | |
| Property/Casualty Insurance – 0.3% | |
| Asurion Corp. | |
| 9.284% 07/02/15 (i) | | | 1,255,733 | | | | 1,165,738 | | |
| 9.198% 07/02/15 | | | 1,204,267 | | | | 1,117,961 | | |
| Crum & Forster Holdings Corp. | |
| 7.750% 05/01/17 | | | 3,665,000 | | | | 3,500,075 | | |
| | | | 5,783,774 | | |
| Insurance Total | | | 8,618,324 | | |
| Real Estate Investment Trusts (REITs) – 0.2% | |
| REITS-Hotels – 0.1% | |
| Host Marriott LP | |
| 6.750% 06/01/16 | | | 3,520,000 | | | | 3,414,400 | | |
| | | | 3,414,400 | | |
| REITS-Regional Malls – 0.1% | |
| Rouse Co. LP/TRC Co-Issuer, Inc. | |
| 6.750% 05/01/13 (b) | | | 1,785,000 | | | | 1,598,489 | | |
| | | | 1,598,489 | | |
| Real Estate Investment Trusts (REITs) Total | | | 5,012,889 | | |
| Financials Total | | | 78,016,146 | | |
| Industrials – 4.3% | |
| Aerospace & Defense – 0.3% | |
| Aerospace/Defense-Equipment – 0.2% | |
| DRS Technologies, Inc. | |
| 6.875% 11/01/13 | | | 3,020,000 | | | | 3,087,950 | | |
| | | | 3,087,950 | | |
| | | Par ($)(a) | | Value ($) | |
| Electronics-Military – 0.1% | |
| L-3 Communications Corp. | |
| 6.375% 10/15/15 | | | 2,720,000 | | | | 2,621,400 | | |
| | | | 2,621,400 | | |
| Aerospace & Defense Total | | | 5,709,350 | | |
| Electrical Components & Equipment – 0.2% | |
| Wire & Cable Products – 0.2% | |
| Belden, Inc. | |
| 7.000% 03/15/17 | | | 2,580,000 | | | | 2,515,500 | | |
| General Cable Corp. | |
| 5.073% 04/01/15 (c) | | | 860,000 | | | | 769,700 | | |
| 7.125% 04/01/17 | | | 1,455,000 | | | | 1,418,625 | | |
| | | | 4,703,825 | | |
| Electrical Components & Equipment Total | | | 4,703,825 | | |
| Electronics – 0.3% | |
| Electronic Components-Miscellaneous – 0.3% | |
| Flextronics International Ltd. | |
| 6.250% 11/15/14 | | | 1,305,000 | | | | 1,246,275 | | |
| 7.455% 10/01/14 | | | 444,196 | | | | 411,252 | | |
| 7.396% 10/01/14 | | | 93,916 | | | | 86,950 | | |
| 7.394% 10/01/14 | | | 1,451,888 | | | | 1,344,205 | | |
| NXP BV/NXP Funding LLC | |
| 9.500% 10/15/15 | | | 2,325,000 | | | | 2,194,219 | | |
| | | | 5,282,901 | | |
| Electronics Total | | | 5,282,901 | | |
| Engineering & Construction – 0.1% | |
| Building & Construction-Miscellaneous – 0.1% | |
| Esco Corp. | |
| 8.625% 12/15/13 (b) | | | 1,515,000 | | | | 1,522,575 | | |
| | | | 1,522,575 | | |
| Engineering & Construction Total | | | 1,522,575 | | |
| Environmental Control – 0.4% | |
| Non-Hazardous Waste Disposal – 0.3% | |
| Allied Waste North America, Inc. | |
| 7.125% 05/15/16 | | | 850,000 | | | | 835,125 | | |
| 7.875% 04/15/13 | | | 4,645,000 | | | | 4,749,512 | | |
| | | | 5,584,637 | | |
| Recycling – 0.1% | |
| Aleris International, Inc. | |
| 10.000% 12/15/16 | | | 2,180,000 | | | | 1,564,150 | | |
PIK,
9.000% 12/15/14 | | | 1,525,000 | | | | 1,246,688 | | |
| | | | 2,810,838 | | |
| Environmental Control Total | | | 8,395,475 | | |
See Accompanying Notes to Financial Statements.
15
Columbia Strategic Income Fund, May 31, 2008
Corporate Fixed-Income Bonds & Notes (continued)
| | | Par ($)(a) | | Value ($) | |
| Hand/Machine Tools – 0.1% | |
| Machinery-Electrical – 0.1% | |
| Baldor Electric Co. | |
| 8.625% 02/15/17 | | | 1,415,000 | | | | 1,443,300 | | |
| | | | 1,443,300 | | |
| Hand/Machine Tools Total | | | 1,443,300 | | |
| Machinery-Construction & Mining – 0.2% | |
| Terex Corp. | |
| 8.000% 11/15/17 | | | 4,065,000 | | | | 4,156,463 | | |
| | | | 4,156,463 | | |
| Machinery-Construction & Mining Total | | | 4,156,463 | | |
| Machinery-Diversified – 0.2% | |
| Machinery-General Industry – 0.1% | |
| Manitowoc Co., Inc. | |
| 7.125% 11/01/13 | | | 2,490,000 | | | | 2,402,850 | | |
| | | | 2,402,850 | | |
| Machinery-Material Handling – 0.1% | |
| Columbus McKinnon Corp. | |
| 8.875% 11/01/13 | | | 1,760,000 | | | | 1,843,600 | | |
| | | | 1,843,600 | | |
| Machinery-Diversified Total | | | 4,246,450 | | |
| Miscellaneous Manufacturing – 0.7% | |
| Diversified Manufacturing Operators – 0.5% | |
| Bombardier, Inc. | |
| 6.300% 05/01/14 (b) | | | 4,500,000 | | | | 4,410,000 | | |
| Koppers Holdings, Inc. | |
(f) 11/15/14
(9.875% 11/15/09) | | | 2,440,000 | | | | 2,244,800 | | |
| Trinity Industries, Inc. | |
| 6.500% 03/15/14 | | | 3,140,000 | | | | 3,092,900 | | |
| | | | 9,747,700 | | |
| Miscellaneous Manufacturing – 0.2% | |
| American Railcar Industries, Inc. | |
| 7.500% 03/01/14 | | | 1,990,000 | | | | 1,860,650 | | |
| TriMas Corp. | |
| 9.875% 06/15/12 | | | 2,011,000 | | | | 1,870,230 | | |
| | | | 3,730,880 | | |
| Miscellaneous Manufacturing Total | | | 13,478,580 | | |
| Packaging & Containers – 0.9% | |
| Containers-Metal/Glass – 0.5% | |
| Crown Americas LLC & Crown Americas Capital Corp. | |
| 7.750% 11/15/15 | | | 3,440,000 | | | | 3,612,000 | | |
| Owens-Brockway Glass Container, Inc. | |
| 8.250% 05/15/13 | | | 3,940,000 | | | | 4,077,900 | | |
| | | Par ($)(a) | | Value ($) | |
| Owens-Illinois, Inc. | |
| 7.500% 05/15/10 | | | 2,180,000 | | | | 2,223,600 | | |
| | | | 9,913,500 | | |
| Containers-Paper/Plastic – 0.4% | |
| Berry Plastics Holding Corp. | |
| 10.250% 03/01/16 | | | 2,900,000 | | | | 2,320,000 | | |
| Jefferson Smurfit Corp. | |
| 8.250% 10/01/12 | | | 3,580,000 | | | | 3,293,600 | | |
| Solo Cup Co. | |
| 8.500% 02/15/14 | | | 3,325,000 | | | | 2,959,250 | | |
| | | | 8,572,850 | | |
| Packaging & Containers Total | | | 18,486,350 | | |
| Transportation – 0.9% | |
| Transportation-Marine – 0.4% | |
| Navios Maritime Holdings, Inc. | |
| 9.500% 12/15/14 | | | 3,030,000 | | | | 3,120,900 | | |
| Ship Finance International Ltd. | |
| 8.500% 12/15/13 | | | 2,400,000 | | | | 2,460,000 | | |
| Stena AB | |
| 7.500% 11/01/13 | | | 3,070,000 | | | | 3,070,000 | | |
| | | | 8,650,900 | | |
| Transportation-Railroad – 0.1% | |
| TFM SA de CV | |
| 9.375% 05/01/12 | | | 2,915,000 | | | | 3,046,175 | | |
| | | | 3,046,175 | | |
| Transportation-Services – 0.3% | |
| CHC Helicopter Corp. | |
| 7.375% 05/01/14 | | | 3,570,000 | | | | 3,614,625 | | |
| PHI, Inc. | |
| 7.125% 04/15/13 | | | 1,910,000 | | | | 1,843,150 | | |
| | | | 5,457,775 | | |
| Transportation-Trucks – 0.1% | |
| QDI LLC | |
| 9.000% 11/15/10 | | | 1,585,000 | | | | 1,109,500 | | |
| | | | 1,109,500 | | |
| Transportation Total | | | 18,264,350 | | |
| Industrials Total | | | 85,689,619 | | |
| Technology – 0.7% | |
| Computers – 0.3% | |
| Computer Services – 0.3% | |
| Sungard Data Systems, Inc. | |
| 9.125% 08/15/13 | | | 5,310,000 | | | | 5,469,300 | | |
| | | | 5,469,300 | | |
| Computers Total | | | 5,469,300 | | |
See Accompanying Notes to Financial Statements.
16
Columbia Strategic Income Fund, May 31, 2008
Corporate Fixed-Income Bonds & Notes (continued)
| | | Par ($)(a) | | Value ($) | |
| Semiconductors – 0.4% | |
| Electronic Components-Semiconductors – 0.4% | |
| Amkor Technology, Inc. | |
| 9.250% 06/01/16 | | | 2,220,000 | | | | 2,203,350 | | |
| Freescale Semiconductor, Inc. | |
PIK,
9.125% 12/15/14 | | | 6,965,000 | | | | 5,972,487 | | |
| | | | 8,175,837 | | |
| Semiconductors Total | | | 8,175,837 | | |
| Technology Total | | | 13,645,137 | | |
| Utilities – 2.5% | |
| Electric – 2.4% | |
| Electric-Generation – 0.7% | |
| AES Corp. | |
| 7.750% 03/01/14 | | | 3,675,000 | | | | 3,675,000 | | |
| 8.000% 10/15/17 | | | 1,445,000 | | | | 1,450,419 | | |
| Edison Mission Energy | |
| 7.000% 05/15/17 | | | 4,170,000 | | | | 4,076,175 | | |
| Intergen NV | |
| 9.000% 06/30/17 (b) | | | 5,365,000 | | | | 5,633,250 | | |
| | | | 14,834,844 | | |
| Electric-Integrated – 0.8% | |
| CMS Energy Corp. | |
| 6.875% 12/15/15 | | | 2,175,000 | | | | 2,159,597 | | |
| Energy Future Holdings Corp. | |
| 10.875% 11/01/17 (b) | | | 3,225,000 | | | | 3,362,062 | | |
| Mirant Mid Atlantic LLC | |
| 8.625% 06/30/12 | | | 400,356 | | | | 422,877 | | |
| Texas Competitive Electric Holdings Co., | |
PIK,
10.500% 11/01/16 (b) | | | 8,945,000 | | | | 9,034,450 | | |
| | | | 14,978,986 | | |
| Independent Power Producer – 0.9% | |
| Dynegy Holdings, Inc. | |
| 7.125% 05/15/18 | | | 4,015,000 | | | | 3,703,837 | | |
| 7.750% 06/01/19 | | | 1,660,000 | | | | 1,572,850 | | |
| Mirant North America LLC | |
| 7.375% 12/31/13 | | | 2,020,000 | | | | 2,035,150 | | |
| NRG Energy, Inc. | |
| 7.250% 02/01/14 | | | 1,460,000 | | | | 1,430,800 | | |
| 7.375% 02/01/16 | | | 1,595,000 | | | | 1,555,125 | | |
| 7.375% 01/15/17 | | | 2,870,000 | | | | 2,805,425 | | |
| NSG Holdings LLC/NSG Holdings, Inc. | |
| 7.750% 12/15/25 (b) | | | 2,810,000 | | | | 2,774,875 | | |
| Reliant Energy, Inc. | |
| 7.875% 06/15/17 | | | 2,435,000 | | | | 2,447,175 | | |
| | | | 18,325,237 | | |
| Electric Total | | | 48,139,067 | | |
| | | Par ($)(a) | | Value ($) | |
| Independent Power Producers – 0.1% | |
| Electric-Integrated – 0.1% | |
| Mirant Americas Generation LLC | |
| 8.500% 10/01/21 | | | 3,035,000 | | | | 2,928,775 | | |
| | | | 2,928,775 | | |
| Utilities Total | | | 51,067,842 | | |
Total Corporate Fixed-Income Bonds & Notes
(Cost of $681,210,825) | | | 678,376,912 | | |
| Mortgage-Backed Securities – 6.0% | |
| Federal Home Loan Mortgage Corp. | |
| 7.500% 03/01/16 | | | 814 | | | | 850 | | |
| 8.000% 06/01/09 | | | 47 | | | | 48 | | |
| 8.000% 08/01/09 | | | 197 | | | | 202 | | |
| 8.000% 05/01/10 | | | 1,025 | | | | 1,069 | | |
| 8.000% 05/01/16 | | | 898 | | | | 914 | | |
| 8.500% 05/01/09 | | | 117 | | | | 118 | | |
| 8.500% 01/01/10 | | | 173 | | | | 182 | | |
| 9.000% 06/01/08 | | | 9 | | | | 9 | | |
| 9.000% 07/01/09 | | | 849 | | | | 875 | | |
| 9.000% 12/01/18 | | | 1,268 | | | | 1,348 | | |
| 9.000% 01/01/22 | | | 19,059 | | | | 21,078 | | |
| 9.250% 08/01/08 | | | 63 | | | | 63 | | |
| 9.250% 05/01/16 | | | 48,343 | | | | 53,326 | | |
| 9.500% 11/01/08 | | | 325 | | | | 328 | | |
| 9.500% 02/01/10 | | | 1,040 | | | | 1,050 | | |
| 9.500% 08/01/16 | | | 591 | | | | 652 | | |
| 9.750% 12/01/08 | | | 247 | | | | 249 | | |
| 9.750% 09/01/16 | | | 1,646 | | | | 1,777 | | |
| 10.000% 07/01/09 | | | 2,980 | | | | 3,034 | | |
| 10.000% 11/01/16 | | | 19,949 | | | | 21,106 | | |
| 10.000% 10/01/19 | | | 4,113 | | | | 4,573 | | |
| 10.000% 11/01/19 | | | 4,970 | | | | 5,642 | | |
| 10.500% 01/01/20 | | | 5,457 | | | | 6,145 | | |
| 10.750% 05/01/10 | | | 14,942 | | | | 15,459 | | |
| 10.750% 07/01/11 | | | 13,332 | | | | 14,143 | | |
| 10.750% 08/01/11 | | | 2,614 | | | | 2,711 | | |
| 10.750% 09/01/13 | | | 2,315 | | | | 2,401 | | |
| 11.250% 10/01/10 | | | 8,615 | | | | 8,933 | | |
| 11.250% 08/01/13 | | | 1,828 | | | | 1,901 | | |
| 11.250% 09/01/15 | | | 6,290 | | | | 7,184 | | |
| Federal National Mortgage Association | |
| 5.500% 11/01/36 (i) | | | 11,790,571 | | | | 11,721,670 | | |
| 6.000% 10/01/36 | | | 4,493,543 | | | | 4,564,176 | | |
| 6.000% 02/01/37 | | | 13,755,992 | | | | 13,972,219 | | |
| 6.000% 08/01/37 | | | 19,447,636 | | | | 19,749,196 | | |
| 6.500% 12/01/31 | | | 21,693 | | | | 22,569 | | |
| 6.500% 05/01/32 | | | 29,413 | | | | 30,573 | | |
| 6.500% 01/01/33 | | | 15,939 | | | | 16,568 | | |
See Accompanying Notes to Financial Statements.
17
Columbia Strategic Income Fund, May 31, 2008
Mortgage-Backed Securities (continued)
| | | Par ($)(a) | | Value ($) | |
| 6.500% 05/01/33 | | | 74,691 | | | | 77,709 | | |
| 6.500% 11/01/36 | | | 31,560,587 | | | | 32,579,402 | | |
| 6.500% 11/01/37 | | | 18,810,263 | | | | 19,413,485 | | |
| 7.500% 11/01/11 | | | 3,901 | | | | 3,987 | | |
| 8.000% 12/01/08 | | | 48 | | | | 49 | | |
| 8.000% 04/01/09 | | | 466 | | | | 469 | | |
| 8.000% 07/01/09 | | | 99 | | | | 99 | | |
| 8.500% 06/01/09 | | | 130 | | | | 131 | | |
| 8.500% 10/01/10 | | | 836 | | | | 857 | | |
| 8.500% 05/01/11 | | | 49 | | | | 49 | | |
| 8.500% 02/01/15 | | | 154 | | | | 155 | | |
| 8.500% 06/01/15 | | | 1,150 | | | | 1,193 | | |
| 8.500% 09/01/21 | | | 4,263 | | | | 4,377 | | |
| 9.000% 05/01/09 | | | 702 | | | | 708 | | |
| 9.000% 08/01/09 | | | 848 | | | | 860 | | |
| 9.000% 10/01/09 | | | 672 | | | | 679 | | |
| 9.000% 04/01/10 | | | 293 | | | | 299 | | |
| 9.000% 10/01/11 | | | 555 | | | | 559 | | |
| 9.000% 05/01/12 | | | 5,250 | | | | 5,483 | | |
| 9.000% 09/01/13 | | | 328 | | | | 333 | | |
| 9.000% 07/01/14 | | | 673 | | | | 722 | | |
| 9.000% 04/01/16 | | | 4,164 | | | | 4,168 | | |
| 9.000% 12/01/16 | | | 515 | | | | 526 | | |
| 9.000% 05/01/17 | | | 8,554 | | | | 9,140 | | |
| 9.000% 08/01/21 | | | 29,272 | | | | 30,069 | | |
| 10.000% 04/01/14 | | | 84,902 | | | | 93,212 | | |
| 10.000% 03/01/16 | | | 1,810 | | | | 1,885 | | |
| 10.500% 03/01/14 | | | 120 | | | | 124 | | |
| 10.500% 07/01/14 | | | 19,420 | | | | 20,132 | | |
| 10.500% 01/01/16 | | | 1,554 | | | | 1,627 | | |
| 10.500% 03/01/16 | | | 118,334 | | | | 133,650 | | |
| Freddie Mac Gold Pool | |
| 5.000% 05/01/21 | | | 15,548,222 | | | | 15,498,963 | | |
| Government National Mortgage Association | |
| 9.000% 08/15/08 | | | 33 | | | | 34 | | |
| 9.000% 09/15/08 | | | 394 | | | | 398 | | |
| 9.000% 10/15/08 | | | 596 | | | | 602 | | |
| 9.000% 03/15/09 | | | 3,152 | | | | 3,227 | | |
| 9.000% 05/15/09 | | | 8,686 | | | | 8,905 | | |
| 9.000% 06/15/09 | | | 9,649 | | | | 9,881 | | |
| 9.000% 05/15/16 | | | 22,502 | | | | 24,496 | | |
| 9.000% 06/15/16 | | | 21,546 | | | | 23,456 | | |
| 9.000% 07/15/16 | | | 59,215 | | | | 64,462 | | |
| 9.000% 08/15/16 | | | 38,821 | | | | 42,260 | | |
| 9.000% 09/15/16 | | | 90,335 | | | | 98,137 | | |
| 9.000% 10/15/16 | | | 12,115 | | | | 13,187 | | |
| 9.000% 11/15/16 | | | 35,483 | | | | 38,627 | | |
| 9.000% 12/15/16 | | | 32,655 | | | | 35,548 | | |
| 9.000% 01/15/17 | | | 2,333 | | | | 2,547 | | |
| | | Par ($)(a) | | Value ($) | |
| 9.000% 02/15/17 | | | 5,697 | | | | 6,220 | | |
| 9.000% 04/15/17 | | | 18,548 | | | | 20,253 | | |
| 9.000% 07/15/17 | | | 27,072 | | | | 29,561 | | |
| 9.000% 10/15/17 | | | 8,413 | | | | 9,186 | | |
| 9.000% 12/15/17 | | | 10,711 | | | | 11,885 | | |
| 9.500% 06/15/09 | | | 1,589 | | | | 1,637 | | |
| 9.500% 07/15/09 | | | 14,948 | | | | 15,405 | | |
| 9.500% 08/15/09 | | | 10,008 | | | | 10,313 | | |
| 9.500% 09/15/09 | | | 13,766 | | | | 14,188 | | |
| 9.500% 10/15/09 | | | 26,010 | | | | 26,798 | | |
| 9.500% 11/15/09 | | | 13,896 | | | | 14,323 | | |
| 9.500% 10/15/16 | | | 6,831 | | | | 7,511 | | |
| 9.500% 08/15/17 | | | 6,558 | | | | 7,237 | | |
| 9.500% 09/15/17 | | | 1,954 | | | | 2,157 | | |
| 10.000% 11/15/09 | | | 10,753 | | | | 11,117 | | |
| 10.000% 01/15/10 | | | 393 | | | | 408 | | |
| 10.000% 12/15/10 | | | 135 | | | | 142 | | |
| 10.000% 09/15/17 | | | 23,370 | | | | 26,056 | | |
| 10.000% 11/15/17 | | | 3,343 | | | | 3,728 | | |
| 10.000% 02/15/18 | | | 12,416 | | | | 13,890 | | |
| 10.000% 08/15/18 | | | 268 | | | | 300 | | |
| 10.000% 09/15/18 | | | 2,997 | | | | 3,354 | | |
| 10.000% 11/15/18 | | | 8,810 | | | | 9,848 | | |
| 10.000% 03/15/19 | | | 9,069 | | | | 10,174 | | |
| 10.000% 06/15/19 | | | 2,493 | | | | 2,787 | | |
| 10.000% 08/15/19 | | | 1,528 | | | | 1,714 | | |
| 10.000% 11/15/20 | | | 1,557 | | | | 1,750 | | |
| 10.000% 09/15/21 | | | 19 | | | | 22 | | |
| 10.500% 12/15/10 | | | 259 | | | | 274 | | |
| 10.500% 10/15/15 | | | 5,218 | | | | 5,820 | | |
| 10.500% 12/15/15 | | | 684 | | | | 763 | | |
| 10.500% 01/15/16 | | | 3,089 | | | | 3,464 | | |
| 10.500% 10/15/17 | | | 8,346 | | | | 9,401 | | |
| 10.500% 12/15/17 | | | 2,901 | | | | 3,268 | | |
| 10.500% 01/15/18 | | | 5,010 | | | | 5,662 | | |
| 10.500% 07/15/18 | | | 980 | | | | 1,108 | | |
| 10.500% 12/15/18 | | | 953 | | | | 1,069 | | |
| 10.500% 05/15/19 | | | 82 | | | | 93 | | |
| 10.500% 06/15/19 | | | 1,697 | | | | 1,925 | | |
| 10.500% 07/15/19 | | | 777 | | | | 881 | | |
| 11.000% 09/15/15 | | | 48,057 | | | | 54,095 | | |
| 11.000% 10/15/15 | | | 51,063 | | | | 57,472 | | |
| 11.750% 08/15/13 | | | 6,115 | | | | 6,831 | | |
| 12.000% 05/15/14 | | | 270 | | | | 304 | | |
Total Mortgage-Backed Securities
(Cost of $118,368,638) | | | 118,919,603 | | |
See Accompanying Notes to Financial Statements.
18
Columbia Strategic Income Fund, May 31, 2008
| Asset-Backed Securities – 1.1% | |
| | | Par ($)(a) | | Value ($) | |
Advanta Business Card Master
Trust 2005 Class A5, | |
| 2.539% 04/20/12 (c) | | | 7,000,000 | | | | 6,966,879 | | |
| Chase Credit Card Master Trust | |
| 2.624% 02/15/11 (c) | | | 8,000,000 | | | | 7,992,930 | | |
| Equity One ABS, Inc. | |
| 4.205% 04/25/34 | | | 5,050,000 | | | | 4,471,645 | | |
| First Plus Home Loan Trust | |
| 7.720% 05/10/24 | | | 3,730 | | | | 3,694 | | |
| GMAC Mortgage Corp. | |
| 4.865% 09/25/34 (c) | | | 4,130,000 | | | | 2,131,213 | | |
Total Asset-Backed Securities
(Cost of $24,170,350) | | | 21,566,361 | | |
| Municipal Bonds – 0.3% | |
| California – 0.2% | |
| CA Cabazon Band Mission Indians | |
| 13.000% 10/01/11 | | | 2,820,000 | | | | 2,962,156 | | |
| California Total | | | 2,962,156 | | |
| Virginia – 0.1% | |
| VA Tobacco Settlement Financing Corp. | |
Series 2007 A1,
6.706% 06/01/46 | | | 2,475,000 | | | | 2,137,905 | | |
| Virginia Total | | | 2,137,905 | | |
Total Municipal Bonds
(Cost of $5,294,752) | | | 5,100,061 | | |
| Collateralized Mortgage Obligations – 0.1% | |
| Agency – 0.1% | |
| Federal Home Loan Mortgage Corp. | |
I.O.,
5.500% 05/15/27 | | | 154,278 | | | | 9,305 | | |
| National Development Co. | |
| 6.369% 06/16/18 (b) | | | 2,850,000 | | | | 2,918,400 | | |
| Agency Total | | | 2,927,705 | | |
Total Collateralized Mortgage Obligations
(Cost of $2,851,249) | | | 2,927,705 | | |
| Securities Lending Collateral – 19.5% | |
| | | Shares | | | |
State Street Navigator
Securities Lending
Prime Portfolio
(7 day yield of 2.727%) (j) | | | 388,701,676 | | | | 388,701,676 | | |
Total Securities Lending Collateral
(Cost of $388,701,676) | | | 388,701,676 | | |
| Short-Term Obligation – 4.4% | |
| | | Par ($)(a) | | Value ($) | |
Repurchase agreement with
Fixed Income Clearing Corp.,
dated 05/30/08, due 06/02/08
at 2.130%, collateralized by a
U.S. Government Agency
Obligation maturing 08/11/14,
market value $89,260,688
(repurchase proceeds
$87,525,533) | | | 87,510,000 | | | | 87,510,000 | | |
Total Short-Term Obligation
(Cost of $87,510,000) | | | 87,510,000 | | |
Total Investments – 118.8%
(Cost of $2,334,302,785) (k) | | | 2,368,003,125 | | |
| Other Assets & Liabilities, Net – (18.8)% | | | (375,412,312 | ) | |
| Net Assets – 100.0% | | | 1,992,590,813 | | |
Notes to Investment Portfolio:
(a) Principal amount is stated in U.S. dollars unless otherwise noted.
(b) Security exempt from registration pursuant to Rule 144A under the Securities Act of 1933. These securities may be resold in transactions exempt from registration, normally to qualified institutional buyers. At May 31, 2008, these securities, which are not illiquid except for the following, amounted to $154,862,220, which represents 7.8% of net assets.
| Security | | Acquisition
Date | | Par/Units | | Cost | | Value | |
ACE Cash
Express, Inc.
10.250% 10/01/14 | | 09/26/06 | | $ | 1,550,000 | | | $ | 1,565,225 | | | $ | 1,201,250 | | |
Local TV
Finance LLC
9.250% 06/15/15 | | 05/02/07 | | | 1,585,000 | | | | 1,567,331 | | | | 1,275,925 | | |
Orascom Telecom
Finance SCA
7.875% 02/08/14 | | 02/01/07 | | | 1,150,000 | | | | 1,150,000 | | | | 1,101,125 | | |
Seminole Indian
Tribe of Florida
7.804% 10/01/20 | | 10/04/07 | | | 3,215,000 | | | | 3,265,055 | | | | 3,086,336 | | |
| | | $ | 6,664,636 | | |
(c) The interest rate shown on floating rate or variable rate securities reflects the rate at May 31, 2008.
(d) All or a portion of this security was on loan at May 31, 2008. The total market value of securities on loan at May 31, 2008 is $380,779,698.
(e) Zero coupon bond.
(f) Step bond. This security is currently not paying coupon. Shown parenthetically is the next coupon rate to be paid and the date the security will begin accruing at this rate.
(g) Loan participation agreement.
(h) The issuer has filed for bankruptcy protection under Chapter 11, and is in default of certain debt covenants. Income is not being accrued. At May 31, 2008, the value of this security amounted to $1,038,450, which represents 0.1% of net assets.
(i) Securities purchased on a delayed delivery basis.
(j) Investment made with cash collateral received from securities lending activity.
(k) Cost for federal income tax purposes is $2,362,457,734.
See Accompanying Notes to Financial Statements.
19
Columbia Strategic Income Fund, May 31, 2008
Forward foreign currency exchange contracts outstanding on May 31, 2008 are:
Forward Currency
Contracts to Buy | | Value | | Aggregate
Face Value | | Settlement
Date | | Unrealized
Depreciation | |
| CAD | | | | $ | 9,559,441 | | | $ | 9,575,165 | | | 06/13/08 | | $ | (15,724 | ) | |
Forward Currency
Contracts to Sell | | Value | | Aggregate
Face Value | | Settlement
Date | | Unrealized
Appreciation
(Depreciation) | |
| CAD | | | | $ | 11,622,922 | | | $ | 11,307,676 | | | 06/09/08 | | $ | (315,246 | ) | |
| CAD | | | | | 9,559,441 | | | | 9,438,649 | | | 06/13/08 | | | (120,792 | ) | |
| EUR | | | | | 12,827,766 | | | | 12,706,237 | | | 06/12/08 | | | (121,529 | ) | |
| EUR | | | | | 8,054,282 | | | | 7,975,128 | | | 06/12/08 | | | (79,154 | ) | |
| EUR | | | | | 8,054,282 | | | | 7,974,610 | | | 06/12/08 | | | (79,672 | ) | |
| EUR | | | | | 15,548,808 | | | | 15,391,840 | | | 06/12/08 | | | (156,968 | ) | |
| EUR | | | | | 19,432,393 | | | | 19,318,625 | | | 06/16/08 | | | (113,768 | ) | |
| EUR | | | | | 5,003,418 | | | | 5,050,444 | | | 06/27/08 | | | 47,026 | | |
| EUR | | | | | 9,827,761 | | | | 9,891,661 | | | 06/27/08 | | | 63,900 | | |
| EUR | | | | | 9,827,761 | | | | 9,920,952 | | | 06/27/08 | | | 93,191 | | |
| GBP | | | | | 11,228,708 | | | | 11,207,208 | | | 06/27/08 | | | (21,500 | ) | |
| GBP | | | | | 10,704,834 | | | | 10,695,085 | | | 06/27/08 | | | (9,749 | ) | |
| SEK | | | | | 22,802,442 | | | | 22,849,329 | | | 06/23/08 | | | 46,887 | | |
| | | $ | (767,374 | ) | |
At May 31, 2008, the asset allocation of the Fund is as follows:
| Asset Allocation (Unaudited) | | % of
Net Assets | |
| Government & Agency Obligations | | | 53.4 | | |
| Corporate Fixed-Income Bonds & Notes | | | 34.0 | | |
| Mortgage-Backed Securities | | | 6.0 | | |
| Asset-Backed Securities | | | 1.1 | | |
| Municipal Bonds | | | 0.3 | | |
| Collateralized Mortgage Obligations | | | 0.1 | | |
| | | | 94.9 | | |
| Securities Lending Collateral | | | 19.5 | | |
| Short-Term Obligation | | | 4.4 | | |
| Other Assets & Liabilities, Net | | | (18.8 | ) | |
| | | | 100.0 | | |
| Acronym | | Name | |
| AUD | | Australian Dollar | |
|
| BRL | | Brazilian Real | |
|
| CAD | | Canadian Dollar | |
|
| EUR | | Euro | |
|
| GBP | | British Pound | |
|
| I.O. | | Interest Only | |
|
| JPY | | Japanese Yen | |
|
| NOK | | Norwegian Krone | |
|
| NZD | | New Zealand Dollar | |
|
| PIK | | Payment-In-Kind | |
|
| PLN | | Polish Zloty | |
|
| P.O. | | Principal Only | |
|
| SEK | | Swedish Krona | |
|
| STRIPS | | Separate Trading of Registered Interest and Principal of Securities | |
|
| ZAR | | South African Rand | |
|
See Accompanying Notes to Financial Statements.
20
Statement of Assets and Liabilities – Columbia Strategic Income Fund
May 31, 2008
| | | | | ($) | |
| Assets | | Investments, at cost | | | 2,334,302,785 | | |
| | | Investments, at value (including securities on loan of $380,779,698) | | | 2,368,003,125 | | |
| | | Cash | | | 914,279 | | |
| | | Unrealized appreciation on forward foreign currency exchange contracts | | | 251,004 | | |
| | | Foreign currency (cost of $6,413) | | | 6,384 | | |
| | | Receivable for: | | | | | |
| | | Fund shares sold | | | 3,355,832 | | |
| | | Interest | | | 34,010,056 | | |
| | | Securities lending | | | 194,884 | | |
| | | Foreign tax reclaims | | | 195,756 | | |
| | | Trustees' deferred compensation plan | | | 118,373 | | |
| | | Other assets | | | 28,644 | | |
| | | Total Assets | | | 2,407,078,337 | | |
| Liabilities | | Collateral on securities loaned | | | 388,701,676 | | |
| | | Unrealized depreciation on forward foreign currency exchange contracts | | | 1,034,102 | | |
| | | Payable for: | | | | | |
| | | Investments purchased | | | 8,352,225 | | |
| | | Investments purchased on a delayed delivery basis | | | 12,266,086 | | |
| | | Fund shares repurchased | | | 2,099,268 | | |
| | | Investment advisory fee | | | 906,826 | | |
| | | Transfer agent fee | | | 303,758 | | |
| | | Pricing and bookkeeping fees | | | 26,810 | | |
| | | Trustees' fees | | | 52,734 | | |
| | | Custody fee | | | 30,903 | | |
| | | Distribution and service fees | | | 466,556 | | |
| | | Chief compliance officer expenses | | | 232 | | |
| | | Trustees' deferred compensation plan | | | 118,373 | | |
| | | Other liabilities | | | 127,975 | | |
| | | Total Liabilities | | | 414,487,524 | | |
| | | Net Assets | | | 1,992,590,813 | | |
| Net Assets Consist of | | Paid-in capital | | | 2,309,397,715 | | |
| | | Overdistributed net investment income | | | (22,792,169 | ) | |
| | | Accumulated net realized loss | | | (327,196,390 | ) | |
| | | Net unrealized appreciation (depreciation) on: | | | | | |
| | | Investments | | | 33,700,340 | | |
| | | Foreign currency translations | | | (518,683 | ) | |
| | | Net Assets | | | 1,992,590,813 | | |
| Class A | | Net assets | | | 865,282,280 | | |
| | | Shares outstanding | | | 146,397,391 | | |
| | | Net asset value per share | | | 5.91 | (a) | |
| | | Maximum sales charge | | | 4.75 | % | |
| | | Maximum offering price per share ($5.91/0.9525) | | | 6.20 | (b) | |
| Class B | | Net assets | | | 169,001,225 | | |
| | | Shares outstanding | | | 28,612,456 | | |
| | | Net asset value and offering price per share | | | 5.91 | (a) | |
| Class C | | Net assets | | | 130,420,331 | | |
| | | Shares outstanding | | | 22,059,433 | | |
| | | Net asset value and offering price per share | | | 5.91 | (a) | |
| Class J | | Net assets | | | 101,670,066 | | |
| | | Shares outstanding | | | 17,260,335 | | |
| | | Net asset value and redemption price per share | | | 5.89 | | |
| | | Maximum sales charge | | | 3.00 | % | |
| | | Maximum offering price per share ($5.89/0.9700) | | | 6.07 | (c) | |
| Class Z | | Net assets | | | 726,216,911 | | |
| | | Shares outstanding | | | 124,079,396 | | |
| | | Net asset value, offering and redemption price per share | | | 5.85 | | |
(a) Redemption price per share is equal to net asset value less any applicable contingent deferred sales charge.
(b) On sales of $50,000 or more the offering price is reduced.
(c) On sales of 10,000 or more shares this offering price is reduced.
See Accompanying Notes to Financial Statements.
21
Statement of Operations – Columbia Strategic Income Fund
For the Year Ended May 31, 2008
| | | | | ($) | |
| Investment Income | | Interest | | | 114,217,390 | | |
| | | Dollar roll fee income | | | 75,028 | | |
| | | Securities lending | | | 2,008,058 | | |
| | | Total Investment Income | | | 116,300,476 | | |
| Expenses | | Investment advisory fee | | | 10,213,556 | | |
| | | Distribution fee: | | | | | |
| | | Class B | | | 1,411,276 | | |
| | | Class C | | | 872,255 | | |
| | | Class J | | | 399,760 | | |
| | | Printing fee—Class J | | | 92,476 | | |
| | | Service fee: | | | | | |
| | | Class A | | | 2,063,879 | | |
| | | Class B | | | 461,430 | | |
| | | Class C | | | 285,378 | | |
| | | Class J | | | 280,084 | | |
| | | Transfer agent fee | | | 1,998,628 | | |
| | | Pricing and bookkeeping fees | | | 198,635 | | |
| | | Trustees' fees | | | 86,899 | | |
| | | Custody fee | | | 236,351 | | |
| | | Chief compliance officer expenses | | | 1,745 | | |
| | | Other expenses | | | 527,829 | | |
| | | Total Expenses | | | 19,130,181 | | |
| | | Fees waived by Distributor—Class C | | | (174,856 | ) | |
| | | Expense reductions | | | (41,044 | ) | |
| | | Net Expenses | | | 18,914,281 | | |
| | | Net Investment Income | | | 97,386,195 | | |
| Net Realized and Unrealized Gain (Loss) on Investments, Foreign Currency, Futures Contracts and Swap Contracts | |
| | | Net realized loss on: | | | | | |
| | | Investments | | | (7,050,385 | ) | |
| | | Foreign currency transactions | | | (10,621,082 | ) | |
| | | Futures contracts | | | (223,278 | ) | |
| | | Swap contracts | | | (216,606 | ) | |
| | | Net realized loss | | | (18,111,351 | ) | |
| | | Net change in unrealized appreciation (depreciation) on: | | | | | |
| | | Investments | | | 2,841,669 | | |
| | | Foreign currency translations | | | (615,587 | ) | |
| | | Futures contracts | | | (23,700 | ) | |
| | | Net change in unrealized appreciation | | | 2,202,382 | | |
| | | Net Loss | | | (15,908,969 | ) | |
| | | Net Increase Resulting from Operations | | | 81,477,226 | | |
See Accompanying Notes to Financial Statements.
22
Statement of Changes in Net Assets – Columbia Strategic Income Fund
| | | | | Year Ended May 31, | |
| Increase (Decrease) in Net Assets | | | | 2008 ($) | | 2007 ($) | |
| Operations | | Net investment income | | | 97,386,195 | | | | 88,686,684 | | |
| | | Net realized gain (loss) on investments,
foreign currency transactions, futures contracts
and swap contracts | | | (18,111,351 | ) | | | 10,556,197 | | |
| | | Net change in unrealized appreciation (depreciation)
on investments, foreign currency translations and
futures contracts | | | 2,202,382 | | | | 31,787,209 | | |
| | | Net Increase Resulting from Operations | | | 81,477,226 | | | | 131,030,090 | | |
| Distributions to Shareholders | | From net investment income: | | | | | | | | | |
| | | Class A | | | (50,892,739 | ) | | | (45,967,241 | ) | |
| | | Class B | | | (9,849,548 | ) | | | (13,463,100 | ) | |
| | | Class C | | | (6,352,948 | ) | | | (4,800,099 | ) | |
| | | Class J | | | (6,462,217 | ) | | | (8,488,036 | ) | |
| | | Class Z | | | (39,628,577 | ) | | | (25,361,881 | ) | |
| | | Total Distributions to Shareholders | | | (113,186,029 | ) | | | (98,080,357 | ) | |
| Share Transactions | | Class A | | | | | | | | | |
| | | Subscriptions | | | 189,657,562 | | | | 243,782,994 | | |
| | | Distributions reinvested | | | 35,665,784 | | | | 30,652,446 | | |
| | | Redemptions | | | (181,842,631 | ) | | | (157,571,581 | ) | |
| | | Net Increase | | | 43,480,715 | | | | 116,863,859 | | |
| | | Class B | | | | | | | | | |
| | | Subscriptions | | | 21,783,584 | | | | 24,246,789 | | |
| | | Distributions reinvested | | | 6,018,471 | | | | 8,090,930 | | |
| | | Redemptions | | | (72,884,532 | ) | | | (116,655,571 | ) | |
| | | Net Decrease | | | (45,082,477 | ) | | | (84,317,852 | ) | |
| | | Class C | | | | | | | | | |
| | | Subscriptions | | | 46,095,457 | | | | 46,433,341 | | |
| | | Distributions reinvested | | | 4,320,524 | | | | 3,101,980 | | |
| | | Redemptions | | | (24,491,364 | ) | | | (17,063,342 | ) | |
| | | Net Increase | | | 25,924,617 | | | | 32,471,979 | | |
| | | Class J | | | | | | | | | |
| | | Subscriptions | | | 314,315 | | | | 669,417 | | |
| | | Redemptions | | | (26,328,075 | ) | | | (47,241,716 | ) | |
| | | Net Decrease | | | (26,013,760 | ) | | | (46,572,299 | ) | |
| | | Class Z | | | | | | | | | |
| | | Subscriptions | | | 299,913,954 | | | | 258,880,354 | | |
| | | Distributions reinvested | | | 5,570,944 | | | | 3,041,609 | | |
| | | Redemptions | | | (93,724,391 | ) | | | (52,433,511 | ) | |
| | | Net Increase | | | 211,760,507 | | | | 209,488,452 | | |
| | | Net Increase from Share Transactions | | | 210,069,602 | | | | 227,934,139 | | |
| | | Total Increase in Net Assets | | | 178,360,799 | | | | 260,883,872 | | |
| Net Assets | | Beginning of period | | | 1,814,230,014 | | | | 1,553,346,142 | | |
| | | End of period | | | 1,992,590,813 | | | | 1,814,230,014 | | |
| | | Overdistributed net investment income at end of period | | | (22,792,169 | ) | | | (27,370,174 | ) | |
See Accompanying Notes to Financial Statements.
23
Statement of Changes in Net Assets (continued) – Columbia Strategic Income Fund
| | | | | Year Ended May 31, | |
| | | | | 2008 | | 2007 | |
| Changes in Shares | | Class A | | | | | | | | | |
| | | Subscriptions | | | 31,848,528 | | | | 40,808,153 | | |
| | | Issued for distributions reinvested | | | 6,012,418 | | | | 5,149,884 | | |
| | | Redemptions | | | (30,569,080 | ) | | | (26,443,794 | ) | |
| | | Net Increase | | | 7,291,866 | | | | 19,514,243 | | |
| | | Class B | | | | | | | | | |
| | | Subscriptions | | | 3,662,880 | | | | 4,071,735 | | |
| | | Issued for distributions reinvested | | | 1,015,372 | | | | 1,362,642 | | |
| | | Redemptions | | | (12,253,467 | ) | | | (19,586,407 | ) | |
| | | Net Decrease | | | (7,575,215 | ) | | | (14,152,030 | ) | |
| | | Class C | | | | | | | | | |
| | | Subscriptions | | | 7,741,845 | | | | 7,773,527 | | |
| | | Issued for distributions reinvested | | | 728,030 | | | | 520,600 | | |
| | | Redemptions | | | (4,114,663 | ) | | | (2,861,003 | ) | |
| | | Net Increase | | | 4,355,212 | | | | 5,433,124 | | |
| | | Class J | | | | | | | | | |
| | | Subscriptions | | | 52,960 | | | | 112,530 | | |
| | | Redemptions | | | (4,437,920 | ) | | | (7,966,271 | ) | |
| | | Net Decrease | | | (4,384,960 | ) | | | (7,853,741 | ) | |
| | | Class Z | | | | | | | | | |
| | | Subscriptions | | | 50,836,758 | | | | 43,707,459 | | |
| | | Issued for distributions reinvested | | | 948,121 | | | | 514,520 | | |
| | | Redemptions | | | (15,895,913 | ) | | | (8,886,953 | ) | |
| | | Net Increase | | | 35,888,966 | | | | 35,335,026 | | |
See Accompanying Notes to Financial Statements.
24
Financial Highlights – Columbia Strategic Income Fund
Selected data for a share outstanding throughout each period is as follows:
| | | Year Ended May 31, | |
| Class A Shares | | 2008 | | 2007 | | 2006 | | 2005 | | 2004 | |
| Net Asset Value, Beginning of Period | | $ | 6.01 | | | $ | 5.88 | | | $ | 6.15 | | | $ | 6.02 | | | $ | 6.09 | | |
| Income from Investment Operations: | |
| Net investment income (a) | | | 0.31 | | | | 0.33 | | | | 0.34 | | | | 0.36 | | | | 0.36 | | |
Net realized and unrealized gain (loss) on investments,
foreign currency, futures contracts and swap contracts | | | (0.05 | ) | | | 0.16 | | | | (0.15 | ) | | | 0.25 | | | | 0.01 | | |
| Total from Investment Operations | | | 0.26 | | | | 0.49 | | | | 0.19 | | | | 0.61 | | | | 0.37 | | |
| Less Distributions to Shareholders: | |
| From net investment income | | | (0.36 | ) | | | (0.36 | ) | | | (0.46 | ) | | | (0.48 | ) | | | (0.44 | ) | |
| Net Asset Value, End of Period | | $ | 5.91 | | | $ | 6.01 | | | $ | 5.88 | | | $ | 6.15 | | | $ | 6.02 | | |
| Total return (b) | | | 4.47 | % | | | 8.57 | %(c)(d) | | | 3.24 | %(c) | | | 10.37 | % | | | 6.21 | % | |
| Ratios to Average Net Assets/Supplemental Data: | |
| Net expenses (e) | | | 0.95 | % | | | 0.95 | % | | | 0.99 | % | | | 1.09 | % | | | 1.17 | % | |
| Waiver/Reimbursement | | | — | | | | 0.01 | % | | | 0.01 | % | | | — | | | | — | | |
| Net investment income (e) | | | 5.24 | % | | | 5.49 | % | | | 5.56 | % | | | 5.81 | % | | | 5.90 | % | |
| Portfolio turnover rate | | | 41 | % | | | 49 | % | | | 56 | % | | | 57 | % | | | 68 | % | |
| Net assets, end of period (000's) | | $ | 865,282 | | | $ | 835,878 | | | $ | 703,746 | | | $ | 615,772 | | | $ | 566,269 | | |
(a) Per share data was calculated using the average shares outstanding during the period.
(b) Total return at net asset value assuming all distributions reinvested and no initial sales charge or contingent deferred sales charge.
(c) Had the investment advisor and/or any of its affiliates not waived fees or reimbursed a portion of expenses, total return would have been reduced.
(d) Total return includes a voluntary reimbursement by the investment advisor for a realized investment loss due to a trading error. This reimbursement increased total return and net asset value per share by less than 0.01% and less than $0.01, respectively.
(e) The benefits derived from expense reductions had an impact of less than 0.01%.
See Accompanying Notes to Financial Statements.
25
Financial Highlights – Columbia Strategic Income Fund
Selected data for a share outstanding throughout each period is as follows:
| | | Year Ended May 31, | |
| Class B Shares | | 2008 | | 2007 | | 2006 | | 2005 | | 2004 | |
| Net Asset Value, Beginning of Period | | $ | 6.00 | | | $ | 5.88 | | | $ | 6.15 | | | $ | 6.02 | | | $ | 6.09 | | |
| Income from Investment Operations: | |
| Net investment income (a) | | | 0.27 | | | | 0.28 | | | | 0.29 | | | | 0.32 | | | | 0.32 | | |
Net realized and unrealized gain (loss) on investments,
foreign currency, futures contracts and swap contracts | | | (0.05 | ) | | | 0.16 | | | | (0.14 | ) | | | 0.25 | | | | 0.01 | | |
| Total from Investment Operations | | | 0.22 | | | | 0.44 | | | | 0.15 | | | | 0.57 | | | | 0.33 | | |
| Less Distributions to Shareholders: | |
| From net investment income | | | (0.31 | ) | | | (0.32 | ) | | | (0.42 | ) | | | (0.44 | ) | | | (0.40 | ) | |
| Net Asset Value, End of Period | | $ | 5.91 | | | $ | 6.00 | | | $ | 5.88 | | | $ | 6.15 | | | $ | 6.02 | | |
| Total return (b) | | | 3.86 | % | | | 7.59 | %(c)(d) | | | 2.48 | %(c) | | | 9.55 | % | | | 5.42 | % | |
| Ratios to Average Net Assets/Supplemental Data: | |
| Net expenses (e) | | | 1.70 | % | | | 1.70 | % | | | 1.74 | % | | | 1.84 | % | | | 1.92 | % | |
| Waiver/Reimbursement | | | — | | | | 0.01 | % | | | 0.01 | % | | | — | | | | — | | |
| Net investment income (e) | | | 4.50 | % | | | 4.75 | % | | | 4.82 | % | | | 5.06 | % | | | 5.15 | % | |
| Portfolio turnover rate | | | 41 | % | | | 49 | % | | | 56 | % | | | 57 | % | | | 68 | % | |
| Net assets, end of period (000's) | | $ | 169,001 | | | $ | 217,270 | | | $ | 295,983 | | | $ | 349,975 | | | $ | 408,345 | | |
(a) Per share data was calculated using the average shares outstanding during the period.
(b) Total return at net asset value assuming all distributions reinvested and no contingent deferred sales charge.
(c) Had the investment advisor and/or any of its affiliates not waived fees or reimbursed a portion of expenses, total return would have been reduced.
(d) Total return includes a voluntary reimbursement by the investment advisor for a realized investment loss due to a trading error. This reimbursement increased total return and net asset value per share by less than 0.01% and less than $0.01, respectively.
(e) The benefits derived from expense reductions had an impact of less than 0.01%.
See Accompanying Notes to Financial Statements.
26
Financial Highlights – Columbia Strategic Income Fund
Selected data for a share outstanding throughout each period is as follows:
| | | Year Ended May 31, | |
| Class C Shares | | 2008 | | 2007 | | 2006 | | 2005 | | 2004 | |
| Net Asset Value, Beginning of Period | | $ | 6.01 | | | $ | 5.89 | | | $ | 6.15 | | | $ | 6.02 | | | $ | 6.09 | | |
| Income from Investment Operations: | |
| Net investment income (a) | | | 0.28 | | | | 0.29 | | | | 0.30 | | | | 0.32 | | | | 0.33 | | |
Net realized and unrealized gain (loss) on investments,
foreign currency, futures contracts and swap contracts | | | (0.06 | ) | | | 0.15 | | | | (0.13 | ) | | | 0.26 | | | | 0.01 | | |
| Total from Investment Operations | | | 0.22 | | | | 0.44 | | | | 0.17 | | | | 0.58 | | | | 0.34 | | |
| Less Distributions to Shareholders: | |
| From net investment income | | | (0.32 | ) | | | (0.32 | ) | | | (0.43 | ) | | | (0.45 | ) | | | (0.41 | ) | |
| Net Asset Value, End of Period | | $ | 5.91 | | | $ | 6.01 | | | $ | 5.89 | | | $ | 6.15 | | | $ | 6.02 | | |
| Total return (b)(c) | | | 3.84 | % | | | 7.74 | %(d) | | | 2.79 | % | | | 9.71 | % | | | 5.57 | % | |
| Ratios to Average Net Assets/Supplemental Data: | |
| Net expenses (e) | | | 1.55 | % | | | 1.55 | % | | | 1.59 | % | | | 1.69 | % | | | 1.77 | % | |
| Waiver/Reimbursement | | | 0.15 | % | | | 0.16 | % | | | 0.16 | % | | | 0.15 | % | | | 0.15 | % | |
| Net investment income (e) | | | 4.63 | % | | | 4.89 | % | | | 4.95 | % | | | 5.21 | % | | | 5.31 | % | |
| Portfolio turnover rate | | | 41 | % | | | 49 | % | | | 56 | % | | | 57 | % | | | 68 | % | |
| Net assets, end of period (000's) | | $ | 130,420 | | | $ | 106,401 | | | $ | 72,221 | | | $ | 51,488 | | | $ | 41,520 | | |
(a) Per share data was calculated using the average shares outstanding during the period.
(b) Total return at net asset value assuming all distributions reinvested and no contingent deferred sales charge.
(c) Had the investment advisor and/or any of its affiliates not waived fees or reimbursed a portion of expenses, total return would have been reduced.
(d) Total return includes a voluntary reimbursement by the investment advisor for a realized investment loss due to a trading error. This reimbursement increased total return and net asset value per share by less than 0.01% and less than $0.01, respectively.
(e) The benefits derived from expense reductions had an impact of less than 0.01%.
See Accompanying Notes to Financial Statements.
27
Financial Highlights – Columbia Strategic Income Fund
Selected data for a share outstanding throughout each period is as follows:
| | | Year Ended May 31, | |
| Class J Shares | | 2008 | | 2007 | | 2006 | | 2005 | | 2004 | |
| Net Asset Value, Beginning of Period | | $ | 5.99 | | | $ | 5.87 | | | $ | 6.14 | | | $ | 6.01 | | | $ | 6.08 | | |
| Income from Investment Operations: | |
| Net investment income (a) | | | 0.29 | | | | 0.30 | | | | 0.31 | | | | 0.34 | | | | 0.34 | | |
Net realized and unrealized gain (loss) on investments,
foreign currency, futures contracts and swap contracts | | | (0.05 | ) | | | 0.16 | | | | (0.14 | ) | | | 0.25 | | | | 0.01 | | |
| Total from Investment Operations | | | 0.24 | | | | 0.46 | | | | 0.17 | | | | 0.59 | | | | 0.35 | | |
| Less Distributions to Shareholders: | |
| From net investment income | | | (0.34 | ) | | | (0.34 | ) | | | (0.44 | ) | | | (0.46 | ) | | | (0.42 | ) | |
| Net Asset Value, End of Period | | $ | 5.89 | | | $ | 5.99 | | | $ | 5.87 | | | $ | 6.14 | | | $ | 6.01 | | |
| Total return (b) | | | 4.09 | % | | | 8.00 | %(c)(d) | | | 2.88 | %(c) | | | 10.01 | % | | | 5.88 | % | |
| Ratios to Average Net Assets/Supplemental Data: | |
| Net expenses (e) | | | 1.38 | % | | | 1.31 | % | | | 1.37 | % | | | 1.44 | % | | | 1.52 | % | |
| Waiver/Reimbursement | | | — | | | | 0.01 | % | | | 0.01 | % | | | — | | | | — | | |
| Net investment income (e) | | | 4.82 | % | | | 5.14 | % | | | 5.19 | % | | | 5.46 | % | | | 5.55 | % | |
| Portfolio turnover rate | | | 41 | % | | | 49 | % | | | 56 | % | | | 57 | % | | | 68 | % | |
| Net assets, end of period (000's) | | $ | 101,670 | | | $ | 129,706 | | | $ | 173,101 | | | $ | 212,131 | | | $ | 229,179 | | |
(a) Per share data was calculated using the average shares outstanding during the period.
(b) Total return at net asset value assuming all distributions reinvested and no initial sales charge.
(c) Had the investment advisor and/or any of its affiliates not waived fees or reimbursed a portion of expenses, total return would have been reduced.
(d) Total return includes a voluntary reimbursement by the investment advisor for a realized investment loss due to a trading error. This reimbursement increased total return and net asset value per share by less than 0.01% and less than $0.01, respectively.
(e) The benefits derived from expense reductions had an impact of less than 0.01%.
See Accompanying Notes to Financial Statements.
28
Financial Highlights – Columbia Strategic Income Fund
Selected data for a share outstanding throughout each period is as follows:
| | | Year Ended May 31, | |
| Class Z Shares | | 2008 | | 2007 | | 2006 | | 2005 | | 2004 | |
| Net Asset Value, Beginning of Period | | $ | 5.95 | | | $ | 5.83 | | | $ | 6.10 | | | $ | 5.98 | | | $ | 6.05 | | |
| Income from Investment Operations: | |
| Net investment income (a) | | | 0.32 | | | | 0.34 | | | | 0.34 | | | | 0.37 | | | | 0.38 | | |
Net realized and unrealized gain (loss) on investments,
foreign currency, futures contracts and swap contracts | | | (0.05 | ) | | | 0.15 | | | | (0.13 | ) | | | 0.25 | | | | 0.01 | | |
| Total from Investment Operations | | | 0.27 | | | | 0.49 | | | | 0.21 | | | | 0.62 | | | | 0.39 | | |
| Less Distributions to Shareholders: | |
| From net investment income | | | (0.37 | ) | | | (0.37 | ) | | | (0.48 | ) | | | (0.50 | ) | | | (0.46 | ) | |
| Net Asset Value, End of Period | | $ | 5.85 | | | $ | 5.95 | | | $ | 5.83 | | | $ | 6.10 | | | $ | 5.98 | | |
| Total return (b) | | | 4.77 | % | | | 8.73 | %(c)(d) | | | 3.51 | %(c) | | | 10.53 | % | | | 6.52 | % | |
| Ratios to Average Net Assets/Supplemental Data: | |
| Net expenses (e) | | | 0.70 | % | | | 0.71 | % | | | 0.75 | % | | | 0.85 | % | | | 0.93 | % | |
| Waiver/Reimbursement | | | — | | | | 0.01 | % | | | 0.01 | % | | | — | | | | — | | |
| Net investment income (e) | | | 5.47 | % | | | 5.73 | % | | | 5.76 | % | | | 6.05 | % | | | 6.15 | % | |
| Portfolio turnover rate | | | 41 | % | | | 49 | % | | | 56 | % | | | 57 | % | | | 68 | % | |
| Net assets, end of period (000) | | $ | 726,217 | | | $ | 524,975 | | | $ | 308,295 | | | $ | 46,698 | | | $ | 1,150 | | |
(a) Per share data was calculated using the average shares outstanding during the period.
(b) Total return at net asset value assuming all distributions reinvested.
(c) Had the investment advisor and/or any of its affiliates not waived fees or reimbursed a portion of expenses, total return would have been reduced.
(d) Total return includes a voluntary reimbursement by the investment advisor for a realized investment loss due to a trading error. This reimbursement increased total return and net asset value per share by less than 0.01% and less than $0.01, respectively.
(e) The benefits derived from expense reductions had an impact of less than 0.01%.
See Accompanying Notes to Financial Statements.
29
Notes to Financial Statements – Columbia Strategic Income Fund
May 31, 2008
Note 1. Organization
Columbia Strategic Income Fund (the "Fund"), a series of Columbia Funds Series Trust I (the "Trust"), is a diversified portfolio. The Trust is a Massachusetts business trust registered under the Investment Company Act of 1940, as amended (the "1940 Act"), as an open-end management investment company.
Investment Objective
The Fund seeks total return, consisting of current income and capital appreciation.
Fund Shares
The Trust may issue an unlimited number of shares, and the Fund offers five classes of shares: Class A, Class B, Class C, Class J and Class Z. Each share class has its own expense structure and sales charges, as applicable.
Class A shares are subject to a maximum front-end sales charge of 4.75% based on the amount of initial investment. Class A shares purchased without an initial sales charge in accounts aggregating $1 million to $50 million at the time of purchase are subject to a 1.00% contingent deferred sales charge ("CDSC") if the shares are sold within one year after purchase. Class B shares are subject to a maximum CDSC of 5.00% based upon the holding period after purchase. Class B shares will convert to Class A shares eight years after purchase. Class C shares are subject to a 1.00% CDSC on shares sold within one year after purchase. Class J shares are subject to a 3.00% front-end sales charge and are available for purchase only by residents or citizens of Japan. Class Z shares are offered continuously at net asset value. There are certain restrictions on the purchase of Class Z shares, as described in the Fund's prospectus.
Note 2. Significant Accounting Policies
The preparation of financial statements in accordance with accounting principles generally accepted in the United States of America ("GAAP") requires management to make certain estimates and assumptions that affect the reported amounts of assets and liabilities, the disclosure of contingent assets and liabilities at the date of the financial statements and the reported amounts of revenue and expenses during the reporting period. Actual results could differ from those estimates. The following is a summary of significant accounting policies consistently followed by the Fund in the preparation of its financial statements.
Security Valuation
Debt securities generally are valued by pricing services approved by the Trust's Board of Trustees, based upon market transactions for normal, institutional-size trading units of similar securities. The services may use various pricing techniques which take into account appropriate factors such as yield, quality, coupon rate, maturity, type of issue, trading characteristics and other data, as well as broker quotes. Debt securities for which quotations are readily available are valued at an over-the-counter or exchange bid quotation.
Certain debt securities, which tend to be more thinly traded and of lesser quality, are priced based on fundamental analysis of the financial condition of the issuer and the estimated value of any collateral. Valuations developed through pricing techniques may vary from the actual amounts realized upon sale of the securities, and the potential variation may be greater for those securities valued using fundamental analysis.
Short-term debt obligations maturing within 60 days are valued at amortized cost, which approximates market value.
Futures contracts are valued at the settlement price established each day by the board of trade or exchange on which they are traded.
Forward foreign currency exchange contracts are valued at the prevailing forward exchange rate of the underlying currencies.
Credit default swaps are marked to market daily based upon quotations from market makers or pricing services. Quotations obtained from independent pricing services use information provided by market makers.
Foreign securities are generally valued at the last sale price on the foreign exchange or market on which they trade. If any foreign share prices are not readily available as a result of limited share activity, the securities are valued at the last sale price of the local shares in the principal market in which such securities are normally traded.
Generally, trading in foreign securities is substantially completed each day at various times prior to the close of the New York Stock Exchange ("NYSE"). The values of such securities used in computing the net asset value of the Fund's shares are determined as of such times. Foreign currency
30
Columbia Strategic Income Fund, May 31, 2008
exchange rates are generally determined at 4:00 p.m. Eastern (U.S.) time. Occasionally events affecting the values of such foreign securities and such exchange rates may occur between the times at which they are determined and the close of the customary trading session of the NYSE, which would not be reflected in the computation of the Fund's net asset value. If events materially affecting the values of such foreign securities occur and it is determined that market quotations are not reliable, then these foreign securities will be valued at their fair value using procedures approved by the Board of Trustees.
Investments for which market quotations are not readily available, or that have quotations which management believes are not reliable, are valued at fair value as determined in good faith under consistently applied procedures established by and under the general supervision of the Board of Trustees. If a security is valued at a fair value, such value is likely to be different from the last quoted market price for the security.
In September 2006, Statement of Financial Accounting Standards No. 157, Fair Value Measurements ("SFAS 157"), was issued. SFAS 157 is effective for fiscal years beginning after November 15, 2007. SFAS 157 defines fair value, establishes a framework for measuring fair value and expands disclosures about fair value measurements. Management is evaluating the impact the application of SFAS 157 will have on the Fund's financial statement disclosures.
Security Transactions
Security transactions are accounted for on the trade date. Cost is determined and gains (losses) are based upon the specific identification method for both financial statement and federal income tax purposes.
In March 2008, Statement of Financial Accounting Standards No. 161 ("SFAS 161"), Disclosures about Derivative Instruments and Hedging Activities—an amendment of FASB Statement No. 133, was issued. SFAS 161 is effective for fiscal years beginning after November 15, 2008. SFAS 161 requires additional discussion about the reporting entity's derivative instruments and hedging activities, by providing for qualitative disclosures about the objectives and strategies for using derivatives, quantitative data about the fair value of and gains and losses on derivative contracts, and details of credit-risk-related contingent features in their hed ged positions. Management is evaluating the impact the application of SFAS 161 will have on the Fund's financial statement disclosures.
Futures Contracts
The Fund may invest in futures contracts to gain or reduce exposure to particular securities or segments of the bond markets. Futures contracts are financial instruments whose values depend on, or are derived from, the value of the underlying security, index or currency. The Fund may use futures contracts for both hedging and non-hedging purposes, such as to adjust the Fund's sensitivity to changes in interest rates, or to offset a potential loss in one position by establishing an opposite position. The Fund typically uses futures contracts in an effort to achieve more efficiently, economic exposure similar to that which it could have achieved through the purchase and sale of fixed income securities.
The use of futures contracts involves certain risks, which include: (1) imperfect correlation between the price movement of the instruments and the underlying securities, (2) inability to close out positions due to differing trading hours, or the temporary absence of a liquid market, for either the instruments or the underlying securities, and (3) an inaccurate prediction by Columbia Management Advisors, LLC ("Columbia"), the Fund's investment advisor, of the future direction of interest rates. Any of these risks may involve amounts exceeding the variation margin recorded in the Fund's Statement of Assets and Liabilities at any given time.
Upon entering into a futures contract, the Fund pledges cash or securities with the broker in an amount sufficient to meet the initial margin requirement. Subsequent payments are made or received by the Fund equal to the daily change in the contract value and are recorded as variation margin receivable or payable and offset in unrealized gains or losses. The Fund recognizes a realized gain or loss when the contract is closed or expires.
Forward Foreign Currency Exchange Contracts
Forward foreign currency exchange contracts are agreements to exchange one currency for another at a future date at a specified price. These contracts are used to minimize the exposure to foreign exchange rate fluctuations during the period between the trade and settlement date of the contract. The Fund may utilize forward foreign currency exchange contracts in connection with the settlement of purchases and sales of securities. The Fund may also enter into these contracts to hedge certain other foreign currency denominated assets. Contracts to buy generally are used to acquire
31
Columbia Strategic Income Fund, May 31, 2008
exposure to foreign currencies, while contracts to sell are generally used to hedge the Fund's investments against currency fluctuations. Forward foreign currency exchange contracts are valued daily at the current exchange rate of the underlying currency, resulting in unrealized gains (losses) which become realized at the time the forward foreign currency exchange contracts are closed or mature. Realized and unrealized gains (losses) arising from such transactions are included in net realized and unrealized gains (losses) on foreign currency transactions. The use of forward foreign currency exchange contracts does not eliminate fluctuations in the prices of the Fund's portfolio securities. While the maximum potential loss from such contracts is the aggregate face value in U.S. dollars at the time the contract was opened, exposure is typically limited to the change in value of the contract (in U.S. dollars) over the period it rem ains open. The Fund could also be exposed to risk that counterparties of the contracts may be unable to fulfill the terms of the contracts.
Repurchase Agreements
The Fund may engage in repurchase agreement transactions with institutions that Columbia has determined are creditworthy. The Fund, through its custodian, receives delivery of the underlying securities collateralizing a repurchase agreement. Columbia is responsible for determining that the collateral is at least equal, at all times, to the value of the repurchase obligation including interest. A repurchase agreement transaction involves certain risks in the event of default or insolvency of the counterparty. These risks include possible delays in or restrictions on the Fund's ability to dispose of the underlying securities and a possible decline in the value of the underlying securities during the period while the Fund seeks to assert its rights.
Loan Participations and Commitments
The Fund may invest in loan participations. When the Fund purchases a loan participation, the Fund typically enters into a contractual relationship with the lender or third party selling such participation ("Selling Participant"), but not the borrower. However, the Fund assumes the credit risk of the borrower, Selling Participant and any other persons interpositioned between the Fund and the borrower. The Fund may not directly benefit from the collateral supporting the senior loan which it has purchased from the Selling Participant.
Mortgage Dollar Roll Transactions
The Fund may enter into mortgage "dollar rolls" in which the Fund sells securities for delivery in the current month and simultaneously contracts with the same counterparty to repurchase similar (same type, coupon and maturity) but not identical securities on a specified future date not exceeding 120 days. During the roll period, the Fund loses the right to receive principal and interest paid on the securities sold. However, the Fund would benefit to the extent of any difference between the price received for the securities sold and the lower forward price for the future purchase (often referred to as the "drop") or fee income plus the interest earned on the cash proceeds of the securities sold until the settlement date of the forward purchase. Unless such benefits exceed the income, capital appreciation and gain or loss due to mortgage prepayments that would have been realized on the securities sold as part of the mortgage doll ar roll, the use of this technique will diminish the investment performance of the Fund compared with what such performance would have been without the use of mortgage dollar rolls. All cash proceeds will be invested in instruments that are permissible investments for the Fund. The Fund will hold and maintain in a segregated account until the settlement date, cash or liquid securities in an amount equal to the forward purchase price.
The Fund's policy is to record the components of mortgage dollar rolls using "to be announced" mortgage-backed securities. For financial reporting and tax purposes, the Fund treats mortgage dollar rolls as two separate transactions, one involving the purchase of a security and a separate transaction involving a sale. The Fund does not currently enter into mortgage dollar rolls that are accounted for as financing transactions.
Mortgage dollar rolls involve certain risks. If the broker-dealer to whom the Fund sells the securities becomes insolvent, the Fund's right to purchase or repurchase the mortgage-related securities may be restricted and the instruments which the Fund is required to repurchase may be worth less than instruments which the Fund originally held. Successful use of mortgage dollar rolls may depend upon the investment advisor's ability to predict correctly interest rates and mortgage prepayments. For these reasons, there is no assurance that mortgage dollar rolls can be successfully employed.
32
Columbia Strategic Income Fund, May 31, 2008
Delayed Delivery Securities
The Fund may trade securities on other than normal settlement terms, including securities purchased or sold on a "when-issued" basis. This may increase the risk if the other party to the transaction fails to deliver and causes the Fund to subsequently invest at less advantageous prices. The Fund holds until the settlement date, in a segregated account, cash or liquid securities in an amount equal to the delayed delivery commitment.
Credit Default Swaps
The Fund may engage in credit default swap transactions for hedging purposes or to seek to increase total return. Credit default swaps are agreements in which one party pays fixed periodic payments to a counterparty in consideration for a guarantee from the counterparty to make a specific payment should a negative credit event take place. The Fund may receive an upfront premium as the protection seller or make an upfront premium as the protection buyer.
Credit default swaps are marked to market daily and any change is recorded as unrealized appreciation/depreciation on the Fund's Statement of Assets and Liabilities. Periodic payments and premiums received or made are amortized and recorded as realized gain or loss on the Statement of Operations, respectively. Gains or losses are realized as a result of a credit event or termination of the contract. Collateral, in the form of restricted cash or securities, may be required to be held in segregated accounts with the Fund's custodian in compliance with the terms of the swap contracts.
By entering into these agreements, the Fund could be exposed to risks in excess of the amounts recorded on the Statement of Assets and Liabilities. Risks include the possibility that there will be no liquid market for these agreements, or that the counterparty to an agreement will default on its obligation to perform.
Stripped Securities
Stripped mortgage-backed securities are derivative multi-class mortgage securities structured so that one class receives most, if not all, of the principal from the underlying mortgage assets, while the other class receives most, if not all, of the interest and the remainder of the principal. If the underlying mortgage assets experience greater than anticipated prepayments of principal, the Fund may fail to fully recoup its initial investment in an interest-only security. The market value of these securities can be extremely volatile in response to changes in interest rates. Credit risk reflects the risk that the Fund may not receive all or part of its principal because the issuer or credit enhancer has defaulted on its obligation.
Income Recognition
Interest income is recorded on an accrual basis and includes accretion of discounts, amortization of premiums and paydown gains and losses. Fee income attributable to mortgage dollar roll transactions is recorded on the accrual basis over the term of the transaction. The value of additional securities received as an income payment is recorded as income and as the cost basis of such securities.
Foreign Currency Transactions
The values of all assets and liabilities quoted in foreign currencies are translated into U.S. dollars at that day's exchange rates. Net realized and unrealized gains (losses) on foreign currency transactions include gains (losses) arising from the fluctuation in exchange rates between trade and settlement dates on securities transactions, gains (losses) arising from the disposition of foreign currency and currency gains (losses) between the accrual and payment dates on dividends, interest income and foreign withholding taxes.
For financial statement purposes, the Fund does not distinguish that portion of gains (losses) on investments which is due to changes in foreign exchange rates from that which is due to changes in market prices of the investments. Such fluctuations are included with the net realized and unrealized gains (losses) on investments on the Statement of Operations.
Determination of Class Net Asset Value
All income, expenses (other than class-specific expenses, as shown on the Statement of Operations) and realized and unrealized gains (losses) are allocated to each class of the Fund on a daily basis for purposes of determining the net asset value of each class. Income and expenses are allocated to each class based on the settled shares method, while realized and unrealized gains (losses) are allocated based on the relative net assets of each class.
33
Columbia Strategic Income Fund, May 31, 2008
Federal Income Tax Status
The Fund intends to qualify each year as a "regulated investment company" under Subchapter M of the Internal Revenue Code, as amended, and will distribute substantially all of its tax exempt or taxable income, if any, for its tax year, and as such will not be subject to federal income taxes. In addition, the Fund intends to distribute in each calendar year substantially all of its net investment income, capital gains and certain other amounts, if any, such that the Fund should not be subject to federal excise tax. Therefore, no federal income or excise tax provision is recorded.
Expenses
General expenses of the Trust are allocated to the Fund and the other series of the Trust based upon relative net assets or other expense allocation methodologies determined by the nature of the expense. Expenses directly attributable to the Fund are charged to the Fund.
Distributions to Shareholders
Dividends from net investment income are declared and paid monthly. Net realized capital gains, if any, are distributed at least annually.
Indemnification
In the normal course of business, the Fund enters into contracts that contain a variety of representations and warranties and which provide general indemnities. The Fund's maximum exposure under these arrangements is unknown because this would involve future claims against the Fund. Also, under the Trust's organizational documents and by contract, the Trustees and officers of the Trust are indemnified against certain liabilities that may arise out of actions relating to their duties to the Trust. However, based on experience, the Fund expects the risk of loss due to these representations, warranties and indemnities to be minimal.
Note 3. Federal Tax Information
The timing and character of income and capital gain distributions are determined in accordance with income tax regulations, which may differ from GAAP. Reclassifications are made to the Fund's capital accounts for permanent tax differences to reflect income and gains available for distribution (or available capital loss carryforwards) under income tax regulations.
For the year ended May 31, 2008, permanent book and tax basis differences resulting primarily from differing treatments for Section 988 bond bifurcation, discount accretion/premium amortization on debt securities, expired capital loss carryforwards, paydowns and market discounts were identified and reclassified among the components of the Fund's net assets as follows:
Overdistributed
Net Investment
Income | | Accumulated
Net Realized
Loss | | Paid-In Capital | |
| $ | 20,377,839 | | | $ | 46,685,192 | | | $ | (67,063,031 | ) | |
Net investment income and net realized gains (losses), as disclosed on the Statement of Operations, and net assets were not affected by this reclassification.
The tax character of distributions paid during the years ended May 31, 2008 and May 31, 2007 was as follows:
| | | May 31, | |
| Distributions paid from | | 2008 | | 2007 | |
| Ordinary Income* | | $ | 113,186,029 | | | $ | 98,080,357 | | |
| Long-Term Capital Gains | | | — | | | | — | | |
* For tax purposes short-term capital gains distributions, if any, are considered ordinary income distributions.
As of May 31, 2008, the components of distributable earnings on a tax basis were as follows:
Undistributed
Ordinary
Income | | Undistributed
Long-term
Capital Gains | | Net Unrealized
Appreciation* | |
| $ | 4,665,338 | | | $ | — | | | $ | 5,545,391 | | |
* The differences between book-basis and tax-basis net unrealized appreciation/depreciation are primarily due to deferral of losses from wash sales and discount accretion/premium amortization on debt securities.
34
Columbia Strategic Income Fund, May 31, 2008
Unrealized appreciation and depreciation at May 31, 2008, based on cost of investments for federal income tax purposes, were:
| Unrealized appreciation | | $ | 75,366,766 | | |
| Unrealized depreciation | | | (69,821,375 | ) | |
| Net unrealized appreciation | | $ | 5,545,391 | | |
The following capital loss carryforwards, determined as of May 31, 2008, may be available to reduce taxable income arising from future net realized gains on investments, if any, to the extent permitted by the Internal Revenue Code:
| Year of Expiration | | Capital Loss
Carryforward | |
| | 2009 | | | $ | 138,841,137 | | |
| | 2010 | | | | 138,626,928 | | |
| | 2011 | | | | 318,608 | | |
| | 2013 | | | | 234,018 | | |
| | 2014 | | | | 8,752,148 | | |
| | 2015 | | | | 703,478 | | |
| | 2016 | | | | 3,654,802 | | |
| | Total | | | $ | 291,131,119 | | |
Capital loss carryforwards of $67,063,032 expired during the year ended May 31, 2008.
Under current tax rules, certain currency and capital losses realized after October 31 may be deferred and treated as occurring on the first day of the following fiscal year. As of May 31, 2008, post-October capital losses of $36,006,959 attributed to security transactions were deferred to June 1, 2008.
The Fund adopted Financial Accounting Standards Board ("FASB") Interpretation No. 48, Accounting for Uncertainty in Income Taxes—an Interpretation of FASB Statement No. 109 ("FIN 48") effective November 30, 2007. FIN 48 requires management to determine whether a tax position of the Fund is more likely than not to be sustained upon examination by the applicable taxing authority, including resolution of any related appeals or litigation processes, based on the technical merits of the position. The tax benefit to be recognized is measured as the largest amount of benefit that is greater than fifty percent likely of being realized upon ul timate settlement. FIN 48 was applied to all existing tax positions upon initial adoption. Management has evaluated the known implications of FIN 48 on its computation of net assets for the Fund. As a result of this evaluation, management has concluded that FIN 48 did not have any effect on the Fund's financial statements and no cumulative effect adjustments were recorded. However, management's conclusions regarding FIN 48 may be subject to review and adjustment at a later date based on factors including, but not limited to, further implementation guidance from the FASB, new tax laws, regulations, and administrative interpretations (including relevant court decisions). The Fund's federal tax returns for the prior three fiscal years remain subject to examination by the Internal Revenue Service. The Fund is not aware of any tax positions for which it is reasonably possible that the total amounts of unrecognized tax benefits will significantly change in the next twelve months.
Note 4. Fees and Compensation Paid to Affiliates
Investment Advisory Fee
Columbia, an indirect, wholly owned subsidiary of Bank of America Corporation ("BOA"), provides investment advisory, administrative and other services to the Fund. Columbia receives a monthly investment advisory fee based on the Fund's average daily net assets at the following annual rates:
| Average Daily Net Assets | | Annual Fee Rate | |
| First $500 million | | | 0.60 | % | |
| $500 million to $1 billion | | | 0.55 | % | |
| $1 billion to $1.5 billion | | | 0.52 | % | |
| Over $1.5 billion | | | 0.49 | % | |
For the year ended May 31, 2008, the Fund's effective investment advisory fee rate was 0.54% of the Fund's average daily net assets.
Pricing and Bookkeeping Fees
The Fund has entered into a Financial Reporting Services Agreement (the "Financial Reporting Services Agreement") with State Street Bank & Trust Company ("State Street") and Columbia pursuant to which State Street provides financial reporting services to the Fund. The Fund has also entered into an Accounting Services Agreement (collectively with the
35
Columbia Strategic Income Fund, May 31, 2008
Financial Reporting Services Agreement, the "State Street Agreements") with State Street and Columbia pursuant to which State Street provides accounting services to the Fund. Under the State Street Agreements, the Fund pays State Street an annual fee of $38,000 paid monthly plus an additional monthly fee based on an annualized percentage rate of average daily net assets of the Fund for the month. The aggregate fee will not exceed $140,000 per year (exclusive of out-of-pocket expenses and charges). The Fund also reimburses State Street for certain out-of-pocket expenses and charges.
The Fund has entered into a Pricing and Bookkeeping Oversight and Services Agreement (the "Services Agreement") with Columbia. Under the Services Agreement, Columbia provides services related to Fund expenses and the requirements of the Sarbanes-Oxley Act of 2002, and provides oversight of the accounting and financial reporting services provided by State Street. Under the Services Agreement, the Fund reimburses Columbia for out-of-pocket expenses. Prior to January 1, 2008, the Fund also reimbursed Columbia for accounting oversight services, services related to Fund expenses and the requirements of the Sarbanes-Oxley Act of 2002.
For the year ended May 31, 2008, the amount charged to the Fund by affiliates included on the Statement of Operations under "Pricing and bookkeeping fees" aggregated $8,212.
Transfer Agent Fee
Columbia Management Services, Inc. (the "Transfer Agent"), an affiliate of Columbia and an indirect, wholly owned subsidiary of BOA, provides shareholder services to the Fund and has contracted with Boston Financial Data Services ("BFDS") to serve as sub-transfer agent. The Transfer Agent is entitled to receive a fee for its services, paid monthly, at the annual rate of $17.34 per open account plus reimbursement of certain sub-transfer agent fees paid by the Transfer Agent (exclusive of BFDS fees), calculated based on assets held in omnibus accounts and intended to recover the cost of payments to other parties (including affiliates of BOA) for services to those accounts. Prior to November 1, 2007, the annual rate was $17.00 per open account. The Transfer Agent pays the fees of BFDS for services as sub-transfer agent and is not entitled to reimbursement for such fees from the Fund. The Transfer Agent may also retain, as additiona l compensation for its services, fees for wire, telephone and redemption orders, IRA trustee agent fees and account transcript fees due to the Transfer Agent from shareholders of the Fund and credits (net of bank charges) earned with respect to balances in accounts the Transfer Agent maintains in connection with its services to the Fund. The Transfer Agent also receives reimbursement for certain out-of-pocket expenses.
An annual minimum account balance fee of $20 may apply to certain accounts with a value below the Fund's initial minimum investment requirements to reduce the impact of small accounts on transfer agent fees. These minimum account balance fees are recorded as part of expense reductions on the Statement of Operations. For the year ended May 31, 2008, these minimum account balance fees reduced total expenses by $22,815.
Underwriting Discounts, Service and Distribution Fees
Columbia Management Distributors, Inc. (the "Distributor"), an affiliate of Columbia and an indirect, wholly owned subsidiary of BOA, is the principal underwriter of the Fund. For the year ended May 31, 2008, the Distributor retained net underwriting discounts of $172,789 on sales of the Fund's Class A shares and received net CDSC fees of $10,052, $259,346 and $29,972 on Class A, Class B and Class C share redemptions, respectively.
The Fund has adopted Rule 12b-1 plans (the "Plans"), which require the payment of a monthly service fee to the Distributor. The service fee may equal up to 0.15% annually of the average daily net assets attributable to outstanding Class A and Class B shares issued prior to January 1, 1993 and 0.25% annually of the average daily net assets attributable to outstanding Class A, Class B, Class C and Class J shares issued thereafter. This arrangement results in a rate of service fee that is a blend between the 0.15% and 0.25% annual rates. For the year ended May 31, 2008, the annualized effective service fee rate was 0.25% for Class A, Class B, Class C and Class J shares of the Fund.
The Plans also require the payment of a monthly distribution fee to the Distributor equal to 0.75% annually of the average daily net assets attributable to Class B and Class C shares and 0.35% annually of the average daily net assets attributable to Class J shares. The Distributor has voluntarily agreed to
36
Columbia Strategic Income Fund, May 31, 2008
waive a portion of the Class C shares distribution fee so that it will not exceed 0.60% annually of the average daily net assets attributable to Class C shares. This arrangement may be modified or terminated by the Distributor at any time.
The CDSC and the distribution fees are used principally as repayment to the Distributor for amounts paid by the Distributor to dealers who sold such shares.
Fees Paid to Officers and Trustees
All officers of the Fund are employees of Columbia or its affiliates and, with the exception of the Fund's Chief Compliance Officer, receive no compensation from the Fund. The Board of Trustees has appointed a Chief Compliance Officer to the Fund in accordance with federal securities regulations. The Fund, along with other affiliated funds, pays its pro-rata share of the expenses associated with the Chief Compliance Officer. The Fund's expenses for the Chief Compliance Officer will not exceed $15,000 per year.
The Trust's eligible Trustees may participate in a deferred compensation plan which may be terminated at any time. Obligations of the plan will be paid solely out of the Fund's assets.
Note 5. Custody Credits
The Fund has an agreement with its custodian bank under which custody fees may be reduced by balance credits. These credits are recorded as part of expense reductions on the Statement of Operations. The Fund could have invested a portion of the assets utilized in connection with the expense offset arrangement in an income-producing asset if it had not entered into such an agreement.
For the year ended May 31, 2008, these custody credits reduced total expenses by $18,229 for the Fund.
Note 6. Portfolio Information
For the year ended May 31, 2008, the cost of purchases and proceeds from sales of securities, excluding short-term obligations, were $899,572,563 and $704,692,609, respectively, of which $105,488,164 and $276,396,250, respectively, were U.S. Government securities.
Note 7. Line of Credit
The Fund and other affiliated funds participate in a $350,000,000 committed, unsecured revolving line of credit and a $150,000,000 uncommitted, unsecured line of credit, both provided by State Street. Borrowings are available for short-term liquidity or temporary or emergency purposes. Interest on the committed line of credit is charged to each participating fund based on the fund's borrowings at a rate per annum equal to the Federal Funds Rate plus 0.50%. In addition, a commitment fee based on the unused portion of the committed line of credit of 0.10% per annum is charged and apportioned among the participating funds based on their relative net assets. Effective September 17, 2007, interest on the uncommitted line of credit is charged to each participating fund based on the fund's borrowings at a rate per annum equal to the Federal Funds Rate plus 0.375%. Prior to September 17, 2007, interest on the uncommitted line of credit was charged to each participating fund based on the fund's borrowings at a rate per annum equal to the Federal Funds Rate plus 0.50%. State Street charges an annual operations agency fee of $40,000 for the committed line of credit and may charge an annual administration fee of $15,000 for the uncommitted line of credit. The commitment fee, the operations agency fee and the administration fee are accrued and apportioned among the participating funds pro rata based on their relative net assets.
For the year ended May 31, 2008, the Fund did not borrow under these arrangements.
Note 8. Securities Lending
The Fund may lend its securities to certain approved brokers, dealers and other financial institutions. Each loan is collateralized by cash, in an amount at least equal to the market value of the securities loaned plus accrued income from the investment of collateral. The market value of the loaned securities is determined at the close of business of the Fund and any additional required collateral is delivered to the Fund on the next business day. The collateral received is invested and the income generated by the investment of the collateral, net of any fees remitted to State Street as the lending agent and borrower rebates, is paid to the Fund. Generally, in the event of borrower default, the Fund has the right to use the collateral to offset any losses incurred. In the event the Fund is delayed or prevented from exercising its
37
Columbia Strategic Income Fund, May 31, 2008
right to dispose of the collateral, there may be a potential loss to the Fund. The Fund bears the risk of loss with respect to the investment of collateral.
Note 9. Shares of Beneficial Interest
As of May 31, 2008, 31.5% of the Fund's shares outstanding was beneficially owned by one participant account over which BOA and/or any of its affiliates had either sole or joint investment discretion. Subscription and redemption activity of this account may have a significant effect on the operations of the Fund.
As of May 31, 2008, the Fund also had one shareholder that held 7.1% of the shares outstanding, over which BOA and/or any of its affiliates did not have investment discretion. Subscription and redemption activity of this account may have a significant effect on the operations of the Fund.
Note 10. Significant Risks and Contingencies
Sector Focus Risk
The Fund may focus its investments in certain sectors, subjecting it to greater risk than a fund that is less focused.
High-Yield Securities Risk
Investing in high-yield securities may involve greater credit risk and considerations not typically associated with investing in U.S. Government bonds and other higher quality fixed income securities. These securities are non-investment grade securities, often referred to as "junk" bonds. Economic downturns may disrupt the high yield market and impair the ability of issuers to repay principal and interest. Also, an increase in interest rates would likely have an adverse impact on the value of such obligations. Moreover, high-yield securities may be less liquid to the extent that there is no established secondary market.
Foreign Securities
There are certain additional risks involved when investing in foreign securities. These risks may involve foreign currency exchange rate fluctuations, adverse political and economic developments and the possible prevention of currency exchange or other foreign governmental laws or restrictions. In addition, the liquidity of foreign securities may be more limited than that of domestic securities.
Investments in emerging market countries are subject to additional risk. The risk of foreign investments is typically increased in less developed countries. These countries are also more likely to experience high levels of inflation, deflation or currency devaluation which could hurt their economies and securities markets.
Legal Proceedings
On February 9, 2005, Columbia Management Advisors, Inc. (which has since merged into Banc of America Capital Management, LLC (now named Columbia Management Advisors, LLC)) ("Columbia") and Columbia Funds Distributor, Inc. (which has been renamed Columbia Management Distributors, Inc.) (the "Distributor") (collectively, the "Columbia Group") entered into an Assurance of Discontinuance with the New York Attorney General ("NYAG") (the "NYAG Settlement") and consented to the entry of a cease-and-desist order by the Securities and Exchange Commission ("SEC") (the "SEC Order") on matters relating to mutual fund trading.
Under the terms of the SEC Order, the Columbia Group agreed, among other things, to: pay $70 million in disgorgement and $70 million in civil money penalties; cease and desist from violations of the antifraud provisions and certain other provisions of the federal securities laws; maintain certain compliance and ethics oversight structures; retain an independent consultant to review the Columbia Group's applicable supervisory, compliance, control and other policies and procedures; and retain an independent distribution consultant (see below). The Columbia Funds have also voluntarily undertaken to implement certain governance measures designed to maintain the independence of their boards of trustees. The NYAG Settlement also, among other things, requires Columbia and its affiliates to reduce management fees for certain Columbia Funds (including the former Nations Funds) and other mutual funds collectively by $32 million per year f or five years, for a projected total of $160 million in management fee reductions.
Pursuant to the procedures set forth in the SEC Order, the $140 million in settlement amounts described above is being distributed in accordance with a distribution plan that was developed by an independent distribution consultant and approved by the SEC on April 6, 2007. Distributions under the distribution plan began in late June 2007.
38
Columbia Strategic Income Fund, May 31, 2008
A copy of the SEC Order is available on the SEC website at http://www.sec.gov. A copy of the NYAG Settlement is available as part of the Bank of America Corporation Form 8-K filing on February 10, 2005.
In connection with the events described above, various parties have filed suit against certain funds, the Trustees of the Columbia Funds, FleetBoston Financial Corporation and its affiliated entities and/or Bank of America and its affiliated entities.
On February 20, 2004, the Judicial Panel on Multidistrict Litigation transferred these cases and cases against other mutual fund companies based on similar allegations to the United States District Court in Maryland for consolidated or coordinated pretrial proceedings (the "MDL"). Subsequently, additional related cases were transferred to the MDL. On September 29, 2004, the plaintiffs in the MDL filed amended and consolidated complaints. One of these amended complaints is a putative class action that includes claims under the federal securities laws and state common law, and that names Columbia, the Distributor, the Trustees of the Columbia Funds, Bank of America Corporation and others as defendants. Another of the amended complaints is a derivative action purportedly on behalf of the Columbia Funds that asserts claims under federal securities laws and state common law.
On February 25, 2005, Columbia and other defendants filed motions to dismiss the claims in the pending cases. On March 1, 2006, for reasons stated in the court's memoranda dated November 3, 2005, the United States District Court for the District of Maryland granted in part and denied in part the defendants' motions to dismiss. The court dismissed all of the class action claims pending against the Columbia Funds Trusts. As to Columbia and the Distributor, the claims under the Securities Act of 1933, the claims under Sections 34(b) and 36(a) of the Investment Company Act of 1940 ("ICA") and the state law claims were dismissed. The claims under Sections 10(b) and 20(a) of the Securities Exchange Act of 1934 and claims under Section 36(b) of the ICA were not dismissed.
On March 21, 2005, a purported class action was filed in Massachusetts state court alleging that certain conduct, including market timing, entitled Class B shareholders in certain Columbia funds to an exemption from contingent deferred sales charges upon early redemption ("the CDSC Lawsuit"). The CDSC Lawsuit was removed to federal court in Massachusetts and transferred to the MDL.
On September 14, 2007, the plaintiffs and the Columbia defendants named in the MDL, including the Columbia Funds, entered into a stipulation of settlement with respect to all Columbia-related claims in the MDL described above, including the CDSC Lawsuit. The settlement is subject to court approval.
In 2004, the Columbia Funds' adviser and distributor and certain affiliated entities and individuals were named as defendants in certain purported shareholder class and derivative actions making claims, including claims under the Investment Company and the Investment Advisers Acts of 1940 and state law. Certain Columbia Funds were named as nominal defendants. The suits allege, inter alia, that the fees and expenses paid by the funds are excessive and that the advisers and their affiliates inappropriately used fund assets to distribute the funds and for other improper purposes. On March 2, 2005, the actions were consolidated in the Massachusetts federal court as In re Columbia Entities Litigation. The plaintiffs filed a consolidated amended complaint on June 9, 2005. On November 30, 2005, the judge dismissed all claims by plaintiffs and entered final judgment in favor of the defendants. The plaintiffs appealed to the United States Court of Appeals for the First Circuit on December 30, 2005. A stipulation and settlement agreement dated January 19, 2007 was filed in the First Circuit on February 14, 2007, with a joint stipulation of dismissal and motion for remand to obtain district court approval of the settlement. That joint motion was granted and the appeal was dismissed. On March 6, 2007, the case was remanded to the District Court. The settlement, approved by the District Court on September 18, 2007, became effective October 19, 2007. Pursuant to the settlement, the funds' adviser and/or its affiliates made certain payments, including plaintiffs' attorneys' fees and costs of notice to class members.
39
Report of Independent Registered Public Accounting Firm
To the Trustees of Columbia Funds Series Trust I and the Shareholders of Columbia Strategic Income Fund
In our opinion, the accompanying statement of assets and liabilities, including the investment portfolio, and the related statements of operations and of changes in net assets and the financial highlights present fairly, in all material respects, the financial position of Columbia Strategic Income Fund (the "Fund") (a series of Columbia Funds Series Trust I) at May 31, 2008, the results of its operations for the year then ended, the changes in its net assets for each of the two years in the period then ended and the financial highlights for each of the five years in the period then ended, in conformity with accounting principles generally accepted in the United States of America. These financial statements and financial highlights (hereafter referred to as "financial statements") are the responsibility of the Fund's management. Our responsibility is to express an opinion on these financial statements based on our audits. We cond ucted our audits of these financial statements in accordance with the standards of the Public Company Accounting Oversight Board (United States). Those standards require that we plan and perform the audit to obtain reasonable assurance about whether the financial statements are free of material misstatement. An audit includes examining, on a test basis, evidence supporting the amounts and disclosures in the financial statements, assessing the accounting principles used and significant estimates made by management, and evaluating the overall financial statement presentation. We believe that our audits, which included confirmation of securities at May 31, 2008 by correspondence with the custodian and brokers, provide a reasonable basis for our opinion.
PricewaterhouseCoopers LLP
Boston, Massachusetts
July 21, 2008
40
Fund Governance
The Trustees serve terms of indefinite duration. The names, addresses and ages of the Trustees and officers of the Funds in Columbia Funds Series Trust I, the year each was first elected or appointed to office, their principal business occupations during at least the last five years, the number of Funds overseen by each Trustee and other directorships they hold are shown below. Each officer listed below serves as an officer of each Fund in the Columbia Funds Complex.
Independent Trustees
Name, Address and Year of Birth,
Position with Funds, Year First
Elected or Appointed to Office1 | | Principal Occupation(s) During Past Five Years, Number of Portfolios in Columbia
Funds Complex Overseen by Trustee, Other Directorships Held | |
| John D. Collins (Born 1938) | |
|
c/o Columbia Management
Advisors, LLC
One Financial Center
Boston, MA 02111
Trustee2 (since 2007) | | Retired. Consultant, KPMG, LLP from July 1999 to June 2000; Partner, KPMG, LLP from March 1962 to June 1999. Oversees 83, Mrs. Fields Famous Brands LLC (consumer products); Suburban Propane Partners, L.P.; and Montpelier Re | |
|
| Rodman L. Drake (Born 1943) | |
|
c/o Columbia Management
Advisors, LLC
One Financial Center
Boston, MA 02111
Trustee2 (since 2007) | | Co-Founder of Baringo Capital LLC (private equity) since 2002; President, Continuation Investments Group, Inc. from 1997 to 2001. Oversees 83, Jackson Hewitt Tax Service Inc. (tax preparation services); Crystal Capital River Inc. (real estate investment trust); Student Loan Corporation (student loan provider); Celgene Corporation (global biotechnology company); Apex Silver Mines Ltd. (mining); and Hyperion Brookfield Total Return Fund Inc. and Hyperion Brookfield Strategic Mortgage Income Fund (exchange-traded funds) | |
|
| Douglas A. Hacker (Born 1955) | |
|
c/o Columbia Management
Advisors, LLC
One Financial Center
Boston, MA 02111
Trustee (since 1996) | | Independent business executive since May, 2006; Executive Vice President—Strategy of United Airlines (airline) from December, 2002 to May, 2006; President of UAL Loyalty Services (airline marketing company) from September, 2001 to December, 2002; Executive Vice President and Chief Financial Officer of United Airlines from July, 1999 to September, 2001. Oversees 80, Nash Finch Company (food distributor); Aircastle Limited (aircraft leasing) | |
|
| Janet Langford Kelly (Born 1957) | |
|
c/o Columbia Management
Advisors, LLC
One Financial Center
Boston, MA 02111
Trustee (since 1996) | | Senior Vice President, General Counsel and Corporate Secretary, ConocoPhillips (integrated energy company) since September, 2007; Deputy General Counsel—Corporate Legal Services, ConocoPhillips from August, 2006 to August, 2007; Partner, Zelle, Hofmann, Voelbel, Mason & Gette LLP (law firm) from March, 2005 to July, 2006; Adjunct Professor of Law, Northwestern University, from September, 2004 to June, 2006, Director, UAL Corporation (airline) from February, 2006 to July, 2006; Chief Administrative Officer and Senior Vice President, Kmart Holding Corporation (consumer goods), from September, 2003 to March, 2004; Executive Vice President—Corporate Development and Administration, General Counsel and Secretary, Kellogg Company (food manufacturer), from September, 1999 to August, 2003. Oversees 80, None | |
|
41
Fund Governance (continued)
Independent Trustees (continued)
Name, Address and Year of Birth,
Position with Funds, Year First
Elected or Appointed to Office1 | | Principal Occupation(s) During Past Five Years, Number of Portfolios in Columbia
Funds Complex Overseen by Trustee, Other Directorships Held | |
| Charles R. Nelson (Born 1942) | |
|
c/o Columbia Management
Advisors, LLC
One Financial Center
Boston, MA 02111
Trustee (since 1981) | | Professor of Economics, University of Washington, since January, 1976; Ford and Louisa Van Voorhis Professor of Political Economy, University of Washington, since September, 1993; Director, Institute for Economic Research, University of Washington from September, 2001 to June, 2003; Adjunct Professor of Statistics, University of Washington, since September, 1980; Associate Editor, Journal of Money Credit and Banking, since September, 1993; Consultant on econometric and statistical matters. Oversees 80, None | |
|
| John J. Neuhauser (Born 1943) | |
|
c/o Columbia Management
Advisors, LLC
One Financial Center
Boston, MA 02111
Trustee (since 1985) | | President, Saint Michael's College, since August, 2007; University Professor, Boston College from November, 2005 to August, 2007; Academic Vice President and Dean of Faculties, Boston College from August, 1999 to October, 2005. Oversees 80, Liberty All-Star Equity Fund and Liberty All-Star Growth Fund, Inc. (closed-end funds) | |
|
| Jonathan Piel (Born 1938) | |
|
c/o Columbia Management
Advisors, LLC
One Financial Center
Boston, MA 02111
Trustee2 (since 2007) | | Cable television producer and website designer; The Editor, Scientific American from 1984 to 1994 and Vice President from 1984 to 1994; Member, Advisory Board, Stone Age Institute, Bloomington, Indiana (research institute that explores the effect of technology on human evolution); Member, Board of Directors of the National Institute of Social Sciences, New York City; and Member, Board of Trustees of the William Alanson White Institute, New York City (institution for training psychoanalysts). Oversees 83, None | |
|
| Patrick J. Simpson (Born 1944) | |
|
c/o Columbia Management
Advisors, LLC
One Financial Center
Boston, MA 02111
Trustee (since 2000) | | Partner, Perkins Coie LLP (law firm). Oversees 80, None | |
|
| Thomas C. Theobald (Born 1937) | |
|
c/o Columbia Management
Advisors, LLC
One Financial Center
Boston, MA 02111
Trustee and Chairman of the Board
(since 1996) | | Partner and Senior Advisor, Chicago Growth Partners (private equity investing) since September, 2004; Managing Director, William Blair Capital Partners (private equity investing) from September, 1994 to September, 2004. Oversees 80, Anixter International (network support equipment distributor); Ventas, Inc. (real estate investment trust); Jones Lang LaSalle (real estate management services); Ambac Financial Group (financial guaranty insurance) | |
|
42
Fund Governance (continued)
Independent Trustees (continued)
Name, Address and Year of Birth,
Position with Funds, Year First
Elected or Appointed to Office1 | | Principal Occupation(s) During Past Five Years, Number of Portfolios in Columbia
Funds Complex Overseen by Trustee, Other Directorships Held | |
| Anne-Lee Verville (Born 1945) | |
|
c/o Columbia Management
Advisors, LLC
One Financial Center
Boston, MA 02111
Trustee (since 1998) | | Retired since 1997 (formerly General Manager, Global Education Industry, IBM Corporation (computer and technology) from 1994 to 1997, President—Application Systems Division (from 1991 to 1994), Chief Financial Officer—US Marketing & Services (from 1988 to 1991), and Chief Information Officer (from 1987 to 1988), IBM Corporation (computer and technology)). Oversees 80, None | |
|
Interested Trustee
| William E. Mayer (Born 1940) | |
|
c/o Columbia Management
Advisors, LLC
One Financial Center
Boston, MA 02111
Trustee3 (since 1994) | | Partner, Park Avenue Equity Partners (private equity) since February, 1999; Dean and Professor, College of Business, University of Maryland, 1992 to 1997. Oversees 80, Lee Enterprises (print media), WR Hambrecht + Co. (financial service provider); BlackRock Kelso Capital Corporation (investment company) | |
|
1 In December 2000, the boards of each of the former Liberty Funds and former Stein Roe Funds were combined into one board of trustees responsible for the oversight of both fund groups (collectively, the "Liberty Board"). In October 2003, the trustees on the Liberty Board were elected to the boards of the Columbia Funds (the "Columbia Board") and of the CMG Fund Trust (the "CMG Funds Board"); simultaneous with that election, Patrick J. Simpson who had been a director on the Columbia Board and trustee on the CMG Funds Board, was appointed to serve as trustee of the Liberty Board. The date shown is the earliest date on which a trustee/director was elected or appointed to the board of a Fund in the Columbia Funds Complex.
2 Messrs. Drake, Piel and Collins have served as directors/trustees of the Excelsior Funds since 1996, 1996 and 2005, respectively. The Excelsior Funds consisted of 27 portfolios managed by affiliates of Columbia Management Advisors, LLC. Effective December 12, 2007, the Board elected Messrs. Drake, Piel and Collins as Trustees of the Trust.
3 Mr. Mayer is an "interested person" (as defined in the Investment Company Act of 1940) by reason of his affiliation with WR Hambrecht + Co., a registered broker/dealer that may execute portfolio transactions for or engage in principal transactions with the Funds or other funds or accounts advised/managed by the Advisor or other Bank of America affiliates.
The Statement of Additional Information includes additional information about the Trustees of the Funds and is available, without charge, upon request by calling 1-800-426-3750.
43
Fund Governance (continued)
Officers
Name, Address and Year of Birth,
Position with Columbia Funds,
Year First Elected or Appointed
to Office | | Principal Occupation(s) During Past Five Years | |
| Christopher L. Wilson (Born 1957) | |
|
One Financial Center
Boston, MA 02111
President (since 2004) | | President—Columbia Funds, since October 2004; Managing Director—Columbia Management Advisors, LLC, since September 2005; Senior Vice President—Columbia Management Distributors, Inc., since January 2005; Director—Columbia Management Services, Inc., since January 2005; Director—Bank of America Global Liquidity Funds, plc and Banc of America Capital Management (Ireland), Limited, since May 2005; Director—FIM Funding, Inc., since January 2005; President and Chief Executive Officer—CDC IXIS AM Services, Inc. (investment management), from September 1998 through August 2004; and a senior officer or director of various other Bank of America-affiliated entities, including other registered and unregistered funds. | |
|
| James R. Bordewick, Jr. (Born 1959) | |
|
One Financial Center
Boston, MA 02111
Senior Vice President, Secretary
and Chief Legal Officer (since 2006) | | Associate General Counsel, Bank of America since April 2005; Senior Vice President and Associate General Counsel, MFS Investment Management (investment management) prior to April 2005. | |
|
| J. Kevin Connaughton (Born 1964) | |
|
One Financial Center
Boston, MA 02111
Senior Vice President and
Chief Financial Officer
(since 2000) | | Managing Director of Columbia Management Advisors, LLC since December 2004; Treasurer—Columbia Funds, October 2003—May 2008; Treasurer—the Liberty Funds, Stein Roe Funds and Liberty All-Star Funds, December 2000—December 2006; Senior Vice President—Columbia Management Advisors, LLC, April 2003—December 2004; President—Columbia Funds, Liberty Funds and Stein Roe Funds, February 2004 to October 2004; Treasurer—Galaxy Funds, September 2002 to December 2005; Treasurer, December 2002 to December 2004, and President, February 2004 to December 2004—Columbia Management Multi-Strategy Hedge Fund, LLC; and a senior officer of various other Bank of America-affiliated entities, including other registered and unregistered funds. | |
|
| Linda J. Wondrack (Born 1964) | |
|
One Financial Center
Boston, MA 02111
Senior Vice President,
Chief Compliance Officer
(since 2007) | | Director (Columbia Management Group, LLC and Investment Product Group Compliance), Bank of America since June 2005; Director of Corporate Compliance and Conflicts Officer, MFS Investment Management (investment management), August 2004 to May 2005; Managing Director, Deutsche Asset Management (investment management) prior to August 2004. | |
|
| Michael G. Clarke (Born 1969) | |
|
One Financial Center
Boston, MA 02111
Treasurer (since 2008) | | Director of Fund Administration of the Advisor since January 2006; Managing Director of the Advisor, September 2004 to December 2005; Vice President Fund Administration June 2002 to September 2004. | |
|
44
Fund Governance (continued)
Officers (continued)
Name, Address and Year of Birth,
Position with Columbia Funds,
Year First Elected or Appointed
to Office | | Principal Occupation(s) During Past Five Years | |
| Jeffrey R. Coleman (Born 1969) | |
|
One Financial Center
Boston, MA 02111
Deputy Treasurer (since 2008) | | Director of Fund Administration of the Advisor since January 2006; Fund Controller of the Advisor from October 2004 to January 2006; Vice President of CDC IXIS Asset Management Services, Inc. (investment management) from August 2000 to September 2004. | |
|
| Joseph F. DiMaria (Born 1968) | |
|
One Financial Center
Boston, MA 02111
Deputy Treasurer (since 2006) | | Director of Fund Administration of the Advisor since January 2006; Head of Tax/Compliance and Assistant Treasurer from November 2004 to December 2005; Director of Trustee Administration (Sarbanes-Oxley) from May 2003 to October 2004; Senior Audit Manager, PricewaterhouseCoopers (independent registered public accounting firm) from July 2000 to April 2003. | |
|
| Barry S. Vallan (Born 1969) | |
|
One Financial Center
Boston, MA 02111
Controller (since 2006) | | Vice President—Fund Treasury of the Advisor since October 2004; Vice President—Trustee Reporting from April 2002 to October 2004. | |
|
45
This page intentionally left blank.
This page intentionally left blank.
This page intentionally left blank.
Important Information About This Report – Columbia Strategic Income Fund
The fund mails one shareholder report to each shareholder address. If you would like more than one report, please call shareholder services at 1-800-345-6611 and additional reports will be sent to you. This report has been prepared for shareholders of Columbia Strategic Income Fund.
A description of the policies and procedures that the fund uses to determine how to vote proxies and a copy of the fund's voting records are available (i) at www.columbiamanagement.com; (ii) on the Securities and Exchange Commission's website at www.sec.gov, and (iii) without charge, upon request, by calling 1-800-368-0346. Information regarding how the fund voted proxies relating to portfolio securities during the 12-month period ended June 30 is available from the SEC's website. Information regarding how the fund voted proxies relating to portfolio securities is also available from the fund's website, www.columbiamanagement.com.
The fund files a complete schedule of portfolio holdings with the SEC for the first and third quarters of each fiscal year on Form N-Q. The fund's Form N-Q is available on the SEC's website at www.sec.gov and may be reviewed and copied at the SEC's Public Reference Room in Washington, DC. Information on the operation of the Public Reference Room may be obtained by calling 1-800-SEC-0330.
Please read and consider the investment objectives, risks, charges and expenses for any fund carefully before investing. For a prospectus which contains this and other important information about the fund, contact your Columbia Management representative or financial advisor or go to www.columbiamanagement.com.
Columbia Management Group, LLC ("Columbia Management") is the investment management division of Bank of America Corporation. Columbia Management entities furnish investment management services and products for institutional and individual investors. Columbia Funds are distributed by Columbia Management Distributors, Inc., member of FINRA, SIPC, part of Columbia Management and an affiliate of Bank of America Corporation.
| Transfer Agent | |
|
Columbia Management Services, Inc.
P.O. Box 8081
Boston, MA 02266-8081
1-800-345-6611 | |
|
| Distributor | |
|
Columbia Management
Distributors, Inc.
One Financial Center
Boston, MA 02111 | |
|
| Investment Advisor | |
|
Columbia Management Advisors, LLC
100 Federal Street
Boston, MA 02110 | |
|
49
Columbia Management®
Columbia Strategic Income Fund
Annual Report, May 31, 2008
PRSRT STD
U.S. Postage
PAID
Holliston, MA
Permit NO. 20
©2008 Columbia Management Distributors, Inc.
One Financial Center, Boston, MA 02111-2621
800-345-6611 www.columbiafunds.com
SHC-42/153857-0508 (07/08) 08/50218
Item 2. Code of Ethics.
(a) The registrant has, as of the end of the period covered by this report, adopted a code of ethics that applies to the registrant’s principal executive officer, principal financial officer, principal accounting officer or controller, or persons performing similar functions, regardless of whether these individuals are employed by the registrant or a third party.
(b) During the period covered by this report, there were not any amendments to a provision of the code of ethics adopted in 2(a) above.
(c) During the period covered by this report, there were no waivers, including any implicit waivers, from a provision of the code of ethics described in 2(a) above that relates to one or more of the items set forth in paragraph (b) of this item’s instructions.
Item 3. Audit Committee Financial Expert.
The registrant’s Board of Trustees has determined that Douglas A. Hacker, John D. Collins and Anne-Lee Verville, each of whom are members of the registrant’s Board of Trustees and Audit Committee, each qualify as an audit committee financial expert. Mr. Hacker, Mr. Collins and Ms. Verville are each independent trustees, as defined in paragraph (a)(2) of this item’s instructions.
Item 4. Principal Accountant Fees and Services.
Fee information below is disclosed for the two series of the registrant whose report to stockholders is included in this annual filing. Fee information for fiscal year ended May 31, 2008 also includes fees for one series that merged into the registrant during the period.
(a) Audit Fees. Aggregate Audit Fees billed by the principal accountant for professional services rendered during the fiscal years ended May 31, 2008 and May 31, 2007 are approximately as follows:
2008 | | 2007 | |
$ | 109,900 | | $ | 96,700 | |
| | | | | |
Audit Fees include amounts related to the audit of the registrant’s annual financial statements or services that are normally provided by the accountant in connection with statutory and regulatory filings or engagements for those fiscal years. Fiscal year 2008 also includes Audit Fees for the review of and re-issuance of an audit opinion in conjunction with the filing of a Securities Registration Statement in Japan.
(b) Audit-Related Fees. Aggregate Audit-Related Fees billed to the registrant by the principal accountant for professional services rendered during the fiscal years ended May 31, 2008 and May 31, 2007 are approximately as follows:
Audit-Related Fees include amounts for assurance and related services by the principal accountant that are reasonably related to the performance of the audit of the registrant’s financial statements and are not reported in Audit Fees above. In both fiscal years 2008 and 2007, Audit-Related Fees include agreed-upon procedures performed for semi-annual shareholder reports. Fiscal year 2008 also includes Audit-Related Fees for agreed-upon procedures related to a fund merger and a fund accounting and custody conversion.
During the fiscal years ended May 31, 2008 and May 31, 2007, there were no Audit-Related Fees billed by the registrant’s principal accountant to the registrant’s investment adviser (not including any sub-adviser whose role is primarily portfolio management and is subcontracted with or overseen by another investment adviser) and any entity controlling, controlled by, or under common control with the adviser that provides ongoing services to the registrant for an engagement that related directly to the operations and financial reporting of the registrant.
(c) Tax Fees. Aggregate Tax Fees billed by the principal accountant to the registrant for professional services rendered during the fiscal years ended May 31, 2008 and May 31, 2007 are approximately as follows:
Tax Fees include amounts for the review of annual tax returns and typically include amounts for professional services by the principal accountant for tax compliance, tax advice and tax planning. In fiscal year 2008, Tax Fees also include agreed-upon procedures related to a fund merger and the review of a final tax return.
During the fiscal years ended May 31, 2008 and May 31, 2007, there were no Tax Fees billed by the registrant’s principal accountant to the registrant’s investment adviser (not including any sub-adviser whose role is primarily portfolio management and is subcontracted with or overseen by another investment adviser) and any entity controlling, controlled by, or under common control with the adviser that provides ongoing services
to the registrant for an engagement that related directly to the operations and financial reporting of the registrant.
(d) All Other Fees. Aggregate All Other Fees billed by the principal accountant to the registrant for professional services rendered during the fiscal years ended May 31, 2008 and May 31, 2007 are approximately as follows:
All Other Fees include amounts for products and services provided by the principal accountant, other than the services reported in paragraphs (a) through (c) above. In fiscal year 2007, All Other Fees consist of fees billed for agreed-upon procedures related to the review of the registrant’s anti-money laundering program.
Aggregate All Other Fees billed by the registrant’s principal accountant to the registrant’s investment adviser (not including any sub-adviser whose role is primarily portfolio management and is subcontracted with or overseen by another investment adviser) and any entity controlling, controlled by, or under common control with the adviser that provides ongoing services to the registrant for an engagement that related directly to the operations and financial reporting of the registrant during the fiscal years ended May 31, 2008 and May 31, 2007 are approximately as follows:
2008 | | 2007 | |
$ | 1,210,800 | | $ | 849,100 | |
| | | | | |
In both fiscal years 2008 and 2007, All Other Fees consist of fees billed for internal control examinations of the registrant’s transfer agent and investment advisor.
(e)(1) Audit Committee Pre-Approval Policies and Procedures
The registrant’s Audit Committee is required to pre-approve the engagement of the registrant’s independent accountants to provide audit and non-audit services to the registrant and non-audit services to its investment adviser (not including any sub-adviser whose role is primarily portfolio management and is subcontracted with or overseen by another investment adviser) or any entity controlling, controlled by or under common control with such investment adviser that provides ongoing services to the registrant (“Adviser Affiliates”), if the engagement relates directly to the operations and financial reporting of the registrant.
The Audit Committee has adop ted a Policy for Engagement of Independent Accountants for Audit and Non-Audit Services (“Policy”). The Policy sets forth the understanding of the Audit Committee regarding the engagement of the registrant’s independent accountants to provide (i) audit and permissible audit-related, tax and other services to the registrant (collectively “Fund Services”); (ii) non-audit services to the registrant’s investment adviser (not including any sub-adviser whose role is primarily
portfolio management and is subcontracted with or overseen by another investment adviser) and Adviser Affiliates, if the engagement relates directly to the operations or financial reporting of a Fund (collectively “Fund-related Adviser Services”); and (iii) certain other audit and non-audit services to the registrant’s investment adviser (not including any sub-adviser whose role is primarily portfolio management and is subcontracted with or overseen by another investment adviser) and Adviser Affiliates. Unless a type of service receives general pre-approval under the Policy, it requires specific pre-approval by the Audit Committee if it is to be provided by the independent accountants. Pre-approval of non-audit services to the registrant, the regist rant’s investment adviser (not including any sub-adviser whose role is primarily portfolio management and is subcontracted with or overseen by another investment adviser) and Adviser Affiliates may be waived provided that the “de minimis” requirements set forth under paragraph (c)(7)(i)(C) of Rule 2-01 of Regulation S-X are met.
Under the Policy, the Audit Committee may delegate pre-approval authority to any pre-designated member or members who are Independent Trustees/Directors. The member(s) to whom such authority is delegated must report, for informational purposes only, any pre-approval decisions to the Audit Committee at its next regular meeting. The Audit Committee’s responsibilities with respect to the pre-approval of servi ces performed by the independent accountants may not be delegated to management.
The Policy requires the Fund Treasurer and/or Director of Board Administration to submit to the Audit Committee, on an annual basis, a schedule of the types of services that are subject to general pre-approval. The schedule(s) provide a description of each type of service that is subject to general pre-approval and, where possible, will provide estimated fee caps for each instance of providing each service. The Audit Committees will review and approve the types of services and review the projected fees for the next fiscal year and may add to, or subtract from, the list of general pre-approved services from time to time based on subsequent determinations. That approval acknowledges that the Audit Committee is in agreement with the specific types of services that the independent accountants will be permitted to perform.
The Fund Treasurer and/or Director of Board Administration shall report to the Audit Committee at each of its regular meetings regarding all Fund Services or Fund-related Adviser Services initiated since the last such report was rendered, including a general description of the services, actual billed and projected fees, and the means by which such Fund Services or Fund-related Adviser Services were pre-approved by the Audit Committee.
*****
(e)(2) The percentage of services described in paragraphs (b) through (d) of this Item approved pursuant to the “de minimis” exception under paragraph (c)(7)(i)(C) of Rule 2-01 of Regulation S-X during both fiscal years ended May 31, 2008 and May 31, 2007 was zero.
(f) Not applicable.
(g) The aggregate non-audit fees billed by the registrant’s accountant for services rendered to the registrant, and rendered to the registrant’s investment adviser (not including any sub-adviser whose role is primarily portfolio management and is subcontracted with or overseen by another investment adviser), and any entity controlling, controlled by, or under common control with the adviser that provides ongoing services to the registrant for the fiscal years ended May 31, 2008 and May 31, 2007 are approximately as follows:
2008 | | 2007 | |
$ | 1,259,100 | | $ | 863,500 | |
| | | | | |
(h) The registrant’s Audit Committee of the Board of Directors has considered whether the provision of non-audit services that were rendered to the registrant’s adviser (not including any sub-adviser whose role is primarily portfolio management and is subcontracted with or overseen by another investment adviser), and any entity controlling, controlled by, or under common control with the investment adviser that provides ongoing services to the registrant that were not pre-approved pursuant to paragraph (c)(7)(ii) of Rule 2-01 of Regulation S-X, is compatible with maintaining the principal accountant’s independence.
Item 5. Audit Committee of Listed Registrants.
Not applicable.
Item 6. Investments
(a) The registrant’s “Schedule I – Investments in securities of unaffiliated issuers” (as set forth in 17 CFR 210.12-12) is included in Item 1 of this Form N-CSR.
(b) Not applicable.
Item 7. Disclosure of Proxy Voting Policies and Procedures for Closed-End Management Investment Companies.
Not applicable.
Item 8. Portfolio Managers of Closed-End Management Investment Companies.
Not applicable.
Item 9. Purchases of Equity Securities by Closed-End Management Investment Company and Affiliated Purchasers.
Not applicable.
Item 10. Submission of Matters to a Vote of Security Holders.
There have not been any material changes to the procedures by which shareholders may recommend nominees to the registrant’s board of directors, since those procedures were last disclosed in response to requirements of Item 407(c)(2)(iv) of Regulation S-K (as required by Item 22(b)(15) of Schedule 14A) or this Item.
Item 11. Controls and Procedures.
(a) The registrant’s principal executive officer and principal financial officers, based on their evaluation of the registrant’s disclosure controls and procedures as of a date within 90 days of the filing of this report, have concluded that such controls and procedures are adequately designed to ensure that information required to be disclosed by the registrant in Form N-CSR is accumulated and communicated to the registrant’s management, including the principal executive officer and principal financial officer, or persons performing similar functions, as appropriate to allow timely decisions regarding required disclosure.
(b) There was no change in the registrant’s internal control over financial reporting that occurred during the registrant’s second fiscal quarter of the period covered by this report that has materially affected, or is reasonably likely to materially affect, the registrant’s internal control over financial reporting.
Item 12. Exhibits.
(a)(1) Code of ethics required to be disclosed under Item 2 of Form N-CSR attached hereto as Exhibit 99.CODE ETH.
(a)(2) Certifications pursuant to Rule 30a-2(a) under the Investment Company Act of 1940 (17 CFR 270.30a-2(a)) attached hereto as Exhibit 99.CERT.
(a)(3) Not applicable.
(b) Certification pursuant to Rule 30a-2(b) under the Investment Company Act of 1940 (17 CFR 270.30a-2(b)) attached hereto as Exhibit 99.906CERT.
SIGNATURES
Pursuant to the requirements of the Securities Exchange Act of 1934 and the Investment Company Act of 1940, the registrant has duly caused this report to be signed on its behalf by the undersigned, thereunto duly authorized.
(registrant) | Columbia Funds Series Trust I |
|
|
By (Signature and Title) | /s/ Christopher L. Wilson |
| Christopher L. Wilson, President |
|
|
Date | July 22, 2008 |
| | | |
Pursuant to the requirements of the Securities Exchange Act of 1934 and the Investment Company Act of 1940, this report has been signed below by the following persons on behalf of the registrant and in the capacities and on the dates indicated.
By (Signature and Title) | /s/ Christopher L. Wilson |
| Christopher L. Wilson, President |
| |
| |
Date | July 22, 2008 |
| |
| |
By (Signature and Title) | /s/ J. Kevin Connaughton |
| J. Kevin Connaughton, Chief Financial Officer |
| |
| |
Date | July 22, 2008 |
| | |