UNITED STATES
SECURITIES AND EXCHANGE COMMISSION
Washington, D.C. 20549
FORM N-CSR
CERTIFIED SHAREHOLDER REPORT OF REGISTERED MANAGEMENT
INVESTMENT COMPANIES
Investment Company Act file number 811-4367
Columbia Funds Series Trust I
(Exact name of registrant as specified in charter)
One Financial Center, Boston, Massachusetts 02111
(Address of principal executive offices) (Zip code)
James R. Bordewick, Jr., Esq.
Columbia Management Advisors, LLC
One Financial Center
Boston, MA 02111
(Name and address of agent for service)
Registrant’s telephone number, including area code: 1-617-426-3750
Date of fiscal year end: June 30, 2008
Date of reporting period: June 30, 2008
Form N-CSR is to be used by management investment companies to file reports with the Commission not later than 10 days after the transmission to stockholders of any report that is required to be transmitted to stockholders under Rule 30e-1 under the Investment Company Act of 1940 (17 CFR 270.30e-1). The Commission may use the information provided on Form N-CSR in its regulatory, disclosure review, inspection, and policymaking roles.
A registrant is required to disclose the information specified by Form N-CSR, and the Commission will make this information public. A registrant is not required to respond to the collection of information contained in Form N-CSR unless the Form displays a currently valid Office of Management and Budget (“OMB”) control number. Please direct comments concerning the accuracy of the information collection burden estimate and any suggestions for reducing the burden to Secretary, Securities and Exchange Commission, 450 Fifth Street, NW, Washington, DC 20549-0609. The OMB has reviewed this collection of information under the clearance requirements of 44 U.S.C. § 3507.
Item 1. Reports to Stockholders.

Annual Report
June 30, 2008
Columbia Small Cap Value Fund I
| | |
| NOT FDIC INSURED | | May Lose Value |
| NOT BANK ISSUED | | No Bank Guarantee |
Table of Contents
The views expressed in this report reflect the current views of the respective parties. These views are not guarantees of future performance and involve certain risks, uncertainties and assumptions that are difficult to predict so actual outcomes and results may differ significantly from the views expressed. These views are subject to change at any time based upon economic, market or other conditions and the respective parties disclaim any responsibility to update such views. These views may not be relied on as investment advice and, because investment decisions for a Columbia Fund are based on numerous factors, may not be relied on as an indication of trading intent on behalf of any particular Columbia Fund. References to specific company securities should not be construed as a recommendation or investment advice.
President’s Message

Dear Shareholder:
We are pleased to provide this financial report for your Columbia Fund. This document provides information that can help support your investment decision-making. It’s been a challenging year for the financial markets, particularly as concerns over a weaker housing market and economic uncertainty make the news headlines daily. For a sense of how Columbia Management’s investment professionals have responded to these issues, I encourage you to read the Economic Update and Portfolio Managers’ Report. I believe these discussions reflect Columbia Management’s investment management expertise as well as its commitment to market research and consistent investment performance.
We understand that many factors drove your decision to invest in Columbia Funds. Columbia Management’s commitment is to honor that decision by providing investment solutions designed to exceed your expectations. As we review the past year and look forward to those ahead, we hope you will consider how we might support your investment needs beyond the services we provide currently. Some of the many advantages we bring to the table as the fund’s investment manager include:
| n | | Broad and deep investment expertise, including dedicated portfolio management, research and trading |
| n | | Strategically positioned investment disciplines and processes |
| n | | Comprehensive compliance and risk management |
| n | | A team-driven culture that draws upon multiple sources to pursue consistent and superior performance |
| n | | A comprehensive array of investment solutions, including equity, fixed-income and cash strategies |
Working for you, and with you
Team approach — Rather than rely on the talent or judgment of one individual, Columbia Management takes a team-oriented approach to investing. We draw from the diverse experiences and insights of our people — including portfolio managers, research analysts and traders — to bring multiple investment perspectives and deep expertise to all of our investment management activities.
Client focus — At Columbia Management, our philosophy and culture are anchored in focused solutions and personal service. We are committed to putting our clients’ interests first and we understand the premium our clients place on reliability —whether it’s related to service, investment performance or risk management. Columbia Management is committed to maintaining high standards of reliability on all counts.
While our asset management capabilities are multifaceted and our investment professionals are multitalented, ultimately, everything we do at Columbia Management has a single purpose: to help investors pursue their most important financial goals. We are honored that you’ve chosen to invest with us and look forward to providing the investment solutions and services necessary to sustain a lasting relationship.
Sincerely,

Christopher L. Wilson
President, Columbia Funds
Fund Profile – Columbia Small Cap Value Fund I
Performance data quoted represents past performance and current performance may be lower or higher. Past performance is no guarantee of future results. The investment return and principal value will fluctuate so that shares, when redeemed, may be worth more or less than the original cost. Please visit www.columbiafunds.com for daily and most recent month-end performance updates.
Summary
1-year return as of 06/30/08
| | |
| |

| | –16.96% Class A shares
(without sales charge) |
| |
| | –21.63% Russell 2000 Value Index |
Morningstar Style Box
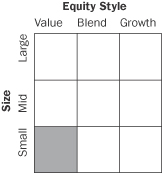
The Morningstar Style Box reveals a fund’s investment strategy. For equity funds the vertical axis shows the market capitalization of the stocks owned and the horizontal axis shows investment style (value, blend or growth). All of these numbers are drawn from the data most recently provided by the fund and entered into Morningstar’s database as of month end. Although the data are gathered from reliable source, Morningstar cannot guarantee completeness and accuracy. Information shown is as of 03/31/08.
Summary
| n | | For the 12-month period that ended June 30, 2008, the fund’s Class A shares returned negative 16.96% without sales charge. |
n | | Although the fund’s shares declined, they did not fall nearly as much as the fund’s benchmark, the Russell 2000 Value Index.1 |
| n | | Stock selection and sector weights, particularly in consumer discretionary, health care and financials, helped the fund stay ahead of the index. |
Portfolio Management
Stephen Barbaro has managed or co-managed the fund since June 2002 and has been associated with the advisor or its predecessors or affiliate organizations since 1976.
Jeremy Javidi has co-managed the fund since August 2005 and has been associated with the advisor or its predecessors or affiliate organizations since 2000.
1 | The Russell 2000 Value Index measures the performance of those Russell 2000 Index companies with lower price-to-book ratios and lower forecasted growth value. Indices are not investments, do not incur fees or expenses and are not professionally managed. It is not possible to invest directly in an index. Securities in the fund may not match those in an index. |
1
Economic Update – Columbia Small Cap Value Fund I
Summary
For the 12-month period that ended June 30, 2008
| | n | | The broad U.S. stock market, as measured by the S&P 500 Index, returned negative 13.12%. Stock markets outside the United States returned negative 10.61%, as measured (in U.S. dollars) by the MSCI EAFE Index. A declining dollar helped offset losses. | |
| | |
| S&P Index | | MSCI Index |
| |

| |
|
–13.12% | | –10.61% |
| | n | | Despite volatility in many segments of the bond market, the Lehman Brothers U.S. Aggregate Bond Index delivered a solid return. High-yield bonds lost ground, as measured by the Merrill Lynch U.S. High Yield, Cash Pay Index. | |
| | |
Lehman
Index | | Merrill Lynch
Index |
| |

| |
|
7.12% | | –2.03% |
The Standard & Poor’s (S&P) 500 Index tracks the performance of 500 widely held, large-capitalization U.S. stocks.
The Morgan Stanley Capital International (MSCI) Europe, Australasia, Far East (EAFE) Index is a free float-adjusted market capitalization index that is designed to measure developed market equity performance, excluding the U.S. and Canada.
The Lehman Brothers U.S. Aggregate Bond Index is a market value-weighted index that tracks the daily price, coupon, pay-downs and total return performance of fixed-rate, publicly placed, dollar-denominated and non-convertible investment grade debt issues with at least $250 million par amount outstanding and with at least one year to final maturity.
The Merrill Lynch U.S. High Yield, Cash Pay Index tracks the performance of non-investment-grade corporate bonds.
Indices are not investments, do not incur fees or expenses and are not professionally managed. It is not possible to invest directly in an index. Securities in the fund may not match those in an index.
The pace of economic growth slowed throughout the 12-month period that began July 1, 2007 and ended June 30, 2008 as a multitude of factors weighed on consumers and businesses alike. The most severe housing downturn in decades continued to take a toll on growth. Inventories of homes for sale rose, home prices declined and tighter credit standards, the result of turmoil in the subprime mortgage market, made it more difficult for homebuyers to qualify for loans. Energy prices soared to record highs and food prices rose, raising concerns about inflation. Consumer confidence declined sharply. According to the Conference Board, which tracks consumer confidence, its June reading was the fifth lowest ever.
As growth weakened, businesses pulled back on hiring, which further dimmed the outlook for consumers. Nearly 300,000 job losses were reported in the first six months of 2008, and the unemployment rate spiked to 5.5%, one full percentage point higher than it was at the beginning of the period. Manufacturing activity also slowed, but appeared to stabilize late in the period, one of the few positive indicators that economic weakness might be contained. Federal tax rebates also began to arrive in May, raising hopes for a boost in consumer spending, which remained more resilient than most economists expected. Any improvement on the consumer side of the economy potentially could help avert a recession.
In an effort to inspire confidence in the capital markets, loosen the reins on credit and shore up economic growth, the Federal Reserve Board (the Fed) brought a key short-term rate — the federal funds rate — down from 5.25% to 2.0% during the 12-month period. After seven rate cuts, the Fed acknowledged that downside risks to growth remained but also that the inflation outlook was a concern and that it would monitor inflation developments carefully.
Stocks retreated as economic storm clouds gathered
Against a shifting economic backdrop, the U.S. stock market lost 13.12% for the 12-month period, as measured by the S&P 500 Index. Large- cap stocks held up better than small- and mid-cap stocks, as measured by their respective Russell indices.1 Growth stocks also held up better than value stocks by a significant margin. As the dollar fell to a record low against the euro and multi-year lows versus a number of other currencies, investors reaped somewhat better results from investments outside the U.S. The MSCI EAFE Index, a broad gauge of stock market performance in foreign developed markets, lost 10.61% (in U.S. dollars) for the period, as a weak second half wiped out solid gains that had been posted in the first half of the 12-month period. Despite weakness near the end of the period, emerging stock markets, both collectively and individually, generated positive returns. The MSCI Emerging Markets Index returned 4.89% (in U.S. dollars) as demand for exports as well as domestic infrastructure expansion, continued.2
1 | The Russell 1000 Index measures the performance of 1,000 of the largest U.S. companies, based on market capitalization. The Russell Midcap Index measures the performance of the 800 smallest companies in the Russell 1000 Index, as ranked by total market capitalization. The Russell 2000 Index measures the performance of the 2,000 smallest of the 3,000 largest U.S. companies, based on market capitalization. |
2 | The MSCI Emerging Markets Index is a widely accepted index composed of a sample of companies from 25 countries representing the global emerging stock markets. |
Indices are not investments, do not incur fees or expenses and are not professionally managed. It is not possible to invest directly in an index. Securities in the fund may not match those in an index.
2
Economic Update (continued) – Columbia Small Cap Value Fund I
Bonds delivered solid gains
The U.S. bond market seesawed during the 12-month period but delivered a solid gain as investors sought the relative safety of the highest quality sectors. After a weak start, bond prices generally rose and yields declined as economic growth slowed and stock market volatility increased. Although the benchmark 10-year U.S. Treasury yield edged back above 4.0% in 2008, it slipped to 3.97% at the end of the period, one full percentage point below where it was one year ago. In this environment, the Lehman Brothers U.S. Aggregate Bond Index returned 7.12%. High-yield bonds disappointed in 2007 but regained some ground in 2008. The Merrill Lynch U.S. High Yield, Cash Pay Index returned negative 2.03%. Municipal bonds generated modest but solid returns during most of the period, but gave back some performance early in 2008 as industry-specific events threatened investor confidence. In February, yields on municipal bonds rose above yields on comparable maturity Treasuries — and prices fell — in a difficult month for the sector. In this environment, the Lehman Brothers Municipal Bond Index returned 3.23% for the one-year period.3
Past performance is no guarantee of future results.
3 | The Lehman Brothers Municipal Bond Index is considered representative of the broad market for investment-grade, tax-exempt bonds with a maturity of at least one year. |
Indices are not investments, do not incur fees or expenses and are not professionally managed. It is not possible to invest directly in an index. Securities in the fund may not match those in an index.
3
Performance Information – Columbia Small Cap Value Fund I
Performance data quoted represents past performance and current performance may be lower or higher. Past performance is no guarantee of future results. The investment return and principal value will fluctuate so that shares, when redeemed, may be worth more or less than the original cost. Please visit www.columbiafunds.com for daily and most recent month-end performance updates.
| | |
| Annual operating expense ratio (%)* |
| |
Class A | | 1.29 |
Class B | | 2.04 |
Class C | | 2.04 |
Class Z | | 1.04 |
| * | The annual operating expense ratio is as stated in the fund's prospectus that is current as of the date of this report. Differences in expense ratios disclosed elsewhere in this report may result from including fee waivers and expense reimbursements as well as different time periods used in calculating the ratios. |
|
| Growth of a $10,000 investment 07/01/98 – 06/30/08 |
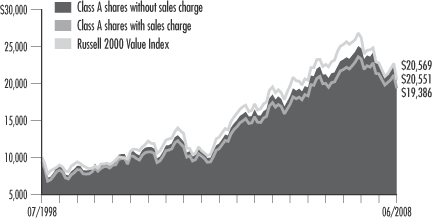
The chart above shows the growth in value of a hypothetical $10,000 investment in Class A shares of Columbia Small Cap Value Fund I during the stated time period, and does not reflect the deduction of taxes that a shareholder may pay on fund distributions or on the redemption of fund shares. The Russell 2000 Value Index measures the performance of those Russell 2000 Index companies with lower price-to-book ratios and lower forecasted growth values. Indices are not investments, do not incur fees or expenses and are not professionally managed. It is not possible to invest directly in an index. Securities in the fund may not match those in an index.
| | | | |
| Performance of a $10,000 investment 07/01/98 – 06/30/08 ($) |
| | |
| Sales charge | | without | | with |
Class A | | 20,569 | | 19,386 |
Class B | | 19,067 | | 19,067 |
Class C | | 19,069 | | 19,069 |
Class Z | | 21,122 | | n/a |
| | | | | | | | | | | | | | |
| Average annual total return as of 06/30/08 (%) |
| | | | |
| Share class | | A | | B | | C | | Z |
| Inception | | 07/25/86 | | 11/09/92 | | 01/15/96 | | 07/31/95 |
| Sales charge | | without | | with | | without | | with | | without | | with | | without |
1-year | | –16.96 | | –21.73 | | –17.58 | | –21.29 | | –17.59 | | –18.34 | | –16.74 |
5-year | | 11.60 | | 10.29 | | 10.78 | | 10.51 | | 10.77 | | 10.77 | | 11.90 |
10-year | | 7.48 | | 6.84 | | 6.67 | | 6.67 | | 6.67 | | 6.67 | | 7.76 |
The “with sales charge” returns include the maximum initial sales charge of 5.75% for Class A shares, the applicable contingent deferred sales charge of 5.00% in the first year, declining to 1.00% in the sixth year and eliminated thereafter for Class B shares and 1.00% for Class C shares for the first year only. The “without sales charge” returns do not include the effect of sales charges. If they had, returns would be lower.
Performance results reflect any fee waivers or reimbursements of fund expenses by the investment advisor and/or any of its affiliates. Absent these fee waivers or expense reimbursement arrangements, performance results would have been lower.
All results shown assume reinvestment of distributions. Class Z shares are sold at net asset value with no distribution and service (Rule 12b-1) fees. Class Z shares have limited eligibility and the investment minimum requirements may vary. Please see the fund’s prospectus for details. Performance for different share classes will vary based on differences in sales charges and fees associated with each class.
The table does not reflect the deduction of taxes that a shareholder may pay on fund distributions or on the redemption of fund shares.
4
Understanding Your Expenses – Columbia Small Cap Value Fund I
Estimating your actual expenses
To estimate the expenses that you paid over the period, first you will need your account balance at the end of the period:
| n | | For shareholders who receive their account statements from Columbia Management Services, Inc., your account balance is available online at www.columbiafunds.com or by calling Shareholder Services at 800.345.6611. |
| n | | For shareholders who receive their account statements from their financial intermediary, contact your financial intermediary to obtain your account balance. |
| | 1. | Divide your ending account balance by $1,000. For example, if an account balance was $8,600 at the end of the period, the result would be 8.6. | |
| | 2. | In the section of the table below titled “Expenses paid during the period,” locate the amount for your share class. You will find this number in the column labeled “actual.” Multiply this number by the result from step 1. Your answer is an estimate of the expenses you paid on your account during the period. | |
If the value of your account falls below the minimum initial investment requirement applicable to you, your account generally will be subject to a $20 annual fee. This fee is not included in the accompanying table. If you are subject to the fee, keep it in mind when you are estimating the ongoing expenses of investing in the fund and when comparing the expenses of this fund with other funds.
As a fund shareholder, you incur two types of costs. There are transaction costs, which generally include sales charges on purchases and may include redemption fees or exchange fees. There are also ongoing costs, which generally include investment advisory fees, distribution and service (Rule 12b-1) fees and other fund expenses. The information on this page is intended to help you understand the ongoing costs of investing in the fund and to compare these costs with the ongoing costs of investing in other mutual funds.
Analyzing your fund’s expenses by share class
To illustrate these ongoing costs, we have provided an example and calculated the expenses paid by investors in each share class during the period. The information in the following table is based on an initial investment of $1,000, which is invested at the beginning of the period and held for the entire period. Expense information is calculated two ways and each method provides you with different information. The amount listed in the “actual” column is calculated using the fund’s actual operating expenses and total return for the period. The amount listed in the “hypothetical” column for each share class assumes that the return each year is 5% before expenses and is calculated based on the fund’s actual operating expenses. You should not use the hypothetical account values and expenses to estimate either your actual account balance at the end of the period or the expenses you paid during this period.
Compare with other funds
Since all mutual funds are required to include the same hypothetical calculations about expenses in shareholder reports, you can use this information to compare the ongoing costs of investing in the fund with other funds. To do so, compare the 5% hypothetical example with the 5% hypothetical examples that appear in the shareholder reports of other funds. As you compare hypothetical examples of other funds, it is important to note that hypothetical examples are meant to highlight the ongoing costs of investing in a fund and do not reflect any transaction costs, such as sales charges, redemption fees or exchange fees.
| | | | | | | | | | | | | | |
| | | | |
| | | Account value at the
beginning of the period ($) | | Account value at the
end of the period ($) | | Expenses paid during the period ($) | | Fund's annualized
expense ratio (%) |
| | | Actual | | Hypothetical | | Actual | | Hypothetical | | Actual | | Hypothetical | | Actual |
Class A | | 1,000.00 | | 1,000.00 | | 909.70 | | 1,018.60 | | 5.98 | | 6.32 | | 1.26 |
Class B | | 1,000.00 | | 1,000.00 | | 906.31 | | 1,014.87 | | 9.53 | | 10.07 | | 2.01 |
Class C | | 1,000.00 | | 1,000.00 | | 906.22 | | 1,014.87 | | 9.53 | | 10.07 | | 2.01 |
Class Z | | 1,000.00 | | 1,000.00 | | 910.69 | | 1,019.84 | | 4.80 | | 5.07 | | 1.01 |
Expenses paid during the period are equal to the annualized expense ratio for the share class, multiplied by the average account value over the period, then multiplied by the number of days in the fund’s most recent fiscal half-year and divided by 366.
It is important to note that the expense amounts shown in the table are meant to highlight only ongoing costs of investing in the fund and do not reflect any transaction costs, such as sales charges, redemption fees or exchange fees. Therefore, the hypothetical examples provided may not help you determine the relative total costs of owning shares of different funds. If these transaction costs were included, your costs would have been higher.
5
Portfolio Managers’ Report – Columbia Small Cap Value Fund I
Performance data quoted represents past performance and current performance may be lower or higher. Past performance is no guarantee of future results. The investment return and principal value will fluctuate so that shares, when redeemed, may be worth more or less than the original cost. Please visit www.columbiafunds.com for daily and most recent month-end performance updates.
| | |
Net asset value per share |
| |
as of 06/30/08 ($) | | |
Class A | | 39.50 |
Class B | | 33.00 |
Class C | | 34.76 |
Class Z | | 41.22 |
| | |
| | |
| Distributions declared per share |
| |
07/01/07 – 06/30/08 ($) | | |
Class A | | 4.35 |
Class B | | 4.21 |
Class C | | 4.21 |
Class Z | | 4.47 |
For the 12-month period that ended June 30, 2008, the fund’s Class A shares returned negative 16.96% without sales charge. Although we are never pleased to report negative performance, it is worth noting that this decline was not as steep as the return of the fund’s benchmark, the Russell 2000 Value Index1, or the average return of its peer group, the Lipper Small-Cap Value Classification2, which were negative 21.63% and negative 19.70%, respectively. Most sectors across the market and across the fund were down, with the biggest losses coming from the consumer discretionary, financials and technology sectors. The fund gained some downside protection from stock selection, as well as positive sector weights.
High-quality focus, defensive positioning helped
In selecting stocks for the fund, we remained focused on companies with strong balance sheets, positive earnings growth and attractive stock valuations. This strategy worked particularly well during the past year as economic uncertainty triggered concerns about earnings and capital, which pushed investors toward companies with demonstrated financial strength. The fund further benefited from overweights in less economically-sensitive sectors, such as health care, which held up relatively well in the downturn, and underweights in the weakest sectors, including consumer discretionary and financials.
Contributions from consumer discretionary and financials
Stock selection was strongest in some of the sectors that declined the most. In consumer discretionary, the fund avoided media stocks and greatly underweighted autos and auto parts — among the sector’s worst performing industries. In addition, the fund’s specialty retail holdings posted strong gains, led by America’s Car-Mart, Inc., which sells used vehicles in small markets to customers who need financing help. The company benefited from strong execution on its strategy. In financials, the fund successfully avoided some of the biggest blow-ups, while generating returns — particularly from real estate investment trusts and from thrifts and mortgage finance companies — that were down much less than those in the index. An overweight in insurance further aided returns, as did investments in selective commercial banks, such as UMB Financial Corp., a top holding that climbed sharply after reporting record first-quarter profits.
1 | The Russell 2000 Value Index measures the performance of those Russell 2000 Index companies with lower price-to-book ratios and lower forecasted growth values. Indices are not investments, do not incur fees or expenses and are not professionally managed. It is not possible to invest directly in an index. Securities in the fund may not match those in an index. |
2 | Lipper Inc., a widely respected data provider in the industry, calculates an average total return (assuming reinvestment of distributions) for mutual funds with investment objectives similar to those of the fund. Lipper makes no adjustment for the effect of sales loads. |
6
Portfolio Managers’ Report (continued) – Columbia Small Cap Value Fund I
| | |
| Top 5 sectors |
| |
as of 06/30/08 (%) | | |
Financials | | 28.1 |
Information Technology | | 14.2 |
Industrials | | 13.2 |
Health Care | | 10.0 |
Energy | | 8.2 |
| | |
| Top 10 holdings |
| |
as of 06/30/08 (%) | | |
Greif, Inc. | | 1.3 |
CH Energy Group, Inc. | | 0.9 |
UMB Financial Corp. | | 0.9 |
America’s Car-Mart, Inc. | | 0.9 |
STERIS Corp. | | 0.8 |
Potlatch Corp. | | 0.8 |
Comstock Resources, Inc. | | 0.8 |
Untied American Indemnity Ltd. | | 0.8 |
H.B. Fuller Co. | | 0.8 |
Werner Enterprises, Inc. | | 0.8 |
| | |
| Holdings discussed in this report |
| |
as of 06/30/08 (%) | | |
America’s Car-Mart, Inc. | | 0.9 |
UMB Financial Corp. | | 0.9 |
Owens & Minor, Inc. | | 0.7 |
Amedisys, Inc. | | 0.4 |
PAREXEL International Corp. | | 0.5 |
The fund is actively managed and the composition of its portfolio will change over time. Information provided is calculated as a percentage of net assets.
Positive injection from health care
The fund’s health-care investments generated modestly positive returns, despite the sector’s decline in the index. Stock and industry selection made the difference, particularly among health care providers and services, where we found some higher-quality and less expensive stocks. Among the winners were Owens & Minor, Inc., a medical and surgical supply distributor, and Amedisys, Inc., a home health and hospice provider. In addition, life sciences tools and services investments posted strong gains, led by PAREXEL International Corp., a contract researcher that saw increased demand from drug companies doing more outsourcing. Other positive contributions versus the index came from consumer staples, where stock selection was especially helpful in food retailing and food. Investments in energy, an overweight, did not help relative returns, but were only slightly behind the return posted by the sector in the index.
Lost ground from materials
Materials stock selection detracted from the fund’s returns versus the index. The fund did not own some of the index’s best performers in the metals and mining and agricultural chemicals industries, largely because the stocks had expensive stock valuations and heavy debt loads. Some of these stocks were heavily weighted in the index and generated triple digit returns as growing global demand pushed commodity prices higher.
Staying the course
The fund remains defensively positioned, both in terms of its focus on higher quality stocks and its sector weights. We are cautiously optimistic about the fund’s prospects, largely because of the financial strength and attractive valuations of the fund’s holdings. In addition, small-cap stocks have often led the market into a downturn, as they did in this recent cycle, and have the potential to be among the first to recover once investor confidence is restored.
Portfolio holdings and characteristics are subject to change periodically and may not be representative of current holdings and characteristics. The outlook for the fund may differ from that presented for other Columbia Funds.
Equity investments are affected by stock market fluctuations that occur in response to economic and business developments.
Investments in small-cap stocks may be subject to greater volatility and price fluctuations because they may be thinly traded and less liquid than investments in larger companies.
Value stocks are stocks of companies that may have experienced adverse business or industry developments or may be subject to special risks that have caused the stocks to be out of favor and, in the advisor’s opinion, undervalued. The price of the company’s stock may not approach the value the advisor has placed on it.
7
Investment Portfolio – Columbia Small Cap Value Fund I
June 30, 2008
Common Stocks – 99.6%
| | | | |
| | | Shares | | Value ($) |
| Consumer Discretionary – 7.6% | | |
Auto Components – 0.8% | | |
American Axle & Manufacturing Holdings, Inc. | | 77,830 | | 621,862 |
BorgWarner, Inc. | | 114,860 | | 5,097,487 |
Modine Manufacturing Co. | | 125,263 | | 1,549,503 |
| | | | |
Auto Components Total | | | | 7,268,852 |
| |
Diversified Consumer Services – 0.1% | | |
Regis Corp. | | 46,200 | | 1,217,370 |
| | | | |
Diversified Consumer Services Total | | | | 1,217,370 |
| |
Hotels, Restaurants & Leisure – 1.5% | | |
Benihana, Inc., Class A (a) | | 233,430 | | 1,479,946 |
Bob Evans Farms, Inc. | | 128,100 | | 3,663,660 |
CEC Entertainment, Inc. (a) | | 103,500 | | 2,899,035 |
Landry’s Restaurants, Inc. | | 170,890 | | 3,070,893 |
O’Charleys, Inc. | | 172,300 | | 1,733,338 |
| | | | |
Hotels, Restaurants & Leisure Total | | | | 12,846,872 |
| |
Household Durables – 1.7% | | |
American Greetings Corp., Class A | | 324,220 | | 4,000,875 |
CSS Industries, Inc. | | 94,404 | | 2,286,465 |
Ethan Allen Interiors, Inc. | | 69,520 | | 1,710,192 |
Furniture Brands International, Inc. | | 169,930 | | 2,270,265 |
Skyline Corp. | | 84,243 | | 1,979,710 |
Universal Electronics, Inc. (a) | | 113,080 | | 2,363,372 |
| | | | |
Household Durables Total | | | | 14,610,879 |
| |
Leisure Equipment & Products – 0.1% | | |
MarineMax, Inc. (a) | | 151,980 | | 1,089,697 |
| | | | |
Leisure Equipment & Products Total | | | | 1,089,697 |
| |
Specialty Retail – 2.5% | | |
America’s Car-Mart, Inc. (a) | | 412,483 | | 7,391,695 |
Foot Locker, Inc. | | 158,040 | | 1,967,598 |
Monro Muffler Brake, Inc. | | 239,456 | | 3,709,174 |
Rent-A-Center, Inc. (a) | | 273,195 | | 5,619,621 |
Zale Corp. (a) | | 130,980 | | 2,474,212 |
| | | | |
Specialty Retail Total | | | | 21,162,300 |
| |
Textiles, Apparel & Luxury Goods – 0.9% | | |
Hampshire Group Ltd. (a) | | 179,629 | | 925,089 |
Movado Group, Inc. | | 142,620 | | 2,823,876 |
Wolverine World Wide, Inc. | | 145,510 | | 3,880,752 |
| | | | |
Textiles, Apparel & Luxury Goods Total | | 7,629,717 |
| | | | |
Consumer Discretionary Total | | 65,825,687 |
| | | | |
| | | Shares | | Value ($) |
| Consumer Staples – 4.5% | | | | |
Beverages – 0.2% | | | | |
MGP Ingredients, Inc. | | 317,661 | | 1,842,434 |
| | | | |
Beverages Total | | | | 1,842,434 |
| | |
Food & Staples Retailing – 1.5% | | | | |
BJ’s Wholesale Club, Inc. (a) | | 106,910 | | 4,137,417 |
Ruddick Corp. | | 88,500 | | 3,036,435 |
Weis Markets, Inc. | | 186,019 | | 6,040,037 |
| | | | |
Food & Staples Retailing Total | | | | 13,213,889 |
| | |
Food Products – 2.1% | | | | |
Flowers Foods, Inc. | | 95,973 | | 2,719,875 |
Fresh Del Monte Produce, Inc. (a) | | 75,814 | | 1,786,936 |
J & J Snack Foods Corp. | | 72,534 | | 1,988,157 |
Lancaster Colony Corp. | | 112,793 | | 3,415,372 |
Lance, Inc. | | 152,020 | | 2,853,415 |
Maui Land & Pineapple Co., Inc. (a) | | 119,962 | | 3,532,881 |
Ralcorp Holdings, Inc. (a) | | 42,950 | | 2,123,448 |
| | | | |
Food Products Total | | | | 18,420,084 |
| | |
Personal Products – 0.7% | | | | |
Bare Escentuals, Inc. (a) | | 97,130 | | 1,819,245 |
NBTY, Inc. (a) | | 118,300 | | 3,792,698 |
| | | | |
Personal Products Total | | | | 5,611,943 |
| | | | |
Consumer Staples Total | | | | 39,088,350 |
| | | | |
| Energy – 8.2% | | | | |
Energy Equipment & Services – 3.9% | | |
Complete Production Services,
Inc. (a) | | 140,574 | | 5,119,705 |
Key Energy Services, Inc. (a) | | 203,160 | | 3,945,367 |
Lufkin Industries, Inc. | | 53,878 | | 4,486,960 |
Oil States International, Inc. (a) | | 73,470 | | 4,660,937 |
Patterson-UTI Energy, Inc. | | 112,220 | | 4,044,409 |
TGC Industries, Inc. (a) | | 256,618 | | 2,283,900 |
Tidewater, Inc. | | 65,950 | | 4,288,728 |
TriCo Marine Services, Inc. (a) | | 121,609 | | 4,429,000 |
| | | | |
Energy Equipment & Services Total | | | | 33,259,006 |
| |
Oil, Gas & Consumable Fuels – 4.3% | | |
Alpha Natural Resources, Inc. (a) | | 33,710 | | 3,515,616 |
Bois d’Arc Energy, Inc. (a) | | 138,371 | | 3,363,799 |
Comstock Resources, Inc. (a) | | 85,030 | | 7,179,083 |
Frontier Oil Corp. | | 135,100 | | 3,230,241 |
Harvest Natural Resources,
Inc. (a) | | 392,150 | | 4,337,179 |
Holly Corp. | | 88,750 | | 3,276,650 |
Nordic American Tanker Shipping | | 71,967 | | 2,793,759 |
Stone Energy Corp. (a) | | 80,950 | | 5,335,414 |
See Accompanying Notes to Financial Statements.
8
Columbia Small Cap Value Fund I
June 30, 2008
Common Stocks (continued)
| | | | |
| | | Shares | | Value ($) |
| Energy (continued) | | | | |
Oil, Gas & Consumable Fuels (continued) | | |
Swift Energy Co. (a) | | 55,230 | | 3,648,494 |
Western Refining, Inc. | | 63,886 | | 756,410 |
| | | | |
Oil, Gas & Consumable Fuels Total | | | | 37,436,645 |
| | | | |
Energy Total | | | | 70,695,651 |
| | | | |
| Financials – 28.1% | | | | |
Capital Markets – 0.4% | | | | |
Piper Jaffray Companies, Inc. (a) | | 109,080 | | 3,199,316 |
| | | | |
Capital Markets Total | | | | 3,199,316 |
| | |
Commercial Banks – 7.9% | | | | |
BancFirst Corp. | | 86,264 | | 3,692,099 |
BancTrust Financial Group, Inc. | | 275,128 | | 1,813,094 |
Bank of Granite Corp. | | 306,863 | | 2,181,796 |
Bryn Mawr Bank Corp. | | 168,884 | | 2,955,470 |
Capital Corp. of the West | | 226,888 | | 862,174 |
Capitol Bancorp Ltd. | | 197,949 | | 1,775,603 |
Chemical Financial Corp. | | 234,393 | | 4,781,617 |
Columbia Banking System, Inc. | | 144,575 | | 2,794,635 |
Community Trust Bancorp, Inc. | | 107,671 | | 2,827,440 |
First Citizens BancShares,
Inc., Class A | | 38,797 | | 5,411,794 |
First Financial Corp. | | 156,153 | | 4,779,843 |
First Horizon National Corp. | | 401,610 | | 2,983,962 |
First National Bank of Alaska | | 1,418 | | 2,623,300 |
Mass Financial Corp., Class A (a) | | 283,270 | | 1,260,552 |
Merchants Bancshares, Inc. | | 163,405 | | 3,668,442 |
Northfield Bancorp, Inc. (a) | | 146,803 | | 1,578,132 |
Northrim BanCorp, Inc. | | 176,031 | | 3,198,483 |
Sterling Bancorp NY | | 252,606 | | 3,018,642 |
Taylor Capital Group, Inc. | | 173,525 | | 1,299,702 |
UMB Financial Corp. | | 144,339 | | 7,400,261 |
West Coast Bancorp | | 218,850 | | 1,897,429 |
Whitney Holding Corp. | | 276,700 | | 5,063,610 |
| | | | |
Commercial Banks Total | | | | 67,868,080 |
| | |
Consumer Finance – 1.0% | | | | |
Advance America Cash Advance Centers, Inc. | | 478,580 | | 2,431,186 |
Cash America International, Inc. | | 209,680 | | 6,500,080 |
| | | | |
Consumer Finance Total | | | | 8,931,266 |
| |
Diversified Financial Services – 0.5% | | |
Medallion Financial Corp. | | 422,501 | | 3,979,960 |
| | | | |
Diversified Financial Services Total | | | | 3,979,960 |
| | | | |
| | | Shares | | Value ($) |
| | |
Insurance – 8.7% | | | | |
American Physicians Capital, Inc. | | 45,534 | | 2,205,667 |
Amerisafe, Inc. (a) | | 140,605 | | 2,241,244 |
Baldwin & Lyons, Inc., Class B | | 159,562 | | 2,789,144 |
CNA Surety Corp. (a) | | 225,309 | | 2,847,906 |
EMC Insurance Group, Inc. | | 177,709 | | 4,279,233 |
FBL Financial Group, Inc. | | 102,990 | | 2,047,441 |
Harleysville Group, Inc. | | 118,744 | | 4,017,109 |
Horace Mann Educators Corp. | | 288,453 | | 4,044,111 |
IPC Holdings Ltd. | | 152,630 | | 4,052,326 |
Max Capital Group Ltd. | | 135,490 | | 2,890,002 |
Mercury General Corp. | | 62,510 | | 2,920,467 |
National Western Life Insurance Co., Class A | | 18,578 | | 4,059,293 |
Navigators Group, Inc. (a) | | 103,220 | | 5,579,041 |
Phoenix Companies, Inc. | | 626,315 | | 4,766,257 |
ProCentury Corp. | | 311,509 | | 4,934,303 |
RAM Holdings Ltd. (a) | | 766,960 | | 766,960 |
RLI Corp. | | 90,801 | | 4,491,925 |
Safety Insurance Group, Inc. | | 111,900 | | 3,989,235 |
Selective Insurance Group, Inc. | | 158,354 | | 2,970,721 |
Stewart Information Services Corp. | | 136,970 | | 2,649,000 |
United America Indemnity Ltd., Class A (a) | | 513,191 | | 6,861,364 |
| | | | |
Insurance Total | | | | 75,402,749 |
|
Real Estate Investment Trusts (REITs) – 4.8% |
DiamondRock Hospitality Co. | | 313,340 | | 3,412,273 |
DuPont Fabros Technology, Inc. | | 198,981 | | 3,709,006 |
Franklin Street Properties Corp. | | 368,070 | | 4,652,405 |
Getty Realty Corp. | | 149,047 | | 2,147,767 |
LaSalle Hotel Properties | | 168,380 | | 4,231,390 |
National Health Investors, Inc. | | 111,227 | | 3,171,082 |
Potlatch Corp. | | 159,310 | | 7,188,067 |
Sun Communities, Inc. | | 248,958 | | 4,538,504 |
SWA Reit & Investments Ltd. | | 74,542 | | 39,903 |
Universal Health Realty Income Trust | | 129,573 | | 3,887,190 |
Urstadt Biddle Properties, Inc., Class A | | 277,332 | | 4,065,687 |
| | | | |
Real Estate Investment Trusts (REITs) Total | | | | 41,043,274 |
| |
Thrifts & Mortgage Finance – 4.8% | | |
Bank Mutual Corp. | | 447,636 | | 4,494,266 |
BankFinancial Corp. | | 276,500 | | 3,597,265 |
Beneficial Mutual Bancorp, Inc. (a) | | 347,738 | | 3,849,460 |
Brookline Bancorp, Inc. | | 522,080 | | 4,985,864 |
Clifton Savings Bancorp, Inc. | | 273,514 | | 2,664,026 |
Corus Bankshares, Inc. | | 553,243 | | 2,301,491 |
ESSA Bancorp, Inc. | | 184,178 | | 2,305,909 |
See Accompanying Notes to Financial Statements.
9
Columbia Small Cap Value Fund I
June 30, 2008
Common Stocks (continued)
| | | | |
| | | Shares | | Value ($) |
| Financials (continued) | | | | |
Thrifts & Mortgage Finance (continued) | | |
Flagstar BanCorp, Inc. | | 641,005 | | 1,929,425 |
Home Federal Bancorp, Inc. | | 353,490 | | 3,485,411 |
TrustCo Bank Corp. NY | | 330,874 | | 2,455,085 |
United Financial Bancorp, Inc. | | 233,066 | | 2,603,347 |
Washington Federal, Inc. | | 182,870 | | 3,309,947 |
Westfield Financial, Inc. | | 393,343 | | 3,559,754 |
| | | | |
Thrifts & Mortgage Finance Total | | | | 41,541,250 |
| | | | |
Financials Total | | | | 241,965,895 |
| | | | |
| Health Care – 10.0% | | | | |
Health Care Equipment & Supplies – 2.2% | | |
Analogic Corp. | | 65,440 | | 4,127,301 |
Haemonetics Corp. (a) | | 96,600 | | 5,357,436 |
Hill-Rom Holdings, Inc. | | 85,060 | | 2,294,919 |
STERIS Corp. | | 251,580 | | 7,235,441 |
| | | | |
Health Care Equipment & Supplies Total | | | | 19,015,097 |
| |
Health Care Providers & Services – 5.6% | | |
Amedisys, Inc. (a) | | 68,930 | | 3,475,451 |
AmSurg Corp. (a) | | 132,200 | | 3,219,070 |
Cross Country Healthcare, Inc. (a) | | 278,364 | | 4,011,225 |
Gentiva Health Services, Inc. (a) | | 292,340 | | 5,569,077 |
Healthspring, Inc. (a) | | 92,265 | | 1,557,433 |
Kindred Healthcare, Inc. (a) | | 226,600 | | 6,517,016 |
Magellan Health Services, Inc. (a) | | 53,730 | | 1,989,622 |
NovaMed, Inc. (a) | | 536,739 | | 2,023,506 |
Owens & Minor, Inc. | | 132,611 | | 6,058,997 |
Pediatrix Medical Group, Inc. (a) | | 85,314 | | 4,200,008 |
RehabCare Group, Inc. (a) | | 173,137 | | 2,775,386 |
Res-Care, Inc. (a) | | 254,208 | | 4,519,818 |
U.S. Physical Therapy, Inc. (a) | | 146,185 | | 2,398,896 |
| | | | |
Health Care Providers & Services Total | | | | 48,315,505 |
| |
Life Sciences Tools & Services – 1.5% | | |
Bio-Rad Laboratories, Inc., Class A (a) | | 63,820 | | 5,162,400 |
PAREXEL International Corp. (a) | | 165,790 | | 4,361,935 |
Varian, Inc. (a) | | 56,760 | | 2,898,165 |
| | | | |
Life Sciences Tools & Services Total | | | | 12,422,500 |
| | |
Pharmaceuticals – 0.7% | | | | |
Alpharma, Inc., Class A (a) | | 176,910 | | 3,985,782 |
Sciele Pharma, Inc. (a) | | 122,520 | | 2,370,762 |
| | | | |
Pharmaceuticals Total | | | | 6,356,544 |
| | | | |
Health Care Total | | | | 86,109,646 |
| | | | |
| | | | |
| | | Shares | | Value ($) |
| Industrials – 13.2% | | | | |
Aerospace & Defense – 0.9% | | | | |
AAR Corp. (a) | | 126,044 | | 1,705,375 |
Esterline Technologies Corp. (a) | | 52,870 | | 2,604,376 |
Moog, Inc., Class A (a) | | 81,720 | | 3,043,253 |
| | | | |
Aerospace & Defense Total | | | | 7,353,004 |
| | |
Airlines – 0.5% | | | | |
AirTran Holdings, Inc. (a) | | 262,750 | | 536,010 |
JetBlue Airways Corp. (a) | | 351,135 | | 1,309,733 |
Skywest, Inc. | | 160,260 | | 2,027,289 |
| | | | |
Airlines Total | | | | 3,873,032 |
| | |
Building Products – 1.6% | | | | |
Builders FirstSource, Inc. (a) | | 170,316 | | 904,378 |
Lennox International, Inc. | | 110,840 | | 3,209,926 |
NCI Building Systems, Inc. (a) | | 148,080 | | 5,438,979 |
Trex Co., Inc. (a) | | 157,487 | | 1,847,323 |
Universal Forest Products, Inc. | | 74,240 | | 2,224,230 |
| | | | |
Building Products Total | | | | 13,624,836 |
| |
Commercial Services & Supplies – 3.5% | | |
ABM Industries, Inc. | | 129,150 | | 2,873,588 |
Casella Waste Systems, Inc., Class A (a) | | 248,268 | | 3,026,387 |
CBIZ, Inc. (a) | | 335,301 | | 2,665,643 |
CDI Corp. | | 98,457 | | 2,504,746 |
Consolidated Graphics, Inc. (a) | | 126,070 | | 6,211,469 |
Healthcare Services Group, Inc. | | 206,342 | | 3,138,462 |
Kimball International, Inc.,
Class B | | 210,310 | | 1,741,367 |
Korn/Ferry International (a) | | 200,440 | | 3,152,921 |
TeleTech Holdings, Inc. (a) | | 99,320 | | 1,982,427 |
United Stationers, Inc. (a) | | 79,430 | | 2,934,938 |
| | | | |
Commercial Services & Supplies Total | | 30,231,948 |
| |
Construction & Engineering – 1.4% | | |
EMCOR Group, Inc. (a) | | 221,300 | | 6,313,689 |
KHD Humboldt Wedag International Ltd. (a) | | 188,852 | | 5,954,504 |
| | | | |
Construction & Engineering Total | | 12,268,193 |
| |
Electrical Equipment – 0.8% | | |
Belden CDT, Inc. | | 109,150 | | 3,698,002 |
Woodward Governor Co. | | 80,150 | | 2,858,149 |
| | | | |
Electrical Equipment Total | | 6,556,151 |
| |
Machinery – 1.4% | | |
EnPro Industries, Inc. (a) | | 172,962 | | 6,458,401 |
Harsco Corp. | | 77,716 | | 4,228,528 |
Kadant, Inc. (a) | | 78,449 | | 1,772,947 |
| | | | |
Machinery Total | | 12,459,876 |
See Accompanying Notes to Financial Statements.
10
Columbia Small Cap Value Fund I
June 30, 2008
Common Stocks (continued)
| | | | |
| | | Shares | | Value ($) |
| Industrials (continued) | | | | |
Road & Rail – 2.1% | | |
Amerco, Inc. (a) | | 56,250 | | 2,682,000 |
Genesee & Wyoming, Inc., Class A (a) | | 102,460 | | 3,485,689 |
Heartland Express, Inc. | | 195,275 | | 2,911,550 |
Ryder System, Inc. | | 36,730 | | 2,529,963 |
Werner Enterprises, Inc. | | 354,650 | | 6,589,397 |
| | | | |
Road & Rail Total | | 18,198,599 |
| |
Trading Companies & Distributors – 1.0% | | |
Kaman Corp. | | 147,141 | | 3,348,929 |
Watsco, Inc. | | 134,030 | | 5,602,454 |
| | | | |
Trading Companies & Distributors Total | | 8,951,383 |
| | | | |
Industrials Total | | | | 113,517,022 |
| | | | |
| Information Technology – 14.2% |
Communications Equipment – 1.9% | | |
Anaren, Inc. (a) | | 270,850 | | 2,862,884 |
Bel Fuse, Inc., Class B | | 67,000 | | 1,655,570 |
Black Box Corp. | | 100,577 | | 2,734,689 |
Comtech Telecommunications Corp. (a) | | 57,650 | | 2,824,850 |
Dycom Industries, Inc. (a) | | 230,420 | | 3,345,698 |
Polycom, Inc. (a) | | 109,500 | | 2,667,420 |
Tollgrade Communications, Inc. (a) | | 177,593 | | 797,393 |
| | | | |
Communications Equipment Total | | | | 16,888,504 |
| | |
Computers & Peripherals – 1.3% | | | | |
Brocade Communications Systems, Inc. (a) | | 338,000 | | 2,785,120 |
Electronics for Imaging, Inc. (a) | | 204,550 | | 2,986,430 |
Emulex Corp. (a) | | 194,460 | | 2,265,459 |
QLogic Corp. (a) | | 213,120 | | 3,109,421 |
| | | | |
Computers & Peripherals Total | | | | 11,146,430 |
|
Electronic Equipment & Instruments – 3.8% |
Anixter International, Inc. (a) | | 104,300 | | 6,204,807 |
Benchmark Electronics, Inc. (a) | | 211,050 | | 3,448,557 |
Brightpoint, Inc. (a) | | 377,764 | | 2,757,677 |
CPI International, Inc. (a) | | 210,060 | | 2,583,738 |
GSI Group Inc/Canada (a) | | 283,710 | | 2,201,589 |
MTS Systems Corp. | | 106,374 | | 3,816,699 |
NAM TAI Electronics, Inc. | | 430,373 | | 5,629,279 |
Plexus Corp. (a) | | 97,910 | | 2,710,149 |
Vishay Intertechnology, Inc. (a) | | 376,318 | | 3,337,941 |
| | | | |
Electronic Equipment & Instruments Total | | 32,690,436 |
| | | | |
| | | Shares | | Value ($) |
| | |
IT Services – 1.6% | | | | |
CACI International, Inc.,
Class A (a) | | 80,630 | | 3,690,435 |
CSG Systems International, Inc. (a) | | 96,828 | | 1,067,044 |
MAXIMUS, Inc. | | 75,590 | | 2,632,044 |
MPS Group, Inc. (a) | | 615,946 | | 6,547,506 |
| | | | |
IT Services Total | | | | 13,937,029 |
|
Semiconductors & Semiconductor Equipment – 2.7% |
Actel Corp. (a) | | 237,007 | | 3,993,568 |
Advanced Energy Industries,
Inc. (a) | | 127,790 | | 1,750,723 |
ATMI, Inc. (a) | | 57,360 | | 1,601,491 |
Cabot Microelectronics Corp. (a) | | 50,590 | | 1,677,059 |
Exar Corp. (a) | | 213,300 | | 1,608,282 |
Fairchild Semiconductor International, Inc. (a) | | 165,450 | | 1,940,729 |
Kulicke & Soffa Industries,
Inc. (a) | | 111,801 | | 815,029 |
Mattson Technology, Inc. (a) | | 457,930 | | 2,179,747 |
MKS Instruments, Inc. (a) | | 129,321 | | 2,832,130 |
RF Micro Devices, Inc. (a) | | 420,170 | | 1,218,493 |
Ultra Clean Holdings (a) | | 206,550 | | 1,644,138 |
Varian Semiconductor Equipment Associates, Inc. (a) | | 49,442 | | 1,721,570 |
| | | | |
Semiconductors & Semiconductor Equipment Total | | | | 22,982,959 |
| | |
Software – 2.9% | | | | |
ACI Worldwide, Inc. (a) | | 148,300 | | 2,608,597 |
Captaris, Inc. (a) | | 428,913 | | 1,737,098 |
InterVoice, Inc. (a) | | 217,250 | | 1,238,325 |
Lawson Software, Inc. (a) | | 176,690 | | 1,284,536 |
Mentor Graphics Corp. (a) | | 241,945 | | 3,822,731 |
MSC.Software Corp. (a) | | 339,420 | | 3,726,832 |
Progress Software Corp. (a) | | 102,800 | | 2,628,596 |
SPSS, Inc. (a) | | 68,700 | | 2,498,619 |
Sybase, Inc. (a) | | 179,850 | | 5,291,187 |
| | | | |
Software Total | | | | 24,836,521 |
| | | | |
Information Technology Total | | | | 122,481,879 |
|
| Materials – 6.1% | | | | |
Chemicals – 1.9% | | | | |
H.B. Fuller Co. | | 296,100 | | 6,644,484 |
Minerals Technologies, Inc. | | 69,840 | | 4,441,126 |
Sensient Technologies Corp. | | 190,770 | | 5,372,083 |
| | | | |
Chemicals Total | | | | 16,457,693 |
See Accompanying Notes to Financial Statements.
11
Columbia Small Cap Value Fund I
June 30, 2008
Common Stocks (continued)
| | | | |
| | | Shares | | Value ($) |
| Materials (continued) | | | | |
Construction Materials – 0.4% | | | | |
Eagle Materials, Inc. | | 139,580 | | 3,535,561 |
| | | | |
Construction Materials Total | | | | 3,535,561 |
| | |
Containers & Packaging – 2.1% | | | | |
AptarGroup, Inc. | | 104,030 | | 4,364,059 |
Greif, Inc., Class A | | 72,174 | | 4,621,301 |
Greif, Inc., Class B | | 121,387 | | 6,891,140 |
Packaging Corp. of America | | 110,761 | | 2,382,469 |
| | | | |
Containers & Packaging Total | | | | 18,258,969 |
| | |
Metals & Mining – 1.3% | | | | |
Carpenter Technology Corp. | | 56,360 | | 2,460,114 |
Haynes International, Inc. (a) | | 58,240 | | 3,351,712 |
Worthington Industries, Inc. | | 252,170 | | 5,169,485 |
| | | | |
Metals & Mining Total | | | | 10,981,311 |
| | |
Paper & Forest Products – 0.4% | | | | |
Mercer International, Inc. (a) | | 379,779 | | 2,840,747 |
| | | | |
Paper & Forest Products Total | | | | 2,840,747 |
| | | | |
Materials Total | | | | 52,074,281 |
|
| Telecommunication Services – 0.6% |
| Diversified Telecommunication Services – 0.3% |
Warwick Valley Telephone Co. | | 194,460 | | 2,053,497 |
| | | | |
Diversified Telecommunication Services Total | | 2,053,497 |
|
Wireless Telecommunication Services – 0.3% |
Syniverse Holdings, Inc. (a) | | 176,060 | | 2,852,172 |
| | | | |
Wireless Telecommunication Services Total | | 2,852,172 |
| | | | |
Telecommunication Services Total | | 4,905,669 |
|
| Utilities – 7.1% | | | | |
Electric Utilities – 4.0% | | | | |
ALLETE, Inc. | | 128,530 | | 5,398,260 |
El Paso Electric Co. (a) | | 254,149 | | 5,032,150 |
Hawaiian Electric Industries, Inc. | | 174,090 | | 4,305,246 |
Maine & Maritimes Corp. (a) | | 41,589 | | 1,763,374 |
MGE Energy, Inc. | | 136,253 | | 4,444,573 |
Otter Tail Corp. | | 107,859 | | 4,188,165 |
Portland General Electric Co. | | 212,162 | | 4,777,888 |
UIL Holdings Corp. | | 148,116 | | 4,356,091 |
| | | | |
Electric Utilities Total | | | | 34,265,747 |
| | |
Gas Utilities – 0.5% | | | | |
WGL Holdings, Inc. | | 117,000 | | 4,064,580 |
| | | | |
Gas Utilities Total | | | | 4,064,580 |
| | | | |
| | | Shares | | Value ($) |
|
Independent Power Producers & Energy Traders – 0.5% |
Black Hills Corp. | | 137,550 | | 4,409,853 |
| | | | |
Independent Power Producers & Energy Traders Total | | 4,409,853 |
| | |
Multi-Utilities – 2.1% | | | | |
Avista Corp. | | 268,240 | | 5,756,431 |
CH Energy Group, Inc. | | 226,525 | | 8,057,494 |
NorthWestern Corp. | | 170,750 | | 4,340,465 |
| | | | |
Multi-Utilities Total | | | | 18,154,390 |
| | | | |
Utilities Total | | | | 60,894,570 |
| | | | |
Total Common Stocks
(cost of $823,283,945) | | | | 857,558,650 |
| | | | |
| | | Par ($) |
| Short-Term Obligation – 0.4% |
Repurchase agreement with Fixed Income Clearing Corp., dated 06/30/08, due 07/01/08 at 1.600%, collateralized by a U.S. Treasury Obligation maturing 02/15/10, market value $3,273,275 (repurchase proceeds $3,207,143) | | 3,207,000 | | 3,207,000 |
| | | | |
Total Short-Term Obligation (cost of $3,207,000) | | | | 3,207,000 |
| | | | |
Total Investments – 100.0% (cost of $826,490,945) (b) | | | | 860,765,650 |
| | | | |
Other Assets & Liabilities, Net – 0.0% | | 373,392 |
| | | | |
Net Assets – 100.0% | | | | 861,139,042 |
Notes to Investment Portfolio:
| (a) | Non-income producing security. |
| (b) | Cost for federal income tax purposes is $828,724,502. |
At June 30, 2008, the Fund held investments in the following sectors:
| | | |
Sector (Unaudited) | | % of Net Assets | |
Financials | | 28.1 | |
Information Technology | | 14.2 | |
Industrials | | 13.2 | |
Health Care | | 10.0 | |
Energy | | 8.2 | |
Consumer Discretionary | | 7.6 | |
Utilities | | 7.1 | |
Materials | | 6.1 | |
Consumer Staples | | 4.5 | |
Telecommunication Services | | 0.6 | |
| | | |
| | 99.6 | |
Short-Term Obligation | | 0.4 | |
Other Assets & Liabilities, Net | | 0.0 | * |
| | | |
| | 100.0 | |
| | | |
* Represents less than 0.1%.
See Accompanying Notes to Financial Statements.
12
Statement of Assets and Liabilities– Columbia Small Cap Value Fund I
June 30, 2008
| | | | | |
| | | | | ($) | |
| Assets | | Investments, at cost | | 826,490,945 | |
| | | | | |
| | Investments, at value | | 860,765,650 | |
| | Cash | | 15,251 | |
| | Receivable for: | | | |
| | Investments sold | | 2,853,925 | |
| | Fund shares sold | | 1,942,324 | |
| | Interest | | 143 | |
| | Dividends | | 1,157,266 | |
| | Trustees’ deferred compensation plan | | 59,089 | |
| | Other assets | | 12,765 | |
| | | | | |
| | Total Assets | | 866,806,413 | |
| | |
| Liabilities | | Payable for: | | | |
| | Investments purchased | | 2,904,117 | |
| | Fund shares repurchased | | 1,450,544 | |
| | Investment advisory fee | | 580,959 | |
| | Transfer agent fee | | 347,712 | |
| | Pricing and bookkeeping fees | | 11,928 | |
| | Trustees' fees | | 5,226 | |
| | Custody fee | | 15,119 | |
| | Distribution and service fees | | 212,890 | |
| | Chief compliance officer expenses | | 205 | |
| | Trustees’ deferred compensation plan | | 59,089 | |
| | Other liabilities | | 79,582 | |
| | | | | |
| | Total Liabilities | | 5,667,371 | |
| | |
| | | | | |
| | Net Assets | | 861,139,042 | |
| | |
| Net Assets Consist of | | Paid-in capital | | 790,810,958 | |
| | Undistributed net investment income | | 306,919 | |
| | Accumulated net realized gain | | 35,746,512 | |
| | Net unrealized appreciation (depreciation) on: | | | |
| | Investments | | 34,274,705 | |
| | Foreign currency translations | | (52 | ) |
| | | | | |
| | Net Assets | | 861,139,042 | |
See Accompanying Notes to Financial Statements.
13
Statement of Assets and Liabilities (continued) – Columbia Small Cap Value Fund I
June 30, 2008
| | | | | | |
| | | | | | |
| | |
| Class A | | Net assets | | $ | 513,670,704 | |
| | Shares outstanding | | | 13,003,621 | |
| | Net asset value per share | | $ | 39.50 | (a) |
| | Maximum sales charge | | | 5.75 | % |
| | Maximum offering price per share ($39.50/0.9425) | | $ | 41.91 | (b) |
| | |
| Class B | | Net assets | | $ | 50,783,648 | |
| | Shares outstanding | | | 1,538,844 | |
| | Net asset value and offering price per share | | $ | 33.00 | (a) |
| | |
| Class C | | Net assets | | $ | 61,053,003 | |
| | Shares outstanding | | | 1,756,207 | |
| | Net asset value and offering price per share | | $ | 34.76 | (a) |
| | |
| Class Z | | Net assets | | $ | 235,631,687 | |
| | Shares outstanding | | | 5,716,843 | |
| | Net asset value, offering and redemption price per share | | $ | 41.22 | |
| (a) | Redemption price per share is equal to net asset value less any applicable contingent deferred sales charge. |
| (b) | On sales of $50,000 or more the offering price is reduced. |
See Accompanying Notes to Financial Statements.
14
Statement of Operations – Columbia Small Cap Value Fund I
For the Year Ended June 30, 2008
| | | | | |
| | | | | ($) | |
| Investment Income | | Dividends | | 14,139,996 | |
| | Interest | | 86,844 | |
| | Securities lending income | | 398,650 | |
| | | | | |
| | Total Investment Income | | 14,625,490 | |
| | |
| Expenses | | Investment advisory fee | | 7,336,126 | |
| | Distribution fee: | | | |
| | Class B | | 539,046 | |
| | Class C | | 556,897 | |
| | Service fee: | | | |
| | Class A | | 1,435,227 | |
| | Class B | | 179,682 | |
| | Class C | | 185,632 | |
| | Transfer agent fee | | 1,519,981 | |
| | Pricing and bookkeeping fees | | 150,605 | |
| | Trustees’ fees | | 64,500 | |
| | Custody fee | | 82,049 | |
| | Chief compliance officer expenses | | 993 | |
| | Other expenses | | 365,651 | |
| | | | | |
| | Expenses before interest expense | | 12,416,389 | |
| | Interest expense | | 16,477 | |
| | | | | |
| | Total Expenses | | 12,432,866 | |
| | Expense reductions | | (19,152 | ) |
| | | | | |
| | Net Expenses | | 12,413,714 | |
| | |
| | | | | |
| | Net Investment Income | | 2,211,776 | |
| | |
| Net Realized and Unrealized Gain (Loss) on Investments and Foreign Currency | | Net realized gain on investments | | 55,032,503 | |
| | Net change in unrealized depreciation on: | | | |
| | Investments | | (234,008,538 | ) |
| | Foreign currency translations | | (52 | ) |
| | | | | |
| | Net change in unrealized depreciation | | (234,008,590 | ) |
| | | | | |
| | Net Loss | | (178,976,087 | ) |
| | |
| | | | | |
| | Net Decrease Resulting from Operations | | (176,764,311 | ) |
See Accompanying Notes to Financial Statements.
15
Statement of Changes in Net Assets – Columbia Small Cap Value Fund I
| | | | | | | | |
| | | | | Year Ended June 30, | |
| Increase (Decrease) in Net Assets | | 2008 ($) | | | 2007 ($) | |
| Operations | | Net investment income | | 2,211,776 | | | 1,105,686 | |
| | Net realized gain on investments | | 55,032,503 | | | 117,606,211 | |
| | Net change in unrealized appreciation (depreciation) on investments and foreign currency translations | | (234,008,590 | ) | | 19,751,116 | |
| | | | | | | | |
| | Net Increase (Decrease) Resulting from Operations | | (176,764,311 | ) | | 138,463,013 | |
| | | |
| Distributions to Shareholders | | From net investment income: | | | | | | |
| | Class A | | (1,590,109 | ) | | (173,757 | ) |
| | Class Z | | (1,242,987 | ) | | (321,285 | ) |
| | From net realized gains: | | | | | | |
| | Class A | | (50,668,302 | ) | | (40,153,772 | ) |
| | Class B | | (7,829,642 | ) | | (9,209,625 | ) |
| | Class C | | (7,569,234 | ) | | (5,770,874 | ) |
| | Class Z | | (20,406,711 | ) | | (8,623,480 | ) |
| | | | | | | | |
| | Total Distributions to Shareholders | | (89,306,985 | ) | | (64,252,793 | ) |
| | | |
| | Net Capital Share Transactions | | 101,825,529 | | | 127,213,555 | |
| | | | | | | | |
| | Total Increase (Decrease) in Net Assets | | (164,245,767 | ) | | 201,423,775 | |
| | | |
| Net Assets | | Beginning of period | | 1,025,384,809 | | | 823,961,034 | |
| | End of period | | 861,139,042 | | | 1,025,384,809 | |
| | Undistributed net investment income, at end of period | | 306,919 | | | 531,899 | |
See Accompanying Notes to Financial Statements.
16
Statement of Changes in Net Assets – Capital Stock Activity
| | | | | | | | | | | | |
| | | Columbia Small Cap Value Fund I | |
| | | Year Ended
June 30, 2008 | | | Year Ended
June 30, 2007 | |
| | | Shares | | | Dollars ($) | | | Shares | | | Dollars ($) | |
Changes in Shares | | | | | | | | | | | | |
Class A | | | | | | | | | | | | |
Subscriptions | | 3,614,777 | | | 161,334,656 | | | 4,123,736 | | | 205,052,117 | |
Distributions reinvested | | 1,043,838 | | | 46,962,310 | | | 749,682 | | | 36,637,045 | |
Redemptions | | (4,368,142 | ) | | (198,705,832 | ) | | (2,695,057 | ) | | (134,142,032 | ) |
| | | | | | | | | | | | |
Net Increase | | 290,473 | | | 9,591,134 | | | 2,178,361 | | | 107,547,130 | |
| | | | |
Class B | | | | | | | | | | | | |
Subscriptions | | 67,445 | | | 2,588,620 | | | 169,087 | | | 7,230,412 | |
Distributions reinvested | | 191,638 | | | 7,232,413 | | | 202,991 | | | 8,501,258 | |
Redemptions | | (908,991 | ) | | (34,087,764 | ) | | (1,433,825 | ) | | (61,015,618 | ) |
| | | | | | | | | | | | |
Net Decrease | | (649,908 | ) | | (24,266,731 | ) | | (1,061,747 | ) | | (45,283,948 | ) |
| | | | |
Class C | | | | | | | | | | | | |
Subscriptions | | 316,737 | | | 12,871,921 | | | 524,648 | | | 23,447,465 | |
Distributions reinvested | | 142,870 | | | 5,680,491 | | | 100,579 | | | 4,413,377 | |
Redemptions | | (582,164 | ) | | (23,008,126 | ) | | (316,134 | ) | | (14,109,929 | ) |
| | | | | | | | | | | | |
Net Increase (Decrease) | | (122,557 | ) | | (4,455,714 | ) | | 309,093 | | | 13,750,913 | |
| | | | |
Class Z | | | | | | | | | | | | |
Subscriptions | | 3,680,443 | | | 179,006,809 | | | 1,412,679 | | | 73,680,096 | |
Distributions reinvested | | 312,515 | | | 14,650,724 | | | 64,574 | | | 3,276,470 | |
Redemptions | | (1,542,658 | ) | | (72,700,693 | ) | | (496,817 | ) | | (25,757,106 | ) |
| | | | | | | | | | | | |
Net Increase | | 2,450,300 | | | 120,956,840 | | | 980,436 | | | 51,199,460 | |
See Accompanying Notes to Financial Statements.
17
Financial Highlights – Columbia Small Cap Value Fund I
Selected data for a share outstanding throughout each period is as follows:
| | | | | | | | | | | | | | | | | | | | |
| | |
| | | Year Ended June 30, | |
| Class A Shares | | 2008 | | | 2007 | | | 2006 | | | 2005 | | | 2004 | |
Net Asset Value, Beginning of Period | | $ | 52.16 | | | $ | 48.03 | | | $ | 43.12 | | | $ | 42.17 | | | $ | 31.39 | |
| | | | | |
Income from Investment Operations: | | | | | | | | | | | | | | | | | | | | |
Net investment income (a) | | | 0.15 | | | | 0.12 | (b) | | | 0.06 | | | | 0.11 | | | | 0.08 | |
Net realized and unrealized gain (loss) on investments and foreign currency translations | | | (8.46 | ) | | | 7.61 | | | | 6.82 | | | | 4.46 | | | | 11.88 | |
| | | | | | | | | | | | | | | | | | | | |
Total from Investment Operations | | | (8.31 | ) | | | 7.73 | | | | 6.88 | | | | 4.57 | | | | 11.96 | |
| | | | | |
Less Distributions to Shareholders: | | | | | | | | | | | | | | | | | | | | |
From net investment income | | | (0.14 | ) | | | (0.01 | ) | | | — | | | | — | | | | — | |
From net realized gains | | | (4.21 | ) | | | (3.59 | ) | | | (1.97 | ) | | | (3.62 | ) | | | (1.18 | ) |
| | | | | | | | | | | | | | | | | | | | |
Total Distributions to Shareholders | | | (4.35 | ) | | | (3.60 | ) | | | (1.97 | ) | | | (3.62 | ) | | | (1.18 | ) |
| | | | | |
Net Asset Value, End of Period | | $ | 39.50 | | | $ | 52.16 | | | $ | 48.03 | | | $ | 43.12 | | | $ | 42.17 | |
Total return (c) | | | (16.96 | )% | | | 16.61 | % | | | 16.25 | % (d)(e) | | | 10.99 | % | | | 38.58 | %(e) |
| | | | | |
Ratios to Average Net Assets/Supplemental Data: | | | | | | | | | | | | | | | | | | | | |
Net expenses before interest expense (f) | | | 1.26 | % | | | 1.29 | % | | | 1.28 | % | | | 1.32 | % | | | 1.42 | % |
Interest expense | | | — | %(g) | | | — | %(g) | | | — | %(g) | | | — | | | | — | |
Net expenses (f) | | | 1.26 | % | | | 1.29 | % | | | 1.28 | % | | | 1.32 | % | | | 1.42 | % |
Waiver/Reimbursement | | | — | | | | — | | | | 0.01 | % | | | — | | | | 0.01 | % |
Net investment income (f) | | | 0.29 | % | | | 0.25 | % | | | 0.13 | % | | | 0.28 | % | | | 0.22 | % |
Portfolio turnover rate | | | 40 | % | | | 39 | % | | | 32 | % | | | 31 | % | | | 46 | % |
Net assets, end of period (000’s) | | $ | 513,671 | | | $ | 663,160 | | | $ | 505,971 | | | $ | 396,568 | | | $ | 292,365 | |
| (a) | Per share data was calculated using the average shares outstanding during the period. |
| (b) | Net investment income per share reflects special dividends. The effect of these dividends amounted to $0.05 per share. |
| (c) | Total return at net asset value assuming all distributions reinvested and no initial sales charge or contingent deferred sales charge. |
| (d) | Total return includes a voluntary reimbursement by the investment advisor for a realized investment loss due to a trading error. This reimbursement increased total return and net asset value per share by less than 0.01% and less than $0.01, respectively. |
| (e) | Had the investment advisor and/or any of its affiliates not waived fees or reimbursed a portion of expenses, total return would have been reduced. |
| (f) | The benefits derived from expense reductions had an impact of less than 0.01%. |
| (g) | Rounds to less than 0.01%. |
See Accompanying Notes to Financial Statements.
18
Financial Highlights – Columbia Small Cap Value Fund I
Selected data for a share outstanding throughout each period is as follows:
| | | | | | | | | | | | | | | | | | | | |
| | | Year Ended June 30, | |
| Class B Shares | | 2008 | | | 2007 | | | 2006 | | | 2005 | | | 2004 | |
Net Asset Value, Beginning of Period | | $ | 44.51 | | | $ | 41.75 | | | $ | 38.00 | | | $ | 37.60 | | | $ | 28.18 | |
| | | | | |
Income from Investment Operations: | | | | | | | | | | | | | | | | | | | | |
Net investment loss (a) | | | (0.21 | ) | | | (0.24 | )(b) | | | (0.26 | ) | | | (0.18 | ) | | | (0.18 | ) |
Net realized and unrealized gain (loss) on investments and foreign currency translations | | | (7.09 | ) | | | 6.59 | | | | 5.98 | | | | 3.96 | | | | 10.64 | |
| | | | | | | | | | | | | | | | | | | | |
Total from Investment Operations | | | (7.30 | ) | | | 6.35 | | | | 5.72 | | | | 3.78 | | | | 10.46 | |
| | | | | |
Less Distributions to Shareholders: | | | | | | | | | | | | | | | | | | | | |
From net realized gains | | | (4.21 | ) | | | (3.59 | ) | | | (1.97 | ) | | | (3.38 | ) | | | (1.04 | ) |
| | | | | |
Net Asset Value, End of Period | | $ | 33.00 | | | $ | 44.51 | | | $ | 41.75 | | | $ | 38.00 | | | $ | 37.60 | |
Total return (c) | | | (17.58 | )% | | | 15.74 | % | | | 15.36 | %(d)(e) | | | 10.18 | % | | | 37.58 | %(e) |
| | | | | |
Ratios to Average Net Assets/Supplemental Data: | | | | | | | | | | | | | | | | | | | | |
Net expenses before interest expense (f) | | | 2.01 | % | | | 2.04 | % | | | 2.03 | % | | | 2.07 | % | | | 2.17 | % |
Interest expense | | | — | %(g) | | | — | %(g) | | | — | %(g) | | | — | | | | — | |
Net expenses (f) | | | 2.01 | % | | | 2.04 | % | | | 2.03 | % | | | 2.07 | % | | | 2.17 | % |
Waiver/Reimbursement | | | — | | | | — | | | | 0.01 | % | | | — | | | | 0.01 | % |
Net investment loss (f) | | | (0.47 | )% | | | (0.55 | )% | | | (0.64 | )% | | | (0.47 | )% | | | (0.53 | )% |
Portfolio turnover rate | | | 40 | % | | | 39 | % | | | 32 | % | | | 31 | % | | | 46 | % |
Net assets, end of period (000’s) | | $ | 50,784 | | | $ | 97,425 | | | $ | 135,721 | | | $ | 182,648 | | | $ | 213,159 | |
| (a) | Per share data was calculated using the average shares outstanding during the period. |
| (b) | Net investment income per share reflects special dividends. The effect of these dividends amounted to $0.05 per share. |
| (c) | Total return at net asset value assuming all distributions reinvested and no contingent deferred sales charge. |
| (d) | Total return includes a voluntary reimbursement by the investment advisor for a realized investment loss due to a trading error. This reimbursement increased total return and net asset value per share by less than 0.01% and less than $0.01, respectively. |
| (e) | Had the investment advisor and/or any of its affiliates not waived fees or reimbursed a portion of expenses, total return would have been reduced. |
| (f) | The benefits derived from expense reductions had an impact of less than 0.01%. |
| (g) | Rounds to less than 0.01%. |
See Accompanying Notes to Financial Statements.
19
Financial Highlights – Columbia Small Cap Value Fund I
Selected data for a share outstanding throughout each period is as follows:
| | | | | | | | | | | | | | | | | | | | |
| | | Year Ended June 30, | |
| Class C Shares | | 2008 | | | 2007 | | | 2006 | | | 2005 | | | 2004 | |
Net Asset Value, Beginning of Period | | $ | 46.65 | | | $ | 43.60 | | | $ | 39.60 | | | $ | 39.05 | | | $ | 29.24 | |
| | | | | |
Income from Investment Operations: | | | | | | | | | | | | | | | | | | | | |
Net investment loss (a) | | | (0.22 | ) | | | (0.23 | )(b) | | | (0.26 | ) | | | (0.18 | ) | | | (0.19 | ) |
Net realized and unrealized gain (loss) on investments and foreign currency translations | | | (7.46 | ) | | | 6.87 | | | | 6.23 | | | | 4.11 | | | | 11.04 | |
| | | | | | | | | | | | | | | | | | | | |
Total from Investment Operations | | | (7.68 | ) | | | 6.64 | | | | 5.97 | | | | 3.93 | | | | 10.85 | |
| | | | | |
Less Distributions to Shareholders: | | | | | | | | | | | | | | | | | | | | |
From net realized gains | | | (4.21 | ) | | | (3.59 | ) | | | (1.97 | ) | | | (3.38 | ) | | | (1.04 | ) |
| | | | | |
Net Asset Value, End of Period | | $ | 34.76 | | | $ | 46.65 | | | $ | 43.60 | | | $ | 39.60 | | | $ | 39.05 | |
Total return (c) | | | (17.59 | )% | | | 15.74 | % | | | 15.37 | %(d)(e) | | | 10.19 | % | | | 37.56 | %(e) |
| | | | | |
Ratios to Average Net Assets/Supplemental Data: | | | | | | | | | | | | | | | | | | | | |
Net expenses before interest expense (f) | | | 2.01 | % | | | 2.04 | % | | | 2.03 | % | | | 2.07 | % | | | 2.17 | % |
Interest expense | | | — | %(g) | | | — | %(g) | | | — | %(g) | | | — | | | | — | |
Net expenses (f) | | | 2.01 | % | | | 2.04 | % | | | 2.03 | % | | | 2.07 | % | | | 2.17 | % |
Waiver/Reimbursement | | | — | | | | — | | | | 0.01 | % | | | — | | | | 0.01 | % |
Net investment loss (f) | | | (0.47 | )% | | | (0.51 | )% | | | (0.62 | )% | | | (0.47 | )% | | | (0.53 | )% |
Portfolio turnover rate | | | 40 | % | | | 39 | % | | | 32 | % | | | 31 | % | | | 46 | % |
Net assets, end of period (000’s) | | $ | 61,053 | | | $ | 87,642 | | | $ | 68,436 | | | $ | 57,471 | | | $ | 38,798 | |
| (a) | Per share data was calculated using the average shares outstanding during the period. |
| (b) | Net investment income per share reflects special dividends. The effect of these dividends amounted to $0.05 per share. |
| (c) | Total return at net asset value assuming all distributions reinvested and no contingent deferred sales charge. |
| (d) | Total return includes a voluntary reimbursement by the investment advisor for a realized investment loss due to a trading error. This reimbursement increased total return and net asset value per share by less than 0.01% and less than $0.01, respectively. |
| (e) | Had the investment advisor and/or any of its affiliates not waived fees or reimbursed a portion of expenses, total return would have been reduced. |
| (f) | The benefits derived from expense reductions had an impact of less than 0.01%. |
| (g) | Rounds to less than 0.01%. |
See Accompanying Notes to Financial Statements.
20
Financial Highlights – Columbia Small Cap Value Fund I
Selected data for a share outstanding throughout each period is as follows:
| | | | | | | | | | | | | | | | | | | | |
| | | Year Ended June 30, | |
| Class Z Shares | | 2008 | | | 2007 | | | 2006 | | | 2005 | | | 2004 | |
Net Asset Value, Beginning of Period | | $ | 54.23 | | | $ | 49.79 | | | $ | 44.54 | | | $ | 43.41 | | | $ | 32.24 | |
| | | | | |
Income from Investment Operations: | | | | | | | | | | | | | | | | | | | | |
Net investment income (a) | | | 0.30 | | | | 0.26 | (b) | | | 0.18 | | | | 0.23 | | | | 0.21 | |
Net realized and unrealized gain (loss) on investments and foreign currency translations | | | (8.84 | ) | | | 7.90 | | | | 7.05 | | | | 4.62 | | | | 12.19 | |
| | | | | | | | | | | | | | | | | | | | |
Total from Investment Operations | | | (8.54 | ) | | | 8.16 | | | | 7.23 | | | | 4.85 | | | | 12.40 | |
| | | | | |
Less Distributions to Shareholders: | | | | | | | | | | | | | | | | | | | | |
From net investment income | | | (0.26 | ) | | | (0.13 | ) | | | (0.01 | ) | | | — | | | | — | |
From net realized gains | | | (4.21 | ) | | | (3.59 | ) | | | (1.97 | ) | | | (3.72 | ) | | | (1.23 | ) |
| | | | | | | | | | | | | | | | | | | | |
Total Distributions to Shareholders | | | (4.47 | ) | | | (3.72 | ) | | | (1.98 | ) | | | (3.72 | ) | | | (1.23 | ) |
| | | | | |
Net Asset Value, End of Period | | $ | 41.22 | | | $ | 54.23 | | | $ | 49.79 | | | $ | 44.54 | | | $ | 43.41 | |
Total return (c) | | | (16.74 | )% | | | 16.91 | % | | | 16.51 | %(d)(e) | | | 11.34 | % | | | 38.94 | %(e) |
| | | | | |
Ratios to Average Net Assets/Supplemental Data: | | | | | | | | | | | | | | | | | | | | |
Net expenses before interest expense (f) | | | 1.01 | % | | | 1.04 | % | | | 1.03 | % | | | 1.07 | % | | | 1.17 | % |
Interest expense | | | — | %(g) | | | — | %(g) | | | — | %(g) | | | — | | | | — | |
Net expenses (f) | | | 1.01 | % | | | 1.04 | % | | | 1.03 | % | | | 1.07 | % | | | 1.17 | % |
Waiver/Reimbursement | | | — | | | | — | | | | 0.01 | % | | | — | | | | 0.01 | % |
Net investment income (f) | | | 0.55 | % | | | 0.51 | % | | | 0.37 | % | | | 0.53 | % | | | 0.52 | % |
Portfolio turnover rate | | | 40 | % | | | 39 | % | | | 32 | % | | | 31 | % | | | 46 | % |
Net assets, end of period (000’s) | | $ | 235,632 | | | $ | 177,158 | | | $ | 113,833 | | | $ | 83,508 | | | $ | 65,526 | |
| (a) | Per share data was calculated using the average shares outstanding during the period. |
| (b) | Net investment income per share reflects special dividends. The effect of these dividends amounted to $0.05 per share. |
| (c) | Total return at net asset value assuming all distributions reinvested. |
| (d) | Total return includes a voluntary reimbursement by the investment advisor for a realized investment loss due to a trading error. This reimbursement increased total return and net asset value per share by less than 0.01% and less than $0.01, respectively. |
| (e) | Had the investment advisor and/or any of its affiliates not waived fees or reimbursed a portion of expenses, total return would have been reduced. |
| (f) | The benefits derived from expense reductions had an impact of less than 0.01%. |
| (g) | Rounds to less than 0.01%. |
See Accompanying Notes to Financial Statements.
21
Notes to Financial Statements – Columbia Small Cap Value Fund I
June 30, 2008
Note 1. Organization
Columbia Small Cap Value Fund I (the “Fund”), a series of Columbia Funds Series Trust I (the “Trust”), is a diversified portfolio. The Trust is a Massachusetts business trust registered under the Investment Company Act of 1940, as amended, as an open-end management investment company.
Investment Objective
The Fund seeks long-term capital appreciation.
Fund Shares
The Trust may issue an unlimited number of shares, and the Fund offers four classes of shares: Class A, Class B, Class C and Class Z. Each share class has its own expense structure and sales charges, as applicable.
Class A shares are subject to a maximum front-end sales charge of 5.75% based on the amount of initial investment. Class A shares purchased without an initial sales charge in accounts aggregating $1 million to $50 million at the time of purchase are subject to a 1.00% contingent deferred sales charge (“CDSC”) if the shares are sold within one year after purchase. Class B shares are subject to a maximum CDSC of 5.00% based upon the holding period after purchase. Class B shares will convert to Class A shares eight years after purchase. Class C shares are subject to a 1.00% CDSC on shares sold within one year after purchase. Class Z shares are offered continuously at net asset value. There are certain restrictions on the purchase of Class Z shares, as described in the Fund’s prospectus.
Note 2. Significant Accounting Policies
The preparation of financial statements in accordance with accounting principles generally accepted in the United States of America (“GAAP”) requires management to make certain estimates and assumptions that affect the reported amounts of assets and liabilities, the disclosure of contingent assets and liabilities at the date of the financial statements and the reported amounts of revenue and expenses during the reporting period. Actual results could differ from those estimates. The following is a summary of significant accounting policies consistently followed by the Fund in the preparation of its financial statements.
Security Valuation
Equity securities are valued at the last sale price on the principal exchange on which they trade, except for securities traded on the NASDAQ, which are valued at the NASDAQ official close price. Unlisted securities or listed securities for which there were no sales during the day are valued at the closing bid price on such exchanges or over-the-counter markets.
Short-term debt obligations maturing within 60 days are valued at amortized cost, which approximates market value.
Foreign securities are generally valued at the last sale price on the foreign exchange or market on which they trade. If any foreign share prices are not readily available as a result of limited share activity, the securities are valued at the last sale price of the local shares in the principal market in which such securities are normally traded.
Generally, trading in foreign securities is substantially completed each day at various times prior to the close of the New York Stock Exchange (“NYSE”). The values of such securities used in computing the net asset value of the Fund’s shares are determined as of such times. Foreign currency exchange rates are generally determined at 4:00 p.m. Eastern (U.S.) time. Occasionally, events affecting the values of such foreign securities and such exchange rates may occur between the times at which they are determined and the close of the customary trading session of the NYSE, which would not be reflected in the computation of the Fund’s net asset value. If events materially affecting the values of such foreign securities occur and it is determined that market quotations are not reliable, then these foreign securities will be valued at their fair value using procedures approved by the Board of Trustees.
Investments for which market quotations are not readily available, or that have quotations which management believes are not reliable, are valued at fair value as determined in good faith under consistently applied procedures established by and under the general supervision of the Board of Trustees. If a security is valued at fair value, such value is likely to be different from the last quoted market price for the security.
22
Columbia Small Cap Value Fund I
June 30, 2008
In September 2006, Statement of Financial Accounting Standards No. 157, Fair Value Measurements (“SFAS 157”), was issued. SFAS 157 is effective for fiscal years beginning after November 15, 2007. SFAS 157 defines fair value, establishes a framework for measuring fair value and expands disclosures about fair value measurements. Management is evaluating the impact the application of SFAS 157 will have on the Fund’s financial statement disclosures.
Security Transactions
Security transactions are accounted for on the trade date. Cost is determined and gains (losses) are based upon the specific identification method for both financial statement and federal income tax purposes.
In March 2008, Statement of Financial Accounting Standards No. 161 (“SFAS 161”), Disclosures about Derivative Instruments and Hedging Activities-an amendment of FASB Statement No. 133, was issued. SFAS 161 is effective for fiscal years beginning after November 15, 2008. SFAS 161 requires additional discussion about the reporting entity’s derivative instruments and hedging activities, by providing for qualitative disclosures about the objectives and strategies for using derivatives, quantitative data about the fair value of and gains and losses on derivative contracts, and details of credit-risk-related contingent features in their hedged positions. Management is evaluating the impact the application of SFAS 161 will have on the Fund’s financial statement disclosures.
Repurchase Agreements
The Fund may engage in repurchase agreement transactions with institutions that Columbia Management Advisors, LLC (“Columbia”), the Fund’s investment advisor, has determined are creditworthy. The Fund, through its custodian, receives delivery of the underlying securities collateralizing a repurchase agreement. Columbia is responsible for determining that the collateral is at least equal, at all times, to the value of the repurchase obligation including interest. A repurchase agreement transaction involves certain risks in the event of default or insolvency of the counterparty. These risks include possible delays in or restrictions on the Fund’s ability to dispose of the underlying securities and a possible decline in the value of the underlying securities during the period while the Fund seeks to assert its rights.
Income Recognition
Interest income is recorded on the accrual basis. Corporate actions and dividend income are recorded on the ex-date except for certain foreign securities which are recorded as soon after the ex-date as the Fund becomes aware of such, net of any non-reclaimable tax withholdings. Awards from class action litigation are recorded as a reduction of cost if the Fund still owns the applicable securities on the payment date. If the Fund no longer owns the applicable securities, the proceeds are recorded as realized gains.
Distributions received from real estate investment trusts (REITs) in excess of their income are recorded as a reduction of the cost of the related investments. If the Fund no longer owns the applicable securities, any distributions received in excess of income are recorded as realized gains.
Foreign Currency Transactions
The values of all assets and liabilities quoted in foreign currencies are translated into U.S. dollars at that day’s exchange rates. Net realized and unrealized gains (losses) on foreign currency transactions include gains (losses) arising from the fluctuation in exchange rates between trade and settlement dates on securities transactions, gains (losses) arising from the disposition of foreign currency and currency gains (losses) between the accrual and payment dates on dividends, interest income and foreign withholding taxes.
For financial statement purposes, the Fund does not distinguish that portion of gains (losses) on investments which is due to changes in foreign exchange rates from that which is due to changes in market prices of the investments. Such fluctuations are included with the net realized and unrealized gains (losses) on investments on the Statement of Operations.
Determination of Class Net Asset Value
All income, expenses (other than class-specific expenses, as shown on the Statement of Operations) and realized and unrealized gains (losses) are allocated to each class of the Fund on a daily basis, based on the relative net assets of each class, for purposes of determining the net asset value of each class.
23
Columbia Small Cap Value Fund I
June 30, 2008
Federal Income Tax Status
The Fund intends to qualify each year as a “regulated investment company” under Subchapter M of the Internal Revenue Code, as amended, and will distribute substantially all of its tax exempt or taxable income, if any, for its tax year, and as such will not be subject to federal income taxes. In addition, the Fund intends to distribute in each calendar year substantially all of its net investment income, capital gains and certain other amounts, if any, such that the Fund should not be subject to federal excise tax. Therefore, no federal income or excise tax provision is recorded.
Expenses
General expenses of the Trust are allocated to the Fund and the other series of the Trust based upon relative net assets or other expense allocation methodologies determined by the nature of the expense. Expenses directly attributable to the Fund are charged to the Fund.
Distributions to Shareholders
Distributions to shareholders are recorded on the ex-date. Net realized capital gains, if any, are distributed at least annually.
Indemnification
In the normal course of business, the Fund enters into contracts that contain a variety of representations and warranties and which provide general indemnities. The Fund’s maximum exposure under these arrangements is unknown because this would involve future claims against the Fund. Also, under the Trust’s organizational documents and by contract, the Trustees and officers of the Trust are indemnified against certain liabilities that may arise out of actions relating to their duties to the Trust. However, based on experience, the Fund expects the risk of loss due to these representations, warranties and indemnities to be minimal.
Note 3. Federal Tax Information
The timing and character of income and capital gain distributions are determined in accordance with income tax regulations, which may differ from GAAP. Reclassifications are made to the Fund’s capital accounts for permanent tax differences to reflect income and gains available for distribution (or available capital loss carryforwards) under income tax regulations.
For the year ended June 30, 2008, permanent book and tax basis differences resulting primarily from distribution reclassifications and redemption based payments treated as eligible for the dividends paid deduction were identified and reclassified among the components of the Fund’s net assets as follows:
| | | | |
| | | | | |
Undistributed Net
Investment
Income | | Accumulated Net Realized
Gain | | Paid-In
Capital |
| $396,340 | | $(5,763,609) | | $5,367,269 |
Net investment income and net realized gains (losses), as disclosed on the Statement of Operations, and net assets were not affected by this reclassification.
The tax character of distributions paid during the years ended June 30, 2008 and June 30, 2007 was as follows:
| | | | | | |
| | | June 30, |
| | | 2008 | | 2007 |
| Distribution Paid From | | | | |
Ordinary Income* | | $ | 14,936,561 | | $ | 6,299,576 |
Long-Term Capital Gains | | | 74,370,424 | | | 57,953,217 |
| * | For tax purposes short-term capital gain distributions, if any, are considered ordinary income distributions. |
As of June 30, 2008, the components of distributable earnings on a tax basis were as follows:
| | | | |
| | | | | |
Undistributed
Ordinary Income | | Undistributed Long-term Capital Gains | | Net
Unrealized Appreciation* |
| $373,900 | | $42,913,853 | | $32,041,148 |
| * | The differences between book-basis and tax-basis net unrealized appreciation are primarily due to deferral of losses from wash sales. |
Unrealized appreciation and depreciation at June 30, 2008, based on cost of investments for federal income tax purposes, were:
| | | | |
| | | | |
Unrealized appreciation | | $ | 164,566,516 | |
Unrealized depreciation | | | (132,525,368 | ) |
Net unrealized appreciation | | $ | 32,041,148 | |
24
Columbia Small Cap Value Fund I
June 30, 2008
The following capital loss carryforwards, determined as of June 30, 2008 may be available to reduce taxable income arising from future net realized gains on investments, if any, to the extent permitted by the Internal Revenue Code:
| | | |
| | | |
| Year of Expiration | | Capital Loss Carryforward* |
| 2009 | | $ | 1,233,446 |
| 2012 | | | 3,700,337 |
| | | |
| | $ | 4,933,783 |
| * | These carryforwards remain from the Fund’s merger with Liberty Contrarian Small Cap Fund on 11/01/2002. Utilization of Liberty Contrarian Small Cap Fund’s losses could be subject to limitations imposed by the Internal Revenue Code. |
Capital loss carryforwards of $1,233,446 were utilized during the year ended June 30, 2008.
The Fund adopted Financial Accounting Standards Board (“FASB”) Interpretation No. 48, Accounting for Uncertainty in Income Taxes—an Interpretation of FASB Statement No. 109 (“FIN 48”) effective December 31, 2007. FIN 48 requires management to determine whether a tax position of the Fund is more likely than not to be sustained upon examination by the applicable taxing authority, including resolution of any related appeals or litigation processes, based on the technical merits of the position. The tax benefit to be recognized is measured as the largest amount of benefit that is greater than fifty percent likely of being realized upon ultimate settlement. FIN 48 was applied to all existing tax positions upon initial adoption. Management has evaluated the known implications of FIN 48 on its computation of net assets for the Fund. As a result of this evaluation, management has concluded that FIN 48 did not have any effect on the Fund’s financial statements and no cumulative effect adjustments were recorded. However, management’s conclusions regarding FIN 48 may be subject to review and adjustment at a later date based on factors including, but not limited to, further implementation guidance from the FASB, new tax laws, regulations, and administrative interpretations (including relevant court decisions). The Fund’s federal tax returns for the prior three fiscal years remain subject to examination by the Internal Revenue Service. The Fund is not aware of any tax positions for which it is reasonably possible that the total amounts of unrecognized tax benefits will significantly change in the next twelve months.
Note 4. Fees and Compensation Paid to Affiliates
Investment Advisory Fee
Columbia, an indirect, wholly owned subsidiary of Bank of America Corporation (“BOA”) provides investment advisory, administrative and other services to the Fund. In rendering investment advisory services to the Fund, Columbia may use the portfolio management and research resources of Columbia Management Pte. Ltd., an affiliate of Columbia. Columbia receives a monthly investment advisory fee based on the Fund’s average daily net assets at the following annual rates:
| | |
| | | |
| Average Daily Net Assets | | Annual Fee Rate |
First $500 million | | 0.80% |
$500 million to $1 billion | | 0.75% |
Over $1 billion | | 0.70% |
For the year ended June 30, 2008, the Fund’s effective investment advisory fee rate was 0.78% of the Fund’s average daily net assets.
Pricing and Bookkeeping Fees
The Fund has entered into a Financial Reporting Services Agreement (the “Financial Reporting Services Agreement”) with State Street Bank & Trust Company (“State Street”) and Columbia pursuant to which State Street provides financial reporting services to the Fund. The Fund has also entered into an Accounting Services Agreement (collectively with the Financial Reporting Services Agreement, the “State Street Agreements”) with State Street and Columbia pursuant to which State Street provides accounting services to the Fund. Under the State Street Agreements, the Fund pays State Street an annual fee of $38,000 paid monthly plus an additional monthly fee based on an annualized percentage rate of average daily net assets of the Fund for the month. The aggregate fee will not exceed $140,000 per year (exclusive of out-of-pocket expenses and charges). The Fund also reimburses State Street for certain out-of-pocket expenses and charges.
The Fund has entered into a Pricing and Bookkeeping Oversight and Services Agreement (the “Services Agreement”) with Columbia. Under the Services Agreement, Columbia provides services related to Fund expenses and the
25
Columbia Small Cap Value Fund I
June 30, 2008
requirements of the Sarbanes-Oxley Act of 2002, and provides oversight of the accounting and financial reporting services provided by State Street. Under the Services Agreement, the Fund reimburses Columbia for out-of-pocket expenses. Prior to January 1, 2008, the Fund also reimbursed Columbia for the cost of accounting oversight services, services related to Fund expenses and the requirements of the Sarbanes-Oxley Act of 2002.
For the year ended June 30, 2008, the amount charged to the Fund by affiliates included on the Statement of Operations under “Pricing and bookkeeping fees” aggregated $7,494.
Transfer Agent Fee
Columbia Management Services, Inc. (the “Transfer Agent”), an affiliate of Columbia and an indirect, wholly owned subsidiary of BOA, provides shareholder services to the Fund and has contracted with Boston Financial Data Services (“BFDS”) to serve as sub-transfer agent. The Transfer Agent is entitled to receive a fee for its services, paid monthly, at the annual rate of $17.34 per open account plus reimbursement of certain sub-transfer agent fees paid by the Transfer Agent (exclusive of BFDS fees), calculated based on assets held in omnibus accounts and intended to recover the cost of payments to other parties (including affiliates of BOA) for services to those accounts. Prior to November 1, 2007, the annual rate was $17.00 per open account. The Transfer Agent pays the fees of BFDS for services as sub-transfer agent and is not entitled to reimbursement for such fees from the Fund. The Transfer Agent may also retain, as additional compensation for its services, fees for wire, telephone and redemption orders, IRA trustee agent fees and account transcript fees due to the Transfer Agent from shareholders of the Fund and credits (net of bank charges) earned with respect to balances in accounts the Transfer Agent maintains in connection with its services to the Fund. The Transfer Agent also receives reimbursement for certain out-of-pocket expenses.
An annual minimum account balance fee of $20 may apply to certain accounts with a value below the Fund’s initial minimum investment requirements to reduce the impact of small accounts on transfer agent fees. These minimum account balance fees are recorded as part of expense reductions on the Statement of Operations. For the year ended June 30, 2008, these minimum account balance fees reduced total expenses by $16,603.
Underwriting Discounts, Service and Distribution Fees
Columbia Management Distributors, Inc. (the “Distributor”), an affiliate of Columbia and an indirect, wholly owned subsidiary of BOA, is the principal underwriter of the Fund’s shares. For the year ended June 30, 2008, the Distributor retained net underwriting discounts of $54,614 on sales of the Fund’s Class A shares and received net CDSC fees of $1,051, $95,335 and $16,400 on Class A, Class B and Class C share redemptions, respectively.
The Fund has adopted Rule 12b-1 plans (the “Plans”) which require the payment of a monthly service fee to the Distributor at the annual rate of 0.25% of the average daily net assets of the Fund attributable to Class A, Class B and Class C shares. The Plans also require the payment of a monthly distribution fee to the Distributor at the annual rate of 0.75% of the average daily net assets attributable to Class B and Class C shares only.
The CDSC and the distribution fees are used principally as repayment to the Distributor for amounts paid by the Distributor to dealers who sold such shares.
Fees Paid to Officers and Trustees
All officers of the Fund are employees of Columbia or its affiliates and, with the exception of the Fund’s Chief Compliance Officer, receive no compensation from the Fund. The Board of Trustees has appointed a Chief Compliance Officer to the Fund in accordance with federal securities regulations. The Fund, along with other affiliated funds, pays its pro-rata share of the expenses associated with the Chief Compliance Officer. The Fund’s expenses for the Chief Compliance Officer will not exceed $15,000 per year.
The Trust’s eligible Trustees may participate in a deferred compensation plan which may be terminated at any time. Obligations of the plan will be paid solely out of the Fund’s assets.
Note 5. Custody Credits
The Fund has an agreement with its custodian bank under which custody fees may be reduced by balance credits. These credits are recorded as part of expense reductions on the Statement of Operations. The Fund could have invested a portion of the assets utilized in connection with the expense offset arrangement in an income-producing asset if it had not entered into such an agreement.
26
Columbia Small Cap Value Fund I
June 30, 2008
For the year ended June 30, 2008, these custody credits reduced total expenses by $2,549 for the Fund.
Note 6. Portfolio Information
For the year ended June 30, 2008, the cost of purchases and proceeds from sales of securities, excluding short-term obligations, were $394,126,072 and $374,928,548, respectively.
Note 7. Line of Credit
The Fund and other affiliated funds participate in a $350,000,000 committed, unsecured revolving line of credit and a $150,000,000 uncommitted, unsecured line of credit, both provided by State Street. Borrowings are available for short-term liquidity or temporary or emergency purposes.
Interest on the committed line of credit is charged to each participating fund based on the fund’s borrowings at a rate per annum equal to the Federal Funds Rate plus 0.50%. In addition, a commitment fee of 0.10% per annum is accrued and apportioned among the participating funds. Effective September 17, 2007, interest on the uncommitted line of credit is charged to each participating fund based on the fund’s borrowings at a rate per annum equal to the Federal Funds Rate plus 0.375%. Prior to September 17, 2007, interest on the uncommitted line of credit was charged to each participating fund based on the fund’s borrowings at a rate per annum equal to the Federal Funds Rate plus 0.50%. State Street charges an annual operations agency fee of $40,000 for the committed line of credit and may charge an annual administration fee of $15,000 for the uncommitted line of credit. The commitment fee, the operations agency fee and the administration fee are accrued and apportioned among the participating funds pro rata based on their relative net assets.
For the year ended June 30, 2008, the average daily balance outstanding on days where borrowing existed was $2,576,923 at a weighted average interest rate of 4.427%.
Note 8. Securities Lending
The Fund may lend its securities to certain approved brokers, dealers and other financial institutions. Each loan is collateralized by cash, in an amount at least equal to the market value of the securities loaned plus accrued income from the investment of collateral. The market value of the loaned securities is determined at the close of business of the Fund and any additional required collateral is delivered to the Fund on the next business day. The collateral received is invested and the income generated by the investment of the collateral, net of any fees remitted to State Street as the lending agent and borrower rebates, is paid to the Fund. Generally, in the event of borrower default, the Fund has the right to use the collateral to offset any losses incurred. In the event the Fund is delayed or prevented from exercising its right to dispose of the collateral, there may be a potential loss to the Fund. The Fund bears the risk of loss with respect to the investment of collateral.
At June 30, 2008, the Fund did not have any securities on loan under this agreement.
Note 9. Shares of Beneficial Interest
As of June 30, 2008, 7.4% of the Fund’s shares outstanding were beneficially owned by one participant account over which BOA and/or any of its affiliates had either sole or joint investment discretion.
As of June 30, 2008, the Fund also had two shareholders that collectively held 11.6% of the shares outstanding, over which BOA and/or any of its affiliates did not have investment discretion. Subscription and redemption activity of these accounts may have a significant effect on the operations of the Fund.
Note 10. Significant Risks and Contingencies
Sector Focus Risk
The Fund may focus its investments in certain sectors, subjecting it to greater risk than a fund that is less focused.
Legal Proceedings
On February 9, 2005, Columbia Management Advisors, Inc. (which has since merged into Banc of America Capital Management, LLC (now named Columbia Management Advisors, LLC)) (“Columbia”) and Columbia Funds Distributor, Inc. (which has been renamed Columbia Management Distributors, Inc.) (the “Distributor”) (collectively, the “Columbia Group”) entered into an Assurance of Discontinuance with the New York Attorney General (“NYAG”) (the “NYAG Settlement”) and consented to the entry of a cease-and-desist order by the Securities and Exchange Commission (“SEC”) (the “SEC Order”) on matters relating to mutual fund trading.
27
Columbia Small Cap Value Fund I
June 30, 2008
Under the terms of the SEC Order, the Columbia Group agreed, among other things, to: pay $70 million in disgorgement and $70 million in civil money penalties; cease and desist from violations of the antifraud provisions and certain other provisions of the federal securities laws; maintain certain compliance and ethics oversight structures; retain an independent consultant to review the Columbia Group’s applicable supervisory, compliance, control and other policies and procedures; and retain an independent distribution consultant (see below). The Columbia Funds have also voluntarily undertaken to implement certain governance measures designed to maintain the independence of their boards of trustees. The NYAG Settlement also, among other things, requires Columbia and its affiliates to reduce management fees for certain Columbia Funds (including the former Nations Funds) and other mutual funds collectively by $32 million per year for five years, for a projected total of $160 million in management fee reductions.
Pursuant to the procedures set forth in the SEC Order, the $140 million in settlement amounts described above is being distributed in accordance with a distribution plan that was developed by an independent distribution consultant and approved by the SEC on April 6, 2007. Distributions under the distribution plan began in late June 2007.
A copy of the SEC Order is available on the SEC website at http://www.sec.gov. A copy of the NYAG Settlement is available as part of the Bank of America Corporation Form 8-K filing on February 10, 2005.
In connection with the events described above, various parties have filed suit against certain funds, the Trustees of the Columbia Funds, FleetBoston Financial Corporation and its affiliated entities and/or Bank of America and its affiliated entities.
On February 20, 2004, the Judicial Panel on Multidistrict Litigation transferred these cases and cases against other mutual fund companies based on similar allegations to the United States District Court in Maryland for consolidated or coordinated pretrial proceedings (the “MDL”). Subsequently, additional related cases were transferred to the MDL. On September 29, 2004, the plaintiffs in the MDL filed amended and consolidated complaints. One of these amended complaints is a putative class action that includes claims under the federal securities laws and state common law, and that names Columbia, the Distributor, the Trustees of the Columbia Funds, Bank of America Corporation and others as defendants. Another of the amended complaints is a derivative action purportedly on behalf of the Columbia Funds that asserts claims under federal securities laws and state common law.
On February 25, 2005, Columbia and other defendants filed motions to dismiss the claims in the pending cases. On March 1, 2006, for reasons stated in the court’s memoranda dated November 3, 2005, the United States District Court for the District of Maryland granted in part and denied in part the defendants’ motions to dismiss. The court dismissed all of the class action claims pending against the Columbia Funds Trusts. As to Columbia and the Distributor, the claims under the Securities Act of 1933, the claims under Sections 34(b) and 36(a) of the Investment Company Act of 1940 (“ICA”) and the state law claims were dismissed. The claims under Sections 10(b) and 20(a) of the Securities Exchange Act of 1934 and claims under Section 36(b) of the ICA were not dismissed.
On March 21, 2005, a purported class action was filed in Massachusetts state court alleging that certain conduct, including market timing, entitled Class B shareholders in certain Columbia funds to an exemption from contingent deferred sales charges upon early redemption (“the CDSC Lawsuit”). The CDSC Lawsuit was removed to federal court in Massachusetts and transferred to the MDL.
On September 14, 2007, the plaintiffs and the Columbia defendants named in the MDL, including the Columbia Funds, entered into a stipulation of settlement with respect to all Columbia-related claims in the MDL described above, including the CDSC Lawsuit. The settlement is subject to court approval.
In 2004, the Columbia Funds’ adviser and distributor and certain affiliated entities and individuals were named as defendants in certain purported shareholder class and derivative actions making claims, including claims under the Investment Company and the Investment Advisers Acts of 1940 and state law. Certain Columbia Funds were named as nominal defendants. The suits allege, inter alia, that the fees and expenses paid by the funds are excessive and that the advisers and their affiliates inappropriately used fund assets to distribute the funds and for other improper purposes. On March 2, 2005, the actions were consolidated in the
28
Columbia Small Cap Value Fund I
June 30, 2008
Massachusetts federal court as In re Columbia Entities Litigation. The plaintiffs filed a consolidated amended complaint on June 9, 2005. On November 30, 2005, the judge dismissed all claims by plaintiffs and entered final judgment in favor of the defendants. The plaintiffs appealed to the United States Court of Appeals for the First Circuit on December 30, 2005. A stipulation and settlement agreement dated January 19, 2007 was filed in the First Circuit on February 14, 2007, with a joint stipulation of dismissal and motion for remand to obtain district court approval of the settlement. That joint motion was granted and the appeal was dismissed. On March 6, 2007, the case was remanded to the District Court. The settlement, approved by the District Court on September 18, 2007, became effective October 19, 2007. Pursuant to the settlement, the funds’ adviser and/or its affiliates made certain payments, including plaintiffs’ attorneys’ fees and costs of notice to class members.
29
Report of Independent Registered Public Accounting Firm
To the Trustees of Columbia Funds Series Trust I and the Shareholders of Columbia Small Cap Value Fund I
In our opinion, the accompanying statement of assets and liabilities, including the investment portfolio, and the related statements of operations and of changes in net assets and the financial highlights present fairly, in all material respects, the financial position of Columbia Small Cap Value Fund I (the “Fund”) (a series of Columbia Funds Series Trust I) at June 30, 2008, the results of its operations for the year then ended, the changes in its net assets for each of the two years in the period then ended and the financial highlights for each of the five years in the period then ended, in conformity with accounting principles generally accepted in the United States of America. These financial statements and financial highlights (hereafter referred to as “financial statements”) are the responsibility of the Fund’s management. Our responsibility is to express an opinion on these financial statements based on our audits. We conducted our audits of these financial statements in accordance with the standards of the Public Company Accounting Oversight Board (United States). Those standards require that we plan and perform the audit to obtain reasonable assurance about whether the financial statements are free of material misstatement. An audit includes examining, on a test basis, evidence supporting the amounts and disclosures in the financial statements, assessing the accounting principles used and significant estimates made by management, and evaluating the overall financial statement presentation. We believe that our audits, which included confirmation of securities at June 30, 2008 by correspondence with the custodian and brokers, provide a reasonable basis for our opinion.
PricewaterhouseCoopers LLP
Boston, Massachusetts
August 20, 2008
30
Federal Income Tax Information (Unaudited)
For the fiscal year ended June 30, 2008, the Fund designates long-term capital gains of $57,413,553.
93.46% of the ordinary income distributed by the Fund, for the year ended June 30, 2008, qualifies for the corporate dividends received deduction.
For non-corporate shareholders 93.51%, or the maximum amount allowable under the Jobs and Growth Tax Relief Reconciliation Act of 2003, of income distributed by the Fund for the period July 1, 2007 to June 30, 2008 may represent qualified dividend income.
Final information will be provided in your 2008 Form 1099-DIV.
31
Fund Governance
The Trustees serve terms of indefinite duration. The names, addresses and ages of the Trustees and officers of the Funds in Columbia Funds Series Trust I, the year each was first elected or appointed to office, their principal business occupations during at least the last five years, the number of Funds overseen by each Trustee and other directorships they hold are shown below. Each officer listed below serves as an officer of each Fund in the Columbia Funds Complex.
Independent Trustees
| | |
Name, address and year of birth,
Position with funds, Year first
elected or appointed to office1 | | Principal occupation(s) during past five years, Number of portfolios in Columbia Funds
Complex overseen by trustee, Other directorships held |
| |
John D. Collins (Born 1938) | | |
c/o Columbia Management Advisors, LLC One Financial Center Boston, MA 02111 Trustee2 (since 2007) | | Retired. Consultant, KPMG, LLP from July 1999 to June 2000; Partner, KPMG, LLP from March 1962 to June 1999. Oversees 77, Mrs. Fields Famous Brands LLC (consumer products); Suburban Propane Partners, L.P.; and Montpelier Re |
| |
Rodman L. Drake (Born 1943) | | |
c/o Columbia Management Advisors, LLC One Financial Center Boston, MA 02111 Trustee2 (since 2007) | | Co-Founder of Baringo Capital LLC (private equity) since 2002; President, Continuation Investments Group, Inc. from 1997 to 2001. Oversees 77, Jackson Hewitt Tax Service Inc. (tax preparation services); Crystal Capital River Inc. (real estate investment trust); Student Loan Corporation (student loan provider); Celgene Corporation (global biotechnology company); Apex Silver Mines Ltd. (mining); and Hyperion Brookfield Total Return Fund Inc. and Hyperion Brookfield Strategic Mortgage Income Fund (exchange-traded funds) |
| |
Douglas A. Hacker (Born 1955) | | |
c/o Columbia Management Advisors, LLC One Financial Center Boston, MA 02111 Trustee (since 1996) | | Independent business executive since May, 2006; Executive Vice President–Strategy of United Airlines (airline) from December, 2002 to May, 2006; President of UAL Loyalty Services (airline marketing company) from September, 2001 to December, 2002; Executive Vice President and Chief Financial Officer of United Airlines from July, 1999 to September, 2001. Oversees 77, Nash Finch Company (food distributor); Aircastle Limited (aircraft leasing) |
| |
Janet Langford Kelly (Born 1957) | | |
c/o Columbia Management Advisors, LLC One Financial Center Boston, MA 02111 Trustee (since 1996) | | Senior Vice President, General Counsel and Corporate Secretary, ConocoPhillips (integrated energy company) since September, 2007; Deputy General Counsel– Corporate Legal Services, ConocoPhillips from August, 2006 to August, 2007; Partner, Zelle, Hofmann, Voelbel, Mason & Gette LLP (law firm) from March, 2005 to July, 2006; Adjunct Professor of Law, Northwestern University, from September, 2004 to June, 2006, Director, UAL Corporation (airline) from February, 2006 to July, 2006; Chief Administrative Officer and Senior Vice President, Kmart Holding Corporation (consumer goods), from September, 2003 to March, 2004; Executive Vice President– Corporate Development and Administration, General Counsel and Secretary, Kellogg Company (food manufacturer), from September, 1999 to August, 2003. Oversees 77, None |
| |
Charles R. Nelson (Born 1942) | | |
c/o Columbia Management Advisors, LLC One Financial Center Boston, MA 02111 Trustee (since 1981) | | Professor of Economics, University of Washington, since January, 1976; Ford and Louisa Van Voorhis Professor of Political Economy, University of Washington, since September, 1993; Director, Institute for Economic Research, University of Washington from September, 2001 to June, 2003; Adjunct Professor of Statistics, University of Washington, since September, 1980; Associate Editor, Journal of Money Credit and Banking, since September, 1993; consultant on econometric and statistical matters. Oversees 77, None |
32
Fund Governance (continued)
Independent Trustees (continued)
| | |
Name, address and year of birth,
Position with funds, Year first
elected or appointed to office1 | | Principal occupation(s) during past five years, Number of portfolios in Columbia Funds
Complex overseen by trustee, Other directorships held |
| |
| John J. Neuhauser (Born 1943) | | |
c/o Columbia Management Advisors, LLC One Financial Center Boston, MA 02111 Trustee (since 1985) | | President, Saint Michael’s College, since August, 2007; University Professor, Boston College from November, 2005 to August, 2007; Academic Vice President and Dean of Faculties, Boston College from August, 1999 to October, 2005. Oversees 77, Liberty All-Star Equity Fund and Liberty All-Star Growth Fund, Inc. (closed-end funds) |
| |
| Jonathan Piel (Born 1938) | | |
c/o Columbia Management Advisors, LLC One Financial Center Boston, MA 02111 Trustee2 (since 2007) | | Cable television producer and website designer; The Editor, Scientific American from 1984 to 1994 and Vice President from 1984 to 1994; Member, Advisory Board, Stone Age Institute, Bloomington, Indiana (research institute that explores the effect of technology on human evolution); Member, Board of Directors of the National Institute of Social Sciences, New York City; and Member, Board of Trustees of the William Alanson White Institute, New York City (institution for training psychoanalysts). Oversees 77, None |
| |
| Patrick J. Simpson (Born 1944) | | |
c/o Columbia Management Advisors, LLC One Financial Center Boston, MA 02111 Trustee (since 2000) | | Partner, Perkins Coie LLP (law firm). Oversees 77, None |
| |
| Thomas C. Theobald (Born 1937) | | |
c/o Columbia Management Advisors, LLC One Financial Center Boston, MA 02111 Trustee and Chairman of the Board (since 1996) | | Partner and Senior Advisor, Chicago Growth Partners (private equity investing) since September, 2004; Managing Director, William Blair Capital Partners (private equity investing) from September, 1994 to September, 2004. Oversees 77, Anixter International (network support equipment distributor); Ventas, Inc. (real estate investment trust); Jones Lang LaSalle (real estate management services); Ambac Financial Group (financial guaranty insurance) |
| |
| Anne-Lee Verville (Born 1945) | | |
c/o Columbia Management Advisors, LLC One Financial Center Boston, MA 02111 Trustee (since 1998) | | Retired since 1997 (formerly General Manager–General Education Industry (from 1994 to1997), President–Application Systems Division (from 1991 to 1994), Chief Financial Officer–US Marketing & Services (from 1988 to 1991), and Chief Information Officer (from 1987 to 1988), IBM Corporation (computer and technology)). Oversees 77, None |
33
Fund Governance (continued)
| | |
Name, address and year of birth,
Position with funds, Year first
elected or appointed to office1 | | Principal occupation(s) during past five years, Number of portfolios in Columbia
Funds Complex overseen by trustee, other directorships held |
Interested Trustee
| | |
| |
| William E. Mayer (Born 1940) | | |
c/o Columbia Management Advisors, LLC One Financial Center Boston, MA 02111 Trustee3 (since 1994) | | Partner, Park Avenue Equity Partners (private equity) since February, 1999; Dean and Professor, College of Business, University of Maryland, 1992 to 1997. Oversees 77, Lee Enterprises (print media), WR Hambrecht + Co. (financial service provider); BlackRock Kelso Capital Corporation (investment company) |
1 | In December 2000, the boards of each of the former Liberty Funds and former Stein Roe Funds were combined into one board of trustees responsible for the oversight of both fund groups (collectively, the “Liberty Board”). In October 2003, the trustees on the Liberty Board were elected to the boards of the Columbia Funds (the “Columbia Board”) and of the CMG Fund Trust (the “CMG Funds Board”); simultaneous with that election, Patrick J. Simpson who had been a director on the Columbia Board and trustee on the CMG Funds Board, was appointed to serve as trustee of the Liberty Board. The date shown is the earliest date on which a trustee/director was elected or appointed to the board of a Fund in the Columbia Funds Complex. |
2 | Messrs. Drake, Piel and Collins have served as directors/trustees of the Excelsior Funds since 1996, 1996 and 2005, respectively. The Excelsior Funds consisted of 27 portfolios managed by affiliates of Columbia Management Advisors, LLC. Effective December 12, 2007, the Board elected Messrs. Drake, Piel and Collins as Trustees of the Trust. |
3 | Mr. Mayer is an “interested person” (as defined in the Investment Company Act of 1940) by reason of his affiliation with WR Hambrecht + Co., a registered broker/dealer that may execute portfolio transactions for or engage in principal transactions with the Funds or other funds or accounts advised/managed by the Advisor or other Bank of America affiliates. |
The Statement of Additional Information includes additional information about the Trustees of the Funds and is available, without charge, upon request by calling 1-800-426-3750.
34
Fund Governance (continued)
Officers
| | |
Name, address and year of birth,
Position with Columbia Funds, Year
first elected or appointed to office | | Principal occupation(s) during past five years |
| |
| Christopher L. Wilson (Born 1957) | | |
One Financial Center Boston, MA 02111 President (since 2004) | | President–Columbia Funds, since October 2004; Managing Director–Columbia Management Advisors, LLC, since September 2005; Senior Vice President–Columbia Management Distributors, Inc., since January 2005; Director–Columbia Management Services, Inc., since January 2005; Director–Bank of America Global Liquidity Funds, plc and Banc of America Capital Management (Ireland), Limited, since May 2005; Director–FIM Funding, Inc., since January 2005; President and Chief Executive Officer–CDC IXIS AM Services, Inc. (investment management), from September 1998 through August 2004; and a senior officer or director of various other Bank of America affiliated entities, including other registered and unregistered funds. |
|
| James R. Bordewick, Jr. (Born 1959) |
One Financial Center Boston, MA 02111 Senior Vice President, Secretary and Chief Legal Officer (since 2006) | | Associate General Counsel, Bank of America since April, 2005; Senior Vice President and Associate General Counsel, MFS Investment Management (investment management) prior to April, 2005. |
| |
| J. Kevin Connaughton (Born 1964) | | |
One Financial Center Boston, MA 02111 Senior Vice President and Chief Financial Officer (since 2000) | | Managing Director of Columbia Management Advisors, LLC since December 2004; Treasurer –Columbia Funds, from October 2003 to May 2008; Treasurer–the Liberty Funds, Stein Roe Funds and Liberty All-Star Funds, December 2000–December 2006; Senior Vice President–Columbia Management Advisors, LLC, from April 2003 to December 2004; President–Columbia Funds, Liberty Funds and Stein Roe Funds, February 2004 to October 2004; Treasurer–Galaxy Funds, September 2002 to December 2005; Treasurer, December 2002 to December 2004, and President, February 2004 to December 2004–Columbia Management Multi-Strategy Hedge Fund, LLC; and a senior officer of various other Bank of America-affiliated entities, including other registered and unregistered funds. |
| |
| Linda J. Wondrack (Born 1964) | | |
One Financial Center Boston, MA 02111 Senior Vice President and Chief Compliance Officer (since 2007) | | Director (Columbia Management Group LLC and Investment Product Group Compliance), Bank of America since June 2005; Director of Corporate Compliance and Conflicts Officer, MFS Investment Management (investment management), August 2004 to May 2005; Managing Director, Deutsche Asset Management (investment management) prior to August 2004. |
| |
| Michael G. Clarke (Born 1969) | | |
One Financial Center Boston, MA 02111 Treasurer (since 2008) | | Director of Fund Administration of the Advisor since January 2006; Managing Director of the Advisor, September 2004 to December 2005; Vice President Fund Administration June 2002 to September 2004. |
| |
| Jeffrey R. Coleman (Born 1969) | | |
One Financial Center Boston, MA 02111 Deputy Treasurer (since 2006) | | Director of Fund Administration of the Advisor since January, 2006; Fund Controller of the Advisor from October 2004 to January 2006; Vice President of CDC IXIS Asset Management Services, Inc. (investment management) from August, 2000 to September, 2004. |
35
Fund Governance (continued)
Officers (continued)
| | |
Name, address and year of birth,
Position with Columbia Funds, Year
first elected or appointed to office | | Principal occupation(s) during past five years |
| |
| Joseph F. DiMaria (Born 1968) | | |
One Financial Center Boston, MA 02111 Deputy Treasurer (since 2006) | | Director of Fund Administration of the Advisor since January, 2006; Head of Tax/Compliance and Assistant Treasurer of the Advisor from November, 2004 to December, 2005; Director of Trustee Administration (Sarbanes-Oxley) of the Advisor from May, 2003 to October, 2004; Senior Audit Manager, PricewaterhouseCoopers (independent registered public accounting firm) from July, 2000 to April, 2003. |
| |
| Barry S. Vallan (Born 1969) | | |
One Financial Center Boston, MA 02111 Controller (since 2006) | | Vice President–Fund Treasury of the Advisor since October, 2004; Vice President– Trustee Reporting of the Advisor from April, 2002 to October, 2004; Management Consultant, PricewaterhouseCoopers (independent registered public accounting firm) prior to October, 2002. |
36
Important Information About This Report – Columbia Small Cap Value Fund I
Transfer Agent
Columbia Management Services, Inc.
P.O. Box 8081
Boston, MA 02266-8081
1-800-345-6611
Distributor
Columbia Management
Distributors, Inc.
One Financial Center
Boston, MA 02111
Investment Advisor
Columbia Management Advisors, LLC
100 Federal Street
Boston, MA 02110
The fund mails one shareholder report to each shareholder address. If you would like more than one report, please call shareholder services at 1-800-345-6611 and additional reports will be sent to you. This report has been prepared for shareholders of Columbia Small Cap Value Fund I.
A description of the policies and procedures that the fund uses to determine how to vote proxies and a copy of the fund’s voting records are available (i) at www.columbiamanagement.com; (ii) on the Securities and Exchange Commission’s website at www.sec.gov, and (iii) without charge, upon request, by calling 1-800-368-0346. Information regarding how the fund voted proxies relating to portfolio securities during the 12-month period ended June 30 is available from the SEC’s website. Information regarding how the fund voted proxies relating to portfolio securities is also available from the fund’s website, www.columbiamanagement.com.
The fund files a complete schedule of portfolio holdings with the SEC for the first and third quarters of each fiscal year on Form N-Q. The fund’s Form N-Q is available on the SEC’s website at www.sec.gov and may be reviewed and copied at the SEC’s Public Reference Room in Washington, D.C. Information on the operation of the Public Reference Room may be obtained by calling 1-800-SEC-0330.
Please read and consider the investment objectives, risks, charges and expenses for any fund carefully before investing. For a prospectus which contains this and other important information about the fund, contact your Columbia Management representative or financial advisor or go to www.columbiamanagement.com.
Columbia Management Group, LLC (“Columbia Management”) is the investment management division of Bank of America Corporation. Columbia Management entities furnish investment management services and products for institutional and individual investors. Columbia Funds are distributed by Columbia Management Distributors, Inc., member of FINRA, SIPC, part of Columbia Management and an affiliate of Bank of America Corporation.
37

Columbia Small Cap Value Fund I
Annual Report, June 30, 2008
©2008 Columbia Management Distributors, Inc.
One Financial Center, Boston, MA 02111-2621
800.345.6611 www.columbiafunds.com
SHC-42/154842-0608 (08/08) 08/53566

Annual Report
June 30, 2008
Columbia High Yield Municipal Fund
| | |
| NOT FDIC INSURED | | May Lose Value |
| NOT BANK ISSUED | | No Bank Guarantee |
Table of contents
The views expressed in this report reflect the current views of the respective parties. These views are not guarantees of future performance and involve certain risks, uncertainties and assumptions that are difficult to predict so actual outcomes and results may differ significantly from the views expressed. These views are subject to change at any time based upon economic, market or other conditions and the respective parties disclaim any responsibility to update such views. These views may not be relied on as investment advice and, because investment decisions for a Columbia Fund are based on numerous factors, may not be relied on as an indication of trading intent on behalf of any particular Columbia Fund. References to specific company securities should not be construed as a recommendation or investment advice.
President’s Message

Dear Shareholder:
We are pleased to provide this financial report for your Columbia Fund. This document provides information that can help support your investment decision-making. It’s been a challenging year for the financial markets, particularly as concerns over a weaker housing market and economic uncertainty make the news headlines daily. For a sense of how Columbia Management’s investment professionals have responded to these issues, I encourage you to read the Economic Update and Portfolio Manager’s Report. I believe these discussions reflect Columbia Management’s investment management expertise as well as its commitment to market research and consistent investment performance.
We understand that many factors drove your decision to invest in Columbia Funds. Columbia Management’s commitment is to honor that decision by providing investment solutions designed to exceed your expectations. As we review the past year and look forward to those ahead, we hope you will consider how we might support your investment needs beyond the services we provide currently. Some of the many advantages we bring to the table as the fund’s investment manager include:
| n | | Broad and deep investment expertise, including dedicated portfolio management, research and trading |
| n | | Strategically positioned investment disciplines and processes |
| n | | Comprehensive compliance and risk management |
| n | | A team-driven culture that draws upon multiple sources to pursue consistent and superior performance |
| n | | A comprehensive array of investment solutions, including equity, fixed-income and cash strategies |
Working for you, and with you
Team approach — Rather than rely on the talent or judgment of one individual, Columbia Management takes a team-oriented approach to investing. We draw from the diverse experiences and insights of our people — including portfolio managers, research analysts and traders — to bring multiple investment perspectives and deep expertise to all of our investment management activities.
Client focus — At Columbia Management, our philosophy and culture are anchored in focused solutions and personal service. We are committed to putting our clients’ interests first and we understand the premium our clients place on reliability—whether it’s related to service, investment performance or risk management. Columbia Management is committed to maintaining high standards of reliability on all counts.
While our asset management capabilities are multifaceted and our investment
professionals are multitalented, ultimately, everything we do at Columbia Management has a single purpose: to help investors pursue their most important financial goals. We are honored that you’ve chosen to invest with us and look forward to providing the investment solutions and services necessary to sustain a lasting relationship.
Sincerely,

Christopher L. Wilson
President, Columbia Funds
Fund Profile – Columbia High Yield Municipal Fund
Performance data quoted represents past performance and current performance may be lower or higher. Past performance is no guarantee of future results. The investment return and principal value will fluctuate so that shares, when redeemed, may be worth more or less than the original cost. Please visit www.columbiafunds.com for daily and most recent month-end performance updates.
Summary
1-year return as of 06/30/08
| | |
| |
 | | –4.39% Class A shares |
| | (without sales charge) |
| |
 | | +3.23% Lehman Brothers Municipal Bond Index1 |
Morningstar Style Box
Fixed Income Maturity
The Morningstar Style Box reveals a fund’s investment strategy. For fixed-income funds the vertical axis shows the average credit quality of the bonds owned, and the horizontal axis shows interest rate sensitivity as measured by a bond’s duration (short, intermediate or long). All of these numbers are drawn from the data most recently provided by the fund and entered into Morningstar’s database as of quarter-end. Although the data gathered is from reliable sources, Morningstar cannot guarantee its completeness and accuracy. Information shown is as of 03/31/08.
Summary
| n | | For the 12-month period that ended June 30, 2008, the fund’s Class A shares returned negative 4.39% without sales charge. |
| n | | The fund was constrained by its holdings of hotel bonds at a time of decreased travel, but its relatively low exposure to airline and tobacco bonds helped it hold up better than its peers in a challenging environment. |
| n | | We plan to focus on diversification in an environment of higher inflation and greater risk aversion. |
Portfolio Management
Maureen G. Newman has managed the fund since November 1998 and has been with the advisor or its predecessors or affiliate organizations since 1996.
1 | The Lehman Brothers Municipal Bond Index is considered representative of the broad market for investment-grade, tax-exempt bonds with a maturity of at least one year. Indices are not investments, do not incur fees or expenses and are not professionally managed. It is not possible to invest directly in an index. Securities in the fund may not match those in an index. |
1
Economic Update – Columbia High Yield Municipal Fund
Summary
For the 12-month period that ended June 30, 2008
| | n | | Despite volatility in many segments of the bond market, the Lehman Brothers U.S. Aggregate Bond Index delivered a solid return. High-yield bonds lost ground, as measured by the Merrill Lynch U.S. High Yield, Cash Pay Index. | |
| | |
| Merrill Lynch Index | | Lehman
Index |
| |

| | 
|
-2.03% | | 7.12% |
| | n | | The broad U.S. stock market, as measured by the S&P 500 Index, returned negative 13.12%. Stock markets outside the United States returned negative 10.61%, as measured (in U.S. dollars) by the MSCI EAFE Index. A declining dollar helped offset losses. | |
| | |
| S&P Index | | MSCI Index |
| |
| |
|
-13.12% | | -10.61% |
The Lehman Brothers U.S. Aggregate Bond Index is a market value-weighted index that tracks the daily price, coupon, pay-downs and total return performance of fixed-rate, publicly placed, dollar-denominated and non-convertible investment grade debt issues with at least $250 million par amount outstanding and with at least one year to final maturity.
The Merrill Lynch U.S. High Yield, Cash Pay Index tracks the performance of non-investment-grade corporate bonds.
The Standard & Poor’s (S&P) 500 Index tracks the performance of 500 widely held, large-capitalization U.S. stocks.
The Morgan Stanley Capital International (MSCI) Europe, Australasia, Far East (EAFE) Index is a free float-adjusted market capitalization index that is designed to measure developed market equity performance, excluding the U.S. and Canada.
Indices are not investments, do not incur fees or expenses and are not professionally managed. It is not possible to invest directly in an index. Securities in the fund may not match those in an index.
The pace of economic growth slowed throughout the 12-month period that began July 1, 2007 and ended June 30, 2008 as a multitude of factors weighed on consumers and businesses alike. The most severe housing downturn in decades continued to take a toll on growth. Inventories of homes for sale rose, home prices declined and tighter credit standards, the result of turmoil in the subprime mortgage market, made it more difficult for homebuyers to qualify for loans. Energy prices soared to record highs and food prices rose, raising concerns about inflation. Consumer confidence declined sharply. According to the Conference Board, which tracks consumer confidence, its June reading was the fifth lowest ever.
As growth weakened, businesses pulled back on hiring, which further dimmed the outlook for consumers. Nearly 300,000 job losses were reported in the first six months of 2008, and the unemployment rate spiked to 5.5%, one full percentage point higher than it was at the beginning of the period. Manufacturing activity also slowed, but appeared to stabilize late in the period, one of the few positive indicators that economic weakness might be contained. Federal tax rebates also began to arrive in May, raising hopes for a boost in consumer spending, which remained more resilient than most economists expected. Any improvement on the consumer side of the economy potentially could help avert recession.
In an effort to inspire confidence in the capital markets, loosen the reins on credit and shore up economic growth, the Federal Reserve Board (the Fed) brought a key short-term rate — the federal funds rate — down from 5.25% to 2.0% during the 12-month period. After seven rate cuts, the Fed acknowledged that downside risks to growth remained but also that the inflation outlook was a concern and that it would monitor inflation developments carefully.
Bonds delivered solid gains
The U.S. bond market seesawed during the 12-month period but delivered a solid gain as investors sought the relative safety of the highest quality sectors. After a weak start, bond prices generally rose and yields declined as economic growth slowed and stock market volatility increased. Although the benchmark 10-year U.S. Treasury yield edged back above 4.0% in 2008, it slipped to 3.97% at the end of the period, one full percentage point below where it was one year ago. In this environment, the Lehman Brothers U.S. Aggregate Bond Index returned 7.12%. High-yield bonds disappointed in 2007 but regained some ground in 2008. The Merrill Lynch U.S. High Yield, Cash Pay Index returned negative 2.03%. Municipal bonds generated modest but solid returns during most of the period, but gave back some performance early in 2008 as industry-specific events threatened investor confidence. In February, yields on municipal bonds rose above yields on comparable maturity Treasuries — and prices fell — in a difficult month for the sector. In this environment, the Lehman Brothers Municipal Bond Index returned 3.23% for the one-year period.1
1 | The Lehman Brothers Municipal Bond Index is considered representative of the broad market for investment-grade, tax-exempt bonds with a maturity of at least one year. |
2
Economic Update (continued) – Columbia High Yield Municipal Fund
Stocks retreated as economic storm clouds gathered
Against a shifting economic backdrop, the U.S. stock market lost 13.12% for the 12-month period, as measured by the S&P 500 Index. Large- cap stocks held up better than small- and mid-cap stocks, as measured by their respective Russell indices.2 Growth stocks also held up better than value stocks by a significant margin. As the dollar fell to a record low against the euro and multi-year lows versus a number of other currencies, investors reaped somewhat better results from investments outside the U.S. The MSCI EAFE Index, a broad gauge of stock market performance in foreign developed markets, lost 10.61% (in U.S. dollars) for the period, as a weak second half wiped out solid gains that had been posted in the first half of the 12-month period. Despite weakness near the end of the period, emerging stock markets, both collectively and individually, generated positive returns. The MSCI Emerging Markets Index returned 4.89% (in U.S. dollars) as demand for exports as well as domestic infrastructure expansion continued.3
Past performance is no guarantee of future results.
2 | The Russell 1000 Index measures the performance of 1,000 of the largest U.S. companies, based on market capitalization. The Russell Midcap Index measures the performance of the 800 smallest companies in the Russell 1000 Index, as ranked by total market capitalization. The Russell 2000 Index measures the performance of the 2,000 smallest of the 3,000 largest U.S. companies, based on market capitalization. |
3 | The MSCI Emerging Markets Index is a widely accepted index composed of a sample of companies from 25 countries representing the global emerging stock markets. |
| | Indices are not investments, do not incur fees or expenses and are not professionally managed. It is not possible to invest directly in an index. Securities in the fund may not match those in an index. |
3
Performance Information – Columbia High Yield Municipal Fund
Performance data quoted represents past performance and current performance may be lower or higher. Past performance is no guarantee of future results. The investment return and principal value will fluctuate so that shares, when redeemed, may be worth more or less than the original cost. Please visit www.columbiafunds.com for daily and most recent month-end performance updates.
| | |
| Annual operating expense ratio (%)* |
| |
Class A | | 0.91 |
Class B | | 1.66 |
Class C | | 1.66 |
Class Z | | 0.71 |
| * | The annual operating expense ratio is as stated in the fund’s prospectus that is current as of the date of this report. Differences in expense ratios disclosed elsewhere in this report may result from including fee waivers and reimbursements as well as different time periods used in calculating the ratios. |
| | |
| Net asset value per share |
| |
as of 06/30/08 ($) | | |
Class A | | 10.32 |
Class B | | 10.32 |
Class C | | 10.32 |
Class Z | | 10.32 |
| | |
| Distributions declared per share |
| |
07/01/07 – 06/30/08 ($) | | |
Class A | | 0.52 |
Class B | | 0.44 |
Class C | | 0.46 |
Class Z | | 0.54 |
A portion of the fund’s income may be subject to the alternative minimum tax. The fund may at times purchase tax-exempt securities at a discount. Some or all of this discount may be included in the fund’s ordinary income, and is taxable when distributed.
|
| Growth of a $10,000 investment 07/01/98 – 06/30/08 |
The chart above shows the growth in value of a hypothetical $10,000 investment in Class A shares of Columbia High Yield Municipal Fund during the stated time period, and does not reflect the deduction of taxes that a shareholder may pay on fund distributions or the redemption of fund shares. The Lehman Brothers Municipal Bond Index is considered representative of the broad market for investment-grade, tax-exempt bonds with a maturity of at least one year. Indices are not investments, do not incur fees or expenses and are not professionally managed. It is not possible to invest directly in an index. Securities in the fund may not match those in an index.
| | | | |
| Performance of a $10,000 investment 07/01/98 – 06/30/08 ($) |
| | |
| Sales charge | | without | | with |
Class A | | 14,479 | | 13,788 |
Class B | | 13,845 | | 13,845 |
Class C | | 13,967 | | 13,967 |
Class Z | | 14,747 | | n/a |
| | | | |
| Average annual total return as of 06/30/08 (%) |
| | | | | | | | | | | | | | |
| Share class | | A | | B | | C | | Z |
| Inception | | 07/31/00 | | 07/15/02 | | 07/15/02 | | 03/05/84 |
| Sales charge | | without | | with | | without | | with | | without | | with | | without |
1-year | | –4.39 | | –8.97 | | –5.10 | | –9.66 | | –4.96 | | –5.87 | | –4.20 |
5-year | | 2.97 | | 1.97 | | 2.20 | | 1.87 | | 2.36 | | 2.36 | | 3.18 |
10-year | | 3.77 | | 3.26 | | 3.31 | | 3.31 | | 3.40 | | 3.40 | | 3.96 |
The “with sales charge” returns include the maximum initial sales charge of 4.75% for Class A shares, the applicable contingent deferred sales charge of 5.00% in the first year, declining to 1.00% in the sixth year and eliminated thereafter for Class B shares and 1.00% for Class C shares for the first year only. The “without sales charge” returns do not include the effect of sales charges. If they had, returns would be lower.
All results shown assume reinvestment of distributions. Class Z shares are sold at net asset value with no distribution and service (Rule 12b-1) fees. Class Z shares have limited eligibility and the investment minimum requirements may vary. Please see the fund’s prospectus for details. Performance for different share classes will vary based on differences in sales charges and fees associated with each class.
Performance results reflect any fee waivers or reimbursements of fund expenses by the investment advisor and/or any of its affiliates. Absent these fee waivers or expense reimbursement arrangements, performance results would have been lower.
The table does not reflect the deduction of taxes that a shareholder may pay on fund distributions or the redemption of fund shares.
Class A, Class B and Class C are newer classes of shares. Class A performance information includes the performance of Class Z shares (the oldest existing share class) for periods prior to its inception. Class B and Class C performance information includes returns of Class A shares for the period from July 31, 2000 through July 15, 2002, and the returns of Class Z shares for periods prior thereto. These returns reflect differences in sales charges, but have not been restated to reflect any differences in expenses (such as distribution and service (Rule 12b-1) fees) between Class Z shares (or Class A shares) and the newer classes of shares. If differences in expenses had been reflected, the returns shown for periods prior to the inception of the newer classes of shares would have been lower, since the newer classes of shares are subject to a distribution and service (Rule 12b-1) fees. Class A shares were initially offered on July 31, 2000, Class B and Class C shares were initially offered July 15, 2002, and Class Z shares were initially offered on March 5, 1984.
4
Understanding Your Expenses – Columbia High Yield Municipal Fund
Estimating your actual expenses
To estimate the expenses that you paid over the period, first you will need your account balance at the end of the period:
| n | | For shareholders who receive their account statements from Columbia Management Services, Inc., your account balance is available online at www.columbiafunds.com or by calling Shareholder Services at 800.345.6611. |
| n | | For shareholders who receive their account statements from their brokerage firm, contact your brokerage firm to obtain your account balance. |
| | 1. | Divide your ending account balance by $1,000. For example, if an account balance was $8,600 at the end of the period, the result would be 8.6. | |
| | 2. | In the section of the table below titled “Expenses paid during the period,” locate the amount for your share class. You will find this number in the column labeled “Actual.” Multiply this number by the result from step 1. Your answer is an estimate of the expenses you paid on your account during the period. | |
If the value of your account falls below the minimum initial investment requirement applicable to you, your account generally will be subject to a $20 annual fee. This fee is not included in the accompanying table. If you are subject to the fee, keep it in mind when you are estimating the ongoing expenses of investing in the fund and when comparing the expenses of this fund with other funds.
As a fund shareholder, you incur two types of costs. There are transaction costs, which generally include sales charges on purchases and may include redemption fees or exchange fees. There are also ongoing costs, which generally include investment advisory fees, distribution and service (Rule 12b-1) fees and other fund expenses. The information on this page is intended to help you understand the ongoing costs of investing in the fund and to compare these costs with the ongoing costs of investing in other mutual funds.
Analyzing your fund’s expenses by share class
To illustrate these ongoing costs, we have provided an example and calculated the expenses paid by investors in each share class during the period. The information in the following table is based on an initial investment of $1,000, which is invested at the beginning of the reporting period and held for the entire period. Expense information is calculated two ways and each method provides you with different information. The amount listed in the “actual” column is calculated using the fund’s actual operating expenses and total return for the period. The amount listed in the “hypothetical” column for each share class assumes that the return each year is 5% before expenses and is calculated based on the fund’s actual operating expenses. You should not use the hypothetical account values and expenses to estimate either your actual account balance at the end of the period or the expenses you paid during this reporting period.
Compare with other funds
Since all mutual funds are required to include the same hypothetical calculations about expenses in shareholder reports, you can use this information to compare the ongoing costs of investing in the fund with other funds. To do so, compare the 5% hypothetical example with the 5% hypothetical examples that appear in the shareholder reports of other funds. As you compare hypothetical examples of other funds, it is important to note that hypothetical examples are meant to highlight the ongoing costs of investing in a fund and do not reflect any transaction costs, such as sales charges, redemption fees or exchange fees.
| | | | | | | | | | | | | | |
| | | Account value at the
beginning of the period ($) | | Account value at the end
of the period ($) | | Expenses paid during the
period ($) | | Fund’s annualized
expense ratio (%) |
| | | Actual | | Hypothetical | | Actual | | Hypothetical | | Actual | | Hypothetical | | Actual |
Class A | | 1,000.00 | | 1,000.00 | | 979.71 | | 1,020.14 | | 4.68 | | 4.77 | | 0.95 |
Class B | | 1,000.00 | | 1,000.00 | | 976.08 | | 1,016.41 | | 8.35 | | 8.52 | | 1.70 |
Class C | | 1,000.00 | | 1,000.00 | | 977.72 | | 1,017.16 | | 7.62 | | 7.77 | | 1.55 |
Class Z | | 1,000.00 | | 1,000.00 | | 980.71 | | 1,021.13 | | 3.69 | | 3.77 | | 0.75 |
Expenses paid during the period are equal to the annualized expense ratio for the share class, multiplied by the average account value over the period, then multiplied by the number of days in the fund’s most recent fiscal half-year and divided by 366.
Had the distributor not waived fees or reimbursed a portion of Class C expenses, Class C account value at the end of the period would have been reduced.
It is important to note that the expense amounts shown in the table are meant to highlight only ongoing costs of investing in the fund and do not reflect any transaction costs, such as sales charges, redemption fees or exchange fees. Therefore, the hypothetical examples provided may not help you determine the relative total costs of owning shares of different funds. If these transaction costs were included, your costs would have been higher.
5
Portfolio Manager’s Report – Columbia High Yield Municipal Fund
Performance data quoted represents past performance and current performance may be lower or higher. Past performance is no guarantee of future results. The investment return and principal value will fluctuate so that shares, when redeemed, may be worth more or less than the original cost. Please visit www.columbiafunds.com for daily and most recent month-end performance updates.
| | |
| 30-day SEC yields |
| |
as of 06/30/08 (%) | | |
Class A | | 4.59 |
Class B | | 4.06 |
Class C | | 4.21 |
Class Z | | 5.02 |
The 30-day SEC yields reflect the fund’s earning power, net of expenses, expressed as an annualized percentage of the public offering price per share at the end of the period.
| | |
| Taxable-equivalent SEC yields |
| |
as of 06/30/08 (%) | | |
Class A | | 7.06 |
Class B | | 6.25 |
Class C | | 6.48 |
Class Z | | 7.72 |
Taxable-equivalent SEC yields are based on the maximum effective 35.0% federal income tax rate. This tax rate does not reflect the phase out of exemptions or the reduction of otherwise allowable deductions that occur when adjusted gross income exceeds certain levels.
Portfolio Manager’s Report
For the 12-month period that ended June 30, 2008, the fund’s Class A shares returned negative 4.39% without sales charge. The fund’s benchmark, the Lehman Brothers Municipal Bond Index, returned 3.23% for the same period.1 The fund outperformed its peer group, the Lipper High Yield Municipal Debt Funds Classification, which had an average return of negative 6.14%.2 We believe that the fund had more exposure than the average fund in its peer group to bonds with higher credit quality, which aided performance. The fund’s benchmark consists of even higher quality bonds, which gave it an advantage as investors sought shelter in quality over the 12 months covered by this report.
Refinancings, shorter-maturity bonds aided performance
Despite a weak environment for high-yield municipal bonds, a number of the fund’s holdings performed well during the period. Greystone Midwest, a pool of several high-yield tax-exempt bonds, was refinanced during the period and enjoyed a price increase of approximately 13% when the security was sold at the end of November. In more recent months, the fund benefited from holding bonds that were pre-refunded. When a bond is pre-refunded, the issuer floats a second bond. The proceeds from the sale of the second bond are typically invested in Treasury securities that are used to pay off the first bond issue at its call date. Bond issuers typically prerefund bonds during periods of low interest rates in order to lower their interest costs.
Finally, having relatively less exposure to airline and tobacco bonds helped the fund. These bonds underperformed as higher oil prices and a weaker economy hurt the airlines, while changes in some of the payments from tobacco companies hurt tobacco bonds. States, counties and cities issued bonds whose payment is tied to expected revenues under a 1998 settlement with tobacco companies. Payments from the tobacco companies, which are used to pay the bonds, have decreased.
Transportation, hotel and housing bonds detract from performance
The fund’s performance was hurt by its holdings of bonds issued by the Las Vegas Monorail, a transportation system in that city. The bonds declined in value when the authority had to use money in its reserve fund to meet its debt service payment in January. Ridership has not been as strong as had been forecast. We reduced the fund’s holdings in the Monorail bonds during the period. Also, several hotel bonds underperformed based on increased concern about the effects of a weaker economy on tourism and business travel. Earlier in the period, fund holdings that were exposed to or relied on the real estate market were the weakest performers. In particular, continuing care retirement centers, which often depend on the ability of retirees to sell
1 | The Lehman Brothers Municipal Bond Index is considered representative of the broad market for investment-grade, tax-exempt bonds with a maturity of at least one year. Indices are not investments, do not incur fees or expenses and are not professionally managed. It is not possible to invest directly in an index. Securities in the fund may not match those in an index. |
2 | Lipper Inc., a widely respected data provider in the industry, calculates an average total return (assuming reinvestment of distributions) for mutual funds with investment objectives similar to those of the fund. Lipper makes no adjustment for the effect of sales loads. |
6
Portfolio Manager’s Report (continued) – Columbia High Yield Municipal Fund
| | |
| Top 10 holdings |
| |
as of 06/30/08 (%) | | |
FL Tampa Bay Water Utility Systems | | 2.2 |
NV Clark County Industrial Development Authority | | 1.2 |
WA Port of Seattle | | 1.1 |
NH Business Finance Authority | | 0.9 |
TX Matagorda County Navigation District No. 1 | | 0.9 |
CO Department of Transportation | | 0.9 |
NY Nassau County Industrial Development Agency | | 0.8 |
CA Communities Development Authority | | 0.7 |
GA Rockdale County Development Authority | | 0.7 |
LA Public Facilities Authority | | 0.6 |
| | |
| Quality breakdown |
| |
as of 06/30/08 (%) | | |
AAA | | 10.9 |
AA | | 10.6 |
A | | 10.0 |
BBB | | 23.3 |
BB | | 3.9 |
B | | 1.4 |
CCC | | 0.2 |
CC | | 0.2 |
Not Rated | | 34.5 |
Cash & equivalent | | 5.0 |
| | |
| Maturity breakdown |
as of 06/30/08 (%) | | |
0-1 year | | 1.3 |
1-3 years | | 6.0 |
3-5 years | | 6.7 |
5-7 years | | 2.1 |
7-10 years | | 4.6 |
10-15 years | | 10.1 |
15-20 years | | 18.5 |
20-25 years | | 13.9 |
25 years and over | | 31.8 |
Cash & equivalent | | 5.0 |
The Fund is actively managed and the composition of its portfolio will change over time. Top 10 holdings, quality and maturity breakdowns are calculated as a percentage of net assets. Ratings shown in the quality breakdown represent the rating assigned to a particular bond by one of the following nationally-recognized rating agencies: Standard & Poor’s, a division of McGraw-Hill Companies, Inc., Moody’s Investors Service, Inc. or Fitch Ratings Ltd. Ratings are relative and subjective and are not absolute standards of quality. The Fund’s credit quality does not remove the market risk.
their homes, underperformed the market. In addition, bonds issued to pay for roads, lighting and other infrastructure for new housing developments suffered as demand for new homes dried up.
Looking Ahead
Market participants appear to be balanced between believing we are either heading into an inflationary period or into a recession that will wring inflation out of the economy, and the Federal Reserve Board is walking a fine line between stimulating the economy through lower federal funds rates and reducing the risks of inflation by raising rates. Uncertainty about when the credit crunch, fueled by mortgage-related writedowns, will end also weighs on investors. We are optimistic that more normal credit market conditions will return but are also somewhat concerned about the potential for higher inflation (and higher interest rates). As a result, we plan to maintain the portfolio’s broad diversification to limit exposure to any one sector or geographic area, and we plan to continue to look for opportunities to buy bonds that have fallen out of favor due to the current level of fear in the market.
Portfolio holdings and characteristics are subject to change periodically and may not be representative of current holdings and characteristics. The outlook for the fund may differ from that presented for other Columbia Funds.
Tax-exempt investing offers current tax-exempt income, but it also involves special risks. The value of the fund will be affected by interest rate changes and the creditworthiness of issues held in the fund. When interest rates go up, bond prices generally drop and vice versa. Interest income from certain tax-exempt bonds may be subject to certain state and local taxes and, if applicable, the alternative minimum tax. Capital gains are not exempt from income taxes.
Investments in high-yield or “junk” bonds offer the potential for higher income than investments in investment-grade bonds, but they also have a higher degree of risk. Changes in economic conditions or other circumstances may adversely affect a high-yield bond issuer’s ability to make timely principal and interest payments.
7
Investment Portfolio – Columbia High Yield Municipal Fund
June 30, 2008
Municipal Bonds – 92.7%
| | | | | | |
| | | | | Par ($) | | Value ($) |
| Education – 3.9% | | | | | | |
| Education – 1.9% | | | | | | |
| CA Municipal Finance Authority | | Biola University, Series 2008,
5.875% 10/01/34 | | 1,500,000 | | 1,509,240 |
| | | |
| CA Statewide Communities Development Authority | | San Francisco Art Institute, Series 2002,
7.375% 04/01/32 | | 500,000 | | 492,490 |
| | | |
| FL Broward County Educational Facilities Authority | | Nova Southeastern University, Series 2004,
5.625% 04/01/34 | | 925,000 | | 909,469 |
| | | |
| NC Capital Facilities Finance Agency | | Meredith College, Series 2008,
6.000% 06/01/31 | | 2,000,000 | | 2,037,280 |
| | | |
| OR Forest Grove Student Housing | | Oak Tree Foundation, Series 2007,
5.500% 03/01/37 | | 3,500,000 | | 3,084,235 |
| | | |
| PA Higher Education Facilities Authority | | Edinboro University, Series 2008
5.875% 07/01/38 | | 2,200,000 | | 2,129,292 |
| | Philadelphia University, Series 2004 A,
5.125% 06/01/25 | | 1,100,000 | | 1,057,243 |
| | | |
| VT Education & Health Buildings Agency | | Vermont Law School Project, Series 2003 A,
5.500% 01/01/33 | | 500,000 | | 462,695 |
| | | |
| WV University | | Series 2000 A,
Insured: AMBAC: | | | | |
| | (a) 04/01/19 | | 1,250,000 | | 738,713 |
| | (a) 04/01/25 | | 2,750,000 | | 1,133,688 |
| | | | | | |
| | Education Total | | | | 13,554,345 |
| | | | | | |
| Prep School – 1.0% | | | | | | |
| CA Statewide Communities Development Authority | | Crossroads School for Arts & Sciences, Series 1998,
6.000% 08/01/28(b) | | 940,000 | | 947,802 |
| | | |
| IL Finance Authority | | Chicago Charter School Foundation, Series 2007,
5.000% 12/01/36 | | 1,750,000 | | 1,430,992 |
| | | |
| KY Louisville & Jefferson County Metropolitan Government | | Assumption High School, Inc., Series 2006,
5.000% 10/01/35 | | 1,500,000 | | 1,368,990 |
See Accompanying Notes to Financial Statements.
8
Columbia High Yield Municipal Fund
June 30, 2008
Municipal Bonds (continued)
| | | | | | |
| | | | | Par ($) | | Value ($) |
| Education (continued) | | | | | | |
| Prep School (continued) | | | | | | |
| MA Health & Educational Facilities Authority | | Learning Center for Deaf Children: Series 1999 C,
6.100% 07/01/19 | | 1,000,000 | | 1,000,810 |
| | | |
| MI Conner Creek Academy | | Series 2007,
5.000% 11/01/26 | | 2,540,000 | | 2,144,725 |
| | | |
| MI Summit Academy North | | Series 2005,
5.500% 11/01/35 | | 750,000 | | 638,603 |
| | | | | | |
| | Prep School Total | | | | 7,531,922 |
| | | | | | |
| Student Loan – 1.0% | | | | | | |
| CT Higher Education Supplemental Loan Authority | | Family Education Loan Program, Series 2005 A, AMT,
Insured: MBIA
4.375% 11/15/21 | | 1,125,000 | | 1,042,436 |
| | | |
| NE Nebhelp, Inc. | | Series 1993 A-6, AMT,
Insured: MBIA
6.450% 06/01/18 | | 4,000,000 | | 4,163,280 |
| | | |
| NM Educational Assistance Foundation | | Series 1996 A-2, AMT,
6.650% 11/01/25 | | 1,915,000 | | 1,965,288 |
| | | | | | |
| | Student Loan Total | | | | 7,171,004 |
| | | | | | |
| Education Total | | | | | | 28,257,271 |
| | | | | | |
| Health Care – 31.8% | | | | | | |
| Continuing Care Retirement – 16.1% | | | | |
| CA La Verne | | Brethren Hillcrest Homes, Series 2003 B,
6.625% 02/15/25 | | 685,000 | | 696,460 |
| | | |
| CO Health Facilities Authority | | Christian Living Communities, Series 2006 A:
5.750% 01/01/26 | | 500,000 | | 465,585 |
| | 5.750% 01/01/37 | | 1,500,000 | | 1,328,460 |
| | | |
| | Covenant Retirement Communities, Inc., Series 2005,
5.000% 12/01/35 | | 2,900,000 | | 2,397,604 |
| | | |
| CT Development Authority | | Elim Park Baptist Home, Inc., Series 2003,
5.850% 12/01/33 | | 660,000 | | 661,907 |
| | | |
| FL City of Lakeland | | Series 2008: | | | | |
| | 6.240% 01/01/28 | | 675,000 | | 670,491 |
| | 6.375% 01/01/43 | | 2,250,000 | | 2,222,167 |
See Accompanying Notes to Financial Statements.
9
Columbia High Yield Municipal Fund
June 30, 2008
Municipal Bonds (continued)
| | | | | | |
| | | | | Par ($) | | Value ($) |
| Health Care (continued) | | | | | | |
| Continuing Care Retirement (continued) | | | | |
| FL Lee County Industrial Development Authority | | Shell Point Village, Series 2007,
5.000% 11/15/29 | | 4,000,000 | | 3,362,960 |
| | | |
| FL Orange County Health Facilities Authority | | Orlando Lutheran: Series 2005,
5.700% 07/01/26 | | 1,000,000 | | 906,020 |
| | Series 2007: | | | | |
| | 5.500% 07/01/32 | | 350,000 | | 296,499 |
| | 5.500% 07/01/38 | | 1,750,000 | | 1,450,838 |
| | | |
| FL Palm Beach County Health Facilities Authority | | Abbey Delray South, Series 2003,
5.350% 10/01/14 | | 1,250,000 | | 1,250,338 |
| | | |
| FL Sarasota County Health Facility Authority | | Series 2007,
5.500% 01/01/32 | | 3,000,000 | | 2,611,890 |
| | | |
| FL St. John’s County Industrial Development Authority | | Glenmoor at St. John’s, Inc., Series 2006 A,
5.375% 01/01/40 | | 4,275,000 | | 3,394,863 |
| | Ponte Vedra, Inc., Series 2007,
5.000% 02/15/27 | | 2,765,000 | | 2,460,048 |
| | | |
| GA Fulton County | | Canterbury Court, Series 2004 A,
6.125% 02/15/34 | | 1,000,000 | | 940,410 |
| | Lenbrook, Series 2006 A,
5.000% 07/01/29 | | 3,000,000 | | 2,426,730 |
| | | |
| GA Savannah Economic Development Authority | | Marshes of Skidaway,
Series 2003 A: | | | | |
| | 7.400% 01/01/24 | | 500,000 | | 512,675 |
| | 7.400% 01/01/34 | | 3,000,000 | | 3,027,360 |
| | | |
| IA Finance Authority | | Deerfield Retirement Community, Inc., Series 2007 A,
5.500% 11/15/27 | | 1,135,000 | | 904,947 |
| | | |
| IL Finance Authority | | Lutheran Senior Services, Series 2006,
5.125% 02/01/26 | | 2,000,000 | | 1,935,740 |
| | Sedgebrook, Inc., Series 2007 A,
6.000% 11/15/37 | | 5,000,000 | | 4,534,800 |
See Accompanying Notes to Financial Statements.
10
Columbia High Yield Municipal Fund
June 30, 2008
Municipal Bonds (continued)
| | | | | | |
| | | | | Par ($) | | Value ($) |
| Health Care (continued) | | | | | | |
| Continuing Care Retirement (continued) | | | | |
| | Tabor Hills Supportive Living, Series 2006,
5.250% 11/15/36 | | 2,000,000 | | 1,723,860 |
| | Washington & Jane Smith Community: Series 2003 A,
7.000% 11/15/32 | | 1,000,000 | | 1,005,640 |
| | Series 2005 A,
6.250% 11/15/35 | | 2,750,000 | | 2,546,967 |
| | | |
| IN Health & Educational Facilities Financing Authority | | Baptist Homes of Indiana, Inc., Series 2005,
5.250% 11/15/35 | | 2,750,000 | | 2,612,142 |
| | | |
| KS Lenexa | | Lakeview Village, Inc., Series 2007,
5.500% 05/15/39 | | 2,250,000 | | 1,904,625 |
| | | |
| KS Manhattan | | Manhattan Health Care Facility, Series 2007 A,
5.000% 05/15/29 | | 2,680,000 | | 2,210,839 |
| | | |
| MA Boston Industrial Development Financing Authority | | Springhouse, Inc., Series 1998,
5.875% 07/01/20 | | 385,000 | | 380,599 |
| | | |
| MA Development Finance Agency | | Berkshire Retirement Community, Inc., Series 1999,
5.625% 07/01/29 | | 1,250,000 | | 1,190,863 |
| | Linden Ponds, Inc., Series 2007 A,
5.750% 11/15/42 | | 2,625,000 | | 2,232,772 |
| | Loomis House, Inc.: Series 1999 A,
5.625% 07/01/15 | | 650,000 | | 658,307 |
| | Series 2002 A,
6.900% 03/01/32 | | 220,000 | | 229,159 |
| | | |
| MD Howard County | | Columbia Vantage House Corp.: Series 2007 A,
5.250% 04/01/33 | | 1,990,000 | | 1,592,776 |
| | Series 2007 B,
5.250% 04/01/37 | | 1,500,000 | | 1,173,675 |
| | | |
| MD Westminster Economic Development Authority | | Carroll Lutheran Village, Inc., Series 2004 A,
6.250% 05/01/34 | | 1,750,000 | | 1,684,812 |
| | | |
| MI Kentwood Economic Development Corp. | | Holland Home, Series 2006 A,
5.375% 11/15/36 | | 2,500,000 | | 2,198,875 |
See Accompanying Notes to Financial Statements.
11
Columbia High Yield Municipal Fund
June 30, 2008
Municipal Bonds (continued)
| | | | | | |
| | | | | Par ($) | | Value ($) |
| Health Care (continued) | | | | | | |
| Continuing Care Retirement (continued) | | | | |
| MI Meridian Economic Development Corp. | | Burcham Hills Retirement Center II, Series 2007 A-1,
5.250% 07/01/26 | | 1,045,000 | | 937,198 |
| | | |
| MN Columbia Heights | | Crest View Corp., | | | | |
| | Series 2007 A:
5.550% 07/01/27 | | 1,000,000 | | 910,390 |
| | 5.700% 07/01/42 | | 2,000,000 | | 1,754,840 |
| | | |
| MO Health & Educational Facilities Authority | | Lutheran Senior Services, Series 2007 A,
4.875% 02/01/27 | | 3,000,000 | | 2,671,050 |
| | | |
| MO St. Louis Industrial Development Authority | | St. Andrews Resources for Seniors, Series 2007 A:
6.250% 12/01/26 | | 2,000,000 | | 1,923,820 |
| �� | 6.375% 12/01/41 | | 3,000,000 | | 2,776,890 |
| | | |
| MT Facility Finance Authority | | St. John’s Lutheran Ministries, Inc., Series 2006 A,
6.125% 05/15/36 | | 1,000,000 | | 920,230 |
| | | |
| NH Higher Educational & Health Facilities Authority | | Rivermead at Peterborough, Series 1998:
5.625% 07/01/18 | | 500,000 | | 496,795 |
| | 5.750% 07/01/28 | | 1,665,000 | | 1,505,676 |
| | | |
| NJ Economic Development Authority | | Lions Gate, Series 2005 A:
5.750% 01/01/25 | | 400,000 | | 373,360 |
| | 5.875% 01/01/37 | | 1,330,000 | | 1,188,182 |
| | | |
| | Seabrook Village, Inc., Series 2006,
5.250% 11/15/36 | | 2,700,000 | | 2,229,093 |
| | | |
| NY East Rochester Housing Authority | | Woodland Village Project, Series 2006,
5.500% 08/01/33 | | 1,700,000 | | 1,457,393 |
| | | |
| NY Nassau County Industrial Development Agency | | Amsterdam at Harborside, Series 2007 A,
6.700% 01/01/43 | | 6,000,000 | | 5,952,060 |
| | | |
| PA Bucks County Industrial Development Authority | | Ann’s Choice, Inc., Series 2005 A,
6.250% 01/01/35 | | 1,750,000 | | 1,719,322 |
| | | |
| PA Chartiers Valley Industrial & Commercial Development Authority | | Asbury Health Center, Series 1999,
6.375% 12/01/24 | | 750,000 | | 748,815 |
See Accompanying Notes to Financial Statements.
12
Columbia High Yield Municipal Fund
June 30, 2008
Municipal Bonds (continued)
| | | | | | |
| | | | | Par ($) | | Value ($) |
| Health Care (continued) | | | | | | |
| Continuing Care Retirement (continued) | | | | |
| | Friendship Village of South Hills, Series 2003 A,
5.750% 08/15/20 | | 1,000,000 | | 1,004,880 |
| | | |
| PA Delaware County Authority | | Dunwoody Village, Series 2003 A,
5.375% 04/01/17 | | 750,000 | | 752,895 |
| | | |
| PA Lancaster County Hospital Authority | | Brethren Village, Series 2008 A:
6.375% 07/01/30 | | 1,000,000 | | 969,570 |
| | 6.500% 07/01/40 | | 1,500,000 | | 1,451,085 |
| | | |
| PA Montgomery County Industrial Development Authority | | Whitemarsh Continuing Care Retirement Community: Series 2005:
6.125% 02/01/28 | | 1,400,000 | | 1,278,732 |
| | 6.250% 02/01/35 | | 1,350,000 | | 1,219,523 |
| | Series 2008,
7.000% 02/01/36 | | 2,000,000 | | 1,973,400 |
| | | |
| SC Jobs Economic Development Authority | | Lutheran Homes, Series 2007:
5.375% 05/01/21 | | 1,000,000 | | 920,170 |
| | 5.500% 05/01/28 | | 1,100,000 | | 962,753 |
| | Wesley Commons, Series 2006,
5.300% 10/01/36 | | 2,500,000 | | 2,074,950 |
| | | |
| TN Johnson City Health & Educational Facilities Authority | | Appalachian Christian Village, Series 2004 A,
6.250% 02/15/32 | | 250,000 | | 231,170 |
| TN Metropolitan Government Nashville & Davidson County | | Blakeford at Green Hills, Series 1998,
5.650% 07/01/24 | | 1,825,000 | | 1,660,312 |
| | | |
| TN Shelby County Health Educational & Housing Facilities Board | | Germantown Village: Series 2003 A,
7.250% 12/01/34 | | 675,000 | | 637,227 |
| | Series 2006,
6.250% 12/01/34 | | 500,000 | | 411,380 |
| | Trezevant Manor, Series 2006 A,
5.750% 09/01/37 | | 1,000,000 | | 920,680 |
| | | |
| TX Abilene Health Facilities Development Corp. | | Sears Methodist Retirement Center: Series 1998 A,
5.900% 11/15/25 | | 1,350,000 | | 1,267,623 |
| | Series 2003 A,
7.000% 11/15/33 | | 800,000 | | 806,840 |
See Accompanying Notes to Financial Statements.
13
Columbia High Yield Municipal Fund
June 30, 2008
Municipal Bonds (continued)
| | | | | | |
| | | | | Par ($) | | Value ($) |
| Health Care (continued) | | | | | | |
| Continuing Care Retirement (continued) | | | | |
| TX HFDC of Central Texas, Inc. | | Legacy at Willow Bend, Series 2006 A,
5.750% 11/01/36 | | 2,100,000 | | 1,749,174 |
| | Village at Gleannloch Farms, Series 2006 A,
5.500% 02/15/37 | | 1,850,000 | | 1,481,980 |
| | | |
| VA Suffolk Industrial Development Authority | | Lake Prince Center, Series 2006,
5.150% 09/01/24 | | 750,000 | | 688,193 |
| | | |
| WI Health & Educational Facilities Authority | | Clement Manor, Series 1998,
5.750% 08/15/24 | | 2,200,000 | | 2,091,232 |
| | Milwaukee Catholic Home, Series 2006,
5.000% 07/01/26 | | 750,000 | | 687,428 |
| | Three Pillars Senior Living Communities: Series 2003,
5.600% 08/15/23 | | 790,000 | | 784,217 |
| | Series 2004 A,
5.500% 08/15/34 | | 870,000 | | 815,077 |
| | United Lutheran Program for the Aging, Series 1998,
5.700% 03/01/28 | | 750,000 | | 658,973 |
| | | | | | |
| | Continuing Care Retirement Total | | | | 116,869,281 |
| | | |
| Health Services – 0.4% | | | | | | |
| CO Health Facilities Authority | | National Jewish Medical & Research Center, Series 1998,
5.375% 01/01/23 | | 1,080,000 | | 1,043,604 |
| | | |
| MA Development Finance Agency | | Boston Biomedical Research Institute, | | | | |
| | Series 1999: | | | | |
| | 5.650% 02/01/19 | | 370,000 | | 356,491 |
| | 5.750% 02/01/29 | | 550,000 | | 517,754 |
| | | |
| MN Minneapolis & St. Paul Housing & Redevelopment Authority | | HealthPartners: Series 2003,
5.875% 12/01/29 | | 400,000 | | 400,876 |
| | Series 2006,
5.250% 05/15/23 | | 1,000,000 | | 967,860 |
| | | | | | |
| | Health Services Total | | | | 3,286,585 |
| | | |
| Hospitals – 12.4% | | | | | | |
| AZ Health Facilities Authority | | Phoenix Memorial Hospital, Series 1991,
8.125% 06/01/12(c) | | 1,849,099 | | 18,491 |
See Accompanying Notes to Financial Statements.
14
Columbia High Yield Municipal Fund
June 30, 2008
Municipal Bonds (continued)
| | | | | | |
| | | | | Par ($) | | Value ($) |
| Health Care (continued) | | | | | | |
| Hospitals (continued) | | | | |
| AZ Yavapai County Industrial Development Authority | | Yavapai Community Hospital Association, Series 2008 B,
5.625% 08/01/37 | | 3,500,000 | | 3,385,585 |
| | | |
| CA ABAG Finance Authority for Nonprofit Corps. | | San Diego Hospital Association, Series 2003 C,
5.375% 03/01/21 | | 500,000 | | 500,325 |
| | | |
| CA Communities Development Authority | | St. Joseph Health Systems, Series 2000, Insured: MBIA 5.125% 07/01/24 | | 5,000,000 | | 5,017,450 |
| | | |
| CA Health Facilities Financing Authority | | Catholic Health Care West, Series 2004 G,
5.250% 07/01/23 | | 500,000 | | 503,835 |
| | | |
| CA Turlock | | Emanuel Medical Center, Inc.: | | | | |
| | Series 2004,
5.375% 10/15/34 | | 2,000,000 | | 1,796,640 |
| | Series 2007 B,
5.125% 10/15/37 | | 4,750,000 | | 4,024,295 |
| | | |
| CO Health Facilities Authority | | Vail Valley Medical Center, Series 2004,
5.000% 01/15/20 | | 1,000,000 | | 976,850 |
| | | |
| FL Hillsborough County Industrial Development Authority | | Tampa General Hospital, Series 2003 B,
5.250% 10/01/34 | | 1,000,000 | | 953,390 |
| | | |
| FL Miami Health Facilities Authority | | Catholic Health East, Series 2003 B,
5.125% 11/15/24 | | 1,000,000 | | 995,010 |
| | | |
| FL Orange County Health Facilities Authority | | Orlando Regional Healthcare System, Series 1999 E,
6.000% 10/01/26 | | 855,000 | | 871,647 |
| | Series 2008 C, 5.250% 10/01/35 | | 4,000,000 | | 3,886,760 |
| | | |
| FL South Lake County Hospital District | | South Lake Hospital, Inc.,
Series 2003: | | | | |
| | 6.375% 10/01/28 | | 750,000 | | 767,843 |
| | 6.375% 10/01/34 | | 500,000 | | 505,595 |
| | | |
| FL West Orange Health Care District | | Series 2001 A,
5.650% 02/01/22 | | 1,450,000 | | 1,473,011 |
See Accompanying Notes to Financial Statements.
15
Columbia High Yield Municipal Fund
June 30, 2008
Municipal Bonds (continued)
| | | | | | |
| | | | | Par ($) | | Value ($) |
| Health Care (continued) | | | | | | |
| Hospitals (continued) | | | | |
| IL Southwestern Development Authority | | Anderson Hospital: | | | | |
| | Series 1999: | | | | |
| | 5.500% 08/15/20 | | 500,000 | | 500,535 |
| | 5.625% 08/15/29 | | 250,000 | | 244,663 |
| | Series 2006,
5.125% 08/15/26 | | 1,245,000 | | 1,168,681 |
| | | |
| IN Health & Educational Facility Financing Authority | | Clarian Health, Series 2006 A,
5.000% 02/15/39 | | 1,500,000 | | 1,358,655 |
| | Schneck Memorial, Series 2006 A,
5.250% 02/15/30 | | 1,000,000 | | 974,710 |
| | | |
| IN Health Facility Financing Authority | | Community Foundation of Northwest Indiana, Inc., Series 2004 A,
6.000% 03/01/34 | | 850,000 | | 830,348 |
| | | |
| LA Public Facilities Authority | | Ochsner Clinic Foundation, Series 2007 A,
5.250% 05/15/38 | | 5,000,000 | | 4,644,800 |
| | Touro Infirmary,
Series 1999 A: | | | | |
| | 5.500% 08/15/19 | | 510,000 | | 486,295 |
| | 5.625% 08/15/29 | | 240,000 | | 217,543 |
| | | |
| MA Health & Educational Facilities Authority | | Caregroup, Inc., Series 2008 E-2,
5.375% 07/01/25 | | 2,000,000 | | 2,006,900 |
| | Jordan Hospital: | | | | |
| | Series 1998 D, | | | | |
| | 5.250% 10/01/18 | | 600,000 | | 594,798 |
| | Series 2003 E, | | | | |
| | 6.750% 10/01/33 | | 750,000 | | 764,108 |
| | Milford-Whitinsville Regional Hospital: | | | | |
| | Series 1998 C, | | | | |
| | 5.750% 07/15/13 | | 610,000 | | 619,113 |
| | Series 2007, | | | | |
| | 5.000% 07/15/32 | | 1,250,000 | | 1,059,638 |
| | | |
| MD Health & Higher Educational Facilities Authority | | Adventist Health Care, Series 2003 A:
5.000% 01/01/16 | | 400,000 | | 397,040 |
| | 5.750% 01/01/25 | | 600,000 | | 602,802 |
| | University of Maryland Medical System, | | | | |
| | Series 2005, | | | | |
| | Insured: AMBAC | | | | |
| | 5.500% 07/01/24 | | 2,100,000 | | 2,176,839 |
| | | |
| MI Dickinson County | | Dickinson County Health Care System, Series 1999,
5.800% 11/01/24 | | 1,000,000 | | 984,580 |
See Accompanying Notes to Financial Statements.
16
Columbia High Yield Municipal Fund
June 30, 2008
Municipal Bonds (continued)
| | | | | | |
| | | | | Par ($) | | Value ($) |
| Health Care (continued) | | | | | | |
| Hospitals (continued) | | | | |
| MI Hospital Finance Authority | | Detroit Medical Center, Series 1997 A,
Insured: AMBAC
5.500% 08/15/24 | | 3,000,000 | | 2,870,010 |
| | | |
| | Garden City Hospital, Series 2007,
5.000% 08/15/38 | | 2,250,000 | | 1,644,007 |
| | | |
| | Henry Ford Health, Series 2006 A,
5.000% 11/15/21 | | 1,000,000 | | 981,780 |
| | | |
| | McLaren Health Care Corp., Series 2005 C,
5.000% 08/01/35 | | 2,500,000 | | 2,321,575 |
| | | |
| MN St. Paul Housing & Redevelopment Authority | | HealthEast, Inc., Series 2005,
5.150% 11/15/20 | | 750,000 | | 729,240 |
| | | |
| MN Washington County Housing & Redevelopment Authority | | HealthEast, Inc., Series 1998,
5.250% 11/15/12 | | 1,100,000 | | 1,113,629 |
| | | |
| MO Cape Girardeau County | | Southeast Missouri Hospital Association, Series 2003,
5.000% 06/01/27 | | 3,750,000 | | 3,364,237 |
| | | |
| MO Health & Educational Facilities Authority | | Lake Regional Health Systems, Series 2003,
5.700% 02/15/34 | | 1,000,000 | | 985,350 |
| | | |
| MO Saline County Industrial Development Authority | | John Fitzgibbon Memorial Hospital, Series 2005,
5.625% 12/01/35 | | 2,750,000 | | 2,374,927 |
| | | |
| NC Medical Care Commission | | Stanly Memorial Hospital, Series 1999,
6.375% 10/01/29 | | 1,000,000 | | 1,021,630 |
| | | |
| NH Higher Educational & Health Facilities Authority | | Catholic Medical Center, Series 2002 A,
6.125% 07/01/32 | | 50,000 | | 50,764 |
| | The Memorial Hospital at North Conway, | | | | |
| | Series 2006, | | | | |
| | 5.250% 06/01/21 | | 1,000,000 | | 956,550 |
| | | |
| NJ Health Care Facilities Financing Authority | | Children’s Specialized Hospital, Series 2005 A,
5.000% 07/01/24 | | 745,000 | | 684,856 |
See Accompanying Notes to Financial Statements.
17
Columbia High Yield Municipal Fund
June 30, 2008
Municipal Bonds (continued)
| | | | | | |
| | | | | Par ($) | | Value ($) |
| Health Care (continued) | | | | | | |
| Hospitals (continued) | | | | |
| NM Farmington | | San Juan Medical Center, Series 2004 A,
5.000% 06/01/23 | | 500,000 | | 471,835 |
| | | |
| NY Dormitory Authority | | Mount Sinai Hospital: Series 2000,
5.500% 07/01/26 | | 225,000 | | 224,235 |
| | Series 2000 C, | | | | |
| | 5.500% 07/01/26 | | 2,275,000 | | 2,267,265 |
| | NYU Hospital Center, Series 2007 B,
5.625% 07/01/37 | | 2,000,000 | | 1,905,400 |
| | | |
| NY Monroe County Industrial Development Agency | | Highland Hospital, Series 2005,
5.000% 08/01/25 | | 1,115,000 | | 1,058,425 |
| | | |
| OH Lakewood Hospital Improvement District | | Lakewood Hospital Association, Series 2003,
5.500% 02/15/15 | | 1,250,000 | | 1,304,250 |
| | | |
| OH Miami County Hospital Facilities Authority | | Upper Valley Medical Center, Inc.,
5.250% 05/15/17 | | 1,000,000 | | 1,000,580 |
| | | |
| OH Sandusky County | | Memorial Hospital, Series 1998,
5.150% 01/01/10 | | 250,000 | | 253,788 |
| | | |
| OK Development Finance Authority | | Duncan Regional Hospital, Series 2003 A,
5.125% 12/01/23 | | 2,000,000 | | 1,963,340 |
| | | |
| OK Norman Regional Hospital Authority | | Series 2007,
5.000% 09/01/27 | | 2,000,000 | | 1,895,900 |
| | | |
| OK Stillwater Medical Center Authority | | Series 2005,
5.000% 05/15/17 | | 1,155,000 | | 1,152,482 |
| | | |
| PA Northampton County General Purpose Authority | | St. Lukes Hospital Bethlehem, Series 2008 A,
5.375% 08/15/28 | | 1,500,000 | | 1,470,090 |
| | | |
| SC Jobs-Economic Development Authority | | Bon Secours St. Frances Medical, Series 2002 B,
5.500% 11/15/23 | | 1,765,000 | | 1,779,191 |
| | | |
| TN Knox County Health, Educational & Housing Facilities Authority | | East Tennessee Hospital, Series 2003 B,
5.750% 07/01/33 | | 150,000 | | 146,886 |
See Accompanying Notes to Financial Statements.
18
Columbia High Yield Municipal Fund
June 30, 2008
Municipal Bonds (continued)
| | | | | | |
| | | | | Par ($) | | Value ($) |
| Health Care (continued) | | | | | | |
| Hospitals (continued) | | | | |
| TN Sullivan County Health Educational & Housing Facilities Board | | Wellmont Health System, | | | | |
| | Series 2006 C: | | | | |
| | 5.250% 09/01/26 | | 1,000,000 | | 944,000 |
| | 5.250% 09/01/36 | | 4,500,000 | | 4,043,475 |
| | | |
| WA Skagit County Public Hospital District No. 1 | | Series 2003,
6.000% 12/01/23 | | 1,000,000 | | 1,010,520 |
| | | |
| WI Health & Educational Facilities Authority | | Aurora Health Care, Inc., Series 2003,
6.400% 04/15/33 | | 700,000 | | 714,812 |
| | | |
| | Fort Health Care, Inc., Series 2004,
6.100% 05/01/34 | | 1,965,000 | | 1,946,647 |
| | | | | | |
| | Hospitals Total | | | | 89,960,451 |
Intermediate Care
Facilities – 0.6% | | | | | | |
| | | |
| IL Development Finance Authority | | Hoosier Care, Inc., Series 1999 A,
7.125% 06/01/34 | | 1,390,000 | | 1,318,568 |
| | | |
| IN Health Facilities Financing Authority | | Hoosier Care, Inc., Series 1999 A,
7.125% 06/01/34 | | 1,145,000 | | 1,086,158 |
| | | |
| LA Public Facilities Authority | | Progressive Health Care Providers, Inc., Series 1998,
6.375% 10/01/28 | | 2,000,000 | | 1,827,260 |
| | | | | | |
| | Intermediate Care Facilities Total | | | | 4,231,986 |
| | | |
| Nursing Homes – 2.3% | | | | | | |
| AK Juneau | | St. Ann’s Care Center, Inc., Series 1999,
6.875% 12/01/25 | | 1,615,000 | | 1,525,093 |
| | | |
| CO Health Facilities Authority | | Evangelical Lutheran Good Samaritan Foundation, Series 2005,
5.000% 06/01/35 | | 750,000 | | 674,348 |
| | | |
| CT Development Authority Health Facility | | Alzheimers Resources Center, Inc., Series 2007:
5.400% 08/15/21 | | 1,080,000 | | 962,021 |
| | 5.500% 08/15/27 | | 1,000,000 | | 852,490 |
| | | |
| IA Finance Authority | | Care Initiatives, Series 1998 B: | | | | |
| | 5.500% 07/01/08 | | 110,000 | | 110,000 |
| | 5.750% 07/01/18 | | 600,000 | | 582,708 |
| | 5.750% 07/01/28 | | 1,475,000 | | 1,317,381 |
See Accompanying Notes to Financial Statements.
19
Columbia High Yield Municipal Fund
June 30, 2008
Municipal Bonds – (continued)
| | | | | | |
| | | | | Par ($) | | Value ($) |
| Health Care (continued) | | | | | | |
| Nursing Homes (continued) | | | | |
| IA Marion Health Care Facilities | | AHF/Kentucky-Iowa, Inc., Series 2003,
6.500% 01/01/29(d)
(8.000% 01/01/09) | | 300,000 | | 327,084 |
| | | |
| KY Economic Development Finance Authority | | AHF/Kentucky-Iowa, Inc., Series 2003,
6.500% 01/01/29(d)
(8.000% 01/01/09) | | 920,000 | | 1,004,410 |
| | | |
| MA Development Finance Agency | | Alliance Health Care, Series 1999 A,
7.100% 07/01/32 | | 2,140,000 | | 2,077,726 |
| | | |
| MA Industrial Finance Agency | | GF/Massachusetts, Inc., Series 1994,
8.300% 07/01/23 | | 810,000 | | 750,084 |
| | | |
| MN Eveleth | | Arrowhead Senior Living Community, Series 2007,
5.200% 10/01/27 | | 1,375,000 | | 1,177,467 |
| | | |
| MN Sartell | | Foundation for Health Care: Series 1999 A,
6.625% 09/01/29 | | 2,000,000 | | 1,943,340 |
| | Series 2001 A,
8.000% 09/01/30 | | 1,000,000 | | 1,046,760 |
| | | |
| MN St. Paul Housing & Redevelopment Authority | | Sholom Home East, Inc., Series 2007 A,
5.050% 10/01/27 | | 1,000,000 | | 856,650 |
| | | |
| MO St. Louis County Industrial Development Authority | | Ranken Jordan, Series 2007,
5.000% 11/15/35 | | 1,300,000 | | 1,057,667 |
| | | |
| NJ Economic Development Authority | | Seashore Gardens, Series 2006,
5.300% 11/01/26 | | 500,000 | | 432,380 |
| | | |
| PA Chester County Industrial Development Authority | | Pennsylvania Nursing Home, Series 2002,
8.500% 05/01/32 | | 375,000 | | 378,195 |
| | | |
| PA Delaware County Industrial Development Authority | | Care Institute-Main Line LLC, Series 2005,
9.000% 08/01/31(e) | | 50,000 | | 36,028 |
| | | | | | |
| | Nursing Homes Total | | | | 17,111,832 |
| | | | | | |
| Health Care Total | | | | | | 231,460,135 |
See Accompanying Notes to Financial Statements.
20
Columbia High Yield Municipal Fund
June 30, 2008
Municipal Bonds – (continued)
| | | | | | |
| | | | | Par ($) | | Value ($) |
| Housing – 7.8% | | | | | | |
| Assisted Living/Senior – 2.2% | | | | | | |
| DE Kent County | | Heritage at Dover, Series 1999, AMT,
7.625% 01/01/30 | | 2,505,000 | | 2,203,498 |
| | | |
| FL St. Johns County Industrial Development Authority | | Bayview Assisted Living, Series 2007 A:
5.200% 10/01/27 | | 2,260,000 | | 1,870,602 |
| | 5.250% 10/01/41 | | 1,400,000 | | 1,081,010 |
| | | |
| GA Columbus Housing Authority | | The Gardens at Calvary, Series 1999,
7.000% 11/15/29 | | 2,000,000 | | 1,817,320 |
| | | |
| GA Jefferson Development Authority | | Sumner Smith Facility, Series 2007 A, AMT,
5.875% 08/01/38 | | 2,360,000 | | 1,964,794 |
| | | |
| MA Development Finance Agency | | VOA Concord Assisted Living, Inc., Series 2007,
5.200% 11/01/41 | | 1,000,000 | | 775,720 |
| | | |
| MN Rochester | | Madonna Meadows, Series 2007 A,
5.200% 10/01/23 | | 830,000 | | 758,769 |
| | | |
| MN Roseville | | Care Institute, Inc., Series 1993,
7.750% 11/01/23 | | 1,270,000 | | 1,089,470 |
| | | |
| MN St. Paul Housing & Redevelopment Authority | | Marian Center, Series 2007 A,
5.300% 11/01/30 | | 1,000,000 | | 853,280 |
| | | |
| NY Huntington Housing Authority | | Gurwin Jewish Senior Center, Series 1999 A:
5.875% 05/01/19 | | 1,900,000 | | 1,828,465 |
| | 6.000% 05/01/29 | | 625,000 | | 573,563 |
| | | |
| NY Mount Vernon Industrial Development Agency | | Wartburg Senior Housing, Inc., Series 1999,
6.200% 06/01/29 | | 1,000,000 | | 925,110 |
| | | |
| NY Suffolk County Industrial Development Agency | | Gurwin Jewish Phase II, Series 2004,
6.700% 05/01/39 | | 500,000 | | 499,940 |
| | | | | | |
| | Assisted Living/Senior Total | | | | 16,241,541 |
| | | |
| Multi-Family – 3.7% | | | | | | |
| DC Housing Finance Agency | | FDS Residential II LP, Series 2004, AMT,
Insured: FHA
4.850% 06/01/35 | | 1,460,000 | | 1,311,591 |
See Accompanying Notes to Financial Statements.
21
Columbia High Yield Municipal Fund
June 30, 2008
Municipal Bonds – (continued)
| | | | | | |
| | | | | Par ($) | | Value ($) |
| Housing (continued) | | | | | | |
| Multi-Family (continued) | | | | | | |
| DE Wilmington | | Electra Arms Senior Association, Series 1998, AMT,
6.250% 06/01/28 | | 855,000 | | 766,388 |
| | | |
| FL Broward County Housing Finance Authority | | Chaves Lake Apartments Ltd., Series 2000 A, AMT,
7.500% 07/01/40 | | 1,500,000 | | 1,525,215 |
| | | |
| FL Capital Trust Agency | | Atlantic Housing Foundation, Inc., Series 2005 C,
5.875% 01/01/28 | | 1,500,000 | | 1,385,550 |
| | | |
| FL Clay County Housing Finance Authority | | Breckenridge Commons Ltd., Series 2000 A, AMT,
7.450% 07/01/40 | | 1,340,000 | | 1,354,204 |
| | | |
| MA Housing Finance Agency | | Series 2005 E, AMT,
5.000% 12/01/28 | | 750,000 | | 706,058 |
| | | |
| MN Minneapolis Student Housing | | Riverton Community Housing, Inc., Series 2006 A,
5.700% 08/01/40 | | 1,600,000 | | 1,416,608 |
| | | |
| MN Washington County Housing & Redevelopment Authority | | Cottages of Aspen, Series 1992, AMT,
9.250% 06/01/22 | | 415,000 | | 415,166 |
| | | |
| MN White Bear Lake | | Birch Lake Townhomes, Series 1989 A,
9.750% 07/15/19 | | 750,000 | | 750,000 |
| | | |
| NC Durham Housing Authority | | Magnolia Pointe Apartments, Series 2005, AMT,
5.650% 02/01/38 | | 3,492,545 | | 3,068,620 |
| | | |
| NC Medical Care Commission | | ARC Project, Series 2004 A,
5.800% 10/01/34 | | 1,550,000 | | 1,491,301 |
| | | |
| NM Mortgage Finance Authority | | Series 2005 E, AMT,
Insured: FHA
4.800% 09/01/40 | | 1,200,000 | | 1,044,192 |
| | | |
| OH Montgomery County | | Heartland of Centerville LLC, Series 2005, AMT,
Insured: FHLMC
4.950% 11/01/35 | | 750,000 | | 716,558 |
See Accompanying Notes to Financial Statements.
22
Columbia High Yield Municipal Fund
June 30, 2008
Municipal Bonds (continued)
| | | | | | |
| | | | | Par ($) | | Value ($) |
| Housing (continued) | | | | | | |
| Multi-Family (continued) | | | | | | |
| OK County Finance Authority | | Sail Associates LLC, Series 2007, AMT,
LOC: Bank of the West
5.250% 12/01/41 | | 1,475,000 | | 1,433,110 |
| | | |
| OR Housing & Community Services Department | | Series 2005 A, AMT,
Insured: FHA
4.850% 07/01/35 | | 1,755,000 | | 1,576,446 |
| | | |
| Resolution Trust Corp. | | Pass-Through Certificates, Series 1993 A,
8.500% 12/01/16(f) | | 455,481 | | 448,740 |
| | | |
| TX El Paso County Housing Finance Corp. | | American Village Communities: Series 2000 C,
8.000% 12/01/32 | | 565,000 | | 558,378 |
| | Series 2000 D,
10.000% 12/01/32 | | 670,000 | | 673,645 |
| | | |
| VA Fairfax County Redevelopment & Housing Authority | | Cedar Ridge Project, Series 2007, AMT,
Insured: FHA
4.700% 04/01/27 | | 3,000,000 | | 2,761,350 |
| | | |
| WA Seattle Housing Authority | | High Rise Rehabilitation Phase I LP, Series 2005, AMT,
Insured: FSA
5.000% 11/01/25 | | 1,000,000 | | 959,610 |
| | | |
| WA Tacoma Housing Authority | | Redwood, Series 2005, AMT,
Guarantor: GNMA
5.050% 11/20/37 | | 3,000,000 | | 2,767,350 |
| | | | | | |
| | Multi-Family Total | | | | 27,130,080 |
| | | |
| Single-Family – 1.9% | | | | | | |
| CO Housing & Finance Authority | | Series 1995 D-1, AMT,
7.375% 06/01/26 | | 10,000 | | 10,354 |
| | Series 1997 A-2, AMT,
7.250% 05/01/27 | | 15,000 | | 15,228 |
| | | |
| FL Housing Finance Corp. | | Series 2006 1, AMT,
Guarantor: GNMA
4.850% 07/01/37 | | 1,885,000 | | 1,677,499 |
| | | |
| MA Housing Finance Agency | | Series 2006 122, AMT,
4.875% 12/01/37 | | 3,970,000 | | 3,578,161 |
| | | |
| MN Housing Finance Agency | | Series 2006 I, AMT,
5.000% 07/01/21 | | 1,350,000 | | 1,325,956 |
See Accompanying Notes to Financial Statements.
23
Columbia High Yield Municipal Fund
June 30, 2008
Municipal Bonds (continued)
| | | | | | |
| | | | | Par ($) | | Value ($) |
| Housing (continued) | | | | | | |
| Single-Family (continued) | | | | | | |
| MN Minneapolis St. Paul Housing Finance Board | | Series 2006, AMT,
Guarantor: GNMA
5.000% 12/01/38 | | 114,843 | | 105,574 |
| | | |
| RI Housing & Mortgage Finance Corp. | | Series 2005, AMT,
4.750% 10/01/30 | | 4,000,000 | | 3,607,800 |
| | | |
| TX Affordable Housing Corp. | | Series 2005 A, AMT,
Guarantor: GNMA
5.100% 09/01/39 | | 3,300,000 | | 3,033,723 |
| | | | | | |
| | Single-Family Total | | | | 13,354,295 |
| | | | | | |
| Housing Total | | | | | | 56,725,916 |
| | | | | | |
| Industrials – 5.2% | | | | | | |
| Food Products – 0.3% | | | | | | |
| MI Strategic Fund | | Imperial Sugar Co.: Series 1998 A,
6.250% 11/01/15 | | 1,000,000 | | 1,005,680 |
| | Series 1998 C, AMT,
6.550% 11/01/25 | | 1,500,000 | | 1,466,445 |
| | | | | | |
| | Food Products Total | | | | 2,472,125 |
| | | |
| Forest Products & Paper – 1.6% | | | | | | |
| AL Camden Industrial Development Board | | Weyerhaeuser Co., Series 2003 B, AMT,
6.375% 12/01/24 | | 275,000 | | 274,566 |
| | | |
| AL Courtland Industrial Development Board | | International Paper Co.: Series 2003 B, AMT,
6.250% 08/01/25 | | 2,000,000 | | 1,952,740 |
| | Series 2005 A,
5.200% 06/01/25 | | 1,000,000 | | 860,170 |
| | | |
| AL Phenix City Industrial Development Board | | Meadwestvaco Corp., Series 2002 A, AMT,
6.350% 05/15/35 | | 1,000,000 | | 934,220 |
| | | |
| AR Camden Environmental Improvement Authority | | International Paper Co., Series 2004 A, AMT,
5.000% 11/01/18 | | 250,000 | | 226,270 |
| | | |
| GA Rockdale County Development Authority | | Visy Paper, Inc., Series 2007 A, AMT,
6.125% 01/01/34 | | 5,000,000 | | 4,852,650 |
| | | |
| MS Lowndes County | | Weyerhaeuser Co.: Series 1992 A,
6.800% 04/01/22 | | 1,995,000 | | 2,091,239 |
See Accompanying Notes to Financial Statements.
24
Columbia High Yield Municipal Fund
June 30, 2008
Municipal Bonds (continued)
| | | | | | |
| | | | | Par ($) | | Value ($) |
| Industrials (continued) | | | | | | |
| Forest Products & Paper (continued) | | | | |
| | Series 1992 B,
6.700% 04/01/22 | | 230,000 | | 238,995 |
| | | |
| VA Bedford County Industrial Development Authority | | Nekoosa Packaging Corp., Series 1998, AMT,
5.600% 12/01/25 | | 400,000 | | 335,628 |
| | | | | | |
| | Forest Products & Paper Total | | | | 11,766,478 |
| | | | | | |
| Manufacturing – 0.4% | | | | | | |
| IL Will-Kankakee Regional Development Authority | | Flanders Corp., Series 1997, AMT,
6.500% 12/15/17 | | 655,000 | | 644,559 |
| | | |
| KS Wichita Airport Authority | | Cessna Citation Service Center, Series 2002 A, AMT,
6.250% 06/15/32 | | 1,875,000 | | 1,861,125 |
| | | | | | |
| | Manufacturing Total | | | | 2,505,684 |
| | | | | | |
| Metals & Mining – 0.3% | | | | | | |
| NV Department of Business & Industry | | Wheeling-Pittsburgh Steel Corp., Series 1999 A, AMT,
8.000% 09/01/14 (f) | | 345,000 | | 345,224 |
| | | |
| VA Greensville County Industrial Development Authority | | Wheeling-Pittsburgh Steel Corp., Series 1999 A, AMT,
7.000% 04/01/14 | | 1,675,000 | | 1,623,360 |
| | | | | | |
| | Metals & Mining Total | | | | 1,968,584 |
| | | | | | |
| Oil & Gas – 2.1% | | | | | | |
| NJ Middlesex County Pollution Control Authority | | Amerada Hess Corp., Series 2004,
6.050% 09/15/34 | | 285,000 | | 277,128 |
| | | |
| NV Clark County Industrial Development Authority | | Southwest Gas Corp.: Series 2003 E, AMT,
5.800% 03/01/38 | | 1,750,000 | | 1,766,187 |
| | Series 2005 A, AMT,
Insured: AMBAC
4.850% 10/01/35 (g) | | 10,000,000 | | 8,852,900 |
| | | |
| TX Gulf Coast Industrial Development Authority | | Citgo Petroleum, Series 1998, AMT,
8.000% 04/01/28 | | 875,000 | | 928,384 |
| | | |
| TX City Industrial Development Corp. | | Arco Pipeline Co., Inc., Series 1990,
7.375% 10/01/20 | | 2,000,000 | | 2,501,740 |
| | | |
| VI Virgin Islands Public Finance Authority | | Hovensa LLC, Series 2003, AMT,
6.125% 07/01/22 | | 875,000 | | 858,104 |
See Accompanying Notes to Financial Statements.
25
Columbia High Yield Municipal Fund
June 30, 2008
Municipal Bonds (continued)
| | | | | | |
| | | | | Par ($) | | Value ($) |
| Industrials (continued) | | | | | | |
| Oil & Gas (continued) | | | | | | |
| VI Virgin Islands | | Hovensa LLC, Series 2002, AMT,
6.500% 07/01/21 | | 125,000 | | 127,286 |
| | | | | | |
| | Oil & Gas Total | | | | 15,311,729 |
| | | | | | |
| Other Industrial Development Bonds – 0.5% | | | | |
| N J Economic Development Authority | | GMT Realty LLC, Series 2006 B, AMT,
6.875% 01/01/37 | | 4,000,000 | | 3,895,320 |
| | | | | | |
| | Other Industrial Development Bonds Total | | | | 3,895,320 |
| | | | | | |
| Industrials Total | | | | 37,919,920 |
| | | | | | |
| Other – 14.9% | | | | | | |
| Other – 0.2% | | | | | | |
| PR Commonwealth of Puerto Rico Government Development Bank | | Series 2006 B,
5.000% 12/01/15 | | 1,250,000 | | 1,251,025 |
| | | | | | |
| | Other Total | | | | 1,251,025 |
| Pool/Bond Bank – 0.7% | | | | | | |
| OH Cleveland-Cuyahoga County Port Authority | | Series 2004 E,
5.600% 05/15/25 | | 530,000 | | 509,828 |
| | Series 2005 B,
LOC: Fifth Third Bank
5.125% 05/15/25 | | 720,000 | | 642,082 |
| | | |
| OH Summit County Port Authority | | Seville Project, Series 2005 A,
5.100% 05/15/25 | | 450,000 | | 400,091 |
| | | |
| PA Industrial Development Authority | | Series 2008,
5.500% 07/01/23 | | 2,355,000 | | 2,418,797 |
| | | |
| SD Economic Development Finance Authority | | Davis Family Sodak, Series 2004 4-A, AMT,
6.000% 04/01/29 | | 1,400,000 | | 1,357,874 |
| | | | | | |
| | Pool/Bond Bank Total | | | | 5,328,672 |
| | | | | | |
| Refunded/Escrowed (h) – 11.6% | | | | |
| CA ABAG Finance Authority for Nonprofit Corps. | | Eskaton Gold River Lodge,
Series 1998, | | | | |
| | Pre-refunded 11/15/08: | | | | |
| | 6.375% 11/15/15 | | 485,000 | | 502,693 |
| | 6.375% 11/15/28 | | 550,000 | | 570,273 |
| | | |
| CA Golden State Tobacco Securitization Corp. | | Series 2003 A-1,
Pre-refunded 06/01/13: | | | | |
| | 6.250% 06/01/33 | | 2,660,000 | | 2,875,034 |
| | 6.750% 06/01/39 | | 200,000 | | 226,602 |
See Accompanying Notes to Financial Statements.
26
Columbia High Yield Municipal Fund
June 30, 2008
Municipal Bonds (continued)
| | | | | | |
| | | | | Par ($) | | Value ($) |
| Other (continued) | | | | | | |
| Refunded/Escrowed (h) (continued) | | | | | | |
| CA Lincoln Community Facilities District No. 2003-1 | | Series 2004,
Pre-refunded 09/01/13: | | | | |
| | 5.750% 09/01/20 | | 450,000 | | 503,114 |
| | 5.900% 09/01/24 | | 445,000 | | 500,643 |
| | | |
| CA Statewide Communities Development Authority | | Eskaton Village - Grass Valley, Series 2000,
Pre-refunded 11/15/10,
8.250% 11/15/31 | | 1,695,000 | | 1,909,858 |
| | | |
| CO Adams County | | Series 1991 B:
Escrowed to Maturity,
11.250% 09/01/11 | | 220,000 | | 272,653 |
| | Pre-refunded 09/01/09, 11.250% 09/01/11 (g) | | 325,000 | | 358,439 |
| | Pre-refunded 09/01/10, 11.250% 09/01/11 | | 360,000 | | 422,424 |
| | | |
| CO Department of Transportation | | Series 2001 A,
Pre-refunded 06/15/11,
Insured: MBIA: | | | | |
| | 5.500% 06/15/14(f) | | 6,000,000 | | 6,472,020 |
| | 5.500% 06/15/15(f) | | 4,000,000 | | 4,314,680 |
| | | |
| CO E-470 Public Highway Authority | | Series 2000 B,
Pre-refunded 09/01/10,
(a) 09/01/35 | | 17,500,000 | | 2,496,900 |
| | | |
| CO Health Facilities Authority | | Volunteers of America Care Facilities: Series 1998 A, Pre-refunded 07/01/08,
5.750% 07/01/20 | | 700,000 | | 714,000 |
| | Series 1999 A, Pre-refunded 07/01/09
5.750% 07/01/10 | | 425,000 | | 435,383 |
| | | |
| CO Northwest Parkway Public Highway Authority | | Series 2001 D, Pre-refunded 06/15/11,
7.125% 06/15/41 | | 2,735,000 | | 3,056,609 |
| | | |
| FL Capital Projects Finance Authority | | Glenridge on Palmer Ranch, Series 2002 A, Pre-refunded 06/01/12,
8.000% 06/01/32 | | 1,250,000 | | 1,462,150 |
| | | |
| FL Islands at Doral Southwest Community Development District | | Series 2003, Pre-refunded 05/01/13,
6.375% 05/01/35 | | 755,000 | | 837,438 |
| | | |
| FL Lee County Industrial Development Authority | | Shell Point Village, Series 1999 A, Pre-refunded 11/15/09,
5.500% 11/15/29 | | 1,200,000 | | 1,262,016 |
| | | |
| FL Lexington Oaks Community Development District | | Series 1998 A, Pre-refunded 11/01/08,
6.125% 05/01/19 | | 220,000 | | 223,049 |
| | Series 2000 A, Pre-refunded 11/01/08,
7.200% 05/01/30 | | 790,000 | | 811,567 |
See Accompanying Notes to Financial Statements.
27
Columbia High Yield Municipal Fund
June 30, 2008
Municipal Bonds (continued)
| | | | | | |
| | | | | Par ($) | | Value ($) |
| Other (continued) | | | | | | |
| Refunded/Escrowed (h) (continued) | | | | |
| FL Orange County Health Facilities Authority | | Orlando Regional Health Care System: Series 1999 E, Pre-refunded 10/01/09,
6.000% 10/01/26 | | 20,000 | | 21,077 |
| | Series 2002, Pre-refunded 12/01/12,
5.750% 12/01/32 | | 350,000 | | 382,169 |
| | | |
| FL Tampa Bay Water Utility Systems | | Series 1999, Pre-refunded 10/01/11,
5.750% 10/01/29 | | 15,000,000 | | 16,224,900 |
| | | |
| GA Forsyth County Hospital Authority | | Georgia Baptist Health Care System, Series 1998, Escrowed to Maturity,
6.000% 10/01/08 | | 170,000 | | 171,737 |
| | | |
| GA Municipal Electric Authority | | Series 1991 V: Escrowed to Maturity, 6.600% 01/01/18 | | 690,000 | | 811,309 |
| | Pre-refunded 01/01/13, 6.600% 01/01/18 | | 75,000 | | 86,229 |
| | | |
| IA Finance Authority | | Care Initiatives, Series 1996, Pre-refunded 07/01/11,
9.250% 07/01/25 | | 455,000 | | 540,176 |
| | | |
| IL Health Facilities Authority | | Lutheran Senior Ministries, Series 2001 A, Pre-refunded 08/15/11,
7.375% 08/15/31 | | 1,300,000 | | 1,468,194 |
| | | |
| MA Development Finance Agency | | Western New England College, Series 2002, Pre-refunded 12/01/12,
6.125% 12/01/32 | | 300,000 | | 335,799 |
| | | |
| MA Health & Educational Facilities Authority | | Civic Investments, Inc., Series 2002 A, Pre-refunded 12/15/12,
9.000% 12/15/15 | | 1,400,000 | | 1,665,706 |
| | Milford-Whitinsville Regional Hospital, Series 2002 D, Pre-refunded 07/15/12,
6.350% 07/15/32 | | 1,715,000 | | 1,915,895 |
| | | |
| MI Pontiac Tax Increment Finance Authority | | Development Area No. 3, Series 2002, Pre-refunded 06/01/12,
6.375% 06/01/31 | | 1,000,000 | | 1,112,930 |
| | | |
| MN Carlton | | Inter-Faith Social Services, Inc., Series 2000, Pre-refunded 04/01/10,
7.500% 04/01/19 | | 235,000 | | 255,179 |
| | | |
| NC Eastern Municipal Power Agency | | Series 1991 A, Escrowed to Maturity,
6.500% 01/01/18 | | 3,320,000 | | 3,985,361 |
| | | |
| NC Medical Care Commission | | DePaul Community Facilities, Inc.,
Series 1999, Pre-refunded 11/01/09,
7.625% 11/01/29 | | 2,150,000 | | 2,315,184 |
See Accompanying Notes to Financial Statements.
28
Columbia High Yield Municipal Fund
June 30, 2008
Municipal Bonds (continued)
| | | | | | |
| | | | | Par ($) | | Value ($) |
| Other (continued) | | | | | | |
| Refunded/Escrowed (h) (continued) | | | | | | |
| NH Health & Educational Facilities Authority | | Catholic Medical Center, Series 2002 A, Pre-refunded 7/01/12,
6.125% 07/01/32 | | 350,000 | | 387,499 |
| | | |
| NH Industrial Development Authority | | Pennichuck Water Works, Inc., Series 1988, AMT, Escrowed to Maturity,
7.500% 07/01/18 | | 345,000 | | 398,071 |
| | | |
| NJ Economic Development Authority | | Seabrook Village, Inc., Series 2000 A, Pre-refunded 11/15/10,
8.250% 11/15/30 | | 1,625,000 | | 1,838,427 |
| | | |
| NJ Tobacco Settlement Financing Corp. | | Series 2003, Pre-refunded 06/01/13,
6.750% 06/01/39 | | 2,000,000 | | 2,290,180 |
| | | |
| NV Henderson | | St. Rose Dominican Hospital:
Series 1998 A, | | | | |
| | Pre-refunded 07/01/08: | | | | |
| | 5.375% 07/01/26 | | 180,000 | | 181,816 |
| | 5.375% 07/01/26 | | 610,000 | | 616,161 |
| | Series 1998, | | | | |
| | 5.125% 07/01/28 | | 540,000 | | 545,449 |
| | | |
| OH Highland County Joint Township | | Series 1999, Pre-refunded 12/01/09,
6.750% 12/01/29 | | 1,775,000 | | 1,903,883 |
| | | |
| PA Lancaster Industrial Development Authority | | Garden Spot Village, Series 2000 A, Pre-refunded 05/01/10,
7.625% 05/01/31 | | 825,000 | | 905,107 |
| | | |
| PR Commonwealth of Puerto Rico | | Series 2006 B, Pre-refunded 07/01/16,
5.000% 07/01/35 | | 3,090,000 | | 3,372,766 |
| | | |
| SC Jobs-Economic Development Authority | | Bon Secours St. Frances Medical, Series 2002 A, Pre-refunded 11/15/12,
5.500% 11/15/23 | | 485,000 | | 526,366 |
| | | |
| SC Tobacco Settlement Management Authority | | Series 2001 B, Pre-refunded 05/15/11
6.375% 05/15/28 | | 1,000,000 | | 1,089,710 |
| | | |
| TX Houston Health Facilities Development Corp. | | Buckingham Senior Living Community, Inc., Series 2004 A,
7.125% 02/15/34 | | 1,000,000 | | 1,187,470 |
| | | |
| TX Tyler Health Facilities Development Corp. | | Mother Frances Hospital, Series 2001,
Pre-refunded 07/01/12,
6.000% 07/01/31 | | 750,000 | | 822,405 |
| | | |
| VA Tobacco Settlement Financing Corp. | | Series 2005, Pre-refunded 06/01/15,
5.625% 06/01/37 | | 2,000,000 | | 2,195,320 |
See Accompanying Notes to Financial Statements.
29
Columbia High Yield Municipal Fund
June 30, 2008
Municipal Bonds (continued)
| | | | | | |
| | | | | Par ($) | | Value ($) |
| Other (continued) | | | | | | |
| Refunded/Escrowed (h) (continued) | | | | | | |
| WI Health & Educational Facilities Authority | | Attic Angel Obligated Group, Series 1998,
Pre-refunded 11/17/08,
5.750% 11/15/27 | | 2,125,000 | | 2,197,909 |
| | | |
| | Wheaton Franciscan Services, Series 2002,
Pre-refunded 02/15/12,
5.750% 08/15/30 | | 1,050,000 | | 1,146,873 |
| | | |
| WV Hospital Finance Authority | | Charleston Area Medical Center, Series 2000,
Pre-refunded 09/01/10,
6.750% 09/01/30 | | 925,000 | | 1,009,906 |
| | | | | | |
| | Refunded/Escrowed Total | | | | 84,134,708 |
| | | |
| Tobacco – 2.4% | | | | | | |
| CA Silicon Valley Tobacco Securitization Authority | | Series 2007 A,
(a) 06/01/36 | | 3,000,000 | | 342,120 |
| | | |
| IA Tobacco Settlement Authority | | Series 2005 C,
5.625% 06/01/46 | | 3,000,000 | | 2,480,940 |
| | | |
| LA Tobacco Settlement Financing Corp. | | Series 2001 B,
5.875% 05/15/39 | | 1,000,000 | | 927,090 |
| | | |
| MI Tobacco Settlement Finance Authority | | Series 2007 A,
6.000% 06/01/48 | | 5,000,000 | | 4,278,600 |
| | | |
| NJ Tobacco Settlement Financing Corp. | | Series 2007 1C,
(a) 06/01/41 | | 7,500,000 | | 532,275 |
| | | |
| NY Nassau County Tobacco Settlement Corp. | | Series 2006,
(a) 06/01/60 | | 25,000,000 | | 332,000 |
| | | |
| OH Buckeye Tobacco Settlement Financing Authority | | Series 2007 A-2:
5.750% 06/01/34 | | 4,000,000 | | 3,418,160 |
| | 5.875% 06/01/47 | | 2,100,000 | | 1,749,699 |
| | 6.000% 06/01/42 | | 3,250,000 | | 2,804,490 |
| | | |
| PR Commonwealth of Puerto Rico Children’s Trust Fund | | Series 2005 B,
(a) 05/15/55 | | 25,000,000 | | 626,750 |
| | | | | | |
| | Tobacco Total | | | | 17,492,124 |
| | | | | | |
| Other Total | | | | | | 108,206,529 |
| | | | | | |
| Other Revenue – 3.6% | | | | | | |
| Hotels – 0.9% | | | | | | |
| MD Economic Development Corp. | | Chesapeake Bay Conference Center, Series 2006 A,
5.000% 12/01/31 | | 2,250,000 | | 1,720,597 |
See Accompanying Notes to Financial Statements.
30
Columbia High Yield Municipal Fund
June 30, 2008
Municipal Bonds (continued)
| | | | | | |
| | | | | Par ($) | | Value ($) |
| Other Revenue (continued) | | | | | | |
| Hotels (continued) | | | | | | |
| NJ Middlesex County Improvement Authority | | Heldrich Associates LLC: Series 2005 B,
6.250% 01/01/37 | | 4,250,000 | | 3,585,172 |
| | Series 2005 C,
8.750% 01/01/37 | | 1,250,000 | | 1,133,588 |
| | | | | | |
| | Hotels Total | | | | 6,439,357 |
| Recreation – 2.5% | | | | | | |
| | | |
| CA Agua Caliente Band Cahuilla Indians | | Series 2003,
6.000% 07/01/18 | | 1,000,000 | | 1,012,900 |
| | | |
| CA Cabazon Band Mission Indians | | Series 2004:
8.375% 10/01/15 (f) | | 445,000 | | 458,724 |
| | 8.750% 10/01/19 (f) | | 1,800,000 | | 1,866,672 |
| | | |
| CT Mashantucket Western Pequot Tribe | | Series 1999 B,
(a) 09/01/15 (f) | | 2,000,000 | | 1,315,460 |
| | Series 2007 A,
6.500% 09/01/31 (f) | | 2,690,000 | | 2,651,721 |
| | | |
| CT Mohegan Tribe Gaming Authority | | Series 2001,
6.250% 01/01/31 (f) | | 475,000 | | 451,925 |
| | | |
| FL Seminole Indian Tribe | | Series 2007,
5.500% 10/01/24 (f) | | 2,000,000 | | 1,939,260 |
| | | |
| IL Finance Authority Sports Facility | | Leafs Hockey Club Project, Series 2007 A,
6.000% 03/01/37 | | 1,000,000 | | 864,840 |
| | | |
| NY Liberty Development Corp. | | National Sports Museum, Series 2006 A,
6.125% 02/15/19 (f) | | 2,250,000 | | 2,240,280 |
| | | |
| OK Chickasaw Nation | | Series 2007,
6.250% 12/01/32 (f) | | 3,500,000 | | 3,435,355 |
| | | |
| OR Cow Creek Band Umpqua Tribe of Indians | | Series 2006 C,
5.625% 10/01/26 (f) | | 1,700,000 | | 1,510,637 |
| | | | | | |
| | Recreation Total | | | | 17,747,774 |
| | | |
| Retail – 0.2% | | | | | | |
| LA Beauregard Parish | | Office Max, Series 2002,
6.800% 02/01/27 | | 1,750,000 | | 1,731,695 |
| | | | | | |
| | Retail Total | | | | 1,731,695 |
| | | | | | |
| Other Revenue Total | | | | | | 25,918,826 |
See Accompanying Notes to Financial Statements.
31
Columbia High Yield Municipal Fund
June 30, 2008
Municipal Bonds (continued)
| | | | | | |
| | | | | Par ($) | | Value ($) |
| Resource Recovery – 2.0% | | | | | | |
| Disposal – 1.0% | | | | | | |
| NH Business Finance Authority | | Waste Management of New Hampshire, Inc., Series 2002, AMT,
5.200% 05/01/27 | | 4,750,000 | | 4,163,802 |
| | | |
| OH Solid Waste | | Republic Services, Inc., Series 2004, AMT,
4.250% 04/01/33 | | 2,000,000 | | 1,833,500 |
| | | |
| UT Carbon County | | Laidlaw Environmental, Series 1997 A, AMT,
7.450% 07/01/17 | | 1,500,000 | | 1,496,010 |
| | | | | | |
| | Disposal Total | | | | 7,493,312 |
| | | |
| Resource Recovery – 1.0% | | | | | | |
| FL Lee County Solid Waste Systems | | Series 2006 A, AMT,
Insured: AMBAC
5.000% 10/01/17 | | 2,010,000 | | 1,975,247 |
| | | |
| MA Development Finance Agency | | Ogden Haverhill Associates, Series 1999 A, AMT,
6.700% 12/01/14 | | 635,000 | | 651,072 |
| | | |
| MA Industrial Finance Agency | | Ogden Haverhill Associates, Series 1998 A, AMT:
5.500% 12/01/13 | | 500,000 | | 500,400 |
| | 5.600% 12/01/19 | | 1,000,000 | | 982,430 |
| | | |
| NY Niagara County Industrial Development Agency | | American REF-Fuel Co., LLC, Series 2001 A, AMT, 5.450% 11/15/26 | | 1,000,000 | | 995,710 |
| | | |
| PA Delaware County Industrial Development Authority | | American REF-Fuel Co., Series 1997 A, 6.200% 07/01/19 | | 2,225,000 | | 2,228,738 |
| | | | | | |
| | Resource Recovery Total | | | | 7,333,597 |
| | | | | | |
| Resource Recovery Total | | | | | | 14,826,909 |
| | | | | | |
| Tax-Backed – 11.8% | | | | | | |
| Local Appropriated – 1.3% | | | | | | |
| | | |
| CA Southeast Resource Recovery Facilities Authority | | Series 2003 B, AMT, Insured: AMBAC 5.375% 12/01/18 | | 2,000,000 | | 2,011,000 |
| | | |
| MO St. Louis Industrial Development Authority | | St. Louis Convention Center, Series 2000, Insured: AMBAC (a) 07/15/18 | | 3,000,000 | | 1,811,910 |
See Accompanying Notes to Financial Statements.
32
Columbia High Yield Municipal Fund
June 30, 2008
Municipal Bonds (continued)
| | | | | | |
| | | | | Par ($) | | Value ($) |
| Tax-Backed (continued) | | | | | | |
| Local Appropriated (continued) | | | | | | |
| SC Fort Mill School Facilities Corp. | | Series 2006: 5.250% 12/01/27 | | 1,825,000 | | 1,766,655 |
| | 5.250% 12/01/28 | | 2,385,000 | | 2,295,300 |
| | | |
| SC Laurens County School District No. 55 | | Series 2005, 5.250% 12/01/30 | | 1,300,000 | | 1,210,872 |
| | | |
| SC Newberry County School District | | Series 2005, 5.000% 12/01/30 | | 750,000 | | 692,902 |
| | | | | | |
| | Local Appropriated Total | | | | 9,788,639 |
| | | |
| Local General Obligations – 0.6% | | | | | | |
| CA Modesto High School District | | Series 2002 A, Insured: FGIC (a) 08/01/19 | | 2,650,000 | | 1,513,654 |
| | | |
| CO Northwest Metropolitan District No. 3 | | Series 2005, 6.250% 12/01/35 | | 1,000,000 | | 840,280 |
| | | |
| CO Red Sky Ranch Metropolitan District | | Series 2003, 6.050% 12/01/33 | | 1,000,000 | | 895,430 |
| | | |
| TX Dallas County Flood Control District | | Series 2002, 7.250% 04/01/32 | | 1,000,000 | | 1,034,170 |
| | | | | | |
| | Local General Obligations Total | | | | 4,283,534 |
| | | |
| Special Non-Property Tax – 1.6% | | | | | | |
| IL Bolingbrook | | Sales Tax Revenue, Series 2005, 6.250% 01/01/24 | | 1,500,000 | | 1,512,765 |
| | | |
| KS Wyandotte County | | Series 2005 B, 5.000% 12/01/20 | | 625,000 | | 593,338 |
| | Series 2006, 4.875% 10/01/28 | | 2,035,000 | | 1,722,098 |
| | | |
| NJ Economic Development Authority | | Cigarette Tax, Series 2004: 5.500% 06/15/31 | | 315,000 | | 298,119 |
| | 5.750% 06/15/29 | | 1,000,000 | | 978,530 |
| | | |
| NV Sparks Tourism Improvement District No. 1 | | Series 2008, 6.750% 06/15/28 (i) | | 3,000,000 | | 2,870,280 |
| | | |
| VA Peninsula Town Center Community Development Authority | | Series 2007, 6.450% 09/01/37 | | 4,000,000 | | 3,662,920 |
| | | | | | |
| | Special Non-Property Tax Total | | | | 11,638,050 |
| | | |
| Special Property Tax – 7.1% | | | | | | |
| | | |
| CA Carson Improvement Bond Act 1915 | | Series 1992, 7.375% 09/02/22 | | 120,000 | | 120,389 |
See Accompanying Notes to Financial Statements.
33
Columbia High Yield Municipal Fund
June 30, 2008
Municipal Bonds (continued)
| | | | | | |
| | | | | Par ($) | | Value ($) |
| Tax-Backed (continued) | | | | | | |
| Special Property Tax (continued) | | | | | | |
| CA Empire Union School District | | Series 1987-1 A, Insured: AMBAC (a) 10/01/21 | | 1,665,000 | | 847,602 |
| | | |
| CA Huntington Beach Community Facilities District | | Grand Coast Resort, Series 2001-1, 6.450% 09/01/31 | | 1,250,000 | | 1,268,988 |
| | | |
| CA Oakdale Public Financing Authority | | Central City Redevelopment Project, Series 2004, 5.375% 06/01/33 | | 2,000,000 | | 1,901,220 |
| | | |
| CA Oceanside Community Development Commission | | Downtown Redevelopment Project, Series 2003, 5.700% 09/01/25 | | 500,000 | | 498,870 |
| | | |
| CA Orange County Improvement Bond Act 1915 | | Phase IV, No. 01-1-B, Series 2003, 5.750% 09/02/33 | | 1,000,000 | | 922,660 |
| | | |
| CA Redwood City Community Facilities District No. 1 | | Series 2003 B, 6.000% 09/01/33 | | 700,000 | | 683,081 |
| | | |
| CA Temecula Valley Unified School District No. 1 | | Series 2003, 6.125% 09/01/33 | | 600,000 | | 573,312 |
| | | |
| FL Ave Maria Stewardship Community District | | Series 2006 A, 5.125% 05/01/38 | | 1,500,000 | | 1,105,575 |
| | | |
| FL Brandy Creek Community Development District | | Series 2003 A, 6.350% 05/01/34 | | 935,000 | | 948,501 |
| | | |
| FL Celebration Community Development District | | Series 2003 A, 6.400% 05/01/34 | | 955,000 | | 976,277 |
| | | |
| FL Channing Park Development District | | Series 2007, 5.300% 05/01/38 | | 1,000,000 | | 751,450 |
| | | |
| FL Colonial Country Club Community Development District | | Series 2003, 6.400% 05/01/33 | | 705,000 | | 715,857 |
| | | |
| FL Double Branch Community Development District | | Series 2002 A, 6.700% 05/01/34 | | 665,000 | | 677,409 |
| | | |
| FL Lexington Oaks Community Development District | | Series 2002 A, 6.700% 05/01/33 | | 250,000 | | 255,223 |
| | | |
| FL Middle Village Community Development District | | Series 2004 A, 6.000% 05/01/35 | | 2,000,000 | | 1,824,180 |
| | | |
| FL Oakmont Grove Community Development District | | Series 2007 A,
5.400% 05/01/38 | | 1,200,000 | | 884,520 |
See Accompanying Notes to Financial Statements.
34
Columbia High Yield Municipal Fund
June 30, 2008
Municipal Bonds (continued)
| | | | | | |
| | | | | Par ($) | | Value ($) |
| Tax-Backed (continued) | | | | | | |
| Special Property Tax (continued) | | | | | | |
| | Series 2007 B,
5.250% 05/01/12 | | 1,000,000 | | 923,400 |
| | | |
| FL Orlando | | Conroy Road Interchange,
Series 1998 A: | | | | |
| | 5.500% 05/01/10 | | 120,000 | | 118,213 |
| | 5.800% 05/01/26 | | 600,000 | | 557,772 |
| | | |
| FL Sarasota National Community Development District | | Series 2003,
5.300% 05/01/39 | | 4,000,000 | | 2,954,960 |
| | | |
| FL Seven Oaks Community Development District II | | Series 2004 A,
5.875% 05/01/35 | | 470,000 | | 392,558 |
| | Series 2004 B,
5.000% 05/01/09 | | 435,000 | | 427,792 |
| | | |
| FL Sweetwater Creek Community Development District | | Series 2007 A,
5.500% 05/01/38 | | 2,000,000 | | 1,473,800 |
| | | |
| FL Tolomato Community Development District | | Series 2007,
6.650% 05/01/40 | | 3,000,000 | | 2,895,990 |
| | | |
| FL Waterset North Community Development District | | Series 2007 A,
6.600% 05/01/39 | | 2,000,000 | | 1,799,880 |
| | | |
| FL West Villages Improvement District | | Series 2006,
5.500% 05/01/37 | | 1,725,000 | | 1,351,606 |
| | | |
| FL Westchester Community Development District No. 1 | | Series 2003,
6.125% 05/01/35 | | 800,000 | | 680,864 |
| | | |
| FL Westridge Community Development District | | Series 2005,
5.800% 05/01/37 | | 2,700,000 | | 2,204,118 |
| | | |
| GA Atlanta | | Eastside Project, Series 2005 B,
5.600% 01/01/30 | | 1,615,000 | | 1,434,281 |
| | | |
| IL Annawan | | Patriot Renewable Fuels, Series 2007,
5.625% 01/01/18 | | 1,500,000 | | 1,397,025 |
| | | |
| IL Chicago | | Pilsen Redevelopment, Series 2004 B,
6.750% 06/01/22 | | 1,225,000 | | 1,257,218 |
| | | |
| IL Du Page County Special Service Area No. 31 | | Monarch Landing Project, Series 2006,
5.625% 03/01/36 | | 750,000 | | 630,945 |
| | | |
| IL Hillside | | Series 2008,
7.000% 01/01/28 | | 2,500,000 | | 2,448,025 |
See Accompanying Notes to Financial Statements.
35
Columbia High Yield Municipal Fund
June 30, 2008
Municipal Bonds (continued)
| | | | | | |
| | | | | Par ($) | | Value ($) |
| Tax-Backed (continued) | | | | | | |
| Special Property Tax (continued) | | | | | | |
| | | |
| IL Lincolnshire Special Services Area No. 1 | | Sedgebrook Project, Series 2004,
6.250% 03/01/34 | | 750,000 | | 696,975 |
| | | |
| IL Plano Special Service Area No. 4 | | Lakewood Springs Project, Series 2005 5-B,
6.000% 03/01/35 | | 3,000,000 | | 2,740,320 |
| | | |
| IL Rosemont | | River Road Hotel Partners Project, Series 2007,
5.100% 12/30/23 | | 2,800,000 | | 2,470,664 |
| | | |
| IL Volo Village Special Service Area No. 3 | | Symphony Meadows Project, Series 2006-1,
6.000% 03/01/36 | | 1,996,000 | | 1,775,302 |
| | | |
| IN City of Portage | | Ameriplex Project, Series 2006,
5.000% 07/15/23 | | 700,000 | | 644,945 |
| | | |
| MO Fenton | | Tax Increment Revenue, Series 2006,
4.500% 04/01/21 | | 445,000 | | 438,254 |
| | | |
| MO Kansas City Tax Increment Financing Commission | | Maincor Project, Inc., Series 2007 A,
5.250% 03/01/18 | | 1,000,000 | | 955,400 |
| | | |
| MO Riverside | | Tax Increment Revenue, Series 2004,
5.250% 05/01/20 | | 1,275,000 | | 1,247,435 |
| | | |
| OH Hickory Chase Community Authority | | Series 2008,
7.000% 12/01/38 | | 2,500,000 | | 2,462,650 |
| | | | | | |
| | Special Property Tax Total | | | | 51,335,506 |
| | | | | | |
| State Appropriated – 0.9% | | | | | | |
| LA Military Department | | Custody Receipts, Series 2006,
5.000% 08/01/24 | | 4,330,000 | | 4,349,831 |
| | | |
| NY Triborough Bridge & Tunnel Authority | | Javits Convention Center, Series 1990 E,
7.250% 01/01/10 | | 675,000 | | 704,133 |
| | | |
| PR Commonwealth of Puerto Rico Public Finance Corp. | | Series 2004 A,
5.750% 08/01/27 | | 1,465,000 | | 1,475,255 |
| | | | | | |
| | State Appropriated Total | | | | 6,529,219 |
See Accompanying Notes to Financial Statements.
36
Columbia High Yield Municipal Fund
June 30, 2008
Municipal Bonds (continued)
| | | | | | |
| | | | | Par ($) | | Value ($) |
| Tax-Backed (continued) | | | | | | |
| State General Obligations – 0.3% | | | | | | |
| | | |
| CA State | | Series 2003,
5.250% 02/01/23 | | 800,000 | | 836,560 |
| | | |
| PR Commonwealth of Puerto Rico | | Series 2004 A,
5.000% 07/01/30 | | 1,390,000 | | 1,373,167 |
| | | | | | |
| | State General Obligations Total | | | | 2,209,727 |
| | | | | | |
| Tax-Backed Total | | | | | | 85,784,675 |
| | | | | | |
| Transportation – 3.5% | | | | | | |
| Air Transportation – 1.7% | | | | | | |
| CA Los Angeles Regional Airports Improvement Corp. | | American Airlines, Inc., Series 2000 C, AMT,
7.500% 12/01/24 | | 400,000 | | 349,624 |
| | | |
| FL Capital Trust Agency | | Air Cargo-Orlando, Series 2003, AMT,
6.750% 01/01/32 | | 650,000 | | 659,178 |
| | | |
| IN Indianapolis Airport Authority | | Fed Ex Corp., Series 2004, AMT,
5.100% 01/15/17 | | 1,000,000 | | 947,990 |
| | | |
| NC Charlotte/Douglas International Airport | | US Airways, Inc., Series 1998, AMT,
5.600% 07/01/27 | | 1,500,000 | | 1,055,475 |
| | | |
NJ Economic Development
Authority | | Continental Airlines, Inc.: Series 1999, AMT:
6.250% 09/15/19 | | 1,000,000 | | 820,520 |
| | 6.250% 09/15/29 | | 2,500,000 | | 1,882,250 |
| | Series 2003, AMT,
9.000% 06/01/33 | | 1,000,000 | | 1,008,520 |
| | | |
| NY New York City Industrial Development Agency | | American Airlines, Inc., Series 2005, AMT,
7.750% 08/01/31 | | 3,000,000 | | 2,651,820 |
| | | |
| PA Philadelphia Authority for Industrial Development | | Aero Philadelphia, Series 1999, AMT: | | | | |
| | 5.250% 01/01/09 | | 100,000 | | 100,023 |
| | 5.500% 01/01/24 | | 1,000,000 | | 931,870 |
| | | |
| TX Dallas-Fort Worth International Airport | | American Airlines, Inc., Series 2000 A, AMT,
9.000% 05/01/29 | | 2,250,000 | | 1,332,405 |
| | | |
| TX Houston Industrial Development Corp. | | United Parcel Service, Series 2002, AMT,
6.000% 03/01/23 | | 935,000 | | 916,188 |
| | | | | | |
| | Air Transportation Total | | | | 12,655,863 |
See Accompanying Notes to Financial Statements.
37
Columbia High Yield Municipal Fund
June 30, 2008
Municipal Bonds (continued)
| | | | | | |
| | | | | Par ($) | | Value ($) |
| Transportation (continued) | | | | | | |
| Airports – 0.2% | | | | | | |
| MO Branson Regional Airport Transportation Development District | | Branson Airport LLC: Series 2007 A,
6.000% 07/01/37 | | 500,000 | | 438,285 |
| | Series 2007 B,
6.000% 07/01/37 | | 1,300,000 | | 1,106,989 |
| | | | | | |
| | Airports Total | | | | 1,545,274 |
| | | |
| Ports – 1.1% | | | | | | |
| WA Port of Seattle | | Series 2000 B, AMT,
Insured: MBIA 6.000% 02/01/11 (f) | | 7,500,000 | | 7,773,675 |
| | | | | | |
| | Ports Total | | | | 7,773,675 |
| | | |
| Toll Facilities – 0.4% | | | | | | |
| CO E-470 Public Highway Authority | | Series 2000 B,
Insured: MBIA
(a) 09/01/18 | | 4,000,000 | | 2,334,280 |
| TX Tollway Authority | | Series 2008,
5.625% 01/01/33 | | 1,000,000 | | 1,002,550 |
| | | | | | |
| | Toll Facilities Total | | | | 3,336,830 |
| | | |
| Transportation – 0.1% | | | | | | |
| | | |
| NV Department of Business & Industry | | Las Vegas Monorail Co., Series 2000,
7.375% 01/01/40 | | 1,250,000 | | 377,700 |
| | | | | | |
| | Transportation Total | | | | 377,700 |
| | | | | | |
| Transportation Total | | | | | | 25,689,342 |
| | | | | | |
| Utilities – 8.2% | | | | | | |
| Independent Power Producers – 1.2% | | | | | | |
| | | |
| NY Port Authority of New York & New Jersey | | KIAC Partners, Series 1996 IV, AMT: | | | | |
| | 6.750% 10/01/11 | | 3,000,000 | | 3,009,900 |
| | 6.750% 10/01/19 | | 120,000 | | 120,118 |
| | | |
| OR Western Generation Agency | | Wauna Cogeneration Project, Series 2006 A,
5.000% 01/01/20 | | 2,235,000 | | 1,941,880 |
| | | |
| PA Economic Development Financing Authority | | Colver Project, Series 2005, AMT,
5.125% 12/01/15 | | 825,000 | | 789,401 |
| | Northampton Generating, Series 1994 A, AMT,
6.500% 01/01/13 | | 3,000,000 | | 3,006,120 |
| | | | | | |
| | Independent Power Producers Total | | | | 8,867,419 |
See Accompanying Notes to Financial Statements.
38
Columbia High Yield Municipal Fund
June 30, 2008
Municipal Bonds (continued)
| | | | | | |
| | | | | Par ($) | | Value ($) |
| Utilities (continued) | | | | | | |
| Investor Owned – 5.2% | | | | | | |
| AR Independence County | | Entergy Mississippi, Inc., Series 1999,
Insurer: AMBAC
4. 900% 07/01/22 | | 1,200,000 | | 1,170,324 |
| | | |
| AZ Maricopa County Pollution Control Corp. | | Southern California Edison Co., Series 2000 A,
2.900% 06/01/35 | | 1,000,000 | | 998,580 |
| | | |
| CA Chula Vista Industrial Development Authority | | San Diego Gas & Electric Co., Series 1996 B, AMT,
5.500% 12/01/21 | | 1,275,000 | | 1,254,995 |
| | | |
| IL Development Finance Authority | | Peoples Gas Light & Coke Co., Series 2003 E, AMT,
Insured: AMBAC
4.875% 11/01/38 | | 2,500,000 | | 2,464,925 |
| | | |
| IN Petersburg | | Indianapolis Power & Light Co., Series 1991,
5.750% 08/01/21 | | 1,000,000 | | 989,090 |
| | | |
| LA Calcasieu Parish Industrial Development Board | | Entergy Gulf States, Inc., Series 1999,
5.450% 07/01/10 | | 500,000 | | 501,325 |
| | | |
| LA West Feliciana Parish | | Entergy Gulf States, Inc., Series 1999 B,
6.600% 09/01/28 | | 250,000 | | 247,772 |
| | | |
| MS Business Finance Corp. | | Systems Energy Resources, Inc., Series 1999,
5.900% 05/01/22 | | 1,500,000 | | 1,469,355 |
| | | |
| MT Forsyth | | Portland General, Series 1998 A,
5.200% 05/01/33 | | 375,000 | | 378,694 |
| | | |
| NH Business Finance Authority | | Public Service Co., Series 2006 B, AMT,
Insured: MBIA 4.750% 05/01/21 | | 7,250,000 | | 6,785,275 |
| | | |
| NM Farmington | | Tucson Electric Power Co., Series 1997 A,
6.950% 10/01/20 | | 2,000,000 | | 2,026,300 |
| | | |
| NV Clark County Industrial Development Authority | | Nevada Power Co.: Series 1995 B, AMT,
5.900% 10/01/30 | | 2,135,000 | | 1,878,373 |
See Accompanying Notes to Financial Statements.
39
Columbia High Yield Municipal Fund
June 30, 2008
Municipal Bonds (continued)
| | | | | | |
| | | | | Par ($) | | Value ($) |
| Utilities (continued) | | | | | | |
| Investor Owned (continued) | | | | | | |
| | Series 1997 A, AMT,
5.900% 11/01/32 | | 750,000 | | 654,945 |
| | | |
| | Southern California Edison Co., Series 2000 A, AMT,
3.250% 06/01/31 | | 1,000,000 | | 998,300 |
| | | |
| PA Economic Development Financing Authority | | Reliant Energy, Inc., Series 2001 A, AMT,
6.750% 12/01/36 | | 800,000 | | 808,840 |
| | | |
| SC Berkeley County Pollution Control Facilities Authority | | South Carolina Generating Co. Project, Series 2003,
4.875% 10/01/14 | | 1,500,000 | | 1,518,840 |
| | | |
| TX Brazos River Authority | | TXU Energy Co., LLC: Series 2001 C, AMT,
5.750% 05/01/36 | | 515,000 | | 484,368 |
| | Series 2003 C, AMT,
6.750% 10/01/38 | | 1,180,000 | | 972,733 |
| | | |
| TX Matagorda County Navigation District No. 1 | | AEP Texas Project, Series 2005 A,
Insured: AMBAC
4.400% 05/01/30 | | 7,500,000 | | 6,544,500 |
| | | |
| TX Sabine River Authority | | TXU Energy Co. LLC, Series 2001 B, AMT,
5.750% 05/01/30 | | 1,415,000 | | 1,330,836 |
| | | |
| WY Campbell County | | Black Hills Power, Inc., Series 2004,
5.350% 10/01/24 | | 3,250,000 | | 3,080,740 |
| | | |
| WY Converse County | | PacifiCorp, Series 1988,
3.900% 01/01/14 | | 1,500,000 | | 1,475,550 |
| | | | | | |
| | Investor Owned Total | | | | 38,034,660 |
| | | |
| Joint Power Authority – 0.8% | | | | | | |
| GA Municipal Electric Authority | | Series 1991 V,
6.600% 01/01/18 | | 3,300,000 | | 3,778,962 |
| | | |
| NC Eastern Municipal Power Agency | | Series 1991 A,
6.500% 01/01/18 | | 1,680,000 | | 1,894,519 |
| | | | | | |
| | Joint Power Authority Total | | | | 5,673,481 |
| | | |
| Municipal Electric – 0.2% | | | | | | |
| PR Electric Power Authority | | Series 1998 NN,
5.500% 07/01/20 | | 1,005,000 | | 1,048,557 |
| | | | | | |
| | Municipal Electric Total | | | | 1,048,557 |
See Accompanying Notes to Financial Statements.
40
Columbia High Yield Municipal Fund
June 30, 2008
Municipal Bonds (continued)
| | | | | | |
| | | | | Par ($) | | Value ($) |
| Utilities (continued) | | | | | | |
| Water & Sewer – 0.8% | | | | | | |
| AZ Surprise Municipal Property Corp. | | Series 2007,
4.900% 04/01/32 | | 2,000,000 | | 1,769,760 |
| MS V Lakes Utility District | | Series 1994,
7.000% 07/15/37 | | 250,000 | | 224,512 |
| PA Dauphin County Industrial Development Authority | | Dauphin Water Supply Co., Series 1992 A, AMT,
6.900% 06/01/24 | | 3,200,000 | | 3,667,616 |
| | | | | | |
| | Water & Sewer Total | | | | 5,661,888 |
| | | | | | |
| Utilities Total | | | | | | 59,286,005 |
| | Total Municipal Bonds
(Cost of $709,947,787) | | | | 674,075,528 |
| | | | | | |
| | | | | Shares | | |
| Investment Company – 3.3% | | | | | | |
| | | |
| | Dreyfus Tax-Exempt Cash Management Fund
(7 day yield of 1.630%) | | 24,044,242 | | 24,044,242 |
| | | | | | |
| | Total Investment Company
(Cost of $24,044,242) | | | | 24,044,242 |
| | | | | | |
| | | | | Par ($) | | |
| Municipal Preferred Stocks – 1.5% | | | | | | |
| | | | | | |
| Housing – 1.5% | | | | | | |
| Multi-Family – 1.5% | | | | | | |
| Centerline Equity Trust | | AMT:
6.300% 04/30/19(f) | | 1,000,000 | | 1,067,480 |
| | Series 1999, 6.625% 06/30/09(f) | | 2,000,000 | | 2,056,040 |
| | Series 2000, 7.600% 11/30/10(f) | | 1,500,000 | | 1,621,260 |
| | | |
| Citigroup Municipal Mortgage Trust | | AMT:
5.600% 10/31/39(f) | | 1,000,000 | | 1,014,300 |
| | 5.700% 10/31/40(f) | | 4,500,000 | | 4,366,755 |
| | | |
| MuniMae Trust | | AMT,
5.800% 06/30/49(f) | | 1,000,000 | | 969,350 |
| | | | | | |
| | Multi-Family Total | | | | 11,095,185 |
| | | | | | | |
| Housing Total | | | | | | 11,095,185 |
| | Total Municipal Preferred Stocks
(Cost of $10,873,700) | | | | 11,095,185 |
See Accompanying Notes to Financial Statements.
41
Columbia High Yield Municipal Fund
June 30, 2008
| | | | | | |
| | | | | Par ($) | | Value ($) |
| Short-Term Obligations – 1.7% | | | | | | |
| Variable Rate Demand Notes (j) – 1.7% | | | | |
| CT Health & Educational Facilities Authority | | Yale University, Series 2005 Y-2,
1.400% 07/01/35 | | 500,000 | | 500,000 |
| | | |
| FL Collier County Health Facilities Authority | | Cleveland Clinic Health System, Series 2003 C-1,
LOC: JPMorgan Chase Bank
1.700% 01/01/35 | | 300,000 | | 300,000 |
| | | |
| MO Development Finance Board | | Nelson Gallery Foundation, Series 2004 A,
SPA: JPMorgan Chase Bank
1.700% 12/01/33 | | 1,200,000 | | 1,200,000 |
| | | |
| NH Health & Education Facilities Authority | | Dartmouth College: Series 2007 A,
LOC: JPMorgan Chase Bank
2.900% 06/01/31 | | 3,000,000 | | 3,000,000 |
| | Series 2007 B,
SPA: JPMorgan Chase Bank
2.900% 06/01/41 | | 1,600,000 | | 1,600,000 |
| | | |
| NV Clark County School District | | Series 2001 A,
Insured: FSA,
SPA: State Street Bank & Trust Co.
2.000% 06/15/21 | | 2,880,000 | | 2,880,000 |
| | | |
| OK Development Finance Authority | | Integris Baptist Medical Center, Series 2007 A-3,
SPA: JPMorgan Chase Bank
1.550% 08/15/33 | | 2,500,000 | | 2,500,000 |
| | | | | | |
| | Variable Rate Demand Notes Total | | | | 11,980,000 |
| | | |
| | | | | | |
| | Total Short-Term Obligations (Cost of $11,980,000) | | | | 11,980,000 |
| | | |
| | | | | | |
| | Total Investments – 99.2%
(Cost of $756,845,729)(k) | | | | 721,194,955 |
| | | |
| | | | | | |
| | Other Assets & Liabilities, Net – 0.8% | | | | 5,652,501 |
| | | |
| | | | | | |
| | Net Assets – 100.0% | | | | 726,847,456 |
Notes to Investment Portfolio:
| | (b) | Denotes a restricted security, which is subject to restrictions on resale under federal securities laws or in transactions exempt from registration. At June 30, 2008, the value of this security represents 0.1% of net assets. |
| | | | | |
Security | | Acquisition
Date | | Acquisition
Cost |
CA Statewide Communities Development Authority~Crossroads School for Arts & Sciences, Series 1998,
6.000% 08/01/28 | | 08/21/98 | | $ | 265,000 |
6.000% 08/01/28 | | 08/31/98 | | | 700,000 |
| | | | | |
| | | | $ | 965,000 |
| | | | | |
See Accompanying Notes to Financial Statements.
42
Columbia High Yield Municipal Fund
June 30, 2008
| | (c) | The issuer has filed for bankruptcy protection under Chapter 11, and is in default of certain debt covenants. Income is not being accrued. At June 30, 2008, the value of this security represents less than 0.1% of net assets. |
| | (d) | Step bond. Shown parenthetically is the next interest rate to be paid and the date the Fund will begin accruing at this rate. |
| | (e) | The issuer is in default of certain debt covenants. Income is not being accrued. At June 30, 2008, the value of this security represents less than 0.1% of net assets. |
| | (f) | Security exempt from registration pursuant to Rule 144A under the Securities Act of 1933. These securities may be resold in transactions exempt from registration, normally to qualified institutional buyers. At June 30, 2008, these securities, which are not illiquid except as listed below, amounted to $46,319,558, which represents 6.4% of net assets. |
| | | | | | | | | | | |
Security | | Acquisition
Date | | Par | | Acquisition
Cost | | Value |
Resolution Trust Corp. Pass-Through Certificates, Series 1993 A, 8.500% 12/01/16 | | 11/12/93 | | $ | 455,481 | | $ | 463,388 | | $ | 448,740 |
| | (g) | The security or a portion of the security is pledged as collateral for open futures contracts. At June 30, 2008, the total market value of securities pledged amounted to $2,217,548. |
| | (h) | The Fund has been informed that each issuer has placed direct obligations of the U.S. Government in an irrevocable trust, solely for the payment of principal and interest. |
| | (i) | Security purchased on a delayed delivery basis. |
| | (j) | Variable rate demand notes. These securities are payable upon demand and are secured by letters of credit or other credit support agreements from banks. The interest rates change periodically and the interest rates shown reflect the rates at June 30, 2008. |
| | (k) | Cost for federal income tax purposes is $756,430,514. |
At June 30, 2008, the Fund held the following open short futures contracts:
| | | | | | | | | | | | | | |
Type | | Number of
Contracts | | Value | | Aggregate
Face Value | | Expiration
Date | | Unrealized
Depreciation | |
10-Year U.S. Treasury Notes | | 755 | | $ | 86,011,016 | | $ | 84,687,312 | | Sept-2008 | | $ | (1,323,704 | ) |
At June 30, 2008, the composition of the Fund by Revenue Source is as follows:
| | |
Revenue Source (Unaudited) | | % of Net Assets |
Health Care | | 31.8 |
Other | | 14.9 |
Tax-Backed | | 11.8 |
Housing | | 9.3 |
Utilities | | 8.2 |
Industrials | | 5.2 |
Education | | 3.9 |
Other Revenue | | 3.6 |
Transportation | | 3.5 |
Resource Recovery | | 2.0 |
| | |
| | 94.2 |
Investment Company | | 3.3 |
Short-Term Obligations | | 1.7 |
Other Assets & Liabilities, Net | | 0.8 |
| | |
| | 100.0 |
| | |
| | |
Acronym | | Name |
| ABAG | | Association of Bay Area Governments |
| AMBAC | | Ambac Assurance Corp. |
| AMT | | Alternative Minimum Tax |
| FGIC | | Financial Guaranty Insurance Co. |
| FHA | | Federal Housing Administration |
| FHLMC | | Federal Home Loan Mortgage Corp. |
| FSA | | Financial Security Assurance, Inc. |
| GNMA | | Government National Mortgage Association |
| HFDC | | Health Facility Development Corporation |
| LOC | | Letter of Credit |
| MBIA | | MBIA Insurance Corp. |
| SPA | | Stand-by Purchase Agreement |
See Accompanying Notes to Financial Statements.
43
Statement of Assets and Liabilities – Columbia High Yield Municipal Fund
June 30, 2008
| | | | | |
| | | | | ($) | |
| Assets | | Investments, at cost | | 756,845,729 | |
| | | | | |
| | Investments, at value | | 721,194,955 | |
| | Cash | | 42,213 | |
| | Receivable for: | | | |
| | Fund shares sold | | 1,573,969 | |
| | Interest | | 10,704,552 | |
| | Trustees’ deferred compensation plan | | 49,104 | |
| | Other assets | | 9,672 | |
| | | | | |
| | Total Assets | | 733,574,465 | |
| | |
| Liabilities | | Payable for: | | | |
| | Investments purchased on a delayed delivery basis | | 2,858,040 | |
| | Fund shares repurchased | | 750,175 | |
| | Futures variation margin | | 70,781 | |
| | Distributions | | 2,380,597 | |
| | Investment advisory fee | | 237,454 | |
| | Administration fee | | 63,707 | |
| | Transfer agent fee | | 155,407 | |
| | Pricing and bookkeeping fees | | 15,855 | |
| | Trustees’ fees | | 7,055 | |
| | Custody fee | | 1,829 | |
| | Distribution and service fees | | 25,433 | |
| | Chief compliance officer expenses | | 218 | |
| | Trustees’ deferred compensation plan | | 49,104 | |
| | Other liabilities | | 111,354 | |
| | | | | |
| | Total Liabilities | | 6,727,009 | |
| | |
| | | | | |
| | Net Assets | | 726,847,456 | |
| | |
| Net Assets Consist of | | Paid-in capital | | 796,269,639 | |
| | Undistributed net investment income | | 1,084,662 | |
| | Accumulated net realized loss | | (33,532,367 | ) |
| | Net unrealized depreciation on: | | | |
| | Investments | | (35,650,774 | ) |
| | Futures contracts | | (1,323,704 | ) |
| | | | | |
| | Net Assets | | 726,847,456 | |
See Accompanying Notes to Financial Statements.
44
Statement of Assets and Liabilities(continued) – Columbia High Yield Municipal Fund
June 30, 2008
| | | | | | |
| | | | | | |
| | |
| Class A | | Net assets | | $ | 74,592,889 | |
| | Shares outstanding | | | 7,228,840 | |
| | Net asset value per share | | $ | 10.32 | (a) |
| | Maximum sales charge | | | 4.75 | % |
| | Maximum offering price per share ($10.32/0.9525) | | $ | 10.83 | (b) |
| | |
| Class B | | Net assets | | $ | 11,945,019 | |
| | Shares outstanding | | | 1,157,614 | |
| | Net asset value and offering price per share | | $ | 10.32 | (a) |
| | |
| Class C | | Net assets | | $ | 11,090,437 | |
| | Shares outstanding | | | 1,074,791 | |
| | Net asset value and offering price per share | | $ | 10.32 | (a) |
| | |
| Class Z | | Net assets | | $ | 629,219,111 | |
| | Shares outstanding | | | 60,978,738 | |
| | Net asset value, offering and redemption price per share | | $ | 10.32 | |
| (a) | Redemption price per share is equal to net asset value less any applicable contingent deferred sales charge. |
| (b) | On sales of $50,000 or more the offering price is reduced. |
See Accompanying Notes to Financial Statements.
45
Statement of Operations – Columbia High Yield Municipal Fund
For the Year Ended June 30, 2008
| | | | | |
| | | | | ($) | |
| Investment Income | | Interest | | 42,626,154 | |
| | Dividends | | 147,504 | |
| | | | | |
| | Total Investment Income | | 42,773,658 | |
| | |
| Expenses | | Investment advisory fee | | 3,036,689 | |
| | Administration fee | | 815,422 | |
| | Distribution fee: | | | |
| | Class B | | 108,813 | |
| | Class C | | 90,771 | |
| | Service fee: | | | |
| | Class A | | 163,110 | |
| | Class B | | 29,017 | |
| | Class C | | 24,222 | |
| | Transfer agent fee | | 781,098 | |
| | Pricing and bookkeeping fees | | 199,371 | |
| | Trustees’ fees | | 48,594 | |
| | Custody fee | | 19,773 | |
| | Chief compliance officer expenses | | 944 | |
| | Other expenses | | 272,033 | |
| | | | | |
| | Expenses before interest expense and fees | | 5,589,857 | |
| | Interest expense and fees | | 355,688 | |
| | | | | |
| | Total Expenses | | 5,945,545 | |
| | |
| | Fees waived by distributor – Class C | | (18,107 | ) |
| | Expense reductions | | (12,572 | ) |
| | | | | |
| | Net Expenses | | 5,914,866 | |
| | |
| | | | | |
| | Net Investment Income | | 36,858,792 | |
| | |
Net Realized and Unrealized Gain (Loss) on Investments, Swap Contracts and Futures Contracts | | Net realized gain (loss) on: | | | |
| | Investments | | (2,545,376 | ) |
| | Swap contracts | | 633,000 | |
| | Futures contracts | | (12,169,237 | ) |
| | | | | |
| | Net realized loss | | (14,081,613 | ) |
| | |
| | Net change in unrealized appreciation (depreciation) on: | | | |
| | Investments | | (52,597,083 | ) |
| | Swap contracts | | (722,810 | ) |
| | Futures contracts | | (1,299,593 | ) |
| | | | | |
| | Net change in unrealized appreciation (depreciation) | | (54,619,486 | ) |
| | | | | |
| | Net Loss | | (68,701,099 | ) |
| | |
| | | | | |
| | Net Decrease Resulting from Operations | | (31,842,307 | ) |
See Accompanying Notes to Financial Statements.
46
Statement of Changes in Net Assets – Columbia High Yield Municipal Fund
| | | | | | | | |
| | | | | Year Ended June 30, | |
| Increase (Decrease) in Net Assets | | | | 2008 ($) | | | 2007 ($) | |
| Operations | | Net investment income | | 36,858,792 | | | 35,505,735 | |
| | Net realized gain (loss) on investments, swap contracts and futures contracts | | (14,081,613 | ) | | 92,995 | |
| | Net change in unrealized appreciation (depreciation) on investments, swap contracts and futures contracts | | (54,619,486 | ) | | 2,784,589 | |
| | | | | | | | |
| | Net Increase (Decrease) Resulting from Operations | | (31,842,307 | ) | | 38,383,319 | |
| | | |
| Distributions to Shareholders | | From net investment income: | | | | | | |
| | Class A | | (3,933,279 | ) | | (4,086,325 | ) |
| | Class B | | (590,174 | ) | | (781,392 | ) |
| | Class C | | (511,488 | ) | | (561,887 | ) |
| | Class Z | | (31,712,990 | ) | | (29,922,246 | ) |
| | | | | | | | |
| | Total Distributions to Shareholders | | (36,747,931 | ) | | (35,351,850 | ) |
| | Net Increase (Decrease) from Share Transactions | | (24,534,734 | ) | | 110,973,250 | |
| | | | | | | | |
| | Total Increase (Decrease) in Net Assets | | (93,124,972 | ) | | 114,004,719 | |
| | | |
| Net Assets | | Beginning of period | | 819,972,428 | | | 705,967,709 | |
| | End of period | | 726,847,456 | | | 819,972,428 | |
| | Undistributed net investment income, at end of period | | 1,084,662 | | | 977,957 | |
See Accompanying Notes to Financial Statements.
47
Statements of Changes in Net Assets – Capital Stock Activity
| | | | | | | | | | | | |
| | | Columbia High Yield Municipal Fund | |
| | | Year Ended
June 30, 2008 | | | Year Ended
June 30, 2007 | |
| | | Shares | | | Dollars ($) | | | Shares | | | Dollars ($) | |
Changes in Shares | | | | | | | | | | | | |
Class A | | | | | | | | | | | | |
Subscriptions | | 1,256,976 | | | 13,647,769 | | | 1,659,081 | | | 19,050,726 | |
Distributions reinvested | | 208,142 | | | 2,235,548 | | | 194,246 | | | 2,230,322 | |
Redemptions | | (2,180,658 | ) | | (23,709,042 | ) | | (1,921,327 | ) | | (21,996,379 | ) |
| | | | | | | | | | | | |
Net Decrease | | (715,540 | ) | | (7,825,725 | ) | | (68,000 | ) | | (715,331 | ) |
Class B | | | | | | | | | | | | |
Subscriptions | | 73,271 | | | 794,844 | | | 181,015 | | | 2,080,535 | |
Distributions reinvested | | 29,283 | | | 315,127 | | | 37,081 | | | 425,793 | |
Redemptions | | (481,908 | ) | | (5,215,968 | ) | | (879,541 | ) | | (10,083,250 | ) |
| | | | | | | | | | | | |
Net Decrease | | (379,354 | ) | | (4,105,997 | ) | | (661,445 | ) | | (7,576,922 | ) |
Class C | | | | | | | | | | | | |
Subscriptions | | 192,222 | | | 2,075,752 | | | 253,740 | | | 2,906,664 | |
Distributions reinvested | | 22,291 | | | 239,567 | | | 26,007 | | | 298,655 | |
Redemptions | | (387,704 | ) | | (4,236,926 | ) | | (340,667 | ) | | (3,900,156 | ) |
| | | | | | | | | | | | |
Net Decrease | | (173,191 | ) | | (1,921,607 | ) | | (60,920 | ) | | (694,837 | ) |
Class Z | | | | | | | | | | | | |
Subscriptions | | 19,046,612 | | | 203,604,008 | | | 20,437,901 | | | 234,519,287 | |
Distributions reinvested | | 498,121 | | | 5,350,463 | | | 455,123 | | | 5,225,620 | |
Redemptions | | (20,234,726 | ) | | (219,635,876 | ) | | (10,449,573 | ) | | (119,784,567 | ) |
| | | | | | | | | | | | |
Net Increase (Decrease) | | (689,993 | ) | | (10,681,405 | ) | | 10,443,451 | | | 119,960,340 | |
See Accompanying Notes to Financial Statements.
48
Financial Highlights – Columbia High Yield Municipal Fund
Selected data for a share outstanding throughout each period is as follows:
| | | | | | | | | | | | | | | | | | | | |
| Class A Shares | | | | | | | | | | | | | | | |
| | | Year Ended June 30, | |
| | | 2008 | | | 2007 | | | 2006 | | | 2005 | | | 2004 | |
Net Asset Value, Beginning of Period | | $ | 11.33 | | | $ | 11.25 | | | $ | 11.39 | | | $ | 10.96 | | | $ | 11.25 | |
| | | | | |
Income from Investment Operations: | | | | | | | | | | | | | | | | | | | | |
Net investment income (a) | | | 0.52 | | | | 0.51 | | | | 0.52 | | | | 0.54 | | | | 0.56 | |
Net realized and unrealized gain (loss) on investments, swap contracts and futures contracts | | | (1.01 | ) | | | 0.08 | | | | (0.14 | ) | | | 0.43 | | | | (0.33 | ) |
| | | | | | | | | | | | | | | | | | | | |
Total from Investment Operations | | | (0.49 | ) | | | 0.59 | | | | 0.38 | | | | 0.97 | | | | 0.23 | |
| | | | | |
Less Distributions to Shareholders: | | | | | | | | | | | | | | | | | | | | |
From net investment income | | | (0.52 | ) | | | (0.51 | ) | | | (0.52 | ) | | | (0.54 | ) | | | (0.52 | ) |
| | | | | | | | | | | | | | | | | | | | |
| | | | | |
Net Asset Value, End of Period | | $ | 10.32 | | | $ | 11.33 | | | $ | 11.25 | | | $ | 11.39 | | | $ | 10.96 | |
Total return (b) | | | (4.39 | )% | | | 5.23 | % | | | 3.39 | %(c) | | | 9.00 | % | | | 2.10 | % |
| | | | | |
Ratios to Average Net Assets/Supplemental Data: | | | | | | | | | | | | | | | | | | | | |
Net expenses before interest expense and fees (d) | | | 0.90 | % | | | 0.88 | % | | | 0.85 | % | | | 0.87 | % | | | 0.89 | % |
Interest expense and fees (e) | | | 0.05 | % | | | 0.07 | % | | | 0.07 | % | | | 0.06 | % | | | 0.05 | % |
Net expenses (d) | | | 0.95 | % | | | 0.95 | % | | | 0.92 | % | | | 0.93 | % | | | 0.94 | % |
Waiver/Reimbursement | | | — | | | | — | | | | — | %(f) | | | — | | | | — | |
Net investment income (d) | | | 4.84 | % | | | 4.43 | % | | | 4.60 | % | | | 4.79 | % | | | 5.04 | % |
Portfolio turnover rate | | | 32 | % | | | 27 | % | | | 13 | % | | | 7 | % | | | 10 | % |
Net assets, end of period (000’s) | | $ | 74,593 | | | $ | 89,977 | | | $ | 90,151 | | | $ | 91,470 | | | $ | 77,738 | |
| (a) | Per share data was calculated using the average shares outstanding during the period. |
| (b) | Total return at net asset value assuming all distributions reinvested and no initial sales charge or contingent deferred sales charge. |
| (c) | Had the investment advisor and/or any of its affiliates not waived fees or reimbursed a portion of expenses, total return would have been reduced. |
| (d) | The benefits derived from expense reductions had an impact of less than 0.01%. |
| (e) | Interest expense and fees relate to the liability for floating-rate notes issued in conjunction with inverse floater securities transactions. |
| (f) | Rounds to less than 0.01%. |
See Accompanying Notes to Financial Statements.
49
Financial Highlights – Columbia High Yield Municipal Fund
Selected data for a share outstanding throughout each period is as follows:
| | | | | | | | | | | | | | | | | | | | |
| Class B Shares | | | | | | | | �� | | | | | | | |
| | | Year Ended June 30, | |
| | | 2008 | | | 2007 | | | 2006 | | | 2005 | | | 2004 | |
Net Asset Value, Beginning of Period | | $ | 11.33 | | | $ | 11.25 | | | $ | 11.39 | | | $ | 10.96 | | | $ | 11.25 | |
| | | | | |
Income from Investment Operations: | | | | | | | | | | | | | | | | | | | | |
Net investment income (a) | | | 0.44 | | | | 0.42 | | | | 0.43 | | | | 0.46 | | | | 0.48 | |
Net realized and unrealized gain (loss) on investments, swap contracts and futures contracts | | | (1.01 | ) | | | 0.08 | | | | (0.14 | ) | | | 0.42 | | | | (0.33 | ) |
| | | | | | | | | | | | | | | | | | | | |
Total from Investment Operations | | | (0.57 | ) | | | 0.50 | | | | 0.29 | | | | 0.88 | | | | 0.15 | |
| | | | | |
Less Distributions to Shareholders: | | | | | | | | | | | | | | | | | | | | |
From net investment income | | | (0.44 | ) | | | (0.42 | ) | | | (0.43 | ) | | | (0.45 | ) | | | (0.44 | ) |
| | | | | | | | | | | | | | | | | | | | |
| | | | | |
Net Asset Value, End of Period | | $ | 10.32 | | | $ | 11.33 | | | $ | 11.25 | | | $ | 11.39 | | | $ | 10.96 | |
Total return (b) | | | (5.10 | )% | | | 4.45 | % | | | 2.62 | %(c) | | | 8.19 | % | | | 1.33 | % |
| | | | | |
Ratios to Average Net Assets/Supplemental Data: | | | | | | | | | | | | | | | | | | | | |
Net expenses before interest expense and fees (d) | | | 1.65 | % | | | 1.63 | % | | | 1.60 | % | | | 1.62 | % | | | 1.64 | % |
Interest expense and fees (e) | | | 0.05 | % | | | 0.07 | % | | | 0.07 | % | | | 0.06 | % | | | 0.05 | % |
Net expenses (d) | | | 1.70 | % | | | 1.70 | % | | | 1.67 | % | | | 1.68 | % | | | 1.69 | % |
Waiver/Reimbursement | | | — | | | | — | | | | — | %(f) | | | — | | | | — | |
Net investment income (d) | | | 4.09 | % | | | 3.68 | % | | | 3.85 | % | | | 4.04 | % | | | 4.29 | % |
Portfolio turnover rate | | | 32 | % | | | 27 | % | | | 13 | % | | | 7 | % | | | 10 | % |
Net assets, end of period (000’s) | | $ | 11,945 | | | $ | 17,407 | | | $ | 24,735 | | | $ | 32,824 | | | $ | 39,097 | |
| (a) | Per share data was calculated using the average shares outstanding during the period. |
| (b) | Total return at net asset value assuming all distributions reinvested and no contingent deferred sales charge. |
| (c) | Had the investment advisor and/or any of its affiliates not waived fees or reimbursed a portion of expenses, total return would have been reduced. |
| (d) | The benefits derived from expense reductions had an impact of less than 0.01%. |
| (e) | Interest expense and fees relate to the liability for floating-rate notes issued in conjunction with inverse floater securities transactions. |
| (f) | Rounds to less than 0.01%. |
See Accompanying Notes to Financial Statements.
50
Financial Highlights – Columbia High Yield Municipal Fund
Selected data for a share outstanding throughout each period is as follows:
| | | | | | | | | | | | | | | | | | | | |
| Class C Shares | | | | | | | | | | | | | | | |
| | | Year Ended June 30, | |
| | | 2008 | | | 2007 | | | 2006 | | | 2005 | | | 2004 | |
Net Asset Value, Beginning of Period | | $ | 11.33 | | | $ | 11.25 | | | $ | 11.39 | | | $ | 10.96 | | | $ | 11.25 | |
| | | | | |
Income from Investment Operations: | | | | | | | | | | | | | | | | | | | | |
Net investment income (a) | | | 0.46 | | | | 0.44 | | | | 0.45 | | | | 0.47 | | | | 0.49 | |
Net realized and unrealized gain (loss) on investments, swap contracts and futures contracts | | | (1.01 | ) | | | 0.08 | | | | (0.14 | ) | | | 0.43 | | | | (0.32 | ) |
| | | | | | | | | | | | | | | | | | | | |
Total from Investment Operations | | | (0.55 | ) | | | 0.52 | | | | 0.31 | | | | 0.90 | | | | 0.17 | |
| | | | | |
Less Distributions to Shareholders: | | | | | | | | | | | | | | | | | | | | |
From net investment income | | | (0.46 | ) | | | (0.44 | ) | | | (0.45 | ) | | | (0.47 | ) | | | (0.46 | ) |
| | | | | | | | | | | | | | | | | | | | |
| | | | | |
Net Asset Value, End of Period | | $ | 10.32 | | | $ | 11.33 | | | $ | 11.25 | | | $ | 11.39 | | | $ | 10.96 | |
Total return (b)(c) | | | (4.96 | )% | | | 4.61 | % | | | 2.77 | % | | | 8.35 | % | | | 1.48 | % |
| | | | | |
Ratios to Average Net Assets/Supplemental Data: | | | | | | | | | | | | | | | | | | | | |
Net expenses before interest expense and fees (d) | | | 1.50 | % | | | 1.48 | % | | | 1.45 | % | | | 1.47 | % | | | 1.49 | % |
Interest expense and fees (e) | | | 0.05 | % | | | 0.07 | % | | | 0.07 | % | | | 0.06 | % | | | 0.05 | % |
Net expenses (d) | | | 1.55 | % | | | 1.55 | % | | | 1.52 | % | | | 1.53 | % | | | 1.54 | % |
Waiver/Reimbursement | | | 0.15 | % | | | 0.15 | % | | | 0.15 | % | | | 0.15 | % | | | 0.15 | % |
Net investment income (d) | | | 4.24 | % | | | 3.82 | % | | | 3.99 | % | | | 4.19 | % | | | 4.44 | % |
Portfolio turnover rate | | | 32 | % | | | 27 | % | | | 13 | % | | | 7 | % | | | 10 | % |
Net assets, end of period (000’s) | | $ | 11,090 | | | $ | 14,134 | | | $ | 14,727 | | | $ | 13,593 | | | $ | 10,482 | |
| (a) | Per share data was calculated using the average shares outstanding during the period. |
| (b) | Total return at net asset value assuming all distributions reinvested and no contingent deferred sales charge. |
| (c) | Had the investment advisor and/or any of its affiliates not waived fees or reimbursed a portion of expenses, total return would have been reduced. |
| (d) | The benefits derived from expense reductions had an impact of less than 0.01%. |
| (e) | Interest expense and fees relate to the liability for floating-rate notes issued in conjunction with inverse floater securities transactions. |
See Accompanying Notes to Financial Statements.
51
Financial Highlights – Columbia High Yield Municipal Fund
Selected data for a share outstanding throughout each period is as follows:
| | | | | | | | | | | | | | | | | | | | |
| Class Z Shares | | | | | | | | | | | | | | | |
| | | Year Ended June 30, | |
| | | 2008 | | | 2007 | | | 2006 | | | 2005 | | | 2004 | |
Net Asset Value, Beginning of Period | | $ | 11.33 | | | $ | 11.25 | | | $ | 11.39 | | | $ | 10.96 | | | $ | 11.25 | |
| | | | | |
Income from Investment Operations: | | | | | | | | | | | | | | | | | | | | |
Net investment income (a) | | | 0.54 | | | | 0.53 | | | | 0.54 | | | | 0.56 | | | | 0.58 | |
Net realized and unrealized gain (loss) on investments, swap contracts and futures contracts | | | (1.01 | ) | | | 0.08 | | | | (0.14 | ) | | | 0.43 | | | | (0.32 | ) |
| | | | | | | | | | | | | | | | | | | | |
Total from Investment Operations | | | (0.47 | ) | | | 0.61 | | | | 0.40 | | | | 0.99 | | | | 0.26 | |
| | | | | |
Less Distributions to Shareholders: | | | | | | | | | | | | | | | | | | | | |
From net investment income | | | (0.54 | ) | | | (0.53 | ) | | | (0.54 | ) | | | (0.56 | ) | | | (0.55 | ) |
| | | | | | | | | | | | | | | | | | | | |
| | | | | |
Net Asset Value, End of Period | | $ | 10.32 | | | $ | 11.33 | | | $ | 11.25 | | | $ | 11.39 | | | $ | 10.96 | |
Total return (b) | | | (4.20 | )% | | | 5.44 | % | | | 3.59 | %(c) | | | 9.22 | % | | | 2.33 | % |
| | | | | |
Ratios to Average Net Assets/Supplemental Data: | | | | | | | | | | | | | | | | | | | | |
Net expenses before interest expense and fees (d) | | | 0.70 | % | | | 0.68 | % | | | 0.65 | % | | | 0.67 | % | | | 0.69 | % |
Interest expense and fees (e) | | | 0.05 | % | | | 0.07 | % | | | 0.07 | % | | | 0.06 | % | | | 0.05 | % |
Net expenses (d) | | | 0.75 | % | | | 0.75 | % | | | 0.72 | % | | | 0.73 | % | | | 0.74 | % |
Waiver/Reimbursement | | | — | | | | — | | | | — | %(f) | | | — | | | | — | |
Net investment income (d) | | | 5.03 | % | | | 4.63 | % | | | 4.80 | % | | | 4.99 | % | | | 5.24 | % |
Portfolio turnover rate | | | 32 | % | | | 27 | % | | | 13 | % | | | 7 | % | | | 10 | % |
Net assets, end of period (000's) | | $ | 629,219 | | | $ | 698,454 | | | $ | 576,355 | | | $ | 447,945 | | | $ | 341,394 | |
| (a) | Per share data was calculated using the average shares outstanding during the period. |
| (b) | Total return at net asset value assuming all distributions reinvested. |
| (c) | Had the investment advisor and/or any of its affiliates not waived fees or reimbursed a portion of expenses, total return would have been reduced. |
| (d) | The benefits derived from expense reductions had an impact of less than 0.01%. |
| (e) | Interest expense and fees relate to the liability for floating-rate notes issued in conjunction with inverse floater securities transactions. |
| (f) | Rounds to less than 0.01%. |
See Accompanying Notes to Financial Statements.
52
Notes to Financial Statements – Columbia High Yield Municipal Fund
June 30, 2008
Note 1. Organization
Columbia High Yield Municipal Fund (the “Fund”), a series of Columbia Funds Series Trust I (the “Trust”), is a diversified portfolio. The Trust is a Massachusetts business trust registered under the Investment Company Act of 1940, as amended, as an open-end management investment company.
Investment Objective
The Fund seeks total return, consisting of current income exempt from federal income tax and of capital appreciation.
Fund Shares
The Trust may issue an unlimited number of shares, and the Fund offers four classes of shares: Class A, Class B, Class C and Class Z. Each share class has its own expense structure and sales charges, as applicable.
Class A shares are subject to a maximum front-end sales charge of 4.75% based on the amount of initial investment. Class A shares purchased without an initial sales charge in accounts aggregating $1 million to $50 million at the time of purchase are subject to a 1.00% contingent deferred sales charge (“CDSC”) if the shares are sold within one year after purchase. Class B shares are subject to a maximum CDSC of 5.00% based upon the holding period after purchase. Class B shares will convert to Class A shares eight years after purchase. Class C shares are subject to a 1.00% CDSC on shares sold within one year after purchase. Class Z shares are offered continuously at net asset value. There are certain restrictions on the purchase of Class Z shares, as described in the Fund’s prospectus.
Note 2. Significant Accounting Policies
The preparation of financial statements in accordance with accounting principles generally accepted in the United States of America (“GAAP”) requires management to make certain estimates and assumptions that affect the reported amounts of assets and liabilities, the disclosure of contingent assets and liabilities at the date of the financial statements and the reported amounts of revenue and expenses during the reporting period. Actual results could differ from those estimates. The following is a summary of significant accounting policies consistently followed by the Fund in the preparation of its financial statements.
Security Valuation
Debt securities generally are valued by pricing services approved by the Trust’s Board of Trustees, based upon market transactions for normal, institutional-size trading units of similar securities. The services may use various pricing techniques which take into account appropriate factors such as yield, quality, coupon rate, maturity, type of issue, trading characteristics and other data, as well as broker quotes. Debt securities for which quotations are readily available are valued at an over-the-counter or exchange bid quotation. Certain debt securities, which tend to be more thinly traded and of lesser quality, are priced based on fundamental analysis of the financial condition of the issuer and the estimated value of any collateral. Valuations developed through pricing techniques may vary from the actual amounts realized upon sale of the securities, and the potential variation may be greater for those securities valued using fundamental analysis.
Short-term debt obligations maturing within 60 days are valued at amortized cost, which approximates market value.
Investments in other open-end investment companies are valued at net asset value.
Futures contracts are valued at the settlement price established each day by the board of trade or exchange on which they are traded.
Investments for which market quotations are not readily available, or that have quotations which management believes are not reliable, are valued at fair value as determined in good faith under consistently applied procedures established by and under the general supervision of the Board of Trustees. If a security is valued at fair value, such value is likely to be different from the last quoted market price for the security.
In September 2006, Statement of Financial Accounting Standards No. 157, Fair Value Measurements (“SFAS 157”), was issued. SFAS 157 is effective for fiscal years beginning after November 15, 2007. SFAS 157 defines fair value, establishes a framework for measuring fair value and expands disclosures about fair value measurements. Management is evaluating the impact the application of SFAS 157 will have on the Fund’s financial statement disclosures.
53
Columbia High Yield Municipal Fund
June 30, 2008
Security Transactions
Security transactions are accounted for on the trade date. Cost is determined and gains (losses) are based upon the specific identification method for both financial statement and federal income tax purposes.
In March 2008, Statement of Financial Accounting Standards No. 161 (“SFAS 161”), Disclosures about Derivative Instruments and Hedging Activities-an amendment of FASB Statement No. 133, was issued. SFAS 161 is effective for fiscal years beginning after November 15, 2008. SFAS 161 requires additional discussion about the reporting entity’s derivative instruments and hedging activities, by providing for qualitative disclosures about the objectives and strategies for using derivatives, quantitative data about the fair value of and gains and losses on derivative contracts, and details of credit-risk-related contingent features in their hedged positions. Management is evaluating the impact the application of SFAS 161 will have on the Fund’s financial statement disclosures.
Floating-Rate Notes Issued in Conjunction with Securities Held
The Fund may sell a fixed-rate bond (“Fixed-Rate Bond”) to a broker who deposits the Fixed-Rate Bond into a special-purpose entity from which are issued floating-rate notes (“Floating-Rate Notes”) that are sold to third parties. The Floating-Rate Notes have interest rates that reset weekly and the holders of the Floating-Rate Notes have the option to tender their notes to the broker at par at each reset date. A residual certificate (an “Inverse Floater”), which pays interest equal to the difference between the Fixed-Rate Bond and the Floating-Rate Notes, is also issued by the special-purpose entity. The Inverse Floater also gives the holder the right to cause the Floating-Rate Note to be called at par and to require transfer of the Fixed-Rate Bond to the holder of the Inverse Floater, thereby liquidating the special-purpose entity. In certain transactions, the Fund ultimately receives the Inverse Floater plus the cash equivalent of the proceeds raised from the issuance of the Floating-Rate Notes in exchange for the Fixed-Rate Bonds.
Although the Fund physically holds the Inverse Floater, the transaction is accounted for as a secured borrowing pursuant to Statement of Financial Accounting Standards No. 140. Accounting for Transfers and Servicing of Financial Assets and Extinguishments of Liabilities (“SFAS 140”), because of its unilateral right to cause the liquidation of the special-purpose entity and recover the Fixed-Rate Bond it originally sold to the broker. In accordance with SFAS 140, the Fund includes the Fixed-Rate Bond on the Portfolio of Investments and recognizes the Floating-Rate Notes as a liability on the Statement of Assets and Liabilities.
Futures Contracts
The Fund may invest in futures contracts to gain or reduce exposure to particular securities or segments of the bond markets. These futures contracts are financial instruments whose values depend on or are derived from the value of the underlying security index or currency. The Fund may use futures contracts for both hedging and non-hedging purposes, such as to adjust the Fund’s sensitivity to changes in interest rates, or to offset a potential loss in one position by establishing an opposite position. The Fund typically uses futures contracts in an effort to achieve more efficiently, economic exposure similar to that which they could have achieved through the purchase and sale of fixed income securities.
The use of futures contracts involves certain risks, which include: (1) imperfect correlation between the price movement of the instruments and the underlying securities, (2) inability to close out positions due to differing trading hours, or the temporary absence of a liquid market, for either the instruments or the underlying securities, or (3) an inaccurate prediction by Columbia Management Advisors, LLC (“Columbia”), the Fund’s investment advisor, of the future direction of interest rates. Any of these risks may involve amounts exceeding the variation margin recorded in the Fund’s Statement of Assets and Liabilities at any given time.
Upon entering into a futures contract, the Fund pledges cash or securities with the broker in an amount sufficient to meet the initial margin requirement. Subsequent payments are made or received by the Fund equal to the daily change in the contract value and are recorded as variation margin receivable or payable and offset in unrealized gains or losses. The Fund recognizes a realized gain or loss when the contract is closed or expires.
Restricted Securities
Restricted securities are securities that may only be resold upon registration under federal securities laws or in transactions exempt from registration. In some cases, the
54
Columbia High Yield Municipal Fund
June 30, 2008
issuer of restricted securities has agreed to register such securities for resale at the issuer’s expense either upon demand by the Fund or in connection with another registered offering of the securities. Many restricted securities may be resold in the secondary market in transactions exempt from registration. Such restricted securities may be determined to be liquid under criteria established by the Board of Trustees. The Fund will not incur any registration costs upon such resale.
Delayed Delivery Securities
The Fund may trade securities on other than normal settlement terms, including securities purchased or sold on a “when-issued” basis. This may increase the risk if the other party to the transaction fails to deliver and causes the Fund to subsequently invest at less advantageous prices. The Fund holds until the settlement date, in a segregated account, cash or liquid securities in an amount equal to the delayed delivery commitment.
Swap Contracts
The Fund may engage in swap transactions such as interest rate and volatility swaps, consistent with its investment objective and policies, to obtain a desired return at a lower cost than if the Fund had invested directly in the asset that yielded the desired return. Swaps involve the exchange by the Fund with another party of their respective commitments to pay or receive interest or total return throughout the lives of the agreements. The interest to be paid or received on swaps is included in realized gain (loss) on investments. Unrealized gains are reported as an asset and unrealized losses are reported as a liability on the Statement of Assets and Liabilities. A realized gain or loss is recorded upon termination of swap agreements and is equal to the difference between the Fund’s basis in the swap and the proceeds from (or cost of) the closing transaction. Swap agreements are stated at fair value. Notional principal amounts are used to express the extent of involvement in these transactions, but the amounts potentially subject to credit risk are much smaller.
If there is a default by the counterparty to a swap contract, the Fund will be limited to contractual remedies pursuant to the agreements related to the transaction. There is no assurance that the swap contract counterparties will be able to meet their obligations pursuant to the swap contracts or that, in the event of default, the Fund will succeed in pursuing contractual remedies. The Fund thus assumes the risk that it may be delayed in or prevented from obtaining payments owed to it pursuant to the swap contracts.
The use of derivative instruments involves, to varying degrees, elements of market risk in excess of the amount recognized in the Statement of Assets and Liabilities.
Income Recognition
Interest income is recorded on the accrual basis. Premium and discount are amortized and accreted, respectively, on all debt securities, unless otherwise noted. Original issue discount is accreted to interest income over the life of the security with a corresponding increase in the cost basis. Dividend income is recorded on the ex-date.
Determination of Class Net Asset Value
All income, expenses (other than class-specific expenses, as shown on the Statement of Operations) and realized and unrealized gains (losses) are allocated to each class of the Fund on a daily basis for purposes of determining the net asset value of each class. Income and expenses are allocated to each class based on the settled shares method, while realized and unrealized gains (losses) are allocated based on the relative net assets of each class.
Federal Income Tax Status
The Fund intends to qualify each year as a “regulated investment company” under Subchapter M of the Internal Revenue Code, as amended, and will distribute substantially all of its tax exempt or taxable income, if any, for its tax year, and as such will not be subject to federal income taxes. In addition, the Fund intends to distribute in each calendar year substantially all of its net investment income, capital gains and certain other amounts, if any, such that the Fund should not be subject to federal excise tax. Therefore, no federal income or excise tax provision is recorded.
Expenses
General expenses of the Trust are allocated to the Fund and the other series of the Trust based upon relative net assets or other expense allocation methodologies determined by the nature of the expense. Expenses directly attributable to the Fund are charged to the Fund.
55
Columbia High Yield Municipal Fund
June 30, 2008
Distributions to Shareholders
Dividends from net investment income are declared daily and paid monthly. Net realized capital gains, if any, are distributed at least annually.
Indemnification
In the normal course of business, the Fund enters into contracts that contain a variety of representations and warranties and which provide general indemnities. The Fund’s maximum exposure under these arrangements is unknown because this would involve future claims against the Fund. Also, under the Trust’s organizational documents and by contract, the Trustees and officers of the Trust are indemnified against certain liabilities that may arise out of actions relating to their duties to the Trust. However, based on experience, the Fund expects the risk of loss due to these representations, warranties and indemnities to be minimal.
Note 3. Federal Tax Information
The timing and character of income and capital gain distributions are determined in accordance with income tax regulations, which may differ from GAAP. Reclassifications are made to the Fund’s capital accounts for permanent tax differences to reflect income and gains available for distribution (or available capital loss carryforwards) under income tax regulations.
For the year ended June 30, 2008, permanent book and tax basis differences resulting primarily from differing treatments for market discount, discount accretion/premium amortization on debt securities and expired capital loss carryforwards were identified and reclassified among the components of the Fund’s net assets as follows:
| | | | |
| | | | | |
Undistributed
Net Investment
Income | | Accumulated Net Realized
Loss | | Paid-In Capital |
| $(4,156) | | $2,742,488 | | $(2,738,332) |
Net investment income and net realized gains (losses), as disclosed on the Statement of Operations, and net assets were not affected by this reclassification.
The tax character of distributions paid during the years ended June 30, 2008 and June 30, 2007 was as follows:
| | | | | | |
| | | June 30, 2008 | | June 30, 2007 |
| Distributions paid from: | | | | |
Tax-Exempt Income | | $ | 36,711,040 | | $ | 35,337,914 |
Ordinary Income* | | | 36,891 | | | 13,936 |
| * | For tax purposes short-term capital gain distributions, if any, are considered ordinary income distributions. |
As of June 30, 2008, the components of distributable earnings on a tax basis were as follows:
| | |
| | | |
Undistributed
Tax-Exempt Income | | Net
Unrealized Depreciation* |
| $3,249,060 | | $(35,235,559) |
| * | The differences between book-basis and tax-basis net unrealized depreciation are primarily due to discount accretion/premium amortization on debt securities. |
Unrealized appreciation and depreciation at June 30, 2008, based on cost of investments for federal income tax purposes, were:
| | | | |
| | | | |
Unrealized appreciation | | $ | 11,531,110 | |
Unrealized depreciation | | | (46,766,669 | ) |
Net unrealized depreciation | | $ | (35,235,559 | ) |
The following capital loss carryforwards, determined as of June 30, 2008, may be available to reduce taxable income arising from future net realized gains on investments, if any, to the extent permitted by the Internal Revenue Code:
| | |
| | | |
| Year of Expiration | | Capital Loss Carryforwards |
| 2009 | | $ 1,928,565 |
| 2010 | | 1,780,434 |
| 2011 | | 697,947 |
| 2012 | | 1,587,432 |
| 2013 | | 5,621,572 |
| 2014 | | 466,991 |
| 2015 | | 1,471,699 |
| 2016 | | 5,694,295 |
| | |
| Total | | $ 19,248,935 |
| | |
56
Columbia High Yield Municipal Fund
June 30, 2008
Of the capital loss carryforwards attributable to the Fund, $2,176,490 ($1,081,414 expiring on June 30, 2009 and $1,095,076 expiring on June 30, 2010) was obtained in a merger with Liberty High Yield Municipal Fund. Utilization of these losses could be subject to limitations imposed by the Internal Revenue Code.
Capital loss carryforwards of $2,738,332 obtained in a merger with Liberty High Yield Municipal Fund, expired during the year ended June 30, 2008. Expired capital loss carryforwards are recorded as a reduction of paid-in capital.
Under current tax rules, certain capital losses realized after October 31 may be deferred and treated as occurring on the first day of the following fiscal year. As of June 30, 2008, post-October capital losses of $13,135,545 attributed to security transactions were deferred to July 1, 2008.
The Fund adopted Financial Accounting Standards Board (“FASB”) Interpretation No. 48, Accounting for Uncertainty in Income Taxes — an Interpretation of FASB Statement No. 109 (“FIN 48”) effective December 31, 2007. FIN 48 requires management to determine whether a tax position of the Fund is more likely than not to be sustained upon examination by the applicable taxing authority, including resolution of any related appeals or litigation processes, based on the technical merits of the position. The tax benefit to be recognized is measured as the largest amount of benefit that is greater than fifty percent likely of being realized upon ultimate settlement. FIN 48 was applied to all existing tax positions upon initial adoption. Management has evaluated the known implications of FIN 48 on its computation of net assets for the Fund. As a result of this evaluation, management has concluded that FIN 48 did not have any effect on the Fund’s financial statements and no cumulative effect adjustments were recorded. However, management’s conclusions regarding FIN 48 may be subject to review and adjustment at a later date based on factors including, but not limited to, further implementation guidance from the FASB, new tax laws, regulations, and administrative interpretations (including relevant court decisions). The Fund’s federal tax returns for the prior three fiscal years remain subject to examination by the Internal Revenue Service. The Fund is not aware of any tax positions for which it is reasonably possible that the total amounts of unrecognized tax benefits will significantly change in the next twelve months.
Note 4. Fees and Compensation Paid to Affiliates
Investment Advisory Fee
Columbia, an indirect, wholly owned subsidiary of Bank of America Corporation (“BOA”), provides investment advisory services to the Fund. Columbia receives a monthly investment advisory fee based on the Fund’s average daily net assets at the following annual rates:
| | | |
| | | | |
| Average Daily Net Assets | | Annual Fee Rate | |
First $100 million | | 0.450 | % |
$100 million to $200 million | | 0.425 | % |
Over $200 million | | 0.400 | % |
For the year ended June 30, 2008, the Fund’s effective investment advisory fee rate was 0.41% of the Fund’s average daily net assets.
Administration Fee
Columbia provides administrative and other services to the Fund for a monthly administration fee based on the Fund’s average daily net assets at the following annual rates:
| | | |
| | | | |
| Average Daily Net Assets | | Annual Fee Rate | |
First $100 million | | 0.150 | % |
$100 million to $200 million | | 0.125 | % |
Over $200 million | | 0.100 | % |
For the year ended June 30, 2008, the Fund’s effective administration fee rate was 0.11% of the Fund’s average daily net assets.
Pricing and Bookkeeping Fees
The Fund has entered into a Financial Reporting Services Agreement (the “Financial Reporting Services Agreement”) with State Street Bank & Trust Company (“State Street”) and Columbia pursuant to which State Street provides financial reporting services to the Fund. The Fund has also entered into an Accounting Services Agreement (collectively with the Financial Reporting Services Agreement, the “State Street Agreements”) with State Street and Columbia pursuant to which State Street provides accounting services to the Fund. Under the State Street Agreements, the Fund pays State Street an annual fee of $38,000 paid monthly plus an
57
Columbia High Yield Municipal Fund
June 30, 2008
additional monthly fee based on an annualized percentage rate of average daily net assets of the Fund for the month. The aggregate fee will not exceed $140,000 per year (exclusive of out-of-pocket expenses and charges). The Fund also reimburses State Street for certain out-of-pocket expenses and charges.
The Fund has entered into a Pricing and Bookkeeping Oversight and Services Agreement (the “Services Agreement”) with Columbia. Under the Services Agreement, Columbia provides services related to Fund expenses and the requirements of the Sarbanes-Oxley Act of 2002, and provides oversight of the accounting and financial reporting services provided by State Street. Under the Services Agreement, the Fund reimburses Columbia for out-of-pocket expenses. Prior to January 1, 2008, the Fund also reimbursed Columbia for accounting oversight services, services related to Fund expenses and the requirements of the Sarbanes-Oxley Act of 2002.
For the year ended June 30, 2008, the amount charged to the Fund by affiliates included on the Statement of Operations under “Pricing and bookkeeping fees” aggregated to $7,494.
Transfer Agent Fee
Columbia Management Services, Inc. (the “Transfer Agent”), an affiliate of Columbia and an indirect, wholly owned subsidiary of BOA, provides shareholder services to the Fund and has contracted with Boston Financial Data Services (“BFDS”) to serve as sub-transfer agent. The Transfer Agent is entitled to receive a fee for its services, paid monthly, at the annual rate of $17.34 per open account plus reimbursement of certain sub-transfer agent fees paid by the Transfer Agent (exclusive of BFDS fees), calculated based on assets held in omnibus accounts and intended to recover the cost of payments to other parties (including affiliates of BOA) for services to those accounts. Prior to November 1, 2007, the annual rate was $17.00 per open account. The Transfer Agent pays the fees of BFDS for services as sub-transfer agent and is not entitled to reimbursement for such fees from the Fund. The Transfer Agent may also retain, as additional compensation for its services, fees for wire, telephone and redemption orders, IRA trustee agent fees and account transcript fees due to the Transfer Agent from shareholders of the Fund and credits (net of bank charges) earned with respect to balances in accounts the Transfer Agent maintains in connection with its services to the Fund. The Transfer Agent also receives reimbursement for certain out-of-pocket expenses.
An annual minimum account balance fee of $20 may apply to certain accounts with a value below the Fund’s initial minimum investment requirements to reduce the impact of small accounts on transfer agent fees. These minimum account balance fees are recorded as part of expense reductions on the Statement of Operations. For the year ended June 30, 2008, these minimum account balance fees reduced total expenses by $1,527.
Underwriting Discounts, Service and Distribution Fees
Columbia Management Distributors, Inc. (the “Distributor”), an affiliate of Columbia and an indirect, wholly owned subsidiary of BOA, is the principal underwriter of the Fund’s shares. For the year ended June 30, 2008, the Distributor has retained net underwriting discounts of $9,673 on sales of the Fund’s Class A shares and received net CDSC fees of $12,689, $23,627 and $4,765 on Class A, Class B and Class C share redemptions, respectively.
The Fund has adopted Rule 12b-1 plans (the “Plans”), which require the payment of a monthly service fee to the Distributor. The service fee is equal to 0.20% annually of the average daily net assets attributable to Class A, Class B and Class C shares. The Plans also require the payment of a monthly distribution fee to the Distributor at the annual rate of 0.75% of the average daily net assets attributable to Class B and Class C shares only. The Distributor has voluntarily agreed to waive a portion of the Class C shares distribution fee so that it will not exceed 0.60% annually of the average daily net assets attributable to Class C shares. This arrangement may be modified or terminated by the Distributor at any time.
The CDSC and the distribution fees are used principally as repayment to the Distributor for amounts paid by the Distributor to dealers who sold such shares.
Fees Paid to Officers and Trustees
All officers of the Fund are employees of Columbia or its affiliates and, with the exception of the Fund’s Chief Compliance Officer, receive no compensation from the Fund. The Board of Trustees has appointed a Chief Compliance Officer to the Fund in accordance with federal securities regulations. The Fund, along with other affiliated funds, pays its pro-rata share of the expenses associated with the Chief Compliance Officer. The Fund’s expenses for the Chief Compliance Officer will not exceed $15,000 per year.
58
Columbia High Yield Municipal Fund
June 30, 2008
The Fund’s eligible Trustees may participate in a deferred compensation plan which may be terminated at any time. Obligations of the plan will be paid solely out of the Fund’s assets.
Note 5. Custody Credits
The Fund has an agreement with its custodian bank under which custody fees may be reduced by balance credits. These credits are recorded as part of expense reductions on the Statement of Operations. The Fund could have invested a portion of the assets utilized in connection with the expense offset arrangement in an income-producing asset if it had not entered into such an agreement.
For the year ended June 30, 2008, these custody credits reduced total expenses by $11,045 for the Fund.
Note 6. Portfolio Information
For the year ended June 30, 2008, the cost of purchases and proceeds from sales of securities, excluding short-term obligations, were $230,088,428 and $330,464,608, respectively.
During the twelve month period ended June 30, 2008, the Fund held Inverse Floaters, related to portfolio securities against which Floating-Rate Notes were issued (see note 2). Interest paid by the Fund on the Floating-Rate Notes during the period was at a weighted average of 3.821%, with a weighted average outstanding Floating-Rate Notes par value of $9,308,743. During the period, the Fund disposed of the Inverse Floaters and their related Floating-Rate Notes liabilities. At June 30, 2008, the Fund held no Inverse Floaters.
Note 7. Line of Credit
The Fund and other affiliated funds participate in a $350,000,000 committed, unsecured revolving line of credit and a $150,000,000 uncommitted, unsecured line of credit, both provided by State Street. Borrowings are available for short-term liquidity or temporary or emergency purposes.
Interest on the committed line of credit is charged to each participating fund based on the fund’s borrowings at a rate per annum equal to the Federal Funds Rate plus 0.50%. In addition, a commitment fee of 0.10% per annum is accrued and apportioned among the participating funds. Effective September 17, 2007, interest on the uncommitted line of credit is charged to each participating fund based on the fund’s borrowings at a rate per annum equal to the Federal Fund’s Rate plus 0.375%. Prior to September 17, 2007, interest on the uncommitted line of credit was charged to each participating fund based on the fund’s borrowings at a rate per annum equal to the Federal Funds Rate plus 0.50%. State Street charges an annual operations agency fee of $40,000 for the committed line of credit and may charge an annual administration fee of $15,000 for the uncommitted line of credit. The commitment fee, the operations agency fee and the administration fee are accrued and apportioned among the participating funds pro rata based on their relative net assets.
For the year ended June 30, 2008, the Fund did not borrow under these arrangements.
Note 8. Shares of Beneficial Interest
As of June 30, 2008, 67.9% of the shares outstanding were beneficially owned by one participant account over which BOA and/or any of its affiliates had either sole or joint investment discretion. Subscription and redemption activity of this account may have a significant effect on the operations of the Fund.
Note 9. Significant Risks and Contingencies
Tax Development Risk
The Fund purchases municipal securities whose interest, in the opinion of bond counsel, is free from federal income tax. There is no assurance that the Internal Revenue Service (IRS) will agree with this opinion. In the event the IRS determines that an issuer does not comply with relevant tax requirements, interest payments from a security could become federally taxable, possibly retroactively to the date the security was issued. As a shareholder of the Fund, you may be required to file an amended tax return as a result.
Geographic Concentration Risk
The Fund had greater than 5% of its total net assets at June 30, 2008 invested in debt obligations issued by California (5.4%), Florida (12.2%) and Illinois (5.1%) and their political subdivisions, agencies and public authorities. The Fund is more susceptible to economic and political factors adversely affecting issuers of the state’s or territory’s municipal securities than are municipal bond funds that are not concentrated to the same extent in these issuers.
59
Columbia High Yield Municipal Fund
June 30, 2008
Concentration of Credit Risk
The Fund holds investments that are insured by private insurers who guarantee the payment of principal and interest in the event of default or that are supported by a letter of credit. At June 30, 2008, MBIA Insurance Corp. (“MBIA”), a private insurer, insured securities amounting to 5.3 % of the total net assets of the Fund.
At July 30, 2008, MBIA was rated AA by Standard & Poor’s.
High-Yield Securities Risk
Investing in high-yield securities may involve greater credit risk and considerations not typically associated with investing in U.S. Government bonds and other higher quality fixed income securities. These securities are non-investment grade securities, often referred to as “junk” bonds. Economic downturns may disrupt the high yield market and impair the ability of issuers to repay principal and interest. Also, an increase in interest rates would likely have an adverse impact on the value of such obligations. Moreover, high-yield securities may be less liquid to the extent that there is no established secondary market.
Sector Focus Risk
The Fund may focus its investments in certain sectors, subjecting it to greater risk than a fund that is less focused.
Legal Proceedings
On February 9, 2005, Columbia Management Advisors, Inc. (which has since merged into Banc of America Capital Management, LLC (now named Columbia Management Advisors, LLC)) (“Columbia”) and Columbia Funds Distributor, Inc. (which has been renamed Columbia Management Distributors, Inc.) (the “Distributor”) (collectively, the “Columbia Group”) entered into an Assurance of Discontinuance with the New York Attorney General (“NYAG”) (the “NYAG Settlement”) and consented to the entry of a cease-and-desist order by the Securities and Exchange Commission (“SEC”) (the “SEC Order”) on matters relating to mutual fund trading.
Under the terms of the SEC Order, the Columbia Group agreed, among other things, to: pay $70 million in disgorgement and $70 million in civil money penalties; cease and desist from violations of the antifraud provisions and certain other provisions of the federal securities laws; maintain certain compliance and ethics oversight structures; retain an independent consultant to review the Columbia Group’s applicable supervisory, compliance, control and other policies and procedures; and retain an independent distribution consultant (see below). The Columbia Funds have also voluntarily undertaken to implement certain governance measures designed to maintain the independence of their boards of trustees. The NYAG Settlement also, among other things, requires Columbia and its affiliates to reduce management fees for certain Columbia Funds (including the former Nations Funds) and other mutual funds collectively by $32 million per year for five years, for a projected total of $160 million in management fee reductions.
Pursuant to the procedures set forth in the SEC Order, the $140 million in settlement amounts described above is being distributed in accordance with a distribution plan that was developed by an independent distribution consultant and approved by the SEC on April 6, 2007. Distributions under the distribution plan began in late June 2007.
A copy of the SEC Order is available on the SEC website at http://www.sec.gov. A copy of the NYAG Settlement is available as part of the Bank of America Corporation Form 8-K filing on February 10, 2005.
In connection with the events described above, various parties have filed suit against certain funds, the Trustees of the Columbia Funds, FleetBoston Financial Corporation and its affiliated entities and/or Bank of America and its affiliated entities.
On February 20, 2004, the Judicial Panel on Multidistrict Litigation transferred these cases and cases against other mutual fund companies based on similar allegations to the United States District Court in Maryland for consolidated or coordinated pretrial proceedings (the “MDL”). Subsequently, additional related cases were transferred to the MDL. On September 29, 2004, the plaintiffs in the MDL filed amended and consolidated complaints. One of these amended complaints is a putative class action that includes claims under the federal securities laws and state common law, and that names Columbia, the Distributor, the Trustees of the Columbia Funds, Bank of America Corporation and others as defendants. Another of the amended complaints is a derivative action purportedly on behalf of the Columbia Funds that asserts claims under federal securities laws and state common law.
60
Columbia High Yield Municipal Fund
June 30, 2008
On February 25, 2005, Columbia and other defendants filed motions to dismiss the claims in the pending cases. On March 1, 2006, for reasons stated in the court’s memoranda dated November 3, 2005, the United States District Court for the District of Maryland granted in part and denied in part the defendants’ motions to dismiss. The court dismissed all of the class action claims pending against the Columbia Funds Trusts. As to Columbia and the Distributor, the claims under the Securities Act of 1933, the claims under Sections 34(b) and 36(a) of the Investment Company Act of 1940 (“ICA”) and the state law claims were dismissed. The claims under Sections 10(b) and 20(a) of the Securities Exchange Act of 1934 and claims under Section 36(b) of the ICA were not dismissed.
On March 21, 2005, a purported class action was filed in Massachusetts state court alleging that certain conduct, including market timing, entitled Class B shareholders in certain Columbia funds to an exemption from contingent deferred sales charges upon early redemption (“the CDSC Lawsuit”). The CDSC Lawsuit was removed to federal court in Massachusetts and transferred to the MDL.
On September 14, 2007, the plaintiffs and the Columbia defendants named in the MDL, including the Columbia Funds, entered into a stipulation of settlement with respect to all Columbia-related claims in the MDL described above, including the CDSC Lawsuit. The settlement is subject to court approval.
In 2004, the Columbia Funds’ adviser and distributor and certain affiliated entities and individuals were named as defendants in certain purported shareholder class and derivative actions making claims, including claims under the Investment Company and the Investment Advisers Acts of 1940 and state law. Certain Columbia Funds were named as nominal defendants. The suits allege, inter alia, that the fees and expenses paid by the funds are excessive and that the advisers and their affiliates inappropriately used fund assets to distribute the funds and for other improper purposes. On March 2, 2005, the actions were consolidated in the Massachusetts federal court as In re Columbia Entities Litigation. The plaintiffs filed a consolidated amended complaint on June 9, 2005. On November 30, 2005, the judge dismissed all claims by plaintiffs and entered final judgment in favor of the defendants. The plaintiffs appealed to the United States Court of Appeals for the First Circuit on December 30, 2005. A stipulation and settlement agreement dated January 19, 2007 was filed in the First Circuit on February 14, 2007, with a joint stipulation of dismissal and motion for remand to obtain district court approval of the settlement. That joint motion was granted and the appeal was dismissed. On March 6, 2007, the case was remanded to the District Court. The settlement, approved by the District Court on September 18, 2007, became effective October 19, 2007. Pursuant to the settlement, the funds’ adviser and/or its affiliates made certain payments, including plaintiffs’ attorneys’ fees and costs of notice to class members.
61
Report of Independent Registered Public Accounting Firm
To the Trustees of Columbia Funds Series Trust I and the Shareholders of Columbia High Yield Municipal Fund
In our opinion, the accompanying statement of assets and liabilities, including the investment portfolio, and the related statements of operations and of changes in net assets and the financial highlights present fairly, in all material respects, the financial position of Columbia High Yield Municipal Fund (the “Fund”) (a series of Columbia Funds Series Trust I) at June 30, 2008, the results of its operations for the year then ended, the changes in its net assets for each of the two years in the period then ended and the financial highlights for each of the five years in the period then ended, in conformity with accounting principles generally accepted in the United States of America. These financial statements and financial highlights (hereafter referred to as “financial statements”) are the responsibility of the Fund’s management. Our responsibility is to express an opinion on these financial statements based on our audits. We conducted our audits of these financial statements in accordance with the standards of the Public Company Accounting Oversight Board (United States). Those standards require that we plan and perform the audit to obtain reasonable assurance about whether the financial statements are free of material misstatement. An audit includes examining, on a test basis, evidence supporting the amounts and disclosures in the financial statements, assessing the accounting principles used and significant estimates made by management, and evaluating the overall financial statement presentation. We believe that our audits, which included confirmation of securities at June 30, 2008 by correspondence with the custodian and brokers, provide a reasonable basis for our opinion.
PricewaterhouseCoopers LLP
Boston, Massachusetts
August 20, 2008
62
Federal Income Tax Information (Unaudited) – Columbia High Yield Municipal Fund
For the fiscal year ended June 30, 2008, 99.90% of distributions made from net investment income of Columbia High Yield Municipal Fund are exempt for Federal income tax purposes. A portion of the income may also be subject to Federal Alternative Minimum Tax.
63
Fund Governance
The Trustees serve terms of indefinite duration. The names, addresses and ages of the Trustees and officers of the Funds in Columbia Funds Series Trust I, the year each was first elected or appointed to office, their principal business occupations during at least the last five years, the number of Funds overseen by each Trustee and other directorships they hold are shown below. Each officer listed below serves as an officer of each Fund in the Columbia Funds Complex.
Independent Trustees
| | |
Name, address and year of birth,
Position with Funds, Year first
elected or appointed to office1 | | Principal occupation(s) during past five years, Number of portfolios in Columbia funds
Complex overseen by trustee, Other directorships held |
| |
| John D. Collins (Born 1938) | | |
c/o Columbia Management Advisors, LLC One Financial Center Boston, MA 02111 Trustee2 (since 2007) | | Retired. Consultant, KPMG, LLP from July 1999 to June 2000; Partner, KPMG, LLP from March 1962 to June 1999. Oversees 77, Mrs. Fields Famous Brands LLC (consumer products); Suburban Propane Partners, L.P.; and Montpelier Re |
| |
| Rodman L. Drake (Born 1943) | | |
c/o Columbia Management Advisors, LLC One Financial Center Boston, MA 02111 Trustee2 (since 2007) | | Co-Founder of Baringo Capital LLC (private equity) since 2002; President, Continuation Investments Group, Inc. from 1997 to 2001. Oversees 77, Jackson Hewitt Tax Service Inc. (tax preparation services); Crystal Capital River Inc. (real estate investment trust); Student Loan Corporation (student loan provider); Celgene Corporation (global biotechnology company); Apex Silver Mines Ltd. (mining); and Hyperion Brookfield Total Return Fund Inc. and Hyperion Brookfield Strategic Mortgage Income Fund (exchange-traded funds) |
| |
| Douglas A. Hacker (Born 1955) | | |
c/o Columbia Management Advisors, LLC One Financial Center Boston, MA 02111 Trustee (since 1996) | | Independent business executive since May, 2006; Executive Vice President–Strategy of United Airlines (airline) from December, 2002 to May, 2006; President of UAL Loyalty Services (airline marketing company) from September, 2001 to December, 2002; Executive Vice President and Chief Financial Officer of United Airlines from July, 1999 to September, 2001. Oversees 77, Nash Finch Company (food distributor); Aircastle Limited (aircraft leasing) |
| |
| Janet Langford Kelly (Born 1957) | | |
c/o Columbia Management Advisors, LLC One Financial Center Boston, MA 02111 Trustee (since 1996) | | Senior Vice President, General Counsel and Corporate Secretary, ConocoPhillips (integrated energy company) since September, 2007; Deputy General Counsel– Corporate Legal Services, ConocoPhillips from August, 2006 to August, 2007; Partner, Zelle, Hofmann, Voelbel, Mason & Gette LLP (law firm) from March, 2005 to July, 2006; Adjunct Professor of Law, Northwestern University, from September, 2004 to June, 2006, Director, UAL Corporation (airline) from February, 2006 to July, 2006; Chief Administrative Officer and Senior Vice President, Kmart Holding Corporation (consumer goods), from September, 2003 to March, 2004; Executive Vice President– Corporate Development and Administration, General Counsel and Secretary, Kellogg Company (food manufacturer), from September, 1999 to August, 2003. Oversees 77, None |
64
Fund Governance (continued)
Independent Trustees (continued)
| | |
Name, address and year of birth,
Position with Funds, Year first
elected or appointed to office1 | | Principal occupation(s) during past five years, Number of portfolios in Columbia funds
Complex overseen by trustee, Other directorships held |
| |
| Charles R. Nelson (Born 1942) | | |
c/o Columbia Management Advisors, LLC One Financial Center Boston, MA 02111 Trustee (since 1981) | | Professor of Economics, University of Washington, since January, 1976; Ford and Louisa Van Voorhis Professor of Political Economy, University of Washington, since September, 1993; Director, Institute for Economic Research, University of Washington from September, 2001 to June, 2003; Adjunct Professor of Statistics, University of Washington, since September, 1980; Associate Editor, Journal of Money Credit and Banking, since September, 1993; consultant on econometric and statistical matters. Oversees 77, None |
| |
| John J. Neuhauser (Born 1943) | | |
c/o Columbia Management Advisors, LLC One Financial Center Boston, MA 02111 Trustee (since 1985) | | President, Saint Michael’s College, since August, 2007; University Professor, Boston College from November, 2005 to August, 2007; Academic Vice President and Dean of Faculties, Boston College from August, 1999 to October, 2005. Oversees 77, Liberty All-Star Equity Fund and Liberty All-Star Growth Fund, Inc. (closed-end funds) |
| |
| Jonathan Piel (Born 1938) | | |
c/o Columbia Management Advisors, LLC One Financial Center Boston, MA 02111 Trustee2 (since 2007) | | Cable television producer and website designer; The Editor, Scientific American from 1984 to 1994 and Vice President from 1984 to 1994; Member, Advisory Board, Stone Age Institute, Bloomington, Indiana (research institute that explores the effect of technology on human evolution); Member, Board of Directors of the National Institute of Social Sciences, New York City; and Member, Board of Trustees of the William Alanson White Institute, New York City (institution for training psychoanalysts). Oversees 77, None |
| |
Patrick J. Simpson (Born 1944) | | |
c/o Columbia Management Advisors, LLC One Financial Center Boston, MA 02111 Trustee (since 2000) | | Partner, Perkins Coie LLP (law firm). Oversees 77, None |
| |
| Thomas C. Theobald (Born 1937) | | |
c/o Columbia Management Advisors, LLC One Financial Center Boston, MA 02111 Trustee and Chairman of the Board (since 1996) | | Partner and Senior Advisor, Chicago Growth Partners (private equity investing) since September, 2004; Managing Director, William Blair Capital Partners (private equity investing) from September, 1994 to September, 2004. Oversees 77, Anixter International (network support equipment distributor); Ventas, Inc. (real estate investment trust); Jones Lang LaSalle (real estate management services); Ambac Financial Group (financial guaranty insurance) |
| |
| Anne-Lee Verville (Born 1945) | | |
c/o Columbia Management Advisors, LLC One Financial Center Boston, MA 02111 Trustee (since 1998) | | Retired since 1997 (formerly General Manager–General Education Industry (from 1994 to 1997), President–Application Systems Division (from 1991 to 1994), Chief Financial Officer–US Marketing & Services (from 1988 to 1991), and Chief Information Officer (from 1987 to 1988), IBM Corporation (computer and technology)). Oversees 77, None |
65
Fund Governance (continued)
Interested Trustee
| | |
Name, address and year of birth,
Position with Funds, Year first
elected or appointed to office1 | | Principal occupation(s) during past five years, Number of portfolios in Columbia funds
Complex overseen by trustee, Other directorships held |
| |
| William E. Mayer (Born 1940) | | |
c/o Columbia Management Advisors, LLC One Financial Center Boston, MA 02111 Trustee3 (since 1994) | | Partner, Park Avenue Equity Partners (private equity) since February, 1999; Dean and Professor, College of Business, University of Maryland, 1992 to 1997. Oversees 77, Lee Enterprises (print media), WR Hambrecht + Co. (financial service provider); BlackRock Kelso Capital Corporation (investment company) |
1 | In December 2000, the boards of each of the former Liberty Funds and former Stein Roe Funds were combined into one board of trustees responsible for the oversight of both fund groups (collectively, the “Liberty Board”). In October 2003, the trustees on the Liberty Board were elected to the boards of the Columbia Funds (the “Columbia Board”) and of the CMG Fund Trust (the “CMG Funds Board”); simultaneous with that election, Patrick J. Simpson who had been a director on the Columbia Board and trustee on the CMG Funds Board, was appointed to serve as trustee of the Liberty Board. The date shown is the earliest date on which a trustee/director was elected or appointed to the board of a Fund in the Columbia Funds Complex. |
2 | Messrs. Drake, Piel and Collins have served as directors/trustees of the Excelsior Funds since 1996, 1996 and 2005, respectively. The Excelsior Funds consisted of 27 portfolios managed by affiliates of Columbia Management Advisors, LLC. Effective December 12, 2007, the Board elected Messrs. Drake, Piel and Collins as Trustees of the Trust. |
3 | Mr. Mayer is an “interested person” (as defined in the Investment Company Act of 1940) by reason of his affiliation with WR Hambrecht + Co., a registered broker/dealer that may execute portfolio transactions for or engage in principal transactions with the Funds or other funds or accounts advised/managed by the Advisor or other Bank of America affiliates. |
The Statement of Additional Information includes additional information about the Trustees of the Funds and is available, without charge, upon request by calling 1-800-426-3750.
66
Fund Governance (continued)
Officers
| | |
Name, address and year of birth,
position with Columbia Funds, Year
first elected or appointed to office | | Principal occupation(s) during past five years |
| |
| Christopher L. Wilson (Born 1957) | | |
One Financial Center Boston, MA 02111 President (since 2004) | | President–Columbia Funds, since October 2004; Managing Director–Columbia Management Advisors, LLC, since September 2005; Senior Vice President–Columbia Management Distributors, Inc., since January 2005; Director–Columbia Management Services, Inc., since January 2005; Director–Bank of America Global Liquidity Funds, plc and Banc of America Capital Management (Ireland), Limited, since May 2005; Director–FIM Funding, Inc., since January 2005; President and Chief Executive Officer–CDC IXIS AM Services, Inc. (investment management), from September 1998 through August 2004; and a senior officer or director of various other Bank of America affiliated entities, including other registered and unregistered funds. |
| |
| James R. Bordewick, Jr. (Born 1959) | | |
One Financial Center Boston, MA 02111 Senior Vice President, Secretary and Chief Legal Officer (since 2006) | | Associate General Counsel, Bank of America since April, 2005; Senior Vice President and Associate General Counsel, MFS Investment Management (investment management) prior to April, 2005. |
| |
| J. Kevin Connaughton (Born 1964) | | |
One Financial Center Boston, MA 02111 Senior Vice President and Chief Financial Officer (since 2000) | | Managing Director of Columbia Management Advisors, LLC since December 2004; Treasurer–Columbia Funds, from October 2003 to May 2008; Treasurer–the Liberty Funds, Stein Roe Funds and Liberty All-Star Funds, December 2000–December 2006; Senior Vice President–Columbia Management Advisors, LLC, from April 2003 to December 2004; President–Columbia Funds, Liberty Funds and Stein Roe Funds, February 2004 to October 2004; Treasurer–Galaxy Funds, September 2002 to December 2005; Treasurer, December 2002 to December 2004, and President, February 2004 to December 2004–Columbia Management Multi-Strategy Hedge Fund, LLC; and a senior officer of various other Bank of America-affiliated entities, including other registered and unregistered funds. |
| |
| Linda J. Wondrack (Born 1964) | | |
One Financial Center Boston, MA 02111 Senior Vice President and Chief Compliance Officer (since 2007) | | Director (Columbia Management Group LLC and Investment Product Group Compliance), Bank of America since June 2005; Director of Corporate Compliance and Conflicts Officer, MFS Investment Management (investment management), August 2004 to May 2005; Managing Director, Deutsche Asset Management (investment management) prior to August 2004. |
| |
| Michael G. Clarke (Born 1969) | | |
One Financial Center Boston, MA 02111 Treasurer (since 2008) | | Director of Fund Administration of the Advisor since January 2006; Managing Director of the Advisor, September 2004 to December 2005; Vice President Fund Administration June 2002 to September 2004. |
| |
| Jeffrey R. Coleman (Born 1969) | | |
One Financial Center Boston, MA 02111 Deputy Treasurer (since 2006) | | Director of Fund Administration of the Advisor since January, 2006; Fund Controller of the Advisor from October 2004 to January 2006; Vice President of CDC IXIS Asset Management Services, Inc. (investment management) from August, 2000 to September, 2004. |
67
Fund Governance (continued)
Officers (continued)
| | |
Name, address and year of birth,
position with Columbia Funds, Year
first elected or appointed to office | | Principal occupation(s) during past five years |
| |
| Joseph F. DiMaria (Born 1968) | | |
One Financial Center Boston, MA 02111 Deputy Treasurer (since 2006) | | Director of Fund Administration of the Advisor since January, 2006; Head of Tax/Compliance and Assistant Treasurer of the Advisor from November, 2004 to December, 2005; Director of Trustee Administration (Sarbanes-Oxley) of the Advisor from May, 2003 to October, 2004; Senior Audit Manager, PricewaterhouseCoopers (independent registered public accounting firm) from July, 2000 to April, 2003. |
| |
| Barry S. Vallan (Born 1969) | | |
One Financial Center Boston, MA 02111 Controller (since 2006) | | Vice President–Fund Treasury of the Advisor since October, 2004; Vice President– Trustee Reporting of the Advisor from April, 2002 to October, 2004; Management Consultant, PricewaterhouseCoopers (independent registered public accounting firm) prior to October, 2002. |
68
Important Information About This Report – Columbia High Yield Municipal Fund
Transfer Agent
Columbia Management Services, Inc.
P.O. Box 8081
Boston, MA 02266-8081
1-800-345-6611
Distributor
Columbia Management
Distributors, Inc.
One Financial Center
Boston, MA 02111
Investment Advisor
Columbia Management Advisors, LLC
100 Federal Street
Boston, MA 02110
The fund mails one shareholder report to each shareholder address. If you would like more than one report, please call shareholder services at 1-800-345-6611 and additional reports will be sent to you. This report has been prepared for shareholders of Columbia High Yield Municipal Fund.
A description of the policies and procedures that the fund uses to determine how to vote proxies and a copy of the fund’s voting records are available (i) at www.columbiamanagement.com; (ii) on the Securities and Exchange Commission’s website at www.sec.gov, and (iii) without charge, upon request, by calling 1-800-368-0346. Information regarding how the fund voted proxies relating to portfolio securities during the 12-month period ended June 30 is available from the SEC’s website. Information regarding how the fund voted proxies relating to portfolio securities is also available from the fund’s website.
The fund files a complete schedule of portfolio holdings with the SEC for the first and third quarters of each fiscal year on Form N-Q. The fund’s Form N-Q is available on the SEC’s website at www.sec.gov and may be reviewed and copied at the SEC’s Public Reference Room in Washington, D.C. Information on the operation of the Public Reference Room may be obtained by calling 1-800-SEC-0330.
Please read and consider the investment objectives, risks, charges and expenses for any fund carefully before investing. For a prospectus which contains this and other important information about the fund, contact your Columbia Management representative or financial advisor or go to www.columbiamanagement.com.
Columbia Management Group, LLC (“Columbia Management”) is the investment management division of Bank of America Corporation. Columbia Management entities furnish investment management services and products for institutional and individual investors. Columbia Funds are distributed by Columbia Management Distributors, Inc., member of FINRA, SIPC, part of Columbia Management and an affiliate of Bank of America Corporation.
69

Columbia High Yield Municipal Fund
Annual Report, June 30, 2008
©2008 Columbia Management Distributors, Inc.
One Financial Center, Boston, MA 02111-2621
800.345.6611 www.columbiafunds.com
SHC-42/154638-0608 (08/08) 08/53564
Item 2. Code of Ethics.
| | (a) | The registrant has, as of the end of the period covered by this report, adopted a code of ethics that applies to the registrant’s principal executive officer, principal financial officer, principal accounting officer or controller, or persons performing similar functions, regardless of whether these individuals are employed by the registrant or a third party. |
| | (b) | During the period covered by this report, there were not any amendments to a provision of the code of ethics adopted in 2(a) above. |
| | (c) | During the period covered by this report, there were no waivers, including any implicit waivers, from a provision of the code of ethics described in 2(a) above that relates to one or more of the items set forth in paragraph (b) of this item’s instructions. |
Item 3. Audit Committee Financial Expert.
The registrant’s Board of Trustees has determined that Douglas A. Hacker, John D. Collins and Anne-Lee Verville, each of whom are members of the registrant’s Board of Trustees and Audit Committee, each qualify as an audit committee financial expert. Mr. Hacker, Mr. Collins and Ms. Verville are each independent trustees, as defined in paragraph (a)(2) of this item’s instructions.
Item 4. Principal Accountant Fees and Services.
Fee information below is disclosed for the two series of the registrant whose report to stockholders is included in this annual filing.
(a) Audit Fees. Aggregate Audit Fees billed by the principal accountant for professional services rendered during the fiscal years ended June 30, 2008 and June 30, 2007 are approximately as follows:
Audit Fees include amounts related to the audit of the registrant’s annual financial statements or services that are normally provided by the accountant in connection with statutory and regulatory filings or engagements for those fiscal years.
(b) Audit-Related Fees. Aggregate Audit-Related Fees billed to the registrant by the principal accountant for professional services rendered during the fiscal years ended June 30, 2008 and June 30, 2007 are approximately as follows:
Audit-Related Fees include amounts for assurance and related services by the principal accountant that are reasonably related to the performance of the audit of the registrant’s financial statements and are not reported in Audit Fees above. In both fiscal years 2008 and 2007, Audit-Related Fees consist of agreed-upon procedures performed for semi-annual shareholder reports.
During the fiscal years ended June 30, 2008 and June 30, 2007, there were no Audit-Related Fees billed by the registrant’s principal accountant to the registrant’s investment adviser (not including any sub-adviser whose role is primarily portfolio management and is subcontracted with or overseen by another investment adviser) and any entity controlling, controlled by, or under common control with the adviser that provides ongoing services to the registrant for an engagement that related directly to the operations and financial reporting of the registrant.
(c) Tax Fees. Aggregate Tax Fees billed by the principal accountant to the registrant for professional services rendered during the fiscal years ended June 30, 2008 and June 30, 2007 are approximately as follows:
Tax Fees include amounts for the review of annual tax returns, the review of required shareholder distribution calculations and typically include amounts for professional services by the principal accountant for tax compliance, tax advice and tax planning.
During the fiscal years ended June 30, 2008 and June 30, 2007, there were no Tax Fees billed by the registrant’s principal accountant to the registrant’s investment adviser (not including any sub-adviser whose role is primarily portfolio management and is subcontracted with or overseen by another investment adviser) and any entity controlling, controlled by, or under common control with the adviser that provides ongoing services to the registrant for an engagement that related directly to the operations and financial reporting of the registrant.
(d) All Other Fees. Aggregate All Other Fees billed by the principal accountant to the registrant for professional services rendered during the fiscal years ended June 30, 2008 and June 30, 2007 are approximately as follows:
All Other Fees include amounts for products and services provided by the principal accountant, other than the services reported in paragraphs (a) through (c) above. In fiscal year 2007, All Other Fees consist of fees billed for agreed-upon procedures related to the review of the registrant’s anti-money laundering program.
Aggregate All Other Fees billed by the registrant’s principal accountant to the registrant’s investment adviser (not including any sub-adviser whose role is primarily portfolio management and is subcontracted with or overseen by another investment adviser) and any entity controlling, controlled by, or under common control with the adviser that provides ongoing services to the registrant for an engagement that related directly to the operations and financial reporting of the registrant during the fiscal years ended June 30, 2008 and June 30, 2007 are approximately as follows:
| | |
2008 | | 2007 |
$1,210,800 | | $849,100 |
In both fiscal years 2008 and 2007, All Other Fees consist of fees billed for internal control examinations of the registrant’s transfer agent and investment advisor.
(e)(1) Audit Committee Pre-Approval Policies and Procedures
The registrant’s Audit Committee is required to pre-approve the engagement of the registrant’s independent accountants to provide audit and non-audit services to the registrant and non-audit services to its investment adviser (not including any sub-adviser whose role is primarily portfolio management and is subcontracted with or overseen by another investment adviser) or any entity controlling, controlled by or under common control with such investment adviser that provides ongoing services to the registrant (“Adviser Affiliates”), if the engagement relates directly to the operations and financial reporting of the registrant.
The Audit Committee has adopted a Policy for Engagement of Independent Accountants for Audit and Non-Audit Services (“Policy”). The Policy sets forth the understanding of the Audit Committee regarding the engagement of the registrant’s independent accountants to provide (i) audit and permissible audit-related, tax and other services to the registrant (collectively “Fund Services”); (ii) non-audit services to the registrant’s investment adviser (not including any sub-adviser whose role is primarily portfolio management and is subcontracted with or overseen by another investment adviser) and Adviser Affiliates, if the engagement relates directly to the operations or financial reporting of a Fund (collectively “Fund-related Adviser Services”); and (iii) certain other audit and non-audit services to the registrant’s investment adviser (not including any sub-adviser whose role is primarily portfolio management and is subcontracted with or overseen by another investment adviser) and Adviser Affiliates. Unless a type of service receives general pre-approval under the Policy, it requires specific pre-approval by the Audit Committee if it is to be provided by the independent accountants. Pre-approval of non-audit services to the registrant, the registrant’s investment adviser (not including any sub-adviser whose role is primarily portfolio management and is subcontracted with or overseen by another investment adviser) and Adviser Affiliates may be waived provided that the “de minimis” requirements set forth under paragraph (c)(7)(i)(C) of Rule 2-01 of Regulation S-X are met.
Under the Policy, the Audit Committee may delegate pre-approval authority to any pre-designated member or members who are Independent Trustees/Directors. The member(s) to whom such authority is delegated must report, for informational purposes only, any pre-approval decisions to the Audit Committee at its next regular meeting. The Audit Committee’s responsibilities with respect to the pre-approval of services performed by the independent accountants may not be delegated to management.
The Policy requires the Fund Treasurer and/or Director of Board Administration to submit to the Audit Committee, on an annual basis, a schedule of the types of services that are subject to general pre-approval. The schedule(s) provide a description of each type of service that is subject to general pre-approval and, where possible, will provide estimated fee caps for each instance of providing each service. The Audit Committees will review and approve the types of services and review the projected fees for the next fiscal year and may add to, or subtract from, the list of general pre-approved services from time to time based on subsequent determinations. That approval acknowledges that the Audit Committee is in agreement with the specific types of services that the independent accountants will be permitted to perform.
The Fund Treasurer and/or Director of Board Administration shall report to the Audit Committee at each of its regular meetings regarding all Fund Services or Fund-related Adviser Services initiated since the last such report was rendered, including a general description of the services, actual billed and projected fees, and the means by which such Fund Services or Fund-related Adviser Services were pre-approved by the Audit Committee.
*****
(e)(2) The percentage of services described in paragraphs (b) through (d) of this Item approved pursuant to the “de minimis” exception under paragraph (c)(7)(i)(C) of Rule 2-01 of Regulation S-X during both fiscal years ended June 30, 2008 and June 30, 2007 was zero.
(g) The aggregate non-audit fees billed by the registrant’s accountant for services rendered to the registrant, and rendered to the registrant’s investment adviser (not including any sub-adviser whose role is primarily portfolio management and is subcontracted with or overseen by another investment adviser), and any entity controlling, controlled by, or under common control with the adviser that provides ongoing services to the registrant for the fiscal years ended June 30, 2008 and June 30, 2007 are approximately as follows:
| | |
2008 | | 2007 |
$1,229,900 | | $867,200 |
(h) The registrant’s Audit Committee of the Board of Directors has considered whether the provision of non-audit services that were rendered to the registrant’s adviser (not including any sub-adviser whose role is primarily portfolio management and is subcontracted with or overseen by another investment adviser), and any entity controlling, controlled by, or under common control with the investment adviser that provides ongoing services to the registrant that were not pre-approved pursuant to paragraph (c)(7)(ii) of Rule 2-01 of Regulation S-X, is compatible with maintaining the principal accountant’s independence.
Item 5. Audit Committee of Listed Registrants.
Not applicable.
Item 6. Investments
| | (a) | The registrant’s “Schedule I – Investments in securities of unaffiliated issuers” (as set forth in 17 CFR 210.12-12) is included in Item 1 of this Form N-CSR. |
Item 7. Disclosure of Proxy Voting Policies and Procedures for Closed-End Management Investment Companies.
Not applicable.
Item 8. Portfolio Managers of Closed-End Management Investment Companies.
Not applicable.
Item 9. Purchases of Equity Securities by Closed-End Management Investment Company and Affiliated Purchasers.
Not applicable.
Item 10. Submission of Matters to a Vote of Security Holders.
There have not been any material changes to the procedures by which shareholders may recommend nominees to the registrant’s board of directors, since those procedures were last disclosed in response to requirements of Item 407(c)(2)(iv) of Regulation S-K (as required by Item 22(b)(15) of Schedule 14A) or this Item.
Item 11. Controls and Procedures.
| | (a) | The registrant’s principal executive officer and principal financial officers, based on their evaluation of the registrant’s disclosure controls and procedures as of a |
date within 90 days of the filing of this report, have concluded that such controls and procedures are adequately designed to ensure that information required to be disclosed by the registrant in Form N-CSR is accumulated and communicated to the registrant’s management, including the principal executive officer and principal financial officer, or persons performing similar functions, as appropriate to allow timely decisions regarding required disclosure.
| | (b) | There was no change in the registrant’s internal control over financial reporting that occurred during the registrant’s second fiscal quarter of the period covered by this report that has materially affected, or is reasonably likely to materially affect, the registrant’s internal control over financial reporting. |
Item 12. Exhibits.
(a)(1) Code of ethics required to be disclosed under Item 2 of Form N-CSR attached hereto as Exhibit 99.CODE ETH.
(a)(2) Certifications pursuant to Rule 30a-2(a) under the Investment Company Act of 1940 (17 CFR 270.30a-2(a)) attached hereto as Exhibit 99.CERT.
(a)(3) Not applicable.
(b) Certification pursuant to Rule 30a-2(b) under the Investment Company Act of 1940 (17 CFR 270.30a-2(b)) attached hereto as Exhibit 99.906CERT.
SIGNATURES
Pursuant to the requirements of the Securities Exchange Act of 1934 and the Investment Company Act of 1940, the registrant has duly caused this report to be signed on its behalf by the undersigned, thereunto duly authorized.
| | |
| (registrant) | | Columbia Funds Series Trust I |
| | | | |
| By (Signature and Title) | | /s/ Christopher L. Wilson |
| | Christopher L. Wilson, President |
Pursuant to the requirements of the Securities Exchange Act of 1934 and the Investment Company Act of 1940, this report has been signed below by the following persons on behalf of the registrant and in the capacities and on the dates indicated.
| | | | |
| By (Signature and Title) | | /s/ Christopher L. Wilson |
| | Christopher L. Wilson, President |
| | | | |
| By (Signature and Title) | | /s/ J. Kevin Connaughton |
| | J. Kevin Connaughton, Chief Financial Officer |