UNITED STATES
SECURITIES AND EXCHANGE COMMISSION
Washington, D.C. 20549
FORM N-CSR
CERTIFIED SHAREHOLDER REPORT OF REGISTERED
MANAGEMENT INVESTMENT COMPANIES
Investment Company Act file number | 811-4367 |
|
Columbia Funds Series Trust I |
(Exact name of registrant as specified in charter) |
|
One Financial Center, Boston, Massachusetts | | 02111 |
(Address of principal executive offices) | | (Zip code) |
|
James R. Bordewick, Jr., Esq.
Columbia Management Advisors, LLC
One Financial Center
Boston, MA 02111 |
(Name and address of agent for service) |
|
Registrant’s telephone number, including area code: | 1-617-426-3750 | |
|
Date of fiscal year end: | October 31 | |
|
Date of reporting period: | October 31, 2008 | |
| | | | | | | | |
Form N-CSR is to be used by management investment companies to file reports with the Commission not later than 10 days after the transmission to stockholders of any report that is required to be transmitted to stockholders under Rule 30e-1 under the Investment Company Act of 1940 (17 CFR 270.30e-1). The Commission may use the information provided on Form N-CSR in its regulatory, disclosure review, inspection, and policymaking roles.
A registrant is required to disclose the information specified by Form N-CSR, and the Commission will make this information public. A registrant is not required to respond to the collection of information contained in Form N-CSR unless the Form displays a currently valid Office of Management and Budget (“OMB”) control number. Please direct comments concerning the accuracy of the information collection burden estimate and any suggestions for reducing the burden to Secretary, Securities and Exchange Commission, 450 Fifth Street, NW, Washington, DC 20549-0609. The OMB has reviewed this collection of information under the clearance requirements of 44 U.S.C. § 3507.
Item 1. Reports to Stockholders.
Columbia Management®
Annual Report
October 31, 2008
Columbia California Tax-Exempt Fund
| NOT FDIC INSURED | | May Lose Value | |
|
| NOT BANK ISSUED | | No Bank Guarantee | |
|
Table of Contents
| Fund Profile | | | 1 | | |
|
| Economic Update | | | 2 | | |
|
| Performance Information | | | 3 | | |
|
| Understanding Your Expenses | | | 4 | | |
|
| Portfolio Manager's Report | | | 5 | | |
|
| Investment Portfolio | | | 7 | | |
|
Statement of Assets and
Liabilities | | | 18 | | |
|
| Statement of Operations | | | 19 | | |
|
Statement of Changes in
Net Assets | | | 20 | | |
|
| Financial Highlights | | | 22 | | |
|
| Notes to Financial Statements | | | 26 | | |
|
Report of Independent Registered
Public Accounting Firm | | | 34 | | |
|
| Federal Income Tax Information | | | 35 | | |
|
| Fund Governance | | | 36 | | |
|
Board Consideration and
Approval of Advisory
Agreements | | | 40 | | |
|
Summary of Management Fee
Evaluation by Independent
Fee Consultant | | | 43 | | |
|
Important Information About
This Report | | | 49 | | |
|
The views expressed in this report reflect the current views of the respective parties. These views are not guarantees of future performance and involve certain risks, uncertainties and assumptions that are difficult to predict, so actual outcomes and results may differ significantly from the views expressed. These views are subject to change at any time based upon economic, market or other conditions and the respective parties disclaim any responsibility to update such views. These views may not be relied on as investment advice and, because investment decisions for a Columbia Fund are based on numerous factors, may not be relied on as an indication of trading intent on behalf of any particular Columbia Fund. References to specific securities should not be construed as a recommendation or investment advice.
President's Message

Dear Shareholder:
We are pleased to provide this shareholder report for your Columbia Fund and hope you will find the portfolio management details, discussions and performance information helpful in monitoring your investments. As we've seen this past year, the financial markets can be quite volatile, with significant short-term price fluctuations. It's important to keep these ups and downs in perspective, particularly in light of your long-term investment strategy.
Staying the course with your long-term strategy typically involves riding out short-term price fluctuations, though we recognize that at times this can be tough. To support your efforts and give you the information you need to make prudent decisions, Columbia Management offers several valuable online resources. We encourage you to visit www.columbiamanagement.com/investor, where you can receive the most up-to-date information, including:
g Daily pricing and performance. View pricing and performance from a link in Fund Tracker on the homepage. This listing of funds is updated nightly with the current net asset value and the amount and percentage change from the prior day.
g News & Commentary. This tab provides links to quarterly fund commentaries and information from our investment strategies group, including trends in the economy and market impact.
If you would like more details on individual funds, select a fund from the dropdown menu on the top right side of the homepage for access to:
g Monthly and quarterly performance information.
g Portfolio holdings. Full holdings are updated monthly for money market funds, except for Columbia Cash Reserves, Columbia Government Plus Reserves, Columbia Government Reserves, Columbia Treasury Reserves and Columbia Money Market Reserves which are updated weekly, monthly for equity funds and quarterly for most other funds.
g Quarterly fact sheets. Accessible from the Literature tab in each fund page.
By registering on the site, you'll receive secured, 24-hour access to*:
g Mutual fund account details with balances, dividend and transaction information.
g Fund Tracker to customize your homepage with current net asset values for the funds that interest you.
g On-line transactions including purchases, exchanges and redemptions.
g Account maintenance for updating your address and dividend payment options.
g Electronic delivery of prospectuses and shareholder reports.
I encourage you to visit our website for access to the product information and tools described above. These valuable online resources can help you monitor your investments and provide direct access to your account. All of these tools, and more, can be found on www.columbiamanagement.com/investor.
While your financial advisor is a great resource for investment guidance, you can also access our website or call our service representatives at 800.345.6611 for additional assistance. We thank you for investing with Columbia Management and look forward to helping with your ongoing investment needs.
Sincerely,

Christopher L. Wilson
President, Columbia Funds
*Some restrictions apply. Shareholders who purchase shares through certain third-party organizations may not have the ability to register for online access.
Fund Profile – Columbia California Tax-Exempt Fund
Summary
g For the 12-month period that ended October 31, 2008, the fund's Class A shares returned negative 6.80% without sales charge.
g The fund trailed its benchmark, the Barclays Capital Municipal Bond Index1, but performed better than its peer group average, the Lipper California Municipal Debt Funds Classification.2
g Bonds in the mid-to-lower quality tiers held back performance compared to the benchmark. We believe that our focus on bonds in the 10-25 year maturity range and our comparatively smaller exposure to weaker performing sectors aided performance relative to the fund's peer group.
Portfolio Management
Gary Swayze has managed the fund since October 1997 and has been associated with the advisor or its predecessors or affiliate organizations since 1997.
1The Barclays Capital Municipal Bond Index (formerly the Lehman Brothers Municipal Bond Index) is considered representative of the broad market for investment-grade, tax exempt bonds with maturities of at least one year. Indices are not investments, do not incur fees or expenses and are not professionally managed. It is not possible to invest directly in an index. Securities in the fund may not match those in an index.
2Lipper Inc., a widely respected data provider in the industry, calculates an average total return (assuming reinvestment of distributions) for mutual funds with investment objectives similar to those of the fund. Lipper makes no adjustment for the effect of sales loads.
Performance data quoted represents past performance and current performance may be lower or higher. Past performance is no guarantee of future results. The investment return and principal value will fluctuate so that shares, when redeemed, may be worth more or less than the original cost. Please visit www.columbiafunds.com for daily and most recent month-end performance updates.
Summary
1-year return as of 10/31/08
| | –6.80 | % | |
|
 Class A Shares Class A Shares
(without sales charge) | |
|
| | –3.30 | % | |
|
 Barclays Capital Barclays Capital
Municipal Bond Index | |
|
Morningstar Style Box
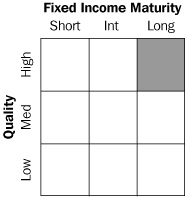
The Morningstar Style Box reveals a fund's investment strategy. For fixed-income funds the vertical axis shows the average credit quality of the bonds owned, and the horizontal axis shows interest rate sensitivity as measured by a bond's duration (short, intermediate or long). All of these numbers are drawn from the data most recently provided by the fund and entered into Morningstar's database as of quarter-end. Although the data is gathered from reliable sources, Morningstar cannot guarantee its completeness and accuracy. Information shown is as of 06/30/08.
1
Economic Update – Columbia California Tax-Exempt Fund
Summary
For the 12-month period that ended October 31, 2008
g Despite volatility in many segments of the bond market, the Barclays Capital U.S. Aggregate Bond Index delivered a modest gain. High-yield bonds lost significant ground, as measured by the Merrill Lynch U.S. High Yield, Cash Pay Index.
Barclays
Index | | Merrill
Lynch Index | |
|
 | |  | |
|
g The broad U.S. stock market, as measured by the S&P 500 Index, returned negative 36.10%. Developed stock markets outside the United States returned negative 46.62%, as measured (in U.S. dollars) by the MSCI EAFE Index.
| S&P Index | | MSCI Index | |
|
 | |  | |
|
The Barclays Capital U.S. Aggregate Bond Index (formerly the Lehman Brothers U.S. Aggregate Bond Index) is a market value-weighted index that tracks the daily price, coupon, pay-downs and total return performance of fixed-rate, publicly placed, dollar-denominated and non-convertible investment grade debt issues with at least $250 million par amount outstanding and with at least one year to final maturity.
The Merrill Lynch U.S. High Yield, Cash Pay Index tracks the performance of non-investment-grade corporate bonds.
The Standard & Poor's (S&P) 500 Index tracks the performance of 500 widely held, large-capitalization US stocks.
The Morgan Stanley Capital International (MSCI) Europe, Australasia, Far East (EAFE) Index is a free float-adjusted market capitalization index that is designed to measure developed market equity performance, excluding the US and Canada.
Indices are not investments, do not incur fees or expenses and are not professionally managed. It is not possible to invest directly in an index. Securities in the fund may not match those in an index.
The pace of economic growth ground to a halt during the 12-month period that began November 1, 2007 and ended October 31, 2008. Although the economic growth was modestly positive at the beginning of the period, the economy slipped into recession in 2008, with little relief in sight. A host of factors weighed on consumers and businesses alike.
The most severe housing downturn in decades showed no sign of abating as inventories of homes for sale rose, home prices declined and tighter credit standards, a result of continued turmoil in the subprime mortgage market, made it more difficult for homebuyers to qualify for loans.
The labor market contracted for ten consecutive months, driving the unemployment rate to 6.5%, the highest rate since the early 1990s. Nearly 1.2 million jobs have been lost since the beginning of 2008, with announced layoffs likely to drive that number even higher in the months ahead. Manufacturing activity slowed and consumer spending declined, dimming hopes for the holiday season.
A weakening economy and turmoil in the financial markets took a toll on consumer confidence, which plummeted to the lowest point ever in the 40-year history of the Conference Board's monthly survey.
In an effort to inspire confidence in the capital markets, loosen the reins on credit and shore up economic growth, the Federal Reserve Board (the Fed) brought a key short-term rate—the federal funds rate—down from 4.50% to 1.0% during the 12-month period. Despite earlier concerns about inflation, a weak economic outlook has kept the Fed focused on stimulating economic growth through lowering borrowing rates. In fact, the one bright spot during this period of uncertainty has been lower energy and commodity prices. With oil trading near $60 per barrel at the end of the period, gasoline prices are forecasted to come down below $2 per gallon after peaking above $4 per gallon during the summer months.
Bonds eke out a small, positive return
The U.S. bond market seesawed during the 12-month period but managed to eke out a small gain as investors sought the relative safety of the highest quality sectors. After a weak start, bond prices in several sectors rose and yields declined as economic growth slowed and stock market volatility increased. The benchmark 10-year U.S. Treasury yield ended the period at just under 4.0%, nearly one-half percentage point lower than where it stood one year ago. In this environment, the Barclays Capital U.S. Aggregate Bond Index returned 0.30%. High-yield bonds disappointed as economic prospects weakened and default fears rose. The Merrill Lynch U.S. High Yield, Cash Pay Index returned negative 26.43%.
Stocks retreat as economic outlook darkens
Against a shifting economic backdrop, the U.S. stock market lost 36.10% for the 12-month period, as measured by the S&P 500 Index. Losses extended across all market caps and both growth and value, although value stocks held up somewhat better than growth stocks, as measured by their respective Russell indices.1 Stock markets outside the U.S. suffered even greater losses. The MSCI EAFE Index, a broad gauge of stock market performance in foreign developed markets, lost 46.62% (in U.S. dollars) for the period. Emerging stock markets, which have had a strong run over the past several years, were also caught in the downdraft. As investors backed away from risk, emerging markets suffered most of all. The MSCI Emerging Markets Index returned negative 56.22% (in U.S. dollars).2
Past performance is no guarantee of future results.
1The Russell 1000 Index measures the performance of 1,000 of the largest US companies, based on market capitalization. The Russell Midcap Index measures the performance of the 800 smallest companies in the Russell 1000 Index, as ranked by total market capitalization. The Russell 2000 Index measures the performance of the 2,000 smallest of the 3,000 largest US companies based on market capitalization.
2The Morgan Stanley Capital International (MSCI) Emerging Markets Index is a widely accepted index composed of a sample of companies from 25 countries representing the global emerging stock markets.
Indices are not investments, do not incur fees or expenses and are not professionally managed. It is not possible to invest directly in an index. Securities in the fund may not match those in an index.
2
Performance Information – Columbia California Tax-Exempt Fund
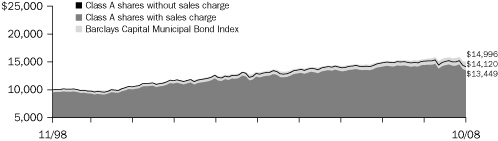
Growth of a $10,000 Investment 11/01/98 – 10/31/08
The chart above shows the growth in value of a hypothetical $10,000 investment in Class A shares of Columbia California Tax-Exempt Fund during the stated time period, and does not reflect the deduction of taxes that a shareholder may pay on fund distributions or on the redemption of fund shares. The Barclays Capital Municipal Bond Index is considered representative of the broad market for investment-grade, tax exempt bonds with maturities of at least one year. Indices are not investments, do not incur fees or expenses and are not professionally managed. It is not possible to invest directly in an index. Securities in the fund may not match those in an index.
Performance of a $10,000 Investment 11/01/98 – 10/31/08 ($)
| Sales charge | | without | | with | |
| Class A | | | 14,120 | | | | 13,449 | | |
| Class B | | | 13,107 | | | | 13,107 | | |
| Class C | | | 13,501 | | | | 13,501 | | |
| Class Z | | | 14,223 | | | | n/a | | |
Average annual total return as of 10/31/08 (%)
| Share class | | A | | B | | C | | Z | |
| Inception | | 06/16/86 | | 08/04/92 | | 08/01/97 | | 09/19/05 | |
| Sales charge | | without | | with | | without | | with | | without | | with | | without | |
| 1-year | | | –6.80 | | | | –11.22 | | | | –7.49 | | | | –11.93 | | | | –7.22 | | | | –8.11 | | | | –6.57 | | |
| 5-year | | | 1.98 | | | | 0.99 | | | | 1.22 | | | | 0.89 | | | | 1.52 | | | | 1.52 | | | | 2.13 | | |
| 10-year | | | 3.51 | | | | 3.01 | | | | 2.74 | | | | 2.74 | | | | 3.05 | | | | 3.05 | | | | 3.59 | | |
Average annual total return as of 09/30/08 (%)
| Share class | | A | | B | | C | | Z | |
| Sales charge | | without | | with | | without | | with | | without | | with | | without | |
| 1-year | | | –4.35 | | | | –8.89 | | | | –5.06 | | | | –9.62 | | | | –4.78 | | | | –5.70 | | | | –4.11 | | |
| 5-year | | | 2.22 | | | | 1.23 | | | | 1.46 | | | | 1.12 | | | | 1.76 | | | | 1.76 | | | | 2.37 | | |
| 10-year | | | 3.66 | | | | 3.16 | | | | 2.90 | | | | 2.90 | | | | 3.20 | | | | 3.20 | | | | 3.74 | | |
The "with sales charge" returns include the maximum initial sales charge of 4.75% for Class A shares, the applicable contingent deferred sales charge of 5.00% in the first year, declining to 1.00% in the sixth year, and eliminated thereafter for Class B shares and 1.00% for Class C shares for the first year only. The "without sales charge" returns do not include the effect of sales charges. If they had, returns would be lower.
Performance results reflect any fee waivers or reimbursements of fund expenses by the investment advisor and/or any of its affiliates. Absent these fee waivers or expense reimbursement arrangements, performance results would have been lower.
All results shown assume reinvestment of distributions. Class Z shares are sold at net asset value with no distribution and service (Rule 12b-1) fees. Class Z shares have limited eligibility and the investment minimum requirements may vary. Please see the fund's prospectus for details. Performance for different share classes will vary based on differences in sales charges and the fees associated with each class.
The tables do not reflect the deduction of taxes that a shareholder may pay on fund distributions or on the redemption of fund shares.
Class Z share (newer class shares) performance information includes returns of the fund's Class A shares (the oldest existing fund class) for periods prior to the inception of Class Z shares. These returns have not been restated to reflect any differences in expenses such as distribution and service (Rule 12b-1) fees between Class A shares and Class Z shares. The Class A share returns have been adjusted to take into account the fact that Class Z shares are sold without sales charges. If differences in expenses had been reflected, the returns shown for periods prior to the inception of Class Z shares would have been higher, to the extent that Class Z shares are not subject to any distribution and service (Rule 12b-1) fees. Class A shares were initially offered on June 16, 1986, Class B shares were initially offered on August 4, 1992, Class C shares were initially offered on August 1, 1997, and Class Z shares were initially offere d on September 19, 2005.
Performance data quoted represents past performance and current performance may be lower or higher. Past performance is no guarantee of future results. The investment return and principal value will fluctuate so that shares, when redeemed, may be worth more or less than the original cost. Please visit www.columbiafunds.com for daily and most recent month-end performance updates.
Annual operating expense ratio (%)*
| Class A | | | 0.86 | | |
| Class B | | | 1.61 | | |
| Class C | | | 1.61 | | |
| Class Z | | | 0.63 | | |
* The annual operating expense ratio is as stated in the fund's prospectus that is current as of the date of this report. Differences in expense ratios disclosed elsewhere in this report may result from including fee waivers and expense reimbursements as well as different time periods used in calculating the ratios.
3
Understanding Your Expenses – Columbia California Tax-Exempt Fund
Estimating your actual expenses
To estimate the expenses that you paid over the period, first you will need your account balance at the end of the period:
g For shareholders who receive their account statements from Columbia Management Services, Inc., your account balance is available online at www.columbiafunds.com or by calling Shareholder Services at 800.345.6611.
g For shareholders who receive their account statements from their financial intermediary, contact your financial intermediary to obtain your account balance.
1. Divide your ending account balance by $1,000. For example, if an account balance was $8,600 at the end of the period, the result would be 8.6.
2. In the section of the table below titled "Expenses paid during the period," locate the amount for your share class. You will find this number in the column labeled "Actual." Multiply this number by the result from step 1. Your answer is an estimate of the expenses you paid on your account during the period.
If the value of your account falls below the minimum initial investment requirement applicable to you, your account generally will be subject to a $20 annual fee. This fee is not included in the accompanying table. If you are subject to the fee, keep it in mind when you are estimating the ongoing expenses of investing in the fund and when comparing the expenses of this fund with other funds.
As a fund shareholder, you incur two types of costs. There are transaction costs, which generally include sales charges on purchases and may include redemption fees or exchange fees. There are also ongoing costs, which generally include investment advisory fees, distribution and service (Rule 12b-1) fees and other fund expenses. The information on this page is intended to help you understand the ongoing costs of investing in the fund and to compare these costs with the ongoing costs of investing in other mutual funds.
Analyzing your fund's expenses by share class
To illustrate these ongoing costs, we have provided an example and calculated the expenses paid by investors in each share class during the period. The information in the following table is based on an initial investment of $1,000, which is invested at the beginning of the period and held for the entire period. Expense information is calculated two ways and each method provides you with different information. The amount listed in the "Actual" column is calculated using the fund's actual operating expenses and total return for the period. The amount listed in the "Hypothetical" column for each share class assumes that the return each year is 5% before expenses and is calculated based on the fund's actual operating expenses. You should not use the hypothetical account values and expenses to estimate either your actual account balance at the end of the period or the expenses you paid during this period.
Compare with other funds
Since all mutual funds are required to include the same hypothetical calculations about expenses in shareholder reports, you can use this information to compare the ongoing costs of investing in the fund with other funds. To do so, compare the 5% hypothetical example with the 5% hypothetical examples that appear in the shareholder reports of other funds. As you compare hypothetical examples of other funds, it is important to note that hypothetical examples are meant to highlight the ongoing costs of investing in a fund and do not reflect any transaction costs, such as sales charges, redemption fees or exchange fees.
05/01/08 – 10/31/08
| | | Account value at the
beginning of the period ($) | | Account value at the
end of the period ($) | | Expenses paid
during the period ($) | | Fund's annualized
expense ratio (%) | |
| | | Actual | | Hypothetical | | Actual | | Hypothetical | | Actual | | Hypothetical | | Actual | |
| Class A | | | 1,000.00 | | | | 1,000.00 | | | | 932.68 | | | | 1,020.91 | | | | 4.08 | | | | 4.27 | | | | 0.84 | | |
| Class B | | | 1,000.00 | | | | 1,000.00 | | | | 929.22 | | | | 1,017.14 | | | | 7.71 | | | | 8.06 | | | | 1.59 | | |
| Class C | | | 1,000.00 | | | | 1,000.00 | | | | 930.62 | | | | 1,018.65 | | | | 6.26 | | | | 6.55 | | | | 1.29 | | |
| Class Z | | | 1,000.00 | | | | 1,000.00 | | | | 933.79 | | | | 1,022.12 | | | | 2.92 | | | | 3.05 | | | | 0.60 | | |
Expenses paid during the period are equal to the annualized expense ratio for the share class, multiplied by the average account value over the period, then multiplied by the number of days in the fund's most recent fiscal half-year and divided by 366.
Had the investment advisor and/or any of its affiliates not waived fees or reimbursed a portion of expenses, account value at the end of the period would have been reduced.
It is important to note that the expense amounts shown in the table are meant to highlight only ongoing costs of investing in the fund and do not reflect any transaction costs, such as sales charges, redemption fees or exchange fees. Therefore, the hypothetical examples provided may not help you determine the relative total costs of owning shares of different funds. If these transaction costs were included, your costs would have been higher.
4
Portfolio Manager's Report – Columbia California Tax-Exempt Fund
For the 12-month period that ended October 31, 2008, the fund's Class A shares returned negative 6.80% without sales charge. The fund's benchmark, the Barclays Capital Municipal Bond Index returned negative 3.30%.1 The average return of the fund's peer group, the Lipper California Municipal Debt Funds Classification, was negative 9.24%2. The fund's shortfall to its benchmark was the result of two factors: the index is national in scope and it has less exposure than the fund to longer-term (20 to 30 years) and mid-to-lower quality sectors, which were underperformers during the period. We believe that the fund outperformed its peer group average because it had a greater focus on bonds in the 10-25 year maturity range and comparatively less exposure to weaker performing sectors.
Economic slowdown has sharp impact
A year ago, we anticipated an economic slowdown and an easing of inflationary pressures fed by high commodity prices and worldwide growth. But the intensity of the slowdown has been unexpectedly sharp. In hopes of reviving the economy, the Federal Reserve Board (the Fed) cut short-term interest rates aggressively while Congress passed a stimulus package to aid middle-class households.
Fallout from a widespread credit crisis caused municipal bonds to underperform Treasuries over this period. Sinking home values and waves of foreclosures began to shrink tax revenues and swell deficits for state and local governments. In addition, downgrades of municipal bond insurers dramatically reduced the number of AAA-rated3 municipal bonds. As a result, investors demanded higher yields for insured issues, which represent over half of the new issue market. Meanwhile, volatile markets forced some institutions to sell off their municipal bond holdings, especially hedge funds.
Amid this economic stress, the yield difference between higher and lower quality municipal bonds widened. The period's worst performance came in lower quality, long-maturity sectors where yields rose substantially. Skittish investors preferred to confine their commitments to better quality issues with maturities of five years or less, causing yields to decline and raising prices modestly for these bonds.
Lower and medium quality fund holdings and those with long maturities hurt results. We achieved better returns among intermediate-term prerefunded bonds, which are backed by escrowed government securities.
1The Barclays Capital Municipal Bond Index is considered representative of the broad market for investment-grade, tax-exempt bonds with maturities of at least one year. Indices are not investments, do not incur fees or expenses and are not professionally managed. It is not possible to invest directly in an index. Securities in the fund may not match those in an index.
2Lipper Inc., a widely respected data provider in the industry, calculates an average total return (assuming reinvestment of distributions) for mutual funds with investment objectives similar to those of the fund. Lipper makes no adjustment for the effect of sales loads.
3The credit quality ratings represent those of Moody's Investors Service, Inc. ("Moody's"), Standard & Poor's Corporation ("S&P") or Fitch Ratings ("Fitch") credit ratings. The ratings represent their opinions as to the quality of the securities they rate. Ratings are relative and subjective and are not absolute standards of quality. The security's credit quality does not eliminate risk.
Performance data quoted represents past performance and current performance may be lower or higher. Past performance is no guarantee of future results. The investment return and principal value will fluctuate so that shares, when redeemed, may be worth more or less than the original cost. Please visit www.columbiafunds.com for daily and most recent month-end performance updates.
Net asset value per share
as of 10/31/08 ($)
| Class A | | | 6.71 | | |
| Class B | | | 6.71 | | |
| Class C | | | 6.71 | | |
| Class Z | | | 6.71 | | |
Distributions declared per share
11/01/07 – 10/31/08 ($)
| Class A | | | 0.35 | | |
| Class B | | | 0.29 | | |
| Class C | | | 0.31 | | |
| Class Z | | | 0.36 | | |
A portion of the fund's income may be subject to the alternative minimum tax. The fund may at times purchase tax-exempt securities at a discount. Some, or all, of this discount may be included in the fund's ordinary income, and is taxable when distributed. Distributions include $0.04 per share of taxable realized gains.
30-day SEC yields
as of 10/31/08 (%)
| Class A | | | 4.35 | | |
| Class B | | | 3.80 | | |
| Class C | | | 4.10 | | |
| Class Z | | | 4.82 | | |
The 30-day SEC yields reflect the fund's earning power, net of expenses, expressed as an annualized percentage of the public offering price per share at the end of the period.
Taxable equivalent SEC yields
as of 10/31/08 (%)
| Class A | | | 7.38 | | |
| Class B | | | 6.45 | | |
| Class C | | | 6.95 | | |
| Class Z | | | 8.18 | | |
Taxable-equivalent SEC yields are based on the combined maximum effective 35.0% federal income tax rate and the applicable state income tax rate. This tax rate does not reflect the phase out of exemptions or the reduction of the otherwise allowable deductions that occur when adjusted gross income exceeds certain levels.
5
Portfolio Manager's Report (continued) – Columbia California Tax-Exempt Fund
Top 5 sectors
as of 10/31/08 (%)
| Refunded/Escrowed | | | 16.7 | | |
| Local General Obligations | | | 16.5 | | |
| Special Property Tax | | | 11.4 | | |
| Water & Sewer | | | 8.7 | | |
| Local Appropriated | | | 7.8 | | |
Quality breakdown
as of 10/31/08 (%)
| AAA | | | 21.2 | | |
| AA | | | 52.3 | | |
| A | | | 10.4 | | |
| BBB | | | 11.9 | | |
| BB | | | 0.2 | | |
| Non-rated | | | 2.9 | | |
| Cash & Equivalents | | | 1.1 | | |
Maturity breakdown
as of 10/31/08 (%)
| 1-3 years | | | 1.1 | | |
| 3-5 years | | | 6.7 | | |
| 5-7 years | | | 15.0 | | |
| 7-10 years | | | 16.9 | | |
| 10-15 years | | | 23.7 | | |
| 15-20 years | | | 13.5 | | |
| 20-25 years | | | 8.3 | | |
| 25 years and over | | | 13.6 | | |
| Cash & Equivalents | | | 1.1 | | |
Ratings shown in the quality breakdown represent the rating assigned to a particular bond by one of the following nationally-recognized rating agencies: Standard and Poor's, Moody's Investors Service, Inc. or Fitch Ratings Ltd. Ratings are relative and subjective and are not absolute standards of quality. The fund's credit quality does not remove market risk.
The fund is actively managed and the composition of its portfolio will change over time. Information provided is calculated as a percentage of net assets.
Housing and budget concerns pressured California's economy
Falling home prices and mortgage foreclosures were the triggers for California's latest recession. Stressed homeowners have slashed spending, eroding tax revenues at a time of severe shortfalls in the state's budget. Cutbacks in government construction projects added to California's unemployment rate, already among the nation's highest. With the 2009 budget gap unresolved well into the fiscal year, steep reductions were anticipated in state payrolls and programs; a boost in the sales tax was also possible. Depending on the outcome of these and other factors there may be rating downgrades by the rating agencies. Longer term, once the current slowdown ends and the budget stabilizes, we believe that California's strengths in technology, agriculture and higher education, plus global tourism and international trade, may set the state's economy back on course.
A cautious, deliberate approach
A widening difference in yield between higher and lower quality securities of comparable maturities offers potential opportunities in bonds in the mid and lower quality tiers. However, we are being selective in our choice of securities because we do not believe that the challenges facing municipal issuers will dissipate quickly in light of the current economic slowdown. In this environment, we believe that short-term interest rates are likely to remain low and further stimulus moves are possible. Eventually, we believe that taxes may rise, making municipal bonds more attractive. However, we believe that continued stimulus programs could also trigger inflation over the longer-term, a potential negative for bond investors.
Portfolio holdings and characteristics are subject to change periodically and may not be representative of current holdings and characteristics. The outlook for the fund may differ from that presented for other Columbia Funds.
Tax-exempt investing offers current tax-exempt income, but it also involves special risks. The value of the fund will be affected by interest rate changes and the creditworthiness of issues held in the fund. When interest rates go up, bond prices generally drop and vice versa.
Interest income from certain tax-exempt bonds may be subject to certain state and local taxes and, if applicable, the alternative minimum tax. Capital gains are not exempt from income taxes.
Single-state municipal bond funds pose additional risks due to limited geographical diversification.
6
Investment Portfolio – Columbia California Tax-Exempt Fund
October 31, 2008
| Municipal Bonds – 95.6% | |
| | | Par ($) | | Value ($) | |
| Education – 3.2% | |
| Education – 2.8% | |
| CA Educational Facilities Authority | |
California College of Arts,
Series 2005:
5.000% 06/01/26 | | | 1,000,000 | | | | 717,120 | | |
| 5.000% 06/01/35 | | | 1,500,000 | | | | 980,175 | | |
| California Lutheran University, | |
Series 2008,
5.750% 10/01/38 | | | 3,000,000 | | | | 2,350,800 | | |
| Loyola Marymount University, | |
Series 2001,
Insured: MBIA
(a) 10/01/15 | | | 1,265,000 | | | | 903,956 | | |
| University of Redlands, | |
Series 2008 A,
5.125% 08/01/38 | | | 1,750,000 | | | | 1,499,942 | | |
| University of Southern California, | |
Series 2007 A,
4.500% 10/01/33 | | | 2,500,000 | | | | 2,051,900 | | |
| Woodbury University, | |
Series 2006,
5.000% 01/01/25 | | | 1,830,000 | | | | 1,339,286 | | |
CA Statewide Communities Development
Authority | |
San Francisco Art Institute,
Series 2002,
7.375% 04/01/32 | | | 2,000,000 | | | | 1,641,560 | | |
| Education Total | | | 11,484,739 | | |
| Prep School – 0.4% | |
CA Statewide Communities Development
Authority | |
Crossroads School for Arts & Sciences,
Series 1998,
6.000% 08/01/28 (b) | | | 1,690,000 | | | | 1,458,690 | | |
| Prep School Total | | | 1,458,690 | | |
| Education Total | | | 12,943,429 | | |
| Health Care – 8.3% | |
| Continuing Care Retirement – 0.8% | |
CA ABAG Finance Authority for
Nonprofit Corps. | |
Channing House,
Series 1999,
5.375% 02/15/19 | | | 1,700,000 | | | | 1,525,512 | | |
| | | Par ($) | | Value ($) | |
CA Riverside County Public
Financing Authority | |
Air Force Village West, Inc.,
Series 1999,
5.750% 05/15/19 | | | 2,000,000 | | | | 1,822,000 | | |
| Continuing Care Retirement Total | | | 3,347,512 | | |
| Hospitals – 7.5% | |
CA ABAG Finance Authority for
Nonprofit Corps. | |
San Diego Hospital Association,
Series 2003 C,
5.375% 03/01/21 | | | 1,000,000 | | | | 897,620 | | |
| CA Health Facilities Financing Authority | |
Catholic Healthcare West,
Series 2004 I,
4.950% 07/01/26 | | | 1,000,000 | | | | 966,380 | | |
Cedars-Sinai Medical Center,
Series 2005:
5.000% 11/15/27 | | | 1,500,000 | | | | 1,263,435 | | |
| 5.000% 11/15/34 | | | 2,500,000 | | | | 1,977,075 | | |
Kaiser Permanante,
Series 2006, | | | |
| 5.250% 04/01/39 | | | 2,000,000 | | | | 1,636,400 | | |
Stanford Hospital & Clinics,
Series 2003 A, | | | |
| 5.000% 11/15/12 | | | 500,000 | | | | 501,310 | | |
Sutter Health,
Series 2042 A, | | | |
| 5.000% 11/15/42 | | | 2,000,000 | | | | 1,602,140 | | |
CA Infrastructure & Economic
Development Bank | |
Kaiser Assistance Corp.,
Series 2001 A,
5.550% 08/01/31 | | | 2,500,000 | | | | 2,170,600 | | |
| CA Kaweah Delta Health Care District | |
| Series 2006, | |
| 4.500% 06/01/34 | | | 3,500,000 | | | | 2,353,785 | | |
| CA Loma Linda Hospital | |
Loma Linda University Medical Center,
Series 2005,
5.000% 12/01/22 | | | 6,155,000 | | | | 5,068,212 | | |
| CA Municipal Finance Authority | |
Community Hospital Center,
Series 2007,
5.250% 02/01/37 | | | 2,500,000 | | | | 1,761,425 | | |
See Accompanying Notes to Financial Statements.
7
Columbia California Tax-Exempt Fund
October 31, 2008
| Municipal Bonds (continued) | |
| | | Par ($) | | Value ($) | |
CA Rancho Mirage Joint Powers
Financing Authority | |
Eisenhower Medical Center,
Series 2007 A,
5.000% 07/01/47 | | | 2,500,000 | | | | 1,843,375 | | |
| CA Sierra View Local Health Care District | |
| Series 2007, | |
| 5.250% 07/01/37 | | | 1,500,000 | | | | 1,144,140 | | |
CA Statewide Communities
Development Authority | |
Kaiser Permanente,
Series 2007 A,
4.750% 04/01/33 | | | 2,000,000 | | | | 1,534,260 | | |
| CA Turlock Health Facility | |
Emanuel Medical Center, Inc.:
Series 2004:
5.000% 10/15/13 | | | 940,000 | | | | 899,721 | | |
| 5.375% 10/15/34 | | | 800,000 | | | | 598,824 | | |
| Series 2007 A, | |
| 5.000% 10/15/22 | | | 2,780,000 | | | | 2,234,397 | | |
| Series 2007 B, | |
| 5.125% 10/15/37 | | | 2,500,000 | | | | 1,740,350 | | |
| Hospitals Total | | | 30,193,449 | | |
| Health Care Total | | | 33,540,961 | | |
| Housing – 1.0% | |
| Multi-Family – 0.4% | |
CA Statewide Communities
Development Authority | |
Oracle Communities Corp.,
Series 2002 E-1,
5.375% 07/01/32 | | | 2,000,000 | | | | 1,459,340 | | |
| Multi-Family Total | | | 1,459,340 | | |
| Single-Family – 0.6% | |
| CA Housing Finance Agency | |
Series 1997 B-3 Class I, AMT,
Insured: FHA
5.400% 08/01/28 | | | 485,000 | | | | 474,417 | | |
Series 2006 K, AMT,
4.625% 08/01/26 | | | 2,500,000 | | | | 1,889,150 | | |
| CA Rural Home Mortgage Finance Authority | |
Series 1997 A-2, AMT,
Guarantor: GNMA
7.000% 09/01/29 | | | 40,000 | | | | 40,420 | | |
Series 1998 B-5, AMT,
Guarantor: FNMA
6.350% 12/01/29 | | | 55,000 | | | | 55,929 | | |
| | | Par ($) | | Value ($) | |
Series 2000 B, AMT,
Guarantor: FNMA
7.300% 06/01/31 | | | 40,000 | | | | 40,983 | | |
Series 2000 D, AMT,
Guarantor: GNMA
7.100% 06/01/31 | | | 40,000 | | | | 40,481 | | |
| Single-Family Total | | | 2,541,380 | | |
| Housing Total | | | 4,000,720 | | |
| Industrials – 0.5% | |
| Oil & Gas – 0.5% | |
CA Southern California Public
Power Authority | |
| Series 2007, | |
| 5.000% 11/01/33 | | | 3,385,000 | | | | 2,111,902 | | |
| Oil & Gas Total | | | 2,111,902 | | |
| Industrials Total | | | 2,111,902 | | |
| Other – 18.7% | |
| Other – 0.7% | |
CA Infrastructure & Economic
Development Bank | |
Walt Disney Family Museum,
Series 2008,
5.250% 02/01/38 | | | 3,050,000 | | | | 2,694,217 | | |
| Other Total | | | 2,694,217 | | |
| Pool/Bond Bank – 0.1% | |
| CA Educational Facilities Authority | |
| Series 1999 B, | |
| 5.250% 04/01/24 | | | 725,000 | | | | 558,627 | | |
| Pool/Bond Bank Total | | | 558,627 | | |
| Refunded/Escrowed (c) – 16.7% | |
| CA Central Unified School District | |
Series 1993,
Escrowed to Maturity,
Insured: AMBAC
(a) 03/01/18 | | | 20,065,000 | | | | 12,749,903 | | |
CA Daly City Housing Development
Finance Agency | |
Linc Franciscan LP,
Series 2002 A,
Pre-refunded 12/15/13,
5.850% 12/15/32 | | | 2,000,000 | | | | 2,277,920 | | |
See Accompanying Notes to Financial Statements.
8
Columbia California Tax-Exempt Fund
October 31, 2008
| Municipal Bonds (continued) | |
| | | Par ($) | | Value ($) | |
| CA East Whittier City School District | |
Series 1997 A,
Escrowed to Maturity,
Insured: FGIC
5.750% 08/01/17 | | | 1,675,000 | | | | 1,835,415 | | |
| CA Educational Facilities Authority | |
Series 1999 B,
Pre-refunded 04/01/09,
5.250% 04/01/24 | | | 275,000 | | | | 281,831 | | |
Series 2000 B,
Pre-refunded 06/01/10,
6.625% 06/01/20 | | | 170,000 | | | | 182,493 | | |
| CA Health Facilities Financing Authority | |
Kaiser Permanente,
Series 1998 A,
Escrowed to Maturity,
Insured: FSA
5.000% 06/01/24 | | | 3,000,000 | | | | 2,993,430 | | |
CA Infrastructure & Economic Development
Bank Revenue | |
Series 2003 A,
Pre-refunded 07/01/26,
Insured: AMBAC
5.125% 07/01/37 | | | 4,275,000 | | | | 4,402,865 | | |
CA Inland Empire Solid Waste
Financing Authority | |
Series 1996 B, AMT,
Escrowed to Maturity,
Insured: FSA
6.250% 08/01/11 | | | 1,270,000 | | | | 1,328,966 | | |
| CA Lompoc Unified School District | |
Election of 2002,
Series 2003 A,
Pre-refunded 08/01/13,
Insured: FGIC
5.000% 08/01/27 | | | 2,065,000 | | | | 2,235,342 | | |
CA Metropolitan Water District of
Southern California | |
| Series 1993 A, | |
Escrowed to Maturity,
5.750% 07/01/21 | | | 2,865,000 | | | | 3,103,569 | | |
| CA Morgan Hill Unified School District | |
Series 2002,
Escrowed to Maturity,
Insured: FGIC
(a) 08/01/21 | | | 2,010,000 | | | | 1,026,567 | | |
| | | Par ($) | | Value ($) | |
CA Pleasanton-Suisun City Home
Financing Authority | |
Series 1984 A,
Escrowed to Maturity,
Insured: MBIA
(a) 10/01/16 | | | 5,270,000 | | | | 3,674,350 | | |
| CA Pomona | |
Single Family Mortgage Revenue,
Series 1990 B,
Escrowed to Maturity,
Guarantor: GNMA
7.500% 08/01/23 | | | 1,000,000 | | | | 1,206,320 | | |
| CA Redding Electric Systems Revenue | |
Series 1992 A, IFRN,
Escrowed to Maturity,
Insured: MBIA
6.223% 07/01/22 (d) | | | 580,000 | | | | 735,649 | | |
| CA Riverside County | |
Series 1989 A, AMT,
Escrowed to Maturity,
Guarantor: GNMA
7.800% 05/01/21 | | | 2,500,000 | | | | 3,100,375 | | |
CA San Joaquin Hills Transportation
Corridor Agency | |
Series 1993,
Escrowed to Maturity,
(a) 01/01/20 | | | 15,400,000 | | | | 8,662,038 | | |
| CA San Jose Redevelopment Agency | |
Series 1993,
Escrowed to Maturity,
Insured: MBIA
6.000% 08/01/15 | | | 1,405,000 | | | | 1,611,914 | | |
| CA Santa Margarita Water District | |
Community Facilities District No. 99-1,
Series 2003,
Pre-refunded 09/01/13,
6.000% 09/01/30 | | | 1,000,000 | | | | 1,108,120 | | |
CA Southern California Public
Power Authority | |
Series 2003 A-1,
Pre-refunded 07/01/13,
Insured: AMBAC
5.000% 07/01/25 | | | 1,000,000 | | | | 1,082,820 | | |
| CA State Department of Water Resources | |
Series 2001,
Escrowed to Maturity,
Insured: FSA
5.500% 12/01/14 | | | 10,000 | | | | 11,164 | | |
See Accompanying Notes to Financial Statements.
9
Columbia California Tax-Exempt Fund
October 31, 2008
| Municipal Bonds (continued) | |
| | | Par ($) | | Value ($) | |
CA Statewide Communities
Development Authority | |
Eskaton Village - Grass Valley,
Series 2000,
Pre-refunded 11/15/10,
8.250% 11/15/31 | | | 2,395,000 | | | | 2,666,928 | | |
| CA State | |
Series 2000:
Pre-refunded 05/01/10,
5.625% 05/01/26 | | | 60,000 | | | | 63,655 | | |
| Pre-refunded 09/01/10, | |
| Insured: FGIC | |
| 5.250% 09/01/30 | | | 155,000 | | | | 163,375 | | |
| Series 2004: | |
| Pre-refunded 02/01/14, | |
| 5.000% 02/01/33 | | | 1,000,000 | | | | 1,079,630 | | |
| Pre-refunded 04/01/14, | |
| 5.250% 04/01/34 | | | 1,500,000 | | | | 1,640,850 | | |
| CA Whisman School District | |
Series 1996 A,
Escrowed to Maturity,
Insured: FGIC
(a) 08/01/16 | | | 1,645,000 | | | | 1,166,124 | | |
PR Commonwealth of Puerto Rico
Aqueduct & Sewer Authority | |
Series 1995,
Escrowed to Maturity,
Insured: MBIA
6.250% 07/01/13 | | | 2,750,000 | | | | 3,109,508 | | |
PR Commonwealth of Puerto Rico
Electric Power Authority | |
| Series 1989 O, | |
Pre-refunded to various dates
beginning 07/01/15,
(a) 07/01/17 | | | 2,490,000 | | | | 1,611,528 | | |
PR Commonwealth of Puerto Rico
Infrastructure Financing Authority | |
| Series 2000 A, | |
Economically Defeased to Maturity,
5.500% 10/01/32 | | | 1,500,000 | | | | 1,501,125 | | |
PR Commonwealth of Puerto Rico
Public Finance Corp. | |
| Series 2002 E, | |
Pre-refunded 02/01/12,
5.500% 08/01/29 | | | 480,000 | | | | 511,502 | | |
| Refunded/Escrowed Total | | | 67,125,276 | | |
| | | Par ($) | | Value ($) | |
| Tobacco – 1.2% | |
| CA Golden State Tobacco Securitization Corp. | |
| Series 2007 A-1, | |
| 5.000% 06/01/33 | | | 7,500,000 | | | | 4,650,675 | | |
| Tobacco Total | | | 4,650,675 | | |
| Other Total | | | 75,028,795 | | |
| Resource Recovery – 0.8% | |
| Disposal – 0.8% | |
| CA Pollution Control Financing Authority | |
Waste Management,
Series 2002 A,
5.000% 01/01/22 | | | 2,000,000 | | | | 1,465,500 | | |
CA Statewide Communities Development
Authority | |
| Series 2003 A, AMT, | |
| 4.950% 12/01/12 | | | 2,000,000 | | | | 1,749,760 | | |
| Disposal Total | | | 3,215,260 | | |
| Resource Recovery Total | | | 3,215,260 | | |
| Tax-Backed – 46.0% | |
| Local Appropriated – 7.8% | |
| CA Alameda County | |
| Series 1989, | |
| Insured: MBIA | |
| (a) 06/15/14 | | | 2,185,000 | | | | 1,672,071 | | |
| CA Anaheim Public Financing Authority | |
| Series 1997 C, | |
| Insured: FSA | |
| 6.000% 09/01/14 | | | 3,500,000 | | | | 3,868,445 | | |
| Series 2007 A-1, | |
| Insured: FGIC | |
| 4.250% 09/01/35 | | | 3,500,000 | | | | 2,533,440 | | |
| CA Antelope Valley East-Kern Water Agency | |
Certificates of Participation,
Series 2007 A-1,
Insured: FGIC
4.375% 06/01/37 | | | 2,500,000 | | | | 1,882,525 | | |
| CA Bodega Bay Fire Protection District | |
Certificates of Participation,
Series 1996,
6.450% 10/01/31 | | | 1,185,000 | | | | 975,267 | | |
See Accompanying Notes to Financial Statements.
10
Columbia California Tax-Exempt Fund
October 31, 2008
| Municipal Bonds (continued) | |
| | | Par ($) | | Value ($) | |
| CA Los Angeles County Schools | |
Regionalized Business Services Corp.,
Series 1999 A,
Insured: AMBAC:
(a) 08/01/16 | | | 1,945,000 | | | | 1,307,662 | | |
| (a) 08/01/17 | | | 1,980,000 | | | | 1,246,529 | | |
| CA Modesto | |
Certificates of Participation,
Series 1993 A,
Insured: AMBAC
5.000% 11/01/23 | | | 2,235,000 | | | | 1,989,552 | | |
CA Oakland Joint Powers Financing
Authority | |
| Series 2008 B, | |
| 5.000% 08/01/22 | | | 3,000,000 | | | | 2,892,810 | | |
| CA Sacramento City Financing Authority | |
| Series 1993 A, | |
| Insured: AMBAC | |
| 5.375% 11/01/14 | | | 1,100,000 | | | | 1,134,111 | | |
| CA San Joaquin County | |
Certificates of Participation,
Series 1993,
Insured: MBIA
5.500% 11/15/13 | | | 1,750,000 | | | | 1,820,893 | | |
| CA Santa Ana Financing Authority | |
| Series 1994 A, | |
| Insured: MBIA | |
| 6.250% 07/01/18 | | | 6,035,000 | | | | 6,449,665 | | |
| CA Victor Elementary School District | |
| Series 1996, | |
| Insured: MBIA | |
| 6.450% 05/01/18 | | | 3,345,000 | | | | 3,641,534 | | |
| Local Appropriated Total | | | 31,414,504 | | |
| Local General Obligations – 16.5% | |
| CA Cabrillo Unified School District | |
| Series 1996 A, | |
| Insured: AMBAC | |
| (a) 08/01/15 | | | 3,000,000 | | | | 2,149,710 | | |
CA Central Valley School District
Financing Authority | |
| Series 1998 A, | |
| Insured: MBIA | |
| 6.450% 02/01/18 | | | 1,000,000 | | | | 1,087,140 | | |
| | | Par ($) | | Value ($) | |
| CA Clovis Unified School District | |
| Series 2001 A, | |
| Insured: FGIC | |
| (a) 08/01/16 | | | 3,000,000 | | | | 2,053,890 | | |
| CA Coast Community College District | |
| Series 2005, | |
| Insured: MBIA | |
| (a) 08/01/22 | | | 4,000,000 | | | | 1,856,800 | | |
| CA Corona-Norco Unified School District | |
| Series 2001 C, | |
| Insured: FGIC | |
| (a) 09/01/17 | | | 1,000,000 | | | | 626,570 | | |
CA Culver City School Facilities
Financing Authority | |
| Series 2005, | |
| Insured: FSA: | |
| 5.500% 08/01/25 | | | 655,000 | | | | 675,253 | | |
| 5.500% 08/01/26 | | | 1,750,000 | | | | 1,804,057 | | |
CA East Side Union High School
District Santa Clara County | |
| Series 2003 B, | |
| Insured: MBIA | |
| 5.250% 08/01/26 | | | 2,010,000 | | | | 1,838,326 | | |
| CA Fillmore Unified School District | |
| Series 1997 A, | |
| Insured: FGIC | |
| (a) 07/01/17 | | | 650,000 | | | | 411,158 | | |
| CA Fresno Unified School District | |
| Series 2002 A, | |
| Insured: MBIA | |
| 6.000% 02/01/19 | | | 2,480,000 | | | | 2,594,526 | | |
| CA Golden West Schools Financing Authority | |
Beverly Hills Unified School District,
Series 2005,
Insured: FGIC
5.250% 08/01/18 | | | 1,000,000 | | | | 1,042,630 | | |
Placentia Yorba Linda Unified,
Series 2006,
Insured: AMBAC
5.500% 08/01/24 | | | 1,825,000 | | | | 1,877,268 | | |
| CA Grossmont Union High School District | |
| Series 2006, | |
| Insured: MBIA | |
| (a) 08/01/28 | | | 5,000,000 | | | | 1,517,300 | | |
See Accompanying Notes to Financial Statements.
11
Columbia California Tax-Exempt Fund
October 31, 2008
| Municipal Bonds (continued) | |
| | | Par ($) | | Value ($) | |
CA Hacienda La Puente Unified
School District | |
| Series 2005, | |
| Insured: FGIC | |
| 5.000% 08/01/19 | | | 2,050,000 | | | | 2,026,199 | | |
| CA Jefferson Union High School District | |
| Series 2000 A, | |
| Insured: MBIA | |
| 6.450% 08/01/25 | | | 1,000,000 | | | | 1,040,770 | | |
| CA Lafayette | |
| Series 2002, | |
| 5.125% 07/15/25 | | | 1,995,000 | | | | 1,965,155 | | |
| CA Las Virgenes Unified School District | |
| Series 1997 C, | |
| Insured: FGIC | |
| (a) 11/01/20 | | | 1,205,000 | | | | 615,526 | | |
| CA Los Angeles Unified School District | |
| Series 2002 E, | |
| Insured: MBIA | |
| 5.750% 07/01/16 | | | 2,500,000 | | | | 2,742,150 | | |
| CA Manteca Unified School District | |
| Series 2006, | |
| Insured: MBIA | |
| (a) 08/01/32 | | | 5,440,000 | | | | 1,191,578 | | |
| CA Modesto High School District | |
| Series 2002 A, | |
| Insured: FGIC | |
| (a) 08/01/16 | | | 1,500,000 | | | | 1,008,480 | | |
| CA New Haven Unified School District | |
| Series 2002, | |
| Insured: FSA | |
| 12.000% 08/01/17 | | | 1,565,000 | | | | 2,423,089 | | |
| CA Oak Park Unified School District | |
| Series 2000, | |
| Insured: FSA | |
| (a) 05/01/14 | | | 2,095,000 | | | | 1,660,853 | | |
| CA Oxnard Union High School District | |
| Series 2001 A, | |
| Insured: MBIA | |
| 5.650% 02/01/17 | | | 960,000 | | | | 1,001,222 | | |
| CA Pajaro Valley Unified School District | |
| Series 2005, | |
| Insured: FSA | |
| 5.250% 08/01/18 | | | 1,000,000 | | | | 1,033,760 | | |
| | | Par ($) | | Value ($) | |
| CA Pomona Unified School District | |
| Series 2001 A, | |
| Insured: MBIA | |
| 5.900% 02/01/16 | | | 845,000 | | | | 898,565 | | |
| CA Redwood City Elementary School District | |
| Series 1997, | |
| Insured: FGIC | |
| (a) 08/01/18 | | | 2,385,000 | | | | 1,389,429 | | |
| CA Rocklin Unified School District | |
| Series 1995 C, | |
| Insured: MBIA | |
| (a) 07/01/20 | | | 6,920,000 | | | | 3,679,295 | | |
| Series 2003, | |
| Insured: FGIC | |
| (a) 08/01/17 | | | 2,000,000 | | | | 1,259,120 | | |
| CA San Juan Unified School District | |
| Series 2001, | |
| Insured: FSA | |
| (a) 08/01/15 | | | 2,760,000 | | | | 2,001,304 | | |
| CA San Marino Unified School District | |
| Series 1998 B, | |
| 5.000% 06/01/23 | | | 1,000,000 | | | | 994,840 | | |
| CA San Mateo County Community College | |
| Series 2006 C, | |
| Insured: MBIA | |
| (a) 09/01/26 | | | 1,925,000 | | | | 662,335 | | |
| CA San Mateo Union High School District | |
| Series 2000 B, | |
| Insured: FGIC | |
| (a) 09/01/26 | | | 4,005,000 | | | | 1,385,890 | | |
| CA Sanger Unified School District | |
| Series 1999, | |
| Insured: MBIA | |
| 5.350% 08/01/15 | | | 1,500,000 | | | | 1,522,395 | | |
| CA Santa Margarita - Dana Point Authority | |
| Series 1994 B, | |
| Insured: MBIA | |
| 7.250% 08/01/13 | | | 2,000,000 | | | | 2,294,320 | | |
| CA Saratoga | |
| Series 2001, | |
| Insured: MBIA | |
| 5.250% 08/01/31 | | | 2,000,000 | | | | 1,930,340 | | |
| CA Simi Valley Unified School District | |
| Series 1997, | |
| Insured: AMBAC | |
| 5.250% 08/01/22 | | | 925,000 | | | | 875,485 | | |
See Accompanying Notes to Financial Statements.
12
Columbia California Tax-Exempt Fund
October 31, 2008
| Municipal Bonds (continued) | |
| | | Par ($) | | Value ($) | |
| CA South San Francisco Unified School District | |
| Series 2006, | |
| Insured: MBIA | |
| 5.250% 09/15/22 | | | 1,500,000 | | | | 1,548,180 | | |
| CA Tahoe-Truckee Unified School District | |
| No. 1-A, | |
| Series 1999, | |
| Insured: FGIC | |
| (a) 08/01/23 | | | 3,780,000 | | | | 1,533,697 | | |
| No. 2-A, | |
| Series 1999, | |
| Insured: FGIC | |
| (a) 08/01/24 | | | 2,965,000 | | | | 1,121,333 | | |
| CA Union Elementary School District | |
| Series 1999 A, | |
| Insured: FGIC | |
| (a) 09/01/19 | | | 1,750,000 | | | | 970,882 | | |
| CA Upland Unified School District | |
| Series 2001, | |
| Insured: FSA | |
| 5.125% 08/01/25 | | | 750,000 | | | | 733,043 | | |
| CA West Contra Costa Unified School District | |
| Series 2001 A, | |
| Insured: MBIA | |
| 5.600% 02/01/20 | | | 1,610,000 | | | | 1,568,591 | | |
| Series 2005 D, | |
| Insured: FGIC | |
| (a) 08/01/22 | | | 5,000,000 | | | | 2,100,450 | | |
| CA West Covina Unified School District | |
| Series 2002 A, | |
| Insured: MBIA | |
| 5.250% 02/01/19 | | | 725,000 | | | | 718,374 | | |
| CA Yuba City Unified School District | |
| Series 2000, | |
| Insured: FGIC | |
| (a) 09/01/20 | | | 2,385,000 | | | | 1,174,994 | | |
| Local General Obligations Total | | | 66,606,272 | | |
| Special Non-Property Tax – 3.2% | |
| CA San Diego Redevelopment Agency | |
| Series 2001, | |
| Insured: FSA | |
| (a) 09/01/20 | | | 3,630,000 | | | | 1,817,323 | | |
CA San Francisco Bay Area Rapid Transit
Financing Authority | |
| Series 2001, | |
| Insured: AMBAC | |
| 5.000% 07/01/26 | | | 525,000 | | | | 501,816 | | |
| | | Par ($) | | Value ($) | |
| Series 2005 A, | |
| Insured: MBIA | |
| 4.250% 07/01/25 | | | 2,000,000 | | | | 1,711,520 | | |
| PR Commonwealth of Puerto Rico Highway & Transportation Authority | |
| Series 1996 Y, | |
| Insured: MBIA | |
| 6.250% 07/01/12 | | | 3,000,000 | | | | 3,142,380 | | |
| Series 1998 A, | |
| Insured: MBIA | |
| 4.750% 07/01/38 | | | 2,250,000 | | | | 1,706,288 | | |
| Series 2002 E, | |
| Insured: FSA | |
| 5.500% 07/01/14 | | | 2,000,000 | | | | 2,091,800 | | |
| Series 2006 BB, | |
| Insured: FSA | |
| 5.250% 07/01/22 | | | 2,000,000 | | | | 1,932,680 | | |
| Special Non-Property Tax Total | | | 12,903,807 | | |
| Special Property Tax – 11.4% | |
| CA Carson Improvement Bond Act 1915 | |
| Series 1992, | |
| 7.375% 09/02/22 | | | 125,000 | | | | 118,813 | | |
| CA Cerritos Public Financing Authority | |
Los Coyotes Redevelopment,
Series 1993 A,
Insured: AMBAC
6.500% 11/01/23 | | | 2,000,000 | | | | 2,112,220 | | |
| CA Elk Grove Unified School District | |
Community Facilities District No. 1,
Series 1995 A,
Insured: AMBAC:
(a) 12/01/18 | | | 2,720,000 | | | | 1,518,386 | | |
| 6.500% 12/01/24 | | | 4,055,000 | | | | 4,046,687 | | |
| CA Inglewood Redevelopment Agency | |
| Series 1998 A, | |
| Insured: AMBAC | |
| 5.250% 05/01/23 | | | 1,000,000 | | | | 977,670 | | |
| CA Lancaster Financing Authority | |
| Series 2003, | |
| Insured: MBIA | |
| 5.125% 02/01/17 | | | 1,270,000 | | | | 1,287,640 | | |
| CA Long Beach Bond Finance Authority | |
| Series 2006 C, | |
| Insured: AMBAC | |
| 5.500% 08/01/31 | | | 3,250,000 | | | | 2,937,610 | | |
See Accompanying Notes to Financial Statements.
13
Columbia California Tax-Exempt Fund
October 31, 2008
| Municipal Bonds (continued) | |
| | | Par ($) | | Value ($) | |
CA Los Angeles Community
Redevelopment Agency | |
| Series 1998 C, | |
| Insured: MBIA | |
| 5.375% 07/01/18 | | | 1,665,000 | | | | 1,676,722 | | |
CA Los Angeles County Public Works
Financing Authority | |
| J.F. Shea Co., | |
| Series 1996 A, | |
| Insured: FSA | |
| 5.500% 10/01/18 | | | 2,695,000 | | | | 2,859,179 | | |
| Regional Park & Open Space, | |
| Series 2005, | |
| Insured: FSA | |
| 5.250% 10/01/18 | | | 2,000,000 | | | | 2,124,120 | | |
| CA Oakdale Public Financing Authority | |
Central City Redevelopment Project,
Series 2004,
5.375% 06/01/33 | | | 1,500,000 | | | | 1,134,960 | | |
| CA Oakland Redevelopment Agency | |
| Series 1992, | |
| Insured: AMBAC | |
| 5.500% 02/01/14 | | | 8,400,000 | | | | 8,844,360 | | |
| CA Oceanside Community Facilities | |
Ocean Ranch Corp.,
Series 2004,
5.875% 09/01/34 | | | 1,000,000 | | | | 803,130 | | |
CA Orange County Community
Facilities District | |
Ladera Ranch,
Series 2004 A,
5.625% 08/15/34 | | | 850,000 | | | | 679,787 | | |
CA Rancho Cucamonga
Redevelopment Agency | |
| Series 2007 A, | |
| Insured: MBIA | |
| 5.000% 09/01/34 | | | 1,000,000 | | | | 854,320 | | |
CA Redwood City Community Facilities
District No. 1 | |
| Series 2003 B, | |
| 5.950% 09/01/28 | | | 750,000 | | | | 628,507 | | |
CA Riverside County Public
Financing Authority | |
| Series 1991 A, | |
| 8.000% 02/01/18 | | | 20,000 | | | | 20,061 | | |
| | | Par ($) | | Value ($) | |
CA San Bernardino Joint Powers
Financing Authority | |
| Series 1998 A, | |
| Insured: AMBAC | |
| 5.750% 07/01/14 | | | 985,000 | | | | 1,041,874 | | |
| Series 2005 A, | |
| Insured: FSA | |
| 5.750% 10/01/24 | | | 2,420,000 | | | | 2,557,383 | | |
| CA San Jose Redevelopment Agency | |
| Series 1993, | |
| Insured: MBIA | |
| 6.000% 08/01/15 | | | 2,790,000 | | | | 3,004,663 | | |
| CA Sulphur Springs Unified School District | |
| Series 2002-1-A, | |
| 6.000% 09/01/33 | | | 1,500,000 | | | | 1,162,935 | | |
| CA West Covina Redevelopment Agency | |
| Series 1996, | |
| 6.000% 09/01/17 | | | 5,000,000 | | | | 5,346,100 | | |
| Special Property Tax Total | | | 45,737,127 | | |
| State Appropriated – 2.5% | |
| CA Public Works Board | |
Department of Mental Health,
Coalinga State Hospital,
Series 2004 A,
5.500% 06/01/19 | | | 1,500,000 | | | | 1,526,790 | | |
Various State Prisons Projects,
Series 1993 A,
Insured: AMBAC:
5.000% 12/01/19 | | | 6,000,000 | | | | 5,789,520 | | |
| 5.250% 12/01/13 | | | 2,500,000 | | | | 2,553,300 | | |
| State Appropriated Total | | | 9,869,610 | | |
| State General Obligations – 4.6% | |
| CA State | |
| Series 1995, | |
| 5.750% 03/01/09 | | | 65,000 | | | | 65,709 | | |
| Series 2000, | |
| 5.625% 05/01/26 | | | 160,000 | | | | 160,387 | | |
| Series 2003, | |
| 5.250% 02/01/20 | | | 1,250,000 | | | | 1,259,088 | | |
| Series 2007, | |
| 4.500% 08/01/26 | | | 2,500,000 | | | | 2,142,050 | | |
| Series 2008, | |
| 5.000% 08/01/34 | | | 2,500,000 | | | | 2,231,925 | | |
PR Commonwealth of Puerto Rico Public
Buildings Authority | |
| Series 2002 C, | |
| 5.500% 07/01/14 | | | 500,000 | | | | 507,485 | | |
See Accompanying Notes to Financial Statements.
14
Columbia California Tax-Exempt Fund
October 31, 2008
| Municipal Bonds (continued) | |
| | | Par ($) | | Value ($) | |
| PR Commonwealth of Puerto Rico | |
| Series 1995, | |
| Insured: MBIA | |
| 5.650% 07/01/15 | | | 1,000,000 | | | | 1,019,920 | | |
| Series 1996, | |
| Insured: MBIA | |
| 6.500% 07/01/14 | | | 2,000,000 | | | | 2,119,980 | | |
| Series 2004 A: | |
| 5.250% 07/01/21 | | | 2,000,000 | | | | 1,841,380 | | |
| 5.250% 07/01/22 | | | 2,000,000 | | | | 1,833,300 | | |
| Series 2007 A, | |
| 5.500% 07/01/21 | | | 2,500,000 | | | | 2,356,125 | | |
| PR Public Buildings Authority | |
| Series 2007, | |
| 6.250% 07/01/23 | | | 3,000,000 | | | | 3,011,130 | | |
| State General Obligations Total | | | 18,548,479 | | |
| Tax-Backed Total | | | 185,079,799 | | |
| Transportation – 2.4% | |
| Airports – 0.7% | |
| CA County of Sacramento | |
| Series 2008 B, AMT, | |
| Insured: FSA | |
| 5.250% 07/01/39 | | | 1,000,000 | | | | 757,550 | | |
CA San Diego County Regional
Airport Authority | |
| Series 2005, AMT, | |
| Insured: AMBAC | |
| 5.250% 07/01/20 | | | 750,000 | | | | 666,195 | | |
CA San Francisco City & County
Airports Commission | |
| Series 2008 34E, AMT, | |
| 5.750% 05/01/25 | | | 1,500,000 | | | | 1,327,590 | | |
| Airports Total | | | 2,751,335 | | |
| Toll Facilities – 1.7% | |
| CA Bay Area Toll Authority | |
| Series 2008 F-1, | |
| 5.125% 04/01/47 | | | 2,500,000 | | | | 2,219,700 | | |
CA Foothill Eastern Transportation
Corridor Agency | |
| Series 1995 A, | |
| Insured: MBIA | |
| 5.000% 01/01/35 | | | 2,000,000 | | | | 1,646,480 | | |
| | | Par ($) | | Value ($) | |
| Series 1999, | |
| 5.750% 01/15/40 | | | 4,000,000 | | | | 3,113,000 | | |
| Toll Facilities Total | | | 6,979,180 | | |
| Transportation Total | | | 9,730,515 | | |
| Utilities – 14.7% | |
| Investor Owned – 1.8% | |
CA Chula Vista Industrial Development
Authority | |
San Diego Gas & Electric Co.,
Series 1996 B, AMT,
5.500% 12/01/21 | | | 2,000,000 | | | | 1,772,640 | | |
San Diego Gas D,
Series 2005, AMT,
5.000% 12/01/27 | | | 3,500,000 | | | | 2,747,185 | | |
| CA Pollution Control Financing Authority | |
San Diego Gas & Electric Co.,
Series 1996 A,
Insured: AMBAC
5.900% 06/01/14 | | | 2,650,000 | | | | 2,858,237 | | |
| Investor Owned Total | | | 7,378,062 | | |
| Joint Power Authority – 1.1% | |
CA Southern California Public
Power Authority | |
| Series 1989, | |
| 6.750% 07/01/13 | | | 4,000,000 | | | | 4,512,760 | | |
| Joint Power Authority Total | | | 4,512,760 | | |
| Municipal Electric – 3.1% | |
| CA Modesto Irrigation District | |
Certificates of Participation,
Series 2004 B,
5.500% 07/01/35 | | | 2,000,000 | | | | 1,832,900 | | |
| CA Sacramento Municipal Utility District | |
| Series 1993 G, | |
| Insured: MBIA | |
| 6.500% 09/01/13 | | | 1,500,000 | | | | 1,605,705 | | |
| Series 1997 K, | |
| Insured: AMBAC: | |
| 5.250% 07/01/24 | | | 2,220,000 | | | | 2,182,615 | | |
| 5.700% 07/01/17 | | | 1,900,000 | | | | 2,053,501 | | |
| Series 2001 N, | |
| Insured: MBIA | |
| 5.000% 08/15/28 | | | 2,000,000 | | | | 1,815,140 | | |
See Accompanying Notes to Financial Statements.
15
Columbia California Tax-Exempt Fund
October 31, 2008
| Municipal Bonds (continued) | |
| | | Par ($) | | Value ($) | |
PR Commonwealth of Puerto Rico
Electric Power Authority | |
| Series 2007 VV, | |
| Insured: MBIA | |
| 5.250% 07/01/29 | | | 2,000,000 | | | | 1,756,900 | | |
| Series 2008 WW, | |
| 5.000% 07/01/28 | | | 1,500,000 | | | | 1,286,265 | | |
| Municipal Electric Total | | | 12,533,026 | | |
| Water & Sewer – 8.7% | |
| CA Big Bear Lake | |
| Series 1996, | |
| Insured: MBIA | |
| 6.000% 04/01/15 | | | 1,350,000 | | | | 1,440,018 | | |
| CA Chino Basin Regional Financing Authority | |
| Inland Empire Utilities Agency, | |
| Series 2008 A, | |
| Insured: AMBAC | |
| 5.000% 11/01/38 | | | 2,000,000 | | | | 1,718,320 | | |
| CA Contra Costa Water District | |
| Series 2002 L, | |
| Insured: FSA | |
| 5.000% 10/01/24 | | | 1,920,000 | | | | 1,882,752 | | |
| CA Eastern Municipal Water District | |
| Certificates of Participation, | |
| Series 1991, | |
| Insured: FGIC | |
| 6.750% 07/01/12 | | | 1,000,000 | | | | 1,062,740 | | |
| CA Elsinore Valley Municipal Water District | |
| Certificates of Participation, | |
| Series 1992 A, | |
| Insured: FGIC | |
| 6.000% 07/01/12 | | | 2,500,000 | | | | 2,572,500 | | |
| CA Fresno | |
| Series 1993 A-1, | |
| Insured: AMBAC | |
| 6.250% 09/01/14 | | | 5,000,000 | | | | 5,305,300 | | |
| CA Lodi Wastewater Systems Revenue | |
| Series 2007 A, | |
| Insured: FSA | |
| 5.000% 10/01/37 | | | 1,250,000 | | | | 1,110,525 | | |
CA Los Angeles Department of
Water & Power | |
| Series 2001 A: | |
| 5.125% 07/01/41 | | | 3,000,000 | | | | 2,684,490 | | |
| Insured: FGIC | |
| 5.125% 07/01/41 | | | 3,000,000 | | | | 2,676,540 | | |
| | | Par ($) | | Value ($) | |
| CA Manteca Financing Authority | |
| Series 2003 B, | |
| Insured: MBIA | |
| 5.000% 12/01/33 | | | 665,000 | | | | 668,644 | | |
CA Metropolitan Water District of
Southern California | |
| Series 1993 A, | |
| 5.750% 07/01/21 | | | 3,635,000 | | | | 3,860,188 | | |
| CA Pico Rivera Water Authority | |
| Series 1999 A, | |
| Insured: MBIA | |
| 5.500% 05/01/29 | | | 2,000,000 | | | | 1,936,880 | | |
| CA Sacramento County Sanitation District | |
| Series 2001, | |
| Insured: AMBAC | |
| 5.500% 12/01/18 | | | 2,000,000 | | | | 2,134,520 | | |
| CA Santa Clara Valley Water District | |
| Series 2006, | |
| Insured: FSA | |
| 4.250% 06/01/30 | | | 2,500,000 | | | | 1,992,275 | | |
| CA Santa Maria Water & Wastewater | |
| Series 1997 A, | |
| Insured: AMBAC | |
| (a) 08/01/14 | | | 2,000,000 | | | | 1,520,620 | | |
| CA State Department of Water Resources | |
| Series 2001, | |
| Insured: FSA | |
| 5.500% 12/01/14 | | | 1,990,000 | | | | 2,182,891 | | |
| Water & Sewer Total | | | 34,749,203 | | |
| Utilities Total | | | 59,173,051 | | |
Total Municipal Bonds
(cost of $406,286,166) | | | 384,824,432 | | |
| Municipal Preferred Stock – 0.5% | |
| | | Shares | | | |
| Housing – 0.5% | |
| Multi-Family – 0.5% | |
| Munimae TE Bond Subsidiary LLC | |
| Series 2004 A-2, | |
| 4.900% 06/30/49 (e) | | | 2,000,000 | | | | 1,740,180 | | |
| Multi-Family Total | | | 1,740,180 | | |
| Housing Total | | | 1,740,180 | | |
Total Municipal Preferred Stock
(cost of $2,000,000) | | | 1,740,180 | | |
See Accompanying Notes to Financial Statements.
16
Columbia California Tax-Exempt Fund
October 31, 2008
| Investment Company – 0.4% | |
| | | Shares | | Value ($) | |
| Dreyfus Municipal Cash | |
Management Plus
(7 day yield of 2.260%) | | | 1,637,554 | | | | 1,637,554 | | |
Total Investment Company
(cost of $1,637,554) | | | 1,637,554 | | |
| Other – 0.0% | |
| Transportation – 0.0% | |
CA Statewide Communities Development
Authority | |
United Airlines, Inc.,
Series 2001,
07/01/39 (f)(g) | | | 2,000,000 | | | | 80,000 | | |
| Transportation Total | | | 80,000 | | |
Total Other
(cost of $—) | | | 80,000 | | |
| Short-Term Obligation – 0.0% | |
| | | Par ($) | | | |
| Variable Rate Demand Note (h) – 0.0% | |
| CA Department of Water Resources | |
Power Supply Revenue,
Series 2005 F-2,
LOC: JPMorgan Chase Bank,
LOC: Societe Generale
0.900% 05/01/20 | | | 100,000 | | | | 100,000 | | |
| Variable Rate Demand Note Total | | | 100,000 | | |
Total Short-Term Obligation
(cost of $100,000) | | | 100,000 | | |
Total Investments – 96.5%
(cost of $410,023,720) (i) | | | 388,382,166 | | |
| Other Assets & Liabilities, Net – 3.5% | | | 14,067,224 | | |
| Net Assets – 100.0% | | | 402,449,390 | | |
Notes to Investment Portfolio:
(a) Zero coupon bond.
(b) Denotes a restricted security, which is subject to restrictions on resale under federal securities laws or in transactions exempt from registration. At October 31, 2008, the value of this security amounted to $1,458,690 which represents 0.4% of net assets. Additional information on this restricted security is as follows:
| Security | | Acquisition
Date | | Acquisition
Cost | |
CA Statewide Communities Development
Authority; Crossroads School for Arts &
Sciences, Series 1998, 6.000% 08/01/28 | | | 08/21/98 | | | $ | 1,750,000 | | |
(c) The Fund has been informed that each issuer has placed direct obligations of the U.S. Government in an irrevocable trust, solely for the payment of principal and interest.
(d) The interest rate shown on floating rate or variable rate securities reflects the rate at October 31, 2008.
(e) Security exempt from registration pursuant to Rule 144A under the Securities Act of 1933. This security may be resold in transactions exempt from registration, normally to qualified institutional buyers. At October 31, 2008, the value of this security, which is not illiquid, represents 0.5% of net assets.
(f) Non-income producing.
(g) Position reflects anticipated residual bankruptcy claims. Income is not being accrued.
(h) This security is payable upon demand and secured by letters of credit or other credit support agreements from banks. The interest rate changes periodically and the interest rate shown reflect the rate at October 31, 2008.
(i) Cost for federal income tax purposes is $409,883,637.
At October 31, 2008, the composition of the Fund by revenue source is as follows:
| Holdings By Revenue Source (Unaudited) | | % of
Net Assets | |
| Tax-Backed | | | 46.0 | | |
| Refunded/Escrowed | | | 16.7 | | |
| Utilities | | | 14.7 | | |
| Health Care | | | 8.3 | | |
| Education | | | 3.2 | | |
| Transportation | | | 2.4 | | |
| Other | | | 2.0 | | |
| Housing | | | 1.0 | | |
| Resource Recovery | | | 0.8 | | |
| Industrials | | | 0.5 | | |
| | | | 95.6 | | |
| Municipal Preferred Stock | | | 0.5 | | |
| Investment Company | | | 0.4 | | |
| Other | | | 0.0 | * | |
| Short-Term Obligation | | | 0.0 | * | |
| Other Assets & Liabilities, Net | | | 3.5 | | |
| | | | 100.0 | | |
* Represented less than 0.1%.
| Acronym | | Name | |
| AMBAC | | Ambac Assurance Corp. | |
|
| AMT | | Alternative Minimum Tax | |
|
| FGIC | | Financial Guaranty Insurance Co. | |
|
| FHA | | Federal Housing Administration | |
|
| FNMA | | Federal National Mortgage Association | |
|
| FSA | | Financial Security Assurance, Inc. | |
|
| GNMA | | Government National Mortgage Association | |
|
| IFRN | | Inverse Floating Rate Note | |
|
| LOC | | Letter of Credit | |
|
| MBIA | | MBIA Insurance Corp. | |
|
See Accompanying Notes to Financial Statements.
17
Statement of Assets and Liabilities – Columbia California Tax-Exempt Fund
October 31, 2008
| Assets | | Investments, at cost | | $ | 410,023,720 | | |
| | | Investments, at value | | $ | 388,382,166 | | |
| | | Cash | | | 2,629,050 | | |
| | | Receivable for: | | | | | |
| | | Investments sold | | | 4,704,390 | | |
| | | Fund shares sold | | | 2,561,551 | | |
| | | Interest | | | 5,587,653 | | |
| | | Trustees' deferred compensation plan | | | 33,550 | | |
| | | Other assets | | | 919 | | |
| | | Total Assets | | | 403,899,279 | | |
| Liabilities | | Expense reimbursement due to investment advisor | | | 17,238 | | |
| | | Payable for: | |
| | | Fund shares repurchased | | | 199,763 | | |
| | | Distributions | | | 812,968 | | |
| | | Investment advisory fee | | | 170,839 | | |
| | | Transfer agent fee | | | 29,755 | | |
| | | Pricing and bookkeeping fees | | | 13,180 | | |
| | | Trustees' fees | | | 31,549 | | |
| | | Custody fee | | | 2,706 | | |
| | | Distribution and service fees | | | 73,790 | | |
| | | Chief compliance officer expenses | | | 62 | | |
| | | Trustees' deferred compensation plan | | | 33,550 | | |
| | | Other liabilities | | | 64,489 | | |
| | | Total Liabilities | | | 1,449,889 | | |
| | | Net Assets | | | 402,449,390 | | |
| Net Assets Consist of | | Paid-in capital | | | 423,973,206 | | |
| | | Undistributed net investment income | | | 282,480 | | |
| | | Accumulated net realized loss | | | (164,742 | ) | |
| | | Net unrealized depreciation on investments | | | (21,641,554 | ) | |
| | | Net Assets | | | 402,449,390 | | |
| Class A | | Net assets | | $ | 263,220,250 | | |
| | | Shares outstanding | | | 39,247,362 | | |
| | | Net asset value per share | | $ | 6.71 | (a) | |
| | | Maximum sales charge | | | 4.75 | % | |
| | | Maximum offering price per share ($6.71/0.9525) | | $ | 7.04 | (b) | |
| Class B | | Net assets | | $ | 9,739,809 | | |
| | | Shares outstanding | | | 1,452,248 | | |
| | | Net asset value and offering price per share | | $ | 6.71 | (a) | |
| Class C | | Net assets | | $ | 21,898,671 | | |
| | | Shares outstanding | | | 3,265,246 | | |
| | | Net asset value and offering price per share | | $ | 6.71 | (a) | |
| Class Z | | Net assets | | $ | 107,590,660 | | |
| | | Shares outstanding | | | 16,042,628 | | |
| | | Net asset value, offering and redemption price per share | | $ | 6.71 | | |
(a) Redemption price per share is equal to net asset value less any applicable contingent deferred sales charge.
(b) On sales of $50,000 or more the offering price is reduced.
See Accompanying Notes to Financial Statements.
18
Statement of Operations – Columbia California Tax-Exempt Fund
For the Year Ended October 31, 2008
| | | | | ($) | |
| Investment Income | | Interest | | | 21,586,446 | | |
| | | Dividends | | | 125,457 | | |
| | | Securities lending income | | | 13 | | |
| | | Total Investment Income | | | 21,711,916 | | |
| Expenses | | Investment advisory fee | | | 2,181,403 | | |
| | | Distribution fee: | | | | | |
| | | Class B | | | 98,202 | | |
| | | Class C | | | 150,840 | | |
| | | Service fee: | | | | | |
| | | Class A | | | 664,448 | | |
| | | Class B | | | 31,156 | | |
| | | Class C | | | 47,855 | | |
| | | Transfer agent fee | | | 85,476 | | |
| | | Pricing and bookkeeping fees | | | 131,048 | | |
| | | Trustees' fees | | | 25,657 | | |
| | | Custody fee | | | 18,955 | | |
| | | Chief compliance officer expenses | | | 749 | | |
| | | Other expenses | | | 207,175 | | |
| | | Total Expenses | | | 3,642,964 | | |
| | | Fees waived or expenses reimbursed by investment advisor | | | (29,313 | ) | |
| | | Fees waived by distributor—Class C | | | (60,360 | ) | |
| | | Expense reductions | | | (3,853 | ) | |
| | | Net Expenses | | | 3,549,438 | | |
| | | Net Investment Income | | | 18,162,478 | | |
| Net Realized and Unrealized Gain (Loss) on Investments and Futures Contracts | | | |
| | | Net realized gain (loss) on: | | | | | |
| | | Investments | | | 1,080,044 | | |
| | | Futures contracts | | | (22,545 | ) | |
| | | Net realized gain | | | 1,057,499 | | |
| | | Net change in unrealized appreciation (depreciation) on: | |
| | | Investments | | | (49,695,003 | ) | |
| | | Futures contracts | | | 192,106 | | |
| | | Net change in unrealized appreciation (depreciation) | | | (49,502,897 | ) | |
| | | Net Loss | | | (48,445,398 | ) | |
| | | Net Decrease Resulting from Operations | | | (30,282,920 | ) | |
See Accompanying Notes to Financial Statements.
19
Statement of Changes in Net Assets – Columbia California Tax-Exempt Fund
| | | | | Year Ended October 31, | |
| Increase (Decrease) in Net Assets | | | | 2008 ($) | | 2007 ($) | |
| Operations | | Net investment income | | | 18,162,478 | | | | 17,848,496 | | |
| | | Net realized gain on investments and futures contracts | | | 1,057,499 | | | | 2,419,467 | | |
| | | Net change in unrealized appreciation (depreciation) on
investments and futures contracts | | | (49,502,897 | ) | | | (12,124,486 | ) | |
| | | Net Increase (Decrease) Resulting from Operations | | | (30,282,920 | ) | | | 8,143,477 | | |
| Distributions to Shareholders | | From net investment income: | | | | | | | | | |
| | | Class A | | | (11,559,069 | ) | | | (11,429,081 | ) | |
| | | Class B | | | (442,150 | ) | | | (648,196 | ) | |
| | | Class C | | | (741,322 | ) | | | (572,773 | ) | |
| | | Class Z | | | (5,418,607 | ) | | | (5,193,527 | ) | |
| | | From net realized gains: | |
| | | Class A | | | (1,597,721 | ) | | | (985,879 | ) | |
| | | Class B | | | (89,254 | ) | | | (77,965 | ) | |
| | | Class C | | | (104,151 | ) | | | (54,363 | ) | |
| | | Class Z | | | (730,285 | ) | | | (419,456 | ) | |
| | | Total Distributions to Shareholders | | | (20,682,559 | ) | | | (19,381,240 | ) | |
| | | Net Capital Share Transactions | | | 16,332,602 | | | | (8,450,947 | ) | |
| | | Total Decrease in Net Assets | | | (34,632,877 | ) | | | (19,688,710 | ) | |
| Net Assets | | Beginning of period | | | 437,082,267 | | | | 456,770,977 | | |
| | | End of period | | | 402,449,390 | | | | 437,082,267 | | |
| | | Undistributed net investment income, at end of period | | | 282,480 | | | | 310,689 | | |
See Accompanying Notes to Financial Statements.
20
Statement of Changes in Net Assets (continued) – Capital Stock Activity
| | | Year Ended October 31, | |
| | | 2008 | | 2007 | |
| | | Shares | | Dollars ($) | | Shares | | Dollars ($) | |
| Class A | |
| Subscriptions | | | 8,916,823 | | | | 65,274,242 | | | | 4,085,761 | | | | 30,967,797 | | |
| Distributions reinvested | | | 1,184,466 | | | | 8,612,536 | | | | 1,015,424 | | | | 7,726,947 | | |
| Redemptions | | | (8,118,611 | ) | | | (58,820,520 | ) | | | (5,669,785 | ) | | | (42,946,663 | ) | |
| Net Increase (Decrease) | | | 1,982,678 | | | | 15,066,258 | | | | (568,600 | ) | | | (4,251,919 | ) | |
| Class B | |
| Subscriptions | | | 145,678 | | | | 1,073,625 | | | | 35,886 | | | | 273,102 | | |
| Distributions reinvested | | | 46,959 | | | | 343,107 | | | | 63,700 | | | | 485,409 | | |
| Redemptions | | | (876,556 | ) | | | (6,424,692 | ) | | | (1,065,726 | ) | | | (8,110,885 | ) | |
| Net Decrease | | | (683,919 | ) | | | (5,007,960 | ) | | | (966,140 | ) | | | (7,352,374 | ) | |
| Class C | |
| Subscriptions | | | 1,651,124 | | | | 12,081,252 | | | | 436,145 | | | | 3,310,841 | | |
| Distributions reinvested | | | 63,179 | | | | 458,523 | | | | 43,463 | | | | 330,590 | | |
| Redemptions | | | (670,276 | ) | | | (4,878,905 | ) | | | (355,147 | ) | | | (2,711,044 | ) | |
| Net Increase | | | 1,044,027 | | | | 7,660,870 | | | | 124,461 | | | | 930,387 | | |
| Class Z | |
| Subscriptions | | | 4,727,932 | | | | 34,922,006 | | | | 3,628,532 | | | | 27,532,856 | | |
| Distributions reinvested | | | 74,327 | | | | 545,939 | | | | 46,070 | | | | 352,743 | | |
| Redemptions | | | (5,048,600 | ) | | | (36,854,511 | ) | | | (3,386,180 | ) | | | (25,662,640 | ) | |
| Net Increase (Decrease) | | | (246,341 | ) | | | (1,386,566 | ) | | | 288,422 | | | | 2,222,959 | | |
See Accompanying Notes to Financial Statements.
21
Financial Highlights – Columbia California Tax-Exempt Fund
Selected data for a share outstanding throughout each period is as follows:
| | | Year Ended October 31, | |
| Class A Shares | | 2008 | | 2007 | | 2006 | | 2005 | | 2004 | |
| Net Asset Value, Beginning of Period | | $ | 7.55 | | | $ | 7.74 | | | $ | 7.59 | | | $ | 7.74 | | | $ | 7.70 | | |
| Income from Investment Operations: | |
| Net investment income (a) | | | 0.30 | | | | 0.30 | | | | 0.31 | | | | 0.31 | | | | 0.31 | | |
Net realized and unrealized gain (loss)
on investments and futures contracts | | | (0.79 | ) | | | (0.16 | ) | | | 0.18 | | | | (0.15 | ) | | | 0.20 | | |
| Total from Investment Operations | | | (0.49 | ) | | | 0.14 | | | | 0.49 | | | | 0.16 | | | | 0.51 | | |
| Less Distributions to Shareholders: | |
| From net investment income | | | (0.31 | ) | | | (0.30 | ) | | | (0.31 | ) | | | (0.31 | ) | | | (0.31 | ) | |
| From net realized gains | | | (0.04 | ) | | | (0.03 | ) | | | (0.03 | ) | | | — | | | | (0.16 | ) | |
| Total Distributions to Shareholders | | | (0.35 | ) | | | (0.33 | ) | | | (0.34 | ) | | | (0.31 | ) | | | (0.47 | ) | |
| Net Asset Value, End of Period | | $ | 6.71 | | | $ | 7.55 | | | $ | 7.74 | | | $ | 7.59 | | | $ | 7.74 | | |
| Total return (b) | | | (6.80 | )%(c) | | | 1.86 | %(c) | | | 6.61 | %(c) | | | 2.05 | %(c) | | | 6.81 | % | |
| Ratios to Average Net Assets/Supplemental Data: | |
| Net expenses (d) | | | 0.84 | % | | | 0.83 | % | | | 0.83 | % | | | 0.90 | % | | | 0.87 | % | |
| Waiver/Reimbursement | | | 0.01 | % | | | 0.03 | % | | | 0.02 | % | | | — | %(e) | | | — | | |
| Net investment income (d) | | | 4.14 | % | | | 3.99 | % | | | 4.04 | % | | | 4.00 | % | | | 4.07 | % | |
| Portfolio turnover rate | | | 12 | % | | | 12 | % | | | 10 | % | | | 7 | % | | | 4 | % | |
| Net assets, end of period (000's) | | $ | 263,220 | | | $ | 281,254 | | | $ | 292,740 | | | $ | 303,486 | | | $ | 199,877 | | |
(a) Per share data was calculated using the average shares outstanding during the period.
(b) Total return at net asset value assuming all distributions reinvested and no initial sales charge or contingent deferred sales charge.
(c) Had the investment advisor and/or any of its affiliates not waived fees or reimbursed a portion of expenses, total return would have been reduced.
(d) The benefits derived from expense reductions had an impact of less than 0.01%.
(e) Rounds to less than 0.01%.
See Accompanying Notes to Financial Statements.
22
Financial Highlights – Columbia California Tax-Exempt Fund
Selected data for a share outstanding throughout each period is as follows:
| | | Year Ended October 31, | |
| Class B Shares | | 2008 | | 2007 | | 2006 | | 2005 | | 2004 | |
| Net Asset Value, Beginning of Period | | $ | 7.55 | | | $ | 7.74 | | | $ | 7.59 | | | $ | 7.74 | | | $ | 7.70 | | |
| Income from Investment Operations: | |
| Net investment income (a) | | | 0.25 | | | | 0.25 | | | | 0.25 | | | | 0.25 | | | | 0.25 | | |
Net realized and unrealized gain (loss)
on investments and futures contracts | | | (0.80 | ) | | | (0.17 | ) | | | 0.18 | | | | (0.15 | ) | | | 0.20 | | |
| Total from Investment Operations | | | (0.55 | ) | | | 0.08 | | | | 0.43 | | | | 0.10 | | | | 0.45 | | |
| Less Distributions to Shareholders: | |
| From net investment income | | | (0.25 | ) | | | (0.24 | ) | | | (0.25 | ) | | | (0.25 | ) | | | (0.25 | ) | |
| From net realized gains | | | (0.04 | ) | | | (0.03 | ) | | | (0.03 | ) | | | — | | | | (0.16 | ) | |
| Total Distributions to Shareholders | | | (0.29 | ) | | | (0.27 | ) | | | (0.28 | ) | | | (0.25 | ) | | | (0.41 | ) | |
| Net Asset Value, End of Period | | $ | 6.71 | | | $ | 7.55 | | | $ | 7.74 | | | $ | 7.59 | | | $ | 7.74 | | |
| Total return (b) | | | (7.49 | )%(c) | | | 1.10 | %(c) | | | 5.82 | %(c) | | | 1.29 | %(c) | | | 6.01 | % | |
| Ratios to Average Net Assets/Supplemental Data: | |
| Net expenses (d) | | | 1.59 | % | | | 1.58 | % | | | 1.58 | % | | | 1.65 | % | | | 1.62 | % | |
| Waiver/Reimbursement | | | 0.01 | % | | | 0.03 | % | | | 0.02 | % | | | — | %(e) | | | — | | |
| Net investment income (d) | | | 3.38 | % | | | 3.25 | % | | | 3.29 | % | | | 3.25 | % | | | 3.32 | % | |
| Portfolio turnover rate | | | 12 | % | | | 12 | % | | | 10 | % | | | 7 | % | | | 4 | % | |
| Net assets, end of period (000's) | | $ | 9,740 | | | $ | 16,123 | | | $ | 24,004 | | | $ | 30,327 | | | $ | 28,600 | | |
(a) Per share data was calculated using the average shares outstanding during the period.
(b) Total return at net asset value assuming all distributions reinvested and no contingent deferred sales charge.
(c) Had the investment advisor and/or any of its affiliates not waived fees or reimbursed a portion of expenses, total return would have been reduced.
(d) The benefits derived from expense reductions had an impact of less than 0.01%.
(e) Rounds to less than 0.01%.
See Accompanying Notes to Financial Statements.
23
Financial Highlights – Columbia California Tax-Exempt Fund
Selected data for a share outstanding throughout each period is as follows:
| | | Year Ended October 31, | |
| Class C Shares | | 2008 | | 2007 | | 2006 | | 2005 | | 2004 | |
| Net Asset Value, Beginning of Period | | $ | 7.55 | | | $ | 7.74 | | | $ | 7.59 | | | $ | 7.74 | | | $ | 7.70 | | |
| Income from Investment Operations: | |
| Net investment income (a) | | | 0.27 | | | | 0.27 | | | | 0.27 | | | | 0.27 | | | | 0.28 | | |
Net realized and unrealized gain (loss)
on investments and futures contracts | | | (0.80 | ) | | | (0.16 | ) | | | 0.18 | | | | (0.15 | ) | | | 0.19 | | |
| Total from Investment Operations | | | (0.53 | ) | | | 0.11 | | | | 0.45 | | | | 0.12 | | | | 0.47 | | |
| Less Distributions to Shareholders: | |
| From net investment income | | | (0.27 | ) | | | (0.27 | ) | | | (0.27 | ) | | | (0.27 | ) | | | (0.27 | ) | |
| From net realized gains | | | (0.04 | ) | | | (0.03 | ) | | | (0.03 | ) | | | — | | | | (0.16 | ) | |
| Total Distributions to Shareholders | | | (0.31 | ) | | | (0.30 | ) | | | (0.30 | ) | | | (0.27 | ) | | | (0.43 | ) | |
| Net Asset Value, End of Period | | $ | 6.71 | | | $ | 7.55 | | | $ | 7.74 | | | $ | 7.59 | | | $ | 7.74 | | |
| Total return (b)(c) | | | (7.22 | )% | | | 1.40 | % | | | 6.13 | % | | | 1.59 | % | | | 6.33 | % | |
| Ratios to Average Net Assets/Supplemental Data: | |
| Net expenses (d) | | | 1.29 | % | | | 1.28 | % | | | 1.28 | % | | | 1.35 | % | | | 1.32 | % | |
| Waiver/Reimbursement | | | 0.31 | % | | | 0.33 | % | | | 0.32 | % | | | 0.30 | % | | | 0.30 | % | |
| Net investment income (d) | | | 3.69 | % | | | 3.54 | % | | | 3.59 | % | | | 3.55 | % | | | 3.62 | % | |
| Portfolio turnover rate | | | 12 | % | | | 12 | % | | | 10 | % | | | 7 | % | | | 4 | % | |
| Net assets, end of period (000's) | | $ | 21,899 | | | $ | 16,765 | | | $ | 16,224 | | | $ | 17,063 | | | $ | 14,244 | | |
(a) Per share data was calculated using the average shares outstanding during the period.
(b) Total return at net asset value assuming all distributions reinvested and no contingent deferred sales charge.
(c) Had the investment advisor and/or any of its affiliates not waived fees or reimbursed a portion of expenses, total return would have been reduced.
(d) The benefits derived from expense reductions had an impact of less than 0.01%.
See Accompanying Notes to Financial Statements.
24
Financial Highlights – Columbia California Tax-Exempt Fund
Selected data for a share outstanding throughout each period is as follows:
| | | Year Ended October 31, | | Period Ended
October 31, | |
| Class Z Shares | | 2008 | | 2007 | | 2006 | | 2005 (a) | |
| Net Asset Value, Beginning of Period | | $ | 7.55 | | | $ | 7.74 | | | $ | 7.59 | | | $ | 7.73 | | |
| Income from Investment Operations: | |
| Net investment income (b) | | | 0.32 | | | | 0.32 | | | | 0.32 | | | | 0.04 | | |
Net realized and unrealized gain (loss)
on investments and futures contracts | | | (0.80 | ) | | | (0.16 | ) | | | 0.19 | | | | (0.14 | ) | |
| Total from Investment Operations | | | (0.48 | ) | | | 0.16 | | | | 0.51 | | | | (0.10 | ) | |
| Less Distributions to Shareholders: | |
| From net investment income | | | (0.32 | ) | | | (0.32 | ) | | | (0.33 | ) | | | (0.04 | ) | |
| From net realized gains | | | (0.04 | ) | | | (0.03 | ) | | | (0.03 | ) | | | — | | |
| Total Distributions to Shareholders | | | (0.36 | ) | | | (0.35 | ) | | | (0.36 | ) | | | (0.04 | ) | |
| Net Asset Value, End of Period | | $ | 6.71 | | | $ | 7.55 | | | $ | 7.74 | | | $ | 7.59 | | |
| Total return (c)(d) | | | (6.57 | )% | | | 2.09 | % | | | 6.85 | % | | | (1.28 | )%(e) | |
| Ratios to Average Net Assets/Supplemental Data: | |
| Net expenses (f) | | | 0.60 | % | | | 0.60 | % | | | 0.60 | % | | | 0.58 | %(g) | |
| Waiver/Reimbursement | | | 0.01 | % | | | 0.03 | % | | | 0.02 | % | | | — | %(g)(h) | |
| Net investment income (f) | | | 4.38 | % | | | 4.23 | % | | | 4.26 | % | | | 4.29 | %(g) | |
| Portfolio turnover rate | | | 12 | % | | | 12 | % | | | 10 | % | | | 7 | % | |
| Net assets, end of period (000's) | | $ | 107,591 | | | $ | 122,941 | | | $ | 123,803 | % | | $ | 117,979 | | |
(a) Class Z shares commenced operations on September 19, 2005. Per share data and total return reflect activity from that date.
(b) Per share data was calculated using the average shares outstanding during the period.
(c) Total return at net asset value assuming all distributions reinvested.
(d) Had the investment advisor and/or any of its affiliates not waived fees or reimbursed a portion of expenses, total return would have been reduced.
(e) Not annualized.
(f) The benefits derived from expense reductions had an impact of less than 0.01%.
(g) Annualized.
(h) Rounds to less than 0.01%.
See Accompanying Notes to Financial Statements.
25
Notes to Financial Statements – Columbia California Tax-Exempt Fund
October 31, 2008
Note 1. Organization
Columbia California Tax-Exempt Fund (the "Fund"), a series of Columbia Funds Series Trust I (the "Trust"), is a diversified portfolio. The Trust is a Massachusetts business trust registered under the Investment Company Act of 1940, as amended (the "1940 Act"), as an open-end management investment company.
Investment Objective
The Fund seeks total return, consisting of current income exempt from federal income tax and California individual income tax and of capital appreciation, consistent with moderate fluctuation of principal.
Fund Shares
The Trust may issue an unlimited number of shares, and the Fund offers four classes of shares: Class A, Class B, Class C and Class Z. Each share class has its own expense structure and sales charges, as applicable.
Class A shares are subject to a maximum front-end sales charge of 4.75% based on the amount of initial investment. Class A shares purchased without an initial sales charge in accounts aggregating $1 million to $50 million at the time of purchase are subject to a 1.00% contingent deferred sales charge ("CDSC") if the shares are sold within one year after purchase. Class B shares are subject to a maximum CDSC of 5.00% based upon the holding period after purchase. Class B shares will convert to Class A shares eight years after purchase. Class C shares are subject to a 1.00% CDSC on shares sold within one year after purchase. Class Z shares are offered continuously at net asset value. There are certain restrictions on the purchase of Class Z shares, as described in the Fund's prospectus.
Note 2. Significant Accounting Policies
The preparation of financial statements in accordance with accounting principles generally accepted in the United States of America ("GAAP") requires management to make certain estimates and assumptions that affect the reported amounts of assets and liabilities, the disclosure of contingent assets and liabilities at the date of the financial statements and the reported amounts of revenue and expenses during the reporting period. Actual results could differ from those estimates. The following is a summary of significant accounting policies consistently followed by the Fund in the preparation of its financial statements.
Security Valuation
Debt securities generally are valued by pricing services approved by the Trust's Board of Trustees, based upon market transactions for normal, institutional-size trading units of similar securities. The services may use various pricing techniques which take into account appropriate factors such as yield, quality, coupon rate, maturity, type of issue, trading characteristics and other data, as well as broker quotes. Debt securities for which quotations are readily available are valued at an over-the-counter or exchange bid quotation.
Certain debt securities, which tend to be more thinly traded and of lesser quality, are priced based on fundamental analysis of the financial condition of the issuer and the estimated value of any collateral. Valuations developed through pricing techniques may vary from the actual amounts realized upon sale of the securities, and the potential variation may be greater for those securities valued using fundamental analysis.
Short-term debt obligations maturing within 60 days are valued at amortized cost, which approximates market value.
Investments in other open-end investment companies are valued at net asset value.
Futures contracts are valued at the settlement price established each day by the board of trade or exchange on which they are traded.
Investments for which market quotations are not readily available, or that have quotations which management believes are not reliable, are valued at fair value as determined in good faith under consistently applied procedures established by and under the general supervision of the Board of Trustees. If a security is valued at fair value, such value is likely to be different from the last quoted market price for the security.
In September 2006, Statement of Financial Accounting Standards No. 157, Fair Value Measurements ("SFAS 157"), was issued. SFAS 157 is effective for fiscal years beginning after November 15, 2007. SFAS 157 defines fair value, establishes a framework for measuring fair value and expands disclosures about fair value measurements. Management is evaluating the impact the application of SFAS 157 will have on the Fund's financial statement disclosures.
26
Columbia California Tax-Exempt Fund, October 31, 2008
Security Transactions
Security transactions are accounted for on the trade date. Cost is determined and gains (losses) are based upon the specific identification method for both financial statement and federal income tax purposes.
In March 2008, Statement of Financial Accounting Standards No. 161, Disclosures about Derivative Instruments and Hedging Activities—an amendment of FASB Statement No. 133 ("SFAS 161"), was issued. SFAS 161 is effective for fiscal years and interim periods beginning after November 15, 2008. SFAS 161 requires additional discussion about the reporting entity's derivative instruments and hedging activities, by providing for qualitative disclosures about the objectives and strategies for using derivatives, quantitative data about the fair value of and gains and losses on derivative contracts, and details of credit-risk-related contingent features in their hedged positions. Management is evaluating the impact the application of SFAS 161 will have on the Fund's financial statement d isclosures.
Futures Contracts
The Fund may invest in futures for both hedging and non-hedging purposes, including, for example, to seek to enhance returns or as a substitute for a position in an underlying asset.
The use of futures contracts involves certain risks, which include: (1) imperfect correlation between the price movement of the instruments and the underlying securities, (2) inability to close out positions due to differing trading hours, or the temporary absence of a liquid market, for either the instruments or the underlying securities, or (3) an inaccurate prediction of the future direction of interest rates by Columbia Management Advisors, LLC ("Columbia"), the Fund's investment advisor. Any of these risks may involve amounts exceeding the variation margin recorded in the Fund's Statement of Assets and Liabilities at any given time.
Upon entering into a futures contract, the Fund pledges cash or securities with the broker in an amount sufficient to meet the initial margin requirement. Subsequent payments are made or received by the Fund equal to the daily change in the contract value and are recorded as variation margin receivable or payable and offset in unrealized gains or losses. The Fund recognizes a realized gain or loss when the contract is closed or expires.
Restricted Securities
Restricted securities are securities that may only be resold upon registration under federal securities laws or in transactions exempt from registration. In some cases, the issuer of restricted securities has agreed to register such securities for resale at the issuer's expense either upon demand by the Fund or in connection with another registered offering of the securities. Many restricted securities may be resold in the secondary market in transactions exempt from registration. Such restricted securities may be determined to be liquid under criteria established by the Board of Trustees. The Fund will not incur any registration costs upon such resale.
Income Recognition
Interest income is recorded on the accrual basis. Premium and discount are amortized and accreted, respectively, on all debt securities, unless otherwise noted. Original issue discount is accreted to interest income over the life of the security with a corresponding increase in the cost basis. Dividend income is recorded on the ex-date.
Expenses
General expenses of the Trust are allocated to the Fund and the other series of the Trust based upon relative net assets or other expense allocation methodologies determined by the nature of the expense. Expenses directly attributable to the Fund are charged to the Fund.
Determination of Class Net Asset Value
All income, expenses (other than class-specific expenses, as shown on the Statement of Operations) and realized and unrealized gains (losses) are allocated to each class of the Fund on a daily basis for purposes of determining the net asset value of each class. Income and expenses are allocated to each class based on the settled shares method, while realized and unrealized gains (losses) are allocated based on the relative net assets of each class.
27
Columbia California Tax-Exempt Fund, October 31, 2008
Federal Income Tax Status
The Fund intends to qualify each year as a "regulated investment company" under Subchapter M of the Internal Revenue Code, as amended, and will distribute substantially all of its tax exempt or taxable income, if any, for its tax year, and as such will not be subject to federal income taxes. In addition, the Fund intends to distribute in each calendar year substantially all of its net investment income, capital gains and certain other amounts, if any, such that the Fund should not be subject to federal excise tax. Therefore, no federal income or excise tax provision is recorded.
Distributions to Shareholders
Distributions from net investment income are declared daily and distributed monthly. Net realized capital gains, if any, are distributed at least annually. Income distributions and capital gain distributions are determined in accordance with federal income tax regulations which may differ from GAAP.
Indemnification
In the normal course of business, the Fund enters into contracts that contain a variety of representations and warranties and which provide general indemnities. The Fund's maximum exposure under these arrangements is unknown because this would involve future claims against the Fund. Also, under the Trust's organizational documents and by contract, the Trustees and officers of the Trust are indemnified against certain liabilities that may arise out of actions relating to their duties to the Trust. However, based on experience, the Fund expects the risk of loss due to these representations, warranties and indemnities to be minimal.
Note 3. Federal Tax Information
The timing and character of income and capital gain distributions are determined in accordance with income tax regulations, which may differ from GAAP. Reclassifications are made to the Fund's capital accounts for permanent tax differences to reflect income and gains available for distribution (or available capital loss carryforwards) under income tax regulations.
For the year ended October 31, 2008, permanent book and tax basis differences resulting primarily from differing treatments for market discount reclassifications and discount accretion/premium amortization on debt securities were identified and reclassified among the components of the Fund's net assets as follows:
Undistributed Net
Investment Income | | Accumulated Net
Realized Loss | | Paid-In Capital | |
| $ | (29,539 | ) | | $ | 29,538 | | | $ | 1 | | |
Net investment income and net realized gains (losses), as disclosed on the Statement of Operations, and net assets were not affected by this reclassification.
The tax character of distributions paid during the years ended October 31, 2008 and October 31, 2007 was as follows:
| | | October 31, | |
| | | 2008 | | 2007 | |
| Tax-Exempt Income | | $ | 18,139,735 | | | $ | 17,835,543 | | |
| Ordinary Income* | | | 302,206 | | | | 396,868 | | |
| Long-Term Capital Gains | | | 2,240,618 | | | | 1,148,829 | | |
* For tax purposes short-term capital gain distributions, if any, are considered ordinary income distributions.
As of October 31, 2008, the components of distributable earnings on a tax basis were as follows:
Undistributed
Tax-Exempt
Income | | Undistributed
Long-Term
Capital Gains | | Net Unrealized
Depreciation* | |
| $ | 1,000,997 | | | $ | 354,029 | | | $ | (21,501,471 | ) | |
* The differences between book-basis and tax-basis net unrealized depreciation are primarily due to deferral of losses from discount accretion/premium amortization on debt securities.
28
Columbia California Tax-Exempt Fund, October 31, 2008
Unrealized appreciation and depreciation at October 31, 2008, based on cost of investments for federal income tax purposes, were:
| Unrealized appreciation | | $ | 12,168,017 | | |
| Unrealized depreciation | | | (33,669,488 | ) | |
| Net unrealized depreciation | | $ | (21,501,471 | ) | |
The Fund adopted Financial Accounting Standards Board ("FASB") Interpretation No. 48, Accounting for Uncertainty in Income Taxes—an Interpretation of FASB Statement No. 109 ("FIN 48"), effective April 30, 2008. FIN 48 requires management to determine whether a tax position of the Fund is more likely than not to be sustained upon examination by the applicable taxing authority, including resolution of any related appeals or litigation processes, based on the technical merits of the position. The tax benefit to be recognized is measured as the largest amount of benefit that is greater than fifty percent likely of being realized upon ultimate settlement. FIN 48 was applied to all existing tax positions upon initial adoption. Management has evaluated the known implications of FIN 48 on its computation of net assets for the Fund. As a result of this evaluation, management has concluded that FIN 48 did not have any effect on the Fund's financial statements and no cumulative effect adjustments were recorded. However, management's conclusions regarding FIN 48 may be subject to review and adjustment at a later date based on factors including, but not limited to, further implementation guidance from the FASB, new tax laws, regulations, and administrative interpretations (including relevant court decisions). The Fund's federal tax returns for the prior three fiscal years remain subject to examination by the Internal Revenue Service. The Fund is not aware of any tax positions for which it is reasonably possible that the total amounts of unrecognized tax benefits will significantly change in the next twelve months.
Note 4. Fees and Compensation Paid to Affiliates
Investment Advisory Fee
Columbia, an indirect, wholly owned subsidiary of Bank of America Corporation ("BOA"), provides investment advisory, administrative and other services to the Fund. Columbia receives a monthly investment advisory fee based on the Fund's pro-rata portion of the combined average daily net assets of the Fund, Columbia Connecticut Tax-Exempt Fund, Columbia Massachusetts Tax-Exempt Fund and Columbia New York Tax-Exempt Fund as follows:
| Combined Average Daily Net Assets | | Annual Fee Rate | |
| First $1 billion | | | 0.50 | % | |
| $1 billion to $3 billion | | | 0.45 | % | |
| Over $3 billion | | | 0.40 | % | |
For the year ended October 31, 2008, the Fund's effective investment advisory fee rate was 0.50% of the Fund's average daily net assets.
Pricing and Bookkeeping Fees
The Fund has entered into a Financial Reporting Services Agreement (the "Financial Reporting Services Agreement") with State Street Bank & Trust Company ("State Street") and Columbia pursuant to which State Street provides financial reporting services to the Fund. The Fund has also entered into an Accounting Services Agreement (collectively with the Financial Reporting Services Agreement, the "State Street Agreements") with State Street and Columbia pursuant to which State Street provides accounting services to the Fund. Under the State Street Agreements, the Fund pays State Street an annual fee of $38,000 paid monthly plus an additional monthly fee based on an annualized percentage rate of average daily net assets of the Fund for the month. The aggregate fee will not exceed $140,000 per year (exclusive of out-of-pocket expenses and charges). The Fund also reimburses State Street for certain out-of-pocket expenses and charge s.
The Fund has entered into a Pricing and Bookkeeping Oversight and Services Agreement (the "Services Agreement") with Columbia. Under the Services Agreement, Columbia provides services related to Fund expenses and the requirements of the Sarbanes-Oxley Act of 2002, and provides oversight of the accounting and financial reporting services provided by State Street. Under the Services Agreement, the Fund reimburses Columbia for out-of-pocket expenses. Prior to January 1, 2008, the Fund also reimbursed Columbia for accounting oversight services, services related to Fund expenses and the requirements of the Sarbanes-Oxley Act of 2002.
29
Columbia California Tax-Exempt Fund, October 31, 2008
For the year ended October 31, 2008, the amount charged to the Fund by affiliates included on the Statement of Operations under "Pricing and bookkeeping fees" aggregated to $1,952.
Transfer Agent Fee
Columbia Management Services, Inc. (the "Transfer Agent"), an affiliate of Columbia and an indirect, wholly owned subsidiary of BOA, provides shareholder services to the Fund and has contracted with Boston Financial Data Services ("BFDS") to serve as sub-transfer agent. The Transfer Agent is entitled to receive a fee for its services, paid monthly, at the annual rate of $17.34 per open account plus reimbursement of certain sub-transfer agent fees paid by the Transfer Agent (exclusive of BFDS fees), calculated based on assets held in omnibus accounts and intended to recover the cost of payments to other parties (including affiliates of BOA) for services to those accounts. The Transfer Agent pays the fees of BFDS for services as sub-transfer agent and is not entitled to reimbursement for such fees from the Fund. The Transfer Agent may also retain, as additional compensation for its services, fees for wire, telephone and redemption orders, IRA trustee agent fees and account transcript fees due to the Transfer Agent from shareholders of the Fund and credits (net of bank charges) earned with respect to balances in accounts the Transfer Agent maintains in connection with its services to the Fund. The Transfer Agent also receives reimbursement for certain out-of-pocket expenses.
An annual minimum account balance fee of $20 may apply to certain accounts with a value below the Fund's initial minimum investment requirements to reduce the impact of small accounts on transfer agent fees. These minimum account balance fees are recorded as part of expense reductions on the Statement of Operations. For the year ended October 31, 2008, these minimum account balance fees reduced total expenses by $1,460.
Underwriting Discounts, Service and Distribution Fees
Columbia Management Distributors, Inc. (the "Distributor"), an affiliate of Columbia and an indirect, wholly owned subsidiary of BOA, is the principal underwriter of the Fund's shares. For the year ended October 31, 2008, the Distributor has retained net underwriting discounts of $27,845 on sales of the Fund's Class A shares and received net CDSC fees of $45,355, $21,054 and $7,517 on Class A, Class B and Class C share redemptions, respectively.
The Fund has adopted distribution and shareholder servicing plans (the "Plans") pursuant to Rule 12b-1 under the 1940 Act, which require the payment of distribution and service fees. The fees are intended to compensate the Distributor and/or eligible selling and/or servicing agents for selling shares of the Fund and providing services to investors. The service fee is equal to 0.10% annually of the net assets attributable to shares of the Fund issued prior to December 1, 1994 and 0.25% annually of the net assets attributable to shares issued thereafter. This arrangement results in an annual rate of service fee for all shares that is a blend between the 0.10% and 0.25% rates. For the year ended October 31, 2008, the Fund's effective service fee rate was 0.24% of the Fund's average daily net assets attributable to Class A, Class B and Class C shares.
The Plans also require the payment of a monthly distribution fee to the Distributor equal to 0.75% annually of the average daily net assets attributable to Class B and Class C shares only. The Distributor has voluntarily agreed to waive a portion of the Class C shares distribution fee so that it will not exceed 0.45% annually of the average daily net assets attributable to Class C shares. This arrangement may be modified or terminated by the Distributor at any time.
Fee Waivers and Expense Reimbursements
Columbia and/or some of the Fund's other service providers have voluntarily agreed to waive fees and/or reimburse the Fund for certain expenses so that total expenses (exclusive of distribution and service fees, brokerage commissions, interest, taxes and extraordinary expenses, but inclusive of custodial charges relating to overdrafts, if any), after giving effect to any balance credits from the Fund's custodian, will not exceed 0.60% annually of the Fund's average daily net assets. Columbia, at its discretion, may modify or terminate this arrangement any time.
Fees Paid to Officers and Trustees
All officers of the Fund are employees of Columbia or its affiliates and, with the exception of the Fund's Chief Compliance Officer, receive no compensation from the Fund. The Board of Trustees has appointed a Chief Compliance Officer to the Fund in accordance with federal securities regulations. The Fund, along with other affiliated funds, pays
30
Columbia California Tax-Exempt Fund, October 31, 2008
its pro-rata share of the expenses associated with the Chief Compliance Officer. The Fund's expenses for the Chief Compliance Officer will not exceed $15,000 per year.
The Trust's eligible Trustees may participate in a deferred compensation plan which may be terminated at any time. Obligations of the plan will be paid solely out of the Fund's assets.
Note 5. Custody Credits
The Fund has an agreement with its custodian bank under which custody fees may be reduced by balance credits. These credits are recorded as part of expense reductions on the Statement of Operations. The Fund could have invested a portion of the assets utilized in connection with the expense offset arrangement in an income-producing asset if it had not entered into such an agreement.
For the year ended October 31, 2008, these custody credits reduced total expenses by $2,393 for the Fund.
Note 6. Portfolio Information
For the year ended October 31, 2008, the cost of purchases and proceeds from sales of securities, excluding short-term obligations, were $51,696,473 and $49,228,648, respectively.
Note 7. Line of Credit
The Fund and other affiliated funds participate in a $280,000,000 committed, unsecured revolving line of credit. The maximum amount that may be borrowed by any fund is limited to the lesser of $200,000,000 and the Fund's borrowing limit set forth in the Fund's registration statement. Borrowings are available for short-term liquidity or temporary or emergency purposes.
Interest is charged to each participating fund based on the fund's borrowings at a rate per annum equal to the greater of the Federal Funds Rate plus 0.50% and the overnight LIBOR Rate plus 0.50%. In addition, an annual operations agency fee of $20,000, an amendment fee of 0.02% and a commitment fee of 0.12% per annum are accrued and apportioned among the participating funds pro rata based on their relative net assets.
Prior to October 16, 2008, the Fund and other affiliated funds participated in a $350,000,000 committed, unsecured revolving line of credit and a $150,000,000 uncommitted, unsecured line of credit, both provided by State Street. Interest on the committed line of credit was charged to each participating fund based on the fund's borrowings at a rate per annum equal to the Federal Funds Rate plus 0.50%. In addition, a commitment fee of 0.10% per annum was accrued and apportioned among the participating funds pro rata based on their relative net assets. Interest on the uncommitted line of credit was charged to each participating fund based on the fund's borrowings at a rate per annum equal to the Federal Funds Rate plus 0.375%. State Street charged an annual operations agency fee of $40,000 for the committed line of credit and was able to charge an annual administration fee of $15,000 for the uncommitted line of credit. The commitme nt fee, the operations agency fee and the administration fee were accrued and apportioned among the participating funds pro rata based on their relative net assets.
For the year ended October 31, 2008, the Fund did not borrow under these arrangements.
Note 8. Shares of Beneficial Interest
As of October 31, 2008, one shareholder held 24.6% of the Fund's shares outstanding, over which BOA and/or any of its affiliates had either sole or joint investment discretion.
Subscription and redemption activity of this account may have a significant effect on the operations of the Fund.
Note 9. Securities Lending
The Fund may lend its securities to certain approved brokers, dealers and other financial institutions. Each loan is collateralized by cash, in an amount at least equal to the market value of the securities loaned plus accrued income from the investment of collateral. The market value of the loaned securities is determined at the close of business of the Fund and any additional required collateral is delivered to the Fund on the next business day. The collateral received is invested and the income generated by the investment of the collateral, net of any fees remitted to State Street as the lending agent and borrower rebates, is paid to the Fund. Generally, in the event of borrower default, the Fund has the right to use the collateral to offset any losses incurred. In the event the Fund is delayed or prevented from exercising its right to dispose of the collateral, there may be a potential loss to the Fund. The Fund bears the ri sk of loss with respect to the investment of collateral.
31
Columbia California Tax-Exempt Fund, October 31, 2008
Note 10. Significant Risks and Contingencies
Concentration of Credit Risk
The Fund holds investments that are insured by private insurers who guarantee the payment of principal and interest in the event of default or that are supported by a letter of credit. At October 31, 2008, private insurers who insured greater than 5% of the net assets of the Fund were as follows:
| Insurer | | % of Total
Net Assets | |
| MBIA Insurance Corp. | | | 19.8 | | |
| AMBAC Assurance Corp. | | | 18.9 | | |
| Financial Security Assurance, Inc. | | | 9.6 | | |
| Financial Guaranty Insurance Co. | | | 8.9 | | |
At November 24, 2008, MBIA Insurance Corp., Financial Guaranty Insurance Co., AMBAC Assurance Corp. and Financial Security Assurance, Inc. were rated by Standard & Poor's AA, CCC, A and AAA, respectively.
Geographic Concentration Risk
The Fund had greater than 5% of its total net assets at October 31, 2008 invested in debt obligations issued by each of California and Puerto Rico and their political subdivisions, agencies and public authorities. The Fund is more susceptible to economic and political factors adversely affecting issuers of the state's or territory's municipal securities than are municipal bond funds that are not concentrated to the same extent in these issuers.
Sector Focus Risk
The Fund may focus its investments in certain sectors, subjecting it to greater risk than a fund that is less focused.
Tax Development Risk
The Fund purchases municipal securities whose interest, in the opinion of bond counsel, is free from federal income tax. There is no assurance that the Internal Revenue Service (IRS) will agree with this opinion. In the event the IRS determines that an issuer does not comply with relevant tax requirements, interest payments from a security could become federally taxable, possibly retroactively to the date the security was issued. As a shareholder of the Fund, you may be required to file an amended tax return as a result.
Legal Proceedings
On February 9, 2005, Columbia Management Advisors, Inc. (which has since merged into Banc of America Capital Management, LLC (now named Columbia Management Advisors, LLC)) ("Columbia") and Columbia Funds Distributor, Inc. (which has been renamed Columbia Management Distributors, Inc.) (the "Distributor") (collectively, the "Columbia Group") entered into an Assurance of Discontinuance with the New York Attorney General ("NYAG") (the "NYAG Settlement") and consented to the entry of a cease-and-desist order by the Securities and Exchange Commission ("SEC") (the "SEC Order") on matters relating to mutual fund trading.
Under the terms of the SEC Order, the Columbia Group agreed, among other things, to: pay $70 million in disgorgement and $70 million in civil money penalties; cease and desist from violations of the antifraud provisions and certain other provisions of the federal securities laws; maintain certain compliance and ethics oversight structures; retain an independent consultant to review the Columbia Group's applicable supervisory, compliance, control and other policies and procedures; and retain an independent distribution consultant (see below). The Columbia Funds have also voluntarily undertaken to implement certain governance measures designed to maintain the independence of their boards of trustees. The NYAG Settlement also, among other things, requires Columbia and its affiliates to reduce management fees for certain Columbia Funds (including the former Nations Funds) and other mutual funds collectively by $32 million per year f or five years, for a projected total of $160 million in management fee reductions.
Pursuant to the procedures set forth in the SEC Order, the $140 million in settlement amounts described above is being distributed in accordance with a distribution plan that was developed by an independent distribution consultant and approved by the SEC on April 6, 2007. Distributions under the distribution plan began in late June 2007.
A copy of the SEC Order is available on the SEC website at http://www.sec.gov. A copy of the NYAG Settlement is available
32
Columbia California Tax-Exempt Fund, October 31, 2008
as part of the Bank of America Corporation Form 8-K filing on February 10, 2005.
In connection with the events described above, various parties have filed suit against certain funds, the Trustees of the Columbia Funds, FleetBoston Financial Corporation and its affiliated entities and/or Bank of America and its affiliated entities.
On February 20, 2004, the Judicial Panel on Multidistrict Litigation transferred these cases and cases against other mutual fund companies based on similar allegations to the United States District Court in Maryland for consolidated or coordinated pretrial proceedings (the "MDL"). Subsequently, additional related cases were transferred to the MDL. On September 29, 2004, the plaintiffs in the MDL filed amended and consolidated complaints. One of these amended complaints is a putative class action that includes claims under the federal securities laws and state common law, and that names Columbia, the Distributor, the Trustees of the Columbia Funds, Bank of America Corporation and others as defendants. Another of the amended complaints is a derivative action purportedly on behalf of the Columbia Funds that asserts claims under federal securities laws and state common law.
On February 25, 2005, Columbia and other defendants filed motions to dismiss the claims in the pending cases. On March 1, 2006, for reasons stated in the court's memoranda dated November 3, 2005, the United States District Court for the District of Maryland granted in part and denied in part the defendants' motions to dismiss. The court dismissed all of the class action claims pending against the Columbia Funds Trusts. As to Columbia and the Distributor, the claims under the Securities Act of 1933, the claims under Sections 34(b) and 36(a) of the Investment Company Act of 1940 ("ICA") and the state law claims were dismissed. The claims under Sections 10(b) and 20(a) of the Securities Exchange Act of 1934 and claims under Section 36(b) of the ICA were not dismissed.
On March 21, 2005, a purported class action was filed in Massachusetts state court alleging that certain conduct, including market timing, entitled Class B shareholders in certain Columbia funds to an exemption from contingent deferred sales charges upon early redemption ("the CDSC Lawsuit"). The CDSC Lawsuit was removed to federal court in Massachusetts and transferred to the MDL.
On September 14, 2007, the plaintiffs and the Columbia defendants named in the MDL, including the Columbia Funds, entered into a stipulation of settlement with respect to all Columbia-related claims in the MDL described above, including the CDSC Lawsuit. The settlement is subject to court approval.
In 2004, the Columbia Funds' adviser and distributor and certain affiliated entities and individuals were named as defendants in certain purported shareholder class and derivative actions making claims, including claims under the Investment Company and the Investment Advisers Acts of 1940 and state law. Certain Columbia Funds were named as nominal defendants. The suits allege, inter alia, that the fees and expenses paid by the funds are excessive and that the advisers and their affiliates inappropriately used fund assets to distribute the funds and for other improper purposes. On March 2, 2005, the actions were consolidated in the Massachusetts federal court as In re Columbia Entities Litigation. The plaintiffs filed a consolidated amended complaint on June 9, 2005. On November 30, 2005, the judge dismissed all claims by plaintiffs and entered final judgment in favor of the defendants. The plaintiffs appealed to the United States Court of Appeals for the First Circuit on December 30, 2005. A stipulation and settlement agreement dated January 19, 2007 was filed in the First Circuit on February 14, 2007, with a joint stipulation of dismissal and motion for remand to obtain district court approval of the settlement. That joint motion was granted and the appeal was dismissed. On March 6, 2007, the case was remanded to the District Court. The settlement, approved by the District Court on September 18, 2007, became effective October 19, 2007. Pursuant to the settlement, the funds' adviser and/or its affiliates made certain payments, including plaintiffs' attorneys' fees and costs of notice to class members.
33
Report of Independent Registered Public Accounting Firm
To the Trustees of Columbia Funds Series Trust I and the Shareholders of Columbia California Tax-Exempt Fund:
In our opinion, the accompanying statement of assets and liabilities, including the investment portfolio, and the related statements of operations and of changes in net assets and the financial highlights present fairly, in all material respects, the financial position of Columbia California Tax-Exempt Fund (the "Fund") (a series of Columbia Funds Series Trust I) at October 31, 2008, the results of its operations for the year then ended, the changes in its net assets for each of the two years in the period then ended and the financial highlights for the periods indicated, in conformity with accounting principles generally accepted in the United States of America. These financial statements and financial highlights (hereafter referred to as "financial statements") are the responsibility of the Fund's management. Our responsibility is to express an opinion on these financial statements based on our audits. We conducted our audits of these financial statements in accordance with the standards of the Public Company Accounting Oversight Board (United States). Those standards require that we plan and perform the audit to obtain reasonable assurance about whether the financial statements are free of material misstatement. An audit includes examining, on a test basis, evidence supporting the amounts and disclosures in the financial statements, assessing the accounting principles used and significant estimates made by management, and evaluating the overall financial statement presentation. We believe that our audits, which included confirmation of securities at October 31, 2008 by correspondence with the custodian and brokers, provide a reasonable basis for our opinion.
PricewaterhouseCoopers LLP
Boston, Massachusetts
December 22, 2008
34
Federal Income Tax Information (Unaudited)
For the fiscal year ended October 31, 2008, the Fund designates long-term capital gains of $448,720.
99.8% of the distributions from net investment income will be treated as exempt income for federal income tax purposes.
35
Fund Governance
The Trustees serve terms of indefinite duration. The names, addresses and ages of the Trustees and officers of the Funds in Columbia Funds Series Trust I, the year each was first elected or appointed to office, their principal business occupations during at least the last five years, the number of Funds overseen by each Trustee and other directorships they hold are shown below. Each officer listed below serves as an officer of each Fund in the Columbia Funds Complex.
Independent Trustees
Name, Address and Year of Birth,
Position with Funds, Year First
Elected or Appointed to Office | | Principal Occupation(s) During Past Five Years, Number of Funds in Columbia
Funds Complex Overseen by Trustee, Other Directorships Held
| |
| John D. Collins (Born 1938) | |
|
c/o Columbia Management Advisors, LLC
One Financial Center
Boston, MA 02111
Trustee(1) (since 2007) | | Retired. Consultant, KPMG, LLP (accounting and tax firm) from July 1999 to June 2000; Partner, KPMG, LLP from March 1962 to June 1999. Oversees 80, Mrs. Fields Famous Brands LLC (consumer products); Suburban Propane Partners, L.P.; and Montpelier Re (underwriting firm) | |
|
| Rodman L. Drake (Born 1943) | |
|
c/o Columbia Management Advisors, LLC
One Financial Center
Boston, MA 02111
Trustee(1) (since 2007) | | Co-Founder of Baringo Capital LLC (private equity) since 2002; President, Continuation Investments Group, Inc. from 1997 to 2001. Oversees 80, Jackson Hewitt Tax Service Inc. (tax preparation services); Crystal Capital River Inc. (real estate investment trust); Student Loan Corporation (student loan provider); Celgene Corporation (global biotechnology company); Apex Silver Mines Ltd. (mining); and Hyperion Brookfield Total Return Fund, Inc. and Hyperion Brookfield Strategic Mortgage Income Fund, Inc. (exchange-traded funds) | |
|
| Douglas A. Hacker (Born 1955) | |
|
c/o Columbia Management Advisors, LLC
One Financial Center
Boston, MA 02111
Trustee (since 1996) | | Independent business executive since May 2006; Executive Vice President—Strategy of United Airlines (airline) from December 2002 to May 2006; President of UAL Loyalty Services (airline marketing company) from September 2001 to December 2002; Executive Vice President and Chief Financial Officer of United Airlines from July 1999 to September 2001. Oversees 80, Nash Finch Company (food distributor); Aircastle Limited (aircraft leasing) | |
|
| Janet Langford Kelly (Born 1957) | |
|
c/o Columbia Management Advisors, LLC
One Financial Center
Boston, MA 02111
Trustee (since 1996) | | Senior Vice President, General Counsel and Corporate Secretary, ConocoPhillips (integrated energy company) since September 2007; Deputy General Counsel—Corporate Legal Services, ConocoPhillips from August 2006 to August 2007; Partner, Zelle, Hofmann, Voelbel, Mason & Gette LLP (law firm) from March 2005 to July 2006; Adjunct Professor of Law, Northwestern University, from September 2004 to June 2006; Director, UAL Corporation (airline) from February 2006 to July 2006; Chief Administrative Officer and Senior Vice President, Kmart Holding Corporation (consumer goods), from September 2003 to March 2004; Executive Vice President—Corporate Development and Administration, General Counsel and Secretary, Kellogg Company (food manufacturer), from September 1999 to August 2003. Oversees 80, None | |
|
36
Fund Governance (continued)
Independent Trustees (continued)
Name, Address and Year of Birth,
Position with Funds, Year First
Elected or Appointed to Office | | Principal Occupation(s) During Past Five Years, Number of Funds in Columbia
Funds Complex Overseen by Trustee, Other Directorships Held
| |
| Charles R. Nelson (Born 1942) | |
|
c/o Columbia Management Advisors, LLC
One Financial Center
Boston, MA 02111
Trustee (since 1981) | | Professor of Economics, University of Washington, since January 1976; Ford and Louisa Van Voorhis Professor of Political Economy, University of Washington, since September 1993; Director, Institute for Economic Research, University of Washington from September 2001 to June 2003; Adjunct Professor of Statistics, University of Washington, since September 1980; Associate Editor, Journal of Money Credit and Banking, since September 1993; Consultant on econometric and statistical matters. Oversees 80, None | |
|
| John J. Neuhauser (Born 1943) | |
|
c/o Columbia Management Advisors, LLC
One Financial Center
Boston, MA 02111
Trustee (since 1985) | | President, Saint Michael's College, since August 2007; University Professor, Boston College from November 2005 to August 2007; Academic Vice President and Dean of Faculties, Boston College from August 1999 to October 2005. Oversees 80, Liberty All-Star Equity Fund and Liberty All-Star Growth Fund, Inc. (closed-end funds) | |
|
| Jonathan Piel (Born 1938) | |
|
c/o Columbia Management Advisors, LLC
One Financial Center
Boston, MA 02111
Trustee(1) (since 2007) | | Cable television producer and website designer; The Editor, Scientific American from 1984 to 1994; Vice President, Scientific American, Inc., from 1984 to 1994; Member, Advisory Board, Stone Age Institute, Bloomington, Indiana (research institute that explores the effect of technology on human evolution); Member, Board of Directors of the National Institute of Social Sciences, New York City; and Member, Board of Trustees of the William Alanson White Institute, New York City (institution for training psychoanalysts). Oversees 80, None | |
|
| Patrick J. Simpson (Born 1944) | |
|
c/o Columbia Management Advisors, LLC
One Financial Center
Boston, MA 02111
Trustee (since 2000) | | Partner, Perkins Coie LLP (law firm). Oversees 80, None | |
|
| Thomas C. Theobald (Born 1937) | |
|
c/o Columbia Management Advisors, LLC
One Financial Center
Boston, MA 02111
Trustee and Chairman of the Board (since 1996) | | Partner and Senior Advisor, Chicago Growth Partners (private equity investing) since September 2004; Managing Director, William Blair Capital Partners (private equity investing) from September 1994 to September 2004. Oversees 80, Anixter International (network support equipment distributor); Ventas, Inc. (real estate investment trust); Jones Lang LaSalle (real estate management services); Ambac Financial Group (financial guaranty insurance) | |
|
| Anne-Lee Verville (Born 1945) | |
|
c/o Columbia Management Advisors, LLC
One Financial Center
Boston, MA 02111
Trustee (since 1998) | | Retired since 1997 (formerly General Manager—Global Education Industry (from 1994 to 1997), President—Application Systems Division (from 1991 to 1994), Chief Financial Officer—US Marketing & Services (from 1988 to 1991), and Chief Information Officer (from 1987 to 1988), IBM Corporation (computer and technology)). Oversees 80, None | |
|
37
Fund Governance (continued)
Interested Trustee
Name, Address and Year of Birth,
Position with Funds, Year First
Elected or Appointed to Office | | Principal Occupation(s) During Past Five Years, Number of Funds in Columbia
Funds Complex Overseen by Trustee, Other Directorships Held
| |
| William E. Mayer (Born 1940) | |
|
c/o Columbia Management Advisors, LLC
One Financial Center
Boston, MA 02111
Trustee(2) (since 1994) | | Partner, Park Avenue Equity Partners (private equity) since February 1999; Dean and Professor, College of Business, University of Maryland from 1992 to 1997. Oversees 80, Lee Enterprises (print media), WR Hambrecht + Co. (financial service provider); BlackRock Kelso Capital Corporation (investment company) | |
|
1 Messrs. Drake, Piel and Collins have served as directors/trustees of the Excelsior Funds since 1996, 1996 and 2005, respectively. The Excelsior Funds consisted of 27 portfolios managed by affiliates of Columbia Management Advisors, LLC. Effective December 12, 2007, the Board elected Messrs. Drake, Piel and Collins as Trustees of the Trust.
2 Mr. Mayer is an "interested person" (as defined in the Investment Company Act of 1940) by reason of his affiliation with WR Hambrecht + Co., a registered broker/dealer that may execute portfolio transactions for or engage in principal transactions with the Funds or other funds or accounts advised/managed by the Advisor or other Bank of America affiliates.
The Statement of Additional Information includes additional information about the Trustees of the Funds and is available, without charge, upon request by calling 1-800-345-6611.
Officers
Name, Address and Year of Birth,
Position with Columbia Funds, Year
First Elected or Appointed to Office | | Principal Occupation(s) During Past Five Years | |
| Christopher L. Wilson (Born 1957) | |
|
One Financial Center
Boston, MA 02111
President (since 2004) | | President—Columbia Funds, since October 2004; Managing Director—Columbia Management Advisors, LLC, since September 2005; Senior Vice President—Columbia Management Distributors, Inc., since January 2005; Director—Columbia Management Services, Inc., since January 2005; Director—Bank of America Global Liquidity Funds, plc and Banc of America Capital Management (Ireland), Limited, since May 2005; Director—FIM Funding, Inc., since January 2005; President and Chief Executive Officer—CDC IXIS AM Services, Inc. (investment management), from September 1998 through August 2004; and a senior officer or director of various other Bank of America affiliated entities, including other registered and unregistered funds. | |
|
| James R. Bordewick, Jr. (Born 1959) | |
|
One Financial Center
Boston, MA 02111
Senior Vice President, Secretary and Chief Legal Officer (since 2006) | | Associate General Counsel, Bank of America since April 2005; Senior Vice President and Associate General Counsel, MFS Investment Management (investment management) prior to April 2005. | |
|
38
Fund Governance (continued)
Officers (continued)
Name, Address and Year of Birth,
Position with Columbia Funds, Year
First Elected or Appointed to Office | | Principal Occupation(s) During Past Five Years | |
| J. Kevin Connaughton (Born 1964) | |
|
One Financial Center
Boston, MA 02111
Senior Vice President and Chief Financial Officer (since 2000) | | Managing Director of Columbia Management Advisors, LLC since December 2004; Treasurer—Columbia Funds, from October 2003 to May 2008; Treasurer—the Liberty Funds, Stein Roe Funds and Liberty All-Star Funds, December 2000—December 2006; Senior Vice President—Columbia Management Advisors, LLC, from April 2003 to December 2004; President—Columbia Funds, Liberty Funds and Stein Roe Funds, February 2004 to October 2004; Treasurer—Galaxy Funds, September 2002 to December 2005; Treasurer, December 2002 to December 2004, and President, February 2004 to December 2004—Columbia Management Multi-Strategy Hedge Fund, LLC; and a senior officer of various other Bank of America-affiliated entities, including other registered and unregistered funds. | |
|
| Linda J. Wondrack (Born 1964) | |
|
One Financial Center
Boston, MA 02111
Senior Vice President and Chief Compliance Officer (since 2007) | | Director (Columbia Management Group LLC and Investment Product Group Compliance), Bank of America since June 2005; Director of Corporate Compliance and Conflicts Officer, MFS Investment Management (investment management), August 2004 to May 2005; Managing Director, Deutsche Asset Management (investment management) prior to August 2004. | |
|
| Michael G. Clarke (Born 1969) | |
|
One Financial Center
Boston, MA 02111
Treasurer (since 2008) | | Director of Fund Administration of the Advisor since January 2006; Managing Director of the Advisor September 2004 to December 2005; Vice President Fund Administration June 2002 to September 2004. | |
|
| Jeffrey R. Coleman (Born 1969) | |
|
One Financial Center
Boston, MA 02111
Deputy Treasurer (since 2006) | | Director of Fund Administration of the Advisor since January 2006; Fund Controller of the Advisor from October 2004 to January 2006; Vice President of CDC IXIS Asset Management Services, Inc. (investment management) from August 2000 to September 2004. | |
|
| Joseph F. DiMaria (Born 1968) | |
|
One Financial Center
Boston, MA 02111
Chief Accounting Officer (since 2008) | | Director of Fund Administration of the Advisor since January 2006; Head of Tax/Compliance and Assistant Treasurer of the Advisor from November 2004 to December 2005; Director of Trustee Administration (Sarbanes-Oxley) of the Advisor from May 2003 to October 2004. | |
|
| Julian Quero (Born 1967) | |
|
One Financial Center
Boston, MA 02111
Deputy Treasurer (since 2008) | | Senior Tax Manager of the Advisor since August 2006; Senior Compliance Manager of the Advisor from April 2002 to August 2006. | |
|
| Barry S. Vallan (Born 1969) | |
|
One Financial Center
Boston, MA 02111
Controller (since 2006) | | Vice President—Fund Treasury of the Advisor since October 2004; Vice
President—Trustee Reporting of the Advisor from April 2002 to October 2004 | |
|
39
Board Consideration and Approval of Advisory Agreements
The Advisory Fees and Expenses Committee of the Board of Trustees meets several times annually to review the advisory agreements (collectively, the "Agreements") of the funds for which the Trustees serve as trustees (each a "fund") and to determine whether to recommend that the full Board approve the continuation of the Agreements for an additional one-year period. After the Committee has made its recommendation, the full Board, including the Independent Trustees, determines whether to approve the continuation of the Agreements. In addition, the full Board, including the Independent Trustees, considers matters bearing on the Agreements at most of its other meetings throughout the year and meets regularly with senior management of the funds and Columbia, the funds' investment adviser, including the senior manager of each investment area within Columbia. Through the Board's Investment Oversight Committees, Trustees also meet with selected fund portfolio managers, research analysts and traders at various times throughout the year.
The Trustees receive and review all materials that they, their legal counsel or Columbia believe to be reasonably necessary for the Trustees to evaluate the Agreements and to determine whether to approve the continuation of the Agreements. Those materials generally include, among other items, (i) information on the investment performance of each fund relative to the performance of peer groups of mutual funds and the fund's performance benchmarks, and additional information assessing performance on a risk-adjusted basis, (ii) information on each fund's advisory fees and other expenses, including information comparing the fund's expenses to those of peer groups of mutual funds and information about any applicable expense caps and fee "breakpoints," (iii) information about the profitability of the Agreements to Columbia, including potential "fall-out" or ancillary benefits that Columbia and its affiliates may receive as a result of their relationships with the funds and (iv) information obtained through Columbia's response to a questionnaire prepared at the request of the Trustees by counsel to the funds and independent legal counsel to the Independent Trustees. The Trustees also consider other information such as (v) Columbia's financial results and financial condition, (vi) each fund's investment objective and strategies and the size, education and experience of Columbia's investment staffs and their use of technology, external research and trading cost measurement tools, (vii) the allocation of the funds' brokerage and the use of "soft" commission dollars to pay for research products and services, (viii) Columbia's resources devoted to, and its record of compliance with, the funds' investment policies and restrictions, policies on personal securities transactions and other compliance policies and legal and regulatory requirements, (ix) Columbia's response to va rious legal and regulatory proceedings since 2003 and to the recent period of volatility in the securities markets and (x) the economic outlook generally and for the mutual fund industry in particular. In addition, the Advisory Fees and Expenses Committee confers with the funds' independent fee consultant and reviews materials relating to the funds' relationships with Columbia provided by the independent fee consultant. Throughout the process, the Trustees have the opportunity to ask questions of and to request additional materials from Columbia and to consult with the independent fee consultant and independent legal counsel to the Independent Trustees.
The Board of Trustees most recently approved the continuation of the Agreements at its October, 2008 meeting, following meetings of the Advisory Fees and Expenses Committee held in February, April, August, September and October, 2008. In considering whether to approve the continuation of the Agreements, the Trustees, including the Independent Trustees, did not identify any single factor as determinative, and each weighed various factors as he or she deemed appropriate. The Trustees considered the following matters in connection with their approval of the continuation of the Agreements:
The nature, extent and quality of the services provided to the funds under the Agreements. The Trustees considered the nature, extent and quality of the services provided by Columbia and its affiliates to the funds and the resources dedicated to the funds by Columbia and its affiliates. Among other things, the Trustees considered (i) Columbia's ability (including its personnel and other resources, compensation programs for personnel involved in fund management,
40
reputation and other attributes) to attract, motivate and retain highly qualified research, advisory and supervisory investment professionals; (ii) the portfolio management services provided by those investment professionals; and (iii) the trade execution services provided on behalf of the funds. For each fund, the Trustees also considered the benefits to shareholders of investing in a mutual fund that is part of a family of funds offering exposure to a variety of asset classes and investment disciplines and providing a variety of fund and shareholder services. After reviewing those and related factors, the Trustees concluded, within the context of their overall conclusions regarding each of the Agreements, that the nature, extent and quality of services provided supported the continuation of the Agreements.
Investment performance of the funds and Columbia. The Trustees reviewed information about the performance of each fund over various time periods, including information prepared by an independent third-party data provider that compared the performance of each fund to the performance of peer groups of mutual funds and performance benchmarks. The Trustees also reviewed a description of the third party's methodology for identifying each fund's peer group for purposes of performance and expense comparisons. The Trustees also considered additional information that the Advisory Fees and Expenses Committee requested from Columbia relating to funds that presented relatively weaker performance and/or relatively higher expenses. In the case of each fund whose performance lagged that of a relevant peer group for certain (although not necessarily all) periods, the Trustees concluded that other factors relevant to performance were sufficient, in light of other considerations, to warrant continuation of the fund's Agreements. Those factors varied from fund to fund, but included one or more of the following: (i) that the fund's performance, although lagging in certain recent periods, was stronger over the longer term; (ii) that the underperformance was attributable, to a significant extent, to investment decisions that were reasonable and consistent with the fund's investment strategy and policies and that the fund was performing within a reasonable range of expectations, given those investment decisions, market conditions and the fund's investment strategy; (iii) that the fund's performance was competitive when compared to other relevant performance benchmarks or peer groups; (iv) that Columbia had taken or was taking steps designed to help improve the fund's investment performance, including, but not limited to, replacing portfolio managers or modifying investment strategies; and (v) that Columbia proposed to waive advisory fees or cap the expenses of the fund.
The Trustees noted that, through April 30, 2008, Columbia California Tax-Exempt Fund's performance was in the second quintile (where the best performance would be in the first quintile) for the one- and three- and five-year periods, and in the first quintile for the ten-year period, of the peer group selected by an independent third-party data provider for purposes of performance comparisons.
The Trustees also considered Columbia's performance and reputation generally, the funds' performance as a fund family generally, and Columbia's historical responsiveness to Trustee concerns about performance and Columbia's willingness to take steps intended to improve performance. After reviewing those and related factors, the Trustees concluded, within the context of their overall conclusions regarding each of the Agreements, that the performance of each fund and Columbia was sufficient, in light of other considerations, to warrant the continuation of the Agreement(s) pertaining to that fund.
The costs of the services provided and profits realized by Columbia and its affiliates from their relationships with the funds. The Trustees considered the fees charged to the funds for advisory services as well as the total expense levels of the funds. That information included comparisons (provided by management and by an independent third-party data provider) of each fund's advisory fees and total expense levels to those of the fund's peer groups and information about the advisory fees charged by Columbia to comparable institutional accounts. In considering the fees charged to those accounts, the Trustees took into account, among other things, management's representations about the differences between managing mutual funds as compared to other types of accounts, including differences in the services provided, differences in the risk profile of such business for Columbia, and the additional resources required to manage mutual funds effectively. In evaluating each fund's advisory fees, the Trustees also took into account the demands, complexity and quality of the investment management of the fund. The Trustees considered existing advisory fee breakpoints, and Columbia's use of advisory fee waivers and expense caps, which benefited a number of the funds. The Trustees also noted management's stated justification for the fees charged to the funds, which
41
included information about the investment performance of the funds and the services provided to the funds.
The Trustees considered that Columbia California Tax-Exempt Fund's total expenses were in the third quintile and actual management fees were in the second quintile (where the lowest fees and expenses would be in the first quintile) of the peer group selected by an independent third-party data provider for purposes of expense comparisons.
The Trustees also considered the compensation directly or indirectly received by Columbia and its affiliates from their relationships with the funds. The Trustees reviewed information provided by management as to the profitability to Columbia and its affiliates of their relationships with each fund, and information about the allocation of expenses used to calculate profitability. When reviewing profitability, the Trustees also considered court cases in which adviser profitability was an issue in whole or in part, the performance of the relevant funds, the expense level of each fund, and whether Columbia had implemented breakpoints and/or expense caps with respect to the fund.
After reviewing those and related factors, the Trustees concluded, within the context of their overall conclusions regarding each of the Agreements, that the advisory fees charged to each fund, and the related profitability to Columbia and its affiliates of their relationships with the fund, supported the continuation of the Agreement(s) pertaining to that fund.
Economies of Scale. The Trustees considered the existence of any economies of scale in the provision by Columbia of services to each fund, to groups of related funds, and to Columbia's investment advisory clients as a whole and whether those economies were shared with the funds through breakpoints in the investment advisory fees or other means, such as fee waivers/expense reductions and additional investments by Columbia in investment, trading and compliance resources. The Trustees noted that many of the funds benefited from breakpoints, fee waivers/expense caps, or both. In considering those issues, the Trustees also took note of the costs of the services provided (both on an absolute and a relative basis) and the profitability to Columbia and its affiliates of their relationships with the funds, as discussed above.
After reviewing those and related factors, the Trustees concluded, within the context of their overall conclusions regarding each of the Agreements, that the extent to which economies of scale were shared with the funds supported the continuation of the Agreements.
Other Factors. The Trustees also considered other factors, which included but were not limited to the following:
n the extent to which each fund had operated in accordance with its investment objective and investment restrictions, the nature and scope of the compliance programs of the funds and Columbia and the compliance-related resources that Columbia and its affiliates were providing to the funds;
n the nature, quality, cost and extent of administrative and shareholder services overseen and performed by Columbia and its affiliates, both under the Agreements and under separate agreements for the provision of transfer agency and administrative services;
n so-called "fall-out benefits" to Columbia and its affiliates, such as the engagement of its affiliates to provide distribution, brokerage and transfer agency services to the funds, and the benefits of research made available to Columbia by reason of brokerage commissions generated by the funds' securities transactions, as well as possible conflicts of interest associated with those fall-out and other benefits, and the reporting, disclosure and other processes in place to disclose and monitor those possible conflicts of interest; and
n the report provided by the funds' independent fee consultant, which included information about and analysis of the funds' fees, expenses and performance.
Based on their evaluation of all factors that they deemed to be material, including those factors described above, and assisted by the advice of independent counsel and the independent fee consultant, the Trustees, including the Independent Trustees, approved the continuance of each of the Agreements through October 31, 2009.
42
Summary of Management Fee Evaluation by
Independent Fee Consultant
EXCERPTS FROM REPORT OF INDEPENDENT FEE CONSULTANT TO THE FUNDS SUPERVISED BY THE COLUMBIA ATLANTIC BOARD
Prepared Pursuant to the February 9, 2005
Assurance of Discontinuance among the
Office of Attorney General of New York State,
Columbia Management Advisors, LLC, and
Columbia Management Distributors, Inc.
November 3, 2008
I. Overview
On February 9, 2005, Columbia Management Advisors, LLC ("CMA") and Columbia Management Distributors, Inc.1 ("CMD") agreed to the New York Attorney General's Assurance of Discontinuance ("AOD"). Among other things, the AOD stipulates that CMA may manage or advise a Columbia Fund ("Columbia Fund" and, together with some or all of such funds, the "Columbia Funds") only if the Independent Members of the Columbia Fund's Board of Trustees appoint a Senior Officer or retain an Independent Fee Consultant ("IFC") who is to manage the process by which proposed management fees are negotiated. The AOD further stipulates that the Senior Officer or IFC is to prepare a written annual evaluation of the fee negotiation process.
With effect from January 1, 2007, the Independent Members of the Board of Trustees for certain Columbia Funds known collectively as the "Atlantic Funds" (together with the other members of that Board, the "Trustees") retained me as IFC for the Atlantic Funds.2 In this capacity, I have prepared the fourth annual written evaluation of the fee negotiation process. As was the case with last year's report (the "2007 Report") my immediate predecessor as IFC, John Rea, provided invaluable assistance in the preparation of this year's report.
A. Role of the Independent Fee Consultant
The AOD charges the IFC with "managing the process by which proposed management fees ... to be charged the Columbia Fund are negotiated so that they are negotiated in a manner which is at arms' length and reasonable and consistent with this Assurance of Discontinuance." The AOD also provides that CMA "may manage or advise a Columbia Fund only if the reasonableness of the proposed management fees is determined by the Board of Trustees ... using ... an annual independent written evaluation prepared by or under the direction of ... the Independent Fee Consultant." Therefore, the AOD makes clear that the IFC does not supplant the Trustees in negotiating management fees with CMA, nor does the IFC substitute his or her judgment for that of the Trustees with respect to the reasonableness of proposed fees or any other matter that is committed to the business judgmen t of the Trustees.
B. Elements Involved in Managing the Fee Negotiation Process
In preparing the report required by the AOD, the IFC must consider at least the following six factors set forth in the AOD:
1. The nature and quality of CMA's services, including the Fund's performance;
2. Management fees (including any components thereof) charged by other mutual fund companies for like services;
3. Possible economies of scale as the Fund grows larger;
4. Management fees (including any components thereof) charged to institutional and other clients of CMA for like services;
5. Costs to CMA and its affiliates of supplying services pursuant to the management fee agreements, excluding any intra-corporate profit; and
6. Profit margins of CMA and its affiliates from supplying such services.
C. Organization of the Annual Evaluation
This report, like last year's, focuses on the six factors and contains a section for each factor except that CMA's costs and profits from managing the Funds have been combined into a single section. In addition to a discussion of these factors, the report offers recommendations to improve the fee review process in future years. A review of the status of recommendations made in the 2007 Report is being provided separately with the materials for the October meeting.
1 CMA and CMD are subsidiaries of Columbia Management Group, LLC ("CMG"), and are the successors to the entities named in the AOD.
2 I have no material relationship with Bank of America, CMG or any of its affiliates, aside from serving as IFC, and I am aware of no material relationship with any of their affiliates. I retained John Rea, an independent economic consultant, to assist me with this report.
Unless otherwise stated or required by the context, this report covers only the Atlantic Funds, which are also referred as the "Funds."
43
II. Summary of Findings
A. General
1. Based upon my examination of the information supplied by CMG in the light of the six factors set forth in the AOD, I conclude that the Trustees have the relevant information necessary to evaluate the reasonableness of the proposed management fees for each Atlantic Fund.
2. In my view, the process by which the proposed management fees of the Funds have been negotiated in 2008 thus far has been, to the extent practicable, at arms' length and reasonable and consistent with the AOD.
B. Nature and Quality of Services, Including Performance
3. The performance of the Funds has been relatively strong in recent years. Based upon 1-, 3-, 5-, and 10-year returns through April 30, 2008, at least half of all the Funds were in the first and second performance quintiles in each of the four performance periods and, at most, only 11% were in the fifth quintile in any one performance period. Both equity and fixed-income funds posted strong performance relative to comparable funds.
4. Performance rankings were similar in 2007 and 2008, although last year's were slightly stronger. Despite the stability in the distribution of rankings in the two years, at least half the Funds changed quintile rankings between the two years in at least one of the 1-, 3-, and 5-year performance periods.
5. The performance of the actively managed equity Funds against their benchmarks was very strong. At least 57% and as many as 73% posted net returns exceeding their benchmarks over the 1-, 3-, and 5-year periods. In contrast, gross and net returns of fixed-income Funds typically fell short of their benchmarks.
6. Atlantic equity Funds' overall performance adjusted for risk also was strong. Based upon 3-year returns, nearly 80% of the equity Funds had a combination of risk-adjusted and unadjusted returns that placed them in the top half of their performance universes. Only about one-fifth of the fixed income Funds posted high returns and low risk relative to comparable funds. About two-thirds of the fixed-income Funds took on more risk than the typical fund in their performance universes.
7. The industry-standard procedure used by Lipper that includes all share classes in the performance universe tends to bias a Fund's ranking upward within that universe. The bias occurs because either no-12b-1 fee or low-12b-1 fee share classes of the Atlantic Funds are compared with funds in performance universes that include all share classes of multi-class funds with 12b-1 fees of up to 100 basis points. Correcting this bias by limiting the performance universe to classes of comparable funds with low or no 12b-1 fees (a "filtered universe") lowers the relative performance for the Funds, but their performance, on the whole, remains strong. The filtering process, however, did identify two Funds for further review that had not been designated review funds using unfiltered universes.
8. A small number of Funds have consistently underperformed over the past four years. The exact number depends on the criteria used to evaluate longer-term performance. For example, the one-year returns of one Fund have been in the fourth or fifth performance quintiles in each of the past four years; there are six Funds whose three-year returns have been in the fourth or fifth quintile over the past four years.
9. The services performed by CMG professionals beyond portfolio management, such as compliance, legal, information technology, risk management, finance and fund administration, are critical to the success of the Funds and appear to be of high quality.
C. Management Fees Charged by Other Mutual Fund Companies
10. The Funds' management fees and total expenses are generally low relative to those of their peers. Only 21% of the Funds ranked in the two most expensive quintiles for actual management fees, and only 23% in those quintiles for total expenses.
11. The highest concentration of low-expense Funds is found among the equity and tax-exempt fixed income Funds. The 12 former Excelsior Funds have relatively high fees and expenses, with half of those Funds ranking in either the fourth or fifth quintiles. The higher actual management fee
44
rankings of certain Excelsior Funds are due in part to fee schedules that are higher than standard Columbia Fund fee schedules at current asset levels. After discussion with the Trustees, CMA is proposing to lower the management fees on three of these Funds.
12. The distribution of expense rankings is similar in 2007 and 2008, while management fee rankings improved markedly in 2008. Part of the improvement reflects expense limitations introduced last year for the state intermediate municipal bond Funds.
13. The management fees of the Atlantic Funds are generally in line with those of Columbia Funds supervised by the Nations Board of Trustees (the "Nations Funds"). In investment categories in which the Atlantic Funds have higher average fees, the difference principally arises out of differences in asset size.
D. Trustees' Fee and Performance Evaluation Process
14. The Trustees' evaluation process identified 17 Funds in 2008 for further review based upon their relative performance or expenses or both. When compared in filtered universes, two more Funds met the criteria for further review. CMG provided further information about those Funds to assist the Trustees in their evaluation.
E. Potential Economies of Scale
15. CMG presented to the Trustees its analysis of the sources and sharing of potential economies of scale. CMG views economies of scale as arising at the complex level and would regard estimates of scale economies for individual funds as unreliable. In its analysis, CMG did not identify specific sources of economies of scale or provide any estimates of any economies of scale that might arise from future asset growth. CMG's analysis included measures taken by the Trustees and CMG that seek to share any potential economies of scale through breakpoints in management fee schedules, expense reimbursements, fee waivers, enhanced shareholder services, fund mergers, and operational consolidation.
16. An examination of the contractual fee schedules for five Atlantic Funds shows that they are generally in line with those of their competitors, in terms of number and extent of fee breakpoints. A similar examination last year of five different Funds led to the same conclusion.
F. Management Fees Charged to Institutional Clients
17. CMG has provided Trustees with comparisons of mutual fund management fees and institutional fees based upon standardized fee schedules and upon actual fees. The results show that, consistent with industry practice, institutional fees are generally lower than the Funds' management fees. However, because the services provided and risks borne by the manager are more extensive for mutual funds compared to institutional accounts, the differences are of limited value in assisting the Trustees in their review of the reasonableness of the Funds' management fees.
G. Revenues, Expenses, and Profits
18. The activity-based cost allocation methodology ("ABC") employed by CMG to allocate costs, both direct and indirect, for purposes of calculating Fund profitability is thoughtful and detailed. This year, CMG proposed a change to the method by which indirect expenses are allocated. Under this "hybrid" method, indirect costs relating to fund management are allocated among the Funds 50% by assets and 50% per Fund. Allocating indirect expenses equally to each Fund has an intuitive logic, as each Fund regardless of size has certain expenses, such as preparing and printing prospectuses and financial statements.
19. The materials provided on CMG's revenues and expenses with respect to the Funds and the methodology underlying their construction form a sufficient basis for Trustees to evaluate the expenses and profitability of the Funds.
20. In 2007, CMG's complex-wide pre-tax margins on the Atlantic Funds were slightly below industry medians, based on limited data available for publicly held mutual fund managers. However, as is to be expected in a complex now comprising 75 Funds (including former Excelsior Funds), some Atlantic Funds have relatively high pre-tax profit margins, when calculated solely with respect to management revenues and expenses, while other Atlantic Funds operate at a loss. There is a positive relationship
45
between fund size and profitability, with smaller funds generally operating at a loss.
21. CMG pays a fixed percentage of its management fee revenues to an affiliate, U.S. Trust, Bank of America Private Wealth Management, to compensate it for services it performs with respect to Atlantic Fund assets held for the benefit of its customers. Based on our analysis of the services provided by this affiliate, we have concluded that all payments other than those for sub-transfer agent or sub-accounting services should be treated as a distribution expense.
III. Recommendations
1) Criteria for review. The Trustees may wish to consider modifying the criteria for classifying a fund as a "Review Fund" to include criteria that focus exclusively on performance without regard to expense or fee levels. For example, a fund whose one-year or three-year performance was median or below for four consecutive years could be treated as a Review Fund. When we applied such criteria to the Funds, several additional Funds would have been added to the list of Review Funds.
2) Profitability data. CMG should present to the Trustees each year the profitability of each Fund, each investment style and each complex (of which Atlantic is one) calculated as follows:
a. Management-only profitability should be calculated without reference to any Private Bank expense.
b. Profitability excluding distribution (which essentially covers the management and transfer agency functions) should be adjusted by removing from the expense calculation any portion of the Private Bank payment not attributable to the performance by the Private Bank of sub-transfer agency or sub-accounting functions.
c. Total profitability, including distribution: No adjustment for Private Bank expenses should be made, because all such expenses represent legitimate fund expenses to be taken into account in calculating CMG's profit margin including distribution.
d. Distribution only: This should include all Private Bank expenses other than those attributable to sub-transfer agency services.
Therefore, the following data need not be provided:
1. Adjusting total profitability data for Private Bank expenses
2. Adjusting profitability excluding distribution by backing out all Private Bank expenses.
3) Potential economies of scale. CMG and the IFC should continue to work on methods for more precisely quantifying to the extent possible the sources and magnitude of any economies of scale as CMG's mutual fund assets under management increase, to the extent that the data allows for meaningful year-over-year comparisons. The framework suggested in Section IV.D.4 may prove to be a useful model for such an analysis.
4) Competitive breakpoint analysis. As part of the annual fee evaluation process, the breakpoints of a select group of Atlantic Funds (which would differ each year) should continue to be compared to those of industry rivals to ensure that the Funds' breakpoint schedules remain within industry norms. As breakpoint schedules change relatively little each year, performing such a comparison for each Atlantic Fund each year would not be an efficient use of Trustee and CMG resources.
5) Cost allocation methodology. CMG's point that the current ABC system of allocating indirect expenses creates anomalous results in several cases, including sub-advised Funds, is well-taken. We would like to work with CMG over the forthcoming year on alternatives to the current system of allocating indirect expenses that (1) resolve the anomalies, (2) limit the amount of incremental effort on CMG's part and (3) remain faithful to the general principle that expenses should be allocated by time and effort to the extent reasonably possible.
6) Management fee disparities. CMG and the Atlantic Trustees, as part of any future study of management fees, should analyze the differences in management fee schedules, principally arising out of the reorganization of the former Excelsior Funds as Atlantic Funds. As part of that analysis, CMG should provide an explanation for any significant fee differences among comparable funds across fund families managed by CMA, such as differences in the management styles of different Funds included the same Lipper category. Finally, whenever CMG proposes a
46
management fee change or an expense cap for any mutual fund managed by CMA that is comparable to any Atlantic Fund, CMG should provide the Trustees with sufficient information about the proposal to allow the Trustees to assess the applicability of the proposed change to the relevant Atlantic Fund or Funds.
7) Tax-exempt Fund expense data. The expense rankings of certain tax-exempt Funds were adversely affected by including certain investment-related interest expenses that Lipper excluded in calculating the expense ratios of competitors. We recommend that CMG follow the Lipper practice and exclude such interest expenses from data submitted to Lipper to avoid unfairly disadvantaging the tax-exempt Funds.
8) Reduction of volume of paper documents submitted. The effort to rationalize and simplify the data presented to the Trustees and the process by which that data was prepared and organized was regarded as a success by all parties. We should continue to look for opportunities to reduce and simplify the presentation of 15(c) data, especially in the area of Fund profitability. The Fund "Dashboard" volume presents a large volume of Fund data on a single page. If it is continued, the Trustees may wish to consider receiving the underlying Lipper data on CD, rather than the current paper volumes.
Respectfully submitted,
Steven E. Asher
47
This page intentionally left blank.
Important Information About This Report
The fund mails one shareholder report to each shareholder address. If you would like more than one report, please call shareholder services at 1-800-345-6611 and additional reports will be sent to you. This report has been prepared for shareholders of Columbia California Tax-Exempt Fund.
A description of the policies and procedures that the fund uses to determine how to vote proxies and a copy of the fund's voting records are available (i) at www.columbiamanagement.com; (ii) on the Securities and Exchange Commission's website at www.sec.gov, and (iii) without charge, upon request, by calling 1-800-368-0346. Information regarding how the fund voted proxies relating to portfolio securities during the 12-month period ended June 30 is available from the SEC's website. Information regarding how the fund voted proxies relating to portfolio securities is also available from the fund's website, www.columbiamanagement.com.
The fund files a complete schedule of portfolio holdings with the SEC for the first and third quarters of each fiscal year on Form N-Q. The fund's Form N-Q is available on the SEC's website at www.sec.gov and may be reviewed and copied at the SEC's Public Reference Room in Washington, DC. Information on the operation of the Public Reference Room may be obtained by calling 1-800-SEC-0330.
An investment in money market mutual funds is not a bank deposit, and is not insured or guaranteed by Bank of America, N.A. or any of its affiliates or by the Federal Deposit Insurance Corporation or any other government agency. Although money market mutual funds seek to preserve the value of your investment at $1.00 per share, it is possible to lose money by investing in money market mutual funds. Please see the prospectuses for a complete discussion of the risks of investing in money market mutual funds.
Please read and consider the investment objectives, risks, charges and expenses for any fund carefully before investing. For a prospectus which contains this and other important information about the fund, contact your Columbia Management representative or financial advisor or go to www.columbiamanagement.com.
Columbia Management Group, LLC ("Columbia Management") is the investment management division of Bank of America Corporation. Columbia Management entities furnish investment management services and products for institutional and individual investors. Columbia Funds are distributed by Columbia Management Distributors, Inc., member of FINRA, SIPC, part of Columbia Management and an affiliate of Bank of America Corporation.
Transfer Agent
Columbia Management Services, Inc.
P.O. Box 8081
Boston, MA 02266-8081
1-800-345-6611
Distributor
Columbia Management
Distributors, Inc.
One Financial Center
Boston, MA 02111
Investment Advisor
Columbia Management Advisors, LLC
100 Federal Street
Boston, MA 02110
49
Columbia Management®
Columbia California Tax-Exempt Fund
Annual Report, October 31, 2008
PRSRT STD
U.S. Postage
PAID
Holliston, MA
Permit NO. 20
©2008 Columbia Management Distributors, Inc.
One Financial Center, Boston, MA 02111-2621
800-345-6611 www.columbiafunds.com
SHC-42/156810-1008 (12/08) 08/65973
Columbia Management®
Annual Report
October 31, 2008
Columbia Connecticut Tax-Exempt Fund
| NOT FDIC INSURED | | May Lose Value | |
|
| NOT BANK ISSUED | | No Bank Guarantee | |
|
Table of Contents
| Fund Profile | | | 1 | | |
|
| Economic Update | | | 2 | | |
|
| Performance Information | | | 3 | | |
|
| Understanding Your Expenses | | | 4 | | |
|
| Portfolio Manager's Report | | | 5 | | |
|
| Investment Portfolio | | | 7 | | |
|
Statement of Assets and
Liabilities | | | 12 | | |
|
| Statement of Operations | | | 13 | | |
|
Statement of Changes in
Net Assets | | | 14 | | |
|
| Financial Highlights | | | 16 | | |
|
| Notes to Financial Statements | | | 19 | | |
|
| Report of Independent Registered Public Accounting Firm | | | 27 | | |
|
| Federal Income Tax Information | | | 28 | | |
|
| Fund Governance | | | 29 | | |
|
Board Consideration and
Approval of Advisory Agreements | | | 33 | | |
|
Summary of Management
Fee Evaluation by Independent
Fee Consultant | | | 36 | | |
|
Important Information About
This Report | | | 41 | | |
|
The views expressed in this report reflect the current views of the respective parties. These views are not guarantees of future performance and involve certain risks, uncertainties and assumptions that are difficult to predict, so actual outcomes and results may differ significantly from the views expressed. These views are subject to change at any time based upon economic, market or other conditions and the respective parties disclaim any responsibility to update such views. These views may not be relied on as investment advice and, because investment decisions for a Columbia Fund are based on numerous factors, may not be relied on as an indication of trading intent on behalf of any particular Columbia Fund. References to specific securities should not be construed as a recommendation or investment advice.
President's Message

Dear Shareholder:
We are pleased to provide this shareholder report for your Columbia Fund and hope you will find the portfolio management details, discussions and performance information helpful in monitoring your investments. As we've seen this past year, the financial markets can be quite volatile, with significant short-term price fluctuations. It's important to keep these ups and downs in perspective, particularly in light of your long-term investment strategy.
Staying the course with your long-term strategy typically involves riding out short-term price fluctuations, though we recognize that at times this can be tough. To support your efforts and give you the information you need to make prudent decisions, Columbia Management offers several valuable online resources. We encourage you to visit www.columbiamanagement.com/investor, where you can receive the most up-to-date information, including:
g Daily pricing and performance. View pricing and performance from a link in Fund Tracker on the homepage. This listing of funds is updated nightly with the current net asset value and the amount and percentage change from the prior day.
g News & Commentary. This tab provides links to quarterly fund commentaries and information from our investment strategies group, including trends in the economy and market impact.
If you would like more details on individual funds, select a fund from the dropdown menu on the top right side of the homepage for access to:
g Monthly and quarterly performance information.
g Portfolio holdings. Full holdings are updated monthly for money market funds, except for Columbia Cash Reserves, Columbia Government Plus Reserves, Columbia Government Reserves, Columbia Treasury Reserves and Columbia Money Market Reserves which are updated weekly, monthly for equity funds and quarterly for most other funds.
g Quarterly fact sheets. Accessible from the Literature tab in each fund page.
By registering on the site, you'll receive secured, 24-hour access to*:
g Mutual fund account details with balances, dividend and transaction information.
g Fund Tracker to customize your homepage with current net asset values for the funds that interest you.
g On-line transactions including purchases, exchanges and redemptions.
g Account maintenance for updating your address and dividend payment options.
g Electronic delivery of prospectuses and shareholder reports.
I encourage you to visit our website for access to the product information and tools described above. These valuable online resources can help you monitor your investments and provide direct access to your account. All of these tools, and more, can be found on www.columbiamanagement.com/investor.
While your financial advisor is a great resource for investment guidance, you can also access our website or call our service representatives at 800.345.6611 for additional assistance. We thank you for investing with Columbia Management and look forward to helping with your ongoing investment needs.
Sincerely,

Christopher L. Wilson
President, Columbia Funds
*Some restrictions apply. Shareholders who purchase shares through certain third-party organizations may not have the ability to register for online access.
Fund Profile – Columbia Connecticut Tax-Exempt Fund
Summary
g For the 12-month period that ended October 31, 2008, the fund's Class A shares returned negative 5.36% without sales charge.
g The fund trailed its benchmark, the Barclays Capital Municipal Bond Index,1 but performed better than its peer group average, the Lipper Connecticut Municipal Debt Funds Classification.2
g Bonds in the mid-to-lower quality tiers held back performance compared to the benchmark. We believe the fund had less exposure than the average fund in its peer group to mid-quality bonds and bonds with the longest maturities, which helped it outperform.
Portfolio Management
Gary Swayze has managed the fund since November 1997 and has been with the advisor or its predecessors or affiliate organizations since 1997.
1The Barclays Capital Municipal Bond Index (formerly the Lehman Brothers Municipal Bond Index) is considered representative of the broad market for investment-grade, tax exempt bonds with maturities of at least one year. Indices are not investments, do not incur fees or expenses and are not professionally managed. It is not possible to invest directly in an index. Securities in the fund may not match those in an index.
2Lipper Inc., a widely respected data provider in the industry, calculates an average total return (assuming reinvestment of distributions) for mutual funds with investment objectives similar to those of the fund. Lipper makes no adjustment for the effect of sales loads.
Performance data quoted represents past performance and current performance may be lower or higher. Past performance is no guarantee of future results. The investment return and principal value will fluctuate so that shares, when redeemed, may be worth more or less than the original cost. Please visit www.columbiafunds.com for daily and most recent month-end performance updates.
Summary
1-year return as of 10/31/08
| | | –5.36% | |
|
 | | Class A shares
(without sales charge) | |
|
| | | –3.30% | |
|
 | | Barclays Capital
Municipal Bond Index | |
|
Morningstar Style Box

The Morningstar Style Box reveals a fund's investment strategy. For fixed-income funds the vertical axis shows the average credit quality of the bonds owned, and the horizontal axis shows interest rate sensitivity as measured by a bond's duration (short, intermediate or long). All of these numbers are drawn from the data most recently provided by the fund and entered into Morningstar's database as of quarter-end. Although the data gathered is from reliable sources, Morningstar cannot guarantee its completeness and accuracy. Information shown is as of 06/30/08.
1
Economic Update – Columbia Connecticut Tax-Exempt Fund
Summary
For the 12-month period that ended October 31, 2008
g Despite volatility in many segments of the bond market, the Barclays Capital U.S. Aggregate Bond Index delivered a modest gain. High-yield bonds lost significant ground, as measured by the Merrill Lynch U.S. High Yield, Cash Pay Index.
Barclays
Index | | Merrill
Lynch Index | |
|
 | |  | |
|
g The broad U.S. stock market, as measured by the S&P 500 Index, returned negative 36.10%. Developed stock markets outside the United States returned negative 46.62%, as measured (in U.S. dollars) by the MSCI EAFE Index.
| S&P Index | | MSCI Index | |
|
 | |  | |
|
The Barclays Capital U.S. Aggregate Bond Index (formerly the Lehman Brothers U.S. Aggregate Bond Index) is a market value-weighted index that tracks the daily price, coupon, pay-downs and total return performance of fixed-rate, publicly placed, dollar-denominated and non-convertible investment grade debt issues with at least $250 million par amount outstanding and with at least one year to final maturity.
The Merrill Lynch U.S. High Yield, Cash Pay Index tracks the performance of non-investment-grade corporate bonds.
The Standard & Poor's (S&P) 500 Index tracks the performance of 500 widely held, large-capitalization US stocks.
The Morgan Stanley Capital International (MSCI) Europe, Australasia, Far East (EAFE) Index is a free float-adjusted market capitalization index that is designed to measure developed market equity performance, excluding the US and Canada.
Indices are not investments, do not incur fees or expenses and are not professionally managed. It is not possible to invest directly in an index. Securities in the fund may not match those in an index.
The pace of economic growth ground to a halt during the 12-month period that began November 1, 2007 and ended October 31, 2008. Although the economic growth was modestly positive at the beginning of the period, the economy slipped into recession in 2008, with little relief in sight. A host of factors weighed on consumers and businesses alike.
The most severe housing downturn in decades showed no sign of abating as inventories of homes for sale rose, home prices declined and tighter credit standards, a result of continued turmoil in the subprime mortgage market, made it more difficult for homebuyers to qualify for loans.
The labor market contracted for ten consecutive months, driving the unemployment rate to 6.5%, the highest rate since the early 1990s. Nearly 1.2 million jobs have been lost since the beginning of 2008, with announced layoffs likely to drive that number even higher in the months ahead. Manufacturing activity slowed and consumer spending declined, dimming hopes for the holiday season.
A weakening economy and turmoil in the financial markets took a toll on consumer confidence, which plummeted to the lowest point ever in the 40-year history of the Conference Board's monthly survey.
In an effort to inspire confidence in the capital markets, loosen the reins on credit and shore up economic growth, the Federal Reserve Board (the Fed) brought a key short-term rate—the federal funds rate—down from 4.50% to 1.0% during the 12-month period. Despite earlier concerns about inflation, a weak economic outlook has kept the Fed focused on stimulating economic growth through lowering borrowing rates. In fact, the one bright spot during this period of uncertainty has been lower energy and commodity prices. With oil trading near $60 per barrel at the end of the period, gasoline prices are forecasted to come down below $2 per gallon after peaking above $4 per gallon during the summer months.
Bonds eke out a small, positive return
The U.S. bond market seesawed during the 12-month period but managed to eke out a small gain as investors sought the relative safety of the highest quality sectors. After a weak start, bond prices in several sectors rose and yields declined as economic growth slowed and stock market volatility increased. The benchmark 10-year U.S. Treasury yield ended the period at just under 4.0%, nearly one-half percentage point lower than where it stood one year ago. In this environment, the Barclays Capital U.S. Aggregate Bond Index returned 0.30%. High-yield bonds disappointed as economic prospects weakened and default fears rose. The Merrill Lynch U.S. High Yield, Cash Pay Index returned negative 26.43%.
Stocks retreat as economic outlook darkens
Against a shifting economic backdrop, the U.S. stock market lost 36.10% for the 12-month period, as measured by the S&P 500 Index. Losses extended across all market caps and both growth and value, although value stocks held up somewhat better than growth stocks, as measured by their respective Russell indices.1 Stock markets outside the U.S. suffered even greater losses. The MSCI EAFE Index, a broad gauge of stock market performance in foreign developed markets, lost 46.62% (in U.S. dollars) for the period. Emerging stock markets, which have had a strong run over the past several years, were also caught in the downdraft. As investors backed away from risk, emerging markets suffered most of all. The MSCI Emerging Markets Index returned negative 56.22% (in U.S. dollars).2
Past performance is no guarantee of future results.
1The Russell 1000 Index measures the performance of 1,000 of the largest US companies, based on market capitalization. The Russell Midcap Index measures the performance of the 800 smallest companies in the Russell 1000 Index, as ranked by total market capitalization. The Russell 2000 Index measures the performance of the 2,000 smallest of the 3,000 largest US companies based on market capitalization.
2The Morgan Stanley Capital International (MSCI) Emerging Markets Index is a widely accepted index composed of a sample of companies from 25 countries representing the global emerging stock markets.
Indices are not investments, do not incur fees or expenses and are not professionally managed. It is not possible to invest directly in an index. Securities in the fund may not match those in an index.
2
Performance Information – Columbia Connecticut Tax-Exempt Fund
Growth of a $10,000 investment 11/01/98 – 10/31/08
The chart above shows the growth in value of a hypothetical $10,000 investment in Class A shares of Columbia Connecticut Tax-Exempt Fund during the stated time period, and does not reflect the deduction of taxes that a shareholder may pay on fund distributions or on the redemption of fund shares. The Barclays Capital Municipal Bond Index is considered representative of the broad market for investment-grade, tax exempt bonds with maturities of at least one year. Indices are not investments, do not incur fees or expenses and are not professionally managed. It is not possible to invest directly in an index. Securities in the fund may not match those in an index.
Performance of a $10,000 investment 11/01/98 – 10/31/08 ($)
| Sales charge | | without | | with | |
| Class A | | | 14,036 | | | | 13,369 | | |
| Class B | | | 13,029 | | | | 13,029 | | |
| Class C | | | 13,422 | | | | 13,422 | | |
Average annual total return as of 10/31/08 (%)
| Share class | | A | | B | | C | |
| Inception | | 11/01/91 | | 06/08/92 | | 08/01/97 | |
| Sales charge | | without | | with | | without | | with | | without | | with | |
| 1-year | | | –5.36 | | | | –9.86 | | | | –6.07 | | | | –10.57 | | | | –5.79 | | | | –6.69 | | |
| 5-year | | | 1.43 | | | | 0.45 | | | | 0.68 | | | | 0.35 | | | | 0.98 | | | | 0.98 | | |
| 10-year | | | 3.45 | | | | 2.95 | | | | 2.68 | | | | 2.68 | | | | 2.99 | | | | 2.99 | | |
Average annual total return as of 09/30/08 (%)
| Share class | | A | | B | | C | |
| Sales charge | | without | | with | | without | | with | | without | | with | |
| 1-year | | | –3.78 | | | | –8.35 | | | | –4.50 | | | | –9.08 | | | | –4.22 | | | | –5.13 | | |
| 5-year | | | 1.55 | | | | 0.57 | | | | 0.80 | | | | 0.46 | | | | 1.10 | | | | 1.10 | | |
| 10-year | | | 3.56 | | | | 3.06 | | | | 2.80 | | | | 2.80 | | | | 3.10 | | | | 3.10 | | |
The "with sales charge" returns include the maximum initial sales charge of 4.75% for Class A shares, the applicable contingent deferred sales charge of 5.00% in the first year, declining to 1.00% in the sixth year and eliminated thereafter for Class B shares and 1.00% for Class C shares for the first year only. The "without sales charge" returns do not include the effect of sales charges. If they had, returns would be lower.
Performance results reflect any fee waivers or reimbursements of fund expenses by the investment advisor and/or any of its affiliates. Absent these fee waivers or expense reimbursement arrangements, performance results would have been lower.
All results shown assume reinvestment of distributions. Please see the fund's prospectus for details. Performance for different share classes will vary based on differences in sales charges and the fees associated with each class.
The tables do not reflect the deduction of taxes that a shareholder may pay on fund distributions or on the redemption of fund shares.
Performance data quoted represents past performance and current performance may be lower or higher. Past performance is no guarantee of future results. The investment return and principal value will fluctuate so that shares, when redeemed, may be worth more or less than the original cost. Please visit www.columbiafunds.com for daily and most recent month-end performance updates.
Annual operating expense ratio (%)*
| Class A | | | 0.98 | | |
| Class B | | | 1.73 | | |
| Class C | | | 1.73 | | |
* The annual operating expense ratio is as stated in the fund's prospectus that is current as of the date of this report. Differences in expense ratios disclosed elsewhere in this report may result from including fee waivers and expense reimbursements as well as different time periods used in calculating the ratios.
3
Understanding Your Expenses – Columbia Connecticut Tax-Exempt Fund
Estimating your actual expenses
To estimate the expenses that you paid over the period, first you will need your account balance at the end of the period:
g For shareholders who receive their account statements from Columbia Management Services, Inc., your account balance is available online at www.columbiafunds.com or by calling Shareholder Services at 800.345.6611.
g For shareholders who receive their account statements from their financial intermediary, contact your financial intermediary to obtain your account balance.
1. Divide your ending account balance by $1,000. For example, if an account balance was $8,600 at the end of the period, the result would be 8.6.
2. In the section of the table below titled "Expenses paid during the period," locate the amount for your share class. You will find this number in the column labeled "Actual." Multiply this number by the result from step 1. Your answer is an estimate of the expenses you paid on your account during the period.
If the value of your account falls below the minimum initial investment requirement applicable to you, your account generally will be subject to a $20 annual fee. This fee is not included in the accompanying table. If you are subject to the fee, keep it in mind when you are estimating the ongoing expenses of investing in the fund and when comparing the expenses of this fund with other funds.
As a fund shareholder, you incur two types of costs. There are transaction costs, which generally include sales charges on purchases and may include redemption fees or exchange fees. There are also ongoing costs, which generally include investment advisory fees, distribution and service (Rule 12b-1) fees and other fund expenses. The information on this page is intended to help you understand the ongoing costs of investing in the fund and to compare these costs with the ongoing costs of investing in other mutual funds.
Analyzing your fund's expenses by share class
To illustrate these ongoing costs, we have provided an example and calculated the expenses paid by investors in each share class during the period. The information in the following table is based on an initial investment of $1,000, which is invested at the beginning of the period and held for the entire period. Expense information is calculated two ways and each method provides you with different information. The amount listed in the "Actual" column is calculated using the fund's actual operating expenses and total return for the period. The amount listed in the "Hypothetical" column for each share class assumes that the return each year is 5% before expenses and is calculated based on the fund's actual operating expenses. You should not use the hypothetical account values and expenses to estimate either your actual account balance at the end of the period or the expenses you paid during this period.
Compare with other funds
Since all mutual funds are required to include the same hypothetical calculations about expenses in shareholder reports, you can use this information to compare the ongoing costs of investing in the fund with other funds. To do so, compare the 5% hypothetical example with the 5% hypothetical examples that appear in the shareholder reports of other funds. As you compare hypothetical examples of other funds, it is important to note that hypothetical examples are meant to highlight the ongoing costs of investing in a fund and do not reflect any transaction costs, such as sales charges, redemption fees or exchange fees.
05/01/08 – 10/31/08
| | | Account value at the
beginning of the period ($) | | Account value at the
end of the period ($) | | Expenses paid
during the period ($) | | Fund's annualized
expense ratio (%) | |
| | | Actual | | Hypothetical | | Actual | | Hypothetical | | Actual | | Hypothetical | | Actual | |
| Class A | | | 1,000.00 | | | | 1,000.00 | | | | 940.68 | | | | 1,020.91 | | | | 4.10 | | | | 4.27 | | | | 0.84 | | |
| Class B | | | 1,000.00 | | | | 1,000.00 | | | | 937.21 | | | | 1,017.14 | | | | 7.74 | | | | 8.06 | | | | 1.59 | | |
| Class C | | | 1,000.00 | | | | 1,000.00 | | | | 938.62 | | | | 1,018.65 | | | | 6.29 | | | | 6.55 | | | | 1.29 | | |
Expenses paid during the period are equal to the annualized expense ratio for the share class, multiplied by the average account value over the period, then multiplied by the number of days in the fund's most recent fiscal half-year and divided by 366.
Had the investment advisor and/or any of its affiliates not waived fees or reimbursed a portion of expenses, account value at the end of the period would have been reduced.
It is important to note that the expense amounts shown in the table are meant to highlight only ongoing costs of investing in the fund and do not reflect any transaction costs, such as sales charges, redemption fees or exchange fees. Therefore, the hypothetical examples provided may not help you determine the relative total costs of owning shares of different funds. If these transaction costs were included, your costs would have been higher.
4
Portfolio Manager's Report – Columbia Connecticut Tax-Exempt Fund
For the 12-month period that ended October 31, 2008, the fund's Class A shares returned negative 5.36% without sales charge. The fund's benchmark, the Barclays Capital Municipal Bond Index returned negative 3.30%.1 The average return of the fund's peer group, the Lipper Connecticut Municipal Debt Funds Classification, was negative 6.43%.2 The fund's shortfall to its benchmark was the result of two factors: the index is national in scope and it has less exposure than the fund to longer-term (20 to 30 years) and mid-to-lower quality sectors, which were underperformers during the period. We believe the fund outperformed its peer group average because it had less exposure to the longest maturity bonds and to weaker performing sectors.
Economic slowdown has sharp impact
A year ago, we anticipated an economic slowdown and an easing of inflationary pressures fed by high commodity prices and worldwide growth. But the intensity of the slowdown has been unexpectedly sharp. In hopes of reviving the economy, the Federal Reserve Board (the Fed) cut short-term interest rates aggressively while Congress passed a stimulus package to aid middle-class households.
Fallout from a widespread credit crisis caused municipal bonds to underperform Treasuries over this period. Sinking home values and waves of foreclosures began to shrink tax revenues and swell deficits for state and local governments. In addition, downgrades of municipal bond insurers dramatically reduced the number of AAA-rated3 municipal bonds. As a result, investors demanded higher yields for insured issues, which represent over half of the new issue market. Meanwhile, volatile markets forced some institutions to sell off their municipal bond holdings, especially hedge funds.
Amid this economic stress, the yield difference between higher and lower quality municipal bonds widened. The period's worst performance came in lower quality, long-maturity sectors where yields rose substantially. Skittish investors preferred to confine their commitments to better quality issues with maturities of five years or less, causing yields to decline and raising prices modestly for these bonds.
Lower and medium quality fund holdings and those with the longest maturities hurt results. We achieved better returns among intermediate-term prerefunded bonds, which are backed by escrowed government securities. Bonds of Puerto Rico, which are exempt from state and federal income taxes, also hurt returns. We attribute the fund's outperformance of its peer group to our smaller exposure to medium quality bonds and to bonds with the longest maturities.
1The Barclays Capital Municipal Bond Index is considered representative of the broad market for investment-grade, tax-exempt bonds with maturities of at least one year. Indices are not investments, do not incur fees or expenses and are not professionally managed. It is not possible to invest directly in an index. Securities in the fund may not match those in an index.
2Lipper Inc., a widely respected data provider in the industry, calculates an average total return (assuming reinvestment of distributions) for mutual funds with investment objectives similar to those of the fund. Lipper makes no adjustment for the effect of sales loads.
3The credit quality ratings represent those of Moody's Investors Service, Inc. ("Moody's"), Standard & Poor's Corporation ("S&P") or Fitch Ratings ("Fitch") credit ratings. The ratings represent their opinions as to the quality of the securities they rate. Ratings are relative and subjective and are not absolute standards of quality. The security's credit quality does not eliminate risk.
Performance data quoted represents past performance and current performance may be lower or higher. Past performance is no guarantee of future results. The investment return and principal value will fluctuate so that shares, when redeemed, may be worth more or less than the original cost. Please visit www.columbiafunds.com for daily and most recent month-end performance updates.
Net asset value per share
as of 10/31/08 ($)
| Class A | | | 6.95 | | |
| Class B | | | 6.95 | | |
| Class C | | | 6.95 | | |
Distributions declared per share
11/01/07 – 10/31/08 ($)
| Class A | | | 0.36 | | |
| Class B | | | 0.31 | | |
| Class C | | | 0.33 | | |
A portion of the fund's income may be subject to the alternative minimum tax. The fund may at times purchase tax-exempt securities at a discount. Some, or all, of this discount may be included in the fund's ordinary income, and is taxable when distributed. Distributions include $0.09 per share of taxable realized gains.
30-day SEC yields
as of 10/31/08 (%)
| Class A | | | 4.05 | | |
| Class B | | | 3.49 | | |
| Class C | | | 3.79 | | |
The 30-day SEC yields reflect the fund's earning power, net of expenses, expressed as an annualized percentage of the public offering price per share at the end of the period.
Taxable-equivalent SEC yields
as of 10/31/08 (%)
| Class A | | | 6.56 | | |
| Class B | | | 5.65 | | |
| Class C | | | 6.14 | | |
Taxable-equivalent SEC yields are based on the combined maximum effective 35.0% federal income tax rate and the applicable state income tax rate. These tax rates do not reflect the phase out of exemptions or the reduction of the otherwise allowable deductions that occur when adjusted gross income exceeds certain levels.
5
Portfolio Manager's Report (continued) – Columbia Connecticut Tax-Exempt Fund
Top 5 sectors
as of 10/31/08 (%)
| Local General Obligations | | | 27.9 | | |
| Education | | | 14.1 | | |
| Special Non-Property Tax | | | 10.8 | | |
| Prep School | | | 7.1 | | |
| Municipal Electric | | | 6.0 | | |
Quality breakdown
as of 10/31/08 (%)
| AAA | | | 32.3 | | |
| AA | | | 50.9 | | |
| A | | | 10.4 | | |
| BB | | | 1.5 | | |
| Non-rated | | | 3.2 | | |
| Cash & Equivalents | | | 1.7 | | |
Maturity breakdown
as of 10/31/08 (%)
| 1-3 years | | | 0.3 | | |
| 3-5 years | | | 8.3 | | |
| 5-7 years | | | 15.1 | | |
| 7-10 years | | | 16.1 | | |
| 10-15 years | | | 18.9 | | |
| 15-20 years | | | 20.6 | | |
| 20-25 years | | | 6.3 | | |
| 25 years and over | | | 12.7 | | |
| Cash & Equivalents | | | 1.7 | | |
Ratings shown in the quality breakdown represent the rating assigned to a particular bond by one of the following nationally-recognized rating agencies: Standard and Poor's, Moody's Investors Service, Inc. or Fitch Ratings Ltd. Ratings are relative and subjective and are not absolute standards of quality. The fund's credit quality does not remove market risk.
The fund is actively managed and the composition of its portfolio will change over time. Information provided is calculated as a percentage of net assets.
Connecticut feels recession impact
Connecticut may have been one of the first states to fall into recession. Payroll growth has stalled, higher unemployment has eaten into retail activity, and housing data—existing home sales and housing starts—continue to sag. Fairfield County, with its ties to Wall Street and the financial industry, has been especially hard hit. Manufacturing, including the state's aerospace industry, has slumped in tune with slowing worldwide demand.
Looking ahead, we believe that depressed home prices could soon attract buyers. New initiatives in alternative energy and biotech also offer potential to fuel renewed growth. However, we believe that the forces weighing on Connecticut's economy, including high living costs, heavy traffic and costly energy, will continue to hold back expansion and limit new investment.
A cautious, deliberate approach
A widening difference in yield between higher and lower quality securities of comparable maturities offers potential opportunities in bonds in the mid and lower quality tiers. However, we are being selective in our choice of securities because we do not believe that the challenges facing municipal issuers will dissipate quickly in light of the current economic slowdown. In this environment, we believe that short-term interest rates are likely to remain low and further stimulus moves are possible. Eventually, we believe that taxes may rise, making municipal bonds more attractive. However, we believe that continued stimulus programs could also trigger inflation over the longer-term, a potential negative for bond investors.
Portfolio holdings and characteristics are subject to change periodically and may not be representative of current holdings and characteristics. The outlook for the fund may differ from that presented for other Columbia Funds.
Tax-exempt investing offers current tax-exempt income, but it also involves special risks. The value of the fund will be affected by interest rate changes and the creditworthiness of issues held in the fund. When interest rates go up, bond prices generally drop and vice versa.
Interest income from certain tax-exempt bonds may be subject to certain state and local taxes and, if applicable, the alternative minimum tax. Capital gains are not exempt from income taxes.
Single-state municipal bond funds pose additional risks due to limited geographical diversification.
6
Investment Portfolio – Columbia Connecticut Tax-Exempt Fund
October 31, 2008
| Municipal Bonds – 95.0% | |
| | | Par ($) | | Value ($) | |
| Education – 21.2% | |
| Education – 14.1% | |
| CT Health & Educational Facilities Authority | |
| Connecticut College, | |
| Series 2002 E, | |
| Insured: MBIA | |
| 5.250% 07/01/22 | | | 400,000 | | | | 396,892 | | |
| Fairfield University, | |
| Series 2008 N, | |
| 4.750% 07/01/27 | | | 1,000,000 | | | | 871,250 | | |
| Quinnipiac University, | |
| Series 2007 I, | |
| Insured: MBIA | |
| 4.375% 07/01/28 | | | 1,015,000 | | | | 815,542 | | |
| Trinity College: | |
| Series 1998 F, | |
| Insured: MBIA | |
| 5.500% 07/01/21 | | | 2,000,000 | | | | 2,055,000 | | |
| Series 2007 J, | |
| Insured: MBIA: | |
| 4.250% 07/01/31 | | | 1,000,000 | | | | 776,580 | | |
| 4.500% 07/01/37 | | | 1,500,000 | | | | 1,176,720 | | |
| University of Connecticut, | |
| Series 2000 A, | |
| Insured: FGIC | |
| 5.250% 11/15/14 | | | 2,135,000 | | | | 2,246,383 | | |
| University of Hartford, | |
| Series 2002, | |
| Insured: RAD | |
| 5.375% 07/01/15 | | | 1,000,000 | | | | 992,470 | | |
| Yale University: | |
| Series 2003 X-1, | |
| 5.000% 07/01/42 | | | 2,000,000 | | | | 1,879,280 | | |
| Series 2007 Z-1, | |
| 5.000% 07/01/42 | | | 1,500,000 | | | | 1,409,460 | | |
| Education Total | | | 12,619,577 | | |
| Prep School – 7.1% | |
| CT Health & Educational Facilities Authority | |
| Brunswick School, | |
| Series 2003 B, | |
| Insured: MBIA | |
| 5.000% 07/01/33 | | | 670,000 | | | | 642,463 | | |
| Loomis Chaffee School: | |
| Series 2001 E, | |
| 5.250% 07/01/21 | | | 1,765,000 | | | | 1,738,419 | | |
| Series 2005 F, | |
| Insured: AMBAC: | |
| 5.250% 07/01/25 | | | 2,035,000 | | | | 2,034,837 | | |
| 5.250% 07/01/26 | | | 1,045,000 | | | | 1,043,725 | | |
| | | Par ($) | | Value ($) | |
| Miss Porter's School, | |
| Series 2006 B, | |
| Insured: AMBAC | |
| 5.000% 07/01/36 | | | 1,075,000 | | | | 966,651 | | |
| Prep School Total | | | 6,426,095 | | |
| Education Total | | | 19,045,672 | | |
| Health Care – 7.3% | |
| Hospitals – 4.3% | |
| CT Health & Educational Facilities Authority | |
| Danbury Hospital, | |
| Series 2006 H, | |
| Insured: AMBAC | |
| 4.500% 07/01/33 | | | 2,000,000 | | | | 1,297,560 | | |
| Middlesex Hospital, | |
| Series 2006 L, | |
| Insured: FSA | |
| 4.250% 07/01/36 | | | 1,000,000 | | | | 733,650 | | |
| William W. Backus Hospital, | |
| Series F 2005, | |
| Insured: FSA | |
| 5.125% 07/01/35 | | | 2,000,000 | | | | 1,817,740 | | |
| Hospitals Total | | | 3,848,950 | | |
| Intermediate Care Facilities – 0.8% | |
| CT Health & Educational Facilities Authority | |
| Village for Families & Children, Inc., | |
| Series 2002 A, | |
| Insured: AMBAC | |
| 5.000% 07/01/23 | | | 255,000 | | | | 205,265 | | |
| CT Housing Finance Authority | |
| Series 2000, | |
| Insured: AMBAC | |
| 5.850% 06/15/30 | | | 500,000 | | | | 481,575 | | |
| Intermediate Care Facilities Total | | | 686,840 | | |
| Nursing Homes – 2.2% | |
| CT Development Authority Health Facility | |
| Alzheimers Resources Center, Inc., | |
| Series 2007: | |
| 5.400% 08/15/21 | | | 500,000 | | | | 376,050 | | |
| 5.500% 08/15/27 | | | 2,375,000 | | | | 1,644,212 | | |
| Nursing Homes Total | | | 2,020,262 | | |
| Health Care Total | | | 6,556,052 | | |
See Accompanying Notes to Financial Statements.
7
Columbia Connecticut Tax-Exempt Fund
October 31, 2008
| Municipal Bonds (continued) | |
| | | Par ($) | | Value ($) | |
| Housing – 3.0% | |
| Multi-Family – 0.8% | |
| CT Greenwich Housing Authority | |
| Greenwich Close Apartments, | |
| Series 1997 A, | |
| 6.350% 09/01/27 | | | 750,000 | | | | 718,433 | | |
| Multi-Family Total | | | 718,433 | | |
| Single-Family – 2.2% | |
| CT Housing Finance Authority | |
| Series 2003 C-1, | |
| 4.850% 11/15/23 | | | 1,000,000 | | | | 924,220 | | |
| Series 2006, AMT, | |
| 4.875% 11/15/36 | | | 1,500,000 | | | | 1,061,595 | | |
| Single-Family Total | | | 1,985,815 | | |
| Housing Total | | | 2,704,248 | | |
| Other – 1.9% | |
| Refunded/Escrowed (a) – 1.9% | |
| CT Government | |
| Series 1993 B, | |
| Escrowed to Maturity, | |
| 5.400% 09/15/09 | | | 25,000 | | | | 25,814 | | |
| CT New Haven | |
| Series 2002 B, | |
| Escrowed to Maturity, | |
| Insured: FGIC | |
| 5.000% 11/01/16 | | | 10,000 | | | | 10,368 | | |
| Series 2002 C, | |
| Escrowed to Maturity, | |
| Insured: MBIA | |
| 5.000% 11/01/20 | | | 10,000 | | | | 10,188 | | |
| CT North Branford | |
| Series 2001, | |
| Pre-refunded 10/01/10, | |
| Insured: MBIA | |
| 5.000% 10/01/15 | | | 50,000 | | | | 52,976 | | |
PR Commonwealth of Puerto Rico Public
Finance Corp. | |
| Series 2002 E, | |
| Escrowed to Maturity, | |
| Insured: AMBAC | |
| 5.500% 08/01/27 | | | 1,500,000 | | | | 1,549,710 | | |
| Refunded/Escrowed Total | | | 1,649,056 | | |
| Other Total | | | 1,649,056 | | |
| | | Par ($) | | Value ($) | |
| Resource Recovery – 3.3% | |
| Disposal – 1.8% | |
| CT New Haven Solid Waste Authority | |
| Series 2008, | |
| 5.375% 06/01/28 | | | 1,750,000 | | | | 1,640,188 | | |
| Disposal Total | | | 1,640,188 | | |
| Resource Recovery – 1.5% | |
| CT Resource Recovery Authority | |
| American Re-Fuel Co., | |
| Series 2001 AII, AMT, | |
| 5.500% 11/15/15 | | | 1,500,000 | | | | 1,288,995 | | |
| Resource Recovery Total | | | 1,288,995 | | |
| Resource Recovery Total | | | 2,929,183 | | |
| Tax-Backed – 46.9% | |
| Local General Obligations – 27.9% | |
| CT Bridgeport | |
| Series 1997 A, | |
| Insured: MBIA | |
| 5.500% 08/15/19 | | | 1,500,000 | | | | 1,523,910 | | |
| Series 2004 C, | |
| Insured: MBIA | |
| 5.500% 08/15/21 | | | 1,225,000 | | | | 1,217,675 | | |
| CT Cheshire | |
| Series 2000 B, | |
| 5.000% 08/01/14 | | | 1,720,000 | | | | 1,843,324 | | |
| CT East Hartford | |
| Series 2003, | |
| Insured: FGIC | |
| 5.250% 05/01/15 | | | 1,000,000 | | | | 1,079,420 | | |
| CT East Haven | |
| Series 2003, | |
| Insured: MBIA | |
| 5.000% 09/01/15 | | | 640,000 | | | | 672,704 | | |
| CT Granby | |
| Series 1993, | |
| Insured: MBIA | |
| 6.550% 04/01/10 | | | 175,000 | | | | 185,029 | | |
| Series 2006, | |
| 5.000% 02/15/26 | | | 540,000 | | | | 560,293 | | |
| CT Hartford County Metropolitan District | |
| Series 1993: | |
| 5.200% 12/01/13 | | | 500,000 | | | | 536,315 | | |
| 5.625% 02/01/13 | | | 600,000 | | | | 645,756 | | |
See Accompanying Notes to Financial Statements.
8
Columbia Connecticut Tax-Exempt Fund
October 31, 2008
| Municipal Bonds (continued) | |
| | | Par ($) | | Value ($) | |
| CT New Britain | |
| Series 1993 A, | |
| Insured: MBIA | |
| 6.000% 10/01/12 | | | 2,000,000 | | | | 2,113,400 | | |
| Series 1993 B, | |
| Insured: MBIA | |
| 6.000% 03/01/12 | | | 1,000,000 | | | | 1,047,360 | | |
| Series 2006, | |
| Insured: AMBAC | |
| 5.000% 04/15/21 | | | 1,160,000 | | | | 1,175,451 | | |
| CT New Haven | |
| Series 2002 B, | |
| Insured: FGIC | |
| 5.000% 11/01/16 | | | 1,000,000 | | | | 1,026,350 | | |
| CT New Milford | |
| Series 2004, | |
| Insured: AMBAC | |
| 5.000% 01/15/17 | | | 1,025,000 | | | | 1,089,257 | | |
| CT North Haven | |
| Series 2007, | |
| 4.750% 07/15/26 | | | 1,150,000 | | | | 1,113,775 | | |
| CT Plainville | |
| Series 2002, | |
| Insured: FGIC: | |
| 5.000% 12/01/15 | | | 400,000 | | | | 412,212 | | |
| 5.000% 12/01/16 | | | 500,000 | | | | 512,000 | | |
| CT Stamford | |
| Series 2003 B, | |
| 5.250% 08/15/16 | | | 2,750,000 | | | | 2,997,143 | | |
| CT Suffield | |
| Series 2005, | |
| 5.000% 06/15/20 | | | 1,400,000 | | | | 1,439,228 | | |
| CT West Hartford | |
| Series 2005 B, | |
| 5.000% 10/01/24 | | | 1,500,000 | | | | 1,510,395 | | |
| CT Westbrook | |
| Series 1992, | |
| Insured: MBIA | |
| 6.300% 03/15/12 | | | 265,000 | | | | 291,023 | | |
| CT Westport | |
| Series 2003, | |
| 5.000% 08/15/15 | | | 1,000,000 | | | | 1,070,240 | | |
| | | Par ($) | | Value ($) | |
PR Commonwealth of Puerto Rico
Municipal Finance Agency | |
| Series 2002 A, | |
| Insured: FSA | |
| 5.250% 08/01/18 | | | 1,000,000 | | | | 1,002,780 | | |
| Local General Obligations Total | | | 25,065,040 | | |
| Special Non-Property Tax – 10.8% | |
| CT Special Tax Obligation Revenue | |
| Transportation Infrastructure: | |
| Series 2002 B, | |
| Insured: AMBAC | |
| 5.000% 12/01/21 | | | 1,500,000 | | | | 1,463,370 | | |
| Series 2004 B, | |
| Insured: AMBAC | |
| 5.250% 07/01/18 | | | 2,000,000 | | | | 2,130,940 | | |
PR Commonwealth of Puerto Rico
Highway & Transportation Authority | |
| Series 1993 X, | |
| Insured: FSA | |
| 5.500% 07/01/13 | | | 3,000,000 | | | | 3,119,460 | | |
| Series 2002 E, | |
| Insured: FSA | |
| 5.500% 07/01/21 | | | 1,000,000 | | | | 995,410 | | |
| Series 2005 L, | |
| Insured: AMBAC | |
| 5.250% 07/01/38 | | | 2,000,000 | | | | 1,645,860 | | |
PR Commonwealth of Puerto Rico
Infrastructure Financing Authority | |
| Series 2005 A, | |
| Insured: AMBAC | |
| (b) 07/01/35 | | | 2,000,000 | | | | 321,700 | | |
| Special Non-Property Tax Total | | | 9,676,740 | | |
| State Appropriated – 2.6% | |
| CT Juvenile Training School | |
| Series 2001, | |
| 4.750% 12/15/25 | | | 2,500,000 | | | | 2,343,675 | | |
| State Appropriated Total | | | 2,343,675 | | |
| State General Obligations – 5.6% | |
| CT State | |
| Series 2001 C, | |
| Insured: FSA | |
| 5.500% 12/15/15 | | | 1,500,000 | | | | 1,651,155 | | |
| Series 2001, | |
| Insured: FSA | |
| 5.500% 12/15/14 | | | 1,500,000 | | | | 1,648,620 | | |
See Accompanying Notes to Financial Statements.
9
Columbia Connecticut Tax-Exempt Fund
October 31, 2008
| Municipal Bonds (continued) | |
| | | Par ($) | | Value ($) | |
| Series 2005 B, | |
| Insured: AMBAC | |
| 5.250% 06/01/20 | | | 400,000 | | | | 416,124 | | |
| PR Commonwealth of Puerto Rico | |
| Public Improvement, | |
| Series 2001, | |
| Insured: FSA | |
| 5.500% 07/01/16 | | | 1,250,000 | | | | 1,297,362 | | |
| State General Obligations Total | | | 5,013,261 | | |
| Tax-Backed Total | | | 42,098,716 | | |
| Transportation – 0.6% | |
| Transportation – 0.6% | |
| CT New Haven Air Rights Parking Facility | |
| Series 2002, | |
| Insured: AMBAC | |
| 5.375% 12/01/15 | | | 500,000 | | | | 517,890 | | |
| Transportation Total | | | 517,890 | | |
| Transportation Total | | | 517,890 | | |
| Utilities – 10.8% | |
| Municipal Electric – 6.0% | |
PR Commonwealth of Puerto Rico
Electric Power Authority | |
| Series 2002 JJ, | |
| Insured: MBIA | |
| 5.250% 07/01/15 | | | 2,000,000 | | | | 1,988,760 | | |
| Series 2002 KK, | |
| Insured: MBIA | |
| 5.500% 07/01/15 | | | 1,000,000 | | | | 1,008,240 | | |
| Series 2003 NN, | |
| Insured: MBIA | |
| 5.250% 07/01/19 | | | 2,500,000 | | | | 2,379,150 | | |
| Municipal Electric Total | | | 5,376,150 | | |
| Water & Sewer – 4.8% | |
CT Greater New Haven Water Pollution
Control Authority | |
| Series 2008, | |
| Insured: FSA | |
| 4.750% 11/15/28 | | | 600,000 | | | | 545,076 | | |
| CT South Central Regional Water Authority | |
| Series 2005, | |
| Insured: MBIA | |
| 5.000% 08/01/30 | | | 1,870,000 | | | | 1,749,815 | | |
| | | Par ($) | | Value ($) | |
| Series 2007 A, | |
| Insured: MBIA: | |
| 5.250% 08/01/23 | | | 1,000,000 | | | | 1,005,020 | | |
| 5.250% 08/01/24 | | | 1,000,000 | | | | 1,000,980 | | |
| Water & Sewer Total | | | 4,300,891 | | |
| Utilities Total | | | 9,677,041 | | |
Total Municipal Bonds
(cost of $91,797,008) | | | 85,177,858 | | |
| Investment Company – 0.5% | |
| | | Shares | | | |
Dreyfus Municipal Cash
Management Plus
(7 day yield of 2.260%) | | | 432,900 | | | | 432,900 | | |
Total Investment Company
(cost of $432,900) | | | 432,900 | | |
| Short-Term Obligation – 0.2% | |
| | | Par ($) | | | |
| Variable Rate Demand Note (c) – 0.2% | |
| CA Department of Water Resources | |
| Series 2005 F-5, | |
| LOC: Citibank N.A. | |
| 0.900% 05/01/22 | | | 200,000 | | | | 200,000 | | |
| Variable Rate Demand Note Total | | | 200,000 | | |
Total Short-Term Obligation
(cost of $200,000) | | | 200,000 | | |
Total Investments – 95.7%
(cost of $92,429,908) (d) | | | 85,810,758 | | |
| Other Assets & Liabilities, Net – 4.3% | | | 3,879,931 | | |
| Net Assets – 100.0% | | | 89,690,689 | | |
Notes to Investment Portfolio:
(a) The Fund has been informed that each issuer has placed direct obligations of the U.S. Government in an irrevocable trust, solely for the payment of principal and interest.
(b) Zero coupon bond.
(c) This security is payable upon demand and secured by letters of credit or other credit support agreements from banks. The interest rate changes periodically and the interest rate shown reflect the rate at October 31, 2008.
(d) Cost for federal income tax purposes is $92,406,304.
See Accompanying Notes to Financial Statements.
10
Columbia Connecticut Tax-Exempt Fund
October 31, 2008
At October 31, 2008, the composition of the Fund by revenue source is as follows:
| Holdings By Revenue Source (Unaudited) | | % of
Net Assets | |
| Tax-Backed | | | 46.9 | | |
| Education | | | 21.2 | | |
| Utilities | | | 10.8 | | |
| Health Care | | | 7.3 | | |
| Resource Recovery | | | 3.3 | | |
| Housing | | | 3.0 | | |
| Other | | | 1.9 | | |
| Transportation | | | 0.6 | | |
| | | | 95.0 | | |
| Investment Company | | | 0.5 | | |
| Short-Term Obligation | | | 0.2 | | |
| Other Assets & Liabilities, Net | | | 4.3 | | |
| | | | 100.0 | | |
| Acronym | | Name | |
| AMBAC | | Ambac Assurance Corp. | |
|
| AMT | | Alternative Minimum Tax | |
|
| FGIC | | Financial Guaranty Insurance Co. | |
|
| FSA | | Financial Security Assurance, Inc. | |
|
| LOC | | Letter of Credit | |
|
| MBIA | | MBIA Insurance Corp. | |
|
| RAD | | Radian Asset Assurance, Inc. | |
|
See Accompanying Notes to Financial Statements.
11
Statement of Assets and Liabilities – Columbia Connecticut Tax-Exempt Fund
October 31, 2008
| Assets | | Investments, at cost | | $ | 92,429,908 | | |
| | | Investments, at value | | $ | 85,810,758 | | |
| | | Cash | | | 864,086 | | |
| | | Receivable for: | | | | | |
| | | Investments sold | | | 1,999,915 | | |
| | | Fund shares sold | | | 64,818 | | |
| | | Interest | | | 1,410,192 | | |
| | | Expense reimbursement due from investment advisor | | | 6,767 | | |
| | | Trustees' deferred compensation plan | | | 22,042 | | |
| | | Other assets | | | 216 | | |
| | | Total Assets | | | 90,178,794 | | |
| Liabilities | | Payable for: | | | | | |
| | | Fund shares repurchased | | | 208,177 | | |
| | | Distributions | | | 111,355 | | |
| | | Investment advisory fee | | | 38,685 | | |
| | | Transfer agent fee | | | 13,326 | | |
| | | Pricing and bookkeeping fees | | | 6,073 | | |
| | | Trustees' fees | | | 143 | | |
| | | Audit fee | | | 33,800 | | |
| | | Custody fee | | | 1,166 | | |
| | | Distribution and service fees | | | 29,761 | | |
| | | Chief compliance officer expenses | | | 53 | | |
| | | Trustees' deferred compensation plan | | | 22,042 | | |
| | | Other liabilities | | | 23,524 | | |
| | | Total Liabilities | | | 488,105 | | |
| | | Net Assets | | | 89,690,689 | | |
| Net Assets Consist of | | Paid-in capital | | | 95,842,758 | | |
| | | Undistributed net investment income | | | 266,768 | | |
| | | Accumulated net realized gain | | | 200,313 | | |
| | | Net unrealized depreciation on investments | | | (6,619,150 | ) | |
| | | Net Assets | | | 89,690,689 | | |
| Class A | | Net assets | | $ | 67,265,337 | | |
| | | Shares outstanding | | | 9,672,160 | | |
| | | Net asset value per share | | $ | 6.95 | (a) | |
| | | Maximum sales charge | | | 4.75 | % | |
| | | Maximum offering price per share ($6.95/0.9525) | | $ | 7.30 | (b) | |
| Class B | | Net assets | | $ | 10,860,276 | | |
| | | Shares outstanding | | | 1,561,624 | | |
| | | Net asset value and offering price per share | | $ | 6.95 | (a) | |
| Class C | | Net assets | | $ | 11,565,076 | | |
| | | Shares outstanding | | | 1,662,969 | | |
| | | Net asset value and offering price per share | | $ | 6.95 | (a) | |
(a) Redemption price per share is equal to net asset value less any applicable contingent deferred sales charge.
(b) On sales of $50,000 or more the offering price is reduced.
See Accompanying Notes to Financial Statements.
12
Statement of Operations – Columbia Connecticut Tax-Exempt Fund
For the Year Ended October 31, 2008
| | | | | ($) | |
| Investment Income | | Interest | | | 4,772,991 | | |
| | | Dividends | | | 15,508 | | |
| | | Total Investment Income | | | 4,788,499 | | |
| Expenses | | Investment advisory fee | | | 524,477 | | |
| | | Distribution fee: | | | | | |
| | | Class B | | | 103,338 | | |
| | | Class C | | | 92,776 | | |
| | | Service fee: | | | | | |
| | | Class A | | | 188,383 | | |
| | | Class B | | | 32,873 | | |
| | | Class C | | | 29,621 | | |
| | | Transfer agent fee | | | 40,861 | | |
| | | Pricing and bookkeeping fees | | | 64,845 | | |
| | | Trustees' fees | | | 17,938 | | |
| | | Custody fee | | | 8,043 | | |
| | | Chief compliance officer expenses | | | 635 | | |
| | | Other expenses | | | 134,693 | | |
| | | Total Expenses | | | 1,238,483 | | |
| | | Fees waived or expenses reimbursed by investment advisor | | | (160,592 | ) | |
| | | Fees waived by distributor—Class C | | | (37,126 | ) | |
| | | Expense reductions | | | (1,529 | ) | |
| | | Net Expenses | | | 1,039,236 | | |
| | | Net Investment Income | | | 3,749,263 | | |
| | | Net realized gain on: | | | | | |
| | | Investments | | | 499,536 | | |
Net Realized and Unrealized
Gain (Loss) on Investments and
Futures Contracts | |
| | | Futures contracts | | | 61,389 | | |
| | | Net realized gain | | | 560,925 | | |
| | | Net change in unrealized appreciation (depreciation) on: | | | | | |
| | | Investments | | | (9,598,231 | ) | |
| | | Futures contracts | | | (20,720 | ) | |
| | | Net change in unrealized appreciation (depreciation) | | | (9,618,951 | ) | |
| | | Net Loss | | | (9,058,026 | ) | |
| | | Net Decrease Resulting from Operations | | | (5,308,763 | ) | |
See Accompanying Notes to Financial Statements.
13
Statement of Changes in Net Assets – Columbia Connecticut Tax-Exempt Fund
| | | | | Year Ended October 31, | |
| Increase (Decrease) in Net Assets | | | | 2008 ($) | | 2007 ($) | |
| Operations | | Net investment income | | | 3,749,263 | | | | 4,031,548 | | |
| | | Net realized gain on investments and futures contracts | | | 560,925 | | | | 1,142,284 | | |
| | | Net change in unrealized appreciation (depreciation) on
investments and futures contracts | | | (9,618,951 | ) | | | (3,126,182 | ) | |
| | | Net Increase (Decrease) Resulting from Operations | | | (5,308,763 | ) | | | 2,047,650 | | |
| Distributions to Shareholders | | From net investment income: | | | | | | | | | |
| | | Class A | | | (2,926,539 | ) | | | (3,028,284 | ) | |
| | | Class B | | | (408,528 | ) | | | (584,055 | ) | |
| | | Class C | | | (404,081 | ) | | | (412,247 | ) | |
| | | From net realized gains: | | | | | | | | | |
| | | Class A | | | (917,387 | ) | | | (946,187 | ) | |
| | | Class B | | | (179,705 | ) | | | (268,780 | ) | |
| | | Class C | | | (143,822 | ) | | | (149,496 | ) | |
| | | Total Distributions to Shareholders | | | (4,980,062 | ) | | | (5,389,049 | ) | |
| | | Net Capital Share Transactions | | | (14,287,061 | ) | �� | | (9,175,892 | ) | |
| | | Total Decrease in Net Assets | | | (24,575,886 | ) | | | (12,517,291 | ) | |
| Net Assets | | Beginning of period | | | 114,266,575 | | | | 126,783,866 | | |
| | | End of period | | | 89,690,689 | | | | 114,266,575 | | |
| | | Undistributed net investment income at end of period | | | 266,768 | | | | 285,948 | | |
See Accompanying Notes to Financial Statements.
14
Statement of Changes in Net Assets (continued) – Capital Stock Activity
| | | Year Ended October 31, | |
| | | 2008 | | 2007 | |
| | | Shares | | Dollars ($) | | Shares | | Dollars ($) | |
| Class A | |
| Subscriptions | | | 610,845 | | | | 4,564,564 | | | | 1,338,394 | | | | 10,275,047 | | |
| Distributions reinvested | | | 354,270 | | | | 2,649,306 | | | | 337,680 | | | | 2,620,668 | | |
| Redemptions | | | (2,239,346 | ) | | | (16,546,937 | ) | | | (1,825,289 | ) | | | (14,148,553 | ) | |
| Net Decrease | | | (1,274,231 | ) | | | (9,333,067 | ) | | | (149,215 | ) | | | (1,252,838 | ) | |
| Class B | |
| Subscriptions | | | 36,717 | | | | 272,456 | | | | 44,175 | | | | 342,619 | | |
| Distributions reinvested | | | 46,527 | | | | 348,837 | | | | 66,949 | | | | 520,625 | | |
| Redemptions | | | (731,158 | ) | | | (5,483,520 | ) | | | (1,067,796 | ) | | | (8,253,790 | ) | |
| Net Decrease | | | (647,914 | ) | | | (4,862,227 | ) | | | (956,672 | ) | | | (7,390,546 | ) | |
| Class C | |
| Subscriptions | | | 273,434 | | | | 2,031,391 | | | | 237,987 | | | | 1,854,490 | | |
| Distributions reinvested | | | 38,569 | | | | 288,570 | | | | 43,807 | | | | 340,249 | | |
| Redemptions | | | (321,759 | ) | | | (2,411,728 | ) | | | (349,952 | ) | | | (2,727,247 | ) | |
| Net Decrease | | | (9,756 | ) | | | (91,767 | ) | | | (68,158 | ) | | | (532,508 | ) | |
See Accompanying Notes to Financial Statements.
15
Financial Highlights – Columbia Connecticut Tax-Exempt Fund
Selected data for a share outstanding throughout each period is as follows:
| | | Year Ended October 31, | |
| Class A Shares | | 2008 | | 2007 | | 2006 | | 2005 | | 2004 | |
| Net Asset Value, Beginning of Period | | $ | 7.71 | | | $ | 7.92 | | | $ | 7.91 | | | $ | 8.19 | | | $ | 8.21 | | |
| Income from Investment Operations: | |
| Net investment income (a) | | | 0.28 | | | | 0.28 | | | | 0.29 | | | | 0.29 | | | | 0.29 | | |
Net realized and unrealized gain (loss) on investments
and futures contracts | | | (0.68 | ) | | | (0.12 | ) | | | 0.11 | | | | (0.23 | ) | | | 0.10 | | |
| Total from Investment Operations | | | (0.40 | ) | | | 0.16 | | | | 0.40 | | | | 0.06 | | | | 0.39 | | |
| Less Distributions to Shareholders: | |
| From net investment income | | | (0.27 | ) | | | (0.28 | ) | | | (0.28 | ) | | | (0.29 | ) | | | (0.29 | ) | |
| From net realized gains | | | (0.09 | ) | | | (0.09 | ) | | | (0.11 | ) | | | (0.05 | ) | | | (0.12 | ) | |
| Total Distributions to Shareholders | | | (0.36 | ) | | | (0.37 | ) | | | (0.39 | ) | | | (0.34 | ) | | | (0.41 | ) | |
| Net Asset Value, End of Period | | $ | 6.95 | | | $ | 7.71 | | | $ | 7.92 | | | $ | 7.91 | | | $ | 8.19 | | |
| Total return (b)(c) | | | (5.36 | )% | | | 2.03 | % | | | 5.25 | % | | | 0.72 | % | | | 4.91 | % | |
| Ratios to Average Net Assets/Supplemental Data: | |
| Net expenses (d) | | | 0.84 | % | | | 0.84 | % | | | 0.84 | % | | | 0.84 | % | | | 0.83 | % | |
| Waiver/Reimbursement | | | 0.15 | % | | | 0.13 | % | | | 0.16 | % | | | 0.09 | % | | | 0.09 | % | |
| Net investment income (d) | | | 3.73 | % | | | 3.61 | % | | | 3.67 | % | | | 3.63 | % | | | 3.60 | % | |
| Portfolio turnover rate | | | 10 | % | | | 14 | % | | | 13 | % | | | 9 | % | | | 9 | % | |
| Net assets, end of period (000's) | | $ | 67,265 | | | $ | 84,351 | | | $ | 87,906 | | | $ | 98,063 | | | $ | 106,661 | | |
(a) Per share data was calculated using the average shares outstanding during the period.
(b) Total return at net asset value assuming all distributions reinvested and no initial sales charge or contingent deferred sales charge.
(c) Had the investment advisor and/or any of its affiliates not waived fees or reimbursed a portion of expenses, total return would have been reduced.
(d) The benefits derived from expense reductions had an impact of less than 0.01%.
See Accompanying Notes to Financial Statements.
16
Financial Highlights – Columbia Connecticut Tax-Exempt Fund
Selected data for a share outstanding throughout each period is as follows:
| | | Year Ended October 31, | |
| Class B Shares | | 2008 | | 2007 | | 2006 | | 2005 | | 2004 | |
| Net Asset Value, Beginning of Period | | $ | 7.71 | | | $ | 7.92 | | | $ | 7.91 | | | $ | 8.19 | | | $ | 8.21 | | |
| Income from Investment Operations: | |
| Net investment income (a) | | | 0.22 | | | | 0.22 | | | | 0.23 | | | | 0.23 | | | | 0.23 | | |
Net realized and unrealized gain (loss) on investments
and futures contracts | | | (0.67 | ) | | | (0.12 | ) | | | 0.11 | | | | (0.23 | ) | | | 0.10 | | |
| Total from Investment Operations | | | (0.45 | ) | | | 0.10 | | | | 0.34 | | | | — | | | | 0.33 | | |
| Less Distributions to Shareholders: | |
| From net investment income | | | (0.22 | ) | | | (0.22 | ) | | | (0.22 | ) | | | (0.23 | ) | | | (0.23 | ) | |
| From net realized gains | | | (0.09 | ) | | | (0.09 | ) | | | (0.11 | ) | | | (0.05 | ) | | | (0.12 | ) | |
| Total Distributions to Shareholders | | | (0.31 | ) | | | (0.31 | ) | | | (0.33 | ) | | | (0.28 | ) | | | (0.35 | ) | |
| Net Asset Value, End of Period | | $ | 6.95 | | | $ | 7.71 | | | $ | 7.92 | | | $ | 7.91 | | | $ | 8.19 | | |
| Total return (b)(c) | | | (6.07 | )% | | | 1.27 | % | | | 4.47 | % | | | (0.03 | )% | | | 4.13 | % | |
| Ratios to Average Net Assets/Supplemental Data: | |
| Net expenses (d) | | | 1.59 | % | | | 1.59 | % | | | 1.59 | % | | | 1.59 | % | | | 1.58 | % | |
| Waiver/Reimbursement | | | 0.15 | % | | | 0.13 | % | | | 0.16 | % | | | 0.09 | % | | | 0.09 | % | |
| Net investment income (d) | | | 2.98 | % | | | 2.86 | % | | | 2.93 | % | | | 2.88 | % | | | 2.84 | % | |
| Portfolio turnover rate | | | 10 | % | | | 14 | % | | | 13 | % | | | 9 | % | | | 9 | % | |
| Net assets, end of period (000's) | | $ | 10,860 | | | $ | 17,026 | | | $ | 25,085 | | | $ | 34,784 | | | $ | 46,271 | | |
(a) Per share data was calculated using the average shares outstanding during the period.
(b) Total return at net asset value assuming all distributions reinvested and no contingent deferred sales charge.
(c) Had the investment advisor and/or any of its affiliates not waived fees or reimbursed a portion of expenses, total return would have been reduced.
(d) The benefits derived from expense reductions had an impact of less than 0.01%.
See Accompanying Notes to Financial Statements.
17
Financial Highlights – Columbia Connecticut Tax-Exempt Fund
Selected data for a share outstanding throughout each period is as follows:
| | | Year Ended October 31, | |
| Class C Shares | | 2008 | | 2007 | | 2006 | | 2005 | | 2004 | |
| Net Asset Value, Beginning of Period | | $ | 7.71 | | | $ | 7.92 | | | $ | 7.91 | | | $ | 8.19 | | | $ | 8.21 | | |
| Income from Investment Operations: | |
| Net investment income (a) | | | 0.25 | | | | 0.24 | | | | 0.25 | | | | 0.26 | | | | 0.26 | | |
Net realized and unrealized gain (loss) on investments
and futures contracts | | | (0.68 | ) | | | (0.12 | ) | | | 0.12 | | | | (0.24 | ) | | | 0.10 | | |
| Total from Investment Operations | | | (0.43 | ) | | | 0.12 | | | | 0.37 | | | | 0.02 | | | | 0.36 | | |
| Less Distributions to Shareholders: | |
| From net investment income | | | (0.24 | ) | | | (0.24 | ) | | | (0.25 | ) | | | (0.25 | ) | | | (0.26 | ) | |
| From net realized gains | | | (0.09 | ) | | | (0.09 | ) | | | (0.11 | ) | | | (0.05 | ) | | | (0.12 | ) | |
| Total Distributions to Shareholders | | | (0.33 | ) | | | (0.33 | ) | | | (0.36 | ) | | | (0.30 | ) | | | (0.38 | ) | |
| Net Asset Value, End of Period | | $ | 6.95 | | | $ | 7.71 | | | $ | 7.92 | | | $ | 7.91 | | | $ | 8.19 | | |
| Total return (b)(c) | | | (5.79 | )% | | | 1.57 | % | | | 4.78 | % | | | 0.27 | % | | | 4.44 | % | |
| Ratios to Average Net Assets/Supplemental Data: | |
| Net expenses (d) | | | 1.29 | % | | | 1.29 | % | | | 1.29 | % | | | 1.29 | % | | | 1.28 | % | |
| Waiver/Reimbursement | | | 0.45 | % | | | 0.43 | % | | | 0.46 | % | | | 0.39 | % | | | 0.39 | % | |
| Net investment income (d) | | | 3.28 | % | | | 3.16 | % | | | 3.23 | % | | | 3.18 | % | | | 3.15 | % | |
| Portfolio turnover rate | | | 10 | % | | | 14 | % | | | 13 | % | | | 9 | % | | | 9 | % | |
| Net assets, end of period (000's) | | $ | 11,565 | | | $ | 12,890 | | | $ | 13,792 | | | $ | 19,585 | | | $ | 24,764 | | |
(a) Per share data was calculated using the average shares outstanding during the period.
(b) Total return at net asset value assuming all distributions reinvested and no contingent deferred sales charge.
(c) Had the investment advisor and/or any of its affiliates not waived fees or reimbursed a portion of expenses, total return would have been reduced.
(d) The benefits derived from expense reductions had an impact of less than 0.01%.
See Accompanying Notes to Financial Statements.
18
Notes to Financial Statements – Columbia Connecticut Tax-Exempt Fund
October 31, 2008
Note 1. Organization
Columbia Connecticut Tax-Exempt Fund (the "Fund"), a series of Columbia Funds Series Trust I (the "Trust"), is a diversified portfolio. The Trust is a Massachusetts business trust registered under the Investment Company Act of 1940, as amended (the "1940 Act"), as an open-end management investment company.
Investment Objective
The Fund seeks total return, consisting of current income exempt from federal income tax and Connecticut individual income tax and of capital appreciation, consistent with moderate fluctuation of principal.
Fund Shares
The Trust may issue an unlimited number of shares, and the Fund offers three classes of shares: Class A, Class B and Class C. Each share class has its own expense structure and sales charges, as applicable.
Class A shares are subject to a maximum front-end sales charge of 4.75% based on the amount of initial investment. Class A shares purchased without an initial sales charge in accounts aggregating $1 million to $50 million at the time of purchase are subject to a 1.00% contingent deferred sales charge ("CDSC") if the shares are sold within one year after purchase. Class B shares are subject to a maximum CDSC of 5.00% based upon the holding period after purchase. Class B shares will convert to Class A shares eight years after purchase. Class C shares are subject to a 1.00% CDSC on shares sold within one year after purchase.
Note 2. Significant Accounting Policies
The preparation of financial statements in accordance with accounting principles generally accepted in the United States of America ("GAAP") requires management to make certain estimates and assumptions that affect the reported amounts of assets and liabilities, the disclosure of contingent assets and liabilities at the date of the financial statements and the reported amounts of revenue and expenses during the reporting period. Actual results could differ from those estimates. The following is a summary of significant accounting policies consistently followed by the Fund in the preparation of its financial statements.
Security Valuation
Debt securities generally are valued by pricing services approved by the Trust's Board of Trustees, based upon market transactions for normal, institutional-size trading units of similar securities. The services may use various pricing techniques which take into account appropriate factors such as yield, quality, coupon rate, maturity, type of issue, trading characteristics and other data, as well as broker quotes. Debt securities for which quotations are readily available are valued at an over-the-counter or exchange bid quotation.
Certain debt securities, which tend to be more thinly traded and of lesser quality, are priced based on fundamental analysis of the financial condition of the issuer and the estimated value of any collateral. Valuations developed through pricing techniques may vary from the actual amounts realized upon sale of the securities, and the potential variation may be greater for those securities valued using fundamental analysis.
Short-term debt obligations maturing within 60 days are valued at amortized cost, which approximates market value.
Investments in other open-end investment companies are valued at net asset value.
Futures contracts are valued at the settlement price established each day by the board of trade or exchange on which they are traded.
Investments for which market quotations are not readily available, or that have quotations which management believes are not reliable, are valued at fair value as determined in good faith under consistently applied procedures established by and under the general supervision of the Board of Trustees. If a security is valued at fair value, such value is likely to be different from the last quoted market price for the security.
In September 2006, Statement of Financial Accounting Standards No. 157, Fair Value Measurements ("SFAS 157"), was issued. SFAS 157 is effective for fiscal years beginning after November 15, 2007. SFAS 157 defines fair value, establishes a framework for measuring fair value and expands disclosures about fair value measurements. Management is evaluating the impact the application of SFAS 157 will have on the Fund's financial statement disclosures.
19
Columbia Connecticut Tax-Exempt Fund, October 31, 2008
Security Transactions
Security transactions are accounted for on the trade date. Cost is determined and gains (losses) are based upon the specific identification method for both financial statement and federal income tax purposes.
In March 2008, Statement of Financial Accounting Standards No. 161, Disclosures about Derivative Instruments and Hedging Activities-an amendment of FASB Statement No. 133 ("SFAS 161"), was issued. SFAS 161 is effective for fiscal years and interim periods beginning after November 15, 2008. SFAS 161 requires additional discussion about the reporting entity's derivative instruments and hedging activities, by providing for qualitative disclosures about the objectives and strategies for using derivatives, quantitative data about the fair value of and gains and losses on derivative contracts, and details of credit-risk-related contingent features in their hedged positions. Management is evaluating the impact the application of SFAS 161 will have on the Fund's financial statement disclo sures.
Futures Contracts
The Fund may invest in futures for both hedging and non-hedging purposes, including, for example, to seek enhanced returns or as a substitute for a position in an underlying asset.
The use of futures contracts involves certain risks, which include: (1) imperfect correlation between the price movement of the instruments and the underlying securities, (2) inability to close out positions due to differing trading hours, or the temporary absence of a liquid market, for either the instruments or the underlying securities, or (3) an inaccurate prediction of the future direction of interest rates by Columbia Management Advisors, LLC ("Columbia"), the Fund's investment advisor. Any of these risks may involve amounts exceeding the variation margin recorded in the Fund's Statement of Assets and Liabilities at any given time.
Upon entering into a futures contract, the Fund pledges cash or securities with the broker in an amount sufficient to meet the initial margin requirement. Subsequent payments are made or received by the Fund equal to the daily change in the contract value and are recorded as variation margin receivable or payable and offset in unrealized gains or losses. The Fund recognizes a realized gain or loss when the contract is closed or expires.
Income Recognition
Interest income is recorded on the accrual basis. Premium and discount are amortized and accreted, respectively, on all debt securities, unless otherwise noted. Original issue discount is accreted to interest income over the life of the security with a corresponding increase in the cost basis. Dividend income is recorded on the ex-date.
Expenses
General expenses of the Trust are allocated to the Fund and the other series of the Trust based upon relative net assets or other expense allocation methodologies determined by the nature of the expense. Expenses directly attributable to the Fund are charged to the Fund.
Determination of Class Net Asset Value
All income, expenses (other than class-specific expenses, as shown on the Statement of Operations) and realized and unrealized gains (losses) are allocated to each class of the Fund on a daily basis for purposes of determining the net asset value of each class. Income and expenses are allocated to each class based on the settled shares method, while realized and unrealized gains (losses) are allocated based on the relative net assets of each class.
Federal Income Tax Status
The Fund intends to qualify each year as a "regulated investment company" under Subchapter M of the Internal Revenue Code, as amended, and will distribute substantially all of its tax exempt or taxable income, if any, for its tax year, and as such will not be subject to federal income taxes. In addition, the Fund intends to distribute in each calendar year substantially all of its net investment income, capital gains and certain other amounts, if any, such that the Fund should not be subject to federal excise tax. Therefore, no federal income or excise tax provision is recorded.
Distributions to Shareholders
Distributions from net investment income are declared daily and distributed monthly. Net realized capital gains, if any, are distributed at least annually. Income distributions and capital gain distributions are determined in accordance with federal income tax regulations which may differ from GAAP.
20
Columbia Connecticut Tax-Exempt Fund, October 31, 2008
Indemnification
In the normal course of business, the Fund enters into contracts that contain a variety of representations and warranties and which provide general indemnities. The Fund's maximum exposure under these arrangements is unknown because this would involve future claims against the Fund. Also, under the Trust's organizational documents and by contract, the Trustees and officers of the Trust are indemnified against certain liabilities that may arise out of actions relating to their duties to the Trust. However, based on experience, the Fund expects the risk of loss due to these representations, warranties and indemnities to be minimal.
Note 3. Federal Tax Information
The timing and character of income and capital gain distributions are determined in accordance with income tax regulations, which may differ from GAAP. Reclassifications are made to the Fund's capital accounts for permanent tax differences to reflect income and gains available for distribution (or available capital loss carryforwards) under income tax regulations.
For the year ended October 31, 2008, permanent book and tax basis differences resulting primarily from differing treatments for market discount reclassification and discount accretion/premium amortization on debt instruments were identified and reclassified among the components of the Fund's net assets as follows:
Undistributed
Net Investment
Income | | Accumulated
Net Realized
Gain | | Paid-In Capital | |
| $ | (29,295 | ) | | $ | (47,944 | ) | | $ | 77,239 | | |
Net investment income and net realized gains (losses), as disclosed on the Statement of Operations, and net assets were not affected by this reclassification.
The tax character of distributions paid during the years ended October 31, 2008 and October 31, 2007 was as follows:
| | | October 31, | |
| | | 2008 | | 2007 | |
| Tax-Exempt Income | | $ | 3,739,148 | | | $ | 4,022,563 | | |
| Ordinary Income* | | | 72,275 | | | | 2,023 | | |
| Long-Term Capital Gains | | | 1,168,639 | | | | 1,364,463 | | |
* For tax purposes short-term capital gain distributions, if any, are considered ordinary income distributions.
As of October 31, 2008, the components of distributable earnings on a tax basis were as follows:
Undistributed
Tax-Exempt
Income | | Undistributed
Long-Term
Capital Gains | | Net Unrealized
Depreciation* | |
| $ | 384,549 | | | $ | 252,127 | | | $ | (6,595,546 | ) | |
* The differences between book-basis and tax-basis net unrealized appreciation/depreciation are primarily due to discount accretion/premium amortization on debt securities.
Unrealized appreciation and depreciation at October 31, 2008, based on cost of investments for federal income tax purposes, were:
| Unrealized appreciation | | $ | 648,196 | | |
| Unrealized depreciation | | | (7,243,742 | ) | |
| Net unrealized depreciation | | $ | (6,595,546 | ) | |
The Fund adopted Financial Accounting Standards Board ("FASB") Interpretation No. 48, Accounting for Uncertainty in Income Taxes—an Interpretation of FASB Statement No. 109 ("FIN 48"), effective April 30, 2008. FIN 48 requires management to determine whether a tax position of the Fund is more likely than not to be sustained upon examination by the applicable taxing authority, including resolution of any related appeals or litigation processes, based on the technical merits of the position. The tax benefit to be recognized is measured as the largest amount of benefit that is greater than fifty percent likely of being realized upon ultimate settlement. FIN 48 was applied to all existing tax positions upon initial adoption. Management has evaluated the known implications of FIN 48 on its computation of net assets for the Fund. As a
21
Columbia Connecticut Tax-Exempt Fund, October 31, 2008
result of this evaluation, management has concluded that FIN 48 did not have any effect on the Fund's financial statements and no cumulative effect adjustments were recorded. However, management's conclusions regarding FIN 48 may be subject to review and adjustment at a later date based on factors including, but not limited to, further implementation guidance from the FASB, new tax laws, regulations, and administrative interpretations (including relevant court decisions). The Fund's federal tax returns for the prior three fiscal years remain subject to examination by the Internal Revenue Service. The Fund is not aware of any tax positions for which it is reasonably possible that the total amounts of unrecognized tax benefits will significantly change in the next twelve months.
Note 4. Fees and Compensation Paid to Affiliates
Investment Advisory Fee
Columbia, an indirect, wholly owned subsidiary of Bank of America Corporation ("BOA"), provides investment advisory, administrative and other services to the Fund. Columbia receives a monthly investment advisory fee based on the Fund's pro-rata portion of the combined average daily net assets of the Fund, Columbia California Tax-Exempt Fund, Columbia Massachusetts Tax-Exempt Fund and Columbia New York Tax-Exempt Fund as follows:
| Combined Average Daily Net Assets | | Annual Fee Rate | |
| First $1 billion | | | 0.50 | % | |
| $1 billion to $3 billion | | | 0.45 | % | |
| Over $3 billion | | | 0.40 | % | |
For the year ended October 31, 2008, the Fund's effective investment advisory fee rate was 0.50% of the Fund's average daily net assets.
Pricing and Bookkeeping Fees
The Fund has entered into a Financial Reporting Services Agreement (the "Financial Reporting Services Agreement") with State Street Bank & Trust Company ("State Street") and Columbia pursuant to which State Street provides financial reporting services to the Fund. The Fund has also entered into an Accounting Services Agreement (collectively with the Financial Reporting Services Agreement, the "State Street Agreements") with State Street and Columbia pursuant to which State Street provides accounting services to the Fund. Under the State Street Agreements, the Fund pays State Street an annual fee of $38,000 paid monthly plus an additional monthly fee based on an annualized percentage rate of average daily net assets of the Fund for the month. The aggregate fee will not exceed $140,000 per year (exclusive of out-of-pocket expenses and charges). The Fund also reimburses State Street for certain out-of-pocket expenses and charge s.
The Fund has entered into a Pricing and Bookkeeping Oversight and Services Agreement (the "Services Agreement") with Columbia. Under the Services Agreement, Columbia provides services related to Fund expenses and the requirements of the Sarbanes-Oxley Act of 2002, and provides oversight of the accounting and financial reporting services provided by State Street. Under the Services Agreement, the Fund reimburses Columbia for out-of-pocket expenses. Prior to January 1, 2008, the Fund also reimbursed Columbia for accounting oversight services, services related to Fund expenses and the requirements of the Sarbanes-Oxley Act of 2002.
For the year ended October 31, 2008, the amount charged to the Fund by affiliates included on the Statement of Operations under "Pricing and bookkeeping fees" aggregated to $1,952.
Transfer Agent Fee
Columbia Management Services, Inc. (the "Transfer Agent"), an affiliate of Columbia and an indirect, wholly owned subsidiary of BOA, provides shareholder services to the Fund and has contracted with Boston Financial Data Services ("BFDS") to serve as sub-transfer agent. The Transfer Agent is entitled to receive a fee for its services, paid monthly, at the annual rate of $17.34 per open account plus reimbursement of certain sub-transfer agent fees paid by the Transfer Agent (exclusive of BFDS fees), calculated based on assets held in omnibus accounts and intended to recover the cost of payments to other parties (including affiliates of BOA) for services to those accounts. The Transfer Agent pays the fees of BFDS for services as sub-transfer agent and is not entitled to reimbursement for such fees from the Fund. The Transfer Agent may also retain, as additional compensation for its services, fees for wire, telephone and redemption orders, IRA trustee agent fees and account transcript fees due to the
22
Columbia Connecticut Tax-Exempt Fund, October 31, 2008
Transfer Agent from shareholders of the Fund and credits (net of bank charges) earned with respect to balances in accounts the Transfer Agent maintains in connection with its services to the Fund. The Transfer Agent also receives reimbursement for certain out-of-pocket expenses.
An annual minimum account balance fee of $20 may apply to certain accounts with a value below the Fund's initial minimum investment requirements to reduce the impact of small accounts on transfer agent fees. These minimum account balance fees are recorded as part of expense reductions on the Statement of Operations. For the year ended October 31, 2008, these minimum account balance fees reduced total expenses by $420.
Underwriting Discounts, Service and Distribution Fees
Columbia Management Distributors, Inc. (the "Distributor"), an affiliate of Columbia and an indirect, wholly owned subsidiary of BOA, is the principal underwriter of the Fund's shares. For the year ended October 31, 2008, the Distributor has retained net underwriting discounts of $7,301 on sales of the Fund's Class A shares and received net CDSC fees of $13,389 and $467 on Class B and Class C share redemptions, respectively.
The Fund has adopted distribution and shareholder servicing plans (the "Plans") pursuant to Rule 12b-1 under the 1940 Act, which require the payment of distribution and service fees. The fees are intended to compensate the Distributor and/or eligible selling and/or servicing agents for selling shares of the Fund and providing services to investors. The service fee is equal to 0.10% annually of the net assets attributable to shares of the Fund issued prior to December 1, 1994 and 0.25% annually of the net assets attributable to shares issued thereafter. This arrangement results in an annual rate of service fee for all shares that is a blend between the 0.10% and 0.25% rates. For the year ended October 31, 2008, the Fund's effective service fee rate was 0.24% of the Fund's average daily net assets attributable to Class A, Class B and Class C shares.
The Plans also require the payment of a monthly distribution fee to the Distributor equal to 0.75% annually of the average daily net assets attributable to Class B and Class C shares only. The Distributor has voluntarily agreed to waive a portion of the Class C shares distribution fee so that it will not exceed 0.45% annually of the average daily net assets attributable to Class C shares. This arrangement may be modified or terminated by the Distributor at any time.
Fee Waivers and Expense Reimbursements
Columbia and/or some of the Fund's other service providers have voluntarily agreed to waive fees and/or reimburse the Fund for certain expenses so that total expenses (exclusive of distribution and service fees, brokerage commissions, interest, taxes and extraordinary expenses, but inclusive of custodial charges relating to overdrafts, if any), after giving effect to any balance credits from the Fund's custodian, will not exceed 0.60% annually of the Fund's average daily net assets. Columbia, at its discretion, may modify or terminate this arrangement any time.
Fees Paid to Officers and Trustees
All officers of the Fund are employees of Columbia or its affiliates and, with the exception of the Fund's Chief Compliance Officer, receive no compensation from the Fund. The Board of Trustees has appointed a Chief Compliance Officer to the Fund in accordance with federal securities regulations. The Fund, along with other affiliated funds, pays its pro-rata share of the expenses associated with the Chief Compliance Officer. The Fund's expenses for the Chief Compliance Officer will not exceed $15,000 per year.
The Trust's eligible Trustees may participate in a deferred compensation plan which may be terminated at any time. Obligations of the plan will be paid solely out of the Fund's assets.
Note 5. Custody Credits
The Fund has an agreement with its custodian bank under which custody fees may be reduced by balance credits. These credits are recorded as part of expense reductions on the Statement of Operations. The Fund could have invested a portion of the assets utilized in connection with the expense offset arrangement in an income-producing asset if it had not entered into such an agreement.
For the year ended October 31, 2008, these custody credits reduced total expenses by $1,109 for the Fund.
23
Columbia Connecticut Tax-Exempt Fund, October 31, 2008
Note 6. Portfolio Information
For the year ended October 31, 2008, the cost of purchases and proceeds from sales of securities, excluding short-term obligations, were $9,889,025 and $27,139,560, respectively.
Note 7. Line of Credit
The Fund and other affiliated funds participate in a $280,000,000 committed, unsecured revolving line of credit. The maximum amount that may be borrowed by any fund is limited to the lesser of $200,000,000 and the Fund's borrowing limit set forth in the Fund's registration statement. Borrowings are available for short-term liquidity or temporary or emergency purposes.
Interest is charged to each participating fund based on the fund's borrowings at a rate per annum equal to the greater of the Federal Funds Rate plus 0.50% and the overnight LIBOR Rate plus 0.50%. In addition, an annual operations agency fee of $20,000, an amendment fee of 0.02% and a commitment fee of 0.12% per annum are accrued and apportioned among the participating funds pro rata based on their relative net assets.
Prior to October 16, 2008, the Fund and other affiliated Funds participated in a $350,000,000 committed, unsecured revolving line of credit and a $150,000,000 uncommitted, unsecured line of credit, both provided by State Street. Interest on the committed line of credit was charged to each participating fund based on the fund's borrowings at a rate per annum equal to the Federal Funds Rate plus 0.50%. In addition, a commitment fee of 0.10% per annum was accrued and apportioned among the participating funds pro rata based on their relative net assets. Interest on the uncommitted line of credit was charged to each participating fund based on the fund's borrowings at a rate per annum equal to the Federal Funds Rate plus 0.375%. State Street charged an annual operations agency fee of $40,000 for the committed line of credit and was able to charge an annual administration fee of $15,000 for the uncommitted line of credit. The commitme nt fee, the operations agency fee and the administration fee were accrued and apportioned among the participating funds pro rata based on their relative net assets.
For the year ended October 31, 2008, the Fund did not borrow under these arrangements.
Note 8. Shares of Beneficial Interest
As of October 31, 2008, three shareholders held 10.2% of the Fund's shares outstanding over which BOA and/or any of its affiliates did not have investment discretion.
Subscription and redemption activity of these accounts may have a significant effect on the operations of the Fund.
Note 9. Significant Risks and Contingencies
Sector Focus Risk
The Fund may focus its investments in certain sectors, subjecting it to greater risk than a fund that is less focused.
Geographic Concentration Risk
The Fund had greater than 5% of its total net assets at October 31, 2008 invested in debt obligations issued by each of Connecticut and Puerto Rico and their political subdivisions, agencies and public authorities. The Fund is more susceptible to economic and political factors adversely affecting issuers of the state's or territory's municipal securities than are municipal bond funds that are not concentrated to the same extent in these issuers.
Concentration of Credit Risk
The Fund holds investments that are insured by private insurers who guarantee the payment of principal and interest in the event of default or that are supported by a letter of credit. At October 31, 2008, private insurers who insured greater than 5% of the total net assets of the Fund were as follows:
| Insurer | | % of Total
Net Assets | |
| MBIA Insurance Corp. | | | 24.7 | | |
| AMBAC Assurance Corp. | | | 18.2 | | |
| Financial Security Assurance, Inc. | | | 14.3 | | |
| Financial Guaranty Insurance Co. | | | 5.9 | | |
At November 24, 2008, MBIA Insurance Corp., Financial Guaranty Insurance Co., AMBAC Assurance Corp. and Financial Security Assurance, Inc. were rated by Standard & Poor's AA, CCC, A and AAA, respectively.
24
Columbia Connecticut Tax-Exempt Fund, October 31, 2008
Tax Development Risk
The Fund purchases municipal securities whose interest, in the opinion of bond counsel, is free from federal income tax. There is no assurance that the Internal Revenue Service (IRS) will agree with this opinion. In the event the IRS determines that an issuer does not comply with relevant tax requirements, interest payments from a security could become federally taxable, possibly retroactively to the date the security was issued. As a shareholder of the Fund, you may be required to file an amended tax return as a result.
Legal Proceedings
On February 9, 2005, Columbia Management Advisors, Inc. (which has since merged into Banc of America Capital Management, LLC (now named Columbia Management Advisors, LLC)) ("Columbia") and Columbia Funds Distributor, Inc. (which has been renamed Columbia Management Distributors, Inc.) (the "Distributor") (collectively, the "Columbia Group") entered into an Assurance of Discontinuance with the New York Attorney General ("NYAG") (the "NYAG Settlement") and consented to the entry of a cease-and-desist order by the Securities and Exchange Commission ("SEC") (the "SEC Order") on matters relating to mutual fund trading.
Under the terms of the SEC Order, the Columbia Group agreed, among other things, to: pay $70 million in disgorgement and $70 million in civil money penalties; cease and desist from violations of the antifraud provisions and certain other provisions of the federal securities laws; maintain certain compliance and ethics oversight structures; retain an independent consultant to review the Columbia Group's applicable supervisory, compliance, control and other policies and procedures; and retain an independent distribution consultant (see below). The Columbia Funds have also voluntarily undertaken to implement certain governance measures designed to maintain the independence of their boards of trustees. The NYAG Settlement also, among other things, requires Columbia and its affiliates to reduce management fees for certain Columbia Funds (including the former Nations Funds) and other mutual funds collectively by $32 million per year f or five years, for a projected total of $160 million in management fee reductions.
Pursuant to the procedures set forth in the SEC Order, the $140 million in settlement amounts described above is being distributed in accordance with a distribution plan that was developed by an independent distribution consultant and approved by the SEC on April 6, 2007. Distributions under the distribution plan began in late June 2007.
A copy of the SEC Order is available on the SEC website at http://www.sec.gov. A copy of the NYAG Settlement is available as part of the Bank of America Corporation Form 8-K filing on February 10, 2005.
In connection with the events described above, various parties have filed suit against certain funds, the Trustees of the Columbia Funds, FleetBoston Financial Corporation and its affiliated entities and/or Bank of America and its affiliated entities.
On February 20, 2004, the Judicial Panel on Multidistrict Litigation transferred these cases and cases against other mutual fund companies based on similar allegations to the United States District Court in Maryland for consolidated or coordinated pretrial proceedings (the "MDL"). Subsequently, additional related cases were transferred to the MDL. On September 29, 2004, the plaintiffs in the MDL filed amended and consolidated complaints. One of these amended complaints is a putative class action that includes claims under the federal securities laws and state common law, and that names Columbia, the Distributor, the Trustees of the Columbia Funds, Bank of America Corporation and others as defendants. Another of the amended complaints is a derivative action purportedly on behalf of the Columbia Funds that asserts claims under federal securities laws and state common law.
On February 25, 2005, Columbia and other defendants filed motions to dismiss the claims in the pending cases. On March 1, 2006, for reasons stated in the court's memoranda dated November 3, 2005, the U.S. District Court for the District of Maryland granted in part and denied in part the defendants' motions to dismiss. The court dismissed all of the class action claims pending against the Columbia Funds Trusts. As to Columbia and the Distributor, the claims under the Securities Act of 1933, the claims under Sections 34(b) and 36(a) of the Investment Company Act of 1940 ("ICA") and the state law claims were dismissed. The claims under Sections 10(b) and 20(a) of the Securities Exchange Act of 1934 and claims under Section 36(b) of the ICA were not dismissed.
25
Columbia Connecticut Tax-Exempt Fund, October 31, 2008
On March 21, 2005, a purported class action was filed in Massachusetts state court alleging that certain conduct, including market timing, entitled Class B shareholders in certain Columbia funds to an exemption from contingent deferred sales charges upon early redemption ("the CDSC Lawsuit"). The CDSC Lawsuit was removed to federal court in Massachusetts and transferred to the MDL.
On September 14, 2007, the plaintiffs and the Columbia defendants named in the MDL, including the Columbia Funds, entered into a stipulation of settlement with respect to all Columbia-related claims in the MDL described above, including the CDSC Lawsuit. The settlement is subject to court approval.
In 2004, the Columbia Funds' adviser and distributor and certain affiliated entities and individuals were named as defendants in certain purported shareholder class and derivative actions making claims, including claims under the Investment Company and the Investment Advisers Acts of 1940 and state law. Certain Columbia Funds were named as nominal defendants. The suits allege, inter alia, that the fees and expenses paid by the funds are excessive and that the advisers and their affiliates inappropriately used fund assets to distribute the funds and for other improper purposes. On March 2, 2005, the actions were consolidated in the Massachusetts federal court as In re Columbia Entities Litigation. The plaintiffs filed a consolidated amended complaint on June 9, 2005. On November 30, 2005, the judge dismissed all claims by plaintiffs and entered final judgment in favor of the defendants. The plaintiffs appealed to the United States Court of Appeals for the First Circuit on December 30, 2005. A stipulation and settlement agreement dated January 19, 2007 was filed in the First Circuit on February 14, 2007, with a joint stipulation of dismissal and motion for remand to obtain district court approval of the settlement. That joint motion was granted and the appeal was dismissed. On March 6, 2007, the case was remanded to the District Court. The settlement, approved by the District Court on September 18, 2007, became effective October 19, 2007. Pursuant to the settlement, the funds' adviser and/or its affiliates made certain payments, including plaintiffs' attorneys' fees and costs of notice to class members.
26
Report of Independent Registered Public Accounting Firm
To the Trustees of Columbia Funds Series Trust I and the Shareholders of Columbia Connecticut Tax-Exempt Fund:
In our opinion, the accompanying statement of assets and liabilities, including the investment portfolio, and the related statements of operations and of changes in net assets and the financial highlights present fairly, in all material respects, the financial position of Columbia Connecticut Tax-Exempt Fund (the "Fund") (a series of Columbia Funds Series Trust I) at October 31, 2008, the results of its operations for the year then ended, the changes in its net assets for each of the two years in the period then ended and the financial highlights for each of the five years in the period then ended, in conformity with accounting principles generally accepted in the United States of America. These financial statements and financial highlights (hereafter referred to as "financial statements") are the responsibility of the Fund's management. Our responsibility is to express an opinion on these financial statements based on our audit s. We conducted our audits of these financial statements in accordance with the standards of the Public Company Accounting Oversight Board (United States). Those standards require that we plan and perform the audit to obtain reasonable assurance about whether the financial statements are free of material misstatement. An audit includes examining, on a test basis, evidence supporting the amounts and disclosures in the financial statements, assessing the accounting principles used and significant estimates made by management, and evaluating the overall financial statement presentation. We believe that our audits, which included confirmation of securities at October 31, 2008 by correspondence with the custodian and brokers, provide a reasonable basis for our opinion.
PricewaterhouseCoopers LLP
Boston, Massachusetts
December 22, 2008
27
Federal Income Tax Information (Unaudited)
For the fiscal year ended October 31, 2008, the Fund designates long-term capital gains of $402,460.
100.0% of the distributions from net investment income will be treated as exempt income for federal income tax purposes.
28
Fund Governance
The Trustees serve terms of indefinite duration. The names, addresses and ages of the Trustees and officers of the Funds in Columbia Funds Series Trust I, the year each was first elected or appointed to office, their principal business occupations during at least the last five years, the number of Funds overseen by each Trustee and other directorships they hold are shown below. Each officer listed below serves as an officer of each Fund in the Columbia Funds Complex.
Independent Trustees
Name, Address and Year of Birth,
Position with Funds, Year First
Elected or Appointed to Office | | Principal Occupation(s) During Past Five Years, Number of Funds in Columbia
Funds Complex Overseen by Trustee, Other Directorships Held | |
| John D. Collins (Born 1938) | |
|
c/o Columbia Management Advisors, LLC
One Financial Center
Boston, MA 02111
Trustee1 (since 2007) | | Retired. Consultant, KPMG, LLP (accounting and tax firm) from July 1999 to June 2000; Partner, KPMG, LLP from March 1962 to June 1999. Oversees 80, Mrs. Fields Famous Brands LLC (consumer products); Suburban Propane Partners, L.P.; and Montpelier Re (underwriting firm) | |
|
| Rodman L. Drake (Born 1943) | |
|
c/o Columbia Management Advisors, LLC
One Financial Center
Boston, MA 02111
Trustee1 (since 2007) | | Co-Founder of Baringo Capital LLC (private equity) since 2002; President, Continuation Investments Group, Inc. from 1997 to 2001. Oversees 80, Jackson Hewitt Tax Service Inc. (tax preparation services); Crystal Capital River Inc. (real estate investment trust); Student Loan Corporation (student loan provider); Celgene Corporation (global biotechnology company); Apex Silver Mines Ltd. (mining); and Hyperion Brookfield Total Return Fund, Inc. and Hyperion Brookfield Strategic Mortgage Income Fund, Inc. (exchange-traded funds) | |
|
| Douglas A. Hacker (Born 1955) | |
|
c/o Columbia Management Advisors, LLC
One Financial Center
Boston, MA 02111
Trustee (since 1996) | | Independent business executive since May 2006; Executive Vice President–Strategy of United Airlines (airline) from December 2002 to May 2006; President of UAL Loyalty Services (airline marketing company) from September 2001 to December 2002; Executive Vice President and Chief Financial Officer of United Airlines from July 1999 to September 2001. Oversees 80, Nash Finch Company (food distributor); Aircastle Limited (aircraft leasing) | |
|
| Janet Langford Kelly (Born 1957) | |
|
c/o Columbia Management Advisors, LLC
One Financial Center
Boston, MA 02111
Trustee (since 1996) | | Senior Vice President, General Counsel and Corporate Secretary, ConocoPhillips (integrated energy company) since September 2007; Deputy General Counsel–Corporate Legal Services, ConocoPhillips from August 2006 to August 2007; Partner, Zelle, Hofmann, Voelbel, Mason & Gette LLP (law firm) from March 2005 to July 2006; Adjunct Professor of Law, Northwestern University, from September 2004 to June 2006; Director, UAL Corporation (airline) from February 2006 to July 2006; Chief Administrative Officer and Senior Vice President, Kmart Holding Corporation (consumer goods), from September 2003 to March 2004; Executive Vice President–Corporate Development and Administration, General Counsel and Secretary, Kellogg Company (food manufacturer), from September 1999 to August 2003. Oversees 80, None | |
|
29
Fund Governance (continued)
Independent Trustees (continued)
Name, Address and Year of Birth,
Position with Funds, Year First
Elected or Appointed to Office | | Principal Occupation(s) During Past Five Years, Number of Funds in Columbia
Funds Complex Overseen by Trustee, Other Directorships Held | |
| Charles R. Nelson (Born 1942) | |
|
c/o Columbia Management Advisors, LLC
One Financial Center
Boston, MA 02111
Trustee (since 1981) | | Professor of Economics, University of Washington, since January 1976; Ford and Louisa Van Voorhis Professor of Political Economy, University of Washington, since September 1993; Director, Institute for Economic Research, University of Washington from September 2001 to June 2003; Adjunct Professor of Statistics, University of Washington, since September 1980; Associate Editor, Journal of Money Credit and Banking, since September 1993; Consultant on econometric and statistical matters. Oversees 80, None | |
|
| John J. Neuhauser (Born 1943) | |
|
c/o Columbia Management Advisors, LLC
One Financial Center
Boston, MA 02111
Trustee (since 1985) | | President, Saint Michael's College, since August 2007; University Professor, Boston College from November 2005 to August 2007; Academic Vice President and Dean of Faculties, Boston College from August 1999 to October 2005. Oversees 80, Liberty All-Star Equity Fund and Liberty All-Star Growth Fund, Inc. (closed-end funds) | |
|
| Jonathan Piel (Born 1938) | |
|
c/o Columbia Management Advisors, LLC
One Financial Center
Boston, MA 02111
Trustee1 (since 2007) | | Cable television producer and website designer; The Editor, Scientific American from 1984 to 1994; Vice President, Scientific American, Inc., from 1984 to 1994; Member, Advisory Board, Stone Age Institute, Bloomington, Indiana (research institute that explores the effect of technology on human evolution); Member, Board of Directors of the National Institute of Social Sciences, New York City; and Member, Board of Trustees of the William Alanson White Institute, New York City (institution for training psychoanalysts). Oversees 80, None | |
|
| Patrick J. Simpson (Born 1944) | |
|
c/o Columbia Management Advisors, LLC
One Financial Center
Boston, MA 02111
Trustee (since 2000) | | Partner, Perkins Coie LLP (law firm). Oversees 80, None | |
|
| Thomas C. Theobald (Born 1937) | |
|
c/o Columbia Management Advisors, LLC
One Financial Center
Boston, MA 02111
Trustee and
Chairman of the Board (since 1996) | | Partner and Senior Advisor, Chicago Growth Partners (private equity investing) since September 2004; Managing Director, William Blair Capital Partners (private equity investing) from September 1994 to September 2004. Oversees 80, Anixter International (network support equipment distributor); Ventas, Inc. (real estate investment trust); Jones Lang LaSalle (real estate management services); Ambac Financial Group (financial guaranty insurance) | |
|
| Anne-Lee Verville (Born 1945) | |
|
c/o Columbia Management Advisors, LLC
One Financial Center
Boston, MA 02111
Trustee (since 1998) | | Retired since 1997 (formerly General Manager–Global Education Industry (from 1994 to 1997), President–Application Systems Division (from 1991 to 1994), Chief Financial Officer–US Marketing & Services (from 1988 to 1991), and Chief Information Officer (from 1987 to 1988), IBM Corporation (computer and technology)). Oversees 80, None | |
|
30
Fund Governance (continued)
Interested Trustee
Name, Address and Year of Birth,
Position with Funds, Year First
Elected or Appointed to Office | | Principal Occupation(s) During Past Five Years, Number of Funds in Columbia
Funds Complex Overseen by Trustee, Other Directorships Held | |
| William E. Mayer (Born 1940) | |
|
c/o Columbia Management Advisors, LLC
One Financial Center
Boston, MA 02111
Trustee2 (since 1994) | | Partner, Park Avenue Equity Partners (private equity) since February 1999; Dean and Professor, College of Business, University of Maryland from 1992 to 1997. Oversees 80, Lee Enterprises (print media), WR Hambrecht + Co. (financial service provider); BlackRock Kelso Capital Corporation (investment company) | |
|
1 Messrs. Drake, Piel and Collins have served as directors/trustees of the Excelsior Funds since 1996, 1996 and 2005, respectively. The Excelsior Funds consisted of 27 portfolios managed by affiliates of Columbia Management Advisors, LLC. Effective December 12, 2007, the Board elected Messrs. Drake, Piel and Collins as Trustees of the Trust.
2 Mr. Mayer is an "interested person" (as defined in the Investment Company Act of 1940) by reason of his affiliation with WR Hambrecht + Co., a registered broker/dealer that may execute portfolio transactions for or engage in principal transactions with the Funds or other funds or accounts advised/managed by the Advisor or other Bank of America affiliates.
The Statement of Additional Information includes additional information about the Trustees of the Funds and is available, without charge, upon request by calling 1-800-345-6611.
Officers
Name, Address and Year of Birth,
Position with Columbia Funds,
Year First Elected or
Appointed to Office | | Principal Occupation(s) During Past Five Years | |
| Christopher L. Wilson (Born 1957) | |
|
One Financial Center
Boston, MA 02111
President (since 2004) | | President–Columbia Funds, since October 2004; Managing Director–Columbia Management Advisors, LLC, since September 2005; Senior Vice President–Columbia Management Distributors, Inc., since January 2005; Director–Columbia Management Services, Inc., since January 2005; Director–Bank of America Global Liquidity Funds, plc and Banc of America Capital Management (Ireland), Limited, since May 2005; Director–FIM Funding, Inc., since January 2005; President and Chief Executive Officer–CDC IXIS AM Services, Inc. (investment management), from September 1998 through August 2004; and a senior officer or director of various other Bank of America affiliated entities, including other registered and unregistered funds. | |
|
| James R. Bordewick, Jr. (Born 1959) | |
|
One Financial Center
Boston, MA 02111
Senior Vice President, Secretary
and Chief Legal Officer (since 2006) | | Associate General Counsel, Bank of America since April 2005; Senior Vice President and Associate General Counsel, MFS Investment Management (investment management) prior to April 2005. | |
|
31
Fund Governance (continued)
Officers (continued)
Name, Address and Year of Birth,
Position with Columbia Funds,
Year First Elected or
Appointed to Office | | Principal Occupation(s) During Past Five Years | |
| J. Kevin Connaughton (Born 1964) | |
|
One Financial Center
Boston, MA 02111
Senior Vice President
and Chief Financial Officer
(since 2000) | | Managing Director of Columbia Management Advisors, LLC since December 2004; Treasurer–Columbia Funds, from October 2003 to May 2008; Treasurer–the Liberty Funds, Stein Roe Funds and Liberty All-Star Funds, December 2000–December 2006; Senior Vice President–Columbia Management Advisors, LLC, from April 2003 to December 2004; President–Columbia Funds, Liberty Funds and Stein Roe Funds, February 2004 to October 2004; Treasurer–Galaxy Funds, September 2002 to December 2005; Treasurer, December 2002 to December 2004, and President, February 2004 to December 2004–Columbia Management Multi-Strategy Hedge Fund, LLC; and a senior officer of various other Bank of America-affiliated entities, including other registered and unregistered funds. | |
|
| Linda J. Wondrack (Born 1964) | |
|
One Financial Center
Boston, MA 02111
Senior Vice President
and Chief Compliance Officer
(since 2007) | | Director (Columbia Management Group LLC and Investment Product Group Compliance), Bank of America since June 2005; Director of Corporate Compliance and Conflicts Officer, MFS Investment Management (investment management), August 2004 to May 2005; Managing Director, Deutsche Asset Management (investment management) prior to August 2004. | |
|
| Michael G. Clarke (Born 1969) | |
|
One Financial Center
Boston, MA 02111
Treasurer (since 2008) | | Director of Fund Administration of the Advisor since January 2006; Managing Director of the Advisor September 2004 to December 2005; Vice President Fund Administration June 2002 to September 2004. | |
|
| Jeffrey R. Coleman (Born 1969) | |
|
One Financial Center
Boston, MA 02111
Deputy Treasurer (since 2006) | | Director of Fund Administration of the Advisor since January 2006; Fund Controller of the Advisor from October 2004 to January 2006; Vice President of CDC IXIS Asset Management Services, Inc. (investment management) from August 2000 to September 2004. | |
|
| Joseph F. DiMaria (Born 1968) | |
|
One Financial Center
Boston, MA 02111
Chief Accounting Officer
(since 2008) | | Director of Fund Administration of the Advisor since January 2006; Head of Tax/Compliance and Assistant Treasurer of the Advisor from November 2004 to December 2005; Director of Trustee Administration (Sarbanes-Oxley) of the Advisor from May 2003 to October 2004. | |
|
| Julian Quero (Born 1967) | |
|
One Financial Center
Boston, MA 02111
Deputy Treasurer (since 2008) | | Senior Tax Manager of the Advisor since August 2006; Senior Compliance Manager of the Advisor from April 2002 to August 2006. | |
|
| Barry S. Vallan (Born 1969) | |
|
One Financial Center
Boston, MA 02111
Controller (since 2006) | | Vice President–Fund Treasury of the Advisor since October 2004; Vice President–Trustee Reporting of the Advisor from April 2002 to October 2004 | |
|
32
Board Consideration and Approval of Advisory Agreements
The Advisory Fees and Expenses Committee of the Board of Trustees meets several times annually to review the advisory agreements (collectively, the "Agreements") of the funds for which the Trustees serve as trustees (each a "fund") and to determine whether to recommend that the full Board approve the continuation of the Agreements for an additional one-year period. After the Committee has made its recommendation, the full Board, including the Independent Trustees, determines whether to approve the continuation of the Agreements. In addition, the full Board, including the Independent Trustees, considers matters bearing on the Agreements at most of its other meetings throughout the year and meets regularly with senior management of the funds and Columbia, the funds' investment adviser, including the senior manager of each investment area within Columbia. Through the Board's Investment Oversight Committees, Trustees also meet with selected fund portfolio managers, research analysts and traders at various times throughout the year.
The Trustees receive and review all materials that they, their legal counsel or Columbia believe to be reasonably necessary for the Trustees to evaluate the Agreements and to determine whether to approve the continuation of the Agreements. Those materials generally include, among other items, (i) information on the investment performance of each fund relative to the performance of peer groups of mutual funds and the fund's performance benchmarks, and additional information assessing performance on a risk-adjusted basis, (ii) information on each fund's advisory fees and other expenses, including information comparing the fund's expenses to those of peer groups of mutual funds and information about any applicable expense caps and fee "breakpoints," (iii) information about the profitability of the Agreements to Columbia, including potential "fall-out" or ancillary benefits that Columbia and its affiliates may receive as a result of their relationships with the funds and (iv) information obtained through Columbia's response to a questionnaire prepared at the request of the Trustees by counsel to the funds and independent legal counsel to the Independent Trustees. The Trustees also consider other information such as (v) Columbia's financial results and financial condition, (vi) each fund's investment objective and strategies and the size, education and experience of Columbia's investment staffs and their use of technology, external research and trading cost measurement tools, (vii) the allocation of the funds' brokerage and the use of "soft" commission dollars to pay for research products and services, (viii) Columbia's resources devoted to, and its record of compliance with, the funds' investment policies and restrictions, policies on personal securities transactions and other compliance policies and legal and regulatory requirements, (ix) Columbia's response to va rious legal and regulatory proceedings since 2003 and to the recent period of volatility in the securities markets and (x) the economic outlook generally and for the mutual fund industry in particular. In addition, the Advisory Fees and Expenses Committee confers with the funds' independent fee consultant and reviews materials relating to the funds' relationships with Columbia provided by the independent fee consultant. Throughout the process, the Trustees have the opportunity to ask questions of and to request additional materials from Columbia and to consult with the independent fee consultant and independent legal counsel to the Independent Trustees.
The Board of Trustees most recently approved the continuation of the Agreements at its October, 2008 meeting, following meetings of the Advisory Fees and Expenses Committee held in February, April, August, September and October, 2008. In considering whether to approve the continuation of the Agreements, the Trustees, including the Independent Trustees, did not identify any single factor as determinative, and each weighed various factors as he or she deemed appropriate. The Trustees considered the following matters in connection with their approval of the continuation of the Agreements:
The nature, extent and quality of the services provided to the funds under the Agreements. The Trustees considered the nature, extent and quality of the services provided by Columbia and its affiliates to the funds and the resources dedicated to the funds by Columbia and its affiliates. Among other things, the Trustees considered (i) Columbia's ability (including its personnel and other resources, compensation programs for personnel involved in fund management, reputation and other attributes) to attract, motivate and retain highly qualified research, advisory and supervisory investment professionals; (ii) the portfolio management services provided by those investment professionals; and (iii) the trade execution services provided on behalf of the funds. For each fund, the Trustees also considered the benefits to shareholders of investing in a mutual f und that is part of a family of funds offering exposure to a variety of asset classes
33
and investment disciplines and providing a variety of fund and shareholder services. After reviewing those and related factors, the Trustees concluded, within the context of their overall conclusions regarding each of the Agreements, that the nature, extent and quality of services provided supported the continuation of the Agreements.
Investment performance of the funds and Columbia. The Trustees reviewed information about the performance of each fund over various time periods, including information prepared by an independent third-party data provider that compared the performance of each fund to the performance of peer groups of mutual funds and performance benchmarks. The Trustees also reviewed a description of the third party's methodology for identifying each fund's peer group for purposes of performance and expense comparisons. The Trustees also considered additional information that the Advisory Fees and Expenses Committee requested from Columbia relating to funds that presented relatively weaker performance and/or relatively higher expenses. In the case of each fund whose performance lagged that of a relevant peer group for certain (although not necessarily all) periods, the Trustees concluded that other factors relevant to performance were sufficient, in light of other considerations, to warrant continuation of the fund's Agreements. Those factors varied from fund to fund, but included one or more of the following: (i) that the fund's performance, although lagging in certain recent periods, was stronger over the longer term; (ii) that the underperformance was attributable, to a significant extent, to investment decisions that were reasonable and consistent with the fund's investment strategy and policies and that the fund was performing within a reasonable range of expectations, given those investment decisions, market conditions and the fund's investment strategy; (iii) that the fund's performance was competitive when compared to other relevant performance benchmarks or peer groups; (iv) that Columbia had taken or was taking steps designed to help improve the fund's investment performance, including, but not limited to, replacing portfolio managers or modifying investment str ategies; and (v) that Columbia proposed to waive advisory fees or cap the expenses of the fund.
The Trustees noted that, through April 30, 2008, Columbia Connecticut Tax-Exempt Fund's performance was in the second quintile (where the best performance would be in the first quintile) for the one-year period, in the third quintile for the three- and five-year periods, and in the first quintile for the ten-year period, of the peer group selected by an independent third-party data provider for purposes of performance comparisons.
The Trustees also considered Columbia's performance and reputation generally, the funds' performance as a fund family generally, and Columbia's historical responsiveness to Trustee concerns about performance and Columbia's willingness to take steps intended to improve performance. After reviewing those and related factors, the Trustees concluded, within the context of their overall conclusions regarding each of the Agreements, that the performance of each fund and Columbia was sufficient, in light of other considerations, to warrant the continuation of the Agreement(s) pertaining to that fund.
The costs of the services provided and profits realized by Columbia and its affiliates from their relationships with the funds. The Trustees considered the fees charged to the funds for advisory services as well as the total expense levels of the funds. That information included comparisons (provided by management and by an independent third-party data provider) of each fund's advisory fees and total expense levels to those of the fund's peer groups and information about the advisory fees charged by Columbia to comparable institutional accounts. In considering the fees charged to those accounts, the Trustees took into account, among other things, management's representations about the differences between managing mutual funds as compared to other types of accounts, including differences in the services provided, differences in the risk profile of such business for Columbia, and the additional resources required to manage mutual funds effectively. In evaluating each fund's advisory fees, the Trustees also took into account the demands, complexity and quality of the investment management of the fund. The Trustees considered existing advisory fee breakpoints, and Columbia's use of advisory fee waivers and expense caps, which benefited a number of the funds. The Trustees also noted management's stated justification for the fees charged to the funds, which included information about the investment performance of the funds and the services provided to the funds.
The Trustees considered that Columbia Connecticut Tax-Exempt Fund's total expenses were in the third quintile and actual management fees were in the second quintile (where the lowest fees and expenses would be in the first quintile) of the peer group selected by an independent third-party data provider for purposes of expense comparisons.
34
The Trustees also considered the compensation directly or indirectly received by Columbia and its affiliates from their relationships with the funds. The Trustees reviewed information provided by management as to the profitability to Columbia and its affiliates of their relationships with each fund, and information about the allocation of expenses used to calculate profitability. When reviewing profitability, the Trustees also considered court cases in which adviser profitability was an issue in whole or in part, the performance of the relevant funds, the expense level of each fund, and whether Columbia had implemented breakpoints and/or expense caps with respect to the fund.
After reviewing those and related factors, the Trustees concluded, within the context of their overall conclusions regarding each of the Agreements, that the advisory fees charged to each fund, and the related profitability to Columbia and its affiliates of their relationships with the fund, supported the continuation of the Agreement(s) pertaining to that fund.
Economies of Scale. The Trustees considered the existence of any economies of scale in the provision by Columbia of services to each fund, to groups of related funds, and to Columbia's investment advisory clients as a whole and whether those economies were shared with the funds through breakpoints in the investment advisory fees or other means, such as fee waivers/expense reductions and additional investments by Columbia in investment, trading and compliance resources. The Trustees noted that many of the funds benefited from breakpoints, fee waivers/expense caps, or both. In considering those issues, the Trustees also took note of the costs of the services provided (both on an absolute and a relative basis) and the profitability to Columbia and its affiliates of their relationships with the funds, as discussed above.
After reviewing those and related factors, the Trustees concluded, within the context of their overall conclusions regarding each of the Agreements, that the extent to which economies of scale were shared with the funds supported the continuation of the Agreements.
Other Factors. The Trustees also considered other factors, which included but were not limited to the following:
• the extent to which each fund had operated in accordance with its investment objective and investment restrictions, the nature and scope of the compliance programs of the funds and Columbia and the compliance-related resources that Columbia and its affiliates were providing to the funds;
• the nature, quality, cost and extent of administrative and shareholder services overseen and performed by Columbia and its affiliates, both under the Agreements and under separate agreements for the provision of transfer agency and administrative services;
• so-called "fall-out benefits" to Columbia and its affiliates, such as the engagement of its affiliates to provide distribution, brokerage and transfer agency services to the funds, and the benefits of research made available to Columbia by reason of brokerage commissions generated by the funds' securities transactions, as well as possible conflicts of interest associated with those fall-out and other benefits, and the reporting, disclosure and other processes in place to disclose and monitor those possible conflicts of interest; and
• the report provided by the funds' independent fee consultant, which included information about and analysis of the funds' fees, expenses and performance.
Based on their evaluation of all factors that they deemed to be material, including those factors described above, and assisted by the advice of independent counsel and the independent fee consultant, the Trustees, including the Independent Trustees, approved the continuance of each of the Agreements through October 31, 2009.
35
Summary of Management Fee Evaluation by
Independent Fee Consultant
EXCERPTS FROM REPORT OF INDEPENDENT FEE CONSULTANT TO THE FUNDS SUPERVISED BY THE COLUMBIA ATLANTIC BOARD
Prepared Pursuant to the February 9, 2005
Assurance of Discontinuance among the
Office of Attorney General of New York State,
Columbia Management Advisors, LLC, and
Columbia Management Distributors, Inc.
November 3, 2008
I. Overview
On February 9, 2005, Columbia Management Advisors, LLC ("CMA") and Columbia Management Distributors, Inc.1 ("CMD") agreed to the New York Attorney General's Assurance of Discontinuance ("AOD"). Among other things, the AOD stipulates that CMA may manage or advise a Columbia Fund ("Columbia Fund" and, together with some or all of such funds, the "Columbia Funds") only if the Independent Members of the Columbia Fund's Board of Trustees appoint a Senior Officer or retain an Independent Fee Consultant ("IFC") who is to manage the process by which proposed management fees are negotiated. The AOD further stipulates that the Senior Officer or IFC is to prepare a written annual evaluation of the fee negotiation process.
With effect from January 1, 2007, the Independent Members of the Board of Trustees for certain Columbia Funds known collectively as the "Atlantic Funds" (together with the other members of that Board, the "Trustees") retained me as IFC for the Atlantic Funds.2 In this capacity, I have prepared the fourth annual written evaluation of the fee negotiation process. As was the case with last year's report (the "2007 Report") my immediate predecessor as IFC, John Rea, provided invaluable assistance in the preparation of this year's report.
A. Role of the Independent Fee Consultant
The AOD charges the IFC with "managing the process by which proposed management fees ... to be charged the Columbia Fund are negotiated so that they are negotiated in a manner which is at arms' length and reasonable and consistent with this Assurance of Discontinuance." The AOD also provides that CMA "may manage or advise a Columbia Fund only if the reasonableness of the proposed management fees is determined by the Board of Trustees ... using ... an annual independent written evaluation prepared by or under the direction of ... the Independent Fee Consultant." Therefore, the AOD makes clear that the IFC does not supplant the Trustees in negotiating management fees with CMA, nor does the IFC substitute his or her judgment for that of the Trustees with respect to the reasonableness of proposed fees or any other matter that is committed to the business judgmen t of the Trustees.
B. Elements Involved in Managing the Fee Negotiation Process
In preparing the report required by the AOD, the IFC must consider at least the following six factors set forth in the AOD:
1. The nature and quality of CMA's services, including the Fund's performance;
2. Management fees (including any components thereof) charged by other mutual fund companies for like services;
3. Possible economies of scale as the Fund grows larger;
4. Management fees (including any components thereof) charged to institutional and other clients of CMA for like services;
5. Costs to CMA and its affiliates of supplying services pursuant to the management fee agreements, excluding any intra-corporate profit; and
6. Profit margins of CMA and its affiliates from supplying such services.
C. Organization of the Annual Evaluation
This report, like last year's, focuses on the six factors and contains a section for each factor except that CMA's costs and profits from managing the Funds have been combined into a single section. In addition to a discussion of these factors, the report offers recommendations to improve the fee review process in future years. A review of the status of
1 CMA and CMD are subsidiaries of Columbia Management Group, LLC ("CMG"), and are the successors to the entities named in the AOD.
2 I have no material relationship with Bank of America, CMG or any of its affiliates, aside from serving as IFC, and I am aware of no material relationship with any of their affiliates. I retained John Rea, an independent economic consultant, to assist me with this report.
Unless otherwise stated or required by the context, this report covers only the Atlantic Funds, which are also referred as the "Funds."
36
recommendations made in the 2007 Report is being provided separately with the materials for the October meeting.
II. Summary of Findings
A. General
1. Based upon my examination of the information supplied by CMG in the light of the six factors set forth in the AOD, I conclude that the Trustees have the relevant information necessary to evaluate the reasonableness of the proposed management fees for each Atlantic Fund.
2. In my view, the process by which the proposed management fees of the Funds have been negotiated in 2008 thus far has been, to the extent practicable, at arms' length and reasonable and consistent with the AOD.
B. Nature and Quality of Services, Including Performance
3. The performance of the Funds has been relatively strong in recent years. Based upon 1-, 3-, 5-, and 10-year returns through April 30, 2008, at least half of all the Funds were in the first and second performance quintiles in each of the four performance periods and, at most, only 11% were in the fifth quintile in any one performance period. Both equity and fixed-income funds posted strong performance relative to comparable funds.
4. Performance rankings were similar in 2007 and 2008, although last year's were slightly stronger. Despite the stability in the distribution of rankings in the two years, at least half the Funds changed quintile rankings between the two years in at least one of the 1-, 3-, and 5-year performance periods.
5. The performance of the actively managed equity Funds against their benchmarks was very strong. At least 57% and as many as 73% posted net returns exceeding their benchmarks over the 1-, 3-, and 5-year periods. In contrast, gross and net returns of fixed-income Funds typically fell short of their benchmarks.
6. Atlantic equity Funds' overall performance adjusted for risk also was strong. Based upon 3-year returns, nearly 80% of the equity Funds had a combination of risk-adjusted and unadjusted returns that placed them in the top half of their performance universes. Only about one-fifth of the fixed income Funds posted high returns and low risk relative to comparable funds. About two-thirds of the fixed-income Funds took on more risk than the typical fund in their performance universes.
7. The industry-standard procedure used by Lipper that includes all share classes in the performance universe tends to bias a Fund's ranking upward within that universe. The bias occurs because either no-12b-1 fee or low-12b-1 fee share classes of the Atlantic Funds are compared with funds in performance universes that include all share classes of multi-class funds with 12b-1 fees of up to 100 basis points. Correcting this bias by limiting the performance universe to classes of comparable funds with low or no 12b-1 fees (a "filtered universe") lowers the relative performance for the Funds, but their performance, on the whole, remains strong. The filtering process, however, did identify two Funds for further review that had not been designated review funds using unfiltered universes.
8. A small number of Funds have consistently underperformed over the past four years. The exact number depends on the criteria used to evaluate longer-term performance. For example, the one-year returns of one Fund have been in the fourth or fifth performance quintiles in each of the past four years; there are six Funds whose three-year returns have been in the fourth or fifth quintile over the past four years.
9. The services performed by CMG professionals beyond portfolio management, such as compliance, legal, information technology, risk management, finance and fund administration, are critical to the success of the Funds and appear to be of high quality.
C. Management Fees Charged by Other Mutual Fund Companies
10. The Funds' management fees and total expenses are generally low relative to those of their peers. Only 21% of the Funds ranked in the two most expensive quintiles for actual management fees, and only 23% in those quintiles for total expenses.
11. The highest concentration of low-expense Funds is found among the equity and tax-exempt fixed income Funds. The 12 former Excelsior Funds have relatively high fees and expenses, with half of those Funds ranking in either the
37
fourth or fifth quintiles. The higher actual management fee rankings of certain Excelsior Funds are due in part to fee schedules that are higher than standard Columbia Fund fee schedules at current asset levels. After discussion with the Trustees, CMA is proposing to lower the management fees on three of these Funds.
12. The distribution of expense rankings is similar in 2007 and 2008, while management fee rankings improved markedly in 2008. Part of the improvement reflects expense limitations introduced last year for the state intermediate municipal bond Funds.
13. The management fees of the Atlantic Funds are generally in line with those of Columbia Funds supervised by the Nations Board of Trustees (the "Nations Funds"). In investment categories in which the Atlantic Funds have higher average fees, the difference principally arises out of differences in asset size.
D. Trustees' Fee and Performance Evaluation Process
14. The Trustees' evaluation process identified 17 Funds in 2008 for further review based upon their relative performance or expenses or both. When compared in filtered universes, two more Funds met the criteria for further review. CMG provided further information about those Funds to assist the Trustees in their evaluation.
E. Potential Economies of Scale
15. CMG presented to the Trustees its analysis of the sources and sharing of potential economies of scale. CMG views economies of scale as arising at the complex level and would regard estimates of scale economies for individual funds as unreliable. In its analysis, CMG did not identify specific sources of economies of scale or provide any estimates of any economies of scale that might arise from future asset growth. CMG's analysis included measures taken by the Trustees and CMG that seek to share any potential economies of scale through breakpoints in management fee schedules, expense reimbursements, fee waivers, enhanced shareholder services, fund mergers, and operational consolidation.
16. An examination of the contractual fee schedules for five Atlantic Funds shows that they are generally in line with those of their competitors, in terms of number and extent of fee breakpoints. A similar examination last year of five different Funds led to the same conclusion.
F. Management Fees Charged to Institutional Clients
17. CMG has provided Trustees with comparisons of mutual fund management fees and institutional fees based upon standardized fee schedules and upon actual fees. The results show that, consistent with industry practice, institutional fees are generally lower than the Funds' management fees. However, because the services provided and risks borne by the manager are more extensive for mutual funds compared to institutional accounts, the differences are of limited value in assisting the Trustees in their review of the reasonableness of the Funds' management fees.
G. Revenues, Expenses, and Profits
18. The activity-based cost allocation methodology ("ABC") employed by CMG to allocate costs, both direct and indirect, for purposes of calculating Fund profitability is thoughtful and detailed. This year, CMG proposed a change to the method by which indirect expenses are allocated. Under this "hybrid" method, indirect costs relating to fund management are allocated among the Funds 50% by assets and 50% per Fund. Allocating indirect expenses equally to each Fund has an intuitive logic, as each Fund regardless of size has certain expenses, such as preparing and printing prospectuses and financial statements.
19. The materials provided on CMG's revenues and expenses with respect to the Funds and the methodology underlying their construction form a sufficient basis for Trustees to evaluate the expenses and profitability of the Funds.
20. In 2007, CMG's complex-wide pre-tax margins on the Atlantic Funds were slightly below industry medians, based on limited data available for publicly held mutual fund managers. However, as is to be expected in a complex now comprising 75 Funds (including former Excelsior Funds), some Atlantic Funds have relatively high pre-tax profit margins, when calculated solely with respect to management revenues and expenses, while other Atlantic Funds operate at a loss. There is a positive relationship
38
between fund size and profitability, with smaller funds generally operating at a loss.
21. CMG pays a fixed percentage of its management fee revenues to an affiliate, U.S. Trust, Bank of America Private Wealth Management, to compensate it for services it performs with respect to Atlantic Fund assets held for the benefit of its customers. Based on our analysis of the services provided by this affiliate, we have concluded that all payments other than those for sub-transfer agent or sub-accounting services should be treated as a distribution expense.
III. Recommendations
1. Criteria for review. The Trustees may wish to consider modifying the criteria for classifying a fund as a "Review Fund" to include criteria that focus exclusively on performance without regard to expense or fee levels. For example, a fund whose one-year or three-year performance was median or below for four consecutive years could be treated as a Review Fund. When we applied such criteria to the Funds, several additional Funds would have been added to the list of Review Funds.
2. Profitability data. CMG should present to the Trustees each year the profitability of each Fund, each investment style and each complex (of which Atlantic is one) calculated as follows:
a. Management-only profitability should be calculated without reference to any Private Bank expense.
b. Profitability excluding distribution (which essentially covers the management and transfer agency functions) should be adjusted by removing from the expense calculation any portion of the Private Bank payment not attributable to the performance by the Private Bank of sub-transfer agency or sub-accounting functions.
c. Total profitability, including distribution: No adjustment for Private Bank expenses should be made, because all such expenses represent legitimate fund expenses to be taken into account in calculating CMG's profit margin including distribution.
d. Distribution only: This should include all Private Bank expenses other than those attributable to sub-transfer agency services.
Therefore, the following data need not be provided:
1. Adjusting total profitability data for Private Bank expenses
2. Adjusting profitability excluding distribution by backing out all Private Bank expenses.
3. Potential economies of scale. CMG and the IFC should continue to work on methods for more precisely quantifying to the extent possible the sources and magnitude of any economies of scale as CMG's mutual fund assets under management increase, to the extent that the data allows for meaningful year-over-year comparisons. The framework suggested in Section IV.D.4 may prove to be a useful model for such an analysis.
4. Competitive breakpoint analysis. As part of the annual fee evaluation process, the breakpoints of a select group of Atlantic Funds (which would differ each year) should continue to be compared to those of industry rivals to ensure that the Funds' breakpoint schedules remain within industry norms. As breakpoint schedules change relatively little each year, performing such a comparison for each Atlantic Fund each year would not be an efficient use of Trustee and CMG resources.
5. Cost allocation methodology. CMG's point that the current ABC system of allocating indirect expenses creates anomalous results in several cases, including sub-advised Funds, is well-taken. We would like to work with CMG over the forthcoming year on alternatives to the current system of allocating indirect expenses that (1) resolve the anomalies, (2) limit the amount of incremental effort on CMG's part and (3) remain faithful to the general principle that expenses should be allocated by time and effort to the extent reasonably possible.
6. Management fee disparities. CMG and the Atlantic Trustees, as part of any future study of management fees, should analyze the differences in management fee schedules, principally arising out of the reorganization of the former Excelsior Funds as Atlantic Funds. As part of that analysis, CMG should provide an explanation for any significant fee differences among comparable funds across fund families managed by CMA, such as differences in the management styles of different Funds included the same Lipper category. Finally, whenever CMG proposes a
39
management fee change or an expense cap for any mutual fund managed by CMA that is comparable to any Atlantic Fund, CMG should provide the Trustees with sufficient information about the proposal to allow the Trustees to assess the applicability of the proposed change to the relevant Atlantic Fund or Funds.
7. Tax-exempt Fund expense data. The expense rankings of certain tax-exempt Funds were adversely affected by including certain investment-related interest expenses that Lipper excluded in calculating the expense ratios of competitors. We recommend that CMG follow the Lipper practice and exclude such interest expenses from data submitted to Lipper to avoid unfairly disadvantaging the tax-exempt Funds.
8. Reduction of volume of paper documents submitted. The effort to rationalize and simplify the data presented to the Trustees and the process by which that data was prepared and organized was regarded as a success by all parties. We should continue to look for opportunities to reduce and simplify the presentation of 15(c) data, especially in the area of Fund profitability. The Fund "Dashboard" volume presents a large volume of Fund data on a single page. If it is continued, the Trustees may wish to consider receiving the underlying Lipper data on CD, rather than the current paper volumes.
Respectfully submitted,
Steven E. Asher
40
Important Information About This Report
The fund mails one shareholder report to each shareholder address. If you would like more than one report, please call shareholder services at 1-800-345-6611 and additional reports will be sent to you. This report has been prepared for shareholders of Columbia Connecticut Tax-Exempt Fund.
A description of the policies and procedures that the fund uses to determine how to vote proxies and a copy of the fund's voting records are available (i) at www.columbiamanagement.com; (ii) on the Securities and Exchange Commission's website at www.sec.gov, and (iii) without charge, upon request, by calling 1-800-368-0346. Information regarding how the fund voted proxies relating to portfolio securities during the 12-month period ended June 30 is available from the SEC's website. Information regarding how the fund voted proxies relating to portfolio securities is also available from the fund's website, www.columbiamanagement.com.
The fund files a complete schedule of portfolio holdings with the SEC for the first and third quarters of each fiscal year on Form N-Q. The fund's Form N-Q is available on the SEC's website at www.sec.gov and may be reviewed and copied at the SEC's Public Reference Room in Washington, DC. Information on the operation of the Public Reference Room may be obtained by calling 1-800-SEC-0330.
An investment in money market mutual funds is not a bank deposit, and is not insured or guaranteed by Bank of America, N.A. or any of its affiliates or by the Federal Deposit Insurance Corporation or any other government agency. Although money market mutual funds seek to preserve the value of your investment at $1.00 per share, it is possible to lose money by investing in money market mutual funds. Please see the prospectuses for a complete discussion of the risks of investing in money market mutual funds.
Please read and consider the investment objectives, risks, charges and expenses for any fund carefully before investing. For a prospectus which contains this and other important information about the fund, contact your Columbia Management representative or financial advisor or go to www.columbiamanagement.com.
Columbia Management Group, LLC ("Columbia Management") is the investment management division of Bank of America Corporation. Columbia Management entities furnish investment management services and products for institutional and individual investors. Columbia Funds are distributed by Columbia Management Distributors, Inc., member of FINRA, SIPC, part of Columbia Management and an affiliate of Bank of America Corporation.
Transfer Agent
Columbia Management Services, Inc.
P.O. Box 8081
Boston, MA 02266-8081
1-800-345-6611
Distributor
Columbia Management
Distributors, Inc.
One Financial Center
Boston, MA 02111
Investment Advisor
Columbia Management Advisors, LLC
100 Federal Street
Boston, MA 02110
41
Columbia Management®
Columbia Connecticut Tax-Exempt Fund
Annual Report, October 31, 2008
PRSRT STD
U.S. Postage
PAID
Holliston, MA
Permit NO. 20
©2008 Columbia Management Distributors, Inc.
One Financial Center, Boston, MA 02111-2621
800-345-6611 www.columbiafunds.com
SHC-42/157010-1008 (12/08) 08/65974
Columbia Management®
Annual Report
October 31, 2008
Columbia Massachusetts Tax-Exempt Fund
| NOT FDIC INSURED | | May Lose Value | |
|
| NOT BANK ISSUED | | No Bank Guarantee | |
|
Table of Contents
| Fund Profile | | | 1 | | |
|
| Economic Update | | | 2 | | |
|
| Performance Information | | | 3 | | |
|
| Understanding Your Expenses | | | 4 | | |
|
| Portfolio Manager's Report | | | 5 | | |
|
| Investment Portfolio | | | 7 | | |
|
Statement of Assets and
Liabilities | | | 12 | | |
|
| Statement of Operations | | | 13 | | |
|
Statement of Changes in
Net Assets | | | 14 | | |
|
| Financial Highlights | | | 16 | | |
|
| Notes to Financial Statements | | | 19 | | |
|
| Report of Independent Registered Public Accounting Firm | | | 27 | | |
|
| Federal Income Tax Information | | | 28 | | |
|
| Fund Governance | | | 29 | | |
|
| Board Consideration and Approval of Advisory Agreements | | | 34 | | |
|
| Summary of Management Fee Evaluation by Independent Fee Consultant | | | 37 | | |
|
| Important Information About This Report | | | 45 | | |
|
The views expressed in this report reflect the current views of the respective parties. These views are not guarantees of future performance and involve certain risks, uncertainties and assumptions that are difficult to predict, so actual outcomes and results may differ significantly from the views expressed. These views are subject to change at any time based upon economic, market or other conditions and the respective parties disclaim any responsibility to update such views. These views may not be relied on as investment advice and, because investment decisions for a Columbia Fund are based on numerous factors, may not be relied on as an indication of trading intent on behalf of any particular Columbia Fund. References to specific securities should not be construed as a recommendation or investment advice.
President's Message

Dear Shareholder:
We are pleased to provide this shareholder report for your Columbia Fund and hope you will find the portfolio management details, discussions and performance information helpful in monitoring your investments. As we've seen this past year, the financial markets can be quite volatile, with significant short-term price fluctuations. It's important to keep these ups and downs in perspective, particularly in light of your long-term investment strategy.
Staying the course with your long-term strategy typically involves riding out short-term price fluctuations, though we recognize that at times this can be tough. To support your efforts and give you the information you need to make prudent decisions, Columbia Management offers several valuable online resources. We encourage you to visit www.columbiamanagement.com/investor, where you can receive the most up-to-date information, including:
g Daily pricing and performance. View pricing and performance from a link in Fund Tracker on the homepage. This listing of funds is updated nightly with the current net asset value and the amount and percentage change from the prior day.
g News & Commentary. This tab provides links to quarterly fund commentaries and information from our investment strategies group, including trends in the economy and market impact.
If you would like more details on individual funds, select a fund from the dropdown menu on the top right side of the homepage for access to:
g Monthly and quarterly performance information.
g Portfolio holdings. Full holdings are updated monthly for money market funds, except for Columbia Cash Reserves, Columbia Government Plus Reserves, Columbia Government Reserves, Columbia Treasury Reserves and Columbia Money Market Reserves which are updated weekly, monthly for equity funds and quarterly for most other funds.
g Quarterly fact sheets. Accessible from the Literature tab in each fund page.
By registering on the site, you'll receive secured, 24-hour access to*:
g Mutual fund account details with balances, dividend and transaction information.
g Fund Tracker to customize your homepage with current net asset values for the funds that interest you.
g On-line transactions including purchases, exchanges and redemptions.
g Account maintenance for updating your address and dividend payment options.
g Electronic delivery of prospectuses and shareholder reports.
I encourage you to visit our website for access to the product information and tools described above. These valuable online resources can help you monitor your investments and provide direct access to your account. All of these tools, and more, can be found on www.columbiamanagement.com/investor.
While your financial advisor is a great resource for investment guidance, you can also access our website or call our service representatives at 800.345.6611 for additional assistance. We thank you for investing with Columbia Management and look forward to helping with your ongoing investment needs.
Sincerely,

Christopher L. Wilson
President, Columbia Funds
*Some restrictions apply. Shareholders who purchase shares through certain third-party organizations may not have the ability to register for online access.
Fund Profile – Columbia Massachusetts Tax-Exempt Fund
Summary
g For the 12-month period that ended October 31, 2008, the fund's Class A shares returned negative 5.46% without sales charge.
g The fund trailed its benchmark, the Barclays Capital Municipal Bond Index1, but performed better than its peer group average, the Lipper Massachusetts Municipal Debt Funds Classification.2
g Bonds in the mid-to-lower quality tiers held back performance compared to the benchmark. We believe the fund outperformed its peer group because it was focused on bonds in the 10-25 year maturity range and had less exposure to weaker performing sectors.
Portfolio Management
Gary Swayze has managed the fund since July 1998 and has been with the advisor or its predecessors or affiliate organizations since 1997.
1The Barclays Capital Municipal Bond Index (formerly the Lehman Brothers Municipal Bond Index) is considered representative of the broad market for investment-grade, tax exempt bonds with maturities of at least one year. Indices are not investments, do not incur fees or expenses and are not professionally managed. It is not possible to invest directly in an index. Securities in the fund may not match those in an index.
2Lipper Inc., a widely respected data provider in the industry, calculates an average total return (assuming reinvestment of distributions) for mutual funds with investment objectives similar to those of the fund. Lipper makes no adjustment for the effect of sales loads.
Performance data quoted represents past performance and current performance may be lower or higher. Past performance is no guarantee of future results. The investment return and principal value will fluctuate so that shares, when redeemed, may be worth more or less than the original cost. Please visit www.columbiafunds.com for daily and most recent month-end performance updates.
Summary
1-year return as of 10/31/08
| | | –5.46% | |
|
 | | Class A shares
(without sales charge) | |
|
| | | –3.30% | |
|
 | | Barclays Capital Municipal
Bond Index | |
|
Morningstar Style Box
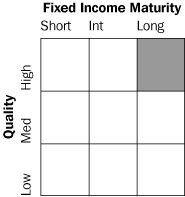
The Morningstar Style Box reveals a fund's investment strategy. For fixed-income funds the vertical axis shows the average credit quality of the bonds owned, and the horizontal axis shows interest rate sensitivity as measured by a bond's duration (short, intermediate or long). All of these numbers are drawn from the data most recently provided by the fund and entered into Morningstar's database as of quarter-end. Although the data is gathered from reliable sources, Morningstar cannot guarantee its completeness and accuracy. Information shown is as of 06/30/08.
1
Economic Update – Columbia Massachusetts Tax-Exempt Fund
Summary
For the 12-month period that ended October 31, 2008
g Despite volatility in many segments of the bond market, the Barclays Capital U.S. Aggregate Bond Index delivered a modest gain. High-yield bonds lost significant ground, as measured by the Merrill Lynch U.S. High Yield, Cash Pay Index.
Barclays
Index | | Merrill
Lynch Index | |
|
 | |  | |
|
g The broad U.S. stock market, as measured by the S&P 500 Index, returned negative 36.10%. Developed stock markets outside the United States returned negative 46.62%, as measured (in U.S. dollars) by the MSCI EAFE Index.
| S&P Index | | MSCI Index | |
|
 | |  | |
|
The Barclays Capital U.S. Aggregate Bond Index (formerly the Lehman Brothers U.S. Aggregate Bond Index) is a market value-weighted index that tracks the daily price, coupon, pay-downs and total return performance of fixed-rate, publicly placed, dollar-denominated and non-convertible investment grade debt issues with at least $250 million par amount outstanding and with at least one year to final maturity.
The Merrill Lynch U.S. High Yield, Cash Pay Index tracks the performance of non-investment-grade corporate bonds.
The Standard & Poor's (S&P) 500 Index tracks the performance of 500 widely held, large-capitalization US stocks.
The Morgan Stanley Capital International (MSCI) Europe, Australasia, Far East (EAFE) Index is a free float-adjusted market capitalization index that is designed to measure developed market equity performance, excluding the US and Canada.
Indices are not investments, do not incur fees or expenses and are not professionally managed. It is not possible to invest directly in an index. Securities in the fund may not match those in an index.
The pace of economic growth ground to a halt during the 12-month period that began November 1, 2007 and ended October 31, 2008. Although the economic growth was modestly positive at the beginning of the period, the economy slipped into recession in 2008, with little relief in sight. A host of factors weighed on consumers and businesses alike.
The most severe housing downturn in decades showed no sign of abating as inventories of homes for sale rose, home prices declined and tighter credit standards, a result of continued turmoil in the subprime mortgage market, made it more difficult for homebuyers to qualify for loans.
The labor market contracted for ten consecutive months, driving the unemployment rate to 6.5%, the highest rate since the early 1990s. Nearly 1.2 million jobs have been lost since the beginning of 2008, with announced layoffs likely to drive that number even higher in the months ahead. Manufacturing activity slowed and consumer spending declined, dimming hopes for the holiday season.
A weakening economy and turmoil in the financial markets took a toll on consumer confidence, which plummeted to the lowest point ever in the 40-year history of the Conference Board's monthly survey.
In an effort to inspire confidence in the capital markets, loosen the reins on credit and shore up economic growth, the Federal Reserve Board (the Fed) brought a key short-term rate—the federal funds rate—down from 4.50% to 1.0% during the 12-month period. Despite earlier concerns about inflation, a weak economic outlook has kept the Fed focused on stimulating economic growth through lowering borrowing rates. In fact, the one bright spot during this period of uncertainty has been lower energy and commodity prices. With oil trading near $60 per barrel at the end of the period, gasoline prices are forecasted to come down below $2 per gallon after peaking above $4 per gallon during the summer months.
Bonds eke out a small, positive return
The U.S. bond market seesawed during the 12-month period but managed to eke out a small gain as investors sought the relative safety of the highest quality sectors. After a weak start, bond prices in several sectors rose and yields declined as economic growth slowed and stock market volatility increased. The benchmark 10-year U.S. Treasury yield ended the period at just under 4.0%, nearly one-half percentage point lower than where it stood one year ago. In this environment, the Barclays Capital U.S. Aggregate Bond Index returned 0.30%. High-yield bonds disappointed as economic prospects weakened and default fears rose. The Merrill Lynch U.S. High Yield, Cash Pay Index returned negative 26.43%.
Stocks retreat as economic outlook darkens
Against a shifting economic backdrop, the U.S. stock market lost 36.10% for the 12-month period, as measured by the S&P 500 Index. Losses extended across all market caps and both growth and value, although value stocks held up somewhat better than growth stocks, as measured by their respective Russell indices.1 Stock markets outside the U.S. suffered even greater losses. The MSCI EAFE Index, a broad gauge of stock market performance in foreign developed markets, lost 46.62% (in U.S. dollars) for the period. Emerging stock markets, which have had a strong run over the past several years, were also caught in the downdraft. As investors backed away from risk, emerging markets suffered most of all. The MSCI Emerging Markets Index returned negative 56.22% (in U.S. dollars).2
Past performance is no guarantee of future results.
1The Russell 1000 Index measures the performance of 1,000 of the largest US companies, based on market capitalization. The Russell Midcap Index measures the performance of the 800 smallest companies in the Russell 1000 Index, as ranked by total market capitalization. The Russell 2000 Index measures the performance of the 2,000 smallest of the 3,000 largest US companies based on market capitalization.
2The Morgan Stanley Capital International (MSCI) Emerging Markets Index is a widely accepted index composed of a sample of companies from 25 countries representing the global emerging stock markets.
Indices are not investments, do not incur fees or expenses and are not professionally managed. It is not possible to invest directly in an index. Securities in the fund may not match those in an index.
2
Performance Information – Columbia Massachusetts Tax-Exempt Fund
Growth of a $10,000 investment 11/01/98 – 10/31/08
The chart above shows the growth in value of a hypothetical $10,000 investment in Class A shares of Columbia Massachusetts Tax-Exempt Fund during the stated time period, and does not reflect the deduction of taxes that a shareholder may pay on fund distributions or on the redemption of fund shares. The Barclays Capital Municipal Bond Index is considered representative of the broad market for investment-grade, tax exempt bonds with maturities of at least one year. Indices are not investments, do not incur fees or expenses and are not professionally managed. It is not possible to invest directly in an index. Securities in the fund may not match those in an index.
Performance of a $10,000 investment 11/01/98 – 10/31/08 ($)
| Sales charge | | without | | with | |
| Class A | | | 14,357 | | | | 13,675 | | |
| Class B | | | 13,328 | | | | 13,328 | | |
| Class C | | | 13,727 | | | | 13,727 | | |
Average annual total return as of 10/31/08 (%)
| Share class | | A | | B | | C | |
| Inception | | 04/10/87 | | 06/08/92 | | 08/01/97 | |
| Sales charge | | without | | with | | without | | with | | without | | with | |
| 1-year | | | –5.46 | | | | –9.95 | | | | –6.16 | | | | –10.70 | | | | –5.88 | | | | –6.79 | | |
| 5-year | | | 1.88 | | | | 0.89 | | | | 1.12 | | | | 0.79 | | | | 1.42 | | | | 1.42 | | |
| 10-year | | | 3.68 | | | | 3.18 | | | | 2.91 | | | | 2.91 | | | | 3.22 | | | | 3.22 | | |
Average annual total return as of 09/30/08 (%)
| Share class | | A | | B | | C | |
| Sales charge | | without | | with | | without | | with | | without | | with | |
| 1-year | | | –3.35 | | | | –7.94 | | | | –4.07 | | | | –8.71 | | | | –3.79 | | | | –4.72 | | |
| 5-year | | | 2.06 | | | | 1.07 | | | | 1.30 | | | | 0.97 | | | | 1.60 | | | | 1.60 | | |
| 10-year | | | 3.83 | | | | 3.32 | | | | 3.06 | | | | 3.06 | | | | 3.36 | | | | 3.36 | | |
The "with sales charge" returns include the maximum initial sales charge of 4.75% for Class A shares, the applicable contingent deferred sales charge of 5.00% in the first year, declining to 1.00% in the sixth year and eliminated thereafter for Class B shares and 1.00% for Class C shares for the first year only. The "without sales charge" returns do not include the effect of sales charges. If they had, returns would be lower.
Performance results reflect any fee waivers or reimbursements of fund expenses by the investment advisor and/or any of its affiliates. Absent these fee waivers or expense reimbursement arrangements, performance results would have been lower.
All results shown assume reinvestment of distributions. Please see the fund's prospectus for details. Performance for different share classes will vary based on differences in sales charges and the fees associated with each class.
The tables do not reflect the deduction of taxes a shareholder may pay on fund distributions or on the redemption of fund shares
Performance data quoted represents past performance and current performance may be lower or higher. Past performance is no guarantee of future results. The investment return and principal value will fluctuate so that shares, when redeemed, may be worth more or less than the original cost. Please visit www.columbiafunds.com for daily and most recent month-end performance updates.
Annual operating expense ratio (%)*
| Class A | | | 1.01 | | |
| Class B | | | 1.76 | | |
| Class C | | | 1.76 | | |
* The annual operating expense ratio is as stated in the fund's prospectus that is current as of the date of this report. Differences in expense ratios disclosed elsewhere in this report may result from including fee waivers and expense reimbursements as well as different time periods used in calculating the ratios.
3
Understanding Your Expenses – Columbia Massachusetts Tax-Exempt Fund
Estimating your actual expenses
To estimate the expenses that you paid over the period, first you will need your account balance at the end of the period:
g For shareholders who receive their account statements from Columbia Management Services, Inc., your account balance is available online at www.columbiafunds.com or by calling Shareholder Services at 800.345.6611.
g For shareholders who receive their account statements from their financial intermediary, contact your financial intermediary to obtain your account balance.
1. Divide your ending account balance by $1,000. For example, if an account balance was $8,600 at the end of the period, the result would be 8.6.
2. In the section of the table below titled "Expenses paid during the period," locate the amount for your share class. You will find this number in the column labeled "Actual." Multiply this number by the result from step 1. Your answer is an estimate of the expenses you paid on your account during the period.
If the value of your account falls below the minimum initial investment requirement applicable to you, your account generally will be subject to a $20 annual fee. This fee is not included in the accompanying table. If you are subject to the fee, keep it in mind when you are estimating the ongoing expenses of investing in the fund and when comparing the expenses of this fund with other funds.
As a fund shareholder, you incur two types of costs. There are transaction costs, which generally include sales charges on purchases and may include redemption fees or exchange fees. There are also ongoing costs, which generally include investment advisory fees, distribution and service (Rule 12b-1) fees and other fund expenses. The information on this page is intended to help you understand the ongoing costs of investing in the fund and to compare these costs with the ongoing costs of investing in other mutual funds.
Analyzing your fund's expenses by share class
To illustrate these ongoing costs, we have provided an example and calculated the expenses paid by investors in each share class during the period. The information in the following table is based on an initial investment of $1,000, which is invested at the beginning of the period and held for the entire period. Expense information is calculated two ways and each method provides you with different information. The amount listed in the "Actual" column is calculated using the fund's actual operating expenses and total return for the period. The amount listed in the "Hypothetical" column for each share class assumes that the return each year is 5% before expenses and is calculated based on the fund's actual operating expenses. You should not use the hypothetical account values and expenses to estimate either your actual account balance at the end of the period or the expenses you paid during this period.
Compare with other funds
Since all mutual funds are required to include the same hypothetical calculations about expenses in shareholder reports, you can use this information to compare the ongoing costs of investing in the fund with other funds. To do so, compare the 5% hypothetical example with the 5% hypothetical examples that appear in the shareholder reports of other funds. As you compare hypothetical examples of other funds, it is important to note that hypothetical examples are meant to highlight the ongoing costs of investing in a fund and do not reflect any transaction costs, such as sales charges, redemption fees or exchange fees.
05/01/08 – 10/31/08
| | | Account value at the
beginning of the period ($) | | Account value at the
end of the period ($) | | Expenses paid
during the period ($) | | Fund's annualized
expense ratio (%) | |
| | | Actual | | Hypothetical | | Actual | | Hypothetical | | Actual | | Hypothetical | | Actual | |
| Class A | | | 1,000.00 | | | | 1,000.00 | | | | 937.71 | | | | 1,020.46 | | | | 4.53 | | | | 4.72 | | | | 0.93 | | |
| Class B | | | 1,000.00 | | | | 1,000.00 | | | | 934.09 | | | | 1,016.69 | | | | 8.17 | | | | 8.52 | | | | 1.68 | | |
| Class C | | | 1,000.00 | | | | 1,000.00 | | | | 935.50 | | | | 1,018.20 | | | | 6.71 | | | | 7.00 | | | | 1.38 | | |
Expenses paid during the period are equal to the annualized expense ratio for the share class, multiplied by the average account value over the period, then multiplied by the number of days in the fund's most recent fiscal half-year and divided by 366.
Had the investment advisor and/or any of its affiliates not waived fees or reimbursed a portion of expenses for Class C shares, account value at the end of the period would have been reduced.
It is important to note that the expense amounts shown in the table are meant to highlight only ongoing costs of investing in the fund and do not reflect any transaction costs, such as sales charges, redemption fees or exchange fees. Therefore, the hypothetical examples provided may not help you determine the relative total costs of owning shares of different funds. If these transaction costs were included, your costs would have been higher.
4
Portfolio Manager's Report – Columbia Massachusetts Tax-Exempt Fund
For the 12-month period that ended October 31, 2008, the fund's Class A shares returned negative 5.46% without sales charge. The fund's benchmark, the Barclays Capital Municipal Bond Index, returned negative 3.30%1, and the average return of the fund's peer group, the Lipper Massachusetts Municipal Debt Funds Classification, was negative 7.80%.2 The fund's shortfall to its benchmark was the result of two factors: the index is national in scope and it has less exposure than the fund to longer-term (20 to 30 years) and mid-to-lower quality sectors, which were underperformers during the period. We believe the fund outperformed its peer group average because it had a greater focus on bonds in the 10-25 year maturity range and comparatively less exposure to weaker performing sectors.
Economic slowdown has sharp impact
A year ago, we anticipated an economic slowdown and an easing of inflationary pressures fed by high commodity prices and worldwide growth. But the intensity of the slowdown has been unexpectedly sharp. In hopes of reviving the economy, the Federal Reserve Board (the Fed) cut short-term interest rates aggressively while Congress passed a stimulus package to aid middle-class households.
Fallout from a widespread credit crisis caused municipal bonds to underperform Treasuries over this period. Sinking home values and waves of foreclosures began to shrink tax revenues and swell deficits for state and local governments. In addition, downgrades of municipal bond insurers dramatically reduced the number of AAA-rated3 municipal bonds. As a result, investors demanded higher yields for insured issues, which represent over half of the new issue market. Meanwhile, volatile markets forced some institutions to sell off their municipal bond holdings, especially hedge funds.
Amid this economic stress, the yield difference between higher and lower quality municipal bonds widened. The period's worst performance came in lower quality, long-maturity sectors where yields rose substantially. Skittish investors preferred to confine their commitments to better quality issues with maturities of five years or less, causing yields to decline and raising prices modestly for these bonds.
Lower and medium quality fund holdings and those with long maturities hurt results. We achieved better returns among intermediate-term prerefunded bonds, which are backed by escrowed government securities.
In Massachusetts, steps to tighten the budget
The commonwealth faces a large budget gap for the current fiscal year, based on an anticipated revenue shortfall of more than $1 billion and $300 million in over-budget
1The Barclays Capital Municipal Bond Index is considered representative of the broad market for investment-grade, tax-exempt bonds with maturities of at least one year. Indices are not investments, do not incur fees or expenses and are not professionally managed. It is not possible to invest directly in an index. Securities in the fund may not match those in an index.
2Lipper Inc., a widely respected data provider in the industry, calculates an average total return (assuming reinvestment of distributions) for mutual funds with investment objectives similar to those of the fund. Lipper makes no adjustment for the effect of sales loads.
3The credit quality ratings represent those of Moody's Investors Service, Inc. ("Moody's"), Standard & Poor's Corporation ("S&P") or Fitch Ratings ("Fitch") credit ratings. The ratings represent their opinions as to the quality of the securities they rate. Ratings are relative and subjective and are not absolute standards of quality. The security's credit quality does not eliminate risk.
Performance data quoted represents past performance and current performance may be lower or higher. Past performance is no guarantee of future results. The investment return and principal value will fluctuate so that shares, when redeemed, may be worth more or less than the original cost. Please visit www.columbiafunds.com for daily and most recent month-end performance updates.
Net asset value per share
as of 10/31/08 ($)
| Class A | | | 6.98 | | |
| Class B | | | 6.98 | | |
| Class C | | | 6.98 | | |
Distributions declared per share
11/01/07 – 10/31/08 ($)
| Class A | | | 0.31 | | |
| Class B | | | 0.25 | | |
| Class C | | | 0.27 | | |
A portion of the fund's income may be subject to the alternative minimum tax. The fund may at times purchase tax-exempt securities at a discount. Some, or all, of this discount may be included in the fund's ordinary income, and is taxable when distributed.
30-day SEC yields
as of 10/31/08 (%)
| Class A | | | 4.19 | | |
| Class B | | | 3.66 | | |
| Class C | | | 3.95 | | |
The 30-day SEC yields reflect the fund's earning power, net of expenses, expressed as an annualized percentage of the public offering price per share at the end of the period.
Taxable-equivalent SEC yields
as of 10/31/08 (%)
| Class A | | | 6.81 | | |
| Class B | | | 5.95 | | |
| Class C | | | 6.42 | | |
Taxable-equivalent SEC yields are based on the combined maximum effective 35.0% federal income tax rate and the applicable state income tax rate. This tax rate does not reflect the phase out of exemptions or the reduction of the otherwise allowable deductions that occur when adjusted gross income exceeds certain levels.
5
Portfolio Manager's Report (continued) – Columbia Massachusetts Tax-Exempt Fund
Top 5 sectors
as of 10/31/08 (%)
| Refunded/Escrowed | | | 17.9 | | |
| Education | | | 17.6 | | |
| State General Obligations | | | 11.0 | | |
| Water & Sewer | | | 8.8 | | |
| Special Non-Property Tax | | | 7.2 | | |
Quality breakdown
as of 10/31/08 (%)
| AAA | | | 30.8 | | |
| AA | | | 39.2 | | |
| A | | | 12.9 | | |
| BBB | | | 4.7 | | |
| BB | | | 4.3 | | |
| Non-rated | | | 4.3 | | |
| Cash & Equivalents | | | 3.8 | | |
Maturity breakdown
as of 10/31/08 (%)
| 1-3 years | | | 2.2 | | |
| 3-5 years | | | 2.8 | | |
| 5-7 years | | | 4.9 | | |
| 7-10 years | | | 20.8 | | |
| 10-15 years | | | 34.9 | | |
| 15-20 years | | | 6.8 | | |
| 20-25 years | | | 12.6 | | |
| 25 years and over | | | 11.2 | | |
| Cash & Equivalents | | | 3.8 | | |
Ratings shown in the quality breakdown represent the rating assigned to a particular bond by one of the following nationally-recognized rating agencies: Standard and Poor's, Moody's Investors Service, Inc. or Fitch Ratings Ltd. Ratings are relative and subjective and are not absolute standards of quality. The fund's credit quality does not remove market risk.
The fund is actively managed and the composition of its portfolio will change over time. Information provided is calculated as a percentage of net assets.
outlays. Meanwhile, the financial crisis has led to job cuts in the high-paying financial sector, as well as in construction and manufacturing.
The governor has called for the elimination of 1000 public jobs and reductions in the commonwealth's pension contribution. These measures would close most of the gap but the rest will have to come from the Commonwealth's rainy day fund. Once past the current crisis, we believe that Massachusetts will benefit from its unquestioned strengths in the biotech, financial services, technology and education industries.
A cautious, deliberate approach
A widening difference in yield between higher and lower quality securities of comparable maturities offers potential opportunities in bonds in the mid and lower quality tiers. However, we are being selective in our choice of securities because we do not believe that the challenges facing municipal issuers will dissipate quickly in light of the current economic slowdown. In this environment, we believe that short-term interest rates are likely to remain low and further stimulus moves are possible. Eventually, we believe that taxes may rise, making municipal bonds more attractive. However, we believe that continued stimulus programs could also trigger inflation over the longer-term, a potential negative for bond investors.
Portfolio holdings and characteristics are subject to change periodically and may not be representative of current holdings and characteristics. The outlook for the fund may differ from that presented for other Columbia Funds.
Tax-exempt investing offers current tax-exempt income, but it also involves special risks. The value of the fund will be affected by interest rate changes and the creditworthiness of issues held in the fund. When interest rates go up, bond prices generally drop and vice versa.
Interest income from certain tax-exempt bonds may be subject to certain state and local taxes and, if applicable, the alternative minimum tax. Capital gains are not exempt from income taxes.
The fund is non-diversified, which generally means that it may invest a greater percentage of its total assets in the securities of fewer issuers than a "diversified" fund. This increases the risk that a change in the value of any one investment held by the fund could affect the overall value of the fund more than it would affect that of a diversified fund holding a greater number of investments. Accordingly, the fund's value will likely be more volatile than the value of more diversified funds
Single-state municipal bond funds pose additional risks due to limited geographical diversification.
6
Investment Portfolio – Columbia Massachusetts Tax-Exempt Fund
October 31, 2008
| Municipal Bonds – 95.2% | |
| | | Par ($) | | Value ($) | |
| Education – 21.8% | |
| Education – 17.6% | |
| MA College Building Authority | |
Series 1994 A,
7.500% 05/01/14 | | | 1,825,000 | | | | 2,050,935 | | |
| MA Development Finance Agency | |
Boston University:
Series 1999 P,
6.000% 05/15/59 | | | 1,000,000 | | | | 949,780 | | |
Series 2005 T-1,
5.000% 10/01/39 | | | 2,000,000 | | | | 1,650,180 | | |
College of The Holy Cross,
Series 2002,
Insured: AMBAC
5.250% 09/01/32 | | | 2,000,000 | | | | 1,944,220 | | |
Emerson College,
Series 2006,
5.000% 01/01/23 | | | 2,500,000 | | | | 2,234,850 | | |
| MA Health & Educational Facilities Authority | |
Boston College,
Series 2008,
5.500% 06/01/35 | | | 1,000,000 | | | | 987,570 | | |
Harvard University,
Series 1991 N,
6.250% 04/01/20 | | | 2,675,000 | | | | 3,066,807 | | |
Massachusetts Institute of Technology,
Series 2002 K:
5.375% 07/01/17 | | | 4,250,000 | | | | 4,625,487 | | |
| 5.500% 07/01/32 | | | 1,500,000 | | | | 1,554,495 | | |
Northeastern University,
Series 2008 R,
5.000% 10/01/28 | | | 1,000,000 | | | | 896,400 | | |
Tufts University,
Series 2002 J:
5.500% 08/15/16 | | | 1,250,000 | | | | 1,356,913 | | |
| 5.500% 08/15/18 | | | 1,000,000 | | | | 1,072,910 | | |
| Education Total | | | 22,390,547 | | |
| Prep School – 2.5% | |
| MA Development Finance Agency | |
Dexter School,
Series 2007,
4.500% 05/01/26 | | | 1,600,000 | | | | 1,365,376 | | |
| MA Health & Educational Facilities Authority | |
Learning Center for Deaf Children,
Series 1999 C,
6.100% 07/01/19 | | | 1,000,000 | | | | 899,750 | | |
| | | Par ($) | | Value ($) | |
| MA Industrial Finance Agency | |
Cambridge Friends School,
Series 1998,
5.750% 09/01/18 | | | 1,000,000 | | | | 880,390 | | |
| Prep School Total | | | 3,145,516 | | |
| Student Loan – 1.7% | |
| MA Educational Financing Authority | |
Sereies 2008 H, AMT,
Insured: AGO
6.350% 01/01/30 | | | 1,000,000 | | | | 926,900 | | |
Series 2002 E, AMT,
Insured: AMBAC
5.000% 01/01/13 | | | 1,340,000 | | | | 1,324,550 | | |
| Student Loan Total | | | 2,251,450 | | |
| Education Total | | | 27,787,513 | | |
| Health Care – 11.5% | |
| Continuing Care Retirement – 2.4% | |
MA Boston Industrial Development
Financing Authority | |
Springhouse, Inc.,
Series 1998,
5.875% 07/01/18 | | | 950,000 | | | | 853,603 | | |
| MA Development Finance Agency | |
Linden Ponds, Inc.,
Series 2007 A,
5.750% 11/15/42 | | | 2,000,000 | | | | 1,262,880 | | |
Loomis House, Inc.,
Series 2002 A,
6.900% 03/01/32 | | | 1,000,000 | | | | 875,490 | | |
| Continuing Care Retirement Total | | | 2,991,973 | | |
| Health Services – 0.7% | |
| MA Development Finance Agency | |
Boston Biomedical Research Institute,
Series 1999,
5.750% 02/01/29 | | | 1,200,000 | | | | 905,028 | | |
| Health Services Total | | | 905,028 | | |
| Hospitals – 5.5% | |
| MA Development Finance Agency | |
Massachusetts Biomedical Research Corp.,
Series 2000,
6.250% 08/01/20 | | | 1,000,000 | | | | 1,011,170 | | |
See Accompanying Notes to Financial Statements.
7
Columbia Massachusetts Tax-Exempt Fund
October 31, 2008
| Municipal Bonds (continued) | |
| | | Par ($) | | Value ($) | |
| MA Health & Educational Facilities Authority | |
Covenant Health System,
Series 2002,
6.000% 07/01/31 | | | 790,000 | | | | 727,630 | | |
Jordan Hospital,
Series 2003 E,
6.750% 10/01/33 | | | 1,500,000 | | | | 1,212,915 | | |
Tri-County Medical Associates, Inc.,
Series 2007,
5.000% 07/15/27 | | | 1,695,000 | | | | 1,199,331 | | |
| MA Industrial Finance Agency | |
Massachusetts Biomedical Research Corp.,
Series 1989 A-2
(a) 08/01/10 | | | 3,000,000 | | | | 2,821,950 | | |
| Hospitals Total | | | 6,972,996 | | |
| Intermediate Care Facilities – 1.0% | |
| MA Development Finance Agency | |
Evergreen Center, Inc.,
Series 2005,
5.500% 01/01/35 | | | 750,000 | | | | 529,448 | | |
New England Center for Children,
Series 1998,
5.875% 11/01/18 | | | 850,000 | | | | 748,646 | | |
| Intermediate Care Facilities Total | | | 1,278,094 | | |
| Nursing Homes – 1.9% | |
| MA Industrial Finance Agency | |
Chelsea Jewish Nursing Home,
Series 1997 A,
Insured: FHA
6.500% 08/01/37 | | | 810,000 | | | | 821,429 | | |
GF/Massachusetts, Inc.,
Series 1994,
8.300% 07/01/23 | | | 1,955,000 | | | | 1,606,130 | | |
| Nursing Homes Total | | | 2,427,559 | | |
| Health Care Total | | | 14,575,650 | | |
| Housing – 1.6% | |
| Assisted Living/Senior – 0.6% | |
| MA Development Finance Agency | |
VOA Concord Assisted Living, Inc.,
Series 2007,
5.200% 11/01/41 | | | 1,145,000 | | | | 722,747 | | |
| Assisted Living/Senior Total | | | 722,747 | | |
| | | Par ($) | | Value ($) | |
| Multi-Family – 1.0% | |
| MA Housing Finance Agency | |
Series 2004 A, AMT,
Insured: FSA
5.250% 07/01/25 | | | 1,500,000 | | | | 1,271,445 | | |
| Multi-Family Total | | | 1,271,445 | | |
| Housing Total | | | 1,994,192 | | |
| Other – 23.6% | |
| Other – 2.7% | |
| MA Development Finance Agency | |
WGBH Educational Foundation:
Series 2002 A,
Insured: AMBAC
5.750% 01/01/42 | | | 2,000,000 | | | | 1,872,480 | | |
Series 2008 A,
Insured: AGO
4.500% 01/01/39 | | | 2,000,000 | | | | 1,578,320 | | |
| Other Total | | | 3,450,800 | | |
| Pool/Bond Bank – 3.0% | |
| MA Water Pollution Abatement Trust | |
Series 1999 A,
6.000% 08/01/17 | | | 2,445,000 | | | | 2,744,317 | | |
Series 2002-8,
5.000% 08/01/17 | | | 20,000 | | | | 20,615 | | |
Series 2005-11,
4.750% 08/01/23 | | | 25,000 | | | | 24,351 | | |
Series 2006,
5.250% 08/01/24 | | | 1,000,000 | | | | 1,041,380 | | |
| Pool/Bond Bank Total | | | 3,830,663 | | |
| Refunded/Escrowed (b) – 17.9% | |
| MA College Building Authority | |
Series 1999 A,
Insured: MBIA,
Escrowed to Maturity:
(a) 05/01/18 | | | 7,760,000 | | | | 4,878,479 | | |
| (a) 05/01/23 | | | 6,000,000 | | | | 2,751,360 | | |
| MA Development Finance Agency | |
Western New England College,
Series 2002,
Pre-refunded 12/01/12,
5.875% 12/01/22 | | | 905,000 | | | | 971,056 | | |
| MA Health & Educational Facilities Authority | |
Covenant Health System,
Series 2002,
Pre-refunded 01/01/12,
6.000% 07/01/31 | | | 210,000 | | | | 229,936 | | |
See Accompanying Notes to Financial Statements.
8
Columbia Massachusetts Tax-Exempt Fund
October 31, 2008
| Municipal Bonds (continued) | |
| | | Par ($) | | Value ($) | |
| MA Turnpike Authority | |
Series 1993 A,
Escrowed to Maturity,
5.000% 01/01/20 | | | 4,500,000 | | | | 4,621,005 | | |
| MA Water Resources Authority | |
Series 1992 A,
Escrowed to Maturity,
6.500% 07/15/19 | | | 5,100,000 | | | | 5,790,999 | | |
Series 1993 C,
Insured: AMBAC,
Escrowed to Maturity,
5.250% 12/01/15 | | | 610,000 | | | | 652,627 | | |
PR Commonwealth of Puerto Rico Public
Buildings Authority | |
Series 2002 C,
Escrowed to Maturity,
5.500% 07/01/14 | | | 5,000 | | | | 5,504 | | |
PR Commonwealth of Puerto Rico Public
Finance Corp. | |
Series 1998 A,
Insured: AMBAC,
Economically Defeased to Maturity
5.375% 06/01/19 | | | 2,190,000 | | | | 2,275,388 | | |
Series 2002 E,
Escrowed to Maturity,
6.000% 08/01/26 | | | 600,000 | | | | 646,088 | | |
| Refunded/Escrowed Total | | | 22,822,442 | | |
| Other Total | | | 30,103,905 | | |
| Other Revenue – 1.4% | |
| Hotels – 1.4% | |
MA Boston Industrial Development
Financing Authority | |
Crosstown Center Hotel LLC,
Series 2002, AMT,
6.500% 09/01/35 | | | 2,220,000 | | | | 1,717,303 | | |
| Hotels Total | | | 1,717,303 | | |
| Other Revenue Total | | | 1,717,303 | | |
| Tax-Backed – 19.3% | |
| Local General Obligations – 1.1% | |
| MA Norwell | |
Series 2003,
Insured: FGIC
5.000% 11/15/22 | | | 1,410,000 | | | | 1,390,542 | | |
| Local General Obligations Total | | | 1,390,542 | | |
| | | Par ($) | | Value ($) | |
| Special Non-Property Tax – 7.2% | |
| MA Bay Transportation Authority | |
Series 2004 C,
5.250% 07/01/21 | | | 1,500,000 | | | | 1,566,315 | | |
Series 2005 B,
Insured: MBIA
5.500% 07/01/27 | | | 1,000,000 | | | | 1,046,490 | | |
Series 2008 B,
5.250% 07/01/27 | | | 710,000 | | | | 724,392 | | |
MA Special Obligation Dedicated
Tax Revenue | |
| Series 2005, | |
Insured: FGIC
5.500% 01/01/30 | | | 2,500,000 | | | | 2,465,975 | | |
PR Commonwealth of Puerto Rico Highway &
Transportation Authority | |
Series 2002 E,
Insured: FSA
5.500% 07/01/14 | | | 1,000,000 | | | | 1,045,900 | | |
Series 2006 BB,
Insured: FSA
5.250% 07/01/22 | | | 1,500,000 | | | | 1,449,510 | | |
PR Commonwealth of Puerto Rico Sales Tax
Financing Corp. | |
Series 2007 A,
5.250% 08/01/57 | | | 1,000,000 | | | | 862,550 | | |
| Special Non-Property Tax Total | | | 9,161,132 | | |
| State General Obligations – 11.0% | |
| MA Bay Transportation Authority | |
Series 1991 A,
Insured: MBIA
7.000% 03/01/21 | | | 1,500,000 | | | | 1,719,945 | | |
Series 1992 B,
Insured: MBIA
6.200% 03/01/16 | | | 3,725,000 | | | | 4,090,348 | | |
Series 1994,
Insured: FGIC
7.000% 03/01/14 | | | 1,250,000 | | | | 1,434,038 | | |
| MA State | |
Series 2001 D,
5.500% 11/01/15 | | | 1,000,000 | | | | 1,090,350 | | |
Series 2003 D,
Insured: AMBAC
5.500% 10/01/19 | | | 450,000 | | | | 480,051 | | |
Series 2004 B,
5.250% 08/01/22 | | | 1,000,000 | | | | 1,041,150 | | |
See Accompanying Notes to Financial Statements.
9
Columbia Massachusetts Tax-Exempt Fund
October 31, 2008
| Municipal Bonds (continued) | |
| | | Par ($) | | Value ($) | |
PR Commonwealth of Puerto Rico
Public Buildings Authority | |
Series 2002 C,
5.500% 07/01/14 | | | 495,000 | | | | 502,410 | | |
| PR Commonwealth of Puerto Rico | |
Public Improvement:
Series 1998,
5.250% 07/01/18 | | | 1,000,000 | | | | 957,510 | | |
Series 2001,
Insured: FSA
5.500% 07/01/16 | | | 1,750,000 | | | | 1,816,307 | | |
Series 2007 A,
5.500% 07/01/21 | | | 1,000,000 | | | | 942,450 | | |
| State General Obligations Total | | | 14,074,559 | | |
| Tax-Backed Total | | | 24,626,233 | | |
| Transportation – 4.4% | |
| Air Transportation – 1.2% | |
| MA Port Authority | |
Bosfuel Corp.,
Series 2007, AMT,
Insured: FGIC
5.000% 07/01/32 | | | 2,000,000 | | | | 1,495,980 | | |
| Air Transportation Total | | | 1,495,980 | | |
| Airports – 2.4% | |
| MA Port Authority | |
Series 1999 D, AMT,
Insured: FGIC
6.000% 07/01/29 | | | 2,000,000 | | | | 1,867,620 | | |
Series 2007 A,
Insured: FSA
4.500% 07/01/37 | | | 1,500,000 | | | | 1,188,780 | | |
| Airports Total | | | 3,056,400 | | |
| Toll Facilities – 0.8% | |
| MA Turnpike Authority | |
Series 1997 C,
Insured: MBIA
(a) 01/01/20 | | | 2,000,000 | | | | 1,051,640 | | |
| Toll Facilities Total | | | 1,051,640 | | |
| Transportation Total | | | 5,604,020 | | |
| | | Par ($) | | Value ($) | |
| Utilities – 11.6% | |
| Municipal Electric – 2.8% | |
| MA Development Finance Agency | |
Devens Electric System,
Series 2001,
6.000% 12/01/30 | | | 1,000,000 | | | | 971,380 | | |
PR Commonwealth of Puerto Rico
Electric Power Authority | |
Series 2003 NN,
Insured: MBIA
5.250% 07/01/21 | | | 1,360,000 | | | | 1,265,711 | | |
Series 2007 VV,
Insured: MBIA
5.250% 07/01/29 | | | 1,000,000 | | | | 878,450 | | |
Series 2008 WW,
5.000% 07/01/28 | | | 500,000 | | | | 428,755 | | |
| Municipal Electric Total | | | 3,544,296 | | |
| Water & Sewer – 8.8% | |
| MA Boston Water & Sewer Commission | |
Series 1992 A,
5.750% 11/01/13 | | | 1,000,000 | | | | 1,057,540 | | |
Series 1993 A,
5.250% 11/01/19 | | | 4,750,000 | | | | 4,952,350 | | |
| MA Water Resources Authority | |
Series 1993 C:
Insured: AMBAC
5.250% 12/01/15 | | | 390,000 | | | | 404,933 | | |
Insured: MBIA
5.250% 12/01/15 | | | 1,070,000 | | | | 1,116,395 | | |
Series 2002 J,
Insured: FSA:
5.250% 08/01/19 | | | 1,000,000 | | | | 1,053,440 | | |
| 5.500% 08/01/21 | | | 2,500,000 | | | | 2,654,925 | | |
| Water & Sewer Total | | | 11,239,583 | | |
| Utilities Total | | | 14,783,879 | | |
Total Municipal Bonds
(cost of $126,613,364) | | | 121,192,695 | | |
| | | Shares | | | |
| Investment Company – 0.2% | |
Dreyfus Massachusetts
Municipal Money Market Fund
(7 day yield of 1.760%) | | | 199,259 | | | | 199,259 | | |
Total Investment Company
(cost of $199,259) | | | 199,259 | | |
See Accompanying Notes to Financial Statements.
10
Columbia Massachusetts Tax-Exempt Fund
October 31, 2008
| Short-Term Obligations – 0.5% | |
| | | Par ($) | | Value ($) | |
| Variable Rate Demand Notes (c) – 0.5% | |
| MA Development Finance Agency | |
Harvard University,
Series 2006 B-1,
0.700% 07/15/36 | | | 200,000 | | | | 200,000 | | |
MA Health & Educational Facilities
Authority | |
Harvard University,
Series 1999 R,
0.700% 11/01/49 | | | 500,000 | | | | 500,000 | | |
| Variable Rate Demand Notes Total | | | 700,000 | | |
Total Short-Term Obligations
(cost of $700,000) | | | 700,000 | | |
Total Investments – 95.9%
(cost of $127,512,623) (d) | | | 122,091,954 | | |
| Other Assets & Liabilities, Net – 4.1% | | | 5,245,343 | | |
| Net Assets – 100.0% | | | 127,337,297 | | |
Notes to Investment Portfolio:
(a) Zero coupon bond.
(b) The Fund has been informed that each issuer has placed direct obligations of the U.S. Government in an irrevocable trust, solely for the payment of principal and interest.
(c) These securities are payable upon demand and are secured by letters of credit or other credit support agreements from banks. These interest rates change periodically and the interest rates shown reflect the rates at October 31, 2008.
(d) Cost for federal income tax purposes is $127,235,211.
At October 31, 2008, the composition of the Fund by revenue source is as follows:
| Holdings By Revenue Source (Unaudited) | | % of
Net Assets | |
| Education | | | 21.8 | | |
| Tax-Backed | | | 19.3 | | |
| Refunded/Escrowed | | | 17.9 | | |
| Utilities | | | 11.6 | | |
| Health Care | | | 11.5 | | |
| Other | | | 5.7 | | |
| Transportation | | | 4.4 | | |
| Housing | | | 1.6 | | |
| Other Revenue | | | 1.4 | | |
| | | | 95.2 | | |
| Investment Company | | | 0.2 | | |
| Short-Term Obligations | | | 0.5 | | |
| Other Assets & Liabilities, Net | | | 4.1 | | |
| | | | 100.0 | | |
| Acronym | | Name | |
| AGO | | Assured Guaranty Corp. | |
|
| AMBAC | | AMBAC Assurance Corp. | |
|
| AMT | | Alternative Minimum Tax | |
|
| FGIC | | Financial Guaranty Insurance Co. | |
|
| FHA | | Federal Housing Administration | |
|
| FSA | | Financial Security Assurance, Inc. | |
|
| MBIA | | MBIA Insurance Corp. | |
|
See Accompanying Notes to Financial Statements.
11
Statement of Assets and Liabilities – Columbia Massachusetts Tax-Exempt Fund
October 31, 2008
| Assets | | Investments, at cost | | $ | 127,512,623 | | |
| | | Investments, at value | | $ | 122,091,954 | | |
| | | Cash | | | 3,853,187 | | |
| | | Receivable for: | | | | | |
| | | Fund shares sold | | | 24,301 | | |
| | | Interest | | | 1,959,204 | | |
| | | Trustees' deferred compensation plan | | | 23,740 | | |
| | | Other assets | | | 301 | | |
| | | Total Assets | | | 127,952,687 | | |
| Liabilities | | Payable for: | | | | | |
| | | Fund shares repurchased | | | 221,767 | | |
| | | Distributions | | | 187,524 | | |
| | | Investment advisory fee | | | 54,413 | | |
| | | Transfer agent fee | | | 21,198 | | |
| | | Pricing and bookkeeping fees | | | 6,485 | | |
| | | Trustees' fees | | | 163 | | |
| | | Audit fee | | | 33,800 | | |
| | | Custody fee | | | 1,272 | | |
| | | Distribution and service fees | | | 35,023 | | |
| | | Chief compliance officer expenses | | | 54 | | |
| | | Trustees' deferred compensation plan | | | 23,740 | | |
| | | Other liabilities | | | 29,951 | | |
| | | Total Liabilities | | | 615,390 | | |
| | | Net Assets | | | 127,337,297 | | |
| Net Assets Consist of | | Paid-in capital | | | 131,929,033 | | |
| | | Undistributed net investment income | | | 369,382 | | |
| | | Accumulated net realized gain | | | 459.551 | | |
| | | Net unrealized depreciation on investments | | | (5,420,669 | ) | |
| | | Net Assets | | | 127,337,297 | | |
| Class A | | Net assets | | $ | 108,149,440 | | |
| | | Shares outstanding | | | 15,503,688 | | |
| | | Net asset value per share | | $ | 6.98 | (a) | |
| | | Maximum sales charge | | | 4.75 | % | |
| | | Maximum offering price per share ($6.98/0.9525) | | $ | 7.33 | (b) | |
| Class B | | Net assets | | $ | 10,517,572 | | |
| | | Shares outstanding | | | 1,507,762 | | |
| | | Net asset value and offering price per share | | $ | 6.98 | (a) | |
| Class C | | Net assets | | $ | 8,670,285 | | |
| | | Shares outstanding | | | 1,242,927 | | |
| | | Net asset value and offering price per share | | $ | 6.98 | (a) | |
(a) Redemption price per share is equal to net asset value less any applicable contingent deferred sales charge.
(b) On sales of $50,000 or more the offering price is reduced.
See Accompanying Notes to Financial Statements.
12
Statement of Operations – Columbia Massachusetts Tax-Exempt Fund
For the Year Ended October 31, 2008
| | | | | ($) | |
| Investment Income | | Interest | | | 7,262,809 | | |
| | | Dividends | | | 17,150 | | |
| | | Total Investment Income | | | 7,279,959 | | |
| Expenses | | Investment advisory fee | | | 722,531 | | |
| | | Distribution fee: | | | | | |
| | | Class B | | | 100,723 | | |
| | | Class C | | | 72,757 | | |
| | | Service fee: | | | | | |
| | | Class A | | | 277,174 | | |
| | | Class B | | | 30,579 | | |
| | | Class C | | | 22,110 | | |
| | | Transfer agent fee | | | 51,893 | | |
| | | Pricing and bookkeeping fees | | | 69,933 | | |
| | | Trustees' fees | | | 17,779 | | |
| | | Custody fee | | | 9,930 | | |
| | | Chief compliance officer expenses | | | 649 | | |
| | | Other expenses | | | 141,429 | | |
| | | Expenses before interest expense and fees | | | 1,517,487 | | |
| | | Interest expense and fees | | | 50,533 | | |
| | | Total Expenses | | | 1,568,020 | | |
| | | Fees waived by distributor—Class C | | | (29,096 | ) | |
| | | Expense reductions | | | (3,855 | ) | |
| | | Net Expenses | | | 1,535,069 | | |
| | | Net Investment Income | | | 5,744,890 | | |
| Net Realized and Unrealized Gain (Loss) on Investments and Futures Contracts | |
| | | Net realized gain (loss) on: | | | | | |
| | | Investments | | | 1,217,787 | | |
| | | Futures contracts | | | (17,182 | ) | |
| | | Net realized gain | | | 1,200,605 | | |
| | | Net change in unrealized appreciation (depreciation) on: | | | | | |
| | | Investments | | | (14,617,873 | ) | |
| | | Futures contracts | | | 66,388 | | |
| | | Net change in unrealized appreciation (depreciation) | | | (14,551,485 | ) | |
| | | Net Loss | | | (13,350,880 | ) | |
| | | Net Decrease Resulting from Operations | | | (7,605,990 | ) | |
See Accompanying Notes to Financial Statements.
13
Statement of Changes in Net Assets – Columbia Massachusetts Tax-Exempt Fund
| | | | | Year Ended October 31, | |
| Increase (Decrease) in Net Assets | | | | 2008 ($) | | 2007 ($) | |
| Operations | | Net investment income | | | 5,744,890 | | | | 6,261,578 | | |
| | | Net realized gain (loss) on investments and
futures contracts | | | 1,200,605 | | | | (109,217 | ) | |
| | | Net change in unrealized appreciation (depreciation)
on investments and futures contracts | | | (14,551,485 | ) | | | (3,764,170 | ) | |
| | | Net Increase (Decrease) Resulting from Operations | | | (7,605,990 | ) | | | 2,388,191 | | |
| Distributions to Shareholders | | From net investment income: | | | | | | | | | |
| | | Class A | | | (4,924,183 | ) | | | (5,224,712 | ) | |
| | | Class B | | | (443,714 | ) | | | (577,275 | ) | |
| | | Class C | | | (350,134 | ) | | | (422,977 | ) | |
| | | From net realized gains: | | | | | | | | | |
| | | Class A | | | — | | | | (1,239,462 | ) | |
| | | Class B | | | — | | | | (189,466 | ) | |
| | | Class C | | | — | | | | (120,859 | ) | |
| | | Total Distributions to Shareholders | | | (5,718,031 | ) | | | (7,774,751 | ) | |
| | | Net Capital Share Transactions | | | (13,795,105 | ) | | | (12,563,583 | ) | |
| | | Total Decrease in Net Assets | | | (27,119,126 | ) | | | (17,950,143 | ) | |
| Net Assets | | Beginning of period | | | 154,456,423 | | | | 172,406,566 | | |
| | | End of period | | | 127,337,297 | | | | 154,456,423 | | |
| | | Undistributed net investment income, at end of period | | | 369,382 | | | | 358,052 | | |
See Accompanying Notes to Financial Statements.
14
Statement of Changes in Net Assets (continued) – Capital Stock Activity
| | | Year Ended October 31, | |
| | | 2008 | | 2007 | |
| | | Shares | | Dollars ($) | | Shares | | Dollars ($) | |
| Class A | |
| Subscriptions | | | 882,973 | | | | 6,678,958 | | | | 1,235,563 | | | | 9,584,171 | | |
| Distributions reinvested | | | 392,191 | | | | 2,938,491 | | | | 510,589 | | | | 3,967,962 | | |
| Redemptions | | | (2,530,546 | ) | | | (19,074,394 | ) | | | (2,279,635 | ) | | | (17,610,668 | ) | |
| Net Decrease | | | (1,255,382 | ) | | | (9,456,945 | ) | | | (533,483 | ) | | | (4,058,535 | ) | |
| Class B | |
| Subscriptions | | | 42,455 | | | | 323,103 | | | | 38,454 | | | | 301,682 | | |
| Distributions reinvested | | | 40,274 | | | | 302,130 | | | | 69,641 | | | | 541,996 | | |
| Redemptions | | | (518,466 | ) | | | (3,855,607 | ) | | | (834,976 | ) | | | (6,467,145 | ) | |
| Net Decrease | | | (435,737 | ) | | | (3,230,374 | ) | | | (726,881 | ) | | | (5,623,467 | ) | |
| Class C | |
| Subscriptions | | | 211,865 | | | | 1,602,702 | | | | 160,143 | | | | 1,243,939 | | |
| Distributions reinvested | | | 26,640 | | | | 199,738 | | | | 40,297 | | | | 313,083 | | |
| Redemptions | �� | | (385,242 | ) | | | (2,910,226 | ) | | | (572,697 | ) | | | (4,438,603 | ) | |
| Net Decrease | | | (146,737 | ) | | | (1,107,786 | ) | | | (372,257 | ) | | | (2,881,581 | ) | |
See Accompanying Notes to Financial Statements.
15
Financial Highlights – Columbia Massachusetts Tax-Exempt Fund
Selected data for a share outstanding throughout each period is as follows:
| | | Year Ended October 31, | |
| Class A Shares | | 2008 | | 2007 | | 2006 | | 2005 | | 2004 | |
| Net Asset Value, Beginning of Period | | $ | 7.69 | | | $ | 7.94 | | | $ | 7.83 | | | $ | 8.17 | | | $ | 8.16 | | |
| Income from Investment Operations: | |
| Net investment income (a) | | | 0.31 | | | | 0.31 | | | | 0.31 | | | | 0.32 | | | | 0.33 | | |
Net realized and unrealized gain (loss)
on investments and futures contracts | | | (0.71 | ) | | | (0.18 | ) | | | 0.17 | | | | (0.23 | ) | | | 0.17 | | |
| Total from Investment Operations | | | (0.40 | ) | | | 0.13 | | | | 0.48 | | | | 0.09 | | | | 0.50 | | |
| Less Distributions to Shareholders: | |
| From net investment income | | | (0.31 | ) | | | (0.31 | ) | | | (0.31 | ) | | | (0.32 | ) | | | (0.33 | ) | |
| From net realized gains | | | — | | | | (0.07 | ) | | | (0.06 | ) | | | (0.11 | ) | | | (0.16 | ) | |
| Total Distributions to Shareholders | | | (0.31 | ) | | | (0.38 | ) | | | (0.37 | ) | | | (0.43 | ) | | | (0.49 | ) | |
| Net Asset Value, End of Period | | $ | 6.98 | | | $ | 7.69 | | | $ | 7.94 | | | $ | 7.83 | | | $ | 8.17 | | |
| Total return (b) | | | (5.46 | )% | | | 1.65 | % | | | 6.30 | % | | | 1.09 | %(c) | | | 6.28 | % | |
Ratios to Average Net Assets/
Supplemental Data: | |
| Net expenses before interest expense and fees (d) | | | 0.93 | % | | | 0.94 | % | | | 0.93 | % | | | 0.90 | % | | | 0.91 | % | |
| Interest expense and fees (e) | | | 0.03 | % | | | 0.07 | % | | | 0.06 | % | | | 0.04 | % | | | 0.01 | % | |
| Net expenses (d) | | | 0.96 | % | | | 1.01 | % | | | 0.99 | % | | | 0.94 | % | | | 0.92 | % | |
| Waiver/Reimbursement | | | — | | | | — | | | | — | | | | — | %(f) | | | — | | |
| Net investment income (d) | | | 4.08 | % | | | 3.96 | % | | | 3.99 | % | | | 4.03 | % | | | 4.05 | % | |
| Portfolio turnover rate | | | 16 | % | | | 14 | % | | | 6 | % | | | 6 | % | | | 6 | % | |
| Net assets, end of period (000's) | | $ | 108,149 | | | $ | 128,833 | | | $ | 137,232 | | | $ | 146,149 | | | $ | 157,198 | | |
(a) Per share data was calculated using the average shares outstanding during the period.
(b) Total return at net asset value assuming all distributions reinvested and no initial sales charge or contingent deferred sales charge.
(c) Had the investment advisor and/or any of its affiliates not waived fees or reimbursed a portion of expenses, total return would have been reduced.
(d) The benefits derived from expense reductions had an impact of less than 0.01%.
(e) Interest expense and fees relate to the liability for floating-rate notes issued in conjunction with inverse floater securities transactions.
(f) Rounds to less than 0.01%.
See Accompanying Notes to Financial Statements.
16
Financial Highlights – Columbia Massachusetts Tax-Exempt Fund
Selected data for a share outstanding throughout each period is as follows:
| | | Year Ended October 31, | |
| Class B Shares | | 2008 | | 2007 | | 2006 | | 2005 | | 2004 | |
| Net Asset Value, Beginning of Period | | $ | 7.69 | | | $ | 7.94 | | | $ | 7.83 | | | $ | 8.17 | | | $ | 8.16 | | |
| Income from Investment Operations: | |
| Net investment income (a) | | | 0.25 | | | | 0.25 | | | | 0.25 | | | | 0.26 | | | | 0.27 | | |
Net realized and unrealized gain (loss)
on investments and futures contracts | | | (0.71 | ) | | | (0.18 | ) | | | 0.17 | | | | (0.23 | ) | | | 0.16 | | |
| Total from Investment Operations | | | (0.46 | ) | | | 0.07 | | | | 0.42 | | | | 0.03 | | | | 0.43 | | |
| Less Distributions to Shareholders: | |
| From net investment income | | | (0.25 | ) | | | (0.25 | ) | | | (0.25 | ) | | | (0.26 | ) | | | (0.26 | ) | |
| From net realized gains | | | — | | | | (0.07 | ) | | | (0.06 | ) | | | (0.11 | ) | | | (0.16 | ) | |
| Total Distributions to Shareholders | | | (0.25 | ) | | | (0.32 | ) | | | (0.31 | ) | | | (0.37 | ) | | | (0.42 | ) | |
| Net Asset Value, End of Period | | $ | 6.98 | | | $ | 7.69 | | | $ | 7.94 | | | $ | 7.83 | | | $ | 8.17 | | |
| Total return (b) | | | (6.16 | )% | | | 0.90 | % | | | 5.50 | % | | | 0.34 | %(c) | | | 5.49 | % | |
Ratios to Average Net Assets/
Supplemental Data: | |
| Net expenses before interest expense and fees (d) | | | 1.68 | % | | | 1.69 | % | | | 1.68 | % | | | 1.65 | % | | | 1.66 | % | |
| Interest expense and fees (e) | | | 0.03 | % | | | 0.07 | % | | | 0.06 | % | | | 0.04 | % | | | 0.01 | % | |
| Net expenses (d) | | | 1.71 | % | | | 1.76 | % | | | 1.74 | % | | | 1.69 | % | | | 1.67 | % | |
| Waiver/Reimbursement | | | — | | | | — | | | | — | | | | — | %(f) | | | — | | |
| Net investment income (d) | | | 3.32 | % | | | 3.21 | % | | | 3.25 | % | | | 3.28 | % | | | 3.29 | % | |
| Portfolio turnover rate | | | 16 | % | | | 14 | % | | | 6 | % | | | 6 | % | | | 6 | % | |
| Net assets, end of period (000's) | | $ | 10,518 | | | $ | 14,941 | | | $ | 21,192 | | | $ | 27,208 | | | $ | 34,035 | | |
(a) Per share data was calculated using the average shares outstanding during the period.
(b) Total return at net asset value assuming all distributions reinvested and no contingent deferred sales charge.
(c) Had the investment advisor and/or any of its affiliates not waived fees or reimbursed a portion of expenses, total return would have been reduced.
(d) The benefits derived from expense reductions had an impact of less than 0.01%.
(e) Interest expense and fees relate to the liability for floating-rate notes issued in conjunction with inverse floater securities transactions.
(f) Rounds to less than 0.01%.
See Accompanying Notes to Financial Statements.
17
Financial Highlights – Columbia Massachusetts Tax-Exempt Fund
Selected data for a share outstanding throughout each period is as follows:
| | | Year Ended October 31, | |
| Class C Shares | | 2008 | | 2007 | | 2006 | | 2005 | | 2004 | |
| Net Asset Value, Beginning of Period | | $ | 7.69 | | | $ | 7.94 | | | $ | 7.83 | | | $ | 8.17 | | | $ | 8.16 | | |
| Income from Investment Operations: | |
| Net investment income (a) | | | 0.27 | | | | 0.27 | | | | 0.28 | | | | 0.29 | | | | 0.29 | | |
Net realized and unrealized gain (loss)
on investments and futures contracts | | | (0.71 | ) | | | (0.18 | ) | | | 0.16 | | | | (0.24 | ) | | | 0.17 | | |
| Total from Investment Operations | | | (0.44 | ) | | | 0.09 | | | | 0.44 | | | | 0.05 | | | | 0.46 | | |
| Less Distributions to Shareholders: | |
| From net investment income | | | (0.27 | ) | | | (0.27 | ) | | | (0.27 | ) | | | (0.28 | ) | | | (0.29 | ) | |
| From net realized gains | | | — | | | | (0.07 | ) | | | (0.06 | ) | | | (0.11 | ) | | | (0.16 | ) | |
| Total Distributions to Shareholders | | | (0.27 | ) | | | (0.34 | ) | | | (0.33 | ) | | | (0.39 | ) | | | (0.45 | ) | |
| Net Asset Value, End of Period | | $ | 6.98 | | | $ | 7.69 | | | $ | 7.94 | | | $ | 7.83 | | | $ | 8.17 | | |
| Total return (b)(c) | | | (5.88 | )% | | | 1.20 | % | | | 5.82 | % | | | 0.64 | % | | | 5.81 | % | |
Ratios to Average Net Assets/
Supplemental Data: | |
| Net expenses before interest expense and fees (d) | | | 1.38 | % | | | 1.39 | % | | | 1.38 | % | | | 1.35 | % | | | 1.36 | % | |
| Interest expense and fees (e) | | | 0.03 | % | | | 0.07 | % | | | 0.06 | % | | | 0.04 | % | | | 0.01 | % | |
| Net expenses (d) | | | 1.41 | % | | | 1.46 | % | | | 1.44 | % | | | 1.39 | % | | | 1.37 | % | |
| Waiver/Reimbursement | | | 0.30 | % | | | 0.30 | % | | | 0.30 | % | | | 0.30 | % | | | 0.30 | % | |
| Net investment income (d) | | | 3.63 | % | | | 3.51 | % | | | 3.54 | % | | | 3.57 | % | | | 3.58 | % | |
| Portfolio turnover rate | | | 16 | % | | | 14 | % | | | 6 | % | | | 6 | % | | | 6 | % | |
| Net assets, end of period (000's) | | $ | 8,670 | | | $ | 10,683 | | | $ | 13,982 | | | $ | 13,986 | | | $ | 13,360 | | |
(a) Per share data was calculated using the average shares outstanding during the period.
(b) Total return at net asset value assuming all distributions reinvested and no contingent deferred sales charge.
(c) Had the investment advisor and/or any of its affiliates not waived fees or reimbursed a portion of expenses, total return would have been reduced.
(d) The benefits derived from expense reductions had an impact of less than 0.01%.
(e) Interest expense and fees relate to the liability for floating-rate notes issued in conjunction with inverse floater securities transactions.
See Accompanying Notes to Financial Statements.
18
Notes to Financial Statements – Columbia Massachusetts Tax-Exempt Fund
October 31, 2008
Note 1. Organization
Columbia Massachusetts Tax-Exempt Fund (the "Fund"), a series of Columbia Funds Series Trust I (the "Trust"), is a non-diversified portfolio. The Trust is a Massachusetts business trust registered under the Investment Company Act of 1940, as amended (the "1940 Act"), as an open-end management investment company.
Investment Objective
The Fund seeks total return, consisting of current income exempt from federal income tax and Massachusetts individual income tax and of capital appreciation, consistent with moderate fluctuation of principal.
Fund Shares
The Trust may issue an unlimited number of shares, and the Fund offers three classes of shares: Class A, Class B and Class C. Each share class has its own expense structure and sales charges, as applicable.
Class A shares are subject to a maximum front-end sales charge of 4.75% based on the amount of initial investment. Class A shares purchased without an initial sales charge in accounts aggregating $1 million to $50 million at the time of purchase are subject to a 1.00% contingent deferred sales charge ("CDSC") if the shares are sold within one year after purchase. Class B shares are subject to a maximum CDSC of 5.00% based upon the holding period after purchase. Class B shares will convert to Class A shares eight years after purchase. Class C shares are subject to a 1.00% CDSC on shares sold within one year after purchase.
Note 2. Significant Accounting Policies
The preparation of financial statements in accordance with accounting principles generally accepted in the United States of America ("GAAP") requires management to make certain estimates and assumptions that affect the reported amounts of assets and liabilities, the disclosure of contingent assets and liabilities at the date of the financial statements and the reported amounts of revenue and expenses during the reporting period. Actual results could differ from those estimates. The following is a summary of significant accounting policies consistently followed by the Fund in the preparation of its financial statements.
Security Valuation
Debt securities generally are valued by pricing services approved by the Trust's Board of Trustees, based upon market transactions for normal, institutional-size trading units of similar securities. The services may use various pricing techniques which take into account appropriate factors such as yield, quality, coupon rate, maturity, type of issue, trading characteristics and other data, as well as broker quotes. Debt securities for which quotations are readily available are valued at an over-the-counter or exchange bid quotation.
Certain debt securities, which tend to be more thinly traded and of lesser quality, are priced based on fundamental analysis of the financial condition of the issuer and the estimated value of any collateral. Valuations developed through pricing techniques may vary from the actual amounts realized upon sale of the securities, and the potential variation may be greater for those securities valued using fundamental analysis.
Short-term debt obligations maturing within 60 days are valued at amortized cost, which approximates market value.
Investments in other open-end investment companies are valued at net asset value.
Futures contracts are valued at the settlement price established each day by the board of trade or exchange on which they are traded.
Investments for which market quotations are not readily available, or that have quotations which management believes are not reliable, are valued at fair value as determined in good faith under consistently applied procedures established by and under the general supervision of the Board of Trustees. If a security is valued at fair value, such value is likely to be different from the last quoted market price for the security.
In September 2006, Statement of Financial Accounting Standards No. 157, Fair Value Measurements ("SFAS 157"), was issued. SFAS 157 is effective for fiscal years beginning after November 15, 2007. SFAS 157 defines fair value, establishes a framework for measuring fair value and expands disclosures about fair value measurements. Management is evaluating the impact the application of SFAS 157 will have on the Fund's financial statement disclosures.
19
Columbia Massachusetts Tax-Exempt Fund, October 31, 2008
Security Transactions
Security transactions are accounted for on the trade date. Cost is determined and gains (losses) are based upon the specific identification method for both financial statement and federal income tax purposes.
In March 2008, Statement of Financial Accounting Standards No. 161, Disclosures about Derivative Instruments and Hedging Activities-an amendment of FASB Statement No. 133 ("SFAS 161"), was issued. SFAS 161 is effective for fiscal years and interim periods beginning after November 15, 2008. SFAS 161 requires additional discussion about the reporting entity's derivative instruments and hedging activities, by providing for qualitative disclosures about the objectives and strategies for using derivatives, quantitative data about the fair value of and gains and losses on derivative contracts, and details of credit-risk-related contingent features in their hedged positions. Management is evaluating the impact the application of SFAS 161 will have on the Fund's financial statement disclo sures.
Futures Contracts
The Fund may invest in futures for both hedging and non-hedging purposes, including, for example, to seek to enhance returns or as a substitute for a position in an underlying asset.
The use of futures contracts involves certain risks, which include: (1) imperfect correlation between the price movement of the instruments and the underlying securities, (2) inability to close out positions due to differing trading hours, or the temporary absence of a liquid market, for either the instruments or the underlying securities, or (3) an inaccurate prediction of the future direction of interest rates by Columbia Management Advisors, LLC ("Columbia"), the Fund's investment advisor. Any of these risks may involve amounts exceeding the variation margin recorded in the Fund's Statement of Assets and Liabilities at any given time.
Upon entering into a futures contract, the Fund pledges cash or securities with the broker in an amount sufficient to meet the initial margin requirement. Subsequent payments are made or received by the Fund equal to the daily change in the contract value and are recorded as variation margin receivable or payable and offset in unrealized gains or losses. The Fund recognizes a realized gain or loss when the contract is closed or expires.
Floating-Rate Notes Issued in Conjunction with Securities Held
The Fund may sell a fixed-rate bond ("Fixed-Rate Bond") to a broker who deposits the Fixed-Rate Bond into a special-purpose entity from which are issued floating-rate notes ("Floating-Rate Notes") that are sold to third parties. The Floating-Rate Notes have interest rates that reset weekly and the holders of the Floating-Rate Notes have the option to tender their notes to the broker at par at each reset date. A residual certificate (an "Inverse Floater"), which pays interest equal to the difference between the Fixed-Rate Bond and the Floating-Rate Notes, is also issued by the special-purpose entity. The Inverse Floater also gives the holder the right to cause the Floating-Rate Note to be called at par and to require transfer of the Fixed-Rate Bond to the holder of the Inverse Floater, thereby liquidating the special-purpose entity. In certain transactions, the Fund ultimately receives the Inverse Floater plus the cash equivalent of the proceeds raised from the issuance of the Floating-Rate Notes in exchange for the Fixed-Rate Bonds.
Although the Fund physically holds the Inverse Floater, the transaction is accounted for as a secured borrowing pursuant to Statement of Financial Accounting Standards No. 140, Accounting for Transfers and Servicing of Financial Assets and Extinguishments of Liabilities ("SFAS 140"), because of its unilateral right to cause the liquidation of the special-purpose entity and recover the Fixed-Rate Bond it originally sold to the broker. In accordance with SFAS 140, the Fund includes the Fixed-Rate Bond on the Portfolio of Investments and recognizes the Floating-Rate Notes as a liability on the Statement of Assets and Liabilities.
Income Recognition
Interest income is recorded on the accrual basis. Premium and discount are amortized and accreted, respectively, on all debt securities, unless otherwise noted. Original issue discount is accreted to interest income over the life of the security with a corresponding increase in the cost basis. Dividend income is recorded on the ex-date.
Expenses
General expenses of the Trust are allocated to the Fund and the other series of the Trust based upon relative net assets or other expense allocation methodologies determined by the nature of the expense. Expenses directly attributable to the Fund are charged to the Fund.
20
Columbia Massachusetts Tax-Exempt Fund, October 31, 2008
Determination of Class Net Asset Value
All income, expenses (other than class-specific expenses, as shown on the Statement of Operations) and realized and unrealized gains (losses) are allocated to each class of the Fund on a daily basis for purposes of determining the net asset value of each class. Income and expenses are allocated to each class based on the settled shares method, while realized and unrealized gains (losses) are allocated based on the relative net assets of each class.
Federal Income Tax Status
The Fund intends to qualify each year as a "regulated investment company" under Subchapter M of the Internal Revenue Code, as amended, and will distribute substantially all of its tax exempt or taxable income, if any, for its tax year, and as such will not be subject to federal income taxes. In addition, the Fund intends to distribute in each calendar year substantially all of its net investment income, capital gains and certain other amounts, if any, such that the Fund should not be subject to federal excise tax. Therefore, no federal income or excise tax provision is recorded.
Distributions to Shareholders
Distributions from net investment income are declared daily and distributed monthly. Net realized capital gains, if any, are distributed at least annually. Income distributions and capital gain distributions are determined in accordance with federal income tax regulations which may differ from GAAP.
Indemnification
In the normal course of business, the Fund enters into contracts that contain a variety of representations and warranties and which provide general indemnities. The Fund's maximum exposure under these arrangements is unknown because this would involve future claims against the Fund. Also, under the Trust's organizational documents and by contract, the Trustees and officers of the Trust are indemnified against certain liabilities that may arise out of actions relating to their duties to the Trust. However, based on experience, the Fund expects the risk of loss due to these representations, warranties and indemnities to be minimal.
Note 3. Federal Tax Information
The timing and character of income and capital gain distributions are determined in accordance with income tax regulations, which may differ from GAAP. Reclassifications are made to the Fund's capital accounts for permanent tax differences to reflect income and gains available for distribution (or available capital loss carryforwards) under income tax regulations.
For the year ended October 31, 2008, permanent book and tax basis differences resulting primarily from differing treatments for distribution reclassifications and discount accretion/premium amortization on debt securities were identified and reclassified among the components of the Fund's net assets as follows:
Undistributed
Net Investment
Income | | Accumulated
Net Realized
Gain | | Paid-In Capital | |
| $ | (15,529 | ) | | $ | 15,528 | | | $ | 1 | | |
Net investment income and net realized gains (losses), as disclosed on the Statement of Operations, and net assets were not affected by this reclassification.
The tax character of distributions paid during the years ended October 31, 2008 and October 31, 2007 was as follows:
| | | October 31, | |
| | | 2008 | | 2007 | |
| Tax-Exempt Income | | $ | 5,714,770 | | | $ | 6,271,824 | | |
| Ordinary Income* | | | 3,261 | | | | 73,183 | | |
| Long-Term Capital Gains | | | — | | | | 1,429,744 | | |
* For tax purposes short-term capital gain distributions, if any, are considered ordinary income distributions.
As of October 31, 2008, the components of distributable earnings on a tax basis were as follows:
Undistributed
Tax-Exempt
Income | | Undistributed
Long-Term
Capital Gains | | Net Unrealized
Depreciation* | |
| $ | 311,934 | | | $ | 783,051 | | | $ | (5,143,257 | ) | |
* The differences between book-basis and tax-basis net unrealized depreciation are primarily due to discount accretion/premium amortization on debt securities.
21
Columbia Massachusetts Tax-Exempt Fund, October 31, 2008
Unrealized appreciation and depreciation at October 31, 2008, based on cost of investments for federal income tax purposes, were:
| Unrealized appreciation | | $ | 3,830,358 | | |
| Unrealized depreciation | | | (8,973,615 | ) | |
| Net unrealized depreciation | | $ | (5,143,257 | ) | |
Capital loss carryfowards of $246,754 were utilized during the year ended October 31, 2008.
The Fund adopted Financial Accounting Standards Board ("FASB") Interpretation No. 48, Accounting for Uncertainty in Income Taxes—an Interpretation of FASB Statement No. 109 ("FIN 48"), effective April 30, 2008. FIN 48 requires management to determine whether a tax position of the Fund is more likely than not to be sustained upon examination by the applicable taxing authority, including resolution of any related appeals or litigation processes, based on the technical merits of the position. The tax benefit to be recognized is measured as the largest amount of benefit that is greater than fifty percent likely of being realized upon ultimate settlement. FIN 48 was applied to all existing tax positions upon initial adoption. Management has evaluated the known implications of FIN 48 on its computation of net assets for the Fund. As a result of this evaluation, management has concluded that FIN 48 did not have any effect on the Fund's financial statements and no cumulative effect adjustments were recorded. However, management's conclusions regarding FIN 48 may be subject to review and adjustment at a later date based on factors including, but not limited to, further implementation guidance from the FASB, new tax laws, regulations, and administrative interpretations (including relevant court decisions). The Fund's federal tax returns for the prior three fiscal years remain subject to examination by the Internal Revenue Service. The Fund is not aware of any tax positions for which it is reasonably possible that the total amounts of unrecognized tax benefits will significantly change in the next twelve months.
Note 4. Fees and Compensation Paid to Affiliates
Investment Advisory Fee
Columbia, an indirect, wholly owned subsidiary of Bank of America Corporation ("BOA"), provides investment advisory, administrative and other services to the Fund. Columbia receives a monthly investment advisory fee based on the Fund's pro-rata portion of the combined average daily net assets of the Fund, Columbia California Tax-Exempt Fund, Columbia Connecticut Tax-Exempt Fund and Columbia New York Tax-Exempt Fund as follows:
| Combined Average Daily Net Assets | | Annual Fee Rate | |
| First $1 billion | | | 0.50 | % | |
| $1 billion to $3 billion | | | 0.45 | % | |
| Over $3 billion | | | 0.40 | % | |
For the year ended October 31, 2008, the Fund's effective investment advisory fee rate was 0.50% of the Fund's average daily net assets.
Pricing and Bookkeeping Fees
The Fund has entered into a Financial Reporting Services Agreement (the "Financial Reporting Services Agreement") with State Street Bank & Trust Company ("State Street") and Columbia pursuant to which State Street provides financial reporting services to the Fund. The Fund has also entered into an Accounting Services Agreement (collectively with the Financial Reporting Services Agreement, the "State Street Agreements") with State Street and Columbia pursuant to which State Street provides accounting services to the Fund. Under the State Street Agreements, the Fund pays State Street an annual fee of $38,000 paid monthly plus an additional monthly fee based on an annualized percentage rate of average daily net assets of the Fund for the month. The aggregate fee will not exceed $140,000 per year (exclusive of out-of-pocket expenses and charges). The Fund also reimburses State Street for certain out-of-pocket expenses and charge s.
The Fund has entered into a Pricing and Bookkeeping Oversight and Services Agreement (the "Services Agreement") with Columbia. Under the Services Agreement, Columbia provides services related to Fund expenses and the
22
Columbia Massachusetts Tax-Exempt Fund, October 31, 2008
requirements of the Sarbanes-Oxley Act of 2002, and provides oversight of the accounting and financial reporting services provided by State Street. Under the Services Agreement, the Fund reimburses Columbia for out-of-pocket expenses. Prior to January 1, 2008, the Fund also reimbursed Columbia for accounting oversight services, services related to Fund expenses and the requirements of the Sarbanes-Oxley Act of 2002.
For the year ended October 31, 2008, the amount charged to the Fund by affiliates included on the Statement of Operations under "Pricing and bookkeeping fees" aggregated to $1,952.
Transfer Agent Fee
Columbia Management Services, Inc. (the "Transfer Agent"), an affiliate of Columbia and an indirect, wholly owned subsidiary of BOA, provides shareholder services to the Fund and has contracted with Boston Financial Data Services ("BFDS") to serve as sub-transfer agent. The Transfer Agent is entitled to receive a fee for its services, paid monthly, at the annual rate of $17.34 per open account plus reimbursement of certain sub-transfer agent fees paid by the Transfer Agent (exclusive of BFDS fees), calculated based on assets held in omnibus accounts and intended to recover the cost of payments to other parties (including affiliates of BOA) for services to those accounts. The Transfer Agent pays the fees of BFDS for services as sub-transfer agent and is not entitled to reimbursement for such fees from the Fund. The Transfer Agent may also retain, as additional compensation for its services, fees for wire, telephone and redemption orders, IRA trustee agent fees and account transcript fees due to the Transfer Agent from shareholders of the Fund and credits (net of bank charges) earned with respect to balances in accounts the Transfer Agent maintains in connection with its services to the Fund. The Transfer Agent also receives reimbursement for certain out-of-pocket expenses.
An annual minimum account balance fee of $20 may apply to certain accounts with a value below the Fund's initial minimum investment requirements to reduce the impact of small accounts on transfer agent fees. These minimum account balance fees are recorded as part of expense reductions on the Statement of Operations. For the year ended October 31, 2008, these minimum account balance fees reduced total expenses by $920.
Underwriting Discounts, Service and Distribution Fees
Columbia Management Distributors, Inc. (the "Distributor"), an affiliate of Columbia and an indirect, wholly owned subsidiary of BOA, is the principal underwriter of the Fund's shares. For the year ended October 31, 2008, the Distributor has retained net underwriting discounts of $10,095 on sales of the Fund's Class A shares and received net CDSC fees of $13, $14,829 and $1,922 on Class A, Class B and Class C share redemptions, respectively.
The Fund has adopted distribution and shareholder servicing plans (the "Plans") pursuant to Rule 12b-1 under the 1940 Act, which require the payment of distribution and service fees. The fees are intended to compensate the Distributor and/or eligible selling and/or servicing agents for selling shares of the Fund and providing services to investors. The service fee is equal to 0.10% annually of the net assets attributable to shares of the Fund issued prior to December 1, 1994 and 0.25% annually of the net assets attributable to shares issued thereafter. This arrangement results in an annual rate of service fee for all shares that is a blend between the 0.10% and 0.25% rates. For the year ended October 31, 2008, the Fund's effective service fee rate was 0.23% of the Fund's average daily net assets attributable to Class A, Class B and Class C shares.
The Plans also require the payment of a monthly distribution fee to the Distributor equal to 0.75% annually of the average daily net assets attributable to Class B and Class C shares only. The Distributor has voluntarily agreed to waive a portion of the Class C shares distribution fee so that it will not exceed 0.45% annually of the average daily net assets attributable to Class C shares. This arrangement may be modified or terminated by the Distributor at any time.
Fees Paid to Officers and Trustees
All officers of the Fund are employees of Columbia or its affiliates and, with the exception of the Fund's Chief Compliance Officer, receive no compensation from the Fund. The Board of Trustees has appointed a Chief Compliance Officer to the Fund in accordance with federal securities regulations. The Fund, along with other affiliated funds, pays its pro-rata share of the expenses associated with the Chief Compliance Officer. The Fund's expenses for the Chief Compliance Officer will not exceed $15,000 per year.
23
Columbia Massachusetts Tax-Exempt Fund, October 31, 2008
The Trust's eligible Trustees may participate in a deferred compensation plan which may be terminated at any time. Obligations of the plan will be paid solely out of the Fund's assets.
Note 5. Custody Credits
The Fund has an agreement with its custodian bank under which custody fees may be reduced by balance credits. These credits are recorded as part of expense reductions on the Statement of Operations. The Fund could have invested a portion of the assets utilized in connection with the expense offset arrangement in an income-producing asset if it had not entered into such an agreement.
For the year ended October 31, 2008, these custody credits reduced total expenses by $2,935 for the Fund.
Note 6. Portfolio Information
For the year ended October 31, 2008, the cost of purchases and proceeds from sales of securities, excluding short-term obligations, were $21,752,586 and $38,241,078, respectively.
During the year ended October 31, 2008, the Fund held Inverse Floaters related to the portfolio securities against which Floating-Rate Notes were issued (see note 2). Interest paid by the Fund on the Floating-Rate Notes during the year was at a weighted average rate of 3.829%, with a weighted average outstanding Floating-Rate Notes par value of $2,653,846. During the year, the Fund disposed of the Inverse Floaters and their related Floating-Rate Notes liabilities. At October 31, 2008, the Fund held no Inverse Floaters.
Note 7. Line of Credit
The Fund and other affiliated funds participate in a $280,000,000 committed, unsecured revolving line of credit. The maximum amount that may be borrowed by any fund is limited to the lesser of $200,000,000 and the Fund's borrowing limit set forth in the Fund's registration statement. Borrowings are available for short-term liquidity or temporary or emergency purposes.
Interest is charged to each participating fund based on the fund's borrowings at a rate per annum equal to the greater of the Federal Funds Rate plus 0.50% and the overnight LIBOR Rate plus 0.50%. In addition, an annual operations agency fee of $20,000, an amendment fee of 0.02% and a commitment fee of 0.12% per annum are accrued and apportioned among the participating funds pro rata based on their relative net assets.
Prior to October 16, 2008, the Fund and other affiliated funds participated in a $350,000,000 committed, unsecured revolving line of credit and a $150,000,000 uncommitted, unsecured line of credit, both provided by State Street. Interest on the committed line of credit was charged to each participating fund based on the fund's borrowings at a rate per annum equal to the Federal Funds Rate plus 0.50%. In addition, a commitment fee of 0.10% per annum was accrued and apportioned among the participating funds pro rata based on their relative net assets. Interest on the uncommitted line of credit was charged to each participating fund based on the fund's borrowings at a rate per annum equal to the Federal Funds Rate plus 0.375%. State Street charged an annual operations agency fee of $40,000 for the committed line of credit and was able to charge an annual administration fee of $15,000 for the uncommitted line of credit. The commitme nt fee, the operations agency fee and the administration fee were accrued and apportioned among the participating funds pro rata based on their relative net assets.
For the year ended October 31, 2008, the Fund did not borrow under these arrangements.
Note 8. Significant Risks and Contingencies
Concentration of Credit Risk
The Fund holds investments that are insured by private insurers who guarantee the payment of principal and interest in the event of default or that are supported by a letter of credit. At October 31, 2008, private insurers who insured greater than 5% of the total net assets of the Fund were as follows:
| Insurer | | % of Total
Net Assets | |
| MBIA Insurance Corp. | | | 14.8 | | |
| Financial Security Assurance, Inc. | | | 8.2 | | |
| AMBAC Assurance Corp. | | | 7.0 | | |
| Financial Guaranty Insurance Co. | | | 6.8 | | |
24
Columbia Massachusetts Tax-Exempt Fund, October 31, 2008
At November 24, 2008, MBIA Insurance Corp., Financial Guaranty Insurance Co., AMBAC Assurance Corp. and Financial Security Assurance, Inc. were rated by Standard & Poor's AA, CCC, A and AAA, respectively.
Geographic Concentration Risk
The Fund had greater than 5% of its total net assets at October 31, 2008 invested in debt obligations issued by each of Massachusetts and Puerto Rico and their political subdivisions, agencies and public authorities. The Fund is more susceptible to economic and political factors adversely affecting issuers of the state's or territory's municipal securities than are municipal bond funds that are not concentrated to the same extent in these issuers.
Sector Focus Risk
The Fund may focus its investments in certain sectors, subjecting it to greater risk than a fund that is less focused.
Non-Diversified Risk
The Fund is a non-diversified Fund, which generally means that it may invest a greater percentage of its total assets in the securities of fewer issuers than a "diversified" fund. This increases the risk that a change in the value of any one investment held by the Fund could affect the overall value of the Fund more than it would affect that of a diversified fund holding a greater number of investments. Accordingly, the Fund's value will likely be more volatile than the value of more diversified funds. The Fund may not operate as a non-diversified fund at all times.
Tax Development Risk
The Fund purchases municipal securities whose interest, in the opinion of bond counsel, is free from federal income tax. There is no assurance that the Internal Revenue Service (IRS) will agree with this opinion. In the event the IRS determines that an issuer does not comply with relevant tax requirements, interest payments from a security could become federally taxable, possibly retroactively to the date the security was issued. As a shareholder of the Fund, you may be required to file an amended tax return as a result.
Legal Proceedings
On February 9, 2005, Columbia Management Advisors, Inc. (which has since merged into Banc of America Capital Management, LLC (now named Columbia Management Advisors, LLC)) ("Columbia") and Columbia Funds Distributor, Inc. (which has been renamed Columbia Management Distributors, Inc.) (the "Distributor") (collectively, the "Columbia Group") entered into an Assurance of Discontinuance with the New York Attorney General ("NYAG") (the "NYAG Settlement") and consented to the entry of a cease-and-desist order by the Securities and Exchange Commission ("SEC") (the "SEC Order") on matters relating to mutual fund trading.
Under the terms of the SEC Order, the Columbia Group agreed, among other things, to: pay $70 million in disgorgement and $70 million in civil money penalties; cease and desist from violations of the antifraud provisions and certain other provisions of the federal securities laws; maintain certain compliance and ethics oversight structures; retain an independent consultant to review the Columbia Group's applicable supervisory, compliance, control and other policies and procedures; and retain an independent distribution consultant (see below). The Columbia Funds have also voluntarily undertaken to implement certain governance measures designed to maintain the independence of their boards of trustees. The NYAG Settlement also, among other things, requires Columbia and its affiliates to reduce management fees for certain Columbia Funds (including the former Nations Funds) and other mutual funds collectively by $32 million per year f or five years, for a projected total of $160 million in management fee reductions.
Pursuant to the procedures set forth in the SEC Order, the $140 million in settlement amounts described above is being distributed in accordance with a distribution plan that was developed by an independent distribution consultant and approved by the SEC on April 6, 2007. Distributions under the distribution plan began in late June 2007.
A copy of the SEC Order is available on the SEC website at http://www.sec.gov. A copy of the NYAG Settlement is available as part of the Bank of America Corporation Form 8-K filing on February 10, 2005.
In connection with the events described above, various parties have filed suit against certain funds, the Trustees of the Columbia Funds, FleetBoston Financial Corporation and its affiliated entities and/or Bank of America and its affiliated entities.
25
Columbia Massachusetts Tax-Exempt Fund, October 31, 2008
On February 20, 2004, the Judicial Panel on Multidistrict Litigation transferred these cases and cases against other mutual fund companies based on similar allegations to the United States District Court in Maryland for consolidated or coordinated pretrial proceedings (the "MDL"). Subsequently, additional related cases were transferred to the MDL. On September 29, 2004, the plaintiffs in the MDL filed amended and consolidated complaints. One of these amended complaints is a putative class action that includes claims under the federal securities laws and state common law, and that names Columbia, the Distributor, the Trustees of the Columbia Funds, Bank of America Corporation and others as defendants. Another of the amended complaints is a derivative action purportedly on behalf of the Columbia Funds that asserts claims under federal securities laws and state common law.
On February 25, 2005, Columbia and other defendants filed motions to dismiss the claims in the pending cases. On March 1, 2006, for reasons stated in the court's memoranda dated November 3, 2005, the United States District Court for the District of Maryland granted in part and denied in part the defendants' motions to dismiss. The court dismissed all of the class action claims pending against the Columbia Funds Trusts. As to Columbia and the Distributor, the claims under the Securities Act of 1933, the claims under Sections 34(b) and 36(a) of the Investment Company Act of 1940 ("ICA") and the state law claims were dismissed. The claims under Sections 10(b) and 20(a) of the Securities Exchange Act of 1934 and claims under Section 36(b) of the ICA were not dismissed.
On March 21, 2005, a purported class action was filed in Massachusetts state court alleging that certain conduct, including market timing, entitled Class B shareholders in certain Columbia funds to an exemption from contingent deferred sales charges upon early redemption ("the CDSC Lawsuit"). The CDSC Lawsuit was removed to federal court in Massachusetts and transferred to the MDL.
On September 14, 2007, the plaintiffs and the Columbia defendants named in the MDL, including the Columbia Funds, entered into a stipulation of settlement with respect to all Columbia-related claims in the MDL described above, including the CDSC Lawsuit. The settlement is subject to court approval.
In 2004, the Columbia Funds' adviser and distributor and certain affiliated entities and individuals were named as defendants in certain purported shareholder class and derivative actions making claims, including claims under the Investment Company and the Investment Advisers Acts of 1940 and state law. Certain Columbia Funds were named as nominal defendants. The suits allege, inter alia, that the fees and expenses paid by the funds are excessive and that the advisers and their affiliates inappropriately used fund assets to distribute the funds and for other improper purposes. On March 2, 2005, the actions were consolidated in the Massachusetts federal court as In re Columbia Entities Litigation. The plaintiffs filed a consolidated amended complaint on June 9, 2005. On November 30, 2005, the judge dismissed all claims by plaintiffs and entered final judgment in favor of the defendants. The plaintiffs appealed to the United States Court of Appeals for the First Circuit on December 30, 2005. A stipulation and settlement agreement dated January 19, 2007 was filed in the First Circuit on February 14, 2007, with a joint stipulation of dismissal and motion for remand to obtain district court approval of the settlement. That joint motion was granted and the appeal was dismissed. On March 6, 2007, the case was remanded to the District Court. The settlement, approved by the District Court on September 18, 2007, became effective October 19, 2007. Pursuant to the settlement, the funds' adviser and/or its affiliates made certain payments, including plaintiffs' attorneys' fees and costs of notice to class members.
26
Report of Independent Registered Public Accounting Firm
To the Trustees of Columbia Funds Series Trust I and the Shareholders of Columbia Massachusetts Tax-Exempt Fund:
In our opinion, the accompanying statement of assets and liabilities, including the investment portfolio, and the related statements of operations and of changes in net assets and the financial highlights present fairly, in all material respects, the financial position of Columbia Massachusetts Tax-Exempt Fund (the "Fund") (a series of Columbia Funds Series Trust I) at October 31, 2008, the results of its operations for the year then ended, the changes in its net assets for each of the two years in the period then ended and the financial highlights for each of the five years in the period then ended, in conformity with accounting principles generally accepted in the United States of America. These financial statements and financial highlights (hereafter referred to as "financial statements") are the responsibility of the Fund's management. Our responsibility is to express an opinion on these financial statements based on our aud its. We conducted our audits of these financial statements in accordance with the standards of the Public Company Accounting Oversight Board (United States). Those standards require that we plan and perform the audit to obtain reasonable assurance about whether the financial statements are free of material misstatement. An audit includes examining, on a test basis, evidence supporting the amounts and disclosures in the financial statements, assessing the accounting principles used and significant estimates made by management, and evaluating the overall financial statement presentation. We believe that our audits, which included confirmation of securities at October 31, 2008 by correspondence with the custodian and brokers, provide a reasonable basis for our opinion.
PricewaterhouseCoopers LLP
Boston, Massachusetts
December 22, 2008
27
Federal Income Tax Information (Unaudited)
For the fiscal year ended October 31, 2008, the Fund designates long-term capital gains of $822,204.
99.9% of the distributions from net investment income will be treated as exempt income for federal income tax purposes.
28
Fund Governance
The Trustees serve terms of indefinite duration. The names, addresses and ages of the Trustees and officers of the Funds in Columbia Funds Series Trust I, the year each was first elected or appointed to office, their principal business occupations during at least the last five years, the number of Funds overseen by each Trustee and other directorships they hold are shown below. Each officer listed below serves as an officer of each Fund in the Columbia Funds Complex.
Independent Trustees
Name, Address and Year of Birth,
Position with Funds, Year First
Elected or Appointed to Office | | Principal Occupation(s) During Past Five Years, Number of Funds in Columbia
Funds Complex Overseen by Trustee, Other Directorships Held
| |
| John D. Collins (Born 1938) | |
|
c/o Columbia Management
Advisors, LLC
One Financial Center
Boston, MA 02111
Trustee(1) (since 2007) | | Retired. Consultant, KPMG, LLP (accounting and tax firm) from July 1999 to June 2000; Partner, KPMG, LLP from March 1962 to June 1999. Oversees 80, Mrs. Fields Famous Brands LLC (consumer products); Suburban Propane Partners, L.P.; and Montpelier Re (underwriting firm) | |
|
| Rodman L. Drake (Born 1943) | |
|
c/o Columbia Management Advisors, LLC
One Financial Center
Boston, MA 02111
Trustee(1) (since 2007) | | Co-Founder of Baringo Capital LLC (private equity) since 2002; President, Continuation Investments Group, Inc. from 1997 to 2001. Oversees 80, Jackson Hewitt Tax Service Inc. (tax preparation services); Crystal Capital River Inc. (real estate investment trust); Student Loan Corporation (student loan provider); Celgene Corporation (global biotechnology company); Apex Silver Mines Ltd. (mining); and Hyperion Brookfield Total Return Fund, Inc. and Hyperion Brookfield Strategic Mortgage Income Fund, Inc. (exchange-traded funds) | |
|
| Douglas A. Hacker (Born 1955) | |
|
c/o Columbia Management Advisors, LLC
One Financial Center
Boston, MA 02111
Trustee (since 1996) | | Independent business executive since May 2006; Executive Vice President—Strategy of United Airlines (airline) from December 2002 to May 2006; President of UAL Loyalty Services (airline marketing company) from September 2001 to December 2002; Executive Vice President and Chief Financial Officer of United Airlines from July 1999 to September 2001. Oversees 80, Nash Finch Company (food distributor); Aircastle Limited (aircraft leasing) | |
|
| Janet Langford Kelly (Born 1957) | |
|
c/o Columbia Management Advisors, LLC
One Financial Center
Boston, MA 02111
Trustee (since 1996) | | Senior Vice President, General Counsel and Corporate Secretary, ConocoPhillips (integrated energy company) since September 2007; Deputy General Counsel—Corporate Legal Services, ConocoPhillips from August 2006 to August 2007; Partner, Zelle, Hofmann, Voelbel, Mason & Gette LLP (law firm) from March 2005 to July 2006; Adjunct Professor of Law, Northwestern University, from September 2004 to June 2006; Director, UAL Corporation (airline) from February 2006 to July 2006; Chief Administrative Officer and Senior Vice President, Kmart Holding Corporation (consumer goods), from September 2003 to March 2004; Executive Vice President—Corporate Development and Administration, General Counsel and Secretary, Kellogg Company (food manufacturer), from September 1999 to August 2003. Oversees 80, None | |
|
29
Fund Governance (continued)
Independent Trustees (continued)
Name, Address and Year of Birth,
Position with Funds, Year First
Elected or Appointed to Office | | Principal Occupation(s) During Past Five Years, Number of Funds in Columbia
Funds Complex Overseen by Trustee, Other Directorships Held
| |
| Charles R. Nelson (Born 1942) | |
|
c/o Columbia Management Advisors, LLC
One Financial Center
Boston, MA 02111
Trustee (since 1981) | | Professor of Economics, University of Washington, since January 1976; Ford and Louisa Van Voorhis Professor of Political Economy, University of Washington, since September 1993; Director, Institute for Economic Research, University of Washington from September 2001 to June 2003; Adjunct Professor of Statistics, University of Washington, since September 1980; Associate Editor, Journal of Money Credit and Banking, since September 1993; Consultant on econometric and statistical matters. Oversees 80, None | |
|
| John J. Neuhauser (Born 1943) | |
|
c/o Columbia Management Advisors, LLC
One Financial Center
Boston, MA 02111
Trustee (since 1985) | | President, Saint Michael's College, since August 2007; University Professor, Boston College from November 2005 to August 2007; Academic Vice President and Dean of Faculties, Boston College from August 1999 to October 2005. Oversees 80, Liberty All-Star Equity Fund and Liberty All-Star Growth Fund, Inc. (closed-end funds) | |
|
| Jonathan Piel (Born 1938) | |
|
c/o Columbia Management Advisors, LLC
One Financial Center
Boston, MA 02111
Trustee(1) (since 2007) | | Cable television producer and website designer; The Editor, Scientific American from 1984 to 1994; Vice President, Scientific American, Inc., from 1984 to 1994; Member, Advisory Board, Stone Age Institute, Bloomington, Indiana (research institute that explores the effect of technology on human evolution); Member, Board of Directors of the National Institute of Social Sciences, New York City; and Member, Board of Trustees of the William Alanson White Institute, New York City (institution for training psychoanalysts). Oversees 80, None | |
|
| Patrick J. Simpson (Born 1944) | |
|
c/o Columbia Management Advisors, LLC
One Financial Center
Boston, MA 02111
Trustee (since 2000) | | Partner, Perkins Coie LLP (law firm). Oversees 80, None | |
|
| Thomas C. Theobald (Born 1937) | |
|
c/o Columbia Management Advisors, LLC
One Financial Center
Boston, MA 02111
Trustee and
Chairman of the Board (since 1996) | | Partner and Senior Advisor, Chicago Growth Partners (private equity investing) since September 2004; Managing Director, William Blair Capital Partners (private equity investing) from September 1994 to September 2004. Oversees 80, Anixter International (network support equipment distributor); Ventas, Inc. (real estate investment trust); Jones Lang LaSalle (real estate management services); Ambac Financial Group (financial guaranty insurance) | |
|
30
Fund Governance (continued)
Independent Trustees (continued)
Name, Address and Year of Birth,
Position with Funds, Year First
Elected or Appointed to Office | | Principal Occupation(s) During Past Five Years, Number of Funds in Columbia
Funds Complex Overseen by Trustee, Other Directorships Held
| |
| Anne-Lee Verville (Born 1945) | |
|
c/o Columbia Management Advisors, LLC
One Financial Center
Boston, MA 02111
Trustee (since 1998) | | Retired since 1997 (formerly General Manager—Global Education Industry (from 1994 to 1997), President—Application Systems Division (from 1991 to 1994), Chief Financial Officer—US Marketing & Services (from 1988 to 1991), and Chief Information Officer (from 1987 to 1988), IBM Corporation (computer and technology)). Oversees 80, None | |
|
Interested Trustee
| William E. Mayer (Born 1940) | |
|
c/o Columbia Management Advisors, LLC
One Financial Center
Boston, MA 02111
Trustee(2) (since 1994) | | Partner, Park Avenue Equity Partners (private equity) since February 1999; Dean and Professor, College of Business, University of Maryland from 1992 to 1997. Oversees 80, Lee Enterprises (print media), WR Hambrecht + Co. (financial service provider); BlackRock Kelso Capital Corporation (investment company) | |
|
1 Messrs. Drake, Piel and Collins have served as directors/trustees of the Excelsior Funds since 1996, 1996 and 2005, respectively. The Excelsior Funds consisted of 27 portfolios managed by affiliates of Columbia Management Advisors, LLC. Effective December 12, 2007, the Board elected Messrs. Drake, Piel and Collins as Trustees of the Trust.
2 Mr. Mayer is an "interested person" (as defined in the Investment Company Act of 1940) by reason of his affiliation with WR Hambrecht + Co., a registered broker/dealer that may execute portfolio transactions for or engage in principal transactions with the Funds or other funds or accounts advised/managed by the Advisor or other Bank of America affiliates.
The Statement of Additional Information includes additional information about the Trustees of the Funds and is available, without charge, upon request by calling 1-800-345-6611.
Officers
Name, Address and Year of Birth,
Position with Columbia Funds,
Year First Elected or
Appointed to Office | | Principal Occupation(s) During Past Five Years | |
| Christopher L. Wilson (Born 1957) | |
|
One Financial Center
Boston, MA 02111
President (since 2004) | | President—Columbia Funds, since October 2004; Managing Director—Columbia Management Advisors, LLC, since September 2005; Senior Vice President—Columbia Management Distributors, Inc., since January 2005; Director—Columbia Management Services, Inc., since January 2005; Director—Bank of America Global Liquidity Funds, plc and Banc of America Capital Management (Ireland), Limited, since May 2005; Director—FIM Funding, Inc., since January 2005; President and Chief Executive Officer—CDC IXIS AM Services, Inc. (investment management), from September 1998 through August 2004; and a senior officer or director of various other Bank of America affiliated entities, including other registered and unregistered funds. | |
|
31
Fund Governance (continued)
Officers (continued)
Name, Address and Year of Birth,
Position with Columbia Funds,
Year First Elected or
Appointed to Office | | Principal Occupation(s) During Past Five Years | |
| James R. Bordewick, Jr. (Born 1959) | |
|
One Financial Center
Boston, MA 02111
Senior Vice President, Secretary and Chief Legal Officer (since 2006) | | Associate General Counsel, Bank of America since April 2005; Senior Vice President and Associate General Counsel, MFS Investment Management (investment management) prior to April 2005. | |
|
| J. Kevin Connaughton (Born 1964) | |
|
One Financial Center
Boston, MA 02111
Senior Vice President and
Chief Financial Officer (since 2000) | | Managing Director of Columbia Management Advisors, LLC since December 2004; Treasurer—Columbia Funds, from October 2003 to May 2008; Treasurer—the Liberty Funds, Stein Roe Funds and Liberty All-Star Funds, December 2000—December 2006; Senior Vice President—Columbia Management Advisors, LLC, from April 2003 to December 2004; President—Columbia Funds, Liberty Funds and Stein Roe Funds, February 2004 to October 2004; Treasurer—Galaxy Funds, September 2002 to December 2005; Treasurer, December 2002 to December 2004, and President, February 2004 to December 2004—Columbia Management Multi-Strategy Hedge Fund, LLC; and a senior officer of various other Bank of America-affiliated entities, including other registered and unregistered funds. | |
|
| Linda J. Wondrack (Born 1964) | |
|
One Financial Center
Boston, MA 02111
Senior Vice President and
Chief Compliance Officer (since 2007) | | Director (Columbia Management Group LLC and Investment Product Group Compliance), Bank of America since June 2005; Director of Corporate Compliance and Conflicts Officer, MFS Investment Management (investment management), August 2004 to May 2005; Managing Director, Deutsche Asset Management (investment management) prior to August 2004. | |
|
| Michael G. Clarke (Born 1969) | |
|
One Financial Center
Boston, MA 02111
Treasurer (since 2008) | | Director of Fund Administration of the Advisor since January 2006; Managing Director of the Advisor September 2004 to December 2005; Vice President Fund Administration June 2002 to September 2004. | |
|
| Jeffrey R. Coleman (Born 1969) | |
|
One Financial Center
Boston, MA 02111
Deputy Treasurer (since 2006) | | Director of Fund Administration of the Advisor since January 2006; Fund Controller of the Advisor from October 2004 to January 2006; Vice President of CDC IXIS Asset Management Services, Inc. (investment management) from August 2000 to September 2004. | |
|
| Joseph F. DiMaria (Born 1968) | |
|
One Financial Center
Boston, MA 02111
Chief Accounting Officer (since 2008) | | Director of Fund Administration of the Advisor since January 2006; Head of Tax/Compliance and Assistant Treasurer of the Advisor from November 2004 to December 2005; Director of Trustee Administration (Sarbanes-Oxley) of the Advisor from May 2003 to October 2004. | |
|
32
Fund Governance (continued)
Officers (continued)
Name, Address and Year of Birth,
Position with Columbia Funds,
Year First Elected or
Appointed to Office | | Principal Occupation(s) During Past Five Years | |
| Julian Quero (Born 1967) | |
|
One Financial Center
Boston, MA 02111
Deputy Treasurer (since 2008) | | Senior Tax Manager of the Advisor since August 2006; Senior Compliance Manager of the Advisor from April 2002 to August 2006. | |
|
| Barry S. Vallan (Born 1969) | |
|
One Financial Center
Boston, MA 02111
Controller (since 2006) | | Vice President—Fund Treasury of the Advisor since October 2004; Vice President—Trustee Reporting of the Advisor from April 2002 to October 2004 | |
|
33
Board Consideration and Approval of Advisory Agreements
The Advisory Fees and Expenses Committee of the Board of Trustees meets several times annually to review the advisory agreements (collectively, the "Agreements") of the funds for which the Trustees serve as trustees (each a "fund") and to determine whether to recommend that the full Board approve the continuation of the Agreements for an additional one-year period. After the Committee has made its recommendation, the full Board, including the Independent Trustees, determines whether to approve the continuation of the Agreements. In addition, the full Board, including the Independent Trustees, considers matters bearing on the Agreements at most of its other meetings throughout the year and meets regularly with senior management of the funds and Columbia, the funds' investment adviser, including the senior manager of each investment area within Columbia. Through the Board's Investment Oversight Committees, Trustees also meet with selected fund portfolio managers, research analysts and traders at various times throughout the year.
The Trustees receive and review all materials that they, their legal counsel or Columbia believe to be reasonably necessary for the Trustees to evaluate the Agreements and to determine whether to approve the continuation of the Agreements. Those materials generally include, among other items, (i) information on the investment performance of each fund relative to the performance of peer groups of mutual funds and the fund's performance benchmarks, and additional information assessing performance on a risk-adjusted basis, (ii) information on each fund's advisory fees and other expenses, including information comparing the fund's expenses to those of peer groups of mutual funds and information about any applicable expense caps and fee "breakpoints," (iii) information about the profitability of the Agreements to Columbia, including potential "fall-out" or ancillary benefits that Columbia and its affiliates may receive as a result of their relationships with the funds and (iv) information obtained through Columbia's response to a questionnaire prepared at the request of the Trustees by counsel to the funds and independent legal counsel to the Independent Trustees. The Trustees also consider other information such as (v) Columbia's financial results and financial condition, (vi) each fund's investment objective and strategies and the size, education and experience of Columbia's investment staffs and their use of technology, external research and trading cost measurement tools, (vii) the allocation of the funds' brokerage and the use of "soft" commission dollars to pay for research products and services, (viii) Columbia's resources devoted to, and its record of compliance with, the funds' investment policies and restrictions, policies on personal securities transactions and other compliance policies and legal and regulatory requirements, (ix) Columbia's response to va rious legal and regulatory proceedings since 2003 and to the recent period of volatility in the securities markets and (x) the economic outlook generally and for the mutual fund industry in particular. In addition, the Advisory Fees and Expenses Committee confers with the funds' independent fee consultant and reviews materials relating to the funds' relationships with Columbia provided by the independent fee consultant. Throughout the process, the Trustees have the opportunity to ask questions of and to request additional materials from Columbia and to consult with the independent fee consultant and independent legal counsel to the Independent Trustees.
The Board of Trustees most recently approved the continuation of the Agreements at its October, 2008 meeting, following meetings of the Advisory Fees and Expenses Committee held in February, April, August, September and October, 2008. In considering whether to approve the continuation of the Agreements, the Trustees, including the Independent Trustees, did not identify any single factor as determinative, and each weighed various factors as he or she deemed appropriate. The Trustees considered the following matters in connection with their approval of the continuation of the Agreements:
The nature, extent and quality of the services provided to the funds under the Agreements. The Trustees considered the nature, extent and quality of the services provided by Columbia and its affiliates to the funds and the resources dedicated to the funds by Columbia and its affiliates. Among other things, the Trustees considered (i) Columbia's ability (including its personnel and other resources, compensation programs for personnel involved in fund management, reputation and other attributes) to attract, motivate and retain highly qualified research, advisory and supervisory investment professionals; (ii) the portfolio management services provided by those investment professionals; and (iii) the trade execution services provided on behalf of the funds. For each fund, the Trustees also considered the benefits to shareholders of investing in a mutual f und that is part of a family of funds offering exposure to a variety of asset classes
34
and investment disciplines and providing a variety of fund and shareholder services. After reviewing those and related factors, the Trustees concluded, within the context of their overall conclusions regarding each of the Agreements, that the nature, extent and quality of services provided supported the continuation of the Agreements.
Investment performance of the funds and Columbia. The Trustees reviewed information about the performance of each fund over various time periods, including information prepared by an independent third-party data provider that compared the performance of each fund to the performance of peer groups of mutual funds and performance benchmarks. The Trustees also reviewed a description of the third party's methodology for identifying each fund's peer group for purposes of performance and expense comparisons. The Trustees also considered additional information that the Advisory Fees and Expenses Committee requested from Columbia relating to funds that presented relatively weaker performance and/or relatively higher expenses. In the case of each fund whose performance lagged that of a relevant peer group for certain (although not necessarily all) periods, the Trustees concluded that other factors relevant to performance were sufficient, in light of other considerations, to warrant continuation of the fund's Agreements. Those factors varied from fund to fund, but included one or more of the following: (i) that the fund's performance, although lagging in certain recent periods, was stronger over the longer term; (ii) that the underperformance was attributable, to a significant extent, to investment decisions that were reasonable and consistent with the fund's investment strategy and policies and that the fund was performing within a reasonable range of expectations, given those investment decisions, market conditions and the fund's investment strategy; (iii) that the fund's performance was competitive when compared to other relevant performance benchmarks or peer groups; (iv) that Columbia had taken or was taking steps designed to help improve the fund's investment performance, including, but not limited to, replacing portfolio managers or modifying investment str ategies; and (v) that Columbia proposed to waive advisory fees or cap the expenses of the fund.
The Trustees noted that, through April 30, 2008, Columbia Massachusetts Tax-Exempt Fund's performance was in the third quintile (where the best performance would be in the first quintile) for the one-year period, in the second quintile for the three- and five-year periods, and in the first quintile for the ten-year period, of the peer group selected by an independent third-party data provider for purposes of performance comparisons.
The Trustees also considered Columbia's performance and reputation generally, the funds' performance as a fund family generally, and Columbia's historical responsiveness to Trustee concerns about performance and Columbia's willingness to take steps intended to improve performance. After reviewing those and related factors, the Trustees concluded, within the context of their overall conclusions regarding each of the Agreements, that the performance of each fund and Columbia was sufficient, in light of other considerations, to warrant the continuation of the Agreement(s) pertaining to that fund.
The costs of the services provided and profits realized by Columbia and its affiliates from their relationships with the funds. The Trustees considered the fees charged to the funds for advisory services as well as the total expense levels of the funds. That information included comparisons (provided by management and by an independent third-party data provider) of each fund's advisory fees and total expense levels to those of the fund's peer groups and information about the advisory fees charged by Columbia to comparable institutional accounts. In considering the fees charged to those accounts, the Trustees took into account, among other things, management's representations about the differences between managing mutual funds as compared to other types of accounts, including differences in the services provided, differences in the risk profile of such business for Columbia, and the additional resources required to manage mutual funds effectively. In evaluating each fund's advisory fees, the Trustees also took into account the demands, complexity and quality of the investment management of the fund. The Trustees considered existing advisory fee breakpoints, and Columbia's use of advisory fee waivers and expense caps, which benefited a number of the funds. The Trustees also noted management's stated justification for the fees charged to the funds, which included information about the investment performance of the funds and the services provided to the funds.
The Trustees considered that Columbia Massachusetts Tax-Exempt Fund's total expenses were in the fifth and actual management fees were in the second quintile (where the lowest fees and expenses would be in the first quintile) of
35
the peer group selected by an independent third-party data provider for purposes of expense comparisons.
The Trustees also considered the compensation directly or indirectly received by Columbia and its affiliates from their relationships with the funds. The Trustees reviewed information provided by management as to the profitability to Columbia and its affiliates of their relationships with each fund, and information about the allocation of expenses used to calculate profitability. When reviewing profitability, the Trustees also considered court cases in which adviser profitability was an issue in whole or in part, the performance of the relevant funds, the expense level of each fund, and whether Columbia had implemented breakpoints and/or expense caps with respect to the fund.
After reviewing those and related factors, the Trustees concluded, within the context of their overall conclusions regarding each of the Agreements, that the advisory fees charged to each fund, and the related profitability to Columbia and its affiliates of their relationships with the fund, supported the continuation of the Agreement(s) pertaining to that fund.
Economies of Scale. The Trustees considered the existence of any economies of scale in the provision by Columbia of services to each fund, to groups of related funds, and to Columbia's investment advisory clients as a whole and whether those economies were shared with the funds through breakpoints in the investment advisory fees or other means, such as fee waivers/expense reductions and additional investments by Columbia in investment, trading and compliance resources. The Trustees noted that many of the funds benefited from breakpoints, fee waivers/expense caps, or both. In considering those issues, the Trustees also took note of the costs of the services provided (both on an absolute and a relative basis) and the profitability to Columbia and its affiliates of their relationships with the funds, as discussed above.
After reviewing those and related factors, the Trustees concluded, within the context of their overall conclusions regarding each of the Agreements, that the extent to which economies of scale were shared with the funds supported the continuation of the Agreements.
Other Factors. The Trustees also considered other factors, which included but were not limited to the following:
• the extent to which each fund had operated in accordance with its investment objective and investment restrictions, the nature and scope of the compliance programs of the funds and Columbia and the compliance-related resources that Columbia and its affiliates were providing to the funds;
• the nature, quality, cost and extent of administrative and shareholder services overseen and performed by Columbia and its affiliates, both under the Agreements and under separate agreements for the provision of transfer agency and administrative services;
• so-called "fall-out benefits" to Columbia and its affiliates, such as the engagement of its affiliates to provide distribution, brokerage and transfer agency services to the funds, and the benefits of research made available to Columbia by reason of brokerage commissions generated by the funds' securities transactions, as well as possible conflicts of interest associated with those fall-out and other benefits, and the reporting, disclosure and other processes in place to disclose and monitor those possible conflicts of interest; and
• the report provided by the funds' independent fee consultant, which included information about and analysis of the funds' fees, expenses and performance.
Based on their evaluation of all factors that they deemed to be material, including those factors described above, and assisted by the advice of independent counsel and the independent fee consultant, the Trustees, including the Independent Trustees, approved the continuance of each of the Agreements through October 31, 2009.
36
Summary of Management Fee Evaluation by
Independent Fee Consultant
EXCERPTS FROM REPORT OF INDEPENDENT FEE CONSULTANT TO THE FUNDS SUPERVISED BY THE COLUMBIA ATLANTIC BOARD
Prepared Pursuant to the February 9, 2005
Assurance of Discontinuance among the
Office of Attorney General of New York State,
Columbia Management Advisors, LLC, and
Columbia Management Distributors, Inc.
November 3, 2008
I. Overview
On February 9, 2005, Columbia Management Advisors, LLC ("CMA") and Columbia Management Distributors, Inc.1 ("CMD") agreed to the New York Attorney General's Assurance of Discontinuance ("AOD"). Among other things, the AOD stipulates that CMA may manage or advise a Columbia Fund ("Columbia Fund" and, together with some or all of such funds, the "Columbia Funds") only if the Independent Members of the Columbia Fund's Board of Trustees appoint a Senior Officer or retain an Independent Fee Consultant ("IFC") who is to manage the process by which proposed management fees are negotiated. The AOD further stipulates that the Senior Officer or IFC is to prepare a written annual evaluation of the fee negotiation process.
With effect from January 1, 2007, the Independent Members of the Board of Trustees for certain Columbia Funds known collectively as the "Atlantic Funds" (together with the other members of that Board, the "Trustees") retained me as IFC for the Atlantic Funds.2 In this capacity, I have prepared the fourth annual written evaluation of the fee negotiation process. As was the case with last year's report (the "2007 Report") my immediate predecessor as IFC, John Rea, provided invaluable assistance in the preparation of this year's report.
A. Role of the Independent Fee Consultant
The AOD charges the IFC with "managing the process by which proposed management fees ... to be charged the Columbia Fund are negotiated so that they are negotiated in a manner which is at arms' length and reasonable and consistent with this Assurance of Discontinuance." The AOD also provides that CMA "may manage or advise a Columbia Fund only if the reasonableness of the proposed management fees is determined by the Board of Trustees ... using ... an annual independent written evaluation prepared by or under the direction of ... the Independent Fee Consultant." Therefore, the AOD makes clear that the IFC does not supplant the Trustees in negotiating management fees with CMA, nor does the IFC substitute his or her judgment for that of the Trustees with respect to the reasonableness of proposed fees or any other matter that is committed to the business judgmen t of the Trustees.
B. Elements Involved in Managing the Fee Negotiation Process
In preparing the report required by the AOD, the IFC must consider at least the following six factors set forth in the AOD:
1. The nature and quality of CMA's services, including the Fund's performance;
2. Management fees (including any components thereof) charged by other mutual fund companies for like services;
3. Possible economies of scale as the Fund grows larger;
4. Management fees (including any components thereof) charged to institutional and other clients of CMA for like services;
5. Costs to CMA and its affiliates of supplying services pursuant to the management fee agreements, excluding any intra-corporate profit; and
6. Profit margins of CMA and its affiliates from supplying such services.
C. Organization of the Annual Evaluation
This report, like last year's, focuses on the six factors and contains a section for each factor except that CMA's costs and profits from managing the Funds have been combined into a single section. In addition to a discussion of these factors, the report offers recommendations to improve the fee review process in future years. A review of the status of recommendations made in the 2007 Report is being provided separately with the materials for the October meeting.
1 CMA and CMD are subsidiaries of Columbia Management Group, LLC ("CMG"), and are the successors to the entities named in the AOD.
2 I have no material relationship with Bank of America, CMG or any of its affiliates, aside from serving as IFC, and I am aware of no material relationship with any of their affiliates. I retained John Rea, an independent economic consultant, to assist me with this report.
Unless otherwise stated or required by the context, this report covers only the Atlantic Funds, which are also referred as the "Funds."
37
II. Summary of Findings
A. General
1. Based upon my examination of the information supplied by CMG in the light of the six factors set forth in the AOD, I conclude that the Trustees have the relevant information necessary to evaluate the reasonableness of the proposed management fees for each Atlantic Fund.
2. In my view, the process by which the proposed management fees of the Funds have been negotiated in 2008 thus far has been, to the extent practicable, at arms' length and reasonable and consistent with the AOD.
B. Nature and Quality of Services, Including Performance
3. The performance of the Funds has been relatively strong in recent years. Based upon 1-, 3-, 5-, and 10-year returns through April 30, 2008, at least half of all the Funds were in the first and second performance quintiles in each of the four performance periods and, at most, only 11% were in the fifth quintile in any one performance period. Both equity and fixed-income funds posted strong performance relative to comparable funds.
4. Performance rankings were similar in 2007 and 2008, although last year's were slightly stronger. Despite the stability in the distribution of rankings in the two years, at least half the Funds changed quintile rankings between the two years in at least one of the 1-, 3-, and 5-year performance periods.
5. The performance of the actively managed equity Funds against their benchmarks was very strong. At least 57% and as many as 73% posted net returns exceeding their benchmarks over the 1-, 3-, and 5-year periods. In contrast, gross and net returns of fixed-income Funds typically fell short of their benchmarks.
6. Atlantic equity Funds' overall performance adjusted for risk also was strong. Based upon 3-year returns, nearly 80% of the equity Funds had a combination of risk-adjusted and unadjusted returns that placed them in the top half of their performance universes. Only about one-fifth of the fixed income Funds posted high returns and low risk relative to comparable funds. About two-thirds of the fixed-income Funds took on more risk than the typical fund in their performance universes.
7. The industry-standard procedure used by Lipper that includes all share classes in the performance universe tends to bias a Fund's ranking upward within that universe. The bias occurs because either no-12b-1 fee or low-12b-1 fee share classes of the Atlantic Funds are compared with funds in performance universes that include all share classes of multi-class funds with 12b-1 fees of up to 100 basis points. Correcting this bias by limiting the performance universe to classes of comparable funds with low or no 12b-1 fees (a "filtered universe") lowers the relative performance for the Funds, but their performance, on the whole, remains strong. The filtering process, however, did identify two Funds for further review that had not been designated review funds using unfiltered universes.
8. A small number of Funds have consistently underperformed over the past four years. The exact number depends on the criteria used to evaluate longer-term performance. For example, the one-year returns of one Fund have been in the fourth or fifth performance quintiles in each of the past four years; there are six Funds whose three-year returns have been in the fourth or fifth quintile over the past four years.
9. The services performed by CMG professionals beyond portfolio management, such as compliance, legal, information technology, risk management, finance and fund administration, are critical to the success of the Funds and appear to be of high quality.
C. Management Fees Charged by Other Mutual Fund Companies
10. The Funds' management fees and total expenses are generally low relative to those of their peers. Only 21% of the Funds ranked in the two most expensive quintiles for actual management fees, and only 23% in those quintiles for total expenses.
11. The highest concentration of low-expense Funds is found among the equity and tax-exempt fixed income Funds. The 12 former Excelsior Funds have relatively high fees and expenses, with half of those Funds ranking in either the fourth or fifth quintiles. The higher actual management fee rankings of certain Excelsior Funds are due in part to fee schedules that are higher than standard Columbia Fund fee schedules at current asset levels. After discussion with the Trustees, CMA is proposing to lower the management fees on three of these Funds.
38
12. The distribution of expense rankings is similar in 2007 and 2008, while management fee rankings improved markedly in 2008. Part of the improvement reflects expense limitations introduced last year for the state intermediate municipal bond Funds.
13. The management fees of the Atlantic Funds are generally in line with those of Columbia Funds supervised by the Nations Board of Trustees (the "Nations Funds"). In investment categories in which the Atlantic Funds have higher average fees, the difference principally arises out of differences in asset size.
D. Trustees' Fee and Performance Evaluation Process
14. The Trustees' evaluation process identified 17 Funds in 2008 for further review based upon their relative performance or expenses or both. When compared in filtered universes, two more Funds met the criteria for further review. CMG provided further information about those Funds to assist the Trustees in their evaluation.
E. Potential Economies of Scale
15. CMG presented to the Trustees its analysis of the sources and sharing of potential economies of scale. CMG views economies of scale as arising at the complex level and would regard estimates of scale economies for individual funds as unreliable. In its analysis, CMG did not identify specific sources of economies of scale or provide any estimates of any economies of scale that might arise from future asset growth. CMG's analysis included measures taken by the Trustees and CMG that seek to share any potential economies of scale through breakpoints in management fee schedules, expense reimbursements, fee waivers, enhanced shareholder services, fund mergers, and operational consolidation.
16. An examination of the contractual fee schedules for five Atlantic Funds shows that they are generally in line with those of their competitors, in terms of number and extent of fee breakpoints. A similar examination last year of five different Funds led to the same conclusion.
F. Management Fees Charged to Institutional Clients
17. CMG has provided Trustees with comparisons of mutual fund management fees and institutional fees based upon standardized fee schedules and upon actual fees. The results show that, consistent with industry practice, institutional fees are generally lower than the Funds' management fees. However, because the services provided and risks borne by the manager are more extensive for mutual funds compared to institutional accounts, the differences are of limited value in assisting the Trustees in their review of the reasonableness of the Funds' management fees.
G. Revenues, Expenses, and Profits
18. The activity-based cost allocation methodology ("ABC") employed by CMG to allocate costs, both direct and indirect, for purposes of calculating Fund profitability is thoughtful and detailed. This year, CMG proposed a change to the method by which indirect expenses are allocated. Under this "hybrid" method, indirect costs relating to fund management are allocated among the Funds 50% by assets and 50% per Fund. Allocating indirect expenses equally to each Fund has an intuitive logic, as each Fund regardless of size has certain expenses, such as preparing and printing prospectuses and financial statements.
19. The materials provided on CMG's revenues and expenses with respect to the Funds and the methodology underlying their construction form a sufficient basis for Trustees to evaluate the expenses and profitability of the Funds.
20. In 2007, CMG's complex-wide pre-tax margins on the Atlantic Funds were slightly below industry medians, based on limited data available for publicly held mutual fund managers. However, as is to be expected in a complex now comprising 75 Funds (including former Excelsior Funds), some Atlantic Funds have relatively high pre-tax profit margins, when calculated solely with respect to management revenues and expenses, while other Atlantic Funds operate at a loss. There is a positive relationship between fund size and profitability, with smaller funds generally operating at a loss.
39
21. CMG pays a fixed percentage of its management fee revenues to an affiliate, U.S. Trust, Bank of America Private Wealth Management, to compensate it for services it performs with respect to Atlantic Fund assets held for the benefit of its customers. Based on our analysis of the services provided by this affiliate, we have concluded that all payments other than those for sub-transfer agent or sub-accounting services should be treated as a distribution expense.
III. Recommendations
1. Criteria for review. The Trustees may wish to consider modifying the criteria for classifying a fund as a "Review Fund" to include criteria that focus exclusively on performance without regard to expense or fee levels. For example, a fund whose one-year or three-year performance was median or below for four consecutive years could be treated as a Review Fund. When we applied such criteria to the Funds, several additional Funds would have been added to the list of Review Funds.
2. Profitability data. CMG should present to the Trustees each year the profitability of each Fund, each investment style and each complex (of which Atlantic is one) calculated as follows:
a. Management-only profitability should be calculated without reference to any Private Bank expense.
b. Profitability excluding distribution (which essentially covers the management and transfer agency functions) should be adjusted by removing from the expense calculation any portion of the Private Bank payment not attributable to the performance by the Private Bank of sub-transfer agency or sub-accounting functions.
c. Total profitability, including distribution: No adjustment for Private Bank expenses should be made, because all such expenses represent legitimate fund expenses to be taken into account in calculating CMG's profit margin including distribution.
d. Distribution only: This should include all Private Bank expenses other than those attributable to sub-transfer agency services.
Therefore, the following data need not be provided:
1. Adjusting total profitability data for Private Bank expenses
2. Adjusting profitability excluding distribution by backing out all Private Bank expenses.
3. Potential economies of scale. CMG and the IFC should continue to work on methods for more precisely quantifying to the extent possible the sources and magnitude of any economies of scale as CMG's mutual fund assets under management increase, to the extent that the data allows for meaningful year-over-year comparisons. The framework suggested in Section IV.D.4 may prove to be a useful model for such an analysis.
4. Competitive breakpoint analysis. As part of the annual fee evaluation process, the breakpoints of a select group of Atlantic Funds (which would differ each year) should continue to be compared to those of industry rivals to ensure that the Funds' breakpoint schedules remain within industry norms. As breakpoint schedules change relatively little each year, performing such a comparison for each Atlantic Fund each year would not be an efficient use of Trustee and CMG resources.
5. Cost allocation methodology. CMG's point that the current ABC system of allocating indirect expenses creates anomalous results in several cases, including sub-advised Funds, is well-taken. We would like to work with CMG over the forthcoming year on alternatives to the current system of allocating indirect expenses that (1) resolve the anomalies, (2) limit the amount of incremental effort on CMG's part and (3) remain faithful to the general principle that expenses should be allocated by time and effort to the extent reasonably possible.
6. Management fee disparities. CMG and the Atlantic Trustees, as part of any future study of management fees, should analyze the differences in management fee schedules, principally arising out of the reorganization of the former Excelsior Funds as Atlantic Funds. As part of that analysis, CMG should provide an explanation for any significant fee differences among comparable funds across fund families managed by CMA, such as differences in the management styles of different Funds included the same Lipper category. Finally, whenever CMG proposes a management fee change or an expense cap for any mutual fund managed by CMA that is comparable to any Atlantic Fund, CMG should provide the Trustees with sufficient information about the proposal to allow the Trustees to
40
assess the applicability of the proposed change to the relevant Atlantic Fund or Funds.
7. Tax-exempt Fund expense data. The expense rankings of certain tax-exempt Funds were adversely affected by including certain investment-related interest expenses that Lipper excluded in calculating the expense ratios of competitors. We recommend that CMG follow the Lipper practice and exclude such interest expenses from data submitted to Lipper to avoid unfairly disadvantaging the tax-exempt Funds.
8. Reduction of volume of paper documents submitted. The effort to rationalize and simplify the data presented to the Trustees and the process by which that data was prepared and organized was regarded as a success by all parties. We should continue to look for opportunities to reduce and simplify the presentation of 15(c) data, especially in the area of Fund profitability. The Fund "Dashboard" volume presents a large volume of Fund data on a single page. If it is continued, the Trustees may wish to consider receiving the underlying Lipper data on CD, rather than the current paper volumes.
Respectfully submitted,
Steven E. Asher
41
This page intentionally left blank.
This page intentionally left blank.
This page intentionally left blank.
Important Information About This Report
The fund mails one shareholder report to each shareholder address. If you would like more than one report, please call shareholder services at 1-800-345-6611 and additional reports will be sent to you. This report has been prepared for shareholders of Columbia Massachusetts Tax-Exempt Fund.
A description of the policies and procedures that the fund uses to determine how to vote proxies and a copy of the fund's voting records are available (i) at www.columbiamanagement.com; (ii) on the Securities and Exchange Commission's website at www.sec.gov, and (iii) without charge, upon request, by calling 1-800-368-0346. Information regarding how the fund voted proxies relating to portfolio securities during the 12-month period ended June 30 is available from the SEC's website. Information regarding how the fund voted proxies relating to portfolio securities is also available from the fund's website, www.columbiamanagement.com.
The fund files a complete schedule of portfolio holdings with the SEC for the first and third quarters of each fiscal year on Form N-Q. The fund's Form N-Q is available on the SEC's website at www.sec.gov and may be reviewed and copied at the SEC's Public Reference Room in Washington, DC. Information on the operation of the Public Reference Room may be obtained by calling 1-800-SEC-0330.
An investment in money market mutual funds is not a bank deposit, and is not insured or guaranteed by Bank of America, N.A. or any of its affiliates or by the Federal Deposit Insurance Corporation or any other government agency. Although money market mutual funds seek to preserve the value of your investment at $1.00 per share, it is possible to lose money by investing in money market mutual funds. Please see the prospectuses for a complete discussion of the risks of investing in money market mutual funds.
Please read and consider the investment objectives, risks, charges and expenses for any fund carefully before investing. For a prospectus which contains this and other important information about the fund, contact your Columbia Management representative or financial advisor or go to www.columbiamanagement.com.
Columbia Management Group, LLC ("Columbia Management") is the investment management division of Bank of America Corporation. Columbia Management entities furnish investment management services and products for institutional and individual investors. Columbia Funds are distributed by Columbia Management Distributors, Inc., member of FINRA, SIPC, part of Columbia Management and an affiliate of Bank of America Corporation.
Transfer Agent
Columbia Management Services, Inc.
P.O. Box 8081
Boston, MA 02266-8081
1-800-345-6611
Distributor
Columbia Management
Distributors, Inc.
One Financial Center
Boston, MA 02111
Investment Advisor
Columbia Management Advisors, LLC
100 Federal Street
Boston, MA 02110
45
Columbia Management®
Columbia Massachusetts Tax-Exempt Fund
Annual Report, October 31, 2008
PRSRT STD
U.S. Postage
PAID
Holliston, MA
Permit NO. 20
©2008 Columbia Management Distributors, Inc.
One Financial Center, Boston, MA 02111-2621
800-345-6611 www.columbiafunds.com
SHC-42/156809-1008 (12/08) 08/65977
Columbia Management®
Annual Report
October 31, 2008
Columbia New York Tax-Exempt Fund
| NOT FDIC INSURED | | May Lose Value | |
|
| NOT BANK ISSUED | | No Bank Guarantee | |
|
Table of Contents
| Fund Profile | | | 1 | | |
|
| Economic Update | | | 2 | | |
|
| Performance Information | | | 3 | | |
|
| Understanding Your Expenses | | | 4 | | |
|
| Portfolio Manager's Report | | | 5 | | |
|
| Investment Portfolio | | | 7 | | |
|
Statement of Assets and
Liabilities | | | 11 | | |
|
| Statement of Operations | | | 12 | | |
|
Statement of Changes in
Net Assets | | | 13 | | |
|
| Financial Highlights | | | 15 | | |
|
| Notes to Financial Statements | | | 18 | | |
|
| Report of Independent Registered Public Accounting Firm | | | 26 | | |
|
| Federal Income Tax Information | | | 27 | | |
|
| Fund Governance | | | 28 | | |
|
Board Consideration and
Approval of Advisory Agreements | | | 32 | | |
|
Summary of Management
Fee Evaluation by Independent
Fee Consultant | | | 35 | | |
|
Important Information About
This Report | | | 41 | | |
|
The views expressed in this report reflect the current views of the respective parties. These views are not guarantees of future performance and involve certain risks, uncertainties and assumptions that are difficult to predict, so actual outcomes and results may differ significantly from the views expressed. These views are subject to change at any time based upon economic, market or other conditions and the respective parties disclaim any responsibility to update such views. These views may not be relied on as investment advice and, because investment decisions for a Columbia Fund are based on numerous factors, may not be relied on as an indication of trading intent on behalf of any particular Columbia Fund. References to specific securities should not be construed as a recommendation or investment advice.
President's Message

Dear Shareholder:
We are pleased to provide this shareholder report for your Columbia Fund and hope you will find the portfolio management details, discussions and performance information helpful in monitoring your investments. As we've seen this past year, the financial markets can be quite volatile, with significant short-term price fluctuations. It's important to keep these ups and downs in perspective, particularly in light of your long-term investment strategy.
Staying the course with your long-term strategy typically involves riding out short-term price fluctuations, though we recognize that at times this can be tough. To support your efforts and give you the information you need to make prudent decisions, Columbia Management offers several valuable online resources. We encourage you to visit www.columbiamanagement.com/investor, where you can receive the most up-to-date information, including:
g Daily pricing and performance. View pricing and performance from a link in Fund Tracker on the homepage. This listing of funds is updated nightly with the current net asset value and the amount and percentage change from the prior day.
g News & Commentary. This tab provides links to quarterly fund commentaries and information from our investment strategies group, including trends in the economy and market impact.
If you would like more details on individual funds, select a fund from the dropdown menu on the top right side of the homepage for access to:
g Monthly and quarterly performance information.
g Portfolio holdings. Full holdings are updated monthly for money market funds, except for Columbia Cash Reserves, Columbia Government Plus Reserves, Columbia Government Reserves, Columbia Treasury Reserves and Columbia Money Market Reserves which are updated weekly, monthly for equity funds and quarterly for most other funds.
g Quarterly fact sheets. Accessible from the Literature tab in each fund page.
By registering on the site, you'll receive secured, 24-hour access to*:
g Mutual fund account details with balances, dividend and transaction information.
g Fund Tracker to customize your homepage with current net asset values for the funds that interest you.
g On-line transactions including purchases, exchanges and redemptions.
g Account maintenance for updating your address and dividend payment options.
g Electronic delivery of prospectuses and shareholder reports.
I encourage you to visit our website for access to the product information and tools described above. These valuable online resources can help you monitor your investments and provide direct access to your account. All of these tools, and more, can be found on www.columbiamanagement.com/investor.
While your financial advisor is a great resource for investment guidance, you can also access our website or call our service representatives at 800.345.6611 for additional assistance. We thank you for investing with Columbia Management and look forward to helping with your ongoing investment needs.
Sincerely,

Christopher L. Wilson
President, Columbia Funds
*Some restrictions apply. Shareholders who purchase shares through certain third-party organizations may not have the ability to register for online access.
Fund Profile – Columbia New York Tax-Exempt Fund
Summary
g For the 12-month period that ended October 31, 2008, the fund's Class A shares returned negative 7.86% without sales charge.
g The fund underperformed its benchmark, the Barclays Capital Municipal Bond Index1 and its peer group average, the Lipper New York Municipal Debt Funds Classification.2
g Bonds in the mid-to-lower quality tiers held back performance compared to the benchmark and peer group performance. We believe that longer maturity bonds also hampered performance relative to the peer group average.
Portfolio Management
Gary Swayze has managed the fund since September 1997 and has been with the advisor or its predecessors or affiliate organizations since 1997.
1The Barclays Capital Municipal Bond Index (formerly the Lehman Brothers Municipal Bond Index) is considered representative of the broad market for investment-grade, tax exempt bonds with maturities of at least one year. Indices are not investments, do not incur fees or expenses and are not professionally managed. It is not possible to invest directly in an index. Securities in the fund may not match those in an index.
2Lipper Inc., a widely respected data provider in the industry, calculates an average total return (assuming reinvestment of distributions) for mutual funds with investment objectives similar to those of the fund. Lipper makes no adjustment for the effect of sales loads.
Performance data quoted represents past performance and current performance may be lower or higher. Past performance is no guarantee of future results. The investment return and principal value will fluctuate so that shares, when redeemed, may be worth more or less than the original cost. Please visit www.columbiafunds.com for daily and most recent month-end performance updates.
Summary
1-year return as of 10/31/08
| | –7.86% | |
|
 | | Class A shares
(without sales charge) | |
|
| | –3.30% | |
|
 | | Barclays Capital
Municipal Bond Index | |
|
Morningstar Style Box

The Morningstar Style Box reveals a fund's investment strategy. For fixed-income funds the vertical axis shows the average credit quality of the bonds owned, and the horizontal axis shows interest rate sensitivity as measured by a bond's duration (short, intermediate or long). All of these numbers are drawn from the data most recently provided by the fund and entered into Morningstar's database as of quarter-end. Although the data is gathered from reliable sources, Morningstar cannot guarantee its completeness and accuracy. Information shown is as of 06/30/08.
1
Economic Update – Columbia New York Tax-Exempt Fund
Summary
For the 12-month period that ended October 31, 2008
g Despite volatility in many segments of the bond market, the Barclays Capital U.S. Aggregate Bond Index delivered a modest gain. High-yield bonds lost significant ground, as measured by the Merrill Lynch U.S. High Yield, Cash Pay Index.
Barclays
Index | | Merrill
Lynch Index | |
|
 | |  | |
|
g The broad U.S. stock market, as measured by the S&P 500 Index, returned negative 36.10%. Developed stock markets outside the United States returned negative 46.62%, as measured (in U.S. dollars) by the MSCI EAFE Index.
| S&P Index | | MSCI Index | |
|
 | |  | |
|
The Barclays Capital U.S. Aggregate Bond Index (formerly the Lehman Brothers U.S. Aggregate Bond Index) is a market value-weighted index that tracks the daily price, coupon, pay-downs and total return performance of fixed-rate, publicly placed, dollar-denominated and non-convertible investment grade debt issues with at least $250 million par amount outstanding and with at least one year to final maturity.
The Merrill Lynch U.S. High Yield, Cash Pay Index tracks the performance of non-investment-grade corporate bonds.
The Standard & Poor's (S&P) 500 Index tracks the performance of 500 widely held, large-capitalization US stocks.
The Morgan Stanley Capital International (MSCI) Europe, Australasia, Far East (EAFE) Index is a free float-adjusted market capitalization index that is designed to measure developed market equity performance, excluding the US and Canada.
Indices are not investments, do not incur fees or expenses and are not professionally managed. It is not possible to invest directly in an index. Securities in the fund may not match those in an index.
The pace of economic growth ground to a halt during the 12-month period that began November 1, 2007 and ended October 31, 2008. Although the economic growth was modestly positive at the beginning of the period, the economy slipped into recession in 2008, with little relief in sight. A host of factors weighed on consumers and businesses alike.
The most severe housing downturn in decades showed no sign of abating as inventories of homes for sale rose, home prices declined and tighter credit standards, a result of continued turmoil in the subprime mortgage market, made it more difficult for homebuyers to qualify for loans.
The labor market contracted for ten consecutive months, driving the unemployment rate to 6.5%, the highest rate since the early 1990s. Nearly 1.2 million jobs have been lost since the beginning of 2008, with announced layoffs likely to drive that number even higher in the months ahead. Manufacturing activity slowed and consumer spending declined, dimming hopes for the holiday season.
A weakening economy and turmoil in the financial markets took a toll on consumer confidence, which plummeted to the lowest point ever in the 40-year history of the Conference Board's monthly survey.
In an effort to inspire confidence in the capital markets, loosen the reins on credit and shore up economic growth, the Federal Reserve Board (the Fed) brought a key short-term rate—the federal funds rate—down from 4.50% to 1.0% during the 12-month period. Despite earlier concerns about inflation, a weak economic outlook has kept the Fed focused on stimulating economic growth through lowering borrowing rates. In fact, the one bright spot during this period of uncertainty has been lower energy and commodity prices. With oil trading near $60 per barrel at the end of the period, gasoline prices are forecasted to come down below $2 per gallon after peaking above $4 per gallon during the summer months.
Bonds eke out a small, positive return
The U.S. bond market seesawed during the 12-month period but managed to eke out a small gain as investors sought the relative safety of the highest quality sectors. After a weak start, bond prices in several sectors rose and yields declined as economic growth slowed and stock market volatility increased. The benchmark 10-year U.S. Treasury yield ended the period at just under 4.0%, nearly one-half percentage point lower than where it stood one year ago. In this environment, the Barclays Capital U.S. Aggregate Bond Index returned 0.30%. High-yield bonds disappointed as economic prospects weakened and default fears rose. The Merrill Lynch U.S. High Yield, Cash Pay Index returned negative 26.43%.
Stocks retreat as economic outlook darkens
Against a shifting economic backdrop, the U.S. stock market lost 36.10% for the 12-month period, as measured by the S&P 500 Index. Losses extended across all market caps and both growth and value, although value stocks held up somewhat better than growth stocks, as measured by their respective Russell indices.1 Stock markets outside the U.S. suffered even greater losses. The MSCI EAFE Index, a broad gauge of stock market performance in foreign developed markets, lost 46.62% (in U.S. dollars) for the period. Emerging stock markets, which have had a strong run over the past several years, were also caught in the downdraft. As investors backed away from risk, emerging markets suffered most of all. The MSCI Emerging Markets Index returned negative 56.22% (in U.S. dollars).2
Past performance is no guarantee of future results.
1The Russell 1000 Index measures the performance of 1,000 of the largest US companies, based on market capitalization. The Russell Midcap Index measures the performance of the 800 smallest companies in the Russell 1000 Index, as ranked by total market capitalization. The Russell 2000 Index measures the performance of the 2,000 smallest of the 3,000 largest US companies based on market capitalization.
2The Morgan Stanley Capital International (MSCI) Emerging Markets Index is a widely accepted index composed of a sample of companies from 25 countries representing the global emerging stock markets.
Indices are not investments, do not incur fees or expenses and are not professionally managed. It is not possible to invest directly in an index. Securities in the fund may not match those in an index.
2
Performance Information – Columbia New York Tax-Exempt Fund
Growth of a $10,000 investment 11/01/98 – 10/31/08
The chart above shows the growth in value of a hypothetical $10,000 investment in Class A shares of Columbia New York Tax-Exempt Fund during the stated time period, and does not reflect the deduction of taxes that a shareholder may pay on fund distributions or on the redemption of fund shares. The Barclays Capital Municipal Bond Index is considered representative of the broad market for investment-grade, tax exempt bonds with maturities of at least one year. Indices are not investments, do not incur fees or expenses and are not professionally managed. It is not possible to invest directly in an index. Securities in the fund may not match those in an index.
Performance of a $10,000 investment 11/01/98 – 10/31/08 ($)
| Sales charge | | without | | with | |
| Class A | | | 13,986 | | | | 13,322 | | |
| Class B | | | 12,983 | | | | 12,983 | | |
| Class C | | | 13,377 | | | | 13,377 | | |
Average annual total return as of 10/31/08 (%)
| Share class | | A | | B | | C | |
| Inception | | 09/26/86 | | 08/04/92 | | 08/01/97 | |
| Sales charge | | without | | with | | without | | with | | without | | with | |
| 1-year | | –7.86 | | –12.23 | | –8.54 | | –12.91 | | –8.27 | | –9.15 | |
| 5-year | | 1.36 | | 0.38 | | 0.61 | | 0.27 | | 0.91 | | 0.91 | |
| 10-year | | 3.41 | | 2.91 | | 2.64 | | 2.64 | | 2.95 | | 2.95 | |
Average annual total return as of 09/30/08 (%)
| Share class | | A | | B | | C | |
| Sales charge | | without | | with | | without | | with | | without | | with | |
| 1-year | | –3.99 | | –8.55 | | –4.70 | | –9.26 | | –4.42 | | –5.34 | |
| 5-year | | 1.94 | | 0.95 | | 1.18 | | 0.84 | | 1.48 | | 1.48 | |
| 10-year | | 3.73 | | 3.23 | | 2.96 | | 2.96 | | 3.27 | | 3.27 | |
The "with sales charge" returns include the maximum initial sales charge of 4.75% for Class A shares, the applicable contingent deferred sales charge of 5.00% in the first year, declining to 1.00% in the sixth year, and eliminated thereafter for Class B shares and 1.00% for Class C shares for the first year only. The "without sales charge" returns do not include the effect of sales charges. If they had, returns would be lower.
Performance results reflect any fee waivers or reimbursements of fund expenses by the investment advisor and/or any of its affiliates. Absent these fee waivers or expense reimbursement arrangements, performance results would have been lower.
All results shown assume reinvestment of distributions. Please see the fund's prospectus for details. Performance for different share classes will vary based on differences in sales charges and the fees associated with each class.
The tables do not reflect the deduction of taxes a shareholder may pay on fund distributions or on the redemption of fund shares.
Performance data quoted represents past performance and current performance may be lower or higher. Past performance is no guarantee of future results. The investment return and principal value will fluctuate so that shares, when redeemed, may be worth more or less than the original cost. Please visit www.columbiafunds.com for daily and most recent month-end performance updates.
Annual operating expense ratio (%)*
| Class A | | | 1.05 | | |
| Class B | | | 1.80 | | |
| Class C | | | 1.80 | | |
* The annual operating expense ratio is as stated in the fund's prospectus that is current as of the date of this report. Differences in expense ratios disclosed elsewhere in this report may result from including fee waivers and expense reimbursements as well as different time periods used in calculating the ratios.
3
Understanding Your Expenses – Columbia New York Tax-Exempt Fund
Estimating your actual expenses
To estimate the expenses that you paid over the period, first you will need your account balance at the end of the period:
g For shareholders who receive their account statements from Columbia Management Services, Inc., your account balance is available online at www.columbiafunds.com or by calling Shareholder Services at 800.345.6611.
g For shareholders who receive their account statements from their financial intermediary, contact your financial intermediary to obtain your account balance.
1. Divide your ending account balance by $1,000. For example, if an account balance was $8,600 at the end of the period, the result would be 8.6.
2. In the section of the table below titled "Expenses paid during the period," locate the amount for your share class. You will find this number in the column labeled "Actual." Multiply this number by the result from step 1. Your answer is an estimate of the expenses you paid on your account during the period.
If the value of your account falls below the minimum initial investment requirement applicable to you, your account generally will be subject to a $20 annual fee. This fee is not included in the accompanying table. If you are subject to the fee, keep it in mind when you are estimating the ongoing expenses of investing in the fund and when comparing the expenses of this fund with other funds.
As a fund shareholder, you incur two types of costs. There are transaction costs, which generally include sales charges on purchases and may include redemption fees or exchange fees. There are also ongoing costs, which generally include investment advisory fees, distribution and service (Rule 12b-1) fees and other fund expenses. The information on this page is intended to help you understand the ongoing costs of investing in the fund and to compare these costs with the ongoing costs of investing in other mutual funds.
Analyzing your fund's expenses by share class
To illustrate these ongoing costs, we have provided an example and calculated the expenses paid by investors in each share class during the period. The information in the following table is based on an initial investment of $1,000, which is invested at the beginning of the period and held for the entire period. Expense information is calculated two ways and each method provides you with different information. The amount listed in the "Actual" column is calculated using the fund's actual operating expenses and total return for the period. The amount listed in the "Hypothetical" column for each share class assumes that the return each year is 5% before expenses and is calculated based on the fund's actual operating expenses. You should not use the hypothetical account values and expenses to estimate either your actual account balance at the end of the period or the expenses you paid during this period.
Compare with other funds
Since all mutual funds are required to include the same hypothetical calculations about expenses in shareholder reports, you can use this information to compare the ongoing costs of investing in the fund with other funds. To do so, compare the 5% hypothetical example with the 5% hypothetical examples that appear in the shareholder reports of other funds. As you compare hypothetical examples of other funds, it is important to note that hypothetical examples are meant to highlight the ongoing costs of investing in a fund and do not reflect any transaction costs, such as sales charges, redemption fees or exchange fees.
05/01/08 – 10/31/08
| | | Account value at the
beginning of the period ($) | | Account value at the
end of the period ($) | | Expenses paid
during the period ($) | | Fund's annualized
expense ratio (%) | |
| | | Actual | | Hypothetical | | Actual | | Hypothetical | | Actual | | Hypothetical | | Actual | |
| Class A | | | 1,000.00 | | | | 1,000.00 | | | | 920.62 | | | | 1,020.91 | | | | 4.06 | | | | 4.27 | | | | 0.84 | | |
| Class B | | | 1,000.00 | | | | 1,000.00 | | | | 917.20 | | | | 1,017.14 | | | | 7.66 | | | | 8.06 | | | | 1.59 | | |
| Class C | | | 1,000.00 | | | | 1,000.00 | | | | 918.51 | | | | 1,018.65 | | | | 6.22 | | | | 6.55 | | | | 1.29 | | |
Expenses paid during the period are equal to the annualized expense ratio for the share class, multiplied by the average account value over the period, then multiplied by the number of days in the fund's most recent fiscal half-year and divided by 366.
Had the investment advisor and/or any of its affiliates not waived fees or reimbursed a portion of expenses, account value at the end of the period would have been reduced.
It is important to note that the expense amounts shown in the table are meant to highlight only ongoing costs of investing in the fund and do not reflect any transaction costs, such as sales charges, redemption fees or exchange fees. Therefore, the hypothetical examples provided may not help you determine the relative total costs of owning shares of different funds. If these transaction costs were included, your costs would have been higher.
4
Portfolio Manager's Report – Columbia New York Tax-Exempt Fund
For the 12-month period that ended October 31, 2008, the fund's Class A shares returned negative 7.86% without sales charge. That was worse than the negative 3.30% return of the fund's benchmark, the Barclays Capital Municipal Bond Index1, and behind the negative 7.30% average return of its peer group, the Lipper New York Municipal Debt Funds Classification.2 The fund's shortfall to its benchmark was the result of two factors: the index is national in scope and it has less exposure than the fund to longer-term (20 to 30 years) and mid-to-lower quality sectors, which were underperformers during the period. We believe the fund underperformed its peer group average because it had more exposure to bonds with longer maturities and medium quality in the health care industry and bonds issued by assisted living and other retirement facilities.
Economic slowdown has sharp impact
A year ago, we anticipated an economic slowdown and an easing of inflationary pressures fed by high commodity prices and worldwide growth. But the intensity of the slowdown has been unexpectedly sharp. In hopes of reviving the economy, the Federal Reserve Board (the Fed) cut short-term interest rates aggressively while Congress passed a stimulus package to aid middle-class households.
Fallout from a widespread credit crisis caused municipal bonds to underperform Treasuries over this period. Sinking home values and waves of foreclosures began to shrink tax revenues and swell deficits for state and local governments. In addition, downgrades of municipal bond insurers dramatically reduced the number of AAA-rated3 municipal bonds. As a result, investors demanded higher yields for insured issues, which represent over half of the new issue market. Meanwhile, volatile markets forced some institutions to sell off their municipal bond holdings, especially hedge funds.
Amid this economic stress, the yield difference between higher and lower quality municipal bonds widened. The period's worst performance came in lower quality, long-maturity sectors where yields rose substantially. Skittish investors preferred to confine their commitments to better quality issues with maturities of five years or less, causing yields to decline and raising prices modestly for these bonds.
Lower and medium quality fund holdings and those with long maturities hurt results. We achieved better returns among intermediate-term prerefunded bonds, which are backed by escrowed government securities.
A weak recovery possible next year
Wall Street normally generates about 20% of New York State's tax revenues. This year's turmoil, with merged and bankrupt firms eliminating thousands of jobs, has sapped
1The Barclays Capital Municipal Bond Index is considered representative of the broad market for investment-grade, tax-exempt bonds with maturities of at least one year. Indices are not investments, do not incur fees or expenses and are not professionally managed. It is not possible to invest directly in an index. Securities in the fund may not match those in an index.
2Lipper Inc., a widely respected data provider in the industry, calculates an average total return (assuming reinvestment of distributions) for mutual funds with investment objectives similar to those of the fund. Lipper makes no adjustment for the effect of sales loads.
3The credit quality ratings represent those of Moody's Investors Service, Inc. ("Moody's"), Standard & Poor's Corporation ("S&P") or Fitch Ratings ("Fitch") credit ratings. The ratings represent their opinions as to the quality of the securities they rate. Ratings are relative and subjective and are not absolute standards of quality. The security's credit quality does not eliminate risk.
Performance data quoted represents past performance and current performance may be lower or higher. Past performance is no guarantee of future results. The investment return and principal value will fluctuate so that shares, when redeemed, may be worth more or less than the original cost. Please visit www.columbiafunds.com for daily and most recent month-end performance updates.
Net asset value per share
as of 10/31/08 ($)
| Class A | | | 6.55 | | |
| Class B | | | 6.55 | | |
| Class C | | | 6.55 | | |
Distributions declared per share
11/01/07 – 10/31/08 ($)
| Class A | | | 0.38 | | |
| Class B | | | 0.32 | | |
| Class C | | | 0.35 | | |
A portion of the fund's income may be subject to the alternative minimum tax. The fund may at times purchase tax-exempt securities at a discount. Some, or all, of this discount may be included in the fund's ordinary income, and is taxable when distributed.Distributions include $0.08 per share of taxable realized gains.
30-day SEC yields
as of 10/31/08 (%)
| Class A | | | 4.63 | | |
| Class B | | | 4.09 | | |
| Class C | | | 4.40 | | |
The 30-day SEC yields reflect the fund's earning power, net of expenses, expressed as an annualized percentage of the public offering price per share at the end of the period.
Taxable-equivalent SEC yields
as of 10/31/08 (%)
| Class A | | | 7.65 | | |
| Class B | | | 6.76 | | |
| Class C | | | 7.27 | | |
Taxable-equivalent SEC yields are based on the combined maximum effective 35.0% federal income tax rate and the applicable state income tax rate. This tax rate does not reflect the phase out of exemptions or the reduction of the otherwise allowable deductions that occur when adjusted gross income exceeds certain levels.
5
Portfolio Manager's Report (continued) – Columbia New York Tax-Exempt Fund
Top 5 sectors
as of 10/31/08 (%)
| Special Non-Property Tax | | | 19.3 | | |
| Education | | | 11.5 | | |
| Hospitals | | | 7.0 | | |
| Municipal Electric | | | 6.6 | | |
| State Appropriated | | | 5.2 | | |
Quality breakdown
as of 10/31/08 (%)
| AAA | | | 27.9 | | |
| AA | | | 36.7 | | |
| A | | | 13.3 | | |
| BBB | | | 6.4 | | |
| BB | | | 0.9 | | |
| B | | | 1.7 | | |
| Non-Rated | | | 8.0 | | |
| Cash & Equivalents | | | 5.1 | | |
Maturity breakdown
as of 10/31/08 (%)
| 1-3 years | | | 1.2 | | |
| 5-7 years | | | 8.7 | | |
| 7-10 years | | | 9.9 | | |
| 10-15 years | | | 25.2 | | |
| 15-20 years | | | 18.2 | | |
| 20-25 years | | | 18.5 | | |
| 25 years and over | | | 13.2 | | |
| Cash & Equivalents | | | 5.1 | | |
Ratings shown in the quality breakdown represent the rating assigned to a particular bond by one of the following nationally-recognized rating agencies: Standard and Poor's, Moody's Investors Service, Inc. or Fitch Ratings Ltd. Ratings are relative and subjective and are not absolute standards of quality. The fund's credit quality does not remove market risk.
The fund is actively managed and the composition of its portfolio will change over time. Information provided is calculated as a percentage of net assets.
that revenue flow significantly. Job cuts in manufacturing and construction, along with falling prices and weak sales in the housing sector are also pressuring the state's budget, which already faced a multi-billion dollar deficit. Even if New York emerges from recession next year, its reliance on the volatile financial services sector and older manufacturing industries could keep growth in check. On the plus side, IBM's large nanotechnology investment at the University of Albany should brighten that region's job picture modestly.
A cautious, deliberate approach
A widening difference in yield between higher and lower quality securities of comparable maturities offers potential opportunities in bonds in the mid and lower quality tiers. However, we are being selective in our choice of securities because we do not believe that the challenges facing municipal issuers will dissipate quickly in light of the current economic slowdown. In this environment, we believe that short-term interest rates are likely to remain low and further stimulus moves are possible. Eventually, we believe that taxes may rise, making municipal bonds more attractive. However, we believe that continued stimulus programs could also trigger inflation over the longer-term, a potential negative for bond investors.
Portfolio holdings and characteristics are subject to change periodically and may not be representative of current holdings and characteristics. The outlook for the fund may differ from that presented for other Columbia Funds.
Tax-exempt investing offers current tax-exempt income, but it also involves special risks. The value of the fund will be affected by interest rate changes and the creditworthiness of issues held in the fund. When interest rates go up, bond prices generally drop and vice versa.
Interest income from certain tax-exempt bonds may be subject to certain state and local taxes and, if applicable, the alternative minimum tax. Capital gains are not exempt from income taxes.
The fund is non-diversified, which generally means that it may invest a greater percentage of its total assets in the securities of fewer issuers than a "diversified" fund. This increases the risk that a change in the value of any one investment held by the fund could affect the overall value of the fund more than it would affect that of a diversified fund holding a greater number of investments. Accordingly, the fund's value will likely be more volatile than the value of more diversified funds
Single-state municipal bond funds pose additional risks due to limited geographical diversification.
6
Investment Portfolio – Columbia New York Tax-Exempt Fund
October 31, 2008
| Municipal Bonds – 94.2% | |
| | | Par ($) | | Value ($) | |
| Education – 12.3% | |
| Education – 11.5% | |
| NY Dormitory Authority | |
Columbia University,
Series 2008,
5.000% 07/01/38 | | | 500,000 | | | | 478,375 | | |
New York University:
Series 1998 A,
Insured: MBIA
5.750% 07/01/27 | | | 2,000,000 | | | | 2,098,400 | | |
Series 2001 1,
Insured: AMBAC
5.500% 07/01/40 | | | 1,000,000 | | | | 987,800 | | |
St. John's University,
Series 2007 C,
Insured: MBIA
5.250% 07/01/30 | | | 1,000,000 | | | | 908,510 | | |
University of Rochester:
Series 2000 A,
Insured: MBIA
(a) 07/01/14
(5.700% 07/01/10) | | | 370,000 | | | | 352,954 | | |
Series 2007,
5.000% 07/01/27 | | | 1,000,000 | | | | 945,380 | | |
NY Dutchess County Industrial
Development Agency | |
Bard College,
Series 2007,
4.500% 08/01/36 | | | 500,000 | | | | 373,210 | | |
NY St. Lawrence County Industrial
Development Agency | |
Clarkson University,
Series 2007,
5.000% 07/01/31 | | | 1,000,000 | | | | 902,060 | | |
| Education Total | | | 7,046,689 | | |
| Prep School – 0.8% | |
NY New York City Industrial
Development Agency | |
Marymount School Academy,
Series 2001,
Insured: ACA
5.125% 09/01/21 | | | 625,000 | | | | 505,950 | | |
| Prep School Total | | | 505,950 | | |
| Education Total | | | 7,552,639 | | |
| | | Par ($) | | Value ($) | |
| Health Care – 12.7% | |
| Continuing Care Retirement – 3.3% | |
NY Broome County Industrial
Development Agency | |
Good Shepherd Village Endwell,
Series 2008 A,
6.750% 07/01/28 | | | 500,000 | | | | 416,200 | | |
NY Nassau County Industrial
Development Agency | |
Amsterdam at Harborside,
Series 2007 A,
6.700% 01/01/43 | | | 750,000 | | | | 596,903 | | |
NY Suffolk County Industrial
Development Agency | |
Active Retirement Community,
Series 2006,
5.000% 11/01/28 | | | 1,335,000 | | | | 979,943 | | |
| Continuing Care Retirement Total | | | 1,993,046 | | |
| Hospitals – 7.0% | |
| NY Albany Industrial Development Agency | |
St. Peter's Hospital,
Series 2008 A,
5.250% 11/15/32 | | | 750,000 | | | | 568,695 | | |
| NY Dormitory Authority | |
Kaleida Health,
Series 2006,
Insured: FHA
4.700% 02/15/35 | | | 1,000,000 | | | | 797,180 | | |
North Shore University Hospital,
Series 2007 A,
5.000% 05/01/32 | | | 1,000,000 | | | | 786,370 | | |
NYU Hospital Center,
Series 2007 B,
5.625% 07/01/37 | | | 1,000,000 | | | | 725,720 | | |
Orange Regional Medical Center,
Series 2008,
6.125% 12/01/29 | | | 650,000 | | | | 525,096 | | |
NY Saratoga County Industrial
Development Agency | |
| Saratoga Hospital: | |
Series 2004 A,
5.000% 12/01/13 | | | 250,000 | | | | 242,070 | | |
Series 2007 B,
5.250% 12/01/32 | | | 500,000 | | | | 379,035 | | |
| NY Yonkers Industrial Development Agency | |
St. John's Riverside Hospital,
Series 2001 A,
6.800% 07/01/16 | | | 320,000 | | | | 290,125 | | |
| Hospitals Total | | | 4,314,291 | | |
See Accompanying Notes to Financial Statements.
7
Columbia New York Tax-Exempt Fund
October 31, 2008
| Municipal Bonds (continued) | |
| | | Par ($) | | Value ($) | |
| Nursing Homes – 2.4% | |
| NY Amherst Industrial Development Agency | |
Beechwood Health Care Center,
Series 2007,
5.200% 01/01/40 | | | 750,000 | | | | 458,273 | | |
NY Essex County Industrial
Development Agency | |
Moses Ludington Nursing Home,
Series 2000 A,
Insured: FHA
6.200% 02/01/30 | | | 1,055,000 | | | | 1,020,807 | | |
| Nursing Homes Total | | | 1,479,080 | | |
| Health Care Total | | | 7,786,417 | | |
| Housing – 5.6% | |
| Assisted Living/Senior – 4.3% | |
| NY Huntington Housing Authority | |
Gurwin Jewish Senior Center,
Series 1999 A,
5.875% 05/01/19 | | | 1,500,000 | | | | 1,250,325 | | |
NY Mount Vernon Industrial
Development Agency | |
Wartburg Senior Housing, Inc.,
Series 1999:
6.150% 06/01/19 | | | 1,000,000 | | | | 878,660 | | |
| 6.200% 06/01/29 | | | 615,000 | | | | 483,519 | | |
| Assisted Living/Senior Total | | | 2,612,504 | | |
| Single-Family – 1.3% | |
| NY Mortgage Agency | |
Series 2007 148,
5.200% 10/01/32 | | | 1,000,000 | | | | 787,570 | | |
| Single-Family Total | | | 787,570 | | |
| Housing Total | | | 3,400,074 | | |
| Other – 9.5% | �� |
| Other – 0.8% | |
NY Westchester County Industrial
Development Agency | |
Guiding Eyes for the Blind,
Series 2004,
5.375% 08/01/24 | | | 550,000 | | | | 459,921 | | |
| Other Total | | | 459,921 | | |
| | | Par ($) | | Value ($) | |
| Pool/Bond Bank – 4.6% | |
| NY Environmental Facilities Corp. | |
Series 2005 B,
5.500% 04/15/35 | | | 1,000,000 | | | | 1,019,640 | | |
Series 2006 A,
4.750% 06/15/31 | | | 1,000,000 | | | | 886,980 | | |
Series 2008 A,
5.000% 06/15/37 | | | 1,000,000 | | | | 918,840 | | |
| Pool/Bond Bank Total | | | 2,825,460 | | |
| Refunded/Escrowed (b) – 4.1% | |
| NY Dormitory Authority | |
Memorial Sloan-Kettering Cancer Center,
Series 2003,
Escrowed to Maturity,
Insured: MBIA
(c) 07/01/25 | | | 3,000,000 | | | | 1,222,410 | | |
Series 2000 A,
Pre-refunded 07/01/10,
Insured: MBIA
(a) 07/01/14
(5.700% 07/01/10) | | | 630,000 | | | | 607,585 | | |
| NY Greece Central School District | |
Series 1992,
Escrowed to Maturity,
Insured: FGIC
6.000% 06/15/16 | | | 500,000 | | | | 572,640 | | |
| NY Urban Development Corp. | |
Series 2002 A,
Pre-refunded 01/01/11,
5.500% 01/01/17 | | | 105,000 | | | | 111,393 | | |
| Refunded/Escrowed Total | | | 2,514,028 | | |
| Other Total | | | 5,799,409 | | |
| Other Revenue – 1.1% | |
| Recreation – 1.1% | |
| NY Trust Cultural Resources | |
Museum of Modern Art,
Series 2008 1A,
5.000% 04/01/31 | | | 750,000 | | | | 688,425 | | |
| Recreation Total | | | 688,425 | | |
| Other Revenue Total | | | 688,425 | | |
See Accompanying Notes to Financial Statements.
8
Columbia New York Tax-Exempt Fund
October 31, 2008
| Municipal Bonds (continued) | |
| | | Par ($) | | Value ($) | |
| Tax-Backed – 28.9% | |
| Local Appropriated – 2.6% | |
| NY Dormitory Authority | |
Series 2001 2-4,
4.750% 01/15/30 | | | 1,000,000 | | | | 883,860 | | |
Westchester County,
Series 1998,
(c) 08/01/19 | | | 1,200,000 | | | | 694,536 | | |
| Local Appropriated Total | | | 1,578,396 | | |
| Local General Obligations – 1.8% | |
| NY Mount Sinai School District | |
Series 1992,
Insured: AMBAC
6.200% 02/15/19 | | | 1,005,000 | | | | 1,133,348 | | |
| Local General Obligations Total | | | 1,133,348 | | |
| Special Non-Property Tax – 19.3% | |
| NY Local Government Assistance Corp. | |
| Series 1993 C, | |
| 5.500% 04/01/17 | | | 2,100,000 | | | | 2,163,651 | | |
Series 1993 E:
5.000% 04/01/21 | | | 5,650,000 | | | | 5,601,297 | | |
| 6.000% 04/01/14 | | | 2,945,000 | | | | 3,164,020 | | |
| PR Commonwealth of Puerto Rico Sales Tax Financing Corp. | |
Series 2007 A,
5.250% 08/01/57 | | | 1,000,000 | | | | 862,550 | | |
| Special Non-Property Tax Total | | | 11,791,518 | | |
| State Appropriated – 5.2% | |
| NY Dormitory Authority | |
Series 1993,
6.000% 07/01/20 | | | 2,000,000 | | | | 2,079,120 | | |
State University,
Series 2000 C,
Insured: FSA
5.750% 05/15/17 | | | 1,000,000 | | | | 1,099,540 | | |
| State Appropriated Total | | | 3,178,660 | | |
| Tax-Backed Total | | | 17,681,922 | | |
| Transportation – 10.1% | |
| Air Transportation – 3.3% | |
NY New York City Industrial
Development Agency | |
American Airlines, Inc.,
Series 2005, AMT,
7.750% 08/01/31 | | | 1,000,000 | | | | 748,010 | | |
| | | Par ($) | | Value ($) | |
Terminal One Group Association LP,
Series 2005, AMT,
5.500% 01/01/24 | | | 1,500,000 | | | | 1,263,150 | | |
| Air Transportation Total | | | 2,011,160 | | |
| Ports – 3.2% | |
| NY Port Authority of New York & New Jersey | |
Series 1993,
5.375% 03/01/28 | | | 2,000,000 | | | | 1,961,060 | | |
| Ports Total | | | 1,961,060 | | |
| Toll Facilities – 1.6% | |
| NY Thruway Authority | |
Series 2007,
Insured: FGIC
5.000% 01/01/27 | | | 1,000,000 | | | | 951,770 | | |
| Toll Facilities Total | | | 951,770 | | |
| Transportation – 2.0% | |
| NY Metropolitan Transportation Authority | |
Series 2005 B,
Insured: AMBAC
5.250% 11/15/23 | | | 1,250,000 | | | | 1,240,988 | | |
| Transportation Total | | | 1,240,988 | | |
| Transportation Total | | | 6,164,978 | | |
| Utilities – 14.0% | |
| Independent Power Producers – 1.3% | |
NY Suffolk County Industrial
Development Agency | |
Nissequogue Cogeneration Partners Facilities,
Series 1998, AMT,
5.500% 01/01/23 | | | 1,000,000 | | | | 785,340 | | |
| Independent Power Producers Total | | | 785,340 | | |
| Investor Owned – 3.7% | |
NY Energy & Research
Development Authority | |
| Brooklyn Union Gas Co.: | |
Series 1993, IFRN,
7.838% 04/01/20(d) | | | 1,500,000 | | | | 1,514,190 | | |
Series 2005 A, AMT,
Insured: FGIC
4.700% 02/01/24 | | | 1,000,000 | | | | 782,760 | | |
| Investor Owned Total | | | 2,296,950 | | |
| Municipal Electric – 6.6% | |
| NY Long Island Power Authority | |
Series 2000,
Insured: FSA
(c) 06/01/18 | | | 1,000,000 | | | | 618,260 | | |
Series 2008 A,
6.000% 05/01/33 | | | 1,000,000 | | | | 998,730 | | |
See Accompanying Notes to Financial Statements.
9
Columbia New York Tax-Exempt Fund
October 31, 2008
| Municipal Bonds (continued) | |
| | | Par ($) | | Value ($) | |
PR Commonwealth of Puerto Rico Electric
Power Authority | |
Series 2002 KK,
Insured: MBIA
5.500% 07/01/15 | | | 1,500,000 | | | | 1,512,360 | | |
Series 2003 NN,
Insured: MBIA
5.250% 07/01/21 | | | 1,000,000 | | | | 930,670 | | |
| Municipal Electric Total | | | 4,060,020 | | |
| Water & Sewer – 2.4% | |
| NY Great Neck North Water Authority | |
Series 2008,
5.000% 01/01/33 | | | 690,000 | | | | 642,383 | | |
NY New York City Municipal Water
Finance Authority | |
Series 2008,
4.500% 06/15/38 | | | 1,000,000 | | | | 801,730 | | |
| Water & Sewer Total | | | 1,444,113 | | |
| Utilities Total | | | 8,586,423 | | |
Total Municipal Bonds
(cost of $61,610,560) | | | 57,660,287 | | |
| Investment Company – 0.2% | |
| | | Shares | | | |
Dreyfus Cash
Management Plus
(7 day yield of 2.260%) | | | 116,043 | | | | 116,043 | | |
Total Investment Company
(cost of $116,043) | | | 116,043 | | |
| Short-Term Obligation – 0.1% | |
| | | Par ($) | | | |
| Variable Rate Demand Note (e) – 0.1% | |
| NY New York City | |
Series 1993 A-8,
LOC: JPMorgan Chase
0.850% 08/01/18 | | | 100,000 | | | | 100,000 | | |
| Variable Rate Demand Note Total | | | 100,000 | | |
Total Short-Term Obligation
(cost of $100,000) | | | 100,000 | | |
Total Investments – 94.5%
(cost of $61,826,603) (f) | | | 57,876,330 | | |
| Other Assets & Liabilities, Net – 5.5% | | | 3,346,516 | | |
| Net Assets – 100.0% | | | 61,222,846 | | |
Notes to Investment Portfolio:
(a) Step bond. This security is currently not paying coupon. Shown parenthetically is the next coupon rate to be paid and the date the security will begin accruing at this rate.
(b) The Fund has been informed that each issuer has placed direct obligations of the U.S. Government in an irrevocable trust, solely for the payment of principal and interest.
(c) Zero coupon bond.
(d) The interest rate shown on floating rate or variable rate securities reflects the rate at October 31, 2008.
(e) This security is payable upon demand and secured by letters of credit or other credit support agreements from banks. The interest rate changes periodically and the interest rate shown reflect the rate at October 31, 2008.
(f) Cost for federal income tax purposes is $61,092,341.
At October 31, 2008, the composition of the Fund by revenue source is as follows:
| Holdings By Revenue Source (Unaudited) | | % of
Net Assets | |
| Tax-Backed | | | 28.9 | | |
| Utilities | | | 14.0 | | |
| Health Care | | | 12.7 | | |
| Education | | | 12.3 | | |
| Transportation | | | 10.1 | | |
| Other | | | 9.5 | | |
| Housing | | | 5.6 | | |
| Other Revenue | | | 1.1 | | |
| | | | 94.2 | | |
| Investment Company | | | 0.2 | | |
| Short-Term Obligation | | | 0.1 | | |
| Other Assets & Liabilities, Net | | | 5.5 | | |
| | | | 100.0 | | |
| Acronym | | Name | |
| ACA | | ACA Financial Guaranty Corp. | |
|
| AMBAC | | Ambac Assurance Corp. | |
|
| AMT | | Alternative Minimum Tax | |
|
| FGIC | | Financial Guaranty Insurance Co. | |
|
| FHA | | Federal Housing Administration | |
|
| FSA | | Financial Security Assurance, Inc. | |
|
| IFRN | | Inverse Floating Rate Note | |
|
| LOC | | Letter of Credit | |
|
| MBIA | | MBIA Insurance Corp. | |
|
See Accompanying Notes to Financial Statements.
10
Statement of Assets and Liabilities – Columbia New York Tax-Exempt Fund
October 31, 2008
| Assets | | Investments, at cost | | $ | 61,826,603 | | |
| | | Investments, at value | | $ | 57,876,330 | | |
| | | Cash | | | 2,857,930 | | |
| | | Receivable for: | | | | | |
| | | Fund shares sold | | | 18,416 | | |
| | | Interest | | | 880,349 | | |
| | | Expense reimbursement due from investment advisor | | | 5,959 | | |
| | | Trustees' deferred compensation plan | | | 17,686 | | |
| | | Other assets | | | 152 | | |
| | | Total Assets | | | 61,656,822 | | |
| Liabilities | | Payable for: | | | | | |
| | | Fund shares repurchased | | | 207,590 | | |
| | | Distributions | | | 87,622 | | |
| | | Investment advisory fee | | | 26,535 | | |
| | | Transfer agent fee | | | 11,300 | | |
| | | Pricing and bookkeeping fees | | | 5,286 | | |
| | | Trustees' fees | | | 122 | | |
| | | Audit fee | | | 34,300 | | |
| | | Custody fee | | | 938 | | |
| | | Distribution and service fees | | | 22,452 | | |
| | | Chief compliance officer expenses | | | 52 | | |
| | | Trustees' deferred compensation plan | | | 17,686 | | |
| | | Other liabilities | | | 20,093 | | |
| | | Total Liabilities | | | 433,976 | | |
| | | Net Assets | | | 61,222,846 | | |
| Net Assets Consist of | | Paid-in capital | | | 64,091,180 | | |
| | | Undistributed net investment income | | | 753,793 | | |
| | | Accumulated net realized gain | | | 328,146 | | |
| | | Net unrealized depreciation on investments | | | (3,950,273 | ) | |
| | | Net Assets | | | 61,222,846 | | |
| Class A | | Net assets | | $ | 42,819,428 | | |
| | | Shares outstanding | | | 6,539,682 | | |
| | | Net asset value per share | | $ | 6.55 | (a) | |
| | | Maximum sales charge | | | 4.75 | % | |
| | | Maximum offering price per share ($6.55/0.9525) | | $ | 6.88 | (b) | |
| Class B | | Net assets | | $ | 10,083,967 | | |
| | | Shares outstanding | | | 1,540,070 | | |
| | | Net asset value and offering price per share | | $ | 6.55 | (a) | |
| Class C | | Net assets | | $ | 8,319,451 | | |
| | | Shares outstanding | | | 1,270,591 | | |
| | | Net asset value and offering price per share | | $ | 6.55 | (a) | |
(a) Redemption price per share is equal to net asset value less any applicable contingent deferred sales charge.
(b) On sales of $50,000 or more the offering price is reduced.
See Accompanying Notes to Financial Statements.
11
Statement of Operations – Columbia New York Tax-Exempt Fund
For the Year Ended October 31, 2008
| | | | | ($) | |
| Investment Income | | Interest | | | 3,676,355 | | |
| | | Dividends | | | 13,647 | | |
| | | Total Investment Income | | | 3,690,002 | | |
| Expenses | | Investment advisory fee | | | 359,613 | | |
| | | Distribution fee: | | | | | |
| | | Class B | | | 99,265 | | |
| | | Class C | | | 71,872 | | |
| | | Service fee: | | | | | |
| | | Class A | | | 118,042 | | |
| | | Class B | | | 31,790 | | |
| | | Class C | | | 23,053 | | |
| | | Transfer agent fee | | | 31,437 | | |
| | | Pricing and bookkeeping fees | | | 57,014 | | |
| | | Trustees' fees | | | 16,421 | | |
| | | Custody fee | | | 7,418 | | |
| | | Chief compliance officer expenses | | | 619 | | |
| | | Other expenses | | | 130,514 | | |
| | | Total Expenses | | | 947,058 | | |
| | | Fees waived or expenses reimbursed by investment advisor | | | (169,561 | ) | |
| | | Fees waived by distributor—Class C | | | (28,793 | ) | |
| | | Expense reductions | | | (1,940 | ) | |
| | | Net Expenses | | | 746,764 | | |
| | | Net Investment Income | | | 2,943,238 | | |
| Net Realized and Unrealized | | Net realized gain (loss) on: | | | | | |
| Gain (Loss) on Investments and | | Investments | | | 878,415 | | |
| Futures Contracts | | Futures contracts | | | (5,516 | ) | |
| | | Net realized gain | | | 872,899 | | |
| | | Net change in unrealized appreciation (depreciation) on: | | | | | |
| | | Investments | | | (9,443,419 | ) | |
| | | Futures contracts | | | 32,706 | | |
| | | Net change in unrealized appreciation (depreciation) | | | (9,410,713 | ) | |
| | | Net Loss | | | (8,537,814 | ) | |
| | | Net Decrease Resulting from Operations | | | (5,594,576 | ) | |
See Accompanying Notes to Financial Statements.
12
Statement of Changes in Net Assets – Columbia New York Tax-Exempt Fund
| | | | | Year Ended October, 31 | |
| Increase (Decrease) in Net Assets | | | | 2008 ($) | | 2007 ($) | |
| Operations | | Net investment income | | | 2,943,238 | | | | 3,260,992 | | |
| | | Net realized gain on investments and futures contracts | | | 872,899 | | | | 858,461 | | |
| | | Net change in unrealized appreciation (depreciation)
on investments and futures contracts | | | (9,410,713 | ) | | | (3,098,578 | ) | |
| | | Net Increase (Decrease) Resulting from Operations | | | (5,594,576 | ) | | | 1,020,875 | | |
| Distributions to Shareholders | | From net investment income: | | | | | | | | | |
| | | Class A | | | (2,036,977 | ) | | | (2,175,017 | ) | |
| | | Class B | | | (448,956 | ) | | | (644,834 | ) | |
| | | Class C | | | (354,557 | ) | | | (349,044 | ) | |
| | | From net realized gains: | | | | | | | | | |
| | | Class A | | | (503,414 | ) | | | (176,684 | ) | |
| | | Class B | | | (156,300 | ) | | | (69,863 | ) | |
| | | Class C | | | (97,587 | ) | | | (29,654 | ) | |
| | | Total Distributions to Shareholders | | | (3,597,791 | ) | | | (3,445,096 | ) | |
| | | Net Capital Share Transactions | | | (5,256,998 | ) | | | (10,197,471 | ) | |
| | | Total Decrease in Net Assets | | | (14,449,365 | ) | | | (12,621,692 | ) | |
| Net Assets | | Beginning of period | | | 75,672,211 | | | | 88,293,903 | | |
| | | End of period | | | 61,222,846 | | | | 75,672,211 | | |
| | | Undistributed net investment income, at end of period | | | 753,793 | | | | 665,779 | | |
See Accompanying Notes to Financial Statements.
13
Statement of Changes in Net Assets (continued) – Capital Stock Activity
| | | Year Ended October 31, | |
| | | 2008 | | 2007 | |
| | | Shares | | Dollars ($) | | Shares | | Dollars ($) | |
| Class A | |
| Subscriptions | | | 1,146,528 | | | | 8,338,652 | | | | 1,166,791 | | | | 8,848,362 | | |
| Distributions reinvested | | | 226,091 | | | | 1,630,788 | | | | 184,427 | | | | 1,394,070 | | |
| Redemptions | | | (1,476,999 | ) | | | (10,519,253 | ) | | | (1,989,353 | ) | | | (14,997,279 | ) | |
| Net Decrease | | | (104,380 | ) | | | (549,813 | ) | | | (638,135 | ) | | | (4,754,847 | ) | |
| Class B | |
| Subscriptions | | | 60,627 | | | | 438,310 | | | | 55,702 | | | | 421,686 | | |
| Distributions reinvested | | | 55,749 | | | | 403,425 | | | | 61,502 | | | | 465,244 | | |
| Redemptions | | | (738,672 | ) | | | (5,354,041 | ) | | | (914,801 | ) | | | (6,878,604 | ) | |
| Net Decrease | | | (622,296 | ) | | | (4,512,306 | ) | | | (797,597 | ) | | | (5,991,674 | ) | |
| Class C | |
| Subscriptions | | | 237,969 | | | | 1,733,849 | | | | 316,643 | | | | 2,412,806 | | |
| Distributions reinvested | | | 34,549 | | | | 249,308 | | | | 29,905 | | | | 225,961 | | |
| Redemptions | | | (301,262 | ) | | | (2,178,036 | ) | | | (276,450 | ) | | | (2,089,717 | ) | |
| Net Increase (Decrease) | | | (28,744 | ) | | | (194,879 | ) | | | 70,098 | | | | 549,050 | | |
See Accompanying Notes to Financial Statements.
14
Financial Highlights – Columbia New York Tax-Exempt Fund
Selected data for a share outstanding throughout each period is as follows:
| | | Year Ended October 31, | |
| Class A Shares | | 2008 | | 2007 | | 2006 | | 2005 | | 2004 | |
| Net Asset Value, Beginning of Period | | $ | 7.49 | | | $ | 7.70 | | | $ | 7.61 | | | $ | 7.84 | | | $ | 7.72 | | |
| Income from Investment Operations: | |
| Net investment income (a) | | | 0.31 | | | | 0.31 | | | | 0.32 | | | | 0.31 | | | | 0.31 | | |
Net realized and unrealized gain (loss) on
investments and futures contracts | | | (0.87 | ) | | | (0.19 | ) | | | 0.15 | | | | (0.22 | ) | | | 0.16 | | |
| Total from Investment Operations | | | (0.56 | ) | | | 0.12 | | | | 0.47 | | | | 0.09 | | | | 0.47 | | |
| Less Distributions to Shareholders: | |
| From net investment income | | | (0.30 | ) | | | (0.31 | ) | | | (0.31 | ) | | | (0.30 | ) | | | (0.31 | ) | |
| From net realized gains | | | (0.08 | ) | | | (0.02 | ) | | | (0.07 | ) | | | (0.02 | ) | | | (0.04 | ) | |
| Total Distributions to Shareholders | | | (0.38 | ) | | | (0.33 | ) | | | (0.38 | ) | | | (0.32 | ) | | | (0.35 | ) | |
| Net Asset Value, End of Period | | $ | 6.55 | | | $ | 7.49 | | | $ | 7.70 | | | $ | 7.61 | | | $ | 7.84 | | |
| Total return (b)(c) | | | (7.86 | )% | | | 1.59 | % | | | 6.31 | % | | | 1.19 | % | | | 6.26 | % | |
| Ratios to Average Net Assets/Supplemental Data: | |
| Net expenses (d) | | | 0.84 | % | | | 0.84 | % | | | 0.84 | % | | | 0.84 | % | | | 0.83 | % | |
| Waiver/Reimbursement | | | 0.24 | % | | | 0.21 | % | | | 0.21 | % | | | 0.14 | % | | | 0.13 | % | |
| Net investment income (d) | | | 4.29 | % | | | 4.15 | % | | | 4.16 | % | | | 4.00 | % | | | 4.04 | % | |
| Portfolio turnover rate | | | 17 | % | | | 15 | % | | | 9 | % | | | 7 | % | | | 8 | % | |
| Net assets, end of period (000's) | | $ | 42,819 | | | $ | 49,751 | | | $ | 56,050 | | | $ | 58,004 | | | $ | 65,280 | | |
(a) Per share data was calculated using the average shares outstanding during the period.
(b) Total return at net asset value assuming all distributions reinvested and no initial sales charge or contingent deferred sales charge.
(c) Had the investment advisor and/or any of its affiliates not waived fees or reimbursed a portion of expenses, total return would have been reduced.
(d) The benefits derived from expense reductions had an impact of less than 0.01%.
See Accompanying Notes to Financial Statements.
15
Financial Highlights – Columbia New York Tax-Exempt Fund
Selected data for a share outstanding throughout each period is as follows:
| | | Year Ended October 31, | |
| Class B Shares | | 2008 | | 2007 | | 2006 | | 2005 | | 2004 | |
| Net Asset Value, Beginning of Period | | $ | 7.49 | | | $ | 7.70 | | | $ | 7.61 | | | $ | 7.84 | | | $ | 7.72 | | |
| Income from Investment Operations: | |
| Net investment income (a) | | | 0.26 | | | | 0.26 | | | | 0.26 | | | | 0.25 | | | | 0.25 | | |
Net realized and unrealized gain (loss) on
investments and futures contracts | | | (0.88 | ) | | | (0.20 | ) | | | 0.15 | | | | (0.21 | ) | | | 0.16 | | |
| Total from Investment Operations | | | (0.62 | ) | | | 0.06 | | | | 0.41 | | | | 0.04 | | | | 0.41 | | |
| Less Distributions to Shareholders: | |
| From net investment income | | | (0.24 | ) | | | (0.25 | ) | | | (0.25 | ) | | | (0.25 | ) | | | (0.25 | ) | |
| From net realized gains | | | (0.08 | ) | | | (0.02 | ) | | | (0.07 | ) | | | (0.02 | ) | | | (0.04 | ) | |
| Total Distributions to Shareholders | | | (0.32 | ) | | | (0.27 | ) | | | (0.32 | ) | | | (0.27 | ) | | | (0.29 | ) | |
| Net Asset Value, End of Period | | $ | 6.55 | | | $ | 7.49 | | | $ | 7.70 | | | $ | 7.61 | | | $ | 7.84 | | |
| Total return (b)(c) | | | (8.54 | )% | | | 0.83 | % | | | 5.52 | % | | | 0.44 | % | | | 5.47 | % | |
| Ratios to Average Net Assets/Supplemental Data: | |
| Net expenses (d) | | | 1.59 | % | | | 1.59 | % | | | 1.59 | % | | | 1.59 | % | | | 1.58 | % | |
| Waiver/Reimbursement | | | 0.24 | % | | | 0.21 | % | | | 0.21 | % | | | 0.14 | % | | | 0.13 | % | |
| Net investment income (d) | | | 3.54 | % | | | 3.40 | % | | | 3.41 | % | | | 3.25 | % | | | 3.29 | % | |
| Portfolio turnover rate | | | 17 | % | | | 15 | % | | | 9 | % | | | 7 | % | | | 8 | % | |
| Net assets, end of period (000's) | | $ | 10,084 | | | $ | 16,192 | | | $ | 22,782 | | | $ | 28,278 | | | $ | 34,877 | | |
(a) Per share data was calculated using the average shares outstanding during the period.
(b) Total return at net asset value assuming all distributions reinvested and no contingent deferred sales charge.
(c) Had the investment advisor and/or any of its affiliates not waived fees or reimbursed a portion of expenses, total return would have been reduced.
(d) The benefits derived from expense reductions had an impact of less than 0.01%.
See Accompanying Notes to Financial Statements.
16
Financial Highlights – Columbia New York Tax-Exempt Fund
Selected data for a share outstanding throughout each period is as follows:
| | | Year Ended October 31, | |
| Class C Shares | | 2008 | | 2007 | | 2006 | | 2005 | | 2004 | |
| Net Asset Value, Beginning of Period | | $ | 7.49 | | | $ | 7.70 | | | $ | 7.61 | | | $ | 7.84 | | | $ | 7.72 | | |
| Income from Investment Operations: | |
| Net investment income (a) | | | 0.28 | | | | 0.28 | | | | 0.28 | | | | 0.28 | | | | 0.28 | | |
Net realized and unrealized gain (loss) on
investments and futures contracts | | | (0.87 | ) | | | (0.19 | ) | | | 0.15 | | | | (0.22 | ) | | | 0.16 | | |
| Total from Investment Operations | | | (0.59 | ) | | | 0.09 | | | | 0.43 | | | | 0.06 | | | | 0.44 | | |
| Less Distributions to Shareholders: | |
| From net investment income | | | (0.27 | ) | | | (0.28 | ) | | | (0.27 | ) | | | (0.27 | ) | | | (0.28 | ) | |
| From net realized gains | | | (0.08 | ) | | | (0.02 | ) | | | (0.07 | ) | | | (0.02 | ) | | | (0.04 | ) | |
| Total Distributions to Shareholders | | | (0.35 | ) | | | (0.30 | ) | | | (0.34 | ) | | | (0.29 | ) | | | (0.32 | ) | |
| Net Asset Value, End of Period | | $ | 6.55 | | | $ | 7.49 | | | $ | 7.70 | | | $ | 7.61 | | | $ | 7.84 | | |
| Total return (b)(c) | | | (8.27 | )% | | | 1.14 | % | | | 5.84 | % | | | 0.74 | % | | | 5.78 | % | |
| Ratios to Average Net Assets/Supplemental Data: | |
| Net expenses (d) | | | 1.29 | % | | | 1.29 | % | | | 1.29 | % | | | 1.29 | % | | | 1.28 | % | |
| Waiver/Reimbursement | | | 0.54 | % | | | 0.51 | % | | | 0.51 | % | | | 0.44 | % | | | 0.43 | % | |
| Net investment income (d) | | | 3.84 | % | | | 3.69 | % | | | 3.71 | % | | | 3.55 | % | | | 3.59 | % | |
| Portfolio turnover rate | | | 17 | % | | | 15 | % | | | 9 | % | | | 7 | % | | | 8 | % | |
| Net assets, end of period (000's) | | $ | 8,319 | | | $ | 9,729 | | | $ | 9,461 | | | $ | 9,974 | | | $ | 9,774 | | |
(a) Per share data was calculated using the average shares outstanding during the period.
(b) Total return at net asset value assuming all distributions reinvested and no contingent deferred sales charge.
(c) Had the investment advisor and/or any of its affiliates not waived fees or reimbursed a portion of expenses, total return would have been reduced.
(d) The benefits derived from expense reductions had an impact of less than 0.01%.
See Accompanying Notes to Financial Statements.
17
Notes to Financial Statements – Columbia New York Tax-Exempt Fund
October 31, 2008
Note 1. Organization
Columbia New York Tax-Exempt Fund (the "Fund"), a series of Columbia Funds Series Trust I (the "Trust"), is a non-diversified portfolio. The Trust is a Massachusetts business trust registered under the Investment Company Act of 1940, as amended (the "1940 Act"), as an open-end management investment company.
Investment Objective
The Fund seeks total return, consisting of current income exempt from federal income tax and New York individual income tax and of capital appreciation, consistent with moderate fluctuation of principal.
Fund Shares
The Trust may issue an unlimited number of shares, and the Fund offers three classes of shares: Class A, Class B and Class C. Each share class has its own expense structure and sales charges, as applicable.
Class A shares are subject to a maximum front-end sales charge of 4.75% based on the amount of initial investment. Class A shares purchased without an initial sales charge in accounts aggregating $1 million to $50 million at the time of purchase are subject to a 1.00% contingent deferred sales charge ("CDSC") if the shares are sold within one year after purchase. Class B shares are subject to a maximum CDSC of 5.00% based upon the holding period after purchase. Class B shares will convert to Class A shares eight years after purchase. Class C shares are subject to a 1.00% CDSC on shares sold within one year after purchase.
Note 2. Significant Accounting Policies
The preparation of financial statements in accordance with accounting principles generally accepted in the United States of America ("GAAP") requires management to make certain estimates and assumptions that affect the reported amounts of assets and liabilities, the disclosure of contingent assets and liabilities at the date of the financial statements and the reported amounts of revenue and expenses during the reporting period. Actual results could differ from those estimates. The following is a summary of significant accounting policies consistently followed by the Fund in the preparation of its financial statements.
Security Valuation
Debt securities generally are valued by pricing services approved by the Trust's Board of Trustees, based upon market transactions for normal, institutional-size trading units of similar securities. The services may use various pricing techniques which take into account appropriate factors such as yield, quality, coupon rate, maturity, type of issue, trading characteristics and other data, as well as broker quotes. Debt securities for which quotations are readily available are valued at an over-the-counter or exchange bid quotation.
Certain debt securities, which tend to be more thinly traded and of lesser quality, are priced based on fundamental analysis of the financial condition of the issuer and the estimated value of any collateral. Valuations developed through pricing techniques may vary from the actual amounts realized upon sale of the securities, and the potential variation may be greater for those securities valued using fundamental analysis.
Short-term debt obligations maturing within 60 days are valued at amortized cost, which approximates market value.
Investments in other open-end investment companies are valued at net asset value.
Futures contracts are valued at the settlement price established each day by the board of trade or exchange on which they are traded.
Investments for which market quotations are not readily available, or that have quotations which management believes are not reliable, are valued at fair value as determined in good faith under consistently applied procedures established by and under the general supervision of the Board of Trustees. If a security is valued at fair value, such value is likely to be different from the last quoted market price for the security.
In September 2006, Statement of Financial Accounting Standards No. 157, Fair Value Measurements ("SFAS 157"), was issued. SFAS 157 is effective for fiscal years beginning after November 15, 2007. SFAS 157 defines fair value, establishes a framework for measuring fair value and expands disclosures about fair value measurements. Management is evaluating the impact the application of SFAS 157 will have on the Fund's financial statement disclosures.
18
Columbia New York Tax-Exempt Fund, October 31, 2008
Security Transactions
Security transactions are accounted for on the trade date. Cost is determined and gains (losses) are based upon the specific identification method for both financial statement and federal income tax purposes.
In March 2008, Statement of Financial Accounting Standards No. 161, Disclosures about Derivative Instruments and Hedging Activities-an amendment of FASB Statement No. 133 ("SFAS 161"), was issued. SFAS 161 is effective for fiscal years and interim periods beginning after November 15, 2008. SFAS 161 requires additional discussion about the reporting entity's derivative instruments and hedging activities, by providing for qualitative disclosures about the objectives and strategies for using derivatives, quantitative data about the fair value of and gains and losses on derivative contracts, and details of credit-risk-related contingent features in their hedged positions. Management is evaluating the impact the application of SFAS 161 will have on the Fund's financial statement disclo sures.
Futures Contracts
The Fund may invest in futures for both hedging and non-hedging purposes, including, for example, to seek to enhance returns or as a substitute for a position in an underlying asset.
The use of futures contracts involves certain risks, which include: (1) imperfect correlation between the price movement of the instruments and the underlying securities, (2) inability to close out positions due to differing trading hours, or the temporary absence of a liquid market, for either the instruments or the underlying securities, or (3) an inaccurate prediction of the future direction of interest rates by Columbia Management Advisors, LLC ("Columbia"), the Fund's investment advisor. Any of these risks may involve amounts exceeding the variation margin recorded in the Fund's Statement of Assets and Liabilities at any given time.
Upon entering into a futures contract, the Fund pledges cash or securities with the broker in an amount sufficient to meet the initial margin requirement. Subsequent payments are made or received by the Fund equal to the daily change in the contract value and are recorded as variation margin receivable or payable and offset in unrealized gains or losses. The Fund recognizes a realized gain or loss when the contract is closed or expires.
Income Recognition
Interest income is recorded on the accrual basis. Premium and discount are amortized and accreted, respectively, on all debt securities, unless otherwise noted. Original issue discount is accreted to interest income over the life of the security with a corresponding increase in the cost basis. Dividend income is recorded on the ex-date.
Expenses
General expenses of the Trust are allocated to the Fund and the other series of the Trust based upon relative net assets or other expense allocation methodologies determined by the nature of the expense. Expenses directly attributable to the Fund are charged to the Fund.
Determination of Class Net Asset Value
All income, expenses (other than class-specific expenses, as shown on the Statement of Operations) and realized and unrealized gains (losses) are allocated to each class of the Fund on a daily basis for purposes of determining the net asset value of each class. Income and expenses are allocated to each class based on the settled shares method, while realized and unrealized gains (losses) are allocated based on the relative net assets of each class.
Federal Income Tax Status
The Fund intends to qualify each year as a "regulated investment company" under Subchapter M of the Internal Revenue Code, as amended, and will distribute substantially all of its tax exempt or taxable income, if any, for its tax year, and as such will not be subject to federal income taxes. In addition, the Fund intends to distribute in each calendar year substantially all of its net investment income, capital gains and certain other amounts, if any, such that the Fund should not be subject to federal excise tax. Therefore, no federal income or excise tax provision is recorded.
Distributions to Shareholders
Distributions from net investment income are declared daily and distributed monthly. Net realized capital gains, if any, are distributed at least annually. Income distributions and capital gain distributions are determined in accordance with federal income tax regulations which may differ from GAAP.
19
Columbia New York Tax-Exempt Fund, October 31, 2008
Indemnification
In the normal course of business, the Fund enters into contracts that contain a variety of representations and warranties and which provide general indemnities. The Fund's maximum exposure under these arrangements is unknown because this would involve future claims against the Fund. Also, under the Trust's organizational documents and by contract, the Trustees and officers of the Trust are indemnified against certain liabilities that may arise out of actions relating to their duties to the Trust. However, based on experience, the Fund expects the risk of loss due to these representations, warranties and indemnities to be minimal.
Note 3. Federal Tax Information
The timing and character of income and capital gain distributions are determined in accordance with income tax regulations, which may differ from GAAP. Reclassifications are made to the Fund's capital accounts for permanent tax differences to reflect income and gains available for distribution (or available capital loss carryforwards) under income tax regulations.
For the year ended October 31, 2008, permanent book and tax basis differences resulting primarily from differing treatments for discount accretion/premium amortization on debt securities were identified and reclassified among the components of the Fund's net assets as follows:
Undistributed
Net Investment
Income | | Accumulated
Net Realized
Gain | | Paid-In Capital | |
| $ | (14,734 | ) | | $ | 14,733 | | | $ | 1 | | |
Net investment income and net realized gains (losses), as disclosed on the Statement of Operations, and net assets were not affected by this reclassification.
The tax character of distributions paid during the years ended October 31, 2008 and October 31, 2007 was as follows:
| | | October 31, | |
| | | 2008 | | 2007 | |
| Tax-Exempt Income | | $ | 2,840,490 | | | $ | 3,168,895 | | |
| Ordinary Income* | | | — | | | | 38,296 | | |
| Long-Term Capital Gains | | | 757,301 | | | | 237,905 | | |
* For tax purposes short-term capital gain distributions, if any, are considered ordinary income distributions.
As of October 31, 2008, the components of distributable earnings on a tax basis were as follows:
Undistributed
Tax-Exempt
Income | | Undistributed
Long-Term
Capital Gains | | Net Unrealized
Depreciation* | |
| $ | 130,305 | | | $ | 766,645 | | | $ | (3,216,011 | ) | |
* The differences between book-basis and tax-basis net unrealized depreciation are primarily due to discount accretion/premium amortization on debt securities.
Unrealized appreciation and depreciation at October 31, 2008, based on cost of investments for federal income tax purposes, were:
| Unrealized appreciation | | $ | 3,008,502 | | |
| Unrealized depreciation | | | (6,224,513 | ) | |
| Net unrealized depreciation | | $ | (3,216,011 | ) | |
The Fund adopted Financial Accounting Standards Board ("FASB") Interpretation No. 48, Accounting for Uncertainty in Income Taxes—an Interpretation of FASB Statement No. 109 ("FIN 48"), effective April 30, 2008. FIN 48 requires management to determine whether a tax position of the Fund is more likely than not to be sustained upon examination by the applicable taxing authority, including resolution of any related appeals or litigation processes, based on the technical merits of the position. The tax benefit to be recognized is measured as the largest amount of benefit that is greater than fifty percent likely of being realized upon ultimate settlement. FIN 48 was applied to all existing tax positions upon initial adoption. Management has evaluated the known implications of FIN 48 on its computation of net assets for the Fund. As a
20
Columbia New York Tax-Exempt Fund, October 31, 2008
result of this evaluation, management has concluded that FIN 48 did not have any effect on the Fund's financial statements and no cumulative effect adjustments were recorded. However, management's conclusions regarding FIN 48 may be subject to review and adjustment at a later date based on factors including, but not limited to, further implementation guidance from the FASB, new tax laws, regulations, and administrative interpretations (including relevant court decisions). The Fund's federal tax returns for the prior three fiscal years remain subject to examination by the Internal Revenue Service. The Fund is not aware of any tax positions for which it is reasonably possible that the total amounts of unrecognized tax benefits will significantly change in the next twelve months.
Note 4. Fees and Compensation Paid to Affiliates
Investment Advisory Fee
Columbia, an indirect, wholly owned subsidiary of Bank of America Corporation ("BOA"), provides investment advisory, administrative and other services to the Fund. Columbia receives a monthly investment advisory fee based on the Fund's pro-rata portion of the combined average daily net assets of the Fund, Columbia California Tax-Exempt Fund, Columbia Connecticut Tax-Exempt Fund and Columbia Massachusetts Tax-Exempt Fund as follows:
| Combined Average Daily Net Assets | | Annual Fee Rate | |
| First $1 billion | | | 0.50 | % | |
| $1 billion to $3 billion | | | 0.45 | % | |
| Over $3 billion | | | 0.40 | % | |
For the year ended October 31, 2008, the Fund's effective investment advisory fee rate was 0.50% of the Fund's average daily net assets.
Pricing and Bookkeeping Fees
The Fund has entered into a Financial Reporting Services Agreement (the "Financial Reporting Services Agreement") with State Street Bank & Trust Company ("State Street") and Columbia pursuant to which State Street provides financial reporting services to the Fund. The Fund has also entered into an Accounting Services Agreement (collectively with the Financial Reporting Services Agreement, the "State Street Agreements") with State Street and Columbia pursuant to which State Street provides accounting services to the Fund. Under the State Street Agreements, the Fund pays State Street an annual fee of $38,000 paid monthly plus an additional monthly fee based on an annualized percentage rate of average daily net assets of the Fund for the month. The aggregate fee will not exceed $140,000 per year (exclusive of out-of-pocket expenses and charges). The Fund also reimburses State Street for certain out-of-pocket expenses and charge s.
The Fund has entered into a Pricing and Bookkeeping Oversight and Services Agreement (the "Services Agreement") with Columbia. Under the Services Agreement, Columbia provides services related to Fund expenses and the requirements of the Sarbanes-Oxley Act of 2002, and provides oversight of the accounting and financial reporting services provided by State Street. Under the Services Agreement, the Fund reimburses Columbia for out-of-pocket expenses. Prior to January 1, 2008, the Fund also reimbursed Columbia for accounting oversight services, services related to Fund expenses and the requirements of the Sarbanes-Oxley Act of 2002.
For the year ended October 31, 2008, the amount charged to the Fund by affiliates included on the Statement of Operations under "Pricing and bookkeeping fees" aggregated to $1,952.
Transfer Agent Fee
Columbia Management Services, Inc. (the "Transfer Agent"), an affiliate of Columbia and an indirect, wholly owned subsidiary of BOA, provides shareholder services to the Fund and has contracted with Boston Financial Data Services ("BFDS") to serve as sub-transfer agent. The Transfer Agent is entitled to receive a fee for its services, paid monthly, at the annual rate of $17.34 per open account plus reimbursement of certain sub-transfer agent fees paid by the Transfer Agent (exclusive of BFDS fees), calculated based on assets held in omnibus accounts and intended to recover the cost of payments to other parties (including affiliates of BOA) for services to those accounts. The Transfer Agent pays the fees of BFDS for services as sub-transfer agent and is not entitled to reimbursement for such fees from the Fund. The Transfer Agent may also retain, as additional compensation for its services, fees for wire, telephone and redemption orders, IRA trustee agent fees and account transcript fees due to the Transfer Agent from shareholders of the Fund and credits (net
21
Columbia New York Tax-Exempt Fund, October 31, 2008
of bank charges) earned with respect to balances in accounts the Transfer Agent maintains in connection with its services to the Fund. The Transfer Agent also receives reimbursement for certain out-of-pocket expenses.
An annual minimum account balance fee of $20 may apply to certain accounts with a value below the Fund's initial minimum investment requirements to reduce the impact of small accounts on transfer agent fees. These minimum account balance fees are recorded as part of expense reductions on the Statement of Operations. For the year ended October 31, 2008, these minimum account balance fees reduced total expenses by $340.
Underwriting Discounts, Service and Distribution Fees
Columbia Management Distributors, Inc. (the "Distributor"), an affiliate of Columbia and an indirect, wholly owned subsidiary of BOA, is the principal underwriter of the Fund's shares. For the year ended October 31, 2008, the Distributor has retained net underwriting discounts of $4,631 on sales of the Fund's Class A shares and received net CDSC fees of $16,938, $18,972 and $321 on Class A, Class B and Class C share redemptions, respectively.
The Fund has adopted distribution and shareholder servicing plans (the "Plans") pursuant to Rule 12b-1 under the 1940 Act, which require the payment of distribution and service fees. The fees are intended to compensate the Distributor and/or eligible selling and/or servicing agents for selling shares of the Fund and providing services to investors. The service fee is equal to 0.10% annually of the net assets attributable to shares of the Fund issued prior to December 1, 1994 and 0.25% annually of the net assets attributable to shares issued thereafter. This arrangement results in an annual rate of service fee for all shares that is a blend between the 0.10% and 0.25% rates. For the year ended October 31, 2008, the Fund's effective service fee rate was 0.24% of the Fund's average daily net assets attributable to Class A, Class B and Class C shares.
The Plans also require the payment of a monthly distribution fee to the Distributor equal to 0.75% annually of the average daily net assets attributable to Class B and Class C shares only. The Distributor has voluntarily agreed to waive a portion of the Class C shares distribution fee so that it will not exceed 0.45% annually of the average daily net assets attributable to Class C shares. This arrangement may be modified or terminated by the Distributor at any time.
Fee Waivers and Expense Reimbursements
Columbia and/or some of the Fund's other service providers have voluntarily agreed to waive fees and/or reimburse the Fund for certain expenses so that total expenses (exclusive of distribution and service fees, brokerage commissions, interest, taxes and extraordinary expenses, but inclusive of custodial charges relating to overdrafts, if any), after giving effect to any balance credits from the Fund's custodian, will not exceed 0.60% annually of the Fund's average daily net assets. Columbia, at its discretion, may modify or terminate this arrangement any time.
Fees Paid to Officers and Trustees
All officers of the Fund are employees of Columbia or its affiliates and, with the exception of the Fund's Chief Compliance Officer, receive no compensation from the Fund. The Board of Trustees has appointed a Chief Compliance Officer to the Fund in accordance with federal securities regulations. The Fund, along with other affiliated funds, pays its pro-rata share of the expenses associated with the Chief Compliance Officer. The Fund's expenses for the Chief Compliance Officer will not exceed $15,000 per year.
The Trust's eligible Trustees may participate in a deferred compensation plan which may be terminated at any time. Obligations of the plan will be paid solely out of the Fund's assets.
Note 5. Custody Credits
The Fund has an agreement with its custodian bank under which custody fees may be reduced by balance credits. These credits are recorded as part of expense reductions on the Statement of Operations. The Fund could have invested a portion of the assets utilized in connection with the expense offset arrangement in an income-producing asset if it had not entered into such an agreement.
For the year ended October 31, 2008, these custody credits reduced total expenses by $1,600 for the Fund.
22
Columbia New York Tax-Exempt Fund, October 31, 2008
Note 6. Portfolio Information
For the year ended October 31, 2008, the cost of purchases and proceeds from sales of securities, excluding short-term obligations, were $11,986,365 and $19,860,046, respectively.
Note 7. Line of Credit
The Fund and other affiliated funds participate in a $280,000,000 committed, unsecured revolving line of credit. The maximum amount that may be borrowed by any fund is limited to the lesser of $200,000,000 and the Fund's borrowing limit set forth in the Fund's registration statement. Borrowings are available for short-term liquidity or temporary or emergency purposes.
Interest is charged to each participating fund based on the fund's borrowings at a rate per annum equal to the greater of the Federal Funds Rate plus 0.50% and the overnight LIBOR Rate plus 0.50%. In addition, an annual operations agency fee of $20,000, an amendment fee of 0.02% and a commitment fee of 0.12% per annum are accrued and apportioned among the participating funds pro rata based on their relative net assets.
Prior to October 16, 2008, the Fund and other affiliated funds participated in a $350,000,000 committed, unsecured revolving line of credit and a $150,000,000 uncommitted, unsecured line of credit, both provided by State Street. Interest on the committed line of credit was charged to each participating fund based on the fund's borrowings at a rate per annum equal to the Federal Funds Rate plus 0.50%. In addition, a commitment fee of 0.10% per annum was accrued and apportioned among the participating funds pro rata based on their relative net assets. Interest on the uncommitted line of credit was charged to each participating fund based on the fund's borrowings at a rate per annum equal to the Federal Funds Rate plus 0.375%. State Street charged an annual operations agency fee of $40,000 for the committed line of credit and was able to charge an annual administration fee of $15,000 for the uncommitted line of credit. The commitme nt fee, the operations agency fee and the administration fee were accrued and apportioned among the participating funds pro rata based on their relative net assets.
For the year ended October 31, 2008, the Fund did not borrow under these arrangements.
Note 8. Shares of Beneficial Interest
As of October 31, 2008, two shareholders collectively held 27.8% of the Fund's shares outstanding over which BOA and/or any of its affiliates did not have investment discretion.
Subscription and redemption activity of these accounts may have a significant effect on the operations of the Fund.
Note 9. Significant Risks and Contingencies
Concentration of Credit Risk
The Fund holds investments that are insured by private insurers who guarantee the payment of principal and interest in the event of default or that are supported by a letter of credit. At October 31, 2008, private insurers who insured greater than 5% of the net assets of the Fund were as follows:
| Insurer | | % of Total Net Assets | |
| MBIA Insurance Corp. | | | 12.5 | | |
| AMBAC Assurance Corp. | | | 5.5 | | |
At November 24, 2008, MBIA Insurance Corp. and AMBAC Assurance Corp. were rated by Standard & Poor's AA and A, respectively.
Geographic Concentration
The Fund had greater than 5% of its total net assets at October 31, 2008 invested in debt obligations issued by the state of New York and its political subdivisions, agencies and public authorities. The Fund is more susceptible to economic and political factors adversely affecting issuers of the state's or territory's municipal securities than are municipal bond funds that are not concentrated to the same extent in these issuers.
Non-Diversified Risk
The Fund is a non-diversified Fund, which generally means that it may invest a greater percentage of its total assets in the securities of fewer issuers than a "diversified" fund. This increases the risk that a change in the value of any one investment held by the Fund could affect the overall value of the Fund more than it would affect that of a diversified fund holding a greater number of investments. Accordingly, the Fund's value will likely be more volatile than the value of more
23
Columbia New York Tax-Exempt Fund, October 31, 2008
diversified funds. The Fund may not operate as a non-diversified fund at all times.
Sector Focus Risk
The Fund may focus its investments in certain sectors, subjecting it to greater risk than a fund that is less focused.
Tax Development Risk
The Fund purchases municipal securities whose interest, in the opinion of bond counsel, is free from federal income tax. There is no assurance that the Internal Revenue Service (IRS) will agree with this opinion. In the event the IRS determines that an issuer does not comply with relevant tax requirements, interest payments from a security could become federally taxable, possibly retroactively to the date the security was issued. As a shareholder of the Fund, you may be required to file an amended tax return as a result.
Legal Proceedings
On February 9, 2005, Columbia Management Advisors, Inc. (which has since merged into Banc of America Capital Management, LLC (now named Columbia Management Advisors, LLC)) ("Columbia") and Columbia Funds Distributor, Inc. (which has been renamed Columbia Management Distributors, Inc.) (the "Distributor") (collectively, the "Columbia Group") entered into an Assurance of Discontinuance with the New York Attorney General ("NYAG") (the "NYAG Settlement") and consented to the entry of a cease-and-desist order by the Securities and Exchange Commission ("SEC") (the "SEC Order") on matters relating to mutual fund trading.
Under the terms of the SEC Order, the Columbia Group agreed, among other things, to: pay $70 million in disgorgement and $70 million in civil money penalties; cease and desist from violations of the antifraud provisions and certain other provisions of the federal securities laws; maintain certain compliance and ethics oversight structures; retain an independent consultant to review the Columbia Group's applicable supervisory, compliance, control and other policies and procedures; and retain an independent distribution consultant (see below). The Columbia Funds have also voluntarily undertaken to implement certain governance measures designed to maintain the independence of their boards of trustees. The NYAG Settlement also, among other things, requires Columbia and its affiliates to reduce management fees for certain Columbia Funds (including the former Nations Funds) and other mutual funds collectively by $32 million per year f or five years, for a projected total of $160million in management fee reductions.
Pursuant to the procedures set forth in the SEC Order, the $140 million in settlement amounts described above is being distributed in accordance with a distribution plan that was developed by an independent distribution consultant and approved by the SEC on April 6, 2007. Distributions under the distribution plan began in late June 2007.
A copy of the SEC Order is available on the SEC website at http://www.sec.gov. A copy of the NYAG Settlement is available as part of the Bank of America Corporation Form 8-K filing on February 10, 2005.
In connection with the events described above, various parties have filed suit against certain funds, the Trustees of the Columbia Funds, FleetBoston Financial Corporation and its affiliated entities and/or Bank of America and its affiliated entities.
On February 20, 2004, the Judicial Panel on Multidistrict Litigation transferred these cases and cases against other mutual fund companies based on similar allegations to the United States District Court in Maryland for consolidated or coordinated pretrial proceedings (the "MDL"). Subsequently, additional related cases were transferred to the MDL. On September 29, 2004, the plaintiffs in the MDL filed amended and consolidated complaints. One of these amended complaints is a putative class action that includes claims under the federal securities laws and state common law, and that names Columbia, the Distributor, the Trustees of the Columbia Funds, Bank of America Corporation and others as defendants. Another of the amended complaints is a derivative action purportedly on behalf of the Columbia Funds that asserts claims under federal securities laws and state common law.
On February 25, 2005, Columbia and other defendants filed motions to dismiss the claims in the pending cases. On March 1, 2006, for reasons stated in the court's memoranda dated November 3, 2005, the U.S. District Court for the District of Maryland granted in part and denied in part the defendants' motions to dismiss. The court dismissed all of the class action claims pending against the Columbia Funds Trusts. As to
24
Columbia New York Tax-Exempt Fund, October 31, 2008
Columbia and the Distributor, the claims under the Securities Act of 1933, the claims under Sections 34(b) and 36(a) of the Investment Company Act of 1940 ("ICA") and the state law claims were dismissed. The claims under Sections 10(b) and 20(a) of the Securities Exchange Act of 1934 and claims under Section 36(b) of the ICA were not dismissed.
On March 21, 2005, a purported class action was filed in Massachusetts state court alleging that certain conduct, including market timing, entitled Class B shareholders in certain Columbia funds to an exemption from contingent deferred sales charges upon early redemption ("the CDSC Lawsuit"). The CDSC Lawsuit was removed to federal court in Massachusetts and transferred to the MDL.
On September 14, 2007, the plaintiffs and the Columbia defendants named in the MDL, including the Columbia Funds, entered into a stipulation of settlement with respect to all Columbia-related claims in the MDL described above, including the CDSC Lawsuit. The settlement is subject to court approval.
In 2004, the Columbia Funds' adviser and distributor and certain affiliated entities and individuals were named as defendants in certain purported shareholder class and derivative actions making claims, including claims under the Investment Company and the Investment Advisers Acts of 1940 and state law. Certain Columbia Funds were named as nominal defendants. The suits allege, inter alia, that the fees and expenses paid by the funds are excessive and that the advisers and their affiliates inappropriately used fund assets to distribute the funds and for other improper purposes. On March 2, 2005, the actions were consolidated in the Massachusetts federal court as In re Columbia Entities Litigation. The plaintiffs filed a consolidated amended complaint on June 9, 2005. On November 30, 2005, the judge dismissed all claims by plaintiffs and entered final judgment in favor of the defendants. The plaintiffs appealed to the United States Court of Appeals for the First Circuit on December 30, 2005. A stipulation and settlement agreement dated January 19, 2007 was filed in the First Circuit on February 14, 2007, with a joint stipulation of dismissal and motion for remand to obtain district court approval of the settlement. That joint motion was granted and the appeal was dismissed. On March 6, 2007, the case was remanded to the District Court. The settlement, approved by the District Court on September 18, 2007, became effective October 19, 2007. Pursuant to the settlement, the funds' adviser and/or its affiliates made certain payments, including plaintiffs' attorneys' fees and costs of notice to class members.
25
Report of Independent Registered Public Accounting Firm
To the Trustees of Columbia Funds Series Trust I and the Shareholders of Columbia New York Tax-Exempt Fund:
In our opinion, the accompanying statement of assets and liabilities, including the investment portfolio, and the related statements of operations and of changes in net assets and the financial highlights present fairly, in all material respects, the financial position of Columbia New York Tax-Exempt Fund (the "Fund") (a series of Columbia Funds Series Trust I) at October 31, 2008, the results of its operations for the year then ended, the changes in its net assets for each of the two years in the period then ended and the financial highlights for each of the five years in the period then ended, in conformity with accounting principles generally accepted in the United States of America. These financial statements and financial highlights (hereafter referred to as "financial statements") are the responsibility of the Fund's management. Our responsibility is to express an opinion on these financial statements based on our audits. We conducted our audits of these financial statements in accordance with the standards of the Public Company Accounting Oversight Board (United States). Those standards require that we plan and perform the audit to obtain reasonable assurance about whether the financial statements are free of material misstatement. An audit includes examining, on a test basis, evidence supporting the amounts and disclosures in the financial statements, assessing the accounting principles used and significant estimates made by management, and evaluating the overall financial statement presentation. We believe that our audits, which included confirmation of securities at October 31, 2008 by correspondence with the custodian and brokers, provide a reasonable basis for our opinion.
PricewaterhouseCoopers LLP
Boston, Massachusetts
December 22, 2008
26
Federal Income Tax Information (Unaudited)
For the fiscal year ended October 31, 2008, the Fund designates long-term capital gains of $847,496.
100.00% of the distributions from net investment income will be treated as exempt income for federal income tax purposes.
27
Fund Governance
The Trustees serve terms of indefinite duration. The names, addresses and ages of the Trustees and officers of the Funds in Columbia Funds Series Trust I, the year each was first elected or appointed to office, their principal business occupations during at least the last five years, the number of Funds overseen by each Trustee and other directorships they hold are shown below. Each officer listed below serves as an officer of each Fund in the Columbia Funds Complex.
Independent Trustees
Name, Address and Year of Birth,
Position with Funds, Year First
Elected or Appointed to Office | | Principal Occupation(s) During Past Five Years, Number of Funds in Columbia
Funds Complex Overseen by Trustee, Other Directorships Held
| |
| John D. Collins (Born 1938) | |
|
c/o Columbia Management Advisors, LLC
One Financial Center
Boston, MA 02111
Trustee(1) (since 2007) | | Retired. Consultant, KPMG, LLP (accounting and tax firm) from July 1999 to June 2000; Partner, KPMG, LLP from March 1962 to June 1999. Oversees 80, Mrs. Fields Famous Brands LLC (consumer products); Suburban Propane Partners, L.P.; and Montpelier Re (underwriting firm) | |
|
| Rodman L. Drake (Born 1943) | |
|
c/o Columbia Management Advisors, LLC
One Financial Center
Boston, MA 02111
Trustee(1) (since 2007) | | Co-Founder of Baringo Capital LLC (private equity) since 2002; President, Continuation Investments Group, Inc. from 1997 to 2001. Oversees 80, Jackson Hewitt Tax Service Inc. (tax preparation services); Crystal Capital River Inc. (real estate investment trust); Student Loan Corporation (student loan provider); Celgene Corporation (global biotechnology company); Apex Silver Mines Ltd. (mining); and Hyperion Brookfield Total Return Fund, Inc. and Hyperion Brookfield Strategic Mortgage Income Fund, Inc. (exchange-traded funds) | |
|
| Douglas A. Hacker (Born 1955) | |
|
c/o Columbia Management Advisors, LLC
One Financial Center
Boston, MA 02111
Trustee (since 1996) | | Independent business executive since May 2006; Executive Vice President—Strategy of United Airlines (airline) from December 2002 to May 2006; President of UAL Loyalty Services (airline marketing company) from September 2001 to December 2002; Executive Vice President and Chief Financial Officer of United Airlines from July 1999 to September 2001. Oversees 80, Nash Finch Company (food distributor); Aircastle Limited (aircraft leasing) | |
|
| Janet Langford Kelly (Born 1957) | |
|
c/o Columbia Management Advisors, LLC
One Financial Center
Boston, MA 02111
Trustee (since 1996) | | Senior Vice President, General Counsel and Corporate Secretary, ConocoPhillips (integrated energy company) since September 2007; Deputy General Counsel—Corporate Legal Services, ConocoPhillips from August 2006 to August 2007; Partner, Zelle, Hofmann, Voelbel, Mason & Gette LLP (law firm) from March 2005 to July 2006; Adjunct Professor of Law, Northwestern University, from September 2004 to June 2006; Director, UAL Corporation (airline) from February 2006 to July 2006; Chief Administrative Officer and Senior Vice President, Kmart Holding Corporation (consumer goods), from September 2003 to March 2004; Executive Vice President—Corporate Development a nd Administration, General Counsel and Secretary, Kellogg Company (food manufacturer), from September 1999 to August 2003. Oversees 80, None | |
|
28
Fund Governance (continued)
Independent Trustees (continued)
Name, Address and Year of Birth,
Position with Funds, Year First
Elected or Appointed to Office | | Principal Occupation(s) During Past Five Years, Number of Funds in Columbia
Funds Complex Overseen by Trustee, Other Directorships Held
| |
| Charles R. Nelson (Born 1942) | |
|
c/o Columbia Management Advisors, LLC
One Financial Center
Boston, MA 02111
Trustee (since 1981) | | Professor of Economics, University of Washington, since January 1976; Ford and Louisa Van Voorhis Professor of Political Economy, University of Washington, since September 1993; Director, Institute for Economic Research, University of Washington from September 2001 to June 2003; Adjunct Professor of Statistics, University of Washington, since September 1980; Associate Editor, Journal of Money Credit and Banking, since September 1993; Consultant on econometric and statistical matters. Oversees 80, None | |
|
| John J. Neuhauser (Born 1943) | |
|
c/o Columbia Management Advisors, LLC
One Financial Center
Boston, MA 02111
Trustee (since 1985) | | President, Saint Michael's College, since August 2007; University Professor, Boston College from November 2005 to August 2007; Academic Vice President and Dean of Faculties, Boston College from August 1999 to October 2005. Oversees 80, Liberty All-Star Equity Fund and Liberty All-Star Growth Fund, Inc. (closed-end funds) | |
|
| Jonathan Piel (Born 1938) | |
|
c/o Columbia Management Advisors, LLC
One Financial Center
Boston, MA 02111
Trustee(1) (since 2007) | | Cable television producer and website designer; The Editor, Scientific American from 1984 to 1994; Vice President, Scientific American, Inc., from 1984 to 1994; Member, Advisory Board, Stone Age Institute, Bloomington, Indiana (research institute that explores the effect of technology on human evolution); Member, Board of Directors of the National Institute of Social Sciences, New York City; and Member, Board of Trustees of the William Alanson White Institute, New York City (institution for training psychoanalysts). Oversees 80, None | |
|
| Patrick J. Simpson (Born 1944) | |
|
c/o Columbia Management Advisors, LLC
One Financial Center
Boston, MA 02111
Trustee (since 2000) | | Partner, Perkins Coie LLP (law firm). Oversees 80, None | |
|
| Thomas C. Theobald (Born 1937) | |
|
c/o Columbia Management Advisors, LLC
One Financial Center
Boston, MA 02111
Trustee and
Chairman of the Board (since 1996) | | Partner and Senior Advisor, Chicago Growth Partners (private equity investing) since September 2004; Managing Director, William Blair Capital Partners (private equity investing) from September 1994 to September 2004. Oversees 80, Anixter International (network support equipment distributor); Ventas, Inc. (real estate investment trust); Jones Lang LaSalle (real estate management services); Ambac Financial Group (financial guaranty insurance) | |
|
| Anne-Lee Verville (Born 1945) | |
|
c/o Columbia Management Advisors, LLC
One Financial Center
Boston, MA 02111
Trustee (since 1998) | | Retired since 1997 (formerly General Manager—Global Education Industry (from 1994 to 1997), President—Application Systems Division (from 1991 to 1994), Chief Financial Officer—US Marketing & Services (from 1988 to 1991), and Chief Information Officer (from 1987 to 1988), IBM Corporation (computer and technology)). Oversees 80, None | |
|
29
Fund Governance (continued)
Interested Trustee
Name, Address and Year of Birth,
Position with Funds, Year First
Elected or Appointed to Office | | Principal Occupation(s) During Past Five Years, Number of Funds in Columbia
Funds Complex Overseen by Trustee, Other Directorships Held
| |
| William E. Mayer (Born 1940) | |
|
c/o Columbia Management Advisors, LLC
One Financial Center
Boston, MA 02111
Trustee(2) (since 1994) | | Partner, Park Avenue Equity Partners (private equity) since February 1999; Dean and Professor, College of Business, University of Maryland from 1992 to 1997. Oversees 80, Lee Enterprises (print media), WR Hambrecht + Co. (financial service provider); BlackRock Kelso Capital Corporation (investment company) | |
|
1 Messrs. Drake, Piel and Collins have served as directors/trustees of the Excelsior Funds since 1996, 1996 and 2005, respectively. The Excelsior Funds consisted of 27 portfolios managed by affiliates of Columbia Management Advisors, LLC. Effective December 12, 2007, the Board elected Messrs. Drake, Piel and Collins as Trustees of the Trust.
2 Mr. Mayer is an "interested person" (as defined in the Investment Company Act of 1940) by reason of his affiliation with WR Hambrecht + Co., a registered broker/dealer that may execute portfolio transactions for or engage in principal transactions with the Funds or other funds or accounts advised/managed by the Advisor or other Bank of America affiliates.
The Statement of Additional Information includes additional information about the Trustees of the Funds and is available, without charge, upon request by calling 1-800-345-6611.
Officers
Name, Address and Year of Birth,
Position with Columbia Funds,
Year First Elected or
Appointed to Office | | Principal Occupation(s) During Past Five Years
| |
| Christopher L. Wilson (Born 1957) | |
|
One Financial Center
Boston, MA 02111
President (since 2004) | | President—Columbia Funds, since October 2004; Managing Director—Columbia Management Advisors, LLC, since September 2005; Senior Vice President—Columbia Management Distributors, Inc., since January 2005; Director—Columbia Management Services, Inc., since January 2005; Director—Bank of America Global Liquidity Funds, plc and Banc of America Capital Management (Ireland), Limited, since May 2005; Director—FIM Funding, Inc., since January 2005; President and Chief Executive Officer—CDC IXIS AM Services, Inc. (investment management), from September 1998 through August 2004; and a senior officer or director of various other Bank of America affiliated entities, including other registered and unregistered funds. | |
|
| James R. Bordewick, Jr. (Born 1959) | |
|
One Financial Center
Boston, MA 02111
Senior Vice President, Secretary and
Chief Legal Officer (since 2006) | | Associate General Counsel, Bank of America since April 2005; Senior Vice President and Associate General Counsel, MFS Investment Management (investment management) prior to April 2005. | |
|
30
Fund Governance (continued)
Officers (continued)
Name, Address and Year of Birth,
Position with Columbia Funds,
Year First Elected or
Appointed to Office | | Principal Occupation(s) During Past Five Years
| |
| J. Kevin Connaughton (Born 1964) | |
|
One Financial Center
Boston, MA 02111
Senior Vice President and
Chief Financial Officer (since 2000) | | Managing Director of Columbia Management Advisors, LLC since December 2004; Treasurer—Columbia Funds, from October 2003 to May 2008; Treasurer—the Liberty Funds, Stein Roe Funds and Liberty All-Star Funds, December 2000—December 2006; Senior Vice President—Columbia Management Advisors, LLC, from April 2003 to December 2004; President—Columbia Funds, Liberty Funds and Stein Roe Funds, February 2004 to October 2004; Treasurer—Galaxy Funds, September 2002 to December 2005; Treasurer, December 2002 to December 2004, and President, February 2004 to December 2004—Columbia Management Multi-Strategy Hedge Fund, LLC; and a senior officer of various other Bank of America-affiliated entities, including other registered and unregistered funds. | |
|
| Linda J. Wondrack (Born 1964) | |
|
One Financial Center
Boston, MA 02111
Senior Vice President and
Chief Compliance Officer (since 2007) | | Director (Columbia Management Group LLC and Investment Product Group Compliance), Bank of America since June 2005; Director of Corporate Compliance and Conflicts Officer, MFS Investment Management (investment management), August 2004 to May 2005; Managing Director, Deutsche Asset Management (investment management) prior to August 2004. | |
|
| Michael G. Clarke (Born 1969) | |
|
One Financial Center
Boston, MA 02111
Treasurer (since 2008) | | Director of Fund Administration of the Advisor since January 2006; Managing Director of the Advisor September 2004 to December 2005; Vice President Fund Administration June 2002 to September 2004. | |
|
| Jeffrey R. Coleman (Born 1969) | |
|
One Financial Center
Boston, MA 02111
Deputy Treasurer (since 2006) | | Director of Fund Administration of the Advisor since January 2006; Fund Controller of the Advisor from October 2004 to January 2006; Vice President of CDC IXIS Asset Management Services, Inc. (investment management) from August 2000 to September 2004. | |
|
| Joseph F. DiMaria (Born 1968) | |
|
One Financial Center
Boston, MA 02111
Chief Accounting Officer (since 2008) | | Director of Fund Administration of the Advisor since January 2006; Head of Tax/Compliance and Assistant Treasurer of the Advisor from November 2004 to December 2005; Director of Trustee Administration (Sarbanes-Oxley) of the Advisor from May 2003 to October 2004. | |
|
| Julian Quero (Born 1967) | |
|
One Financial Center
Boston, MA 02111
Deputy Treasurer (since 2008) | | Senior Tax Manager of the Advisor since August 2006; Senior Compliance Manager of the Advisor from April 2002 to August 2006. | |
|
| Barry S. Vallan (Born 1969) | |
|
One Financial Center
Boston, MA 02111
Controller (since 2006) | | Vice President—Fund Treasury of the Advisor since October 2004; Vice President—Trustee Reporting of the Advisor from April 2002 to October 2004 | |
|
31
Board Consideration and Approval of Advisory Agreements
The Advisory Fees and Expenses Committee of the Board of Trustees meets several times annually to review the advisory agreements (collectively, the "Agreements") of the funds for which the Trustees serve as trustees (each a "fund") and to determine whether to recommend that the full Board approve the continuation of the Agreements for an additional one-year period. After the Committee has made its recommendation, the full Board, including the Independent Trustees, determines whether to approve the continuation of the Agreements. In addition, the full Board, including the Independent Trustees, considers matters bearing on the Agreements at most of its other meetings throughout the year and meets regularly with senior management of the funds and Columbia, the funds' investment adviser, including the senior manager of each investment area within Columbia. Through the Board's Investment Oversight Committees, Trustees also meet with selected fund portfolio managers, research analysts and traders at various times throughout the year.
The Trustees receive and review all materials that they, their legal counsel or Columbia believe to be reasonably necessary for the Trustees to evaluate the Agreements and to determine whether to approve the continuation of the Agreements. Those materials generally include, among other items, (i) information on the investment performance of each fund relative to the performance of peer groups of mutual funds and the fund's performance benchmarks, and additional information assessing performance on a risk-adjusted basis, (ii) information on each fund's advisory fees and other expenses, including information comparing the fund's expenses to those of peer groups of mutual funds and information about any applicable expense caps and fee "breakpoints," (iii) information about the profitability of the Agreements to Columbia, including potential "fall-out" or ancillary benefits that Columbia and its affiliates may receive as a result of their relationships with the funds and (iv) information obtained through Columbia's response to a questionnaire prepared at the request of the Trustees by counsel to the funds and independent legal counsel to the Independent Trustees. The Trustees also consider other information such as (v) Columbia's financial results and financial condition, (vi) each fund's investment objective and strategies and the size, education and experience of Columbia's investment staffs and their use of technology, external research and trading cost measurement tools, (vii) the allocation of the funds' brokerage and the use of "soft" commission dollars to pay for research products and services, (viii) Columbia's resources devoted to, and its record of compliance with, the funds' investment policies and restrictions, policies on personal securities transactions and other compliance policies and legal and regulatory requirements, (ix) Columbia's response to va rious legal and regulatory proceedings since 2003 and to the recent period of volatility in the securities markets and (x) the economic outlook generally and for the mutual fund industry in particular. In addition, the Advisory Fees and Expenses Committee confers with the funds' independent fee consultant and reviews materials relating to the funds' relationships with Columbia provided by the independent fee consultant. Throughout the process, the Trustees have the opportunity to ask questions of and to request additional materials from Columbia and to consult with the independent fee consultant and independent legal counsel to the Independent Trustees.
The Board of Trustees most recently approved the continuation of the Agreements at its October, 2008 meeting, following meetings of the Advisory Fees and Expenses Committee held in February, April, August, September and October, 2008. In considering whether to approve the continuation of the Agreements, the Trustees, including the Independent Trustees, did not identify any single factor as determinative, and each weighed various factors as he or she deemed appropriate. The Trustees considered the following matters in connection with their approval of the continuation of the Agreements:
The nature, extent and quality of the services provided to the funds under the Agreements. The Trustees considered the nature, extent and quality of the services provided by Columbia and its affiliates to the funds and the resources dedicated to the funds by Columbia and its affiliates. Among other things, the Trustees considered (i) Columbia's ability (including its personnel and other resources, compensation programs for personnel involved in fund management, reputation and other attributes) to attract, motivate and retain highly qualified research, advisory and supervisory investment professionals; (ii) the portfolio management services provided by those investment professionals; and (iii) the trade execution services provided on behalf of the funds. For each fund, the Trustees also considered the benefits to shareholders of investing in a mutual f und that is part of a family of funds offering exposure to a variety of asset classes
32
and investment disciplines and providing a variety of fund and shareholder services. After reviewing those and related factors, the Trustees concluded, within the context of their overall conclusions regarding each of the Agreements, that the nature, extent and quality of services provided supported the continuation of the Agreements.
Investment performance of the funds and Columbia. The Trustees reviewed information about the performance of each fund over various time periods, including information prepared by an independent third-party data provider that compared the performance of each fund to the performance of peer groups of mutual funds and performance benchmarks. The Trustees also reviewed a description of the third party's methodology for identifying each fund's peer group for purposes of performance and expense comparisons. The Trustees also considered additional information that the Advisory Fees and Expenses Committee requested from Columbia relating to funds that presented relatively weaker performance and/or relatively higher expenses. In the case of each fund whose performance lagged that of a relevant peer group for certain (although not necessarily all) periods, the Trustees concluded that other factors relevant to performance were sufficient, in light of other considerations, to warrant continuation of the fund's Agreements. Those factors varied from fund to fund, but included one or more of the following: (i) that the fund's performance, although lagging in certain recent periods, was stronger over the longer term; (ii) that the underperformance was attributable, to a significant extent, to investment decisions that were reasonable and consistent with the fund's investment strategy and policies and that the fund was performing within a reasonable range of expectations, given those investment decisions, market conditions and the fund's investment strategy; (iii) that the fund's performance was competitive when compared to other relevant performance benchmarks or peer groups; (iv) that Columbia had taken or was taking steps designed to help improve the fund's investment performance, including, but not limited to, replacing portfolio managers or modifying investment str ategies; and (v) that Columbia proposed to waive advisory fees or cap the expenses of the fund.
The Trustees noted that, through April 30, 2008, Columbia New York Tax-Exempt Fund's performance was in the fourth quintile (where the best performance would be in the first quintile) for the one-year period, in the third quintile for the three-year period, in the second quintile for the five-year period and in the first quintile for the ten-year period, of the peer group selected by an independent third-party data provider for purposes of performance comparisons.
The Trustees also considered Columbia's performance and reputation generally, the funds' performance as a fund family generally, and Columbia's historical responsiveness to Trustee concerns about performance and Columbia's willingness to take steps intended to improve performance. After reviewing those and related factors, the Trustees concluded, within the context of their overall conclusions regarding each of the Agreements, that the performance of each fund and Columbia was sufficient, in light of other considerations, to warrant the continuation of the Agreement(s) pertaining to that fund.
The costs of the services provided and profits realized by Columbia and its affiliates from their relationships with the funds. The Trustees considered the fees charged to the funds for advisory services as well as the total expense levels of the funds. That information included comparisons (provided by management and by an independent third-party data provider) of each fund's advisory fees and total expense levels to those of the fund's peer groups and information about the advisory fees charged by Columbia to comparable institutional accounts. In considering the fees charged to those accounts, the Trustees took into account, among other things, management's representations about the differences between managing mutual funds as compared to other types of accounts, including differences in the services provided, differences in the risk profile of such business for Columbia, and the additional resources required to manage mutual funds effectively. In evaluating each fund's advisory fees, the Trustees also took into account the demands, complexity and quality of the investment management of the fund. The Trustees considered existing advisory fee breakpoints, and Columbia's use of advisory fee waivers and expense caps, which benefited a number of the funds. The Trustees also noted management's stated justification for the fees charged to the funds, which included information about the investment performance of the funds and the services provided to the funds.
The Trustees considered that Columbia New York Tax-Exempt Fund's total expenses were in the third quintile and actual management fees were in the first quintile (where the lowest fees and expenses would be in the first quintile) of the peer group selected by an independent third-party data provider for purposes of expense comparisons.
33
The Trustees also considered the compensation directly or indirectly received by Columbia and its affiliates from their relationships with the funds. The Trustees reviewed information provided by management as to the profitability to Columbia and its affiliates of their relationships with each fund, and information about the allocation of expenses used to calculate profitability. When reviewing profitability, the Trustees also considered court cases in which adviser profitability was an issue in whole or in part, the performance of the relevant funds, the expense level of each fund, and whether Columbia had implemented breakpoints and/or expense caps with respect to the fund.
After reviewing those and related factors, the Trustees concluded, within the context of their overall conclusions regarding each of the Agreements, that the advisory fees charged to each fund, and the related profitability to Columbia and its affiliates of their relationships with the fund, supported the continuation of the Agreement(s) pertaining to that fund.
Economies of Scale. The Trustees considered the existence of any economies of scale in the provision by Columbia of services to each fund, to groups of related funds, and to Columbia's investment advisory clients as a whole and whether those economies were shared with the funds through breakpoints in the investment advisory fees or other means, such as fee waivers/expense reductions and additional investments by Columbia in investment, trading and compliance resources. The Trustees noted that many of the funds benefited from breakpoints, fee waivers/expense caps, or both. In considering those issues, the Trustees also took note of the costs of the services provided (both on an absolute and a relative basis) and the profitability to Columbia and its affiliates of their relationships with the funds, as discussed above.
After reviewing those and related factors, the Trustees concluded, within the context of their overall conclusions regarding each of the Agreements, that the extent to which economies of scale were shared with the funds supported the continuation of the Agreements.
Other Factors. The Trustees also considered other factors, which included but were not limited to the following:
n the extent to which each fund had operated in accordance with its investment objective and investment restrictions, the nature and scope of the compliance programs of the funds and Columbia and the compliance-related resources that Columbia and its affiliates were providing to the funds;
n the nature, quality, cost and extent of administrative and shareholder services overseen and performed by Columbia and its affiliates, both under the Agreements and under separate agreements for the provision of transfer agency and administrative services;
n so-called "fall-out benefits" to Columbia and its affiliates, such as the engagement of its affiliates to provide distribution, brokerage and transfer agency services to the funds, and the benefits of research made available to Columbia by reason of brokerage commissions generated by the funds' securities transactions, as well as possible conflicts of interest associated with those fall-out and other benefits, and the reporting, disclosure and other processes in place to disclose and monitor those possible conflicts of interest; and
n the report provided by the funds' independent fee consultant, which included information about and analysis of the funds' fees, expenses and performance.
Based on their evaluation of all factors that they deemed to be material, including those factors described above, and assisted by the advice of independent counsel and the independent fee consultant, the Trustees, including the Independent Trustees, approved the continuance of each of the Agreements through October 31, 2009.
34
Summary of Management Fee Evaluation by
Independent Fee Consultant
EXCERPTS FROM REPORT OF INDEPENDENT FEE CONSULTANT TO THE FUNDS SUPERVISED BY THE COLUMBIA ATLANTIC BOARD
Prepared Pursuant to the February 9, 2005
Assurance of Discontinuance among the
Office of Attorney General of New York State,
Columbia Management Advisors, LLC, and
Columbia Management Distributors, Inc.
November 3, 2008
I. Overview
On February 9, 2005, Columbia Management Advisors, LLC ("CMA") and Columbia Management Distributors, Inc.1 ("CMD") agreed to the New York Attorney General's Assurance of Discontinuance ("AOD"). Among other things, the AOD stipulates that CMA may manage or advise a Columbia Fund ("Columbia Fund" and, together with some or all of such funds, the "Columbia Funds") only if the Independent Members of the Columbia Fund's Board of Trustees appoint a Senior Officer or retain an Independent Fee Consultant ("IFC") who is to manage the process by which proposed management fees are negotiated. The AOD further stipulates that the Senior Officer or IFC is to prepare a written annual evaluation of the fee negotiation process.
With effect from January 1, 2007, the Independent Members of the Board of Trustees for certain Columbia Funds known collectively as the "Atlantic Funds" (together with the other members of that Board, the "Trustees") retained me as IFC for the Atlantic Funds.2 In this capacity, I have prepared the fourth annual written evaluation of the fee negotiation process. As was the case with last year's report (the "2007 Report") my immediate predecessor as IFC, John Rea, provided invaluable assistance in the preparation of this year's report.
A. Role of the Independent Fee Consultant
The AOD charges the IFC with "managing the process by which proposed management fees...to be charged the Columbia Fund are negotiated so that they are negotiated in a manner which is at arms' length and reasonable and consistent with this Assurance of Discontinuance." The AOD also provides that CMA "may manage or advise a Columbia Fund only if the reasonableness of the proposed management fees is determined by the Board of Trustees...using...an annual independent written evaluation prepared by or under the direction of...the Independent Fee Consultant." Therefore, the AOD makes clear that the IFC does not supplant the Trustees in negotiating management fees with CMA, nor does the IFC substitute his or her judgment for that of the Trustees with respect to the reasonableness of proposed fees or any other matter that is committed to the business judgment of the Trustees.
B. Elements Involved in Managing the Fee Negotiation Process
In preparing the report required by the AOD, the IFC must consider at least the following six factors set forth in the AOD:
1. The nature and quality of CMA's services, including the Fund's performance;
2. Management fees (including any components thereof) charged by other mutual fund companies for like services;
3. Possible economies of scale as the Fund grows larger;
4. Management fees (including any components thereof) charged to institutional and other clients of CMA for like services;
5. Costs to CMA and its affiliates of supplying services pursuant to the management fee agreements, excluding any intra-corporate profit; and
6. Profit margins of CMA and its affiliates from supplying such services.
C. Organization of the Annual Evaluation
This report, like last year's, focuses on the six factors and contains a section for each factor except that CMA's costs and profits from managing the Funds have been combined into a single section. In addition to a discussion of these factors, the report offers recommendations to improve the fee review process in future years. A review of the status of recommendations made in the 2007 Report is being provided separately with the materials for the October meeting.
1 CMA and CMD are subsidiaries of Columbia Management Group, LLC ("CMG"), and are the successors to the entities named in the AOD.
2 I have no material relationship with Bank of America, CMG or any of its affiliates, aside from serving as IFC, and I am aware of no material relationship with any of their affiliates. I retained John Rea, an independent economic consultant, to assist me with this report.
Unless otherwise stated or required by the context, this report covers only the Atlantic Funds, which are also referred as the "Funds."
35
II. Summary of Findings
A. General
1. Based upon my examination of the information supplied by CMG in the light of the six factors set forth in the AOD, I conclude that the Trustees have the relevant information necessary to evaluate the reasonableness of the proposed management fees for each Atlantic Fund.
2. In my view, the process by which the proposed management fees of the Funds have been negotiated in 2008 thus far has been, to the extent practicable, at arms' length and reasonable and consistent with the AOD.
B. Nature and Quality of Services, Including Performance
3. The performance of the Funds has been relatively strong in recent years. Based upon 1-, 3-, 5-, and 10-year returns through April 30, 2008, at least half of all the Funds were in the first and second performance quintiles in each of the four performance periods and, at most, only 11% were in the fifth quintile in any one performance period. Both equity and fixed-income funds posted strong performance relative to comparable funds.
4. Performance rankings were similar in 2007 and 2008, although last year's were slightly stronger. Despite the stability in the distribution of rankings in the two years, at least half the Funds changed quintile rankings between the two years in at least one of the 1-, 3-, and 5-year performance periods.
5. The performance of the actively managed equity Funds against their benchmarks was very strong. At least 57% and as many as 73% posted net returns exceeding their benchmarks over the 1-, 3-, and 5-year periods. In contrast, gross and net returns of fixed-income Funds typically fell short of their benchmarks.
6. Atlantic equity Funds' overall performance adjusted for risk also was strong. Based upon 3-year returns, nearly 80% of the equity Funds had a combination of risk-adjusted and unadjusted returns that placed them in the top half of their performance universes. Only about one-fifth of the fixed income Funds posted high returns and low risk relative to comparable funds. About two-thirds of the fixed-income Funds took on more risk than the typical fund in their performance universes.
7. The industry-standard procedure used by Lipper that includes all share classes in the performance universe tends to bias a Fund's ranking upward within that universe. The bias occurs because either no-12b-1 fee or low-12b-1 fee share classes of the Atlantic Funds are compared with funds in performance universes that include all share classes of multi-class funds with 12b-1 fees of up to 100 basis points. Correcting this bias by limiting the performance universe to classes of comparable funds with low or no 12b-1 fees (a "filtered universe") lowers the relative performance for the Funds, but their performance, on the whole, remains strong. The filtering process, however, did identify two Funds for further review that had not been designated review funds using unfiltered universes.
8. A small number of Funds have consistently underperformed over the past four years. The exact number depends on the criteria used to evaluate longer-term performance. For example, the one-year returns of one Fund have been in the fourth or fifth performance quintiles in each of the past four years; there are six Funds whose three-year returns have been in the fourth or fifth quintile over the past four years.
9. The services performed by CMG professionals beyond portfolio management, such as compliance, legal, information technology, risk management, finance and fund administration, are critical to the success of the Funds and appear to be of high quality.
C. Management Fees Charged by Other Mutual Fund Companies
10. The Funds' management fees and total expenses are generally low relative to those of their peers. Only 21% of the Funds ranked in the two most expensive quintiles for actual management fees, and only 23% in those quintiles for total expenses.
11. The highest concentration of low-expense Funds is found among the equity and tax-exempt fixed income Funds. The 12 former Excelsior Funds have relatively high fees and expenses, with half of those Funds ranking in either the
36
fourth or fifth quintiles. The higher actual management fee rankings of certain Excelsior Funds are due in part to fee schedules that are higher than standard Columbia Fund fee schedules at current asset levels. After discussion with the Trustees, CMA is proposing to lower the management fees on three of these Funds.
12. The distribution of expense rankings is similar in 2007 and 2008, while management fee rankings improved markedly in 2008. Part of the improvement reflects expense limitations introduced last year for the state intermediate municipal bond Funds.
13. The management fees of the Atlantic Funds are generally in line with those of Columbia Funds supervised by the Nations Board of Trustees (the "Nations Funds"). In investment categories in which the Atlantic Funds have higher average fees, the difference principally arises out of differences in asset size.
D. Trustees' Fee and Performance Evaluation Process
14. The Trustees' evaluation process identified 17 Funds in 2008 for further review based upon their relative performance or expenses or both. When compared in filtered universes, two more Funds met the criteria for further review. CMG provided further information about those Funds to assist the Trustees in their evaluation.
E. Potential Economies of Scale
15. CMG presented to the Trustees its analysis of the sources and sharing of potential economies of scale. CMG views economies of scale as arising at the complex level and would regard estimates of scale economies for individual funds as unreliable. In its analysis, CMG did not identify specific sources of economies of scale or provide any estimates of any economies of scale that might arise from future asset growth. CMG's analysis included measures taken by the Trustees and CMG that seek to share any potential economies of scale through breakpoints in management fee schedules, expense reimbursements, fee waivers, enhanced shareholder services, fund mergers, and operational consolidation.
16. An examination of the contractual fee schedules for five Atlantic Funds shows that they are generally in line with those of their competitors, in terms of number and extent of fee breakpoints. A similar examination last year of five different Funds led to the same conclusion.
F. Management Fees Charged to Institutional Clients
17. CMG has provided Trustees with comparisons of mutual fund management fees and institutional fees based upon standardized fee schedules and upon actual fees. The results show that, consistent with industry practice, institutional fees are generally lower than the Funds' management fees. However, because the services provided and risks borne by the manager are more extensive for mutual funds compared to institutional accounts, the differences are of limited value in assisting the Trustees in their review of the reasonableness of the Funds' management fees.
G. Revenues, Expenses, and Profits
18. The activity-based cost allocation methodology ("ABC") employed by CMG to allocate costs, both direct and indirect, for purposes of calculating Fund profitability is thoughtful and detailed. This year, CMG proposed a change to the method by which indirect expenses are allocated. Under this "hybrid" method, indirect costs relating to fund management are allocated among the Funds 50% by assets and 50% per Fund. Allocating indirect expenses equally to each Fund has an intuitive logic, as each Fund regardless of size has certain expenses, such as preparing and printing prospectuses and financial statements.
19. The materials provided on CMG's revenues and expenses with respect to the Funds and the methodology underlying their construction form a sufficient basis for Trustees to evaluate the expenses and profitability of the Funds.
20. In 2007, CMG's complex-wide pre-tax margins on the Atlantic Funds were slightly below industry medians, based on limited data available for publicly held mutual fund managers. However, as is to be expected in a complex now comprising 75 Funds (including former Excelsior
37
Funds), some Atlantic Funds have relatively high pre-tax profit margins, when calculated solely with respect to management revenues and expenses, while other Atlantic Funds operate at a loss. There is a positive relationship between fund size and profitability, with smaller funds generally operating at a loss.
21. CMG pays a fixed percentage of its management fee revenues to an affiliate, U.S. Trust, Bank of America Private Wealth Management, to compensate it for services it performs with respect to Atlantic Fund assets held for the benefit of its customers. Based on our analysis of the services provided by this affiliate, we have concluded that all payments other than those for sub-transfer agent or sub-accounting services should be treated as a distribution expense.
III. Recommendations
1) Criteria for review. The Trustees may wish to consider modifying the criteria for classifying a fund as a "Review Fund" to include criteria that focus exclusively on performance without regard to expense or fee levels. For example, a fund whose one-year or three-year performance was median or below for four consecutive years could be treated as a Review Fund. When we applied such criteria to the Funds, several additional Funds would have been added to the list of Review Funds.
2) Profitability data. CMG should present to the Trustees each year the profitability of each Fund, each investment style and each complex (of which Atlantic is one) calculated as follows:
a. Management-only profitability should be calculated without reference to any Private Bank expense.
b. Profitability excluding distribution (which essentially covers the management and transfer agency functions) should be adjusted by removing from the expense calculation any portion of the Private Bank payment not attributable to the performance by the Private Bank of sub-transfer agency or sub-accounting functions.
c. Total profitability, including distribution: No adjustment for Private Bank expenses should be made, because all such expenses represent legitimate fund expenses to be taken into account in calculating CMG's profit margin including distribution.
d. Distribution only: This should include all Private Bank expenses other than those attributable to sub-transfer agency services.
Therefore, the following data need not be provided:
1. Adjusting total profitability data for Private Bank expenses
2. Adjusting profitability excluding distribution by backing out all Private Bank expenses.
3) Potential economies of scale. CMG and the IFC should continue to work on methods for more precisely quantifying to the extent possible the sources and magnitude of any economies of scale as CMG's mutual fund assets under management increase, to the extent that the data allows for meaningful year-over-year comparisons. The framework suggested in Section IV.D.4 may prove to be a useful model for such an analysis.
4) Competitive breakpoint analysis. As part of the annual fee evaluation process, the breakpoints of a select group of Atlantic Funds (which would differ each year) should continue to be compared to those of industry rivals to ensure that the Funds' breakpoint schedules remain within industry norms. As breakpoint schedules change relatively little each year, performing such a comparison for each Atlantic Fund each year would not be an efficient use of Trustee and CMG resources.
5) Cost allocation methodology. CMG's point that the current ABC system of allocating indirect expenses creates anomalous results in several cases, including sub-advised Funds, is well-taken. We would like to work with CMG over the forthcoming year on alternatives to the current system of allocating indirect expenses that (1) resolve the anomalies, (2) limit the amount of incremental effort on CMG's part and (3) remain faithful to the general principle that expenses should be allocated by time and effort to the extent reasonably possible.
6) Management fee disparities. CMG and the Atlantic Trustees, as part of any future study of management fees, should analyze the differences in management fee schedules, principally arising out of the reorganization of the former Excelsior Funds as Atlantic Funds. As part of that analysis, CMG should provide an explanation for any significant fee differences among comparable funds across
38
fund families managed by CMA, such as differences in the management styles of different Funds included the same Lipper category. Finally, whenever CMG proposes a management fee change or an expense cap for any mutual fund managed by CMA that is comparable to any Atlantic Fund, CMG should provide the Trustees with sufficient information about the proposal to allow the Trustees to assess the applicability of the proposed change to the relevant Atlantic Fund or Funds.
7) Tax-exempt Fund expense data. The expense rankings of certain tax-exempt Funds were adversely affected by including certain investment-related interest expenses that Lipper excluded in calculating the expense ratios of competitors. We recommend that CMG follow the Lipper practice and exclude such interest expenses from data submitted to Lipper to avoid unfairly disadvantaging the tax-exempt Funds.
8) Reduction of volume of paper documents submitted. The effort to rationalize and simplify the data presented to the Trustees and the process by which that data was prepared and organized was regarded as a success by all parties. We should continue to look for opportunities to reduce and simplify the presentation of 15(c) data, especially in the area of Fund profitability. The Fund "Dashboard" volume presents a large volume of Fund data on a single page. If it is continued, the Trustees may wish to consider receiving the underlying Lipper data on CD, rather than the current paper volumes.
* * *
Respectfully submitted,
Steven E. Asher
39
This page intentionally left blank.
Important Information About This Report
The fund mails one shareholder report to each shareholder address. If you would like more than one report, please call shareholder services at 1-800-345-6611 and additional reports will be sent to you. This report has been prepared for shareholders of Columbia New York Tax-Exempt Fund.
A description of the policies and procedures that the fund uses to determine how to vote proxies and a copy of the fund's voting records are available (i) at www.columbiamanagement.com; (ii) on the Securities and Exchange Commission's website at www.sec.gov, and (iii) without charge, upon request, by calling 1-800-368-0346. Information regarding how the fund voted proxies relating to portfolio securities during the 12-month period ended June 30 is available from the SEC's website. Information regarding how the fund voted proxies relating to portfolio securities is also available from the fund's website, www.columbiamanagement.com.
The fund files a complete schedule of portfolio holdings with the SEC for the first and third quarters of each fiscal year on Form N-Q. The fund's Form N-Q is available on the SEC's website at www.sec.gov and may be reviewed and copied at the SEC's Public Reference Room in Washington, DC. Information on the operation of the Public Reference Room may be obtained by calling 1-800-SEC-0330.
An investment in money market mutual funds is not a bank deposit, and is not insured or guaranteed by Bank of America, N.A. or any of its affiliates or by the Federal Deposit Insurance Corporation or any other government agency. Although money market mutual funds seek to preserve the value of your investment at $1.00 per share, it is possible to lose money by investing in money market mutual funds. Please see the prospectuses for a complete discussion of the risks of investing in money market mutual funds.
Please read and consider the investment objectives, risks, charges and expenses for any fund carefully before investing. For a prospectus which contains this and other important information about the fund, contact your Columbia Management representative or financial advisor or go to www.columbiamanagement.com.
Columbia Management Group, LLC ("Columbia Management") is the investment management division of Bank of America Corporation. Columbia Management entities furnish investment management services and products for institutional and individual investors. Columbia Funds are distributed by Columbia Management Distributors, Inc., member of FINRA, SIPC, part of Columbia Management and an affiliate of Bank of America Corporation.
Transfer Agent
Columbia Management Services, Inc.
P.O. Box 8081
Boston, MA 02266-8081
1-800-345-6611
Distributor
Columbia Management
Distributors, Inc.
One Financial Center
Boston, MA 02111
Investment Advisor
Columbia Management Advisors, LLC
100 Federal Street
Boston, MA 02110
41
Columbia Management®
Columbia New York Tax-Exempt Fund
Annual Report, October 31, 2008
PRSRT STD
U.S. Postage
PAID
Holliston, MA
Permit NO. 20
©2008 Columbia Management Distributors, Inc.
One Financial Center, Boston, MA 02111-2621
800-345-6611 www.columbiafunds.com
SHC-42/156909-1008 (12/08) 08/65979
Columbia Management®
Annual Report
October 31, 2008
Columbia Tax-Exempt Bond Funds
g Columbia Connecticut Intermediate
Municipal Bond Fund
g Columbia Intermediate Municipal
Bond Fund
g Columbia Massachusetts Intermediate
Municipal Bond Fund
g Columbia New Jersey Intermediate
Municipal Bond Fund
g Columbia New York Intermediate
Municipal Bond Fund
g Columbia Rhode Island Intermediate
Municipal Bond Fund
| NOT FDIC INSURED | | May Lose Value | |
|
| NOT BANK ISSUED | | No Bank Guarantee | |
|
Table of Contents
| Economic Update | | | 1 | | |
|
Columbia Connecticut Intermediate
Municipal Bond Fund | | | 2 | | |
|
Columbia Intermediate Municipal
Bond Fund | | | 7 | | |
|
Columbia Massachusetts
Intermediate Municipal
Bond Fund | | | 12 | | |
|
Columbia New Jersey Intermediate
Municipal Bond Fund | | | 17 | | |
|
Columbia New York Intermediate
Municipal Bond Fund | | | 22 | | |
|
Columbia Rhode Island
Intermediate Municipal
Bond Fund | | | 27 | | |
|
| Investment Portfolios | | | 32 | | |
|
Statements of Assets and
Liabilities | | | 96 | | |
|
| Statements of Operations | | | 100 | | |
|
Statements of Changes in
Net Assets | | | 102 | | |
|
| Financial Highlights | | | 108 | | |
|
| Notes to Financial Statements | | | 138 | | |
|
| Report of Independent Registered Public Accounting Firm | | | 151 | | |
|
| Federal Income Tax Information | | | 152 | | |
|
| Fund Governance | | | 153 | | |
|
Board Consideration and
Approval of Investment
Advisory Agreements | | | 157 | | |
|
Summary of Management
Fee Evaluation by Independent
Fee Consultant | | | 161 | | |
|
Important Information About
This Report | | | 169 | | |
|
The views expressed in this report reflect the current views of the respective parties. These views are not guarantees of future performance and involve certain risks, uncertainties and assumptions that are difficult to predict, so actual outcomes and results may differ significantly from the views expressed. These views are subject to change at any time based upon economic, market or other conditions and the respective parties disclaim any responsibility to update such views. These views may not be relied on as investment advice and, because investment decisions for a Columbia Fund are based on numerous factors, may not be relied on as an indication of trading intent on behalf of any particular Columbia Fund. References to specific securities should not be construed as a recommendation or investment advice.
President's Message

Dear Shareholder:
We are pleased to provide this shareholder report for your Columbia Fund and hope you will find the portfolio management details, discussions and performance information helpful in monitoring your investments. As we've seen this past year, the financial markets can be quite volatile, with significant short-term price fluctuations. It's important to keep these ups and downs in perspective, particularly in light of your long-term investment strategy.
Staying the course with your long-term strategy typically involves riding out short-term price fluctuations, though we recognize that at times this can be tough. To support your efforts and give you the information you need to make prudent decisions, Columbia Management offers several valuable online resources. We encourage you to visit www.columbiamanagement.com/investor, where you can receive the most up-to-date information, including:
g Daily pricing and performance. View pricing and performance from a link in Fund Tracker on the homepage. This listing of funds is updated nightly with the current net asset value and the amount and percentage change from the prior day.
g News & Commentary. This tab provides links to quarterly fund commentaries and information from our investment strategies group, including trends in the economy and market impact.
If you would like more details on individual funds, select a fund from the dropdown menu on the top right side of the homepage for access to:
g Monthly and quarterly performance information.
g Portfolio holdings. Full holdings are updated monthly for money market funds except for Columbia Cash Reserves, Columbia Government Plus Reserves, Columbia Government Reserves, Columbia Treasury Reserves and Columbia Money Market Reserves which are updated weekly, monthly for equity funds and quarterly for most other funds.
g Quarterly fact sheets. Accessible from the Literature tab in each fund page.
By registering on the site, you'll receive secured, 24-hour access to*:
g Mutual fund account details with balances, dividend and transaction information.
g Fund Tracker to customize your homepage with current net asset values for the funds that interest you.
g On-line transactions including purchases, exchanges and redemptions.
g Account maintenance for updating your address and dividend payment options.
g Electronic delivery of prospectuses and shareholder reports.
I encourage you to visit our website for access to the product information and tools described above. These valuable online resources can help you monitor your investments and provide direct access to your account. All of these tools, and more, can be found on www.columbiamanagement.com/investor.
While your financial advisor is a great resource for investment guidance, you can also access our website or call our service representatives at 800.345.6611 for additional assistance. We thank you for investing with Columbia Management and look forward to helping with your ongoing investment needs.
Sincerely,

Christopher L. Wilson
President, Columbia Funds
*Some restrictions apply. Shareholders who purchase shares through certain third-party organizations may not have the ability to register for online access.
Economic Update – Columbia Tax-Exempt Bond Funds
The pace of economic growth ground to a halt during the 12-month period that began November 1, 2007 and ended October 31, 2008. Although economic growth was modestly positive at the beginning of the period, the economy slipped into recession in 2008, with little near-term relief in sight. A host of factors weighed on consumers and businesses alike.
The most severe housing downturn in decades showed no sign of abating as inventories of homes for sale rose, home prices declined and tighter credit standards, a result of continued turmoil in the subprime mortgage market, made it more difficult for homebuyers to qualify for loans.
The labor market contracted for ten consecutive months, driving the unemployment rate to 6.5%, the highest rate since the early 1990s. Nearly 1.2 million jobs have been lost since the beginning of 2008, with announced layoffs likely to drive that number even higher in the months ahead. Manufacturing activity slowed and consumer spending declined, dimming hopes for the holiday season.
A weakening economy and turmoil in the financial markets took a toll on consumer confidence, which plummeted to the lowest point ever in the 40-year history of the monthly survey. Consumer confidence is surveyed by The Conference Board.
In an effort to inspire confidence in the capital markets, loosen the reins on credit and shore up economic growth, the Federal Reserve Board (the Fed) brought a key short-term rate—the federal funds rate—down from 4.50% to 1.0% during the 12-month period. Despite earlier concerns about inflation, a weak economic outlook has kept the Fed focused on stimulating economic growth through lowering borrowing rates. In fact, the one bright spot during this period of uncertainty has been lower energy and commodity prices. With oil trading near $60 per barrel at the end of the period, gasoline prices are expected to come down below $2 per gallon after peaking above $4 per gallon during the summer months.
Bonds eke out a small, positive return
The U.S. bond market seesawed during the 12-month period but managed to eke out a small gain as investors sought the relative safety of the highest quality sectors. After a weak start, bond prices in several sectors rose and yields declined as economic growth slowed and stock market volatility increased. The benchmark 10-year U.S. Treasury yield ended the period at just under 4.0%, nearly one-half percentage point lower than where it stood one year ago. In this environment, the Barclays Capital U.S. Aggregate Bond Index (formerly the Lehman Brothers U.S. Aggregate Bond Index) returned 0.30%.1 High-yield bonds disappointed as economic prospects weakened and default fears rose. The Merrill Lynch U.S. High Yield, Cash Pay Index returned negative 26.43%.2
Stocks retreat as economic outlook darkens
Against a shifting economic backdrop, the U.S. stock market lost 36.10% for the 12-month period, as measured by the S&P 500 Index.3 Losses extended across all market caps and both growth and value, although value stocks held up somewhat better than growth stocks, as measured by their respective Russell indices.4 Stock markets outside the U.S. suffered even greater losses. The MSCI EAFE Index, a broad gauge of stock market performance in foreign developed markets, lost 46.62% (in U.S. dollars) for the period.5 Emerging stock markets, which have had a strong run over the past several years, were also caught in the downdraft. As investors backed away from risk, emerging markets suffered most of all. The MSCI Emerging Markets Index returned negative 56.22 % (in U.S. dollars).6
Past performance is no guarantee of future results.
1 The Barclays Capital U.S. Aggregate Bond Index (formerly the Lehman Brothers U.S. Aggregate Bond Index) is a market value-weighted index that tracks the daily price, coupon, pay-downs, and total return performance of fixed-rate, publicly placed, dollar-denominated, and non-convertible investment grade debt with at least $250 million par amount outstanding and with at least one year to final maturity.
2 The Merrill Lynch U.S. High Yield, Cash Pay Index tracks the performance of non-investment-grade corporate bonds.
3 The Standard & Poor's (S&P) 500 Index tracks the performance of 500 widely held, large capitalization US stocks.
4 The Russell 1000 Index measures the performance of 1,000 of the largest U.S. companies, based on market capitalization. The Russell Midcap Index measures the performance of the 800 smallest companies in the Russell 1000 Index, as ranked by total market capitalization. The Russell 2000 Index measures the performance of the 2,000 smallest of the 3,000 largest U.S. companies, based on market capitalization.
5 The Morgan Stanley Capital International (MSCI) Europe, Australasia, Far East (EAFE) Index is a free float-adjusted market capitalization index that is designed to measure developed market equity performance, excluding the U.S. and Canada.
6 The Morgan Stanley Capital International (MSCI) Emerging Markets Index is a widely accepted index composed of a sample of companies from 25 countries representing the global emerging stock markets.
Indices are not investments, do not incur fees or expenses and are not professionally managed. It is not possible to invest directly in an index. Securities in the fund may not match those in an index.
Summary
For the 12-month period that ended October 31, 2008
g Despite volatility in many segments of the bond market, the Barclays Capital U.S. Aggregate Bond Index delivered a modest gain. High-yield bonds lost significant ground, as measured by the Merrill Lynch U.S. High Yield, Cash Pay Index.
Barclays
Index | | Merrill
Lynch Index | |
|
 | |  | |
|
g The broad U.S. stock market, as measured by the S&P 500 Index, returned negative 36.10%. Developed stock markets outside the United States returned negative 46.62%, as measured (in U.S. dollars) by the MSCI EAFE Index.
| S&P Index | | MSCI Index | |
|
 | |  | |
|
1
Fund Profile – Columbia Connecticut Intermediate Municipal Bond Fund
Performance data quoted represents past performance and current performance may be lower or higher. Past performance is no guarantee of future results. The investment return and principal value will fluctuate so that shares, when redeemed, may be worth more or less than the original cost. Please visit www.columbiafunds.com for daily and most recent month-end performance updates.
Summary
1-year return as of 10/31/08
| | –1.80% | |
|
 | | Class A shares
(without sales charge) | |
|
| | +0.53% | |
|
 | | Barclays Capital
3-15 Year Blend
Municipal Bond Index | |
|
Morningstar Style Box

The Morningstar Style Box reveals a fund's investment strategy. For fixed-income funds the vertical axis shows the average credit quality of the bonds owned, and the horizontal axis shows interest rate sensitivity as measured by a bond's duration (short, intermediate or long). All of these numbers are drawn from the data most recently provided by the fund and entered into Morningstar's database as of quarter-end. Although the data is gathered from reliable sources, Morningstar cannot guarantee its completeness and accuracy. Information shown is as of 06/30/08.
Summary
g For the 12-month period that ended October 31, 2008, the fund's Class A shares returned negative 1.80% without sales charge. Class Z shares returned negative 1.53%.
g The fund's return trailed both its benchmark, the Barclays Capital 3-15 Year Blend Municipal Bond Index,1 as well as the average return of its peer group, the Lipper Other States Intermediate Municipal Debt Funds Classification.2
g The fund had more exposure to longer-term bonds than its benchmark and, we believe, the average fund in its peer group, which hurt performance.
Portfolio Management
Brian McGreevy has managed the fund or its predecessors since September 2002 and has been associated with the advisor or its predecessors or affiliate organizations since 1994.
1The Barclays Capital 3-15 Year Blend Municipal Bond Index tracks the performance of municipal bonds issued after December 31, 1990 with remaining maturities between 2 and 17 years and at least $7 million in principal amount outstanding. Indices are not investments, do not incur fees or expenses and are not professionally managed. It is not possible to invest directly in an index. Securities in the fund may not match those in an index.
2Lipper Inc., a widely respected data provider in the industry, calculates an average total return (assuming reinvestment of distributions) for mutual funds with investment objectives similar to those of the fund. Lipper makes no adjustment for the effect of sales loads.
2
Performance Information – Columbia Connecticut Intermediate Municipal Bond Fund
Growth of a $10,000 investment 11/01/98 – 10/31/08
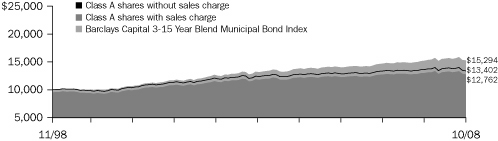 | |
|
The chart above shows the growth in value of a hypothetical $10,000 investment in Class A shares of Columbia Connecticut Intermediate Municipal Bond Fund during the stated time period, and does not reflect the deduction of taxes that a shareholder may pay on fund distributions or on the redemption of fund shares. The Barclays Capital 3-15 Year Blend Municipal Bond Index (formerly the Lehman Brothers 3-15 Year Blend Municipal Bond Index) tracks the performance of municipal bonds issued after December 31, 1990 with remaining maturities between 2 and 17 years and at least $7 million in principal amount outstanding. Indices are not investments, do not incur fees or expenses and are not professionally managed. It is not possible to invest directly in an index. Securities in the fund may not match those in an index. The growth of a $10,000 investment with sales charge for Class A is calculated with an initial sales charge of 4.75%, wh ich was the effective sales charge prior to August 22, 2005.
Performance of a $10,000 investment 11/01/98 – 10/31/08 ($)
| Sales charge | | without | | with | |
| Class A | | | 13,402 | | | | 12,762 | | |
| Class B | | | 12,664 | | | | 12,664 | | |
| Class C | | | 12,932 | | | | 12,932 | | |
| Class T | | | 13,490 | | | | 12,845 | | |
| Class Z | | | 13,685 | | | | n/a | | |
Average annual total return as of 10/31/08 (%)
| Share class | | A | | B | | C | | T | | Z | |
| Inception | | 11/18/02 | | 11/18/02 | | 11/18/02 | | 06/26/00 | | 08/01/94 | |
| Sales charge | | without | | with | | without | | with | | without | | with | | without | | with | | without | |
| 1-year | | | –1.80 | | | | –5.02 | | | | –2.52 | | | | –5.36 | | | | –2.18 | | | | –3.12 | | | | –1.68 | | | | –6.35 | | | | –1.53 | | |
| 5-year | | | 1.63 | | | | 0.64 | | | | 0.88 | | | | 0.88 | | | | 1.23 | | | | 1.23 | | | | 1.74 | | | | 0.75 | | | | 1.89 | | |
| 10-year | | | 2.97 | | | | 2.47 | | | | 2.39 | | | | 2.39 | | | | 2.60 | | | | 2.60 | | | | 3.04 | | | | 2.54 | | | | 3.19 | | |
Average annual total return as of 09/30/08 (%)
| Share class | | A | | B | | C | | T | | Z | |
| Sales charge | | without | | with | | without | | with | | without | | with | | without | | with | | without | |
| 1-year | | | –0.95 | | | | –4.19 | | | | –1.67 | | | | –4.53 | | | | –1.32 | | | | –2.28 | | | | –0.82 | | | | –5.53 | | | | –0.68 | | |
| 5-year | | | 1.63 | | | | 0.65 | | | | 0.88 | | | | 0.88 | | | | 1.23 | | | | 1.23 | | | | 1.74 | | | | 0.76 | | | | 1.89 | | |
| 10-year | | | 3.04 | | | | 2.54 | | | | 2.47 | | | | 2.47 | | | | 2.68 | | | | 2.68 | | | | 3.11 | | | | 2.61 | | | | 3.26 | | |
The "with sales charge" returns include the maximum initial sales charge of 3.25% for Class A shares (for the 1-year period), 4.75% for Class A shares (for the 5-year and 10-year periods) and 4.75% for Class T shares, respectively, the applicable contingent deferred sales charge of 3.00% in the first year, declining to 1.00% in the fourth year and eliminated thereafter for Class B shares and 1.00% for Class C shares for the first year only. The "without sales charge" returns do not include the effect of sales charges. If they had, returns would be lower.
Prior to August 22, 2005, new purchases of Class A shares had a maximum initial sales charge of 4.75%.
Performance results reflect any fee waivers or reimbursements of fund expenses by the investment advisor and/or any of its affiliates. Absent these fee waivers or expense reimbursement arrangements, performance results would have been lower.
All results shown assume reinvestment of distributions. Class Z shares are sold at net asset value with no distribution and service (Rule 12b-1) fees. Class Z shares have limited eligibility and the investment minimum requirements may vary. Please see the fund's prospectus for details. Performance for different share classes will vary based on differences in sales charges and fees associated with each class.
The tables do not reflect the deduction of taxes that a shareholder may pay on fund distributions or on the redemption of fund shares.
Class A, Class B and Class C shares are newer classes of shares, initially offered on November 18, 2002. Their returns include returns of Retail A shares (for Class A shares) and Retail B shares (for Class B and Class C shares) of the Galaxy Connecticut Intermediate Municipal Bond Fund (the "Galaxy Connecticut Fund") for periods prior to November 18, 2002 (adjusted, as applicable, to reflect the sales charges applicable to Class A, Class B and Class C shares). The returns shown for Class B and Class C shares also include the returns for Retail A shares (adjusted, as applicable, to reflect the sales charges applicable to Class B and Class C shares) for periods prior to inception of Retail B shares of the Galaxy Connecticut Fund (March 1, 2001). The returns shown for Class T shares include the returns of Retail A shares of the Galaxy Connecticut Fund for periods prior to November 18, 2002. Retail A share returns include returns of the BKB shares of the Galaxy Connecticut Fund for periods prior to June 26, 2001, the date on which BKB shares were converted to Retail A shares, and returns of shares of the Boston 1784 Connecticut Tax-Exempt Income Fund (the "1784 Connecticut Fund") (whose shares were initially offered on August 1, 1994) for periods prior to June 26, 2000. The returns for Class Z shares include the returns of Trust shares of the Galaxy Connecticut Fund for periods prior to November 18, 2002, and the returns of the 1784 Connecticut Fund for periods prior to June 26, 2000. No returns have been restated to reflect any differences in expenses such as distribution and service (Rule 12b-1) fees between any predecessor share class and the corresponding newer share class. If differences in expenses had been reflected, the returns shown for periods prior to the inception of the newer share classes would have been lower.
Performance data quoted represents past performance and current performance may be lower or higher. Past performance is no guarantee of future results. The investment return and principal value will fluctuate so that shares, when redeemed, may be worth more or less than the original cost. Please visit www.columbiafunds.com for daily and most recent month-end performance updates.
Annual operating expense ratio (%)*
| Class A | | | 1.06 | | |
| Class B | | | 1.81 | | |
| Class C | | | 1.81 | | |
| Class T | | | 0.96 | | |
| Class Z | | | 0.81 | | |
Annual operating expense ratio
after contractual waivers (%)*
| Class A | | | 0.75 | | |
| Class B | | | 1.50 | | |
| Class C | | | 1.50 | | |
| Class T | | | 0.65 | | |
| Class Z | | | 0.50 | | |
* The annual operating expense ratio and annual operating expense ratio after contractual waivers are as stated in the fund's prospectus that is current as of the date of this report. The contractual waiver expires 02/28/09. Differences in expense ratios disclosed elsewhere in this report may result from including fee waivers and expense reimbursements as well as different time periods used in calculating the ratios.
3
Understanding Your Expenses – Columbia Connecticut Intermediate Municipal Bond Fund
Estimating your actual expenses
To estimate the expenses that you paid over the period, first you will need your account balance at the end of the period:
g For shareholders who receive their account statements from Columbia Management Services, Inc., your account balance is available online at www.columbiafunds.com or by calling Shareholder Services at 800.345.6611.
g For shareholders who receive their account statements from their financial intermediary, contact your financial intermediary to obtain your account balance.
1. Divide your ending account balance by $1,000. For example, if an account balance was $8,600 at the end of the period, the result would be 8.6.
2. In the section of the table below titled "Expenses paid during the period," locate the amount for your share class. You will find this number in the column labeled "Actual." Multiply this number by the result from step 1. Your answer is an estimate of the expenses you paid on your account during the period.
If the value of your account falls below the minimum initial investment requirement applicable to you, your account generally will be subject to a $20 annual fee. This fee is not included in the accompanying table. If you are subject to the fee, keep it in mind when you are estimating the ongoing expenses of investing in the fund and when comparing the expenses of this fund with other funds.
As a fund shareholder, you incur two types of costs. There are transaction costs, which generally include sales charges on purchases and may include redemption fees or exchange fees. There are also ongoing costs, which generally include investment advisory fees, distribution and service (Rule 12b-1) fees and other fund expenses. The information on this page is intended to help you understand the ongoing costs of investing in the fund and to compare these costs with the ongoing costs of investing in other mutual funds.
Analyzing your fund's expenses by share class
To illustrate these ongoing costs, we have provided an example and calculated the expenses paid by investors in each share class during the period. The information in the following table is based on an initial investment of $1,000, which is invested at the beginning of the period and held for the entire period. Expense information is calculated two ways and each method provides you with different information. The amount listed in the "Actual" column is calculated using the fund's actual operating expenses and total return for the period. The amount listed in the "Hypothetical" column for each share class assumes that the return each year is 5% before expenses and is calculated based on the fund's actual operating expenses. You should not use the hypothetical account values and expenses to estimate either your actual account balance at the end of the period or the expenses you paid during this period.
Compare with other funds
Since all mutual funds are required to include the same hypothetical calculations about expenses in shareholder reports, you can use this information to compare the ongoing costs of investing in the fund with other funds. To do so, compare the 5% hypothetical example with the 5% hypothetical examples that appear in the shareholder reports of other funds. As you compare hypothetical examples of other funds, it is important to note that hypothetical examples are meant to highlight the ongoing costs of investing in a fund and do not reflect any transaction costs, such as sales charges, redemption fees or exchange fees.
05/01/08 - 10/31/08
| | | Account value at the
beginning of the period ($) | | Account value at the
end of the period ($) | | Expenses paid
during the period ($) | | Fund's annualized
expense ratio (%) | |
| | | Actual | | Hypothetical | | Actual | | Hypothetical | | Actual | | Hypothetical | | Actual | |
| Class A | | | 1,000.00 | | | | 1,000.00 | | | | 967.32 | | | | 1,021.37 | | | | 3.71 | | | | 3.81 | | | | 0.75 | | |
| Class B | | | 1,000.00 | | | | 1,000.00 | | | | 963.70 | | | | 1,017.60 | | | | 7.40 | | | | 7.61 | | | | 1.50 | | |
| Class C | | | 1,000.00 | | | | 1,000.00 | | | | 965.41 | | | | 1,019.36 | | | | 5.68 | | | | 5.84 | | | | 1.15 | | |
| Class T | | | 1,000.00 | | | | 1,000.00 | | | | 967.77 | | | | 1,021.87 | | | | 3.22 | | | | 3.30 | | | | 0.65 | | |
| Class Z | | | 1,000.00 | | | | 1,000.00 | | | | 968.48 | | | | 1,022.62 | | | | 2.47 | | | | 2.54 | | | | 0.50 | | |
Expenses paid during the period are equal to the annualized expense ratio for the share class, multiplied by the average account value over the period, then multiplied by the number of days in the fund's most recent fiscal half-year and divided by 366.
Had the investment advisor and/or any of its affiliates not waived fees or reimbursed a portion of expenses, account value at the end of the period would have been reduced.
It is important to note that the expense amounts shown in the table are meant to highlight only ongoing costs of investing in the fund and do not reflect any transaction costs, such as sales charges, redemption fees or exchange fees. Therefore, the hypothetical examples provided may not help you determine the relative total costs of owning shares of different funds. If these transaction costs were included, your costs would have been higher.
4
Portfolio Manager's Report – Columbia Connecticut Intermediate Municipal Bond Fund
For the 12-month period that ended October 31, 2008, Class A shares of Columbia Connecticut Intermediate Municipal Bond Fund returned negative 1.80% without sales charge. Class Z shares returned negative 1.53%. By comparison, the Barclays Capital 3-15 Year Blend Municipal Bond Index1 (formerly the Lehman Brothers 3-15 Year Blend Municipal Bond Index) returned positive 0.53%, while the Lipper Other States Intermediate Municipal Debt Funds Classification2 had an average total return of negative 1.30%. We believe the fund underperformed its benchmark and the average fund in its peer group largely because we purchased several bonds with maturities ranging from eight to 15 years, which raised exposure to the weakest performing maturity range of the market. A late purchase of BBB-rated bonds also hurt performance but added to the overall yield in the portfolio, as did exposure to bonds issued by Puerto Rico or it s subdivisions. These bonds, which accounted for 12% of the fund's assets, have lower ratings and underperformed as the yield difference between higher and lower quality bonds widened.
On October 31, 2008, the fund's Class A shares had a 30-day SEC annualized yield of 3.38%. This equaled a taxable equivalent yield of 5.47% for shareholders in the 35.0% federal income tax bracket and taxed at the state's applicable state income tax rate. This tax rate does not reflect the phase out of exemptions or the reduction of the otherwise allowable deductions that occur when adjusted gross income exceeds certain levels.
A year of instability and uncertainty
In an environment of high volatility and low liquidity, investors sought shelter in bonds with the highest quality and shortest maturities. By the end of the period, the number of high quality bonds had fallen dramatically as a widening financial crisis threatened all aspects of the financial markets. The percentage of AAA-rated bonds in the index dropped from 65% in January to 32% in October. In June, MBIA and AMBAC, two large municipal insurers, were downgraded by major credit rating agencies. Against this backdrop, lower quality, longer-term securities were the weakest performers, with the worst performance coming from bonds with maturities of 12 to 17 years. In addition, the municipal market experienced selling pressure from mutual funds and hedge funds as the yield difference between high and low quality bonds widened and arbitrage trades became unprofitable.
Longer-term bonds hampered returns
While the fund benefited from a steady supply of new high quality issues, performance was hurt when we purchased some longer intermediate-term bonds at a time when the market favored shorter-term issues with less price volatility. Some of the new issues grew out of a change in federal law that allowed the state housing authority to issue bonds not subject to the alternative minimum tax (AMT). For the past several years, the housing agency has maintained strong underwriting standards, including income
1The Barclays Capital 3-15 Year Blend Municipal Bond Index tracks the performance of municipal bonds issued after December 31, 1990 with remaining maturities between 2 and 17 years and at least $7 million in principal amount outstanding. Indices are not investments, do not incur fees or expenses and are not professionally managed. It is not possible to invest directly in an index. Securities in the fund may not match those in an index.
2Lipper Inc., a widely respected data provider in the industry, calculates an average total return (assuming reinvestment of distributions) for mutual funds with investment objectives similar to those of the fund. Lipper makes no adjustment for the effect of sales loads.
Performance data quoted represents past performance and current performance may be lower or higher. Past performance is no guarantee of future results. The investment return and principal value will fluctuate so that shares, when redeemed, may be worth more or less than the original cost. Please visit www.columbiafunds.com for daily and most recent month-end performance updates.
Net asset value per share
as of 10/31/08 ($)
| Class A | | | 10.06 | | |
| Class B | | | 10.06 | | |
| Class C | | | 10.06 | | |
| Class T | | | 10.06 | | |
| Class Z | | | 10.06 | | |
Distributions declared per share
11/01/07 – 10/31/08 ($)
| Class A | | | 0.38 | | |
| Class B | | | 0.30 | | |
| Class C | | | 0.34 | | |
| Class T | | | 0.39 | | |
| Class Z | | | 0.41 | | |
A portion of the fund's income may be subject to the alternative minimum tax. The fund may at times purchase tax-exempt securities at a discount. Some, or all, of this discount may be included in the fund's ordinary income, and is taxable when distributed.
30-day SEC yields
as of 10/31/08 (%)
| Class A | | | 3.38 | | |
| Class B | | | 2.81 | | |
| Class C | | | 3.15 | | |
| Class T | | | 3.48 | | |
| Class Z | | | 3.80 | | |
The 30-day SEC yields reflect the fund's earning power, net of expenses, expressed as an annualized percentage of the public offering price per share at the end of the period.
5
Portfolio Manager's Report (continued) – Columbia Connecticut Intermediate Municipal Bond Fund
Taxable-equivalent SEC yields
as of 10/31/08 (%)
| Class A | | | 5.47 | | |
| Class B | | | 4.55 | | |
| Class C | | | 5.10 | | |
| Class T | | | 5.64 | | |
| Class Z | | | 6.15 | | |
Taxable-equivalent SEC yields are based on the maximum effective 35.0% federal income tax rate and applicable state income tax rate. This tax rate does not reflect the phase out of exemptions or the reduction of the otherwise allowable deductions that occur when adjusted gross income exceeds certain levels.
Top 5 sectors
as of 10/31/08 (%)
| Local General Obligations | | | 20.6 | | |
| Refunded/Escrowed | | | 16.6 | | |
| State General Obligations | | | 13.7 | | |
| Education | | | 11.0 | | |
| Special Non-Property Tax | | | 7.5 | | |
Sector breakdowns are calculated as a percentage of net assets.
Quality breakdown
as of 10/31/08 (%)
| AAA | | | 31.4 | | |
| AA | | | 48.7 | | |
| A | | | 8.7 | | |
| BBB | | | 3.7 | | |
| Non-rated | | | 0.7 | | |
| Cash and Equivalents | | | 6.8 | | |
Maturity breakdown
as of 10/31/08 (%)
| 0-1 year | | | 4.0 | | |
| 1-3 years | | | 11.9 | | |
| 3-5 years | | | 12.1 | | |
| 5-7 years | | | 12.3 | | |
| 7-10 years | | | 16.3 | | |
| 10-15 years | | | 18.1 | | |
| 15-20 years | | | 14.2 | | |
| 20-25 years | | | 3.1 | | |
| 25 years and over | | | 1.2 | | |
| Cash and Equivalents | | | 6.8 | | |
Quality and maturity breakdowns are calculated as a percentage of net assets. Ratings shown in the quality breakdown represent the highest rating assigned to a particular bond by one of the following nationally recognized rating agencies: Standard and Poor's, Moody's Investors Service, Inc. or Fitch Ratings Ltd. Ratings are relative and subjective and are not absolute standards of quality. The fund's credit quality does not remove market risk.
The fund is actively managed and the composition of its portfolio will change over time.
documentation, minimum down payments and credit checks, so these new bonds offered good quality as well as attractive yields. At the same time, inflows to the fund were strong over the period, and we used the new cash to purchase bonds, including some longer intermediate-term issues, which although they hampered returns during this period, we believe have the potential to do well in a more stable environment. In addition, the fund had no exposure to bonds subject to the AMT, which aided performance because prices on bonds subject to the AMT declined as demand weakened and yields rose more than on other, comparable maturity municipal bonds.
A favorable but cautious economic outlook
We believe that Connecticut's diverse economy is in a good position to retain a stable credit rating for the state and its local municipalities as the state's aerospace and defense industries continue to benefit from strong domestic and international sales. Even so, there are risks going forward. A declining stock market and falling employment in the securities industry will have a negative impact on the state, especially in Fairfield County, where Wall Street employment—and now unemployment—is high. We expect municipal bond issuance to remain strong as the state takes advantage of relatively low interest rates. Credit selection and risk management will be especially important as the state works through this economic downturn.
Portfolio holdings and characteristics are subject to change periodically and may not be representative of current holdings and characteristics. The outlook for this fund may differ from that presented for other Columbia Funds.
Tax-exempt bonds involve special risks. The value of the fund will be affected by interest rate changes and the creditworthiness of issues held in the fund. When interest rates go up, bond prices generally drop and vice versa.
Interest income from certain tax-exempt bonds may be subject to certain state and local taxes and, if applicable, the alternative minimum tax. Capital gains are not exempt from income taxes.
The Fund is non-diversified, which generally means that it may invest a greater percentage of its total assets in the securities of fewer issuers than a "diversified" fund. This increases the risk that a change in the value of any one investment held by the Fund could affect the overall value of the Fund more than it would affect that of a diversified fund holding a greater number of investments. Accordingly, the Fund's value will likely be more volatile than the value of more diversified funds.
Single-state municipal bond funds pose additional risks due to limited geographical diversification.
6
Fund Profile – Columbia Intermediate Municipal Bond Fund
Summary
g For the 12-month period that ended October 31, 2008, the fund's Class A shares returned negative 2.25% without sales charge. Class Z shares returned negative 2.05%.
g The fund's return trailed both its benchmark, the Barclays Capital 3-15 Year Blend Municipal Bond Index1, as well as the average return of its peer group, the Lipper Intermediate Municipal Debt Funds Classification2.
g Investments in non-rated and lower-rated investment grade bonds, as well as bonds with maturities of 10+ years, hampered returns, as these sectors underperformed higher quality and shorter-maturity issues.
Portfolio Management
Susan Sanderson has managed the fund or its predecessors since June 2002 and has been associated with the advisor or its predecessors or affiliate organizations since 1985.
1The Barclays Capital 3-15 Year Blend Municipal Bond Index tracks the performance of municipal bonds issued after December 31, 1990 with remaining maturities between 2 and 17 years and at least $7 million in principal amount outstanding. Indices are not investments, do not incur fees or expenses and are not professionally managed. It is not possible to invest directly in an index. Securities in the fund may not match those in an index.
2Lipper Inc., a widely respected data provider in the industry, calculates an average total return (assuming reinvestment of distributions) for mutual funds with investment objectives similar to those of the fund. Lipper makes no adjustment for the effect of sales loads.
Performance data quoted represents past performance and current performance may be lower or higher. Past performance is no guarantee of future results. The investment return and principal value will fluctuate so that shares, when redeemed, may be worth more or less than the original cost. Please visit www.columbiafunds.com for daily and most recent month-end performance updates.
Summary
1-year return as of 10/31/08
| | –2.25% | |
|
 | | Class A shares
(without sales charge) | |
|
| | +0.53% | |
|
 | | Barclays Capital
3-15 Year Blend
Municipal Bond Index | |
|
Morningstar Style Box

The Morningstar Style Box reveals a fund's investment strategy. For fixed-income funds the vertical axis shows the average credit quality of the bonds owned, and the horizontal axis shows interest rate sensitivity as measured by a bond's duration (short, intermediate or long). All of these numbers are drawn from the data most recently provided by the fund and entered into Morningstar's database as of quarter-end. Although the data gathered is from reliable sources, Morningstar cannot guarantee its completeness and accuracy. Information shown is as of 06/30/08.
7
Performance Information – Columbia Intermediate Municipal Bond Fund
Performance data quoted represents past performance and current performance may be lower or higher. Past performance is no guarantee of future results. The investment return and principal value will fluctuate so that shares, when redeemed, may be worth more or less than the original cost. Please visit www.columbiafunds.com for daily and most recent month-end performance updates.
Annual operating expense ratio (%)*
| Class A | | | 0.72 | | |
| Class B | | | 1.37 | | |
| Class C | | | 1.37 | | |
| Class T | | | 0.67 | | |
| Class Z | | | 0.52 | | |
Annual operating expense ratio
after contractual waivers (%)*
| Class A | | | 0.70 | | |
| Class B | | | 1.35 | | |
| Class C | | | 1.35 | | |
| Class T | | | 0.65 | | |
| Class Z | | | 0.50 | | |
* The annual operating expense ratio and annual operating expense ratio after contractual waivers are as stated in the fund's prospectus that is current as of the date of this report. The contractual waiver expires 02/28/09. Differences in expense ratios disclosed elsewhere in this report may result from including fee waivers and expense reimbursements as well as different time periods used in calculating the ratios.
Growth of a $10,000 investment 11/01/98 – 10/31/08
 | |
|
The chart above shows the growth in value of a hypothetical $10,000 investment in Class A shares of Columbia Intermediate Municipal Bond Fund during the stated time period, and does not reflect the deduction of taxes that a shareholder may pay on fund distributions or on the redemption of fund shares. The Barclays Capital 3-15 Year Blend Municipal Bond Index (formerly the Lehman Brothers 3-15 Year Blend Municipal Bond Index) tracks the performance of municipal bonds issued after December 31, 1990 with remaining maturities between 2 and 17 years and at least $7 million in principal amount outstanding. Indices are not investments, do not incur fees or expenses and are not professionally managed. It is not possible to invest directly in an index. Securities in the fund may not match those in an index. The growth of a $10,000 investment with sales charge for Class A shares are calculated with an initial sales charge of 4.75%, which was the effective sales charge prior to August 22, 2005.
Performance of a $10,000 investment 11/01/98 – 10/31/08 ($)
| Sales charge | | without | | with | |
| Class A | | | 13,653 | | | | 13,007 | | |
| Class B | | | 13,001 | | | | 13,001 | | |
| Class C | | | 13,349 | | | | 13,349 | | |
| Class T | | | 13,694 | | | | 13,047 | | |
| Class Z | | | 13,897 | | | | n/a | | |
Average annual total return as of 10/31/08 (%)
| Share class | | A | | B | | C | | T | | Z | |
| Inception | | 11/25/02 | | 11/25/02 | | 11/25/02 | | 06/26/00 | | 06/14/93 | |
| Sales charge | | without | | with | | without | | with | | without | | with | | without | | with | | without | |
| 1-year | | | –2.25 | | | | –5.40 | | | | –2.88 | | | | –5.70 | | | | –2.45 | | | | –3.39 | | | | –2.20 | | | | –6.85 | | | | –2.05 | | |
| 5-year | | | 1.86 | | | | 0.88 | | | | 1.20 | | | | 1.20 | | | | 1.66 | | | | 1.66 | | | | 1.91 | | | | 0.93 | | | | 2.05 | | |
| 10-year | | | 3.16 | | | | 2.66 | | | | 2.66 | | | | 2.66 | | | | 2.93 | | | | 2.93 | | | | 3.19 | | | | 2.70 | | | | 3.35 | | |
Average annual total return as of 09/30/08 (%)
| Share class | | A | | B | | C | | T | | Z | |
| Sales charge | | without | | with | | without | | with | | without | | with | | without | | with | | without | |
| 1-year | | | –0.94 | | | | –4.13 | | | | –1.58 | | | | –4.44 | | | | –1.15 | | | | –2.10 | | | | –0.89 | | | | –5.60 | | | | –0.74 | | |
| 5-year | | | 1.92 | | | | 0.93 | | | | 1.26 | | | | 1.26 | | | | 1.72 | | | | 1.72 | | | | 1.97 | | | | 0.98 | | | | 2.13 | | |
| 10-year | | | 3.27 | | | | 2.76 | | | | 2.77 | | | | 2.77 | | | | 3.04 | | | | 3.04 | | | | 3.30 | | | | 2.79 | | | | 3.45 | | |
The "with sales charge" returns include the maximum initial sales charge of 3.25% for Class A shares (for the 1-year period), 4.75% for Class A shares (for the 5-year and 10-year periods) and 4.75% for Class T shares, respectively, the applicable contingent deferred sales charge of 3.00% in the first year, declining to 1.00% in the fourth year and eliminated thereafter for Class B shares and 1.00% for Class C shares for the first year only. The "without sales charge" returns do not include the effect of sales charges. If they had, returns would be lower.
Prior to August 22, 2005, new purchases of Class A shares had a maximum initial sales charge of 4.75%.
Performance results reflect any fee waivers or reimbursements of fund expenses by the investment advisor and/or any of its affiliates. Absent these fee waivers or expense reimbursement arrangements, performance results would have been lower.
All results shown assume reinvestment of distributions. Class Z shares are sold at net asset value with no distribution and service (Rule 12b-1) fees. Class Z shares have limited eligibility and the investment minimum requirements may vary. Please see the fund's prospectus for details. Performance for different share classes will vary based on differences in sales charges and fees associated with each class.
The tables do not reflect the deduction of taxes that a shareholder may pay on fund distributions or on the redemption of fund shares.
Class A, Class B and Class C shares are newer classes of shares, initially offered on November 25, 2002. Their returns include returns of Retail A shares (for Class A shares) and Retail B shares (for Class B and Class C shares) of the Galaxy Intermediate Tax-Exempt Bond Fund (the "Galaxy Intermediate Tax-Exempt Fund") for periods prior to November 25, 2002 (adjusted, as applicable, to reflect the sales charges applicable to Class A, Class B and Class C shares). The returns shown for Class B and Class C shares also include the returns for Retail A shares (adjusted, as applicable, to reflect the sales charges applicable to Class B and Class C shares) for periods prior to inception of Retail B shares of the Galaxy Intermediate Tax-Exempt Fund (March 1, 2001). The returns shown for Class T shares include the returns of Retail A shares of the Galaxy Intermediate Tax-Exempt Fund for periods prior to November 25, 2002. Class T shares w ere initially offered on June 26, 2000. Retail A share returns include the returns of BKB shares of the Galaxy Intermediate Tax-Exempt Fund for periods prior to June 26, 2001, the date on which BKB shares were converted to Retail A shares, and the returns of shares of the Boston 1784 Tax-Exempt Medium-Term Income Fund (the "1784 Tax-Exempt Fund") (whose shares were initially offered on June 14, 1993) for periods prior to June 26, 2000. The returns for Class Z shares include the returns of Trust shares of the Galaxy Intermediate Tax-Exempt Fund for periods prior to November 25, 2002, and the returns of the 1784 Tax-Exempt Fund for periods prior to June 26, 2000. No returns have been restated to reflect any differences in expenses such as distribution and service (Rule 12b-1) fees between any predecessor share class and the corresponding newer share class. If differences in expenses had been reflected, the returns shown for periods prior to the inception of the newer share classes would have been lower.
8
Understanding Your Expenses – Columbia Intermediate Municipal Bond Fund
As a fund shareholder, you incur two types of costs. There are transaction costs, which generally include sales charges on purchases and may include redemption fees or exchange fees. There are also ongoing costs, which generally include investment advisory fees, distribution and service (Rule 12b-1) fees and other fund expenses. The information on this page is intended to help you understand the ongoing costs of investing in the fund and to compare these costs with the ongoing costs of investing in other mutual funds.
Analyzing your fund's expenses by share class
To illustrate these ongoing costs, we have provided an example and calculated the expenses paid by investors in each share class during the period. The information in the following table is based on an initial investment of $1,000, which is invested at the beginning of the period and held for the entire period. Expense information is calculated two ways and each method provides you with different information. The amount listed in the "Actual" column is calculated using the fund's actual operating expenses and total return for the period. The amount listed in the "Hypothetical" column for each share class assumes that the return each year is 5% before expenses and is calculated based on the fund's actual operating expenses. You should not use the hypothetical account values and expenses to estimate either your actual account balance at the end of the period or the expenses you paid during this period.
Compare with other funds
Since all mutual funds are required to include the same hypothetical calculations about expenses in shareholder reports, you can use this information to compare the ongoing costs of investing in the fund with other funds. To do so, compare the 5% hypothetical example with the 5% hypothetical examples that appear in the shareholder reports of other funds. As you compare hypothetical examples of other funds, it is important to note that hypothetical examples are meant to highlight the ongoing costs of investing in a fund and do not reflect any transaction costs, such as sales charges, redemption fees or exchange fees.
Estimating your actual expenses
To estimate the expenses that you paid over the period, first you will need your account balance at the end of the period:
g For shareholders who receive their account statements from Columbia Management Services, Inc., your account balance is available online at www.columbiafunds.com or by calling Shareholder Services at 800.345.6611.
g For shareholders who receive their account statements from their financial intermediary, contact your financial intermediary to obtain your account balance.
1. Divide your ending account balance by $1,000. For example, if an account balance was $8,600 at the end of the period, the result would be 8.6.
2. In the section of the table below titled "Expenses paid during the period," locate the amount for your share class. You will find this number in the column labeled "Actual." Multiply this number by the result from step 1. Your answer is an estimate of the expenses you paid on your account during the period.
If the value of your account falls below the minimum initial investment requirement applicable to you, your account generally will be subject to a $20 annual fee. This fee is not included in the accompanying table. If you are subject to the fee, keep it in mind when you are estimating the ongoing expenses of investing in the fund and when comparing the expenses of this fund with other funds.
05/01/08 - 10/31/08
| | | Account value at the
beginning of the period ($) | | Account value at the
end of the period ($) | | Expenses paid
during the period ($) | | Fund's annualized
expense ratio (%) | |
| | | Actual | | Hypothetical | | Actual | | Hypothetical | | Actual | | Hypothetical | | Actual | |
| Class A | | | 1,000.00 | | | | 1,000.00 | | | | 962.19 | | | | 1,021.62 | | | | 3.45 | | | | 3.56 | | | | 0.70 | | |
| Class B | | | 1,000.00 | | | | 1,000.00 | | | | 958.98 | | | | 1,018.35 | | | | 6.65 | | | | 6.85 | | | | 1.35 | | |
| Class C | | | 1,000.00 | | | | 1,000.00 | | | | 961.19 | | | | 1,020.61 | | | | 4.44 | | | | 4.57 | | | | 0.90 | | |
| Class T | | | 1,000.00 | | | | 1,000.00 | | | | 962.40 | | | | 1,021.87 | | | | 3.21 | | | | 3.30 | | | | 0.65 | | |
| Class Z | | | 1,000.00 | | | | 1,000.00 | | | | 963.10 | | | | 1,022.62 | | | | 2.47 | | | | 2.54 | | | | 0.50 | | |
Expenses paid during the period are equal to the annualized expense ratio for the share class, multiplied by the average account value over the period, then multiplied by the number of days in the fund's most recent fiscal half-year and divided by 366.
Had the investment advisor and/or any of its affiliates not waived fees or reimbursed a portion of expenses, account value at the end of the period would have been reduced.
It is important to note that the expense amounts shown in the table are meant to highlight only ongoing costs of investing in the fund and do not reflect any transaction costs, such as sales charges, redemption fees or exchange fees. Therefore, the hypothetical examples provided may not help you determine the relative total costs of owning shares of different funds. If these transaction costs were included, your costs would have been higher.
9
Portfolio Manager's Report – Columbia Intermediate Municipal Bond Fund
Performance data quoted represents past performance and current performance may be lower or higher. Past performance is no guarantee of future results. The investment return and principal value will fluctuate so that shares, when redeemed, may be worth more or less than the original cost. Please visit www.columbiafunds.com for daily and most recent month-end performance updates.
Net asset value per share
as of 10/31/08 ($)
| Class A | | | 9.62 | | |
| Class B | | | 9.62 | | |
| Class C | | | 9.62 | | |
| Class T | | | 9.62 | | |
| Class Z | | | 9.62 | | |
Distributions declared per share
11/01/07 – 10/31/08 ($)
| Class A | | | 0.38 | | |
| Class B | | | 0.32 | | |
| Class C | | | 0.36 | | |
| Class T | | | 0.39 | | |
| Class Z | | | 0.40 | | |
A portion of the fund's income may be subject to the alternative minimum tax. The fund may at times purchase tax-exempt securities at a discount. Some, or all, of this discount may be included in the fund's ordinary income, and is taxable when distributed.
30-day SEC yields
as of 10/31/08 (%)
| Class A | | | 3.86 | | |
| Class B | | | 3.40 | | |
| Class C | | | 3.85 | | |
| Class T | | | 3.90 | | |
| Class Z | | | 4.25 | | |
The 30-day SEC yields reflect the fund's earning power, net of expenses, expressed as an annualized percentage of the public offering price per share at the end of the period.
For the 12-month period that ended October 31, 2008, Class A shares of Columbia Intermediate Municipal Bond Fund returned negative 2.25% without sales charge. Class Z shares returned negative 2.05%. By comparison, the Barclays Capital 3-15 Year Blend Municipal Bond Index1 (formerly the Lehman Brothers 3-15 Year Blend Municipal Bond Index) returned positive 0.53%, while the Lipper Intermediate Municipal Debt Funds Classification2 had an average total return of negative 2.07%. Investments in longer-maturity bonds as well as lower-rated investment grade and non-rated issues hampered returns.
On May 5, 2008, Columbia Intermediate Municipal Bond Fund acquired Intermediate-Term Tax-Exempt Fund, a series of Excelsior Tax-Exempt Funds, Inc. The acquisition added to the fund's holdings of underperforming lower investment-grade and longer-maturity bonds and some shorter-maturity and high-grade names that fared better during the second half of the period.
On October 31, 2008, Columbia Intermediate Municipal Bond Fund's Class A shares had a 30-day SEC annualized yield of 3.86%. This equaled a taxable equivalent yield of 5.94% for shareholders in the 35.0% federal income tax bracket. This tax rate does not reflect the phase out of exemptions or the reduction of otherwise allowable deductions that occur when adjusted gross income exceeds certain levels. The fund's yield was higher than the average for its peer group.
Pressure on municipal bonds
Municipal bonds avoided the sharp price declines of stocks and high-yield bonds, but made little headway amid challenging market conditions. Throughout the year, credit ratings agencies downgraded municipal bond insurers because of worries that they might not have adequate capital to cover potential defaults. New issuance slowed as issuers postponed coming to market. In addition, institutions and non-traditional buyers, including hedge funds, were heavy sellers of municipal bonds, pressuring prices. By the fall, an estimated $18 billion in new issuance was scheduled to come to the market. However, a portion of it was postponed as a result of the credit freeze. Uncertainty around this overhang also weighed on municipal bond prices. In a challenging environment, higher quality and shorter-maturity municipal bonds beat lower investment grade bonds, non-rated bonds and longer-maturity bonds.
Longer intermediate-maturity bias
The fund maintained its focus on bonds with maturities between seven and 15 years, which offered a yield advantage over shorter-term issues as well as strong long-term return potential. We locked in yields by focusing on bonds that were non-callable or protected from being redeemed any time soon. However, an overweight versus the Barclays index in bonds with 10- to 15-year maturities and a modest stake in even longer-term issues hindered returns. An underweight in bonds with maturities of two years or less also hurt performance.
1The Barclays Capital 3-15 Year Blend Municipal Bond Index tracks the performance of municipal bonds issued after December 31, 1990 with remaining maturities between 2 and 17 years and at least $7 million in principal amount outstanding. Indices are not investments, do not incur fees or expenses and are not professionally managed. It is not possible to invest directly in an index. Securities in the fund may not match those in an index.
2Lipper Inc., a widely respected data provider in the industry, calculates an average total return (assuming reinvestment of distributions) for mutual funds with investment objectives similar to those of the fund. Lipper makes no adjustment for the effect of sales loads.
10
Portfolio Manager's Report (continued) – Columbia Intermediate Municipal Bond Fund
Benefit from high-quality exposure
Bonds with the highest credit ratings (AAA or AA)—which accounted for approximately 77% of the fund's assets—aided returns. Among the winners were pre-refunded bonds, which typically have better credit quality and shorter maturities than issues that have not been refunded. Pre-refunding occurs when an issuer goes to market with a new bond and puts the proceeds from that sale into an escrow account to pay off an older, higher interest-rate issue. The fund, however, lost ground on its holdings of lower-rated investment grade (A or BAA), below investment grade and non-rated issues, which accounted for approximately 21% of its assets. Sectors that performed poorly included tobacco, hospital, and Puerto Rico bonds, as well as land secured deals. The fund reduced its exposure to bonds directly subject to the alternative minimum tax (AMT) to approximately 1.73%.
Potential for more volatility and weak economic growth
We believe that low short-term interest rates, the federal government bailout's package and easing inflation pressures bode well for the economy's long-term outlook. We believe that near term, however, job layoffs, reduced consumer spending, the slumping housing market and lackluster corporate earnings will likely hurt economic growth. To prepare the fund for this environment, we recently began to shift the portfolio's focus toward intermediate-term bonds with six- to 12-year maturities and increasing positions in higher investment grade issues.
Portfolio holdings and characteristics are subject to change periodically and may not be representative of current holdings and characteristics. The outlook for this fund may differ from that presented for other Columbia Funds.
Tax-exempt bonds involve special risks. The value of the fund will be affected by interest rate changes and the creditworthiness of issues held in the fund. When interest rates go up, bond prices generally drop and vice versa.
Interest income from certain tax-exempt bonds may be subject to certain state and local taxes and, if applicable, the alternative minimum tax. Capital gains are not exempt from income taxes.
Taxable-equivalent SEC yields
as of 10/31/08 (%)
| Class A | | | 5.94 | | |
| Class B | | | 5.23 | | |
| Class C | | | 5.92 | | |
| Class T | | | 6.00 | | |
| Class Z | | | 6.54 | | |
Taxable-equivalent SEC yields are based on the maximum effective 35.0% federal income tax rate. This tax rate does not reflect the phase out of exemptions or the reduction of the otherwise allowable deductions that occur when adjusted gross income exceeds certain levels.
Top 5 sectors
as of 10/31/08 (%)
| Local General Obligations | | | 11.9 | | |
| State General Obligations | | | 10.6 | | |
| Refunded/Escrowed | | | 9.8 | | |
| Special Non-Property Tax | | | 8.6 | | |
| Hospitals | | | 8.2 | | |
Sector breakdowns are calculated as a percentage of net assets.
Quality breakdown
as of 10/31/08 (%)
| AAA | | | 33.4 | | |
| AA | | | 44.0 | | |
| A | | | 8.3 | | |
| BBB | | | 8.7 | | |
| BB | | | 0.2 | | |
| B | | | 0.7 | | |
| Non-rated | | | 2.9 | | |
| Cash and Equivalents | | | 1.8 | | |
Maturity breakdown
as of 10/31/08 (%)
| 0-1 year | | | 0.1 | | |
| 1-3 years | | | 10.3 | | |
| 3-5 years | | | 17.7 | | |
| 5-7 years | | | 13.4 | | |
| 7-10 years | | | 24.0 | | |
| 10-15 years | | | 24.9 | | |
| 15-20 years | | | 6.3 | | |
| 20-25 years | | | 1.3 | | |
| 25 years and over | | | 0.2 | | |
| Cash and Equivalents | | | 1.8 | | |
Quality and maturity breakdowns are calculated as a percentage of net assets. Ratings shown in the quality breakdown represent the highest rating assigned to a particular bond by one of the following nationally recognized rating agencies: Standard and Poor's, Moody's Investors Service, Inc. or Fitch Ratings Ltd. Ratings are relative and subjective and are not absolute standards of quality. The fund's credit quality does not remove market risk.
The fund is actively managed and the composition of its portfolio will change over time.
11
Fund Profile – Columbia Massachusetts Intermediate Municipal Bond Fund
Performance data quoted represents past performance and current performance may be lower or higher. Past performance is no guarantee of future results. The investment return and principal value will fluctuate so that shares, when redeemed, may be worth more or less than the original cost. Please visit www.columbiafunds.com for daily and most recent month-end performance updates.
Summary
1-year return as of 10/31/08
| | –0.88% | |
|
 | | Class A shares
(without sales charge) | |
|
| | +0.53% | |
|
 | | Barclays Capital
3-15 Year Blend
Municipal Bond Index | |
|
Morningstar Style Box
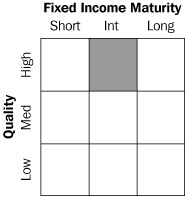
The Morningstar Style Box reveals a fund's investment strategy. For fixed-income funds the vertical axis shows the average credit quality of the bonds owned, and the horizontal axis shows interest rate sensitivity as measured by a bond's duration (short, intermediate or long). All of these numbers are drawn from the data most recently provided by the fund and entered into Morningstar's database as of quarter-end. Although the data gathered is from reliable sources, Morningstar cannot guarantee its completeness and accuracy. Information shown is as of 06/30/08.
Summary
g For the 12-month period that ended October 31, 2008, the fund's Class A shares returned negative 0.88% without sales charge. Class Z shares returned negative 0.62%.
g The fund's return trailed its benchmark, the Barclays Capital 3-15 Year Blend Municipal Bond Index1, but it held up better in a challenging environment than the average return of its peer group, the Lipper Massachusetts Intermediate Municipal Debt Funds Classification2.
g Investments in longer maturity bonds hindered performance versus the benchmark, while we believe that a bias toward shorter-maturity, higher quality bonds helped returns relative to the average fund in its peer group.
Portfolio Management
Susan Sanderson has managed the fund or its predecessors since 1993 and has been associated with the advisor or its predecessors or affiliate organizations since 1985.
1The Barclays Capital 3-15 Year Blend Municipal Bond Index tracks the performance of municipal bonds issued after December 31, 1990 with remaining maturities between 2 and 17 years and at least $7 million in principal amount outstanding. Indices are not investments, do not incur fees or expenses and are not professionally managed. It is not possible to invest directly in an index. Securities in the fund may not match those in an index.
2Lipper Inc., a widely respected data provider in the industry, calculates an average total return (assuming reinvestment of distributions) for mutual funds with investment objectives similar to those of the fund. Lipper makes no adjustment for the effect of sales loads.
12
Performance Information – Columbia Massachusetts Intermediate Municipal Bond Fund
Growth of a $10,000 investment 11/01/98 – 10/31/08
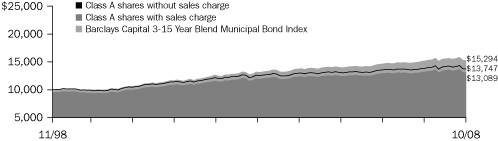 | |
|
The chart above shows the growth in value of a hypothetical $10,000 investment in Class A shares of Columbia Massachusetts Intermediate Municipal Bond Fund during the stated time period, and does not reflect the deduction of taxes that a shareholder may pay on fund distributions or on the redemption of fund shares. The Barclays Capital 3-15 Year Blend Municipal Bond Index (formerly the Lehman Brothers 3-15 Year Blend Municipal Bond Index) tracks the performance of municipal bonds issued after December 31, 1990 with remaining maturities between 2 and 17 years and at least $7 million in principal amount outstanding. Indices are not investments, do not incur fees or expenses and are not professionally managed. It is not possible to invest directly in an index. Securities in the fund may not match those in an index. The growth of a $10,000 investment with sales charges for Class A is calculated with an initial sales charge of 4.75%, which was the effective sales charge prior to August 22, 2005.
Performance of a $10,000 investment 11/01/98 – 10/31/08 ($)
| Sales charge | | without | | with | |
| Class A | | | 13,747 | | | | 13,089 | | |
| Class B | | | 12,993 | | | | 12,993 | | |
| Class C | | | 13,264 | | | | 13,264 | | |
| Class T | | | 13,835 | | | | 13,173 | | |
| Class Z | | | 14,012 | | | | n/a | | |
Average annual total return as of 10/31/08 (%)
| Share class | | A | | B | | C | | T | | Z | |
| Inception | | 12/09/02 | | 12/09/02 | | 12/09/02 | | 06/26/00 | | 06/14/93 | |
| Sales charge | | without | | with | | without | | with | | without | | with | | without | | with | | without | |
| 1-year | | | –0.88 | | | | –4.12 | | | | –1.61 | | | | –4.48 | | | | –1.27 | | | | –2.23 | | | | –0.77 | | | | –5.52 | | | | –0.62 | | |
| 5-year | | | 1.89 | | | | 0.90 | | | | 1.13 | | | | 1.13 | | | | 1.48 | | | | 1.48 | | | | 1.99 | | | | 1.00 | | | | 2.14 | | |
| 10-year | | | 3.23 | | | | 2.73 | | | | 2.65 | | | | 2.65 | | | | 2.86 | | | | 2.86 | | | | 3.30 | | | | 2.79 | | | | 3.43 | | |
Average annual total return as of 09/30/08 (%)
| Share class | | A | | B | | C | | T | | Z | |
| Sales charge | | without | | with | | without | | with | | without | | with | | without | | with | | without | |
| 1-year | | | –0.49 | | | | –3.74 | | | | –1.22 | | | | –4.10 | | | | –0.88 | | | | –1.84 | | | | –0.38 | | | | –5.14 | | | | –0.23 | | |
| 5-year | | | 1.77 | | | | 0.78 | | | | 1.02 | | | | 1.02 | | | | 1.37 | | | | 1.37 | | | | 1.88 | | | | 0.88 | | | | 2.03 | | |
| 10-year | | | 3.23 | | | | 2.73 | | | | 2.66 | | | | 2.66 | | | | 2.87 | | | | 2.87 | | | | 3.30 | | | | 2.80 | | | | 3.43 | | |
The "with sales charge" returns include the maximum initial sales charge of 3.25% for Class A shares (for the 1-year period), 4.75% for Class A shares (for the 5-year and 10-year periods) and 4.75% for Class T shares, respectively, the applicable contingent deferred sales charge of 3.00% in the first year, declining to 1.00% in the fourth year and eliminated thereafter for Class B shares and 1.00% for Class C shares for the first year only. The "without sales charge" returns do not include the effect of sales charges. If they had, returns would be lower.
Prior to August 22, 2005, new purchases of Class A shares had a maximum initial sales charge of 4.75%.
Performance results reflect any fee waivers or reimbursements of fund expenses by the investment advisor and/or any of its affiliates. Absent these fee waivers or expense reimbursement arrangements, performance results would have been lower.
All results shown assume reinvestment of distributions. Class Z shares are sold at net asset value with no distribution and service (Rule 12b-1) fees. Class Z shares have limited eligibility and the investment minimum requirements may vary. Please see the fund's prospectus for details. Performance for different share classes will vary based on differences in sales charges and fees associated with each class.
The tables do not reflect the deduction of taxes that a shareholder may pay on fund distributions or on the redemption of fund shares.
Class A, Class B and Class C shares are newer classes of shares, initially offered on December 9, 2002. Their returns include returns of Retail A shares (for Class A shares) and Retail B shares (for Class B and Class C shares) of the Galaxy Massachusetts Intermediate Municipal Bond Fund (the "Galaxy Massachusetts Fund") for periods prior to December 9, 2002 (adjusted, as applicable, to reflect the sales charges applicable to Class A, Class B and Class C shares). The returns shown for Class B and Class C shares also include the returns for Retail A shares (adjusted, as applicable, to reflect the sales charges applicable to Class B and Class C shares) for periods prior to inception of Retail B shares of the Galaxy Massachusetts Fund (March 1, 2001). The returns shown for Class T shares include the returns of Retail A shares of the Galaxy Massachusetts Fund for periods prior to December 9, 2002. Retail A share returns include the r eturns of BKB shares of the Galaxy Massachusetts Fund for periods prior to June 26, 2001, the date on which BKB shares were converted to Retail A shares, and returns of the Boston 1784 Massachusetts Tax-Exempt Income Fund (the"1784 Massachusetts Fund") (whose shares were initially offered June 14, 1993) for periods prior to June 26, 2000. The returns for Class Z shares include the returns of Trust shares of the Galaxy Massachusetts Fund for periods prior to December 9, 2002, and the returns of the 1784 Massachusetts Fund for periods prior to June 26, 2000. No returns have been restated to reflect any differences in expenses such as distribution and service (Rule 12b-1) fees between any predecessor share class and the corresponding newer share class. If differences in expenses had been reflected, the returns shown for periods prior to the inception of the newer share classes would have been lower.
Performance data quoted represents past performance and current performance may be lower or higher. Past performance is no guarantee of future results. The investment return and principal value will fluctuate so that shares, when redeemed, may be worth more or less than the original cost. Please visit www.columbiafunds.com for daily and most recent month-end performance updates.
Annual operating expense ratio (%)*
| Class A | | | 0.91 | | |
| Class B | | | 1.66 | | |
| Class C | | | 1.66 | | |
| Class T | | | 0.81 | | |
| Class Z | | | 0.66 | | |
Annual operating expense ratio
after contractual waivers (%)*
| Class A | | | 0.75 | | |
| Class B | | | 1.50 | | |
| Class C | | | 1.50 | | |
| Class T | | | 0.65 | | |
| Class Z | | | 0.50 | | |
* The annual operating expense ratio and annual operating expense ratio after contractual waivers are as stated in the fund's prospectus that is current as of the date of this report. The contractual waiver expires 02/28/09. Differences in expense ratios disclosed elsewhere in this report may result from including fee waivers and expense reimbursements as well as different time periods used in calculating the ratios.
13
Understanding Your Expenses – Columbia Massachusetts Intermediate Municipal Bond Fund
Estimating your actual expenses
To estimate the expenses that you paid over the period, first you will need your account balance at the end of the period:
g For shareholders who receive their account statements from Columbia Management Services, Inc., your account balance is available online at www.columbiafunds.com or by calling Shareholder Services at 800.345.6611.
g For shareholders who receive their account statements from their financial intermediary, contact your financial intermediary to obtain your account balance.
1. Divide your ending account balance by $1,000. For example, if an account balance was $8,600 at the end of the period, the result would be 8.6.
2. In the section of the table below titled "Expenses paid during the period," locate the amount for your share class. You will find this number in the column labeled "Actual." Multiply this number by the result from step 1. Your answer is an estimate of the expenses you paid on your account during the period.
If the value of your account falls below the minimum initial investment requirement applicable to you, your account generally will be subject to a $20 annual fee. This fee is not included in the accompanying table. If you are subject to the fee, keep it in mind when you are estimating the ongoing expenses of investing in the fund and when comparing the expenses of this fund with other funds.
As a fund shareholder, you incur two types of costs. There are transaction costs, which generally include sales charges on purchases and may include redemption fees or exchange fees. There are also ongoing costs, which generally include investment advisory fees, distribution and service (Rule 12b-1) fees and other fund expenses. The information on this page is intended to help you understand the ongoing costs of investing in the fund and to compare these costs with the ongoing costs of investing in other mutual funds.
Analyzing your fund's expenses by share class
To illustrate these ongoing costs, we have provided an example and calculated the expenses paid by investors in each share class during the period. The information in the following table is based on an initial investment of $1,000, which is invested at the beginning of the period and held for the entire period. Expense information is calculated two ways and each method provides you with different information. The amount listed in the "Actual" column is calculated using the fund's actual operating expenses and total return for the period. The amount listed in the "Hypothetical" column for each share class assumes that the return each year is 5% before expenses and is calculated based on the fund's actual operating expenses. You should not use the hypothetical account values and expenses to estimate either your actual account balance at the end of the period or the expenses you paid during this period.
Compare with other funds
Since all mutual funds are required to include the same hypothetical calculations about expenses in shareholder reports, you can use this information to compare the ongoing costs of investing in the fund with other funds. To do so, compare the 5% hypothetical example with the 5% hypothetical examples that appear in the shareholder reports of other funds. As you compare hypothetical examples of other funds, it is important to note that hypothetical examples are meant to highlight the ongoing costs of investing in a fund and do not reflect any transaction costs, such as sales charges, redemption fees or exchange fees.
05/01/08 - 10/31/08
| | | Account value at the
beginning of the period ($) | | Account value at the
end of the period ($) | | Expenses paid
during the period ($) | | Fund's annualized
expense ratio (%) | |
| | | Actual | | Hypothetical | | Actual | | Hypothetical | | Actual | | Hypothetical | | Actual | |
| Class A | | | 1,000.00 | | | | 1,000.00 | | | | 969.08 | | | | 1,021.37 | | | | 3.71 | | | | 3.81 | | | | 0.75 | | |
| Class B | | | 1,000.00 | | | | 1,000.00 | | | | 965.41 | | | | 1,017.60 | | | | 7.41 | | | | 7.61 | | | | 1.50 | | |
| Class C | | | 1,000.00 | | | | 1,000.00 | | | | 967.12 | | | | 1,019.36 | | | | 5.69 | | | | 5.84 | | | | 1.15 | | |
| Class T | | | 1,000.00 | | | | 1,000.00 | | | | 969.58 | | | | 1,021.87 | | | | 3.22 | | | | 3.30 | | | | 0.65 | | |
| Class Z | | | 1,000.00 | | | | 1,000.00 | | | | 970.29 | | | | 1,022.62 | | | | 2.48 | | | | 2.54 | | | | 0.50 | | |
Expenses paid during the period are equal to the annualized expense ratio for the share class, multiplied by the average account value over the period, then multiplied by the number of days in the fund's most recent fiscal half-year and divided by 366.
Had the investment advisor and/or any of its affiliates not waived fees or reimbursed a portion of expenses, account value at the end of the period would have been reduced.
It is important to note that the expense amounts shown in the table are meant to highlight only ongoing costs of investing in the fund and do not reflect any transaction costs, such as sales charges, redemption fees or exchange fees. Therefore, the hypothetical examples provided may not help you determine the relative total costs of owning shares of different funds. If these transaction costs were included, your costs would have been higher.
14
Portfolio Manager's Report – Columbia Massachusetts Intermediate Municipal Bond Fund
For the 12-month period that ended October 31, 2008, Class A shares of Columbia Massachusetts Intermediate Municipal Bond Fund returned negative 0.88% without sales charge. Class Z shares returned negative 0.62%. By comparison, the Barclays Capital 3-15 Year Blend Municipal Bond Index1 (formerly the Lehman Brothers 3-15 Year Blend Municipal Bond Index) returned positive 0.53%, while the Lipper Massachusetts Intermediate Municipal Debt Funds Classification2 had an average total return of negative 1.17%. The fund had more exposure than the index to longer-maturity bonds, which hampered relative returns. We believe that investments in short-maturity, high quality bonds helped the fund hold up better than the average fund in its peer group in a challenging environment.
On October 31, 2008, the fund's Class A shares had a 30-day SEC annualized yield of 3.50%. This equaled a taxable equivalent yield of 5.69% for shareholders in the 35.0% federal income tax bracket and taxed at the state's applicable state income tax rate. This tax rate does not reflect the phase out of exemptions or the reduction of the otherwise allowable deductions that occur when adjusted gross income exceeds certain levels. The fund maintained an above-average yield throughout the year.
Challenging year for Massachusetts municipal bonds
The Massachusetts economy came under pressure, as both the stock market decline and job losses reduced income tax revenues. In addition, many municipal bond insurers saw their credit ratings fall as credit rating agencies became concerned about whether the insurers had enough capital to cover potential defaults. The value of insured issues fell, and issuers postponed new offerings. Selling by hedge funds and mutual funds further depressed municipal bond prices. By early fall, a credit freeze forced many bond deals to be pulled from the market, creating a worrisome overhang of new issues.
Best returns from short-maturity and high quality bonds
In a difficult market, investors favored the shortest-maturity bonds, which handily beat the declines posted by longer-term issues. We believe the fund had more exposure than the average fund in its peer group to bonds with maturities of four years or less, which benefited performance. Investments in short-maturity pre-refunded bonds did especially well. Pre-refunding occurs when an issuer goes to market with a new bond and puts the proceeds from that sale into an escrow account to pay off an older, higher interest-rate issue. This process shortens the maturity of the bond and boosts its credit quality. An overweight in bonds with 10- to 12-year maturities and exposure to 20-year or longer issues hampered performance versus the index.
The fund benefited from a sizable position in the highest quality (AAA and AA) bonds, while losing some ground from having a small stake in lower investment grade (BAA) and non-rated issues, including some Puerto Rico and hospital bonds. Late in the
1The Barclays Capital 3-15 Year Blend Municipal Bond Index tracks the performance of municipal bonds issued after December 31, 1990 with remaining maturities between 2 and 17 years and at least $7 million in principal amount outstanding. Indices are not investments, do not incur fees or expenses and are not professionally managed. It is not possible to invest directly in an index. Securities in the fund may not match those in an index.
2Lipper Inc., a widely respected data provider in the industry, calculates an average total return (assuming reinvestment of distributions) for mutual funds with investment objectives similar to those of the fund. Lipper makes no adjustment for the effect of sales loads.
Performance data quoted represents past performance and current performance may be lower or higher. Past performance is no guarantee of future results. The investment return and principal value will fluctuate so that shares, when redeemed, may be worth more or less than the original cost. Please visit www.columbiafunds.com for daily and most recent month-end performance updates.
Net asset value per share
as of 10/31/08 ($)
| Class A | | | 9.90 | | |
| Class B | | | 9.90 | | |
| Class C | | | 9.90 | | |
| Class T | | | 9.90 | | |
| Class Z | | | 9.90 | | |
Distributions declared per share
11/01/07 – 10/31/08 ($)
| Class A | | | 0.37 | | |
| Class B | | | 0.29 | | |
| Class C | | | 0.33 | | |
| Class T | | | 0.38 | | |
| Class Z | | | 0.39 | | |
A portion of the fund's income may be subject to the alternative minimum tax. The fund may at times purchase tax-exempt securities at a discount. Some, or all, of this discount may be included in the fund's ordinary income, and is taxable when distributed.
Distributions include taxable realized gains which round to less than $0.01 per share.
30-day SEC yields
as of 10/31/08 (%)
| Class A | | | 3.50 | | |
| Class B | | | 2.94 | | |
| Class C | | | 3.28 | | |
| Class T | | | 3.60 | | |
| Class Z | | | 3.93 | | |
The 30-day SEC yields reflect the fund's earning power, net of expenses, expressed as an annualized percentage of the public offering price per share at the end of the period.
Taxable-equivalent SEC yields
as of 10/31/08 (%)
| Class A | | | 5.69 | | |
| Class B | | | 4.78 | | |
| Class C | | | 5.33 | | |
| Class T | | | 5.85 | | |
| Class Z | | | 6.38 | | |
Taxable-equivalent SEC yields are based on the maximum effective 35.0% federal income tax rate and applicable state income tax rate. This tax rate does not reflect the phase out of exemptions or the reduction of the otherwise allowable deductions that occur when adjusted gross income exceeds certain levels.
15
Portfolio Manager's Report (continued) – Columbia Massachusetts Intermediate Municipal Bond Fund
Top 5 sectors
as of 10/31/08 (%)
| Education | | | 15.6 | | |
| State General Obligations | | | 14.6 | | |
| Local General Obligations | | | 13.6 | | |
| Refunded/Escrowed | | | 11.7 | | |
| Special Non-Property Tax | | | 10.3 | | |
Sector breakdowns are calculated as a percentage of net assets.
Maturity breakdown
as of 10/31/08 (%)
| 1-3 years | | | 13.7 | | |
| 3-5 years | | | 15.8 | | |
| 5-7 years | | | 11.4 | | |
| 7-10 years | | | 19.3 | | |
| 10-15 years | | | 28.2 | | |
| 15-20 years | | | 5.1 | | |
| 20-25 years | | | 0.0 | | |
| 25 years and over | | | 2.9 | | |
| Cash & Equivalents | | | 3.4 | | |
Quality breakdown
as of 10/31/08 (%)
| AAA | | | 31.0 | | |
| AA | | | 53.5 | | |
| A | | | 7.5 | | |
| BBB | | | 3.3 | | |
| BB | | | 0.5 | | |
| Non-rated | | | 0.8 | | |
| Cash & Equivalents | | | 3.4 | | |
Quality and maturity breakdowns are calculated as a percentage of net assets. Ratings shown in the quality breakdown represent the highest rating assigned to a particular bond by one of the following nationally recognized rating agencies: Standard & Poor's, Moody's Investors Service, Inc. or Fitch Ratings Ltd. Ratings are relative and subjective and are not absolute standards of quality. The fund's credit quality does not remove market risk.
The fund is actively managed and the composition of its portfolio will change over time.
period, we began shifting the fund's focus toward shorter intermediate bonds with six- to 10-year maturities, and increasing the fund's holdings in higher investment grade issues, which we believe offer good long-term prospects. The fund does not own any bonds that are directly subject to the alternative minimum tax.
Mixed outlook for state economy
We expect the Commonwealth to maintain its AA credit rating, thanks to a relatively sound financial position and quick response to a looming budget gap. And, we expect demand for municipal bonds to remain strong among individual investors. Despite job losses, we believe that Massachusetts's diverse economic base, highly educated work force, and above–average level of personal income should help it weather the economic slowdown. At the same time, we believe that high business and living costs, weak population growth, and a prolonged housing slump will likely hurt long-term growth.
Portfolio holdings and characteristics are subject to change periodically and may not be representative of current holdings and characteristics. The outlook for this fund may differ from that presented for other Columbia Funds.
Tax-exempt bonds involve special risks. The value of the fund will be affected by interest rate changes and the creditworthiness of issues held in the fund. When interest rates go up, bond prices generally drop and vice versa.
Interest income from certain tax-exempt bonds may be subject to certain state and local taxes and, if applicable, the alternative minimum tax. Capital gains are not exempt from income taxes.
The Fund is non-diversified, which generally means that it may invest a greater percentage of its total assets in the securities of fewer issuers than a "diversified" fund. This increases the risk that a change in the value of any one investment held by the Fund could affect the overall value of the Fund more than it would affect that of a diversified fund holding a greater number of investments. Accordingly, the Fund's value will likely be more volatile than the value of more diversified funds.
Single-state municipal bond funds pose additional risks due to limited geographical diversification.
16
Fund Profile – Columbia New Jersey Intermediate Municipal Bond Fund
Summary
g For the 12-month period that ended October 31, 2008, the fund's Class A shares returned negative 1.64% without sales charge. Class Z shares returned negative 1.38%.
g The fund's return trailed both its benchmark, the Barclays Capital 3-15 Year Blend Municipal Bond Index,1 as well as the average return of its peer group, the Lipper Other States Intermediate Municipal Debt Funds Classification.2
g The fund underperformed its benchmark and peer group because it had more exposure to higher-yielding, lower quality investments and to longer-term bonds, all of which underperformed during the period.
Portfolio Management
Brian M. McGreevy has managed the fund or its predecessors since September 1998 and has been associated with the advisor or its predecessors or affiliate organizations since 1994.
1The Barclays Capital 3-15 Year Blend Municipal Bond Index tracks the performance of municipal bonds issued after December 31, 1990 with remaining maturities between 2 and 17 years and at least $7 million in principal amount outstanding. Indices are not investments, do not incur fees or expenses and are not professionally managed. It is not possible to invest directly in an index. Securities in the fund may not match those in an index.
2Lipper Inc., a widely respected data provider in the industry, calculates an average total return (assuming reinvestment of distributions) for mutual funds with investment objectives similar to those of the fund. Lipper makes no adjustment for the effect of sales loads.
Performance data quoted represents past performance and current performance may be lower or higher. Past performance is no guarantee of future results. The investment return and principal value will fluctuate so that shares, when redeemed, may be worth more or less than the original cost. Please visit www.columbiafunds.com for daily and most recent month-end performance updates.
Summary
1-year return as of 10/31/08
| | –1.64% | |
|
 | | Class A shares
(without sales charge) | |
|
| | +0.53% | |
|
 | | Barclays Capital
3-15 Year Blend
Municipal Bond Index | |
|
Morningstar Style Box

The Morningstar Style Box reveals a fund's investment strategy. For fixed-income funds the vertical axis shows the average credit quality of the bonds owned, and the horizontal axis shows interest rate sensitivity as measured by a bond's duration (short, intermediate or long). All of these numbers are drawn from the data most recently provided by the fund and entered into Morningstar's database as of quarter-end. Although the data gathered is from reliable sources, Morningstar cannot guarantee its completeness and accuracy. Information shown is as of 06/30/08.
17
Performance Information – Columbia New Jersey Intermediate Municipal Bond Fund
Performance data quoted represents past performance and current performance may be lower or higher. Past performance is no guarantee of future results. The investment return and principal value will fluctuate so that shares, when redeemed, may be worth more or less than the original cost. Please visit www.columbiafunds.com for daily and most recent month-end performance updates.
Annual operating expense ratio (%)*
| Class A | | | 1.18 | | |
| Class B | | | 1.93 | | |
| Class C | | | 1.93 | | |
| Class T | | | 1.08 | | |
| Class Z | | | 0.93 | | |
Annual operating expense ratio
after contractual waivers (%)*
| Class A | | | 0.75 | | |
| Class B | | | 1.50 | | |
| Class C | | | 1.50 | | |
| Class T | | | 0.65 | | |
| Class Z | | | 0.50 | | |
* The annual operating expense ratio and annual operating expense ratio after contractual waivers are as stated in the fund's prospectus that is current as of the date of this report. The contractual waiver expires 02/28/09. Differences in expense ratios disclosed elsewhere in this report may result from including fee waivers and expense reimbursements as well as different time periods used in calculating the ratios.
Growth of a $10,000 investment 11/01/98 – 10/31/08
 | |
|
The chart above shows the growth in value of a hypothetical $10,000 investment in Class A shares of Columbia New Jersey Intermediate Municipal Bond Fund during the stated time period, and does not reflect the deduction of taxes that a shareholder may pay on fund distributions or on the redemption of fund shares. The Barclays Capital 3-15 Year Blend Municipal Bond Index (formerly the Lehman Brothers 3-15 Year Blend Municipal Bond Index) tracks the performance of municipal bonds issued after December 31, 1990 with remaining maturities between 2 and 17 years and at least $7 million in principal amount outstanding. Indices are not investments, do not incur fees or expenses and are not professionally managed. It is not possible to invest directly in an index. Securities in the fund may not match those in an index. The growth of a $10,000 investment with sales charge for Class A is calculated with an initial sales charge of 4.75%, whi ch was the effective sales charge prior to August 22, 2005.
Performance of a $10,000 investment 11/01/98 – 10/31/08 ($)
| Sales charge | | without | | with | |
| Class A | | | 13,660 | | | | 13,012 | | |
| Class B | | | 12,890 | | | | 12,890 | | |
| Class C | | | 13,163 | | | | 13,163 | | |
| Class T | | | 13,741 | | | | 13,089 | | |
| Class Z | | | 13,956 | | | | n/a | | |
Average annual total return as of 10/31/08 (%)
| Share class | | A | | B | | C | | T | | Z | |
| Inception | | 11/18/02 | | 11/18/02 | | 11/18/02 | | 04/03/98 | | 04/03/98 | |
| Sales charge | | without | | with | | without | | with | | without | | with | | without | | with | | without | |
| 1-year | | | –1.64 | | | | –4.85 | | | | –2.36 | | | | –5.21 | | | | –2.02 | | | | –2.97 | | | | –1.53 | | | | –6.18 | | | | –1.38 | | |
| 5-year | | | 1.83 | | | | 0.85 | | | | 1.07 | | | | 1.07 | | | | 1.42 | | | | 1.42 | | | | 1.93 | | | | 0.95 | | | | 2.08 | | |
| 10-year | | | 3.17 | | | | 2.67 | | | | 2.57 | | | | 2.57 | | | | 2.79 | | | | 2.79 | | | | 3.23 | | | | 2.73 | | | | 3.39 | | |
Average annual total return as of 09/30/08 (%)
| Share class | | A | | B | | C | | T | | Z | |
| Sales charge | | without | | with | | without | | with | | without | | with | | without | | with | | without | |
| 1-year | | | –0.85 | | | | –4.08 | | | | –1.58 | | | | –4.45 | | | | –1.24 | | | | –2.19 | | | | –0.74 | | | | –5.42 | | | | –0.59 | | |
| 5-year | | | 1.77 | | | | 0.78 | | | | 1.01 | | | | 1.01 | | | | 1.37 | | | | 1.37 | | | | 1.87 | | | | 0.88 | | | | 2.03 | | |
| 10-year | | | 3.24 | | | | 2.74 | | | | 2.64 | | | | 2.64 | | | | 2.86 | | | | 2.86 | | | | 3.30 | | | | 2.80 | | | | 3.45 | | |
The "with sales charge" returns include the maximum initial sales charge of 3.25% for Class A shares (for the 1-year period), 4.75% for Class A shares (for 5-year and 10-year periods) and 4.75% for Class T shares, respectively, the applicable contingent deferred sales charge of 3.00% in the first year, declining to 1.00% in the fourth year, and eliminated thereafter for Class B shares and 1.00% for Class C shares for the first year only. The "without sales charge" returns do not include the effect of sales charges. If they had, returns would be lower.
Prior to August 22, 2005, new purchases of Class A shares had a maximum initial sales charge of 4.75%.
Performance results reflect any fee waivers or reimbursements of fund expenses by the investment advisor and/or any of its affiliates. Absent these fee waivers or expense reimbursement arrangements, performance results would have been lower.
All results shown assume reinvestment of distributions. Class Z shares are sold at net asset value with no distribution and service (Rule 12b-1) fees. Class Z shares have limited eligibility and the investment minimum requirements may vary. Please see the fund's prospectus for details. Performance for different share classes will vary based on differences in sales charges and fees associated with each class.
The tables do not reflect the deduction of taxes that a shareholder may pay on fund distributions or on the redemption of fund shares.
Class A, Class B and Class C shares are newer classes of shares, initially offered on November 18, 2002. Their returns include returns of Retail A shares (for Class A shares) and Retail B shares (for Class B and Class C shares) of the Galaxy New Jersey Municipal Bond Fund (the "Galaxy New Jersey Fund") for periods prior to November 18, 2002 (adjusted, as applicable, to reflect the sales charges applicable to Class A, Class B and Class C shares). The returns shown for Class B and Class C shares also include the returns for Retail A shares (adjusted, as applicable, to reflect the sales charges applicable to Class B and Class C shares) for periods prior to the inception of Retail B shares of the Galaxy New Jersey Fund (March 1, 2001). The returns shown for Class T shares include the returns of Retail A shares of the Galaxy New Jersey Fund for periods prior to November 18, 2002. Retail A shares were initially offered on April 3, 199 8. The returns for Class Z shares include the returns of Trust shares of the Galaxy New Jersey Fund for periods prior to November 18, 2002. Trust shares were initially offered by the Galaxy New Jersey Fund on April 3, 1998. No returns have been restated to reflect any differences in expenses, such as distribution and service (Rule 12b-1) fees between any predecessor share class and the corresponding newer share class. If differences in expenses had been reflected, the returns shown for periods prior to the inception of the newer classes would have been lower.
18
Understanding Your Expenses – Columbia New Jersey Intermediate Municipal Bond Fund
As a fund shareholder, you incur two types of costs. There are transaction costs, which generally include sales charges on purchases and may include redemption fees or exchange fees. There are also ongoing costs, which generally include investment advisory fees, distribution and service (Rule 12b-1) fees and other fund expenses. The information on this page is intended to help you understand the ongoing costs of investing in the fund and to compare these costs with the ongoing costs of investing in other mutual funds.
Analyzing your fund's expenses by share class
To illustrate these ongoing costs, we have provided an example and calculated the expenses paid by investors in each share class during the period. The information in the following table is based on an initial investment of $1,000, which is invested at the beginning of the period and held for the entire period. Expense information is calculated two ways and each method provides you with different information. The amount listed in the "Actual" column is calculated using the fund's actual operating expenses and total return for the period. The amount listed in the "Hypothetical" column for each share class assumes that the return each year is 5% before expenses and is calculated based on the fund's actual operating expenses. You should not use the hypothetical account values and expenses to estimate either your actual account balance at the end of the period or the expenses you paid during this period.
Compare with other funds
Since all mutual funds are required to include the same hypothetical calculations about expenses in shareholder reports, you can use this information to compare the ongoing costs of investing in the fund with other funds. To do so, compare the 5% hypothetical example with the 5% hypothetical examples that appear in the shareholder reports of other funds. As you compare hypothetical examples of other funds, it is important to note that hypothetical examples are meant to highlight the ongoing costs of investing in a fund and do not reflect any transaction costs, such as sales charges, redemption fees or exchange fees.
Estimating your actual expenses
To estimate the expenses that you paid over the period, first you will need your account balance at the end of the period:
g For shareholders who receive their account statements from Columbia Management Services, Inc., your account balance is available online at www.columbiafunds.com or by calling Shareholder Services at 800.345.6611.
g For shareholders who receive their account statements from their financial intermediary, contact your financial intermediary to obtain your account balance.
1. Divide your ending account balance by $1,000. For example, if an account balance was $8,600 at the end of the period, the result would be 8.6.
2. In the section of the table below titled "Expenses paid during the period," locate the amount for your share class. You will find this number in the column labeled "Actual." Multiply this number by the result from step 1. Your answer is an estimate of the expenses you paid on your account during the period.
If the value of your account falls below the minimum initial investment requirement applicable to you, your account generally will be subject to a $20 annual fee. This fee is not included in the accompanying table. If you are subject to the fee, keep it in mind when you are estimating the ongoing expenses of investing in the fund and when comparing the expenses of this fund with other funds.
05/01/08 - 10/31/08
| | | Account value at the
beginning of the period ($) | | Account value at the
end of the period ($) | | Expenses paid
during the period ($) | | Fund's annualized
expense ratio (%) | |
| | | Actual | | Hypothetical | | Actual | | Hypothetical | | Actual | | Hypothetical | | Actual | |
| Class A | | | 1,000.00 | | | | 1,000.00 | | | | 969.28 | | | | 1,021.37 | | | | 3.71 | | | | 3.81 | | | | 0.75 | | |
| Class B | | | 1,000.00 | | | | 1,000.00 | | | | 965.71 | | | | 1,017.60 | | | | 7.41 | | | | 7.61 | | | | 1.50 | | |
| Class C | | | 1,000.00 | | | | 1,000.00 | | | | 967.42 | | | | 1,019.36 | | | | 5.69 | | | | 5.84 | | | | 1.15 | | |
| Class T | | | 1,000.00 | | | | 1,000.00 | | | | 969.79 | | | | 1,021.87 | | | | 3.22 | | | | 3.30 | | | | 0.65 | | |
| Class Z | | | 1,000.00 | | | | 1,000.00 | | | | 970.49 | | | | 1,022.62 | | | | 2.48 | | | | 2.54 | | | | 0.50 | | |
Expenses paid during the period are equal to the annualized expense ratio for the share class, multiplied by the average account value over the period, then multiplied by the number of days in the fund's most recent fiscal half-year and divided by 366.
Had the investment advisor and/or any of its affiliates not waived fees or reimbursed a portion of expenses, account value at the end of the period would have been reduced.
It is important to note that the expense amounts shown in the table are meant to highlight only ongoing costs of investing in the fund and do not reflect any transaction costs, such as sales charges, redemption fees or exchange fees. Therefore, the hypothetical examples provided may not help you determine the relative total costs of owning shares of different funds. If these transaction costs were included, your costs would have been higher.
19
Portfolio Manager's Report – Columbia New Jersey Intermediate Municipal Bond Fund
Performance data quoted represents past performance and current performance may be lower or higher. Past performance is no guarantee of future results. The investment return and principal value will fluctuate so that shares, when redeemed, may be worth more or less than the original cost. Please visit www.columbiafunds.com for daily and most recent month-end performance updates.
Net asset value per share
as of 10/31/08 ($)
| Class A | | | 9.55 | | |
| Class B | | | 9.55 | | |
| Class C | | | 9.55 | | |
| Class T | | | 9.55 | | |
| Class Z | | | 9.55 | | |
Distribution declared per share
11/01/07 – 10/31/08 ($)
| Class A | | | 0.37 | | |
| Class B | | | 0.30 | | |
| Class C | | | 0.33 | | |
| Class T | | | 0.38 | | |
| Class Z | | | 0.40 | | |
A portion of the fund's income may be subject to the alternative minimum tax. The fund may at times purchase tax-exempt securities at a discount. Some, or all, of this discount may be included in the fund's ordinary income, and is taxable when distributed.
30-day SEC yields
as of 10/31/08 (%)
| Class A | | | 3.40 | | |
| Class B | | | 2.83 | | |
| Class C | | | 3.17 | | |
| Class T | | | 3.49 | | |
| Class Z | | | 3.82 | | |
The 30-day SEC yields reflect the fund's earning power, net of expenses, expressed as an annualized percentage of the public offering price per share at the end of the period.
For the 12-month period that ended October 31, 2008, Class A shares of Columbia New Jersey Intermediate Municipal Bond Fund returned negative 1.64% without sales charge. Class Z shares returned negative 1.38%. By comparison, the Barclays Capital 3-15 Year Blend Municipal Bond Index1 (formerly the Lehman Brothers 3-15 Year Blend Municipal Bond Index) returned positive 0.53%, while the Lipper Other States Intermediate Municipal Debt Funds Classification2 had an average total return of negative 1.30%. The fund underperformed its benchmark, in general, because it had more exposure to bonds maturing in nine to 12 years. These positions detracted from returns as investors favored short-term bonds, which had less price volatility. We believe that the fund had slightly more exposure than the average fund in its peer group to lower quality investment-grade bonds, which accounted for its relative underperformance aga inst that measure.
On October 31, 2008, the fund's Class A shares had a 30-day SEC annualized yield of 3.40%. This equaled a taxable equivalent yield of 5.75% for shareholders in the 35.0% federal income tax bracket and taxed at the state's applicable state income tax rate. This tax rate does not reflect the phase out of exemptions or the reduction of the otherwise allowable deductions that occur when adjusted gross income exceeds certain levels.
Shorter-maturity, higher quality bonds led the municipal market
In an environment of high volatility and low liquidity, investors sought shelter in bonds with the highest quality and shortest maturities. By the end of the period, the number of high-quality bonds had fallen dramatically as a widening financial crisis threatened all aspects of the financial markets. The percentage of AAA-rated bonds in the index dropped from 65% in January to 32% in October, primarily because MBIA and AMBAC, two large municipal bond insurers, were downgraded by major credit agencies in June. Lower quality, longer-term securities were the weakest performers, with the worst performance coming from bonds with maturities of 12 to 17 years. Against this backdrop, the municipal market experienced selling pressure from mutual funds and hedge funds as the yield difference between higher and lower quality bonds widened and arbitrage trades became unprofitable.
While the fund had the vast majority of its assets invested in high quality bonds, we believe that it had more exposure than its peers to higher-yielding, lower rated investment-grade credits, particularly in the hospital sector. The fund's performance was also hurt by an above-average stake in bonds with maturities of nine years or longer. While we also held a significant stake in bonds maturing in two years or less, it was not enough to offset the underperformance of longer-term issues. On the plus side, about 20% of the fund's assets were in pre-refunded bonds, which are high quality issues that performed well. Pre-refunding occurs when an issuer takes advantage of lower interest rates by selling a new bond and investing the proceeds in short-term government
1The Barclays Capital 3-15 Year Blend Municipal Bond Index tracks the performance of municipal bonds issued after December 31, 1990 with remaining maturities between 2 and 17 years and at least $7 million in principal amount outstanding. Indices are not investments, do not incur fees or expenses and are not professionally managed. It is not possible to invest directly in an index. Securities in the fund may not match those in an index.
2Lipper Inc., a widely respected data provider in the industry, calculates an average total return (assuming reinvestment of distributions) for mutual funds with investment objectives similar to those of the fund. Lipper makes no adjustment for the effect of sales loads.
20
Portfolio Manager's Report (continued) – Columbia New Jersey Intermediate Municipal Bond Fund
securities to pay off the old, higher-yielding bonds at the earliest opportunity. In addition, the fund had no exposure to bonds subject to the alternative minimum tax (AMT), which aided performance because prices on bonds subject to the AMT declined as demand weakened and yields rose more than on other, comparable maturity municipal bonds.
Slowing economic growth undermines credit outlook
In spite of the state's diverse industrial base, we expect economic growth in New Jersey to continue slowing. The state's unemployment rate increased from 4.2% at the end of 2007 to 5.8% as jobs were lost in housing, manufacturing and financial services. These developments have continued to undermine the state's economic, population and tax revenue growth and, ultimately, its credit outlook. At the same time, New Jersey, like other states, is aggressively making adjustments to current spending as revenues fall short of projections. While cuts will be painful in some areas, we believe that timely political action now should help the state weather the downturn over the long term.
Portfolio holdings and characteristics are subject to change periodically and may not be representative of current holdings and characteristics. The outlook for this fund may differ from that presented for other Columbia Funds.
Tax-exempt bonds involve special risks. The value of the fund will be affected by interest rate changes and the creditworthiness of issues held in the fund. When interest rates go up, bond prices generally drop and vice versa.
Interest income from certain tax-exempt bonds may be subject to certain state and local taxes and, if applicable, the alternative minimum tax. Capital gains are not exempt from income taxes.
Single-state municipal bond funds pose additional risks due to limited geographical diversification.
Taxable-equivalent SEC yields
as of 10/31/08 (%)
| Class A | | | 5.75 | | |
| Class B | | | 4.78 | | |
| Class C | | | 5.36 | | |
| Class T | | | 5.90 | | |
| Class Z | | | 6.46 | | |
Taxable-equivalent SEC yields are based on the combined maximum effective 35.0% federal income tax rate and applicable state income tax rate. These tax rates do not reflect the phase out of exemptions or the reduction of the otherwise allowable deductions that occur when adjusted gross income exceeds certain levels.
Top 5 sectors
as of 10/31/08 (%)
| Refunded/Escrowed | | | 20.1 | | |
| Local General Obligations | | | 17.9 | | |
| State Appropriated | | | 14.9 | | |
| Water/Sewer | | | 9.3 | | |
| Special Non-Property Tax | | | 4.6 | | |
Sector breakdowns are calculated as a percentage of net assets.
Maturity breakdown
as of 10/31/08 (%)
| 0-1 year | | | 4.5 | | |
| 1-3 years | | | 14.5 | | |
| 3-5 years | | | 11.1 | | |
| 5-7 years | | | 10.6 | | |
| 7-10 years | | | 19.3 | | |
| 10-15 years | | | 19.8 | | |
| 15-20 years | | | 12.8 | | |
| 25+ years | | | 0.5 | | |
| Cash and Equivalents | | | 6.9 | | |
Quality breakdown
as of 10/31/08 (%)
| AAA | | | 29.5 | | |
| AA | | | 38.5 | | |
| A | | | 11.8 | | |
| BBB | | | 11.8 | | |
| Cash and Equivalents | | | 6.9 | | |
| Non-Rated | | | 1.5 | | |
Quality and maturity breakdowns are calculated as a percentage of net assets. Ratings shown in the quality breakdown represent the highest rating assigned to a particular bond by one of the following nationally recognized rating agencies: Standard & Poor's, Moody's Investors Service, Inc. or Fitch Ratings Ltd. Ratings are relative and subjective and are not absolute standards of quality. The fund's credit quality does not remove market risk.
The fund is actively managed and the composition of its portfolio will change over time.
21
Fund Profile – Columbia New York Intermediate Municipal Bond Fund
Performance data quoted represents past performance and current performance may be lower or higher. Past performance is no guarantee of future results. The investment return and principal value will fluctuate so that shares, when redeemed, may be worth more or less than the original cost. Please visit www.columbiafunds.com for daily and most recent month-end performance updates.
Summary
1-year return as of 10/31/08
| | –1.02% | |
|
 | | Class A shares
(without sales charge) | |
|
| | +0.53% | |
|
 | | Barclays Capital
3-15 Year Blend
Municipal Bond Index | |
|
Morningstar Style Box

The Morningstar Style Box reveals a fund's investment strategy. For fixed-income funds the vertical axis shows the average credit quality of the bonds owned, and the horizontal axis shows interest rate sensitivity as measured by a bond's duration (short, intermediate or long). All of these numbers are drawn from the data most recently provided by the fund and entered into Morningstar's database as of quarter-end. Although the data gathered is from reliable sources, Morningstar cannot guarantee its completeness and accuracy. Information shown is as of 06/30/08.
Summary
g For the 12-month period that ended October 31, 2008, the fund's Class A shares returned negative 1.02% without sales charge. Class Z shares returned negative 0.75%.
g The fund's return trailed its benchmark, the Barclays Capital 3-15 Year Blend Municipal Bond Index,1 but was ahead of the average return of its peer group, the Lipper New York Intermediate Municipal Debt Funds Classification.2
g The fund underperformed its benchmark primarily because it had more exposure to longer-maturity bonds, which were the period's weakest performers. We believe the fund's emphasis on higher quality securities helped it outperform the average fund in its peer group.
Portfolio Management
Brian M. McGreevy has managed the fund or its predecessors since September 1998 and has been associated with the advisor or its predecessors or affiliate organizations since 1994.
1The Barclays Capital 3-15 Year Blend Municipal Bond Index tracks the performance of municipal bonds issued after December 31, 1990 with remaining maturities between 2 and 17 years and at least $7 million in principal amount outstanding. Indices are not investments, do not incur fees or expenses and are not professionally managed. It is not possible to invest directly in an index. Securities in the fund may not match those in an index.
2Lipper Inc., a widely respected data provider in the industry, calculates an average total return (assuming reinvestment of distributions) for mutual funds with investment objectives similar to those of the fund. Lipper makes no adjustment for the effect of sales loads.
22
Performance Information – Columbia New York Intermediate Municipal Bond Fund
Growth of a $10,000 investment 11/01/98 – 10/31/08
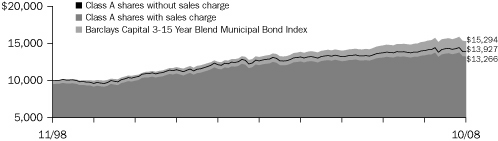 | |
|
The chart above shows the growth in value of a hypothetical $10,000 investment in Class A shares of Columbia New York Intermediate Municipal Bond Fund during the stated time period, and does not reflect the deduction of taxes that a shareholder may pay on fund distributions or on the redemption of fund shares. The Barclays Capital 3-15 Year Blend Municipal Bond Index (formerly the Lehman Brothers 3-15 Year Blend Municipal Bond Index) tracks the performance of municipal bonds issued after December 31, 1990 with remaining maturities between 2 and 17 years and at least $7 million in principal amount outstanding. Indices are not investments, do not incur fees or expenses and are not professionally managed. It is not possible to invest directly in an index. Securities in the fund may not match those in an index. The growth of a $10,000 investment with sales charge for Class A is calculated with an initial sales charge of 4.75%, which was the effective sales charge prior to August 22, 2005.
Performance of a $10,000 investment 11/01/98 – 10/31/08 ($)
| Sales charge | | without | | with | |
| Class A | | | 13,927 | | | | 13,266 | | |
| Class B | | | 13,162 | | | | 13,162 | | |
| Class C | | | 13,441 | | | | 13,441 | | |
| Class T | | | 14,008 | | | | 13,344 | | |
| Class Z | | | 14,246 | | | | n/a | | |
Average annual total return as of 10/31/08 (%)
| Share class | | A | | B | | C | | T | | Z | |
| Inception | | 11/25/02 | | 11/25/02 | | 11/25/02 | | 12/31/91 | | 12/31/91 | |
| Sales charge | | without | | with | | without | | with | | without | | with | | without | | with | | without | |
| 1-year | | | –1.02 | | | | –4.25 | | | | –1.74 | | | | –4.60 | | | | –1.40 | | | | –2.36 | | | | –0.90 | | | | –5.64 | | | | –0.75 | | |
| 5-year | | | 1.90 | | | | 0.92 | | | | 1.14 | | | | 1.14 | | | | 1.49 | | | | 1.49 | | | | 2.01 | | | | 1.02 | | | | 2.16 | | |
| 10-year | | | 3.37 | | | | 2.87 | | | | 2.79 | | | | 2.79 | | | | 3.00 | | | | 3.00 | | | | 3.43 | | | | 2.93 | | | | 3.60 | | |
Average annual total return as of 09/30/08 (%)
| Share class | | A | | B | | C | | T | | Z | |
| Sales charge | | without | | with | | without | | with | | without | | with | | without | | with | | without | |
| 1-year | | | –0.60 | | | | –3.85 | | | | –1.32 | | | | –4.20 | | | | –0.99 | | | | –1.95 | | | | –0.48 | | | | –5.24 | | | | –0.33 | | |
| 5-year | | | 1.76 | | | | 0.77 | | | | 1.00 | | | | 1.00 | | | | 1.35 | | | | 1.35 | | | | 1.86 | | | | 0.87 | | | | 2.01 | | |
| 10-year | | | 3.37 | | | | 2.87 | | | | 2.79 | | | | 2.79 | | | | 3.00 | | | | 3.00 | | | | 3.42 | | | | 2.93 | | | | 3.60 | | |
The "with sales charge" returns include the maximum initial sales charge of 3.25% for Class A shares (for the 1-year period), 4.75% for Class A shares (for 5-year and 10-year periods) and 4.75% for Class T shares, respectively, the applicable contingent deferred sales charge of 3.00% in the first year, declining to 1.00% in the fourth year, and eliminated thereafter for Class B shares and 1.00% for Class C shares for the first year only. The "without sales charge" returns do not include the effect of sales charges. If they had, returns would be lower.
Prior to August 22, 2005, new purchases of Class A shares had a maximum initial sales charge of 4.75%.
Performance results reflect any fee waivers or reimbursements of fund expenses by the investment advisor and/or any of its affiliates. Absent these fee waivers or expense reimbursement arrangements, performance results would have been lower.
All results shown assume reinvestment of distributions. Class Z shares are sold at net asset value with no distribution and service (Rule 12b-1) fees. Class Z shares have limited eligibility and the investment minimum requirements may vary. Please see the fund's prospectus for details. Performance for different share classes will vary based on differences in sales charges and fees associated with each class.
The tables do not reflect the deduction of taxes that a shareholder may pay on fund distributions or on the redemption of fund shares.
Class A, Class B and Class C shares are newer classes of shares, initially offered on November 25, 2002. Their returns include returns of Retail A shares (for Class A shares) and Retail B shares (for Class B and Class C shares) of the Galaxy New York Municipal Bond Fund (the "Galaxy New York Fund") for periods prior to November 25, 2002 (adjusted, as applicable, to reflect the sales charges applicable to Class A, Class B and Class C shares). The returns shown for Class B and Class C shares also include the returns for Retail A shares (adjusted, as applicable, to reflect the sales charges applicable to Class B and Class C shares) for periods prior to the inception of Retail B shares of the Galaxy New York Fund (March 1, 2001). The returns shown for Class T shares include the returns of Retail A shares of the Galaxy New York Fund for periods prior to November 25, 2002. Retail A shares were initially offered on December 31, 1991. T he returns for Class Z shares include the returns of Trust shares of the Galaxy New York Fund for periods prior to November 25, 2002. Trust shares were initially offered by the Galaxy New York Fund on December 31, 1991. No returns have been restated to reflect any differences in expenses, such as distribution and service (Rule 12b-1) fees between any predecessor share class and the corresponding newer share class. If differences in expenses had been reflected, the returns shown for periods prior to the inception of the newer classes would have been lower.
Performance data quoted represents past performance and current performance may be lower or higher. Past performance is no guarantee of future results. The investment return and principal value will fluctuate so that shares, when redeemed, may be worth more or less than the original cost. Please visit www.columbiafunds.com for daily and most recent month-end performance updates.
Annual operating expense ratio (%)*
| Class A | | | 0.98 | | |
| Class B | | | 1.73 | | |
| Class C | | | 1.73 | | |
| Class T | | | 0.88 | | |
| Class Z | | | 0.73 | | |
Annual operating expense ratio
after contractual waivers (%)*
| Class A | | | 0.75 | | |
| Class B | | | 1.50 | | |
| Class C | | | 1.50 | | |
| Class T | | | 0.65 | | |
| Class Z | | | 0.50 | | |
* The annual operating expense ratio and annual operating expense ratio after contractual waivers are as stated in the fund's prospectus that is current as of the date of this report. The contractual waiver expires 02/28/09. Differences in expense ratios disclosed elsewhere in this report may result from including fee waivers and expense reimbursements as well as different time periods used in calculating the ratios.
23
Understanding Your Expenses – Columbia New York Intermediate Municipal Bond Fund
Estimating your actual expenses
To estimate the expenses that you paid over the period, first you will need your account balance at the end of the period:
g For shareholders who receive their account statements from Columbia Management Services, Inc., your account balance is available online at www.columbiafunds.com or by calling Shareholder Services at 800.345.6611.
g For shareholders who receive their account statements from their financial intermediary, contact your financial intermediary to obtain your account balance.
1. Divide your ending account balance by $1,000. For example, if an account balance was $8,600 at the end of the period, the result would be 8.6.
2. In the section of the table below titled "Expenses paid during the period," locate the amount for your share class. You will find this number in the column labeled "Actual." Multiply this number by the result from step 1. Your answer is an estimate of the expenses you paid on your account during the period.
If the value of your account falls below the minimum initial investment requirement applicable to you, your account generally will be subject to a $20 annual fee. This fee is not included in the accompanying table. If you are subject to the fee, keep it in mind when you are estimating the ongoing expenses of investing in the fund and when comparing the expenses of this fund with other funds.
As a fund shareholder, you incur two types of costs. There are transaction costs, which generally include sales charges on purchases and may include redemption fees or exchange fees. There are also ongoing costs, which generally include investment advisory fees, distribution and service (Rule 12b-1) fees and other fund expenses. The information on this page is intended to help you understand the ongoing costs of investing in the fund and to compare these costs with the ongoing costs of investing in other mutual funds.
Analyzing your fund's expenses by share class
To illustrate these ongoing costs, we have provided an example and calculated the expenses paid by investors in each share class during the period. The information in the following table is based on an initial investment of $1,000, which is invested at the beginning of the period and held for the entire period. Expense information is calculated two ways and each method provides you with different information. The amount listed in the "Actual" column is calculated using the fund's actual operating expenses and total return for the period. The amount listed in the "Hypothetical" column for each share class assumes that the return each year is 5% before expenses and is calculated based on the fund's actual operating expenses. You should not use the hypothetical account values and expenses to estimate either your actual account balance at the end of the period or the expenses you paid during this period.
Compare with other funds
Since all mutual funds are required to include the same hypothetical calculations about expenses in shareholder reports, you can use this information to compare the ongoing costs of investing in the fund with other funds. To do so, compare the 5% hypothetical example with the 5% hypothetical examples that appear in the shareholder reports of other funds. As you compare hypothetical examples of other funds, it is important to note that hypothetical examples are meant to highlight the ongoing costs of investing in a fund and do not reflect any transaction costs, such as sales charges, redemption fees or exchange fees.
05/01/08 - 10/31/08
| | | Account value at the
beginning of the period ($) | | Account value at the
end of the period ($) | | Expenses paid
during the period ($) | | Fund's annualized
expense ratio (%) | |
| | | Actual | | Hypothetical | | Actual | | Hypothetical | | Actual | | Hypothetical | | Actual | |
| Class A | | | 1,000.00 | | | | 1,000.00 | | | | 972.40 | | | | 1,021.37 | | | | 3.72 | | | | 3.81 | | | | 0.75 | | |
| Class B | | | 1,000.00 | | | | 1,000.00 | | | | 968.78 | | | | 1,017.60 | | | | 7.42 | | | | 7.61 | | | | 1.50 | | |
| Class C | | | 1,000.00 | | | | 1,000.00 | | | | 970.49 | | | | 1,019.36 | | | | 5.70 | | | | 5.84 | | | | 1.15 | | |
| Class T | | | 1,000.00 | | | | 1,000.00 | | | | 972.90 | | | | 1,021.87 | | | | 3.22 | | | | 3.30 | | | | 0.65 | | |
| Class Z | | | 1,000.00 | | | | 1,000.00 | | | | 973.71 | | | | 1,022.62 | | | | 2.48 | | | | 2.54 | | | | 0.50 | | |
Expenses paid during the period are equal to the annualized expense ratio for the share class, multiplied by the average account value over the period, then multiplied by the number of days in the fund's most recent fiscal half-year and divided by 366.
Had the investment advisor and/or any of its affiliates not waived fees or reimbursed a portion of expenses, account value at the end of the period would have been reduced.
It is important to note that the expense amounts shown in the table are meant to highlight only ongoing costs of investing in the fund and do not reflect any transaction costs, such as sales charges, redemption fees or exchange fees. Therefore, the hypothetical examples provided may not help you determine the relative total costs of owning shares of different funds. If these transaction costs were included, your costs would have been higher.
24
Portfolio Manager's Report – Columbia New York Intermediate Municipal Bond Fund
For the 12-month period that ended October 31, 2008, Class A shares of Columbia New York Intermediate Municipal Bond Fund returned negative 1.02% without sales charge. Class Z shares returned negative 0.75%. By comparison, the Barclays Capital 3-15 Year Blend Municipal Bond Index1 (formerly the Lehman Brothers 3-15 Year Blend Municipal Bond Index) returned positive 0.53%, while the Lipper New York Intermediate Municipal Debt Funds Classification2 had an average total return of negative 1.14%. The fund underperformed its benchmark primarily because it had more exposure to longer-maturity bonds, which were the period's weakest performers. Several purchases of bonds in the 12- to 17-year maturity range were made late in the reporting period. They provided attractive yields; however, the move turned out to be premature as investors favored short-term bonds, with their lower price volatility, against a backdrop of weak economic news and a downward spiraling stock market. We believe that the fund did better than the average fund in its peer group, in part, because it had more exposure to higher quality securities, which performed well in a risk-averse market.
On May 5, 2008, Columbia New York Intermediate Municipal Bond Fund acquired the assets of New York Intermediate-Term Tax-Exempt Fund, a series of Excelsior Tax-Exempt Funds, Inc. Because the two funds had similar investment styles and portfolio holdings, the acquisition had minimal impact on the day-to-day operation of the fund.
On October 31, 2008, the fund's Class A shares had a 30-day SEC annualized yield of 3.51%. This equaled a taxable equivalent yield of 5.80% for shareholders in the 35.0% federal income tax bracket and taxed at the state's applicable state income tax rate. This tax rate does not reflect the phase out of exemptions or the reduction of the otherwise allowable deductions that occur when adjusted gross income exceeds certain levels.
Gains from shorter-maturity and higher quality bonds
In an environment of high volatility and low liquidity, investors sought shelter in bonds with the highest quality and shortest maturities. By the end of the period, the number of high-quality bonds had fallen dramatically as a widening financial crisis threatened all aspects of the financial markets. The percentage of AAA rated bonds in the index dropped from 65% in January to 32% in October, primarily because of the downgrades of MBIA and AMBAC, two large municipal bond insurers. Lower quality, longer-term securities were the weakest performers, with the worst performance coming from bonds with maturities of 12 to 17 years. Against this backdrop, the municipal market experienced significant selling pressure from mutual funds, insurance companies and arbitrage/hedge funds seeking to cover redemptions or to unwind unprofitable hedge trades and margin calls.
Mixed results from fund positioning
At a time of increased concern about the financial strength of many New York municipalities, the fund benefited from its holdings of AA and AAA rated bonds.
1The Barclays Capital 3-15 Year Blend Municipal Bond Index tracks the performance of municipal bonds issued after December 31, 1990 with remaining maturities between 2 and 17 years and at least $7 million in principal amount outstanding. Indices are not investments, do not incur fees or expenses and are not professionally managed. It is not possible to invest directly in an index. Securities in the fund may not match those in an index.
2Lipper Inc., a widely respected data provider in the industry, calculates an average total return (assuming reinvestment of distributions) for mutual funds with investment objectives similar to those of the fund. Lipper makes no adjustment for the effect of sales loads.
Performance data quoted represents past performance and current performance may be lower or higher. Past performance is no guarantee of future results. The investment return and principal value will fluctuate so that shares, when redeemed, may be worth more or less than the original cost. Please visit www.columbiafunds.com for daily and most recent month-end performance updates.
Net asset value per share
as of 10/31/08 ($)
| Class A | | | 11.03 | | |
| Class B | | | 11.03 | | |
| Class C | | | 11.03 | | |
| Class T | | | 11.03 | | |
| Class Z | | | 11.03 | | |
Distribution declared per share
11/01/07 – 10/31/08 ($)
| Class A | | | 0.40 | | |
| Class B | | | 0.32 | | |
| Class C | | | 0.36 | | |
| Class T | | | 0.41 | | |
| Class Z | | | 0.43 | | |
A portion of the fund's income may be subject to the alternative minimum tax. The fund may at times purchase tax-exempt securities at a discount. Some, or all, of this discount may be included in the fund's ordinary income, and is taxable when distributed.
30-day SEC yields
as of 10/31/08 (%)
| Class A | | | 3.51 | | |
| Class B | | | 2.94 | | |
| Class C | | | 3.29 | | |
| Class T | | | 3.60 | | |
| Class Z | | | 3.93 | | |
The 30-day SEC yields reflect the fund's earning power, net of expenses, expressed as an annualized percentage of the public offering price per share at the end of the period.
25
Portfolio Manager's Report (continued) – Columbia New York Intermediate Municipal Bond Fund
Taxable-equivalent SEC yields
as of 10/31/08 (%)
| Class A | | | 5.80 | | |
| Class B | | | 4.86 | | |
| Class C | | | 5.43 | | |
| Class T | | | 5.95 | | |
| Class Z | | | 6.49 | | |
Taxable-equivalent SEC yields are based on the combined maximum effective 35.0% federal income tax rate and applicable state income tax rate. These tax rates do not reflect the phase out of exemptions or the reduction of the otherwise allowable deductions that occur when adjusted gross income exceeds certain levels.
Top 5 sectors
as of 10/31/08 (%)
| Refunded/Escrowed | | | 18.7 | | |
| Special Non-Property Tax | | | 14.2 | | |
| Local General Obligations | | | 11.6 | | |
| State Appropriated | | | 9.4 | | |
| Education | | | 8.4 | | |
Sector breakdowns are calculated as a percentage of net assets.
Maturity breakdown
as of 10/31/08 (%)
| 0-1 year | | | 3.8 | | |
| 1-3 years | | | 14.9 | | |
| 3-5 years | | | 15.7 | | |
| 5-7 years | | | 10.6 | | |
| 7-10 years | | | 12.2 | | |
| 10-15 years | | | 29.9 | | |
| 15-20 years | | | 11.9 | | |
| 20-25 years | | | 0.9 | | |
| Cash and Equivalents | | | 0.1 | | |
Quality breakdown
as of 10/31/08 (%)
| AAA | | | 32.6 | | |
| AA | | | 52.4 | | |
| A | | | 7.9 | | |
| BBB | | | 5.5 | | |
| BB | | | 1.3 | | |
| Cash and Equivalents | | | 0.1 | | |
| Non-Rated | | | 0.2 | | |
Quality and maturity breakdowns are calculated as a percentage of net assets. Ratings shown in the quality breakdown represent the highest rating assigned to a particular bond by one of the following nationally recognized rating agencies: Standard & Poor's, Moody's Investors Service, Inc. or Fitch Ratings Ltd. Ratings are relative and subjective and are not absolute standards of quality. The fund's credit quality does not remove market risk.
The fund is actively managed and the composition of its portfolio will change over time.
Exposure to pre-refunded bonds, which accounted for 19% of the fund's assets, also aided performance because these high quality bonds outperformed many other sectors. Pre-refunding occurs when an issuer takes advantage of lower interest rates by selling a new bond and investing the proceeds in short-term government securities in order to pay off the previous, higher-yielding bond at the earliest opportunity. The fund had a relatively small exposure to bonds issued by Puerto Rico, which underperformed. That exposure increased when the fund merged during the period with New York Intermediate-Term Tax-Exempt Fund, a fund of approximately equal size to the fund. The fund had no exposure to bonds subject to the alternative minimum tax (AMT), which aided performance because prices on bonds subject to the AMT declined as demand weakened and yields rose more than on other, comparable maturity municipal bonds.
A decision to increase exposure to longer intermediate-term securities and to cut back on bonds with maturities in the zero to two-year range hurt performance as longer-term rates rose and short-term interest rates declined. In addition, exposure to the Niagara Indian casino detracted from performance, as legal issues associated with the facility drove yields up and prices down.
Cautious outlook for New York
New York normally accounts for 12% to 15% of new municipal issues nationwide and the state continued to generate a steady supply of new issues during the period. However, New York, like other states, has also experienced tremendous dislocation over the past 12 months. Between November 2007 and October 2008, the state's unemployment rate increased from 4.5% to 5.8% as jobs in housing, manufacturing and, most notably, financial services were lost. We believe that this economic slowdown will continue to put pressure on state and local governments. However, New York is aggressively making adjustments to current spending as revenues fall short of projections. While cuts will be painful in some areas, we believe that timely political action now should help the state weather the downturn over the long term. Going forward, we plan to maintain the fund's overall focus on higher quality bonds, while looking for opportunities in sectors or in maturities where we feel the value is greater than the market perceives.
Portfolio holdings and characteristics are subject to change periodically and may not be representative of current holdings and characteristics. The outlook for this fund may differ from that presented for other Columbia Funds.
Tax-exempt bonds involve special risks. The value of the fund will be affected by interest rate changes and the creditworthiness of issues held in the fund. When interest rates go up, bond prices generally drop and vice versa.
Interest income from certain tax-exempt bonds may be subject to certain state and local taxes and, if applicable, the alternative minimum tax. Capital gains are not exempt from income taxes.
The Fund is non-diversified, which generally means that it may invest a greater percentage of its total assets in the securities of fewer issuers than a "diversified" fund. This increases the risk that a change in the value of any one investment held by the Fund could affect the overall value of the Fund more than it would affect that of a diversified fund holding a greater number of investments. Accordingly, the Fund's value will likely be more volatile than the value of more diversified funds.
Single-state municipal bond funds pose additional risks due to limited geographical diversification.
26
Fund Profile – Columbia Rhode Island Intermediate Municipal Bond Fund
Summary
g For the 12-month period that ended October 31, 2008, the fund's Class A shares returned negative 1.16% without sales charge. Class Z shares returned negative 0.89%.
g The fund's return trailed its benchmark, the Barclays Capital 3-15 Year Blend Municipal Bond Index,1 but was ahead of the average return of its peer group, the Lipper Other States Intermediate Municipal Debt Funds Classification.2
g The fund underperformed its benchmark primarily because it had more exposure to longer-maturity bonds, which were the period's weakest performers. We believe the fund's emphasis on higher quality securities helped it outperform the average fund in its peer group.
Portfolio Management
Brian M. McGreevy has managed the fund or its predecessors since July 1997 and has been associated with the advisor or its predecessors or affiliate organizations since 1994.
1The Barclays Capital 3-15 Year Blend Municipal Bond Index tracks the performance of municipal bonds issued after December 31, 1990 with remaining maturities between 2 and 17 years and at least $7 million in principal amount outstanding. Indices are not investments, do not incur fees or expenses and are not professionally managed. It is not possible to invest directly in an index. Securities in the fund may not match those in an index.
2Lipper Inc., a widely respected data provider in the industry, calculates an average total return (assuming reinvestment of distributions) for mutual funds with investment objectives similar to those of the fund. Lipper makes no adjustment for the effect of sales loads.
Performance data quoted represents past performance and current performance may be lower or higher. Past performance is no guarantee of future results. The investment return and principal value will fluctuate so that shares, when redeemed, may be worth more or less than the original cost. Please visit www.columbiafunds.com for daily and most recent month-end performance updates.
Summary
1-year return as of 10/31/08
| | –1.16% | |
|
 | | Class A shares
(without sales charge) | |
|
| | +0.53% | |
|
 | | Barclays Capital
3-15 Year Blend
Municipal Bond Index | |
|
Morningstar Style Box

The Morningstar Style Box reveals a fund's investment strategy. For fixed-income funds the vertical axis shows the average credit quality of the bonds owned, and the horizontal axis shows interest rate sensitivity as measured by a bond's duration (short, intermediate or long). All of these numbers are drawn from the data most recently provided by the fund and entered into Morningstar's database as of quarter-end. Although the data gathered is from reliable sources, Morningstar cannot guarantee its completeness and accuracy. Information shown is as of 06/30/08.
27
Performance Information – Columbia Rhode Island Intermediate Municipal Bond Fund
Performance data quoted represents past performance and current performance may be lower or higher. Past performance is no guarantee of future results. The investment return and principal value will fluctuate so that shares, when redeemed, may be worth more or less than the original cost. Please visit www.columbiafunds.com for daily and most recent month-end performance updates.
Annual operating expense ratio (%)*
| Class A | | | 1.03 | | |
| Class B | | | 1.78 | | |
| Class C | | | 1.78 | | |
| Class T | | | 0.78 | | |
| Class Z | | | 0.78 | | |
Annual operating expense ratio
after contractual waivers (%)*
| Class A | | | 0.75 | | |
| Class B | | | 1.50 | | |
| Class C | | | 1.50 | | |
| Class T | | | 0.50 | | |
| Class Z | | | 0.50 | | |
* The annual operating expense ratio and annual operating expense ratio after contractual waivers are as stated in the fund's prospectus that is current as of the date of this report. The contractual waiver expires 02/28/09. Differences in expense ratios disclosed elsewhere in this report may result from including fee waivers and expense reimbursements as well as different time periods used in calculating the ratios.
Growth of a $10,000 investment 11/01/98 – 10/31/08
 | |
|
The chart above shows the growth in value of a hypothetical $10,000 investment in Class A shares of Columbia Rhode Island Intermediate Municipal Bond Fund during the stated time period, and does not reflect the deduction of taxes that a shareholder may pay on fund distributions or on the redemption of fund shares. The Barclays Capital 3-15 Year Blend Municipal Bond Index (formerly the Lehman Brothers 3-15 Year Blend Municipal Bond Index) tracks the performance of municipal bonds issued after December 31, 1990 with remaining maturities between 2 and 17 years and at least $7 million in principal amount outstanding. Indices are not investments, do not incur fees or expenses and are not professionally managed. It is not possible to invest directly in an index. Securities in the fund may not match those in an index. The growth of a $10,000 investment with sales charge for Class A is calculated with an initial sales charge of 4.75%, w hich was the effective sales charge prior to August 22, 2005.
Performance of a $10,000 investment 11/01/98 – 10/31/08 ($)
| Sales charge | | without | | with | |
| Class A | | | 13,927 | | | | 13,262 | | |
| Class B | | | 13,125 | | | | 13,125 | | |
| Class C | | | 13,401 | | | | 13,401 | | |
| Class T | | | 14,133 | | | | 13,459 | | |
| Class Z | | | 14,140 | | | | n/a | | |
Average annual total return as of 10/31/08 (%)
| Share class | | A | | B | | C | | T | | Z | |
| Inception | | 11/18/02 | | 11/18/02 | | 11/18/02 | | 12/20/94 | | 06/19/00 | |
| Sales charge | | without | | with | | without | | with | | without | | with | | without | | with | | without | |
| 1-year | | | –1.16 | | | | –4.36 | | | | –1.88 | | | | –4.74 | | | | –1.54 | | | | –2.49 | | | | –0.89 | | | | –5.59 | | | | –0.89 | | |
| 5-year | | | 1.87 | | | | 0.89 | | | | 1.12 | | | | 1.12 | | | | 1.47 | | | | 1.47 | | | | 2.13 | | | | 1.15 | | | | 2.13 | | |
| 10-year | | | 3.37 | | | | 2.86 | | | | 2.76 | | | | 2.76 | | | | 2.97 | | | | 2.97 | | | | 3.52 | | | | 3.02 | | | | 3.52 | | |
Average annual total return as of 09/30/08 (%)
| Share class | | A | | B | | C | | T | | Z | |
| Sales charge | | without | | with | | without | | with | | without | | with | | without | | with | | without | |
| 1-year | | | –0.73 | | | | –3.95 | | | | –1.46 | | | | –4.33 | | | | –1.12 | | | | –2.08 | | | | –0.47 | | | | –5.19 | | | | –0.47 | | |
| 5-year | | | 1.74 | | | | 0.75 | | | | 0.99 | | | | 0.99 | | | | 1.34 | | | | 1.34 | | | | 2.00 | | | | 1.01 | | | | 2.00 | | |
| 10-year | | | 3.37 | | | | 2.86 | | | | 2.76 | | | | 2.76 | | | | 2.97 | | | | 2.97 | | | | 3.52 | | | | 3.01 | | | | 3.52 | | |
The "with sales charge" returns include the maximum initial sales charge of 3.25% for Class A shares (for the 1-year period), 4.75% for Class A shares (for the 5-year and 10-year periods) and 4.75% for Class T shares, respectively, the applicable contingent deferred sales charge of 3.00% in the first year, declining to 1.00% in the fourth year and eliminated thereafter for Class B shares and 1.00% for Class C shares for the first year only. The "without sales charge" returns do not include the effect of sales charges. If they had, returns would be lower.
Prior to August 22, 2005, new purchases of Class A shares had a maximum initial sales charge of 4.75%.
Performance results reflect any fee waivers or reimbursements of fund expenses by the investment advisor and/or any of its affiliates. Absent these fee waivers or expense reimbursement arrangements, performance results would have been lower.
All results shown assume reinvestment of distributions. Class Z shares are sold at net asset value with no distribution and service (Rule 12b-1) fees. Class Z shares have limited eligibility and the investment minimum requirements may vary. Please see the fund's prospectus for details. Performance for different share classes will vary based on differences in sales charges and fees associated with each class.
The tables do not reflect the deduction of taxes that a shareholder may pay on fund distributions or on the redemption of fund shares.
Class A, Class B, and Class C shares are newer classes of shares, initially offered on November 18, 2002. Their returns include returns of Retail A shares (for Class A shares) and Retail B shares (for Class B and Class C shares) of the Galaxy Rhode Island Municipal Bond Fund (the "Galaxy Rhode Island Fund") for periods prior to November 18, 2002 (adjusted, as applicable, to reflect the sales charges applicable to Class A, Class B and Class C shares). The returns shown for Class B and Class C shares also include the returns for Retail A shares (adjusted, as applicable, to reflect the sales charges applicable to Class B and Class C shares) for periods prior to inception of Retail B shares of the Galaxy Rhode Island Fund (March 1, 2001). The returns shown for Class T shares include the returns of Retail A shares of the Galaxy Rhode Island Fund for periods prior to November 18, 2002. Retail A shares were initially offered on Decembe r 20, 1994. The returns for Class Z shares include returns of Trust shares of the Galaxy Rhode Island Fund for periods prior to November 18, 2002, and the returns of Retail A shares of the Galaxy Rhode Island Fund for periods prior to June 19, 2000, the date on which Trust shares were initially offered by the Galaxy Rhode Island Fund. No returns have been restated to reflect any differences in expenses such as distribution and service (Rule 12b-1) fees between any predecessor share class and the corresponding newer share class. If differences in expenses had been reflected, the returns shown for periods prior to the inception of the newer classes would have been lower.
28
Understanding Your Expenses – Columbia Rhode Island Intermediate Municipal Bond Fund
As a fund shareholder, you incur two types of costs. There are transaction costs, which generally include sales charges on purchases and may include redemption fees or exchange fees. There are also ongoing costs, which generally include investment advisory fees, distribution and service (Rule 12b-1) fees and other fund expenses. The information on this page is intended to help you understand the ongoing costs of investing in the fund and to compare these costs with the ongoing costs of investing in other mutual funds.
Analyzing your fund's expenses by share class
To illustrate these ongoing costs, we have provided an example and calculated the expenses paid by investors in each share class during the period. The information in the following table is based on an initial investment of $1,000, which is invested at the beginning of the period and held for the entire period. Expense information is calculated two ways and each method provides you with different information. The amount listed in the "Actual" column is calculated using the fund's actual operating expenses and total return for the period. The amount listed in the "Hypothetical" column for each share class assumes that the return each year is 5% before expenses and is calculated based on the fund's actual operating expenses. You should not use the hypothetical account values and expenses to estimate either your actual account balance at the end of the period or the expenses you paid during this period.
Compare with other funds
Since all mutual funds are required to include the same hypothetical calculations about expenses in shareholder reports, you can use this information to compare the ongoing costs of investing in the fund with other funds. To do so, compare the 5% hypothetical example with the 5% hypothetical examples that appear in the shareholder reports of other funds. As you compare hypothetical examples of other funds, it is important to note that hypothetical examples are meant to highlight the ongoing costs of investing in a fund and do not reflect any transaction costs, such as sales charges, redemption fees or exchange fees.
Estimating your actual expenses
To estimate the expenses that you paid over the period, first you will need your account balance at the end of the period:
g For shareholders who receive their account statements from Columbia Management Services, Inc., your account balance is available online at www.columbiafunds.com or by calling Shareholder Services at 800.345.6611.
g For shareholders who receive their account statements from their financial intermediary, contact your financial intermediary to obtain your account balance.
1. Divide your ending account balance by $1,000. For example, if an account balance was $8,600 at the end of the period, the result would be 8.6.
2. In the section of the table below titled "Expenses paid during the period," locate the amount for your share class. You will find this number in the column labeled "Actual." Multiply this number by the result from step 1. Your answer is an estimate of the expenses you paid on your account during the period.
If the value of your account falls below the minimum initial investment requirement applicable to you, your account generally will be subject to a $20 annual fee. This fee is not included in the accompanying table. If you are subject to the fee, keep it in mind when you are estimating the ongoing expenses of investing in the fund and when comparing the expenses of this fund with other funds.
05/01/08 - 10/31/08
| | | Account value at the
beginning of the period ($) | | Account value at the
end of the period ($) | | Expenses paid
during the period ($) | | Fund's annualized
expense ratio (%) | |
| | | Actual | | Hypothetical | | Actual | | Hypothetical | | Actual | | Hypothetical | | Actual | |
| Class A | | | 1,000.00 | | | | 1,000.00 | | | | 972.80 | | | | 1,021.37 | | | | 3.72 | | | | 3.81 | | | | 0.75 | | |
| Class B | | | 1,000.00 | | | | 1,000.00 | | | | 969.08 | | | | 1,017.60 | | | | 7.42 | | | | 7.61 | | | | 1.50 | | |
| Class C | | | 1,000.00 | | | | 1,000.00 | | | | 970.79 | | | | 1,019.36 | | | | 5.70 | | | | 5.84 | | | | 1.15 | | |
| Class T | | | 1,000.00 | | | | 1,000.00 | | | | 974.01 | | | | 1,022.62 | | | | 2.48 | | | | 2.54 | | | | 0.50 | | |
| Class Z | | | 1,000.00 | | | | 1,000.00 | | | | 974.01 | | | | 1,022.62 | | | | 2.48 | | | | 2.54 | | | | 0.50 | | |
Expenses paid during the period are equal to the annualized expense ratio for the share class, multiplied by the average account value over the period, then multiplied by the number of days in the fund's most recent fiscal half-year and divided by 366.
Had the investment advisor and/or any of its affiliates not waived fees or reimbursed a portion of expenses, account value at the end of the period would have been reduced.
It is important to note that the expense amounts shown in the table are meant to highlight only ongoing costs of investing in the fund and do not reflect any transaction costs, such as sales charges, redemption fees or exchange fees. Therefore, the hypothetical examples provided may not help you determine the relative total costs of owning shares of different funds. If these transaction costs were included, your costs would have been higher.
29
Portfolio Manager's Report – Columbia Rhode Island Intermediate Municipal Bond Fund
Performance data quoted represents past performance and current performance may be lower or higher. Past performance is no guarantee of future results. The investment return and principal value will fluctuate so that shares, when redeemed, may be worth more or less than the original cost. Please visit www.columbiafunds.com for daily and most recent month-end performance updates.
Net asset value per share
as of 10/31/08 ($)
| Class A | | | 10.52 | | |
| Class B | | | 10.52 | | |
| Class C | | | 10.52 | | |
| Class T | | | 10.52 | | |
| Class Z | | | 10.52 | | |
Distributions declared per share
11/01/07 – 10/31/08 ($)
| Class A | | | 0.41 | | |
| Class B | | | 0.33 | | |
| Class C | | | 0.37 | | |
| Class T | | | 0.44 | | |
| Class Z | | | 0.44 | | |
A portion of the fund's income tax may be subject to the alternative minimum tax. The fund may at times purchase tax-exempt securities at a discount. Some, or all, of this discount may be included in the fund's ordinary income, and is taxable when distributed.
30-day SEC yields
as of 10/31/08 (%)
| Class A | | | 3.61 | | |
| Class B | | | 3.05 | | |
| Class C | | | 3.40 | | |
| Class T | | | 3.85 | | |
| Class Z | | | 4.04 | | |
The 30-day SEC yields reflect the fund's earning power net of expenses, expressed as an annualized percentage of the public offering price per share at the end of the period.
For the 12-month period that ended October 31, 2008, Class A shares of Columbia Rhode Island Intermediate Municipal Bond Fund returned negative 1.16% without sales charge. Class Z shares returned negative 0.89%. By comparison, the Barclays Capital 3-15 Year Blend Municipal Bond Index1 (formerly the Lehman Brothers 3-15 Year Blend Municipal Bond Index) returned positive 0.53%, while the Lipper Other States Intermediate Municipal Debt Funds Classification2 had an average total return of negative 1.30%.
The fund underperformed its benchmark primarily because it had more exposure to longer-maturity bonds, which were the period's weakest performers. Several purchases of longer-term bonds were made late in the reporting period. They provided attractive yields; however, the move turned out to be premature as interest rates rose across all maturities in response to the Lehman Brothers bankruptcy and dislocations in the financial markets. The fund was also hurt when Financial Security Assurance, Inc., a large municipal bond insurer, was put on negative credit watch by the major credit rating agencies. We believe that the fund did better than the average fund in its peer group because it had more exposure to higher quality securities, which performed well in a risk-averse market.
On October 31, 2008, the fund's Class A shares had a 30-day SEC annualized yield of 3.61%. This equaled a taxable equivalent yield of 6.16% for shareholders in the 35.0% federal income tax bracket and taxed at the state's applicable state income tax rate. This tax rate does not reflect the phase out of exemptions or the reduction of the otherwise allowable deductions that occur when adjusted gross income exceeds certain levels.
Gains from shorter-maturity and higher quality bonds
In an environment of high volatility and low liquidity, investors sought shelter in bonds with the highest quality and shortest maturities. By the end of the period, the number of high-quality bonds had fallen dramatically as a widening financial crisis threatened all aspects of the financial markets. The percentage of AAA-rated bonds in the index dropped from 65% in January to 32% in October primarily because of the downgrades of MBIA and AMBAC, two large municipal bond insurers. Lower quality, longer-term securities were the weakest performers, with the worst performance coming from bonds with maturities of 12 to 17 years. Against this backdrop, the municipal market experienced significant selling pressure from mutual funds, insurance companies and arbitrage/hedge funds seeking to cover redemptions or to unwind unprofitable hedge trades and margin calls.
Gains from high quality and pre-refunded bonds
At a time when the supply of new issues from Rhode Island was light— not unusual for a small state—the fund benefited from the overall quality of its portfolio, which we
1The Barclays Capital 3-15 Year Blend Municipal Bond Index tracks the performance of municipal bonds issued after December 31, 1990 with remaining maturities between 2 and 17 years and at least $7 million in principal amount outstanding. Indices are not investments, do not incur fees or expenses and are not professionally managed. It is not possible to invest directly in an index. Securities in the fund may not match those in an index.
2Lipper Inc., a widely respected data provider in the industry, calculates an average total return (assuming reinvestment of distributions) for mutual funds with investment objectives similar to those of the fund. Lipper makes no adjustment for the effect of sales loads.
30
Portfolio Manager's Report (continued) – Columbia Rhode Island Intermediate Municipal Bond Fund
believe was higher than that of its peer group, as well as its 20% stake in pre-refunded bonds. Pre-refunding occurs when an issuer takes advantage of lower interest rates by selling a new bond, then investing the proceeds in short-term U.S. government securities and paying off the old, higher-yielding bonds at the earliest opportunity. The fund had no exposure to bonds subject to the alternative minimum tax (AMT), which aided performance because prices on bonds subject to the AMT declined as demand weakened and yields rose more than on other, comparable maturity municipal bonds.
Greater exposure to insured bonds
During the period, we added an insured general-obligation issue from Cranston, Rhode Island, which hampered the fund's return later in the period when the insurer's credit rating was placed on credit watch with negative implications. Many of the bonds issued in Rhode Island come with insurance, and the fund holds a greater percentage of insured bonds than its benchmark or its peer group.
Weak economy calls for cautious approach
We believe that a slowing economy and continued downward pressure by the Federal Reserve Board on short-term lending rates have the potential to bring yields down and prices up on municipal bonds over time. However, the overall health of the Rhode Island economy is weaker than many other states: Unemployment is rising, population growth is zero to declining and the housing sector continues to feel pressures. Given these factors, we do not expect Rhode Island to make a quick recovery. We plan to continue to monitor developments in the state and maintain diversification across sectors and issuers. We will also try to minimize exposure to issuers that we feel may face additional negative credit pressures.
Portfolio holdings and characteristics are subject to change periodically and may not be representative of current holdings and characteristics. The outlook for this fund may differ from that presented for other Columbia Funds.
Tax-exempt bonds involve special risks. The value of the fund will be affected by interest rate changes and the creditworthiness of issues held in the fund. When interest rates go up, bond prices generally drop and vice versa.
Interest income from certain tax-exempt bonds may be subject to certain state and local taxes and, if applicable, the alternative minimum tax. Capital gains are not exempt from income taxes.
The Fund is non-diversified, which generally means that it may invest a greater percentage of its total assets in the securities of fewer issuers than a "diversified" fund. This increases the risk that a change in the value of any one investment held by the Fund could affect the overall value of the Fund more than it would affect that of a diversified fund holding a greater number of investments. Accordingly, the Fund's value will likely be more volatile than the value of more diversified funds.
Single-state municipal bond funds pose additional risks due to limited geographical diversification.
Taxable-equivalent SEC yields
as of 10/31/08 (%)
| Class A | | | 6.16 | | |
| Class B | | | 5.21 | | |
| Class C | | | 5.81 | | |
| Class T | | | 6.57 | | |
| Class Z | | | 6.90 | | |
Taxable-equivalent SEC yields are based on the combined maximum effective 35.0% federal income tax rate and applicable state income tax rate. These tax rates do not reflect the phase out of exemptions or the reduction of the otherwise allowable deductions that occur when adjusted gross income exceeds certain levels.
Top 5 sectors
as of 10/31/08 (%)
| Refunded/Escrowed | | | 20.5 | | |
| Education | | | 15.6 | | |
| Local General Obligations | | | 15.4 | | |
| Local Appropriated | | | 11.3 | | |
| State General Obligations | | | 7.2 | | |
Sector breakdowns are calculated as a percentage of net assets.
Maturity breakdown
as of 10/31/08 (%)
| 0-1 year | | | 3.3 | | |
| 1-3 years | | | 13.2 | | |
| 3-5 years | | | 13.0 | | |
| 5-7 years | | | 13.5 | | |
| 7-10 years | | | 15.0 | | |
| 10-15 years | | | 24.9 | | |
| 15-20 years | | | 13.0 | | |
| 20-25 years | | | 1.6 | | |
| Cash & Equivalents | | | 2.5 | | |
Quality breakdown
as of 10/31/08 (%)
| AAA | | | 40.0 | | |
| AA | | | 44.2 | | |
| A | | | 8.3 | | |
| BBB | | | 4.4 | | |
| Cash & Equivalents | | | 2.5 | | |
| Non-Rated | | | 0.6 | | |
Quality and maturity breakdowns are calculated as a percentage of net assets. Ratings shown in the quality breakdown represent the highest rating assigned to a particular bond by one of the following nationally recognized rating agencies: Standard & Poor's, Moody's Investors Service, Inc. or Fitch Ratings Ltd. Ratings are relative and subjective and are not absolute standards of quality. The fund's credit quality does not remove market risk.
The fund is actively managed and the composition of its portfolio will change over time.
31
Investment Portfolio – Columbia Connecticut Intermediate Municipal Bond Fund
October 31, 2008
| Municipal Bonds – 92.1% | |
| | | Par ($) | | Value ($) | |
| Education – 11.0% | |
| Education – 9.0% | |
| CT Health & Educational Facilities Authority | |
| Connecticut College: | |
Series 2002 E,
Insured: MBIA:
5.000% 07/01/14 | | | 500,000 | | | | 523,810 | | |
| 5.250% 07/01/22 | | | 400,000 | | | | 396,892 | | |
Series 2007 F,
Insured: MBIA
4.125% 07/01/24 | | | 1,505,000 | | | | 1,247,193 | | |
Series 2008 N:
5.000% 07/01/18 | | | 2,120,000 | | | | 2,089,536 | | |
| 5.000% 07/01/22 | | | 2,500,000 | | | | 2,341,975 | | |
| Quinnipiac University: | |
Series 2007 I,
Insured: MBIA:
5.000% 07/01/19 | | | 2,000,000 | | | | 1,952,240 | | |
| 5.000% 07/01/22 | | | 2,000,000 | | | | 1,882,660 | | |
Series 2007 K2,
Insured: MBIA
5.000% 07/01/28 | | | 2,000,000 | | | | 1,794,120 | | |
| Trinity College: | |
Series 1998 F,
Insured: MBIA
5.500% 07/01/21 | | | 500,000 | | | | 513,750 | | |
Series 2004 H,
Insured: MBIA
5.000% 07/01/25 | | | 540,000 | | | | 518,135 | | |
| Yale University, | |
Series 1997 E,
4.700% 07/01/29 | | | 2,000,000 | | | | 1,865,000 | | |
| CT University of Connecticut | |
| Student Fee, | |
Series 2002 A,
5.250% 05/15/14 | | | 1,185,000 | | | | 1,244,534 | | |
PR Commonwealth of Puerto Rico Industrial,
Tourist, Educational, Medical & Environmental
Control Facilities | |
| Universidad Interamericana de Puerto Rico, Inc., | |
Series 1998 A,
Insured: MBIA:
5.250% 10/01/12 | | | 725,000 | | | | 739,921 | | |
| 5.375% 10/01/13 | | | 975,000 | | | | 997,298 | | |
| 5.500% 10/01/14 | | | 650,000 | | | | 664,541 | | |
| Education Total | | | 18,771,605 | | |
| | | Par ($) | | Value ($) | |
| Prep School – 2.0% | |
CT Health & Educational Facilities
Authority | |
| Greenwich Academy, Inc., | |
Series 2007 E,
Insured: FSA
5.250% 03/01/26 | | | 2,000,000 | | | | 1,935,480 | | |
| Loomis Chaffee School, | |
Series 2005 F,
Insured: AMBAC
5.250% 07/01/27 | | | 1,670,000 | | | | 1,656,139 | | |
| Miss Porter's School, | |
Series 2006 B,
Insured: AMBAC
4.500% 07/01/29 | | | 600,000 | | | | 514,872 | | |
| Prep School Total | | | 4,106,491 | | |
| Education Total | | | 22,878,096 | | |
| Health Care – 4.3% | |
| Continuing Care Retirement – 0.2% | |
| CT Development Authority | |
| Elim Park Baptist, Inc., | |
Series 2003,
5.750% 12/01/23 | | | 500,000 | | | | 440,230 | | |
| Continuing Care Retirement Total | | | 440,230 | | |
| Hospitals – 3.3% | |
| CT Health & Educational Facilities Authority | |
| Hospital For Special Care, | |
Series 2007 C,
Insured: RAD
5.250% 07/01/27 | | | 750,000 | | | | 570,735 | | |
| Hospital for St. Raphael, | |
Series 1993 H,
Insured: AMBAC
5.300% 07/01/10 | | | 2,740,000 | | | | 2,760,687 | | |
| Middlesex Hospital, | |
Series 1997 H,
Insured: MBIA
5.000% 07/01/12 | | | 1,060,000 | | | | 1,042,531 | | |
| Middlesex Hospital, | |
Series 2008 M,
Insured: FSA
4.875% 07/01/27 | | | 500,000 | | | | 449,965 | | |
| William W. Backus Hospital, | |
Series 2005 G,
Insured: FSA
5.000% 07/01/24 | | | 2,060,000 | | | | 1,971,379 | | |
| Hospitals Total | | | 6,795,297 | | |
See Accompanying Notes to Financial Statements.
32
Columbia Connecticut Intermediate Municipal Bond Fund
October 31, 2008
| Municipal Bonds (continued) | |
| | | Par ($) | | Value ($) | |
| Intermediate Care Facilities – 0.1% | |
| CT Health & Educational Facilities Authority | |
| Village for Families & Children, Inc., | |
Series 2002 A,
Insured: AMBAC
5.000% 07/01/23 | | | 260,000 | | | | 209,290 | | |
| Intermediate Care Facilities Total | | | 209,290 | | |
| Nursing Homes – 0.7% | |
| CT Development Authority Health Facility | |
| Alzheimers Resource Center, Inc., | |
Series 2007,
5.200% 08/15/17 | | | 1,285,000 | | | | 1,039,256 | | |
| 5.400% 08/15/21 | | | 500,000 | | | | 376,050 | | |
| Nursing Homes Total | | | 1,415,306 | | |
| Health Care Total | | | 8,860,123 | | |
| Housing – 6.1% | |
| Multi-Family – 0.7% | |
PR Commonwealth of Puerto Rico Housing
Finance Authority | |
| Series 2008, | |
| 5.000% 12/01/13 | | | 1,300,000 | | | | 1,354,366 | | |
| Multi-Family Total | | | 1,354,366 | | |
| Single-Family – 5.4% | |
| CT Housing Finance Authority | |
| Mortgage Finance Program: | |
Series 1996 C-1,
6.000% 11/15/10 | | | 815,000 | | | | 844,332 | | |
Series 2005 D-1,
4.100% 05/15/17 | | | 2,200,000 | | | | 2,041,116 | | |
Series 2008 B-1,
4.750% 11/15/23 | | | 3,000,000 | | | | 2,697,840 | | |
| Refunding Housing Mortgage Finance Program, | |
Series 2003 D,
4.400% 11/15/15 | | | 2,000,000 | | | | 1,945,200 | | |
Series 2003 C-1,
4.850% 11/15/23 | | | 4,000,000 | | | | 3,696,880 | | |
| Single-Family Total | | | 11,225,368 | | |
| Housing Total | | | 12,579,734 | | |
| Industrials – 0.3% | |
| Oil & Gas – 0.3% | |
| TN Energy Acquisition Corp. | |
| Series 2006, | |
| 5.250% 09/01/22 | | | 850,000 | | | | 619,336 | | |
| Oil & Gas Total | | | 619,336 | | |
| Industrials Total | | | 619,336 | | |
| | | Par ($) | | Value ($) | |
| Other – 18.3% | |
| Other – 0.2% | |
PR Commonwealth of Puerto Rico
Government Development Bank | |
| Series 2006 B, | |
| 5.000% 12/01/14 | | | 360,000 | | | | 355,680 | | |
| Other Total | | | 355,680 | | |
| Pool/Bond Bank – 1.5% | |
| CT Revolving Fund | |
| Series 2003 A, | |
| 5.000% 10/01/19 | | | 1,000,000 | | | | 1,018,710 | | |
| Series 2003 B: | |
| 5.000% 10/01/12 | | | 1,000,000 | | | | 1,065,360 | | |
| 5.000% 10/01/15 | | | 1,000,000 | | | | 1,070,790 | | |
| Pool/Bond Bank Total | | | 3,154,860 | | |
| Refunded/Escrowed (a) – 16.6% | |
| CT Bridgeport | |
| Series 2000 A, | |
Pre-refunded 07/15/10,
Insured: FGIC
6.000% 07/15/13 | | | 2,000,000 | | | | 2,143,900 | | |
| CT Clean Water Fund | |
| Series 1993, | |
Escrowed to Maturity,
6.000% 10/01/12 | | | 1,200,000 | | | | 1,277,232 | | |
| Series 1999, | |
Pre-refunded 07/15/09,
5.250% 07/15/11 | | | 1,500,000 | | | | 1,552,650 | | |
| CT Fairfield | |
| Series 2002 A, | |
Pre-refunded 04/01/12,
5.000% 04/01/22 | | | 2,200,000 | | | | 2,344,760 | | |
| CT Health & Educational Facilities Authority | |
| Connecticut College, | |
Series 2000 D-1,
Pre-refunded 07/01/10,
Insured: MBIA
5.750% 07/01/30 | | | 1,250,000 | | | | 1,329,338 | | |
| Fairfield University, | |
Series 1999 I,
Pre-refunded 07/01/09,
Insured: MBIA
5.250% 07/01/25 | | | 2,000,000 | | | | 2,054,800 | | |
| Trinity College, | |
Series 2001 G,
Pre-refunded 07/01/11,
Insured: AMBAC:
5.000% 07/01/31 | | | 1,000,000 | | | | 1,067,270 | | |
| 5.500% 07/01/15 | | | 2,825,000 | | | | 3,051,113 | | |
See Accompanying Notes to Financial Statements.
33
Columbia Connecticut Intermediate Municipal Bond Fund
October 31, 2008
| Municipal Bonds (continued) | |
| | | Par ($) | | Value ($) | |
| CT New Haven | |
| Series 2002 B, | |
Escrowed to Maturity,
Insured: FGIC
5.375% 11/01/12 | | | 5,000 | | | | 5,447 | | |
| Series 2002 C: | |
Escrowed to Maturity,
Insured: MBIA
5.000% 11/01/18 | | | 15,000 | | | | 15,300 | | |
Pre-refunded 11/01/12,
Insured: MBIA
5.000% 11/01/18 | | | 1,985,000 | | | | 2,137,428 | | |
| Series 2003 A, | |
Pre-refunded 11/01/13,
Insured: FGIC
5.250% 11/01/16 | | | 170,000 | | | | 187,046 | | |
| CT Seymour | |
| Series 2001 B, | |
Pre-refunded 08/01/11,
Insured: MBIA
5.250% 08/01/15 | | | 1,100,000 | | | | 1,173,304 | | |
CT Special Assessment Second Injury Fund
Revenue | |
| Series 2000 A, | |
Escrowed to Maturity,
Insured: FSA
5.250% 01/01/10 | | | 2,000,000 | | | | 2,071,240 | | |
| CT Stamford | |
| Series 2002, | |
Pre-refunded 08/15/12,
5.000% 08/15/19 | | | 1,000,000 | | | | 1,071,820 | | |
| CT State | |
| Series 1993 E, | |
Escrowed to Maturity,
6.000% 03/15/12 | | | 25,000 | | | | 27,416 | | |
| Series 1999 B, | |
Pre-refunded 11/01/09,
5.750% 11/01/11 | | | 1,000,000 | | | | 1,049,270 | | |
| Series 2000 A, | |
Pre-refunded 04/15/10,
5.500% 04/15/19 | | | 865,000 | | | | 908,060 | | |
| CT Torrington | |
| Series 1999, | |
Pre-refunded 09/15/09,
Insured: FGIC
5.125% 09/15/12 | | | 1,300,000 | | | | 1,351,961 | | |
| | | Par ($) | | Value ($) | |
| CT University of Connecticut | |
| Series 2000 A, | |
Pre-refunded 03/01/10,
Insured: FGIC
5.375% 03/01/19 | | | 2,000,000 | | | | 2,101,180 | | |
| Series 2002 A, | |
Pre-refunded 04/01/12,
5.375% 04/01/13 | | | 1,000,000 | | | | 1,077,570 | | |
| CT Westport | |
| Series 1999, | |
Pre-refunded 07/15/09,
5.000% 07/15/18 | | | 1,890,000 | | | | 1,953,031 | | |
| Series 2000, | |
Pre-refunded 08/15/10:
5.375% 08/15/14 | | | 550,000 | | | | 579,662 | | |
| 5.375% 08/15/15 | | | 1,550,000 | | | | 1,633,591 | | |
| Series 2001, | |
Pre-refunded 12/01/11,
5.000% 12/01/16 | | | 1,155,000 | | | | 1,230,837 | | |
PR Commonwealth of Puerto Rico
Infrastructure Financing Authority | |
| Series 2000 A, | |
Economically Defeased to Maturity,
5.500% 10/01/40 | | | 1,000,000 | | | | 998,450 | | |
| Refunded/Escrowed Total | | | 34,393,676 | | |
| Other Total | | | 37,904,216 | | |
| Other Revenue – 0.7% | |
| Recreation – 0.7% | |
| CT Development Authority | |
| Mystic Marinelife Aquarium, | |
Series 2007 A,
LOC: Citibank N.A.
4.625% 05/01/37 | | | 2,000,000 | | | | 1,550,340 | | |
| Recreation Total | | | 1,550,340 | | |
| Other Revenue Total | | | 1,550,340 | | |
| Resource Recovery – 0.7% | |
| Disposal – 0.7% | |
CT New Haven Solid Waste & Recycling
Authority Revenue | |
| Series 2008, | |
| 5.125% 06/01/23 | | | 1,520,000 | | | | 1,428,420 | | |
| Disposal Total | | | 1,428,420 | | |
| Resource Recovery Total | | | 1,428,420 | | |
See Accompanying Notes to Financial Statements.
34
Columbia Connecticut Intermediate Municipal Bond Fund
October 31, 2008
| Municipal Bonds (continued) | |
| | | Par ($) | | Value ($) | |
| Tax-Backed – 45.3% | |
| Local General Obligations – 20.6% | |
| CT Bridgeport | |
| Series 2002 A, | |
Insured: FGIC
5.375% 08/15/14 | | | 1,600,000 | | | | 1,650,848 | | |
| Series 2004 C, | |
Insured: MBIA
5.250% 08/15/17 | | | 1,500,000 | | | | 1,531,635 | | |
| CT Colchester | |
| Series 1997 A, | |
Insured: AMBAC
5.400% 08/15/10 | | | 885,000 | | | | 931,038 | | |
| CT Danbury | |
| Series 1995, | |
| 5.625% 02/01/13 | | | 200,000 | | | | 220,474 | | |
| Series 2004, | |
Insured: FGIC
4.750% 08/01/16 | | | 1,270,000 | | | | 1,328,737 | | |
| CT East Haven | |
| Series 2003, | |
Insured: MBIA
5.000% 09/01/15 | | | 640,000 | | | | 672,704 | | |
| CT Easton | |
| Series 2001, | |
| 4.750% 10/15/21 | | | 855,000 | | | | 855,308 | | |
| CT Fairfield | |
| Series 2004, | |
| 4.500% 01/01/16 | | | 1,690,000 | | | | 1,737,759 | | |
| Series 2008: | |
| 5.000% 01/01/20 | | | 1,000,000 | | | | 1,034,560 | | |
| 5.000% 01/01/22 | | | 500,000 | | | | 511,605 | | |
| CT Farmington | |
| Series 2002, | |
| 5.000% 09/15/19 | | | 820,000 | | | | 834,555 | | |
| CT Hartford County Metropolitan District | |
| Series 1989, | |
| 6.700% 10/01/09 | | | 250,000 | | | | 261,093 | | |
| Series 2002, | |
| 5.000% 04/01/19 | | | 1,205,000 | | | | 1,224,943 | | |
| CT Hartford | |
| Series 2003, | |
Insured: FSA
4.750% 12/01/15 | | | 2,065,000 | | | | 2,172,545 | | |
| Series 2005 C, | |
Insured: MBIA
5.000% 09/01/19 | | | 2,085,000 | | | | 2,113,252 | | |
| | | Par ($) | | Value ($) | |
| Series 2006, | |
Insured: AMBAC
5.000% 07/15/22 | | | 600,000 | | | | 591,186 | | |
| CT Montville | |
| Series 1994, | |
| 5.300% 12/01/09 | | | 370,000 | | | | 383,931 | | |
| CT New Britain | |
| Series 2006, | |
Insured: AMBAC
5.000% 04/15/17 | | | 1,165,000 | | | | 1,209,468 | | |
| CT New Haven | |
| Series 2002 B, | |
Insured: FGIC
5.375% 11/01/12 | | | 995,000 | | | | 1,054,013 | | |
| Series 2003 A, | |
Insured: FGIC
5.250% 11/01/16 | | | 1,830,000 | | | | 1,910,557 | | |
| Series 2008, | |
Insured: FSA
5.000% 11/01/18 | | | 4,260,000 | | | | 4,475,556 | | |
| CT New London | |
| Series 2003 C, | |
Insured: AMBAC
5.000% 02/01/17 | | | 1,290,000 | | | | 1,313,207 | | |
| CT New Milford | |
| Series 2004, | |
Insured: AMBAC
5.000% 01/15/16 | | | 1,025,000 | | | | 1,095,038 | | |
| CT North Haven | |
| Series 2007: | |
| 4.750% 07/15/24 | | | 1,150,000 | | | | 1,126,241 | | |
| 4.750% 07/15/25 | | | 1,150,000 | | | | 1,120,158 | | |
| CT Regional School District No. 15 | |
| Series 2003, | |
Insured: FGIC:
5.000% 02/01/15 | | | 1,105,000 | | | | 1,175,753 | | |
| 5.000% 02/01/16 | | | 1,025,000 | | | | 1,086,582 | | |
| CT Stamford | |
| Series 2003 B: | |
| 5.250% 08/15/16 | | | 1,650,000 | | | | 1,798,285 | | |
| 5.250% 08/15/17 | | | 1,125,000 | | | | 1,220,726 | | |
| CT Watertown | |
| Series 2005, | |
Insured: MBIA
5.000% 08/01/17 | | | 1,060,000 | | | | 1,111,590 | | |
See Accompanying Notes to Financial Statements.
35
Columbia Connecticut Intermediate Municipal Bond Fund
October 31, 2008
| Municipal Bonds (continued) | |
| | | Par ($) | | Value ($) | |
| CT Weston | |
| Series 2004, | |
| 5.250% 07/15/15 | | | 1,300,000 | | | | 1,412,021 | | |
| CT Westport | |
| Series 2003, | |
| 5.000% 08/15/18 | | | 1,200,000 | | | | 1,244,844 | | |
| CT Windham | |
| Series 2004, | |
Insured: MBIA
5.000% 06/15/15 | | | 785,000 | | | | 839,377 | | |
PR Commonwealth of Puerto Rico
Municipal Finance Agency | |
| Series 1999 A, | |
Insured: FSA
5.750% 08/01/12 | | | 1,500,000 | | | | 1,532,265 | | |
| Local General Obligations Total | | | 42,781,854 | | |
| Special Non-Property Tax – 7.5% | |
| CT Special Tax Obligation Revenue | |
| Transportation Infrastructure: | |
Series 1992 B,
6.125% 09/01/12 | | | 400,000 | | | | 431,420 | | |
Series 1998 A,
Insured: FGIC:
5.250% 10/01/14 | | | 2,100,000 | | | | 2,124,402 | | |
| 5.500% 10/01/12 | | | 3,250,000 | | | | 3,492,645 | | |
Series 2003 B,
Insured: FGIC
5.000% 01/01/23 | | | 800,000 | | | | 789,560 | | |
| NJ Economic Development Authority | |
| Series 2004 A, | |
| 5.500% 06/15/24 | | | 1,000,000 | | | | 792,730 | | |
| OH Hamilton County Sales Tax Revenue | |
| Series 2000 B, | |
Insured: AMBAC
(b) 12/01/28 | | | 3,000,000 | | | | 858,150 | | |
PR Commonwealth of Puerto Rico
Highway & Transportation Authority | |
| Series 1998, | |
Insured: MBIA
5.250% 07/01/14 | | | 2,615,000 | | | | 2,643,059 | | |
| Series 2002 E, | |
Insured: FSA
5.500% 07/01/17 | | | 1,870,000 | | | | 1,930,980 | | |
| Series 2006 BB, | |
Insured: FSA
5.250% 07/01/22 | | | 2,500,000 | | | | 2,415,850 | | |
| Special Non-Property Tax Total | | | 15,478,796 | | |
| | | Par ($) | | Value ($) | |
| State Appropriated – 3.5% | |
| CT State Certificates of Participation | |
| Juvenile Training School, | |
Series 2001,
5.250% 12/15/14 | | | 1,565,000 | | | | 1,637,100 | | |
| CT University of Connecticut | |
| Series 2002 A, | |
| 5.000% 04/01/10 | | | 1,085,000 | | | | 1,122,812 | | |
| Series 2004 A, | |
Insured: MBIA
5.000% 01/15/13 | | | 2,000,000 | | | | 2,113,540 | | |
| Series 2007 A, | |
| 4.000% 04/01/24 | | | 2,100,000 | | | | 1,681,281 | | |
PR Commonwealth of Puerto Rico Public
Finance Corp. | |
| Series 2004 A, | |
LOC: Government Development
Bank for Puerto Rico
5.750% 08/01/27 | | | 700,000 | | | | 702,590 | | |
| State Appropriated Total | | | 7,257,323 | | |
| State General Obligations – 13.7% | |
| CT State | |
| Refunding: | |
Series 2006 E,
5.000% 12/15/20 | | | 3,000,000 | | | | 3,050,100 | | |
Series 1993 E,
6.000% 03/15/12 | | | 975,000 | | | | 1,057,895 | | |
Series 2000 C,
5.375% 12/15/10 | | | 1,000,000 | | | | 1,057,480 | | |
Series 2001,
Insured: FSA
5.500% 12/15/14 | | | 1,500,000 | | | | 1,648,620 | | |
Series 2003 E,
Insured: FGIC
5.000% 08/15/21 | | | 1,000,000 | | | | 998,990 | | |
Series 2005 B,
Insured: AMBAC
5.250% 06/01/20 | | | 600,000 | | | | 624,186 | | |
Series 2005 D,
Insured: FGIC
5.000% 11/15/23 | | | 4,000,000 | | | | 4,025,840 | | |
Series 2008 B,
5.000% 04/15/22 | | | 5,415,000 | | | | 5,462,381 | | |
| PR Commonwealth of Puerto Rico | |
| Capital Appreciation, | |
Series 1998,
Insured: MBIA:
(b) 07/01/14 | | | 4,500,000 | | | | 3,310,740 | | |
| 6.000% 07/01/16 | | | 1,000,000 | | | | 1,030,850 | | |
See Accompanying Notes to Financial Statements.
36
Columbia Connecticut Intermediate Municipal Bond Fund
October 31, 2008
| Municipal Bonds (continued) | |
| | | Par ($) | | Value ($) | |
| Public Improvement: | |
Series 1998:
Insured: FSA
5.250% 07/01/10 | | | 1,250,000 | | | | 1,287,925 | | |
Insured: MBIA
5.250% 07/01/15 | | | 3,000,000 | | | | 2,993,100 | | |
| Series 2004 A, | |
| 5.000% 07/01/30 | | | 1,000,000 | | | | 985,480 | | |
| Series 2006 A, | |
| 5.250% 07/01/23 | | | 1,000,000 | | | | 911,960 | | |
| State General Obligations Total | | | 28,445,547 | | |
| Tax-Backed Total | | | 93,963,520 | | |
| Utilities – 5.4% | |
| Investor Owned – 1.6% | |
| CT Development Authority | |
| Pollution Control Revenue, | |
Connecticut Light & Power Co.,
Series 1993 A,
5.850% 09/01/28 | | | 4,285,000 | | | | 3,368,781 | | |
| Investor Owned Total | | | 3,368,781 | | |
| Joint Power Authority – 0.9% | |
CT State Municipal Electric Energy
Cooperative Power Supply Systems | |
| Series 2006 A, | |
Insured: AMBAC
5.000% 01/01/22 | | | 2,000,000 | | | | 1,982,740 | | |
| Joint Power Authority Total | | | 1,982,740 | | |
| Municipal Electric – 0.5% | |
PR Commonwealth of Puerto Rico Electric
Power Authority | |
| Series 2003 NN, | |
Insured: MBIA
5.250% 07/01/19 | | | 1,000,000 | | | | 951,660 | | |
| Municipal Electric Total | | | 951,660 | | |
| Water & Sewer – 2.4% | |
CT Greater New Haven Water Pollution
Control Authority | |
| Series 2005 A, | |
Insured: MBIA
5.000% 11/15/30 | | | 2,500,000 | | | | 2,329,325 | | |
| CT South Central Regional Water Authority | |
| Series 2007 A, | |
Insured: MBIA:
5.250% 08/01/23 | | | 500,000 | | | | 502,510 | | |
| 5.250% 08/01/22 | | | 1,370,000 | | | | 1,383,810 | | |
| | | Par ($) | | Value ($) | |
| Series 2008 B, | |
Insured: MBIA
5.250% 08/01/29 | | | 750,000 | | | | 727,800 | | |
| Water & Sewer Total | | | 4,943,445 | | |
| Utilities Total | | | 11,246,626 | | |
Total Municipal Bonds
(cost of $198,417,755) | | | 191,030,411 | | |
| Investment Company – 2.9% | |
| | | Shares | | | |
| Dreyfus Tax-Exempt Cash | |
Management Fund
(7 day yield of 2.260%) | | | 5,980,418 | | | | 5,980,418 | | |
Total Investment Company
(cost of $5,980,418) | | | 5,980,418 | | |
| Short-Term Obligations – 0.3% | |
| | | Par ($) | | | |
| Variable Rate Demand Notes (c) – 0.3% | |
| MI Higher Education Facilities Authority | |
| University of Detroit Mercy, | |
Series 2007,
LOC: JPMorgan Chase Bank
1.250% 11/01/36 | | | 200,000 | | | | 200,000 | | |
| MO Health & Educational Facilities Authority | |
| Washington University, | |
Series 2000 B,
SPA: JPMorgan Chase Bank
1.250% 03/01/40 | | | 200,000 | | | | 200,000 | | |
| WA Housing Finance Commission | |
| Franke Tobey Jones, | |
Series 2003,
LOC: Wells Fargo Bank N.A.
1.150% 09/01/33 | | | 100,000 | | | | 100,000 | | |
| WI University Hospitals & Clinics | |
| Series 2008 B, | |
LOC: U.S. Bank N.A.
1.200% 04/01/34 | | | 200,000 | | | | 200,000 | | |
| Variable Rate Demand Notes Total | | | 700,000 | | |
Total Short-Term Obligations
(cost of $700,000) | | | 700,000 | | |
Total Investments – 95.3%
(cost of $205,098,173) (d) | | | 197,710,829 | | |
| Other Assets & Liabilities, Net – 4.7% | | | 9,669,297 | | |
| Net Assets – 100.0% | | | 207,380,126 | | |
See Accompanying Notes to Financial Statements.
37
Columbia Connecticut Intermediate Municipal Bond Fund
October 31, 2008
Notes to Investment Portfolio:
(a) The Fund has been informed that each issuer has placed direct obligations of the U.S. Government in an irrevocable trust, solely for the payment of principal and interest.
(b) Zero coupon bond.
(c) Variable rate demand notes. These securities are payable upon demand and are secured by letters of credit or other credit support agreements from banks. The interest rates change periodically and the interest rates shown reflect the rate at October 31, 2008.
(d) Cost for federal income tax purposes is $205,149,641.
At October 31, 2008, the composition of the Fund by revenue source is as follows:
| Holdings By Revenue Source (Unaudited) | | % of
Net Assets | |
| Tax-Backed | | | 45.3 | | |
| Refunded/Escrowed | | | 16.6 | | |
| Education | | | 11.0 | | |
| Housing | | | 6.1 | | |
| Utilities | | | 5.4 | | |
| Health Care | | | 4.3 | | |
| Other | | | 1.7 | | |
| Other Revenue | | | 0.7 | | |
| Resource Recovery | | | 0.7 | | |
| Industrials | | | 0.3 | | |
| | | | 92.1 | | |
| Investment Company | | | 2.9 | | |
| Short-Term Obligations | | | 0.3 | | |
| Other Assets & Liabilities, Net | | | 4.7 | | |
| | | | 100.0 | | |
| Acronym | | Name | |
| AMBAC | | Ambac Assurance Corp. | |
|
| FGIC | | Financial Guaranty Insurance Co. | |
|
| FSA | | Financial Security Assurance, Inc. | |
|
| LOC | | Letter of Credit | |
|
| MBIA | | MBIA Insurance Corp. | |
|
| RAD | | Radian Asset Assurance, Inc. | |
|
| SPA | | Stand-by Purchase Agreement | |
|
See Accompanying Notes to Financial Statements.
38
Investment Portfolio – Columbia Intermediate Municipal Bond Fund
October 31, 2008
| Municipal Bonds – 97.1% | |
| | | Par ($) | | Value ($) | |
| Education – 2.7% | |
| Education – 2.7% | |
| CA Municipal Finance Authority | |
| Biola University, | |
Series 2008 A,
5.625% 10/01/23 | | | 3,000,000 | | | | 2,516,460 | | |
| CA University | |
| Series 2008 A, | |
Insured: FSA
5.000% 11/01/22 | | | 5,000,000 | | | | 4,921,900 | | |
CT Health & Educational Facilities
Authority | |
| Trinity College, | |
Series 1998 F,
Insured: MBIA
5.500% 07/01/21 | | | 1,000,000 | | | | 1,027,500 | | |
FL Broward County Educational
Facilities Authority | |
| Nova Southeastern University, | |
Series 2004 B,
5.250% 04/01/17 | | | 610,000 | | | | 549,683 | | |
FL Volusia County Educational
Facilities Authority | |
| Embry-Riddle Aeronautical University, | |
Series 1999 A,
5.750% 10/15/29 | | | 2,380,000 | | | | 1,958,431 | | |
| IL Finance Authority | |
| DePaul University, | |
Series 2004 A:
5.375% 10/01/17 | | | 1,000,000 | | | | 986,390 | | |
| 5.375% 10/01/18 | | | 2,000,000 | | | | 1,946,300 | | |
| KS Development Finance Authority | |
| Board of Regents Scientific Research, | |
Series 2003,
Insured: AMBAC
5.000% 10/01/19 | | | 2,000,000 | | | | 2,021,820 | | |
| Regents-Wichita University, | |
Series 2000 B,
Insured: AMBAC
5.900% 04/01/15 | | | 2,000,000 | | | | 2,066,560 | | |
| KS Washburn University | |
| Topeka Living Learning, | |
Series 2004,
Insured: AMBAC
5.000% 07/01/18 | | | 900,000 | | | | 899,253 | | |
| | | Par ($) | | Value ($) | |
| MA College Building Authority | |
| Series 1994 A, | |
| 7.500% 05/01/14 | | | 500,000 | | | | 561,900 | | |
MA Health & Educational Facilities
Authority | |
| Boston College, | |
Series 2008,
5.500% 06/01/24 | | | 2,670,000 | | | | 2,786,679 | | |
| MA Industrial Finance Agency | |
| Tufts University, | |
Series 1998 H,
Insured: MBIA
5.500% 02/15/12 | | | 2,000,000 | | | | 2,136,280 | | |
MO Health & Educational Facilities
Authority | |
| St. Louis University, | |
Series 1998,
5.500% 10/01/16 | | | 1,000,000 | | | | 1,080,460 | | |
| Washington University, | |
Series 2001 A,
5.500% 06/15/16 | | | 1,000,000 | | | | 1,097,180 | | |
| NY Dormitory Authority | |
| Series 2005 B, | |
Insured: FGIC
5.500% 07/01/21 | | | 6,345,000 | | | | 6,513,587 | | |
| St. John's University, | |
Series 2007 C,
Insured: MBIA
5.250% 07/01/23 | | | 5,245,000 | | | | 5,002,052 | | |
| University of Rochester, | |
Series 2007 A-1,
5.000% 07/01/22 | | | 4,000,000 | | | | 3,899,240 | | |
PA Erie Higher Education Building
Authority | |
| Mercyhurst College, | |
Series 2004 B,
5.000% 03/15/14 | | | 255,000 | | | | 241,424 | | |
PA Higher Educational Facilities
Authority | |
| Bryn Mawr College, | |
Series 2002,
Insured: AMBAC
5.250% 12/01/12 | | | 1,500,000 | | | | 1,602,615 | | |
| State Systems Higher Education, | |
Series 2001 T,
Insured: AMBAC
5.000% 06/15/12 | | | 750,000 | | | | 771,037 | | |
See Accompanying Notes to Financial Statements.
39
Columbia Intermediate Municipal Bond Fund
October 31, 2008
| Municipal Bonds (continued) | |
| | | Par ($) | | Value ($) | |
| University of Sciences, | |
Series 2005 A,
Insured: SYNC
5.000% 11/01/16 | | | 360,000 | | | | 359,132 | | |
| Widener University, | |
Series 2003,
5.000% 07/15/10 | | | 500,000 | | | | 506,570 | | |
| PA University | |
| Series 2002, | |
| 5.250% 08/15/11 | | | 1,000,000 | | | | 1,059,890 | | |
| RI Health & Educational Building Corp. | |
| Series 2003, | |
Insured: SYNC
5.250% 04/01/15 | | | 1,500,000 | | | | 1,501,095 | | |
TN Metropolitan Government, Nashville &
Davidson County, Health & Educational
Facilities Board | |
| Meharry Medical College, | |
Series 1996,
Insured: AMBAC:
6.000% 12/01/09 | | | 595,000 | | | | 606,495 | | |
| 6.000% 12/01/16 | | | 500,000 | | | | 534,250 | | |
| TX Alamo Community College District | |
| Series 2001, | |
Insured: FSA
5.375% 11/01/16 | | | 540,000 | | | | 566,822 | | |
| TX Houston Community College System | |
| Series 2001 A, | |
Insured: MBIA
5.375% 04/15/15 | | | 520,000 | | | | 538,387 | | |
| TX Public Finance Authority | |
| Stephen F. Austin University, | |
Series 2005,
Insured: MBIA
5.000% 10/15/19 | | | 2,000,000 | | | | 1,938,460 | | |
| TX University of Texas | |
| Series 2004 A, | |
| 5.250% 08/15/17 | | | 2,000,000 | | | | 2,142,700 | | |
| Series 2006 D, | |
| 5.000% 08/15/18 | | | 10,000,000 | | | | 10,372,200 | | |
| Education Total | | | 64,712,752 | | |
| Education Total | | | 64,712,752 | | |
| | | Par ($) | | Value ($) | |
| Health Care – 10.5% | |
| Continuing Care Retirement – 2.1% | |
| CO Health Facilities Authority | |
| Covenant Retirement Communities, Inc., | |
Series 2005,
5.000% 12/01/18 | | | 1,000,000 | | | | 854,530 | | |
| FL Lakeland | |
| Carpenters Retirement Community, | |
Series 2008,
5.875% 01/01/19 | | | 1,875,000 | | | | 1,559,456 | | |
FL Lee County Industrial Development
Authority | |
| Shell Point, | |
Series 2007,
5.000% 11/15/22 | | | 7,650,000 | | | | 5,380,551 | | |
FL Orange County Health Facilities
Authority | |
| Orlando Lutheran Towers, | |
Series 2005,
5.000% 07/01/13 | | | 3,670,000 | | | | 3,382,639 | | |
FL Sarasota County Health Facilities
Authority | |
| Village on the Isle, | |
Series 2007,
5.500% 01/01/27 | | | 4,000,000 | | | | 2,791,040 | | |
FL St. John's County Industrial
Development Authority | |
| Vicars Landing, | |
Series 2007,
5.000% 02/15/17 | | | 1,625,000 | | | | 1,377,204 | | |
| IL Finance Authority | |
| Monarch Landing, Inc., | |
Series 2007 A:
5.500% 12/01/13 | | | 2,200,000 | | | | 2,000,614 | | |
| 6.000% 12/01/17 | | | 3,590,000 | | | | 3,095,298 | | |
| Sedgebrook, Inc., | |
Series 2007 A:
5.400% 11/15/16 | | | 2,165,000 | | | | 1,827,044 | | |
| 5.875% 11/15/22 | | | 8,000,000 | | | | 6,303,200 | | |
IN Health & Educational Facility
Financing Authority | |
| Baptist Homes of Indiana, | |
Series 2005,
5.250% 11/15/25 | | | 6,000,000 | | | | 5,000,880 | | |
See Accompanying Notes to Financial Statements.
40
Columbia Intermediate Municipal Bond Fund
October 31, 2008
| Municipal Bonds (continued) | |
| | | Par ($) | | Value ($) | |
| KS Lenexa | |
| Lakeview Village, Inc., | |
Series 2007,
5.250% 05/15/22 | | | 2,650,000 | | | | 1,956,336 | | |
| MA Development Finance Agency | |
| First Mortgage Orchard Cove, | |
Series 2007,
5.000% 10/01/17 | | | 1,840,000 | | | | 1,451,042 | | |
| MD Howard County Retirement Authority | |
| Columbia Vantage House Corp., | |
Series 2007 A,
5.250% 04/01/27 | | | 1,500,000 | | | | 1,051,350 | | |
MO St. Louis Industrial Development
Authority | |
| St. Andrews Resources for Seniors, | |
Series 2007 A,
6.250% 12/01/26 | | | 7,000,000 | | | | 5,536,510 | | |
| NC Medical Care Commission | |
| Givens Estates, | |
Series 2007,
5.000% 07/01/27 | | | 3,375,000 | | | | 2,506,950 | | |
NY Nassau County Industrial
Development Agency | |
| Amsterdam Harborside, | |
Series 2007 A,
5.875% 01/01/18 | | | 2,375,000 | | | | 2,061,215 | | |
| PA Delaware County Authority | |
| Dunwoody Village, Inc., | |
Series 2003 A,
5.000% 04/01/09 | | | 500,000 | | | | 500,450 | | |
TX Tarrant County Cultural Education
Facilities Finance Corp. | |
| Air Force Village, | |
Series 2007,
5.125% 05/15/27 | | | 3,750,000 | | | | 2,627,550 | | |
| Continuing Care Retirement Total | | | 51,263,859 | | |
| Hospitals – 8.2% | |
AL Health Care Authority for Baptist
Health | |
| Series 2006 D, | |
| 5.000% 11/15/18 | | | 2,250,000 | | | | 2,005,898 | | |
| AL University at Birmingham Hospital | |
| Series 2006 A, | |
| 5.000% 09/01/21 | | | 2,200,000 | | | | 1,918,994 | | |
| | | Par ($) | | Value ($) | |
| AR Washington County Hospital | |
| Washington Regional Medical Center, | |
Series 2005 B:
5.000% 02/01/16 | | | 1,000,000 | | | | 915,510 | | |
| 5.000% 02/01/17 | | | 2,000,000 | | | | 1,796,120 | | |
AZ Maricopa County Industrial
Development Authority | |
| Catholic Healthcare West, | |
Series 2007 A,
5.000% 07/01/18 | | | 3,500,000 | | | | 3,265,255 | | |
| CA Health Facilities Financing Authority | |
| Catholic Healthcare West, | |
Series 2004,
4.450% 07/01/26 (a) | | | 1,010,000 | | | | 995,830 | | |
| CA Loma Linda Hospital | |
| Loma Linda University Medical Center, | |
Series 2005 A,
5.000% 12/01/19 | | | 10,390,000 | | | | 9,047,404 | | |
| CA Municipal Finance Authority | |
| Community Hospital Central California, | |
Series 2007:
5.000% 02/01/21 | | | 1,070,000 | | | | 872,071 | | |
| 5.000% 02/01/22 | | | 1,500,000 | | | | 1,203,435 | | |
CA Rancho Mirage Joint Powers
Financing Authority | |
| Series 1997 B, | |
Insured: MBIA
4.875% 07/01/22 | | | 1,730,000 | | | | 1,568,107 | | |
| CA Turlock Health Facility | |
| Emanuel Medical Center, Inc., | |
Series 2007 B,
5.000% 10/15/22 | | | 3,590,000 | | | | 2,885,427 | | |
FL Escambia County Health Facilities
Authority | |
| Ascension Health, | |
Series 2003 A:
5.250% 11/15/11 | | | 2,125,000 | | | | 2,189,515 | | |
| 5.250% 11/15/14 | | | 1,000,000 | | | | 1,025,860 | | |
FL Highlands County Health Facilities
Authority | |
| Adventist Health Systems: | |
Series 2005 A,
5.000% 11/15/20 (a) | | | 1,000,000 | | | | 880,160 | | |
Series 2005 B:
5.000% 11/15/20 | | | 875,000 | | | | 770,140 | | |
| 5.000% 11/15/22 | | | 740,000 | | | | 627,254 | | |
| Adventist Hinsdale Hospital, | |
Series 2005 A,
5.000% 11/15/22 (a) | | | 1,000,000 | | | | 847,640 | | |
See Accompanying Notes to Financial Statements.
41
Columbia Intermediate Municipal Bond Fund
October 31, 2008
| Municipal Bonds (continued) | |
| | | Par ($) | | Value ($) | |
FL Hillsborough County Industrial
Development Authority | |
| Tampa General Hospital, | |
Series 2003 A,
5.000% 10/01/18 | | | 1,000,000 | | | | 862,830 | | |
FL Lee Memorial Health System Hospital
Board | |
| Series 2002 A, | |
Insured: FSA
5.750% 04/01/15 | | | 1,000,000 | | | | 1,049,560 | | |
| FL Marion County Hospital District | |
| Munroe Regional Medical Center, | |
Series 1999,
5.250% 10/01/11 | | | 1,935,000 | | | | 1,993,398 | | |
FL Orange County Health Facilities
Authority | |
| Series 1996 A, | |
Insured: MBIA
6.250% 10/01/16 | | | 1,700,000 | | | | 1,788,876 | | |
| FL Sarasota County Public Hospital Board | |
| Series 1998 B, | |
Insured: MBIA
5.250% 07/01/11 | | | 1,750,000 | | | | 1,809,010 | | |
| FL South Broward Hospital District | |
| Series 2003 A, | |
Insured: MBIA:
5.250% 05/01/12 | | | 3,955,000 | | | | 4,020,257 | | |
| 5.250% 05/01/13 | | | 1,500,000 | | | | 1,520,790 | | |
FL St. Petersburg Health Facilities
Authority | |
| All Children's Hospital, | |
Series 2002,
Insured: AMBAC:
5.500% 11/15/14 | | | 1,720,000 | | | | 1,727,551 | | |
| 5.500% 11/15/15 | | | 1,995,000 | | | | 1,992,646 | | |
| 5.500% 11/15/16 | | | 1,980,000 | | | | 1,957,190 | | |
| FL Tampa Health Systems | |
| Catholic Health East, | |
Series 1998 A-1,
Insured: MBIA:
5.500% 11/15/13 | | | 6,080,000 | | | | 6,347,094 | | |
| 5.500% 11/15/14 | | | 6,000,000 | | | | 6,239,460 | | |
| GA Fulton DeKalb Hospital Authority | |
| Series 2003, | |
Insured: FSA
5.250% 01/01/16 | | | 1,000,000 | | | | 1,047,780 | | |
| | | Par ($) | | Value ($) | |
| KS Lawrence Memorial Hospital | |
| Series 2003, | |
| 5.250% 07/01/11 | | | 1,005,000 | | | | 1,020,145 | | |
| KS Manhattan Hospital | |
| Mercy Health Care Center, | |
Series 2001,
Insured: FSA
5.250% 08/15/10 | | | 1,005,000 | | | | 1,029,703 | | |
| KS Wichita Hospital | |
| Series 2001 III, | |
| 6.250% 11/15/18 | | | 5,000,000 | | | | 5,073,200 | | |
MA Health & Educational Facilities
Authority | |
| CareGroup, Inc., | |
Series 2008 E-2:
5.375% 07/01/20 | | | 9,720,000 | | | | 8,310,600 | | |
| 5.375% 07/01/22 | | | 13,345,000 | | | | 11,074,615 | | |
| Partners HealthCare System, Inc., | |
Series 2001 C:
6.000% 07/01/14 | | | 1,000,000 | | | | 1,035,900 | | |
| 6.000% 07/01/17 | | | 45,000 | | | | 47,975 | | |
MD Health & Higher Educational
Facilities Authority | |
| University of Maryland Medical System: | |
Series 2005,
Insured: AMBAC
5.500% 07/01/24 | | | 4,150,000 | | | | 3,775,877 | | |
Series 2008:
5.250% 07/01/19 | | | 1,635,000 | | | | 1,538,045 | | |
| 5.250% 07/01/21 | | | 1,750,000 | | | | 1,659,823 | | |
| MI Saginaw Hospital Finance Authority | |
| Covenant Medical Center, | |
Series 2004 G,
5.125% 07/01/22 | | | 10,560,000 | | | | 9,170,621 | | |
| NC Albemarle Hospital Authority | |
| Series 2007: | |
| 5.250% 10/01/21 | | | 3,000,000 | | | | 2,502,060 | | |
| 5.250% 10/01/27 | | | 3,700,000 | | | | 2,846,965 | | |
| NH Health & Education Facilities Authority | |
| Southern New Hampshire Medical Center, | |
Series 2007,
5.250% 10/01/23 | | | 7,000,000 | | | | 6,023,640 | | |
| NM Farmington Hospital | |
| San Juan Regional Medical Center, Inc., | |
Series 2004 A,
5.125% 06/01/18 | | | 500,000 | | | | 456,570 | | |
See Accompanying Notes to Financial Statements.
42
Columbia Intermediate Municipal Bond Fund
October 31, 2008
| Municipal Bonds (continued) | |
| | | Par ($) | | Value ($) | |
| NY Albany Industrial Development Agency | |
| St. Peter's Hospital, | |
Series 2008 A:
5.250% 11/15/16 | | | 1,750,000 | | | | 1,638,053 | | |
| 5.250% 11/15/17 | | | 1,250,000 | | | | 1,154,313 | | |
NY Monroe County Industrial Development
Agency | |
| Highland Hospital of Rochester, | |
Series 2005:
5.000% 08/01/14 | | | 730,000 | | | | 699,763 | | |
| 5.000% 08/01/15 | | | 545,000 | | | | 513,679 | | |
| OH Lakewood | |
| Lakewood Hospital Association, | |
Series 2003,
5.500% 02/15/14 | | | 1,400,000 | | | | 1,416,114 | | |
| OH Lorain County Hospital | |
| Catholic Healthcare Partnerships, | |
Series 2001 A:
5.625% 10/01/14 | | | 6,135,000 | | | | 6,296,596 | | |
| 5.625% 10/01/15 | | | 3,000,000 | | | | 3,059,100 | | |
| 5.625% 10/01/16 | | | 3,000,000 | | | | 3,037,680 | | |
| OK Development Finance Authority | |
| Duncan Regional Hospital, Inc., | |
Series 2003 A,
5.000% 12/01/15 | | | 1,545,000 | | | | 1,527,542 | | |
| PA Higher Educational Facilities Authority | |
| University of Pennsylvania Health Systems, | |
Series 2005 A,
Insured: AMBAC
5.000% 08/15/18 | | | 250,000 | | | | 253,428 | | |
PA Northampton County General Purpose
Authority | |
| St. Lukes Hospital Bethlehem, | |
Series 2008 A:
5.000% 08/15/20 | | | 3,480,000 | | | | 2,806,794 | | |
| 5.125% 08/15/21 | | | 3,715,000 | | | | 2,978,613 | | |
| 5.250% 08/15/22 | | | 1,965,000 | | | | 1,571,528 | | |
| SC Greenville Hospital Systems Board | |
| Greenville Hospital Systems Partners in Health, | |
Series 2008 A:
5.250% 05/01/19 | | | 5,640,000 | | | | 5,456,192 | | |
| 5.250% 05/01/20 | | | 5,810,000 | | | | 5,559,996 | | |
TN Knox County Health, Educational &
Housing Facilities Board | |
| Fort Sanders Alliance, | |
Series 1993,
Insured: MBIA
7.250% 01/01/09 | | | 300,000 | | | | 301,581 | | |
| | | Par ($) | | Value ($) | |
TN Sullivan County Health, Educational &
Housing Facilities Board | |
| Series 2006 C, | |
| 5.000% 09/01/22 | | | 3,750,000 | | | | 2,782,763 | | |
| TX Amarillo Health Facilities Corp. | |
| Baptist St. Anthony's Hospital Corp., | |
Series 1998,
Insured: FSA
5.500% 01/01/14 | | | 1,000,000 | | | | 1,047,920 | | |
TX Harris County Health Facilities
Development Corp. | |
| Memorial Hospital Systems, | |
Series 1997 A,
Insured: MBIA
6.000% 06/01/13 | | | 2,170,000 | | | | 2,272,250 | | |
TX Jefferson County Health Facilities
Development Corp. | |
| Baptist Hospitals, | |
Series 2001,
Insured: AMBAC
5.200% 08/15/21 | | | 3,425,000 | | | | 2,888,439 | | |
TX Tarrant County Cultural Education
Facilities Finance Corp. | |
| Texas Health Resources, | |
Series 2007 A,
5.000% 02/15/21 | | | 5,000,000 | | | | 4,568,800 | | |
| TX Tarrant County Hospital District | |
| Series 2002, | |
Insured: MBIA
5.500% 08/15/13 | | | 1,355,000 | | | | 1,402,330 | | |
VA Augusta County Industrial
Development Authority | |
| Augusta Health Care, Inc., | |
Series 2003,
5.250% 09/01/18 | | | 1,500,000 | | | | 1,431,885 | | |
WI Health & Educational Facilities
Authority | |
| Aurora Health Care, Inc., | |
Series 1999 A,
5.600% 02/15/29 | | | 7,615,000 | | | | 6,132,816 | | |
| Wheaton Franciscan Healthcare, | |
Series 2006:
5.125% 08/15/23 | | | 13,065,000 | | | | 9,108,787 | | |
| 5.125% 08/15/26 | | | 10,000,000 | | | | 6,678,200 | | |
| Hospitals Total | | | 197,321,963 | | |
See Accompanying Notes to Financial Statements.
43
Columbia Intermediate Municipal Bond Fund
October 31, 2008
| Municipal Bonds (continued) | |
| | | Par ($) | | Value ($) | |
| Nursing Homes – 0.2% | |
| IA Finance Authority Health Facilities | |
| Development Care Initiatives, | |
Series 2006 A:
5.250% 07/01/18 | | | 2,695,000 | | | | 2,260,054 | | |
| 5.500% 07/01/21 | | | 1,530,000 | | | | 1,232,905 | | |
| MN Eveleth Health Care | |
| Series 2007, | |
| 5.000% 10/01/17 | | | 1,000,000 | | | | 794,500 | | |
MO St. Louis County Industrial
Development Authority | |
| Ranken Jordan, | |
Series 2007,
5.000% 11/15/27 | | | 1,350,000 | | | | 984,730 | | |
| Nursing Homes Total | | | 5,272,189 | | |
| Health Care Total | | | 253,858,011 | | |
| Housing – 1.2% | |
| Assisted Living/Senior – 0.2% | |
AZ Maricopa County Industrial
Development Authority Health Facilities | |
| Series 1999 A, | |
Guarantor: GNMA
6.300% 09/20/38 | | | 3,715,000 | | | | 3,728,114 | | |
| Assisted Living/Senior Total | | | 3,728,114 | | |
| Multi-Family – 0.5% | |
| FL Capital Trust Agency | |
| Atlantic Housing Foundation, | |
Series 2008 B,
7.000% 07/15/32 | | | 1,990,000 | | | | 1,685,928 | | |
| TCB Shadow Run, | |
Series 2000 A,
LIQ FAC: FNMA
5.150% 11/01/30 (a) | | | 4,300,000 | | | | 4,433,472 | | |
| FL Collier County Finance Authority | |
| Goodlette Arms, | |
Series 2002 A-1,
LIQ FAC: FNMA
4.900% 02/15/32 (a) | | | 3,250,000 | | | | 3,319,420 | | |
| LA Housing Finance Agency | |
| Series 2006 A, | |
| 4.750% 12/01/31 | | | 1,510,000 | | | | 1,380,412 | | |
| NC Medical Care Commission | |
| ARC/HDS Alamance Housing Corp., | |
Series 2004 A:
4.650% 10/01/14 | | | 480,000 | | | | 438,917 | | |
| 5.500% 10/01/24 | | | 1,575,000 | | | | 1,290,066 | | |
| Multi-Family Total | | | 12,548,215 | | |
| | | Par ($) | | Value ($) | |
| Single-Family – 0.5% | |
AZ Tucson & Pima County Industrial
Development Authority | |
| Series 2001 A-1, AMT, | |
Guarantor: GNMA:
6.000% 07/01/21 (a) | | | 200,000 | | | | 201,268 | | |
| 6.350% 01/01/34 (a) | | | 130,000 | | | | 130,389 | | |
| CA Department of Veteran Affairs | |
| Series 2006, | |
| 4.500% 12/01/23 | | | 5,000,000 | | | | 4,370,450 | | |
FL Escambia County Housing Finance
Authority | |
| Series 1999, AMT, | |
Guarantor: GNMA
4.500% 10/01/09 | | | 365,000 | | | | 368,964 | | |
| Series 2000 A, AMT, | |
Insured: MBIA
6.300% 10/01/20 | | | 50,000 | | | | 50,415 | | |
| FL Housing Finance Agency | |
| Series 1997-2, AMT, | |
Insured: MBIA
5.750% 07/01/14 | | | 745,000 | | | | 738,727 | | |
| FL Housing Finance Corp. | |
| Series 1998-1, | |
Insured: MBIA:
4.950% 01/01/11 | | | 550,000 | | | | 553,756 | | |
| 4.950% 07/01/11 | | | 765,000 | | | | 769,850 | | |
| KS Sedgwick & Shawnee Counties | |
| Mortgage-Backed Securities Program, | |
Series 2003, AMT,
Guarantor: GNMA
6.050% 06/01/27 (a) | | | 435,000 | | | | 416,391 | | |
| NC Housing Finance Agency | |
| Series 1997 RR, AMT, | |
Insured: FHA
5.850% 09/01/28 | | | 625,000 | | | | 621,650 | | |
| NM Mortgage Finance Authority | |
| Series 1998 B-3, | |
Guarantor: GNMA
5.500% 07/01/28 | | | 260,000 | | | | 240,846 | | |
| Series 2001 B-2, AMT, | |
Guarantor: GNMA
6.200% 09/01/32 (a) | | | 1,395,000 | | | | 1,398,613 | | |
| Series 2002 B-2, AMT, | |
Guarantor: GNMA
6.350% 03/01/33 (a) | | | 990,000 | | | | 972,220 | | |
See Accompanying Notes to Financial Statements.
44
Columbia Intermediate Municipal Bond Fund
October 31, 2008
| Municipal Bonds (continued) | |
| | | Par ($) | | Value ($) | |
| Series 2002 PG-A-2, AMT, | |
Guarantor: GNMA
6.450% 03/01/33 (a) | | | 640,000 | | | | 642,336 | | |
OR Housing & Community Services
Department Mortgage | |
| Series 1997 H, AMT, | |
| 5.150% 07/01/09 | | | 50,000 | | | | 50,447 | | |
| Series 2000 H, | |
Insured: FHA
5.550% 07/01/21 | | | 95,000 | | | | 92,881 | | |
| TN Housing Development Agency | |
| Home Ownership Program, | |
Series 1998, AMT,
4.950% 07/01/10 | | | 1,060,000 | | | | 1,076,875 | | |
| Single-Family Total | | | 12,696,078 | | |
| Housing Total | | | 28,972,407 | | |
| Industrials – 1.4% | |
| Forest Products & Paper – 0.7% | |
| FL Bay County Pollution Control | |
| International Paper Co., | |
Series 1998 A,
5.100% 09/01/12 | | | 2,375,000 | | | | 2,236,253 | | |
| FL Escambia County Pollution Control | |
| International Paper Co., | |
Series 2003 A,
4.700% 04/01/15 | | | 500,000 | | | | 424,000 | | |
| LA Morehouse Parish Pollution Control | |
| International Paper Co., | |
Series 2001 A,
5.250% 11/15/13 | | | 8,525,000 | | | | 7,802,165 | | |
MS Warren County Environmental
Improvement | |
| International Paper Co., | |
Series 2000 A, AMT,
6.700% 08/01/18 | | | 2,600,000 | | | | 2,280,980 | | |
| TX Gulf Coast Waste Disposal Authority | |
| International Paper Co., | |
Series 2002 A, AMT,
6.100% 08/01/24 | | | 5,750,000 | | | | 4,351,485 | | |
| Forest Products & Paper Total | | | 17,094,883 | | |
| Oil & Gas – 0.7% | |
CA Southern California Public Power
Authority | |
| Series 2007, | |
| 5.250% 11/01/22 | | | 2,500,000 | | | | 1,817,625 | | |
| | | Par ($) | | Value ($) | |
| GA Main Street Natural Gas, Inc. | |
| Series 2007 A: | |
| 5.125% 09/15/17 | | | 1,000,000 | | | | 808,660 | | |
| 5.250% 09/15/18 | | | 1,000,000 | | | | 796,730 | | |
| TN Energy Acquisition Corp. | |
| Series 2006, | |
| 5.250% 09/01/22 | | | 5,000,000 | | | | 3,643,150 | | |
TX Municipal Gas Acquisition &
Supply Corp. | |
| Series 2006 A, | |
| 5.000% 12/15/12 | | | 5,500,000 | | | | 4,955,885 | | |
TX SA Energy Acquisition Public
Facility Corp. | |
| Series 2007, | |
| 5.250% 08/01/16 | | | 4,450,000 | | | | 3,730,568 | | |
| Oil & Gas Total | | | 15,752,618 | | |
| Other Industrial Development Bonds – 0.0% | |
| MI Strategic Fund Ltd. Obligation | |
| NSF International, | |
Series 2004,
5.000% 08/01/13 | | | 820,000 | | | | 793,260 | | |
| Other Industrial Development Bonds Total | | | 793,260 | | |
| Industrials Total | | | 33,640,761 | | |
| Other – 14.9% | |
| Other – 1.6% | |
| FL Hurricane Catastrophe Fund | |
| Series 2006 A, | |
| 5.250% 07/01/12 | | | 12,000,000 | | | | 12,623,280 | | |
| Series 2008 A, | |
| 5.000% 07/01/14 | | | 15,000,000 | | | | 15,644,850 | | |
PR Commonwealth of Puerto Rico
Government Development Bank | |
| Series 2006 B: | |
| 5.000% 12/01/13 | | | 5,000,000 | | | | 4,988,700 | | |
| 5.000% 12/01/15 | | | 5,000,000 | | | | 4,905,500 | | |
| Other Total | | | 38,162,330 | | |
| Pool/Bond Bank – 2.1% | |
| FL Gulf Breeze | |
| Series 1985 C, | |
Insured: FGIC
5.000% 12/01/15 | | | 1,000,000 | | | | 1,009,560 | | |
| FL Municipal Loan Council | |
| Series 2002 A, | |
Insured: MBIA
5.500% 05/01/13 | | | 1,000,000 | | | | 1,047,230 | | |
See Accompanying Notes to Financial Statements.
45
Columbia Intermediate Municipal Bond Fund
October 31, 2008
| Municipal Bonds (continued) | |
| | | Par ($) | | Value ($) | |
| Series 2005 A, | |
Insured: MBIA
5.000% 02/01/19 | | | 1,015,000 | | | | 984,367 | | |
| FL Water Pollution Control Financing | |
| Series 2001, | |
| 5.500% 01/15/13 | | | 1,390,000 | | | | 1,452,634 | | |
| KS Development Finance Authority | |
| Water Pollution Control Revolving Fund: | |
Series 2001 II,
5.500% 05/01/14 | | | 1,000,000 | | | | 1,091,590 | | |
Series 2002 II,
5.500% 11/01/15 | | | 105,000 | | | | 111,707 | | |
| MA Water Pollution Abatement Trust | |
| Series 1999 A, | |
| 6.000% 08/01/19 | | | 2,500,000 | | | | 2,815,950 | | |
| Series 2004 A, | |
| 5.250% 08/01/17 | | | 2,920,000 | | | | 3,136,839 | | |
MO Environmental Improvement & Energy
Resources Authority | |
| Series 2004 B, | |
| 5.250% 01/01/18 | | | 7,470,000 | | | | 7,979,155 | | |
| NY Dormitory Authority | |
| Series 2002 A, | |
Insured: MBIA
5.250% 10/01/12 | | | 2,420,000 | | | | 2,559,150 | | |
| NY Environmental Facilities Corp. | |
| Pollution Control, | |
Series 1994,
5.750% 06/15/09 | | | 10,000 | | | | 10,237 | | |
| OH Water Development Authority | |
| Pollution Control, | |
Series 2005 B,
(b) 06/01/15 | | | 2,000,000 | | | | 1,494,880 | | |
PA Delaware Valley Regional Financing
Authority | |
| Local Government: | |
Series 1997 B,
Insured: AMBAC
5.600% 07/01/17 | | | 2,000,000 | | | | 2,063,540 | | |
Series 2002:
5.500% 07/01/12 | | | 15,000,000 | | | | 15,717,750 | | |
| 5.750% 07/01/17 | | | 2,000,000 | | | | 2,112,940 | | |
| PA Finance Authority | |
| Penn Hills, | |
Series 2000 A,
Insured: FGIC
5.500% 12/01/22 | | | 835,000 | | | | 806,401 | | |
| | | Par ($) | | Value ($) | |
PA Industrial Development Authority
Economic Development | |
| Series 2002, | |
Insured: AMBAC
5.250% 07/01/11 | | | 1,000,000 | | | | 1,037,830 | | |
| TX Water Development Board | |
| Series 1999 B, | |
| 5.625% 07/15/21 | | | 1,500,000 | | | | 1,524,945 | | |
| VA Resources Authority | |
| Series 2007, | |
| 5.000% 10/01/17 | | | 3,760,000 | | | | 3,985,976 | | |
| Pool/Bond Bank Total | | | 50,942,681 | | |
| Refunded/Escrowed (c) – 9.8% | |
| AL Birmingham Waterworks & Sewer Board | |
| Series 2002 B, | |
Pre-refunded 01/01/13,
Insured: MBIA
5.000% 01/01/37 | | | 15,000,000 | | | | 16,026,600 | | |
| AL Birmingham | |
| Series 2001 A, | |
Pre-refunded 11/01/11,
5.250% 05/01/17 | | | 2,000,000 | | | | 2,149,640 | | |
| AZ School Facilities Board | |
| Certificates of Participation, | |
Series 2003 A,
Pre-refunded 03/01/13,
Insured: MBIA
5.250% 09/01/14 | | | 10,000,000 | | | | 10,818,700 | | |
| AZ University of Arizona | |
| Certificates of Participation, | |
Series 2002 A,
Pre-refunded 06/01/12,
Insured: AMBAC
5.500% 06/01/15 | | | 455,000 | | | | 490,472 | | |
| CA Department Water Resources | |
| Series 2002 X, | |
Escrowed to Maturity,
5.500% 12/01/15 | | | 10,000 | | | | 11,203 | | |
| CA Golden State Tobacco Securitization Corp. | |
| Series 2003 A-1, | |
Pre-refunded 06/01/13,
6.250% 06/01/33 | | | 3,265,000 | | | | 3,486,759 | | |
See Accompanying Notes to Financial Statements.
46
Columbia Intermediate Municipal Bond Fund
October 31, 2008
| Municipal Bonds (continued) | |
| | | Par ($) | | Value ($) | |
| CA Health Facilities Financing Authority | |
| Catholic West, | |
Series 2004 H,
Pre-refunded 07/01/11,
4.450% 07/01/26 (a) | | | 90,000 | | | | 94,023 | | |
CO Douglas County School
District No. RE-1 | |
| Series 2001, | |
Pre-refunded 12/15/11,
Insured: MBIA
5.250% 12/15/13 | | | 7,385,000 | | | | 7,911,550 | | |
CO Northwest Parkway Public Highway
Authority | |
| Series 2001 C, | |
Pre-refunded 06/15/16,
Insured: AMBAC
(d) 06/15/21
(5.700% 06/15/11) | | | 4,000,000 | | | | 3,780,880 | | |
| CT Special Tax Obligation | |
| Transportation Infrastructure, | |
Series 2001 A,
Pre-refunded 10/01/11,
Insured: FSA
5.375% 10/01/17 | | | 1,000,000 | | | | 1,073,070 | | |
| FL Broward County | |
| Series 2001 A, | |
Pre-refunded 01/01/11,
5.250% 01/01/14 | | | 1,025,000 | | | | 1,089,278 | | |
FL Hillsborough County School Board
District | |
| Series 2002, | |
Pre-refunded 10/01/11,
Insured: AMBAC
5.375% 10/01/13 | | | 1,060,000 | | | | 1,134,984 | | |
| FL Marion County Hospital District | |
| Munroe Regional Medical Center, | |
Series 1999,
Pre-refunded 10/01/09,
5.250% 10/01/11 | | | 90,000 | | | | 93,745 | | |
| FL Miami-Dade County School Board | |
| Series 2001 A, | |
Escrowed to Maturity,
Insured: MBIA
5.500% 05/01/10 | | | 2,000,000 | | | | 2,093,340 | | |
| | | Par ($) | | Value ($) | |
| FL Orange County Health Facilities Authority | |
| Orlando Regional Health Care System, | |
Series 1996 A,
Escrowed to Maturity,
Insured: MBIA
6.250% 10/01/16 | | | 4,705,000 | | | | 5,353,678 | | |
Series 1996 A,
Escrowed to Maturity,
Insured: MBIA
6.250% 10/01/16 | | | 115,000 | | | | 129,737 | | |
FL Orlando Utilities Commission Water &
Electric | |
| Series 1989 D, | |
Escrowed to Maturity,
6.750% 10/01/17 | | | 1,800,000 | | | | 2,036,790 | | |
| FL Orlando Utilities Commission | |
| Series 2002 C, | |
Pre-refunded 10/01/12,
5.250% 10/01/16 | | | 1,290,000 | | | | 1,385,602 | | |
| FL Pinellas County Housing Authority | |
| Affordable Housing, | |
Series 2001,
Escrowed to Maturity,
Insured: FSA
4.600% 12/01/10 | | | 7,000,000 | | | | 7,301,700 | | |
| FL Port St. Lucie Utilities | |
| Series 2003, | |
Pre-refunded 09/01/13,
Insured: MBIA
5.000% 09/01/16 | | | 1,000,000 | | | | 1,076,580 | | |
FL Reedy Creek Improvement District
Utilities | |
| Series 2003 1, | |
Pre-refunded 10/01/13,
Insured: MBIA
5.250% 10/01/15 | | | 1,490,000 | | | | 1,622,237 | | |
| FL Seminole County Sales Tax | |
| Series 2001, | |
Pre-refunded 10/01/11,
Insured: FGIC
5.375% 10/01/13 | | | 1,295,000 | | | | 1,398,548 | | |
| FL South Broward Hospital District | |
| Series 2002, | |
Pre-refunded 05/01/12:
5.500% 05/01/22 | | | 1,000,000 | | | | 1,082,460 | | |
| 5.600% 05/01/27 | | | 4,000,000 | | | | 4,342,960 | | |
See Accompanying Notes to Financial Statements.
47
Columbia Intermediate Municipal Bond Fund
October 31, 2008
| Municipal Bonds (continued) | |
| | | Par ($) | | Value ($) | |
FL Highlands County Health Facilities
Authority | |
| Adventist Health System, | |
Series 2005 B,
Pre-refunded 11/15/15:
5.000% 11/15/20 | | | 125,000 | | | | 133,652 | | |
| 5.000% 11/15/22 | | | 260,000 | | | | 277,997 | | |
| GA Municipal Electric Authority | |
| Series 1998 Y: | |
Escrowed to Maturity,
Insured: AMBAC
6.400% 01/01/13 | | | 165,000 | | | | 179,357 | | |
Pre-refunded 01/01/11,
Insured: AMBAC
6.400% 01/01/13 | | | 45,000 | | | | 48,479 | | |
| HI University of Hawaii | |
| Series 2002 A, | |
Pre-refunded 07/15/12,
Insured: FGIC
5.500% 07/15/14 | | | 1,000,000 | | | | 1,083,610 | | |
| IL Chicago Board of Education | |
| Series 2000, | |
Pre-refunded 12/01/10,
Insured: FGIC
5.600% 12/01/18 | | | 1,300,000 | | | | 1,383,083 | | |
| IL Chicago Housing Authority | |
| Capital Program, | |
Series 2001:
Escrowed to Maturity,
5.250% 07/01/12 | | | 5,975,000 | | | | 6,418,883 | | |
Pre-refunded 07/01/12,
5.375% 07/01/13 | | | 5,000,000 | | | | 5,380,400 | | |
| IL Health Facilities Authority | |
| Galesburg Cottage Hospital, | |
Series 2000,
Pre-refunded 05/01/10,
Insured: RAD
6.000% 05/01/15 | | | 1,500,000 | | | | 1,581,000 | | |
IL Kendall & Kane Counties Community
Unit School District No. 115 | |
| Series 2002, | |
Escrowed to Maturity,
Insured: FGIC
(b) 01/01/17 | | | 600,000 | | | | 415,056 | | |
| IL State | |
| Series 2002, | |
Pre-refunded 12/01/12,
Insured: FSA
5.375% 12/01/13 | | | 10,000,000 | | | | 10,856,800 | | |
| | | Par ($) | | Value ($) | |
| IN Toll Road Commission | |
| Series 1980, | |
Escrowed to Maturity,
9.000% 01/01/15 | | | 2,240,000 | | | | 2,681,325 | | |
| KS Department of Transportation | |
| Series 1998, | |
Escrowed to Maturity,
5.500% 09/01/14 | | | 1,575,000 | | | | 1,736,595 | | |
| KS Development Finance Authority | |
| Water Pollution Revolving Fund II, | |
Series 2002,
Pre-refunded 11/01/12,
5.500% 11/01/15 | | | 895,000 | | | | 974,977 | | |
KS Labette County Single Family
Mortgage | |
| Capital Accumulator Bonds, | |
Series 1998 A,
Escrowed to Maturity,
(b) 12/01/14 | | | 2,175,000 | | | | 1,694,412 | | |
KS Shawnee County Unified School
District No. 501 | |
| Series 2002, | |
Pre-refunded 02/01/12,
5.000% 02/01/14 | | | 1,000,000 | | | | 1,060,490 | | |
| KS Shawnee County | |
| Series 2002, | |
Pre-refunded 09/01/12,
Insured: FSA
5.250% 09/01/17 | | | 1,660,000 | | | | 1,788,418 | | |
KS Wyandotte County School
District No. 204 | |
| Series 2000 A, | |
Escrowed to Maturity,
Insured: FSA
6.375% 09/01/11 | | | 365,000 | | | | 400,248 | | |
KS Wyandotte County School
District No. 500 | |
| Series 2002, | |
Pre-refunded 09/01/12,
Insured: FSA
5.000% 09/01/20 | | | 1,890,000 | | | | 2,019,257 | | |
MA Health & Educational Facilities
Authority | |
| Partners Healthcare Systems, | |
Series 2001 C,
Pre-refunded 07/01/11,
6.000% 07/01/17 | | | 1,205,000 | | | | 1,314,884 | | |
See Accompanying Notes to Financial Statements.
48
Columbia Intermediate Municipal Bond Fund
October 31, 2008
| Municipal Bonds (continued) | |
| | | Par ($) | | Value ($) | |
| MA State | |
| Series 2001 C, | |
Pre-refunded 12/01/11,
5.375% 12/01/16 | | | 3,000,000 | | | | 3,224,490 | | |
| ME Municipal Bond Bank | |
| Series 2002 A, | |
Pre-refunded 11/01/11,
5.375% 11/01/16 | | | 355,000 | | | | 380,737 | | |
| MI Building Authority | |
| Series 2003 II, | |
Pre-refunded 10/15/13,
Insured: MBIA
5.000% 10/15/17 | | | 1,000,000 | | | | 1,068,860 | | |
| MI Detroit Sewage Disposal Revenue | |
| Series 2003 A, | |
Pre-refunded 07/01/13,
Insured: FSA
5.000% 07/01/14 | | | 7,180,000 | | | | 7,716,490 | | |
NJ Health Care Facilities Financing
Authority | |
| Atlantic Health Systems, | |
Series 1997 A,
Escrowed to Maturity,
Insured: AMBAC
6.000% 07/01/12 | | | 1,500,000 | | | | 1,636,545 | | |
| NJ Tobacco Settlement Financing Corp. | |
| Series 2003, | |
Pre-refunded 06/01/13,
6.750% 06/01/39 | | | 4,000,000 | | | | 4,571,440 | | |
| NJ Transportation Trust Fund Authority | |
| Series 1999 A, | |
Escrowed to Maturity,
5.625% 06/15/14 | | | 2,000,000 | | | | 2,212,100 | | |
| NJ Turnpike Authority | |
| Series 2000 A, | |
Escrowed to Maturity,
Insured: MBIA:
6.000% 01/01/11 | | | 875,000 | | | | 935,524 | | |
| 6.000% 01/01/13 | | | 925,000 | | | | 1,025,233 | | |
| NY Dormitory Authority | |
| Columbia University, | |
Series 2001 A,
Pre-refunded 07/01/11,
5.250% 07/01/20 | | | 2,000,000 | | | | 2,151,060 | | |
| NY Environmental Facilities Corp. | |
| Series 1994, | |
Escrowed to Maturity,
5.750% 06/15/09 | | | 50,000 | | | | 51,318 | | |
| | | Par ($) | | Value ($) | |
| NY Metropolitan Transportation Authority | |
| Series 1993 O, | |
Escrowed to Maturity,
5.500% 07/01/17 | | | 3,000,000 | | | | 3,276,120 | | |
| Series 1998 A, | |
Pre-refunded 07/01/11,
Insured: FSA
5.500% 07/01/15 | | | 1,530,000 | | | | 1,640,680 | | |
| Series 1998 R, | |
Escrowed to Maturity,
5.500% 07/01/14 | | | 1,740,000 | | | | 1,761,263 | | |
NY New York City Transitional Finance
Authority | |
| Series 1998 A, | |
Pre-refunded 11/15/12,
5.500% 11/15/16 | | | 170,000 | | | | 186,254 | | |
| NY New York City | |
| Series 2002 G, | |
Pre-refunded 08/01/12,
5.750% 08/01/18 | | | 380,000 | | | | 417,533 | | |
| OH London City School District | |
| Series 2001, | |
Pre-refunded 12/01/11,
Insured: FGIC
5.500% 12/01/15 | | | 375,000 | | | | 404,205 | | |
| OH Water Development Authority | |
| Water Pollution Control, | |
Series 2002,
Pre-refunded 06/01/12,
5.250% 06/01/18 | | | 5,535,000 | | | | 5,939,387 | | |
| PA Central Dauphin School District | |
| Series 1998 AA, | |
Escrowed to Maturity,
Insured: MBIA
5.000% 12/01/13 | | | 205,000 | | | | 221,181 | | |
| PA Chambersburg Area School District | |
| Series 2001, | |
Pre-refunded 06/15/11,
Insured: FSA
5.000% 06/15/12 | | | 300,000 | | | | 316,815 | | |
| PA Elizabeth Forward School District | |
| Series 1994 B, | |
Escrowed to Maturity,
Insured: MBIA
(b) 09/01/21 | | | 2,210,000 | | | | 1,120,956 | | |
See Accompanying Notes to Financial Statements.
49
Columbia Intermediate Municipal Bond Fund
October 31, 2008
| Municipal Bonds (continued) | |
| | | Par ($) | | Value ($) | |
| PA Ephrata Area School District | |
| Series 2001 A, | |
Pre-refunded 10/15/11,
Insured: FGIC
5.000% 04/15/14 | | | 750,000 | | | | 795,757 | | |
| PA Philadelphia School District | |
| Series 2000 A, | |
Pre-refunded 02/01/11,
Insured: FSA
5.750% 02/01/13 | | | 1,000,000 | | | | 1,066,030 | | |
| Series 2002 A, | |
Pre-refunded 02/01/12,
Insured: FSA
5.500% 02/01/15 | | | 1,000,000 | | | | 1,075,530 | | |
| PA State | |
| Series 2001, | |
Pre-refunded 01/15/11,
5.125% 01/15/16 | | | 10,000,000 | | | | 10,609,300 | | |
| PA Warwick School District | |
| Lancaster County, | |
Series 2001,
Pre-refunded 08/15/11,
Insured: FGIC
5.250% 02/15/12 | | | 750,000 | | | | 798,847 | | |
| SC Greenville County School District | |
| Series 2002, | |
Pre-refunded 12/01/12,
5.875% 12/01/17 | | | 1,000,000 | | | | 1,113,520 | | |
| TN Madison County | |
| Series 2002, | |
Pre-refunded 04/01/12,
5.000% 04/01/13 | | | 1,160,000 | | | | 1,233,614 | | |
| TX Alamo Community College District | |
| Series 2001, | |
Pre-refunded 11/01/11,
Insured: FSA
5.375% 11/01/16 | | | 460,000 | | | | 493,350 | | |
| TX Comal Independent School District | |
| Series 2001, | |
Pre-refunded 02/01/11,
Guarantor: PSFG
5.500% 02/01/14 | | | 575,000 | | | | 609,851 | | |
| TX Dallas Waterworks & Sewer Systems | |
| Series 2001, | |
Pre-refunded 04/01/11:
5.000% 10/01/12 | | | 1,300,000 | | | | 1,369,160 | | |
| 5.000% 10/01/16 | | | 7,300,000 | | | | 7,688,360 | | |
| | | Par ($) | | Value ($) | |
TX Harris County Health Facilities
Development Corp. | |
| St. Luke's Episcopal Hospital, | |
Series 2001,
Pre-refunded 08/15/11,
5.625% 02/15/16 | | | 2,780,000 | | | | 2,980,327 | | |
| TX Harris County | |
| Series 1992, | |
Escrowed to Maturity,
6.000% 12/15/10 | | | 1,000,000 | | | | 1,073,140 | | |
| TX Houston Area Water Corp. | |
| Series 2002, | |
Pre-refunded 03/01/12,
Insured: FGIC
5.500% 03/01/18 | | | 3,000,000 | | | | 3,228,180 | | |
| TX Houston Community College System | |
| Series 2001 A, | |
Pre-refunded 04/15/11,
Insured: MBIA
5.375% 04/15/15 | | | 480,000 | | | | 510,058 | | |
| TX Houston | |
| Series 1979, | |
Escrowed to Maturity,
6.400% 12/01/14 | | | 4,965,000 | | | | 5,370,194 | | |
| TX Lower Colorado River Authority | |
| Junior Lien, | |
Series 1993 5th,
Escrowed to Maturity,
5.375% 01/01/16 | | | 2,100,000 | | | | 2,300,172 | | |
TX North Central Health Facilities
Development Corp. | |
| Presbyterian Healthcare Residential, | |
Series 1996 B,
Escrowed to Maturity,
Insured: MBIA
5.500% 06/01/16 | | | 10,000,000 | | | | 10,796,500 | | |
TX North Harris Montgomery Community
College District | |
| Series 2002, | |
Pre-refunded 02/15/12,
Insured: FGIC
5.375% 02/15/16 | | | 965,000 | | | | 1,034,818 | | |
| TX Northside Independent School District | |
| Series 2002 A, | |
Pre-refunded 02/15/12,
Guarantor: PSFG
5.250% 02/15/20 | | | 2,485,000 | | | | 2,655,123 | | |
See Accompanying Notes to Financial Statements.
50
Columbia Intermediate Municipal Bond Fund
October 31, 2008
| Municipal Bonds (continued) | |
| | | Par ($) | | Value ($) | |
| TX San Antonio | |
| Series 2001, | |
Escrowed to Maturity,
5.250% 08/01/13 | | | 20,000 | | | | 21,731 | | |
| Series 2002, | |
Escrowed to Maturity,
5.000% 02/01/11 | | | 30,000 | | | | 31,493 | | |
| TX Spring Branch Independent School District | |
| Series 2001, | |
Pre-refunded 02/01/11,
Guarantor: PSFG
5.375% 02/01/18 | | | 1,820,000 | | | | 1,924,159 | | |
TX Tarrant County Health Facilities
Development Corp. | |
| Harris Methodist Health Systems, | |
Series 1994,
Escrowed to Maturity,
Insured: MBIA
6.000% 09/01/10 | | | 725,000 | | | | 754,587 | | |
| TX University of Texas | |
| Series 2001 B, | |
Pre-refunded 08/15/11,
5.375% 08/15/15 | | | 2,500,000 | | | | 2,671,150 | | |
| Series 2003 A, | |
Pre-refunded 08/15/13,
5.375% 08/15/15 | | | 1,000,000 | | | | 1,092,560 | | |
VA Arlington County Industrial
Development Authority | |
| Virginia Hospital Center, | |
Series 2001,
Pre-refunded 07/01/11,
5.500% 07/01/14 | | | 4,180,000 | | | | 4,503,323 | | |
| VA Tobacco Settlement Financing Corp. | |
| Series 2005, | |
Refunded to various dates/prices,
5.250% 06/01/19 | | | 2,500,000 | | | | 2,588,350 | | |
| WA King County | |
| Series 2002, | |
Escrowed to Maturity,
5.500% 12/01/13 | | | 970,000 | | | | 1,069,085 | | |
| WI State | |
| Series 2000 D, | |
Pre-refunded 05/01/11,
Insured: MBIA
5.500% 05/01/16 | | | 2,000,000 | | | | 2,132,860 | | |
| | | Par ($) | | Value ($) | |
| WV Hospital Finance Authority | |
| Charleston Area Medical Center: | |
Series 1993 A,
Escrowed to Maturity,
6.500% 09/01/23 | | | 3,980,000 | | | | 4,470,217 | | |
Series 2000,
Pre-refunded 09/01/10,
6.750% 09/01/22 | | | 1,535,000 | | | | 1,667,409 | | |
| Refunded/Escrowed Total | | | 237,400,405 | | |
| Tobacco – 1.4% | |
| AR Development Finance Authority | |
| Tobacco Settlement, | |
Series 2006,
Insured: AMBAC:
(b) 07/01/21 | | | 1,400,000 | | | | 687,162 | | |
| (b) 07/01/23 | | | 1,000,000 | | | | 429,870 | | |
| MI Tobacco Settlement Finance Authority | |
| Series 2007 A, | |
| 6.000% 06/01/34 | | | 2,500,000 | | | | 1,699,350 | | |
| NJ Tobacco Settlement Financing Corp. | |
| Series 2007 1-A: | |
| 4.250% 06/01/11 | | | 3,000,000 | | | | 2,885,550 | | |
| 4.500% 06/01/23 | | | 6,470,000 | | | | 5,209,644 | | |
| 4.625% 06/01/26 | | | 10,000,000 | | | | 7,139,500 | | |
| 5.000% 06/01/29 | | | 2,500,000 | | | | 1,561,950 | | |
OH Buckeye Tobacco Settlement
Financing Authority | |
| Series 2007 A-2, | |
| 5.125% 06/01/24 | | | 11,650,000 | | | | 9,086,417 | | |
| WI Badger Tobacco Asset Securitization Corp. | |
| Series 2002, | |
| 6.000% 06/01/17 | | | 5,000,000 | | | | 4,681,100 | | |
| Tobacco Total | | | 33,380,543 | | |
| Other Total | | | 359,885,959 | | |
| Other Revenue – 0.4% | |
| Recreation – 0.4% | |
| FL Board of Education | |
| Series 2002 A, | |
Insured: FGIC:
5.250% 07/01/18 | | | 2,675,000 | | | | 2,735,830 | | |
| 5.375% 07/01/17 | | | 1,450,000 | | | | 1,493,790 | | |
| 5.500% 07/01/12 | | | 1,000,000 | | | | 1,057,970 | | |
See Accompanying Notes to Financial Statements.
51
Columbia Intermediate Municipal Bond Fund
October 31, 2008
| Municipal Bonds (continued) | |
| | | Par ($) | | Value ($) | |
| FL Seminole Indian Tribe | |
| Series 2007 A, | |
| 5.750% 10/01/22 (e) | | | 2,000,000 | | | | 1,802,920 | | |
| OK Chickasaw Nation Health Systems | |
| Series 2007, | |
| 5.375% 12/01/17 | | | 4,500,000 | | | | 3,807,180 | | |
| Recreation Total | | | 10,897,690 | | |
| Other Revenue Total | | | 10,897,690 | | |
| Resource Recovery – 0.7% | |
| Disposal – 0.2% | |
| IL Development Finance Authority | |
| Waste Management, Inc., | |
Series 1997, AMT,
5.050% 01/01/10 (a) | | | 4,000,000 | | | | 3,935,560 | | |
| Disposal Total | | | 3,935,560 | | |
| Resource Recovery – 0.5% | |
FL Palm Beach County Solid Waste
Authority | |
| Series 1997 A, | |
Insured: AMBAC
6.000% 10/01/10 | | | 5,000,000 | | | | 5,285,850 | | |
NY Niagara County Industrial
Development Agency | |
| Series 2001 B, AMT, | |
| 5.550% 11/15/24 (a) | | | 8,000,000 | | | | 7,350,000 | | |
| Resource Recovery Total | | | 12,635,850 | | |
| Resource Recovery Total | | | 16,571,410 | | |
| Tax-Backed – 42.2% | |
| Local Appropriated – 2.1% | |
CA Orange County Public Financing
Authority | |
| Series 2005, | |
Insured: MBIA
5.000% 07/01/16 | | | 10,000,000 | | | | 10,412,700 | | |
| CA San Bernardino County | |
| Certificates of Participation, | |
Series 2002 A,
Insured: MBIA
5.000% 07/01/15 | | | 1,000,000 | | | | 1,014,080 | | |
| FL Broward County School Board | |
| Certificates of Paticipation, | |
Series 2006,
Insured: FSA
5.000% 07/01/14 | | | 1,580,000 | | | | 1,637,417 | | |
| | | Par ($) | | Value ($) | |
| FL Broward County | |
| Certificates of Participation, | |
Series 2004,
Insured: MBIA
5.000% 06/01/13 | | | 1,000,000 | | | | 1,047,440 | | |
| FL Collier County School Board | |
| Certificates of Participation, | |
Series 2002,
Insured: FSA
5.000% 02/15/13 | | | 1,500,000 | | | | 1,546,875 | | |
| FL Flagler County School Board | |
| Certificates of Participation, | |
Series 2005 A,
Insured: FSA
5.000% 08/01/18 | | | 2,320,000 | | | | 2,317,866 | | |
| FL Hillsborough County School Board | |
| Certificates of Participation, | |
Series 1998 A,
Insured: MBIA
5.500% 07/01/14 | | | 2,000,000 | | | | 2,104,040 | | |
| FL Lake County School Board | |
| Certificates of Participation, | |
Series 2006 C,
Insured: AMBAC
5.250% 06/01/18 | | | 1,500,000 | | | | 1,507,440 | | |
| FL Miami-Dade County Public Facilities | |
| Series 2005 B, | |
Insured: MBIA
5.000% 06/01/19 | | | 2,000,000 | | | | 1,925,280 | | |
| FL Miami-Dade County School Board | |
| Series 2006, | |
Insured: AMBAC
4.750% 11/01/23 | | | 1,000,000 | | | | 892,990 | | |
| FL Orange County School Board | |
| Certificates of Participation, | |
Series 2005 A,
Insured: MBIA
5.000% 08/01/18 | | | 1,000,000 | | | | 985,000 | | |
KS Johnson County Park & Recreation
District | |
| Certificates of Participation, | |
Series 2003 A,
Insured: MBIA
4.000% 09/01/15 | | | 100,000 | | | | 97,870 | | |
See Accompanying Notes to Financial Statements.
52
Columbia Intermediate Municipal Bond Fund
October 31, 2008
| Municipal Bonds (continued) | |
| | | Par ($) | | Value ($) | |
| MI Grand Rapids Building Authority | |
| Series 1998: | |
| 5.000% 04/01/12 | | | 1,205,000 | | | | 1,270,648 | | |
| 5.000% 04/01/13 | | | 1,000,000 | | | | 1,057,710 | | |
| 5.000% 04/01/14 | | | 1,415,000 | | | | 1,499,504 | | |
| NC Iredell County | |
| Certificates of Participation, | |
Series 2008,
Insured: FSA
5.250% 06/01/17 | | | 1,710,000 | | | | 1,782,470 | | |
| SC Berkeley County School District | |
| Series 2003, | |
| 5.250% 12/01/18 | | | 1,000,000 | | | | 1,002,470 | | |
SC Charleston Educational Excellence
Financing Corp. | |
| Charleston County School District, | |
Series 2005,
5.250% 12/01/24 | | | 10,000,000 | | | | 9,550,000 | | |
SC Dorchester County School
District No. 2 | |
| Series 2004, | |
| 5.250% 12/01/17 | | | 2,000,000 | | | | 2,028,680 | | |
| SC Greenville County School District | |
| Series 2005, | |
| 5.500% 12/01/18 | | | 5,000,000 | | | | 5,165,050 | | |
SC Newberry Investing in Children's
Education | |
| Series 2005, | |
| 5.250% 12/01/19 | | | 1,500,000 | | | | 1,310,340 | | |
| Local Appropriated Total | | | 50,155,870 | | |
| Local General Obligations – 11.9% | |
| AK Anchorage | |
| Series 2004 B, | |
Insured: AMBAC
5.250% 12/01/15 | | | 5,000,000 | | | | 5,355,600 | | |
AZ Maricopa County Unified High School
District No. 210 | |
| Series 2003, | |
Insured: MBIA
5.000% 07/01/15 | | | 6,300,000 | | | | 6,672,708 | | |
| AZ Tucson | |
| Series 1998, | |
| 5.500% 07/01/18 | | | 4,760,000 | | | | 5,176,167 | | |
| | | Par ($) | | Value ($) | |
| CA Carlsbad Unified School District | |
| Series 1997, | |
Insured: FGIC
(b) 11/01/14 | | | 300,000 | | | | 228,585 | | |
| CA Los Angeles Unified School District | |
| Series 2007 A-1, | |
Insured: FSA
4.500% 07/01/24 | | | 4,000,000 | | | | 3,646,080 | | |
| Series 2007, | |
Insured: FSA
5.000% 07/01/20 | | | 6,230,000 | | | | 6,323,699 | | |
| CA Manteca Unified School District | |
| Series 2006, | |
Insured: MBIA
(b) 08/01/24 | | | 5,000,000 | | | | 1,900,800 | | |
| CA Monrovia Unified School District | |
| Series 2005, | |
Insured: MBIA
5.250% 08/01/21 | | | 5,600,000 | | | | 5,629,568 | | |
| CA Natomas Unified School District | |
| Series 1999, | |
Insured: MBIA
5.850% 03/01/15 | | | 250,000 | | | | 265,868 | | |
CA San Mateo County Community
College | |
| Series 2006 A, | |
Insured: MBIA
(b) 09/01/20 | | | 9,310,000 | | | | 4,794,184 | | |
| CA Union Elementary School District | |
| Series 1999 A, | |
Insured: FGIC
(b) 09/01/20 | | | 1,000,000 | | | | 515,840 | | |
CA West Contra Costa Unified School
District | |
| Series 2005, | |
Insured: FGIC
(b) 08/01/20 | | | 7,285,000 | | | | 3,558,358 | | |
| CO Adams County School District No. 12 | |
| Series 1995 A, | |
Insured: MBIA
(b) 12/15/12 | | | 1,300,000 | | | | 1,106,196 | | |
CO Jefferson County School
Disctrict R-001 | |
| Series 1997 1, | |
Insured: MBIA
6.500% 12/15/11 | | | 10,000,000 | | | | 10,968,000 | | |
See Accompanying Notes to Financial Statements.
53
Columbia Intermediate Municipal Bond Fund
October 31, 2008
| Municipal Bonds (continued) | |
| | | Par ($) | | Value ($) | |
| FL Palm Beach County | |
| Series 1998, | |
| 5.500% 12/01/11 | | | 2,000,000 | | | | 2,134,580 | | |
| FL Reedy Creek Improvement District | |
| Series 2004 A, | |
Insured: MBIA
5.000% 06/01/17 | | | 1,000,000 | | | | 1,021,640 | | |
| IL Chicago Board of Education | |
| Series 1996, | |
Insured: MBIA
6.250% 12/01/12 | | | 2,100,000 | | | | 2,293,746 | | |
| Series 2005 A, | |
Insured: AMBAC
5.500% 12/01/22 | | | 5,000,000 | | | | 5,184,200 | | |
| IL Chicago | |
| Series 1999, | |
Insured: FGIC
5.250% 01/01/18 | | | 7,540,000 | | | | 7,738,076 | | |
| Series 2000 C, | |
Insured: FGIC
5.750% 01/01/13 | | | 190,000 | | | | 198,962 | | |
| Series 2004 A, | |
Insured: FSA
5.250% 01/01/17 | | | 1,000,000 | | | | 1,043,080 | | |
| IL Du Page County School District | |
| Series 1997, | |
Insured: FGIC
6.750% 02/01/11 | | | 1,145,000 | | | | 1,231,585 | | |
IL Kendall & Kane Counties Community
Unit School District No. 115 | |
| Series 2002, | |
Insured: FGIC
(b) 01/01/17 | | | 3,050,000 | | | | 2,017,849 | | |
KS Johnson County Unified School
District No. 231 | |
| Series 2001 A, | |
Insured: FSA
5.500% 10/01/15 | | | 50,000 | | | | 54,240 | | |
KS Johnson County Unified School
District No. 232 | |
| Series 2004, | |
Insured: MBIA
5.000% 09/01/15 | | | 150,000 | | | | 157,880 | | |
KS Leavenworth County Unified School
District No. 464 | |
| Series 2005 A, | |
Insured: MBIA
5.000% 09/01/19 | | | 1,030,000 | | | | 1,045,409 | | |
| | | Par ($) | | Value ($) | |
KS Montgomery County Unified School
District No. 445 | |
| Series 2002, | |
Insured: FGIC
6.250% 04/01/12 | | | 1,065,000 | | | | 1,153,331 | | |
KS Reno County Unified School
District No. 313 | |
| Series 1996 B, | |
Insured: FSA
5.900% 09/01/10 | | | 995,000 | | | | 1,053,038 | | |
KS Shawnee County Unified School
District No. 437 | |
| Series 2001, | |
Insured: FSA
5.500% 09/01/13 | | | 1,555,000 | | | | 1,635,673 | | |
KS Wyandotte County Unified School
District No. 204 | |
| Series 2000 A, | |
Insured: FSA
6.375% 09/01/11 | | | 135,000 | | | | 147,004 | | |
| MI Detroit City School District | |
| Series 2002 A, | |
Insured: FGIC
6.000% 05/01/19 | | | 2,000,000 | | | | 2,139,400 | | |
| Series 2003 B, | |
Insured: FGIC
5.250% 05/01/14 | | | 2,000,000 | | | | 2,091,380 | | |
MN Elk River Independent School
District No. 728 | |
| Series 2001 A, | |
Insured: MBIA
5.000% 02/01/17 | | | 2,000,000 | | | | 2,084,400 | | |
| NC Cary Water & Public Improvement | |
| Series 2001, | |
| 5.000% 03/01/13 | | | 4,300,000 | | | | 4,479,224 | | |
ND West Fargo Public School
District No. 6 | |
| Series 2002, | |
Insured: FGIC
5.250% 05/01/17 | | | 3,600,000 | | | | 3,699,072 | | |
| NH Manchester | |
| Series 2004, | |
Insured: MBIA:
5.500% 06/01/18 | | | 4,215,000 | | | | 4,480,966 | | |
| 5.500% 06/01/19 | | | 4,450,000 | | | | 4,768,175 | | |
See Accompanying Notes to Financial Statements.
54
Columbia Intermediate Municipal Bond Fund
October 31, 2008
| Municipal Bonds (continued) | |
| | | Par ($) | | Value ($) | |
| NV Clark County School District | |
| Series 2001 C, | |
Insured: FGIC
5.375% 06/15/13 | | | 8,895,000 | | | | 9,513,291 | | |
| Series 2003, | |
Insured: MBIA
5.000% 06/15/16 | | | 10,760,000 | | | | 11,123,903 | | |
| NY New York City | |
| Series 2002 D, | |
| 5.625% 06/01/14 | | | 2,500,000 | | | | 2,631,550 | | |
| Series 2002 E, | |
Insured: MBIA
5.625% 08/01/15 | | | 1,000,000 | | | | 1,063,950 | | |
| Series 2002 G: | |
| 5.750% 08/01/18 | | | 620,000 | | | | 645,625 | | |
Insured: MBIA:
5.625% 08/01/13 | | | 2,500,000 | | | | 2,673,050 | | |
| 5.750% 08/01/11 | | | 14,400,000 | | | | 15,200,928 | | |
| Series 2005 D, | |
| 5.000% 08/01/13 | | | 4,000,000 | | | | 4,158,080 | | |
| Series 2005, | |
| 5.000% 08/01/20 | | | 10,000,000 | | | | 9,732,500 | | |
| Series 2007 D-1, | |
| 5.000% 12/01/21 | | | 5,900,000 | | | | 5,712,616 | | |
| OH Cleveland | |
| Series 2005, | |
Insured: AMBAC
5.500% 10/01/16 | | | 7,710,000 | | | | 8,165,738 | | |
| OH Forest Hills Local School District | |
| Series 1997, | |
Insured: MBIA
6.000% 12/01/10 | | | 1,460,000 | | | | 1,559,163 | | |
| OH Marion City School District | |
| Series 2000, | |
Insured: FSA
6.500% 12/01/14 | | | 500,000 | | | | 572,895 | | |
| OH Mason City School District | |
| Series 2005, | |
Insured: FGIC
5.250% 12/01/19 | | | 2,250,000 | | | | 2,309,467 | | |
OR Linn County Community School
District No. 9 Lebanon | |
| Series 2001, | |
Insured: MBIA
5.250% 06/15/17 | | | 1,120,000 | | | | 1,165,293 | | |
| | | Par ($) | | Value ($) | |
OR Yamhill County School
District No. 29J Newberg | |
| Series 2005, | |
Insured: FGIC
5.500% 06/15/17 | | | 2,500,000 | | | | 2,718,425 | | |
| PA Northampton County | |
| Series 1999, | |
| 5.000% 08/15/16 | | | 345,000 | | | | 351,234 | | |
| PA Oxford Area School District | |
| Series 2001 A, | |
Insured: FGIC
5.250% 02/15/11 | | | 500,000 | | | | 522,670 | | |
| PA Philadelphia School District | |
| Series 2004 D, | |
Insured: FGIC
5.000% 06/01/15 | | | 250,000 | | | | 247,328 | | |
| PA Philadelphia | |
| Series 2003 A, | |
Insured: SYNC
5.250% 02/15/15 | | | 315,000 | | | | 322,002 | | |
| PA Pittsburgh School District | |
| Series 2002, | |
Insured: FSA
5.500% 09/01/12 | | | 500,000 | | | | 537,900 | | |
| PA Pittsburgh | |
| Series 2005 A, | |
Insured: MBIA
5.000% 09/01/17 | | | 170,000 | | | | 165,808 | | |
PA Upper St. Clair Township School
District | |
| Series 2002, | |
Insured: FSA
5.375% 07/15/13 | | | 1,000,000 | | | | 1,059,900 | | |
| PA Westmoreland County | |
| Series 1997, | |
Insured: FGIC
(b) 12/01/18 | | | 1,000,000 | | | | 555,510 | | |
| SC Charleston County School District | |
| Series 2001, | |
| 5.000% 02/01/14 | | | 850,000 | | | | 881,833 | | |
| TN Anderson County | |
| Series 2001, | |
Insured: FSA
5.000% 04/01/13 | | | 1,535,000 | | | | 1,578,180 | | |
See Accompanying Notes to Financial Statements.
55
Columbia Intermediate Municipal Bond Fund
October 31, 2008
| Municipal Bonds (continued) | |
| | | Par ($) | | Value ($) | |
TN Blount County Public Building
Authority | |
| Local Government Public Improvement, | |
Series 2004 B-5-A,
Insured: FGIC
5.000% 06/01/16 | | | 1,075,000 | | | | 1,063,412 | | |
| TN Chattanooga | |
| Series 2005 A, | |
Insured: FSA
5.000% 09/01/14 | | | 4,150,000 | | | | 4,434,814 | | |
| TN Dickson County | |
| Series 2002, | |
Insured: FGIC
5.000% 03/01/14 | | | 1,000,000 | | | | 1,046,770 | | |
| Series 2003, | |
Insured: FGIC
5.000% 06/01/14 | | | 1,000,000 | | | | 1,029,600 | | |
| TN Franklin Special School District | |
| Series 1999, | |
Insured: FSA
(b) 06/01/20 | | | 2,000,000 | | | | 1,076,720 | | |
| TN Hamilton County | |
| Series 1998 B, | |
| 5.100% 08/01/24 | | | 500,000 | | | | 502,115 | | |
| TN Kingsport | |
| Series 2004, | |
Insured: AMBAC
5.000% 03/01/14 | | | 1,000,000 | | | | 1,058,320 | | |
| TN Lawrenceburg Public Building Authority | |
| Series 2001 B, | |
Insured: FSA
5.500% 07/01/16 | | | 1,330,000 | | | | 1,389,158 | | |
| TN Madison County | |
| Series 2002, | |
| 5.000% 04/01/13 | | | 390,000 | | | | 407,971 | | |
| TN Overton County | |
| Series 2004, | |
Insured: MBIA
5.000% 04/01/16 | | | 1,000,000 | | | | 1,040,790 | | |
| TX Aldine Independent School District | |
| Series 2005, | |
Guarantor: PSFG
5.250% 02/15/15 | | | 1,655,000 | | | | 1,762,625 | | |
| TX Barbers Hill Independent School District | |
| Series 2003, | |
Guarantor: PSFG
5.000% 02/15/22 | | | 1,030,000 | | | | 1,030,670 | | |
| | | Par ($) | | Value ($) | |
TX Brownsville Independent School
District | |
| Series 2005, | |
Guarantor: PSFG
5.000% 08/15/15 | | | 1,000,000 | | | | 1,059,000 | | |
TX Brownwood Independent School
District | |
| Series 2005, | |
Insured: FGIC
5.250% 02/15/17 | | | 1,310,000 | | | | 1,343,012 | | |
TX Carrollton-Farmers Branch
Independent School District | |
| Series 2005 A, | |
Insured: MBIA
5.000% 02/15/14 | | | 1,280,000 | | | | 1,351,642 | | |
| TX Cedar Hill Independent School District | |
| Series 2000, | |
Guarantor: PSFG
(b) 08/15/16 | | | 1,460,000 | | | | 909,828 | | |
| TX Comal Independent School District | |
| Series 2001, | |
Guarantor: PSFG
5.500% 02/01/14 | | | 425,000 | | | | 442,438 | | |
| TX Conroe Independent School District | |
| Series 2005 C, | |
Guarantor: PSFG
5.000% 02/15/19 | | | 1,650,000 | | | | 1,685,129 | | |
| TX Corpus Christi | |
| Series 2002, | |
Insured: FSA
5.500% 09/01/15 | | | 1,655,000 | | | | 1,753,787 | | |
| TX Dickinson Independent School District | |
| Series 2006, | |
Guarantor: PSFG
5.000% 02/15/20 | | | 2,405,000 | | | | 2,433,523 | | |
TX Duncanville Independent School
District | |
| Series 2005, | |
Guarantor: PSFG
(b) 02/15/22 | | | 2,000,000 | | | | 949,040 | | |
| TX El Paso | |
| Series 2005, | |
Insured: FGIC
5.250% 08/15/14 | | | 2,000,000 | | | | 2,139,660 | | |
See Accompanying Notes to Financial Statements.
56
Columbia Intermediate Municipal Bond Fund
October 31, 2008
| Municipal Bonds (continued) | |
| | | Par ($) | | Value ($) | |
| TX Fort Bend Independent School District | |
| Series 2000, | |
Guarantor: PSFG
5.250% 08/15/19 | | | 1,000,000 | | | | 1,010,540 | | |
| TX Harris County | |
| Series 2001, | |
| 5.000% 10/01/12 | | | 10,990,000 | | | | 11,457,624 | | |
| TX Houston Independent School District | |
| Series 2007, | |
Insured: PSFG
4.500% 02/15/25 | | | 5,000,000 | | | | 4,476,100 | | |
| TX Houston | |
| Series 2005 D, | |
Insured: AMBAC
5.000% 03/01/17 | | | 1,000,000 | | | | 1,033,070 | | |
| Series 2005 E, | |
Insured: AMBAC
5.000% 03/01/20 | | | 2,525,000 | | | | 2,537,069 | | |
| TX Irving | |
| Series 2005 A, | |
| 5.000% 11/15/18 | | | 2,000,000 | | | | 2,069,240 | | |
TX Johnson City Independent School
District | |
| Series 2003, | |
Guarantor: PSFG
3.000% 02/15/09 | | | 50,000 | | | | 50,178 | | |
| TX Katy Independent School District | |
| Series 1992, | |
Guarantor: PSFG
(b) 08/15/11 | | | 1,775,000 | | | | 1,607,973 | | |
| TX La Joya Independent School District | |
| Series 2005, | |
Guarantor: PSFG
5.000% 02/15/20 | | | 1,000,000 | | | | 1,010,460 | | |
TX La Marque Independent School
District | |
| Series 2003, | |
Guarantor: PSFG
5.000% 02/15/21 | | | 1,740,000 | | | | 1,745,725 | | |
| TX Laredo | |
| Series 2005, | |
Insured: AMBAC
5.000% 08/15/20 | | | 1,065,000 | | | | 1,059,579 | | |
| | | Par ($) | | Value ($) | |
TX North Harris Montgomery Community
College District | |
| Series 2001, | |
Insured: MBIA
5.375% 02/15/16 | | | 420,000 | | | | 431,773 | | |
| Series 2002, | |
Insured: FGIC
5.375% 02/15/16 | | | 35,000 | | | | 36,321 | | |
| TX Northside Independent School District | |
| Series 2002 A, | |
Guarantor: PSFG
5.250% 02/15/20 | | | 800,000 | | | | 811,648 | | |
| TX Pearland | |
| Series 2005, | |
Insured: MBIA
5.000% 03/01/24 | | | 2,525,000 | | | | 2,440,842 | | |
TX Rio Grande City Consolidated
Independent School District | |
| Series 2002, | |
Guarantor: PSFG
5.000% 08/15/19 | | | 1,190,000 | | | | 1,203,614 | | |
TX San Antonio Independent School
District | |
| Series 2001 B, | |
Guarantor: PSFG
(b) 08/15/11 | | | 3,500,000 | | | | 3,170,650 | | |
TX San Benito Consolidated Independent
School District | |
| Series 2005, | |
Guarantor: PSFG
5.000% 02/15/16 | | | 2,260,000 | | | | 2,365,610 | | |
| TX Sherman Independent School District | |
| Series 2005 A, | |
Guarantor: PSFG
5.000% 02/15/16 | | | 1,000,000 | | | | 1,046,730 | | |
TX Spring Branch Independent School
District | |
| Series 2001, | |
Guarantor: PSFG
5.375% 02/01/18 | | | 965,000 | | | | 983,325 | | |
TX Waxahachie Independent School
District | |
| Series 2000, | |
Guarantor: PSFG:
(b) 08/15/15 | | | 210,000 | | | | 143,951 | | |
| (b) 08/15/17 | | | 245,000 | | | | 146,265 | | |
See Accompanying Notes to Financial Statements.
57
Columbia Intermediate Municipal Bond Fund
October 31, 2008
| Municipal Bonds (continued) | |
| | | Par ($) | | Value ($) | |
| TX Webb County | |
| Series 2005, | |
Insured: AMBAC
5.000% 02/01/17 | | | 1,600,000 | | | | 1,643,312 | | |
| TX West University Place | |
| Series 2002, | |
| 5.500% 02/01/15 | | | 1,440,000 | | | | 1,514,405 | | |
TX White Settlement Independent
School District | |
| Series 2003, | |
Guarantor: PSFG
5.375% 08/15/19 | | | 1,910,000 | | | | 1,965,810 | | |
| TX Williamson County | |
| Series 2005, | |
Insured: MBIA
5.000% 02/15/16 | | | 1,985,000 | | | | 2,066,603 | | |
| WA Clark County School District No. 117 | |
| Series 1998, | |
Insured: AMBAC
5.000% 12/01/12 | | | 1,805,000 | | | | 1,880,124 | | |
| WA Clark County School District No. 37 | |
| Series 2001 C, | |
Insured: FGIC
(b) 12/01/16 | | | 1,000,000 | | | | 656,940 | | |
WA King & Snohomish Counties School
District | |
| Series 1993, | |
Insured: FGIC
5.600% 12/01/10 | | | 6,150,000 | | | | 6,340,096 | | |
| WA Seattle | |
| Series 1998 A, | |
| 5.500% 03/01/11 | | | 1,370,000 | | | | 1,449,049 | | |
WA Spokane County School
District No. 354 | |
| Series 1998, | |
Insured: FGIC
5.250% 12/01/11 | | | 1,600,000 | | | | 1,662,544 | | |
| WI Milwaukee County | |
| Series 2001 A: | |
| 5.000% 10/01/12 | | | 2,500,000 | | | | 2,611,525 | | |
| 5.000% 10/01/13 | | | 2,500,000 | | | | 2,592,500 | | |
| Local General Obligations Total | | | 288,294,621 | | |
| Special Non-Property Tax – 8.6% | |
| AZ Scottsdale Municipal Property Corp. | |
| Series 2006, | |
| 5.000% 07/01/21 | | | 3,000,000 | | | | 3,067,710 | | |
| | | Par ($) | | Value ($) | |
CA Los Angeles County Metropolitan
Transportation Authority | |
| Series 2003 A, | |
Insured: FSA:
5.000% 07/01/17 | | | 6,280,000 | | | | 6,454,772 | | |
| 5.000% 07/01/18 | | | 7,700,000 | | | | 7,834,057 | | |
CA San Francisco Bay Area Rapid Transit
District | |
| Series 2005 A, | |
Insured: MBIA
5.000% 07/01/20 | | | 2,040,000 | | | | 2,050,200 | | |
| CO Department of Transportation | |
| Series 2002 B, | |
Insured: MBIA:
5.500% 06/15/14 | | | 3,000,000 | | | | 3,243,870 | | |
| 5.500% 06/15/15 | | | 1,000,000 | | | | 1,081,270 | | |
| CT Special Tax Obligation | |
| Series 2001 B, | |
Insured: FSA
5.375% 10/01/12 | | | 1,000,000 | | | | 1,055,420 | | |
FL Broward County Professional Sports
Facilities | |
| Series 2006 A, | |
Insured: AMBAC
5.000% 09/01/18 | | | 2,500,000 | | | | 2,461,150 | | |
| FL Division Bond Finance Department | |
| Series 1998, | |
Insured: FSA
6.000% 07/01/13 | | | 10,000,000 | | | | 10,918,700 | | |
FL Hillsborough County Industrial
Development Authority | |
| Series 2002 B, | |
Insured: AMBAC
5.500% 09/01/15 | | | 2,335,000 | | | | 2,453,104 | | |
FL Jacksonville Guaranteed Entitlement
Improvement | |
| Series 2002, | |
Insured: FGIC:
5.375% 10/01/18 | | | 3,450,000 | | | | 3,510,064 | | |
| 5.375% 10/01/19 | | | 3,720,000 | | | | 3,766,277 | | |
| FL Jacksonville Sales Tax | |
| Series 2001, | |
Insured: FGIC
5.500% 10/01/12 | | | 2,000,000 | | | | 2,124,460 | | |
| Series 2002, | |
Insured: FGIC
5.375% 10/01/18 | | | 1,000,000 | | | | 1,004,470 | | |
See Accompanying Notes to Financial Statements.
58
Columbia Intermediate Municipal Bond Fund
October 31, 2008
| Municipal Bonds (continued) | |
| | | Par ($) | | Value ($) | |
| Series 2003, | |
Insured: MBIA
5.250% 10/01/19 | | | 1,080,000 | | | | 1,095,347 | | |
| FL Jacksonville | |
| Series 2003 C, AMT, | |
Insured: MBIA
5.250% 10/01/19 | | | 1,750,000 | | | | 1,564,115 | | |
| FL Lee County | |
| Series 1997 A, | |
Insured: MBIA
5.750% 10/01/11 | | | 1,000,000 | | | | 1,047,600 | | |
| FL Miami-Dade County Transit Sales Tax | |
| Series 2006, | |
Insured: SYNC
5.000% 07/01/19 | | | 5,040,000 | | | | 4,968,029 | | |
FL Osceola County Tourist
Development Tax | |
| Series 2002 A, | |
Insured: FGIC
5.500% 10/01/14 | | | 1,555,000 | | | | 1,604,293 | | |
FL Palm Beach County Public
Improvement | |
| Series 2004, | |
| 5.000% 08/01/17 | | | 1,000,000 | | | | 1,022,520 | | |
FL Polk County Transportation
Improvement | |
| Series 2004, | |
Insured: FSA
5.000% 12/01/25 (a) | | | 1,000,000 | | | | 1,041,390 | | |
| FL Tampa Sports Authority | |
| Series 1995, | |
Insured: MBIA:
5.750% 10/01/15 | | | 2,500,000 | | | | 2,635,275 | | |
| 5.750% 10/01/20 | | | 1,000,000 | | | | 1,006,380 | | |
| IL Dedicated Tax Capital Appreciation | |
| Series 1990, | |
Insured: AMBAC
(b) 12/15/17 | | | 2,540,000 | | | | 1,590,497 | | |
| IL Regional Transportation Authority | |
| Series 1994 C, | |
Insured: FGIC
7.750% 06/01/11 | | | 1,750,000 | | | | 1,947,050 | | |
| IL State | |
| Series 2002, | |
Insured: FGIC
5.500% 06/15/15 | | | 1,000,000 | | | | 1,079,460 | | |
| | | Par ($) | | Value ($) | |
| KS Wichita | |
| Series 2003-772, | |
Insured: FGIC
4.250% 09/01/16 | | | 1,260,000 | | | | 1,262,369 | | |
| KS Wyandotte County Unified Government | |
| Series 2005 B, | |
| 4.750% 12/01/16 | | | 2,000,000 | | | | 1,791,800 | | |
| MA Bay Transportation Authority | |
| Series 2000 A, | |
| 5.750% 07/01/14 | | | 250,000 | | | | 259,470 | | |
| MA State | |
| Series 2005 A, | |
Insured: FSA
5.500% 06/01/16 | | | 13,615,000 | | | | 14,712,505 | | |
| MD Department of Transportation | |
| Series 2002, | |
| 5.500% 02/01/15 | | | 3,750,000 | | | | 4,106,475 | | |
| MI Trunk Line | |
| Series 1998 A, | |
| 5.500% 11/01/16 | | | 2,000,000 | | | | 2,158,620 | | |
| Series 2005, | |
Insured: FSA
5.250% 11/01/17 | | | 5,050,000 | | | | 5,335,426 | | |
| NJ Economic Development Authority | |
| Series 2004: | |
| 5.375% 06/15/15 | | | 4,000,000 | | | | 3,565,160 | | |
| 5.500% 06/15/16 | | | 5,500,000 | | | | 4,852,045 | | |
| NM Bernalillo County | |
| Series 1998, | |
| 5.250% 04/01/27 | | | 3,000,000 | | | | 2,929,770 | | |
| NM Dona Ana County | |
| Series 1998, | |
Insured: AMBAC
5.500% 06/01/16 | | | 750,000 | | | | 775,643 | | |
NV Sparks Tourism Improvement
District No. 1 | |
| Series 2008 A, | |
| 6.500% 06/15/20 | | | 5,000,000 | | | | 4,397,800 | | |
| NY Local Government Assistance Corp. | |
| Series 1992 C, | |
| 6.000% 04/01/12 | | | 150,000 | | | | 157,391 | | |
| NY Metropolitan Transportation Authority | |
| Series 2004 A, | |
Insured: FGIC:
5.250% 11/15/16 | | | 3,000,000 | | | | 3,071,010 | | |
| 5.250% 11/15/17 | | | 4,000,000 | | | | 4,048,720 | | |
See Accompanying Notes to Financial Statements.
59
Columbia Intermediate Municipal Bond Fund
October 31, 2008
| Municipal Bonds (continued) | |
| | | Par ($) | | Value ($) | |
NY Nassau County Interim Finance
Authority | |
| Series 2003 B, | |
Insured: AMBAC
5.000% 11/15/14 | | | 5,720,000 | | | | 5,961,098 | | |
NY New York City Transitional Finance
Authority | |
| Series 1998 A, | |
| 5.500% 11/15/16 | | | 1,330,000 | | | | 1,406,448 | | |
| Series 2002 A, | |
5.500% 11/01/26 (f)
(14.000% 11/01/11) | | | 10,000,000 | | | | 10,428,700 | | |
| Series 2004 C, | |
| 5.250% 02/01/18 | | | 3,500,000 | | | | 3,624,600 | | |
| Series 2007 C-1, | |
| 5.000% 11/01/20 | | | 10,300,000 | | | | 10,415,360 | | |
| NY Urban Development Corp. | |
| Series 2004 A, | |
Insured: MBIA
5.500% 03/15/20 | | | 29,450,000 | | | | 31,275,900 | | |
| PA Pittsburgh & Allegheny County | |
| Series 1999, | |
Insured: AMBAC
5.250% 02/01/12 | | | 500,000 | | | | 511,280 | | |
PR Commonwealth of Puerto Rico
Highway & Transportation Authority | |
| Series 2002 E, | |
Insured: FSA
5.500% 07/01/12 | | | 1,000,000 | | | | 1,046,810 | | |
| Series 2005 L, | |
Insured: CIFG
5.250% 07/01/18 | | | 2,000,000 | | | | 2,013,420 | | |
PR Commonwealth of Puerto Rico
Infrastructure Financing Authority | |
| Series 2005 C, | |
Insured: AMBAC
5.500% 07/01/27 | | | 5,000,000 | | | | 4,600,050 | | |
TX Corpus Christi Business & Job
Development Corp. | |
| Series 2002, | |
Insured: AMBAC:
5.500% 09/01/14 | | | 2,065,000 | | | | 2,149,397 | | |
| 5.500% 09/01/18 | | | 1,250,000 | | | | 1,261,337 | | |
| TX Harris County | |
| Series 2004 B, | |
Insured: FSA
5.000% 08/15/32 (a) | | | 2,000,000 | | | | 2,089,080 | | |
| | | Par ($) | | Value ($) | |
| TX Houston Hotel Occupancy | |
| Series 2001 B, | |
Insured: AMBAC:
(b) 09/01/17 | | | 2,000,000 | | | | 1,251,000 | | |
| 5.250% 09/01/19 | | | 1,195,000 | | | | 1,202,720 | | |
| 5.250% 09/01/20 | | | 1,265,000 | | | | 1,267,543 | | |
VA Peninsula Town Center Community
Development Authority | |
| Series 2007, | |
| 6.250% 09/01/24 | | | 2,375,000 | | | | 1,964,576 | | |
| Special Non-Property Tax Total | | | 207,521,003 | | |
| Special Property Tax – 1.5% | |
CA Oceanside Community Development
Commission Tax Allocation | |
| Series 2003, | |
| 5.200% 09/01/17 | | | 860,000 | | | | 775,221 | | |
FL Ave Maria Stewardship Community
Development District | |
| Series 2006, | |
| 4.800% 11/01/12 | | | 1,000,000 | | | | 869,900 | | |
FL Oakmont Grove Community Development
District | |
| Series 2007 B, | |
| 5.250% 05/01/12 | | | 2,000,000 | | | | 1,781,240 | | |
FL Parker Road Community Development
District | |
| Series 2007 B, | |
| 5.350% 05/01/15 | | | 2,000,000 | | | | 1,673,820 | | |
FL Six Mile Creek Community Development
District | |
| Series 2007: | |
| 5.500% 05/01/17 | | | 2,000,000 | | | | 1,544,780 | | |
| 5.650% 05/01/22 | | | 3,000,000 | | | | 2,112,270 | | |
FL Sweetwater Creek Community
Development District | |
| Series 2007 B-1, | |
| 5.300% 05/01/17 | | | 4,485,000 | | | | 3,500,946 | | |
| Series 2007 B-2, | |
| 5.125% 05/01/13 | | | 2,680,000 | | | | 2,312,197 | | |
FL Tolomato Community Development
District | |
| Series 2007, | |
| 6.450% 05/01/23 | | | 7,500,000 | | | | 6,410,175 | | |
FL Viera East Community Development
District | |
| Series 2006, | |
Insured: MBIA
5.750% 05/01/19 | | | 1,910,000 | | | | 2,038,314 | | |
See Accompanying Notes to Financial Statements.
60
Columbia Intermediate Municipal Bond Fund
October 31, 2008
| Municipal Bonds (continued) | |
| | | Par ($) | | Value ($) | |
FL Waterset North Community
Development District | |
| Series 2007 B, | |
| 6.550% 11/01/15 | | | 10,000,000 | | | | 8,838,900 | | |
FL West Palm Beach Community
Redevelopment | |
| Series 2005 A, | |
| 5.000% 03/01/25 | | | 980,000 | | | | 754,433 | | |
| MO Fenton | |
| Tax Increment Revenue, | |
Series 2006,
4.500% 04/01/21 | | | 1,270,000 | | | | 1,229,589 | | |
| NV Las Vegas Redevelopment Agency | |
| Sub Lien-Fremont Street, | |
Series 2003 A,
5.000% 06/15/13 | | | 3,685,000 | | | | 3,625,929 | | |
| Special Property Tax Total | | | 37,467,714 | | |
| State Appropriated – 7.5% | |
| AZ University of Arizona | |
| Certificates of Participation, | |
Series 2002 A,
Insured: AMBAC
5.500% 06/01/15 | | | 45,000 | | | | 47,151 | | |
| CA Public Works Board | |
| Department of Mental Health, | |
Coalinga State Hospital,
Series 2004 A,
5.500% 06/01/19 | | | 2,000,000 | | | | 2,035,720 | | |
Series 2003 C,
5.500% 06/01/18 | | | 1,500,000 | | | | 1,536,270 | | |
Series 2006 F,
Insured: FGIC
5.250% 11/01/18 | | | 4,000,000 | | | | 4,013,280 | | |
FL Department Management Services
Division | |
| Series 2003 A, | |
Insured: FSA
5.250% 09/01/15 | | | 1,515,000 | | | | 1,619,687 | | |
| Series 2005 A, | |
Insured: AMBAC
5.000% 09/01/21 | | | 3,000,000 | | | | 2,918,670 | | |
| KY Turnpike Authority | |
| Series 2001 A, | |
Insured: AMBAC
5.500% 07/01/13 | | | 1,000,000 | | | | 1,078,670 | | |
| | | Par ($) | | Value ($) | |
| MI Building Authority | |
| Series 2003, | |
Insured: FSA
5.250% 10/15/14 | | | 10,000,000 | | | | 10,432,000 | | |
| NJ Economic Development Authority | |
| Series 2001 A, | |
Insured: AMBAC
5.500% 06/15/13 | | | 1,000,000 | | | | 1,065,030 | | |
| Series 2005 K, | |
Insured: AMBAC
5.500% 12/15/19 | | | 2,500,000 | | | | 2,625,550 | | |
| NJ State Transit Corp. | |
| Certificates of Participation, | |
Series 2002 A,
Insured: AMBAC
5.500% 09/15/15 | | | 6,725,000 | | | | 7,051,095 | | |
| NJ Transportation Trust Fund Authority | |
| Series 1995, | |
Insured: MBIA
6.500% 06/15/10 | | | 1,000,000 | | | | 1,056,670 | | |
| Series 2001 C, | |
Insured: FSA
5.500% 12/15/18 | | | 2,000,000 | | | | 2,105,020 | | |
| Series 2003 A, | |
Insured: AMBAC
5.500% 12/15/15 | | | 3,260,000 | | | | 3,502,414 | | |
| Series 2006 A: | |
| 5.500% 12/15/21 | | | 10,030,000 | | | | 10,420,468 | | |
Insured: FSA
5.250% 12/15/22 | | | 4,000,000 | | | | 4,051,600 | | |
Insured: MBIA
5.250% 12/15/21 | | | 10,000,000 | | | | 9,981,500 | | |
| NY Dormitory Authority | |
| City University, | |
Series 2002 B,
Insured: AMBAC
5.250% 11/15/26 (a) | | | 1,000,000 | | | | 1,024,530 | | |
Series 1993 A:
5.250% 05/15/15 | | | 5,850,000 | | | | 6,167,187 | | |
Insured: FSA
5.250% 05/15/15 | | | 4,000,000 | | | | 4,184,880 | | |
Series 1993 B,
Insured: FSA
5.250% 05/15/11 | | | 10,000,000 | | | | 10,550,200 | | |
Series 1995 A:
Insured: AMBAC
5.625% 07/01/16 | | | 1,250,000 | | | | 1,307,163 | | |
Insured: FGIC
5.625% 07/01/16 | | | 5,000,000 | | | | 5,284,000 | | |
See Accompanying Notes to Financial Statements.
61
Columbia Intermediate Municipal Bond Fund
October 31, 2008
| Municipal Bonds (continued) | |
| | | Par ($) | | Value ($) | |
Insured: FSA
5.625% 07/01/16 | | | 500,000 | | | | 525,750 | | |
Series 2005 A:
Insured: AMBAC
5.250% 05/15/18 | | | 6,000,000 | | | | 6,232,980 | | |
Insured: FGIC:
5.500% 05/15/17 | | | 10,000,000 | | | | 10,608,400 | | |
| 5.500% 05/15/22 | | | 6,730,000 | | | | 6,895,356 | | |
| NY Tollway Authority | |
| Series 2002, | |
| 5.500% 04/01/13 | | | 4,510,000 | | | | 4,768,919 | | |
| NY Urban Development Corp. | |
| Series 1995, | |
| 5.750% 04/01/11 | | | 500,000 | | | | 528,930 | | |
| Series 2002 A, | |
| 5.000% 01/01/17 | | | 4,000,000 | | | | 4,064,560 | | |
| Series 2008 B: | |
| 5.000% 01/01/19 | | | 4,000,000 | | | | 4,002,760 | | |
| 5.000% 01/01/20 | | | 10,460,000 | | | | 10,336,049 | | |
PR Commonwealth of Puerto Rico Public
Finance Corp. | |
| Series 2004 A: | |
| 5.750% 08/01/27 (a) | | | 4,175,000 | | | | 4,190,447 | | |
Insured: AMBAC
5.250% 08/01/30 (a) | | | 4,240,000 | | | | 4,170,803 | | |
| UT Building Ownership Authority | |
| Series 1998, | |
Insured: FSA
5.500% 05/15/14 | | | 5,000,000 | | | | 5,410,500 | | |
| VA Public School Authority | |
| Series 2001 A, | |
| 5.000% 08/01/17 | | | 3,500,000 | | | | 3,600,695 | | |
| Series 2005 B, | |
| 5.250% 08/01/16 | | | 13,995,000 | | | | 15,093,887 | | |
| Series 2005, | |
| 5.000% 08/01/16 | | | 6,285,000 | | | | 6,634,949 | | |
| State Appropriated Total | | | 181,123,740 | | |
| State General Obligations – 10.6% | |
| CA Economic Recovery | |
| Series 2004 A, | |
Insured: MBIA:
5.000% 07/01/11 | | | 1,500,000 | | | | 1,571,565 | | |
| 5.000% 07/01/15 | | | 5,000,000 | | | | 5,230,350 | | |
| CA State | |
| Series 2002, | |
Insured: AMBAC
6.000% 02/01/18 | | | 5,000,000 | | | | 5,414,350 | | |
| | | Par ($) | | Value ($) | |
| Series 2003, | |
| 5.250% 11/01/18 | | | 1,000,000 | | | | 1,011,820 | | |
| Series 2004, | |
| 5.000% 02/01/20 | | | 750,000 | | | | 737,723 | | |
| Series 2007, | |
| 4.500% 08/01/26 | | | 11,500,000 | | | | 9,853,430 | | |
| FL Board of Education | |
| Series 1998 B, | |
| 5.250% 06/01/11 | | | 3,990,000 | | | | 4,209,211 | | |
| Series 2005 B, | |
| 5.000% 01/01/14 | | | 17,395,000 | | | | 18,364,945 | | |
| Series 2005 C, | |
| 5.000% 06/01/13 | | | 11,830,000 | | | | 12,508,332 | | |
| FL Department of Transportation | |
| Series 2002, | |
| 5.250% 07/01/13 | | | 7,290,000 | | | | 7,755,539 | | |
| FL State | |
| Series 2004 A, | |
| 5.000% 07/01/30 | | | 1,000,000 | | | | 927,530 | | |
| HI State | |
| Series 2002 CY, | |
Insured: FSA
5.500% 02/01/12 | | | 10,000,000 | | | | 10,706,000 | | |
| Series 2008 DK, | |
| 5.000% 05/01/22 | | | 10,750,000 | | | | 10,836,537 | | |
| MA Bay Transportation Authority | |
| Series 1991 A, | |
Insured: MBIA
7.000% 03/01/21 | | | 5,750,000 | | | | 6,593,123 | | |
| Series 1998 A, | |
Insured: MBIA:
5.500% 03/01/12 | | | 1,290,000 | | | | 1,378,700 | | |
| 5.500% 03/01/14 | | | 750,000 | | | | 810,120 | | |
| MA State | |
| Series 1998 C, | |
| 5.250% 08/01/17 | | | 1,775,000 | | | | 1,893,428 | | |
| Series 2002 D, | |
Insured: AMBAC
5.500% 08/01/18 | | | 6,500,000 | | | | 6,984,055 | | |
| Series 2003 D, | |
| 5.500% 10/01/17 | | | 5,000,000 | | | | 5,415,250 | | |
| Series 2004 A, | |
| 5.250% 08/01/13 | | | 11,605,000 | | | | 12,439,864 | | |
| Series 2004 C, | |
Insured: FSA
5.500% 12/01/16 | | | 10,000,000 | | | | 10,946,000 | | |
| Series 2007 A, | |
| 2.426% 11/01/25 (a) | | | 10,000,000 | | | | 6,200,000 | | |
See Accompanying Notes to Financial Statements.
62
Columbia Intermediate Municipal Bond Fund
October 31, 2008
| Municipal Bonds (continued) | |
| | | Par ($) | | Value ($) | |
| MI State | |
| Series 2001, | |
| 5.500% 12/01/15 | | | 1,250,000 | | | | 1,352,363 | | |
| MN State | |
| Series 2000, | |
| 5.500% 11/01/13 | | | 1,000,000 | | | | 1,043,230 | | |
| MS State | |
| Series 2002 A, | |
| 5.500% 12/01/14 | | | 3,000,000 | | | | 3,258,810 | | |
| NJ State | |
| Series 1992 D, | |
| 6.000% 02/15/11 | | | 10,000,000 | | | | 10,662,900 | | |
| Series 2001 H, | |
| 5.250% 07/01/14 | | | 5,000,000 | | | | 5,366,250 | | |
| OH State | |
| Series 2001 A, | |
| 5.000% 06/15/12 | | | 5,000,000 | | | | 5,141,450 | | |
| OR State | |
| Series 1996 B, AMT, | |
| 5.700% 08/01/16 | | | 295,000 | | | | 293,203 | | |
| Series 1997 A, AMT, | |
| 5.050% 08/01/11 | | | 90,000 | | | | 90,317 | | |
| PA State | |
| Series 2002, | |
| 5.500% 02/01/15 | | | 3,000,000 | | | | 3,269,490 | | |
| Series 2004: | |
Insured: FSA
5.375% 07/01/18 | | | 12,000,000 | | | | 12,853,800 | | |
Insured: MBIA
5.375% 07/01/16 | | | 10,000,000 | | | | 10,769,600 | | |
| Series 2005, | |
| 5.000% 01/01/15 | | | 5,500,000 | | | | 5,850,185 | | |
PR Commonwealth of Puerto Rico Public
Buildings Authority | |
| Series 2007: | |
| 5.750% 07/01/17 | | | 3,000,000 | | | | 3,022,110 | | |
| 6.250% 07/01/21 | | | 10,000,000 | | | | 10,042,400 | | |
| PR Commonwealth of Puerto Rico | |
| Series 1997, | |
Insured: MBIA
6.500% 07/01/15 | | | 4,190,000 | | | | 4,454,431 | | |
| Series 2001 A, | |
| 5.500% 07/01/13 | | | 6,395,000 | | | | 6,526,161 | | |
| Series 2006 B, | |
| 5.250% 07/01/16 | | | 5,000,000 | | | | 4,934,550 | | |
| | | Par ($) | | Value ($) | |
| SC State | |
| Series 2001, | |
| 5.000% 04/01/16 | | | 5,000,000 | | | | 5,171,450 | | |
| TX Water Financial Assistance | |
| Series 1999, | |
| 5.250% 08/01/21 | | | 350,000 | | | | 350,812 | | |
| UT State | |
| Series 2002 B, | |
| 5.375% 07/01/11 | | | 10,000,000 | | | | 10,648,900 | | |
| VI Virgin Islands Public Finance Authority | |
| Series 2004 A, | |
| 5.000% 10/01/10 | | | 200,000 | | | | 200,716 | | |
| WA State | |
| Series 2002, | |
Insured: MBIA
5.000% 01/01/18 | | | 10,000,000 | | | | 10,121,900 | | |
| State General Obligations Total | | | 257,212,900 | | |
| Tax-Backed Total | | | 1,021,775,848 | | |
| Transportation – 7.3% | |
| Air Transportation – 0.3% | |
| TN Memphis Shelby County Airport Authority | |
| FedEx Corp.: | |
Series 1997,
5.350% 09/01/12 | | | 6,180,000 | | | | 6,041,630 | | |
Series 2002,
5.050% 09/01/12 | | | 1,000,000 | | | | 952,440 | | |
| Air Transportation Total | | | 6,994,070 | | |
| Airports – 2.1% | |
| CO Denver City & County | |
| Series 2000 A, AMT, | |
Insured: AMBAC
6.000% 11/15/15 | | | 3,075,000 | | | | 3,043,697 | | |
| FL Greater Orlando Aviation Authority | |
| Series 2003 A, | |
Insured: FSA
5.000% 10/01/13 | | | 1,500,000 | | | | 1,577,925 | | |
| IL Chicago O'Hare International Airport | |
| Series 1993 C, | |
Insured: MBIA
5.000% 01/01/11 | | | 5,640,000 | | | | 5,791,039 | | |
| Series 2005, | |
Insured: MBIA
5.250% 01/01/17 | | | 10,000,000 | | | | 10,192,100 | | |
See Accompanying Notes to Financial Statements.
63
Columbia Intermediate Municipal Bond Fund
October 31, 2008
| Municipal Bonds (continued) | |
| | | Par ($) | | Value ($) | |
| MA Port Authority | |
| Series 2007 D, | |
Insured: FSA
5.000% 07/01/17 | | | 8,000,000 | | | | 8,342,320 | | |
| MO St. Louis Airport Revenue | |
| Series 2007, | |
Insured: FSA:
5.000% 07/01/21 | | | 12,150,000 | | | | 11,648,205 | | |
| 5.000% 07/01/25 | | | 2,000,000 | | | | 1,856,580 | | |
| OK Airport Trust | |
| Series 2000 B, AMT, | |
Insured: FSA
5.375% 07/01/11 | | | 4,670,000 | | | �� | 4,717,120 | | |
| TX Houston Airport Systems | |
| Sub-Lien, | |
Series 2002,
Insured: FSA
5.000% 07/01/27 | | | 5,000,000 | | | | 4,699,050 | | |
| Airports Total | | | 51,868,036 | | |
| Toll Facilities – 3.9% | |
CA San Joaquin Hills Transportation
Corridor Agency | |
| Series 1997 A, | |
Insured: MBIA
(b) 01/15/12 | | | 7,600,000 | | | | 6,684,276 | | |
| CO E-470 Public Highway Authority | |
| Series 1997 B, | |
Insured: MBIA
(b) 09/01/12 | | | 10,000,000 | | | | 8,344,600 | | |
| Series 2000, | |
Insured: MBIA
(b) 09/01/18 | | | 1,500,000 | | | | 828,165 | | |
| FL Turnpike Authority | |
| Series 2005 A, | |
Insured: AMBAC
5.000% 07/01/21 | | | 3,000,000 | | | | 2,969,280 | | |
| IL Toll Highway Authority | |
| Series 2006 A-1, | |
Insured: FSA
5.000% 01/01/18 | | | 2,000,000 | | | | 2,052,360 | | |
| KS Turnpike Authority | |
| Series 2002, | |
Insured: FSA:
5.250% 09/01/15 | | | 1,855,000 | | | | 2,005,700 | | |
| 5.250% 09/01/16 | | | 1,230,000 | | | | 1,324,993 | | |
| | | Par ($) | | Value ($) | |
| NJ Turnpike Authority | |
| Series 2000 A, | |
Insured: MBIA:
6.000% 01/01/11 | | | 2,125,000 | | | | 2,248,484 | | |
| 6.000% 01/01/13 | | | 275,000 | | | | 297,434 | | |
| NY Thruway Authority | |
| Second General Highway & Bridge Trust Fund: | |
Series 2003 A,
Insured: MBIA
5.250% 04/01/12 | | | 2,145,000 | | | | 2,269,088 | | |
Series 2005 B,
Insured: AMBAC
5.500% 04/01/20 | | | 10,840,000 | | | | 11,396,309 | | |
Series 2007 B,
5.000% 04/01/19 | | | 5,000,000 | | | | 5,049,250 | | |
| NY Triborough Bridge & Tunnel Authority | |
| Series 2002, | |
| 5.000% 11/15/20 | | | 6,000,000 | | | | 6,023,820 | | |
| Series 2008 B-1, | |
| 5.000% 11/15/25 (a) | | | 5,000,000 | | | | 5,197,850 | | |
| Series 2008 D, | |
| 5.000% 11/15/22 | | | 10,000,000 | | | | 9,921,200 | | |
| OH Turnpike Commission | |
| Series 1998 A, | |
Insured: FGIC:
5.500% 02/15/21 | | | 2,000,000 | | | | 2,096,080 | | |
| 5.500% 02/15/24 | | | 1,000,000 | | | | 1,042,030 | | |
PA Delaware River Joint Toll Bridge
Commission | |
| Series 2003, | |
| 5.250% 07/01/11 | | | 500,000 | | | | 522,845 | | |
| PA Turnpike Commission | |
| Series 2001 S, | |
| 5.500% 06/01/15 | | | 1,000,000 | | | | 1,051,900 | | |
| TX North Tollway Authority | |
| First Tier: | |
Series 2008 A,
6.000% 01/01/22 | | | 14,000,000 | | | | 14,057,400 | | |
Series 2008 E-3,
5.750% 01/01/38 (a) | | | 8,650,000 | | | | 8,775,944 | | |
| Toll Facilities Total | | | 94,159,008 | | |
| Transportation – 1.0% | |
| FL Osceola County Transportation | |
| Series 2004, | |
Insured: MBIA
5.000% 04/01/18 | | | 1,000,000 | | | | 1,011,780 | | |
See Accompanying Notes to Financial Statements.
64
Columbia Intermediate Municipal Bond Fund
October 31, 2008
| Municipal Bonds (continued) | |
| | | Par ($) | | Value ($) | |
| IN Transportation Finance Authority | |
| Series 2000, | |
| 5.750% 12/01/14 | | | 2,485,000 | | | | 2,598,366 | | |
| KS Department of Transportation | |
| Series 2004 A, | |
| 5.500% 03/01/18 | | | 11,775,000 | | | | 12,719,473 | | |
| MA State | |
| Series 2000 A, | |
| 5.750% 06/15/13 | | | 350,000 | | | | 366,359 | | |
| NY Metropolitan Transportation Authority | |
| Series 2007 A, | |
Insured: FSA:
5.000% 11/15/20 | | | 5,000,000 | | | | 4,997,200 | | |
| 5.000% 11/15/21 | | | 3,000,000 | | | | 2,972,460 | | |
| Transportation Total | | | 24,665,638 | | |
| Transportation Total | | | 177,686,752 | | |
| Utilities – 15.8% | |
| Independent Power Producers – 0.3% | |
| CA Sacramento Power Authority | |
| Series 2005, | |
Insured: AMBAC
5.250% 07/01/14 | | | 6,680,000 | | | | 6,900,707 | | |
| Independent Power Producers Total | | | 6,900,707 | | |
| Investor Owned – 1.7% | |
| AR Independence County | |
| Entergy Mississippi, Inc., | |
Series 1999,
Insurer: AMBAC
4.900% 07/01/22 | | | 4,600,000 | | | | 4,194,740 | | |
| CO Adams County Pollution Control | |
| Public Service Co., | |
Series 2005 A,
Insured: MBIA
4.375% 09/01/17 | | | 11,550,000 | | | | 10,750,855 | | |
FL Hillsborough County Industrial
Development Authority | |
| Tampa Electric Co., | |
Series 2007 B,
5.150% 09/01/25 (a) | | | 2,000,000 | | | | 1,980,500 | | |
| NH Business Finance Authority | |
| Series 2001 C, | |
Insured: MBIA
5.450% 05/01/21 | | | 1,500,000 | | | | 1,397,580 | | |
| | | Par ($) | | Value ($) | |
| TX Brazos River Authority | |
| TXU Energy Co., LLC: | |
Series 2001 C, AMT,
5.750% 05/01/36 (a) | | | 5,195,000 | | | | 4,570,821 | | |
Series 2003 D,
5.400% 10/01/29 (a) | | | 6,100,000 | | | | 4,821,684 | | |
| TX Sabine River Authority | |
| TXU Energy Co. LLC: | |
Series 2001 A,
5.500% 05/01/22 (a) | | | 6,265,000 | | | | 5,545,841 | | |
Series 2001 B, AMT,
5.750% 05/01/30 (a) | | | 2,995,000 | | | | 2,635,151 | | |
| WV Economic Development Authority | |
| Pollution Control Revenue, | |
Appalachian Power,
Series 2008 C,
4.850% 05/01/19 | | | 6,500,000 | | | | 6,195,410 | | |
| Investor Owned Total | | | 42,092,582 | | |
| Joint Power Authority – 1.9% | |
| AZ Power Reserves Authority | |
| Series 2001, | |
| 5.000% 10/01/10 | | | 500,000 | | | | 521,995 | | |
| FL Municipal Power Agency | |
| Series 2002, | |
Insured: AMBAC
5.500% 10/01/21 | | | 1,850,000 | | | | 1,862,191 | | |
| GA Municipal Electric Authority | |
| Series 1998 Y, | |
Insured: AMBAC
6.400% 01/01/13 | | | 4,205,000 | | | | 4,463,523 | | |
| MI Public Power Agency | |
| Series 2002 A, | |
Insured: MBIA
5.250% 01/01/16 | | | 1,000,000 | | | | 1,058,630 | | |
| NC Eastern Municipal Power Agency | |
| Series 2008 A, | |
Insured: AGO
5.250% 01/01/19 | | | 3,200,000 | | | | 3,234,560 | | |
| OK Grand River Dam Authority | |
| Series 2002 A, | |
Insured: FSA
5.000% 06/01/12 | | | 1,000,000 | | | | 1,059,520 | | |
| SC Public Service Authority | |
| Series 2002 A, | |
Insured: FSA
5.500% 01/01/11 | | | 10,000,000 | | | | 10,550,400 | | |
See Accompanying Notes to Financial Statements.
65
Columbia Intermediate Municipal Bond Fund
October 31, 2008
| Municipal Bonds (continued) | |
| | | Par ($) | | Value ($) | |
| TX Municipal Power Agency | |
| Series 1993, | |
Insured: MBIA
(b) 09/01/15 | | | 250,000 | | | | 178,120 | | |
| TX Sam Rayburn Municipal Power Agency | |
| Series 2002: | |
| 5.500% 10/01/11 | | | 8,355,000 | | | | 8,237,696 | | |
| 6.000% 10/01/16 | | | 3,000,000 | | | | 2,856,480 | | |
| WA Energy Northwest Electric | |
| Series 2002 A, | |
Insured: MBIA:
5.500% 07/01/16 | | | 4,675,000 | | | | 4,901,130 | | |
| 5.750% 07/01/18 | | | 1,000,000 | | | | 1,041,290 | | |
| WI Sheboygan Pollution Control | |
| Wisconsin Power, | |
Series 2008,
Insured: FGIC
5.000% 09/01/15 | | | 5,000,000 | | | | 4,852,450 | | |
| Joint Power Authority Total | | | 44,817,985 | | |
| Municipal Electric – 5.4% | |
| CA Department of Water Resources | |
| Series 2002 A: | |
| 5.500% 05/01/11 | | | 10,000,000 | | | | 10,561,000 | | |
| 6.000% 05/01/13 | | | 2,000,000 | | | | 2,161,840 | | |
Insured: AMBAC
5.500% 05/01/14 | | | 6,000,000 | | | | 6,348,120 | | |
| Series 2008 H, | |
| 5.000% 05/01/21 | | | 10,000,000 | | | | 9,920,300 | | |
CA Los Angeles Department of Water &
Power | |
| Series 2003, | |
Insured: MBIA
5.000% 07/01/13 | | | 10,000,000 | | | | 10,600,400 | | |
| FL Gainesville Utilities Systems | |
| Series 1992 B, | |
| 6.500% 10/01/11 | | | 3,000,000 | | | | 3,263,010 | | |
FL JEA St. John's River Power Park
Systems | |
| Series 1997, | |
Insured: MBIA
5.000% 10/01/19 | | | 1,000,000 | | | | 1,005,020 | | |
FL Kissimmee Utilities Authority
Electrical System | |
| Series 2003, | |
Insured: FSA
5.250% 10/01/15 | | | 2,235,000 | | | | 2,335,664 | | |
| | | Par ($) | | Value ($) | |
FL Orlando Utilities Commission
Utility Systems | |
| Series 2005 B, | |
| 5.000% 10/01/24 | | | 3,000,000 | | | | 2,894,520 | | |
| NY Long Island Power Authority | |
| Series 2006 A, | |
Insured: FGIC
5.000% 12/01/19 | | | 10,000,000 | | | | 9,657,900 | | |
| OH American Municipal Power, Inc. | |
| Series 2008: | |
| 5.250% 02/15/20 | | | 4,060,000 | | | | 4,063,492 | | |
| 5.250% 02/15/22 | | | 4,810,000 | | | | 4,741,794 | | |
PR Commonwealth of Puerto Rico
Electric Power Authority | |
| Series 1997 BB, | |
Insured: MBIA
6.000% 07/01/12 | | | 3,000,000 | | | | 3,116,430 | | |
| Series 2002 KK, | |
Insured: FSA:
5.250% 07/01/12 | | | 1,000,000 | | | | 1,038,380 | | |
| 5.500% 07/01/15 | | | 10,000,000 | | | | 10,412,000 | | |
| Series 2003 NN, | |
Insured: MBIA
5.250% 07/01/19 | | | 1,000,000 | | | | 951,660 | | |
| Series 2007 VV, | |
Insured: MBIA
5.250% 07/01/26 | | | 10,450,000 | | | | 9,340,733 | | |
TN Metropolitan Government Nashville &
Davidson County | |
| Series 1998 B, | |
| 5.500% 05/15/13 | | | 3,000,000 | | | | 3,237,060 | | |
| TX Austin | |
| Series 2002 A, | |
Insured: AMBAC
5.500% 11/15/13 | | | 2,000,000 | | | | 2,141,760 | | |
| Series 2002, | |
Insured: FSA
5.500% 11/15/12 | | | 2,410,000 | | | | 2,594,558 | | |
| Subordinated Lien, | |
Series 1998,
Insured: MBIA
5.250% 05/15/18 | | | 1,100,000 | | | | 1,148,466 | | |
| TX San Antonio Electric & Gas | |
| Series 1998 A, | |
| 5.250% 02/01/16 | | | 5,190,000 | | | | 5,272,054 | | |
| Series 2002, | |
| 5.375% 02/01/14 | | | 2,500,000 | | | | 2,682,325 | | |
| Series 2005, | |
| 5.000% 02/01/18 | | | 10,000,000 | | | | 10,206,300 | | |
See Accompanying Notes to Financial Statements.
66
Columbia Intermediate Municipal Bond Fund
October 31, 2008
| Municipal Bonds (continued) | |
| | | Par ($) | | Value ($) | |
| WA Seattle Municipal Light & Power | |
| Series 2001, | |
Insured: FSA
5.250% 03/01/11 | | | 10,365,000 | | | | 10,909,784 | | |
| Municipal Electric Total | | | 130,604,570 | | |
| Water & Sewer – 6.5% | |
| CA Citrus Heights Water District | |
| Series 2000, | |
Insured: FGIC
5.250% 10/01/20 | | | 1,800,000 | | | | 1,784,196 | | |
| CA Department Water Resources | |
| Series 2002 X, | |
| 5.500% 12/01/15 | | | 990,000 | | | | 1,080,456 | | |
| CA Fresno Sewer Revenue | |
| Series 1993 A-1, | |
Insured: AMBAC
5.250% 09/01/19 | | | 5,000,000 | | | | 5,031,700 | | |
| CA Pico Rivera Water Authority | |
| Series 1999 A, | |
Insured: MBIA
5.500% 05/01/29 | | | 3,000,000 | | | | 2,905,320 | | |
| FL Brevard County Utilities | |
| Series 2002, | |
Insured: FGIC
5.250% 03/01/14 | | | 2,000,000 | | | | 2,074,340 | | |
| FL Cocoa Water & Sewer | |
| Series 2003, | |
Insured: AMBAC
5.500% 10/01/19 | | | 1,000,000 | | | | 978,250 | | |
| FL Governmental Utility Authority | |
| Series 2003, | |
Insured: AMBAC
5.000% 10/01/17 | | | 1,180,000 | | | | 1,197,665 | | |
| FL Holly Hill Water & Sewer | |
| Series 2002, | |
Insured: MBIA
5.000% 10/01/15 | | | 745,000 | | | | 753,888 | | |
| FL Hollywood Water & Sewer | |
| Series 2003, | |
Insured: FSA
5.000% 10/01/17 | | | 1,070,000 | | | | 1,088,126 | | |
FL Miami-Dade County Florida
Water & Sewer | |
| Series 2008 B, | |
Insured: FSA
5.250% 10/01/21 | | | 20,000,000 | | | | 19,906,400 | | |
| | | Par ($) | | Value ($) | |
| FL Miami-Dade County Stormwater | |
| Series 2004, | |
Insured: MBIA
5.000% 04/01/24 | | | 2,445,000 | | | | 2,249,669 | | |
| FL Municipal Loan Council | |
| Series 2002 B, | |
Insured: MBIA
5.375% 08/01/16 | | | 1,485,000 | | | | 1,515,264 | | |
| FL Orlando Utilities Commission | |
| Series 2002 C, | |
| 5.250% 10/01/16 | | | 210,000 | | | | 219,089 | | |
| FL Sarasota County Utilities Systems | |
| Series 2002 C, | |
Insured: FGIC
5.250% 10/01/16 | | | 1,000,000 | | | | 1,031,630 | | |
| FL Sebring Water & Wastewater | |
| Series 2002, | |
Insured: FGIC
5.250% 01/01/14 | | | 1,030,000 | | | | 1,053,875 | | |
FL Tallahassee Conservative Utilities
System | |
| Series 2001, | |
Insured: FGIC:
5.500% 10/01/14 | | | 1,330,000 | | | | 1,428,340 | | |
| 5.500% 10/01/18 | | | 1,000,000 | | | | 1,050,490 | | |
| FL Tallahassee Consolidated Utility | |
| Series 2001, | |
Insured: FGIC
5.500% 10/01/17 | | | 1,900,000 | | | | 2,023,842 | | |
| FL Tampa Bay Water Utility Systems | |
| Series 2005, | |
Insured: FGIC
5.500% 10/01/19 | | | 1,500,000 | | | | 1,559,880 | | |
| FL Tohopekaliga Water Utilities Authority | |
| Series 2003 B, | |
Insured: FSA
5.250% 10/01/17 | | | 1,110,000 | | | | 1,147,873 | | |
| FL Winter Park Water & Sewer | |
| Series 2002, | |
Insured: AMBAC
5.250% 12/01/14 | | | 1,405,000 | | | | 1,466,848 | | |
| GA Atlanta Water & Wastewater | |
| Series 1999 A, | |
Insured: FGIC
5.500% 11/01/18 | | | 15,305,000 | | | | 15,425,603 | | |
See Accompanying Notes to Financial Statements.
67
Columbia Intermediate Municipal Bond Fund
October 31, 2008
| Municipal Bonds (continued) | |
| | | Par ($) | | Value ($) | |
| IN Bond Bank | |
| Series 2001 A, | |
| 5.375% 02/01/13 | | | 1,910,000 | | | | 2,044,025 | | |
KS Wyandotte County Unified
Government Utility System | |
| Series 2004 B, | |
Insured: FSA
5.000% 09/01/32 | | | 2,000,000 | | | | 1,833,180 | | |
| MA Water Resource Authority | |
| Series 1998 B, | |
Insured: FSA
5.500% 08/01/15 | | | 1,000,000 | | | | 1,088,700 | | |
| MI Sewage Disposal Revenue | |
| Series 2003 A, | |
Insured: FSA
5.000% 07/01/14 | | | 2,820,000 | | | | 2,935,169 | | |
| NY Municipal Water Finance Authority | |
| Series 2002, | |
Insured: FSA
5.375% 06/15/16 | | | 10,000,000 | | | | 10,464,400 | | |
NY New York City Municipal Water
Finance Authority | |
| Series 2000 B, | |
| 5.125% 06/15/31 | | | 7,000,000 | | | | 6,776,490 | | |
| OH Cleveland Waterworks | |
| Series 1993 G, | |
Insured: MBIA
5.500% 01/01/13 | | | 750,000 | | | | 776,813 | | |
| OH Hamilton County Sewer System | |
| Series 2005 A, | |
Insured: MBIA
5.000% 12/01/15 | | | 5,535,000 | | | | 5,815,458 | | |
| PA Allegheny County | |
| Series 2005 A, | |
Insured: MBIA
5.000% 12/01/17 | | | 265,000 | | | | 261,698 | | |
| PA Lancaster Area Sewer Authority | |
| Series 2004, | |
Insured: MBIA
5.000% 04/01/16 | | | 500,000 | | | | 504,700 | | |
TX North Harris County Regional Water
Authority | |
| Series 2008, | |
| 5.250% 12/15/20 | | | 4,415,000 | | | | 4,311,512 | | |
| | | Par ($) | | Value ($) | |
| TX Colorado River Municipal Water | |
| Series 2003, | |
Insured: AMBAC
5.000% 01/01/12 | | | 4,030,000 | | | | 4,202,162 | | |
| TX Corpus Christi | |
| Series 2002, | |
Insured: FSA
5.000% 07/15/14 | | | 1,000,000 | | | | 1,032,920 | | |
| Series 2005 A, | |
Insured: AMBAC
5.000% 07/15/19 | | | 2,000,000 | | | | 2,005,720 | | |
| TX Dallas Waterworks & Sewer Systems | |
| Series 2003, | |
Inured: FSA
5.375% 10/01/12 | | | 10,000,000 | | | | 10,708,800 | | |
| TX Houston Utility System | |
| Series 2004 A, | |
Insured: FGIC
5.250% 05/15/24 | | | 5,000,000 | | | | 4,633,800 | | |
| TX Houston Water & Sewer System | |
| Junior Lien: | |
Series 1991 C,
Insured: AMBAC
(b) 12/01/11 | | | 4,000,000 | | | | 3,568,440 | | |
Series 2001 A,
Insured: FSA
5.500% 12/01/17 | | | 4,720,000 | | | | 4,976,957 | | |
| TX McKinney | |
| Series 2005, | |
Insured: FGIC
5.250% 08/15/17 | | | 1,125,000 | | | | 1,172,678 | | |
| TX Nueces River Authority | |
| Series 2005, | |
Insured: FSA
5.000% 07/15/15 | | | 1,000,000 | | | | 1,041,940 | | |
| TX San Antonio | |
| Series 2005, | |
Insured: MBIA
5.000% 05/15/14 | | | 1,000,000 | | | | 1,055,330 | | |
| TX Trinity River Authority | |
| Series 2005, | |
Insured: MBIA:
5.000% 02/01/17 | | | 1,000,000 | | | | 1,015,550 | | |
| 5.000% 02/01/18 | | | 1,000,000 | | | | 1,004,640 | | |
See Accompanying Notes to Financial Statements.
68
Columbia Intermediate Municipal Bond Fund
October 31, 2008
| Municipal Bonds (continued) | |
| | | Par ($) | | Value ($) | |
VA Upper Occoquan Sewage Authority
Regional Sewage | |
| Series 2005, | |
Insured: FSA
5.000% 07/01/22 | | | 16,680,000 | | | | 16,597,267 | | |
| Water & Sewer Total | | | 156,801,093 | | |
| Utilities Total | | | 381,216,937 | | |
Total Municipal Bonds
(cost of $2,448,889,603) | | | 2,349,218,527 | | |
| Investment Company – 0.4% | |
| | | Shares | | | |
| Dreyfus Tax-Exempt Cash | |
Management Fund
(7 day yield of 2.260%) | | | 10,021,328 | | | | 10,021,328 | | |
Total Investment Company
(cost of $10,021,328) | | | 10,021,328 | | |
| Short-Term Obligations – 0.1% | |
| | | Par ($) | | | |
| Variable Rate Demand Notes (g) – 0.1% | |
| FL Collier County Health Facilities Authority | |
| Cleveland Clinic Health System, | |
Series 2003 C-1,
LOC: JPMorgan Chase & Co.
1.200% 01/01/35 | | | 1,000,000 | | | | 1,000,000 | | |
MO Health & Educational Facilities
Authority Revenue | |
| Washington University, | |
Series 2000 C,
LOC: JPMorgan Chase Bank
1.250% 03/01/40 | | | 300,000 | | | | 300,000 | | |
WI University Hospitals & Clinics Authority
Revenue | |
| Series 2008 B, | |
LOC: U.S. Bank N.A.
1.200% 04/01/34 | | | 100,000 | | | | 100,000 | | |
| Variable Rate Demand Notes Total | | | 1,400,000 | | |
Total Short-Term Obligations
(cost of $1,400,000) | | | 1,400,000 | | |
Total Investments – 97.6%
(cost of $2,460,310,931) (h) | | | 2,360,639,855 | | |
| Other Assets & Liabilities, Net – 2.4% | | | 57,749,973 | | |
| Net Assets – 100.0% | | | 2,418,389,828 | | |
Notes to Investment Portfolio:
(a) The interest rate shown on floating rate or variable rate securities reflects the rate at October 31, 2008.
(b) Zero coupon bond.
(c) The Fund has been informed that each issuer has placed direct obligations of the U.S. Government in an irrevocable trust, solely for the payment of principal and interest.
(d) Step bond. This security is currently not paying coupon. Shown parenthetically is the next coupon rate to be paid and the date the security will begin accruing at this rate.
(e) Security exempt from registration pursuant to Rule 144A under the Securities Act of 1933. These securities may be resold in transactions exempt from registration, normally to qualified institutional buyers. At October 31, 2008, this security, which is illiquid, amounted to $1,802,920, which represents 0.1% of net assets.
| Security | | Acquisition
Date | | Par | | Cost | | Value | |
FL Seminole
Indian Tribe
Series 2007A,
5.750%
10/01/22 | | | 09/27/07 | | | $ | 2,000,000 | | | $ | 2,070,434 | | | $ | 1,802,920 | | |
(f) Step bond. Shown parenthetically is the next coupon rate to be paid and the date the security will begin accruing at this rate.
(g) Variable rate demand notes. These securities are payable upon demand and are secured by letters of credit or other credit support agreements from banks. The interest rates change periodically and the interest rates shown reflect the rate at October 31, 2008.
(h) Cost for federal income tax purposes is $2,460,250,277.
At October 31, 2008, the composition of the Fund by revenue source is as follows:
| Holdings By Revenue Source (Unaudited) | | % of
Net Assets | |
| Tax-Backed | | | 42.2 | | |
| Utilities | | | 15.8 | | |
| Health Care | | | 10.5 | | |
| Refunded/Escrowed | | | 9.8 | | |
| Transportation | | | 7.3 | | |
| Other | | | 5.1 | | |
| Education | | | 2.7 | | |
| Industrials | | | 1.4 | | |
| Housing | | | 1.2 | | |
| Resource Recovery | | | 0.7 | | |
| Other Revenue | | | 0.4 | | |
| | | | 97.1 | | |
| Investment Company | | | 0.4 | | |
| Short-Term Obligations | | | 0.1 | | |
| Other Assets & Liabilities, Net | | | 2.4 | | |
| | | | 100.0 | | |
| Acronym | | Name | |
| AMBAC | | Ambac Assurance Corp. | |
|
| AMT | | Alternative Minimum Tax | |
|
| AGO | | Assured Guaranty Corp. | |
|
| CIFG | | CIFG Assurance North America, Inc. | |
|
| FGIC | | Financial Guaranty Insurance Co. | |
|
| FHA | | Federal Housing Administration | |
|
| FNMA | | Federal National Mortgage Association | |
|
| FSA | | Financial Security Assurance, Inc. | |
|
| GNMA | | Government National Mortgage Association | |
|
| LIQ FAC | | Liquidity Facility | |
|
| LOC | | Letter of Credit | |
|
| MBIA | | MBIA Insurance Corp. | |
|
| PSFG | | Permanent School Fund Guarantee | |
|
| RAD | | Radian Asset Assurance, Inc. | |
|
| SYNC | | Syncora Guarantee, Inc. | |
|
See Accompanying Notes to Financial Statements.
69
Investment Portfolio – Columbia Massachusetts Intermediate Municipal Bond Fund
October 31, 2008
| Municipal Bonds – 95.3% | |
| | | Par ($) | | Value ($) | |
| Education – 15.6% | |
| Education – 15.5% | |
MA College Building Authority Project
Revenue | |
| Series 2004 A, | |
Insured: MBIA
5.000% 05/01/16 | | | 530,000 | | | | 545,985 | | |
| MA Development Finance Agency | |
| Boston College, | |
Series 2007 P,
5.000% 07/01/20 | | | 3,260,000 | | | | 3,283,733 | | |
| Brandeis University, | |
Series 2008,
5.000% 10/01/20 | | | 750,000 | | | | 755,625 | | |
| Clark University, | |
Series 1998,
5.250% 07/01/16 | | | 1,445,000 | | | | 1,447,399 | | |
| Emerson College, | |
Series 2006:
5.000% 01/01/21 | | | 2,500,000 | | | | 2,280,050 | | |
| 5.000% 01/01/23 | | | 1,000,000 | | | | 893,940 | | |
| Hampshire College, | |
Series 2004,
5.150% 10/01/14 | | | 200,000 | | | | 204,882 | | |
| Mount Holyoke College: | |
Series 2001,
5.500% 07/01/13 | | | 1,355,000 | | | | 1,421,950 | | |
Series 2008,
5.000% 07/01/23 | | | 1,285,000 | | | | 1,267,832 | | |
| Wheelock College, | |
Series 2007 C,
5.000% 10/01/17 | | | 1,190,000 | | | | 1,160,274 | | |
| Worcester Polytechnic Institute, | |
Series 2007,
Insured: MBIA
5.000% 09/01/22 | | | 1,710,000 | | | | 1,666,566 | | |
| MA Health & Educational Facilities Authority | |
| Amherst College, | |
Series 1998 G,
5.375% 11/01/20 | | | 640,000 | | | | 640,941 | | |
| Boston College: | |
Series 2003 N,
5.250% 06/01/15 | | | 1,000,000 | | | | 1,047,230 | | |
Series 2008,
5.500% 06/01/24 | | | 3,000,000 | | | | 3,131,100 | | |
| Brandeis University, | |
Series 1999 J,
Insured: MBIA
5.000% 10/01/26 | | | 2,000,000 | | | | 1,827,240 | | |
| | | Par ($) | | Value ($) | |
| Harvard University: | |
Series 2000 Z,
5.500% 01/15/11 | | | 1,000,000 | | | | 1,060,980 | | |
Series 2001 DD,
5.000% 07/15/35 | | | 4,500,000 | | | | 4,351,590 | | |
| Massachusetts Institute of Technology: | |
Series 2002 K:
5.250% 07/01/12 | | | 1,000,000 | | | | 1,072,860 | | |
| 5.375% 07/01/17 | | | 2,275,000 | | | | 2,475,996 | | |
| 5.500% 07/01/22 | | | 1,000,000 | | | | 1,076,260 | | |
Series 2004 M,
5.250% 07/01/19 | | | 610,000 | | | | 651,047 | | |
| Northeastern University: | |
Series 1998 G,
Insured: MBIA
5.500% 10/01/12 | | | 1,110,000 | | | | 1,159,128 | | |
Series 2008 R,
5.000% 10/01/24 | | | 3,570,000 | | | | 3,275,618 | | |
| Tufts University: | |
Series 2001 I,
5.500% 02/15/36 | | | 2,000,000 | | | | 1,936,720 | | |
Series 2002 J,
5.500% 08/15/16 | | | 1,500,000 | | | | 1,628,295 | | |
| Wellesley College, | |
Series 2003,
5.000% 07/01/15 | | | 610,000 | | | | 631,368 | | |
| Williams College, | |
Series 2003 H,
5.000% 07/01/16 | | | 1,740,000 | | | | 1,791,678 | | |
| MA Industrial Finance Agency | |
| Tufts University, | |
Series 1998 H,
Insured: MBIA
5.500% 02/15/13 | | | 1,830,000 | | | | 1,968,293 | | |
MA University of Massachusetts Building
Authority | |
| Series 2004 1, | |
Insured: AMBAC
5.250% 11/01/12 | | | 500,000 | | | | 529,640 | | |
| Series 2008, | |
Insured: FSA
5.000% 05/01/21 | | | 1,510,000 | | | | 1,511,918 | | |
PR Commonwealth of Puerto Rico
Industrial, Tourist, Educational, Medical &
Environmental Control Facilities | |
| Universidad Interamericana de Puerto Rico, Inc., | |
Series 1998 A,
Insured: MBIA
5.250% 10/01/12 | | | 2,000,000 | | | | 2,041,160 | | |
| Education Total | | | 48,737,298 | | |
See Accompanying Notes to Financial Statements.
70
Columbia Massachusetts Intermediate Municipal Bond Fund
October 31, 2008
| Municipal Bonds (continued) | |
| | | Par ($) | | Value ($) | |
| Prep School – 0.1% | |
| MA Development Finance Agency | |
| Milton Academy, | |
Series 2003 A,
5.000% 09/01/19 | | | 500,000 | | | | 502,395 | | |
| Prep School Total | | | 502,395 | | |
| Education Total | | | 49,239,693 | | |
| Health Care – 8.4% | |
| Continuing Care Retirement – 0.5% | |
| MA Development Finance Agency | |
| First Mortgage Orchard Cove, | |
Series 2007:
5.000% 10/01/17 | | | 1,540,000 | | | | 1,214,460 | | |
| 5.000% 10/01/18 | | | 515,000 | | | | 395,293 | | |
| Continuing Care Retirement Total | | | 1,609,753 | | |
| Hospitals – 7.0% | |
MA Health & Educational Facilities
Authority | |
| Baystate Medical Center, | |
Series 2002 F,
5.750% 07/01/13 | | | 890,000 | | | | 910,844 | | |
| Boston Medical Center, | |
Series 1998 A,
Insured: MBIA
5.250% 07/01/15 | | | 2,500,000 | | | | 2,371,675 | | |
| Caregroup, Inc.: | |
Series 2004 D,
Insured: MBIA
5.250% 07/01/22 | | | 1,000,000 | | | | 949,400 | | |
Series 2008 E-2,
5.375% 07/01/19 | | | 3,000,000 | | | | 2,608,980 | | |
| Milford Regional Medical Center Issue, | |
Series 2007 E:
5.000% 07/15/17 | | | 1,050,000 | | | | 901,698 | | |
| 5.000% 07/15/22 | | | 2,500,000 | | | | 1,911,475 | | |
| Partners Healthcare Systems, Inc.: | |
Series 1999 B,
5.250% 07/01/10 | | | 4,670,000 | | | | 4,764,100 | | |
Series 2001 C,
5.750% 07/01/21 | | | 750,000 | | | | 746,933 | | |
Series 2003 E,
5.000% 07/01/15 | | | 1,140,000 | | | | 1,136,728 | | |
Series 2005 F,
5.000% 07/01/17 | | | 2,000,000 | | | | 1,959,260 | | |
Series 2007,
5.000% 07/01/18 | | | 1,950,000 | | | | 1,886,001 | | |
| | | Par ($) | | Value ($) | |
| UMass Memorial Health Care, Inc., | |
Series 1998 A,
Insured: AMBAC
5.250% 07/01/14 | | | 2,000,000 | | | | 1,927,740 | | |
| Hospitals Total | | | 22,074,834 | | |
| Intermediate Care Facilities – 0.3% | |
| MA Development Finance Agency | |
| Evergreen Center, Inc., | |
Series 2005,
5.500% 01/01/20 | | | 1,355,000 | | | | 1,146,845 | | |
| Intermediate Care Facilities Total | | | 1,146,845 | | |
| Nursing Homes – 0.6% | |
| MA Development Finance Agency | |
| First Mortgage VOA Concord Assisted Living, Inc., | |
Series 2007:
5.000% 11/01/17 | | | 900,000 | | | | 740,331 | | |
| 5.125% 11/01/27 | | | 1,500,000 | | | | 1,053,090 | | |
| Nursing Homes Total | | | 1,793,421 | | |
| Health Care Total | | | 26,624,853 | | |
| Other – 17.5% | |
| Other – 1.0% | |
MA Boston Housing Authority Capital
Program | |
| Seies 2008, | |
Insured: FSA
5.000% 04/01/20 | | | 2,135,000 | | | | 2,106,263 | | |
| MA Development Finance Agency | |
| Combined Jewish Philanthropies, | |
Series 2002 A,
5.250% 02/01/22 | | | 1,000,000 | | | | 1,007,860 | | |
| Other Total | | | 3,114,123 | | |
| Pool/Bond Bank – 4.6% | |
| MA Water Pollution Abatement Revenue | |
| Series 1995 A, | |
| 5.400% 08/01/11 | | | 25,000 | | | | 25,055 | | |
| Series 1999 5, | |
| 5.750% 08/01/16 | | | 95,000 | | | | 98,128 | | |
| Series 2001 7, | |
| 5.250% 02/01/10 | | | 2,000,000 | | | | 2,072,120 | | |
| Series 2002, | |
| 5.000% 08/01/11 | | | 1,000,000 | | | | 1,054,160 | | |
| Series 2004 A, | |
| 5.250% 08/01/15 | | | 3,000,000 | | | | 3,246,090 | | |
| Series 2005 11, | |
| 5.250% 08/01/19 | | | 4,465,000 | | | | 4,746,429 | | |
See Accompanying Notes to Financial Statements.
71
Columbia Massachusetts Intermediate Municipal Bond Fund
October 31, 2008
| Municipal Bonds (continued) | |
| | | Par ($) | | Value ($) | |
| Series 2006, | |
| 5.250% 08/01/20 | | | 3,000,000 | | | | 3,159,090 | | |
| Pool/Bond Bank Total | | | 14,401,072 | | |
| Refunded/Escrowed (a) – 11.7% | |
| MA Bay Transportation Authority | |
| Series 2000 A, | |
Pre-refunded 07/01/10,
5.750% 07/01/18 | | | 915,000 | | | | 966,606 | | |
MA College Building Authority Project
Revenue | |
| Series 1999 A, | |
Escrowed to Maturity,
Insured: MBIA
(b) 05/01/28 | | | 4,000,000 | | | | 1,326,800 | | |
| MA Consolidated Loan | |
| Series 2000 A, | |
Pre-refunded 02/01/10,
5.800% 02/01/17 | | | 3,520,000 | | | | 3,709,200 | | |
| Series 2001 C, | |
Pre-refunded 12/01/11,
5.375% 12/01/18 | | | 3,000,000 | | | | 3,224,490 | | |
| MA Development Finance Agency | |
| Belmont Hill School, | |
Series 1998,
Pre-refunded 09/01/11,
5.000% 09/01/31 | | | 1,000,000 | | | | 1,068,050 | | |
| Higher Education, | |
Smith College,
Series 2000,
Pre-refunded 07/01/10,
5.750% 07/01/23 | | | 2,000,000 | | | | 2,131,720 | | |
| MA College of Pharmacy & Allied Health Sciences, | |
Series 2003 C,
Pre-refunded 07/01/13,
6.375% 07/01/23 | | | 1,000,000 | | | | 1,144,720 | | |
| Western New England College, | |
Series 2002,
Pre-refunded 12/01/12,
5.875% 12/01/22 | | | 600,000 | | | | 643,794 | | |
| MA Health & Educational Facilities Authority | |
| Simmons College, | |
Series 2003 F,
Pre-refunded 10/01/13,
Insured: FGIC:
5.000% 10/01/15 | | | 1,015,000 | | | | 1,096,048 | | |
| 5.000% 10/01/17 | | | 510,000 | | | | 550,723 | | |
| | | Par ($) | | Value ($) | |
| University of Massachusetts: | |
Series 2000 A,
Pre-refunded 10/01/10,
Insured: FGIC
5.875% 10/01/29 | | | 1,000,000 | | | | 1,074,830 | | |
Series 2002 C,
Pre-refunded 10/01/12,
Insured: MBIA
5.250% 10/01/13 | | | 1,475,000 | | | | 1,593,339 | | |
| MA Port Authority | |
| Series 1973, | |
Escrowed to Maturity,
5.625% 07/01/12 | | | 315,000 | | | | 332,117 | | |
MA Route 3 North Transit Improvement
Association | |
| Series 2000, | |
Pre-refunded 06/15/10,
Insured: MBIA:
5.375% 06/15/33 | | | 2,500,000 | | | | 2,622,425 | | |
| 5.750% 06/15/13 | | | 1,000,000 | | | | 1,054,910 | | |
| 5.750% 06/15/14 | | | 2,000,000 | | | | 2,109,820 | | |
| 5.750% 06/15/15 | | | 2,000,000 | | | | 2,109,820 | | |
| MA Sandwich | |
| Series 2000, | |
Pre-refunded 08/15/10,
5.750% 08/15/11 | | | 1,050,000 | | | | 1,122,618 | | |
| MA Special Obligation & Revenue | |
| Consolidated Loan, | |
Series 2002 A,
Pre-refunded 06/01/12,
Insured: FGIC
5.375% 06/01/19 | | | 1,125,000 | | | | 1,196,201 | | |
| MA Springfield | |
| Municipal Purpose Loan, | |
Series 2003,
Pre-refunded 01/15/13,
Insured: MBIA
5.250% 01/15/15 | | | 1,500,000 | | | | 1,622,790 | | |
| MA Turnpike Authority | |
| Series 1993 A, | |
Escrowed to Maturity,
5.000% 01/01/13 | | | 250,000 | | | | 260,385 | | |
MA University of Massachusetts Building
Authority | |
| Series 2003 1, | |
Pre-refunded 11/01/13,
Insured: AMBAC
5.250% 11/01/15 | | | 2,000,000 | | | | 2,184,200 | | |
See Accompanying Notes to Financial Statements.
72
Columbia Massachusetts Intermediate Municipal Bond Fund
October 31, 2008
| Municipal Bonds (continued) | |
| | | Par ($) | | Value ($) | |
| MA Water Pollution Abatement Revenue | |
| Series 1993 A, | |
Escrowed to Maturity,
5.450% 02/01/13 | | | 935,000 | | | | 982,489 | | |
| Series 1995 A, | |
Escrowed to Maturity,
5.400% 08/01/11 | | | 225,000 | | | | 240,512 | | |
| Series 2001 7, | |
Pre-refunded 08/01/11,
5.250% 02/01/13 | | | 250,000 | | | | 261,783 | | |
| MA Water Resources Authority | |
| Series 1993 C, | |
Escrowed to Maturity,
6.000% 12/01/11 | | | 1,220,000 | | | | 1,298,519 | | |
| Series 2000 D, | |
Escrowed to Maturity,
Insured: MBIA
5.500% 08/01/10 | | | 1,000,000 | | | | 1,053,010 | | |
| Refunded/Escrowed Total | | | 36,981,919 | | |
| Tobacco – 0.2% | |
PR Commonwealth of Puerto Rico
Children's Trust Fund | |
| Tobacco Settlement Revenue, | |
Series 2002,
5.000% 05/15/09 | | | 500,000 | | | | 499,725 | | |
| Tobacco Total | | | 499,725 | | |
| Other Total | | | 54,996,839 | | |
| Tax-Backed – 39.7% | |
| Local General Obligations – 13.6% | |
| MA Bellingham | |
| Series 2001, | |
Insured: AMBAC
5.250% 03/01/13 | | | 1,605,000 | | | | 1,678,589 | | |
| MA Boston Special Obligation | |
| Boston Medical Center, | |
Series 2002 A,
Insured: MBIA
5.000% 08/01/14 | | | 5,000,000 | | | | 5,110,150 | | |
| MA Boston | |
| Metropolitan District, | |
Series 2002 A,
5.250% 12/01/14 | | | 2,010,000 | | | | 2,120,148 | | |
| Series 2002 B, | |
Insured: FGIC
5.000% 02/01/12 | | | 6,000,000 | | | | 6,350,760 | | |
| Series 2004 A, | |
| 5.000% 01/01/14 | | | 1,000,000 | | | | 1,067,850 | | |
| | | Par ($) | | Value ($) | |
| MA Brookline | |
| Series 2000, | |
| 5.750% 04/01/14 | | | 1,905,000 | | | | 1,989,906 | | |
| MA Dudley Charlton Regional School District | |
| Series 1999 A, | |
Insured: FGIC
5.125% 06/15/14 | | | 2,305,000 | | | | 2,431,337 | | |
| MA Everett | |
| Series 2000, | |
Insured: MBIA
6.000% 12/15/11 | | | 2,015,000 | | | | 2,189,096 | | |
| MA Falmouth | |
| Series 2002, | |
| 5.000% 02/01/11 | | | 1,450,000 | | | | 1,524,182 | | |
| MA Groton-Dunstable Regional School District | |
| Series 2001, | |
Insured: FSA
5.000% 10/15/21 | | | 1,260,000 | | | | 1,246,946 | | |
| MA Hopedale | |
| Series 2004, | |
Insured: AMBAC
5.000% 11/15/17 | | | 1,000,000 | | | | 1,026,280 | | |
| MA Lawrence | |
| Series 2006, | |
Insured: FSA
5.000% 02/01/18 | | | 1,500,000 | | | | 1,563,180 | | |
| MA Lowell | |
| Series 2002, | |
Insured: AMBAC:
5.000% 08/01/10 | | | 1,000,000 | | | | 1,037,310 | | |
| 5.000% 02/01/13 | | | 1,215,000 | | | | 1,272,142 | | |
| MA Pioneer Valley Regional School District | |
| Series 2002, | |
Insured: AMBAC
5.000% 06/15/12 | | | 1,000,000 | | | | 1,046,660 | | |
| MA Pittsfield | |
| Series 2002, | |
Insured: MBIA
5.000% 04/15/11 | | | 1,000,000 | | | | 1,042,750 | | |
| MA Plymouth | |
| Series 2000, | |
Insured: MBIA
5.000% 10/15/18 | | | 1,725,000 | | | | 1,757,154 | | |
See Accompanying Notes to Financial Statements.
73
Columbia Massachusetts Intermediate Municipal Bond Fund
October 31, 2008
| Municipal Bonds (continued) | |
| | | Par ($) | | Value ($) | |
| MA Sandwich | |
| Series 2005, | |
Insured: MBIA
5.000% 07/15/18 | | | 1,575,000 | | | | 1,619,667 | | |
| MA Springfield | |
| Series 2007, | |
Insured: FSA
4.500% 08/01/21 | | | 2,000,000 | | | | 1,877,300 | | |
| MA Westborough | |
| Series 2003, | |
| 5.000% 11/15/16 | | | 1,000,000 | | | | 1,039,620 | | |
| MA Westfield | |
| Series 2003, | |
Insured: MBIA
5.000% 09/01/18 | | | 500,000 | | | | 503,380 | | |
| MA Worcester | |
| Series 2004 A, | |
Insured: MBIA
5.250% 08/15/13 | | | 2,810,000 | | | | 2,910,092 | | |
PR Commonwealth of Puerto Rico Municipal
Finance Agency | |
| Series 1997 A, | |
Insured: FSA
5.500% 07/01/17 | | | 245,000 | | | | 245,728 | | |
| Local General Obligations Total | | | 42,650,227 | | |
| Special Non-Property Tax – 10.3% | |
| MA Bay Transportation Authority | |
| Series 2000 A: | |
| 5.750% 07/01/14 | | | 85,000 | | | | 88,220 | | |
| 5.750% 07/01/18 | | | 85,000 | | | | 88,220 | | |
| Series 2002 A, | |
| 5.000% 07/01/11 | | | 1,000,000 | | | | 1,053,210 | | |
| Series 2003 A: | |
| 5.250% 07/01/11 | | | 5,000,000 | | | | 5,297,900 | | |
| 5.250% 07/01/17 | | | 1,000,000 | | | | 1,074,060 | | |
| 5.250% 07/01/19 | | | 625,000 | | | | 661,606 | | |
| Series 2004 C, | |
| 5.250% 07/01/18 | | | 1,000,000 | | | | 1,065,470 | | |
| Series 2005 B, | |
Insured: MBIA
5.500% 07/01/23 | | | 2,890,000 | | | | 3,066,579 | | |
| Series 2005, | |
| 5.000% 07/01/20 | | | 2,500,000 | | | | 2,565,475 | | |
| Series 2006 A, | |
| 5.250% 07/01/22 | | | 3,500,000 | | | | 3,643,780 | | |
| Series 2008 B, | |
| 5.000% 07/01/23 | | | 910,000 | | | | 921,284 | | |
| | | Par ($) | | Value ($) | |
| MA Boston Special Obligation | |
| Convention Center, | |
Series 2002 A,
Insured: AMBAC
5.000% 05/01/19 | | | 1,500,000 | | | | 1,500,000 | | |
MA School Building Authority Dedicated
Sales Tax Revenue | |
| Series 2007 A, | |
Insured: AMBAC
5.000% 08/15/18 | | | 5,000,000 | | | | 5,173,250 | | |
| MA Special Obligation & Revenue | |
| Consolidated Loan: | |
Series 1997 A,
5.500% 06/01/13 | | | 1,000,000 | | | | 1,080,820 | | |
Series 2002 A,
Insured: FGIC
5.000% 06/01/10 | | | 1,500,000 | | | | 1,555,695 | | |
| Series 2004 A, | |
Insured: FGIC
5.250% 01/01/19 | | | 750,000 | | | | 744,120 | | |
| PR Commonwealth of Puerto Rico Highway & Transportation Authority | |
| Series 2006 BB, | |
Insured: FSA
5.250% 07/01/22 | | | 3,000,000 | | | | 2,899,020 | | |
| Special Non-Property Tax Total | | | 32,478,709 | | |
| State Appropriated – 1.2% | |
| MA Development Finance Agency | |
| Visual & Performing Arts Project, | |
Series 2000:
5.750% 08/01/13 | | | 1,030,000 | | | | 1,084,878 | | |
| 6.000% 08/01/17 | | | 540,000 | | | | 569,349 | | |
| 6.000% 08/01/21 | | | 1,750,000 | | | | 1,761,743 | | |
PR Commonwealth of Puerto Rico Public
Finance Corp. | |
| Series 2004 A, | |
Insured: AMBAC
5.250% 08/01/30 (c) | | | 500,000 | | | | 491,840 | | |
| State Appropriated Total | | | 3,907,810 | | |
| State General Obligations – 14.6% | |
| MA State | |
| Series 2002 D, | |
Insured: AMBAC
5.500% 08/01/18 | | | 3,500,000 | | | | 3,760,645 | | |
See Accompanying Notes to Financial Statements.
74
Columbia Massachusetts Intermediate Municipal Bond Fund
October 31, 2008
| Municipal Bonds (continued) | |
| | | Par ($) | | Value ($) | |
| Series 2003 D: | |
| 5.500% 10/01/17 | | | 5,000,000 | | | | 5,415,250 | | |
Insured: AMBAC
5.500% 10/01/19 | | | 5,000,000 | | | | 5,333,900 | | |
Insured: FSA
5.500% 10/01/19 | | | 3,500,000 | | | | 3,733,730 | | |
Insured: MBIA
5.500% 10/01/20 | | | 2,500,000 | | | | 2,670,675 | | |
| Series 2004 B, | |
| 5.250% 08/01/20 | | | 3,000,000 | | | | 3,145,230 | | |
| Series 2004 C: | |
Insured: AMBAC
5.500% 12/01/24 | | | 5,000,000 | | | | 5,290,850 | | |
Insured: MBIA
5.500% 12/01/19 | | | 3,795,000 | | | | 4,049,037 | | |
| Series 2006 B, | |
Insured: FSA
5.250% 09/01/22 | | | 4,000,000 | | | | 4,164,920 | | |
| Series 2008 A, | |
| 5.000% 08/01/16 | | | 2,000,000 | | | | 2,111,820 | | |
PR Commonwealth of Puerto Rico Public
Buildings Authority | |
| Series 2004 J, | |
Insured: AMBAC
5.000% 07/01/36 (c) | | | 2,000,000 | | | | 1,945,740 | | |
| PR Commonwealth of Puerto Rico | |
| Series 2004 A, | |
| 5.000% 07/01/30 (c) | | | 1,900,000 | | | | 1,872,412 | | |
| Series 2006 A, | |
| 5.250% 07/01/22 | | | 850,000 | | | | 779,153 | | |
| Series 2007 A, | |
| 5.500% 07/01/18 | | | 1,750,000 | | | | 1,707,632 | | |
| State General Obligations Total | | | 45,980,994 | | |
| Tax-Backed Total | | | 125,017,740 | | |
| Transportation – 5.0% | |
| Airports – 2.9% | |
| MA Port Authority | |
| Series 2005 C, | |
Insured: AMBAC:
5.000% 07/01/15 | | | 1,500,000 | | | | 1,582,440 | | |
| 5.000% 07/01/22 | | | 4,500,000 | | | | 4,464,540 | | |
| Series 2007 D, | |
Insured: FSA
5.000% 07/01/17 | | | 3,000,000 | | | | 3,128,370 | | |
| Airports Total | | | 9,175,350 | | |
| | | Par ($) | | Value ($) | |
| Toll Facilities – 0.9% | |
| MA Turnpike Authority | |
| Metropolitan Highway Systems Revenue: | |
Series 1997 A,
Insured: MBIA
5.000% 01/01/37 | | | 2,000,000 | | | | 1,575,840 | | |
Series 1999 A,
Insured: AMBAC
5.000% 01/01/39 | | | 1,500,000 | | | | 1,171,395 | | |
| Toll Facilities Total | | | 2,747,235 | | |
| Transportation – 1.2% | |
| MA Federal Highway Capital Appreciation | |
| Series 1998 A, | |
| (b) 06/15/15 | | | 4,000,000 | | | | 2,961,160 | | |
MA Woods Hole Martha's Vineyard &
Nantucket Steamship Authority | |
| Series 2004 B, | |
| 5.000% 03/01/18 | | | 975,000 | | | | 996,158 | | |
| Transportation Total | | | 3,957,318 | | |
| Transportation Total | | | 15,879,903 | | |
| Utilities – 9.1% | |
| Joint Power Authority – 0.8% | |
| MA Municipal Wholesale Electric Co. | |
| Series 2001 A, | |
Insured: MBIA
5.000% 07/01/11 | | | 2,500,000 | | | | 2,610,525 | | |
| Joint Power Authority Total | | | 2,610,525 | | |
| Municipal Electric – 1.1% | |
PR Commonwealth of Puerto Rico Electric
Power Authority | |
| Series 1997 BB, | |
Insured: MBIA
6.000% 07/01/12 | | | 1,000,000 | | | | 1,038,810 | | |
| Series 2002 LL, | |
| 5.500% 07/01/17 | | | 2,400,000 | | | | 2,389,992 | | |
| Municipal Electric Total | | | 3,428,802 | | |
| Water & Sewer – 7.2% | |
| MA Water Resource Authority | |
| Series 1993 C, | |
| 6.000% 12/01/11 | | | 780,000 | | | | 823,462 | | |
| Series 1998 B, | |
Insured: FSA
5.500% 08/01/15 | | | 1,165,000 | | | | 1,268,335 | | |
See Accompanying Notes to Financial Statements.
75
Columbia Massachusetts Intermediate Municipal Bond Fund
October 31, 2008
| Municipal Bonds (continued) | |
| | | Par ($) | | Value ($) | |
| Series 2002 J, | |
Insured: FSA:
5.250% 08/01/14 | | | 2,870,000 | | | | 3,086,484 | | |
| 5.250% 08/01/15 | | | 3,000,000 | | | | 3,227,640 | | |
| 5.250% 08/01/18 | | | 1,000,000 | | | | 1,057,380 | | |
| Series 2005 A, | |
Insured: MBIA
5.250% 08/01/17 | | | 6,000,000 | | | | 6,382,320 | | |
| Series 2007 B, | |
Insured: FSA
5.250% 08/01/23 | | | 5,500,000 | | | | 5,682,490 | | |
PR Commonwealth Aqueduct &
Sewer Authority Revenue | |
| Refunding Senior Lien, | |
Series 2008 A,
Insured: AGO
5.000% 07/01/16 | | | 1,000,000 | | | | 1,008,170 | | |
| Water & Sewer Total | | | 22,536,281 | | |
| Utilities Total | | | 28,575,608 | | |
Total Municipal Bonds
(cost of $308,886,695) | | | 300,334,636 | | |
| Investment Company – 0.1% | |
| | | Shares | | | |
| Dreyfus Tax-Exempt Cash | |
Management Fund
(7 day yield of 2.260%) | | | 163,102 | | | | 163,102 | | |
Total Investment Company
(cost of $163,102) | | | 163,102 | | |
Total Investments – 95.4%
(cost of $309,049,797) (d) | | | 300,497,738 | | |
| Other Assets & Liabilities, Net – 4.6% | | | 14,356,208 | | |
| Net Assets – 100.0% | | | 314,853,946 | | |
Notes to Investment Portfolio:
(a) The Fund has been informed that each issuer has placed direct obligations of the U.S. Government in an irrevocable trust, solely for the payment of principal and interest.
(b) Zero coupon bond.
(c) The interest rate shown on floating rate or variable rate securities reflects the rate at October 31, 2008.
(d) Cost for federal income tax purposes is $309,004,044.
At October 31, 2008, the composition of the Fund by revenue source is as follows:
| Holdings By Revenue Source (Unaudited) | | % of
Net Assets | |
| Tax-Backed | | | 39.7 | | |
| Education | | | 15.6 | | |
| Refunded/Escrowed | | | 11.7 | | |
| Utilities | | | 9.1 | | |
| Health Care | | | 8.4 | | |
| Other | | | 5.8 | | |
| Transportation | | | 5.0 | | |
| | | | 95.3 | | |
| Investment Company | | | 0.1 | | |
| Other Assets & Liabilities, Net | | | 4.6 | | |
| | | | 100.0 | | |
| Acronym | | Name | |
| AGO | | Assured Guaranty Corp. | |
|
| AMBAC | | Ambac Assurance Corp. | |
|
| FGIC | | Financial Guaranty Insurance Co. | |
|
| FSA | | Financial Security Assurance, Inc. | |
|
| MBIA | | MBIA Insurance Corp. | |
|
See Accompanying Notes to Financial Statements.
76
Investment Portfolio – Columbia New Jersey Intermediate Municipal Bond Fund
October 31, 2008
| Municipal Bonds – 93.1% | |
| | | Par ($) | | Value ($) | |
| Education – 4.5% | |
| Education – 4.5% | |
| NJ Educational Facilities Authority | |
| Drew University, | |
Series 2003 A,
Insured: FGIC
5.250% 07/01/20 | | | 1,000,000 | | | | 961,950 | | |
| Georgian Court University, | |
Series 2007 D,
5.250% 07/01/27 | | | 500,000 | | | | 431,965 | | |
| Rowan University, | |
Series 2008 B,
Insured: AGO
5.000% 07/01/23 | | | 750,000 | | | | 748,402 | | |
| Seton Hall University Project, | |
Series 2001 A,
Insured: AMBAC
5.250% 07/01/16 | | | 200,000 | | | | 204,852 | | |
| Stevens Institute of Technology, | |
Series 1998 I,
5.000% 07/01/09 | | | 110,000 | | | | 110,754 | | |
| NJ Rutgers State University | |
Series 1997 U,
5.000% 05/01/14 | | | 500,000 | | | | 505,815 | | |
| Education Total | | | 2,963,738 | | |
| Education Total | | | 2,963,738 | | |
| Health Care – 5.4% | |
| Continuing Care Retirement – 1.3% | |
| NJ Economic Development Authority | |
| Lutheran Social Ministries, | |
Series 2005,
5.100% 06/01/27 | | | 675,000 | | | | 493,769 | | |
| Marcus L. Ward Home, | |
Series 2004,
5.750% 11/01/24 | | | 400,000 | | | | 337,704 | | |
| Continuing Care Retirement Total | | | 831,473 | | |
| Hospitals – 4.1% | |
| NJ Economic Development Authority | |
| University of Medicine and Dentistry of New Jersey, | |
Series 2000,
Insured: AMBAC
5.500% 06/01/09 | | | 315,000 | | | | 319,543 | | |
| NJ Health Care Facilities Financing Authority | |
| Children's Specialized Hospital, | |
Series 2005 A,
5.000% 07/01/18 | | | 575,000 | | | | 507,334 | | |
| | | Par ($) | | Value ($) | |
| Hackensack University Medical Center: | |
Series 1998 A,
Insured: MBIA
5.000% 01/01/18 | | | 500,000 | | | | 446,535 | | |
Series 2000:
5.700% 01/01/11 | | | 500,000 | | | | 512,720 | | |
| 5.875% 01/01/15 | | | 500,000 | | | | 505,260 | | |
| South Jersey Hospital, | |
Series 2006,
5.000% 07/01/20 | | | 500,000 | | | | 449,305 | | |
| Hospitals Total | | | 2,740,697 | | |
| Health Care Total | | | 3,572,170 | | |
| Housing – 2.5% | |
| Multi-Family – 1.7% | |
| NJ Housing & Mortgage Finance Agency | |
| Multi-Family Housing: | |
Series 2000 B,
Insured: FSA
6.050% 11/01/17 | | | 165,000 | | | | 166,579 | | |
Series 2000 E-2,
Insured: FSA
5.750% 11/01/25 | | | 135,000 | | | | 131,294 | | |
| NJ Middlesex County Improvement Authority | |
| Student Housing Urban Renewal, | |
Series 2004 A,
5.000% 08/15/18 | | | 500,000 | | | | 427,395 | | |
| PR Housing Finance Authority | |
| Series 2008, | |
| 5.000% 12/01/13 | | | 400,000 | | | | 416,728 | | |
| Multi-Family Total | | | 1,141,996 | | |
| Single-Family – 0.8% | |
| NJ Housing & Mortgage Finance Agency | |
| Series 2008, | |
| 6.375% 10/01/28 (a) | | | 500,000 | | | | 508,225 | | |
| Single-Family Total | | | 508,225 | | |
| Housing Total | | | 1,650,221 | | |
| Industrials – 0.3% | |
| Oil & Gas – 0.3% | |
| TN Energy Acquisition Corp. | |
| Series 2006, | |
| 5.250% 09/01/22 | | | 300,000 | | | | 218,589 | | |
| Oil & Gas Total | | | 218,589 | | |
| Industrials Total | | | 218,589 | | |
See Accompanying Notes to Financial Statements.
77
Columbia New Jersey Intermediate Municipal Bond Fund
October 31, 2008
| Municipal Bonds (continued) | |
| | | Par ($) | | Value ($) | |
| Other – 22.7% | |
| Pool/Bond Bank – 1.2% | |
| NJ Environmental Infrastructure Trust | |
| Series 1998, | |
Insured: FGIC
5.000% 04/01/12 | | | 500,000 | | | | 507,080 | | |
| NJ Monmouth County Improvement Authority | |
| Series 1995, | |
Insured: FSA
5.450% 07/15/13 | | | 305,000 | | | | 305,583 | | |
| Pool/Bond Bank Total | | | 812,663 | | |
| Refunded/Escrowed (b) – 20.1% | |
| NJ Atlantic County Improvement Authority | |
| Series 1985, | |
Escrowed to Maturity,
Insured: MBIA
7.375% 07/01/10 | | | 120,000 | | | | 125,894 | | |
| NJ Bayonne Municipal Utilities Authority | |
| Series 1997, | |
Escrowed to Maturity,
Insured: MBIA
5.000% 01/01/12 | | | 500,000 | | | | 517,985 | | |
| NJ Burlington County Bridge Commissioner | |
| Series 2002, | |
Pre-refunded 08/15/12,
5.250% 08/15/18 | | | 1,130,000 | | | | 1,216,581 | | |
| NJ Cherry Hill Township | |
| Series 1999, | |
Pre-refunded 07/15/09,
Insured: FGIC
5.250% 07/15/19 | | | 500,000 | | | | 512,580 | | |
| NJ Delaware River and Bay Authority | |
| Series 2000 A, | |
Pre-refunded 01/01/10,
Insured: AMBAC
5.400% 01/01/14 | | | 250,000 | | | | 261,535 | | |
| NJ Economic Development Authority | |
| School Facilities Construction, | |
Series 2001 A,
Pre-refunded 06/15/11,
Insured: AMBAC
5.250% 06/15/18 | | | 200,000 | | | | 212,518 | | |
| NJ Educational Facilities Authority | |
| Princeton University, | |
Series 1999 B,
Pre-refunded 07/01/09,
5.125% 07/01/19 | | | 1,000,000 | | | | 1,022,990 | | |
| | | Par ($) | | Value ($) | |
| Rowan University, | |
Series 2000 B,
Pre-refunded 07/01/10,
Insured: FGIC
5.250% 07/01/19 | | | 250,000 | | | | 260,812 | | |
| Stevens Institute of Technology, | |
Series 2002 C,
Escrowed to Maturity
5.000% 07/01/10 | | | 1,120,000 | | | | 1,166,704 | | |
| William Paterson University, | |
Series 2000 A,
Pre-refunded 07/01/10,
Insured: FGIC
5.375% 07/01/21 | | | 500,000 | | | | 524,225 | | |
| NJ Environmental Infrastructure Trust | |
| Series 2000 A, | |
Pre-refunded 09/01/10,
5.250% 09/01/20 | | | 500,000 | | | | 530,420 | | |
| NJ Essex County Improvement Authority | |
| Lease Revenue, | |
Series 2000,
Pre-refunded 10/01/10,
Insured: FGIC
5.250% 10/01/11 | | | 500,000 | | | | 525,470 | | |
| NJ Highway Authority | |
| Garden State Parkway: | |
Series 1989,
Escrowed to Maturity,
6.000% 01/01/19 | | | 1,000,000 | | | | 1,104,200 | | |
Series 1999,
Pre-refunded 01/01/10,
Insured: FGIC
5.600% 01/01/17 | | | 300,000 | | | | 314,136 | | |
| NJ Monmouth County Improvement Authority | |
| Series 2000, | |
Pre-refunded 12/01/10,
Insured: AMBAC
5.000% 12/01/12 | | | 390,000 | | | | 410,202 | | |
| NJ Sports & Exposition Authority | |
| Series 2000 C, | |
Escrowed to Maturity,
5.000% 03/01/11 | | | 305,000 | | | | 320,558 | | |
| NJ State | |
| Certificates of Participation, | |
Series 1998 A,
Escrowed to Maturity,
Insured: AMBAC
5.000% 06/15/14 | | | 500,000 | | | | 537,220 | | |
See Accompanying Notes to Financial Statements.
78
Columbia New Jersey Intermediate Municipal Bond Fund
October 31, 2008
| Municipal Bonds (continued) | |
| | | Par ($) | | Value ($) | |
| NJ Tobacco Settlement Financing Corp. | |
| Series 2002, | |
Pre-refunded 06/01/12,
5.375% 06/01/18 | | | 1,000,000 | | | | 1,073,760 | | |
| NJ Transportation Trust Fund Authority | |
| Transportation Systems, | |
Series 1999 A,
Escrowed to Maturity,
5.750% 06/15/15 | | | 1,000,000 | | | | 1,123,310 | | |
| NJ Trenton | |
| Series 2000, | |
Pre-refunded 03/01/09,
Insured: FGIC
5.700% 03/01/19 | | | 250,000 | | | | 255,823 | | |
| NJ Turnpike Authority | |
| Series 2000 A, | |
Pre-refunded 01/01/10,
Insured: MBIA
5.750% 01/01/19 | | | 295,000 | | | | 306,918 | | |
| NJ Vernon Township Board of Education | |
| Series 1999, | |
Pre-refunded 12/01/09,
Insured: FGIC
5.375% 12/01/19 | | | 300,000 | | | | 311,790 | | |
| NJ West Deptford Township | |
| Series 2000, | |
Pre-refunded 09/01/10,
Insured: FGIC
5.500% 09/01/20 | | | 400,000 | | | | 422,288 | | |
| NJ West Orange Board of Education | |
| Certificates of Participation, | |
Series 1999,
Pre-refunded 10/01/09,
Insured: MBIA
5.625% 10/01/29 | | | 250,000 | | | | 261,250 | | |
| Refunded/Escrowed Total | | | 13,319,169 | | |
| Tobacco – 1.4% | |
| NJ Tobacco Settlement Financing Corp. | |
| Series 2007 1-A: | |
| 4.500% 06/01/23 | | | 430,000 | | | | 346,236 | | |
| 4.625% 06/01/26 | | | 750,000 | | | | 535,462 | | |
| Tobacco Total | | | 881,698 | | |
| Other Total | | | 15,013,530 | | |
| | | Par ($) | | Value ($) | |
| Other Revenue – 0.9% | |
| Hotels – 0.9% | |
| NJ Middlesex County Improvement Authority | |
| Heldrich Associates, | |
Series 2005 A,
5.000% 01/01/20 | | | 815,000 | | | | 622,138 | | |
| Hotels Total | | | 622,138 | | |
| Other Revenue Total | | | 622,138 | | |
| Tax-Backed – 44.3% | |
| Local Appropriated – 4.6% | |
| NJ Bergen County Improvement Authority | |
| Series 2005, | |
| 5.000% 11/15/23 | | | 1,000,000 | | | | 1,019,080 | | |
| NJ Camden County Improvement Authority | |
| Series 2006, | |
Insured: AMBAC
4.000% 09/01/21 | | | 1,140,000 | | | | 1,018,624 | | |
| NJ East Orange Board of Education | |
| Certificates of Participation, | |
Series 1998,
Insured: FSA
(c) 02/01/18 | | | 1,000,000 | | | | 617,840 | | |
| NJ Middlesex County | |
| Certificates of Participation, | |
Series 2001,
Insured: MBIA
5.500% 08/01/17 | | | 250,000 | | | | 260,567 | | |
| NJ Monmouth County Improvement Authority | |
| Series 2000, | |
Insured: AMBAC
5.000% 12/01/12 | | | 110,000 | | | | 112,373 | | |
| Local Appropriated Total | | | 3,028,484 | | |
| Local General Obligations – 17.9% | |
| NJ Atlantic City | |
| Series 2008, | |
| 5.500% 02/15/18 | | | 500,000 | | | | 509,420 | | |
| NJ Board of Education | |
| Tom Rivers School District, | |
Series 2007,
Insured: MBIA
4.500% 01/15/20 | | | 500,000 | | | | 485,775 | | |
| NJ Cherry Hill Township | |
| Series 1999 B, | |
| 5.250% 07/15/11 | | | 500,000 | | | | 529,525 | | |
See Accompanying Notes to Financial Statements.
79
Columbia New Jersey Intermediate Municipal Bond Fund
October 31, 2008
| Municipal Bonds (continued) | |
| | | Par ($) | | Value ($) | |
| NJ Flemington Raritan Regional School District | |
| Series 2000, | |
Insured: FGIC
5.700% 02/01/15 | | | 400,000 | | | | 447,896 | | |
| NJ Freehold Regional High School District | |
| Series 2001, | |
Insured: FGIC
5.000% 03/01/20 | | | 1,205,000 | | | | 1,204,397 | | |
| NJ Greenwich Township Board of Education | |
| Series 1998, | |
Insured: FSA:
5.000% 01/15/13 | | | 165,000 | | | | 165,295 | | |
| 5.000% 01/15/14 | | | 250,000 | | | | 250,448 | | |
NJ Manalapan Englishtown Regional Board
of Education | |
| Series 2004, | |
Insured: FGIC
5.750% 12/01/20 | | | 1,325,000 | | | | 1,420,718 | | |
| NJ Mercer County Improvement Authority | |
| Series 1998 B, | |
Insured: FGIC
5.000% 02/15/14 | | | 250,000 | | | | 251,298 | | |
| NJ Middlesex County | |
| Certificates of Participation, | |
Series 2001,
Insured: MBIA
5.000% 08/01/12 | | | 500,000 | | | | 520,085 | | |
| Series 1998, | |
| 5.000% 10/01/09 | | | 500,000 | | | | 514,800 | | |
| NJ Parsippany-Troy Hills Township | |
| Series 1997, | |
Insured: MBIA
5.000% 12/01/15 | | | 500,000 | | | | 510,865 | | |
| NJ Passaic County | |
| Series 2003, | |
Insured: FSA
5.200% 09/01/16 | | | 1,500,000 | | | | 1,613,355 | | |
| NJ Summit | |
| Series 2001, | |
| 5.250% 06/01/16 | | | 1,205,000 | | | | 1,300,279 | | |
| NJ Union County | |
| General Improvement, | |
Series 1999,
5.125% 02/01/16 | | | 250,000 | | | | 256,463 | | |
| | | Par ($) | | Value ($) | |
NJ Washington Township Board of
Education Mercer County | |
| Series 2005, | |
Insured: FSA:
5.250% 01/01/26 | | | 1,330,000 | | | | 1,364,819 | | |
| 5.250% 01/01/28 | | | 500,000 | | | | 506,620 | | |
| Local General Obligations Total | | | 11,852,058 | | |
| Special Non-Property Tax – 4.6% | |
| IL Dedicated Tax Capital Appreciation | |
| Series 1990, | |
Insured: AMBAC
(c) 12/15/17 | | | 3,000,000 | | | | 1,878,540 | | |
| NJ Economic Development Authority | |
| Series 2004 A, | |
| 5.500% 06/15/24 | | | 750,000 | | | | 594,548 | | |
| Series 2004, | |
Insured: MBIA
(c) 07/01/21 | | | 1,255,000 | | | | 597,618 | | |
| Special Non-Property Tax Total | | | 3,070,706 | | |
| Special Property Tax – 0.4% | |
| NJ Economic Development Authority | |
| Series 2007, | |
| 5.125% 06/15/27 | | | 400,000 | | | | 307,436 | | |
| Special Property Tax Total | | | 307,436 | | |
| State Appropriated – 14.9% | |
| NJ Economic Development Authority | |
| Series 2001 C, | |
Insured: AMBAC
5.500% 06/15/12 | | | 500,000 | | | | 531,395 | | |
| Series 2005 A, | |
Insured: FSA
5.000% 03/01/19 | | | 2,000,000 | | | | 2,028,040 | | |
| NJ Educational Facilities Authority | |
| Series 2001 A, | |
| 5.000% 03/01/15 | | | 1,855,000 | | | | 1,905,586 | | |
| NJ Health Care Facilities Financing Authority | |
| Series 2005, | |
Insured: AMBAC
5.000% 09/15/13 | | | 970,000 | | | | 1,004,900 | | |
| NJ Sports & Exposition Authority | |
| Series 2000 C, | |
| 5.000% 03/01/11 | | | 195,000 | | | | 201,373 | | |
| NJ State | |
| Certificates of Participation, | |
Series 2008 A,
5.000% 06/15/21 | | | 250,000 | | | | 241,850 | | |
See Accompanying Notes to Financial Statements.
80
Columbia New Jersey Intermediate Municipal Bond Fund
October 31, 2008
| Municipal Bonds (continued) | |
| | | Par ($) | | Value ($) | |
| NJ Transit Corp. | |
| Certificates of Participation, | |
Series 2002 A,
Insured: AMBAC
5.500% 09/15/15 | | | 1,000,000 | | | | 1,048,490 | | |
| NJ Transportation Trust Fund Authority | |
| Series 1999 A, | |
| 5.625% 06/15/12 | | | 400,000 | | | | 427,216 | | |
| Series 2003 A, | |
Insured: AMBAC
5.500% 12/15/15 | | | 1,000,000 | | | | 1,074,360 | | |
| Series 2005 B, | |
Insured: AMBAC
5.250% 12/15/23 | | | 1,000,000 | | | | 989,660 | | |
| Series 2006 C, | |
Insured: AMBAC
(c) 12/15/24 | | | 1,000,000 | | | | 392,360 | | |
| State Appropriated Total | | | 9,845,230 | | |
| State General Obligations – 1.9% | |
| PR Commonwealth of Puerto Rico | |
| Capital Appreciation, | |
Series 1998,
Insured: MBIA
6.000% 07/01/16 | | | 250,000 | | | | 257,713 | | |
| Series 2004 A, | |
| 5.000% 07/01/30 (d) | | | 1,000,000 | | | | 985,480 | | |
| State General Obligations Total | | | 1,243,193 | | |
| Tax-Backed Total | | | 29,347,107 | | |
| Transportation – 2.1% | |
| Toll Facilities – 2.1% | |
| NJ Turnpike Authority | |
| Series 2004 B, | |
Insured: AMBAC
(e) 01/01/35
(5.150% 01/01/15) | | | 500,000 | | | | 304,850 | | |
PA Delaware River Joint Toll Bridge
Commission | |
| Series 2003, | |
| 5.250% 07/01/11 | | | 1,000,000 | | | | 1,045,690 | | |
| Toll Facilities Total | | | 1,350,540 | | |
| Transportation Total | | | 1,350,540 | | |
| | | Par ($) | | Value ($) | |
| Utilities – 10.4% | |
| Municipal Electric – 1.1% | |
PR Commonwealth of Puerto Rico Electric
Power Authority | |
| Series 2003 NN, | |
Insured: MBIA
5.250% 07/01/19 | | | 750,000 | | | | 713,745 | | |
| Municipal Electric Total | | | 713,745 | | |
| Water & Sewer – 9.3% | |
| NJ Bergen County Improvement Authority | |
| Series 2008, | |
| 5.000% 12/15/26 | | | 500,000 | | | | 496,440 | | |
NJ Cape May County Municipal Utilities
Sewer Authority | |
| Series 2002 A, | |
Insured: FSA
5.750% 01/01/16 | | | 1,000,000 | | | | 1,098,900 | | |
| NJ Jersey City Municipal Utilities Authority | |
| Series 2007, | |
Insured: FGIC
5.250% 01/01/19 | | | 1,000,000 | | | | 962,570 | | |
| NJ North Hudson Sewerage Authority | |
| Sewer Revenue, | |
Series 2006 A,
Insured: MBIA
5.125% 08/01/17 | | | 600,000 | | | | 628,116 | | |
NJ North Jersey District Water Supply
Commission | |
| Series 1997 A, | |
Insured: MBIA
5.000% 11/15/10 | | | 500,000 | | | | 503,175 | | |
| NJ Ocean County Utilities Authority | |
| Wastewater Revenue, | |
Series 2001,
5.250% 01/01/18 | | | 1,000,000 | | | | 1,023,300 | | |
| NJ Rahway Valley Sewerage Authority | |
| Series 2005 A, | |
Insured: MBIA
(c) 09/01/25 | | | 1,000,000 | | | | 354,530 | | |
NJ Southeast Morris County Municipal
Utilities Authority | |
| Series 2001, | |
Insured: MBIA
5.000% 01/01/10 | | | 1,055,000 | | | | 1,084,245 | | |
| Water & Sewer Total | | | 6,151,276 | | |
| Utilities Total | | | 6,865,021 | | |
Total Municipal Bonds
(cost of $63,537,974) | | | 61,603,054 | | |
See Accompanying Notes to Financial Statements.
81
Columbia New Jersey Intermediate Municipal Bond Fund
October 31, 2008
| Investment Company – 3.9% | |
| | | Shares | | Value ($) | |
| Dreyfus Tax-Exempt Cash | |
Management Fund
(7 day yield of 2.260%) | | | 2,611,046 | | | | 2,611,046 | | |
Total Investment Company
(cost of $2,611,046) | | | 2,611,046 | | |
Total Investments – 97.0%
(cost of $66,149,020) (f) | | | 64,214,100 | | |
| Other Assets & Liabilities, Net – 3.0% | | | 1,985,658 | | |
| Net Assets – 100.0% | | | 66,199,758 | | |
Notes to Investment Portfolio:
(a) Security purchased on a delayed delivery basis.
(b) The Fund has been informed that each issuer has placed direct obligations of the U.S. Government in an irrevocable trust, solely for the payment of principal and interest.
(c) Zero coupon bond.
(d) The interest rate shown on floating rate or variable rate securities reflects the rate at October 31, 2008.
(e) Step bond. This security is currently not paying coupon. Shown parenthetically is the next interest rate to be paid and the date the security will begin accruing at this rate.
(f) Cost for federal income tax purposes is $66,130,929.
At October 31, 2008, the composition of the Fund by revenue source is as follows:
| Holdings By Revenue Source (Unaudited) | | % of
Net Assets | |
| Tax-Backed | | | 44.3 | | |
| Refunded/Escrowed | | | 20.1 | | |
| Utilities | | | 10.4 | | |
| Health Care | | | 5.4 | | |
| Education | | | 4.5 | | |
| Other | | | 2.6 | | |
| Housing | | | 2.5 | | |
| Transportation | | | 2.1 | | |
| Other Revenue | | | 0.9 | | |
| Industrials | | | 0.3 | | |
| | | | 93.1 | | |
| Investment Company | | | 3.9 | | |
| Other Assets & Liabilities, Net | | | 3.0 | | |
| | | | 100.0 | | |
| Acronym | | Name | |
| AGO | | Assured Guaranty Corp. | |
|
| AMBAC | | Ambac Assurance Corp. | |
|
| FGIC | | Financial Guaranty Insurance Co. | |
|
| FSA | | Financial Security Assurance, Inc. | |
|
| MBIA | | MBIA Insurance Corp. | |
|
See Accompanying Notes to Financial Statements.
82
Investment Portfolio – Columbia New York Intermediate Municipal Bond Fund
October 31, 2008
| Municipal Bonds – 98.8% | |
| | | Par ($) | | Value ($) | |
| Education – 8.7% | |
| Education – 8.4% | |
| NY Dormitory Authority | |
Barnard College,
Series 2007 A,
Insured: FGIC
5.000% 07/01/18 | | | 1,745,000 | | | | 1,696,681 | | |
Brooklyn Law School,
Series 2003 A,
Insured: RAD
5.250% 07/01/10 | | | 500,000 | | | | 508,415 | | |
Mount Sinai School of Medicine,
Series 1995 B,
Insured: MBIA
5.700% 07/01/11 | | | 690,000 | | | | 706,795 | | |
New York University Hospital Center,
Series 2007 A:
5.000% 07/01/10 | | | 1,000,000 | | | | 977,030 | | |
| 5.000% 07/01/12 | | | 1,000,000 | | | | 943,120 | | |
New York University:
Series 1998 A,
Insured: MBIA:
5.750% 07/01/20 | | | 2,000,000 | | | | 2,124,860 | | |
| 6.000% 07/01/17 | | | 2,475,000 | | | | 2,755,739 | | |
Series 2001 1,
Insured: AMBAC
5.500% 07/01/15 | | | 1,205,000 | | | | 1,306,847 | | |
Series 2001 2,
Insured: AMBAC
5.500% 07/01/21 | | | 900,000 | | | | 905,904 | | |
Series 2001 A,
Insured: AMBAC
5.750% 07/01/12 | | | 5,000,000 | | | | 5,410,550 | | |
St. John's University,
Series 2007 C,
Insured: MBIA
5.250% 07/01/22 | | | 2,000,000 | | | | 1,920,680 | | |
NY Dutchess County Industrial Development
Agency | |
Bard College,
Series 2007,
5.000% 08/01/20 | | | 375,000 | | | | 348,877 | | |
NY Oneida County Industrial Development
Agency | |
Hamilton College,
Series 2007 A,
Insured: MBIA:
(a) 07/01/18 | | | 1,000,000 | | | | 634,190 | | |
| (a) 07/01/20 | | | 1,000,000 | | | | 555,380 | | |
| | | Par ($) | | Value ($) | |
| NY Troy Industrial Development Authority | |
Rensselaer Polytechnic Institute,
Series 2002 E,
4.050% 04/01/37 (b) | | | 3,750,000 | | | | 3,701,662 | | |
| Education Total | | | 24,496,730 | | |
| Prep School – 0.3% | |
NY New York City Industrial Development
Agency | |
Trinity Episcopal School Corp.,
Series 1997,
Insured: MBIA
5.250% 06/15/17 | | | 1,000,000 | | | | 1,001,240 | | |
| Prep School Total | | | 1,001,240 | | |
| Education Total | | | 25,497,970 | | |
| Health Care – 5.6% | |
| Continuing Care Retirement – 0.1% | |
NY Nassau County Industrial Development
Agency | |
Amsterdam Harborside,
Series 2007 A,
5.875% 01/01/18 | | | 250,000 | | | | 216,970 | | |
NY Suffolk County Industrial Development
Agency | |
Active Retirement Community,
Series 2006,
5.000% 11/01/28 | | | 335,000 | | | | 245,904 | | |
| Continuing Care Retirement Total | | | 462,874 | | |
| Hospitals – 4.9% | |
| NY Albany Industrial Development Agency | |
St. Peter's Hospital:
Series 2008 A:
5.250% 11/15/27 | | | 1,000,000 | | | | 803,100 | | |
| 5.750% 11/15/22 | | | 500,000 | | | | 451,300 | | |
Series 2008 E,
5.250% 11/15/22 | | | 500,000 | | | | 425,750 | | |
| NY Dormitory Authority | |
Kaleida Health,
Series 2006,
Insured: FHA
4.600% 08/15/27 | | | 2,000,000 | | | | 1,699,680 | | |
Long Island Jewish Medical Center,
Series 2003,
5.000% 05/01/11 | | | 820,000 | | | | 845,117 | | |
See Accompanying Notes to Financial Statements.
83
Columbia New York Intermediate Municipal Bond Fund
October 31, 2008
| Municipal Bonds (continued) | |
| | | Par ($) | | Value ($) | |
New York Hospital Medical Center Queens,
Series 2007,
Insured: FHA
4.650% 08/15/27 | | | 1,000,000 | | | | 815,670 | | |
New York Methodist Hospital,
Series 2004,
5.250% 07/01/24 | | | 1,000,000 | | | | 800,050 | | |
North Shore Long Island Jewish Health:
Series 2006 A,
5.000% 11/01/19 | | | 1,000,000 | | | | 902,890 | | |
Series 2007 A,
5.000% 05/01/24 | | | 1,310,000 | | | | 1,111,889 | | |
Orange Regional Medical Center,
Series 2008,
6.125% 12/01/29 | | | 1,350,000 | | | | 1,090,584 | | |
Presbyterian Hospital,
Series 2007,
Insured: FSA
5.250% 08/15/23 | | | 250,000 | | | | 246,192 | | |
White Plains Hospital,
Series 2004,
Insured: FHA
4.625% 02/15/18 | | | 635,000 | | | | 597,338 | | |
NY Madison County Industrial Development
Agency | |
Oneida Health Systems, Inc.,
Series 2007,
5.250% 02/01/27 | | | 675,000 | | | | 523,570 | | |
NY Monroe County Industrial Development
Agency | |
Series 2005,
5.000% 08/01/22 | | | 700,000 | | | | 578,662 | | |
| NY New York City Health & Hospital Corp. | |
Series 2003 A,
Insured: AMBAC
5.000% 02/15/11 | | | 2,000,000 | | | | 2,059,200 | | |
NY Saratoga County Industrial Development
Agency | |
Saratoga Hospital:
Series 2004 A,
5.000% 12/01/13 | | | 485,000 | | | | 469,616 | | |
Series 2007 B:
5.000% 12/01/22 | | | 500,000 | | | | 412,105 | | |
| 5.125% 12/01/27 | | | 500,000 | | | | 394,105 | | |
| Hospitals Total | | | 14,226,818 | | |
| | | Par ($) | | Value ($) | |
| Nursing Homes – 0.6% | |
| NY Amherst Industrial Development Agency | |
Beechwood Health Care Center, Inc.,
Series 2007,
4.875% 01/01/13 | | | 500,000 | | | | 449,535 | | |
| NY Dormitory Authority | |
AIDS Long Term Health Care Facility,
Series 2005,
Insured: SONYMA
5.000% 11/01/12 | | | 500,000 | | | | 513,490 | | |
Gurwin Nursing Home,
Series 2005 A,
Insured: FHA
4.400% 02/15/20 | | | 835,000 | | | | 756,944 | | |
| Nursing Homes Total | | | 1,719,969 | | |
| Health Care Total | | | 16,409,661 | | |
| Housing – 1.7% | |
| Multi-Family – 1.2% | |
| NY Dormitory Authority | |
Gateway-Longview Inc.
Series 2008 A-1,
5.000% 06/01/33 | | | 1,700,000 | | | | 1,446,496 | | |
| PR Housing Finance Authority | |
Series 2008,
5.000% 12/01/13 | | | 2,000,000 | | | | 2,083,640 | | |
| Multi-Family Total | | | 3,530,136 | | |
| Single-Family – 0.5% | |
| NY Mortgage Agency Revenue | |
Series 2000 96,
5.200% 10/01/14 | | | 345,000 | | | | 347,349 | | |
Series 2005 128,
4.350% 10/01/16 | | | 1,000,000 | | | | 1,011,130 | | |
| Single-Family Total | | | 1,358,479 | | |
| Housing Total | | | 4,888,615 | | |
| Industrials – 0.2% | |
| Oil & Gas – 0.2% | |
| TN Energy Acquisition Corp. | |
Series 2006,
5.250% 09/01/22 | | | 750,000 | | | | 546,473 | | |
| Oil & Gas Total | | | 546,473 | | |
| Industrials Total | | | 546,473 | | |
See Accompanying Notes to Financial Statements.
84
Columbia New York Intermediate Municipal Bond Fund
October 31, 2008
| Municipal Bonds (continued) | |
| | | Par ($) | | Value ($) | |
| Other – 23.4% | |
| Other – 0.4% | |
NY New York City Industrial Development
Agency | |
United Jewish Appeal,
Series 2004 A,
5.000% 07/01/27 | | | 625,000 | | | | 607,231 | | |
NY Westchester County Industrial
Development Agency | |
Guiding Eyes for the Blind,
Series 2004,
5.375% 08/01/24 | | | 500,000 | | | | 418,110 | | |
| Other Total | | | 1,025,341 | | |
| Pool/Bond Bank – 4.3% | |
| NY Dormitory Authority | |
Series 2008 A,
Insured: FSA
5.000% 10/01/23 | | | 3,000,000 | | | | 2,987,400 | | |
| NY Environmental Facilities Corp. | |
Series 1994 2,
5.750% 06/15/12 | | | 185,000 | | | | 200,250 | | |
Series 2002 K,
5.000% 06/15/12 | | | 6,000,000 | | | | 6,350,580 | | |
Series 2008 B,
5.000% 06/15/21 | | | 3,000,000 | | | | 3,020,580 | | |
| Pool/Bond Bank Total | | | 12,558,810 | | |
| Refunded/Escrowed (c) – 18.7% | |
| NY Dormitory Authority | |
City University Systems Consolidated 4th Generation,
Series 2001 A,
Pre-refunded 07/01/11,
Insured: FGIC
5.500% 07/01/16 | | | 2,280,000 | | | | 2,444,935 | | |
Columbia University,
Series 2002 B,
Pre-refunded 07/01/12,
5.375% 07/01/15 | | | 1,000,000 | | | | 1,078,950 | | |
Memorial Sloan-Kettering Cancer Center,
Series 2003,
Escrowed to Maturity,
Insured: MBIA
(a) 07/01/25 | | | 3,750,000 | | | | 1,528,012 | | |
University Dormitory Facilities:
Series 2000 A,
Pre-refunded 07/01/10,
6.000% 07/01/30 | | | 1,000,000 | | | | 1,071,290 | | |
Series 2002,
Pre-refunded 07/01/12,
5.375% 07/01/19 | | | 1,130,000 | | | | 1,223,711 | | |
| | | Par ($) | | Value ($) | |
| NY Environmental Facilities Corp. | |
New York City Municipal Water,
Series 1994 A,
Escrowed to Maturity,
5.750% 06/15/12 | | | 1,815,000 | | | | 1,987,988 | | |
| NY Long Island Power Authority | |
Electric Systems,
Series 1998 A,
Escrowed to Maturity,
Insured: FSA
5.500% 12/01/13 | | | 2,000,000 | | | | 2,190,580 | | |
Series 1998 A,
Escrowed to Maturity,
Insured: FSA
5.250% 12/01/14 | | | 5,000,000 | | | | 5,490,800 | | |
Series 2003 C,
Pre-refunded 09/01/13,
5.500% 09/01/21 | | | 1,000,000 | | | | 1,104,410 | | |
| NY Metropolitan Transportation Authority | |
Series 1996 A,
Pre-refunded 10/01/10,
Insured: MBIA
5.500% 04/01/16 | | | 1,000,000 | | | | 1,059,840 | | |
Series 1997 8,
Pre-refunded 07/01/13,
Insured: FSA
5.375% 07/01/21 | | | 6,000,000 | | | | 6,577,620 | | |
Series 1998 A,
Pre-refunded 10/01/15,
Insured: FGIC
5.000% 04/01/23 | | | 2,000,000 | | | | 2,165,580 | | |
Series 2000 A,
Pre-refunded 04/01/10,
Insured: FGIC
5.875% 04/01/21 | | | 3,300,000 | | | | 3,470,082 | | |
Transportation Facilities,
Series 1999 A,
Pre-refunded 07/01/09,
6.000% 07/01/19 | | | 2,000,000 | | | | 2,057,260 | | |
NY New York City Transitional Finance
Authority | |
Series 2000 C,
Pre-refunded 05/01/10,
5.500% 11/01/29 | | | 3,000,000 | | | | 3,170,370 | | |
| NY New York | |
Series 2003 J,
Pre-refunded 06/01/13,
5.500% 06/01/16 | | | 1,085,000 | | | | 1,192,654 | | |
See Accompanying Notes to Financial Statements.
85
Columbia New York Intermediate Municipal Bond Fund
October 31, 2008
| Municipal Bonds (continued) | |
| | | Par ($) | | Value ($) | |
| NY Onondaga County | |
Series 1992,
Economically Defeased to Maturity,
5.875% 02/15/10 | | | 285,000 | | | | 298,469 | | |
| NY Thruway Authority | |
Highway & Bridge Trust Fund,
Series 2000 B-1:
Escrowed to Maturity,
Insured: FGIC
5.500% 04/01/10 | | | 1,535,000 | | | | 1,606,117 | | |
Pre-refunded 04/01/10,
Insured: FGIC
5.750% 04/01/16 | | | 2,000,000 | | | | 2,119,000 | | |
Second General Highway & Bridge,
Series 2003 A,
Pre-refunded 04/01/13,
Insured: MBIA
5.250% 04/01/17 | | | 1,750,000 | | | | 1,903,387 | | |
| NY Triborough Bridge & Tunnel Authority | |
Series 1991 X,
Escrowed to Maturity,
6.625% 01/01/12 | | | 300,000 | | | | 327,552 | | |
Series 1992 Y,
Escrowed to Maturity:
5.500% 01/01/17 | | | 2,000,000 | | | | 2,179,740 | | |
| 6.000% 01/01/12 | | | 750,000 | | | | 792,442 | | |
Series 1999 B,
Pre-refunded 01/01/22,
5.500% 01/01/30 | | | 2,000,000 | | | | 2,118,000 | | |
| NY TSASC, Inc. | |
Series 1999-1,
Pre-refunded 07/15/09,
6.375% 07/15/39 | | | 4,210,000 | | | | 4,395,198 | | |
| PA Elizabeth Forward School District | |
Series 1994 B,
Escrowed to Maturity,
Insured: MBIA
(a) 09/01/20 | | | 2,210,000 | | | | 1,195,124 | | |
| Refunded/Escrowed Total | | | 54,749,111 | | |
| Other Total | | | 68,333,262 | | |
| Other Revenue – 2.8% | |
| Recreation – 2.8% | |
| NY Cultural Resources | |
Museum of Modern Art,
Series 2008-1A,
5.000% 04/01/26 | | | 4,850,000 | | | | 4,648,386 | | |
| | | Par ($) | | Value ($) | |
| NY Industrial Development Agency | |
YMCA of Greater New York,
Series 2006,
5.000% 08/01/26 | | | 1,000,000 | | | | 885,610 | | |
NY Seneca Nation Indians Capital
Improvements Authority | |
Series 2007 A:
5.000% 12/01/23 (d) | | | 2,500,000 | | | | 1,839,175 | | |
| 5.250% 12/01/16 (d) | | | 1,000,000 | | | | 877,450 | | |
| Recreation Total | | | 8,250,621 | | |
| Other Revenue Total | | | 8,250,621 | | |
| Resource Recovery – 0.5% | |
| Disposal – 0.5% | |
NY Hempstead Town Industrial
Development Authority | |
America Fuel Co.,
Series 2001,
5.000% 12/01/10 | | | 1,500,000 | | | | 1,459,770 | | |
| Disposal Total | | | 1,459,770 | | |
| Resource Recovery Total | | | 1,459,770 | | |
| Tax-Backed – 39.9% | |
| Local Appropriated – 1.7% | |
| NY Dormitory Authority | |
Court Facilities:
Series 2001 2-2,
5.000% 01/15/21 | | | 2,500,000 | | | | 2,404,350 | | |
Series 2003 A,
5.250% 05/15/11 | | | 1,500,000 | | | | 1,564,035 | | |
NY Erie County Industrial Development
Agency | |
City School District Buffalo Project,
Series 2008 A,
Insured: FSA
5.000% 05/01/18 | | | 1,000,000 | | | | 1,009,040 | | |
| Local Appropriated Total | | | 4,977,425 | | |
| Local General Obligations – 11.6% | |
| NY Albany County | |
Series 2006,
Insured: SYNC
4.125% 09/15/20 | | | 1,000,000 | | | | 921,730 | | |
See Accompanying Notes to Financial Statements.
86
Columbia New York Intermediate Municipal Bond Fund
October 31, 2008
| Municipal Bonds (continued) | |
| | | Par ($) | | Value ($) | |
| NY City of New York | |
Series 2004 G,
5.000% 12/01/19 | | | 2,430,000 | | | | 2,392,140 | | |
Series 2007 C,
5.000% 01/01/15 | | | 4,000,000 | | | | 4,119,440 | | |
Series 2008 I-1,
5.000% 02/01/23 | | | 2,000,000 | | | | 1,914,700 | | |
| NY City of Yonkers | |
Series 2005 B,
Insured: MBIA:
5.000% 08/01/21 | | | 2,425,000 | | | | 2,392,675 | | |
| 5.000% 08/01/22 | | | 2,545,000 | | | | 2,495,245 | | |
| NY Monroe County Public Improvement | |
Series 1992,
Insured: MBIA
6.100% 03/01/09 | | | 15,000 | | | | 15,184 | | |
Series 1996,
Insured: MBIA
6.000% 03/01/16 | | | 1,210,000 | | | | 1,351,824 | | |
| NY New York City | |
Series 2001 F,
5.000% 08/01/09 | | | 1,000,000 | | | | 1,021,210 | | |
Series 2003 J,
5.500% 06/01/16 | | | 165,000 | | | | 173,397 | | |
Series 2004 B,
5.250% 08/01/15 | | | 2,000,000 | | | | 2,072,340 | | |
Series 2005 G,
5.250% 08/01/16 | | | 500,000 | | | | 517,030 | | |
Series 2006 J,
5.000% 06/01/17 | | | 1,350,000 | | | | 1,362,744 | | |
Series 2007 C,
4.250% 01/01/27 | | | 800,000 | | | | 642,528 | | |
Series 2007 D,
5.000% 02/01/24 | | | 2,000,000 | | | | 1,895,520 | | |
Series 2007 D-1,
5.000% 12/01/21 | | | 2,000,000 | | | | 1,936,480 | | |
| NY Onondaga County | |
Series 1992,
5.875% 02/15/10 | | | 215,000 | | | | 224,481 | | |
| NY Orange County | |
Series 2005 A,
5.000% 07/15/18 | | | 1,500,000 | | | | 1,568,925 | | |
| NY Red Hook Central School District | |
Series 2002,
Insured: FSA
5.125% 06/15/17 | | | 890,000 | | | | 913,656 | | |
| | | Par ($) | | Value ($) | |
| NY Rensselaer County | |
Series 1998 A,
Insured: AMBAC
5.250% 06/01/11 | | | 545,000 | | | | 576,436 | | |
NY Sachem Central School District of
Holbrook | |
Series 2006,
Insured: FGIC
4.250% 10/15/24 | | | 1,000,000 | | | | 856,220 | | |
| NY Somers Central School District | |
Series 2006,
Insured: MBIA:
4.000% 12/01/21 | | | 500,000 | | | | 438,425 | | |
| 4.000% 12/01/22 | | | 500,000 | | | | 429,825 | | |
| NY Three Village Central School District | |
Series 2005,
Insured: FGIC
5.000% 06/01/18 | | | 1,000,000 | | | | 1,035,780 | | |
| NY Town of Babylon | |
Series 2004,
Insured: AMBAC
5.000% 01/01/13 | | | 2,565,000 | | | | 2,662,419 | | |
| Local General Obligations Total | | | 33,930,354 | | |
| Special Non-Property Tax – 14.2% | |
| NY Dormitory Authority | |
Series 2005 B,
Insured: AMBAC
5.500% 03/15/26 | | | 1,000,000 | | | | 1,035,140 | | |
| NY Environmental Facilities Corp. | |
Series 2004 A,
Insured: FGIC
5.000% 12/15/24 | | | 2,000,000 | | | | 1,958,720 | | |
| NY Housing Finance Agency | |
Series 2008 A,
5.000% 09/15/19 | | | 1,400,000 | | | | 1,432,662 | | |
| NY Local Government Assistance Corp. | |
Series 1993 E,
6.000% 04/01/14 | | | 3,540,000 | | | | 3,803,270 | | |
Series 2003 A-1,
Insured: FSA
5.000% 04/01/12 | | | 5,000,000 | | | | 5,285,650 | | |
| NY Metropolitan Transportation Authority | |
Series 2004 A,
Insured: FGIC
5.250% 11/15/18 | | | 800,000 | | | | 799,360 | | |
See Accompanying Notes to Financial Statements.
87
Columbia New York Intermediate Municipal Bond Fund
October 31, 2008
| Municipal Bonds (continued) | |
| | | Par ($) | | Value ($) | |
| NY Nassau County Interim Finance Authority | |
Series 2004 I-1H,
Insured: AMBAC
5.250% 11/15/15 | | | 5,000,000 | | | | 5,318,500 | | |
| NY Sales Tax Asset Receivables Corp. | |
Series 2004 A,
Insured: MBIA
5.000% 10/15/22 | | | 6,500,000 | | | | 6,500,520 | | |
| NY Thruway Authority | |
Series 2007,
5.000% 03/15/22 | | | 1,000,000 | | | | 1,001,220 | | |
| NY Transitional Finance Authority | |
Series 2003 B,
5.250% 08/01/17 | | | 2,000,000 | | | | 2,068,020 | | |
Series 2005 A-1,
5.000% 11/01/19 | | | 3,000,000 | | | | 3,068,460 | | |
Series 2006,
5.000% 07/15/11 | | | 3,000,000 | | | | 3,138,360 | | |
| Series 2007, | |
Insured: FGIC
5.000% 01/15/21 | | | 4,300,000 | | | | 4,218,472 | | |
PR Commonwealth Infrastructure Financing
Authority | |
Series 2005 C,
Insured: AMBAC
5.500% 07/01/27 | | | 1,000,000 | | | | 920,010 | | |
| PR Commonwealth of Puerto Rico Highway & Transportation Authority | |
Series 2006 BB,
Insured: FSA
5.250% 07/01/22 | | | 1,000,000 | | | | 966,340 | | |
| Special Non-Property Tax Total | | | 41,514,704 | | |
| Special Property Tax – 1.2% | |
| NY Industrial Development Agency | |
Series 2006:
Insured: AMBAC:
5.000% 01/01/19 | | | 850,000 | | | | 827,492 | | |
| 5.000% 01/01/20 | | | 1,000,000 | | | | 957,810 | | |
Insured: MBIA
5.000% 03/01/15 | | | 1,150,000 | | | | 1,171,597 | | |
NY New York City Industrial Development
Agency | |
Series 2006,
Insured: AMBAC
5.000% 01/01/23 | | | 625,000 | | | | 579,944 | | |
| Special Property Tax Total | | | 3,536,843 | | |
| | | Par ($) | | Value ($) | |
| State Appropriated – 9.4% | |
| NY Dormitory Authority | |
4201 Schools Program,
Series 2000,
6.250% 07/01/20 | | | 1,685,000 | | | | 1,775,754 | | |
City University,
Series 2002 B,
Insured: AMBAC
5.250% 11/15/26 (b) | | | 1,500,000 | | | | 1,536,795 | | |
Consolidated 2nd Generation,
Series 2000 A,
Insured: AMBAC
6.125% 07/01/13 | | | 2,000,000 | | | | 2,107,380 | | |
Consolidated 3rd Generation,
Series 2003 1,
5.250% 07/01/11 | | | 1,000,000 | | | | 1,053,530 | | |
Series 1993 A:
5.250% 05/15/15 | | | 2,000,000 | | | | 2,108,440 | | |
| 5.500% 05/15/19 | | | 2,500,000 | | | | 2,595,575 | | |
Series 2005 A,
Insured: FGIC
5.500% 05/15/21 | | | 1,000,000 | | | | 1,026,710 | | |
State University,
Series 2000 C,
Insured: FSA
5.750% 05/15/17 | | | 1,250,000 | | | | 1,374,425 | | |
| NY Housing Finance Agency | |
Series 2003 K,
5.000% 03/15/10 | | | 1,485,000 | | | | 1,528,808 | | |
| NY Thruway Authority | |
Local Highway & Bridge:
Series 2001,
5.250% 04/01/11 | | | 2,000,000 | | | | 2,104,100 | | |
Series 2002,
5.250% 04/01/09 | | | 1,500,000 | | | | 1,520,280 | | |
| NY Urban Development Corp. | |
Series 2002 A,
5.000% 01/01/17 | | | 2,000,000 | | | | 2,032,280 | | |
Series 2008 B,
5.000% 01/01/26 | | | 3,125,000 | | | | 2,945,969 | | |
Series 2008,
5.000% 01/01/22 | | | 2,000,000 | | | | 1,925,160 | | |
PR Commonwealth of Puerto Rico Public
Finance Corp. | |
Series 2004 A,
5.750% 08/01/27 (b) | | | 1,675,000 | | | | 1,681,197 | | |
| State Appropriated Total | | | 27,316,403 | | |
See Accompanying Notes to Financial Statements.
88
Columbia New York Intermediate Municipal Bond Fund
October 31, 2008
| Municipal Bonds (continued) | |
| | | Par ($) | | Value ($) | |
| State General Obligations – 1.8% | |
| PR Commonwealth of Puerto Rico | |
| Series 2004 A, | |
| 5.000% 07/01/30 (b) | | | 1,000,000 | | | | 985,480 | | |
Series 2006 A,
5.250% 07/01/22 | | | 1,500,000 | | | | 1,374,975 | | |
| PR Public Buildings Authority | |
Series 2007,
6.250% 07/01/23 | | | 3,000,000 | | | | 3,011,130 | | |
| State General Obligations Total | | | 5,371,585 | | |
| Tax-Backed Total | | | 116,647,314 | | |
| Transportation – 7.9% | |
| Ports – 0.5% | |
| NY Port Authority of New York & New Jersey | |
Series 2004,
Insured: SYNC
5.000% 09/15/28 | | | 1,500,000 | | | | 1,423,830 | | |
| Ports Total | | | 1,423,830 | | |
| Toll Facilities – 3.5% | |
| NY Thruway Authority | |
Second General Highway & Bridge Trust Fund,
Series 2005 A,
Insured: MBIA
5.000% 04/01/22 | | | 500,000 | | | | 496,120 | | |
Series 2005 B,
Insured: AMBAC
5.000% 04/01/19 | | | 2,500,000 | | | | 2,537,850 | | |
Series 2008 A,
5.000% 04/01/21 | | | 1,000,000 | | | | 990,390 | | |
| NY Triborough Bridge & Tunnel Authority | |
| Series 2002, | |
| 5.250% 11/15/13 | | | 2,015,000 | | | | 2,169,148 | | |
| Series 2006 A, | |
| 5.000% 11/15/19 | | | 2,000,000 | | | | 2,041,900 | | |
Series 2008 A,
5.000% 11/15/21 | | | 2,000,000 | | | | 2,012,480 | | |
| Toll Facilities Total | | | 10,247,888 | | |
| Transportation – 3.9% | |
| NY Metropolitan Transportation Authority | |
Series 2005 B,
Insured: AMBAC
5.250% 11/15/24 | | | 750,000 | | | | 740,385 | | |
Series 2005 C,
5.000% 11/15/16 | | | 750,000 | | | | 767,932 | | |
| | | Par ($) | | Value ($) | |
| Series 2006 A, | |
Insured: CIFG
5.000% 11/15/22 | | | 2,280,000 | | | | 2,096,118 | | |
Series 2006 B,
5.000% 11/15/16 | | | 1,500,000 | | | | 1,535,865 | | |
Series 2007 B,
5.000% 11/15/22 | | | 1,500,000 | | | | 1,434,330 | | |
Series 2008 C,
6.250% 11/15/23 | | | 3,570,000 | | | | 3,760,281 | | |
Series 2008,
5.000% 11/15/30 | | | 1,000,000 | | | | 1,027,490 | | |
| Transportation Total | | | 11,362,401 | | |
| Transportation Total | | | 23,034,119 | | |
| Utilities – 8.1% | |
| Municipal Electric – 3.0% | |
| NY Long Island Power Authority | |
Series 2003 A,
5.000% 06/01/09 | | | 2,000,000 | | | | 2,031,860 | | |
PR Commonwealth of Puerto Rico Electric
Power Authority | |
Series 1997 BB,
Insured: MBIA
6.000% 07/01/12 | | | 1,000,000 | | | | 1,038,810 | | |
Series 2003 NN,
Insured: MBIA
5.250% 07/01/19 | | | 500,000 | | | | 475,830 | | |
| PR Puerto Rico Electric Power Authority | |
Series 1997 BB,
Insured: MBIA
6.000% 07/01/11 | | | 5,000,000 | | | | 5,197,100 | | |
| Municipal Electric Total | | | 8,743,600 | | |
| Water & Sewer – 5.1% | |
| NY Municipal Water Finance Authority | |
Series 2001 D,
5.125% 06/15/19 | | | 4,000,000 | | | | 4,066,440 | | |
| Series 2002, | |
Insured: FSA
5.375% 06/15/16 | | | 5,000,000 | | | | 5,232,200 | | |
| NY Onondaga County Water Authority | |
Series 2005 A:
Insured: AMBAC:
5.000% 09/15/22 | | | 895,000 | | | | 887,876 | | |
| 5.000% 09/15/23 | | | 940,000 | | | | 930,224 | | |
See Accompanying Notes to Financial Statements.
89
Columbia New York Intermediate Municipal Bond Fund
October 31, 2008
| Municipal Bonds (continued) | |
| | | Par ($) | | Value ($) | |
NY Rensselaer County Water Service &
Sewer Authority | |
Series 2008:
5.100% 09/01/28 | | | 1,155,000 | | | | 1,021,852 | | |
| 5.100% 09/01/28 | | | 1,060,000 | | | | 937,803 | | |
| NY Western Nassau County Water Authority | |
Series 2005,
Insured: AMBAC
5.000% 05/01/22 | | | 1,765,000 | | | | 1,721,034 | | |
| Water & Sewer Total | | | 14,797,429 | | |
| Utilities Total | | | 23,541,029 | | |
Total Municipal Bonds
(cost of $297,374,549) | | | 288,608,834 | | |
| Investment Company – 0.1% | |
| | | Shares | | | |
Dreyfus Tax-Exempt Cash
Management Fund
(7 day yield of 2.260%) | | | 172,802 | | | | 172,802 | | |
Total Investment Company
(cost of $172,802) | | | 172,802 | | |
Total Investments – 98.9%
(cost of $297,605,917) (e) | | | 288,781,636 | | |
| Other Assets & Liabilities, Net – 1.1% | | | 3,229,117 | | |
| Net Assets – 100.0% | | | 292,010,753 | | |
Notes to Investment Portfolio:
(a) Zero coupon bond.
(b) The interest rate shown on floating rate or variable rate securities reflects the rate at October 31, 2008.
(c) The Fund has been informed that each issuer has placed direct obligations of the U.S. Government in an irrevocable trust, solely for the payment of principal and interest.
(d) Security exempt from registration pursuant to Rule 144A under the Securities Act of 1933. These securities may be resold in transactions exempt from registration, normally to qualified institutional buyers. At October 31, 2008, these securities, which are not illiquid, amounted to $2,716,625, which represents 0.9% of net assets.
(e) Cost for federal income tax purposes is $297,547,352.
At October 31, 2008, the composition of the Fund by revenue source is as follows:
| Holdings By Revenue Source (Unaudited) | | % of
Net Assets | |
| Tax-Backed | | | 39.9 | | |
| Refunded/Escrowed | | | 18.7 | | |
| Education | | | 8.7 | | |
| Utilities | | | 8.1 | | |
| Transportation | | | 7.9 | | |
| Health Care | | | 5.6 | | |
| Other | | | 4.7 | | |
| Other Revenue | | | 2.8 | | |
| Housing | | | 1.7 | | |
| Resource Recovery | | | 0.5 | | |
| Industrials | | | 0.2 | | |
| | | | 98.8 | | |
| Investment Company | | | 0.1 | | |
| Other Assets & Liabilities, Net | | | 1.1 | | |
| | | | 100.0 | | |
| Acronym | | Name | |
| AMBAC | | Ambac Assurance Corp. | |
|
| CIFG | | CIFG Assurance North America, Inc. | |
|
| FGIC | | Financial Guaranty Insurance Co. | |
|
| FHA | | Federal Housing Administration | |
|
| FSA | | Financial Security Assurance, Inc. | |
|
| MBIA | | MBIA Insurance Corp. | |
|
| RAD | | Radian Asset Assurance, Inc. | |
|
| SONYMA | | State of New York Mortgage Agency | |
|
| SYNC | | Syncora Guarantee, Inc. | |
|
See Accompanying Notes to Financial Statements.
90
Investment Portfolio – Columbia Rhode Island Intermediate Municipal Bond Fund
October 31, 2008
| Municipal Bonds – 96.7% | |
| | | Par ($) | | Value ($) | |
| Education – 16.7% | |
| Education – 15.6% | |
PR Commonwealth of Puerto Rico
Industrial, Tourist, Educational, Medical &
Environmental Control Facilities | |
Universidad Interamericana de Puerto Rico, Inc.,
Series 1998 A,
Insured: MBIA:
5.250% 10/01/12 | | | 360,000 | | | | 367,409 | | |
| 5.375% 10/01/13 | | | 1,550,000 | | | | 1,585,448 | | |
| 5.500% 10/01/14 | | | 350,000 | | | | 357,829 | | |
| RI Health & Educational Building Corp. | |
Higher Education Facility:
Brown University:
Series 2004 D,
Insured: SYNC
5.500% 08/15/16 | | | 1,340,000 | | | | 1,371,852 | | |
Series 2007,
5.000% 09/01/18 | | | 1,000,000 | | | | 1,047,190 | | |
Johnson & Wales:
Series 1999,
Insured: MBIA:
5.500% 04/01/15 | | | 1,000,000 | | | | 1,039,340 | | |
| 5.500% 04/01/17 | | | 1,000,000 | | | | 1,025,670 | | |
| 5.500% 04/01/18 | | | 1,420,000 | | | | 1,439,724 | | |
Series 2003,
Insured: SYNC
5.250% 04/01/16 | | | 1,485,000 | | | | 1,472,363 | | |
New England Institute,
Series 2007,
Insured: AMBAC
4.500% 03/01/26 | | | 500,000 | | | | 409,520 | | |
Providence College,
Series 2003 A,
Insured: SYNC
5.000% 11/01/24 | | | 2,500,000 | | | | 2,252,275 | | |
Roger Williams College,
Series 1998,
Insured: AMBAC
5.125% 11/15/14 | | | 1,000,000 | | | | 1,021,110 | | |
Series 2003 A,
Insured: AMBAC
5.000% 09/15/13 | | | 1,040,000 | | | | 1,090,502 | | |
Series 2004 A,
Insured: AMBAC
5.250% 09/15/20 | | | 1,020,000 | | | | 1,025,049 | | |
Series 2004 D,
Insured: SYNC
5.500% 08/15/17 | | | 1,345,000 | | | | 1,364,839 | | |
| | | Par ($) | | Value ($) | |
University of Rhode Island,
Series 1999,
Insured: FSA
5.000% 11/01/19 | | | 750,000 | | | | 750,000 | | |
| Education Total | | | 17,620,120 | | |
| Prep School – 1.1% | |
| RI Health & Educational Building Corp. | |
Educational Institution Revenue,
Times2 Academy,
Series 2004,
LOC: Citizens Bank
5.000% 12/15/24 | | | 1,500,000 | | | | 1,293,315 | | |
| Prep School Total | | | 1,293,315 | | |
| Education Total | | | 18,913,435 | | |
| Health Care – 1.8% | |
| Hospitals – 1.8% | |
| RI Health & Educational Building Corp. | |
Rhode Island Hospital:
Series 2002,
6.375% 08/15/21 | | | 205,000 | | | | 201,726 | | |
| Series 2006, | |
Insured: FSA
5.000% 05/15/26 | | | 2,000,000 | | | | 1,854,360 | | |
| Hospitals Total | | | 2,056,086 | | |
| Health Care Total | | | 2,056,086 | | |
| Housing – 1.9% | |
| Assisted Living/Senior – 0.4% | |
| RI Health & Educational Building Corp. | |
The Frassati Residence,
Series 1999 A,
Pre-refunded 11/15/09,
LOC: Allied Irish Bank PLC
6.125% 11/15/18 | | | 450,000 | | | | 456,745 | | |
| Assisted Living/Senior Total | | | 456,745 | | |
| Multi-Family – 1.0% | |
| PR Housing Finance Authority | |
Series 2008,
5.000% 12/01/13 | | | 800,000 | | | | 833,456 | | |
| RI Housing & Mortgage Finance Corp. | |
Multi-Family Housing:
Series 1995 A,
Insured: AMBAC
6.150% 07/01/17 | | | 80,000 | | | | 80,048 | | |
See Accompanying Notes to Financial Statements.
91
Columbia Rhode Island Intermediate Municipal Bond Fund
October 31, 2008
| Municipal Bonds (continued) | |
| | | Par ($) | | Value ($) | |
Series 1997 A,
Insured: AMBAC
5.600% 07/01/10 | | | 215,000 | | | | 217,477 | | |
| Multi-Family Total | | | 1,130,981 | | |
| Single-Family – 0.5% | |
| RI Providence Housing Authority | |
Series 2008,
5.000% 09/01/24 | | | 565,000 | | | | 537,643 | | |
| Single-Family Total | | | 537,643 | | |
| Housing Total | | | 2,125,369 | | |
| Industrials – 0.4% | |
| Oil & Gas – 0.4% | |
| TN Energy Acquisition Corp. | |
Series 2006,
5.250% 09/01/22 | | | 600,000 | | | | 437,178 | | |
| Oil & Gas Total | | | 437,178 | | |
| Industrials Total | | | 437,178 | | |
| Other – 26.9% | |
| Other – 1.3% | |
| RI Providence Housing Authority | |
Series 2008:
5.000% 09/01/25 | | | 590,000 | | | | 558,459 | | |
| 5.000% 09/01/26 | | | 310,000 | | | | 291,831 | | |
| 5.000% 09/01/27 | | | 690,000 | | | | 644,425 | | |
| Other Total | | | 1,494,715 | | |
| Pool/Bond Bank – 3.9% | |
RI Clean Water Finance Agency Water
Pollution Control | |
Revolving Fund Pooled Loan:
Series 2006 A,
4.500% 10/01/22 | | | 1,000,000 | | | | 929,640 | | |
Series 2007 A,
4.750% 10/01/21 | | | 1,000,000 | | | | 993,760 | | |
| RI Clean Water Protection Finance Agency | |
Safe Drinking Water Revolving,
Series 2004 A,
Insured: MBIA
5.000% 10/01/18 | | | 1,000,000 | | | | 1,029,350 | | |
Water Pollution Control Revenue, Revolving Fund,
Pooled Loan Association:
Series 1999 A,
Insured: AMBAC
5.250% 10/01/16 | | | 500,000 | | | | 509,675 | | |
| | | Par ($) | | Value ($) | |
Series 2004 A,
4.750% 10/01/23 | | | 1,000,000 | | | | 980,070 | | |
| Pool/Bond Bank Total | | | 4,442,495 | | |
| Refunded/Escrowed (a) – 20.5% | |
| RI & Providence Plantations | |
Certificates of Participation,
Central Power Plants Project,
Series 2000 C,
Pre-refunded 10/01/10,
5.375% 10/01/20 | | | 1,000,000 | | | | 1,055,380 | | |
Series 2001 C,
Economically Defeased to Maturity,
5.000% 09/01/11 | | | 2,000,000 | | | | 2,116,500 | | |
| RI Consolidated Capital Development Loan | |
Series 1999 A,
Pre-refunded 09/01/09,
Insured: FGIC
5.500% 09/01/15 | | | 2,000,000 | | | | 2,082,980 | | |
| RI Depositors Economic Protection Corp. | |
Special Obligation:
Series 1993 A:
Escrowed to Maturity:
Insured: FSA:
5.750% 08/01/14 | | | 1,000,000 | | | | 1,088,490 | | |
| 5.750% 08/01/21 | | | 2,165,000 | | | | 2,370,090 | | |
Insured: MBIA
5.875% 08/01/11 | | | 2,500,000 | | | | 2,702,200 | | |
Pre-refunded 08/01/13,
Insured: FSA
5.750% 08/01/14 | | | 2,105,000 | | | | 2,330,193 | | |
Series 1993 B:
Escrowed to Maturity,
Insured: MBIA
5.800% 08/01/12 | | | 1,000,000 | | | | 1,092,360 | | |
Pre-refunded 02/01/11,
Insured: MBIA
5.250% 08/01/21 | | | 250,000 | | | | 263,405 | | |
| RI Health & Educational Building Corp. | |
Higher Education Facility,
University of Rhode Island,
Series 2000 B,
Pre-refunded 09/15/10,
Insured: AMBAC:
5.500% 09/15/20 | | | 2,000,000 | | | | 2,131,300 | | |
| 5.700% 09/15/30 | | | 2,250,000 | | | | 2,405,903 | | |
Hospital Financing Lifespan,
Series 2002,
Pre-refunded 08/15/12,
6.375% 08/15/21 | | | 1,295,000 | | | | 1,429,317 | | |
See Accompanying Notes to Financial Statements.
92
Columbia Rhode Island Intermediate Municipal Bond Fund
October 31, 2008
| Municipal Bonds (continued) | |
| | | Par ($) | | Value ($) | |
| RI North Kingstown | |
Series 1999,
Pre-refunded 10/01/09,
Insured: FGIC:
5.600% 10/01/16 | | | 995,000 | | | | 1,040,213 | | |
| 5.750% 10/01/19 | | | 500,000 | | | | 523,395 | | |
| RI South Kingstown | |
Series 2000,
Pre-refunded 06/15/10,
Insured: FGIC
6.250% 06/15/19 | | | 500,000 | | | | 536,315 | | |
| Refunded/Escrowed Total | | | 23,168,041 | | |
| Tobacco – 1.2% | |
| RI Tobacco Settlement Financing Corp. | |
Rhode Island Revenue, Asset Backed,
Series 2002 A,
6.000% 06/01/23 | | | 1,455,000 | | | | 1,294,979 | | |
| Tobacco Total | | | 1,294,979 | | |
| Other Total | | | 30,400,230 | | |
| Tax-Backed – 37.2% | |
| Local Appropriated – 11.3% | |
| RI Health & Educational Building Corp. | |
Series 2006 A,
Insured: FSA
5.000% 05/15/23 | | | 2,000,000 | | | | 1,937,700 | | |
Series 2007 A,
Insured: FSA
5.000% 05/15/22 | | | 2,000,000 | | | | 1,950,600 | | |
Series 2007 C,
Insured: FSA
5.000% 05/15/21 | | | 3,000,000 | | | | 2,954,400 | | |
| RI Providence Public Building Authority | |
School & Public Facilities Project:
Series 1998 A,
Insured: FSA
5.250% 12/15/14 | | | 1,500,000 | | | | 1,533,600 | | |
Series 1999 A,
Insured: AMBAC:
5.125% 12/15/14 | | | 500,000 | | | | 519,040 | | |
| 5.375% 12/15/11 | | | 2,035,000 | | | | 2,129,037 | | |
| RI Smithfield | |
Lease Participation Certificates,
Wastewater Treatment Facility Loan,
Series 2003 A,
Insured: MBIA:
5.000% 11/15/11 | | | 810,000 | | | | 848,273 | | |
| 5.000% 11/15/12 | | | 855,000 | | | | 896,331 | | |
| Local Appropriated Total | | | 12,768,981 | | |
| | | Par ($) | | Value ($) | |
| Local General Obligations – 15.4% | |
| IL Will County | |
Community Unit School District,
Number 365 U Valley View,
Series 1999 B,
Insured: FSA
(b) 11/01/10 | | | 2,000,000 | | | | 1,876,960 | | |
PR Commonwealth of Puerto Rico Municipal
Finance Agency | |
Series 1997 A,
Insured: FSA
5.500% 07/01/17 | | | 75,000 | | | | 75,223 | | |
| RI City of Cranston | |
Series 2005,
Insured: AMBAC
5.000% 07/15/15 | | | 2,280,000 | | | | 2,355,468 | | |
Series 2008,
Insured: FSA:
4.750% 07/01/26 | | | 900,000 | | | | 844,587 | | |
| 4.750% 07/01/27 | | | 945,000 | | | | 879,568 | | |
| 4.750% 07/01/28 | | | 990,000 | | | | 911,424 | | |
| RI Coventry | |
Series 2002,
Insured: AMBAC:
5.000% 06/15/21 | | | 750,000 | | | | 752,910 | | |
| 5.000% 06/15/22 | | | 750,000 | | | | 750,502 | | |
RI Exeter West Greenwich Regional School
District | |
Series 1997,
Insured: MBIA
5.400% 11/15/10 | | | 1,000,000 | | | | 1,002,100 | | |
| RI Johnston | |
Series 2004,
Insured: SYNC
5.250% 06/01/19 | | | 525,000 | | | | 527,520 | | |
Series 2005,
Insured: FSA:
4.750% 06/01/21 | | | 390,000 | | | | 394,005 | | |
| 4.750% 06/01/22 | | | 405,000 | | | | 407,260 | | |
| 4.750% 06/01/23 | | | 425,000 | | | | 426,173 | | |
| 4.750% 06/01/24 | | | 445,000 | | | | 444,982 | | |
| 4.750% 06/01/25 | | | 460,000 | | | | 456,854 | | |
Various Purpose,
Series 2004,
Insured: SYNC
5.250% 06/01/20 | | | 555,000 | | | | 552,358 | | |
See Accompanying Notes to Financial Statements.
93
Columbia Rhode Island Intermediate Municipal Bond Fund
October 31, 2008
| Municipal Bonds (continued) | |
| | | Par ($) | | Value ($) | |
| RI Providence | |
Series 1997,
Insured: FSA
5.450% 01/15/10 | | | 500,000 | | | | 502,760 | | |
Series 2001 C,
Insured: FGIC
5.500% 01/15/13 | | | 1,890,000 | | | | 1,995,254 | | |
| RI Warwick | |
Series 2008,
Insured: FSA
4.000% 08/01/16 | | | 1,000,000 | | | | 989,570 | | |
| RI Woonsocket | |
Series 2005,
Insured: AMBAC
4.250% 03/01/25 | | | 550,000 | | | | 456,665 | | |
| WA Seattle | |
| Series 1998 E, | |
Insured: FSA
(b) 12/15/12 | | | 1,000,000 | | | | 850,920 | | |
| Local General Obligations Total | | | 17,453,063 | | |
| Special Non-Property Tax – 2.5% | |
PR Commonwealth of Puerto Rico
Infrastructure Financing Authority | |
Series 2005 C,
Insured: AMBAC
5.500% 07/01/23 | | | 1,000,000 | | | | 935,850 | | |
| RI Economic Development Corp. | |
Series 2000,
Insured: RAD
6.125% 07/01/20 | | | 900,000 | | | | 886,302 | | |
| RI Convention Center Authority Revenue | |
Series 2005 A,
Insured: FSA
5.000% 05/15/23 | | | 1,005,000 | | | | 991,704 | | |
| Special Non-Property Tax Total | | | 2,813,856 | | |
| State Appropriated – 0.8% | |
| RI Economic Development Corp. | |
Economic Development Revenue,
East Greenwich Free Library Association,
Series 2004:
4.500% 06/15/09 | | | 100,000 | | | | 99,352 | | |
| 4.500% 06/15/14 | | | 245,000 | | | | 232,407 | | |
| 5.750% 06/15/24 | | | 415,000 | | | | 357,000 | | |
| RI Health & Educational Building Corp. | |
Series 2007 B,
Insured: AMBAC
4.250% 05/15/19 | | | 250,000 | | | | 232,487 | | |
| State Appropriated Total | | | 921,246 | | |
| | | Par ($) | | Value ($) | |
| State General Obligations – 7.2% | |
| PR Commonwealth of Puerto Rico | |
Capital Appreciation,
Series 1998,
Insured: MBIA:
(b) 07/01/14 | | | 3,500,000 | | | | 2,575,020 | | |
| 6.000% 07/01/16 | | | 250,000 | | | | 257,713 | | |
Series 2006 A,
5.250% 07/01/23 | | | 250,000 | | | | 227,990 | | |
| RI & Providence Plantations | |
Series 2005 A,
Insured: FSA
5.000% 08/01/17 | | | 2,000,000 | | | | 2,078,880 | | |
Series 2006 A,
Insured: FSA
4.500% 08/01/20 | | | 2,000,000 | | | | 1,920,740 | | |
Series 2006 C,
Isured: MBIA
5.000% 11/15/18 | | | 1,000,000 | | | | 1,030,540 | | |
| State General Obligations Total | | | 8,090,883 | | |
| Tax-Backed Total | | | 42,048,029 | | |
| Transportation – 4.7% | |
| Airports – 2.6% | |
| RI Economic Development Corp. | |
Rhode Island Airport Corp.,
Series 2008 C,
Insured: AGO
5.000% 07/01/17 | | | 2,245,000 | | | | 2,282,761 | | |
Series 1998 B,
Insured: FSA
5.000% 07/01/23 | | | 685,000 | | | | 658,778 | | |
| Airports Total | | | 2,941,539 | | |
| Transportation – 2.1% | |
| RI Economic Development Corp. | |
Grant Anticipation Note,
Rhode Island Department Transportation,
Series 2003 C,
Insured: FSA
5.000% 06/15/14 | | | 2,225,000 | | | | 2,334,604 | | |
| Transportation Total | | | 2,334,604 | | |
| Transportation Total | | | 5,276,143 | | |
| Utilities – 7.1% | |
| Municipal Electric – 1.1% | |
PR Commonwealth of Puerto Rico Electric
Power Authority | |
Series 1998 EE,
Insured: MBIA
5.250% 07/01/15 | | | 500,000 | | | | 504,300 | | |
See Accompanying Notes to Financial Statements.
94
Columbia Rhode Island Intermediate Municipal Bond Fund
October 31, 2008
| Municipal Bonds (continued) | |
| | | Par ($) | | Value ($) | |
Series 2003 NN,
Insured: MBIA
5.250% 07/01/19 | | | 750,000 | | | | 713,745 | | |
| Municipal Electric Total | | | 1,218,045 | | |
| Water & Sewer – 6.0% | |
| RI Bristol County Water Authority Revenue | |
Series 1997 A,
Insured: MBIA
5.000% 07/01/16 | | | 500,000 | | | | 500,500 | | |
| RI Kent County Water Authority | |
Series 2002 A,
Insured: MBIA:
5.000% 07/15/15 | | | 750,000 | | | | 770,708 | | |
| 5.000% 07/15/16 | | | 1,265,000 | | | | 1,294,297 | | |
RI Narragansett Bay Commission Wastewater
System Revenue | |
Series 2005 A,
Insured: MBIA
5.000% 08/01/26 | | | 2,500,000 | | | | 2,378,300 | | |
| RI Narragansett Bay Commission | |
Series 2007 A,
5.000% 02/01/32 | | | 2,000,000 | | | | 1,832,740 | | |
| Water & Sewer Total | | | 6,776,545 | | |
| Utilities Total | | | 7,994,590 | | |
Total Municipal Bonds
(cost of $111,633,743) | | | 109,251,060 | | |
| Investment Company – 0.5% | |
| | | Shares | | | |
Dreyfus Tax-Exempt Cash
Management Fund
(7 day yield of 2.260%) | | | 612,398 | | | | 612,398 | | |
Total Investment Company
(cost of $612,398) | | | 612,398 | | |
| Short-Term Obligations – 0.3% | |
| | | Par ($) | | | |
| Variable Rate Demand Notes (c) – 0.3% | |
CT Health & Educational Facilities
Authority | |
Yale University,
Series 2005 Y-2,
0.700% 07/01/35 | | | 100,000 | | | | 100,000 | | |
| | | Par ($) | | Value ($) | |
| WI University Hospitals & Clinics Authority | |
Series 2008 B,
LOC: U.S. Bank N.A.
1.200% 04/01/34 | | | 200,000 | | | | 200,000 | | |
| Variable Rate Demand Notes Total | | | 300,000 | | |
Total Short-Term Obligations
(cost of $300,000) | | | 300,000 | | |
Total Investments – 97.5%
(cost of $112,600,889) (d) | | | 110,163,458 | | |
| Other Assets & Liabilities, Net – 2.5% | | | 2,811,678 | | |
| Net Assets – 100.0% | | | 112,975,136 | | |
Notes to Investment Portfolio:
(a) The Fund has been informed that each issuer has placed direct obligations of the U.S. Government in an irrevocable trust, solely for the payment of principal and interest.
(b) Zero Coupon Bond.
(c) Variable rate demand note. These securities are payable upon demand and are secured by letters of credit or other credit support agreements from banks. The interest rates change periodically and the interest rates shown reflect the rate at October 31, 2008.
(d) Cost for federal income tax purposes is $112,546,141.
At October 31, 2008, the composition of the Fund by revenue source is as follows:
| Holdings By Revenue Source (Unaudited) | | % of
Net Assets | |
| Tax-Backed | | | 37.2 | | |
| Refunded/Escrowed | | | 20.5 | | |
| Education | | | 16.7 | | |
| Utilities | | | 7.1 | | |
| Other | | | 6.4 | | |
| Transportation | | | 4.7 | | |
| Housing | | | 1.9 | | |
| Health Care | | | 1.8 | | |
| Industrials | | | 0.4 | | |
| | | | 96.7 | | |
| Investment Company | | | 0.5 | | |
| Short-Term Obligations | | | 0.3 | | |
| Other Assets & Liabilities, Net | | | 2.5 | | |
| | | | 100.0 | | |
| Acronym | | Name | |
| AMBAC | | Ambac Assurance Corp. | |
|
| AGO | | Assured Guaranty Corp. | |
|
| FGIC | | Financial Guaranty Insurance Co. | |
|
| FSA | | Financial Security Assurance, Inc. | |
|
| LOC | | Letter of Credit | |
|
| MBIA | | MBIA Insurance Corp. | |
|
| RAD | | Radian Asset Assurance, Inc. | |
|
| SYNC | | Syncora Guarantee, Inc. | |
|
See Accompanying Notes to Financial Statements.
95
Statements of Assets and Liabilities – Columbia Tax-Exempt Bond Funds
October 31, 2008
| | | ($) | | ($) | | ($) | |
| | | Columbia
Connecticut
Intermediate
Municipal
Bond Fund | | Columbia
Intermediate
Municipal
Bond Fund | | Columbia
Massachusetts
Intermediate
Municipal
Bond Fund | |
| Assets | |
| Investments, at cost | | | 205,098,173 | | | | 2,460,310,931 | | | | 309,049,797 | | |
| Investments, at value | | | 197,710,829 | | | | 2,360,639,855 | | | | 300,497,738 | | |
| Cash | | | 7,354,152 | | | | 32,180,000 | | | | 10,388,201 | | |
| Receivable for: | |
| Fund shares sold | | | 439,840 | | | | 1,609,084 | | | | 996,868 | | |
| Interest | | | 2,709,656 | | | | 38,117,024 | | | | 4,242,091 | | |
| Trustees' deferred compensation plan | | | 19,670 | | | | 99,229 | | | | 28,134 | | |
| Expense reimbursement due from investment advisor | | | 71,232 | | | | 113,714 | | | | 112,790 | | |
| Other assets | | | 409 | | | | 23,734 | | | | 695 | | |
| Total Assets | | | 208,305,788 | | | | 2,432,782,640 | | | | 316,266,517 | | |
| Liabilities | |
| Payable for: | |
| Investments purchased on a delayed delivery basis | | | — | | | | — | | | | — | | |
| Fund shares repurchased | | | 117,737 | | | | 4,901,359 | | | | 279,910 | | |
| Distributions | | | 607,425 | | | | 7,898,668 | | | | 871,646 | | |
| Investment advisory fee | | | 82,692 | | | | 851,804 | | | | 126,373 | | |
| Administration fee | | | 11,542 | | | | 131,096 | | | | 17,640 | | |
| Transfer agent fee | | | 10,996 | | | | 34,878 | | | | 5,095 | | |
| Pricing and bookkeeping fees | | | 6,979 | | | | 28,375 | | | | 10,856 | | |
| Trustees' fees | | | 519 | | | | 252,454 | | | | 391 | | |
| Distribution and service fees | | | 10,616 | | | | 24,032 | | | | 11,101 | | |
| Custody fee | | | 2,151 | | | | 11,744 | | | | 2,423 | | |
| Chief compliance officer expenses | | | 56 | | | | 89 | | | | 60 | | |
| Trustees' deferred compensation plan | | | 19,670 | | | | 99,229 | | | | 28,134 | | |
| Other liabilities | | | 55,279 | | | | 159,084 | | | | 58,942 | | |
| Total Liabilities | | | 925,662 | | | | 14,392,812 | | | | 1,412,571 | | |
| Net Assets | | | 207,380,126 | | | | 2,418,389,828 | | | | 314,853,946 | | |
| Net Assets Consist of | |
| Paid-in capital | | | 215,170,105 | | | | 2,523,201,113 | | | | 323,680,545 | | |
| Undistributed net investment income | | | 110,661 | | | | 1,687,001 | | | | 53,337 | | |
| Accumulated net realized loss | | | (513,296 | ) | | | (6,827,210 | ) | | | (327,877 | ) | |
| Net unrealized depreciation on investments | | | (7,387,344 | ) | | | (99,671,076 | ) | | | (8,552,059 | ) | |
| Net Assets | | | 207,380,126 | | | | 2,418,389,828 | | | | 314,853,946 | | |
See Accompanying Notes to Financial Statements.
96
| | | ($) | | ($) | | ($) | |
| | | Columbia
New Jersey
Intermediate
Municipal
Bond Fund | | Columbia
New York
Intermediate
Municipal
Bond Fund | | Columbia
Rhode Island
Intermediate
Municipal
Bond Fund | |
| Assets | |
| Investments, at cost | | | 66,149,020 | | | | 297,605,917 | | | | 112,600,889 | | |
| Investments, at value | | | 64,214,100 | | | | 288,781,636 | | | | 110,163,458 | | |
| Cash | | | 1,919,909 | | | | 49,898 | | | | 1,875,239 | | |
| Receivable for: | |
| Fund shares sold | | | 3,835 | | | | 9,630 | | | | 1,138 | | |
| Interest | | | 909,483 | | | | 4,497,153 | | | | 1,515,041 | | |
| Trustees' deferred compensation plan | | | 12,770 | | | | 16,813 | | | | 16,861 | | |
| Expense reimbursement due from investment advisor | | | 32,231 | | | | 128,868 | | | | 32,637 | | |
| Other assets | | | 138 | | | | 7,338 | | | | 248 | | |
| Total Assets | | | 67,092,466 | | | | 293,491,336 | | | | 113,604,622 | | |
| Liabilities | |
| Payable for: | |
| Investments purchased on a delayed delivery basis | | | 500,000 | | | | — | | | | — | | |
| Fund shares repurchased | | | 88,893 | | | | 333,518 | | | | 148,551 | | |
| Distributions | | | 192,023 | | | | 875,026 | | | | 351,713 | | |
| Investment advisory fee | | | 26,654 | | | | 119,544 | | | | 45,666 | | |
| Administration fee | | | 3,720 | | | | 11,692 | | | | 6,374 | | |
| Transfer agent fee | | | 5,943 | | | | 2,143 | | | | 2,642 | | |
| Pricing and bookkeeping fees | | | 6,021 | | | | 11,156 | | | | 5,825 | | |
| Trustees' fees | | | 471 | | | | — | | | | 613 | | |
| Distribution and service fees | | | 3,698 | | | | 5,194 | | | | 1,490 | | |
| Custody fee | | | 1,149 | | | | 2,456 | | | | 1,782 | | |
| Chief compliance officer expenses | | | 55 | | | | 46 | | | | 56 | | |
| Trustees' deferred compensation plan | | | 12,770 | | | | 16,813 | | | | 16,861 | | |
| Other liabilities | | | 51,311 | | | | 102,995 | | | | 47,913 | | |
| Total Liabilities | | | 892,708 | | | | 1,480,583 | | | | 629,486 | | |
| Net Assets | | | 66,199,758 | | | | 292,010,753 | | | | 112,975,136 | | |
| Net Assets Consist of | |
| Paid-in capital | | | 68,228,594 | | | | 301,657,110 | | | | 115,543,237 | | |
| Undistributed net investment income | | | 12,045 | | | | 105,523 | | | | 33,654 | | |
| Accumulated net realized loss | | | (105,961 | ) | | | (927,599 | ) | | | (164,324 | ) | |
| Net unrealized depreciation on investments | | | (1,934,920 | ) | | | (8,824,281 | ) | | | (2,437,431 | ) | |
| Net Assets | | | 66,199,758 | | | | 292,010,753 | | | | 112,975,136 | | |
See Accompanying Notes to Financial Statements.
97
Statements of Assets and Liabilities (continued) – Columbia Tax-Exempt Bond Funds
October 31, 2008
| | | Columbia
Connecticut
Intermediate
Municipal
Bond Fund | | Columbia
Intermediate
Municipal
Bond Fund | | Columbia
Massachusetts
Intermediate
Municipal
Bond Fund | |
| Class A | |
| Net assets | | $ | 12,115,136 | | | $ | 78,125,852 | | | $ | 11,935,782 | | |
| Shares outstanding | | | 1,204,627 | | | | 8,124,106 | | | | 1,205,245 | | |
| Net asset value per share (a) | | $ | 10.06 | | | $ | 9.62 | | | $ | 9.90 | | |
| Maximum sales charge | | | 3.25 | % | | | 3.25 | % | | | 3.25 | % | |
| Maximum offering price per share (b) | | $ | 10.40 | | | $ | 9.94 | | | $ | 10.23 | | |
| Class B | |
| Net assets | | $ | 2,527,914 | | | $ | 5,873,828 | | | $ | 1,439,786 | | |
| Shares outstanding | | | 251,356 | | | | 610,804 | | | | 145,382 | | |
| Net asset value and offering price per share (a) | | $ | 10.06 | | | $ | 9.62 | | | $ | 9.90 | | |
| Class C | |
| Net assets | | $ | 6,203,245 | | | $ | 12,625,355 | | | $ | 4,036,418 | | |
| Shares outstanding | | | 616,807 | | | | 1,312,843 | | | | 407,586 | | |
| Net asset value and offering price per share (a) | | $ | 10.06 | | | $ | 9.62 | | | $ | 9.90 | | |
| Class T | |
| Net assets | | $ | 17,461,346 | | | $ | 10,786,481 | | | $ | 37,689,289 | | |
| Shares outstanding | | | 1,736,218 | | | | 1,121,665 | | | | 3,805,732 | | |
| Net asset value per share (a) | | $ | 10.06 | | | $ | 9.62 | | | $ | 9.90 | | |
| Maximum sales charge | | | 4.75 | % | | | 4.75 | % | | | 4.75 | % | |
| Maximum offering price per share (b) | | $ | 10.56 | | | $ | 10.10 | | | $ | 10.39 | | |
| Class Z | |
| Net assets | | $ | 169,072,485 | | | $ | 2,310,978,312 | | | $ | 259,752,671 | | |
| Shares outstanding | | | 16,811,281 | | | | 240,313,634 | | | | 26,228,708 | | |
| Net asset value, offering and redemption price per share | | $ | 10.06 | | | $ | 9.62 | | | $ | 9.90 | | |
(a) Redemption price per share is equal to net asset value less any applicable contingent deferred sales charge.
(b) On sales of $50,000 or more the offering price is reduced.
See Accompanying Notes to Financial Statements.
98
| | | Columbia
New Jersey
Intermediate
Municipal
Bond Fund | | Columbia
New York
Intermediate
Municipal
Bond Fund | | Columbia
Rhode Island
Intermediate
Municipal
Bond Fund | |
| Class A | |
| Net assets | | $ | 3,511,628 | | | $ | 4,199,809 | | | $ | 3,246,722 | | |
| Shares outstanding | | | 367,657 | | | | 380,894 | | | | 308,505 | | |
| Net asset value per share (a) | | $ | 9.55 | | | $ | 11.03 | | | $ | 10.52 | | |
| Maximum sales charge | | | 3.25 | % | | | 3.25 | % | | | 3.25 | % | |
| Maximum offering price per share (b) | | $ | 9.87 | | | $ | 11.40 | | | $ | 10.87 | | |
| Class B | |
| Net assets | | $ | 1,150,045 | | | $ | 1,502,896 | | | $ | 306,778 | | |
| Shares outstanding | | | 120,407 | | | | 136,308 | | | | 29,149 | | |
| Net asset value and offering price per share (a) | | $ | 9.55 | | | $ | 11.03 | | | $ | 10.52 | | |
| Class C | |
| Net assets | | $ | 2,582,102 | | | $ | 2,648,638 | | | $ | 917,590 | | |
| Shares outstanding | | | 270,341 | | | | 240,224 | | | | 87,188 | | |
| Net asset value and offering price per share (a) | | $ | 9.55 | | | $ | 11.03 | | | $ | 10.52 | | |
| Class T | |
| Net assets | | $ | 3,847,610 | | | $ | 11,520,000 | | | $ | 9,011,096 | | |
| Shares outstanding | | | 402,837 | | | | 1,044,803 | | | | 856,215 | | |
| Net asset value per share (a) | | $ | 9.55 | | | $ | 11.03 | | | $ | 10.52 | | |
| Maximum sales charge | | | 4.75 | % | | | 4.75 | % | | | 4.75 | % | |
| Maximum offering price per share (b) | | $ | 10.03 | | | $ | 11.58 | | | $ | 11.04 | | |
| Class Z | |
| Net assets | | $ | 55,108,373 | | | $ | 272,139,410 | | | $ | 99,492,950 | | |
| Shares outstanding | | | 5,769,571 | | | | 24,681,675 | | | | 9,453,797 | | |
| Net asset value, offering and redemption price per share | | $ | 9.55 | | | $ | 11.03 | | | $ | 10.52 | | |
See Accompanying Notes to Financial Statements.
99
Statements of Operations – Columbia Tax-Exempt Bond Funds
For the Year Ended October 31, 2008
| | | ($) | | ($) | | ($) | |
| | | Columbia
Connecticut
Intermediate
Municipal
Bond Fund | | Columbia
Intermediate
Municipal
Bond Fund | | Columbia
Massachusetts
Intermediate
Municipal
Bond Fund | |
| Investment Income | |
| Interest | | | 8,163,191 | | | | 109,304,909 | | | | 13,958,095 | | |
| Dividends | | | 68,223 | | | | 310,630 | | | | 39,679 | | |
| Total Investment Income | | | 8,231,414 | | | | 109,615,539 | | | | 13,997,774 | | |
| Expenses | |
| Investment advisory fee | | | 906,107 | | | | 10,098,828 | | | | 1,570,491 | | |
| Administration fee | | | 126,477 | | | | 1,647,626 | | | | 219,214 | | |
| Distribution fee: | |
| Class B | | | 20,449 | | | | 45,999 | | | | 11,635 | | |
| Class C | | | 40,836 | | | | 73,802 | | | | 29,860 | | |
| Service fee: | |
| Class A | | | 12,990 | | | | 170,966 | | | | 22,309 | | |
| Class B | | | 6,816 | | | | 14,154 | | | | 3,879 | | |
| Class C | | | 13,612 | | | | 22,708 | | | | 9,953 | | |
| Shareholder service fee—Class T | | | 28,331 | | | | 18,582 | | | | 61,598 | | |
| Transfer agent fee | | | 35,034 | | | | 126,083 | | | | 40,591 | | |
| Pricing and bookkeeping fees | | | 84,939 | | | | 236,697 | | | | 112,432 | | |
| Trustees' fees | | | 19,444 | | | | 102,010 | | | | 27,089 | | |
| Custody fee | | | 13,329 | | | | 76,407 | | | | 16,869 | | |
| Audit fee | | | 40,584 | | | | 44,888 | | | | 39,765 | | |
| Registration fees | | | 44,312 | | | | 18,617 | | | | 46,734 | | |
| Reports to shareholders | | | 26,775 | | | | 121,354 | | | | 54,203 | | |
| Chief compliance officer expenses | | | 611 | | | | 397 | | | | 679 | | |
| Other expenses | | | 41,968 | | | | 280,353 | | | | 63,264 | | |
| Total Expenses | | | 1,462,614 | | | | 13,099,471 | | | | 2,330,565 | | |
| Fees waived by Distributor—Class C | | | (19,057 | ) | | | (51,094 | ) | | | (13,935 | ) | |
| Fees waived or expenses reimbursed by investment advisor | | | (391,465 | ) | | | (438,887 | ) | | | (550,364 | ) | |
| Expense reductions | | | (4,254 | ) | | | (17,079 | ) | | | (5,042 | ) | |
| Net Expenses | | | 1,047,838 | | | | 12,592,411 | | | | 1,761,224 | | |
| Net Investment Income | | | 7,183,576 | | | | 97,023,128 | | | | 12,236,550 | | |
| Net Realized and Unrealized Gain (Loss) on Investments and Futures Contracts | |
| Net realized gain (loss) on: | |
| Investments | | | (186,751 | ) | | | (2,117,724 | ) | | | (286,416 | ) | |
| Futures contracts | | | 35,641 | | | | 509,427 | | | | 71,114 | | |
| Net realized gain (loss) | | | (151,110 | ) | | | (1,608,297 | ) | | | (215,302 | ) | |
| Net change in unrealized appreciation (depreciation) on investments | | | (11,312,779 | ) | | | (152,317,172 | ) | | | (14,469,234 | ) | |
| Net Loss | | | (11,463,889 | ) | | | (153,925,469 | ) | | | (14,684,536 | ) | |
| Net Decrease Resulting from Operations | | | (4,280,313 | ) | | | (56,902,341 | ) | | | (2,447,986 | ) | |
See Accompanying Notes to Financial Statements.
100
| | | ($) | | ($) | | ($) | |
| | | Columbia
New Jersey
Intermediate
Municipal
Bond Fund | | Columbia
New York
Intermediate
Municipal
Bond Fund | | Columbia
Rhode Island
Intermediate
Municipal
Bond Fund | |
| Investment Income | |
| Interest | | | 2,991,738 | | | | 9,599,553 | | | | 5,278,247 | | |
| Dividends | | | 21,558 | | | | 80,589 | | | | 19,351 | | |
| Total Investment Income | | | 3,013,296 | | | | 9,680,142 | | | | 5,297,598 | | |
| Expenses | |
| Investment advisory fee | | | 321,252 | | | | 1,098,000 | | | | 563,862 | | |
| Administration fee | | | 44,841 | | | | 153,263 | | | | 78,706 | | |
| Distribution fee: | |
| Class B | | | 8,926 | | | | 12,570 | | | | 2,731 | | |
| Class C | | | 20,072 | | | | 16,157 | | | | 6,673 | | |
| Service fee: | |
| Class A | | | 8,076 | | | | 9,128 | | | | 6,607 | | |
| Class B | | | 2,975 | | | | 4,190 | | | | 910 | | |
| Class C | | | 6,691 | | | | 5,386 | | | | 2,225 | | |
| Shareholder service fee—Class T | | | 6,407 | | | | 19,158 | | | | — | | |
| Transfer agent fee | | | 10,058 | | | | 16,904 | | | | 8,112 | | |
| Pricing and bookkeeping fees | | | 68,629 | | | | 97,902 | | | | 71,028 | | |
| Trustees' fees | | | 16,591 | | | | 19,970 | | | | 18,926 | | |
| Custody fee | | | 7,332 | | | | 13,681 | | | | 8,739 | | |
| Audit fee | | | 35,039 | | | | 37,539 | | | | 27,692 | | |
| Registration fees | | | 50,471 | | | | 42,049 | | | | 50,867 | | |
| Reports to shareholders | | | 36,631 | | | | 32,628 | | | | 37,943 | | |
| Chief compliance officer expenses | | | 1,850 | | | | 637 | | | | 644 | | |
| Other expenses | | | 31,713 | | | | 43,830 | | | | 40,234 | | |
| Total Expenses | | | 677,554 | | | | 1,622,992 | | | | 925,899 | | |
| Fees waived by Distributor—Class C | | | (9,367 | ) | | | (7,540 | ) | | | (3,114 | ) | |
| Fees waived or expenses reimbursed by investment advisor | | | (287,592 | ) | | | (409,913 | ) | | | (318,052 | ) | |
| Expense reductions | | | (2,177 | ) | | | (2,738 | ) | | | (1,351 | ) | |
| Net Expenses | | | 378,418 | | | | 1,202,801 | | | | 603,382 | | |
| Net Investment Income | | | 2,634,878 | | | | 8,477,341 | | | | 4,694,216 | | |
| Net Realized and Unrealized Gain (Loss) on Investments and Futures Contracts | |
| Net realized gain (loss) on: | |
| Investments | | | (33,551 | ) | | | 82,797 | | | | 35,120 | | |
| Futures contracts | | | 7,826 | | | | 88,584 | | | | 52,107 | | |
| Net realized gain (loss) | | | (25,725 | ) | | | 171,381 | | | | 87,227 | | |
| Net change in unrealized appreciation (depreciation) on investments | | | (3,624,737 | ) | | | (14,173,089 | ) | | | (5,799,586 | ) | |
| Net Loss | | | (3,650,462 | ) | | | (14,001,708 | ) | | | (5,712,359 | ) | |
| Net Decrease Resulting from Operations | | | (1,015,584 | ) | | | (5,524,367 | ) | | | (1,018,143 | ) | |
See Accompanying Notes to Financial Statements.
101
Statements of Changes in Net Assets – Columbia Tax-Exempt Bond Funds
| Increase (Decrease) in Net Assets | | Columbia
Connecticut Intermediate
Municipal Bond Fund | | Columbia
Intermediate Municipal
Bond Fund | | Columbia
Massachusetts Intermediate
Municipal Bond Fund | |
| | | Year Ended October 31, | | Year Ended October 31, | | Year Ended October 31, | |
| | | 2008 ($) | | 2007 ($)(a) | | 2008 ($) | | 2007 ($)(a) | | 2008 ($) | | 2007 ($)(a) | |
| Operations | |
| Net investment income | | | 7,183,576 | | | | 6,071,967 | | | | 97,023,128 | | | | 93,589,626 | | | | 12,236,550 | | | | 10,794,258 | | |
| Net realized gain (loss) on investments and futures contracts | | | (151,110 | ) | | | (187,880 | ) | | | (1,608,297 | ) | | | (2,783,084 | ) | | | (215,302 | ) | | | (35,730 | ) | |
Net change in unrealized appreciation (depreciation)
on investments and futures contracts | | | (11,312,779 | ) | | | (2,126,416 | ) | | | (152,317,172 | ) | | | (37,328,481 | ) | | | (14,469,234 | ) | | | (4,006,310 | ) | |
| Net increase (decrease) resulting from operations | | | (4,280,313 | ) | | | 3,757,671 | | | | (56,902,341 | ) | | | 53,478,061 | | | | (2,447,986 | ) | | | 6,752,218 | | |
| Distributions to Shareholders | |
| From net investment income: | |
| Class A | | | (185,224 | ) | | | (221,167 | ) | | | (3,212,569 | ) | | | (3,590,205 | ) | | | (314,030 | ) | | | (239,582 | ) | |
| Class B | | | (77,931 | ) | | | (89,048 | ) | | | (220,033 | ) | | | (311,961 | ) | | | (43,078 | ) | | | (48,474 | ) | |
| Class C | | | (174,326 | ) | | | (161,046 | ) | | | (403,945 | ) | | | (383,603 | ) | | | (124,485 | ) | | | (130,631 | ) | |
| Class G | | | — | | | | (4,699 | ) | | | — | | | | (8,311 | ) | | | — | | | | — | | |
| Class T | | | (700,158 | ) | | | (719,048 | ) | | | (471,517 | ) | | | (524,380 | ) | | | (1,488,651 | ) | | | (1,484,630 | ) | |
| Class Z | | | (6,041,271 | ) | | | (4,872,905 | ) | | | (92,703,384 | ) | | | (88,757,531 | ) | | | (10,255,310 | ) | | | (8,879,772 | ) | |
| From net realized gains: | |
| Class A | | | — | | | | — | | | | — | | | | — | | | | (2,176 | ) | | | (9,667 | ) | |
| Class B | | | — | | | | — | | | | — | | | | — | | | | (493 | ) | | | (2,997 | ) | |
| Class C | | | — | | | | — | | | | — | | | | — | | | | (1,189 | ) | | | (6,186 | ) | |
| Class G | | | — | | | | — | | | | — | | | | — | | | | — | | | | — | | |
| Class T | | | — | | | | — | | | | — | | | | — | | | | (12,944 | ) | | | (60,217 | ) | |
| Class Z | | | — | | | | — | | | | — | | | | — | | | | (81,124 | ) | | | (315,886 | ) | |
| Total distributions to shareholders | | | (7,178,910 | ) | | | (6,067,913 | ) | | | (97,011,448 | ) | | | (93,575,991 | ) | | | (12,323,480 | ) | | | (11,178,042 | ) | |
| Net Capital Share Transactions | | | 49,942,836 | | | | (8,550,319 | ) | | | 242,880,150 | | | | (104,062,727 | ) | | | 20,163,292 | | | | 1,020,774 | | |
| Net increase (decrease) in net assets | | | 38,483,613 | | | | (10,860,561 | ) | | | 88,966,361 | | | | (144,160,657 | ) | | | 5,391,826 | | | | (3,405,050 | ) | |
| Net Assets | |
| Beginning of period | | | 168,896,513 | | | | 179,757,074 | | | | 2,329,423,467 | | | | 2,473,584,124 | | | | 309,462,120 | | | | 312,867,170 | | |
| End of period | | | 207,380,126 | | | | 168,896,513 | | | | 2,418,389,828 | | | | 2,329,423,467 | | | | 314,853,946 | | | | 309,462,120 | | |
| Undistributed net investment income at end of period | | | 110,661 | | | | 105,995 | | | | 1,687,001 | | | | 1,685,066 | | | | 53,337 | | | | 81,822 | | |
(a) Class G shares reflect activity for the period November 1, 2006 through August 8, 2007.
See Accompanying Notes to Financial Statements.
102
| Increase (Decrease) in Net Assets | | Columbia
New Jersey Intermediate
Municipal Bond Fund | | Columbia
New York Intermediate
Municipal Bond Fund | | Columbia
Rhode Island Intermediate
Municipal Bond Fund | |
| | | Year Ended October 31, | | Year Ended October 31, | | Year Ended October 31, | |
| | | 2008 ($) | | 2007 ($)(a) | | 2008 ($) | | 2007 ($)(a) | | 2008 ($) | | 2007 ($)(a) | |
| Operations | |
| Net investment income | | | 2,634,878 | | | | 2,191,916 | | | | 8,477,341 | | | | 5,103,588 | | | | 4,694,216 | | | | 4,310,429 | | |
| Net realized gain (loss) on investments and futures contracts | | | (25,725 | ) | | | (27,600 | ) | | | 171,381 | | | | (164,109 | ) | | | 87,227 | | | | (137,368 | ) | |
Net change in unrealized appreciation (depreciation)
on investments and futures contracts | | | (3,624,737 | ) | | | (941,095 | ) | | | (14,173,089 | ) | | | (1,546,738 | ) | | | (5,799,586 | ) | | | (1,435,450 | ) | |
| Net increase (decrease) resulting from operations | | | (1,015,584 | ) | | | 1,223,221 | | | | (5,524,367 | ) | | | 3,392,741 | | | | (1,018,143 | ) | | | 2,737,611 | | |
| Distributions to Shareholders | |
| From net investment income: | |
| Class A | | | (120,967 | ) | | | (59,353 | ) | | | (125,808 | ) | | | (66,446 | ) | | | (98,502 | ) | | | (36,834 | ) | |
| Class B | | | (35,740 | ) | | | (35,800 | ) | | | (46,205 | ) | | | (63,508 | ) | | | (10,936 | ) | | | (9,696 | ) | |
| Class C | | | (89,601 | ) | | | (93,272 | ) | | | (66,602 | ) | | | (59,691 | ) | | | (29,824 | ) | | | (28,953 | ) | |
| Class G | | | — | | | | (2,832 | ) | | | — | | | | (1,178 | ) | | | — | | | | (5,025 | ) | |
| Class T | | | (164,338 | ) | | | (177,311 | ) | | | (460,687 | ) | | | (475,447 | ) | | | (405,504 | ) | | | (414,923 | ) | |
| Class Z | | | (2,221,145 | ) | | | (1,820,231 | ) | | | (7,763,230 | ) | | | (4,422,216 | ) | | | (4,140,499 | ) | | | (3,806,250 | ) | |
| From net realized gains: | |
| Class A | | | — | | | | (6,577 | ) | | | — | | | | (424 | ) | | | — | | | | (852 | ) | |
| Class B | | | — | | | | (5,016 | ) | | | — | | | | (636 | ) | | | — | | | | (322 | ) | |
| Class C | | | — | | | | (12,375 | ) | | | — | | | | (534 | ) | | | — | | | | (1,056 | ) | |
| Class G | | | — | | | | (468 | ) | | | — | | | | (13 | ) | | | — | | | | (218 | ) | |
| Class T | | | — | | | | (17,794 | ) | | | — | | | | (3,130 | ) | | | — | | | | (10,689 | ) | |
| Class Z | | | — | | | | (168,325 | ) | | | — | | | | (25,713 | ) | | | — | | | | (94,135 | ) | |
| Total distributions to shareholders | | | (2,631,791 | ) | | | (2,399,354 | ) | | | (8,462,532 | ) | | | (5,118,936 | ) | | | (4,685,265 | ) | | | (4,408,953 | ) | |
| Net Capital Share Transactions | | | 4,365,783 | | | | 2,390,694 | | | | 156,314,790 | | | | 9,222,957 | | | | 2,055,992 | | | | (514,528 | ) | |
| Net increase (decrease) in net assets | | | 718,408 | | | | 1,214,561 | | | | 142,327,891 | | | | 7,496,762 | | | | (3,647,416 | ) | | | (2,185,870 | ) | |
| Net Assets | |
| Beginning of period | | | 65,481,350 | | | | 64,266,789 | | | | 149,682,862 | | | | 142,186,100 | | | | 116,622,552 | | | | 118,808,422 | | |
| End of period | | | 66,199,758 | | | | 65,481,350 | | | | 292,010,753 | | | | 149,682,862 | | | | 112,975,136 | | | | 116,622,552 | | |
| Undistributed net investment income at end of period | | | 12,045 | | | | 14,116 | | | | 105,523 | | | | 90,714 | | | | 33,654 | | | | 34,262 | | |
See Accompanying Notes to Financial Statements.
103
Statements of Changes in Net Assets – Capital Stock Activity
| | | Columbia Connecticut Intermediate
Municipal Bond Fund | | Columbia Intermediate
Municipal Bond Fund | |
| | | Year Ended
October 31, 2008 | | Year Ended
October 31, 2007(a) | | Year Ended
October 31, 2008 | | Year Ended
October 31, 2007(a) | |
| | | Shares | | Dollars ($) | | Shares | | Dollars ($) | | Shares | | Dollars ($) | | Shares | | Dollars ($) | |
| Class A | |
| Subscriptions | | | 1,185,308 | | | | 12,291,366 | | | | 70,687 | | | | 750,054 | | | | 762,780 | | | | 7,762,097 | | | | 466,598 | | | | 4,797,538 | | |
| Distributions reinvested | | | 4,962 | | | | 51,874 | | | | 15,189 | | | | 161,786 | | | | 173,229 | | | | 1,747,705 | | | | 187,556 | | | | 1,924,113 | | |
| Redemptions | | | (227,141 | ) | | | (2,261,436 | ) | | | (549,110 | ) | | | (5,827,852 | ) | | | (1,610,469 | ) | | | (16,315,353 | ) | | | (1,761,936 | ) | | | (18,107,865 | ) | |
| Net increase (decrease) | | | 963,129 | | | | 10,081,804 | | | | (463,234 | ) | | | (4,916,012 | ) | | | (674,460 | ) | | | (6,805,551 | ) | | | (1,107,782 | ) | | | (11,386,214 | ) | |
| Class B | |
| Subscriptions | | | 21,982 | | | | 231,632 | | | | 4,146 | | | | 44,024 | | | | 88,019 | | | | 893,475 | | | | 65,681 | | | | 682,730 | | |
| Distributions reinvested | | | 3,865 | | | | 40,566 | | | | 4,433 | | | | 47,223 | | | | 11,362 | | | | 114,716 | | | | 15,231 | | | | 156,440 | | |
| Redemptions | | | (34,946 | ) | | | (367,132 | ) | | | (114,223 | ) | | | (1,214,383 | ) | | | (284,480 | ) | | | (2,885,009 | ) | | | (459,808 | ) | | | (4,718,398 | ) | |
| Net decrease | | | (9,099 | ) | | | (94,934 | ) | | | (105,644 | ) | | | (1,123,136 | ) | | | (185,099 | ) | | | (1,876,818 | ) | | | (378,896 | ) | | | (3,879,228 | ) | |
| Class C | |
| Subscriptions | | | 180,356 | | | | 1,891,276 | | | | 64,598 | | | | 685,578 | | | | 449,462 | | | | 4,531,183 | | | | 64,354 | | | | 658,502 | | |
| Distributions reinvested | | | 9,221 | | | | 96,685 | | | | 9,076 | | | | 96,626 | | | | 13,458 | | | | 135,457 | | | | 13,262 | | | | 136,037 | | |
| Redemptions | | | (42,709 | ) | | | (452,885 | ) | | | (201,639 | ) | | | (2,153,612 | ) | | | (178,240 | ) | | | (1,794,071 | ) | | | (185,134 | ) | | | (1,902,511 | ) | |
| Net increase (decrease) | | | 146,868 | | | | 1,535,076 | | | | (127,965 | ) | | | (1,371,408 | ) | | | 284,680 | | | | 2,872,569 | | | | (107,518 | ) | | | (1,107,972 | ) | |
| Class G | |
| Subscriptions | | | — | | | | — | | | | — | | | | — | | | | — | | | | — | | | | 88 | | | | 900 | | |
| Distributions reinvested | | | — | | | | — | | | | 172 | | | | 1,834 | | | | — | | | | — | | | | 339 | | | | 3,494 | | |
| Redemptions | | | — | | | | — | | | | (23,711 | ) | | | (249,786 | ) | | | — | | | | — | | | | (39,766 | ) | | | (403,992 | ) | |
| Net decrease | | | — | | | | — | | | | (23,539 | ) | | | (247,952 | ) | | | — | | | | — | | | | (39,339 | ) | | | (399,598 | ) | |
| Class T | |
| Subscriptions | | | 3,148 | | | | 33,324 | | | | 23,320 | | | | 245,334 | | | | 3,613 | | | | 36,386 | | | | 36,584 | | | | 370,436 | | |
| Distributions reinvested | | | 42,273 | | | | 443,744 | | | | 42,878 | | | | 456,660 | | | | 37,544 | | | | 379,009 | | | | 41,340 | | | | 424,089 | | |
| Redemptions | | | (168,431 | ) | | | (1,773,397 | ) | | | (313,491 | ) | | | (3,337,280 | ) | | | (208,373 | ) | | | (2,091,503 | ) | | | (233,032 | ) | | | (2,390,051 | ) | |
| Net decrease | | | (123,010 | ) | | | (1,296,329 | ) | | | (247,293 | ) | | | (2,635,286 | ) | | | (167,216 | ) | | | (1,676,108 | ) | | | (155,108 | ) | | | (1,595,526 | ) | |
| Class Z | |
| Subscriptions | | | 5,907,090 | | | | 62,290,945 | | | | 2,029,787 | | | | 21,592,099 | | | | 33,179,886 | | | | 336,944,459 | | | | 31,387,219 | | | | 322,058,299 | | |
| Issued in connection with merger | | | — | | | | — | | | | — | | | | — | | | | 36,795,116 | | | | 374,435,646 | | | | — | | | | — | | |
| Distributions reinvested | | | 28,221 | | | | 296,980 | | | | 24,222 | | | | 257,615 | | | | 436,777 | | | | 4,405,036 | | | | 373,785 | | | | 3,833,674 | | |
| Redemptions | | | (2,189,985 | ) | | | (22,870,706 | ) | | | (1,888,346 | ) | | | (20,106,239 | ) | | | (46,154,154 | ) | | | (465,419,083 | ) | | | (40,141,309 | ) | | | (411,586,162 | ) | |
| Net increase (decrease) | | | 3,745,326 | | | | 39,717,219 | | | | 165,663 | | | | 1,743,475 | | | | 24,257,625 | | | | 250,366,058 | | | | (8,380,305 | ) | | | (85,694,189 | ) | |
(a) Class G shares reflect activity for the period November 1, 2006 through August 8, 2007.
See Accompanying Notes to Financial Statements.
104
| | | Columbia Massachusetts Intermediate
Municipal Bond Fund | |
| | | Year Ended
October 31, 2008 | | Year Ended
October 31, 2007(a) | |
| | | Shares | | Dollars ($) | | Shares | | Dollars ($) | |
| Class A | |
| Subscriptions | | | 746,892 | | | | 7,714,968 | | | | 219,378 | | | | 2,273,585 | | |
| Distributions reinvested | | | 23,747 | | | | 243,505 | | | | 17,148 | | | | 177,949 | | |
| Redemptions | | | (233,450 | ) | | | (2,432,020 | ) | | | (292,570 | ) | | | (3,038,288 | ) | |
| Net increase (decrease) | | | 537,189 | | | | 5,526,453 | | | | (56,044 | ) | | | (586,754 | ) | |
| Class B | |
| Subscriptions | | | 8,569 | | | | 88,446 | | | | 124 | | | | 1,284 | | |
| Distributions reinvested | | | 3,201 | | | | 32,942 | | | | 3,706 | | | | 38,482 | | |
| Redemptions | | | (25,799 | ) | | | (262,951 | ) | | | (82,134 | ) | | | (856,265 | ) | |
| Net decrease | | | (14,029 | ) | | | (141,563 | ) | | | (78,304 | ) | | | (816,499 | ) | |
| Class C | |
| Subscriptions | | | 88,218 | | | | 919,403 | | | | 66,732 | | | | 694,335 | | |
| Distributions reinvested | | | 6,745 | | | | 69,379 | | | | 7,921 | | | | 82,241 | | |
| Redemptions | | | (53,759 | ) | | | (557,837 | ) | | | (181,998 | ) | | | (1,875,590 | ) | |
| Net increase (decrease) | | | 41,204 | | | | 430,945 | | | | (107,345 | ) | | | (1,099,014 | ) | |
| Class G | |
| Subscriptions | | | — | | | | — | | | | — | | | | — | | |
| Distributions reinvested | | | — | | | | — | | | | 1,490 | | | | 15,489 | | |
| Redemptions | | | — | | | | — | | | | (76,064 | ) | | | (777,966 | ) | |
| Net decrease | | | — | | | | — | | | | (74,574 | ) | | | (762,477 | ) | |
| Class T | |
| Subscriptions | | | 50,579 | | | | 529,883 | | | | 118,337 | | | | 1,217,166 | | |
| Distributions reinvested | | | 114,142 | | | | 1,174,651 | | | | 115,738 | | | | 1,200,953 | | |
| Redemptions | | | (462,260 | ) | | | (4,732,706 | ) | | | (586,906 | ) | | | (6,100,434 | ) | |
| Net decrease | | | (297,539 | ) | | | (3,028,172 | ) | | | (352,831 | ) | | | (3,682,315 | ) | |
| Class Z | |
| Subscriptions | | | 5,714,637 | | | | 59,383,887 | | | | 4,928,447 | | | | 51,060,834 | | |
| Issued in connection with merger | | | — | | | | — | | | | — | | | | — | | |
| Distributions reinvested | | | 34,748 | | | | 358,484 | | | | 32,388 | | | | 337,150 | | |
| Redemptions | | | (4,124,569 | ) | | | (42,366,742 | ) | | | (4,188,713 | ) | | | (43,430,151 | ) | |
| Net increase (decrease) | | | 1,624,816 | | | | 17,375,629 | | | | 772,122 | | | | 7,967,833 | | |
See Accompanying Notes to Financial Statements.
105
Statements of Changes in Net Assets – Capital Stock Activity
| | | Columbia New Jersey Intermediate
Municipal Bond Fund | | Columbia New York Intermediate
Municipal Bond Fund | |
| | | Year Ended
October 31, 2008 | | Year Ended
October 31, 2007(a) | | Year Ended
October 31, 2008 | | Year Ended
October 31, 2007(a) | |
| | | Shares | | Dollars ($) | | Shares | | Dollars ($) | | Shares | | Dollars ($) | | Shares | | Dollars ($) | |
| Class A | |
| Subscriptions | | | 142,658 | | | | 1,422,795 | | | | 174,455 | | | | 1,765,582 | | | | 570,779 | | | | 6,634,385 | | | | 62,235 | | | | 723,698 | | |
| Distributions reinvested | | | 9,696 | | | | 96,369 | | | | 4,873 | | | | 49,430 | | | | 5,051 | | | | 57,658 | | | | 3,459 | | | | 40,003 | | |
| Redemptions | | | (83,059 | ) | | | (831,945 | ) | | | (121,846 | ) | | | (1,243,208 | ) | | | (357,353 | ) | | | (4,064,654 | ) | | | (119,718 | ) | | | (1,392,066 | ) | |
| Net increase (decrease) | | | 69,295 | | | | 687,219 | | | | 57,482 | | | | 571,804 | | | | 218,477 | | | | 2,627,389 | | | | (54,024 | ) | | | (628,365 | ) | |
| Class B | |
| Subscriptions | | | 22,224 | | | | 224,718 | | | | 12,325 | | | | 126,791 | | | | 8,981 | | | | 103,898 | | | | 619 | | | | 7,201 | | |
| Distributions reinvested | | | 2,575 | | | | 25,611 | | | | 3,001 | | | | 30,443 | | | | 2,402 | | | | 27,485 | | | | 3,293 | | | | 38,110 | | |
| Redemptions | | | (28,859 | ) | | | (287,414 | ) | | | (38,785 | ) | | | (392,918 | ) | | | (31,378 | ) | | | (359,454 | ) | | | (101,384 | ) | | | (1,168,474 | ) | |
| Net increase (decrease) | | | (4,060 | ) | | | (37,085 | ) | | | (23,459 | ) | | | (235,684 | ) | | | (19,995 | ) | | | (228,071 | ) | | | (97,472 | ) | | | (1,123,163 | ) | |
| Class C | |
| Subscriptions | | | 60,462 | | | | 598,624 | | | | 28,402 | | | | 286,850 | | | | 110,495 | | | | 1,263,805 | | | | 44,996 | | | | 519,313 | | |
| Distributions reinvested | | | 4,178 | | | | 41,581 | | | | 4,902 | | | | 49,711 | | | | 4,122 | | | | 47,085 | | | | 3,585 | | | | 41,477 | | |
| Redemptions | | | (102,793 | ) | | | (1,035,802 | ) | | | (133,248 | ) | | | (1,361,688 | ) | | | (49,371 | ) | | | (573,490 | ) | | | (91,362 | ) | | | (1,057,987 | ) | |
| Net increase (decrease) | | | (38,153 | ) | | | (395,597 | ) | | | (99,944 | ) | | | (1,025,127 | ) | | | 65,246 | | | | 737,400 | | | | (42,781 | ) | | | (497,197 | ) | |
| Class G | |
| Subscriptions | | | — | | | | — | | | | — | | | | — | | | | — | | | | — | | | | 86 | | | | 1,000 | | |
| Distributions reinvested | | | — | | | | — | | | | 58 | | | | 590 | | | | — | | | | — | | | | 100 | | | | 1,157 | | |
| Redemptions | | | — | | | | — | | | | (13,854 | ) | | | (138,370 | ) | | | — | | | | — | | | | (4,985 | ) | | | (56,852 | ) | |
| Net decrease | | | — | | | | — | | | | (13,796 | ) | | | (137,780 | ) | | | — | | | | — | | | | (4,799 | ) | | | (54,695 | ) | |
| Class T | |
| Subscriptions | | | 820 | | | | 8,210 | | | | 14,906 | | | | 148,910 | | | | 3,412 | | | | 39,214 | | | | 18,730 | | | | 215,334 | | |
| Distributions reinvested | | | 14,320 | | | | 142,504 | | | | 16,041 | | | | 162,607 | | | | 31,007 | | | | 354,764 | | | | 32,167 | | | | 372,049 | | |
| Redemptions | | | (112,202 | ) | | | (1,133,079 | ) | | | (65,896 | ) | | | (665,774 | ) | | | (166,051 | ) | | | (1,898,291 | ) | | | (126,888 | ) | | | (1,462,098 | ) | |
| Net decrease | | | (97,062 | ) | | | (982,365 | ) | | | (34,949 | ) | | | (354,257 | ) | | | (131,632 | ) | | | (1,504,313 | ) | | | (75,991 | ) | | | (874,715 | ) | |
| Class Z | |
| Subscriptions | | | 1,522,626 | | | | 15,296,862 | | | | 1,359,644 | | | | 13,762,992 | | | | 3,628,383 | | | | 41,630,556 | | | | 2,824,975 | | | | 32,616,630 | | |
| Proceeds received in connection with merger | | | — | | | | — | | | | — | | | | — | | | | 12,980,728 | | | | 149,608,565 | | | | — | | | | — | | |
| Distributions reinvested | | | 9,733 | | | | 97,004 | | | | 9,626 | | | | 97,630 | | | | 63,950 | | | | 729,833 | | | | 28,982 | | | | 335,240 | | |
| Redemptions | | | (1,030,214 | ) | | | (10,300,255 | ) | | | (1,017,606 | ) | | | (10,288,884 | ) | | | (3,292,910 | ) | | | (37,286,569 | ) | | | (1,775,616 | ) | | | (20,550,778 | ) | |
| Net increase | | | 502,145 | | | | 5,093,611 | | | | 351,664 | | | | 3,571,738 | | | | 13,380,151 | | | | 154,682,385 | | | | 1,078,341 | | | | 12,401,092 | | |
(a) Class G shares reflect activity for the period November 1, 2006 through August 8, 2007.
See Accompanying Notes to Financial Statements.
106
| | | Columbia Rhode Island Intermediate
Municipal Bond Fund | |
| | | Year Ended
October 31, 2008 | | Year Ended
October 31, 2007(a) | |
| | | Shares | | Dollars ($) | | Shares | | Dollars ($) | |
| Class A | |
| Subscriptions | | | 221,465 | | | | 2,462,390 | | | | 26,619 | | | | 296,135 | | |
| Distributions reinvested | | | 8,407 | | | | 91,495 | | | | 2,945 | | | | 32,609 | | |
| Redemptions | | | (23,685 | ) | | | (254,858 | ) | | | (14,590 | ) | | | (162,210 | ) | |
| Net increase (decrease) | | | 206,187 | | | | 2,299,027 | | | | 14,974 | | | | 166,534 | | |
| Class B | |
| Subscriptions | | | 9,848 | | | | 108,599 | | | | 2,800 | | | | 30,462 | | |
| Distributions reinvested | | | 372 | | | | 4,057 | | | | 381 | | | | 4,243 | | |
| Redemptions | | | (8,521 | ) | | | (92,835 | ) | | | (32,700 | ) | | | (366,122 | ) | |
| Net increase (decrease) | | | 1,699 | | | | 19,821 | | | | (29,519 | ) | | | (331,417 | ) | |
| Class C | |
| Subscriptions | | | 21,192 | | | | 235,053 | | | | 1,998 | | | | 22,237 | | |
| Distributions reinvested | | | 1,224 | | | | 13,350 | | | | 1,285 | | | | 14,258 | | |
| Redemptions | | | (9,937 | ) | | | (106,856 | ) | | | (50,415 | ) | | | (562,691 | ) | |
| Net increase (decrease) | | | 12,479 | | | | 141,547 | | | | (47,132 | ) | | | (526,196 | ) | |
| Class G | |
| Subscriptions | | | — | | | | — | | | | — | | | | — | | |
| Distributions reinvested | | | — | | | | — | | | | 342 | | | | 3,791 | | |
| Redemptions | | | — | | | | — | | | | (21,641 | ) | | | (236,413 | ) | |
| Net decrease | | | — | | | | — | | | | (21,299 | ) | | | (232,622 | ) | |
| Class T | |
| Subscriptions | | | 4,397 | | | | 48,210 | | | | 32,289 | | | | 354,246 | | |
| Distributions reinvested | | | 26,726 | | | | 292,153 | | | | 29,701 | | | | 329,084 | | |
| Redemptions | | | (157,222 | ) | | | (1,730,642 | ) | | | (139,784 | ) | | | (1,552,516 | ) | |
| Net decrease | | | (126,099 | ) | | | (1,390,279 | ) | | | (77,794 | ) | | | (869,186 | ) | |
| Class Z | |
| Subscriptions | | | 1,061,333 | | | | 11,690,278 | | | | 1,058,954 | | | | 11,730,539 | | |
| Proceeds received in connection with merger | | | — | | | | — | | | | — | | | | — | | |
| Distributions reinvested | | | 12,550 | | | | 137,290 | | | | 12,739 | | | | 141,435 | | |
| Redemptions | | | (989,737 | ) | | | (10,841,692 | ) | | | (956,823 | ) | | | (10,593,615 | ) | |
| Net increase | | | 84,146 | | | | 985,876 | | | | 114,870 | | | | 1,278,359 | | |
See Accompanying Notes to Financial Statements.
107
Financial Highlights – Columbia Connecticut Intermediate Municipal Bond Fund
Selected data for a share outstanding throughout each period is as follows:
| | | Year Ended October 31, | |
| Class A Shares | | 2008 | | 2007 | | 2006 | | 2005 | | 2004 | |
| Net Asset Value, Beginning of Period | | $ | 10.62 | | | $ | 10.76 | | | $ | 10.69 | | | $ | 11.04 | | | $ | 10.99 | | |
| Income from Investment Operations: | |
| Net investment income (a) | | | 0.37 | | | | 0.36 | | | | 0.36 | | | | 0.37 | | | | 0.34 | | |
Net realized and unrealized gain (loss)
on investments and futures contracts | | | (0.55 | ) | | | (0.15 | ) | | | 0.07 | | | | (0.35 | ) | | | 0.07 | | |
| Total from Investment Operations | | | (0.18 | ) | | | 0.21 | | | | 0.43 | | | | 0.02 | | | | 0.41 | | |
| Less Distributions to Shareholders: | |
| From net investment income | | | (0.38 | ) | | | (0.35 | ) | | | (0.36 | ) | | | (0.37 | ) | | | (0.36 | ) | |
| Net Asset Value, End of Period | | $ | 10.06 | | | $ | 10.62 | | | $ | 10.76 | | | $ | 10.69 | | | $ | 11.04 | | |
| Total return (b) | | | (1.80 | )%(c) | | | 2.03 | % | | | 4.13 | % | | | 0.15 | %(c) | | | 3.76 | % | |
| Ratios to Average Net Assets/Supplemental Data: | |
| Net expenses (d) | | | 0.75 | % | | | 1.06 | % | | | 1.00 | % | | | 0.94 | % | | | 1.05 | % | |
| Waiver/Reimbursement | | | 0.21 | % | | | — | | | | — | | | | — | %(e) | | | — | | |
| Net investment income (d) | | | 3.55 | % | | | 3.35 | % | | | 3.41 | % | | | 3.38 | % | | | 3.13 | % | |
| Portfolio turnover rate | | | 4 | % | | | 10 | % | | | 10 | % | | | 9 | % | | | 16 | % | |
| Net assets, end of period (000's) | | $ | 12,115 | | | $ | 2,566 | | | $ | 7,586 | | | $ | 10,701 | | | $ | 13,173 | | |
(a) Per share data was calculated using the average shares outstanding during the period.
(b) Total return at net asset value assuming all distributions reinvested and no initial sales charge or contingent deferred sales charge.
(c) Had the investment advisor and/or any of its affiliates not waived fees or reimbursed a portion of expenses, total return would have been reduced.
(d) The benefits derived from expense reductions had an impact of less than 0.01%.
(e) Rounds to less than 0.01%.
See Accompanying Notes to Financial Statements.
108
Financial Highlights – Columbia Connecticut Intermediate Municipal Bond Fund
Selected data for a share outstanding throughout each period is as follows:
| | | Year Ended October 31, | |
| Class B Shares | | 2008 | | 2007 | | 2006 | | 2005 | | 2004 | |
| Net Asset Value, Beginning of Period | | $ | 10.62 | | | $ | 10.76 | | | $ | 10.69 | | | $ | 11.04 | | | $ | 10.99 | | |
| Income from Investment Operations: | |
| Net investment income (a) | | | 0.30 | | | | 0.28 | | | | 0.28 | | | | 0.29 | | | | 0.26 | | |
Net realized and unrealized gain (loss)
on investments and futures contracts | | | (0.56 | ) | | | (0.15 | ) | | | 0.07 | | | | (0.35 | ) | | | 0.06 | | |
| Total from Investment Operations | | | (0.26 | ) | | | 0.13 | | | | 0.35 | | | | (0.06 | ) | | | 0.32 | | |
| Less Distributions to Shareholders: | |
| From net investment income | | | (0.30 | ) | | | (0.27 | ) | | | (0.28 | ) | | | (0.29 | ) | | | (0.27 | ) | |
| Net Asset Value, End of Period | | $ | 10.06 | | | $ | 10.62 | | | $ | 10.76 | | | $ | 10.69 | | | $ | 11.04 | | |
| Total return (b) | | | (2.52 | )%(c) | | | 1.27 | % | | | 3.35 | % | | | (0.60 | )%(c) | | | 2.99 | % | |
| Ratios to Average Net Assets/Supplemental Data: | |
| Net expenses (d) | | | 1.50 | % | | | 1.81 | % | | | 1.75 | % | | | 1.69 | % | | | 1.80 | % | |
| Waiver/Reimbursement | | | 0.21 | % | | | — | | | | — | | | | — | %(e) | | | — | | |
| Net investment income (d) | | | 2.86 | % | | | 2.58 | % | | | 2.66 | % | | | 2.63 | % | | | 2.38 | % | |
| Portfolio turnover rate | | | 4 | % | | | 10 | % | | | 10 | % | | | 9 | % | | | 16 | % | |
| Net assets, end of period (000's) | | $ | 2,528 | | | $ | 2,767 | | | $ | 3,941 | | | $ | 5,039 | | | $ | 6,036 | | |
(a) Per share data was calculated using the average shares outstanding during the period.
(b) Total return at net asset value assuming all distributions reinvested and no contingent deferred sales charge.
(c) Had the investment advisor and/or any of its affiliates not waived fees or reimbursed a portion of expenses, total return would have been reduced.
(d) The benefits derived from expense reductions had an impact of less than 0.01%.
(e) Rounds to less than 0.01%.
See Accompanying Notes to Financial Statements.
109
Financial Highlights – Columbia Connecticut Intermediate Municipal Bond Fund
Selected data for a share outstanding throughout each period is as follows:
| | | Year Ended October 31, | |
| Class C Shares | | 2008 | | 2007 | | 2006 | | 2005 | | 2004 | |
| Net Asset Value, Beginning of Period | | $ | 10.62 | | | $ | 10.76 | | | $ | 10.69 | | | $ | 11.04 | | | $ | 10.99 | | |
| Income from Investment Operations: | |
| Net investment income (a) | | | 0.34 | | | | 0.31 | | | | 0.32 | | | | 0.32 | | | | 0.30 | | |
Net realized and unrealized gain (loss)
on investments and futures contracts | | | (0.56 | ) | | | (0.14 | ) | | | 0.07 | | | | (0.35 | ) | | | 0.06 | | |
| Total from Investment Operations | | | (0.22 | ) | | | 0.17 | | | | 0.39 | | | | (0.03 | ) | | | 0.36 | | |
| Less Distributions to Shareholders: | |
| From net investment income | | | (0.34 | ) | | | (0.31 | ) | | | (0.32 | ) | | | (0.32 | ) | | | (0.31 | ) | |
| Net Asset Value, End of Period | | $ | 10.06 | | | $ | 10.62 | | | $ | 10.76 | | | $ | 10.69 | | | $ | 11.04 | | |
| Total return (b)(c) | | | (2.18 | )% | | | 1.63 | % | | | 3.72 | % | | | (0.25 | )% | | | 3.35 | % | |
| Ratios to Average Net Assets/Supplemental Data: | |
| Net expenses (d) | | | 1.15 | % | | | 1.46 | % | | | 1.40 | % | | | 1.34 | % | | | 1.45 | % | |
| Waiver/Reimbursement | | | 0.56 | % | | | 0.35 | % | | | 0.35 | % | | | 0.35 | % | | | 0.35 | % | |
| Net investment income (d) | | | 3.20 | % | | | 2.93 | % | | | 3.01 | % | | | 2.98 | % | | | 2.73 | % | |
| Portfolio turnover rate | | | 4 | % | | | 10 | % | | | 10 | % | | | 9 | % | | | 16 | % | |
| Net assets, end of period (000's) | | $ | 6,203 | | | $ | 4,993 | | | $ | 6,436 | | | $ | 8,780 | | | $ | 11,408 | | |
(a) Per share data was calculated using the average shares outstanding during the period.
(b) Total return at net asset value assuming all distributions reinvested and no contingent deferred sales charge.
(c) Had the investment advisor and/or any of its affiliates not waived fees or reimbursed a portion of expenses, total return would have been reduced.
(d) The benefits derived from expense reductions had an impact of less than 0.01%.
See Accompanying Notes to Financial Statements.
110
Financial Highlights – Columbia Connecticut Intermediate Municipal Bond Fund
Selected data for a share outstanding throughout each period is as follows:
| | | Year Ended October 31, | |
| Class T Shares | | 2008 | | 2007 | | 2006 | | 2005 | | 2004 | |
| Net Asset Value, Beginning of Period | | $ | 10.62 | | | $ | 10.76 | | | $ | 10.69 | | | $ | 11.04 | | | $ | 10.99 | | |
| Income from Investment Operations: | |
| Net investment income (a) | | | 0.39 | | | | 0.37 | | | | 0.37 | | | | 0.38 | | | | 0.36 | | |
Net realized and unrealized gain (loss)
on investments and futures contracts | | | (0.56 | ) | | | (0.15 | ) | | | 0.07 | | | | (0.35 | ) | | | 0.06 | | |
| Total from Investment Operations | | | (0.17 | ) | | | 0.22 | | | | 0.44 | | | | 0.03 | | | | 0.42 | | |
| Less Distributions to Shareholders: | |
| From net investment income | | | (0.39 | ) | | | (0.36 | ) | | | (0.37 | ) | | | (0.38 | ) | | | (0.37 | ) | |
| Net Asset Value, End of Period | | $ | 10.06 | | | $ | 10.62 | | | $ | 10.76 | | | $ | 10.69 | | | $ | 11.04 | | |
| Total return (b) | | | (1.68 | )%(c) | | | 2.14 | % | | | 4.23 | % | | | 0.25 | %(c) | | | 3.87 | % | |
| Ratios to Average Net Assets/Supplemental Data: | |
| Net expenses (d) | | | 0.65 | % | | | 0.96 | % | | | 0.90 | % | | | 0.84 | % | | | 0.95 | % | |
| Waiver/Reimbursement | | | 0.21 | % | | | — | | | | — | | | | — | %(e) | | | — | | |
| Net investment income (d) | | | 3.71 | % | | | 3.43 | % | | | 3.51 | % | | | 3.48 | % | | | 3.23 | % | |
| Portfolio turnover rate | | | 4 | % | | | 10 | % | | | 10 | % | | | 9 | % | | | 16 | % | |
| Net assets, end of period (000's) | | $ | 17,461 | | | $ | 19,753 | | | $ | 22,676 | | | $ | 25,418 | | | $ | 32,609 | | |
(a) Per share data was calculated using the average shares outstanding during the period.
(b) Total return at net asset value assuming all distributions reinvested and no initial sales charge or contingent deferred sales charge.
(c) Had the investment advisor and/or any of its affiliates not waived fees or reimbursed a portion of expenses, total return would have been reduced.
(d) The benefits derived from expense reductions had an impact of less than 0.01%.
(e) Rounds to less than 0.01%.
See Accompanying Notes to Financial Statements.
111
Financial Highlights – Columbia Connecticut Intermediate Municipal Bond Fund
Selected data for a share outstanding throughout each period is as follows:
| | | Year Ended October 31, | |
| Class Z Shares | | 2008 | | 2007 | | 2006 | | 2005 | | 2004 | |
| Net Asset Value, Beginning of Period | | $ | 10.62 | | | $ | 10.76 | | | $ | 10.69 | | | $ | 11.04 | | | $ | 10.99 | | |
| Income from Investment Operations: | |
| Net investment income (a) | | | 0.41 | | | | 0.38 | | | | 0.39 | | | | 0.39 | | | | 0.37 | | |
Net realized and unrealized gain (loss)
on investments and futures contracts | | | (0.56 | ) | | | (0.14 | ) | | | 0.07 | | | | (0.35 | ) | | | 0.06 | | |
| Total from Investment Operations | | | (0.15 | ) | | | 0.24 | | | | 0.46 | | | | 0.04 | | | | 0.43 | | |
| Less Distributions to Shareholders: | |
| From net investment income | | | (0.41 | ) | | | (0.38 | ) | | | (0.39 | ) | | | (0.39 | ) | | | (0.38 | ) | |
| Net Asset Value, End of Period | | $ | 10.06 | | | $ | 10.62 | | | $ | 10.76 | | | $ | 10.69 | | | $ | 11.04 | | |
| Total return (b) | | | (1.53 | )%(c) | | | 2.29 | % | | | 4.39 | % | | | 0.40 | %(c) | | | 4.02 | % | |
| Ratios to Average Net Assets/Supplemental Data: | |
| Net expenses (d) | | | 0.50 | % | | | 0.81 | % | | | 0.75 | % | | | 0.69 | % | | | 0.80 | % | |
| Waiver/Reimbursement | | | 0.21 | % | | | — | | | | — | | | | — | %(e) | | | — | | |
| Net investment income (d) | | | 3.86 | % | | | 3.58 | % | | | 3.65 | % | | | 3.63 | % | | | 3.38 | % | |
| Portfolio turnover rate | | | 4 | % | | | 10 | % | | | 10 | % | | | 9 | % | | | 16 | % | |
| Net assets, end of period (000's) | | $ | 169,072 | | | $ | 138,817 | | | $ | 138,865 | | | $ | 134,144 | | | $ | 132,227 | | |
(a) Per share data was calculated using the average shares outstanding during the period.
(b) Total return at net asset value assuming all distributions reinvested.
(c) Had the investment advisor and/or any of its affiliates not waived fees or reimbursed a portion of expenses, total return would have been reduced.
(d) The benefits derived from expense reductions had an impact of less than 0.01%.
(e) Rounds to less than 0.01%.
See Accompanying Notes to Financial Statements.
112
Financial Highlights – Columbia Intermediate Municipal Bond Fund
Selected data for a share outstanding throughout each period is as follows:
| | | Year Ended October 31, | |
| Class A Shares | | 2008 | | 2007 | | 2006 | | 2005 (a) | | 2004 | |
| Net Asset Value, Beginning of Period | | $ | 10.22 | | | $ | 10.39 | | | $ | 10.31 | | | $ | 10.72 | | | $ | 10.65 | | |
| Income from Investment Operations: | |
| Net investment income (b) | | | 0.38 | | | | 0.38 | | �� | | 0.38 | | | | 0.38 | | | | 0.38 | | |
Net realized and unrealized gain (loss)
on investments and futures contracts | | | (0.60 | ) | | | (0.17 | ) | | | 0.10 | | | | (0.33 | ) | | | 0.08 | | |
| Total from Investment Operations | | | (0.22 | ) | | | 0.21 | | | | 0.48 | | | | 0.05 | | | | 0.46 | | |
| Less Distributions to Shareholders: | |
| From net investment income | | | (0.38 | ) | | | (0.38 | ) | | | (0.38 | ) | | | (0.39 | ) | | | (0.38 | ) | |
| From net realized gains | | | — | | | | — | | | | (0.02 | ) | | | (0.07 | ) | | | (0.01 | ) | |
| Total Distributions to Shareholders | | | (0.38 | ) | | | (0.38 | ) | | | (0.40 | ) | | | (0.46 | ) | | | (0.39 | ) | |
| Net Asset Value, End of Period | | $ | 9.62 | | | $ | 10.22 | | | $ | 10.39 | | | $ | 10.31 | | | $ | 10.72 | | |
| Total return (c)(d) | | | (2.25 | )% | | | 2.08 | % | | | 4.76 | % | | | 0.45 | % | | | 4.44 | % | |
| Ratios to Average Net Assets/Supplemental Data: | |
| Net expenses (e) | | | 0.70 | % | | | 0.70 | % | | | 0.70 | % | | | 0.81 | % | | | 0.93 | % | |
| Waiver/Reimbursement | | | 0.02 | % | | | 0.02 | % | | | 0.05 | % | | | 0.01 | % | | | — | %(f) | |
| Net investment income (e) | | | 3.76 | % | | | 3.72 | % | | | 3.74 | % | | | 3.67 | % | | | 3.62 | % | |
| Portfolio turnover rate | | | 14 | % | | | 25 | % | | | 18 | % | | | 21 | % | | | 16 | % | |
| Net assets, end of period (000's) | | $ | 78,126 | | | $ | 89,905 | | | $ | 102,899 | | | $ | 70,711 | | | $ | 22,479 | | |
(a) On September 23, 2005, the Columbia Intermediate Tax-Exempt Bond Fund was renamed Columbia Intermediate Municipal Bond Fund.
(b) Per share data was calculated using the average shares outstanding during the period.
(c) Total return at net asset value assuming all distributions reinvested and no initial sales charge or contingent deferred sales charge.
(d) Had the investment advisor and/or any of its affiliates not waived fees or reimbursed a portion of expenses, total return would have been reduced.
(e) The benefits derived from expense reductions had an impact of less than 0.01%.
(f) Rounds to less than 0.01%.
See Accompanying Notes to Financial Statements.
113
Financial Highlights – Columbia Intermediate Municipal Bond Fund
Selected data for a share outstanding throughout each period is as follows:
| | | Year Ended October 31, | |
| Class B Shares | | 2008 | | 2007 | | 2006 | | 2005 (a) | | 2004 | |
| Net Asset Value, Beginning of Period | | $ | 10.22 | | | $ | 10.39 | | | $ | 10.31 | | | $ | 10.72 | | | $ | 10.65 | | |
| Income from Investment Operations: | |
| Net investment income (b) | | | 0.32 | | | | 0.32 | | | | 0.32 | | | | 0.32 | | | | 0.31 | | |
Net realized and unrealized gain (loss)
on investments and futures contracts | | | (0.60 | ) | | | (0.18 | ) | | | 0.09 | | | | (0.34 | ) | | | 0.08 | | |
| Total from Investment Operations | | | (0.28 | ) | | | 0.14 | | | | 0.41 | | | | (0.02 | ) | | | 0.39 | | |
| Less Distributions to Shareholders: | |
| From net investment income | | | (0.32 | ) | | | (0.31 | ) | | | (0.31 | ) | | | (0.32 | ) | | | (0.31 | ) | |
| From net realized gains | | | — | | | | — | | | | (0.02 | ) | | | (0.07 | ) | | | (0.01 | ) | |
| Total Distributions to Shareholders | | | (0.32 | ) | | | (0.31 | ) | | | (0.33 | ) | | | (0.39 | ) | | | (0.32 | ) | |
| Net Asset Value, End of Period | | $ | 9.62 | | | $ | 10.22 | | | $ | 10.39 | | | $ | 10.31 | | | $ | 10.72 | | |
| Total return (c)(d) | | | (2.88 | )% | | | 1.42 | % | | | 4.09 | % | | | (0.20 | )% | | | 3.76 | % | |
| Ratios to Average Net Assets/Supplemental Data: | |
| Net expenses (e) | | | 1.35 | % | | | 1.35 | % | | | 1.35 | % | | | 1.46 | % | | | 1.58 | % | |
| Waiver/Reimbursement | | | 0.02 | % | | | 0.02 | % | | | 0.05 | % | | | 0.01 | % | | | 0.01 | % | |
| Net investment income (e) | | | 3.11 | % | | | 3.07 | % | | | 3.10 | % | | | 3.02 | % | | | 2.98 | % | |
| Portfolio turnover rate | | | 14 | % | | | 25 | % | | | 18 | % | | | 21 | % | | | 16 | % | |
| Net assets, end of period (000's) | | $ | 5,874 | | | $ | 8,133 | | | $ | 12,203 | | | $ | 7,040 | | | $ | 2,605 | | |
(a) On September 23, 2005, the Columbia Intermediate Tax-Exempt Bond Fund was renamed Columbia Intermediate Municipal Bond Fund.
(b) Per share data was calculated using the average shares outstanding during the period.
(c) Total return at net asset value assuming all distributions reinvested and no contingent deferred sales charge.
(d) Had the investment advisor and/or any of its affiliates not waived fees or reimbursed a portion of expenses, total return would have been reduced.
(e) The benefits derived from expense reductions had an impact of less than 0.01%.
See Accompanying Notes to Financial Statements.
114
Financial Highlights – Columbia Intermediate Municipal Bond Fund
Selected data for a share outstanding throughout each period is as follows:
| | | Year Ended October 31, | |
| Class C Shares | | 2008 | | 2007 | | 2006 | | 2005 (a) | | 2004 | |
| Net Asset Value, Beginning of Period | | $ | 10.22 | | | $ | 10.39 | | | $ | 10.31 | | | $ | 10.72 | | | $ | 10.65 | | |
| Income from Investment Operations: | |
| Net investment income (b) | | | 0.36 | | | | 0.36 | | | | 0.36 | | | | 0.36 | | | | 0.36 | | |
Net realized and unrealized gain (loss)
on investments and futures contracts | | | (0.60 | ) | | | (0.17 | ) | | | 0.10 | | | | (0.33 | ) | | | 0.08 | | |
| Total from Investment Operations | | | (0.24 | ) | | | 0.19 | | | | 0.46 | | | | 0.03 | | | | 0.44 | | |
| Less Distributions to Shareholders: | |
| From net investment income | | | (0.36 | ) | | | (0.36 | ) | | | (0.36 | ) | | | (0.37 | ) | | | (0.36 | ) | |
| From net realized gains | | | — | | | | — | | | | (0.02 | ) | | | (0.07 | ) | | | (0.01 | ) | |
| Total Distributions to Shareholders | | | (0.36 | ) | | | (0.36 | ) | | | (0.38 | ) | | | (0.44 | ) | | | (0.37 | ) | |
| Net Asset Value, End of Period | | $ | 9.62 | | | $ | 10.22 | | | $ | 10.39 | | | $ | 10.31 | | | $ | 10.72 | | |
| Total return (c)(d) | | | (2.45 | )% | | | 1.88 | % | | | 4.55 | % | | | 0.25 | % | | | 4.23 | % | |
| Ratios to Average Net Assets/Supplemental Data: | |
| Net expenses (e) | | | 0.90 | % | | | 0.90 | % | | | 0.90 | % | | | 1.01 | % | | | 1.13 | % | |
| Waiver/Reimbursement | | | 0.47 | % | | | 0.47 | % | | | 0.50 | % | | | 0.46 | % | | | 0.45 | % | |
| Net investment income (e) | | | 3.56 | % | | | 3.52 | % | | | 3.55 | % | | | 3.47 | % | | | 3.42 | % | |
| Portfolio turnover rate | | | 14 | % | | | 25 | % | | | 18 | % | | | 21 | % | | | 16 | % | |
| Net assets, end of period (000's) | | $ | 12,625 | | | $ | 10,506 | | | $ | 11,796 | | | $ | 8,318 | | | $ | 3,034 | | |
(a) On September 23, 2005, the Columbia Intermediate Tax-Exempt Bond Fund was renamed Columbia Intermediate Municipal Bond Fund.
(b) Per share data was calculated using the average shares outstanding during the period.
(c) Total return at net asset value assuming all distributions reinvested and no contingent deferred sales charge.
(d) Had the investment advisor and/or any of its affiliates not waived fees or reimbursed a portion of expenses, total return would have been reduced.
(e) The benefits derived from expense reductions had an impact of less than 0.01%.
See Accompanying Notes to Financial Statements.
115
Financial Highlights – Columbia Intermediate Municipal Bond Fund
Selected data for a share outstanding throughout each period is as follows:
| | | Year Ended October 31, | |
| Class T Shares | | 2008 | | 2007 (a) | | 2006 | | 2005 (b) | | 2004 | |
| Net Asset Value, Beginning of Period | | $ | 10.22 | | | $ | 10.39 | | | $ | 10.31 | | | $ | 10.72 | | | $ | 10.65 | | |
| Income from Investment Operations: | |
| Net investment income (c) | | | 0.39 | | | | 0.39 | | | | 0.39 | | | | 0.39 | | | | 0.39 | | |
Net realized and unrealized gain (loss)
on investments and futures contracts | | | (0.60 | ) | | | (0.17 | ) | | | 0.10 | | | | (0.34 | ) | | | 0.08 | | |
| Total from Investment Operations | | | (0.21 | ) | | | 0.22 | | | | 0.49 | | | | 0.05 | | | | 0.47 | | |
| Less Distributions to Shareholders: | |
| From net investment income | | | (0.39 | ) | | | (0.39 | ) | | | (0.39 | ) | | | (0.39 | ) | | | (0.39 | ) | |
| From net realized gains | | | — | | | | — | | | | (0.02 | ) | | | (0.07 | ) | | | (0.01 | ) | |
| Total Distributions to Shareholders | | | (0.39 | ) | | | (0.39 | ) | | | (0.41 | ) | | | (0.46 | ) | | | (0.40 | ) | |
| Net Asset Value, End of Period | | $ | 9.62 | | | $ | 10.22 | | | $ | 10.39 | | | $ | 10.31 | | | $ | 10.72 | | |
| Total return (d)(e) | | | (2.20 | )% | | | 2.14 | % | | | 4.81 | % | | | 0.50 | % | | | 4.49 | % | |
| Ratios to Average Net Assets/Supplemental Data: | |
| Net expenses (f) | | | 0.65 | % | | | 0.65 | % | | | 0.65 | % | | | 0.76 | % | | | 0.88 | % | |
| Waiver/Reimbursement | | | 0.02 | % | | | 0.02 | % | | | 0.05 | % | | | 0.01 | % | | | — | %(g) | |
| Net investment income (f) | | | 3.81 | % | | | 3.77 | % | | | 3.80 | % | | | 3.72 | % | | | 3.67 | % | |
| Portfolio turnover rate | | | 14 | % | | | 25 | % | | | 18 | % | | | 21 | % | | | 16 | % | |
| Net assets, end of period (000's) | | $ | 10,786 | | | $ | 13,170 | | | $ | 14,998 | | | $ | 17,261 | | | $ | 20,125 | | |
(a) On August 8, 2007, Class G shares were exchanged for Class T shares.
(b) On September 23, 2005, the Columbia Intermediate Tax-Exempt Bond Fund was renamed Columbia Intermediate Municipal Bond Fund.
(c) Per share data was calculated using the average shares outstanding during the period.
(d) Total return at net asset value assuming all distributions reinvested and no initial sales charge or contingent deferred sales charge.
(e) Had the investment advisor and/or any of its affiliates not waived fees or reimbursed a portion of expenses, total return would have been reduced.
(f) The benefits derived from expense reductions had an impact of less than 0.01%.
(g) Rounds to less than 0.01%.
See Accompanying Notes to Financial Statements.
116
Financial Highlights – Columbia Intermediate Municipal Bond Fund
Selected data for a share outstanding throughout each period is as follows:
| | | Year Ended October 31, | |
| Class Z Shares | | 2008 | | 2007 | | 2006 | | 2005 (a) | | 2004 | |
| Net Asset Value, Beginning of Period | | $ | 10.22 | | | $ | 10.39 | | | $ | 10.31 | | | $ | 10.72 | | | $ | 10.66 | | |
| Income from Investment Operations: | |
| Net investment income (b) | | | 0.40 | | | | 0.40 | | | | 0.40 | | | | 0.40 | | | | 0.41 | | |
Net realized and unrealized gain (loss)
on investments and futures contracts | | | (0.60 | ) | | | (0.17 | ) | | | 0.10 | | | | (0.33 | ) | | | 0.07 | | |
| Total from Investment Operations | | | (0.20 | ) | | | 0.23 | | | | 0.50 | | | | 0.07 | | | | 0.48 | | |
| Less Distributions to Shareholders: | |
| From net investment income | | | (0.40 | ) | | | (0.40 | ) | | | (0.40 | ) | | | (0.41 | ) | | | (0.41 | ) | |
| From net realized gains | | | — | | | | — | | | | (0.02 | ) | | | (0.07 | ) | | | (0.01 | ) | |
| Total Distributions to Shareholders | | | (0.40 | ) | | | (0.40 | ) | | | (0.42 | ) | | | (0.48 | ) | | | (0.42 | ) | |
| Net Asset Value, End of Period | | $ | 9.62 | | | $ | 10.22 | | | $ | 10.39 | | | $ | 10.31 | | | $ | 10.72 | | |
| Total return (c)(d) | | | (2.05 | )% | | | 2.29 | % | | | 4.97 | % | | | 0.65 | % | | | 4.55 | % | |
| Ratios to Average Net Assets/Supplemental Data: | |
| Net expenses (e) | | | 0.50 | % | | | 0.50 | % | | | 0.50 | % | | | 0.61 | % | | | 0.72 | % | |
| Waiver/Reimbursement | | | 0.02 | % | | | 0.02 | % | | | 0.05 | % | | | 0.01 | % | | | — | %(f) | |
| Net investment income (e) | | | 3.96 | % | | | 3.92 | % | | | 3.94 | % | | | 3.87 | % | | | 3.83 | % | |
| Portfolio turnover rate | | | 14 | % | | | 25 | % | | | 18 | % | | | 21 | % | | | 16 | % | |
| Net assets, end of period (000's) | | $ | 2,310,978 | | | $ | 2,207,710 | | | $ | 2,331,279 | | | $ | 2,063,124 | | | $ | 476,484 | | |
(a) On September 23, 2005, the Columbia Intermediate Tax-Exempt Bond Fund was renamed Columbia Intermediate Municipal Bond Fund.
(b) Per share data was calculated using the average shares outstanding during the period.
(c) Total return at net asset value assuming all distributions reinvested.
(d) Had the investment advisor and/or any of its affiliates not waived fees or reimbursed a portion of expenses, total return would have been reduced.
(e) The benefits derived from expense reductions had an impact of less than 0.01%.
(f) Rounds to less than 0.01%.
See Accompanying Notes to Financial Statements.
117
Financial Highlights – Columbia Massachusetts Intermediate Municipal Bond Fund
Selected data for a share outstanding throughout each period is as follows:
| | | Year Ended October 31, | |
| Class A Shares | | 2008 | | 2007 | | 2006 | | 2005 | | 2004 | |
| Net Asset Value, Beginning of Period | | $ | 10.35 | | | $ | 10.50 | | | $ | 10.49 | | | $ | 10.87 | | | $ | 10.82 | | |
| Income from Investment Operations: | |
| Net investment income (a) | | | 0.36 | | | | 0.34 | | | | 0.35 | | | | 0.37 | | | | 0.36 | | |
Net realized and unrealized gain (loss)
on investments and futures contracts | | | (0.44 | ) | | | (0.14 | ) | | | 0.09 | | | | (0.35 | ) | | | 0.05 | | |
| Total from Investment Operations | | | (0.08 | ) | | | 0.20 | | | | 0.44 | | | | 0.02 | | | | 0.41 | | |
| Less Distributions to Shareholders: | |
| From net investment income | | | (0.37 | ) | | | (0.34 | ) | | | (0.35 | ) | | | (0.37 | ) | | | (0.36 | ) | |
| From net realized gains | | | — | (b) | | | (0.01 | ) | | | (0.08 | ) | | | (0.03 | ) | | | — | | |
| Total Distributions to Shareholders | | | (0.37 | ) | | | (0.35 | ) | | | (0.43 | ) | | | (0.40 | ) | | | (0.36 | ) | |
| Net Asset Value, End of Period | | $ | 9.90 | | | $ | 10.35 | | | $ | 10.50 | | | $ | 10.49 | | | $ | 10.87 | | |
| Total return (c) | | | (0.88 | )%(d) | | | 2.00 | % | | | 4.33 | % | | | 0.18 | %(d) | | | 3.91 | % | |
| Ratios to Average Net Assets/Supplemental Data: | |
| Net expenses (e) | | | 0.75 | % | | | 0.99 | % | | | 0.95 | % | | | 0.91 | % | | | 0.98 | % | |
| Waiver/Reimbursement | | | 0.17 | % | | | — | | | | — | | | | — | %(f) | | | — | | |
| Net investment income (e) | | | 3.51 | % | | | 3.29 | % | | | 3.39 | % | | | 3.43 | % | | | 3.37 | % | |
| Portfolio turnover rate | | | 10 | % | | | 15 | % | | | 18 | % | | | 15 | % | | | 12 | % | |
| Net assets, end of period (000's) | | $ | 11,936 | | | $ | 6,914 | | | $ | 7,603 | | | $ | 8,332 | | | $ | 10,460 | | |
(a) Per share data was calculated using the average shares outstanding during the period.
(b) Rounds to less than $0.01 per share.
(c) Total return at net asset value assuming all distributions reinvested and no initial sales charge or contingent deferred sales charge.
(d) Had the investment advisor and/or any of its affiliates not waived fees or reimbursed a portion of expenses, total return would have been reduced.
(e) The benefits derived from expense reductions had an impact of less than 0.01%.
(f) Rounds to less than 0.01%.
See Accompanying Notes to Financial Statements.
118
Financial Highlights – Columbia Massachusetts Intermediate Municipal Bond Fund
Selected data for a share outstanding throughout each period is as follows:
| | | Year Ended October 31, | |
| Class B Shares | | 2008 | | 2007 | | 2006 | | 2005 | | 2004 | |
| Net Asset Value, Beginning of Period | | $ | 10.35 | | | $ | 10.50 | | | $ | 10.49 | | | $ | 10.87 | | | $ | 10.82 | | |
| Income from Investment Operations: | |
| Net investment income (a) | | | 0.29 | | | | 0.26 | | | | 0.27 | | | | 0.29 | | | | 0.28 | | |
Net realized and unrealized gain (loss)
on investments and futures contracts | | | (0.45 | ) | | | (0.13 | ) | | | 0.09 | | | | (0.35 | ) | | | 0.05 | | |
| Total from Investment Operations | | | (0.16 | ) | | | 0.13 | | | | 0.36 | | | | (0.06 | ) | | | 0.33 | | |
| Less Distributions to Shareholders: | |
| From net investment income | | | (0.29 | ) | | | (0.27 | ) | | | (0.27 | ) | | | (0.29 | ) | | | (0.28 | ) | |
| From net realized gains | | | — | (b) | | | (0.01 | ) | | | (0.08 | ) | | | (0.03 | ) | | | — | | |
| Total Distributions to Shareholders | | | (0.29 | ) | | | (0.28 | ) | | | (0.35 | ) | | | (0.32 | ) | | | (0.28 | ) | |
| Net Asset Value, End of Period | | $ | 9.90 | | | $ | 10.35 | | | $ | 10.50 | | | $ | 10.49 | | | $ | 10.87 | | |
| Total return (c) | | | (1.61 | )%(d) | | | 1.24 | % | | | 3.55 | % | | | (0.57 | )%(d) | | | 3.13 | % | |
| Ratios to Average Net Assets/Supplemental Data: | |
| Net expenses (e) | | | 1.50 | % | | | 1.74 | % | | | 1.70 | % | | | 1.66 | % | | | 1.73 | % | |
| Waiver/Reimbursement | | | 0.17 | % | | | — | | | | — | | | | — | %(f) | | | — | | |
| Net investment income (e) | | | 2.78 | % | | | 2.55 | % | | | 2.64 | % | | | 2.67 | % | | | 2.62 | % | |
| Portfolio turnover rate | | | 10 | % | | | 15 | % | | | 18 | % | | | 15 | % | | | 12 | % | |
| Net assets, end of period (000's) | | $ | 1,440 | | | $ | 1,650 | | | $ | 2,496 | | | $ | 3,220 | | | $ | 3,790 | | |
(a) Per share data was calculated using the average shares outstanding during the period.
(b) Rounds to less than $0.01 per share.
(c) Total return at net asset value assuming all distributions reinvested and no contingent deferred sales charge.
(d) Had the investment advisor and/or any of its affiliates not waived fees or reimbursed a portion of expenses, total return would have been reduced.
(e) The benefits derived from expense reductions had an impact of less than 0.01%.
(f) Rounds to less than 0.01%.
See Accompanying Notes to Financial Statements.
119
Financial Highlights – Columbia Massachusetts Intermediate Municipal Bond Fund
Selected data for a share outstanding throughout each period is as follows:
| | | Year Ended October 31, | |
| Class C Shares | | 2008 | | 2007 | | 2006 | | 2005 | | 2004 | |
| Net Asset Value, Beginning of Period | | $ | 10.35 | | | $ | 10.50 | | | $ | 10.49 | | | $ | 10.87 | | | $ | 10.82 | | |
| Income from Investment Operations: | |
| Net investment income (a) | | | 0.32 | | | | 0.30 | | | | 0.31 | | | | 0.32 | | | | 0.32 | | |
Net realized and unrealized gain (loss)
on investments and futures contracts | | | (0.44 | ) | | | (0.14 | ) | | | 0.09 | | | | (0.34 | ) | | | 0.05 | | |
| Total from Investment Operations | | | (0.12 | ) | | | 0.16 | | | | 0.40 | | | | (0.02 | ) | | | 0.37 | | |
| Less Distributions to Shareholders: | |
| From net investment income | | | (0.33 | ) | | | (0.30 | ) | | | (0.31 | ) | | | (0.33 | ) | | | (0.32 | ) | |
| From net realized gains | | | — | (b) | | | (0.01 | ) | | | (0.08 | ) | | | (0.03 | ) | | | — | | |
| Total Distributions to Shareholders | | | (0.33 | ) | | | (0.31 | ) | | | (0.39 | ) | | | (0.36 | ) | | | (0.32 | ) | |
| Net Asset Value, End of Period | | $ | 9.90 | | | $ | 10.35 | | | $ | 10.50 | | | $ | 10.49 | | | $ | 10.87 | | |
| Total return (c)(d) | | | (1.27 | )% | | | 1.59 | % | | | 3.91 | % | | | (0.22 | )% | | | 3.49 | % | |
| Ratios to Average Net Assets/Supplemental Data: | |
| Net expenses (e) | | | 1.15 | % | | | 1.39 | % | | | 1.35 | % | | | 1.31 | % | | | 1.38 | % | |
| Waiver/Reimbursement | | | 0.52 | % | | | 0.35 | % | | | 0.35 | % | | | 0.35 | % | | | 0.35 | % | |
| Net investment income (e) | | | 3.13 | % | | | 2.89 | % | | | 2.99 | % | | | 3.02 | % | | | 2.97 | % | |
| Portfolio turnover rate | | | 10 | % | | | 15 | % | | | 18 | % | | | 15 | % | | | 12 | % | |
| Net assets, end of period (000's) | | $ | 4,036 | | | $ | 3,792 | | | $ | 4,974 | | | $ | 6,866 | | | $ | 7,666 | | |
(a) Per share data was calculated using the average shares outstanding during the period.
(b) Rounds to less than $0.01 per share.
(c) Total return at net asset value assuming all distributions reinvested and no contingent deferred sales charge.
(d) Had the investment advisor and/or any of its affiliates not waived fees or reimbursed a portion of expenses, total return would have been reduced.
(e) The benefits derived from expense reductions had an impact of less than 0.01%.
See Accompanying Notes to Financial Statements.
120
Financial Highlights – Columbia Massachusetts Intermediate Municipal Bond Fund
Selected data for a share outstanding throughout each period is as follows:
| | | Year Ended October 31, | |
| Class T Shares | | 2008 | | 2007 (a) | | 2006 | | 2005 | | 2004 | |
| Net Asset Value, Beginning of Period | | $ | 10.35 | | | $ | 10.50 | | | $ | 10.49 | | | $ | 10.87 | | | $ | 10.82 | | |
| Income from Investment Operations: | |
| Net investment income (b) | | | 0.38 | | | | 0.35 | | | | 0.36 | | | | 0.38 | | | | 0.38 | | |
Net realized and unrealized gain (loss)
on investments and futures contracts | | | (0.45 | ) | | | (0.13 | ) | | | 0.09 | | | | (0.35 | ) | | | 0.05 | | |
| Total from Investment Operations | | | (0.07 | ) | | | 0.22 | | | | 0.45 | | | | 0.03 | | | | 0.43 | | |
| Less Distributions to Shareholders: | |
| From net investment income | | | (0.38 | ) | | | (0.36 | ) | | | (0.36 | ) | | | (0.38 | ) | | | (0.38 | ) | |
| From net realized gains | | | — | (c) | | | (0.01 | ) | | | (0.08 | ) | | | (0.03 | ) | | | — | | |
| Total Distributions to Shareholders | | | (0.38 | ) | | | (0.37 | ) | | | (0.44 | ) | | | (0.41 | ) | | | (0.38 | ) | |
| Net Asset Value, End of Period | | $ | 9.90 | | | $ | 10.35 | | | $ | 10.50 | | | $ | 10.49 | | | $ | 10.87 | | |
| Total return (d) | | | (0.77 | )%(e) | | | 2.10 | % | | | 4.43 | % | | | 0.28 | %(e) | | | 4.01 | % | |
| Ratios to Average Net Assets/Supplemental Data: | |
| Net expenses (f) | | | 0.65 | % | | | 0.89 | % | | | 0.85 | % | | | 0.81 | % | | | 0.88 | % | |
| Waiver/Reimbursement | | | 0.17 | % | | | — | | | | — | | | | — | %(g) | | | — | | |
| Net investment income (f) | | | 3.63 | % | | | 3.40 | % | | | 3.49 | % | | | 3.52 | % | | | 3.47 | % | |
| Portfolio turnover rate | | | 10 | % | | | 15 | % | | | 18 | % | | | 15 | % | | | 12 | % | |
| Net assets, end of period (000's) | | $ | 37,689 | | | $ | 42,468 | | | $ | 46,787 | | | $ | 54,474 | | | $ | 64,229 | | |
(a) On August 8, 2007, the Class G shares were exchanged for Class T shares.
(b) Per share data was calculated using the average shares outstanding during the period.
(c) Rounds to less than $0.01 per share.
(d) Total return at net asset value assuming all distributions reinvested and no initial sales charge or contingent deferred sales charge.
(e) Had the investment advisor and/or any of its affiliates not waived fees or reimbursed a portion of expenses, total return would have been reduced.
(f) The benefits derived from expense reductions had an impact of less than 0.01%.
(g) Rounds to less than 0.01%.
See Accompanying Notes to Financial Statements.
121
Financial Highlights – Columbia Massachusetts Intermediate Municipal Bond Fund
Selected data for a share outstanding throughout each period is as follows:
| | | Year Ended October 31, | |
| Class Z Shares | | 2008 | | 2007 | | 2006 | | 2005 | | 2004 | |
| Net Asset Value, Beginning of Period | | $ | 10.35 | | | $ | 10.50 | | | $ | 10.49 | | | $ | 10.87 | | | $ | 10.82 | | |
| Income from Investment Operations: | |
| Net investment income (a) | | | 0.39 | | | | 0.37 | | | | 0.38 | | | | 0.39 | | | | 0.39 | | |
Net realized and unrealized gain (loss)
on investments and futures contracts | | | (0.45 | ) | | | (0.14 | ) | | | 0.09 | | | | (0.34 | ) | | | 0.05 | | |
| Total from Investment Operations | | | (0.06 | ) | | | 0.23 | | | | 0.47 | | | | 0.05 | | | | 0.44 | | |
| Less Distributions to Shareholders: | |
| From net investment income | | | (0.39 | ) | | | (0.37 | ) | | | (0.38 | ) | | | (0.40 | ) | | | (0.39 | ) | |
| From net realized gains | | | — | (b) | | | (0.01 | ) | | | (0.08 | ) | | | (0.03 | ) | | | — | | |
| Total Distributions to Shareholders | | | (0.39 | ) | | | (0.38 | ) | | | (0.46 | ) | | | (0.43 | ) | | | (0.39 | ) | |
| Net Asset Value, End of Period | | $ | 9.90 | | | $ | 10.35 | | | $ | 10.50 | | | $ | 10.49 | | | $ | 10.87 | | |
| Total return (c) | | | (0.62 | )%(d) | | | 2.25 | % | | | 4.59 | % | | | 0.43 | %(d) | | | 4.17 | % | |
| Ratios to Average Net Assets/Supplemental Data: | |
| Net expenses (e) | | | 0.50 | % | | | 0.74 | % | | | 0.70 | % | | | 0.66 | % | | | 0.73 | % | |
| Waiver/Reimbursement | | | 0.17 | % | | | — | | | | — | | | | — | %(f) | | | — | | |
| Net investment income (e) | | | 3.78 | % | | | 3.55 | % | | | 3.64 | % | | | 3.67 | % | | | 3.62 | % | |
| Portfolio turnover rate | | | 10 | % | | | 15 | % | | | 18 | % | | | 15 | % | | | 12 | % | |
| Net assets, end of period (000's) | | $ | 259,753 | | | $ | 254,639 | | | $ | 250,224 | | | $ | 247,122 | | | $ | 252,741 | | |
(a) Per share data was calculated using the average shares outstanding during the period.
(b) Rounds to less than $0.01 per share.
(c) Total return at net asset value assuming all distributions reinvested.
(d) Had the investment advisor and/or any of its affiliates not waived fees or reimbursed a portion of expenses, total return would have been reduced.
(e) The benefits derived from expense reductions had an impact of less than 0.01%.
(f) Rounds to less than 0.01%.
See Accompanying Notes to Financial Statements.
122
Financial Highlights – Columbia New Jersey Intermediate Municipal Bond Fund
Selected data for a share outstanding throughout each period is as follows:
| | | Year Ended October 31, | |
| Class A Shares | | 2008 | | 2007 | | 2006 | | 2005 | | 2004 | |
| Net Asset Value, Beginning of Period | | $ | 10.08 | | | $ | 10.26 | | | $ | 10.23 | | | $ | 10.57 | | | $ | 10.50 | | |
| Income from Investment Operations: | |
| Net investment income (a) | | | 0.37 | | | | 0.33 | | | | 0.34 | | | | 0.35 | | | | 0.33 | | |
Net realized and unrealized gain (loss)
on investments and futures contracts | | | (0.53 | ) | | | (0.15 | ) | | | 0.10 | | | | (0.30 | ) | | | 0.10 | | |
| Total from Investment Operations | | | (0.16 | ) | | | 0.18 | | | | 0.44 | | | | 0.05 | | | | 0.43 | | |
| Less Distributions to Shareholders: | |
| From net investment income | | | (0.37 | ) | | | (0.33 | ) | | | (0.34 | ) | | | (0.35 | ) | | | (0.33 | ) | |
| From net realized gains | | | — | | | | (0.03 | ) | | | (0.07 | ) | | | (0.04 | ) | | | (0.03 | ) | |
| Total Distributions to Shareholders | | | (0.37 | ) | | | (0.36 | ) | | | (0.41 | ) | | | (0.39 | ) | | | (0.36 | ) | |
| Net Asset Value, End of Period | | $ | 9.55 | | | $ | 10.08 | | | $ | 10.26 | | | $ | 10.23 | | | $ | 10.57 | | |
| Total return (b) | | | (1.64 | )%(c) | | | 1.84 | % | | | 4.41 | % | | | 0.44 | %(c) | | | 4.20 | %(c) | |
| Ratios to Average Net Assets/Supplemental Data: | |
| Net expenses (d) | | | 0.75 | % | | | 1.25 | % | | | 1.18 | % | | | 1.06 | % | | | 1.13 | % | |
| Waiver/Reimbursement | | | 0.43 | % | | | — | | | | — | | | | — | %(e) | | | — | %(e) | |
| Net investment income (d) | | | 3.75 | % | | | 3.28 | % | | | 3.36 | % | | | 3.33 | % | | | 3.17 | % | |
| Portfolio turnover rate | | | 6 | % | | | 6 | % | | | 3 | % | | | 14 | % | | | 12 | % | |
| Net assets, end of period (000's) | | $ | 3,512 | | | $ | 3,007 | | | $ | 2,472 | | | $ | 3,909 | | | $ | 3,819 | | |
(a) Per share data was calculated using the average shares outstanding during the period.
(b) Total return at net asset value assuming all distributions reinvested and no initial sales charge or contingent deferred sales charge.
(c) Had the investment advisor and/or any of its affiliates not waived fees or reimbursed a portion of expenses, total return would have been reduced.
(d) The benefits derived from expense reductions had an impact of less than 0.01%.
(e) Rounds to less than 0.01%.
See Accompanying Notes to Financial Statements.
123
Financial Highlights – Columbia New Jersey Intermediate Municipal Bond Fund
Selected data for a share outstanding throughout each period is as follows:
| | | Year Ended October 31, | |
| Class B Shares | | 2008 | | 2007 | | 2006 | | 2005 | | 2004 | |
| Net Asset Value, Beginning of Period | | $ | 10.08 | | | $ | 10.26 | | | $ | 10.23 | | | $ | 10.57 | | | $ | 10.50 | | |
| Income from Investment Operations: | |
| Net investment income (a) | | | 0.30 | | | | 0.26 | | | | 0.27 | | | | 0.27 | | | | 0.25 | | |
Net realized and unrealized gain (loss)
on investments and futures contracts | | | (0.53 | ) | | | (0.15 | ) | | | 0.09 | | | | (0.30 | ) | | | 0.10 | | |
| Total from Investment Operations | | | (0.23 | ) | | | 0.11 | | | | 0.36 | | | | (0.03 | ) | | | 0.35 | | |
| Less Distributions to Shareholders: | |
| From net investment income | | | (0.30 | ) | | | (0.26 | ) | | | (0.26 | ) | | | (0.27 | ) | | | (0.25 | ) | |
| From net realized gains | | | — | | | | (0.03 | ) | | | (0.07 | ) | | | (0.04 | ) | | | (0.03 | ) | |
| Total Distributions to Shareholders | | | (0.30 | ) | | | (0.29 | ) | | | (0.33 | ) | | | (0.31 | ) | | | (0.28 | ) | |
| Net Asset Value, End of Period | | $ | 9.55 | | | $ | 10.08 | | | $ | 10.26 | | | $ | 10.23 | | | $ | 10.57 | | |
| Total return (b) | | | (2.36 | )%(c) | | | 1.08 | % | | | 3.63 | % | | | (0.30 | )%(c) | | | 3.41 | %(c) | |
| Ratios to Average Net Assets/Supplemental Data: | |
| Net expenses (d) | | | 1.50 | % | | | 2.00 | % | | | 1.93 | % | | | 1.81 | % | | | 1.89 | % | |
| Waiver/Reimbursement | | | 0.43 | % | | | — | | | | — | | | | — | %(e) | | | — | %(e) | |
| Net investment income (d) | | | 3.01 | % | | | 2.53 | % | | | 2.62 | % | | | 2.58 | % | | | 2.41 | % | |
| Portfolio turnover rate | | | 6 | % | | | 6 | % | | | 3 | % | | | 14 | % | | | 12 | % | |
| Net assets, end of period (000's) | | $ | 1,150 | | | $ | 1,254 | | | $ | 1,518 | | | $ | 1,873 | | | $ | 1,998 | | |
(a) Per share data was calculated using the average shares outstanding during the period.
(b) Total return at net asset value assuming all distributions reinvested and no contingent deferred sales charge.
(c) Had the investment advisor and/or any of its affiliates not waived fees or reimbursed a portion of expenses, total return would have been reduced.
(d) The benefits derived from expense reductions had an impact of less than 0.01%.
(e) Rounds to less than 0.01%.
See Accompanying Notes to Financial Statements.
124
Financial Highlights – Columbia New Jersey Intermediate Municipal Bond Fund
Selected data for a share outstanding throughout each period is as follows:
| | | Year Ended October 31, | |
| Class C Shares | | 2008 | | 2007 | | 2006 | | 2005 | | 2004 | |
| Net Asset Value, Beginning of Period | | $ | 10.08 | | | $ | 10.26 | | | $ | 10.23 | | | $ | 10.57 | | | $ | 10.50 | | |
| Income from Investment Operations: | |
| Net investment income (a) | | | 0.34 | | | | 0.29 | | | | 0.30 | | | | 0.30 | | | | 0.29 | | |
Net realized and unrealized gain (loss)
on investments and futures contracts | | | (0.54 | ) | | | (0.15 | ) | | | 0.10 | | | | (0.29 | ) | | | 0.10 | | |
| Total from Investment Operations | | | (0.20 | ) | | | 0.14 | | | | 0.40 | | | | 0.01 | | | | 0.39 | | |
| Less Distributions to Shareholders: | |
| From net investment income | | | (0.33 | ) | | | (0.29 | ) | | | (0.30 | ) | | | (0.31 | ) | | | (0.29 | ) | |
| From net realized gains | | | — | | | | (0.03 | ) | | | (0.07 | ) | | | (0.04 | ) | | | (0.03 | ) | |
| Total Distributions to Shareholders | | | (0.33 | ) | | | (0.32 | ) | | | (0.37 | ) | | | (0.35 | ) | | | (0.32 | ) | |
| Net Asset Value, End of Period | | $ | 9.55 | | | $ | 10.08 | | | $ | 10.26 | | | $ | 10.23 | | | $ | 10.57 | | |
| Total return (b)(c) | | | (2.02 | )% | | | 1.44 | % | | | 3.99 | % | | | 0.04 | % | | | 3.79 | % | |
| Ratios to Average Net Assets/Supplemental Data: | |
| Net expenses (d) | | | 1.15 | % | | | 1.65 | % | | | 1.58 | % | | | 1.46 | % | | | 1.53 | % | |
| Waiver/Reimbursement | | | 0.78 | % | | | 0.35 | % | | | 0.35 | % | | | 0.35 | % | | | 0.35 | % | |
| Net investment income (d) | | | 3.36 | % | | | 2.88 | % | | | 2.96 | % | | | 2.92 | % | | | 2.77 | % | |
| Portfolio turnover rate | | | 6 | % | | | 6 | % | | | 3 | % | | | 14 | % | | | 12 | % | |
| Net assets, end of period (000's) | | $ | 2,582 | | | $ | 3,108 | | | $ | 4,192 | | | $ | 4,590 | | | $ | 4,389 | | |
(a) Per share data was calculated using the average shares outstanding during the period.
(b) Total return at net asset value assuming all distributions reinvested and no contingent deferred sales charge.
(c) Had the investment advisor and/or any of its affiliates not waived fees or reimbursed a portion of expenses, total return would have been reduced.
(d) The benefits derived from expense reductions had an impact of less than 0.01%.
See Accompanying Notes to Financial Statements.
125
Financial Highlights – Columbia New Jersey Intermediate Municipal Bond Fund
Selected data for a share outstanding throughout each period is as follows:
| | | Year Ended October 31, | |
| Class T Shares | | 2008 | | 2007 (a) | | 2006 | | 2005 | | 2004 | |
| Net Asset Value, Beginning of Period | | $ | 10.08 | | | $ | 10.26 | | | $ | 10.23 | | | $ | 10.57 | | | $ | 10.50 | | |
| Income from Investment Operations: | |
| Net investment income (b) | | | 0.39 | | | | 0.34 | | | | 0.35 | | | | 0.36 | | | | 0.34 | | |
Net realized and unrealized gain (loss)
on investments and futures contracts | | | (0.54 | ) | | | (0.14 | ) | | | 0.10 | | | | (0.30 | ) | | | 0.10 | | |
| Total from Investment Operations | | | (0.15 | ) | | | 0.20 | | | | 0.45 | | | | 0.06 | | | | 0.44 | | |
| Less Distributions to Shareholders: | |
| From net investment income | | | (0.38 | ) | | | (0.35 | ) | | | (0.35 | ) | | | (0.36 | ) | | | (0.34 | ) | |
| From net realized gains | | | — | | | | (0.03 | ) | | | (0.07 | ) | | | (0.04 | ) | | | (0.03 | ) | |
| Total Distributions to Shareholders | | | (0.38 | ) | | | (0.38 | ) | | | (0.42 | ) | | | (0.40 | ) | | | (0.37 | ) | |
| Net Asset Value, End of Period | | $ | 9.55 | | | $ | 10.08 | | | $ | 10.26 | | | $ | 10.23 | | | $ | 10.57 | | |
| Total return (c) | | | (1.53 | )%(d) | | | 1.94 | % | | | 4.51 | % | | | 0.55 | %(d) | | | 4.30 | %(d) | |
| Ratios to Average Net Assets/Supplemental Data: | |
| Net expenses (e) | | | 0.65 | % | | | 1.15 | % | | | 1.08 | % | | | 0.96 | % | | | 1.04 | % | |
| Waiver/Reimbursement | | | 0.43 | % | | | — | | | | — | | | | — | %(f) | | | — | %(f) | |
| Net investment income (e) | | | 3.85 | % | | | 3.38 | % | | | 3.46 | % | | | 3.43 | % | | | 3.26 | % | |
| Portfolio turnover rate | | | 6 | % | | | 6 | % | | | 3 | % | | | 14 | % | | | 12 | % | |
| Net assets, end of period (000's) | | $ | 3,848 | | | $ | 5,037 | | | $ | 5,489 | | | $ | 6,484 | | | $ | 7,192 | | |
(a) On August 8,2007 Class G shares were exchanged for Class T shares.
(b) Per share data was calculated using the average shares outstanding during the period.
(c) Total return at net asset value assuming all distributions reinvested and no initial sales charge or contingent deferred sales charge.
(d) Had the investment advisor and/or any of its affiliates not waived fees or reimbursed a portion of expenses, total return would have been reduced.
(e) The benefits derived from expense reductions had an impact of less than 0.01%.
(f) Rounds to less than 0.01%.
See Accompanying Notes to Financial Statements.
126
Financial Highlights – Columbia New Jersey Intermediate Municipal Bond Fund
Selected data for a share outstanding throughout each period is as follows:
| | | Year Ended October 31, | |
| Class Z Shares | | 2008 | | 2007 | | 2006 | | 2005 | | 2004 | |
| Net Asset Value, Beginning of Period | | $ | 10.08 | | | $ | 10.26 | | | $ | 10.23 | | | $ | 10.57 | | | $ | 10.50 | | |
| Income from Investment Operations: | |
| Net investment income (a) | | | 0.40 | | | | 0.36 | | | | 0.37 | | | | 0.37 | | | | 0.36 | | |
Net realized and unrealized gain (loss)
on investments and futures contracts | | | (0.53 | ) | | | (0.15 | ) | | | 0.09 | | | | (0.30 | ) | | | 0.10 | | |
| Total from Investment Operations | | | (0.13 | ) | | | 0.21 | | | | 0.46 | | | | 0.07 | | | | 0.46 | | |
| Less Distributions to Shareholders: | |
| From net investment income | | | (0.40 | ) | | | (0.36 | ) | | | (0.36 | ) | | | (0.37 | ) | | | (0.36 | ) | |
| From net realized gains | | | — | | | | (0.03 | ) | | | (0.07 | ) | | | (0.04 | ) | | | (0.03 | ) | |
| Total Distributions to Shareholders | | | (0.40 | ) | | | (0.39 | ) | | | (0.43 | ) | | | (0.41 | ) | | | (0.39 | ) | |
| Net Asset Value, End of Period | | $ | 9.55 | | | $ | 10.08 | | | $ | 10.26 | | | $ | 10.23 | | | $ | 10.57 | | |
| Total return (b) | | | (1.38 | )%(c) | | | 2.10 | % | | | 4.67 | % | | | 0.70 | %(c) | | | 4.47 | %(c) | |
| Ratios to Average Net Assets/Supplemental Data: | |
| Net expenses (d) | | | 0.50 | % | | | 1.00 | % | | | 0.93 | % | | | 0.81 | % | | | 0.88 | % | |
| Waiver/Reimbursement | | | 0.43 | % | | | — | | | | — | | | | — | %(e) | | | — | %(e) | |
| Net investment income (d) | | | 4.00 | % | | | 3.52 | % | | | 3.61 | % | | | 3.58 | % | | | 3.42 | % | |
| Portfolio turnover rate | | | 6 | % | | | 6 | % | | | 3 | % | | | 14 | % | | | 12 | % | |
| Net assets, end of period (000's) | | $ | 55,108 | | | $ | 53,075 | | | $ | 50,453 | | | $ | 58,181 | | | $ | 66,764 | | |
(a) Per share data was calculated using the average shares outstanding during the period.
(b) Total return at net asset value assuming all distributions reinvested.
(c) Had the investment advisor and/or any of its affiliates not waived fees or reimbursed a portion of expenses, total return would have been reduced.
(d) The benefits derived from expense reductions had an impact of less than 0.01%.
(e) Rounds to less than 0.01%.
See Accompanying Notes to Financial Statements.
127
Financial Highlights – Columbia New York Intermediate Municipal Bond Fund
Selected data for a share outstanding throughout each period is as follows:
| | | Year Ended October 31, | |
| Class A Shares | | 2008 | | 2007 | | 2006 | | 2005 | | 2004 | |
| Net Asset Value, Beginning of Period | | $ | 11.54 | | | $ | 11.68 | | | $ | 11.61 | | | $ | 11.98 | | | $ | 11.87 | | |
| Income from Investment Operations: | |
| Net investment income (a) | | | 0.40 | | | | 0.38 | | | | 0.38 | | | | 0.39 | | | | 0.37 | | |
Net realized and unrealized gain (loss)
on investments and futures contracts | | | (0.51 | ) | | | (0.14 | ) | | | 0.08 | | | | (0.36 | ) | | | 0.13 | | |
| Total from Investment Operations | | | (0.11 | ) | | | 0.24 | | | | 0.46 | | | | 0.03 | | | | 0.50 | | |
| Less Distributions to Shareholders: | |
| From net investment income | | | (0.40 | ) | | | (0.38 | ) | | | (0.38 | ) | | | (0.39 | ) | | | (0.37 | ) | |
| From net realized gains | | | — | | | | — | (b) | | | (0.01 | ) | | | (0.01 | ) | | | (0.02 | ) | |
| Total Distributions to Shareholders | | | (0.40 | ) | | | (0.38 | ) | | | (0.39 | ) | | | (0.40 | ) | | | (0.39 | ) | |
| Net Asset Value, End of Period | | $ | 11.03 | | | $ | 11.54 | | | $ | 11.68 | | | $ | 11.61 | | | $ | 11.98 | | |
| Total return (c) | | | (1.02 | )%(d) | | | 2.12 | % | | | 4.04 | % | | | 0.22 | %(d) | | | 4.24 | %(d) | |
| Ratios to Average Net Assets/Supplemental Data: | |
| Net expenses (e) | | | 0.75 | % | | | 1.07 | % | | | 1.06 | % | | | 0.97 | % | | | 1.11 | % | |
| Waiver/Reimbursement | | | 0.18 | % | | | — | | | | — | | | | — | %(f) | | | — | %(f) | |
| Net investment income (e) | | | 3.44 | % | | | 3.30 | % | | | 3.30 | % | | | 3.26 | % | | | 3.06 | % | |
| Portfolio turnover rate | | | 9 | % | | | 9 | % | | | 4 | % | | | 4 | % | | | 11 | % | |
| Net assets, end of period (000's) | | $ | 4,200 | | | $ | 1,874 | | | $ | 2,529 | | | $ | 2,858 | | | $ | 5,836 | | |
(a) Per share data was calculated using the average shares outstanding during the period.
(b) Rounds to less than $0.01 per share.
(c) Total return at net asset value assuming all distributions reinvested and no initial sales charge or contingent deferred sales charge.
(d) Had the investment advisor and/or any of its affiliates not waived fees or reimbursed a portion of expenses, total return would have been reduced.
(e) The benefits derived from expense reductions had an impact of less than 0.01%.
(f) Rounds to less than 0.01%.
See Accompanying Notes to Financial Statements.
128
Financial Highlights – Columbia New York Intermediate Municipal Bond Fund
Selected data for a share outstanding throughout each period is as follows:
| | | Year Ended October 31, | |
| Class B Shares | | 2008 | | 2007 | | 2006 | | 2005 | | 2004 | |
| Net Asset Value, Beginning of Period | | $ | 11.54 | | | $ | 11.68 | | | $ | 11.61 | | | $ | 11.98 | | | $ | 11.87 | | |
| Income from Investment Operations: | |
| Net investment income (a) | | | 0.32 | | | | 0.30 | | | | 0.30 | | | | 0.30 | | | | 0.28 | | |
Net realized and unrealized gain (loss)
on investments and futures contracts | | | (0.51 | ) | | | (0.14 | ) | | | 0.07 | | | | (0.36 | ) | | | 0.13 | | |
| Total from Investment Operations | | | (0.19 | ) | | | 0.16 | | | | 0.37 | | | | (0.06 | ) | | | 0.41 | | |
| Less Distributions to Shareholders: | |
| From net investment income | | | (0.32 | ) | | | (0.30 | ) | | | (0.29 | ) | | | (0.30 | ) | | | (0.28 | ) | |
| From net realized gains | | | — | | | | — | (b) | | | (0.01 | ) | | | (0.01 | ) | | | (0.02 | ) | |
| Total Distributions to Shareholders | | | (0.32 | ) | | | (0.30 | ) | | | (0.30 | ) | | | (0.31 | ) | | | (0.30 | ) | |
| Net Asset Value, End of Period | | $ | 11.03 | | | $ | 11.54 | | | $ | 11.68 | | | $ | 11.61 | | | $ | 11.98 | | |
| Total return (c) | | | (1.74 | )%(d) | | | 1.36 | % | | | 3.27 | % | | | (0.53 | )%(d) | | | 3.46 | %(d) | |
| Ratios to Average Net Assets/Supplemental Data: | |
| Net expenses (e) | | | 1.50 | % | | | 1.82 | % | | | 1.81 | % | | | 1.72 | % | | | 1.86 | % | |
| Waiver/Reimbursement | | | 0.18 | % | | | — | | | | — | | | | — | %(f) | | | — | %(f) | |
| Net investment income (e) | | | 2.77 | % | | | 2.55 | % | | | 2.55 | % | | | 2.52 | % | | | 2.31 | % | |
| Portfolio turnover rate | | | 9 | % | | | 9 | % | | | 4 | % | | | 4 | % | | | 11 | % | |
| Net assets, end of period (000's) | | $ | 1,503 | | | $ | 1,804 | | | $ | 2,965 | | | $ | 3,586 | | | $ | 4,295 | | |
(a) Per share data was calculated using the average shares outstanding during the period.
(b) Rounds to less than $0.01 per share.
(c) Total return at net asset value assuming all distributions reinvested and no contingent deferred sales charge.
(d) Had the investment advisor and/or any of its affiliates not waived fees or reimbursed a portion of expenses, total return would have been reduced.
(e) The benefits derived from expense reductions had an impact of less than 0.01%.
(f) Rounds to less than 0.01%.
See Accompanying Notes to Financial Statements.
129
Financial Highlights – Columbia New York Intermediate Municipal Bond Fund
Selected data for a share outstanding throughout each period is as follows:
| | | Year Ended October 31, | |
| Class C Shares | | 2008 | | 2007 | | 2006 | | 2005 | | 2004 | |
| Net Asset Value, Beginning of Period | | $ | 11.54 | | | $ | 11.68 | | | $ | 11.61 | | | $ | 11.98 | | | $ | 11.87 | | |
| Income from Investment Operations: | |
| Net investment income (a) | | | 0.36 | | | | 0.33 | | | | 0.34 | | | | 0.34 | | | | 0.32 | | |
Net realized and unrealized gain (loss)
on investments and futures contracts | | | (0.51 | ) | | | (0.13 | ) | | | 0.07 | | | | (0.36 | ) | | | 0.13 | | |
| Total from Investment Operations | | | (0.15 | ) | | | 0.20 | | | | 0.41 | | | | (0.02 | ) | | | 0.45 | | |
| Less Distributions to Shareholders: | |
| From net investment income | | | (0.36 | ) | | | (0.34 | ) | | | (0.33 | ) | | | (0.34 | ) | | | (0.32 | ) | |
| From net realized gains | | | — | | | | — | (b) | | | (0.01 | ) | | | (0.01 | ) | | | (0.02 | ) | |
| Total Distributions to Shareholders | | | (0.36 | ) | | | (0.34 | ) | | | (0.34 | ) | | | (0.35 | ) | | | (0.34 | ) | |
| Net Asset Value, End of Period | | $ | 11.03 | | | $ | 11.54 | | | $ | 11.68 | | | $ | 11.61 | | | $ | 11.98 | | |
| Total return (c)(d) | | | (1.40 | )% | | | 1.71 | % | | | 3.63 | % | | | (0.18 | )% | | | 3.82 | % | |
| Ratios to Average Net Assets/Supplemental Data: | |
| Net expenses (e) | | | 1.15 | % | | | 1.47 | % | | | 1.46 | % | | | 1.37 | % | | | 1.51 | % | |
| Waiver/Reimbursement | | | 0.53 | % | | | 0.35 | % | | | 0.35 | % | | | 0.35 | % | | | 0.35 | % | |
| Net investment income (e) | | | 3.09 | % | | | 2.89 | % | | | 2.91 | % | | | 2.84 | % | | | 2.66 | % | |
| Portfolio turnover rate | | | 9 | % | | | 9 | % | | | 4 | % | | | 4 | % | | | 11 | % | |
| Net assets, end of period (000's) | | $ | 2,649 | | | $ | 2,019 | | | $ | 2,544 | | | $ | 3,360 | | | $ | 2,790 | | |
(a) Per share data was calculated using the average shares outstanding during the period.
(b) Rounds to less than $0.01 per share.
(c) Total return at net asset value assuming all distributions reinvested and no contingent deferred sales charge.
(d) Had the investment advisor and/or any of its affiliates not waived fees or reimbursed a portion of expenses, total return would have been reduced.
(e) The benefits derived from expense reductions had an impact of less than 0.01%.
See Accompanying Notes to Financial Statements.
130
Financial Highlights – Columbia New York Intermediate Municipal Bond Fund
Selected data for a share outstanding throughout each period is as follows:
| | | Year Ended October 31, | |
| Class T Shares | | 2008 | | 2007 (a) | | 2006 | | 2005 | | 2004 | |
| Net Asset Value, Beginning of Period | | $ | 11.54 | | | $ | 11.68 | | | $ | 11.61 | | | $ | 11.98 | | | $ | 11.87 | | |
| Income from Investment Operations: | |
| Net investment income (b) | | | 0.42 | | | | 0.39 | | | | 0.39 | | | | 0.40 | | | | 0.38 | | |
Net realized and unrealized gain (loss)
on investments and futures contracts | | | (0.52 | ) | | | (0.14 | ) | | | 0.08 | | | | (0.36 | ) | | | 0.13 | | |
| Total from Investment Operations | | | (0.10 | ) | | | 0.25 | | | | 0.47 | | | | 0.04 | | | | 0.51 | | |
| Less Distributions to Shareholders: | |
| From net investment income | | | (0.41 | ) | | | (0.39 | ) | | | (0.39 | ) | | | (0.40 | ) | | | (0.38 | ) | |
| From net realized gains | | | — | | | | — | (c) | | | (0.01 | ) | | | (0.01 | ) | | | (0.02 | ) | |
| Total Distributions to Shareholders | | | (0.41 | ) | | | (0.39 | ) | | | (0.40 | ) | | | (0.41 | ) | | | (0.40 | ) | |
| Net Asset Value, End of Period | | $ | 11.03 | | | $ | 11.54 | | | $ | 11.68 | | | $ | 11.61 | | | $ | 11.98 | | |
| Total return (d) | | | (0.90 | )%(e) | | | 2.22 | % | | | 4.15 | % | | | 0.32 | %(e) | | | 4.34 | %(e) | |
| Ratios to Average Net Assets/Supplemental Data: | |
| Net expenses (f) | | | 0.65 | % | | | 0.97 | % | | | 0.96 | % | | | 0.87 | % | | | 1.01 | % | |
| Waiver/Reimbursement | | | 0.18 | % | | | — | | | | — | | | | — | %(g) | | | — | %(g) | |
| Net investment income (f) | | | 3.62 | % | | | 3.40 | % | | | 3.41 | % | | | 3.36 | % | | | 3.16 | % | |
| Portfolio turnover rate | | | 9 | % | | | 9 | % | | | 4 | % | | | 4 | % | | | 11 | % | |
| Net assets, end of period (000's) | | $ | 11,520 | | | $ | 13,575 | | | $ | 14,634 | | | $ | 17,943 | | | $ | 21,584 | | |
(a) On August 8, 2007 Class G shares were exchanged for Class T shares.
(b) Per share data was calculated using the average shares outstanding during the period.
(c) Rounds to less than $0.01 per share.
(d) Total return at net asset value assuming all distributions reinvested and no initial sales charge or contingent deferred sales charge.
(e) Had the investment advisor and/or any of its affiliates not waived fees or reimbursed a portion of expenses, total return would have been reduced.
(f) The benefits derived from expense reductions had an impact of less than 0.01%.
(g) Rounds to less than 0.01%.
See Accompanying Notes to Financial Statements.
131
Financial Highlights – Columbia New York Intermediate Municipal Bond Fund
Selected data for a share outstanding throughout each period is as follows:
| | | Year Ended October 31, | |
| Class Z Shares | | 2008 | | 2007 | | 2006 | | 2005 | | 2004 | |
| Net Asset Value, Beginning of Period | | $ | 11.54 | | | $ | 11.68 | | | $ | 11.61 | | | $ | 11.98 | | | $ | 11.87 | | |
| Income from Investment Operations: | |
| Net investment income (a) | | | 0.42 | | | | 0.41 | | | | 0.41 | | | | 0.42 | | | | 0.40 | | |
Net realized and unrealized gain (loss)
on investments and futures contracts | | | (0.50 | ) | | | (0.14 | ) | | | 0.08 | | | | (0.36 | ) | | | 0.13 | | |
| Total from Investment Operations | | | (0.08 | ) | | | 0.27 | | | | 0.49 | | | | 0.06 | | | | 0.53 | | |
| Less Distributions to Shareholders: | |
| From net investment income | | | (0.43 | ) | | | (0.41 | ) | | | (0.41 | ) | | | (0.42 | ) | | | (0.40 | ) | |
| From net realized gains | | | — | | | | — | (b) | | | (0.01 | ) | | | (0.01 | ) | | | (0.02 | ) | |
| Total Distributions to Shareholders | | | (0.43 | ) | | | (0.41 | ) | | | (0.42 | ) | | | (0.43 | ) | | | (0.42 | ) | |
| Net Asset Value, End of Period | | $ | 11.03 | | | $ | 11.54 | | | $ | 11.68 | | | $ | 11.61 | | | $ | 11.98 | | |
| Total return (c) | | | (0.75 | )%(d) | | | 2.37 | % | | | 4.30 | % | | | 0.47 | %(d) | | | 4.51 | %(d) | |
| Ratios to Average Net Assets/Supplemental Data: | |
| Net expenses (e) | | | 0.50 | % | | | 0.82 | % | | | 0.81 | % | | | 0.72 | % | | | 0.85 | % | |
| Waiver/Reimbursement | | | 0.18 | % | | | — | | | | — | | | | — | %(f) | | | — | %(f) | |
| Net investment income (e) | | | 3.73 | % | | | 3.55 | % | | | 3.55 | % | | | 3.51 | % | | | 3.32 | % | |
| Portfolio turnover rate | | | 9 | % | | | 9 | % | | | 4 | % | | | 4 | % | | | 11 | % | |
| Net assets, end of period (000's) | | $ | 272,139 | | | $ | 130,411 | | | $ | 119,457 | | | $ | 105,300 | | | $ | 91,408 | | |
(a) Per share data was calculated using the average shares outstanding during the period.
(b) Rounds to less than $0.01 per share.
(c) Total return at net asset value assuming all distributions reinvested.
(d) Had the investment advisor and/or any of its affiliates not waived fees or reimbursed a portion of expenses, total return would have been reduced.
(e) The benefits derived from expense reductions had an impact of less than 0.01%.
(f) Rounds to less than 0.01%.
See Accompanying Notes to Financial Statements.
132
Financial Highlights – Columbia Rhode Island Intermediate Municipal Bond Fund
Selected data for a share outstanding throughout each period is as follows:
| | | Year Ended October 31, | |
| Class A Shares | | 2008 | | 2007 | | 2006 | | 2005 | | 2004 | |
| Net Asset Value, Beginning of Period | | $ | 11.05 | | | $ | 11.21 | | | $ | 11.20 | | | $ | 11.54 | | | $ | 11.48 | | |
| Income from Investment Operations: | |
| Net investment income (a) | | | 0.41 | | | | 0.38 | | | | 0.40 | | | | 0.40 | | | | 0.38 | | |
Net realized and unrealized gain (loss)
on investments and futures contracts | | | (0.53 | ) | | | (0.15 | ) | | | 0.04 | | | | (0.33 | ) | | | 0.06 | | |
| Total from Investment Operations | | | (0.12 | ) | | | 0.23 | | | | 0.44 | | | | 0.07 | | | | 0.44 | | |
| Less Distributions to Shareholders: | |
| From net investment income | | | (0.41 | ) | | | (0.38 | ) | | | (0.40 | ) | | | (0.40 | ) | | | (0.38 | ) | |
| From net realized gains | | | — | | | | (0.01 | ) | | | (0.03 | ) | | | (0.01 | ) | | | — | | |
| Total Distributions to Shareholders | | | (0.41 | ) | | | (0.39 | ) | | | (0.43 | ) | | | (0.41 | ) | | | (0.38 | ) | |
| Net Asset Value, End of Period | | $ | 10.52 | | | $ | 11.05 | | | $ | 11.21 | | | $ | 11.20 | | | $ | 11.54 | | |
| Total return (b) | | | (1.16 | )%(c) | | | 2.11 | % | | | 3.98 | % | | | 0.63 | %(c) | | | 3.90 | % | |
| Ratios to Average Net Assets/Supplemental Data: | |
| Net expenses (d) | | | 0.75 | % | | | 1.11 | % | | | 1.02 | % | | | 0.97 | % | | | 1.06 | % | |
| Waiver/Reimbursement | | | 0.27 | % | | | — | | | | — | | | | — | %(e) | | | — | | |
| Net investment income (d) | | | 3.71 | % | | | 3.44 | % | | | 3.57 | % | | | 3.50 | % | | | 3.33 | % | |
| Portfolio turnover rate | | | 14 | % | | | 11 | % | | | 10 | % | | | 12 | % | | | 11 | % | |
| Net assets, end of period (000's) | | $ | 3,247 | | | $ | 1,130 | | | $ | 979 | | | $ | 1,544 | | | $ | 865 | | |
(a) Per share data was calculated using the average shares outstanding during the period.
(b) Total return at net asset value assuming all distributions reinvested and no initial sales charge or contingent deferred sales charge.
(c) Had the investment advisor and/or any of its affiliates not waived fees or reimbursed a portion of expenses, total return would have been reduced.
(d) The benefits derived from expense reductions has an impact of less than 0.01%.
(e) Rounds to less than 0.01%.
See Accompanying Notes to Financial Statements.
133
Financial Highlights – Columbia Rhode Island Intermediate Municipal Bond Fund
Selected data for a share outstanding throughout each period is as follows:
| | | Year Ended October 31, | |
| Class B Shares | | 2008 | | 2007 | | 2006 | | 2005 | | 2004 | |
| Net Asset Value, Beginning of Period | | $ | 11.05 | | | $ | 11.21 | | | $ | 11.20 | | | $ | 11.54 | | | $ | 11.48 | | |
| Income from Investment Operations: | |
| Net investment income (a) | | | 0.33 | | | | 0.30 | | | | 0.31 | | | | 0.31 | | | | 0.29 | | |
Net realized and unrealized gain (loss)
on investments and futures contracts | | | (0.53 | ) | | | (0.15 | ) | | | 0.04 | | | | (0.32 | ) | | | 0.06 | | |
| Total from Investment Operations | | | (0.20 | ) | | | 0.15 | | | | 0.35 | | | | (0.01 | ) | | | 0.35 | | |
| Less Distributions to Shareholders: | |
| From net investment income | | | (0.33 | ) | | | (0.30 | ) | | | (0.31 | ) | | | (0.32 | ) | | | (0.29 | ) | |
| From net realized gains | | | — | | | | (0.01 | ) | | | (0.03 | ) | | | (0.01 | ) | | | — | | |
| Total Distributions to Shareholders | | | (0.33 | ) | | | (0.31 | ) | | | (0.34 | ) | | | (0.33 | ) | | | (0.29 | ) | |
| Net Asset Value, End of Period | | $ | 10.52 | | | $ | 11.05 | | | $ | 11.21 | | | $ | 11.20 | | | $ | 11.54 | | |
| Total return (b) | | | (1.88 | )%(c) | | | 1.35 | % | | | 3.21 | % | | | (0.12 | )%(c) | | | 3.13 | % | |
| Ratios to Average Net Assets/Supplemental Data: | |
| Net expenses (d) | | | 1.50 | % | | | 1.86 | % | | | 1.77 | % | | | 1.72 | % | | | 1.81 | % | |
| Waiver/Reimbursement | | | 0.27 | % | | | — | | | | — | | | | — | %(e) | | | — | | |
| Net investment income (d) | | | 3.00 | % | | | 2.73 | % | | | 2.82 | % | | | 2.75 | % | | | 2.58 | % | |
| Portfolio turnover rate | | | 14 | % | | | 11 | % | | | 10 | % | | | 12 | % | | | 11 | % | |
| Net assets, end of period (000's) | | $ | 307 | | | $ | 303 | | | $ | 638 | | | $ | 899 | | | $ | 981 | | |
(a) Per share data was calculated using the average shares outstanding during the period.
(b) Total return at net asset value assuming all distributions reinvested and no contingent deferred sales charge.
(c) Had the investment advisor and/or any of its affiliates not waived fees or reimbursed a portion of expenses, total return would have been reduced.
(d) The benefits derived from expense reductions has an impact of less than 0.01%.
(e) Rounds to less than 0.01%.
See Accompanying Notes to Financial Statements.
134
Financial Highlights – Columbia Rhode Island Intermediate Municipal Bond Fund
Selected data for a share outstanding throughout each period is as follows:
| | | Year Ended October 31, | |
| Class C Shares | | 2008 | | 2007 | | 2006 | | 2005 | | 2004 | |
| Net Asset Value, Beginning of Period | | $ | 11.05 | | | $ | 11.21 | | | $ | 11.20 | | | $ | 11.54 | | | $ | 11.48 | | |
| Income from Investment Operations: | |
| Net investment income (a) | | | 0.37 | | | | 0.34 | | | | 0.35 | | | | 0.35 | | | | 0.33 | | |
Net realized and unrealized gain (loss)
on investments and futures contracts | | | (0.53 | ) | | | (0.15 | ) | | | 0.04 | | | | (0.32 | ) | | | 0.06 | | |
| Total from Investment Operations | | | (0.16 | ) | | | 0.19 | | | | 0.39 | | | | 0.03 | | | | 0.39 | | |
| Less Distributions to Shareholders: | |
| From net investment income | | | (0.37 | ) | | | (0.34 | ) | | | (0.35 | ) | | | (0.36 | ) | | | (0.33 | ) | |
| From net realized gains | | | — | | | | (0.01 | ) | | | (0.03 | ) | | | (0.01 | ) | | | — | | |
| Total Distributions to Shareholders | | | (0.37 | ) | | | (0.35 | ) | | | (0.38 | ) | | | (0.37 | ) | | | (0.33 | ) | |
| Net Asset Value, End of Period | | $ | 10.52 | | | $ | 11.05 | | | $ | 11.21 | | | $ | 11.20 | | | $ | 11.54 | | |
| Total return (b)(c) | | | (1.54 | )% | | | 1.70 | % | | | 3.57 | % | | | 0.23 | % | | | 3.49 | % | |
| Ratios to Average Net Assets/Supplemental Data: | |
| Net expenses (d) | | | 1.15 | % | | | 1.51 | % | | | 1.42 | % | | | 1.37 | % | | | 1.46 | % | |
| Waiver/Reimbursement | | | 0.62 | % | | | 0.35 | % | | | 0.35 | % | | | 0.35 | % | | | 0.35 | % | |
| Net investment income (d) | | | 3.35 | % | | | 3.06 | % | | | 3.17 | % | | | 3.10 | % | | | 2.92 | % | |
| Portfolio turnover rate | | | 14 | % | | | 11 | % | | | 10 | % | | | 12 | % | | | 11 | % | |
| Net assets, end of period (000's) | | $ | 918 | | | $ | 825 | | | $ | 1,365 | | | $ | 1,487 | | | $ | 1,695 | | |
(a) Per share data was calculated using the average shares outstanding during the period.
(b) Total return at net asset value assuming all distributions reinvested and no contingent deferred sales charge.
(c) Had the investment advisor and/or any of its affiliates not waived fees or reimbursed a portion of expenses, total return would have been reduced.
(d) The benefits derived from expense reductions has an impact of less than 0.01%.
See Accompanying Notes to Financial Statements.
135
Financial Highlights – Columbia Rhode Island Intermediate Municipal Bond Fund
Selected data for a share outstanding throughout each period is as follows:
| | | Year Ended October 31, | |
| Class T Shares | | 2008 | | 2007 (a) | | 2006 | | 2005 | | 2004 | |
| Net Asset Value, Beginning of Period | | $ | 11.05 | | | $ | 11.21 | | | $ | 11.20 | | | $ | 11.54 | | | $ | 11.48 | | |
| Income from Investment Operations: | |
| Net investment income (b) | | | 0.44 | | | | 0.41 | | | | 0.42 | | | | 0.43 | | | | 0.41 | | |
Net realized and unrealized gain (loss)
on investments and futures contracts | | | (0.53 | ) | | | (0.15 | ) | | | 0.04 | | | | (0.33 | ) | | | 0.06 | | |
| Total from Investment Operations | | | (0.09 | ) | | | 0.26 | | | | 0.46 | | | | 0.10 | | | | 0.47 | | |
| Less Distributions to Shareholders: | |
| From net investment income | | | (0.44 | ) | | | (0.41 | ) | | | (0.42 | ) | | | (0.43 | ) | | | (0.41 | ) | |
| From net realized gains | | | — | | | | (0.01 | ) | | | (0.03 | ) | | | (0.01 | ) | | | — | | |
| Total Distributions to Shareholders | | | (0.44 | ) | | | (0.42 | ) | | | (0.45 | ) | | | (0.44 | ) | | | (0.41 | ) | |
| Net Asset Value, End of Period | | $ | 10.52 | | | $ | 11.05 | | | $ | 11.21 | | | $ | 11.20 | | | $ | 11.54 | | |
| Total return (c) | | | (0.89 | )%(d) | | | 2.36 | % | | | 4.25 | % | | | 0.88 | %(d) | | | 4.17 | % | |
| Ratios to Average Net Assets/Supplemental Data: | |
| Net expenses (e) | | | 0.50 | % | | | 0.86 | % | | | 0.77 | % | | | 0.72 | % | | | 0.81 | % | |
| Waiver/Reimbursement | | | 0.27 | % | | | — | | | | — | | | | — | %(f) | | | — | | |
| Net investment income (e) | | | 4.00 | % | | | 3.69 | % | | | 3.81 | % | | | 3.75 | % | | | 3.58 | % | |
| Portfolio turnover rate | | | 14 | % | | | 11 | % | | | 10 | % | | | 12 | % | | | 11 | % | |
| Net assets, end of period (000's) | | $ | 9,011 | | | $ | 10,852 | | | $ | 11,879 | | | $ | 12,284 | | | $ | 14,479 | | |
(a) On August 8, 2007, Class G shares were exchanged for Class T shares.
(b) Per share data was calculated using the average shares outstanding during the period.
(c) Total return at net asset value assuming all distributions reinvested and no initial sales charge or contingent deferred sales charge.
(d) Had the investment advisor and/or any of its affiliates not waived fees or reimbursed a portion of expenses, total return would have been reduced.
(e) The benefits derived from expense reductions has an impact of less than 0.01%.
(f) Rounds to less than 0.01%.
See Accompanying Notes to Financial Statements.
136
Financial Highlights – Columbia Rhode Island Intermediate Municipal Bond Fund
Selected data for a share outstanding throughout each period is as follows:
| | | Year Ended October 31, | |
| Class Z Shares | | 2008 | | 2007 | | 2006 | | 2005 | | 2004 | |
| Net Asset Value, Beginning of Period | | $ | 11.05 | | | $ | 11.21 | | | $ | 11.20 | | | $ | 11.54 | | | $ | 11.48 | | |
| Income from Investment Operations: | |
| Net investment income (a) | | | 0.44 | | | | 0.41 | | | | 0.42 | | | | 0.43 | | | | 0.41 | | |
Net realized and unrealized gain (loss)
on investments and futures contracts | | | (0.53 | ) | | | (0.15 | ) | | | 0.04 | | | | (0.33 | ) | | | 0.06 | | |
| Total from Investment Operations | | | (0.09 | ) | | | 0.26 | | | | 0.46 | | | | 0.10 | | | | 0.47 | | |
| Less Distributions to Shareholders: | |
| From net investment income | | | (0.44 | ) | | | (0.41 | ) | | | (0.42 | ) | | | (0.43 | ) | | | (0.41 | ) | |
| From net realized gains | | | — | | | | (0.01 | ) | | | (0.03 | ) | | | (0.01 | ) | | | — | | |
| Total Distributions to Shareholders | | | (0.44 | ) | | | (0.42 | ) | | | (0.45 | ) | | | (0.44 | ) | | | (0.41 | ) | |
| Net Asset Value, End of Period | | $ | 10.52 | | | $ | 11.05 | | | $ | 11.21 | | | $ | 11.20 | | | $ | 11.54 | | |
| Total return (b) | | | (0.89 | )%(c) | | | 2.36 | % | | | 4.25 | % | | | 0.88 | %(c) | | | 4.17 | % | |
| Ratios to Average Net Assets/Supplemental Data: | |
| Net expenses (d) | | | 0.50 | % | | | 0.86 | % | | | 0.77 | % | | | 0.72 | % | | | 0.81 | % | |
| Waiver/Reimbursement | | | 0.27 | % | | | — | | | | — | | | | — | %(e) | | | — | | |
| Net investment income (d) | | | 4.01 | % | | | 3.69 | % | | | 3.81 | % | | | 3.75 | % | | | 3.58 | % | |
| Portfolio turnover rate | | | 14 | % | | | 11 | % | | | 10 | % | | | 12 | % | | | 11 | % | |
| Net assets, end of period (000's) | | $ | 99,493 | | | $ | 103,512 | | | $ | 103,708 | | | $ | 104,062 | | | $ | 109,050 | | |
(a) Per share data was calculated using the average shares outstanding during the period.
(b) Total return at net asset value assuming all distributions reinvested.
(c) Had the investment advisor and/or any of its affiliates not waived fees or reimbursed a portion of expenses, total return would have been reduced.
(d) The benefits derived from expense reductions has an impact of less than 0.01%.
(e) Rounds to less than 0.01%.
See Accompanying Notes to Financial Statements.
137
Notes to Financial Statements – Columbia Tax-Exempt Bond Funds
October 31, 2008
Note 1. Organization
Columbia Funds Series Trust I (the "Trust") is a Massachusetts business trust registered under the Investment Company Act of 1940, as amended (the "1940 Act"), as an open-end management investment company. Information presented in these financial statements pertains to the following series of the Trust (individually referred to as a "Fund", and collectively referred to as the "Funds"):
Columbia Connecticut Intermediate Municipal Bond Fund ("Connecticut")
Columbia Intermediate Municipal Bond Fund ("Intermediate Municipal")
Columbia Massachusetts Intermediate Municipal Bond Fund ("Massachusetts")
Columbia New Jersey Intermediate Municipal Bond Fund ("New Jersey")
Columbia New York Intermediate Municipal Bond Fund ("New York")
Columbia Rhode Island Intermediate Municipal Bond Fund ("Rhode Island")
On May 5, 2008, Intermediate Municipal and New York acquired all the assets and liabilities of Intermediate-Term Tax-Exempt Fund and New York Intermediate-Term Tax-Exempt Fund (collectively, the "Acquired Funds"), respectively. The Acquired Funds were each a series of Excelsior Tax-Exempt Funds, Inc.
Investment Objectives
Each Fund, with the exception of Intermediate Municipal, seeks as high a level of current interest income exempt from federal income tax and, to the extent possible, from the individual income tax of its state, as is consistent with relative stability of principal. Intermediate Municipal seeks current income exempt from federal income tax, consistent with preservation of principal. All Funds are non-diversified investment companies, except for Intermediate Municipal and New Jersey which are diversified investment companies.
Fund Shares
The Trust may issue an unlimited number of shares, and each Fund offers five classes of shares: Class A, Class B, Class C, Class T and Class Z. Each share class has its own expense structure and sales charges, as applicable.
Class A and Class T shares are subject to a maximum front-end sales charge of 3.25% and 4.75%, respectively, based on the amount of initial investment. Class A and Class T shares purchased without an initial sales charge in accounts aggregating $1 million to $50 million at the time of purchase are subject to a 1.00% contingent deferred sales charge ("CDSC") if the shares are sold within one year after purchase. Class B shares are subject to a maximum CDSC of 3.00% based upon the holding period after purchase. Class B shares will convert to Class A shares eight years after purchase. Class C shares are subject to a 1.00% CDSC on shares sold within one year after purchase. Class Z shares are offered continuously at net asset value. There are certain restrictions on the purchase of Class T and Class Z shares, as described in each Fund's prospectus.
Note 2. Significant Accounting Policies
The preparation of financial statements in accordance with accounting principles generally accepted in the United States of America ("GAAP") requires management to make certain estimates and assumptions that affect the reported amounts of assets and liabilities, the disclosure of contingent assets and liabilities at the date of the financial statements and the reported amounts of revenue and expenses during the reporting period. Actual results could differ from those estimates. The following is a summary of significant accounting policies consistently followed by the Funds in the preparation of their financial statements.
Security Valuation
Debt securities generally are valued by pricing services approved by the Trust's Board of Trustees, based upon market transactions for normal, institutional-size trading units of similar securities. The services may use various pricing techniques which take into account appropriate factors such as yield, quality, coupon rate, maturity, type of issue, trading characteristics and other data, as well as broker quotes. Debt securities for which quotations are readily available are valued at an over-the-counter or exchange bid quotation. Certain debt securities, which tend to be more thinly traded and of lesser quality, are priced based on fundamental analysis of the financial condition of the issuer and the estimated value of any collateral. Valuations developed through pricing techniques may vary from the actual amounts realized upon sale of the
138
Columbia Tax-Exempt Bond Funds, October 31, 2008 (continued)
securities, and the potential variation may be greater for those securities valued using fundamental analysis.
Short-term debt obligations maturing within 60 days are valued at amortized cost, which approximates market value.
Investments in other open-end investment companies are valued at net asset value.
Futures contracts are valued at the settlement price established each day by the board of trade or exchange on which they are traded.
Investments for which market quotations are not readily available, or that have quotations which management believes are not reliable, are valued at fair value as determined in good faith under consistently applied procedures established by and under the general supervision of the Board of Trustees. If a security is valued at fair value, such value is likely to be different from the last quoted market price for the security.
In September 2006, Statement of Financial Accounting Standards No. 157, Fair Value Measurements ("SFAS 157"), was issued. SFAS 157 is effective for fiscal years beginning after November 15, 2007. SFAS 157 defines fair value, establishes a framework for measuring fair value and expands disclosures about fair value measurements. Management is evaluating the impact the application of SFAS 157 will have on each Fund's financial statement disclosures.
Security Transactions
Security transactions are accounted for on the trade date. Cost is determined and gains (losses) are based upon the specific identification method for both financial statement and federal income tax purposes.
In March 2008, Statement of Financial Accounting Standards No. 161, Disclosures about Derivative Instruments and Hedging Activities—an amendment of FASB Statement No. 133 ("SFAS 161"), was issued. SFAS 161 is effective for fiscal years and interim periods beginning after November 15, 2008. SFAS 161 requires additional discussion about the reporting entity's derivative instruments and hedging activities, by providing for qualitative disclosures about the objectives and strategies for using derivatives, quantitative data about the fair value of and gains and losses on derivative contracts, and details of credit-risk-related contingent features in their hedged positions. Management is evaluating the impact the application of SFAS 161 will have on the Funds' financial statement d isclosures.
In September 2008, FASB Staff Position 133-1 and FIN 45-4, Disclosures about Credit Derivatives and Certain Guarantees: An Amendment of FASB Statement No. 133 and FASB Interpretation No. 45 and Clarification of the Effective Date of FASB Statement No. 161 ( "Amendment"), was issued and is effective for annual and interim reporting periods ending after November 15, 2008. The Amendment requires enhanced disclosures regarding a fund's credit derivatives and hybrid financial instruments containing embedded credit derivatives. Management is currently evaluating the impact the adoption of the Amendment will have on the Funds' financial statement disclosures.
Futures Contracts
The Funds may invest in futures for both hedging and non-hedging purposes, including, for example, to seek enhanced returns or as a substitute for a position in an underlying asset.
The use of futures contracts involves certain risks, which include: (1) imperfect correlation between the price movement of the instruments and the underlying securities, (2) inability to close out positions due to differing trading hours, or the temporary absence of a liquid market, for either the instruments or the underlying securities, or (3) an inaccurate prediction of the future direction of interest rates by Columbia Management Advisors, LLC ("Columbia"), the Funds' investment advisor. Any of these risks may involve amounts exceeding the variation margin recorded in the Funds' Statements of Assets and Liabilities at any given time.
Upon entering into a futures contract, a Fund pledges cash or securities with the broker in an amount sufficient to meet the initial margin requirement. Subsequent payments are made or received by a Fund equal to the daily change in the contract value and are recorded as variation margin receivable or payable and offset in unrealized gains or losses. A Fund recognizes a realized gain or loss when the contract is closed or expires.
Delayed Delivery Securities
Each Fund may trade securities on other than normal settlement terms, including securities purchased or sold on a "when-issued" basis. This may increase the risk if the other party to the transaction fails to deliver and causes the Funds to subsequently invest at less advantageous prices. Each Fund
139
Columbia Tax-Exempt Bond Funds, October 31, 2008 (continued)
holds until the settlement date, in a segregated account, cash or liquid securities in an amount equal to the delayed delivery commitment.
Income Recognition
Interest income is recorded on the accrual basis. Premium and discount are amortized and accreted, respectively, on all debt securities, unless otherwise noted. Original issue discount is accreted to interest income over the life of the security with a corresponding increase in the cost basis. Dividend income is recorded on the ex-date.
Expenses
General expenses of the Trust are allocated to the Funds and other series of the Trust based upon relative net assets or other expense allocation methodologies determined by the nature of the expense. Expenses directly attributable to a Fund are charged to such Fund.
Determination of Class Net Asset Value
All income, expenses (other than class-specific expenses, as shown on the Statements of Operations) and realized and unrealized gains (losses) are allocated to each class of a Fund on a daily basis for purposes of determining the net asset value of each class. Income and expenses are allocated to each class based on the settled shares method, while realized and unrealized gains (losses) are allocated based on the relative net assets of each class.
Federal Income Tax Status
Each Fund intends to qualify each year as a "regulated investment company" under Subchapter M of the Internal Revenue Code, as amended, and will distribute substantially all of its tax-exempt or taxable income, if any, for its tax year, and as such will not be subject to federal income taxes. In addition, each Fund intends to distribute in each calendar year substantially all of its net investment income, capital gains and certain other amounts, if any, such that each Fund should not be subject to federal excise tax. Therefore, no federal income or excise tax provision is recorded.
Distributions to Shareholders
Distributions from net investment income are declared daily and distributed monthly. Net realized capital gains, if any, are distributed at least annually. Income distributions and capital gain distributions are determined in accordance with federal income tax regulations which may differ from GAAP.
Indemnification
In the normal course of business, each Fund enters into contracts that contain a variety of representations and warranties and which provide general indemnities. A Fund's maximum exposure under these arrangements is unknown because this would involve future claims against a Fund. Also, under the Trust's organizational documents and by contract, the Trustees and officers of the Trust are indemnified against certain liabilities that may arise out of actions relating to their duties to the Trust. However, based on experience, the Funds expect the risk of loss due to these representations, warranties and indemnities to be minimal.
Note 3. Federal Tax Information
The timing and character of income and capital gain distributions are determined in accordance with income tax regulations, which may differ from GAAP. Reclassifications are made to each Fund's capital accounts for permanent tax differences to reflect income and gains available for distribution (or available capital loss carryforwards) under income tax regulations.
For the year ended October 31, 2008, permanent book and tax basis differences resulting primarily from differing treatments for distributions and amortization/accretion adjustments on debt securities were identified and reclassified among the components of each Fund's net assets as follows:
| | | Undistributed
Net Investment
Income | | Accumulated
Net Realized
Gain (Loss) | | Paid-In Capital | |
| Connecticut | | $ | — | | | $ | 227,161 | | | $ | (227,161 | ) | |
| Intermediate Municipal | | | (9,745 | ) | | | (786,996 | ) | | | 796,741 | | |
| Massachusetts | | | (39,481 | ) | | | 39,481 | | | | — | | |
140
Columbia Tax-Exempt Bond Funds, October 31, 2008 (continued)
| | | Undistributed
Net Investment
Income | | Accumulated
Net Realized
Gain (Loss) | | Paid-In Capital | |
| New Jersey | | $ | (5,158 | ) | | $ | 5,157 | | | $ | 1 | | |
| New York | | | — | | | | (864,305 | ) | | | 864,305 | | |
| Rhode Island | | | (9,559 | ) | | | 9,559 | | | | — | | |
Net investment income and net realized gains (losses), as disclosed on the Statements of Operations, and net assets were not affected by these reclassifications.
The tax character of distributions paid during the years ended October 31, 2008 and October 31, 2007 was as follows:
| | | October 31, 2008 | |
| | | Tax-Exempt
Income | | Ordinary
Income* | | Long-Term
Capital Gains | |
| Connecticut | | $ | 7,178,910 | | | $ | — | | | $ | — | | |
| Intermediate Municipal | | | 96,828,789 | | | | 182,659 | | | | — | | |
| Massachusetts | | | 12,237,125 | | | | — | | | | 86,355 | | |
| New Jersey | | | 2,631,791 | | | | — | | | | — | | |
| New York | | | 8,426,813 | | | | 35,719 | | | | — | | |
| Rhode Island | | | 4,685,265 | | | | — | | | | — | | |
| | | October 31, 2007 | |
| | | Tax-Exempt
Income | | Ordinary
Income* | | Long-Term
Capital Gains | |
| Connecticut | | $ | 6,067,913 | | | $ | — | | | $ | — | | |
| Intermediate Municipal | | | 93,013,255 | | | | 562,736 | | | | — | | |
| Massachusetts | | | 10,783,089 | | | | — | | | | 394,953 | | |
| New Jersey | | | 2,204,043 | | | | — | | | | 195,311 | | |
| New York | | | 5,096,434 | | | | — | | | | 22,502 | | |
| Rhode Island | | | 4,322,177 | | | | — | | | | 86,776 | | |
* For tax purposes short-term capital gain distributions, if any, are considered ordinary income distributions.
As of October 31, 2008, the components of distributable earnings on a tax basis were as follows:
| | | Undistributed
Tax-Exempt
Income | | Undistributed
Ordinary
Income | | Undistributed
Long-Term
Capital Gains | | Net Unrealized
Depreciation* | |
| Connecticut | | $ | 720,385 | | | $ | — | | | $ | — | | | $ | (7,438,812 | ) | |
| Intermediate Municipal | | | 9,292,781 | | | | — | | | | — | | | | (99,610,422 | ) | |
| Massachusetts | | | 910,091 | | | | — | | | | — | | | | (8,506,306 | ) | |
141
Columbia Tax-Exempt Bond Funds, October 31, 2008 (continued)
| | | Undistributed
Tax-Exempt
Income | | Undistributed
Ordinary
Income | | Undistributed
Long-Term
Capital Gains | | Net Unrealized
Depreciation* | |
| New Jersey | | $ | 201,363 | | | $ | — | | | $ | — | | | $ | (1,916,829 | ) | |
| New York | | | 941,453 | | | | — | | | | — | | | | (8,765,716 | ) | |
| Rhode Island | | | 349,484 | | | | — | | | | — | | | | (2,382,683 | ) | |
* The differences between book-basis and tax-basis net unrealized appreciation/depreciation are primarily due to discount accretion/premium amortization on debt securities.
Unrealized appreciation and depreciation at October 31, 2008, based on cost of investments for federal income tax purposes, were:
| | | Unrealized
Appreciation | | Unrealized
Depreciation | | Net
Unrealized
Depreciation | |
| Connecticut | | $ | 2,542,389 | | | $ | (9,981,201 | ) | | $ | (7,438,812 | ) | |
| Intermediate Municipal | | | 29,087,924 | | | | (128,698,346 | ) | | | (99,610,422 | ) | |
| Massachusetts | | | 3,609,958 | | | | (12,116,264 | ) | | | (8,506,306 | ) | |
| New Jersey | | | 1,090,204 | | | | (3,007,033 | ) | | | (1,916,829 | ) | |
| New York | | | 3,999,513 | | | | (12,765,229 | ) | | | (8,765,716 | ) | |
| Rhode Island | | | 1,724,326 | | | | (4,107,009 | ) | | | (2,382,683 | ) | |
The following capital loss carryforwards, determined as of October 31, 2008, may be available to reduce taxable income arising from future net realized gains on investments, if any, to the extent permitted by the Internal Revenue Code:
| | | Year of Expiration | |
| | | 2012 | | 2013 | | 2014 | | 2015 | | 2016 | | Total | |
| Connecticut | | $ | — | | | $ | — | | | $ | — | | | $ | 160,577 | | | $ | 254,849 | | | $ | 415,426 | | |
| Intermediate Municipal | | | — | | | | 1,549,704 | | | | 183,686 | | | | 1,157,101 | | | | 3,404,128 | | | | 6,294,619 | | |
| Massachusetts | | | — | | | | — | | | | — | | | | — | | | | 327,878 | | | | 327,878 | | |
| New Jersey | | | — | | | | — | | | | — | | | | 16,265 | | | | 57,516 | | | | 73,781 | | |
| New York | | | 92,115 | | | | 580,517 | | | | 131,725 | | | | 89,191 | | | | — | | | | 893,548 | | |
| Rhode Island | | | — | | | | — | | | | — | | | | 129,446 | | | | — | | | | 129,446 | | |
Of the capital loss carryforwards attributable to Intermediate Municipal, $1,733,390 ($1,549,704 and $183,686 will expire on October 31, 2013 and October 31, 2014, respectively) was acquired from fund mergers, all of which remains. The availability of a portion of the remaining capital loss carryforwards acquired as a part of a fund merger may be limited in a given year.
Of the capital loss carryforwards attributable to (referenced in Note 1 above and Note 10 below) New York, $804,357 ($92,115, $580,517 and $131,725 will expire on October 31, 2012, October 31, 2013 and October 31, 2014, respectively) were acquired from the merger with New York Intermediate-Term Tax-Exempt Fund.
Capital loss carryforwards utilized/expired during the year ended October 31, 2008 were:
| Connecticut | | $ | 227,160 | | |
| Intermediate Municipal | | | 176,491 | | |
| New York | | | 122,240 | | |
| Rhode Island | | | 6,445 | | |
142
Columbia Tax-Exempt Bond Funds, October 31, 2008 (continued)
The availability of a portion of the capital loss carryforwards acquired by the Intermediate Municipal Bond Fund and New York Intermediate Municipal Bond Fund as a result of the merger with Intermediate-Term Tax-Exempt Fund and New York Intermediate-Term Tax-Exempt Fund, respectively, may be limited in a given year.
Any capital loss carryforwards acquired as part of a merger that are permanently lost due to provisions under the Internal Revenue Code are included as being expired. Expired capital loss carryforwards are recorded as a reduction of paid-in capital.
The Funds adopted Financial Accounting Standards Board ("FASB") Interpretation No. 48, Accounting for Uncertainty in Income Taxes—an Interpretation of FASB Statement No. 109 ("FIN 48"), effective April 30, 2008. FIN 48 requires management to determine whether a tax position of the Funds is more likely than not to be sustained upon examination by the applicable taxing authority, including resolution of any related appeals or litigation processes, based on the technical merits of the position. The tax benefit to be recognized is measured as the largest amount of benefit that is greater than fifty percent likely of being realized upon ultimate settlement. FIN 48 was applied to all existing tax positions upon initial adoption. Management has evaluated the known implications of FI N 48 on its computation of net assets for each Fund. As a result of this evaluation, management has concluded that FIN 48 did not have any effect on the Funds' financial statements and no cumulative effect adjustments were recorded. However, management's conclusions regarding FIN 48 may be subject to review and adjustment at a later date based on factors including, but not limited to, further implementation guidance from the FASB, new tax laws, regulations, and administrative interpretations (including relevant court decisions). The Funds' federal tax returns for the prior three fiscal years remain subject to examination by the Internal Revenue Service. The Funds are not aware of any tax positions for which it is reasonably possible that the total amounts of unrecognized tax benefits will significantly change in the next twelve months.
Note 4. Fees and Compensation Paid to Affiliates
Investment Advisory Fee
Columbia, an indirect, wholly owned subsidiary of Bank of America Corporation ("BOA"), provides investment advisory services to the Funds. Columbia receives a monthly investment advisory fee based on each Fund's average daily net assets as follows:
| Average Daily Net Assets | | Annual Fee Rate | |
| First $500 million | | | 0.48 | % | |
| $500 million to $1 billion | | | 0.43 | % | |
| $1 billion to $1.5 billion | | | 0.40 | % | |
| $1.5 billion to $3 billion | | | 0.37 | % | |
| $3 billion to $6 billion | | | 0.36 | % | |
| Over $6 billion | | | 0.35 | % | |
For the year ended October 31, 2008, the effective investment advisory fee rates for each Fund, as a percentage of each Fund's average daily net assets, were as follows:
| | | Effective
Fee Rate | |
| Connecticut | | | 0.48 | % | |
| Intermediate Municipal | | | 0.41 | % | |
| Massachusetts | | | 0.48 | % | |
| New Jersey | | | 0.48 | % | |
| New York | | | 0.48 | % | |
| Rhode Island | | | 0.48 | % | |
Administration Fee
Columbia provides administrative and other services to the Funds for a monthly administration fee at the annual rate of 0.067% of each Fund's average daily net assets.
Pricing and Bookkeeping Fees
The Funds have entered into a Financial Reporting Services Agreement (the "Financial Reporting Services Agreement") with State Street Bank & Trust Company ("State Street") and Columbia pursuant to which State Street provides financial reporting services to the Funds. The Funds have also entered into an Accounting Services Agreement (collectively with the Financial Reporting Services Agreement, the "State Street Agreements") with State Street and Columbia pursuant to which State Street provides accounting services to the Funds. Under the State Street Agreements, each Fund pays
143
Columbia Tax-Exempt Bond Funds, October 31, 2008 (continued)
State Street an annual fee of $38,000 paid monthly plus an additional monthly fee based on an annualized percentage rate of average daily net assets of each Fund for the month. The aggregate fee per Fund will not exceed $140,000 per year (exclusive of out-of-pocket expenses and charges). The Funds also reimburse State Street for certain out-of-pocket expenses and charges.
The Funds have entered into a Pricing and Bookkeeping Oversight and Services Agreement (the "Services Agreement") with Columbia. Under the Services Agreement, Columbia provides services related to Fund expenses and the requirements of the Sarbanes-Oxley Act of 2002, and provides oversight of the accounting and financial reporting services provided by State Street. Under the Services Agreement, the Funds reimburse Columbia for out-of-pocket expenses.
For the year ended October 31, 2008, the amounts charged to the Funds by affiliates included in the Statements of Operations under "Pricing and bookkeeping fees" were as follows:
| | | Amounts
Charged
by Affiliates | |
| Connecticut | | $ | 1,952 | | |
| Intermediate Municipal | | | 1,952 | | |
| Massachusetts | | | 1,952 | | |
| New Jersey | | | 1,952 | | |
| New York | | | 1,952 | | |
| Rhode Island | | | 1,952 | | |
Transfer Agent Fee
Columbia Management Services, Inc. (the "Transfer Agent"), an affiliate of Columbia and an indirect, wholly owned subsidiary of BOA, provides shareholder services to the Funds and has contracted with Boston Financial Data Services ("BFDS") to serve as sub-transfer agent. The Transfer Agent is entitled to receive a fee for its services, paid monthly, at the annual rate of $17.34 per open account plus reimbursement of certain sub-transfer agent fees paid by the Transfer Agent (exclusive of BFDS fees), calculated based on assets held in omnibus accounts and intended to recover the cost of payments to other parties (including affiliates of BOA) for services to those accounts. The Transfer Agent pays the fees of BFDS for services as sub-transfer agent and is not entitled to reimbursement for such fees from the Funds. The Transfer Agent may also retain, as additional compensation for its services, fees for wire, telephone and redempti on orders, Individual Retirement Account ("IRA") trustee agent fees and account transcript fees due to the Transfer Agent from shareholders of the Funds and credits (net of bank charges) earned with respect to balances in accounts the Transfer Agent maintains in connection with its services to the Funds. The Transfer Agent also receives reimbursement for certain out-of-pocket expenses.
An annual minimum account balance fee of $20 may apply to certain accounts with a value below each Fund's initial minimum investment requirements to reduce the impact of small accounts on transfer agent fees. These minimum account balance fees are recorded as part of expense reductions on the Statements of Operations. For the year ended October 31, 2008, these minimum account balance fees reduced total expenses of the Funds as follows:
| | | Minimum
Account
Balance Fees | |
| Connecticut | | $ | 200 | | |
| Intermediate Municipal | | | 1,680 | | |
| Massachusetts | | | 489 | | |
| New Jersey | | | 180 | | |
| New York | | | 540 | | |
| Rhode Island | | | 80 | | |
Underwriting Discounts, Service and Distribution Fees
Columbia Management Distributors, Inc. (the "Distributor"), an affiliate of Columbia and an indirect, wholly owned subsidiary of BOA, is the principal underwriter of the Funds' shares. For the year ended October 31, 2008, the Distributor has retained net
144
Columbia Tax-Exempt Bond Funds, October 31, 2008 (continued)
underwriting discounts on the sales of the Funds' Class A and Class T shares, and received net CDSC fees on Class A, Class B and Class C share redemptions as follows:
| | | Front-End Sales Charge | | CDSC | |
| | | Class A | | Class T | | Class A | | Class B | | Class C | |
| Connecticut | | $ | 1,521 | | | $ | 24 | | | $ | — | | | $ | 2,628 | | | $ | 757 | | |
| Intermediate Municipal | | | 2,714 | | | | 22 | | | | 250 | | | | 11,713 | | | | 1,149 | | |
| Massachusetts | | | 1,532 | | | | 418 | | | | — | | | | 2,432 | | | | 291 | | |
| New Jersey | | | 613 | | | | 59 | | | | — | | | | 4,129 | | | | 100 | | |
| New York | | | 860 | | | | 9 | | | | — | | | | 995 | | | | 417 | | |
| Rhode Island | | | 81 | | | | 2 | | | | — | | | | 1,653 | | | | — | | |
The Funds have adopted distribution and shareholder servicing plans (the "Plans") pursuant to Rule 12b-1 under the 1940 Act, which require the payment of distribution and service fees. The fees are intended to compensate the Distributor and/or eligible selling and/or servicing agents for selling shares of the Funds and providing services to investors. Payments under the Plans, which are calculated daily and paid monthly, are based on the average daily net assets of each Fund at the following annual rates:
| | | Distribution Fee | | Service Fee | |
| | | Class B | | Class C | | Class A | | Class B | | Class C | |
| Connecticut1 | | | 0.75 | % | | | 0.75 | % | | | 0.25 | % | | | 0.25 | % | | | 0.25 | % | |
| Intermediate Municipal2 | | | 0.65 | % | | | 0.65 | % | | | 0.20 | % | | | 0.20 | % | | | 0.20 | % | |
| Massachusetts1 | | | 0.75 | % | | | 0.75 | % | | | 0.25 | % | | | 0.25 | % | | | 0.25 | % | |
| New Jersey1 | | | 0.75 | % | | | 0.75 | % | | | 0.25 | % | | | 0.25 | % | | | 0.25 | % | |
| New York1 | | | 0.75 | % | | | 0.75 | % | | | 0.25 | % | | | 0.25 | % | | | 0.25 | % | |
| Rhode Island1 | | | 0.75 | % | | | 0.75 | % | | | 0.25 | % | | | 0.25 | % | | | 0.25 | % | |
1 The Distributor has voluntarily agreed to waive a portion of Class C shares distribution fee so that the combined distribution and service fees will not exceed 0.65% annually of average net assets. This arrangement can be modified or terminated by the Distributor at any time.
2 The Distributor has voluntarily agreed to waive a portion of Intermediate Municipal's Class C share distribution fee so that the combined distribution and service fees will not exceed 0.40% annually of average net assets. This arrangement can be modified or terminated by the Distributor at any time.
Shareholder Services Fee
Each Fund has adopted shareholder services plans that permit them to pay for certain services provided to Class T shareholders by their financial advisors. The Funds may pay shareholder service fees up to a maximum of 0.50% of each Fund's average daily net assets attributable to Class T shares (comprised of up to 0.25% for shareholder liaison services and up to 0.25% for administrative support services) but such fees will not exceed each Fund's net investment income attributable to Class T shares. Connecticut, Intermediate Municipal, Massachusetts, New Jersey and New York do not intend to pay more than 0.15% annually during the current fiscal year for Class T shareholder services fees. No fees were charged during the year ended October 31, 2008 under the Class T service plan with respect to Rhode Island.
Fee Waivers and Expense Reimbursements
Columbia has contractually agreed to waive fees and/or reimburse each Fund for certain expenses through February 28, 2009, so that total expenses (exclusive of distribution and service fees, brokerage commissions, interest, taxes and extraordinary expenses, but inclusive of custodial charges relating to overdrafts, if any), after giving effect to any balance credits from the Funds' custodian, will not exceed 0.50% annually of each
145
Columbia Tax-Exempt Bond Funds, October 31, 2008 (continued)
Fund's average daily net assets. There is no guarantee that these arrangements will continue after February 28, 2009.
Fees Paid to Officers and Trustees
All officers of the Funds are employees of Columbia or its affiliates and, with the exception of the Funds' Chief Compliance Officer, receive no compensation from the Funds. The Board of Trustees has appointed a Chief Compliance Officer to the Funds in accordance with federal securities regulations. The Funds, along with other affiliated funds, pay their pro-rata share of the expenses associated with the Chief Compliance Officer. Each Fund's expenses for the Chief Compliance Officer will not exceed $15,000 per year.
The Trust's eligible Trustees may participate in a deferred compensation plan which may be terminated at any time. Obligations of the plan will be paid solely out of the Funds' assets.
As a result of fund mergers, certain Funds assumed the liabilities of the deferred compensation plan of the acquired fund. The deferred compensation plan of the Acquired Funds may be terminated at any time. Any payments to plan participants are paid solely out of the Funds' assets.
Note 5. Custody Credits
Each Fund has an agreement with its custodian bank under which custody fees may be reduced by balance credits. These credits are recorded as part of expense reductions on the Statements of Operations. The Funds could have invested a portion of the assets utilized in connection with the expense offset arrangement in an income-producing asset if they had not entered into such an agreement.
For the year ended October 31, 2008, these custody credits reduced total expenses for the Funds as follows:
| | | Custody
Credits | |
| Connecticut | | $ | 4,054 | | |
| Intermediate Municipal | | | 15,399 | | |
| Massachusetts | | | 4,553 | | |
| New Jersey | | | 1,997 | | |
| New York | | | 2,198 | | |
| Rhode Island | | | 1,271 | | |
Note 6. Portfolio Information
For the year ended October 31, 2008, the cost of purchases and proceeds from sales of securities, excluding short-term obligations, for the Funds were as follows:
| | | Purchases | | Sales | |
| Connecticut | | $ | 45,814,315 | | | $ | 7,562,225 | | |
| Intermediate Municipal | | | 338,542,620 | | | | 473,825,401 | | |
| Massachusetts | | | 42,847,367 | | | | 30,705,085 | | |
| New Jersey | | | 6,065,814 | | | | 4,140,848 | | |
| New York | | | 38,799,273 | | | | 20,415,904 | | |
| Rhode Island | | | 15,950,780 | | | | 16,384,606 | | |
Note 7. Line of Credit
The Funds and other affiliated funds participate in a $280,000,000 committed, unsecured revolving line of credit. The maximum amount that may be borrowed by any fund is limited to the lesser of $200,000,000 and the Fund's borrowing limit set forth in the Fund's registration statement. Borrowings are available for short-term liquidity or temporary or emergency purposes.
Interest is charged to each participating fund based on the fund's borrowings at a rate per annum equal to the greater of the Federal Funds Rate plus 0.50% and the overnight LIBOR Rate plus 0.50%. In addition, an annual operations agency fee of $20,000, an amendment fee of 0.02% and a commitment fee of 0.12% per annum are accrued and apportioned among the participating funds pro rata based on their relative net assets.
Prior to October 16, 2008, the Funds and other affiliated funds participated in a $350,000,000 committed, unsecured revolving line of credit and a $150,000,000 uncommitted, unsecured line of credit, both provided by State Street. Interest on the committed line of credit was charged to each participating fund based on the fund's borrowings at a rate per annum equal to the Federal Funds Rate plus 0.50%. In addition, a commitment fee of 0.10% per annum was accrued and apportioned among the participating funds pro rata based on their relative net assets. Interest on the uncommitted line of credit was charged to each participating fund based on the fund's borrowings at a rate per annum equal to the Federal Funds Rate plus 0.375%. State Street charged an annual
146
Columbia Tax-Exempt Bond Funds, October 31, 2008 (continued)
operations agency fee of $40,000 for the committed line of credit and was able to charge an annual administration fee of $15,000 for the uncommitted line of credit. The commitment fee, the operations agency fee and the administration fee were accrued and apportioned among the participating funds pro rata based on their relative net assets.
For the year ended October 31, 2008, the Funds did not borrow under these arrangements.
Note 8. Shares of Beneficial Interest
As of October 31, 2008, the Funds had shareholders whose shares were beneficially owned by participant accounts over which BOA and/or any of its affiliates had either sole or joint investment discretion. The percentages of shares of beneficial interest outstanding held therein are as follows:
| | | % of Shares
Outstanding
Held | |
| Connecticut | | | 79.6 | | |
| Intermediate Municipal | | | 90.0 | | |
| Massachusetts | | | 80.6 | | |
| New Jersey | | | 78.5 | | |
| New York | | | 87.7 | | |
| Rhode Island | | | 84.6 | | |
As of October 31, 2008, Connecticut had one account that held 5.6% of the shares outstanding over which BOA and/or any of its affiliates did not have investment discretion.
Subscription and redemption activity of these accounts may have a significant effect on the operations of the Funds.
Note 9. Significant Risks and Contingencies
Non-Diversified Risk
Connecticut, Massachusetts, New York and Rhode Island are non-diversified funds, which generally mean that they may invest a greater percentage of their total assets in the securities of fewer issuers than a "diversified" fund. This increases the risk that a change in the value of any one investment held by a Fund could affect the overall value of the Fund more than it would affect that of a diversified fund holding a greater number of investments. Accordingly, the Funds' value will likely be more volatile than the value of more diversified funds. The Funds may not operate as non-diversified funds at all times.
Geographic Concentration Risk
Each of Connecticut, Intermediate Municipal, Massachusetts, New Jersey, New York and Rhode Island had greater than 5% of its total net assets on October 31, 2008, invested in debt obligations issued by its respective states and political subdivisions, agencies and public authorities, as well as in such obligations of Puerto Rico. The Funds are more susceptible to economic and political factors adversely affecting issuers of their respective state's and Puerto Rico's municipal securities than are municipal bond funds that are not concentrated to the same extent in these issuers.
Concentration of Credit Risk
Each of the Funds holds investments that are insured by private insurers who guarantee the payment of principal and interest in the event of default or that are supported by a letter of credit. At October 31, 2008, private insurers who insured greater than 5% of the total net assets of the Funds were as follows:
Connecticut
| Insurer | | % of Total
Net Assets | |
| MBIA Insurance Corp. | | | 20.8 | | |
| Financial Guaranty Insurance Co. | | | 12.3 | | |
| Financial Security Assurance, Inc. | | | 10.6 | | |
| AMBAC Assurance Corp. | | | 8.6 | | |
Intermediate Municipal
| Insurer | | % of Total
Net Assets | |
| MBIA Insurance Corp. | | | 17.1 | | |
| Financial Security Assurance, Inc. | | | 14.9 | | |
| AMBAC Assurance Corp. | | | 8.2 | | |
| Financial Guaranty Insurance Co. | | | 7.5 | | |
147
Columbia Tax-Exempt Bond Funds, October 31, 2008 (continued)
Massachusetts
| Insurer | | % of Total
Net Assets | |
| MBIA Insurance Corp. | | | 19.9 | | |
| AMBAC Assurance Corp | | | 13.2 | | |
| Financial Security Assurance, Inc. | | | 11.7 | | |
New Jersey
| Insurer | | % of Total
Net Assets | |
| AMBAC Assurance Corp. | | | 15.6 | | |
| Financial Guaranty Insurance Co. | | | 13.4 | | |
| Financial Security Assurance, Inc. | | | 12.5 | | |
| MBIA Insurance Corp. | | | 11.4 | | |
New York
| Insurer | | % of Total
Net Assets | |
| MBIA Insurance Corp. | | | 13.0 | | |
| AMBAC Assurance Corp. | | | 11.5 | | |
| Financial Security Assurance, Inc. | | | 11.2 | | |
| Financial Guaranty Insurance Co. | | | 8.1 | | |
Rhode Island
| Insurer | | % of Total
Net Assets | |
| Financial Security Assurance, Inc. | | | 29.2 | | |
| MBIA Insurance Corp. | | | 22.6 | | |
| AMBAC Assurance Corp. | | | 15.1 | | |
| Syncora Guarantee, Inc. | | | 6.7 | | |
| Financial Guaranty Insurance Co. | | | 5.5 | | |
At November 24, 2008, MBIA Insurance Corp., Financial Guaranty Insurance Co., AMBAC Assurance Corp., Financial Security Assurance, Inc. and Syncora Guarantee, Inc. were rated by Standard & Poor's AA, CCC, A, AAA and B, respectively.
Tax Development Risk
Each Fund purchases municipal securities whose interest, in the opinion of bond counsel, is free from federal income tax. There is no assurance that the Internal Revenue Service (IRS) will agree with this opinion. In the event the IRS determines that an issuer does not comply with relevant tax requirements, interest payments from a security could become federally taxable, possibly retroactively to the date the security was issued. As a shareholder of the Fund, you may be required to file an amended tax return as a result.
Legal Proceedings
On February 9, 2005, Columbia Management Advisors, Inc. (which has since merged into Banc of America Capital Management, LLC (now named Columbia Management Advisors, LLC)) ("Columbia") and Columbia Funds Distributor, Inc. (which has been renamed Columbia Management Distributors, Inc.) (the "Distributor") (collectively, the "Columbia Group") entered into an Assurance of Discontinuance with the New York Attorney General ("NYAG") (the "NYAG Settlement") and consented to the entry of a cease-and-desist order by the Securities and Exchange Commission ("SEC") (the "SEC Order") on matters relating to mutual fund trading.
Under the terms of the SEC Order, the Columbia Group agreed, among other things, to: pay $70 million in disgorgement and $70 million in civil money penalties; cease and desist from violations of the antifraud provisions and certain other provisions of the federal securities laws; maintain certain compliance and ethics oversight structures; retain an independent consultant to review the Columbia Group's applicable supervisory, compliance, control and other policies and procedures; and retain an independent distribution consultant (see below). The Columbia Funds have also voluntarily undertaken to implement certain governance measures designed to maintain the independence of their boards of trustees. The NYAG Settlement also, among other things, requires Columbia and its affiliates to reduce management fees for certain Columbia Funds (including the former Nations Funds) and other mutual funds collectively by $32 million per year f or five years, for a projected total of $160 million in management fee reductions.
Pursuant to the procedures set forth in the SEC Order, the $140 million in settlement amounts described above is being distributed in accordance with a distribution plan that was developed by an independent distribution consultant and approved by the SEC on April 6, 2007. Distributions under the distribution plan began in late June 2007.
148
Columbia Tax-Exempt Bond Funds, October 31, 2008 (continued)
A copy of the SEC Order is available on the SEC website at http://www.sec.gov. A copy of the NYAG Settlement is available as part of the Bank of America Corporation Form 8-K filing on February 10, 2005.
In connection with the events described above, various parties have filed suit against certain funds, the Trustees of the Columbia Funds, FleetBoston Financial Corporation and its affiliated entities and/or Bank of America and its affiliated entities.
On February 20, 2004, the Judicial Panel on Multidistrict Litigation transferred these cases and cases against other mutual fund companies based on similar allegations to the United States District Court in Maryland for consolidated or coordinated pretrial proceedings (the "MDL"). Subsequently, additional related cases were transferred to the MDL. On September 29, 2004, the plaintiffs in the MDL filed amended and consolidated complaints. One of these amended complaints is a putative class action that includes claims under the federal securities laws and state common law, and that names Columbia, the Distributor, the Trustees of the Columbia Funds, Bank of America Corporation and others as defendants. Another of the amended complaints is a derivative action purportedly on behalf of the Columbia Funds that asserts claims under federal securities laws and state common law.
On February 25, 2005, Columbia and other defendants filed motions to dismiss the claims in the pending cases. On March 1, 2006, for reasons stated in the court's memoranda dated November 3, 2005, the U.S. District Court for the District of Maryland granted in part and denied in part the defendants' motions to dismiss. The court dismissed all of the class action claims pending against the Columbia Funds Trusts. As to Columbia and the Distributor, the claims under the Securities Act of 1933, the claims under Sections 34(b) and 36(a) of the Investment Company Act of 1940 ("ICA") and the state law claims were dismissed. The claims under Sections 10(b) and 20(a) of the Securities Exchange Act of 1934 and claims under Section 36(b) of the ICA were not dismissed.
On March 21, 2005, a purported class action was filed in Massachusetts state court alleging that certain conduct, including market timing, entitled Class B shareholders in certain Columbia funds to an exemption from contingent deferred sales charges upon early redemption ("the CDSC Lawsuit"). The CDSC Lawsuit was removed to federal court in Massachusetts and transferred to the MDL.
On September 14, 2007, the plaintiffs and the Columbia defendants named in the MDL, including the Columbia Funds, entered into a stipulation of settlement with respect to all Columbia-related claims in the MDL described above, including the CDSC Lawsuit. The settlement is subject to court approval.
In 2004, the Columbia Funds' adviser and distributor and certain affiliated entities and individuals were named as defendants in certain purported shareholder class and derivative actions making claims, including claims under the Investment Company and the Investment Advisers Acts of 1940 and state law. Certain Columbia Funds were named as nominal defendants. The suits allege, inter alia, that the fees and expenses paid by the funds are excessive and that the advisers and their affiliates inappropriately used fund assets to distribute the funds and for other improper purposes. On March 2, 2005, the actions were consolidated in the Massachusetts federal court as In re Columbia Entities Litigation. The plaintiffs filed a consolidated amended complaint on June 9, 2005. On November 30, 2005, the judge dismissed all claims by plaintiffs and entered final judgment in favor of the defendants. The plaintiffs appealed to the United States Court of Appeals for the First Circuit on December 30, 2005. A stipulation and settlement agreement dated January 19, 2007 was filed in the First Circuit on February 14, 2007, with a joint stipulation of dismissal and motion for remand to obtain district court approval of the settlement. That joint motion was granted and the appeal was dismissed. On March 6, 2007, the case was remanded to the District Court. The settlement, approved by the District Court on September 18, 2007, became effective October 19, 2007. Pursuant to the settlement, the funds' adviser and/or its affiliates made certain payments, including plaintiffs' attorneys' fees and costs of notice to class members.
149
Columbia Tax-Exempt Bond Funds, October 31, 2008 (continued)
Note 10. Business Combinations and Mergers
On May 5, 2008, Intermediate-Term Tax-Exempt Fund, a series of Excelsior Tax-Exempt Funds, Inc., merged into Columbia Intermediate Municipal Bond Fund. Columbia Intermediate Municipal Bond Fund received a tax-free transfer of assets from Intermediate-Term Tax-Exempt Fund as follows:
Class Z Shares
Issued | | Net Assets
Received | | Unrealized
Appreciation* | |
| | 36,795,116 | | | $ | 374,435,646 | | | $ | 1,901,189 | | |
Net Assets
of Columbia
Intermediate
Municipal
Bond Fund
Prior to
Combination | | Net Assets
of Intermediate-
Term Tax-Exempt
Fund Immediately
Prior to Combination | | Net Assets
of Columbia
Intermediate
Municipal
Bond Fund
Immediately
After Combination | |
| $ | 2,308,865,838 | | | $ | 374,435,646 | | | $ | 2,683,301,484 | | |
On May 5, 2008, New York Intermediate-Term Tax-Exempt Fund, a series of Excelsior Tax-Exempt Funds, Inc., merged into Columbia New York Intermediate Municipal Bond Fund. Columbia New York Intermediate Municipal Bond Fund received a tax-free transfer of assets from New York Intermediate-Term Tax-Exempt Fund as follows:
Class Z Shares
Issued | | Net Assets
Received | | Unrealized
Appreciation* | |
| | 12,980,728 | | | $ | 149,608,565 | | | $ | 1,194,768 | | |
Net Assets
of Columbia
New York
Intermediate
Municipal
Bond Fund
Prior to
Combination | | Net Assets
of New York
Intermediate-
Term Tax-Exempt
Fund Immediately
Prior to Combination | | Net Assets
of Columbia
New York
Intermediate
Municipal
Bond Fund
Immediately
After Combination | |
| $ | 157,874,795 | | | $ | 149,608,565 | | | $ | 307,483,360 | | |
* Unrealized appreciation is included in the Net Assets Received.
150
Report of Independent Registered Public Accounting Firm
To the Board of Trustees and the Shareholders of Columbia Funds Series Trust I
In our opinion, the accompanying statements of assets and liabilities, including the investment portfolios, and the related statements of operations and of changes in net assets and the financial highlights present fairly, in all material respects, the financial position of Columbia Connecticut Intermediate Municipal Bond Fund, Columbia Intermediate Municipal Bond Fund, Columbia Massachusetts Intermediate Municipal Bond Fund, Columbia New Jersey Intermediate Municipal Bond Fund, Columbia New York Intermediate Municipal Bond Fund and Columbia Rhode Island Intermediate Municipal Bond Fund (constituting part of Columbia Funds Series Trust I, hereafter collectively referred to as the "Funds") at October 31, 2008, the results of each of their operations for the year then ended, the changes in each of their net assets for each of the two years in the period then ended, and the financial highlights for each of the five years in the per iod then ended, in conformity with accounting principles generally accepted in the United States of America. These financial statements and financial highlights (hereafter referred to as "financial statements") are the responsibility of the Funds' management. Our responsibility is to express an opinion on these financial statements based on our audits. We conducted our audits of these financial statements in accordance with the standards of the Public Company Accounting Oversight Board (United States). Those standards require that we plan and perform the audits to obtain reasonable assurance about whether the financial statements are free of material misstatement. An audit includes examining, on a test basis, evidence supporting the amounts and disclosures in the financial statements, assessing the accounting principles used and significant estimates made by management, and evaluating the overall financial statement presentation. We believe that our audits, which included confirmation of securities at Octobe r 31, 2008 by correspondence with the custodian and brokers, provide a reasonable basis for our opinion.
PricewaterhouseCoopers LLP
Boston, Massachusetts
December 22, 2008
151
Federal Income Tax Information (Unaudited)
Columbia Connecticut Intermediate Municipal Bond Fund
100.0% of the distributions from net investment income will be treated as exempt income for federal income tax purposes.
Columbia Intermediate Municipal Bond Fund
99.9% of the distributions from net investment income will be treated as exempt income for federal income tax purposes.
Columbia Massachusetts Intermediate Municipal Bond Fund
100.0% of the distributions from net investment income will be treated as exempt income for federal income tax purposes.
Columbia New Jersey Intermediate Municipal Bond Fund
100.0% of the distributions from net investment income will be treated as exempt income for federal income tax purposes.
Columbia New York Intermediate Municipal Bond Fund
99.58% of the distributions from net investment income will be treated as exempt income for federal income tax purposes.
Columbia Rhode Island Intermediate Municipal Bond Fund
100.0% of the distributions from net investment income will be treated as exempt income for federal income tax purposes.
152
Fund Governance
The Trustees serve terms of indefinite duration. The names, addresses and ages of the Trustees and officers of the Funds in Columbia Funds Series Trust I, the year each was first elected or appointed to office, their principal business occupations during at least the last five years, the number of Funds overseen by each Trustee and other directorships they hold are shown below. Each officer listed below serves as an officer of each Fund in the Columbia Funds Complex.
Independent Trustees
Name, Address and Year of Birth,
Position with Funds, Year First
Elected or Appointed to Office | | Principal Occupation(s) During Past Five Years, Number of Funds in Columbia
Funds Complex Overseen by Trustee, Other Directorships Held
| |
| John D. Collins (Born 1938) | |
|
c/o Columbia Management Advisors, LLC
One Financial Center
Boston, MA 02111
Trustee1 (since 2007) | | Retired. Consultant, KPMG, LLP (accounting and tax firm) from July 1999 to June 2000; Partner, KPMG, LLP from March 1962 to June 1999. Oversees 80, Mrs. Fields Famous Brands LLC (consumer products); Suburban Propane Partners, L.P.; and Montpelier Re (underwriting firm) | |
|
| Rodman L. Drake (Born 1943) | |
|
c/o Columbia Management Advisors, LLC
One Financial Center
Boston, MA 02111
Trustee1 (since 2007) | | Co-Founder of Baringo Capital LLC (private equity) since 2002; President, Continuation Investments Group, Inc. from 1997 to 2001. Oversees 80, Jackson Hewitt Tax Service Inc. (tax preparation services); Crystal Capital River Inc. (real estate investment trust); Student Loan Corporation (student loan provider); Celgene Corporation (global biotechnology company); Apex Silver Mines Ltd. (mining); and Hyperion Brookfield Total Return Fund, Inc. and Hyperion Brookfield Strategic Mortgage Income Fund, Inc. (exchange-traded funds) | |
|
| Douglas A. Hacker (Born 1955) | |
|
c/o Columbia Management Advisors, LLC
One Financial Center
Boston, MA 02111
Trustee (since 1996) | | Independent business executive since May 2006; Executive Vice President—Strategy of United Airlines (airline) from December 2002 to May 2006; President of UAL Loyalty Services (airline marketing company) from September 2001 to December 2002; Executive Vice President and Chief Financial Officer of United Airlines from July 1999 to September 2001. Oversees 80, Nash Finch Company (food distributor); Aircastle Limited (aircraft leasing) | |
|
| Janet Langford Kelly (Born 1957) | |
|
c/o Columbia Management Advisors, LLC
One Financial Center
Boston, MA 02111
Trustee (since 1996) | | Senior Vice President, General Counsel and Corporate Secretary, ConocoPhillips (integrated energy company) since September 2007; Deputy General Counsel—Corporate Legal Services, ConocoPhillips from August 2006 to August 2007; Partner, Zelle, Hofmann, Voelbel, Mason & Gette LLP (law firm) from March 2005 to July 2006; Adjunct Professor of Law, Northwestern University, from September 2004 to June 2006; Director, UAL Corporation (airline) from February 2006 to July 2006; Chief Administrative Officer and Senior Vice President, Kmart Holding Corporation (consumer goods), from September 2003 to March 2004; Executive Vice President—Corporate Development a nd Administration, General Counsel and Secretary, Kellogg Company (food manufacturer), from September 1999 to August 2003. Oversees 80, None | |
|
153
Fund Governance (continued)
Independent Trustees (continued)
Name, Address and Year of Birth,
Position with Funds, Year First
Elected or Appointed to Office | | Principal Occupation(s) During Past Five Years, Number of Funds in Columbia
Funds Complex Overseen by Trustee, Other Directorships Held
| |
| Charles R. Nelson (Born 1942) | |
|
c/o Columbia Management Advisors, LLC
One Financial Center
Boston, MA 02111
Trustee (since 1981) | | Professor of Economics, University of Washington, since January 1976; Ford and Louisa Van Voorhis Professor of Political Economy, University of Washington, since September 1993; Director, Institute for Economic Research, University of Washington from September 2001 to June 2003; Adjunct Professor of Statistics, University of Washington, since September 1980; Associate Editor, Journal of Money Credit and Banking, since September 1993; Consultant on econometric and statistical matters. Oversees 80, None | |
|
| John J. Neuhauser (Born 1943) | |
|
c/o Columbia Management Advisors, LLC
One Financial Center
Boston, MA 02111
Trustee (since 1985) | | President, Saint Michael's College, since August 2007; University Professor, Boston College from November 2005 to August 2007; Academic Vice President and Dean of Faculties, Boston College from August 1999 to October 2005. Oversees 80, Liberty All-Star Equity Fund and Liberty All-Star Growth Fund, Inc. (closed-end funds) | |
|
| Jonathan Piel (Born 1938) | |
|
c/o Columbia Management Advisors, LLC
One Financial Center
Boston, MA 02111
Trustee1 (since 2007) | | Cable television producer and website designer; The Editor, Scientific American from 1984 to 1994; Vice President, Scientific American, Inc., from 1984 to 1994; Member, Advisory Board, Stone Age Institute, Bloomington, Indiana (research institute that explores the effect of technology on human evolution); Member, Board of Directors of the National Institute of Social Sciences, New York City; and Member, Board of Trustees of the William Alanson White Institute, New York City (institution for training psychoanalysts). Oversees 80, None | |
|
| Patrick J. Simpson (Born 1944) | |
|
c/o Columbia Management Advisors, LLC
One Financial Center
Boston, MA 02111
Trustee (since 2000) | | Partner, Perkins Coie LLP (law firm). Oversees 80, None | |
|
| Thomas C. Theobald (Born 1937) | |
|
c/o Columbia Management Advisors, LLC
One Financial Center
Boston, MA 02111
Trustee and
Chairman of the Board (since 1996) | | Partner and Senior Advisor, Chicago Growth Partners (private equity investing) since September 2004; Managing Director, William Blair Capital Partners (private equity investing) from September 1994 to September 2004. Oversees 80, Anixter International (network support equipment distributor); Ventas, Inc. (real estate investment trust); Jones Lang LaSalle (real estate management services); Ambac Financial Group (financial guaranty insurance) | |
|
| Anne-Lee Verville (Born 1945) | |
|
c/o Columbia Management Advisors, LLC
One Financial Center
Boston, MA 02111
Trustee (since 1998) | | Retired since 1997 (formerly General Manager—Global Education Industry (from 1994 to 1997), President—Application Systems Division (from 1991 to 1994), Chief Financial Officer—US Marketing & Services (from 1988 to 1991), and Chief Information Officer (from 1987 to 1988), IBM Corporation (computer and technology)). Oversees 80, None | |
|
154
Fund Governance (continued)
Interested Trustee
Name, Address and Year of Birth,
Position with Funds, Year First
Elected or Appointed to Office | | Principal Occupation(s) During Past Five Years, Number of Funds in Columbia
Funds Complex Overseen by Trustee, Other Directorships Held
| |
| William E. Mayer (Born 1940) | |
|
c/o Columbia Management Advisors, LLC
One Financial Center
Boston, MA 02111
Trustee2 (since 1994) | | Partner, Park Avenue Equity Partners (private equity) since February 1999; Dean and Professor, College of Business, University of Maryland from 1992 to 1997. Oversees 80, Lee Enterprises (print media), WR Hambrecht + Co. (financial service provider); BlackRock Kelso Capital Corporation (investment company) | |
|
1 Messrs. Drake, Piel and Collins have served as directors/trustees of the Excelsior Funds since 1996, 1996 and 2005, respectively. The Excelsior Funds consisted of 27 portfolios managed by affiliates of Columbia Management Advisors, LLC. Effective December 12, 2007, the Board elected Messrs. Drake, Piel and Collins as Trustees of the Trust.
2 Mr. Mayer is an "interested person" (as defined in the Investment Company Act of 1940) by reason of his affiliation with WR Hambrecht + Co., a registered broker/dealer that may execute portfolio transactions for or engage in principal transactions with the Funds or other funds or accounts advised/managed by the Advisor or other Bank of America affiliates.
The Statement of Additional Information includes additional information about the Trustees of the Funds and is available, without charge, upon request by calling 1-800-345-6611.
Officers
Name, Address and Year of Birth,
Position with Columbia Funds,
Year First Elected or
Appointed to Office | | Principal Occupation(s) During Past Five Years
| |
| Christopher L. Wilson (Born 1957) | |
|
One Financial Center
Boston, MA 02111
President (since 2004) | | President—Columbia Funds, since October 2004; Managing Director—Columbia Management Advisors, LLC, since September 2005; Senior Vice President—Columbia Management Distributors, Inc., since January 2005; Director—Columbia Management Services, Inc., since January 2005; Director—Bank of America Global Liquidity Funds, plc and Banc of America Capital Management (Ireland), Limited, since May 2005; Director—FIM Funding, Inc., since January 2005; President and Chief Executive Officer—CDC IXIS AM Services, Inc. (investment management), from September 1998 through August 2004; and a senior officer or director of various other Bank of America affiliated entities, including other registered and unregistered funds. | |
|
| James R. Bordewick, Jr. (Born 1959) | |
|
One Financial Center
Boston, MA 02111
Senior Vice President, Secretary and
Chief Legal Officer (since 2006) | | Associate General Counsel, Bank of America since April 2005; Senior Vice President and Associate General Counsel, MFS Investment Management (investment management) prior to April 2005. | |
|
155
Fund Governance (continued)
Officers (continued)
Name, Address and Year of Birth,
Position with Columbia Funds,
Year First Elected or
Appointed to Office | | Principal Occupation(s) During Past Five Years
| |
| J. Kevin Connaughton (Born 1964) | |
|
One Financial Center
Boston, MA 02111
Senior Vice President and
Chief Financial Officer (since 2000) | | Managing Director of Columbia Management Advisors, LLC since December 2004; Treasurer—Columbia Funds, from October 2003 to May 2008; Treasurer—the Liberty Funds, Stein Roe Funds and Liberty All-Star Funds, December 2000—December 2006; Senior Vice President—Columbia Management Advisors, LLC, from April 2003 to December 2004; President—Columbia Funds, Liberty Funds and Stein Roe Funds, February 2004 to October 2004; Treasurer—Galaxy Funds, September 2002 to December 2005; Treasurer, December 2002 to December 2004, and President, February 2004 to December 2004—Columbia Management Multi-Strategy Hedge Fund, LLC; and a senior officer of various other Bank of America-affiliated entities, including other registered and unregistered funds. | |
|
| Linda J. Wondrack (Born 1964) | |
|
One Financial Center
Boston, MA 02111
Senior Vice President and
Chief Compliance Officer (since 2007) | | Director (Columbia Management Group LLC and Investment Product Group Compliance), Bank of America since June 2005; Director of Corporate Compliance and Conflicts Officer, MFS Investment Management (investment management), August 2004 to May 2005; Managing Director, Deutsche Asset Management (investment management) prior to August 2004. | |
|
| Michael G. Clarke (Born 1969) | |
|
One Financial Center
Boston, MA 02111
Treasurer (since 2008) | | Director of Fund Administration of the Advisor since January 2006; Managing Director of the Advisor September 2004 to December 2005; Vice President Fund Administration June 2002 to September 2004. | |
|
| Jeffrey R. Coleman (Born 1969) | |
|
One Financial Center
Boston, MA 02111
Deputy Treasurer (since 2006) | | Director of Fund Administration of the Advisor since January 2006; Fund Controller of the Advisor from October 2004 to January 2006; Vice President of CDC IXIS Asset Management Services, Inc. (investment management) from August 2000 to September 2004. | |
|
| Joseph F. DiMaria (Born 1968) | |
|
One Financial Center
Boston, MA 02111
Chief Accounting Officer (since 2008) | | Director of Fund Administration of the Advisor since January 2006; Head of Tax/Compliance and Assistant Treasurer of the Advisor from November 2004 to December 2005; Director of Trustee Administration (Sarbanes-Oxley) of the Advisor from May 2003 to October 2004. | |
|
| Julian Quero (Born 1967) | |
|
One Financial Center
Boston, MA 02111
Deputy Treasurer (since 2008) | | Senior Tax Manager of the Advisor since August 2006; Senior Compliance Manager of the Advisor from April 2002 to August 2006. | |
|
| Barry S. Vallan (Born 1969) | |
|
One Financial Center
Boston, MA 02111
Controller (since 2006) | | Vice President—Fund Treasury of the Advisor since October 2004; Vice President—Trustee Reporting of the Advisor from April 2002 to October 2004 | |
|
156
Board Consideration and Approval of Advisory Agreements
The Advisory Fees and Expenses Committee of the Board of Trustees meets several times annually to review the advisory agreements (collectively, the "Agreements") of the funds for which the Trustees serve as trustees (each a "fund") and to determine whether to recommend that the full Board approve the continuation of the Agreements for an additional one-year period. After the Committee has made its recommendation, the full Board, including the Independent Trustees, determines whether to approve the continuation of the Agreements. In addition, the full Board, including the Independent Trustees, considers matters bearing on the Agreements at most of its other meetings throughout the year and meets regularly with senior management of the funds and Columbia, the funds' investment adviser, including the senior manager of each investment area within Columbia. Through the Board's Investment Oversight Committees, Trustees also meet with selected fund portfolio managers, research analysts and traders at various times throughout the year.
The Trustees receive and review all materials that they, their legal counsel or Columbia believe to be reasonably necessary for the Trustees to evaluate the Agreements and to determine whether to approve the continuation of the Agreements. Those materials generally include, among other items, (i) information on the investment performance of each fund relative to the performance of peer groups of mutual funds and the fund's performance benchmarks, and additional information assessing performance on a risk adjusted basis, (ii) information on each fund's advisory fees and other expenses, including information comparing the fund's expenses to those of peer groups of mutual funds and information about any applicable expense caps and fee "breakpoints," (iii) information about the profitability of the Agreements to Columbia, including potential "fall-out" or ancillary benefits that Columbia and its affiliates may receive as a result of their relationships with the funds and (iv) information obtained through Columbia's response to a questionnaire prepared at the request of the Trustees by counsel to the funds and independent legal counsel to the Independent Trustees. The Trustees also consider other information such as (v) Columbia's financial results and financial condition, (vi) each fund's investment objective and strategies and the size, education and experience of Columbia's investment staffs and their use of technology, external research and trading cost measurement tools, (vii) the allocation of the funds' brokerage and the use of "soft" commission dollars to pay for research products and services, (viii) Columbia's resources devoted to, and its record of compliance with, the funds' investment policies and restrictions, policies on personal securities transactions and other compliance policies and legal and regulatory requirements, (ix) Columbia's response to va rious legal and regulatory proceedings since 2003 and to the recent period of volatility in the securities markets and (x) the economic outlook generally and for the mutual fund industry in particular. In addition, the Advisory Fees and Expenses Committee confers with the funds' independent fee consultant and reviews materials relating to the funds' relationships with Columbia provided by the independent fee consultant. Throughout the process, the Trustees have the opportunity to ask questions of and to request additional materials from Columbia and to consult with the independent fee consultant and independent legal counsel to the Independent Trustees.
The Board of Trustees most recently approved the continuation of the Agreements at its October, 2008 meeting, following meetings of the Advisory Fees and Expenses Committee held in February, April, August, September and October, 2008. In considering whether to approve the continuation of the Agreements, the Trustees, including the Independent Trustees, did not identify any single factor as determinative, and each weighed various factors as he or she deemed appropriate. The Trustees considered the following matters in connection with their approval of the continuation of the Agreements:
The nature, extent and quality of the services provided to the funds under the Agreements. The Trustees considered the nature, extent and quality of the services provided by Columbia and its affiliates to the funds and the resources dedicated to the funds by Columbia and its affiliates. Among other things, the Trustees considered (i) Columbia's ability (including its personnel and other resources, compensation programs for personnel involved in fund management, reputation and other attributes) to attract, motivate and retain highly qualified research, advisory and supervisory investment professionals; (ii) the portfolio management services provided by those investment professionals; and (iii) the trade execution services provided on behalf of the funds. For each fund, the Trustees also considered the benefits to shareholders of investing in a mutual f und that is part of a family of funds offering exposure to a variety of asset classes
157
and investment disciplines and providing a variety of fund and shareholder services. After reviewing those and related factors, the Trustees concluded, within the context of their overall conclusions regarding each of the Agreements, that the nature, extent and quality of services provided supported the continuation of the Agreements.
Investment performance of the funds and Columbia. The Trustees reviewed information about the performance of each fund over various time periods, including information prepared by an independent third-party data provider that compared the performance of each fund to the performance of peer groups of mutual funds and performance benchmarks. The Trustees also reviewed a description of the third party's methodology for identifying each fund's peer group for purposes of performance and expense comparisons. The Trustees also considered additional information that the Advisory Fees and Expenses Committee requested from Columbia relating to funds that presented relatively weaker performance and/or relatively higher expenses. In the case of each fund whose performance lagged that of a relevant peer group for certain (although not necessarily all) periods, the Trustees concluded that other factors relevant to performance were sufficient, in light of other considerations, to warrant continuation of the fund's Agreements. Those factors varied from fund to fund, but included one or more of the following: (i) that the fund's performance, although lagging in certain recent periods, was stronger over the longer term; (ii) that the underperformance was attributable, to a significant extent, to investment decisions that were reasonable and consistent with the fund's investment strategy and policies and that the fund was performing within a reasonable range of expectations, given those investment decisions, market conditions and the fund's investment strategy; (iii) that the fund's performance was competitive when compared to other relevant performance benchmarks or peer groups; (iv) that Columbia had taken or was taking steps designed to help improve the fund's investment performance, including, but not limited to, replacing portfolio managers or modifying investment str ategies; and (v) that Columbia proposed to waive advisory fees or cap the expenses of the fund.
The Trustees noted the performance of each Fund through April 30, 2008 relative to that of a peer group selected by an independent third-party data provider for the purposes of performance comparisons. Specifically, Columbia Intermediate Municipal Bond Fund's performance was in the fourth quintile (where the best performance would be in the first quintile) for the one-year period and in the third quintile for the three,- five- and ten-year periods; Columbia Connecticut Intermediate Municipal Bond Fund's performance was in the third quintile for the one-year period and in the fourth quintile for the three,- five- and ten-year periods; Columbia Massachusetts Intermediate Municipal Bond Fund's performance was in the third quintile for the one-, three-, and ten-year periods, and in the fourth quintile for the five-year period; Columbia New Jersey Intermediate Mu nicipal Bond Fund's performance was in the fourth quintile for the one-year period and in the third quintile for the three-, five- and ten-year periods; Columbia New York Intermediate Municipal Bond Fund's performance was in the fourth quintile for the one-year period, and in the third quintile for the three-, five- and ten-year periods; and Columbia Rhode Island Intermediate Municipal Bond Fund's performance was in the third quintile for the one-, three-, five- and ten-year periods.
The Trustees also considered Columbia's performance and reputation generally, the funds' performance as a fund family generally, and Columbia's historical responsiveness to Trustee concerns about performance and Columbia's willingness to take steps intended to improve performance. After reviewing those and related factors, the Trustees concluded, within the context of their overall conclusions regarding each of the Agreements, that the performance of each fund and Columbia was sufficient, in light of other considerations, to warrant the continuation of the Agreement(s) pertaining to that fund.
The costs of the services provided and profits realized by Columbia and its affiliates from their relationships with the funds. The Trustees considered the fees charged to the funds for advisory services as well as the total expense levels of the funds. That information included comparisons (provided by management and by an independent third-party data provider) of each fund's advisory fees and total expense levels to those of the fund's peer groups and information about the advisory fees charged by Columbia to comparable institutional accounts. In considering the fees charged to those accounts, the Trustees took into account, among other things, management's representations about the differences between managing mutual funds as compared to other types of accounts, including differences in the services provided, differences in the risk profile of such business for Columbia,
158
and the additional resources required to manage mutual funds effectively. In evaluating each fund's advisory fees, the Trustees also took into account the demands, complexity and quality of the investment management of the fund. The Trustees considered existing advisory fee breakpoints, and Columbia's use of advisory fee waivers and expense caps, which benefited a number of the funds. The Trustees also noted management's stated justification for the fees charged to the funds, which included information about the investment performance of the funds and the services provided to the funds.
The Trustees considered each fund's total expenses and actual management fees relative to those of a peer group selected by an independent third-party data provider for purposes of expense comparisons. Specifically, Columbia Intermediate Municipal Bond Fund's total expenses were in the first quintile and actual management fees were in the third quintile (where the lowest fees and expenses would be in the first quintile); Columbia Connecticut Intermediate Municipal Bond Fund's total expenses and actual management fees were in the first quintile; Columbia Massachusetts Intermediate Municipal Bond Fund's total expenses and actual management fees were in the first quintile; Columbia New Jersey Intermediate Municipal Bond Fund's total expenses and actual management fees were in the first quintile; Columbia New York Intermediate Municipal Bond Fund's total expenses and actual management fees were in the first quintile; and Columbia Rh ode Island Intermediate Municipal Bond Fund's total expenses and actual management fees were in the first quintile.
The Trustees also considered the compensation directly or indirectly received by Columbia and its affiliates from their relationships with the funds. The Trustees reviewed information provided by management as to the profitability to Columbia and its affiliates of their relationships with each fund, and information about the allocation of expenses used to calculate profitability. When reviewing profitability, the Trustees also considered court cases in which adviser profitability was an issue in whole or in part, the performance of the relevant funds, the expense level of each fund, and whether Columbia had implemented breakpoints and/or expense caps with respect to the fund.
After reviewing those and related factors, the Trustees concluded, within the context of their overall conclusions regarding each of the Agreements, that the advisory fees charged to each fund, and the related profitability to Columbia and its affiliates of their relationships with the fund, supported the continuation of the Agreement(s) pertaining to that fund.
Economies of Scale. The Trustees considered the existence of any economies of scale in the provision by Columbia of services to each fund, to groups of related funds, and to Columbia's investment advisory clients as a whole and whether those economies were shared with the funds through breakpoints in the investment advisory fees or other means, such as fee waivers/expense reductions and additional investments by Columbia in investment, trading and compliance resources. The Trustees noted that many of the funds benefited from breakpoints, fee waivers/expense caps, or both. In considering those issues, the Trustees also took note of the costs of the services provided (both on an absolute and a relative basis) and the profitability to Columbia and its affiliates of their relationships with the funds, as discussed above.
After reviewing those and related factors, the Trustees concluded, within the context of their overall conclusions regarding each of the Agreements, that the extent to which economies of scale were shared with the funds supported the continuation of the Agreements.
Other Factors. The Trustees also considered other factors, which included but were not limited to the following:
n the extent to which each fund had operated in accordance with its investment objective and investment restrictions, the nature and scope of the compliance programs of the funds and Columbia and the compliance-related resources that Columbia and its affiliates were providing to the funds;
n the nature, quality, cost and extent of administrative and shareholder services overseen and performed by Columbia and its affiliates, both under the Agreements and under separate agreements for the provision of transfer agency and administrative services;
n so-called "fall-out benefits" to Columbia and its affiliates, such as the engagement of its affiliates to provide distribution, brokerage and transfer agency services to the funds, and the benefits of research made available to
159
Columbia by reason of brokerage commissions generated by the funds' securities transactions, as well as possible conflicts of interest associated with those fall-out and other benefits, and the reporting, disclosure and other processes in place to disclose and monitor those possible conflicts of interest; and
n the report provided by the funds' independent fee consultant, which included information about and analysis of the funds' fees, expenses and performance.
Based on their evaluation of all factors that they deemed to be material, including those factors described above, and assisted by the advice of independent counsel and the independent fee consultant, the Trustees, including the Independent Trustees, approved the continuance of each of the Agreements through October 31, 2009.
160
Summary of Management Fee Evaluation by
Independent Fee Consultant
REPORT OF INDEPENDENT FEE CONSULTANT TO THE FUNDS SUPERVISED BY THE COLUMBIA ATLANTIC BOARD
Prepared Pursuant to the February 9, 2005
Assurance of Discontinuance among the
Office of Attorney General of New York State,
Columbia Management Advisors, LLC, and
Columbia Management Distributors, Inc.
November 3, 2008
I. Overview
On February 9, 2005, Columbia Management Advisors, LLC ("CMA") and Columbia Management Distributors, Inc.1 ("CMD") agreed to the New York Attorney General's Assurance of Discontinuance ("AOD"). Among other things, the AOD stipulates that CMA may manage or advise a Columbia Fund ("Columbia Fund" and, together with some or all of such funds, the "Columbia Funds") only if the Independent Members of the Columbia Fund's Board of Trustees appoint a Senior Officer or retain an Independent Fee Consultant ("IFC") who is to manage the process by which proposed management fees are negotiated. The AOD further stipulates that the Senior Officer or IFC is to prepare a written annual evaluation of the fee negotiation process.
With effect from January 1, 2007, the Independent Members of the Board of Trustees for certain Columbia Funds known collectively as the "Atlantic Funds" (together with the other members of that Board, the "Trustees") retained me as IFC for the Atlantic Funds.2 In this capacity, I have prepared the fourth annual written evaluation of the fee negotiation process. As was the case with last year's report (the "2007 Report") my immediate predecessor as IFC, John Rea, provided invaluable assistance in the preparation of this year's report.
A. Role of the Independent Fee Consultant
The AOD charges the IFC with "managing the process by which proposed management fees ... to be charged the Columbia Fund are negotiated so that they are negotiated in a manner which is at arms' length and reasonable and consistent with this Assurance of Discontinuance." The AOD also provides that CMA "may manage or advise a Columbia Fund only if the reasonableness of the proposed management fees is determined by the Board of Trustees ... using ... an annual independent written evaluation prepared by or under the direction of ... the Independent Fee Consultant." Therefore, the AOD makes clear that the IFC does not supplant the Trustees in negotiating management fees with CMA, nor does the IFC substitute his or her judgment for that of the Trustees with respect to the reasonableness of proposed fees or any other matter that is committed to the business judgmen t of the Trustees.
B. Elements Involved in Managing the Fee Negotiation Process
In preparing the report required by the AOD, the IFC must consider at least the following six factors set forth in the AOD:
1. The nature and quality of CMA's services, including the Fund's performance;
2. Management fees (including any components thereof) charged by other mutual fund companies for like services;
3. Possible economies of scale as the Fund grows larger;
4. Management fees (including any components thereof) charged to institutional and other clients of CMA for like services;
5. Costs to CMA and its affiliates of supplying services pursuant to the management fee agreements, excluding any intra-corporate profit; and
6. Profit margins of CMA and its affiliates from supplying such services.
C. Organization of the Annual Evaluation
This report, like last year's, focuses on the six factors and contains a section for each factor except that CMA's costs and profits from managing the Funds have been combined into a single section. In addition to a discussion of these factors, the report offers recommendations to improve the fee review process in future years. A review of the status of
1 CMA and CMD are subsidiaries of Columbia Management Group, LLC ("CMG"), and are the successors to the entities named in the AOD.
2 I have no material relationship with Bank of America, CMG or any of its affiliates, aside from serving as IFC, and I am aware of no material relationship with any of their affiliates. I retained John Rea, an independent economic consultant, to assist me with this report.
Unless otherwise stated or required by the context, this report covers only the Atlantic Funds, which are also referred as the "Funds."
161
recommendations made in the 2007 Report is being provided separately with the materials for the October meeting.
II. Summary of Findings
A. General
1. Based upon my examination of the information supplied by CMG in the light of the six factors set forth in the AOD, I conclude that the Trustees have the relevant information necessary to evaluate the reasonableness of the proposed management fees for each Atlantic Fund.
2. In my view, the process by which the proposed management fees of the Funds have been negotiated in 2008 thus far has been, to the extent practicable, at arms' length and reasonable and consistent with the AOD.
B. Nature and Quality of Services, Including Performance
3. The performance of the Funds has been relatively strong in recent years. Based upon 1-, 3-, 5-, and 10-year returns through April 30, 2008, at least half of all the Funds were in the first and second performance quintiles in each of the four performance periods and, at most, only 11% were in the fifth quintile in any one performance period. Both equity and fixed-income funds posted strong performance relative to comparable funds.
4. Performance rankings were similar in 2007 and 2008, although last year's were slightly stronger. Despite the stability in the distribution of rankings in the two years, at least half the Funds changed quintile rankings between the two years in at least one of the 1-, 3-, and 5-year performance periods.
5. The performance of the actively managed equity Funds against their benchmarks was very strong. At least 57% and as many as 73% posted net returns exceeding their benchmarks over the 1-, 3-, and 5-year periods. In contrast, gross and net returns of fixed-income Funds typically fell short of their benchmarks.
6. Atlantic equity Funds' overall performance adjusted for risk also was strong. Based upon 3-year returns, nearly 80% of the equity Funds had a combination of risk-adjusted and unadjusted returns that placed them in the top half of their performance universes. Only about one-fifth of the fixed income Funds posted high returns and low risk relative to comparable funds. About two-thirds of the fixed-income Funds took on more risk than the typical fund in their performance universes.
7. The industry-standard procedure used by Lipper that includes all share classes in the performance universe tends to bias a Fund's ranking upward within that universe. The bias occurs because either no-12b-1 fee or low-12b-1 fee share classes of the Atlantic Funds are compared with funds in performance universes that include all share classes of multi-class funds with 12b-1 fees of up to 100 basis points. Correcting this bias by limiting the performance universe to classes of comparable funds with low or no 12b-1 fees (a "filtered universe") lowers the relative performance for the Funds, but their performance, on the whole, remains strong. The filtering process, however, did identify two Funds for further review that had not been designated review funds using unfiltered universes.
8. A small number of Funds have consistently underperformed over the past four years. The exact number depends on the criteria used to evaluate longer-term performance. For example, the one-year returns of one Fund have been in the fourth or fifth performance quintiles in each of the past four years; there are six Funds whose three-year returns have been in the fourth or fifth quintile over the past four years.
9. The services performed by CMG professionals beyond portfolio management, such as compliance, legal, information technology, risk management, finance and fund administration, are critical to the success of the Funds and appear to be of high quality.
C. Management Fees Charged by Other Mutual Fund Companies
10. The Funds' management fees and total expenses are generally low relative to those of their peers. Only 21% of the Funds ranked in the two most expensive quintiles for actual management fees, and only 23% in those quintiles for total expenses.
11. The highest concentration of low-expense Funds is found among the equity and tax-exempt fixed income Funds. The 12 former Excelsior Funds have relatively high fees and expenses, with half of those Funds ranking in either the
162
fourth or fifth quintiles. The higher actual management fee rankings of certain Excelsior Funds are due in part to fee schedules that are higher than standard Columbia Fund fee schedules at current asset levels. After discussion with the Trustees, CMA is proposing to lower the management fees on three of these Funds.
12. The distribution of expense rankings is similar in 2007 and 2008, while management fee rankings improved markedly in 2008. Part of the improvement reflects expense limitations introduced last year for the state intermediate municipal bond Funds.
13. The management fees of the Atlantic Funds are generally in line with those of Columbia Funds supervised by the Nations Board of Trustees (the "Nations Funds"). In investment categories in which the Atlantic Funds have higher average fees, the difference principally arises out of differences in asset size.
D. Trustees' Fee and Performance Evaluation Process
14. The Trustees' evaluation process identified 17 Funds in 2008 for further review based upon their relative performance or expenses or both. When compared in filtered universes, two more Funds met the criteria for further review. CMG provided further information about those Funds to assist the Trustees in their evaluation.
E. Potential Economies of Scale
15. CMG presented to the Trustees its analysis of the sources and sharing of potential economies of scale. CMG views economies of scale as arising at the complex level and would regard estimates of scale economies for individual funds as unreliable. In its analysis, CMG did not identify specific sources of economies of scale or provide any estimates of any economies of scale that might arise from future asset growth. CMG's analysis included measures taken by the Trustees and CMG that seek to share any potential economies of scale through breakpoints in management fee schedules, expense reimbursements, fee waivers, enhanced shareholder services, fund mergers, and operational consolidation.
16. An examination of the contractual fee schedules for five Atlantic Funds shows that they are generally in line with those of their competitors, in terms of number and extent of fee breakpoints. A similar examination last year of five different Funds led to the same conclusion.
F. Management Fees Charged to Institutional Clients
17. CMG has provided Trustees with comparisons of mutual fund management fees and institutional fees based upon standardized fee schedules and upon actual fees. The results show that, consistent with industry practice, institutional fees are generally lower than the Funds' management fees. However, because the services provided and risks borne by the manager are more extensive for mutual funds compared to institutional accounts, the differences are of limited value in assisting the Trustees in their review of the reasonableness of the Funds' management fees.
G. Revenues, Expenses, and Profits
18. The activity-based cost allocation methodology ("ABC") employed by CMG to allocate costs, both direct and indirect, for purposes of calculating Fund profitability is thoughtful and detailed. This year, CMG proposed a change to the method by which indirect expenses are allocated. Under this "hybrid" method, indirect costs relating to fund management are allocated among the Funds 50% by assets and 50% per Fund. Allocating indirect expenses equally to each Fund has an intuitive logic, as each Fund regardless of size has certain expenses, such as preparing and printing prospectuses and financial statements.
19. The materials provided on CMG's revenues and expenses with respect to the Funds and the methodology underlying their construction form a sufficient basis for Trustees to evaluate the expenses and profitability of the Funds.
20. In 2007, CMG's complex-wide pre-tax margins on the Atlantic Funds were slightly below industry medians, based on limited data available for publicly held mutual fund managers. However, as is to be expected in a complex now comprising 75 Funds (including former Excelsior Funds), some Atlantic Funds have relatively high pre-tax profit margins, when calculated solely with respect to management revenues and expenses, while other Atlantic Funds operate at a loss. There is a positive relationship
163
between fund size and profitability, with smaller funds generally operating at a loss.
21. CMG pays a fixed percentage of its management fee revenues to an affiliate, U.S. Trust, Bank of America Private Wealth Management, to compensate it for services it performs with respect to Atlantic Fund assets held for the benefit of its customers. Based on our analysis of the services provided by this affiliate, we have concluded that all payments other than those for sub-transfer agent or sub-accounting services should be treated as a distribution expense.
III. Recommendations
1. Criteria for review. The Trustees may wish to consider modifying the criteria for classifying a fund as a "Review Fund" to include criteria that focus exclusively on performance without regard to expense or fee levels. For example, a fund whose one-year or three-year performance was median or below for four consecutive years could be treated as a Review Fund. When we applied such criteria to the Funds, several additional Funds would have been added to the list of Review Funds.
2. Profitability data. CMG should present to the Trustees each year the profitability of each Fund, each investment style and each complex (of which Atlantic is one) calculated as follows:
a. Management-only profitability should be calculated without reference to any Private Bank expense.
b. Profitability excluding distribution (which essentially covers the management and transfer agency functions) should be adjusted by removing from the expense calculation any portion of the Private Bank payment not attributable to the performance by the Private Bank of sub-transfer agency or sub-accounting functions.
c. Total profitability, including distribution: No adjustment for Private Bank expenses should be made, because all such expenses represent legitimate fund expenses to be taken into account in calculating CMG's profit margin including distribution.
d. Distribution only: This should include all Private Bank expenses other than those attributable to sub-transfer agency services.
Therefore, the following data need not be provided:
1. Adjusting total profitability data for Private Bank expenses
2. Adjusting profitability excluding distribution by backing out all Private Bank expenses.
3. Potential economies of scale. CMG and the IFC should continue to work on methods for more precisely quantifying to the extent possible the sources and magnitude of any economies of scale as CMG's mutual fund assets under management increase, to the extent that the data allows for meaningful year-over-year comparisons. The framework suggested in Section IV.D.4 may prove to be a useful model for such an analysis.
4. Competitive breakpoint analysis. As part of the annual fee evaluation process, the breakpoints of a select group of Atlantic Funds (which would differ each year) should continue to be compared to those of industry rivals to ensure that the Funds' breakpoint schedules remain within industry norms. As breakpoint schedules change relatively little each year, performing such a comparison for each Atlantic Fund each year would not be an efficient use of Trustee and CMG resources.
5. Cost allocation methodology. CMG's point that the current ABC system of allocating indirect expenses creates anomalous results in several cases, including sub-advised Funds, is well-taken. We would like to work with CMG over the forthcoming year on alternatives to the current system of allocating indirect expenses that (1) resolve the anomalies, (2) limit the amount of incremental effort on CMG's part and (3) remain faithful to the general principle that expenses should be allocated by time and effort to the extent reasonably possible.
6. Management fee disparities. CMG and the Atlantic Trustees, as part of any future study of management fees, should analyze the differences in management fee schedules, principally arising out of the reorganization of the former Excelsior Funds as Atlantic Funds. As part of that analysis, CMG should provide an explanation for any significant fee differences among comparable funds across fund families managed by CMA, such as differences in the management styles of different Funds included the same Lipper category. Finally, whenever CMG proposes a
164
management fee change or an expense cap for any mutual fund managed by CMA that is comparable to any Atlantic Fund, CMG should provide the Trustees with sufficient information about the proposal to allow the Trustees to assess the applicability of the proposed change to the relevant Atlantic Fund or Funds.
7. Tax-exempt Fund expense data. The expense rankings of certain tax-exempt Funds were adversely affected by including certain investment-related interest expenses that Lipper excluded in calculating the expense ratios of competitors. We recommend that CMG follow the Lipper practice and exclude such interest expenses from data submitted to Lipper to avoid unfairly disadvantaging the tax-exempt Funds.
8. Reduction of volume of paper documents submitted. The effort to rationalize and simplify the data presented to the Trustees and the process by which that data was prepared and organized was regarded as a success by all parties. We should continue to look for opportunities to reduce and simplify the presentation of 15(c) data, especially in the area of Fund profitability. The Fund "Dashboard" volume presents a large volume of Fund data on a single page. If it is continued, the Trustees may wish to consider receiving the underlying Lipper data on CD, rather than the current paper volumes.
* * *
Respectfully submitted,
Steven E. Asher
165
This page intentionally left blank.
This page intentionally left blank.
This page intentionally left blank.
Important Information About This Report
The funds mail one shareholder report to each shareholder address. If you would like more than one report, please call shareholder services at 1-800-345-6611 and additional reports will be sent to you. This report has been prepared for shareholders of the Columbia Tax-Exempt Bond Funds listed on the front cover.
A description of the policies and procedures that each fund uses to determine how to vote proxies and a copy of each fund's voting records are available (i) at www.columbiamanagement.com; (ii) on the Securities and Exchange Commission's website at www.sec.gov; and (iii) without charge, upon request, by calling 1-800-368-0346. Information regarding how each fund voted proxies relating to portfolio securities during the 12-month period ended June 30 is available from the SEC's website. Information regarding how each fund voted proxies relating to portfolio securities is also available from the fund's website, www.columbiamanagement.com.
Each fund files a complete schedule of portfolio holdings with the SEC for the first and third quarters of each fiscal year on Form N-Q. Each fund's Form N-Q is available on the SEC's website at www.sec.gov and may be reviewed and copied at the SEC's Public Reference Room in Washington, D.C. Information on the operation of the Public Reference Room may be obtained by calling 1-800-SEC-0330.
An investment in money market mutual funds is not a bank deposit, and is not insured or guaranteed by Bank of America, N.A. or any of its affiliates or by the Federal Deposit Insurance Corporation or any other government agency. Although money market mutual funds seek to preserve the value of your investment at $1.00 per share, it is possible to lose money by investing in money market mutual funds. Please see the prospectus for a complete discussion of investments in money market funds.
Please read and consider the investment objectives, risks, charges and expenses for any fund carefully before investing. For a prospectus which contains this and other important information about the fund, contact your Columbia Management representative or financial advisor or go to www.columbiamanagement.com.
Columbia Management Group, LLC ("Columbia Management") is the investment management division of Bank of America Corporation. Columbia Management entities furnish investment management services and products for institutional and individual investors. Columbia Funds are distributed by Columbia Management Distributors, Inc., member of FINRA, SIPC, part of Columbia Management and an affiliate of Bank of America Corporation.
Transfer Agent
Columbia Management Services, Inc.
P.O. Box 8081
Boston, MA 02266-8081
1-800-345-6611
Distributor
Columbia Management
Distributors, Inc.
One Financial Center
Boston, MA 02111
Investment Advisor
Columbia Management Advisors, LLC
100 Federal Street
Boston, MA 02110
169
Columbia Management®
Columbia Tax-Exempt Bond Funds
Annual Report, October 31, 2008
PRSRT STD
U.S. Postage
PAID
Holliston, MA
Permit NO. 20
©2008 Columbia Management Distributors, Inc.
One Financial Center, Boston, MA 02111-2621
800-345-6611 www.columbiafunds.com
SHC-42/157008-1008 (12/08) 08/65972
Item 2. Code of Ethics.
(a) The registrant has, as of the end of the period covered by this report, adopted a code of ethics that applies to the registrant’s principal executive officer, principal financial officer, principal accounting officer or controller, or persons performing similar functions, regardless of whether these individuals are employed by the registrant or a third party.
(b) During the period covered by this report, there were not any amendments to a provision of the code of ethics adopted in 2(a) above.
(c) During the period covered by this report, there were no waivers, including any implicit waivers, from a provision of the code of ethics described in 2(a) above that relates to one or more of the items set forth in paragraph (b) of this item’s instructions.
Item 3. Audit Committee Financial Expert.
The registrant’s Board of Trustees has determined that Douglas A. Hacker, John D. Collins and Anne-Lee Verville, each of whom are members of the registrant’s Board of Trustees and Audit Committee, each qualify as an audit committee financial expert. Mr. Hacker, Mr. Collins and Ms. Verville are each independent trustees, as defined in paragraph (a)(2) of this item’s instructions.
Item 4. Principal Accountant Fees and Services.
Fee information below is disclosed for the ten series of the registrant whose reports to stockholders are included in this annual filing. Fee information for fiscal year ended October 31, 2008 also includes fees for two series that were merged into the registrant during the period.
(a) Audit Fees. Aggregate Audit Fees billed by the principal accountant for professional services rendered during the fiscal years ended October 31, 2008 and October 31, 2007 are approximately as follows:
2008 | | 2007 | |
$ | 308,200 | | $ | 288,900 | |
| | | | | |
Audit Fees include amounts related to the audit of the registrant’s annual financial statements or services that are normally provided by the accountant in connection with statutory and regulatory filings or engagements for those fiscal years.
(b) Audit-Related Fees. Aggregate Audit-Related Fees billed to the registrant by the principal accountant for professional services rendered during the fiscal years ended October 31, 2008 and October 31, 2007 are approximately as follows:
2008 | | 2007 | |
$ | 64,100 | | $ | 44,000 | |
| | | | | |
Audit-Related Fees include amounts for assurance and related services by the principal accountant that are reasonably related to the performance of the audit of the registrant’s financial statements and are not reported in Audit Fees above. In both fiscal years 2008 and 2007, Audit-Related Fees consist of agreed-upon procedures performed for semi-annual shareholder reports. Fiscal year 2008 also includes Audit-Related Fees for agreed-upon procedures related to fund mergers.
During the fiscal years ended October 31, 2008 and October 31, 2007, there were no Audit-Related Fees billed by the registrant’s principal accountant to the registrant’s investment adviser (not including any sub-adviser whose role is primarily portfolio management and is subcontracted with or overseen by another investment adviser) and any entity controlling, controlled by, or under common control with the adviser that provides ongoing services to the registrant for an engagement that related directly to the operations and financial reporting of the registrant.
(c) Tax Fees. Aggregate Tax Fees billed by the principal accountant to the registrant for professional services rendered during the fiscal years ended October 31, 2008 and October 31, 2007 are approximately as follows:
2008 | | 2007 | |
$ | 65,400 | | $ | 62,000 | |
| | | | | |
Tax Fees include amounts for the review of annual tax returns, the review of required shareholder distribution calculations and typically include amounts for professional services by the principal accountant for tax compliance, tax advice and tax planning. Fiscal year 2008 also includes tax fees for agreed-upon procedures related to fund mergers and the review of final tax returns.
During the fiscal years ended October 31, 2008 and October 31, 2007, there were no Tax Fees billed by the registrant’s principal accountant to the registrant’s investment adviser (not including any sub-adviser whose role is primarily portfolio management and is subcontracted with or overseen by another investment adviser) and any entity controlling, controlled by, or under common control with the adviser that provides ongoing services to the registrant for an engagement that related directly to the operations and financial reporting of the registrant.
(d) All Other Fees. Aggregate All Other Fees billed by the principal accountant to the registrant for professional services rendered during the fiscal years ended October 31, 2008 and October 31, 2007 are approximately as follows:
All Other Fees include amounts for products and services provided by the principal accountant, other than the services reported in paragraphs (a) through (c) above.
Aggregate All Other Fees billed by the registrant’s principal accountant to the registrant’s investment adviser (not including any sub-adviser whose role is primarily portfolio management and is subcontracted with or overseen by another investment adviser) and any entity controlling, controlled by, or under common control with the adviser that provides ongoing services to the registrant for an engagement that related directly to the operations and financial reporting of the registrant during the fiscal years ended October 31, 2008 and October 31, 2007 are approximately as follows:
2008 | | 2007 | |
$ | 916,300 | | $ | 847,400 | |
| | | | | |
In both fiscal years 2008 and 2007, All Other Fees consist of fees billed for internal control examinations of the registrant’s transfer agent and investment advisor.
(e)(1) Audit Committee Pre-Approval Policies and Procedures
The registrant’s Audit Committee is required to pre-approve the engagement of the registrant’s independent accountants to provide audit and non-audit services to the registrant and non-audit services to its investment adviser (not including any sub-adviser whose role is primarily portfolio management and is subcontracted with or overseen by another investment adviser) or any entity controlling, controlled by or under common control with such investment adviser that provides ongoing services to the registrant (“Adviser Affiliates”), if the engagement relates directly to the operations and financial reporting of the registrant.
The Audit Committee has adop ted a Policy for Engagement of Independent Accountants for Audit and Non-Audit Services (“Policy”). The Policy sets forth the understanding of the Audit Committee regarding the engagement of the registrant’s independent accountants to provide (i) audit and permissible audit-related, tax and other services to the registrant (collectively “Fund Services”); (ii) non-audit services to the registrant’s investment adviser (not including any sub-adviser whose role is primarily portfolio management and is subcontracted with or overseen by another investment adviser) and Adviser Affiliates, if the engagement relates directly to the operations or financial reporting of a Fund (collectively “Fund-related Adviser Services”); and (iii) certain other audit and non-audit services to the registrant’s investment adviser (not including any sub-adviser whose role is primarily portfolio management and is
subcontracted with or overseen by another investment adviser) and Adviser Affiliates. Unless a type of service receives general pre-approval under the Policy, it requires specific pre-approval by the Audit Committee if it is to be provided by the independent accountants. Pre-approval of non-audit services to the registrant, the registrant’s investment adviser (not including any sub-adviser whose role is primarily portfolio management and is subcontracted with or overseen by another investment adviser) and Adviser Affiliates may be waived provided that the “de minimis” requirements set forth under paragraph (c)(7)(i)(C) of Rule 2-01 of Regulation S-X are met.
Under the Policy, the Audit Committee may delegate pre-approval authority to any pre-designated member or members who are Independent Trustees/Directors. The member(s) to whom such authority is delegated must report, for informational purposes only, any pre-approval decisions to the Audit Committee at its next regular meeting. The Audit Committee’s responsibilities with respect to the pre-approval of services performed by the independent accountants may not be delegated to management.
The Policy requires the Fund Treasurer and/or Director of Board Administration to su bmit to the Audit Committee, on an annual basis, a schedule of the types of services that are subject to general pre-approval. The schedule(s) provide a description of each type of service that is subject to general pre-approval and, where possible, will provide estimated fee caps for each instance of providing each service. The Audit Committees will review and approve the types of services and review the projected fees for the next fiscal year and may add to, or subtract from, the list of general pre-approved services from time to time based on subsequent determinations. That approval acknowledges that the Audit Committee is in agreement with the specific types of services that the independent accountants will be permitted to perform.
The Fund Treasurer and/or Director of Board Administration shall report to the Audit Committee at each of its regular meetings regarding all Fund Services or Fund-related Adviser Services initiated since the last such report was rendered, including a general description of the services, actual billed and projected fees, and the means by which such Fund Services or Fund-related Adviser Services were pre-approved by the Audit Committee.
*****
(e)(2) The percentage of services described in paragraphs (b) through (d) of this Item approved pursuant to the “de minimis” exception under paragraph (c)(7)(i)(C) of Rule 2-01 of Regulation S-X during both fiscal years ended October 31, 2008 and October 31, 2007 was zero.
(f) Not applicable.
(g) The aggregate non-audit fees billed by the registrant’s accountant for services rendered to the registrant, and rendered to the registrant’s investment adviser (not including any sub-adviser whose role is primarily portfolio management and is
subcontracted with or overseen by another investment adviser), and any entity controlling, controlled by, or under common control with the adviser that provides ongoing services to the registrant for the fiscal years ended October 31, 2008 and October 31, 2007 are approximately as follows:
2008 | | 2007 | |
$ | 1,045,800 | | $ | 953,400 | |
| | | | | |
(h) The registrant’s Audit Committee of the Board of Directors has considered whether the provision of non-audit services that were rendered to the registrant’s adviser (not including any sub-adviser whose role is primarily portfolio management and is subcontracted with or overseen by another investment adviser), and any entity controlling, controlled by, or under common control with the investment adviser that provides ongoing services to the registrant that were not pre-approved pursuant to paragraph (c)(7)(ii) of Rule 2-01 of Regulation S-X, is compatible with maintaining the principal accountant’s independence.
Item 5. Audit Committee of Listed Registrants.
Not applicable.
Item 6. Investments
(a) The registrant’s “Schedule I – Investments in securities of unaffiliated issuers” (as set forth in 17 CFR 210.12-12) is included in Item 1 of this Form N-CSR.
(b) Not applicable.
Item 7. Disclosure of Proxy Voting Policies and Procedures for Closed-End Management Investment Companies.
Not applicable.
Item 8. Portfolio Managers of Closed-End Management Investment Companies.
Not applicable.
Item 9. Purchases of Equity Securities by Closed-End Management Investment Company and Affiliated Purchasers.
Not applicable.
Item 10. Submission of Matters to a Vote of Security Holders.
There have not been any material changes to the procedures by which shareholders may recommend nominees to the registrant’s board of directors, since those procedures were last disclosed in response to requirements of Item 407(c)(2)(iv) of Regulation S-K (as required by Item 22(b)(15) of Schedule 14A) or this Item.
Item 11. Controls and Procedures.
(a) The registrant’s principal executive officer and principal financial officers, based on their evaluation of the registrant’s disclosure controls and procedures as of a date within 90 days of the filing of this report, have concluded that such controls and procedures are adequately designed to ensure that information required to be disclosed by the registrant in Form N-CSR is accumulated and communicated to the registrant’s management, including the principal executive officer and principal financial officer, or persons performing similar functions, as appropriate to allow timely decisions regarding required disclosure.
(b) There was no change in the registrant’s internal control over financial reporting that occurred during the registrant’s second fiscal quarter of the period covered by this report that has materially affected, or is reasonably likely to materially affect, the registrant’s internal control over financial reporting.
Item 12. Exhibits.
(a)(1) Code of ethics required to be disclosed under Item 2 of Form N-CSR attached hereto as Exhibit 99.CODE ETH.
(a)(2) Certifications pursuant to Rule 30a-2(a) under the Investment Company Act of 1940 (17 CFR 270.30a-2(a)) attached hereto as Exhibit 99.CERT.
(a)(3) Not applicable.
(b) Certification pursuant to Rule 30a-2(b) under the Investment Company Act of 1940 (17 CFR 270.30a-2(b)) attached hereto as Exhibit 99.906CERT.
SIGNATURES
Pursuant to the requirements of the Securities Exchange Act of 1934 and the Investment Company Act of 1940, the registrant has duly caused this report to be signed on its behalf by the undersigned, thereunto duly authorized.
(registrant) | | Columbia Funds Series Trust I |
| |
| |
By (Signature and Title) | | /s/ Christopher L. Wilson |
| Christopher L. Wilson, President |
| |
| |
Date | | December 22, 2008 |
| | | | |
Pursuant to the requirements of the Securities Exchange Act of 1934 and the Investment Company Act of 1940, this report has been signed below by the following persons on behalf of the registrant and in the capacities and on the dates indicated.
By (Signature and Title) | | /s/ Christopher L. Wilson |
| Christopher L. Wilson, President |
| |
| |
Date | | December 22, 2008 |
| |
| |
By (Signature and Title) | | /s/ J. Kevin Connaughton |
| J. Kevin Connaughton, Chief Financial Officer |
| |
| |
Date | | December 22, 2008 |
| | | |