UNITED STATES
SECURITIES AND EXCHANGE COMMISSION
Washington, D.C. 20549
FORM N-CSR
CERTIFIED SHAREHOLDER REPORT OF REGISTERED
MANAGEMENT INVESTMENT COMPANIES
Investment Company Act file number | 811-4367 |
|
Columbia Funds Series Trust I |
(Exact name of registrant as specified in charter) |
|
One Financial Center, Boston, Massachusetts | | 02111 |
(Address of principal executive offices) | | (Zip code) |
|
James R. Bordewick, Jr., Esq.
Columbia Management Advisors, LLC
One Financial Center
Boston, MA 02111 |
(Name and address of agent for service) |
|
Registrant’s telephone number, including area code: | 1-617-426-3750 | |
|
Date of fiscal year end: | September 30 | |
|
Date of reporting period: | September 30, 2008 | |
| | | | | | | | |
Form N-CSR is to be used by management investment companies to file reports with the Commission not later than 10 days after the transmission to stockholders of any report that is required to be transmitted to stockholders under Rule 30e-1 under the Investment Company Act of 1940 (17 CFR 270.30e-1). The Commission may use the information provided on Form N-CSR in its regulatory, disclosure review, inspection, and policymaking roles.
A registrant is required to disclose the information specified by Form N-CSR, and the Commission will make this information public. A registrant is not required to respond to the collection of information contained in Form N-CSR unless the Form displays a currently valid Office of Management and Budget (“OMB”) control number. Please direct comments concerning the accuracy of the information collection burden estimate and any suggestions for reducing the burden to Secretary, Securities and Exchange Commission, 450 Fifth Street, NW, Washington, DC 20549-0609. The OMB has reviewed this collection of information under the clearance requirements of 44 U.S.C. § 3507.
Item 1. Reports to Stockholders.
Columbia Management®
Annual Report
September 30, 2008
Stock Funds
g Columbia Asset Allocation Fund
g Columbia Large Cap Growth Fund
g Columbia Disciplined Value Fund
g Columbia Contrarian Core Fund
(formerly Columbia Common Stock Fund)
g Columbia Small Cap Core Fund
| NOT FDIC INSURED | | May Lose Value | |
|
| NOT BANK ISSUED | | No Bank Guarantee | |
|
Table of Contents
| Economic Update | | | 1 | | |
|
| Columbia Asset Allocation Fund | | | 3 | | |
|
| Columbia Large Cap Growth Fund | | | 8 | | |
|
| Columbia Disciplined Value Fund | | | 13 | | |
|
| Columbia Contrarian Core Fund | | | 18 | | |
|
| Columbia Small Cap Core Fund | | | 23 | | |
|
| Financial Statements | | | | | |
|
| Investment Portfolios | | | 28 | | |
|
Statements of Assets and
Liabilities | | | 62 | | |
|
| Statements of Operations | | | 64 | | |
|
Statements of Changes in
Net Assets | | | 66 | | |
|
| Financial Highlights | | | 73 | | |
|
| Notes to Financial Statements | | | 100 | | |
|
| Report of Independent Registered Public Accounting Firm | | | 114 | | |
|
| Federal Income Tax Information | | | 115 | | |
|
| Fund Governance | | | 116 | | |
|
Important Information About
This Report | | | 121 | | |
|
The views expressed in this report reflect the current views of the respective parties. These views are not guarantees of future performance and involve certain risks, uncertainties and assumptions that are difficult to predict, so actual outcomes and results may differ significantly from the views expressed. These views are subject to change at any time based upon economic, market or other conditions and the respective parties disclaim any responsibility to update such views. These views may not be relied on as investment advice and, because investment decisions for a Columbia Fund are based on numerous factors, may not be relied on as an indication of trading intent on behalf of any particular Columbia Fund. References to specific securities should not be construed as a recommendation or investment advice.
President's Message

Dear Shareholder:
We are pleased to provide this shareholder report for your Columbia Fund and hope you will find the portfolio management details, discussions and performance information helpful in monitoring your investments. As we've seen this past year, the financial markets can be quite volatile, with significant short-term price fluctuations. It's important to keep these ups and downs in perspective, particularly in light of your long-term investment strategy.
Staying the course with your long-term strategy typically involves riding out short-term price fluctuations, though we recognize that at times this can be tough. To support your efforts and give you the information you need to make prudent decisions, Columbia Management offers several valuable online resources. We encourage you to visit www.columbiamanagement.com/investor, where you can receive the most up-to-date information, including:
g Daily pricing and performance. View pricing and performance from a link in Fund Tracker on the homepage. This listing of funds is updated nightly with the current net asset value and the amount and percentage change from the prior day.
g News & Commentary. This tab provides links to quarterly fund commentaries and information from our investment strategies group, including trends in the economy and market impact.
If you would like more details on individual funds, select a fund from the dropdown menu on the top right side of the homepage for access to:
g Monthly and quarterly performance information.
g Portfolio holdings. Full holdings are updated monthly for money market funds except for Columbia Cash Reserves and Columbia Money Market Reserves which are updated weekly, monthly for equity funds and quarterly for most other funds.
g Quarterly fact sheets. Accessible from the Literature tab in each fund page.
By registering on the site, you'll receive secured, 24-hour access to*:
g Mutual fund account details with balances, dividend and transaction information.
g Fund Tracker to customize your homepage with current net asset values for the funds that interest you
g On-line transactions including purchases, exchanges and redemptions.
g Account maintenance for updating your address and dividend payment options.
g Electronic delivery of prospectuses and shareholder reports.
I encourage you to visit our website for access to the product information and tools described above. These valuable online resources can help you monitor your investments and provide direct access to your account. All of these tools, and more, can be found on www.columbiamanagement.com/investor.
While your financial advisor is a great resource for investment guidance, you can also access our website or call our service representatives at 800.345.6611 for additional assistance. We thank you for investing with Columbia Management and look forward to helping with your ongoing investment needs.
Sincerely,

Christopher L. Wilson
President, Columbia Funds
*Some restrictions apply. Shareholders who purchase shares through certain third-party organizations may not have the ability to register for online access.
Economic Update – Stock Funds
The pace of economic growth slowed during the 12-month period that began October 1, 2007 and ended September 30, 2008 as a growing number of factors weighed on consumers and businesses alike. The economy stayed clear of a recession, with an uptick in growth in the first half of 2008. However, it was widely expected that growth would slow to zero or negative near the end of the period as the most severe housing downturn in decades showed no sign of abating and job growth continued to slide. Inventories of homes for sale rose, home prices declined and tighter credit standards, the result of continued turmoil in the subprime mortgage market, made it more difficult for homebuyers to qualify for loans. Food prices rose, raising concerns about inflation, and energy prices soared to record highs before backing down sharply in the last months of the period. Consumer confidence declined sharply through June, then improved modestly in Aug ust and September. However, The Conference Board's consumer confidence survey revealed that consumer appraisal of the economic environment continues to erode. Consumer confidence is surveyed monthly by The Conference Board.
As growth weakened, businesses began to pull back on hiring, which further dimmed the outlook for consumers. Job losses were reported for nine consecutive months in 2008, and the unemployment rate spiked to 6.1%. The slowdown in manufacturing activity was one of the last major indicators to turn negative. Federal tax rebates, which began to arrive in May, helped bolster consumer spending during the early summer months, but consumer spending turned negative later in the period.
In an effort to inspire confidence in the capital markets, loosen the reins on credit and shore up economic growth, the Federal Reserve Board (the Fed) brought a key short-term rate—the federal funds rate—down from 4.75% to 2.0% during the 12-month period. After seven rate cuts, the Fed remains concerned about inflation; but a weak economic outlook began to shift its priorities.1
Stocks retreat as economic storm clouds gather
Against a shifting economic backdrop, the U.S. stock market lost 21.98% for the 12-month period, as measured by the S&P 500 Index. Small- cap stocks held up better than large- and mid-cap stocks, as measured by their respective Russell indices.2 Value stocks held up better than growth stocks in the small- and mid-cap range while growth stocks lost less than value stocks among large caps. As the dollar rebounded modestly against the euro, investors reaped even lower returns from investments outside the U.S. The MSCI EAFE Index, a broad gauge of stock market performance in foreign developed markets, lost 30.50% (in U.S. dollars) for the period. Emerging stock markets, which have had a strong run over the past several years, were also caught in the downdraft. The MSCI Emerging Markets Index returned negative 33.01% (in U.S. dollars).3
Past performance is no guarantee of future results.
1On October 8, the Fed lowered the federal funds rate to 1.5% and on October 29, the Fed lowered the Federal Funds rate to 1.0%.
2The Russell 1000 Index measures the performance of 1,000 of the largest US companies, based on market capitalization. The Russell Midcap Index measures the performance of the 800 smallest companies in the Russell 1000 Index, as ranked by total market capitalization. The Russell 2000 Index measures the performance of the 2,000 smallest of the 3,000 largest U.S. companies based on market capitalization.
3The MSCI Emerging Markets Index is a widely accepted index composed of a sample of companies from 25 countries representing the global emerging stock markets.
Indices are not investments, do not incur fees or expenses and are not professionally managed. It is not possible to invest directly in an index. Securities in the fund may not match those in an index.
Summary
For the 12-month period that ended September 30, 2008
g The broad U.S. stock market, as measured by the S&P 500 Index, returned negative 21.98%. Developed stock markets outside the United States returned negative 30.50%, as measured (in U.S. dollars) by the MSCI EAFE Index.
| S&P Index | | MSCI Index | |
|
 | |  | |
|
g Despite volatility in many segments of the bond market, the Lehman Brothers U.S. Aggregate Bond Index delivered a modest return. High-yield bonds lost significant ground, as measured by the Merrill Lynch U.S. High Yield Cash Pay Index.
Lehman
Index | | Merrill
Lynch Index | |
|
 | |  | |
|
The Standard & Poor's (S&P) 500 Index tracks the performance of 500 widely held, large-capitalization US stocks.
The Morgan Stanley Capital International (MSCI) Europe, Australasia, Far East (EAFE) Index is a free float-adjusted market capitalization index that is designed to measure developed market equity performance excluding the US and Canada.
The Lehman Brothers U.S. Aggregate Bond Index is a market value-weighted index that tracks the daily price, coupon, pay-downs and total return performance of fixed-rate, publicly placed, dollar-denominated and non-convertible investment-grade debt issues with at least $250 million par amount outstanding and with at least one year to final maturity.
The Merrill Lynch U.S. High Yield, Cash Pay Index tracks the performance of non-investment-grade corporate bonds.
1
Economic Update (continued) – Stock Funds
Bonds delivered modest gains
The U.S. bond market seesawed during the 12-month period but delivered a modest gain as investors sought the relative safety of the highest quality sectors. After a weak start, bond prices in many sectors rose and yields declined as economic growth slowed and stock market volatility increased. Although the benchmark 10-year U.S. Treasury yield edged back above 4.0% in 2008, it slipped back to 3.83% at the end of the period, nearly one full percentage point below where it was one year ago. In this environment, the Lehman Brothers U.S. Aggregate Bond Index returned 3.65%. High-yield bonds took a beating. The Merrill Lynch U.S. High Yield, Cash Pay Index returned negative 11.62%.
Past performance is no guarantee of future results.
2
Fund Profile – Columbia Asset Allocation Fund
Summary
g For the 12-month period that ended September 30, 2008, the fund's Class A shares returned negative 16.23% without sales charge.
g In a difficult period, the fund held up better than its peer group, the Lipper Mixed Asset Target Allocation Growth Classification.1
g Shifts in portfolio allocations aided the fund's returns. However, the favorable impact was partially offset by disappointing performance in certain market segments.
Portfolio Management
Vikram J. Kuriyan, PhD, is the lead manager for Columbia Asset Allocation Fund and has managed the fund since August 2005. He has been with the advisor or its predecessors or affiliate organizations since 2000.
Karen Wurdack, PhD, has co-managed the fund since August 2005 and has been with the advisor or its predecessors or affiliate organizations since 1993.
Colin Moore has co-managed the fund since February 2008 and has been with the advisor or its predecessors or affiliate organizations since 2002.
Dr. Kuriyan, Dr. Wurdack and Mr. Moore are responsible for allocating the fund's assets among the various asset classes. The investment decisions for each asset class are made by professionals with expertise in that class.
1Lipper Inc., a widely respected data provider in the industry, calculates an average total return (assuming reinvestment of distributions) for mutual funds with investment objectives similar to those of the fund. Lipper makes no adjustment for the effect of sales loads.
2The Standard & Poor's (S&P) 500 Index tracks the performance of 500 widely held, large-capitalization US stocks.
3The Lehman Brothers U.S. Aggregate Bond Index is a market value-weighted index that tracks the daily price, coupon, pay-downs and total return performance of fixed-rate, publicly placed, dollar-denominated, and non-convertible investment-grade debt issues with at least $250 million par amount outstanding and with at least one year to final maturity.
Indices are not investments, do not incur fees or expenses and are not professionally managed. It is not possible to invest directly in an index. Securities in the fund may not match those in an index.
Performance data quoted represents past performance and current performance may be lower or higher. Past performance is no guarantee of future results. The investment return and principal value will fluctuate so that shares, when redeemed, may be worth more or less than the original cost. Please visit www.columbiafunds.com for daily and most recent month-end performance updates.
Summary
1-year return as of 09/30/08
| | | –16.23% | |
|
 | | Class A shares
(without sales charge) | |
|
| | | –21.98% | |
|
 | | S&P 500 Index2 | |
|
| | | +3.65% | |
|
 | | Lehman Brothers
U.S. Aggregate Bond Index3 | |
|
3
Performance Information – Columbia Asset Allocation Fund
Performance data quoted represents past performance and current performance may be lower or higher. Past performance is no guarantee of future results. The investment return and principal value will fluctuate so that shares, when redeemed, may be worth more or less than the original cost. Please visit www.columbiafunds.com for daily and most recent month-end performance updates.
Annual operating expense ratio (%)*
| Class A | | | 1.32 | | |
| Class B | | | 2.07 | | |
| Class C | | | 2.07 | | |
| Class T | | | 1.37 | | |
| Class Z | | | 1.07 | | |
* The annual operating expense ratio is as stated in the fund's prospectus that is current as of the date of this report. Differences in expense ratios disclosed elsewhere in this report may result from including fee waivers and expense reimbursements as well as different time periods used in calculating the ratios.
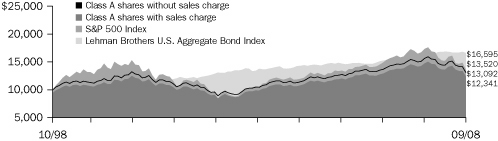
Growth of a $10,000 investment 10/01/98 – 09/30/08
 | |
|
The chart above shows the growth in value of a hypothetical $10,000 investment in Class A shares of Columbia Asset Allocation Fund during the stated time period, and does not reflect the deduction of taxes that a shareholder may pay on fund distributions or on the redemption of fund shares. The Standard & Poor's (S&P) 500 Index tracks the performance of 500 widely held, large-capitalization US stocks. The Lehman Brothers U.S. Aggregate Bond Index is a market value-weighted index that tracks the daily price, coupon, pay-downs and total return performance of fixed-rate, publicly placed, dollar-denominated, and non-convertible investment-grade debt issues with at least $250 million par amount outstanding and with at least one year to final maturity. Indices are not investments, do not incur fees or expenses and are not professionally managed. It is not possible to invest directly in an index. Securities in the fund may not match those in an index.
Performance of a $10,000 investment 10/01/98 – 09/30/08 ($)
| Sales charge | | without | | with | |
| Class A | | | 13,092 | | | | 12,341 | | |
| Class B | | | 12,187 | | | | 12,187 | | |
| Class C | | | 12,182 | | | | 12,182 | | |
| Class T | | | 13,014 | | | | 12,267 | | |
| Class Z | | | 13,370 | | | | n/a | | |
Average annual total return as of 09/30/08 (%)
| Share class | | A | | B | | C | | T | | Z | |
| Inception | | 11/01/98 | | 11/01/98 | | 11/18/02 | | 12/30/91 | | 12/30/91 | |
| Sales charge | | without | | with | | without | | with | | without | | with | | without | | with | | without | |
| 1-year | | | –16.23 | | | | –21.03 | | | | –16.88 | | | | –20.62 | | | | –16.93 | | | | –17.67 | | | | –16.32 | | | | –21.15 | | | | –16.06 | | |
| 5-year | | | 4.58 | | | | 3.36 | | | | 3.80 | | | | 3.49 | | | | 3.80 | | | | 3.80 | | | | 4.53 | | | | 3.31 | | | | 4.86 | | |
| 10-year | | | 2.73 | | | | 2.13 | | | | 2.00 | | | | 2.00 | | | | 1.99 | | | | 1.99 | | | | 2.67 | | | | 2.06 | | | | 2.95 | | |
The "with sales charge" returns include the maximum initial sales charge of 5.75% for Class A and Class T shares, the applicable contingent deferred sales charge of 5.00% in the first year, declining to 1.00% in the sixth year and eliminated thereafter for Class B shares and 1.00% for Class C shares for the first year only. The "without sales charge" returns do not include the effect of sales charges. If they had, returns would be lower.
Performance results reflect any fee waivers or reimbursements of fund expenses by the investment advisor and/or any of its affiliates. Absent these fee waivers or expense reimbursement arrangements, performance results would have been lower.
All results shown assume reinvestment of distributions. Class Z shares are sold at net asset value with no distribution and service (Rule 12b-1) fees. Class Z shares have limited eligibility and the investment minimum requirements may vary. Please see the fund's prospectus for details. Performance for different share classes will vary based on differences in sales charges and fees associated with each class.
The tables do not reflect the deduction of taxes that a shareholder may pay on fund distributions or on the redemption of fund shares.
The returns for Class A shares and Class B shares include the returns of Prime A shares (for Class A shares) and Prime B shares (for Class B shares) of the Galaxy Asset Allocation Fund for periods prior to November 18, 2002, the date on which Class A and Class B shares were initially offered by the fund. The returns shown for Class A shares and Class B shares also include the returns of Retail A shares of the Galaxy Asset Allocation Fund (adjusted, as necessary, to reflect the sales charges applicable to Class A shares and Class B shares, respectively), for periods prior to the inception of Prime A shares and Prime B shares (November 1, 1998). Class A and Class B shares generally would have had substantially similar returns to Prime A shares, Prime B shares and Retail A shares because th ey would have been invested in the same portfolio of securities, although returns would have been lower to the extent that expenses for Class A and Class B shares exceed expenses paid by Prime A shares and Retail A shares. The returns shown for Class C shares include the returns of Prime B shares of the Galaxy Asset Allocation Fund (adjusted to reflect the sales charge applicable to Class C shares) for periods prior to November 18, 2002, the date on which Class C shares were initially offered by the fund. The returns shown for Class C shares also include the returns of Retail A shares of the Galaxy Asset Allocation Fund (adjusted to reflect the sales charges applicable to Class C shares) for periods prior to the date of inception of Prime B shares (November 1, 1998). Class C shares generally would have had substantially similar returns because they would have been invested in the same portfolio of securities, although the returns would have been lower to the extent that expenses for Class C shares exceed exp enses paid by Retail A shares or Prime B shares. Retail A shares of the Galaxy Asset Allocation Fund were initially offered on December 30, 1991. Class A, Class B and Class C shares were initially offered on November 18, 2002. The returns for Class T shares include the returns of Retail A shares (for Class T shares) of the Galaxy Asset Allocation Fund for periods prior to November 18, 2002, the date on which Class T shares were initially offered by the fund. The returns for Class Z shares include returns of Trust shares of the Galaxy Asset Allocation Fund for periods prior to November 18, 2002, the date on which Class Z shares were initially offered by the fund. Trust shares of the Galaxy Asset Allocation Fund were initially offered on December 30, 1991.
4
Understanding Your Expenses – Columbia Asset Allocation Fund
As a fund shareholder, you incur two types of costs. There are transaction costs, which generally include sales charges on purchases and may include redemption fees or exchange fees. There are also ongoing costs, which generally include investment advisory fees, distribution and service (Rule 12b-1) fees and other fund expenses. The information on this page is intended to help you understand the ongoing costs of investing in the fund and to compare these costs with the ongoing costs of investing in other mutual funds.
Analyzing your fund's expenses by share class
To illustrate these ongoing costs, we have provided an example and calculated the expenses paid by investors in each share class during the period. The information in the following table is based on an initial investment of $1,000, which is invested at the beginning of the period and held for the entire period. Expense information is calculated two ways and each method provides you with different information. The amount listed in the "actual" column is calculated using the fund's actual operating expenses and total return for the period. The amount listed in the "hypothetical" column for each share class assumes that the return each year is 5% before expenses and is calculated based on the fund's actual operating expenses. You should not use the hypothetical account values and expenses to estimate either your actual account balance at the end of the period or the expenses you paid during this period.
Compare with other funds
Since all mutual funds are required to include the same hypothetical calculations about expenses in shareholder reports, you can use this information to compare the ongoing costs of investing in the fund with other funds. To do so, compare the 5% hypothetical example with the 5% hypothetical examples that appear in the shareholder reports of other funds. As you compare hypothetical examples of other funds, it is important to note that hypothetical examples are meant to highlight the ongoing costs of investing in a fund and do not reflect any transaction costs, such as sales charges, redemption fees or exchange fees.
Estimating your actual expenses
To estimate the expenses that you paid over the period, first you will need your account balance at the end of the period:
g For shareholders who receive their account statements from Columbia Management Services, Inc., your account balance is available online at www.columbiafunds.com or by calling Shareholder Services at 800.345.6611.
g For shareholders who receive their account statements from their financial intermediary, contact your financial intermediary to obtain your account balance.
1. Divide your ending account balance by $1,000. For example, if an account balance was $8,600 at the end of the period, the result would be 8.6.
2. In the section of the table below titled "Expenses paid during the period," locate the amount for your share class. You will find this number in the column labeled "actual." Multiply this number by the result from step 1. Your answer is an estimate of the expenses you paid on your account during the period.
If the value of your account falls below the minimum initial investment requirement applicable to you, your account generally will be subject to a $20 annual fee. This fee is not included in the accompanying table. If you are subject to the fee, keep it in mind when you are estimating the ongoing expenses of investing in the fund and when comparing the expenses of this fund with other funds.
04/01/08 – 09/30/08
| | | Account value at the
beginning of the period ($) | | Account value at the
end of the period ($) | | Expenses paid
during the period ($) | | Fund's annualized
expense ratio (%) | |
| | | Actual | | Hypothetical | | Actual | | Hypothetical | | Actual | | Hypothetical | | Actual | |
| Class A | | | 1,000.00 | | | | 1,000.00 | | | | 908.00 | | | | 1,018.55 | | | | 6.15 | | | | 6.51 | | | | 1.29 | | |
| Class B | | | 1,000.00 | | | | 1,000.00 | | | | 904.40 | | | | 1,014.80 | | | | 9.71 | | | | 10.28 | | | | 2.04 | | |
| Class C | | | 1,000.00 | | | | 1,000.00 | | | | 904.40 | | | | 1,014.80 | | | | 9.71 | | | | 10.28 | | | | 2.04 | | |
| Class T | | | 1,000.00 | | | | 1,000.00 | | | | 907.80 | | | | 1,018.30 | | | | 6.39 | | | | 6.76 | | | | 1.34 | | |
| Class Z | | | 1,000.00 | | | | 1,000.00 | | | | 909.30 | | | | 1,019.80 | | | | 4.96 | | | | 5.25 | | | | 1.04 | | |
Expenses paid during the period are equal to the annualized expense ratio for the share class, multiplied by the average account value over the period, then multiplied by the number of days in the fund's most recent fiscal half-year and divided by 366.
It is important to note that the expense amounts shown in the table are meant to highlight only ongoing costs of investing in the fund and do not reflect any transaction costs, such as sales charges, redemption fees or exchange fees. Therefore, the hypothetical examples provided may not help you determine the relative total costs of owning shares of different funds. If these transaction costs were included, your costs would have been higher.
5
Portfolio Managers' Report – Columbia Asset Allocation Fund
Performance data quoted represents past performance and current performance may be lower or higher. Past performance is no guarantee of future results. The investment return and principal value will fluctuate so that shares, when redeemed, may be worth more or less than the original cost. Please visit www.columbiafunds.com for daily and most recent month-end performance updates.
Net asset value per share
as of 09/30/08 ($)
| Class A | | | 12.57 | | |
| Class B | | | 12.57 | | |
| Class C | | | 12.57 | | |
| Class T | | | 12.58 | | |
| Class Z | | | 12.58 | | |
Distributions declared per share
10/01/07 – 09/30/08 ($)
| Class A | | | 1.78 | | |
| Class B | | | 1.67 | | |
| Class C | | | 1.67 | | |
| Class T | | | 1.77 | | |
| Class Z | | | 1.82 | | |
For the 12-month period that ended September 30, 2008, the fund's Class A shares returned negative 16.23% without sales charge. The S&P 500 Index returned negative 21.98% and the Lehman Brothers U.S. Aggregate Bond Index returned 3.65%.1 The fund's return was higher than the negative 17.90% average return of its peer group, the Lipper Mixed Asset Target Allocation Growth Funds Classification.2 A decision to increase exposure to investment grade bonds and small cap value while reducing exposure to international and large cap equities, as well as high-yield bonds, aided performance. Disappointing performance from the fund's bond and international equity allocations hampered returns.
Portfolio positioning helped stem losses in a difficult environment
The world's stock markets were battered as a worldwide credit crisis and weakening economic growth undermined investor confidence. Many segments of the U.S. bond market also came under pressure. In this environment, we made some key changes to the fund's allocations that helped stem losses. Within the domestic equity portion of the portfolio, we reduced the fund's exposure to large cap stocks and increased exposure to small caps, which aided performance as large caps underperformed. The fund's exposure to small cap value was particularly helpful to performance because the manager's losses were substantially less than that of the index. We cut back on the fund's international equity position, which was well timed because international stock markets were even weaker than the U.S. market. Within the fixed income portion of the portfolio, we added to the fund's position in investment grade bonds and reduced exposure to high-yield bo nds. The shift helped the fund capture some positive performance. Investment grade bonds were the only major market segment other than cash to generate a positive return for the period. It also limited losses in the high-yield sector, which was the weakest performing area in the fixed-income markets.
A period of transition for U.S. and global economies
The economic landscape weakened considerably near the end of the period as a credit crisis and rising unemployment weighed on consumer demand. However, the Federal Reserve and the U.S. Treasury have taken steps to restore confidence in the capital markets and we believe that they will continue to pursue options to prevent a protracted economic downturn. In this environment, we believe that investors who are focused on their goals have the potential to benefit from the broad diversification offered by Columbia Asset Allocation Fund, even though diversification does not ensure a profit or guarantee against a loss.
1The Standard & Poor's (S&P) 500 Index tracks the performance of 500 widely held, large-capitalization US stocks. The Lehman Brothers U.S. Aggregate Bond Index is a market value-weighted index that tracks the daily price, coupon, pay-downs and total return performance of fixed-rate, publicly placed, dollar-denominated and non-convertible investment-grade debt issues with at least $250 million par amount outstanding and with at least one year to final maturity. Indices are not investments, do not incur fees or expenses and are not professionally managed. It is not possible to invest directly in an index. Securities in the fund may not match those in an index.
2Lipper Inc., a widely respected data provider in the industry, calculates an average total return (assuming reinvestment of distributions) for mutual funds with investment objectives similar to those of the fund. Lipper makes no adjustment for the effect of sales loads.
6
Portfolio Managers' Report (continued) – Columbia Asset Allocation Fund
Portfolio holdings and characteristics are subject to change periodically and may not be representative of current holdings and characteristics. The outlook for the fund may differ from that presented for other Columbia Funds.
Equity investments are affected by stock market fluctuations that occur in response to economic and business developments.
Investing in high-yield securities (commonly known as "junk" bonds) offers the potential for high current income and attractive total return, but involves certain risks. Changes in economic conditions or other circumstances may adversely affect a junk bond issuer's ability to make principal and interest payments. Rising interest rates tend to lower the value of all bonds. High-yield bonds issued by foreign entities have greater potential risks, including less regulation, currency fluctuations, economic instability and political developments.
The fund may be subject to the same types of risks associated with direct ownership of real estate including the decline of property value due to general, local and regional economic conditions.
International investing may involve certain risks, including currency fluctuations, risks associated with possible differences in financial accounting standards and other monetary and political risks. Significant levels of foreign taxes, including potentially confiscatory levels of taxation and withholding taxes, may also apply to some foreign investments.
Top 5 equity sectors
as of 09/30/08 (%)
| Financials | | | 10.5 | | |
| Information Technology | | | 8.7 | | |
| Health Care | | | 7.1 | | |
| Energy | | | 6.5 | | |
| Industrials | | | 6.4 | | |
Top 10 equity holdings
as of 09/30/08 (%)
| JPMorgan Chase & Co. | | | 1.2 | | |
| Johnson & Johnson | | | 1.0 | | |
| Exxon Mobil Corp. | | | 1.0 | | |
| Hewlett-Packard Co. | | | 0.8 | | |
| Procter & Gamble Co. | | | 0.7 | | |
| Microsoft Corp. | | | 0.6 | | |
| Wal-Mart Stores, Inc. | | | 0.6 | | |
| AT&T, Inc. | | | 0.6 | | |
| Wells Fargo & Co. | | | 0.6 | | |
| Avon Products, Inc. | | | 0.6 | | |
Portfolio structure
as of 09/30/08 (%)
| Common Stocks | | | 57.6 | | |
| Corporate Fixed-Income | |
| Bonds & Notes | | | 10.7 | | |
| Mortgage-Backed Securities | | | 10.7 | | |
| Government & Agency | |
| Obligations | | | 6.8 | | |
| Commercial Mortgage-Backed | |
| Securities | | | 3.9 | | |
| Collateralized Mortgage | |
| Obligation | | | 3.4 | | |
| Asset-Backed Securities | | | 1.6 | | |
| Preferred Stocks | | | 0.1 | | |
| Convertible Preferred Stock | | | 0.1 | | |
| Investment Companies | | | 0.1 | | |
| Purchased Put Options | | | 0.0 | * | |
| Cash Equivalent, Net Other | |
| Assets & Liabilities | | | 5.0 | | |
* Rounds to less than 0.1%
The fund is actively managed and the composition of its portfolio will change over time. Information provided is calculated as a percentage of net assets.
7
Fund Profile – Columbia Large Cap Growth Fund
Performance data quoted represents past performance and current performance may be lower or higher. Past performance is no guarantee of future results. The investment return and principal value will fluctuate so that shares, when redeemed, may be worth more or less than the original cost. Please visit www.columbiafunds.com for daily and most recent month-end performance updates.
Summary
1-year return as of 09/30/08
| | | –21.73% | |
|
 | | Class A shares
(without sales charge) | |
|
| | | –20.88% | |
|
 | | Russell 1000 Growth Index | |
|
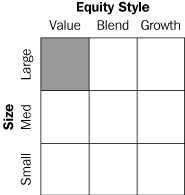
Morningstar Style Box

The Morningstar Style Box reveals a fund's investment strategy. For equity funds the vertical axis shows the market capitalization of the stocks owned and the horizontal axis shows investment style (value, blend or growth). All of these numbers are drawn from the data most recently provided by the fund and entered into Morningstar's database as of month end. Although the data is gathered from reliable sources, Morningstar cannot guarantee completeness and accuracy. Information shown is as of 08/31/08.
Summary
g For the 12-month period that ended September 30, 2008, the fund's Class A shares returned negative 21.73% without sales charge.
g The fund trailed its benchmark, the Russell 1000 Growth Index,1 while it held up better than the average of its peer group, the Lipper Large-Cap Growth Funds Classification.2
g Stock selection, particularly in the technology and financial sectors, contributed to underperformance, while biotechnology and industrial stocks made positive contributions to the fund's relative returns.
Portfolio Management
Paul J. Berlinguet has co-managed the fund since October 2003 and has been with the advisor or its predecessors or affiliate organizations since 2003.
Roger R. Sullivan has co-managed the fund since June 2005 and has been with the advisor or its predecessors or affiliate organizations since 1994.
John T. Wilson has co-managed the fund since August 2005 and has been with the advisor or its predecessors or affiliate organizations since 1996.
1The Russell 1000 Growth Index measures the performance of those Russell 1000 Index companies with higher price-to-book ratios and higher forecasted growth values. Indices are not investments, do not incur fees or expenses and are not professionally managed. It is not possible to invest directly in an index. Securities in the fund may not match those in an index.
2Lipper Inc., a widely respected data provider in the industry, calculates an average total return (assuming reinvestment of distributions) for mutual funds with investment objectives similar to those of the fund. Lipper makes no adjustment for the effect of sales loads.
8
Performance Information – Columbia Large Cap Growth Fund
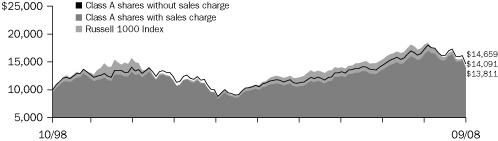
Growth of a $10,000 investment 10/01/98 – 09/30/08
The chart above shows the growth in value of a hypothetical $10,000 investment in Class A shares of Columbia Large Cap Growth Fund during the stated time period, and does not reflect the deduction of taxes that a shareholder may pay on fund distributions or on the redemption of fund shares. The Russell 1000 Growth Index measures the performance of those Russell 1000 Index companies with higher price-to-book ratios and higher forecasted growth values. Indices are not investments, do not incur fees or expenses and are not professionally managed. It is not possible to invest directly in an index. Securities in the fund may not match those in an index.
Performance of a $10,000 investment 10/01/98 – 09/30/08 ($)
| Sales charge | | without | | with | |
| Class A | | | 12,412 | | | | 11,697 | | |
| Class B | | | 11,529 | | | | 11,529 | | |
| Class C | | | 11,535 | | | | 11,535 | | |
| Class E | | | 12,384 | | | | 11,825 | | |
| Class F | | | 11,523 | | | | 11,523 | | |
| Class T | | | 12,291 | | | | 11,583 | | |
| Class Z | | | 12,743 | | | | n/a | | |
Performance data quoted represents past performance and current performance may be lower or higher. Past performance is no guarantee of future results. The investment return and principal value will fluctuate so that shares, when redeemed, may be worth more or less than the original cost. Please visit www.columbiafunds.com for daily and most recent month-end performance updates.
Annual operating expense ratio (%)*
| Class A | | | 1.03 | | |
| Class B | | | 1.78 | | |
| Class C | | | 1.78 | | |
| Class E | | | 1.13 | | |
| Class F | | | 1.78 | | |
| Class T | | | 1.08 | | |
| Class Z | | | 0.78 | | |
* The annual operating expense ratio is as stated in the fund's prospectus that is current as of the date of this report. Differences in expense ratios disclosed elsewhere in this report may result from including fee waivers and expense reimbursements as well as different time periods used in calculating the ratios.
Average annual total return as of 09/30/08 (%)
| Share class | | A | | B | | C | | E | | F | | T | | Z | |
| Inception | | 11/01/98 | | 11/01/98 | | 11/18/02 | | 09/22/06 | | 09/22/06 | | 12/14/90 | | 12/14/90 | |
| Sales charge | | without | | with | | without | | with | | without | | with | | without | | with | | without | | with | | without | | with | | without | |
| 1-year | | –21.73 | | –26.22 | | –22.31 | | –25.92 | | –22.33 | | –23.05 | | –21.82 | | –25.34 | | –22.31 | | –25.93 | | –21.76 | | –26.26 | | –21.55 | |
| 5-year | | 3.96 | | 2.74 | | 3.19 | | 2.83 | | 3.17 | | 3.17 | | 3.92 | | 2.96 | | 3.18 | | 2.82 | | 3.91 | | 2.68 | | 4.22 | |
| 10-year | | 2.18 | | 1.58 | | 1.43 | | 1.43 | | 1.44 | | 1.44 | | 2.16 | | 1.69 | | 1.43 | | 1.43 | | 2.08 | | 1.48 | | 2.45 | |
The "with sales charge" returns include the maximum initial sales charge of 5.75% for Class A and Class T shares, 4.50% for Class E shares, the applicable contingent deferred sales charge of 5.00% in the first year, declining to 1.00% in the sixth year and eliminated thereafter for Class B and Class F shares and 1.00% for Class C shares for the first year only. The "without sales charge" returns do not include the effect of sales charges. If they had, returns would be lower.
Performance results reflect any fee waivers or reimbursements of fund expenses by the investment advisor and/or any of its affiliates. Absent these fee waivers or expense reimbursement arrangements, performance results would have been lower.
All results shown assume reinvestment of distributions. Class Z shares are sold at net asset value with no distribution and service (Rule 12b-1) fees. Class Z shares have limited eligibility and the investment minimum requirements may vary. Please see the fund's prospectus for details. Performance for different share classes will vary based on differences in sales charges and fees associated with each class.
The tables do not reflect the deduction of taxes that a shareholder may pay on fund distributions or on the redemption of fund shares.
The returns for Class E and Class F shares include the returns of Class A shares (for Class E shares) and Class B shares (for Class F shares) of the fund for periods prior to September 22, 2006, the date on which Class E and Class F shares were initially offered by the fund. The returns for Class A and Class B shares include the returns of Prime A shares (for Class A shares) and Prime B shares (for Class B shares) of the Galaxy Equity Growth Fund for periods prior to November 18, 2002, the date on which Class A and Class B shares were initially offered by the fund. The returns shown for Class A and Class B shares also include the returns of Retail A shares of the Galaxy Equity Growth Fund (adjusted, as necessary, to reflect the sales charges applicable to Class A shares and Class B shares, respectively) for periods prior to the date of inception of Prime A and Prime B shares (November 1, 1998). Class E and Class F shares general ly would have had substantially similar returns to Class A and Class B shares, respectively. Class A and Class B shares generally would have had substantially similar returns to Prime A shares, Prime B shares and Retail A shares because they would have been invested in the same portfolio of securities, although returns would have been lower to the extent that expenses for Class A and Class B shares exceed expenses paid by Prime A shares, Prime B shares, respectively, or Retail A shares. The returns shown for Class C shares include the returns of Prime B shares of the Galaxy Equity Growth Fund (adjusted to reflect the sales charge applicable to Class C shares) for periods prior to November 18, 2002, the date on which Class C shares were initially offered by the fund. The returns shown for Class C shares also include the returns of Retail A shares of the Galaxy Equity Growth Fund (adjusted to reflect the sales charges applicable to Class C shares) for periods prior to the date of inception of Prime B shares (N ovember 1, 1998). Class C shares generally would have had substantially similar returns because they would have been invested in the same portfolio of securities, although the returns would have been lower to the extent that expenses for Class C shares exceed expenses paid by Retail A shares and Prime B shares. The returns for Class T shares include the returns of Retail A shares of the Galaxy Equity Growth Fund for periods prior to November 18, 2002, the date on which Class T shares were initially offered by the fund. Retail A shares were initially offered on December 14, 1990. The returns for Class Z shares include returns of Trust shares of the Galaxy Equity Growth Fund for periods prior to November 18, 2002, the date on which Class Z shares were initially offered by the fund. Trust shares of the Galaxy Equity Growth Fund were initially offered on December 14, 1990.
9
Understanding Your Expenses – Columbia Large Cap Growth Fund
Estimating your actual expenses
To estimate the expenses that you paid over the period, first you will need your account balance at the end of the period:
g For shareholders who receive their account statements from Columbia Management Services, Inc., your account balance is available online at www.columbiafunds.com or by calling Shareholder Services at 800.345.6611.
g For shareholders who receive their account statements from their financial intermediary, contact your financial intermediary to obtain your account balance.
1. Divide your ending account balance by $1,000. For example, if an account balance was $8,600 at the end of the period, the result would be 8.6.
2. In the section of the table below titled "Expenses paid during the period," locate the amount for your share class. You will find this number in the column labeled "actual." Multiply this number by the result from step 1. Your answer is an estimate of the expenses you paid on your account during the period.
If the value of your account falls below the minimum initial investment requirement applicable to you, your account generally will be subject to a $20 annual fee. This fee is not included in the accompanying table. If you are subject to the fee, keep it in mind when you are estimating the ongoing expenses of investing in the fund and when comparing the expenses of this fund with other funds.
As a fund shareholder, you incur two types of costs. There are transaction costs, which generally include sales charges on purchases and may include redemption fees or exchange fees. There are also ongoing costs, which generally include investment advisory fees, distribution and service (Rule 12b-1) fees and other fund expenses. The information on this page is intended to help you understand the ongoing costs of investing in the fund and to compare these costs with the ongoing costs of investing in other mutual funds.
Analyzing your fund's expenses by share class
To illustrate these ongoing costs, we have provided an example and calculated the expenses paid by investors in each share class during the period. The information in the following table is based on an initial investment of $1,000, which is invested at the beginning of the period and held for the entire period. Expense information is calculated two ways and each method provides you with different information. The amount listed in the "actual" column is calculated using the fund's actual operating expenses and total return for the period. The amount listed in the "hypothetical" column for each share class assumes that the return each year is 5% before expenses and is calculated based on the fund's actual operating expenses. You should not use the hypothetical account values and expenses to estimate either your actual account balance at the end of the period or the expenses you paid during this period.
Compare with other funds
Since all mutual funds are required to include the same hypothetical calculations about expenses in shareholder reports, you can use this information to compare the ongoing costs of investing in the fund with other funds. To do so, compare the 5% hypothetical example with the 5% hypothetical examples that appear in the shareholder reports of other funds. As you compare hypothetical examples of other funds, it is important to note that hypothetical examples are meant to highlight the ongoing costs of investing in a fund and do not reflect any transaction costs, such as sales charges, redemption fees or exchange fees.
04/01/08 – 09/30/08
| | | Account value at the
beginning of the period ($) | | Account value at the
end of the period ($) | | Expenses paid
during the period ($) | | Fund's annualized
expense ratio (%) | |
| | | Actual | | Hypothetical | | Actual | | Hypothetical | | Actual | | Hypothetical | | Actual | |
| Class A | | | 1,000.00 | | | | 1,000.00 | | | | 882.30 | | | | 1,019.90 | | | | 4.80 | | | | 5.15 | | | | 1.02 | | |
| Class B | | | 1,000.00 | | | | 1,000.00 | | | | 879.40 | | | | 1,016.15 | | | | 8.32 | | | | 8.92 | | | | 1.77 | | |
| Class C | | | 1,000.00 | | | | 1,000.00 | | | | 879.00 | | | | 1,016.15 | | | | 8.31 | | | | 8.92 | | | | 1.77 | | |
| Class E | | | 1,000.00 | | | | 1,000.00 | | | | 882.10 | | | | 1,019.40 | | | | 5.27 | | | | 5.65 | | | | 1.12 | | |
| Class F | | | 1,000.00 | | | | 1,000.00 | | | | 879.30 | | | | 1,016.15 | | | | 8.32 | | | | 8.92 | | | | 1.77 | | |
| Class T | | | 1,000.00 | | | | 1,000.00 | | | | 882.30 | | | | 1,019.65 | | | | 5.04 | | | | 5.40 | | | | 1.07 | | |
| Class Z | | | 1,000.00 | | | | 1,000.00 | | | | 883.50 | | | | 1,021.15 | | | | 3.63 | | | | 3.89 | | | | 0.77 | | |
Expenses paid during the period are equal to the annualized expense ratio for the share class, multiplied by the average account value over the period, then multiplied by the number of days in the fund's most recent fiscal half-year and divided by 366.
It is important to note that the expense amounts shown in the table are meant to highlight only ongoing costs of investing in the fund and do not reflect any transaction costs, such as sales charges, redemption fees or exchange fees. Therefore, the hypothetical examples provided may not help you determine the relative total costs of owning shares of different funds. If these transaction costs were included, your costs would have been higher.
10
Portfolio Managers' Report – Columbia Large Cap Growth Fund
For the 12-month period that ended September 30, 2008, the fund's Class A shares returned negative 21.73% without sales charge. The fund's return was lower than that of its benchmark, the Russell 1000 Growth Index, which returned negative 20.88%, but it held up better than the average return of its peer group, the Lipper Large Cap Growth Funds Classification, which was negative 22.95%. While the fund's return was negative, we continued to keep it diversified across sectors while maintaining a balance between defensive stocks, such as health care, and cyclical stocks, including industrial and energy.
Technology and financial stocks among biggest detractors
Stock selection within technology, the largest sector in the Russell index and the fund, detracted from the fund's performance, largely because of expectations that spending on technology by businesses and consumers will fall given the weakening economy. Two of the biggest detractors were Apple, Inc. and Cisco Systems, Inc. Apple had held up well until earlier this year as people continued to buy its computers, iPhones and iPod music players. However, concerns about declining consumer spending began to take their toll on the stock late in the period. Prospects for a weak economy also translated into lower expectations for corporate spending on information technology, including the communications equipment that Cisco makes.
Another area of weakness was financial services. Two of the weakest stocks were Goldman Sachs Group, Inc. and Lazard Ltd. Both companies are active in the mergers and acquisition market, which has all but dried up over the past several months. We sold Lazard during the period, but we kept a modest position in Goldman. Another underperformer was American Express Co. In spite of growing weakness in the consumer sector, we had expected that this company, which caters to the higher end of that market, would hold up better than it did. We sold the stock during the period.
Biotechnology and industrial stocks made positive contributions
Several stocks made positive contributions to the fund's relative returns, including certain biotechnology and industrial companies. In biotechnology, Amgen, Inc. was one of the top contributors, particularly after it reported positive news from a study of a drug to treat osteoporosis. Genentech, Inc. was another good performer in the biotechnology sector. Its stock rose sharply when a major pharmaceutical company that already owns part of Genentech announced plans to acquire the rest of the firm. Also, Express Scripts, Inc., a pharmacy benefit manager, performed well. The company primarily uses generic drugs, which are quite profitable, to fill many of its prescriptions.
Stock selection also helped in the industrials area. There, two of the biggest contributors were Suntech Power Holdings Co., Ltd. and First Solar, Inc. Demand for solar power has been growing, but the technology remains expensive. However, companies such as First Solar have figured out ways to eliminate some steps in the manufacturing process, which has meant lower costs and prices. We sold Suntech before the end of the period.
Finally, even in the face of slowing consumer spending, a number of consumer stocks did well. Retailer Wal-Mart Stores, Inc. benefited from consumer demand for low-priced items. McDonald's Corp., the fast-food restaurant chain, attracted diners by offering good value. Also, H.J. Heinz Co., which is best known for its ketchup, has gained competitively with successful product and packaging strategies.
Performance data quoted represents past performance and current performance may be lower or higher. Past performance is no guarantee of future results. The investment return and principal value will fluctuate so that shares, when redeemed, may be worth more or less than the original cost. Please visit www.columbiafunds.com for daily and most recent month-end performance updates.
Net asset value per share
as of 09/30/08 ($)
| Class A | | | 19.57 | | |
| Class B | | | 18.15 | | |
| Class C | | | 18.16 | | |
| Class E | | | 19.53 | | |
| Class F | | | 18.14 | | |
| Class T | | | 19.42 | | |
| Class Z | | | 20.02 | | |
Distributions declared per share
10/01/07 – 09/30/08 ($)
| Class A | | | 1.81 | | |
| Class B | | | 1.81 | | |
| Class C | | | 1.81 | | |
| Class E | | | 1.81 | | |
| Class F | | | 1.81 | | |
| Class T | | | 1.81 | | |
| Class Z | | | 1.86 | | |
11
Portfolio Managers' Report (continued) – Columbia Large Cap Growth Fund
Top 5 sectors
as of 09/30/08 (%)
| Information Technology | | | 30.6 | | |
| Heath Care | | | 15.5 | | |
| Consumer Staples | | | 13.8 | | |
| Industrials | | | 12.7 | | |
| Energy | | | 9.6 | | |
Sector breakdown is calculated as a percentage of total investments excluding short-term investments.
Top 10 holdings
as of 09/30/08 (%)
| Microsoft Corp. | | | 3.2 | | |
| QUALCOMM, Inc. | | | 2.8 | | |
| International Business | |
| Machines Corp. | | | 2.3 | | |
| Wal-Mart Stores, Inc. | | | 2.3 | | |
| Cisco Systems, Inc. | | | 2.2 | | |
| Oracle Corp. | | | 2.1 | | |
| Johnson & Johnson | | | 2.1 | | |
| Hewlett-Packard Co. | | | 2.1 | | |
| Google, Inc. | | | 1.9 | | |
| PepsiCo, Inc. | | | 1.8 | | |
Holdings discussed in this report
as of 09/30/08 (%)
| Apple, Inc. | | | 1.6 | | |
| Cisco Systems, Inc. | | | 2.2 | | |
| Goldman Sachs Group, Inc. | | | 0.7 | | |
| Amgen, Inc. | | | 0.5 | | |
| Genentech, Inc. | | | 0.7 | | |
| Express Scripts, Inc. | | | 0.6 | | |
| First Solar, Inc. | | | 0.3 | | |
| Wal-Mart Stores Inc. | | | 2.3 | | |
| McDonald's Corp. | | | 0.9 | | |
| H.J. Heinz Co. | | | 0.7 | | |
The fund is actively managed and the composition of its portfolio will change over time. Information provided is calculated as a percentage of net assets.
Looking ahead
We plan to continue to look for profitable companies with low debt, regardless of what is happening in the markets. We believe that this approach is especially attractive in the current environment, because companies that rely on borrowing to run their businesses may continue to struggle until the credit markets improve. We target high-growth companies that have strong cash flow to help fund growth by spending on research and development, new products and marketing—all of which could help them gain market share. As a result, we believe that the companies in the portfolio have the potential to come out of this difficult period in a stronger and more competitive position.
Portfolio holdings and characteristics are subject to change periodically and may not be representative of current holdings and characteristics. The outlook for the fund may differ from that presented for other Columbia Funds.
Equity investments are affected by stock market fluctuations that occur in response to economic and business developments.
International investing may involve certain risks, including currency fluctuations, risks associated with possible differences in financial accounting standards and other monetary and political risks. Significant levels of foreign taxes, including potentially confiscatory levels of taxation and withholding taxes, may also apply to some foreign investments.
Investing in growth stocks incurs the possibility of losses because their prices are sensitive to changes in current or expected earnings.
12
Fund Profile – Columbia Disciplined Value Fund
Summary
g For the 12-month period that ended September 30, 2008, the fund's Class A shares returned negative 26.09% without sales charge.
g The fund's return was lower than that of its benchmark, the Russell 1000 Value Index,1 and the average return of its peer group, the Lipper Large Cap Value Funds Classification.2
g Energy, telecommunications and materials holdings were among the main detractors from the fund's return.
Portfolio Management
Vikram J. Kuriyan, PhD, has managed or co-managed the fund since June 2005 and has been with the advisor or its predecessors or affiliate organizations since 2000.
1The Russell 1000 Value Index measures the performance of those companies in the Russell 1000 Index with lower price-to-book ratios and lower forecasted growth values. Indices are not investments, do not incur fees or expenses and are not professionally managed. It is not possible to invest directly in an index. Securities in the fund may not match those in an index.
2Lipper Inc., a widely respected data provider in the industry, calculates an average total return (assuming reinvestment of distributions) for mutual funds with investment objectives similar to those of the fund. Lipper makes no adjustment for the effect of sales loads.
Performance data quoted represents past performance and current performance may be lower or higher. Past performance is no guarantee of future results. The investment return and principal value will fluctuate so that shares, when redeemed, may be worth more or less than the original cost. Please visit www.columbiafunds.com for daily and most recent month-end performance updates.
Summary
1-year return as of 09/30/08
| | –26.09% | |
|
 | | Class A shares
(without sales charge) | |
|
| | –23.56% | |
|
 | | Russell 1000 Value Index | |
|
Morningstar Style Box
The Morningstar Style Box reveals a fund's investment strategy. For equity funds the vertical axis shows the market capitalization of the stocks owned and the horizontal axis shows investment style (value, blend or growth). All of these numbers are drawn from the data most recently provided by the fund and entered into Morningstar's database as of month end. Although the data is gathered from reliable sources, Morningstar cannot guarantee completeness and accuracy. Information shown is as of 08/31/08.
13
Performance Information – Columbia Disciplined Value Fund
Performance data quoted represents past performance and current performance may be lower or higher. Past performance is no guarantee of future results. The investment return and principal value will fluctuate so that shares, when redeemed, may be worth more or less than the original cost. Please visit www.columbiafunds.com for daily and most recent month-end performance updates.
Annual operating expense ratio (%)*
| Class A | | | 1.26 | | |
| Class B | | | 2.01 | | |
| Class C | | | 2.01 | | |
| Class T | | | 1.31 | | |
| Class Z | | | 1.01 | | |
* The annual operating expense ratio is as stated in the fund's prospectus that is current as of the date of this report. Differences in expense ratios disclosed elsewhere in this report may result from including fee waivers and expense reimbursements as well as different time periods used in calculating the ratios.
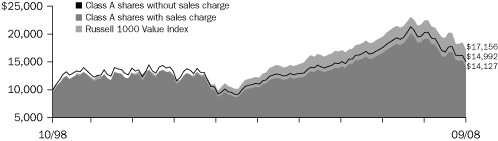
Growth of a $10,000 investment 10/01/98 – 09/30/08
The chart above shows the growth in value of a hypothetical $10,000 investment in Class A shares of Columbia Disciplined Value Fund during the stated time period, and does not reflect the deduction of taxes that a shareholder may pay on fund distributions or on the redemption of fund shares. The Russell 1000 Value Index measures the performance of those companies in the Russell 1000 Index with lower price-to-book ratios and lower forecasted growth values. Indices are not investments, do not incur fees or expenses and are not professionally managed. It is not possible to invest directly in an index. Securities in the fund may not match those in an index.
Performance of a $10,000 investment 10/01/98 – 09/30/08 ($)
| Sales charge | | without | | with | |
| Class A | | | 14,992 | | | | 14,127 | | |
| Class B | | | 13,886 | | | | 13,886 | | |
| Class C | | | 13,854 | | | | 13,854 | | |
| Class T | | | 14,923 | | | | 14,063 | | |
| Class Z | | | 15,449 | | | | n/a | | |
Average annual total return as of 09/30/08 (%)
| Share class | | A | | B | | C | | T | | Z | |
| Inception | | 11/25/02 | | 11/25/02 | | 11/25/02 | | 09/01/88 | | 09/01/88 | |
| Sales charge | | without | | with | | without | | with | | without | | with | | without | | with | | without | |
| 1-year | | | –26.09 | | | | –30.36 | | | | –26.59 | | | | –29.79 | | | | –26.64 | | | | –27.28 | | | | –26.18 | | | | –30.44 | | | | –25.92 | | |
| 5-year | | | 6.35 | | | | 5.10 | | | | 5.56 | | | | 5.26 | | | | 5.55 | | | | 5.55 | | | | 6.29 | | | | 5.04 | | | | 6.61 | | |
| 10-year | | | 4.13 | | | | 3.52 | | | | 3.34 | | | | 3.34 | | | | 3.31 | | | | 3.31 | | | | 4.08 | | | | 3.47 | | | | 4.45 | | |
The "with sales charge" returns include the maximum initial sales charge of 5.75% for Class A and Class T shares, the applicable contingent deferred sales charge of 5.00% in the first year, declining to 1.00% in the sixth year and eliminated thereafter for Class B shares and 1.00% for Class C shares for the first year only. The "without sales charge" returns do not include the effect of sales charges. If they had, returns would be lower.
Performance results reflect any fee waivers or reimbursements of fund expenses by the investment advisor and/or any of its affiliates. Absent these fee waivers or expense reimbursement arrangements, performance results would have been lower.
All results shown assume reinvestment of distributions. Class Z shares are sold at net asset value with no distribution and service (Rule 12b-1) fees. Class Z shares have limited eligibility and the investment minimum requirements may vary. Please see the fund's prospectus for details. Performance for different share classes will vary based on differences in sales charges and fees associated with each class.
The tables do not reflect the deduction of taxes that a shareholder may pay on fund distributions or on the redemption of fund shares.
Class A, Class B and Class C are newer classes of shares. Their performance information includes returns of the Retail A shares (for Class A shares) and Retail B shares (for Class B and Class C shares) of the Galaxy Equity Value Fund for periods prior to November 25, 2002, the date on which Class A, Class B and Class C shares were initially offered by the Fund. The returns shown for Class B and Class C shares also include the performance of Retail A shares of the Galaxy Equity Value Fund for periods prior to the inception of Retail B shares (March 4, 1996). Class B and Class C shares generally would have had substantially similar returns to Retail A or Retail B shares because they would have been invested in the same portfolio of securities, although the returns would have been lower to the extent that expenses for Class B and Class C shares exceed expenses paid by Retail A shares. The returns have not been restated to reflect a ny differences in expenses, such as distribution and service (Rule 12b-1) fees between any of the predecessor shares and the newer classes of shares. The returns for Class T shares include the returns of Retail A shares of the Galaxy Equity Value Fund for periods prior to November 25, 2002, the date on which Class T shares were initially offered by the Fund. Retail A shares were initially offered on September 1, 1988. The returns for Class Z shares include returns of Trust shares of the Galaxy Equity Value Fund for periods prior to November 25, 2002, the date on which Class Z shares were initially offered by the Fund. Trust shares of the Galaxy Equity Value Fund were initially offered on September 1, 1988.
14
Understanding Your Expenses – Columbia Disciplined Value Fund
As a fund shareholder, you incur two types of costs. There are transaction costs, which generally include sales charges on purchases and may include redemption fees or exchange fees. There are also ongoing costs, which generally include investment advisory fees, distribution and service (Rule 12b-1) fees and other fund expenses. The information on this page is intended to help you understand the ongoing costs of investing in the fund and to compare these costs with the ongoing costs of investing in other mutual funds.
Analyzing your fund's expenses by share class
To illustrate these ongoing costs, we have provided an example and calculated the expenses paid by investors in each share class during the period. The information in the following table is based on an initial investment of $1,000, which is invested at the beginning of the period and held for the entire period. Expense information is calculated two ways and each method provides you with different information. The amount listed in the "actual" column is calculated using the fund's actual operating expenses and total return for the period. The amount listed in the "hypothetical" column for each share class assumes that the return each year is 5% before expenses and is calculated based on the fund's actual operating expenses. You should not use the hypothetical account values and expenses to estimate either your actual account balance at the end of the period or the expenses you paid during this period.
Compare with other funds
Since all mutual funds are required to include the same hypothetical calculations about expenses in shareholder reports, you can use this information to compare the ongoing costs of investing in the fund with other funds. To do so, compare the 5% hypothetical example with the 5% hypothetical examples that appear in the shareholder reports of other funds. As you compare hypothetical examples of other funds, it is important to note that hypothetical examples are meant to highlight the ongoing costs of investing in a fund and do not reflect any transaction costs, such as sales charges, redemption fees or exchange fees.
Estimating your actual expenses
To estimate the expenses that you paid over the period, first you will need your account balance at the end of the period:
g For shareholders who receive their account statements from Columbia Management Services, Inc., your account balance is available online at www.columbiafunds.com or by calling Shareholder Services at 800.345.6611.
g For shareholders who receive their account statements from their financial intermediary, contact your financial intermediary to obtain your account balance.
1. Divide your ending account balance by $1,000. For example, if an account balance was $8,600 at the end of the period, the result would be 8.6.
2. In the section of the table below titled "Expenses paid during the period," locate the amount for your share class. You will find this number in the column labeled "actual." Multiply this number by the result from step 1. Your answer is an estimate of the expenses you paid on your account during the period.
If the value of your account falls below the minimum initial investment requirement applicable to you, your account generally will be subject to a $20 annual fee. This fee is not included in the accompanying table. If you are subject to the fee, keep it in mind when you are estimating the ongoing expenses of investing in the fund and when comparing the expenses of this fund with other funds.
04/01/08 – 09/30/08
| | | Account value at the
beginning of the period ($) | | Account value at the
end of the period ($) | | Expenses paid
during the period ($) | | Fund's annualized
expense ratio (%) | |
| | | Actual | | Hypothetical | | Actual | | Hypothetical | | Actual | | Hypothetical | | Actual | |
| Class A | | | 1,000.00 | | | | 1,000.00 | | | | 894.10 | | | | 1,018.40 | | | | 6.25 | | | | 6.66 | | | | 1.32 | | |
| Class B | | | 1,000.00 | | | | 1,000.00 | | | | 890.90 | | | | 1,014.65 | | | | 9.79 | | | | 10.43 | | | | 2.07 | | |
| Class C | | | 1,000.00 | | | | 1,000.00 | | | | 890.60 | | | | 1,014.65 | | | | 9.78 | | | | 10.43 | | | | 2.07 | | |
| Class T | | | 1,000.00 | | | | 1,000.00 | | | | 893.90 | | | | 1,018.15 | | | | 6.49 | | | | 6.91 | | | | 1.37 | | |
| Class Z | | | 1,000.00 | | | | 1,000.00 | | | | 895.50 | | | | 1,019.65 | | | | 5.07 | | | | 5.40 | | | | 1.07 | | |
Expenses paid during the period are equal to the annualized expense ratio for the share class, multiplied by the average account value over the period, then multiplied by the number of days in the fund's most recent fiscal half-year and divided by 366.
It is important to note that the expense amounts shown in the table are meant to highlight only ongoing costs of investing in the fund and do not reflect any transaction costs, such as sales charges, redemption fees or exchange fees. Therefore, the hypothetical examples provided may not help you determine the relative total costs of owning shares of different funds. If these transaction costs were included, your costs would have been higher.
15
Portfolio Manager's Report – Columbia Disciplined Value Fund
Performance data quoted represents past performance and current performance may be lower or higher. Past performance is no guarantee of future results. The investment return and principal value will fluctuate so that shares, when redeemed, may be worth more or less than the original cost. Please visit www.columbiafunds.com for daily and most recent month-end performance updates.
Net asset value per share
as of 09/30/08 ($)
| Class A | | | 10.53 | | |
| Class B | | | 9.92 | | |
| Class C | | | 9.89 | | |
| Class T | | | 10.53 | | |
| Class Z | | | 10.80 | | |
Distribution declared per share
10/01/07 – 09/30/08 ($)
| Class A | | | 2.00 | | |
| Class B | | | 1.90 | | |
| Class C | | | 1.90 | | |
| Class T | | | 1.99 | | |
| Class Z | | | 2.03 | | |
For the 12-month period that ended September 30, 2008, the fund's Class A shares returned negative 26.09% without sales charge. The fund fell behind both its benchmark, the Russell 1000 Value Index, which returned negative 23.56%,1 and the negative 23.80% average return of the Lipper Large Cap Value Funds Classification.2 In one of the most difficult periods for investors in recent memory, stock prices spiraled downward as a global economic slowdown, a stalled credit market and uncertainty about the extent of government measures to improve the situation weighed on investors. This environment provided little refuge for the fund or the index. Additional headwinds from holdings in the energy, telecommunications and materials sectors resulted in the fund's shortfall against its benchmark and peer group.
Rising costs, slowing demand hit key sectors
Among energy names, an emphasis on Valero Energy Corp. hurt performance as the refining company's profit margins were pressured by higher crude oil prices. In the telecommunications sector, a significant position in Sprint Nextel Corp. was detrimental to the fund's return as the popular iPhone gained market share, eating into Sprint's subscriber growth. We subsequently moved out of the position. Late in the period, several materials holdings also saw sharp declines due to growing concerns about the negative effects that the global economic slowdown may have on demand for material goods. Among these were glass container maker Owens-Illinois, Inc. and mining company Freeport-McMoRan Copper & Gold, Inc. Another key detractor from returns was computer hard-drive maker Seagate Technology which saw its shares decline sharply as investors worried over an inventory build-up in the sector that caused pricing competition to increase j ust as demand from personal computer manufacturers slowed.
Positioning in financials and consumer stocks boosts performance
The best performing sectors in the fund's portfolio were financials and consumer discretionary. An underweight position relative to the index in a number of the period's poorest performing financial stocks helped boost relative returns. Among these, zero or very light exposure to Lehman Brothers Holdings, Inc., Wachovia Corp., American International Group, Inc. and some other troubled financial names was beneficial. We sold Lehman before the end of the period. An overweight position in Wells Fargo & Co. also proved helpful to relative results as the nation's third largest bank pursued acquisitions of faltering competitors. Among consumer staples names that bolstered returns were consumer products maker Procter & Gamble Co., which has been able to pass through rising materials costs to consumers. Drugstore CVS Caremark Corp. made a successful takeover bid for West Coast drugstore operator Longs Drug Stores Corp. In the co nsumer discretionary sector, McDonald's Corp. was a top performer as consumer demand for low-cost dining options increased.
1The Russell 1000 Value Index measures the performance of those companies in the Russell 1000 Index with lower price-to-book ratios and lower forecasted growth values. Indices are not investments, do not incur fees or expenses and are not professionally managed. It is not possible to invest directly in an index. Securities in the fund may not match those in an index.
2Lipper Inc., a widely respected data provider in the industry, calculates an average total return (assuming reinvestment of distributions) for mutual funds with investment objectives similar to those of the fund. Lipper makes no adjustment for the effect of sales loads.
16
Portfolio Manager's Report (continued) – Columbia Disciplined Value Fund
Positioned for a change in market leadership
A rocky economic environment and ongoing credit crisis continue to provide a stumbling block for value investors, and particularly for those with a patient buy-and-hold approach. But, as economic shifts take place, we believe that market leadership could shift and financial quality will prove a substantial benefit once more. We believe that the fund's strategy of buying higher quality, more attractively valued companies within each economic sector has the potential to produce rewarding returns in such an environment and over longer periods of time.
Portfolio holdings and characteristics are subject to change periodically and may not be representative of current holdings and characteristics. The outlook for the fund may differ from that presented for other Columbia Funds.
Equity investments are affected by stock market fluctuations that occur in response to economic and business developments.
Investments in small- and mid-cap stocks may present special risks. They tend to be more volatile and may be less liquid than the stocks of larger companies. Small-cap stocks often have narrower markets, limited financial resources and tend to be more thinly traded than stocks of larger companies.
Value stocks are securities of companies that may have experienced adverse business or industry developments or may be subject to special risks that have caused the stocks to be out of favor. The market value of a portfolio security may not meet the manager's future value assessment of such security, or may decline.
Top 5 sectors
as of 09/30/08 (%)
| Financials | | | 28.0 | | |
| Energy | | | 15.7 | | |
| Health Care | | | 11.8 | | |
| Industrials | | | 9.4 | | |
| Consumer Staples | | | 8.9 | | |
Sector breakdown is calculated as a percentage of total investments excluding short-term investments.
Top 10 holdings
as of 09/30/08 (%)
| Exxon Mobil Corp. | | | 7.9 | | |
| Wells Fargo & Co. | | | 4.6 | | |
| JPMorgan Chase & Co. | | | 4.5 | | |
| Pfizer, Inc. | | | 3.9 | | |
| Amgen, Inc. | | | 3.9 | | |
| Chevron Corp. | | | 3.8 | | |
| Procter & Gamble Co. | | | 3.3 | | |
| AT&T, Inc. | | | 2.9 | | |
| Travelers Companies, Inc. | | | 2.8 | | |
| Altria Group, Inc. | | | 2.7 | | |
Holdings discussed in this report
as of 09/30/08 (%)
| Valero Energy Corp. | | | 0.8 | | |
| Owens-Illinois Inc. | | | 0.4 | | |
| Freeport-McMoRan | |
| Copper & Gold, Inc. | | | 1.0 | | |
| Seagate Technology | | | 1.8 | | |
| Wachovia Corp. | | | 0.0 | * | |
| American International | |
| Group | | | 0.1 | | |
| Wells Fargo & Co. | | | 4.6 | | |
| Procter & Gamble Co. | | | 3.3 | | |
| CVS Caremark Corp. | | | 0.3 | | |
| McDonald's Corp. | | | 0.7 | | |
The fund is actively managed and the composition of its portfolio will change over time. Information provided is calculated as a percentage of net assets.
* Rounds to less than 0.1%
17
Fund Profile – Columbia Contrarian Core Fund
Performance data quoted represents past performance and current performance may be lower or higher. Past performance is no guarantee of future results. The investment return and principal value will fluctuate so that shares, when redeemed, may be worth more or less than the original cost. Please visit www.columbiafunds.com for daily and most recent month-end performance updates.
Summary
1-year return as of 09/30/08
| | | –15.35% | |
|
 | | Class A shares
(without sales charge) | |
|
| | | –22.10% | |
|
 | | Russell 1000 Index | |
|
Morningstar Style Box
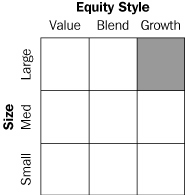
The Morningstar Style Box reveals a fund's investment strategy. For equity funds the vertical axis shows the market capitalization of the stocks owned and the horizontal axis shows investment style (value, blend or growth). All of these numbers are drawn from the data most recently provided by the fund and entered into Morningstar's database as of month end. Although the data is gathered from reliable sources, Morningstar cannot guarantee completeness and accuracy. Information shown is as of 08/31/08.
Summary
g For the 12-month period that ended September 30, 2008, the fund's Class A shares returned negative 15.35% without sales charge.
g In a difficult environment for stocks overall, the fund held up significantly better than the Russell 1000 Index1 and the Lipper Multi-Cap Core Funds Classification.2
g Stock selection in the health care, energy and technology sectors helped the fund minimize its losses.
Portfolio Management
Guy W. Pope has managed the fund since March 2005 and has been with the advisor or its predecessors or affiliate organizations since 1993.
On October 29, 2008, the Board of Trustees voted to change the name of the fund to Columbia Contrarian Core Fund, effective November 14, 2008.
1The Russell 1000 Index measures the performance of 1,000 of the largest US companies, based on market capitalization. Indices are not investments, do not incur fees or expenses and are not professionally managed. It is not possible to invest directly in an index. Securities in the fund may not match those in an index.
2Lipper Inc., a widely respected data provider in the industry, calculates an average total return (assuming reinvestment of distributions) for mutual funds with investment objectives similar to those of the fund. Lipper makes no adjustment for the effect of sales loads.
18
Performance Information – Columbia Contrarian Core Fund
Growth of a $10,000 investment 10/01/98 – 09/30/08
The chart above shows the growth in value of a hypothetical $10,000 investment in Class A shares of Columbia Contrarian Core Fund during the stated time period, and does not reflect the deduction of taxes that a shareholder may pay on fund distributions or on the redemption of fund shares. The Russell 1000 Index measures the performance of 1,000 of the largest US companies, based on market capitalization. Indices are not investments, do not incur fees or expenses and are not professionally managed. It is not possible to invest directly in an index. Securities in the fund may not match those in an index.
Performance of a $10,000 investment 10/01/98 – 09/30/08 ($)
| Sales charge | | without | | with | |
| Class A | | | 14,659 | | | | 13,811 | | |
| Class B | | | 13,604 | | | | 13,604 | | |
| Class C | | | 13,614 | | | | 13,614 | | |
| Class T | | | 14,511 | | | | 13,672 | | |
| Class Z | | | 14,985 | | | | n/a | | |
Average annual total return as of 09/30/08 (%)
| Share Class | | A | | B | | C | | T | | Z | |
| Inception | | 11/01/98 | | 11/01/98 | | 12/09/02 | | 02/12/93 | | 12/14/92 | |
| Sales charge | | without | | with | | without | | with | | without | | with | | without | | with | | without | |
| 1-year | | | –15.35 | | | | –20.23 | | | | –15.96 | | | | –19.75 | | | | –15.95 | | | | –16.71 | | | | –15.37 | | | | –20.24 | | | | –15.11 | | |
| 5-year | | | 6.78 | | | | 5.53 | | | | 5.97 | | | | 5.65 | | | | 5.98 | | | | 5.98 | | | | 6.70 | | | | 5.45 | | | | 7.02 | | |
| 10-year | | | 3.90 | | | | 3.28 | | | | 3.13 | | | | 3.13 | | | | 3.13 | | | | 3.13 | | | | 3.79 | | | | 3.18 | | | | 4.13 | | |
The "with sales charge" returns include the maximum initial sales charge of 5.75% for Class A and Class T shares, the applicable contingent deferred sales charge of 5.00% in the first year, declining to 1.00% in the sixth year and eliminated thereafter for Class B shares and 1.00% for Class C shares for the first year only. The "without sales charge" returns do not include the effect of sales charges. If they had, returns would be lower.
Performance results reflect any fee waivers or reimbursements of fund expenses by the investment advisor and/or any of its affiliates. Absent these fee waivers or expense reimbursement arrangements, performance results would have been lower.
All results shown assume reinvestment of distributions. Class Z shares are sold at net asset value with no distribution and service (Rule 12b-1) fees. Class Z shares have limited eligibility and the investment minimum requirements may vary. Please see the fund's prospectus for details. Performance for different share classes will vary based on differences in sales charges and fees associated with each class.
The tables do not reflect the deduction of taxes that a shareholder may pay on fund distributions or on the redemption of fund shares.
The returns for Class A and Class B shares include the returns of Prime A shares (for Class A shares) and Prime B shares (for Class B shares) of the Galaxy Growth & Income Fund for periods prior to December 9, 2002, the date on which Class A and Class B shares were initially offered by the fund. The returns shown for Class A shares and Class B shares also include the returns of Retail A shares of the Galaxy Growth & Income Fund (adjusted to reflect the sales charge applicable to Class A shares and Class B shares, respectively) for periods prior to the inception of Prime A and Prime B shares (November 1, 1998). Class A and Class B shares generally would have had substantially similar returns to Prime A and Prime B shares, respectively, and Retail A shares because they would have been invested in the same portfolio of securities, although the returns would have been lower to the extent that expenses for Class A and Class B shares exceed expenses paid by Prime A and Prime B shares, respectively, or Retail A shares. The returns shown for Class C shares include the returns of Prime B shares of the Galaxy Growth & Income Fund (adjusted to reflect the sales charge applicable to Class C shares) for periods prior to December 9, 2002, the date on which Class C shares were initially offered by the fund. The returns shown for Class C shares also include the returns of Retail A shares of the Galaxy Growth & Income Fund (adjusted to reflect the sales charges applicable to Class C shares) for periods prior to the inception of Prime B shares (November 1, 1998). Class C shares generally would have had substantially similar returns to Retail A or Prime B shares because they would have been invested in the same portfolio of securities, although the returns would have been lower to the extent that expenses for Class C shares exceed expenses paid by Retail A and Prime B shares. The returns for Class T shares include the returns of Retai l A shares of the Galaxy Growth & Income Fund for periods prior to December 9, 2002, the date on which Class T shares were initially offered by the fund. Retail A shares were initially offered on February 12, 1993. The returns for Class Z shares include returns of Trust shares of the Galaxy Growth & Income Fund for periods prior to December 9, 2002, the date on which Class Z shares were initially offered by the fund, and returns of Trust shares of the Shawmut Fund (whose shares were initially offered on December 14, 1992), for periods prior to December 14, 1995.
Performance data quoted represents past performance and current performance may be lower or higher. Past performance is no guarantee of future results. The investment return and principal value will fluctuate so that shares, when redeemed, may be worth more or less than the original cost. Please visit www.columbiafunds.com for daily and most recent month-end performance updates.
Annual operating expense ratio (%)*
| Class A | | | 1.24 | | |
| Class B | | | 1.99 | | |
| Class C | | | 1.99 | | |
| Class T | | | 1.29 | | |
| Class Z | | | 0.99 | | |
* The annual operating expense ratio is as stated in the fund's prospectus that is current as of the date of this report. Differences in expense ratios disclosed elsewhere in this report may result from including fee waivers and expense reimbursements as well as different time periods used in calculating the ratios.
19
Understanding Your Expenses – Columbia Contrarian Core Fund
Estimating your actual expenses
To estimate the expenses that you paid over the period, first you will need your account balance at the end of the period:
g For shareholders who receive their account statements from Columbia Management Services, Inc., your account balance is available online at www.columbiafunds.com or by calling Shareholder Services at 800.345.6611.
g For shareholders who receive their account statements from their financial intermediary, contact your financial intermediary to obtain your account balance.
1. Divide your ending account balance by $1,000. For example, if an account balance was $8,600 at the end of the period, the result would be 8.6.
2. In the section of the table below titled "Expenses paid during the period," locate the amount for your share class. You will find this number in the column labeled "actual." Multiply this number by the result from step 1. Your answer is an estimate of the expenses you paid on your account during the period.
If the value of your account falls below the minimum initial investment requirement applicable to you, your account generally will be subject to a $20 annual fee. This fee is not included in the accompanying table. If you are subject to the fee, keep it in mind when you are estimating the ongoing expenses of investing in the fund and when comparing the expenses of this fund with other funds.
As a fund shareholder, you incur two types of costs. There are transaction costs, which generally include sales charges on purchases and may include redemption fees or exchange fees. There are also ongoing costs, which generally include investment advisory fees, distribution and service (Rule 12b-1) fees and other fund expenses. The information on this page is intended to help you understand the ongoing costs of investing in the fund and to compare these costs with the ongoing costs of investing in other mutual funds.
Analyzing your fund's expenses by share class
To illustrate these ongoing costs, we have provided an example and calculated the expenses paid by investors in each share class during the period. The information in the following table is based on an initial investment of $1,000, which is invested at the beginning of the period and held for the entire period. Expense information is calculated two ways and each method provides you with different information. The amount listed in the "actual" column is calculated using the fund's actual operating expenses and total return for the period. The amount listed in the "hypothetical" column for each share class assumes that the return each year is 5% before expenses and is calculated based on the fund's actual operating expenses. You should not use the hypothetical account values and expenses to estimate either your actual account balance at the end of the period or the expenses you paid during this period.
Compare with other funds
Since all mutual funds are required to include the same hypothetical calculations about expenses in shareholder reports, you can use this information to compare the ongoing costs of investing in the fund with other funds. To do so, compare the 5% hypothetical example with the 5% hypothetical examples that appear in the shareholder reports of other funds. As you compare hypothetical examples of other funds, it is important to note that hypothetical examples are meant to highlight the ongoing costs of investing in a fund and do not reflect any transaction costs, such as sales charges, redemption fees or exchange fees.
04/01/08 – 09/30/08
| | | Account value at the
beginning of the period ($) | | Account value at the
end of the period ($) | | Expenses paid
during the period ($) | | Fund's annualized
expense ratio (%) | |
| | | Actual | | Hypothetical | | Actual | | Hypothetical | | Actual | | Hypothetical | | Actual | |
| Class A | | | 1,000.00 | | | | 1,000.00 | | | | 904.90 | | | | 1,019.30 | | | | 5.43 | | | | 5.76 | | | | 1.14 | | |
| Class B | | | 1,000.00 | | | | 1,000.00 | | | | 901.30 | | | | 1,015.55 | | | | 8.98 | | | | 9.52 | | | | 1.89 | | |
| Class C | | | 1,000.00 | | | | 1,000.00 | | | | 902.10 | | | | 1,015.55 | | | | 8.99 | | | | 9.52 | | | | 1.89 | | |
| Class T | | | 1,000.00 | | | | 1,000.00 | | | | 905.00 | | | | 1,019.05 | | | | 5.67 | | | | 6.01 | | | | 1.19 | | |
| Class Z | | | 1,000.00 | | | | 1,000.00 | | | | 906.90 | | | | 1,020.55 | | | | 4.24 | | | | 4.50 | | | | 0.89 | | |
Expenses paid during the period are equal to the annualized expense ratio for the share class, multiplied by the average account value over the period, then multiplied by the number of days in the fund's most recent fiscal half-year and divided by 366.
Had the investment advisor and/or any of its affiliates not waived fees or reimbursed a portion of expenses, account value at the end of the period would have been reduced.
It is important to note that the expense amounts shown in the table are meant to highlight only ongoing costs of investing in the fund and do not reflect any transaction costs, such as sales charges, redemption fees or exchange fees. Therefore, the hypothetical examples provided may not help you determine the relative total costs of owning shares of different funds. If these transaction costs were included, your costs would have been higher.
20
Portfolio Manager's Report – Columbia Contrarian Core Fund
For the 12-month period that ended September 30, 2008, Class A shares of the fund returned negative 15.35% without sales charge. The fund's benchmark, the Russell 1000 Index,1 returned negative 22.10% and the average return of its peer group, the Lipper Multi-Cap Core Funds Classification, was negative 22.79% for the same period.2 Although returns were disappointing on an absolute basis, the fund's contrarian stock selection enabled it to avoid some of the market's biggest problem areas during the period and helped it stem losses in a very difficult environment.
Contrarian style aids performance in rocky market
The financial markets were rocked by a credit and liquidity crisis whose scope was magnified as the year went by, and overall economic growth slowed dramatically as a consequence. Although hard evidence that the economy had entered a recession was yet to be confirmed as the reporting period ended in September, the freeze-up in lending left little doubt as to the severity of the crisis.
The fund's contrarian investment style helped mitigate losses in this difficult environment. This phenomenon was best evidenced within financial stocks, where the fund was able to avoid companies with overly leveraged balance sheets and, in fact, came out ahead on its investment in Berkshire Hathaway, Inc., which advanced over 10%. The disruptive capital-markets environment actually helped Berkshire in the sense that investors were encouraged by the likelihood that company chairman Warren Buffett would find an increasing number of opportunities with which to deploy the firm's capital. JPMorgan Chase & Co. also rose slightly for the period. Although not immune from the difficulties of the banking sector, JPMorgan is one of the industry's stronger participants and made several acquisitions, notably those of Bear Stearns and Washington Mutual, that could enhance the franchise in the intermediate to long term.
Within the health care sector, Amgen, Inc. was buoyed by a positive reception of its osteoporosis drug Denosumab, while Covidien Ltd. continued to surprise investors with its earnings momentum, justifying the fund's decision to buy at favorable prices following the company's spinoff from its parent company in 2007. Among energy stocks, the fund's investments in Apache Corp. and Devon Energy Corp. benefited from the higher oil prices that prevailed until the summer of 2008. Other winners included NIKE, Inc. and Avon Products, Inc., both of which enjoyed improvements in their competitive positions and in their international operations.
Disappointments scattered across sectors
There were a few notable disappointments for the fund during the period: the first was American Express Co., which was hit by a reduction in consumer spending, higher credit costs and higher funding costs. Although the company retains a valuable franchise, these operational hurdles led us to reduce our position in the stock during the course of the year. General Electric Co. was another disappointment. The company faced the dual hurdles of a cyclical slowdown in its industrial business and exposure to the credit crisis via its GE Finance subsidiary. Nokia also underperformed, the result of a slowdown in the handset market and loss of market share in the smart phone business.
1The Russell 1000 Index measures the performance of 1,000 of the largest US companies, based on market capitalization. Indices are not investments, do not incur fees or expenses and are not professionally managed. It is not possible to invest directly in an index. Securities in the fund may not match those in an index.
2Lipper Inc., a widely respected data provider in the industry, calculates an average total return (assuming reinvestment of distributions) for mutual funds with investment objectives similar to those of the fund. Lipper makes no adjustment for the effect of sales loads.
Performance data quoted represents past performance and current performance may be lower or higher. Past performance is no guarantee of future results. The investment return and principal value will fluctuate so that shares, when redeemed, may be worth more or less than the original cost. Please visit www.columbiafunds.com for daily and most recent month-end performance updates.
Net asset value per share
as of 09/30/08 ($)
| Class A | | | 11.89 | | |
| Class B | | | 11.14 | | |
| Class C | | | 11.15 | | |
| Class T | | | 11.80 | | |
| Class Z | | | 11.97 | | |
Distributions declared per share
10/01/07 – 09/30/08 ($)
| Class A | | | 1.52 | | |
| Class B | | | 1.47 | | |
| Class C | | | 1.47 | | |
| Class T | | | 1.51 | | |
| Class Z | | | 1.56 | | |
21
Portfolio Manager's Report (continued) – Columbia Contrarian Core Fund
Top 5 sectors
as of 09/30/08 (%)
| Financials | | | 16.7 | | |
| Health Care | | | 16.2 | | |
| Information Technology | | | 15.7 | | |
| Energy | | | 13.4 | | |
| Industrials | | | 11.6 | | |
Sector breakdown is calculated as a percentage of total investments excluding short-term investments.
Top 10 holdings
as of 09/30/08 (%)
| Microsoft Corp. | | | 4.3 | | |
| Hewlett Packard Co. | | | 3.4 | | |
| JPMorgan Chase & Co. | | | 3.3 | | |
| ConocoPhillips | | | 3.1 | | |
| Abbott Laboratories | | | 3.1 | | |
| Philip Morris International, Inc. | | | 3.0 | | |
| General Electric Co. | | | 2.5 | | |
| Google, Inc. | | | 2.5 | | |
| Johnson & Johnson | | | 2.2 | | |
| Tyco International Ltd. | | | 2.2 | | |
Holdings discussed in this report
as of 09/30/08 (%)
| Berkshire Hathaway, Inc. | | | 1.8 | | |
| JPMorgan Chase & Co. | | | 3.3 | | |
| Amgen, Inc. | | | 1.4 | | |
| Covidien Ltd. | | | 1.5 | | |
| Apache Corp. | | | 2.0 | | |
| Devon Energy Corp. | | | 2.0 | | |
| NIKE, Inc. | | | 2.1 | | |
| Avon Products, Inc. | | | 1.2 | | |
| American Express Co. | | | 0.4 | | |
| General Electric Co. | | | 2.5 | | |
| Nokia Oyj | | | 1.1 | | |
The fund is actively managed and the composition of its portfolio will change over time. Information provided is calculated as a percentage of net assets.
Looking ahead
We anticipate a difficult environment for corporate earnings in the year ahead. We believe that a coordinated governmental response will be required to alleviate distress in the capital markets, and we plan to monitor that response with great interest. As our confidence in the market's foundation returns, we anticipate significant opportunities to apply our contrarian philosophy now that prices have come down so broadly. Market declines of this magnitude are often undiscriminating, and we look forward to identifying companies whose share prices have retreated but which also have the capacity to grow earnings into the potentially strong headwinds of the coming year.
Portfolio holdings and characteristics are subject to change periodically and may not be representative of current holdings and characteristics. The outlook for the fund may differ from that presented for other Columbia Funds.
Equity investments are affected by stock market fluctuations that occur in response to economic and business developments.
22
Fund Profile – Columbia Small Cap Core Fund
Summary
g For the 12-month period that ended September 30, 2008, the fund's Class A shares returned negative 12.86% without sales charge.
g In a difficult environment for stocks, overall, the fund held up better than its benchmark, the Russell 2000 Index, as well as the S&P SmallCap 600 Composite Index,1 and the average of its peer group, the Lipper Small-Cap Core Funds Classification.2
g An underweight in financials and timely sales of energy holdings helped the fund, while some technology and industrial stocks held back performance.
Portfolio Management
Peter Larson is the lead manager for Columbia Small Cap Fund. He has managed the fund since 1992 and has been with the advisor or its predecessors or affiliate organizations since 1963.
Richard D'Auteuil has co-managed the fund since September 2005 and has been with the advisor or its predecessors or affiliate organizations since 1993.
Allyn Seymour, Jr. has co-managed the fund since September 2005 and has been with the advisor or its predecessors or affiliate organizations since 1993.
1The Standard & Poor's (S&P) SmallCap 600 Composite Index tracks the performance of 600 domestic companies traded on the New York Stock Exchange, the American Stock Exchange and NASDAQ. The Russell 2000 Index measures the performance of the 2,000 smallest of the 3,000 largest US companies, based on market capitalization. Indices are not investments, do not incur fees or expenses and are not professionally managed. It is not possible to invest directly in an index. Securities in the fund may not match those in an index.
2Lipper Inc., a widely respected data provider in the industry, calculates an average total return (assuming reinvestment of distributions) for mutual funds with investment objectives similar to those of the fund. Lipper makes no adjustment for the effect of sales loads.
Performance data quoted represents past performance and current performance may be lower or higher. Past performance is no guarantee of future results. The investment return and principal value will fluctuate so that shares, when redeemed, may be worth more or less than the original cost. Please visit www.columbiafunds.com for daily and most recent month-end performance updates.
Summary
1-year return as of 09/30/08
| | –12.86% | |
|
 | | Class A shares
(without sales charge) | |
|
| | –14.48% | |
|
 | | Russell 2000 Index | |
|
| | –13.82% | |
|
 | | S&P SmallCap 600 Composite Index | |
|
Morningstar Style Box

The Morningstar Style Box reveals a fund's investment strategy. For equity funds the vertical axis shows the market capitalization of the stocks owned and the horizontal axis shows investment style (value, blend or growth). All of these numbers are drawn from the data most recently provided by the fund and entered into Morningstar's database as of month end. Although the data is gathered from reliable sources, Morningstar cannot guarantee completeness and accuracy. Information shown is as of 08/31/08.
23
Performance Information – Columbia Small Cap Core Fund
Performance data quoted represents past performance and current performance may be lower or higher. Past performance is no guarantee of future results. The investment return and principal value will fluctuate so that shares, when redeemed, may be worth more or less than the original cost. Please visit www.columbiafunds.com for daily and most recent month-end performance updates.
Annual operating expense ratio (%)*
| Class A | | | 1.26 | | |
| Class B | | | 2.01 | | |
| Class C | | | 2.01 | | |
| Class T | | | 1.31 | | |
| Class Z | | | 1.01 | | |
* The annual operating expense ratio is as stated in the fund's prospectus that is current as of the date of this report. Differences in expense ratios disclosed elsewhere in this report may result from including fee waivers and expense reimbursements as well as different time periods used in calculating the ratios.
Growth of a $10,000 investment 10/01/98 – 09/30/08
The chart above shows the growth in value of a hypothetical $10,000 investment in Class A shares of Columbia Small Cap Core Fund during the stated time period, and does not reflect the deduction of taxes that a shareholder may pay on fund distributions or on the redemption of fund shares. The Russell 2000 Index measures the performance of the 2,000 smallest of the 3,000 largest US companies based on market capitalization. The Standard & Poor's (S&P) SmallCap 600 Composite Index tracks the performance of 600 domestic companies traded on the New York Stock Exchange, the American Stock Exchange and NASDAQ. Indices are not investments, do not incur fees or expenses and are not professionally managed. It is not possible to invest directly in an index. Securities in the fund may not match those in an index.
Performance of a $10,000 investment 10/01/98 – 09/30/08 ($)
| Sales charge | | without | | with | |
| Class A | | | 28,061 | | | | 26,439 | | |
| Class B | | | 25,982 | | | | 25,982 | | |
| Class C | | | 26,012 | | | | 26,012 | | |
| Class T | | | 27,668 | | | | 26,068 | | |
| Class Z | | | 28,729 | | | | N/A | | |
Average annual total return as of 09/30/08 (%)
| Share class | | A | | B | | C | | T | | Z | |
| Inception | | 11/01/98 | | 11/01/98 | | 11/18/02 | | 02/12/93 | | 12/14/92 | |
| Sales charge | | without | | with | | without | | with | | without | | with | | without | | with | | without | |
| 1-year | | | –12.86 | | | | –17.87 | | | | –13.53 | | | | –16.99 | | | | –13.46 | | | | –14.15 | | | | –12.90 | | | | –17.93 | | | | –12.60 | | |
| 5-year | | | 8.35 | | | | 7.08 | | | | 7.55 | | | | 7.29 | | | | 7.55 | | | | 7.55 | | | | 8.29 | | | | 7.02 | | | | 8.63 | | |
| 10-year | | | 10.87 | | | | 10.21 | | | | 10.02 | | | | 10.02 | | | | 10.03 | | | | 10.03 | | | | 10.71 | | | | 10.06 | | | | 11.13 | | |
The "with sales charge" returns include the maximum initial sales charge of 5.75% for Class A and Class T shares, the applicable contingent deferred sales charge of 5.00% in the first year, declining to 1.00% in the sixth year and eliminated thereafter for Class B shares and 1.00% for Class C shares for the first year only. The "without sales charge" returns do not include the effect of sales charges. If they had, returns would be lower.
Performance results reflect any fee waivers or reimbursements of fund expenses by the investment advisor and/or any of its affiliates. Absent these fee waivers or expense reimbursement arrangements, performance results would have been lower.
All results shown assume reinvestment of distributions. Class Z shares are sold at net asset value with no distribution and service (Rule 12b-1) fees. Class Z shares have limited eligibility and the investment minimum requirements may vary. Please see the fund's prospectus for details. Performance for different share classes will vary based on differences in sales charges and fees associated with each class.
The tables do not reflect the deduction of taxes that a shareholder may pay on fund distributions or on the redemption of fund shares.
On October 7, 2005, Columbia Small Cap Fund was renamed Columbia Small Cap Core Fund. Prior to November 18, 2002, the fund was named Galaxy Small Cap Value Fund, and offered Retail A, Retail B, Trust, Prime A and Prime B share classes. On that day, the fund changed its name to Liberty Small Cap Fund and began offering Class A, B, C, T and Z shares. The returns for Class A and B shares include returns of Prime A shares and Retail A shares (for Class A shares) and Prime B shares and Retail A shares (for Class B shares) of the former Galaxy Small Cap Value Fund for periods prior to the inception of Class A and Class B shares. Class C share performance information includes returns of Retail A shares of the former Galaxy Small Cap Value Fund for periods prior to the inception of Class C shares. The returns for Class T shares include the returns of Retail A shares of the Galaxy Small Cap Value Fund for periods prior to November 18, 20 02. Retail A shares were initially offered on February 12, 1993. The returns for Class Z shares include the returns of Trust shares of the Galaxy Small Cap Value Fund, for periods prior to November 18, 2002. Total returns are not restated to reflect any expense differential such as distribution and service (Rule 12b-1) fees between any of the share classes. Had the expense differential been reflected, the returns for the periods prior to the inception of Class A, Class B and Class C shares would have been lower.
24
Understanding Your Expenses – Columbia Small Cap Core Fund
As a fund shareholder, you incur two types of costs. There are transaction costs, which generally include sales charges on purchases and may include redemption fees or exchange fees. There are also ongoing costs, which generally include investment advisory fees, distribution and service (Rule 12b-1) fees and other fund expenses. The information on this page is intended to help you understand the ongoing costs of investing in the fund and to compare these costs with the ongoing costs of investing in other mutual funds.
Analyzing your fund's expenses by share class
To illustrate these ongoing costs, we have provided an example and calculated the expenses paid by investors in each share class during the period. The information in the following table is based on an initial investment of $1,000, which is invested at the beginning of the period and held for the entire period. Expense information is calculated two ways and each method provides you with different information. The amount listed in the "actual" column is calculated using the fund's actual operating expenses and total return for the period. The amount listed in the "hypothetical" column for each share class assumes that the return each year is 5% before expenses and is calculated based on the fund's actual operating expenses. You should not use the hypothetical account values and expenses to estimate either your actual account balance at the end of the period or the expenses you paid during this period.
Compare with other funds
Since all mutual funds are required to include the same hypothetical calculations about expenses in shareholder reports, you can use this information to compare the ongoing costs of investing in the fund with other funds. To do so, compare the 5% hypothetical example with the 5% hypothetical examples that appear in the shareholder reports of other funds. As you compare hypothetical examples of other funds, it is important to note that hypothetical examples are meant to highlight the ongoing costs of investing in a fund and do not reflect any transaction costs, such as sales charges, redemption fees or exchange fees.
Estimating your actual expenses
To estimate the expenses that you paid over the period, first you will need your account balance at the end of the period:
g For shareholders who receive their account statements from Columbia Management Services, Inc., your account balance is available online at www.columbiafunds.com or by calling Shareholder Services at 800.345.6611.
g For shareholders who receive their account statements from their financial intermediary, contact your financial intermediary to obtain your account balance.
1. Divide your ending account balance by $1,000. For example, if an account balance was $8,600 at the end of the period, the result would be 8.6.
2. In the section of the table below titled "Expenses paid during the period," locate the amount for your share class. You will find this number in the column labeled "actual." Multiply this number by the result from step 1. Your answer is an estimate of the expenses you paid on your account during the period.
If the value of your account falls below the minimum initial investment requirement applicable to you, your account generally will be subject to a $20 annual fee. This fee is not included in the accompanying table. If you are subject to the fee, keep it in mind when you are estimating the ongoing expenses of investing in the fund and when comparing the expenses of this fund with other funds.
04/01/08 – 09/30/08
| | | Account value at the
beginning of the period ($) | | Account value at the
end of the period ($) | | Expenses paid
during the period ($) | | Fund's annualized
expense ratio (%) | |
| | | Actual | | Hypothetical | | Actual | | Hypothetical | | Actual | | Hypothetical | | Actual | |
| Class A | | | 1,000.00 | | | | 1,000.00 | | | | 990.20 | | | | 1,018.75 | | | | 6.22 | | | | 6.31 | | | | 1.25 | | |
| Class B | | | 1,000.00 | | | | 1,000.00 | | | | 986.30 | | | | 1,015.00 | | | | 9.93 | | | | 10.08 | | | | 2.00 | | |
| Class C | | | 1,000.00 | | | | 1,000.00 | | | | 985.60 | | | | 1,015.00 | | | | 9.93 | | | | 10.08 | | | | 2.00 | | |
| Class T | | | 1,000.00 | | | | 1,000.00 | | | | 989.40 | | | | 1,018.50 | | | | 6.47 | | | | 6.56 | | | | 1.30 | | |
| Class Z | | | 1,000.00 | | | | 1,000.00 | | | | 990.40 | | | | 1,020.00 | | | | 4.98 | | | | 5.05 | | | | 1.00 | | |
Expenses paid during the period are equal to the annualized expense ratio for the share class, multiplied by the average account value over the period, then multiplied by the number of days in the fund's most recent fiscal half-year and divided by 366.
It is important to note that the expense amounts shown in the table are meant to highlight only ongoing costs of investing in the fund and do not reflect any transaction costs, such as sales charges, redemption fees or exchange fees. Therefore, the hypothetical examples provided may not help you determine the relative total costs of owning shares of different funds. If these transaction costs were included, your costs would have been higher.
25
Portfolio Managers' Report – Columbia Small Cap Core Fund
Performance data quoted represents past performance and current performance may be lower or higher. Past performance is no guarantee of future results. The investment return and principal value will fluctuate so that shares, when redeemed, may be worth more or less than the original cost. Please visit www.columbiafunds.com for daily and most recent month-end performance updates.
Net asset value per share
as of 09/30/08 ($)
| Class A | | | 14.14 | | |
| Class B | | | 12.97 | | |
| Class C | | | 12.99 | | |
| Class T | | | 13.94 | | |
| Class Z | | | 14.42 | | |
Distributions declared per share
10/01/07 – 09/30/08 ($)
| Class A | | | 3.67 | | |
| Class B | | | 3.64 | | |
| Class C | | | 3.64 | | |
| Class T | | | 3.66 | | |
| Class Z | | | 3.72 | | |
For the 12-month period that ended September 30, 2008, the fund's Class A shares returned negative 12.86% without sales charge. The fund's benchmarks, the S&P SmallCap 600 Composite Index and the Russell 2000 Index, returned negative 13.82% and negative 14.48%, respectively, for the same period.1 The average return of the fund's peer group, the Lipper Small-Cap Core Funds Classification, was negative 18.73%.2 The fund held up better than its benchmarks and Lipper peers, largely because it had substantially less exposure to financial services companies.
Lower exposure to financials aided performance
With financial stocks falling sharply because of a meltdown in the subprime mortgage market, which triggered a broader credit crisis, the fund's exposure to these companies was about half that of the Russell 2000 Index. While financial stocks performed well in the final three months of the period, the fund was still better off not having as much exposure to the sector for the entire 12-month period.
The fund also benefited from a well-timed shift in its energy holdings. When the price of oil was between $120 and $140 a barrel, the portfolio's energy holdings were reduced. After the price of oil peaked at $147 a barrel, then began to fall, the shift helped the fund. For example, Whiting Petroleum Corp., which had been a positive contributor to the fund, was sold out of the portfolio at about $107 per share; by the end of September, the stock was selling for about $71 per share.
The fund also benefited from news of mergers involving several companies in the portfolio. For example, Darwin Professional Underwriters, Inc., an insurance company; Excel Technologies, Inc., a manufacturer of laser systems and electro-optical components; Hilb Rogal & Hobbs Co., an insurance broker; and Datascope Corp., a medical device company, have either been merged into other companies or are in the process of being acquired at a premium.
A number of individual stocks also performed relatively well. One was Unifirst Corp., a uniform rental company that reported strong profits compared to its competition. Another was Buckle, Inc., a Nebraska-based retail clothing chain that has reported strong sales growth for many months in a row.
Information technology and industrial stocks disappointed
As a group, technology was the fund's weakest-performing sector during the period. One of the worst performers was Benchmark Electronics, Inc., a company that provides electronics manufacturing services. The company said revenue from some of its older programs declined before newer programs could make up for the shortfall. However,
1The Standard & Poor's (S&P) SmallCap 600 Composite Index tracks the performance of 600 domestic companies traded on the New York Stock Exchange, the American Stock Exchange and NASDAQ. The Russell 2000 Index measures the performance of the 2,000 smallest of 3,000 largest US companies based on market capitalization. Indices are not investments, do not incur fees or expenses and are not professionally managed. It is not possible to invest directly in an index. Securities in the fund may not match those in an index.
2Lipper Inc., a widely respected data provider in the industry, calculates an average total return (assuming reinvestment of distributions) for mutual funds with investment objectives similar to those of the fund. Lipper makes no adjustment for the effect of sales loads.
26
Portfolio Managers' Report (continued) – Columbia Small Cap Core Fund
Benchmark still has adequate cash on hand and its earnings have been decent. As a result, it is still in the portfolio. Also, a number of industrial stocks fared poorly. For example, Consolidated Graphics Inc., one of the industry's premier printing companies, lost ground. Printing is a cyclical business, subject to swings in the economy, and as such, the industry did not fare well in an environment of slower growth. The company is well managed, and we've added to our position because we believe that it has potential for the longer term.
Looking ahead—and staying with our strategy
In spite of the market turmoil of the past 12 months, our fundamental strategy has not changed. We plan to continue to look for stocks that we think are cheap relative to their earnings power. If a stock declines and we still like the company, we're more inclined to add to the position than to sell it. The fund's portfolio turnover is low. Yet, we are cautiously looking to take advantage of new opportunities that are the result of the stock-market selloff.
Portfolio holdings and characteristics are subject to change periodically and may not be representative of current holdings and characteristics. The outlook for the fund may differ from that presented for other Columbia Funds.
Equity investments are affected by stock market fluctuations that occur in response to economic and business developments.
Investments in small-cap stocks may be subject to greater volatility and price fluctuations because they may be thinly traded and less liquid than investments in larger companies.
Top 5 equity sectors
as of 09/30/08 (%)
| Information Technology | | | 22.9 | | |
| Industrials | | | 22.1 | | |
| Health Care | | | 17.6 | | |
| Consumer Discretionary | | | 13.0 | | |
| Financials | | | 10.6 | | |
Sector breakdown is calculated as a percentage of total investments excluding short-term investments.
Top 10 holdings
as of 09/30/08 (%)
| Res-Care, Inc. | | | 2.0 | | |
| Benchmark Electronics, Inc. | | | 1.9 | | |
| NCI Building Systems, Inc. | | | 1.6 | | |
| Unifirst Corp. | | | 1.4 | | |
| EMCOR Group, Inc. | | | 1.2 | | |
| Kforce, Inc. | | | 1.2 | | |
| Invacare Corp. | | | 1.1 | | |
| Moog, Inc. | | | 1.1 | | |
| Sensient Technologies Corp. | | | 1.0 | | |
| H.B. Fuller Co. | | | 1.0 | | |
Holdings discussed in this report
as of 09/30/08 (%)
Darwin Professional
Underwriters Inc. | | | 0.5 | | |
| Hilb Rogal & Hobbs | | | 0.1 | | |
| Datascope Corp. | | | 0.9 | | |
| Unifirst Corp. | | | 1.4 | | |
| Buckle, Inc. | | | 0.4 | | |
| Benchmark Electronics, Inc. | | | 1.9 | | |
| Consolidated Graphics, Inc. | | | 0.5 | | |
The fund is actively managed and the composition of its portfolio will change over time. Information provided is calculated as a percentage of net assets.
27
Investment Portfolio – Columbia Asset Allocation Fund
September 30, 2008
| Common Stocks – 57.6% | |
| | | Shares | | Value ($) | |
| Consumer Discretionary – 5.3% | |
| Auto Components – 0.1% | |
| BorgWarner, Inc. | | | 2,820 | | | | 92,411 | | |
| Denso Corp. | | | 3,100 | | | | 76,136 | | |
| Gentex Corp. | | | 2,400 | | | | 34,320 | | |
| Johnson Controls, Inc. | | | 3,000 | | | | 90,990 | | |
| Modine Manufacturing Co. | | | 670 | | | | 9,702 | | |
| WABCO Holdings, Inc. | | | 982 | | | | 34,900 | | |
| Auto Components Total | | | 338,459 | | |
| Automobiles – 0.2% | |
Dongfeng Motor Group Co., Ltd.,
Class H | | | 434,000 | | | | 160,416 | | |
| Ford Motor Co. (a) | | | 6,626 | | | | 34,455 | | |
| Honda Motor Co., Ltd. | | | 4,000 | | | | 118,802 | | |
| Toyota Motor Corp. | | | 2,800 | | | | 118,880 | | |
| Automobiles Total | | | 432,553 | | |
| Distributors – 0.1% | |
| Inchcape PLC | | | 42,732 | | | | 144,663 | | |
| LKQ Corp. (a) | | | 4,458 | | | | 75,652 | | |
| Distributors Total | | | 220,315 | | |
| Diversified Consumer Services – 0.3% | |
| Apollo Group, Inc., Class A (a) | | | 5,080 | | | | 301,244 | | |
| Benesse Corp. | | | 5,200 | | | | 212,252 | | |
| Capella Education Co. (a) | | | 834 | | | | 35,745 | | |
| DeVry, Inc. | | | 1,359 | | | | 67,325 | | |
| ITT Educational Services, Inc. (a) | | | 780 | | | | 63,110 | | |
| Regis Corp. | | | 520 | | | | 14,300 | | |
| Sotheby's | | | 720 | | | | 14,443 | | |
| Diversified Consumer Services Total | | | 708,419 | | |
| Hotels, Restaurants & Leisure – 1.0% | |
| Bally Technologies, Inc. (a) | | | 760 | | | | 23,013 | | |
| Benihana, Inc., Class A (a) | | | 2,052 | | | | 9,439 | | |
| Bob Evans Farms, Inc. | | | 690 | | | | 18,830 | | |
| Carnival Corp. | | | 21,800 | | | | 770,630 | | |
| CEC Entertainment, Inc. (a) | | | 560 | | | | 18,592 | | |
| Darden Restaurants, Inc. | | | 1,810 | | | | 51,820 | | |
| Kangwon Land, Inc. | | | 7,200 | | | | 87,203 | | |
| Landry's Restaurants, Inc. | | | 920 | | | | 14,306 | | |
| McDonald's Corp. | | | 15,720 | | | | 969,924 | | |
| O'Charleys, Inc. | | | 930 | | | | 8,138 | | |
| Paddy Power PLC | | | 9,921 | | | | 172,700 | | |
| Panera Bread Co., Class A (a) | | | 657 | | | | 33,441 | | |
| Penn National Gaming, Inc. (a) | | | 1,400 | | | | 37,198 | | |
Red Robin Gourmet
Burgers, Inc. (a) | | | 1,294 | | | | 34,679 | | |
| Royal Caribbean Cruises Ltd. | | | 5,410 | | | | 112,258 | | |
| Starbucks Corp. (a) | | | 3,820 | | | | 56,803 | | |
| | | Shares | | Value ($) | |
Starwood Hotels & Resorts
Worldwide, Inc. | | | 2,820 | | | | 79,355 | | |
| WMS Industries, Inc. (a) | | | 3,089 | | | | 94,431 | | |
| Yum! Brands, Inc. | | | 2,210 | | | | 72,068 | | |
| Hotels, Restaurants & Leisure Total | | | 2,664,828 | | |
| Household Durables – 0.2% | |
| American Greetings Corp., Class A | | | 1,870 | | | | 28,592 | | |
| Cavco Industries, Inc. (a) | | | 402 | | | | 14,532 | | |
| CSS Industries, Inc. | | | 510 | | | | 13,128 | | |
| Ethan Allen Interiors, Inc. | | | 370 | | | | 10,367 | | |
Furniture Brands
International, Inc. | | | 900 | | | | 9,468 | | |
| JM AB | | | 15,500 | | | | 126,745 | | |
Matsushita Electric
Industrial Co., Ltd. | | | 16,000 | | | | 277,681 | | |
| Tempur-Pedic International, Inc. | | | 2,251 | | | | 26,472 | | |
| Universal Electronics, Inc. (a) | | | 437 | | | | 10,916 | | |
| Household Durables Total | | | 517,901 | | |
| Internet & Catalog Retail – 0.0% | |
| NetFlix, Inc. (a) | | | 1,187 | | | | 36,655 | | |
| NutriSystem, Inc. | | | 550 | | | | 9,746 | | |
| Internet & Catalog Retail Total | | | 46,401 | | |
| Leisure Equipment & Products – 0.1% | |
| Brunswick Corp. | | | 1,610 | | | | 20,592 | | |
| Hasbro, Inc. | | | 1,900 | | | | 65,968 | | |
| Mattel, Inc. | | | 1,720 | | | | 31,029 | | |
| Nikon Corp. | | | 4,000 | | | | 95,082 | | |
| Leisure Equipment & Products Total | | | 212,671 | | |
| Media – 0.7% | |
| Comcast Corp., Class A | | | 26,000 | | | | 510,380 | | |
| DIRECTV Group, Inc. (a) | | | 15,900 | | | | 416,103 | | |
| Liberty Media Corp. (a) | | | 3,800 | | | | 94,886 | | |
| Marvel Entertainment, Inc. (a) | | | 1,487 | | | | 50,766 | | |
| McGraw-Hill Companies, Inc. | | | 6,970 | | | | 220,322 | | |
Regal Entertainment Group,
Class A | | | 3,000 | | | | 47,340 | | |
| Vivendi | | | 11,626 | | | | 363,813 | | |
| Media Total | | | 1,703,610 | | |
| Multiline Retail – 0.7% | |
| Kohl's Corp. (a) | | | 21,920 | | | | 1,010,074 | | |
| Macy's, Inc. | | | 30,396 | | | | 546,520 | | |
| Nordstrom, Inc. | | | 1,410 | | | | 40,636 | | |
| Saks, Inc. (a) | | | 9,893 | | | | 91,510 | | |
| Multiline Retail Total | | | 1,688,740 | | |
| Specialty Retail – 1.2% | |
| Advance Auto Parts, Inc. | | | 1,290 | | | | 51,161 | | |
| America's Car-Mart, Inc. (a) | | | 1,235 | | | | 22,959 | | |
See Accompanying Notes to Financial Statements.
28
Columbia Asset Allocation Fund
September 30, 2008
| Common Stocks (continued) | |
| | | Shares | | Value ($) | |
| Best Buy Co., Inc. | | | 8,600 | | | | 322,500 | | |
| Chico's FAS, Inc. (a) | | | 4,070 | | | | 22,263 | | |
| Citi Trends, Inc. (a) | | | 1,195 | | | | 19,467 | | |
| Dick's Sporting Goods, Inc. (a) | | | 10,600 | | | | 207,548 | | |
| Foot Locker, Inc. | | | 887 | | | | 14,334 | | |
| GameStop Corp., Class A (a) | | | 890 | | | | 30,447 | | |
| Guess ?, Inc. | | | 810 | | | | 28,180 | | |
| J Crew Group, Inc. (a) | | | 1,503 | | | | 42,941 | | |
| Lowe's Companies, Inc. | | | 37,000 | | | | 876,530 | | |
| MarineMax, Inc. (a) | | | 1,213 | | | | 8,770 | | |
| Monro Muffler Brake, Inc. | | | 1,290 | | | | 29,747 | | |
| OfficeMax, Inc. | | | 1,620 | | | | 14,402 | | |
| Rent-A-Center, Inc. (a) | | | 1,479 | | | | 32,952 | | |
| Ross Stores, Inc. | | | 1,240 | | | | 45,644 | | |
| Sherwin-Williams Co. | | | 780 | | | | 44,585 | | |
| Shoe Carnival, Inc. (a) | | | 148 | | | | 2,424 | | |
| Staples, Inc. | | | 28,400 | | | | 639,000 | | |
| Tiffany & Co. | | | 800 | | | | 28,416 | | |
| TJX Companies, Inc. | | | 2,420 | | | | 73,858 | | |
| Tractor Supply Co. (a) | | | 760 | | | | 31,958 | | |
| Urban Outfitters, Inc. (a) | | | 13,310 | | | | 424,190 | | |
| Zale Corp. (a) | | | 620 | | | | 15,500 | | |
| Specialty Retail Total | | | 3,029,776 | | |
| Textiles, Apparel & Luxury Goods – 0.7% | |
| Deckers Outdoor Corp. (a) | | | 560 | | | | 58,284 | | |
| Fossil, Inc. (a) | | | 1,057 | | | | 29,839 | | |
| Hampshire Group Ltd. (a) | | | 765 | | | | 5,661 | | |
| Lululemon Athletica, Inc. (a) | | | 1,560 | | | | 35,927 | | |
| Movado Group, Inc. | | | 820 | | | | 18,327 | | |
| NIKE, Inc., Class B | | | 4,300 | | | | 287,670 | | |
| Phillips-Van Heusen Corp. | | | 2,533 | | | | 96,026 | | |
| Polo Ralph Lauren Corp. | | | 7,431 | | | | 495,202 | | |
| V.F. Corp. | | | 10,300 | | | | 796,293 | | |
| Warnaco Group, Inc. (a) | | | 796 | | | | 36,051 | | |
| Wolverine World Wide, Inc. | | | 780 | | | | 20,639 | | |
| Textiles, Apparel & Luxury Goods Total | | | 1,879,919 | | |
| Consumer Discretionary Total | | | 13,443,592 | | |
| Consumer Staples – 6.4% | |
| Beverages – 1.2% | |
| Anheuser-Busch Companies, Inc. | | | 5,200 | | | | 337,376 | | |
Central European
Distribution Corp. (a) | | | 681 | | | | 30,924 | | |
| Coca-Cola Co. | | | 12,200 | | | | 645,136 | | |
| Diageo PLC, ADR | | | 9,151 | | | | 630,138 | | |
Fomento Economico Mexicano
SAB de CV, ADR | | | 7,556 | | | | 288,186 | | |
| Heineken NV | | | 3,566 | | | | 143,701 | | |
| | | Shares | | Value ($) | |
| MGP Ingredients, Inc. | | | 2,026 | | | | 5,754 | | |
| Pepsi Bottling Group, Inc. | | | 2,200 | | | | 64,174 | | |
| PepsiCo, Inc. | | | 12,200 | | | | 869,494 | | |
| Beverages Total | | | 3,014,883 | | |
| Food & Staples Retailing – 1.5% | |
| BJ's Wholesale Club, Inc. (a) | | | 9,670 | | | | 375,776 | | |
| CVS Caremark Corp. | | | 11,000 | | | | 370,260 | | |
| Kroger Co. | | | 20,410 | | | | 560,867 | | |
| Longs Drug Stores Corp. | | | 329 | | | | 24,886 | | |
| Ruddick Corp. | | | 630 | | | | 20,444 | | |
| Seven & I Holdings Co., Ltd. | | | 12,500 | | | | 359,779 | | |
| Spartan Stores, Inc. | | | 280 | | | | 6,966 | | |
| Sysco Corp. | | | 15,600 | | | | 480,948 | | |
| Wal-Mart Stores, Inc. | | | 25,700 | | | | 1,539,173 | | |
| Weis Markets, Inc. | | | 1,000 | | | | 36,010 | | |
| Whole Foods Market, Inc. | | | 790 | | | | 15,824 | | |
| Food & Staples Retailing Total | | | 3,790,933 | | |
| Food Products – 1.2% | |
| Cadbury PLC, ADR | | | 633 | | | | 25,915 | | |
| China Milk Products Group Ltd. | | | 277,000 | | | | 115,253 | | |
| ConAgra Foods, Inc. | | | 39,400 | | | | 766,724 | | |
| Dean Foods Co. (a) | | | 4,300 | | | | 100,448 | | |
| Flowers Foods, Inc. | | | 1,365 | | | | 40,076 | | |
| Fresh Del Monte Produce, Inc. (a) | | | 1,183 | | | | 26,263 | | |
| General Mills, Inc. | | | 4,200 | | | | 288,624 | | |
| H.J. Heinz Co. | | | 8,150 | | | | 407,255 | | |
| Hershey Co. | | | 1,100 | | | | 43,494 | | |
| J & J Snack Foods Corp. | | | 467 | | | | 15,836 | | |
| Lancaster Colony Corp. | | | 610 | | | | 22,973 | | |
| Lance, Inc. | | | 917 | | | | 20,807 | | |
| Nestle SA, Registered Shares | | | 7,460 | | | | 322,660 | | |
| Ralcorp Holdings, Inc. (a) | | | 270 | | | | 18,201 | | |
| Sanderson Farms, Inc. | | | 635 | | | | 23,330 | | |
| Smithfield Foods, Inc. (a) | | | 10,275 | | | | 163,167 | | |
| Toyo Suisan Kaisha Ltd. | | | 6,000 | | | | 152,100 | | |
| Tyson Foods, Inc., Class A | | | 20,100 | | | | 239,994 | | |
| Unilever PLC | | | 4,867 | | | | 132,120 | | |
| Food Products Total | | | 2,925,240 | | |
| Household Products – 0.8% | |
| Clorox Co. | | | 1,360 | | | | 85,258 | | |
| Kimberly-Clark Corp. | | | 5,100 | | | | 330,684 | | |
| Procter & Gamble Co. | | | 24,600 | | | | 1,714,374 | | |
| Household Products Total | | | 2,130,316 | | |
| Personal Products – 0.7% | |
| Avon Products, Inc. | | | 35,216 | | | | 1,463,929 | | |
| Chattem, Inc. (a) | | | 271 | | | | 21,187 | | |
Estee Lauder Companies,
Inc., Class A | | | 875 | | | | 43,671 | | |
See Accompanying Notes to Financial Statements.
29
Columbia Asset Allocation Fund
September 30, 2008
| Common Stocks (continued) | |
| | | Shares | | Value ($) | |
| NBTY, Inc. (a) | | | 640 | | | | 18,893 | | |
| Shiseido Co., Ltd. | | | 9,000 | | | | 201,585 | | |
| Unicharm Corp. | | | 2,200 | | | | 168,758 | | |
| Personal Products Total | | | 1,918,023 | | |
| Tobacco – 1.0% | |
| British American Tobacco PLC | | | 5,642 | | | | 184,354 | | |
| Japan Tobacco, Inc. | | | 21 | | | | 79,062 | | |
| Lorillard, Inc. | | | 12,245 | | | | 871,232 | | |
| Philip Morris International, Inc. | | | 27,226 | | | | 1,309,570 | | |
| Tobacco Total | | | 2,444,218 | | |
| Consumer Staples Total | | | 16,223,613 | | |
| Energy – 6.5% | |
| Energy Equipment & Services – 1.6% | |
| Basic Energy Services, Inc. (a) | | | 1,140 | | | | 24,282 | | |
| Cameron International Corp. (a) | | | 1,490 | | | | 57,425 | | |
Complete Production
Services, Inc. (a) | | | 2,362 | | | | 47,547 | | |
| Core Laboratories N.V. | | | 390 | | | | 39,515 | | |
| Diamond Offshore Drilling, Inc. | | | 890 | | | | 91,723 | | |
| Dril-Quip, Inc. (a) | | | 279 | | | | 12,106 | | |
| FMC Technologies, Inc. (a) | | | 1,120 | | | | 52,136 | | |
| Halliburton Co. | | | 21,704 | | | | 702,993 | | |
| IHS, Inc., Class A (a) | | | 779 | | | | 37,112 | | |
| Key Energy Services, Inc. (a) | | | 1,100 | | | | 12,760 | | |
| Nabors Industries Ltd. (a) | | | 12,000 | | | | 299,040 | | |
| National-Oilwell Varco, Inc. (a) | | | 1,120 | | | | 56,258 | | |
| Newpark Resources, Inc. (a) | | | 1,074 | | | | 7,840 | | |
| Noble Corp. | | | 5,042 | | | | 221,344 | | |
| Oil States International, Inc. (a) | | | 271 | | | | 9,580 | | |
| Patterson-UTI Energy, Inc. | | | 450 | | | | 9,009 | | |
| Pioneer Drilling Co. (a) | | | 1,724 | | | | 22,929 | | |
| Rowan Companies, Inc. | | | 975 | | | | 29,786 | | |
| Schlumberger Ltd. | | | 10,900 | | | | 851,181 | | |
| Smith International, Inc. | | | 4,200 | | | | 246,288 | | |
| T-3 Energy Services, Inc. (a) | | | 670 | | | | 24,870 | | |
| Technip SA | | | 2,523 | | | | 141,733 | | |
| TGC Industries, Inc. (a) | | | 1,387 | | | | 7,296 | | |
| Tidewater, Inc. | | | 1,140 | | | | 63,110 | | |
| Transocean, Inc. (a) | | | 5,692 | | | | 625,209 | | |
| TriCo Marine Services, Inc. (a) | | | 203 | | | | 3,467 | | |
| Weatherford International Ltd. (a) | | | 14,000 | | | | 351,960 | | |
| Energy Equipment & Services Total | | | 4,048,499 | | |
| Oil, Gas & Consumable Fuels – 4.9% | |
| Alpha Natural Resources, Inc. (a) | | | 1,120 | | | | 57,602 | | |
| Arena Resources, Inc. (a) | | | 840 | | | | 32,634 | | |
| Atlas America, Inc. | | | 866 | | | | 29,539 | | |
| | | Shares | | Value ($) | |
| Berry Petroleum Co., Class A | | | 811 | | | | 31,410 | | |
| BG Group PLC | | | 13,095 | | | | 237,268 | | |
| Bill Barrett Corp. (a) | | | 712 | | | | 22,862 | | |
| BP PLC, ADR | | | 8,153 | | | | 409,036 | | |
| Carrizo Oil & Gas, Inc. (a) | | | 662 | | | | 24,011 | | |
| Centennial Coal Co., Ltd. | | | 38,181 | | | | 114,343 | | |
| Chevron Corp. | | | 10,300 | | | | 849,544 | | |
| Comstock Resources, Inc. (a) | | | 1,280 | | | | 64,064 | | |
| Concho Resources, Inc. (a) | | | 2,640 | | | | 72,890 | | |
| ConocoPhillips | | | 14,138 | | | | 1,035,608 | | |
| CONSOL Energy, Inc. | | | 880 | | | | 40,383 | | |
| Continental Resources, Inc. (a) | | | 1,574 | | | | 61,748 | | |
| Denbury Resources, Inc. (a) | | | 3,530 | | | | 67,211 | | |
| Devon Energy Corp. | | | 6,000 | | | | 547,200 | | |
| El Paso Corp. | | | 68,575 | | | | 875,017 | | |
| EXCO Resources, Inc. (a) | | | 1,330 | | | | 21,706 | | |
| Exxon Mobil Corp. | | | 30,975 | | | | 2,405,518 | | |
| Forest Oil Corp. (a) | | | 1,050 | | | | 52,080 | | |
| Frontier Oil Corp. | | | 2,690 | | | | 49,550 | | |
Harvest Natural
Resources, Inc. (a) | | | 2,120 | | | | 21,454 | | |
| Hess Corp. | | | 14,075 | | | | 1,155,276 | | |
| Holly Corp. | | | 480 | | | | 13,882 | | |
| Newfield Exploration Co. (a) | | | 8,350 | | | | 267,117 | | |
Nordic American
Tanker Shipping | | | 385 | | | | 12,343 | | |
| Occidental Petroleum Corp. | | | 15,100 | | | | 1,063,795 | | |
| Peabody Energy Corp. | | | 600 | | | | 27,000 | | |
| Penn Virginia Corp. | | | 621 | | | | 33,186 | | |
| PetroChina Co., Ltd., Class H | | | 214,000 | | | | 226,206 | | |
| PetroHawk Energy Corp. (a) | | | 2,120 | | | | 45,856 | | |
| Petroleo Brasileiro SA, ADR | | | 11,308 | | | | 496,987 | | |
| Range Resources Corp. | | | 790 | | | | 33,867 | | |
| Royal Dutch Shell PLC, Class B | | | 8,146 | | | | 231,098 | | |
| Southwestern Energy Co. (a) | | | 2,382 | | | | 72,746 | | |
| StatoilHydro ASA | | | 10,100 | | | | 240,775 | | |
| Stone Energy Corp. (a) | | | 561 | | | | 23,747 | | |
| Swift Energy Co. (a) | | | 300 | | | | 11,607 | | |
| Total SA | | | 3,022 | | | | 182,320 | | |
| Ultra Petroleum Corp. (a) | | | 4,740 | | | | 262,312 | | |
| Valero Energy Corp. | | | 16,200 | | | | 490,860 | | |
| Williams Companies, Inc. | | | 2,100 | | | | 49,665 | | |
Yanzhou Coal Mining Co., Ltd.,
Class H | | | 136,000 | | | | 142,097 | | |
| Oil, Gas & Consumable Fuels Total | | | 12,205,420 | | |
| Energy Total | | | 16,253,919 | | |
See Accompanying Notes to Financial Statements.
30
Columbia Asset Allocation Fund
September 30, 2008
| Common Stocks (continued) | |
| | | Shares | | Value ($) | |
| Financials – 10.5% | |
| Capital Markets – 1.4% | |
| Ameriprise Financial, Inc. | | | 3,200 | | | | 122,240 | | |
Credit Suisse Group AG,
Registered Shares | | | 3,437 | | | | 163,640 | | |
Deutsche Bank AG,
Registered Shares | | | 4,164 | | | | 296,259 | | |
| Goldman Sachs Group, Inc. (b) | | | 7,469 | | | | 956,032 | | |
| Greenhill & Co., Inc. | | | 344 | | | | 25,370 | | |
| Invesco Ltd. | | | 2,500 | | | | 52,450 | | |
| Janus Capital Group, Inc. | | | 16,560 | | | | 402,077 | | |
| Jefferies Group, Inc. | | | 1,800 | | | | 40,320 | | |
| Northern Trust Corp. | | | 680 | | | | 49,096 | | |
| Piper Jaffray Companies, Inc. (a) | | | 590 | | | | 25,518 | | |
| State Street Corp. | | | 12,317 | | | | 700,591 | | |
| Stifel Financial Corp. (a) | | | 457 | | | | 22,804 | | |
| T Rowe Price Group, Inc. | | | 1,320 | | | | 70,897 | | |
| TD Ameritrade Holding Corp. (a) | | | 14,100 | | | | 228,420 | | |
Waddell & Reed Financial,
Inc., Class A | | | 16,898 | | | | 418,225 | | |
| Capital Markets Total | | | 3,573,939 | | |
| Commercial Banks – 4.1% | |
Australia & New Zealand
Banking Group Ltd. | | | 9,316 | | | | 144,048 | | |
| BancFirst Corp. | | | 486 | | | | 23,488 | | |
Banco Bilbao Vizcaya
Argentaria SA | | | 25,804 | | | | 418,311 | | |
| Banco Santander SA | | | 35,105 | | | | 531,404 | | |
| BancTrust Financial Group, Inc. | | | 1,578 | | | | 20,703 | | |
| Bank of Granite Corp. | | | 1,759 | | | | 4,098 | | |
| Bank of Hawaii Corp. | | | 1,900 | | | | 101,555 | | |
| Barclays PLC | | | 39,835 | | | | 241,989 | | |
| BNP Paribas | | | 3,692 | | | | 354,924 | | |
| Bryn Mawr Bank Corp. | | | 947 | | | | 20,815 | | |
| Capital Corp. of the West | | | 1,566 | | | | 6,201 | | |
| Capitol Bancorp Ltd. | | | 1,175 | | | | 22,901 | | |
| Chemical Financial Corp. | | | 1,300 | | | | 40,482 | | |
| Citigroup, Inc. | | | 61,952 | | | | 1,270,636 | | |
| City National Corp. | | | 1,400 | | | | 76,020 | | |
| Columbia Banking System, Inc. | | | 870 | | | | 15,425 | | |
| Comerica, Inc. | | | 2,800 | | | | 91,812 | | |
| Community Trust Bancorp, Inc. | | | 608 | | | | 20,915 | | |
| Cullen/Frost Bankers, Inc. | | | 1,800 | | | | 108,000 | | |
| DBS Group Holdings Ltd. | | | 17,000 | | | | 200,992 | | |
First Citizens BancShares,
Inc., Class A | | | 213 | | | | 38,127 | | |
| First Financial Corp. | | | 859 | | | | 40,356 | | |
| First Horizon National Corp. | | | 1,451 | | | | 13,577 | | |
| First National Bank of Alaska (c) | | | 9 | | | | 16,110 | | |
| | | Shares | | Value ($) | |
| HSBC Holdings PLC (d) | | | 24,809 | | | | 401,778 | | |
Industrial & Commercial
Bank of China, Class H | | | 177,000 | | | | 105,433 | | |
| KeyCorp | | | 2,800 | | | | 33,432 | | |
| Lloyds TSB Group PLC | | | 40,127 | | | | 166,919 | | |
| Marshall & Ilsley Corp. | | | 6,098 | | | | 122,875 | | |
Mass Financial Corp.,
Class A (a) | | | 1,750 | | | | 7,875 | | |
| Merchants Bancshares, Inc. | | | 913 | | | | 22,140 | | |
| Mizuho Financial Group, Inc. | | | 64 | | | | 280,790 | | |
| Northfield Bancorp, Inc. (a) | | | 1,099 | | | | 13,309 | | |
| Northrim BanCorp, Inc. | | | 1,027 | | | | 16,843 | | |
Pinnacle Financial
Partners, Inc. (a) | | | 909 | | | | 27,997 | | |
PNC Financial Services
Group, Inc. | | | 11,146 | | | | 832,606 | | |
Royal Bank of Scotland
Group PLC | | | 16,753 | | | | 55,495 | | |
| Sterling Bancorp NY | | | 1,430 | | | | 20,678 | | |
Sumitomo Trust &
Banking Co., Ltd. | | | 17,000 | | | | 112,780 | | |
| SunTrust Banks, Inc. | | | 13,600 | | | | 611,864 | | |
| SVB Financial Group (a) | | | 1,500 | | | | 86,880 | | |
| Swedbank AB, Class A | | | 9,400 | | | | 123,926 | | |
| Taylor Capital Group, Inc. | | | 1,075 | | | | 12,889 | | |
| TCF Financial Corp. | | | 8,696 | | | | 156,528 | | |
| U.S. Bancorp | | | 34,339 | | | | 1,236,891 | | |
Uniao de Bancos
Brasileiros SA, GDR | | | 1,070 | | | | 107,984 | | |
| United Overseas Bank Ltd. | | | 9,000 | | | | 106,603 | | |
| Wells Fargo & Co. | | | 40,966 | | | | 1,537,454 | | |
| West Coast Bancorp | | | 1,280 | | | | 18,765 | | |
| Whitney Holding Corp. | | | 1,410 | | | | 34,193 | | |
Yamaguchi Financial
Group, Inc. | | | 12,000 | | | | 144,235 | | |
| Zions Bancorporation | | | 1,925 | | | | 74,498 | | |
| Commercial Banks Total | | | 10,296,549 | | |
| Consumer Finance – 0.1% | |
Advance America Cash
Advance Centers, Inc. | | | 2,540 | | | | 7,595 | | |
| Cash America International, Inc. | | | 1,130 | | | | 40,725 | | |
| ORIX Corp. | | | 1,040 | | | | 128,612 | | |
| SLM Corp. (a) | | | 2,870 | | | | 35,416 | | |
| World Acceptance Corp. (a) | | | 1,170 | | | | 42,120 | | |
| Consumer Finance Total | | | 254,468 | | |
| Diversified Financial Services – 1.5% | |
| CME Group, Inc. | | | 158 | | | | 58,698 | | |
| Fortis | | | 8,439 | | | | 53,045 | | |
| ING Groep NV | | | 14,246 | | | | 309,896 | | |
See Accompanying Notes to Financial Statements.
31
Columbia Asset Allocation Fund
September 30, 2008
| Common Stocks (continued) | |
| | | Shares | | Value ($) | |
| IntercontinentalExchange, Inc. (a) | | | 2,410 | | | | 194,439 | | |
| JPMorgan Chase & Co. | | | 65,403 | | | | 3,054,320 | | |
| Medallion Financial Corp. | | | 2,278 | | | | 23,851 | | |
Portfolio Recovery
Associates, Inc. (a) | | | 843 | | | | 40,995 | | |
| Diversified Financial Services Total | | | 3,735,244 | | |
| Insurance – 2.2% | |
| ACE Ltd. | | | 25,480 | | | | 1,379,232 | | |
| Aon Corp. | | | 12,500 | | | | 562,000 | | |
| Assurant, Inc. | | | 1,000 | | | | 55,000 | | |
| Aviva PLC | | | 18,443 | | | | 160,407 | | |
| Axis Capital Holdings Ltd. | | | 8,199 | | | | 259,990 | | |
| Baldwin & Lyons, Inc., Class B | | | 860 | | | | 20,614 | | |
Baloise Holding AG,
Registered Shares | | | 3,659 | | | | 249,690 | | |
| Brit Insurance Holdings PLC | | | 73,468 | | | | 237,726 | | |
| CNA Surety Corp. (a) | | | 1,530 | | | | 25,551 | | |
| eHealth, Inc. (a) | | | 838 | | | | 13,408 | | |
| EMC Insurance Group, Inc. | | | 941 | | | | 27,741 | | |
| FBL Financial Group, Inc. | | | 767 | | | | 21,392 | | |
| Harleysville Group, Inc. | | | 589 | | | | 22,264 | | |
Hartford Financial Services
Group, Inc. | | | 1,060 | | | | 43,449 | | |
| Horace Mann Educators Corp. | | | 1,891 | | | | 24,337 | | |
| IPC Holdings Ltd. | | | 800 | | | | 24,168 | | |
| Lincoln National Corp. | | | 10,700 | | | | 458,067 | | |
Marsh & McLennan
Companies, Inc. | | | 24,900 | | | | 790,824 | | |
| Max Capital Group Ltd. | | | 1,100 | | | | 25,553 | | |
| Mercury General Corp. | | | 250 | | | | 13,688 | | |
National Western Life
Insurance Co., Class A | | | 97 | | | | 23,481 | | |
| Navigators Group, Inc. (a) | | | 554 | | | | 32,132 | | |
| Phoenix Companies, Inc. | | | 3,380 | | | | 31,231 | | |
Platinum Underwriters
Holdings Ltd. | | | 2,100 | | | | 74,508 | | |
| Prudential Financial, Inc. | | | 3,300 | | | | 237,600 | | |
| RAM Holdings Ltd. (a) | | | 4,135 | | | | 6,947 | | |
Reinsurance Group of
America, Inc. | | | 1,500 | | | | 81,000 | | |
| RLI Corp. | | | 376 | | | | 23,346 | | |
| Safety Insurance Group, Inc. | | | 630 | | | | 23,896 | | |
| Selective Insurance Group, Inc. | | | 949 | | | | 21,751 | | |
| Stewart Information Services Corp. | | | 910 | | | | 27,073 | | |
Swiss Reinsurance,
Registered Shares | | | 5,610 | | | | 313,315 | | |
United America Indemnity Ltd.,
Class A (a) | | | 2,960 | | | | 42,121 | | |
| Zurich Financial Services AG, | | | 628 | | | | 174,078 | | |
| Insurance Total | | | 5,527,580 | | |
| | | Shares | | Value ($) | |
| Real Estate Investment Trusts (REITs) – 0.9% | |
Alexandria Real Estate
Equities, Inc. | | | 1,100 | | | | 123,750 | | |
| BioMed Realty Trust, Inc. | | | 1,286 | | | | 34,015 | | |
| Boston Properties, Inc. | | | 550 | | | | 51,513 | | |
| DCT Industrial Trust, Inc. | | | 2,604 | | | | 19,504 | | |
| DiamondRock Hospitality Co. | | | 2,320 | | | | 21,112 | | |
| DuPont Fabros Technology, Inc. | | | 1,069 | | | | 16,302 | | |
| Equity Residential Property Trust | | | 2,600 | | | | 115,466 | | |
| Franklin Street Properties Corp. | | | 1,984 | | | | 25,792 | | |
| General Growth Properties, Inc. | | | 1,309 | | | | 19,766 | | |
| Getty Realty Corp. | | | 640 | | | | 14,189 | | |
| Home Properties, Inc. | | | 460 | | | | 26,657 | | |
| LaSalle Hotel Properties | | | 1,040 | | | | 24,253 | | |
| Macerich Co. | | | 600 | | | | 38,190 | | |
| National Health Investors, Inc. | | | 682 | | | | 23,311 | | |
| National Retail Properties, Inc. | | | 842 | | | | 20,166 | | |
| Plum Creek Timber Co., Inc. | | | 14,920 | | | | 743,911 | | |
| Potlatch Corp. | | | 940 | | | | 43,607 | | |
| ProLogis | | | 1,264 | | | | 52,165 | | |
| Rayonier, Inc. | | | 14,900 | | | | 705,515 | | |
| Realty Income Corp. | | | 1,020 | | | | 26,112 | | |
| Sun Communities, Inc. | | | 1,340 | | | | 26,545 | | |
Universal Health Realty
Income Trust | | | 700 | | | | 27,230 | | |
Urstadt Biddle Properties,
Inc., Class A | | | 1,280 | | | | 24,000 | | |
| Real Estate Investment Trusts (REITs) Total | | | 2,223,071 | | |
| Real Estate Management & Development – 0.2% | |
| Avatar Holdings, Inc. (a) | | | 104 | | | | 3,432 | | |
| Emaar Properties PJSC | | | 75,980 | | | | 155,139 | | |
| Hongkong Land Holdings Ltd. | | | 70,000 | | | | 210,367 | | |
Maui Land &
Pineapple Co., Inc. (a) | | | 650 | | | | 17,869 | | |
| Swire Pacific Ltd., Class A | | | 22,500 | | | | 198,322 | | |
| Real Estate Management & Development Total | | | 585,129 | | |
| Thrifts & Mortgage Finance – 0.1% | |
| Bank Mutual Corp. | | | 2,590 | | | | 29,396 | | |
| BankFinancial Corp. | | | 1,570 | | | | 23,048 | | |
| Beneficial Mutual Bancorp, Inc. (a) | | | 1,951 | | | | 24,680 | | |
| Brookline Bancorp, Inc. | | | 3,030 | | | | 38,754 | | |
| Clifton Savings Bancorp, Inc. | | | 1,580 | | | | 18,944 | | |
| Corus Bankshares, Inc. | | | 3,675 | | | | 14,884 | | |
| ESSA Bancorp, Inc. | | | 1,048 | | | | 14,567 | | |
| Flagstar BanCorp, Inc. | | | 3,410 | | | | 10,162 | | |
| Home Federal Bancorp, Inc. | | | 2,020 | | | | 25,755 | | |
| TrustCo Bank Corp. NY | | | 1,850 | | | | 21,663 | | |
| United Financial Bancorp, Inc. | | | 1,299 | | | | 19,290 | | |
See Accompanying Notes to Financial Statements.
32
Columbia Asset Allocation Fund
September 30, 2008
| Common Stocks (continued) | |
| | | Shares | | Value ($) | |
| Washington Federal, Inc. | | | 1,120 | | | | 20,664 | | |
| Westfield Financial, Inc. | | | 2,329 | | | | 23,989 | | |
| Thrifts & Mortgage Finance Total | | | 285,796 | | |
| Financials Total | | | 26,481,776 | | |
| Health Care – 7.1% | |
| Biotechnology – 1.4% | |
| Alexion Pharmaceuticals, Inc. (a) | | | 2,220 | | | | 87,246 | | |
| Amgen, Inc. (a) | | | 24,870 | | | | 1,474,045 | | |
| Array Biopharma, Inc. (a) | | | 3,511 | | | | 26,964 | | |
| BioMarin Pharmaceuticals, Inc. (a) | | | 1,494 | | | | 39,576 | | |
| Celgene Corp. (a) | | | 8,070 | | | | 510,670 | | |
| Cepheid, Inc. (a) | | | 1,847 | | | | 25,544 | | |
| Genentech, Inc. (a) | | | 3,700 | | | | 328,116 | | |
| Genzyme Corp. (a) | | | 5,620 | | | | 454,602 | | |
| Gilead Sciences, Inc. (a) | | | 5,500 | | | | 250,690 | | |
| Myriad Genetics, Inc. (a) | | | 492 | | | | 31,921 | | |
| Omrix Biopharmaceuticals, Inc. (a) | | | 1,789 | | | | 32,095 | | |
| Onyx Pharmaceuticals, Inc. (a) | | | 1,218 | | | | 44,067 | | |
| OSI Pharmaceuticals, Inc. (a) | | | 509 | | | | 25,089 | | |
| Regeneron Pharmaceuticals, Inc. (a) | | | 1,561 | | | | 34,077 | | |
| Rigel Pharmaceuticals, Inc. (a) | | | 730 | | | | 17,045 | | |
| Seattle Genetics, Inc. (a) | | | 2,177 | | | | 23,294 | | |
| United Therapeutics Corp. (a) | | | 515 | | | | 54,162 | | |
| Biotechnology Total | | | 3,459,203 | | |
| Health Care Equipment & Supplies – 0.8% | |
| Analogic Corp. | | | 350 | | | | 17,416 | | |
| ArthroCare Corp. (a) | | | 739 | | | | 20,485 | | |
| Baxter International, Inc. | | | 5,200 | | | | 341,276 | | |
| Beckman Coulter, Inc. | | | 900 | | | | 63,891 | | |
China Medical Technologies,
Inc., ADR | | | 848 | | | | 27,628 | | |
| Cooper Companies, Inc. | | | 700 | | | | 24,332 | | |
| Covidien Ltd. | | | 5,500 | | | | 295,680 | | |
| Haemonetics Corp. (a) | | | 734 | | | | 45,302 | | |
| Hill-Rom Holdings, Inc. | | | 640 | | | | 19,398 | | |
| Hologic, Inc. (a) | | | 5,171 | | | | 99,955 | | |
| Hospira, Inc. (a) | | | 1,650 | | | | 63,030 | | |
| Immucor, Inc. (a) | | | 1,106 | | | | 35,348 | | |
| Insulet Corp. (a) | | | 550 | | | | 7,656 | | |
| Intuitive Surgical, Inc. (a) | | | 357 | | | | 86,030 | | |
| Masimo Corp. (a) | | | 593 | | | | 22,060 | | |
| Medtronic, Inc. | | | 9,100 | | | | 455,910 | | |
| Meridian Bioscience, Inc. | | | 683 | | | | 19,834 | | |
Mindray Medical
International Ltd., ADR | | | 1,450 | | | | 48,908 | | |
| NuVasive, Inc. (a) | | | 701 | | | | 34,580 | | |
| RTI Biologics, Inc. (a) | | | 1,199 | | | | 11,211 | | |
| | | Shares | | Value ($) | |
| STERIS Corp. | | | 1,660 | | | | 62,383 | | |
| Teleflex, Inc. | | | 1,000 | | | | 63,490 | | |
| Varian Medical Systems, Inc. (a) | | | 960 | | | | 54,845 | | |
| Wright Medical Group, Inc. (a) | | | 2,138 | | | | 65,081 | | |
| Health Care Equipment & Supplies Total | | | 1,985,729 | | |
| Health Care Providers & Services – 1.3% | |
| Alliance Imaging, Inc. (a) | | | 4,014 | | | | 41,224 | | |
| Amedisys, Inc. (a) | | | 460 | | | | 22,388 | | |
| AmSurg Corp. (a) | | | 710 | | | | 18,084 | | |
| CIGNA Corp. | | | 15,400 | | | | 523,292 | | |
Community Health
Systems, Inc. (a) | | | 1,800 | | | | 52,758 | | |
Cross Country
Healthcare, Inc. (a) | | | 1,945 | | | | 31,684 | | |
| Express Scripts, Inc. (a) | | | 5,180 | | | | 382,388 | | |
| Gentiva Health Services, Inc. (a) | | | 1,290 | | | | 34,753 | | |
| Healthspring, Inc. (a) | | | 494 | | | | 10,453 | | |
| Humana, Inc. (a) | | | 8,700 | | | | 358,440 | | |
| inVentiv Health, Inc. (a) | | | 2,723 | | | | 48,088 | | |
| Kindred Healthcare, Inc. (a) | | | 1,220 | | | | 33,635 | | |
Laboratory Corp. of
America Holdings (a) | | | 970 | | | | 67,415 | | |
Magellan Health
Services, Inc. (a) | | | 290 | | | | 11,907 | | |
| McKesson Corp. | | | 890 | | | | 47,891 | | |
| Medco Health Solutions, Inc. (a) | | | 27,840 | | | | 1,252,800 | | |
| MWI Veterinary Supply, Inc. (a) | | | 561 | | | | 22,042 | | |
| NovaMed, Inc. (a) | | | 2,894 | | | | 13,718 | | |
| Owens & Minor, Inc. | | | 1,200 | | | | 58,200 | | |
| Pediatrix Medical Group, Inc. (a) | | | 1,060 | | | | 57,155 | | |
| Psychiatric Solutions, Inc. (a) | | | 1,684 | | | | 63,908 | | |
| RehabCare Group, Inc. (a) | | | 1,464 | | | | 26,498 | | |
| Res-Care, Inc. (a) | | | 1,630 | | | | 29,568 | | |
| U.S. Physical Therapy, Inc. (a) | | | 790 | | | | 13,714 | | |
Universal Health Services,
Inc., Class B | | | 1,000 | | | | 56,030 | | |
| Health Care Providers & Services Total | | | 3,278,033 | | |
| Health Care Technology – 0.0% | |
| Eclipsys Corp. (a) | | | 1,440 | | | | 30,168 | | |
| Health Care Technology Total | | | 30,168 | | |
| Life Sciences Tools & Services – 0.8% | |
Bio-Rad Laboratories,
Inc., Class A (a) | | | 604 | | | | 59,868 | | |
Charles River Laboratories
International, Inc. (a) | | | 1,560 | | | | 86,627 | | |
| Covance, Inc. (a) | | | 4,470 | | | | 395,193 | | |
| Dionex Corp. (a) | | | 546 | | | | 34,698 | | |
| Illumina, Inc. (a) | | | 852 | | | | 34,532 | | |
See Accompanying Notes to Financial Statements.
33
Columbia Asset Allocation Fund
September 30, 2008
| Common Stocks (continued) | |
| | | Shares | | Value ($) | |
| PAREXEL International Corp. (a) | | | 2,384 | | | | 68,325 | | |
Pharmaceutical Product
Development, Inc. | | | 1,050 | | | | 43,418 | | |
| Thermo Fisher Scientific, Inc. (a) | | | 21,053 | | | | 1,157,915 | | |
| Varian, Inc. (a) | | | 1,410 | | | | 60,489 | | |
| Waters Corp. (a) | | | 800 | | | | 46,544 | | |
| Life Sciences Tools & Services Total | | | 1,987,609 | | |
| Pharmaceuticals – 2.8% | |
| Abbott Laboratories | | | 18,300 | | | | 1,053,714 | | |
| Allergan, Inc. | | | 1,170 | | | | 60,255 | | |
| Astellas Pharma, Inc. | | | 5,100 | | | | 214,285 | | |
| Auxilium Pharmaceuticals, Inc. (a) | | | 610 | | | | 19,764 | | |
| Biovail Corp. | | | 20,115 | | | | 196,523 | | |
| Daiichi Sankyo Co., Ltd. | | | 6,800 | | | | 173,589 | | |
| Eurand NV (a) | | | 2,416 | | | | 43,875 | | |
| Johnson & Johnson | | | 36,800 | | | | 2,549,504 | | |
| Merck & Co., Inc. | | | 14,491 | | | | 457,336 | | |
| Novartis AG, Registered Shares | | | 9,827 | | | | 514,005 | | |
| Perrigo Co. | | | 1,120 | | | | 43,075 | | |
Roche Holding AG,
Genusschein Shares | | | 3,496 | | | | 544,981 | | |
| Sanofi-Aventis | | | 1,400 | | | | 92,024 | | |
| Schering-Plough Corp. | | | 21,900 | | | | 404,493 | | |
| Takeda Pharmaceutical Co., Ltd. | | | 5,400 | | | | 271,960 | | |
Teva Pharmaceutical
Industries Ltd., ADR | | | 11,740 | | | | 537,575 | | |
| Pharmaceuticals Total | | | 7,176,958 | | |
| Health Care Total | | | 17,917,700 | | |
| Industrials – 6.4% | |
| Aerospace & Defense – 1.6% | |
| AAR Corp. (a) | | | 682 | | | | 11,314 | | |
| AerCap Holdings NV (a) | | | 2,800 | | | | 29,708 | | |
| Curtiss-Wright Corp. | | | 279 | | | | 12,680 | | |
| Esterline Technologies Corp. (a) | | | 290 | | | | 11,481 | | |
| Goodrich Corp. | | | 8,190 | | | | 340,704 | | |
| Hexcel Corp. (a) | | | 1,970 | | | | 26,969 | | |
| Honeywell International, Inc. | | | 14,400 | | | | 598,320 | | |
L-3 Communications
Holdings, Inc. | | | 7,875 | | | | 774,270 | | |
| Lockheed Martin Corp. | | | 3,800 | | | | 416,746 | | |
| Moog, Inc., Class A (a) | | | 270 | | | | 11,578 | | |
| MTU Aero Engines Holding AG | | | 4,478 | | | | 124,267 | | |
| Precision Castparts Corp. | | | 1,010 | | | | 79,568 | | |
| Raytheon Co. | | | 12,100 | | | | 647,471 | | |
Spirit Aerosystems Holdings,
Inc., Class A (a) | | | 2,639 | | | | 42,409 | | |
| | | Shares | | Value ($) | |
| Teledyne Technologies, Inc. (a) | | | 1,179 | | | | 67,392 | | |
| United Technologies Corp. | | | 14,480 | | | | 869,669 | | |
| Aerospace & Defense Total | | | 4,064,546 | | |
| Air Freight & Logistics – 0.2% | |
| C.H. Robinson Worldwide, Inc. | | | 930 | | | | 47,393 | | |
| FedEx Corp. | | | 4,700 | | | | 371,488 | | |
| HUB Group, Inc., Class A (a) | | | 1,353 | | | | 50,940 | | |
| Air Freight & Logistics Total | | | 469,821 | | |
| Airlines – 0.0% | |
| JetBlue Airways Corp. (a) | | | 1,895 | | | | 9,380 | | |
| Skywest, Inc. | | | 1,050 | | | | 16,779 | | |
| Airlines Total | | | 26,159 | | |
| Building Products – 0.0% | |
| Builders FirstSource, Inc. (a) | | | 2,296 | | | | 13,753 | | |
| Lennox International, Inc. | | | 600 | | | | 19,962 | | |
| NCI Building Systems, Inc. (a) | | | 800 | | | | 25,400 | | |
| Trex Co., Inc. (a) | | | 672 | | | | 12,170 | | |
| Universal Forest Products, Inc. | | | 400 | | | | 13,964 | | |
| Building Products Total | | | 85,249 | | |
| Commercial Services & Supplies – 0.5% | |
| ABM Industries, Inc. | | | 700 | | | | 15,288 | | |
Casella Waste Systems, Inc.,
Class A (a) | | | 1,340 | | | | 15,732 | | |
| CBIZ, Inc. (a) | | | 1,810 | | | | 15,295 | | |
| CDI Corp. | | | 731 | | | | 16,323 | | |
| Consolidated Graphics, Inc. (a) | | | 660 | | | | 20,018 | | |
| Dun & Bradstreet Corp. | | | 3,300 | | | | 311,388 | | |
| EnergySolutions, Inc. | | | 2,107 | | | | 21,070 | | |
| Geo Group, Inc. (a) | | | 2,314 | | | | 46,766 | | |
| Healthcare Services Group, Inc. | | | 853 | | | | 15,601 | | |
| Huron Consulting Group, Inc. (a) | | | 641 | | | | 36,524 | | |
| Iron Mountain, Inc. (a) | | | 1,250 | | | | 30,512 | | |
Kimball International,
Inc., Class B | | | 1,140 | | | | 12,312 | | |
| Korn/Ferry International (a) | | | 1,080 | | | | 19,246 | | |
| Mobile Mini, Inc. (a) | | | 2,416 | | | | 46,701 | | |
| MPS Group, Inc. (a) | | | 3,320 | | | | 33,466 | | |
| Pitney Bowes, Inc. | | | 970 | | | | 32,262 | | |
| Robert Half International, Inc. | | | 1,380 | | | | 34,155 | | |
| Stericycle, Inc. (a) | | | 1,380 | | | | 81,296 | | |
| United Stationers, Inc. (a) | | | 430 | | | | 20,567 | | |
| Waste Connections, Inc. (a) | | | 2,760 | | | | 94,668 | | |
| Waste Management, Inc. | | | 10,400 | | | | 327,496 | | |
| Commercial Services & Supplies Total | | | 1,246,686 | | |
| Construction & Engineering – 0.5% | |
| EMCOR Group, Inc. (a) | | | 2,792 | | | | 73,485 | | |
| Foster Wheeler Ltd. (a) | | | 1,200 | | | | 43,332 | | |
See Accompanying Notes to Financial Statements.
34
Columbia Asset Allocation Fund
September 30, 2008
| Common Stocks (continued) | |
| | | Shares | | Value ($) | |
| Granite Construction, Inc. | | | 819 | | | | 29,337 | | |
Jacobs Engineering
Group, Inc. (a) | | | 1,240 | | | | 67,344 | | |
| KBR, Inc. | | | 21,000 | | | | 320,670 | | |
KHD Humboldt Wedag
International Ltd. (a) | | | 1,020 | | | | 19,564 | | |
| Outotec Oyj | | | 6,325 | | | | 170,784 | | |
| Quanta Services, Inc. (a) | | | 16,400 | | | | 442,964 | | |
| Construction & Engineering Total | | | 1,167,480 | | |
| Electrical Equipment – 0.8% | |
| ABB Ltd., Registered Shares (a) | | | 17,901 | | | | 343,425 | | |
| AMETEK, Inc. | | | 1,160 | | | | 47,293 | | |
| Belden, Inc. | | | 590 | | | | 18,756 | | |
| Cooper Industries Ltd., Class A | | | 12,400 | | | | 495,380 | | |
Energy Conversion
Devices, Inc. (a) | | | 387 | | | | 22,543 | | |
| First Solar, Inc. (a) | | | 1,130 | | | | 213,468 | | |
| Gamesa Corp. Tecnologica SA | | | 5,010 | | | | 172,103 | | |
| General Cable Corp. (a) | | | 880 | | | | 31,354 | | |
| GrafTech International Ltd. (a) | | | 1,490 | | | | 22,514 | | |
Harbin Power Equipment Co.,
Ltd., Class H | | | 112,000 | | | | 80,003 | | |
| II-VI, Inc. (a) | | | 1,116 | | | | 43,145 | | |
| Mitsubishi Electric Corp. | | | 24,000 | | | | 161,718 | | |
| Polypore International, Inc. (a) | | | 1,571 | | | | 33,792 | | |
| Roper Industries, Inc. | | | 1,030 | | | | 58,669 | | |
| SunPower Corp., Class A (a) | | | 590 | | | | 41,849 | | |
| Vestas Wind Systems A/S (a) | | | 1,207 | | | | 105,074 | | |
| Woodward Governor Co. | | | 1,517 | | | | 53,505 | | |
| Electrical Equipment Total | | | 1,944,591 | | |
| Industrial Conglomerates – 0.8% | |
| General Electric Co. | | | 42,157 | | | | 1,075,004 | | |
| Keppel Corp. Ltd. | | | 42,000 | | | | 233,211 | | |
| McDermott International, Inc. (a) | | | 17,508 | | | | 447,329 | | |
| Siemens AG, Registered Shares | | | 2,741 | | | | 257,255 | | |
| Textron, Inc. | | | 3,300 | | | | 96,624 | | |
| Industrial Conglomerates Total | | | 2,109,423 | | |
| Machinery – 1.2% | |
| Barnes Group, Inc. | | | 1,438 | | | | 29,076 | | |
| Bucyrus International, Inc. | | | 780 | | | | 34,850 | | |
| Caterpillar, Inc. | | | 5,600 | | | | 333,760 | | |
| Chart Industries, Inc. (a) | | | 772 | | | | 22,048 | | |
| Cummins, Inc. | | | 1,650 | | | | 72,138 | | |
| Dynamic Materials Corp. | | | 637 | | | �� | 14,785 | | |
| Eaton Corp. | | | 6,400 | | | | 359,552 | | |
| EnPro Industries, Inc. (a) | | | 860 | | | | 31,958 | | |
| Flowserve Corp. | | | 540 | | | | 47,936 | | |
Georg Fischer AG,
Registered Shares (a) | | | 426 | | | | 153,249 | | |
| | | Shares | | Value ($) | |
| Gildemeister AG | | | 4,341 | | | | 73,463 | | |
| Glory Ltd. | | | 12,400 | | | | 283,241 | | |
| Harsco Corp. | | | 1,070 | | | | 39,793 | | |
| Illinois Tool Works, Inc. | | | 9,200 | | | | 408,940 | | |
| ITT Corp. | | | 890 | | | | 49,493 | | |
| Joy Global, Inc. | | | 720 | | | | 32,501 | | |
| Kadant, Inc. (a) | | | 427 | | | | 9,723 | | |
| Kennametal, Inc. | | | 1,700 | | | | 46,104 | | |
| Komatsu Ltd. | | | 5,300 | | | | 85,790 | | |
| Lindsay Corp. | | | 335 | | | | 24,371 | | |
| Manitowoc Co., Inc. | | | 1,260 | | | | 19,593 | | |
| Nordson Corp. | | | 408 | | | | 20,037 | | |
| Parker Hannifin Corp. | | | 1,860 | | | | 98,580 | | |
| SKF AB, Class B (a) | | | 15,600 | | | | 200,067 | | |
| SPX Corp. | | | 6,600 | | | | 508,200 | | |
| Wabtec Corp. | | | 1,198 | | | | 61,374 | | |
| Machinery Total | | | 3,060,622 | | |
| Marine – 0.1% | |
| Alexander & Baldwin, Inc. | | | 1,100 | | | | 48,433 | | |
| Genco Shipping & Trading Ltd. | | | 666 | | | | 22,138 | | |
| U-Ming Marine Transport Corp. | | | 57,000 | | | | 82,454 | | |
| Marine Total | | | 153,025 | | |
| Road & Rail – 0.4% | |
| Amerco, Inc. (a) | | | 300 | | | | 12,579 | | |
| Canadian Pacific Railway Ltd. | | | 900 | | | | 48,474 | | |
| Central Japan Railway Co. | | | 9 | | | | 84,941 | | |
Genesee & Wyoming, Inc.,
Class A (a) | | | 550 | | | | 20,636 | | |
| Heartland Express, Inc. | | | 1,050 | | | | 16,296 | | |
| Knight Transportation, Inc. | | | 630 | | | | 10,691 | | |
| Landstar System, Inc. | | | 1,560 | | | | 68,734 | | |
| Old Dominion Freight Line, Inc. (a) | | | 1,090 | | | | 30,891 | | |
| Ryder System, Inc. | | | 200 | | | | 12,400 | | |
| Union Pacific Corp. | | | 11,000 | | | | 782,760 | | |
| Werner Enterprises, Inc. | | | 1,910 | | | | 41,466 | | |
| Road & Rail Total | | | 1,129,868 | | |
| Trading Companies & Distributors – 0.3% | |
| ITOCHU Corp. | | | 26,000 | | | | 157,167 | | |
| Kaman Corp. | | | 793 | | | | 22,585 | | |
| Mitsubishi Corp. | | | 6,800 | | | | 141,506 | | |
| W.W. Grainger, Inc. | | | 4,700 | | | | 408,759 | | |
| Watsco, Inc. | | | 720 | | | | 36,201 | | |
| Trading Companies & Distributors Total | | | 766,218 | | |
| Industrials Total | | | 16,223,688 | | |
See Accompanying Notes to Financial Statements.
35
Columbia Asset Allocation Fund
September 30, 2008
| Common Stocks (continued) | |
| | | Shares | | Value ($) | |
| Information Technology – 8.7% | |
| Communications Equipment – 1.3% | |
| Anaren, Inc. (a) | | | 1,462 | | | | 14,839 | | |
| Arris Group, Inc. (a) | | | 2,263 | | | | 17,493 | | |
| Bel Fuse, Inc., Class B | | | 360 | | | | 10,249 | | |
| Black Box Corp. | | | 611 | | | | 21,098 | | |
Brocade Communications
Systems, Inc. (a) | | | 1,820 | | | | 10,592 | | |
| Cisco Systems, Inc. (a) | | | 48,445 | | | | 1,092,919 | | |
Comtech
Telecommunications Corp. (a) | | | 310 | | | | 15,265 | | |
| Corning, Inc. | | | 15,600 | | | | 243,984 | | |
| Digi International, Inc. (a) | | | 882 | | | | 8,996 | | |
| Dycom Industries, Inc. (a) | | | 1,240 | | | | 16,145 | | |
| Emulex Corp. (a) | | | 1,450 | | | | 15,472 | | |
| Harris Corp. | | | 1,530 | | | | 70,686 | | |
| Juniper Networks, Inc. (a) | | | 1,410 | | | | 29,709 | | |
| Nokia Oyj | | | 19,597 | | | | 365,341 | | |
| Polycom, Inc. (a) | | | 2,864 | | | | 66,244 | | |
| QUALCOMM, Inc. | | | 31,600 | | | | 1,357,852 | | |
| Research In Motion Ltd. (a) | | | 300 | | | | 20,490 | | |
| Riverbed Technology, Inc. (a) | | | 1,755 | | | | 21,973 | | |
| Tollgrade Communications, Inc. (a) | | | 1,100 | | | | 4,620 | | |
| Communications Equipment Total | | | 3,403,967 | | |
| Computers & Peripherals – 2.1% | |
| Apple, Inc. (a) | | | 6,900 | | | | 784,254 | | |
| Avid Technology, Inc. (a) | | | 780 | | | | 18,767 | | |
| Diebold, Inc. | | | 1,600 | | | | 52,976 | | |
| Electronics for Imaging, Inc. (a) | | | 1,100 | | | | 15,323 | | |
| EMC Corp. (a) | | | 74,400 | | | | 889,824 | | |
| Hewlett-Packard Co. | | | 44,520 | | | | 2,058,605 | | |
International Business
Machines Corp. | | | 9,900 | | | | 1,157,904 | | |
| NCR Corp. (a) | | | 4,500 | | | | 99,225 | | |
| NetApp, Inc. (a) | | | 2,120 | | | | 38,647 | | |
| QLogic Corp. (a) | | | 960 | | | | 14,746 | | |
| Seagate Technology | | | 3,620 | | | | 43,874 | | |
| Computers & Peripherals Total | | | 5,174,145 | | |
| Electronic Equipment, Instruments & Components – 0.4% | |
| Agilent Technologies, Inc. (a) | | | 600 | | | | 17,796 | | |
| Anixter International, Inc. (a) | | | 560 | | | | 33,326 | | |
| Arrow Electronics, Inc. (a) | | | 2,300 | | | | 60,306 | | |
| Benchmark Electronics, Inc. (a) | | | 1,810 | | | | 25,485 | | |
| Brightpoint, Inc. (a) | | | 7,200 | | | | 51,840 | | |
| CPI International, Inc. (a) | | | 1,130 | | | | 16,362 | | |
| Daktronics, Inc. | | | 2,155 | | | | 35,902 | | |
| FLIR Systems, Inc. (a) | | | 7,500 | | | | 288,150 | | |
| FUJIFILM Holdings Corp. | | | 6,600 | | | | 171,045 | | |
| GSI Group Inc. (a) | | | 1,530 | | | | 5,401 | | |
| | | Shares | | Value ($) | |
| Itron, Inc. (a) | | | 841 | | | | 74,454 | | |
Mettler-Toledo
International, Inc. (a) | | | 400 | | | | 39,200 | | |
| MTS Systems Corp. | | | 570 | | | | 23,997 | | |
| NAM TAI Electronics, Inc. | | | 2,320 | | | | 18,954 | | |
| Plexus Corp. (a) | | | 530 | | | | 10,971 | | |
| Trimble Navigation Ltd. (a) | | | 1,140 | | | | 29,480 | | |
| Vishay Intertechnology, Inc. (a) | | | 2,030 | | | | 13,439 | | |
Electronic Equipment, Instruments &
Components Total | | | 916,108 | | |
| Internet Software & Services – 0.6% | |
| Ariba, Inc. (a) | | | 1,250 | | | | 17,663 | | |
| Digital River, Inc. (a) | | | 350 | | | | 11,340 | | |
| Equinix, Inc. (a) | | | 5,974 | | | | 414,954 | | |
| Google, Inc., Class A (a) | | | 2,322 | | | | 930,007 | | |
| GSI Commerce, Inc. (a) | | | 1,750 | | | | 27,090 | | |
| Interwoven Inc. (a) | | | 1,400 | | | | 19,768 | | |
| Sohu.com, Inc. (a) | | | 449 | | | | 25,032 | | |
Switch & Data
Facilities Co., Inc. (a) | | | 2,610 | | | | 32,494 | | |
| VeriSign, Inc. (a) | | | 1,610 | | | | 41,989 | | |
| Websense, Inc. (a) | | | 2,386 | | | | 53,327 | | |
| Internet Software & Services Total | | | 1,573,664 | | |
| IT Services – 0.7% | |
| Accenture Ltd., Class A | | | 12,000 | | | | 456,000 | | |
| Alliance Data Systems Corp. (a) | | | 950 | | | | 60,211 | | |
CACI International, Inc.,
Class A (a) | | | 1,316 | | | | 65,932 | | |
Cognizant Technology Solutions
Corp., Class A (a) | | | 2,220 | | | | 50,683 | | |
| Computershare Ltd. | | | 11,326 | | | | 85,171 | | |
CSG Systems
International, Inc. (a) | | | 801 | | | | 14,041 | | |
| Fiserv, Inc. (a) | | | 960 | | | | 45,427 | | |
| Global Payments, Inc. | | | 880 | | | | 39,477 | | |
| MasterCard, Inc., Class A | | | 1,570 | | | | 278,408 | | |
| MAXIMUS, Inc. | | | 470 | | | | 17,315 | | |
| Paychex, Inc. | | | 1,260 | | | | 41,618 | | |
| TeleTech Holdings, Inc. (a) | | | 4,924 | | | | 61,254 | | |
| Visa, Inc., Class A | | | 9,244 | | | | 567,489 | | |
| IT Services Total | | | 1,783,026 | | |
| Office Electronics – 0.1% | |
| Canon, Inc. | | | 6,700 | | | | 250,493 | | |
| Office Electronics Total | | | 250,493 | | |
| Semiconductors & Semiconductor Equipment – 1.2% | |
| Actel Corp. (a) | | | 1,274 | | | | 15,899 | | |
Advanced Energy
Industries, Inc. (a) | | | 690 | | | | 9,439 | | |
See Accompanying Notes to Financial Statements.
36
Columbia Asset Allocation Fund
September 30, 2008
| Common Stocks (continued) | |
| | | Shares | | Value ($) | |
| Analog Devices, Inc. | | | 2,170 | | | | 57,179 | | |
ASML Holding N.V.,
N.Y. Registered Shares | | | 2,170 | | | | 38,214 | | |
| Atheros Communications, Inc. (a) | | | 1,702 | | | | 40,133 | | |
| ATMI, Inc. (a) | | | 310 | | | | 5,574 | | |
| Broadcom Corp., Class A (a) | | | 16,750 | | | | 312,052 | | |
Fairchild Semiconductor
International, Inc. (a) | | | 1,140 | | | | 10,135 | | |
| Intel Corp. | | | 60,000 | | | | 1,123,800 | | |
| Intersil Corp., Class A | | | 14,175 | | | | 235,021 | | |
Kulicke & Soffa
Industries, Inc. (a) | | | 2,437 | | | | 10,991 | | |
| Lam Research Corp. (a) | | | 11,800 | | | | 371,582 | | |
Marvell Technology
Group Ltd. (a) | | | 2,500 | | | | 23,250 | | |
| Mattson Technology, Inc. (a) | | | 2,320 | | | | 10,974 | | |
MEMC Electronic
Materials, Inc. (a) | | | 2,510 | | | | 70,933 | | |
| Microchip Technology, Inc. | | | 10,560 | | | | 310,781 | | |
| Microsemi Corp. (a) | | | 1,237 | | | | 31,519 | | |
| MKS Instruments, Inc. (a) | | | 693 | | | | 13,798 | | |
Monolithic Power
Systems, Inc. (a) | | | 1,471 | | | | 25,551 | | |
| ON Semiconductor Corp. (a) | | | 3,588 | | | | 24,255 | | |
| RF Micro Devices, Inc. (a) | | | 2,270 | | | | 6,628 | | |
| Rubicon Technology, Inc. (a) | | | 1,562 | | | | 11,278 | | |
| Skyworks Solutions, Inc. (a) | | | 3,270 | | | | 27,337 | | |
| Ultra Clean Holdings (a) | | | 1,110 | | | | 5,594 | | |
Varian Semiconductor
Equipment Associates, Inc. (a) | | | 272 | | | | 6,833 | | |
| Verigy Ltd. (a) | | | 7,721 | | | | 125,698 | | |
Semiconductors & Semiconductor
Equipment Total | | | 2,924,448 | | |
| Software – 2.3% | |
| Activision Blizzard, Inc. (a) | | | 42,946 | | | | 662,657 | | |
| Adobe Systems, Inc. (a) | | | 13,500 | | | | 532,845 | | |
| ANSYS, Inc. (a) | | | 1,869 | | | | 70,779 | | |
| Autodesk, Inc. (a) | | | 1,639 | | | | 54,988 | | |
| BluePhoenix Solutions Ltd. (a) | | | 2,141 | | | | 7,536 | | |
| BMC Software, Inc. (a) | | | 23,600 | | | | 675,668 | | |
| Citrix Systems, Inc. (a) | | | 1,985 | | | | 50,141 | | |
| Concur Technologies, Inc. (a) | | | 354 | | | | 13,544 | | |
| Electronic Arts, Inc. (a) | | | 1,200 | | | | 44,388 | | |
| FactSet Research Systems, Inc. | | | 800 | | | | 41,800 | | |
| Informatica Corp. (a) | | | 2,508 | | | | 32,579 | | |
| Jack Henry & Associates, Inc. | | | 750 | | | | 15,248 | | |
| Lawson Software, Inc. (a) | | | 1,089 | | | | 7,623 | | |
| McAfee, Inc. (a) | | | 1,130 | | | | 38,375 | | |
| | | Shares | | Value ($) | |
| Mentor Graphics Corp. (a) | | | 1,291 | | | | 14,653 | | |
| Micros Systems, Inc. (a) | | | 1,297 | | | | 34,578 | | |
| Microsoft Corp. | | | 58,680 | | | | 1,566,169 | | |
| MSC.Software Corp. (a) | | | 1,830 | | | | 19,581 | | |
| Net 1 UEPS Technologies, Inc. (a) | | | 1,446 | | | | 32,289 | | |
| Nintendo Co., Ltd. | | | 700 | | | | 291,400 | | |
| Nuance Communications, Inc. (a) | | | 1,569 | | | | 19,126 | | |
| Oracle Corp. (a) | | | 52,300 | | | | 1,062,213 | | |
| Parametric Technology Corp. (a) | | | 720 | | | | 13,248 | | |
| Progress Software Corp. (a) | | | 560 | | | | 14,554 | | |
| Salesforce.com, Inc. (a) | | | 6,040 | | | | 292,336 | | |
| SPSS, Inc. (a) | | | 370 | | | | 10,863 | | |
| Sybase, Inc. (a) | | | 1,633 | | | | 50,003 | | |
| Synopsys, Inc. (a) | | | 1,400 | | | | 27,930 | | |
| UBISOFT Entertainment (a) | | | 790 | | | | 54,803 | | |
| Software Total | | | 5,751,917 | | |
| Information Technology Total | | | 21,777,768 | | |
| Materials – 2.8% | |
| Chemicals – 1.1% | |
| Agrium, Inc. | | | 640 | | | | 35,891 | | |
| Air Products & Chemicals, Inc. | | | 800 | | | | 54,792 | | |
| Albemarle Corp. | | | 1,325 | | | | 40,863 | | |
| Ashland, Inc. | | | 430 | | | | 12,573 | | |
| BASF SE | | | 7,758 | | | | 371,808 | | |
| Cytec Industries, Inc. | | | 350 | | | | 13,619 | | |
| E.I. Du Pont de Nemours & Co. | | | 12,400 | | | | 499,720 | | |
| Ecolab, Inc. | | | 990 | | | | 48,035 | | |
| H.B. Fuller Co. | | | 1,600 | | | | 33,392 | | |
| Intrepid Potash, Inc. (a) | | | 778 | | | | 23,449 | | |
| Koppers Holdings, Inc. | | | 1,060 | | | | 39,655 | | |
| Linde AG | | | 2,856 | | | | 306,280 | | |
| Monsanto Co. | | | 5,160 | | | | 510,737 | | |
| NewMarket Corp. | | | 240 | | | | 12,614 | | |
| OM Group, Inc. (a) | | | 800 | | | | 18,000 | | |
| Potash Corp. of Saskatchewan, Inc. | | | 800 | | | | 103,712 | | |
| Potash Corp. of Saskatchewan, Inc. | | | 820 | | | | 108,248 | | |
| PPG Industries, Inc. | | | 1,300 | | | | 75,816 | | |
| Praxair, Inc. | | | 5,100 | | | | 365,874 | | |
| Sensient Technologies Corp. | | | 1,030 | | | | 28,974 | | |
| Solutia, Inc. (a) | | | 1,890 | | | | 26,460 | | |
| Terra Industries, Inc. | | | 504 | | | | 14,818 | | |
| Chemicals Total | | | 2,745,330 | | |
| Construction Materials – 0.1% | |
| Ciments Francais SA | | | 2,085 | | | | 217,177 | | |
| Eagle Materials, Inc. | | | 750 | | | | 16,777 | | |
| Construction Materials Total | | | 233,954 | | |
See Accompanying Notes to Financial Statements.
37
Columbia Asset Allocation Fund
September 30, 2008
| Common Stocks (continued) | |
| | | Shares | | Value ($) | |
| Containers & Packaging – 0.1% | |
| AptarGroup, Inc. | | | 250 | | | | 9,778 | | |
| Crown Holdings, Inc. (a) | | | 2,400 | | | | 53,304 | | |
| Greif, Inc., Class A | | | 972 | | | | 63,783 | | |
| Greif, Inc., Class B | | | 702 | | | | 36,630 | | |
| Packaging Corp. of America | | | 4,052 | | | | 93,925 | | |
| Containers & Packaging Total | | | 257,420 | | |
| Metals & Mining – 1.2% | |
| Agnico-Eagle Mines Ltd. | | | 750 | | | | 41,303 | | |
| AK Steel Holding Corp. | | | 630 | | | | 16,330 | | |
| Alcoa, Inc. | | | 12,700 | | | | 286,766 | | |
| Allegheny Technologies, Inc. | | | 2,500 | | | | 73,875 | | |
| Anglo American PLC | | | 4,899 | | | | 163,780 | | |
| BHP Biliton PLC | | | 15,719 | | | | 355,570 | | |
| Carpenter Technology Corp. | | | 300 | | | | 7,695 | | |
Freeport-McMoRan Copper &
Gold, Inc. | | | 15,464 | | | | 879,128 | | |
| Goldcorp, Inc. | | | 4,300 | | | | 136,009 | | |
| Harry Winston Diamond Corp. | | | 1,095 | | | | 14,564 | | |
| Haynes International, Inc. (a) | | | 310 | | | | 14,517 | | |
| Norsk Hydro ASA | | | 15,300 | | | | 103,334 | | |
| Nucor Corp. | | | 5,900 | | | | 233,050 | | |
| Rio Tinto PLC | | | 2,381 | | | | 148,148 | | |
| Salzgitter AG | | | 1,816 | | | | 183,449 | | |
| Titanium Metals Corp. | | | 1,400 | | | | 15,876 | | |
| Worthington Industries, Inc. | | | 1,360 | | | | 20,318 | | |
| Xstrata PLC | | | 1,755 | | | | 54,325 | | |
| Yamato Kogyo Co., Ltd. | | | 7,200 | | | | 249,381 | | |
| Metals & Mining Total | | | 2,997,418 | | |
| Paper & Forest Products – 0.3% | |
| Mercer International, Inc. (a) | | | 2,050 | | | | 7,503 | | |
| Weyerhaeuser Co. | | | 11,500 | | | | 696,670 | | |
| Paper & Forest Products Total | | | 704,173 | | |
| Materials Total | | | 6,938,295 | | |
| Telecommunication Services – 1.8% | |
| Diversified Telecommunication Services – 1.4% | |
| AT&T, Inc. | | | 54,952 | | | | 1,534,260 | | |
Bezeq Israeli
Telecommunication Corp., Ltd. | | | 156,311 | | | | 279,076 | | |
| France Telecom SA | | | 8,193 | | | | 229,437 | | |
Nippon Telegraph &
Telephone Corp. | | | 67 | | | | 298,429 | | |
| Telefonica O2 Czech Republic AS | | | 10,570 | | | | 245,742 | | |
| Telekomunikacja Polska SA | | | 27,271 | | | | 260,920 | | |
| tw telecom, Inc. (a) | | | 1,219 | | | | 12,665 | | |
| | | Shares | | Value ($) | |
| Verizon Communications, Inc. | | | 18,185 | | | | 583,557 | | |
| Warwick Valley Telephone Co. | | | 1,050 | | | | 11,770 | | |
Diversified Telecommunication
Services Total | | | 3,455,856 | | |
| Wireless Telecommunication Services – 0.4% | |
| American Tower Corp., Class A (a) | | | 2,584 | | | | 92,947 | | |
| China Mobile Ltd. | | | 7,500 | | | | 75,093 | | |
Crown Castle
International Corp. (a) | | | 2,050 | | | | 59,389 | | |
| Mobile TeleSystems OJSC, ADR | | | 2,577 | | | | 144,338 | | |
| NII Holdings, Inc. (a) | | | 11,500 | | | | 436,080 | | |
| Syniverse Holdings, Inc. (a) | | | 3,684 | | | | 61,191 | | |
| Vodafone Group PLC | | | 69,228 | | | | 152,938 | | |
| Wireless Telecommunication Services Total | | | 1,021,976 | | |
| Telecommunication Services Total | | | 4,477,832 | | |
| Utilities – 2.1% | |
| Electric Utilities – 1.3% | |
| ALLETE, Inc. | | | 690 | | | | 30,705 | | |
| American Electric Power Co., Inc. | | | 2,700 | | | | 99,981 | | |
| E.ON AG | | | 10,623 | | | | 537,983 | | |
| Edison International | | | 2,200 | | | | 87,780 | | |
| El Paso Electric Co. (a) | | | 1,560 | | | | 32,760 | | |
| Entergy Corp. | | | 6,475 | | | | 576,340 | | |
| Exelon Corp. | | | 7,400 | | | | 463,388 | | |
| FPL Group, Inc. | | | 11,400 | | | | 573,420 | | |
| Hawaiian Electric Industries, Inc. | | | 760 | | | | 22,124 | | |
| Iberdrola SA | | | 21,824 | | | | 223,072 | | |
| ITC Holdings Corp. | | | 1,391 | | | | 72,012 | | |
| Maine & Maritimes Corp. (a) | | | 229 | | | | 7,546 | | |
| MGE Energy, Inc. | | | 730 | | | | 25,951 | | |
| Portland General Electric Co. | | | 1,258 | | | | 29,764 | | |
| PPL Corp. | | | 13,020 | | | | 482,000 | | |
| UIL Holdings Corp. | | | 830 | | | | 28,494 | | |
| Electric Utilities Total | | | 3,293,320 | | |
| Gas Utilities – 0.1% | |
| AGL Resources, Inc. | | | 2,100 | | | | 65,898 | | |
| Questar Corp. | | | 1,330 | | | | 54,424 | | |
| Gas Utilities Total | | | 120,322 | | |
| Independent Power Producers & Energy Traders – 0.0% | |
| Black Hills Corp. | | | 940 | | | | 29,206 | | |
Independent Power Producers &
Energy Traders Total | | | 29,206 | | |
| Multi-Utilities – 0.7% | |
| Avista Corp. | | | 1,450 | | | | 31,480 | | |
| Centrica PLC | | | 33,265 | | | | 186,159 | | |
See Accompanying Notes to Financial Statements.
38
Columbia Asset Allocation Fund
September 30, 2008
| Common Stocks (continued) | |
| | | Shares | | Value ($) | |
| CH Energy Group, Inc. | | | 1,080 | | | | 47,056 | | |
| NorthWestern Corp. | | | 980 | | | | 24,627 | | |
| PG&E Corp. | | | 13,458 | | | | 504,002 | | |
Public Service Enterprise
Group, Inc. | | | 14,680 | | | | 481,357 | | |
| Sempra Energy | | | 2,050 | | | | 103,463 | | |
| United Utilities Group PLC (a) | | | 24,042 | | | | 297,454 | | |
| Wisconsin Energy Corp. | | | 1,800 | | | | 80,820 | | |
| Multi-Utilities Total | | | 1,756,418 | | |
| Utilities Total | | | 5,199,266 | | |
Total Common Stocks
(cost of $148,418,709) | | | 144,937,449 | | |
| Mortgage-Backed Securities – 13.1% | |
| | | Par ($) | | | |
| Federal Home Loan Mortgage Corp. | |
| 5.000% 02/01/38 | | | 941,021 | | | | 917,237 | | |
| 5.000% 03/01/38 | | | 886,145 | | | | 863,748 | | |
| 5.500% 04/01/21 | | | 2,249,021 | | | | 2,266,963 | | |
| 5.500% 12/01/37 | | | 1,199,356 | | | | 1,193,939 | | |
| 5.500% 07/01/38 | | | 900,000 | | | | 895,935 | | |
| 6.000% 12/01/37 | | | 1,800,000 | | | | 1,823,847 | | |
| 6.500% 02/01/11 | | | 20,293 | | | | 21,023 | | |
| 6.500% 04/01/11 | | | 36,129 | | | | 37,480 | | |
| 6.500% 05/01/11 | | | 25,113 | | | | 26,017 | | |
| 6.500% 10/01/11 | | | 15,948 | | | | 16,640 | | |
| 6.500% 07/01/16 | | | 12,813 | | | | 13,434 | | |
| 6.500% 04/01/26 | | | 28,591 | | | | 29,635 | | |
| 6.500% 06/01/26 | | | 33,345 | | | | 34,562 | | |
| 6.500% 02/01/27 | | | 173,168 | | | | 179,382 | | |
| 6.500% 09/01/28 | | | 69,043 | | | | 71,520 | | |
| 6.500% 06/01/31 | | | 43,508 | | | | 45,001 | | |
| 6.500% 07/01/31 | | | 13,399 | | | | 13,863 | | |
| 6.500% 01/01/38 | | | 900,000 | | | | 923,855 | | |
| 6.500% 07/01/38 | | | 905,913 | | | | 929,925 | | |
| 7.000% 07/01/28 | | | 48,008 | | | | 50,655 | | |
| 7.000% 04/01/29 | | | 27,635 | | | | 29,159 | | |
| 7.000% 01/01/30 | | | 13,578 | | | | 14,298 | | |
| 7.000% 06/01/31 | | | 8,415 | | | | 8,847 | | |
| 7.000% 08/01/31 | | | 97,223 | | | | 102,210 | | |
| 7.500% 08/01/15 | | | 567 | | | | 598 | | |
| 7.500% 01/01/30 | | | 71,054 | | | | 76,958 | | |
| 8.000% 09/01/15 | | | 25,764 | | | | 27,490 | | |
| TBA | |
| 5.000% 12/01/38 (g) | | | 2,695,000 | | | | 2,625,097 | | |
| Federal National Mortgage Association | |
| 5.000% 05/01/37 | | | 930,885 | | | | 907,741 | | |
| 5.000% 01/01/38 | | | 1,089,619 | | | | 1,062,528 | | |
| | | Par ($) | | Value ($) | |
| 5.500% 11/01/21 | | | 400,604 | | | | 404,426 | | |
| 5.500% 04/01/36 | | | 1,447,018 | | | | 1,444,325 | | |
| 5.500% 11/01/36 | | | 3,309,730 | | | | 3,303,571 | | |
| 5.500% 06/01/38 | | | 2,016,982 | | | | 2,012,914 | | |
| 6.000% 07/01/35 | | | 313,156 | | | | 317,647 | | |
| 6.000% 09/01/36 | | | 1,012,360 | | | | 1,026,562 | | |
| 6.000% 12/01/36 | | | 3,093,155 | | | | 3,136,550 | | |
| 6.000% 07/01/37 | | | 1,170,486 | | | | 1,186,841 | | |
| 6.000% 06/01/38 | | | 1,979,048 | | | | 2,006,504 | | |
| 6.500% 03/01/11 | | | 4,312 | | | | 4,473 | | |
| 6.500% 08/01/37 | | | 1,686,907 | | | | 1,731,565 | | |
| 7.000% 03/01/15 | | | 53,048 | | | | 55,960 | | |
| 7.000% 07/01/16 | | | 10,223 | | | | 10,772 | | |
| 7.000% 02/01/31 | | | 18,717 | | | | 19,675 | | |
| 7.000% 07/01/31 | | | 81,657 | | | | 85,833 | | |
| 7.000% 07/01/32 | | | 10,098 | | | | 10,612 | | |
| 7.500% 06/01/15 | | | 17,028 | | | | 17,861 | | |
| 7.500% 08/01/15 | | | 35,867 | | | | 37,622 | | |
| 7.500% 09/01/15 | | | 15,098 | | | | 15,837 | | |
| 7.500% 02/01/31 | | | 49,271 | | | | 53,225 | | |
| 7.500% 08/01/31 | | | 22,224 | | | | 23,982 | | |
| 8.000% 12/01/29 | | | 24,467 | | | | 26,644 | | |
| 8.000% 04/01/30 | | | 30,006 | | | | 32,507 | | |
| 8.000% 05/01/30 | | | 2,844 | | | | 3,081 | | |
| 8.000% 07/01/31 | | | 29,485 | | | | 31,921 | | |
| Government National Mortgage Association | |
| 6.000% 04/15/13 | | | 4,497 | | | | 4,648 | | |
| 6.500% 05/15/13 | | | 11,800 | | | | 12,310 | | |
| 6.500% 06/15/13 | | | 4,236 | | | | 4,419 | | |
| 6.500% 08/15/13 | | | 12,365 | | | | 12,899 | | |
| 6.500% 11/15/13 | | | 51,915 | | | | 54,158 | | |
| 6.500% 07/15/14 | | | 33,733 | | | | 35,198 | | |
| 6.500% 01/15/29 | | | 6,494 | | | | 6,689 | | |
| 6.500% 03/15/29 | | | 73,597 | | | | 75,802 | | |
| 6.500% 04/15/29 | | | 131,857 | | | | 135,808 | | |
| 6.500% 05/15/29 | | | 116,666 | | | | 120,161 | | |
| 6.500% 07/15/31 | | | 53,655 | | | | 55,228 | | |
| 7.000% 11/15/13 | | | 160,544 | | | | 169,328 | | |
| 7.000% 05/15/29 | | | 19,528 | | | | 20,576 | | |
| 7.000% 09/15/29 | | | 31,774 | | | | 33,478 | | |
| 7.000% 06/15/31 | | | 22,655 | | | | 23,827 | | |
| 7.500% 06/15/23 | | | 874 | | | | 944 | | |
| 7.500% 01/15/26 | | | 21,479 | | | | 23,196 | | |
| 7.500% 09/15/29 | | | 58,755 | | | | 63,359 | | |
| 8.000% 07/15/25 | | | 9,687 | | | | 10,631 | | |
| 8.500% 12/15/30 | | | 3,200 | | | | 3,520 | | |
| 9.000% 12/15/17 | | | 24,354 | | | | 26,572 | | |
Total Mortgage-Backed Securities
(cost of $32,879,950) | | | 33,103,248 | | |
See Accompanying Notes to Financial Statements.
39
Columbia Asset Allocation Fund
September 30, 2008
| Corporate Fixed-Income Bonds & Notes – 10.7% | |
| | | Par ($) | | Value ($) | |
| Basic Materials – 0.6% | |
| Chemicals – 0.2% | |
| EI Du Pont de Nemours & Co. | |
| 5.000% 07/15/13 | | | 225,000 | | | | 221,610 | | |
| Huntsman International LLC | |
| 7.875% 11/15/14 | | | 350,000 | | | | 301,000 | | |
| Chemicals Total | | | 522,610 | | |
| Forest Products & Paper – 0.2% | |
| Domtar Corp. | |
| 7.125% 08/15/15 | | | 240,000 | | | | 220,800 | | |
| Georgia-Pacific Corp. | |
| 8.000% 01/15/24 | | | 320,000 | | | | 281,600 | | |
| Forest Products & Paper Total | | | 502,400 | | |
| Iron/Steel – 0.1% | |
| Nucor Corp. | |
| 5.850% 06/01/18 | | | 290,000 | | | | 276,203 | | |
| Iron/Steel Total | | | 276,203 | | |
| Metals & Mining – 0.1% | |
| Freeport-McMoRan Copper & Gold, Inc. | |
| 8.375% 04/01/17 | | | 315,000 | | | | 310,275 | | |
| Metals & Mining Total | | | 310,275 | | |
| Basic Materials Total | | | 1,611,488 | | |
| Communications – 1.6% | |
| Media – 0.6% | |
| Charter Communications Holdings II LLC | |
| 10.250% 09/15/10 | | | 350,000 | | | | 315,000 | | |
| Comcast Corp. | |
| 7.050% 03/15/33 | | | 325,000 | | | | 291,483 | | |
| EchoStar DBS Corp. | |
| 6.625% 10/01/14 | | | 330,000 | | | | 264,825 | | |
| News America, Inc. | |
| 6.550% 03/15/33 | | | 275,000 | | | | 246,471 | | |
| R.H. Donnelley Corp. | |
| 8.875% 10/15/17 | | | 450,000 | | | | 153,000 | | |
| Time Warner Cable, Inc. | |
| 7.300% 07/01/38 | | | 325,000 | | | | 289,107 | | |
| Viacom, Inc. | |
| 6.125% 10/05/17 | | | 110,000 | | | | 99,789 | | |
| Media Total | | | 1,659,675 | | |
| Telecommunication Services – 1.0% | |
| AT&T, Inc. | |
| 5.100% 09/15/14 | | | 275,000 | | | | 257,205 | | |
| British Telecommunications PLC | |
| 5.150% 01/15/13 | | | 225,000 | | | | 209,986 | | |
| | | Par ($) | | Value ($) | |
| Citizens Communications Co. | |
| 7.875% 01/15/27 | | | 425,000 | | | | 318,750 | | |
| Intelsat Bermuda Ltd. | |
| 9.250% 06/15/16 (d) | | | 215,000 | | | | 197,800 | | |
| Lucent Technologies, Inc. | |
| 6.450% 03/15/29 | | | 415,000 | | | | 253,150 | | |
| New Cingular Wireless Services, Inc. | |
| 8.750% 03/01/31 | | | 225,000 | | | | 248,774 | | |
| Qwest Communications International, Inc. | |
| 7.500% 02/15/14 | | | 200,000 | | | | 173,000 | | |
| Telefonica Emisones SAU | |
| 5.984% 06/20/11 | | | 225,000 | | | | 222,534 | | |
| Vodafone Group PLC | |
| 5.000% 12/16/13 | | | 300,000 | | | | 283,202 | | |
| Windstream Corp. | |
| 8.625% 08/01/16 | | | 350,000 | | | | 322,875 | | |
| Telecommunication Services Total | | | 2,487,276 | | |
| Communications Total | | | 4,146,951 | | |
| Consumer Cyclical – 0.7% | |
| Apparel – 0.1% | |
| Levi Strauss & Co. | |
| 9.750% 01/15/15 | | | 345,000 | | | | 288,075 | | |
| Apparel Total | | | 288,075 | | |
| Auto Manufacturers – 0.1% | |
| General Motors Corp. | |
| 8.375% 07/15/33 | | | 400,000 | | | | 160,000 | | |
| Auto Manufacturers Total | | | 160,000 | | |
| Lodging – 0.3% | |
| Marriott International, Inc. | |
| 5.625% 02/15/13 | | | 200,000 | | | | 188,645 | | |
| Mashantucket Western Pequot Tribe | |
| 8.500% 11/15/15 (d) | | | 340,000 | | | | 221,000 | | |
| MGM Mirage | |
| 7.500% 06/01/16 | | | 330,000 | | | | 240,900 | | |
| Lodging Total | | | 650,545 | | |
| Retail – 0.2% | |
| CVS Caremark Corp. | |
| 5.750% 06/01/17 | | | 275,000 | | | | 256,985 | | |
| Wal-Mart Stores, Inc. | |
| 5.800% 02/15/18 | | | 300,000 | | | | 293,074 | | |
| Retail Total | | | 550,059 | | |
| Consumer Cyclical Total | | | 1,648,679 | | |
See Accompanying Notes to Financial Statements.
40
Columbia Asset Allocation Fund
September 30, 2008
| Corporate Fixed-Income Bonds & Notes (continued) | |
| | | Par ($) | | Value ($) | |
| Consumer Non-Cyclical – 0.9% | |
| Beverages – 0.1% | |
| Diageo Capital PLC | |
| 5.750% 10/23/17 | | | 225,000 | | | | 215,912 | | |
| Beverages Total | | | 215,912 | | |
| Commercial Services – 0.1% | |
| Iron Mountain, Inc. | |
| 8.000% 06/15/20 | | | 215,000 | | | | 206,400 | | |
| Commercial Services Total | | | 206,400 | | |
| Food – 0.2% | |
| ConAgra Foods, Inc. | |
| 6.750% 09/15/11 | | | 205,000 | | | | 212,529 | | |
| Kraft Foods, Inc. | |
| 6.500% 08/11/17 | | | 320,000 | | | | 307,905 | | |
| Food Total | | | 520,434 | | |
| Healthcare Products – 0.1% | |
| Biomet, Inc. | |
| PIK, | |
| 10.375% 10/15/17 | | | 295,000 | | | | 292,050 | | |
| Healthcare Products Total | | | 292,050 | | |
| Healthcare Services – 0.2% | |
| Community Health Systems, Inc. | |
| 8.875% 07/15/15 | | | 210,000 | | | | 199,500 | | |
| HCA, Inc. | |
| PIK, | |
| 9.625% 11/15/16 | | | 250,000 | | | | 237,500 | | |
| Healthcare Services Total | | | 437,000 | | |
| Household Products/Wares – 0.1% | |
| Fortune Brands, Inc. | |
| 5.375% 01/15/16 | | | 250,000 | | | | 226,948 | | |
| Household Products/Wares Total | | | 226,948 | | |
| Pharmaceuticals – 0.1% | |
| Wyeth | |
| 5.500% 02/01/14 | | | 280,000 | | | | 277,556 | | |
| Pharmaceuticals Total | | | 277,556 | | |
| Consumer Non-Cyclical Total | | | 2,176,300 | | |
| Energy – 1.3% | |
| Coal – 0.1% | |
| Arch Western Finance LLC | |
| 6.750% 07/01/13 | | | 320,000 | | | | 300,800 | | |
| Coal Total | | | 300,800 | | |
| | | Par ($) | | Value ($) | |
| Oil & Gas – 0.6% | |
| Canadian Natural Resources Ltd. | |
| 5.700% 05/15/17 | | | 250,000 | | | | 218,548 | | |
| Chesapeake Energy Corp. | |
| 6.375% 06/15/15 | | | 310,000 | | | | 276,675 | | |
| KCS Energy, Inc. | |
| 7.125% 04/01/12 | | | 320,000 | | | | 281,600 | | |
| Nexen, Inc. | |
| 5.875% 03/10/35 | | | 260,000 | | | | 194,673 | | |
| OPTI Canada, Inc. | |
| 8.250% 12/15/14 | | | 245,000 | | | | 219,275 | | |
| Talisman Energy, Inc. | |
| 6.250% 02/01/38 | | | 255,000 | | | | 198,053 | | |
| Valero Energy Corp. | |
| 6.875% 04/15/12 | | | 225,000 | | | | 231,040 | | |
| Oil & Gas Total | | | 1,619,864 | | |
| Oil & Gas Services – 0.2% | |
| Halliburton Co. | |
| 5.900% 09/15/18 | | | 300,000 | | | | 295,997 | | |
| Weatherford International Ltd. | |
| 5.150% 03/15/13 | | | 190,000 | | | | 182,979 | | |
| Oil & Gas Services Total | | | 478,976 | | |
| Pipelines – 0.4% | |
| El Paso Corp. | |
| 6.875% 06/15/14 | | | 295,000 | | | | 272,070 | | |
| MarkWest Energy Partners LP | |
| 8.500% 07/15/16 | | | 235,000 | | | | 222,075 | | |
| Plains All American Pipeline LP/PAA Finance Corp. | |
| 6.650% 01/15/37 | | | 250,000 | | | | 204,781 | | |
| TransCanada Pipelines Ltd. | |
| 6.350% 05/15/67 (e) | | | 320,000 | | | | 253,146 | | |
| Pipelines Total | | | 952,072 | | |
| Energy Total | | | 3,351,712 | | |
| Financials – 3.2% | |
| Banks – 1.2% | |
| Bank of New York Mellon Corp. | |
| 5.125% 08/27/13 | | | 360,000 | | | | 343,203 | | |
| Credit Suisse/New York NY | |
| 6.000% 02/15/18 | | | 375,000 | | | | 326,700 | | |
| Deutsche Bank AG | |
| 4.875% 05/20/13 | | | 325,000 | | | | 310,432 | | |
| HSBC Capital Funding LP | |
| 9.547% 12/31/49 (d)(e) | | | 550,000 | | | | 504,900 | | |
See Accompanying Notes to Financial Statements.
41
Columbia Asset Allocation Fund
September 30, 2008
| Corporate Fixed-Income Bonds & Notes (continued) | |
| | | Par ($) | | Value ($) | |
| JPMorgan Chase & Co. | |
| 6.000% 01/15/18 | | | 450,000 | | | | 410,343 | | |
| SunTrust Preferred Capital I | |
| 5.853% 12/15/11 (e) | | | 280,000 | | | | 154,000 | | |
| USB Capital IX | |
| 6.189% 04/15/49 (e) | | | 500,000 | | | | 245,000 | | |
| Wachovia Corp. | |
| 4.875% 02/15/14 | | | 500,000 | | | | 306,898 | | |
| Wells Fargo & Co. | |
| 5.250% 10/23/12 | | | 325,000 | | | | 311,951 | | |
| Banks Total | | | 2,913,427 | | |
| Diversified Financial Services – 1.4% | |
| AGFC Capital Trust I | |
| 6.000% 01/15/67 (d)(e) | | | 350,000 | | | | 94,013 | | |
| American Express Credit Corp. | |
| 5.875% 05/02/13 | | | 345,000 | | | | 317,969 | | |
| Capital One Financial Corp. | |
| 5.500% 06/01/15 | | | 450,000 | | | | 369,738 | | |
| CDX North America High Yield | |
| 8.875% 06/29/13 (d) | | | 600,000 | | | | 537,000 | | |
| Citicorp Lease Pass-Through Trust | |
| 8.040% 12/15/19 (d) | | | 750,000 | | | | 654,149 | | |
| Ford Motor Credit Co. | |
| 8.000% 12/15/16 | | | 400,000 | | | | 252,911 | | |
| GMAC LLC | |
| 8.000% 11/01/31 | | | 370,000 | | | | 139,592 | | |
| Goldman Sachs Group, Inc. | |
| 6.345% 02/15/34 | | | 475,000 | | | | 312,109 | | |
| Lehman Brothers Holdings, Inc. | |
| 5.750% 07/18/11 (f)(k) | | | 350,000 | | | | 43,750 | | |
| Merrill Lynch & Co., Inc. | |
| 6.050% 08/15/12 | | | 350,000 | | | | 328,172 | | |
| Morgan Stanley | |
| 6.750% 04/15/11 | | | 400,000 | | | | 296,046 | | |
| Nuveen Investments, Inc. | |
| 10.500% 11/15/15 (d) | | | 325,000 | | | | 250,250 | | |
| Diversified Financial Services Total | | | 3,595,699 | | |
| Insurance – 0.4% | |
| Chubb Corp. | |
| 5.750% 05/15/18 | | | 250,000 | | | | 231,677 | | |
| Principal Life Income Funding Trusts | |
| 5.300% 04/24/13 | | | 200,000 | | | | 199,372 | | |
| Prudential Financial, Inc. | |
| 6.000% 12/01/17 | | | 225,000 | | | | 200,564 | | |
| UnitedHealth Group, Inc. | |
| 5.250% 03/15/11 | | | 225,000 | | | | 223,693 | | |
| Insurance Total | | | 855,306 | | |
| | | Par ($) | | Value ($) | |
| Real Estate Investment Trusts (REITs) – 0.2% | |
| Health Care Property Investors, Inc. | |
| 6.450% 06/25/12 | | | 250,000 | | | | 234,434 | | |
| Simon Property Group LP | |
| 5.750% 12/01/15 | | | 375,000 | | | | 354,404 | | |
| Real Estate Investment Trusts (REITs) Total | | | 588,838 | | |
| Financial Total | | | 7,953,270 | | |
| Industrials – 0.8% | |
| Aerospace & Defense – 0.2% | |
| L-3 Communications Corp. | |
| 5.875% 01/15/15 | | | 310,000 | | | | 280,550 | | |
| United Technologies Corp. | |
| 5.375% 12/15/17 | | | 300,000 | | | | 289,987 | | |
| Aerospace & Defense Total | | | 570,537 | | |
| Environmental Control – 0.1% | |
| Allied Waste North America, Inc. | |
| 7.125% 05/15/16 | | | 215,000 | | | | 200,487 | | |
| Environmental Control Total | | | 200,487 | | |
| Machinery – 0.1% | |
| Caterpillar Financial Services Corp. | |
| 5.450% 04/15/18 | | | 300,000 | | | | 268,391 | | |
| Machinery Total | | | 268,391 | | |
| Machinery-Construction & Mining – 0.1% | |
| Terex Corp. | |
| 8.000% 11/15/17 | | | 215,000 | | | | 195,650 | | |
| Machinery-Construction & Mining Total | | | 195,650 | | |
| Miscellaneous Manufacturing – 0.1% | |
| Bombardier, Inc. | |
| 6.300% 05/01/14 (d) | | | 235,000 | | | | 218,550 | | |
| Miscellaneous Manufacturing Total | | | 218,550 | | |
| Transportation – 0.2% | |
| Burlington Northern Santa Fe Corp. | |
| 6.200% 08/15/36 | | | 250,000 | | | | 229,594 | | |
| Union Pacific Corp. | |
| 6.650% 01/15/11 | | | 200,000 | | | | 206,064 | | |
| United Parcel Service, Inc. | |
| 4.500% 01/15/13 | | | 155,000 | | | | 156,676 | | |
| Transportation Total | | | 592,334 | | |
| Industrials Total | | | 2,045,949 | | |
| Technology – 0.3% | |
| Networking Equipment – 0.1% | |
| Cisco Systems, Inc. | |
| 5.250% 02/22/11 | | | 275,000 | | | | 280,729 | | |
| Networking Equipment Total | | | 280,729 | | |
See Accompanying Notes to Financial Statements.
42
Columbia Asset Allocation Fund
September 30, 2008
| Corporate Fixed-Income Bonds & Notes (continued) | |
| | | Par ($) | | Value ($) | |
| Semiconductors – 0.1% | |
| Freescale Semiconductor, Inc. | |
| PIK, | |
| 9.125% 12/15/14 | | | 425,000 | | | | 267,750 | | |
| Semiconductors Total | | | 267,750 | | |
| Software – 0.1% | |
| Oracle Corp. | |
| 6.500% 04/15/38 | | | 300,000 | | | | 272,742 | | |
| Software Total | | | 272,742 | | |
| Technology Total | | | 821,221 | | |
| Utilities – 1.3% | |
| Electric – 1.1% | |
| Commonwealth Edison Co. | |
| 5.950% 08/15/16 | | | 300,000 | | | | 283,323 | | |
| Consolidated Edison Co. of New York, Inc. | |
| 5.850% 04/01/18 | | | 255,000 | | | | 242,094 | | |
| Indiana Michigan Power Co. | |
| 5.650% 12/01/15 | | | 350,000 | | | | 323,240 | | |
| Intergen NV | |
| 9.000% 06/30/17 (d) | | | 340,000 | | | | 340,000 | | |
| NRG Energy, Inc. | |
| 7.250% 02/01/14 | | | 35,000 | | | | 32,463 | | |
| 7.375% 02/01/16 | | | 315,000 | | | | 283,500 | | |
| Pacific Gas & Electric Co. | |
| 5.800% 03/01/37 | | | 300,000 | | | | 255,897 | | |
| Progress Energy, Inc. | |
| 7.750% 03/01/31 | | | 225,000 | | | | 231,086 | | |
| Southern California Edison Co. | |
| 5.000% 01/15/14 | | | 400,000 | | | | 391,351 | | |
| Texas Competitive Electric Holdings Co. | |
| PIK, | |
| 10.500% 11/01/16 (d) | | | 370,000 | | | | 313,575 | | |
| Electric Total | | | 2,696,529 | | |
| Gas – 0.2% | |
| Atmos Energy Corp. | |
| 6.350% 06/15/17 | | | 225,000 | | | | 211,725 | | |
| Sempra Energy | |
| 4.750% 05/15/09 | | | 275,000 | | | | 275,014 | | |
| Gas Total | | | 486,739 | | |
| Utilities Total | | | 3,183,268 | | |
Total Corporate Fixed-Income Bonds & Notes
(cost of $31,662,573) | | | 26,938,838 | | |
| Government & Agency Obligations – 4.4% | |
| | | Par ($) | | Value ($) | |
| Foreign Government Obligations – 0.6% | |
| Province of Ontario | |
| 3.125% 09/08/10 | | | 400,000 | | | | 402,916 | | |
| Province of Quebec | |
| 5.000% 07/17/09 | | | 600,000 | | | | 610,608 | | |
| United Mexican States | |
| 7.500% 04/08/33 | | | 425,000 | | | | 464,313 | | |
| Foreign Government Obligations Total | | | 1,477,837 | | |
| U.S. Government Agencies – 0.9% | |
| Federal Home Loan Bank | |
| 5.500% 08/13/14 (h) | | | 515,000 | | | | 542,274 | | |
| Federal Home Loan Mortgage Corp. | |
| 6.625% 09/15/09 (h) | | | 1,300,000 | | | | 1,342,108 | | |
| Federal National Mortgage Association | |
| 5.000% 10/15/11 (h) | | | 320,000 | | | | 334,360 | | |
| 5.375% 08/15/09 (i) | | | 60,000 | | | | 61,140 | | |
| U.S. Government Agencies Total | | | 2,279,882 | | |
| U.S. Government Obligations – 2.9% | |
| U.S. Treasury Bonds | |
| 4.875% 05/31/11 (h) | | | 1,200,000 | | | | 1,286,250 | | |
| 5.375% 02/15/31 (h) | | | 4,375,000 | | | | 4,971,435 | | |
| U.S. Treasury Inflation Indexed Bond | |
| 3.500% 01/15/11 (h) | | | 935,071 | | | | 972,401 | | |
| U.S. Government Obligations Total | | | 7,230,086 | | |
Total Government & Agency Obligations
(cost of $10,628,694) | | | 10,987,805 | | |
| Commercial Mortgage-Backed Securities – 3.9% | |
| Bear Stearns Commercial Mortgage Securities | |
| 5.742% 09/11/42 | | | 1,000,000 | | | | 856,576 | | |
| Citigroup/Deutsche Bank Commercial Mortgage Trust | |
| 5.366% 12/11/49 | | | 420,000 | | | | 319,038 | | |
| Commercial Mortgage Pass Through Certificates | |
| 5.234% 07/10/37 | | | 980,000 | | | | 945,866 | | |
| CS First Boston Mortgage Securities Corp. | |
| 4.577% 04/15/37 | | | 1,586,000 | | | | 1,547,012 | | |
| First Union-Chase Commercial Mortgage | |
| 6.645% 06/15/31 | | | 235,683 | | | | 235,141 | | |
| JPMorgan Chase Commercial Mortgage Securities Corp. | |
| 4.780% 07/15/42 | | | 310,000 | | | | 257,807 | | |
| 5.447% 06/12/47 | | | 509,000 | | | | 440,369 | | |
| 5.525% 04/15/43 | | | 1,457,000 | | | | 1,185,468 | | |
See Accompanying Notes to Financial Statements.
43
Columbia Asset Allocation Fund
September 30, 2008
| Commercial Mortgage-Backed Securities (continued) | |
| | | Par ($) | | Value ($) | |
| Morgan Stanley Capital I | |
| 5.809% 12/12/49 | | | 1,500,000 | | | | 1,277,831 | | |
| Wachovia Bank Commercial Mortgage Trust | |
| 3.989% 06/15/35 | | | 3,000,000 | | | | 2,699,764 | | |
Total Commercial Mortgage-Backed Securities
(cost of $10,989,490) | | | 9,764,872 | | |
| Collateralized Mortgage Obligations – 3.4% | |
| Agency – 1.7% | |
| Federal Home Loan Mortgage Corp. | |
| 5.000% 12/15/15 | | | 17,920 | | | | 17,903 | | |
| 5.500% 06/15/34 | | | 2,500,000 | | | | 2,451,908 | | |
| 6.000% 02/15/28 | | | 873,535 | | | | 894,216 | | |
| Federal National Mortgage Association | |
| 5.000% 12/25/15 | | | 873,967 | | | | 879,493 | | |
| Agency Total | | | 4,243,520 | | |
| Non-Agency – 1.7% | |
| American Mortgage Trust | |
| 8.445% 09/27/22 (e) | | | 7,938 | | | | 4,811 | | |
| Bear Stearns Adjustable Rate Mortgage Trust | |
| 5.509% 02/25/47 (e) | | | 1,013,000 | | | | 707,553 | | |
| Countrywide Alternative Loan Trust | |
| 5.250% 08/25/35 | | | 418,415 | | | | 389,722 | | |
| 5.500% 10/25/35 | | | 749,632 | | | | 696,636 | | |
| JPMorgan Mortgage Trust | |
| 6.043% 10/25/36 | | | 779,671 | | | | 673,802 | | |
| Lehman Mortgage Trust | |
| 6.500% 01/25/38 | | | 827,659 | | | | 707,907 | | |
| WaMu Mortgage Pass-Through Certificates | |
| 5.711% 02/25/37 (e) | | | 1,585,861 | | | | 1,167,419 | | |
| Non-Agency Total | | | 4,347,850 | | |
Total Collateralized Mortgage Obligations
(cost of $9,667,489) | | | 8,591,370 | | |
| Asset-Backed Securities – 1.6% | |
| Citicorp Residential Mortgage Securities, Inc. | |
| 6.080% 06/25/37 | | | 490,000 | | | | 444,470 | | |
| Consumer Funding LLC | |
| 5.430% 04/20/15 | | | 820,000 | | | | 823,837 | | |
| Ford Credit Auto Owner Trust | |
| 5.470% 06/15/12 | | | 761,000 | | | | 733,873 | | |
| Franklin Auto Trust | |
| 5.360% 05/20/16 | | | 989,000 | | | | 957,903 | | |
| | | Par ($) | | Value ($) | |
| Green Tree Financial Corp. | |
| 6.870% 01/15/29 | | | 139,128 | | | | 134,816 | | |
| USAA Auto Owner Trust | |
| 4.500% 10/15/13 | | | 1,046,000 | | | | 1,008,700 | | |
Total Asset-Backed Securities
(cost of $4,296,772) | | | 4,103,599 | | |
| Preferred Stocks – 0.1% | |
| | | Shares | | | |
| Consumer Staples – 0.0% | |
| Food Products – 0.0% | |
| Sadia SA | | | 14,700 | | | | 44,033 | | |
| Food Products Total | | | 44,033 | | |
| Consumer Staples Total | | | 44,033 | | |
| Utilities – 0.1% | |
| Electric Utilities – 0.1% | |
| Cia Energetica de Minas Gerais | | | 5,800 | | | | 114,604 | | |
| Electric Utilities Total | | | 114,604 | | |
| Utilities Total | | | 114,604 | | |
Total Preferred Stocks
(cost of $246,163) | | | 158,637 | | |
| Convertible Preferred Stock – 0.1% | |
| Health Care – 0.1% | |
| Pharmaceuticals – 0.1% | |
| Schering-Plough Corp., 6.000% | | | 1,000 | | | | 173,020 | | |
| Pharmaceuticals Total | | | 173,020 | | |
| Health Care Total | | | 173,020 | | |
Total Convertible Preferred Stock
(cost of $265,190) | | | 173,020 | | |
| Investment Companies – 0.1% | |
| iShares MSCI Brazil Index Fund | | | 1,493 | | | | 84,459 | | |
| iShares MSCI EAFE Index Fund | | | 1,528 | | | | 86,026 | | |
Total Investment Companies
(cost of $203,451) | | | 170,485 | | |
See Accompanying Notes to Financial Statements.
44
Columbia Asset Allocation Fund
September 30, 2008
| Purchased Put Options – 0.0% | |
| | | Shares | | Value ($) | |
Agnico Eagle Mines Ltd.
October Put
Strike Price: $60
Expire: 10/18/08 | | | 700 | | | | 4,340 | | |
CBOE SpX Volatility Index
November Put
Strike Price: $25
Expire: 11/15/08 | | | 10,200 | | | | 16,830 | | |
| Purchsed Put Options Total | | | 21,170 | | |
Total Purchased Put Options
(cost of $32,488) | | | 21,170 | | |
| Securities Lending Collateral – 3.8% | |
State Street Navigator
Securities Lending
Prime Portfolio (j)
(7 day yield of 2.719%) | | | 9,660,703 | | | | 9,660,703 | | |
Total Securities Lending Collateral
(cost of $9,660,703) | | | 9,660,703 | | |
| Short-Term Obligation – 5.2% | |
| | | Par ($) | | | |
Repurchase agreement with
Fixed Income Clearing Corp.,
dated 09/30/08, due on 10/01/08,
at 1.400%, collateralized by
U.S. Government Agency Obligations
with various maturities to
07/15/37, market value of
$13,491,674 (repurchase
proceeds $13,213,514) | | | 13,213,000 | | | | 13,213,000 | | |
Total Short-Term Obligation
(cost of $13,213,000) | | | 13,213,000 | | |
Total Investments – 104.0%
(cost of $272,164,672) (l) | | | 261,824,196 | | |
Obligation to Return Collateral for
Securities Loaned – (3.8)% | | | (9,660,703 | ) | |
| Other Assets & Liabilities, Net – (0.2)% | | | (415,642 | ) | |
| Net Assets – 100.0% | | | 251,747,851 | | |
Notes to Investment Portfolio:
(a) Non-income producing security.
(b) All or a portion of this security is pledged as collateral for open written options contracts. The total market value of securities pledged as collateral at September 30, 2008, is $956,032.
(c) Represents fair value as determined in good faith under procedures approved by the Board of Trustees.
(d) Security exempt from registration pursuant to Rule 144A under the Securities Act of 1933. These securities may be resold in transactions exempt from registration, normally to qualified institutional buyers. At September 30, 2008, these securities, which are not illiquid, amounted to $3,733,015, which represents 1.5% of net assets.
(e) The interest rate shown on floating rate or variable rate securities reflects the rate at September 30, 2008.
(f) The issuer has filed for bankruptcy protection under Chapter 11, and is in default of certain debt covenants. Income is not being accrued.
(g) Security purchased on a delayed delivery basis. At September 30, 2008, the value of this security represents less than 0.1% of net assets.
(h) All or a portion of this security was on loan at September 30, 2008. The total market value of securities on loan at September 30, 2008 is $9,307,789.
(i) A portion of this security with a market value of $40,760 is pledged as collateral for open futures contracts.
(j) Investment made with cash collateral received from securities lending activity.
(k) Represents fair value as determined in good faith under procedures approved by the Board of Trustees.
(l) Cost for federal income tax purposes is $274,126,603.
At September 30, 2008, the asset allocation of the Fund is as follows:
| Asset Allocation (Unaudited) | | % of
Net Assets | |
| Common Stocks | | | 57.6 | | |
| Mortgage-Backed Securities | | | 13.1 | | |
| Corporate Fixed-Income Bonds & Notes | | | 10.7 | | |
| Government & Agency Obligations | | | 4.4 | | |
| Commercial Mortgage-Backed Securities | | | 3.9 | | |
| Collateralized Mortgage Obligations | | | 3.4 | | |
| Asset-Backed Securities | | | 1.6 | | |
| Preferred Stocks | | | 0.1 | | |
| Convertible Preferred Stock | | | 0.1 | | |
| | | | 94.9 | | |
| Securities Lending Collateral | | | 3.8 | | |
| Investment Companies | | | 0.1 | | |
| Purchased Put Options | | | 0.0 | * | |
| Short-Term Obligation | | | 5.2 | | |
| Obligation to Return Collateral for Securities Loaned | | | (3.8 | ) | |
| Other Assets & Liabilities, Net | | | (0.2 | ) | |
| * Rounds to less than 0.1%. | | | 100.0 | | |
At September 30, 2008, the Fund held the following open long futures contract:
| Type | | Number of
Contracts | | Value | | Aggregate
Face Value | | Expiration
Date | | Unrealized
Depreciation | |
S&P
500
Index | | | 13 | | | $ | 3,794,050 | | | $ | 3,955,149 | | | Dec-2008 | | $ | (161,099 | ) | |
At September 30, 2008, the Fund held the following open short futures contract:
| Type | | Number of
Contracts | | Value | | Aggregate
Face Value | | Expiration
Date | | Unrealized
Depreciation | |
2 YR
U.S.
Treasury
Note | | | 29 | | | $ | 6,189,687 | | | $ | 6,169,725 | | | Dec-2008 | | $ | (19,962 | ) | |
See Accompanying Notes to Financial Statements.
45
Columbia Asset Allocation Fund
September 30, 2008
For the year ended September 30, 2008, transactions in written options contracts were as follows:
| | | Number of
contracts | | Premium
received | |
| Options outstanding at September 30, 2007 | | | 173 | | | $ | 25,085 | | |
| Options written | | | 462 | | | | 72,576 | | |
| Options bought back | | | (178 | ) | | | (44,350 | ) | |
| Options expired | | | (313 | ) | | | (40,722 | ) | |
| Options exercised | | | (38 | ) | | | (8,693 | ) | |
| Options outstanding at September 30, 2008 | | | 106 | | | $ | 3,896 | | |
At September 30, 2008, the Fund had the following written call options contracts:
Name of
Issuer | | Strike
Price | | Number of
Contracts | | Expiration
Date | | Value | |
| Agnico Eagle Mines Ltd. | | $ | 75 | | | | 7 | | | 11/15/08 | | $ | 1,400 | | |
Goldman Sachs
Group, Inc. | | | 170 | | | | 8 | | | 10/18/08 | | | 360 | | |
| State Street Corp. | | | 70 | | | | 25 | | | 10/18/08 | | | 2,250 | | |
| Verigy Ltd. | | | 20 | | | | 66 | | | 10/18/08 | | | 660 | | |
| Total written call options (proceeds $3,896) | | | | | | $4,670 | |
Forward foreign currency exchange contracts outstanding on September 30, 2008 are:
Forward
Currency
Contracts
to Buy | | Value | | Aggregate
Face Value | | Settlement
Date | | Unrealized
Appreciation
(Depreciation) | |
| AUD | $ | | | | 1,378,677 | | | $ | 1,375,235 | | | 12/17/08 | | $ | 3,442 | | |
| | | CZK | 25, 889 | | | | 27,097 | | | 12/17/08 | | | (1,208 | ) | |
| | | DKK | 112,896 | | | | 110,780 | | | 12/17/08 | | | 2,116 | | |
| | | EUR | 2,539,404 | | | | 2,486,634 | | | 12/17/08 | | | 52,770 | | |
| | | GBP | 1,424,357 | | | | 1,390,899 | | | 12/17/08 | | | 33,458 | | |
| | | JPY | 284,832 | | | | 282,759 | | | 12/17/08 | | | 2,073 | | |
| | | SEK | 103,210 | | | | 108,023 | | | 12/17/08 | | | (4,813 | ) | |
| | | | | $ | 87,838 | | |
Forward
Currency
Contracts
to Sell | | Value | | Aggregate
Face Value | | Settlement
Date | | Unrealized
Appreciation
(Depreciation) | |
| BRL | $ | | | | 78,130 | | | $ | 77,855 | | | 12/17/08 | | $ | (275 | ) | |
| | | CAD | 339,094 | | | | 337,695 | | | 12/17/08 | | | (1,399 | ) | |
| | | CHF | 850,390 | | | | 832,401 | | | 12/17/08 | | | (17,989 | ) | |
| | | CZK | 309,003 | | | | 304,306 | | | 12/17/08 | | | (4,697 | ) | |
| | | EUR | 251,398 | | | | 254,896 | | | 12/17/08 | | | 3,498 | | |
| | | KRW | 76,325 | | | | 81,937 | | | 12/17/08 | | | 5,612 | | |
| | | ILS | 320,541 | | | | 305,379 | | | 12/17/08 | | | (15,162 | ) | |
| | | NOK | 109,612 | | | | 109,884 | | | 12/17/08 | | | 272 | | |
| | | PLN | 310,242 | | | | 301,142 | | | 12/17/08 | | | (9,100 | ) | |
| | | RUB | 168,061 | | | | 165,943 | | | 12/17/08 | | | (2,118 | ) | |
| | | SEK | 274,793 | | | | 275,847 | | | 12/17/08 | | | 1,054 | | |
| | | SGD | 306,637 | | | | 304,819 | | | 12/17/08 | | | (1,818 | ) | |
| | | TWD | 139,203 | | | | 139,399 | | | 12/17/08 | | | 196 | | |
| | | $ | (41,926 | ) | |
| Acronym | | Name | |
| ADR | | American Depositary Receipt | |
|
| AUD | | Australian Dollar | |
|
| BRL | | Brazilian Real | |
|
| CAD | | Canadian Dollar | |
|
| CHF | | Swiss Franc | |
|
| CZK | | Czech Koruna | |
|
| DKK | | Danish Krone | |
|
| EUR | | Euro | |
|
| GBP | | Pound Sterling | |
|
| GDR | | Global Depositary Receipt | |
|
| ILS | | Israeli Shekel | |
|
| JPY | | Japanese Yen | |
|
| KRW | | South Korean Won | |
|
| NOK | | Norwegian Krone | |
|
| PIK | | Payment-in-Kind | |
|
| PLN | | Polish Zloty | |
|
| RUB | | Russian Ruble | |
|
| SEK | | Swedish Krona | |
|
| SGD | | Singapore Dollar | |
|
| TBA | | To Be Announced | |
|
| TWD | | Taiwan Dollar | |
|
See Accompanying Notes to Financial Statements.
46
Investment Portfolio – Columbia Large Cap Growth Fund
September 30, 2008
| Common Stocks – 97.6% | |
| | | Shares | | Value ($) | |
| Consumer Discretionary – 9.1% | |
| Diversified Consumer Services – 0.5% | |
| Apollo Group, Inc., Class A (a) | | | 109,600 | | | | 6,499,280 | | |
| Diversified Consumer Services Total | | | 6,499,280 | | |
| Hotels, Restaurants & Leisure – 0.9% | |
| McDonald's Corp. | | | 198,100 | | | | 12,222,770 | | |
| Hotels, Restaurants & Leisure Total | | | 12,222,770 | | |
| Media – 2.2% | |
| Comcast Corp., Class A | | | 738,300 | | | | 14,492,829 | | |
| DIRECTV Group, Inc. (a) | | | 451,900 | | | | 11,826,223 | | |
| McGraw-Hill Companies, Inc. | | | 163,500 | | | | 5,168,235 | | |
| Media Total | | | 31,487,287 | | |
| Multiline Retail – 0.8% | |
| Kohl's Corp. (a) | | | 233,100 | | | | 10,741,248 | | |
| Multiline Retail Total | | | 10,741,248 | | |
| Specialty Retail – 3.6% | |
| Best Buy Co., Inc. | | | 245,600 | | | | 9,210,000 | | |
| Dick's Sporting Goods, Inc. (a) | | | 300,600 | | | | 5,885,748 | | |
| Lowe's Companies, Inc. | | | 300,400 | | | | 7,116,476 | | |
| Staples, Inc. | | | 806,300 | | | | 18,141,750 | | |
| Urban Outfitters, Inc. (a) | | | 318,900 | | | | 10,163,343 | | |
| Specialty Retail Total | | | 50,517,317 | | |
| Textiles, Apparel & Luxury Goods – 1.1% | |
| NIKE, Inc., Class B | | | 120,900 | | | | 8,088,210 | | |
| Polo Ralph Lauren Corp. | | | 110,200 | | | | 7,343,728 | | |
| Textiles, Apparel & Luxury Goods Total | | | 15,431,938 | | |
| Consumer Discretionary Total | | | 126,899,840 | | |
| Consumer Staples – 13.4% | |
| Beverages – 3.0% | |
| Coca-Cola Co. | | | 346,900 | | | | 18,344,072 | | |
| PepsiCo, Inc. | | | 346,400 | | | | 24,687,928 | | |
| Beverages Total | | | 43,032,000 | | |
| Food & Staples Retailing – 4.4% | |
| BJ's Wholesale Club, Inc. (a) | | | 180,400 | | | | 7,010,344 | | |
| CVS Caremark Corp. | | | 314,500 | | | | 10,586,070 | | |
| Kroger Co. | | | 459,500 | | | | 12,627,060 | | |
| Wal-Mart Stores, Inc. | | | 532,200 | | | | 31,873,458 | | |
| Food & Staples Retailing Total | | | 62,096,932 | | |
| Food Products – 1.4% | |
| Cadbury PLC, ADR | | | 17,868 | | | | 731,516 | | |
| General Mills, Inc. | | | 119,500 | | | | 8,212,040 | | |
| H.J. Heinz Co. | | | 207,800 | | | | 10,383,766 | | |
| Food Products Total | | | 19,327,322 | | |
| | | Shares | | Value ($) | |
| Household Products – 2.4% | |
| Kimberly-Clark Corp. | | | 144,600 | | | | 9,375,864 | | |
| Procter & Gamble Co. | | | 348,600 | | | | 24,293,934 | | |
| Household Products Total | | | 33,669,798 | | |
| Personal Products – 0.7% | |
| Avon Products, Inc. | | | 230,600 | | | | 9,586,042 | | |
| Personal Products Total | | | 9,586,042 | | |
| Tobacco – 1.5% | |
| Philip Morris International, Inc. | | | 430,700 | | | | 20,716,670 | | |
| Tobacco Total | | | 20,716,670 | | |
| Consumer Staples Total | | | 188,428,764 | | |
| Energy – 9.4% | |
| Energy Equipment & Services – 5.0% | |
| Halliburton Co. | | | 299,500 | | | | 9,700,805 | | |
| Nabors Industries Ltd. (a) | | | 339,900 | | | | 8,470,308 | | |
| Schlumberger Ltd. | | | 309,000 | | | | 24,129,810 | | |
| Transocean, Inc. (a) | | | 156,362 | | | | 17,174,802 | | |
| Weatherford International Ltd. (a) | | | 397,800 | | | | 10,000,692 | | |
| Energy Equipment & Services Total | | | 69,476,417 | | |
| Oil, Gas & Consumable Fuels – 4.4% | |
| Devon Energy Corp. | | | 169,675 | | | | 15,474,360 | | |
| El Paso Corp. | | | 965,300 | | | | 12,317,228 | | |
| Hess Corp. | | | 124,900 | | | | 10,251,792 | | |
| Occidental Petroleum Corp. | | | 191,100 | | | | 13,462,995 | | |
| Petroleo Brasileiro SA, ADR | | | 94,728 | | | | 4,163,296 | | |
| Ultra Petroleum Corp. (a) | | | 118,900 | | | | 6,579,926 | | |
| Oil, Gas & Consumable Fuels Total | | | 62,249,597 | | |
| Energy Total | | | 131,726,014 | | |
| Financials – 3.6% | |
| Capital Markets – 2.5% | |
| Goldman Sachs Group, Inc. | | | 71,767 | | | | 9,186,176 | | |
| Janus Capital Group, Inc. | | | 426,700 | | | | 10,360,276 | | |
| TD Ameritrade Holding Corp. (a) | | | 399,300 | | | | 6,468,660 | | |
Waddell & Reed Financial, Inc.,
Class A | | | 355,100 | | | | 8,788,725 | | |
| Capital Markets Total | | | 34,803,837 | | |
| Diversified Financial Services – 1.1% | |
| IntercontinentalExchange, Inc. (a) | | | 56,000 | | | | 4,518,080 | | |
| JPMorgan Chase & Co. | | | 247,200 | | | | 11,544,240 | | |
| Diversified Financial Services Total | | | 16,062,320 | | |
| Financials Total | | | 50,866,157 | | |
See Accompanying Notes to Financial Statements.
47
Columbia Large Cap Growth Fund
September 30, 2008
| Common Stocks (continued) | |
| | | Shares | | Value ($) | |
| Health Care – 15.2% | |
| Biotechnology – 3.5% | |
| Amgen, Inc. (a) | | | 124,000 | | | | 7,349,480 | | |
| Celgene Corp. (a) | | | 201,400 | | | | 12,744,592 | | |
| Genentech, Inc. (a) | | | 104,300 | | | | 9,249,324 | | |
| Genzyme Corp. (a) | | | 146,500 | | | | 11,850,385 | | |
| Gilead Sciences, Inc. (a) | | | 155,900 | | | | 7,105,922 | | |
| Biotechnology Total | | | 48,299,703 | | |
| Health Care Equipment & Supplies – 2.2% | |
| Baxter International, Inc. | | | 149,100 | | | | 9,785,433 | | |
| Covidien Ltd. | | | 156,200 | | | | 8,397,312 | | |
| Medtronic, Inc. | | | 259,200 | | | | 12,985,920 | | |
| Health Care Equipment & Supplies Total | | | 31,168,665 | | |
| Health Care Providers & Services – 2.6% | |
| Express Scripts, Inc. (a) | | | 111,200 | | | | 8,208,784 | | |
| Humana, Inc. (a) | | | 247,700 | | | | 10,205,240 | | |
| Medco Health Solutions, Inc. (a) | | | 401,500 | | | | 18,067,500 | | |
| Health Care Providers & Services Total | | | 36,481,524 | | |
| Life Sciences Tools & Services – 1.6% | |
| Covance, Inc. (a) | | | 98,900 | | | | 8,743,749 | | |
| Thermo Fisher Scientific, Inc. (a) | | | 241,969 | | | | 13,308,295 | | |
| Life Sciences Tools & Services Total | | | 22,052,044 | | |
| Pharmaceuticals – 5.3% | |
| Abbott Laboratories | | | 394,700 | | | | 22,726,826 | | |
| Johnson & Johnson | | | 425,100 | | | | 29,450,928 | | |
| Schering-Plough Corp. | | | 623,500 | | | | 11,516,045 | | |
Teva Pharmaceutical
Industries Ltd., ADR | | | 231,700 | | | | 10,609,543 | | |
| Pharmaceuticals Total | | | 74,303,342 | | |
| Health Care Total | | | 212,305,278 | | |
| Industrials – 12.4% | |
| Aerospace & Defense – 3.4% | |
| Honeywell International, Inc. | | | 410,800 | | | | 17,068,740 | | |
| Lockheed Martin Corp. | | | 107,300 | | | | 11,767,591 | | |
| Raytheon Co. | | | 342,700 | | | | 18,337,877 | | |
| Aerospace & Defense Total | | | 47,174,208 | | |
| Air Freight & Logistics – 0.7% | |
| FedEx Corp. | | | 133,100 | | | | 10,520,224 | | |
| Air Freight & Logistics Total | | | 10,520,224 | | |
| Commercial & Professional Services – 0.7% | |
| Waste Management, Inc. | | | 295,600 | | | | 9,308,444 | | |
| Commercial & Professional Services Total | | | 9,308,444 | | |
| | | Shares | | Value ($) | |
| Construction & Engineering – 0.9% | |
| Quanta Services, Inc. (a) | | | 467,500 | | | | 12,627,175 | | |
| Construction & Engineering Total | | | 12,627,175 | | |
| Electrical Equipment – 1.2% | |
Cooper Industries Ltd.,
Class A | | | 308,900 | | | | 12,340,555 | | |
| First Solar, Inc. (a) | | | 25,300 | | | | 4,779,423 | | |
| Electrical Equipment Total | | | 17,119,978 | | |
| Machinery – 2.5% | |
| Caterpillar, Inc. | | | 158,100 | | | | 9,422,760 | | |
| Illinois Tool Works, Inc. | | | 260,500 | | | | 11,579,225 | | |
| SPX Corp. | | | 189,000 | | | | 14,553,000 | | |
| Machinery Total | | | 35,554,985 | | |
| Professional Services – 0.6% | |
| Dun & Bradstreet Corp. | | | 82,600 | | | | 7,794,136 | | |
| Professional Services Total | | | 7,794,136 | | |
| Road & Rail – 1.6% | |
| Union Pacific Corp. | | | 310,900 | | | | 22,123,644 | | |
| Road & Rail Total | | | 22,123,644 | | |
| Trading Companies & Distributors – 0.8% | |
| W.W. Grainger, Inc. | | | 132,500 | | | | 11,523,525 | | |
| Trading Companies & Distributors Total | | | 11,523,525 | | |
| Industrials Total | | | 173,746,319 | | |
| Information Technology – 29.9% | |
| Communications Equipment – 5.5% | |
| Cisco Systems, Inc. (a) | | | 1,389,223 | | | | 31,340,871 | | |
| Corning, Inc. | | | 444,200 | | | | 6,947,288 | | |
| QUALCOMM, Inc. | | | 898,500 | | | | 38,608,545 | | |
| Communications Equipment Total | | | 76,896,704 | | |
| Computers & Peripherals – 6.8% | |
| Apple, Inc. (a) | | | 197,017 | | | | 22,392,952 | | |
| EMC Corp. (a) | | | 990,700 | | | | 11,848,772 | | |
| Hewlett-Packard Co. | | | 622,649 | | | | 28,791,290 | | |
International Business
Machines Corp. | | | 281,000 | | | | 32,865,760 | | |
| Computers & Peripherals Total | | | 95,898,774 | | |
| Electronic Equipment, Instruments & Components – 0.6% | |
| FLIR Systems, Inc. (a) | | | 213,400 | | | | 8,198,828 | | |
Electronic Equipment, Instruments &
Components Total | | | 8,198,828 | | |
See Accompanying Notes to Financial Statements.
48
Columbia Large Cap Growth Fund
September 30, 2008
| Common Stocks (continued) | |
| | | Shares | | Value ($) | |
| Internet Software & Services – 2.5% | |
| Equinix, Inc. (a) | | | 125,800 | | | | 8,738,068 | | |
| Google, Inc., Class A (a) | | | 67,266 | | | | 26,941,378 | | |
| Internet Software & Services Total | | | 35,679,446 | | |
| IT Services – 2.3% | |
| Accenture Ltd., Class A | | | 343,600 | | | | 13,056,800 | | |
| MasterCard, Inc., Class A | | | 40,800 | | | | 7,235,064 | | |
| Visa, Inc., Class A | | | 192,700 | | | | 11,829,853 | | |
| IT Services Total | | | 32,121,717 | | |
| Semiconductors & Semiconductor Equipment – 3.5% | |
| Broadcom Corp., Class A (a) | | | 429,900 | | | | 8,009,037 | | |
| Intel Corp. | | | 1,186,344 | | | | 22,220,223 | | |
| Lam Research Corp. (a) | | | 335,600 | | | | 10,568,044 | | |
| Microchip Technology, Inc. | | | 269,300 | | | | 7,925,499 | | |
Semiconductors & Semiconductor
Equipment Total | | | 48,722,803 | | |
| Software – 8.7% | |
| Activision Blizzard, Inc. (a) | | | 1,061,000 | | | | 16,371,230 | | |
| Adobe Systems, Inc. (a) | | | 383,800 | | | | 15,148,586 | | |
| BMC Software, Inc. (a) | | | 325,200 | | | | 9,310,476 | | |
| Microsoft Corp. | | | 1,667,298 | | | | 44,500,184 | | |
| Oracle Corp. (a) | | | 1,472,836 | | | | 29,913,299 | | |
| Salesforce.com, Inc. (a) | | | 127,600 | | | | 6,175,840 | | |
| Software Total | | | 121,419,615 | | |
| Information Technology Total | | | 418,937,887 | | |
| Materials – 2.6% | |
| Chemicals – 1.7% | |
| Monsanto Co. | | | 133,947 | | | | 13,258,074 | | |
| Praxair, Inc. | | | 145,700 | | | | 10,452,518 | | |
| Chemicals Total | | | 23,710,592 | | |
| Metals & Mining – 0.9% | |
Freeport-McMoRan Copper &
Gold, Inc. | | | 167,800 | | | | 9,539,430 | | |
| Goldcorp, Inc. | | | 122,100 | | | | 3,862,023 | | |
| Metals & Mining Total | | | 13,401,453 | | |
| Materials Total | | | 37,112,045 | | |
| Telecommunication Services – 0.9% | |
| Wireless Telecommunication Services – 0.9% | |
| NII Holdings, Inc. (a) | | | 327,500 | | | | 12,418,800 | | |
Wireless Telecommunication
Services Total | | | 12,418,800 | | |
| Telecommunication Services Total | | | 12,418,800 | | |
| | | Shares | | Value ($) | |
| Utilities – 1.1% | |
| Electric Utilities – 1.1% | |
| Entergy Corp. | | | 167,500 | | | | 14,909,175 | | |
| Electric Utilities Total | | | 14,909,175 | | |
| Utilities Total | | | 14,909,175 | | |
Total Common Stocks
(cost of $1,412,009,397) | | | 1,367,350,279 | | |
| Short-Term Obligation – 1.9% | |
| | | Par ($) | | | |
Repurchase agreement with
Fixed Income Clearing Corp.,
dated 09/30/08, due 10/01/08,
at 0.200%, collateralized by a
U.S. Treasury Obligation
maturing 02/29/12,
market value $26,928,531
(repurchase proceeds
$26,397,147) | | | 26,397,000 | | | | 26,397,000 | | |
Total Short-Term Obligation
(cost of $26,397,000) | | | 26,397,000 | | |
Total Investments – 99.5%
(cost of $1,438,406,397) (b) | | | 1,393,747,279 | | |
| Other Assets & Liabilities, Net – 0.5% | | | 6,466,233 | | |
| Net Assets – 100.0% | | | 1,400,213,512 | | |
Notes to Investment Portfolio:
(a) Non-income producing security.
(b) Cost for federal income tax purposes is $1,445,795,444.
At September 30, 2008, the Fund held investments in the following sectors:
| Sector (Unaudited) | | % of
Net Assets | |
| Information Technology | | | 29.9 | | |
| Health Care | | | 15.2 | | |
| Consumer Staples | | | 13.4 | | |
| Industrials | | | 12.4 | | |
| Energy | | | 9.4 | | |
| Consumer Discretionary | | | 9.1 | | |
| Financials | | | 3.6 | | |
| Materials | | | 2.6 | | |
| Utilities | | | 1.1 | | |
| Telecommunication Services | | | 0.9 | | |
| | | | 97.6 | | |
| Short-Term Obligation | | | 1.9 | | |
| Other Assets & Liabilities, Net | | | 0.5 | | |
| | | | 100.0 | | |
| Acronym | | Name | |
| ADR | | American Depositary Receipt | |
|
See Accompanying Notes to Financial Statements.
49
Investment Portfolio – Columbia Disciplined Value Fund
September 30, 2008
| Common Stocks – 98.1% | |
| | | Shares | | Value ($) | |
| Consumer Discretionary – 8.5% | |
| Hotels, Restaurants & Leisure – 1.0% | |
| McDonald's Corp. | | | 40,300 | | | | 2,486,510 | | |
| Wyndham Worldwide Corp. | | | 57,900 | | | | 909,609 | | |
| Hotels, Restaurants & Leisure Total | | | 3,396,119 | | |
| Household Durables – 2.6% | |
| Centex Corp. | | | 7,000 | | | | 113,400 | | |
| KB Home | | | 25,700 | | | | 505,776 | | |
| NVR, Inc. (a) | | | 14,100 | | | | 8,065,200 | | |
| Household Durables Total | | | 8,684,376 | | |
| Media – 1.4% | |
| CBS Corp., Class B | | | 72,100 | | | | 1,051,218 | | |
| EW Scripps Co., Class A | | | 272,800 | | | | 1,928,696 | | |
| Time Warner, Inc. | | | 68,800 | | | | 901,968 | | |
| Walt Disney Co. | | | 20,500 | | | | 629,145 | | |
| Media Total | | | 4,511,027 | | |
| Multiline Retail – 1.5% | |
| Macy's, Inc. | | | 284,400 | | | | 5,113,512 | | |
| Multiline Retail Total | | | 5,113,512 | | |
| Specialty Retail – 2.0% | |
| American Eagle Outfitters, Inc. | | | 95,400 | | | | 1,454,850 | | |
| Barnes & Noble, Inc. | | | 19,100 | | | | 498,128 | | |
| Gap, Inc. | | | 262,300 | | | | 4,663,694 | | |
| Home Depot, Inc. | | | 1,300 | | | | 33,657 | | |
| Specialty Retail Total | | | 6,650,329 | | |
| Consumer Discretionary Total | | | 28,355,363 | | |
| Consumer Staples – 8.7% | |
| Beverages – 0.1% | |
| Coca-Cola Co. | | | 3,800 | | | | 200,944 | | |
| Beverages Total | | | 200,944 | | |
| Food & Staples Retailing – 0.5% | |
| CVS Caremark Corp. | | | 34,000 | | | | 1,144,440 | | |
| SUPERVALU, Inc. | | | 25,100 | | | | 544,670 | | |
| Food & Staples Retailing Total | | | 1,689,110 | | |
| Household Products – 3.3% | |
| Procter & Gamble Co. | | | 159,000 | | | | 11,080,710 | | |
| Household Products Total | | | 11,080,710 | | |
| Tobacco – 4.8% | |
| Altria Group, Inc. | | | 450,700 | | | | 8,941,888 | | |
| Reynolds American, Inc. | | | 149,900 | | | | 7,288,138 | | |
| Tobacco Total | | | 16,230,026 | | |
| Consumer Staples Total | | | 29,200,790 | | |
| | | Shares | | Value ($) | |
| Energy – 15.4% | |
| Oil, Gas & Consumable Fuels – 15.4% | |
| Apache Corp. | | | 7,500 | | | | 782,100 | | |
| Chevron Corp. | | | 153,600 | | | | 12,668,928 | | |
| ConocoPhillips | | | 121,300 | | | | 8,885,225 | | |
| Exxon Mobil Corp. (b) | | | 338,800 | | | | 26,311,208 | | |
| Marathon Oil Corp. | | | 4,400 | | | | 175,428 | | |
| Valero Energy Corp. | | | 90,200 | | | | 2,733,060 | | |
| Oil, Gas & Consumable Fuels Total | | | 51,555,949 | | |
| Energy Total | | | 51,555,949 | | |
| Financials – 27.5% | |
| Capital Markets – 3.4% | |
| Bank of New York Mellon Corp. | | | 12,700 | | | | 413,766 | | |
| BlackRock, Inc., Class A | | | 7,800 | | | | 1,517,100 | | |
| Goldman Sachs Group, Inc. | | | 48,000 | | | | 6,144,000 | | |
| Morgan Stanley | | | 142,600 | | | | 3,279,800 | | |
| Capital Markets Total | | | 11,354,666 | | |
| Commercial Banks – 6.5% | |
| BB&T Corp. | | | 12,400 | | | | 468,720 | | |
| PNC Financial Services Group, Inc. | | | 22,300 | | | | 1,665,810 | | |
| U.S. Bancorp | | | 116,600 | | | | 4,199,932 | | |
| Wachovia Corp. | | | 32,500 | | | | 113,750 | | |
| Wells Fargo & Co. | | | 409,400 | | | | 15,364,782 | | |
| Commercial Banks Total | | | 21,812,994 | | |
| Consumer Finance – 1.7% | |
| AmeriCredit Corp. (a) | | | 68,800 | | | | 696,944 | | |
| Capital One Financial Corp. | | | 96,500 | | | | 4,921,500 | | |
| Consumer Finance Total | | | 5,618,444 | | |
| Diversified Financial Services – 4.5% | |
| JPMorgan Chase & Co. | | | 321,600 | | | | 15,018,720 | | |
| Diversified Financial Services Total | | | 15,018,720 | | |
| Insurance – 8.0% | |
Allied World Assurance
Holdings Ltd. | | | 7,000 | | | | 248,640 | | |
| American International Group, Inc. | | | 55,400 | | | | 184,482 | | |
| Assurant, Inc. | | | 97,100 | | | | 5,340,500 | | |
| Axis Capital Holdings Ltd. | | | 22,700 | | | | 719,817 | | |
| Endurance Specialty Holdings Ltd. | | | 24,800 | | | | 766,816 | | |
| Loews Corp. | | | 68,300 | | | | 2,697,167 | | |
| MetLife, Inc. | | | 800 | | | | 44,800 | | |
| Prudential Financial, Inc. | | | 68,800 | | | | 4,953,600 | | |
| Reinsurance Group of America, Inc. | | | 16,300 | | | | 880,200 | | |
| RenaissanceRe Holdings Ltd. | | | 31,600 | | | | 1,643,200 | | |
| Travelers Companies, Inc. | | | 208,300 | | | | 9,415,160 | | |
| Insurance Total | | | 26,894,382 | | |
See Accompanying Notes to Financial Statements.
50
Columbia Disciplined Value Fund
September 30, 2008
| Common Stocks (continued) | |
| | | Shares | | Value ($) | |
| Real Estate Investment Trusts (REITs) – 3.4% | |
| Annaly Capital Management, Inc. | | | 566,000 | | | | 7,612,700 | | |
| Equity Residential Property Trust | | | 32,400 | | | | 1,438,884 | | |
| iStar Financial, Inc. | | | 28,700 | | | | 74,620 | | |
| ProLogis | | | 39,200 | | | | 1,617,784 | | |
| Public Storage | | | 6,100 | | | | 603,961 | | |
| Real Estate Investment Trusts (REITs) Total | | | 11,347,949 | | |
| Thrifts & Mortgage Finance – 0.0% | |
| Tree.com, Inc. (a) | | | 1,099 | | | | 5,297 | | |
| Thrifts & Mortgage Finance Total | | | 5,297 | | |
| Financials Total | | | 92,052,452 | | |
| Health Care – 11.6% | |
| Biotechnology – 3.9% | |
| Amgen, Inc. (a) | | | 218,700 | | | | 12,962,349 | | |
| Biotechnology Total | | | 12,962,349 | | |
| Health Care Providers & Services – 0.2% | |
| WellPoint, Inc. (a) | | | 14,400 | | | | 673,488 | | |
| Health Care Providers & Services Total | | | 673,488 | | |
| Life Sciences Tools & Services – 0.5% | |
| Thermo Fisher Scientific, Inc. (a) | | | 31,100 | | | | 1,710,500 | | |
| Life Sciences Tools & Services Total | | | 1,710,500 | | |
| Pharmaceuticals – 7.0% | |
| Eli Lilly & Co. | | | 23,700 | | | | 1,043,511 | | |
| Johnson & Johnson | | | 22,300 | | | | 1,544,944 | | |
| King Pharmaceuticals, Inc. (a) | | | 676,400 | | | | 6,479,912 | | |
| Merck & Co., Inc. | | | 40,200 | | | | 1,268,712 | | |
| Pfizer, Inc. | | | 712,200 | | | | 13,132,968 | | |
| Pharmaceuticals Total | | | 23,470,047 | | |
| Health Care Total | | | 38,816,384 | | |
| Industrials – 9.2% | |
| Aerospace & Defense – 2.4% | |
| Northrop Grumman Corp. | | | 111,400 | | | | 6,744,156 | | |
| Raytheon Co. | | | 25,600 | | | | 1,369,856 | | |
| Aerospace & Defense Total | | | 8,114,012 | | |
| Commercial & Professional Services – 0.5% | |
| R.R. Donnelley & Sons Co. | | | 66,300 | | | | 1,626,339 | | |
| Commercial & Professional Services Total | | | 1,626,339 | | |
| Industrial Conglomerates – 3.5% | |
| General Electric Co. | | | 267,200 | | | | 6,813,600 | | |
| Tyco International Ltd. | | | 139,200 | | | | 4,874,784 | | |
| Industrial Conglomerates Total | | | 11,688,384 | | |
| | | Shares | | Value ($) | |
| Machinery – 1.1% | |
| AGCO Corp. (a) | | | 34,200 | | | | 1,457,262 | | |
| Oshkosh Corp. | | | 172,000 | | | | 2,263,520 | | |
| Machinery Total | | | 3,720,782 | | |
| Road & Rail – 1.7% | |
| Hertz Global Holdings, Inc. (a) | | | 124,400 | | | | 941,708 | | |
| Ryder System, Inc. | | | 78,600 | | | | 4,873,200 | | |
| Road & Rail Total | | | 5,814,908 | | |
| Industrials Total | | | 30,964,425 | | |
| Information Technology – 3.0% | |
| Computers & Peripherals – 1.8% | |
| Seagate Technology | | | 513,800 | | | | 6,227,256 | | |
| Computers & Peripherals Total | | | 6,227,256 | | |
| Semiconductors & Semiconductor Equipment – 0.5% | |
| Intel Corp. | | | 83,700 | | | | 1,567,701 | | |
Semiconductors & Semiconductor
Equipment Total | | | 1,567,701 | | |
| Software – 0.7% | |
| Symantec Corp. (a) | | | 116,100 | | | | 2,273,238 | | |
| Software Total | | | 2,273,238 | | |
| Information Technology Total | | | 10,068,195 | | |
| Materials – 3.6% | |
| Chemicals – 0.3% | |
| Dow Chemical Co. | | | 29,200 | | | | 927,976 | | |
| Chemicals Total | | | 927,976 | | |
| Containers & Packaging – 0.4% | |
| Owens-Illinois, Inc. (a) | | | 48,200 | | | | 1,417,080 | | |
| Containers & Packaging Total | | | 1,417,080 | | |
| Metals & Mining – 2.9% | |
Freeport-McMoRan Copper &
Gold, Inc. | | | 61,600 | | | | 3,501,960 | | |
| Nucor Corp. | | | 58,200 | | | | 2,298,900 | | |
| Reliance Steel & Aluminum Co. | | | 45,000 | | | | 1,708,650 | | |
| United States Steel Corp. | | | 26,200 | | | | 2,033,382 | | |
| Metals & Mining Total | | | 9,542,892 | | |
| Materials Total | | | 11,887,948 | | |
| Telecommunication Services – 4.9% | |
| Diversified Telecommunication Services – 4.7% | |
| AT&T, Inc. | | | 346,800 | | | | 9,682,656 | | |
| Embarq Corp. | | | 26,100 | | | | 1,058,355 | | |
See Accompanying Notes to Financial Statements.
51
Columbia Disciplined Value Fund
September 30, 2008
| Common Stocks (continued) | |
| | | Shares | | Value ($) | |
Qwest Communications
International, Inc. | | | 1,110,600 | | | | 3,587,238 | | |
| Verizon Communications, Inc. | | | 41,900 | | | | 1,344,571 | | |
| Diversified Telecommunication Services Total | | | 15,672,820 | | |
| Wireless Telecommunication Services – 0.2% | |
| Telephone & Data Systems, Inc. | | | 19,000 | | | | 679,250 | | |
| Wireless Telecommunication Services Total | | | 679,250 | | |
| Telecommunication Services Total | | | 16,352,070 | | |
| Utilities – 5.7% | |
| Electric Utilities – 3.6% | |
| Duke Energy Corp. | | | 53,000 | | | | 923,790 | | |
| Edison International | | | 96,300 | | | | 3,842,370 | | |
| FirstEnergy Corp. | | | 104,100 | | | | 6,973,659 | | |
| Pepco Holdings, Inc. | | | 9,400 | | | | 215,354 | | |
| Electric Utilities Total | | | 11,955,173 | | |
| Gas Utilities – 2.0% | |
| Energen Corp. | | | 125,100 | | | | 5,664,528 | | |
| ONEOK, Inc. | | | 30,700 | | | | 1,056,080 | | |
| Gas Utilities Total | | | 6,720,608 | | |
| Independent Power Producers & Energy Traders – 0.1% | |
| Reliant Energy, Inc. (a) | | | 57,100 | | | | 419,685 | | |
Independent Power Producers &
Energy Traders Total | | | 419,685 | | |
| Utilities Total | | | 19,095,466 | | |
Total Common Stocks
(cost of $349,915,127) | | | 328,349,042 | | |
| Short-Term Obligation – 1.3% | |
| | | Par ($) | | | |
Repurchase agreement with
Fixed Income Clearing Corp.,
dated 09/30/08, due 10/01/08
at 0.200%, collateralized by a
U.S. Treasury Obligation
maturing 02/29/12,
market value $4,465,563
(repurchase proceeds
$4,378,024) | | | 4,378,000 | | | | 4,378,000 | | |
Total Short-Term Obligation
(cost of $4,378,000) | | | 4,378,000 | | |
| | | Value ($) | |
Total Investments – 99.4%
(cost of $354,293,127) (c) | | | 332,727,042 | | |
| Other Assets & Liabilities, Net – 0.6% | | | 2,065,332 | | |
| Net Assets – 100.0% | | | 334,792,374 | | |
Notes to Investment Portfolio:
(a) Non-income producing security.
(b) A portion of this security with a market value of $1,960,915 is pledged as collateral for open futures contracts.
(c) Cost for federal income tax purposes is $354,777,994.
At September 30, 2008, the Fund held investments in the following sectors:
| Sector (Unaudited) | | % of
Net Assets | |
| Financials | | | 27.5 | | |
| Energy | | | 15.4 | | |
| Health Care | | | 11.6 | | |
| Industrials | | | 9.2 | | |
| Consumer Staples | | | 8.7 | | |
| Consumer Discretionary | | | 8.5 | | |
| Utilities | | | 5.7 | | |
| Telecommunication Services | | | 4.9 | | |
| Materials | | | 3.6 | | |
| Information Technology | | | 3.0 | | |
| | | | 98.1 | | |
| Short-Term Obligation | | | 1.3 | | |
| Other Assets & Liabilities, Net | | | 0.6 | | |
| | | | 100.0 | | |
At September 30, 2008, the Fund held the following open long futures contract:
| Type | | Number of
Contracts | | Value | | Aggregate
Face Value | | Expiration
Date | | Unrealized
Depreciation | |
S&P
500
Index | | | 24 | | | $ | 7,004,400 | | | $ | 7,433,739 | | | Dec-2008 | | $ | (429,339 | ) | |
See Accompanying Notes to Financial Statements.
52
Investment Portfolio – Columbia Contrarian Core Fund
September 30, 2008
| Common Stocks – 99.6% | |
| | | Shares | | Value ($) | |
| Consumer Discretionary – 8.9% | |
| Hotels, Restaurants & Leisure – 0.4% | |
| Penn National Gaming, Inc. (a) | | | 49,100 | | | | 1,304,587 | | |
| Hotels, Restaurants & Leisure Total | | | 1,304,587 | | |
| Media – 4.3% | |
| Focus Media Holding Ltd., ADR (a) | | | 78,100 | | | | 2,226,631 | | |
| McGraw-Hill Companies, Inc. | | | 136,600 | | | | 4,317,926 | | |
| News Corp., Class A | | | 306,600 | | | | 3,676,134 | | |
| Viacom, Inc., Class B (a) | | | 142,400 | | | | 3,537,216 | | |
| Media Total | | | 13,757,907 | | |
| Multiline Retail – 0.6% | |
| Target Corp. | | | 38,900 | | | | 1,908,045 | | |
| Multiline Retail Total | | | 1,908,045 | | |
| Specialty Retail – 0.6% | |
| J Crew Group, Inc. (a) | | | 70,000 | | | | 1,999,900 | | |
| Specialty Retail Total | | | 1,999,900 | | |
| Textiles, Apparel & Luxury Goods – 3.0% | |
| NIKE, Inc., Class B | | | 103,000 | | | | 6,890,700 | | |
| Polo Ralph Lauren Corp. | | | 43,300 | | | | 2,885,512 | | |
| Textiles, Apparel & Luxury Goods Total | | | 9,776,212 | | |
| Consumer Discretionary Total | | | 28,746,651 | | |
| Consumer Staples – 9.6% | |
| Beverages – 2.6% | |
| Diageo PLC, ADR | | | 25,100 | | | | 1,728,386 | | |
| PepsiCo, Inc. | | | 93,100 | | | | 6,635,237 | | |
| Beverages Total | | | 8,363,623 | | |
| Food & Staples Retailing – 1.2% | |
| Kroger Co. | | | 146,750 | | | | 4,032,690 | | |
| Food & Staples Retailing Total | | | 4,032,690 | | |
| Household Products – 0.6% | |
| Colgate-Palmolive Co. | | | 24,520 | | | | 1,847,582 | | |
| Household Products Total | | | 1,847,582 | | |
| Personal Products – 2.2% | |
| Avon Products, Inc. | | | 93,300 | | | | 3,878,481 | | |
| Herbalife Ltd. | | | 83,800 | | | | 3,311,776 | | |
| Personal Products Total | | | 7,190,257 | | |
| Tobacco – 3.0% | |
| Philip Morris International, Inc. | | | 198,400 | | | | 9,543,040 | | |
| Tobacco Total | | | 9,543,040 | | |
| Consumer Staples Total | | | 30,977,192 | | |
| | | Shares | | Value ($) | |
| Energy – 13.4% | |
| Energy Equipment & Services – 4.1% | |
| Halliburton Co. | | | 129,000 | | | | 4,178,310 | | |
| Oceaneering International, Inc. (a) | | | 40,400 | | | | 2,154,128 | | |
| Transocean, Inc. (a) | | | 39,200 | | | | 4,305,728 | | |
| Weatherford International Ltd. (a) | | | 97,400 | | | | 2,448,636 | | |
| Energy Equipment & Services Total | | | 13,086,802 | | |
| Oil, Gas & Consumable Fuels – 9.3% | |
| Anadarko Petroleum Corp. | | | 67,900 | | | | 3,293,829 | | |
| Apache Corp. | | | 61,600 | | | | 6,423,648 | | |
| ConocoPhillips | | | 136,300 | | | | 9,983,975 | | |
| Devon Energy Corp. | | | 69,910 | | | | 6,375,792 | | |
| Exxon Mobil Corp. | | | 49,400 | | | | 3,836,404 | | |
| Oil, Gas & Consumable Fuels Total | | | 29,913,648 | | |
| Energy Total | | | 43,000,450 | | |
| Financials – 16.6% | |
| Capital Markets – 5.8% | |
| Bank of New York Mellon Corp. | | | 139,600 | | | | 4,548,168 | | |
| Goldman Sachs Group, Inc. | | | 47,400 | | | | 6,067,200 | | |
| Invesco Ltd. | | | 170,000 | | | | 3,566,600 | | |
| Morgan Stanley | | | 61,900 | | | | 1,423,700 | | |
| State Street Corp. | | | 55,200 | | | | 3,139,776 | | |
| Capital Markets Total | | | 18,745,444 | | |
| Commercial Banks – 2.1% | |
| BB&T Corp. | | | 115,200 | | | | 4,354,560 | | |
| TCF Financial Corp. | | | 135,814 | | | | 2,444,652 | | |
| Commercial Banks Total | | | 6,799,212 | | |
| Consumer Finance – 0.4% | |
| American Express Co. | | | 36,840 | | | | 1,305,241 | | |
| Consumer Finance Total | | | 1,305,241 | | |
| Diversified Financial Services – 3.7% | |
| Citigroup, Inc. | | | 54,489 | | | | 1,117,569 | | |
| JPMorgan Chase & Co. | | | 230,572 | | | | 10,767,713 | | |
| Diversified Financial Services Total | | | 11,885,282 | | |
| Insurance – 4.6% | |
| ACE Ltd. | | | 75,000 | | | | 4,059,750 | | |
Berkshire Hathaway, Inc.,
Class B (a) | | | 1,289 | | | | 5,665,155 | | |
| Unum Group | | | 205,790 | | | | 5,165,329 | | |
| Insurance Total | | | 14,890,234 | | |
| Financials Total | | | 53,625,413 | | |
See Accompanying Notes to Financial Statements.
53
Columbia Contrarian Core Fund
September 30, 2008
| Common Stocks (continued) | |
| | | Shares | | Value ($) | |
| Health Care – 16.1% | |
| Biotechnology – 1.4% | |
| Amgen, Inc. (a) | | | 77,100 | | | | 4,569,717 | | |
| Biotechnology Total | | | 4,569,717 | | |
| Health Care Equipment & Supplies – 4.1% | |
| Baxter International, Inc. | | | 78,200 | | | | 5,132,266 | | |
| Covidien Ltd. | | | 87,225 | | | | 4,689,216 | | |
| Zimmer Holdings, Inc. (a) | | | 54,200 | | | | 3,499,152 | | |
| Health Care Equipment & Supplies Total | | | 13,320,634 | | |
| Health Care Providers & Services – 2.9% | |
| Aetna, Inc. | | | 86,100 | | | | 3,109,071 | | |
| McKesson Corp. | | | 118,210 | | | | 6,360,880 | | |
| Health Care Providers & Services Total | | | 9,469,951 | | |
| Life Sciences Tools & Services – 1.5% | |
| Thermo Fisher Scientific, Inc. (a) | | | 85,850 | | | | 4,721,750 | | |
| Life Sciences Tools & Services Total | | | 4,721,750 | | |
| Pharmaceuticals – 6.2% | |
| Abbott Laboratories | | | 172,987 | | | | 9,960,592 | | |
| Johnson & Johnson | | | 104,090 | | | | 7,211,355 | | |
| Schering-Plough Corp. | | | 144,400 | | | | 2,667,068 | | |
| Pharmaceuticals Total | | | 19,839,015 | | |
| Health Care Total | | | 51,921,067 | | |
| Industrials – 11.6% | |
| Aerospace & Defense – 3.4% | |
| Honeywell International, Inc. | | | 107,150 | | | | 4,452,083 | | |
| Northrop Grumman Corp. | | | 65,500 | | | | 3,965,370 | | |
| United Technologies Corp. | | | 40,400 | | | | 2,426,424 | | |
| Aerospace & Defense Total | | | 10,843,877 | | |
| Construction & Engineering – 0.5% | |
| Foster Wheeler Ltd. (a) | | | 45,500 | | | | 1,643,005 | | |
| Construction & Engineering Total | | | 1,643,005 | | |
| Industrial Conglomerates – 4.7% | |
| General Electric Co. | | | 317,340 | | | | 8,092,170 | | |
| Tyco International Ltd. | | | 203,225 | | | | 7,116,940 | | |
| Industrial Conglomerates Total | | | 15,209,110 | | |
| Machinery – 0.5% | |
| Eaton Corp. | | | 25,402 | | | | 1,427,084 | | |
| Machinery Total | | | 1,427,084 | | |
| Professional Services – 1.0% | |
| Dun & Bradstreet Corp. | | | 35,300 | | | | 3,330,908 | | |
| Professional Services Total | | | 3,330,908 | | |
| | | Shares | | Value ($) | |
| Road & Rail – 1.5% | |
| Union Pacific Corp. | | | 68,320 | | | | 4,861,651 | | |
| Road & Rail Total | | | 4,861,651 | | |
| Industrials Total | | | 37,315,635 | | |
| Information Technology – 15.6% | |
| Communications Equipment – 2.9% | |
| Nokia Oyj, ADR | | | 189,500 | | | | 3,534,175 | | |
| QUALCOMM, Inc. | | | 136,100 | | | | 5,848,217 | | |
| Communications Equipment Total | | | 9,382,392 | | |
| Computers & Peripherals – 5.0% | |
| Apple, Inc. (a) | | | 24,600 | | | | 2,796,036 | | |
| EMC Corp. (a) | | | 200,300 | | | | 2,395,588 | | |
| Hewlett-Packard Co. | | | 234,600 | | | | 10,847,904 | | |
| Computers & Peripherals Total | | | 16,039,528 | | |
| Internet Software & Services – 2.9% | |
| Google, Inc., Class A (a) | | | 20,000 | | | | 8,010,400 | | |
| VeriSign, Inc. (a) | | | 50,700 | | | | 1,322,256 | | |
| Internet Software & Services Total | | | 9,332,656 | | |
| Software – 4.8% | |
| Microsoft Corp. | | | 513,820 | | | | 13,713,856 | | |
| Oracle Corp. (a) | | | 90,040 | | | | 1,828,712 | | |
| Software Total | | | 15,542,568 | | |
| Information Technology Total | | | 50,297,144 | | |
| Materials – 2.5% | |
| Chemicals – 0.6% | |
| Intrepid Potash, Inc. (a) | | | 66,600 | | | | 2,007,324 | | |
| Chemicals Total | | | 2,007,324 | | |
| Containers & Packaging – 0.9% | |
| Owens-Illinois, Inc. (a) | | | 100,200 | | | | 2,945,880 | | |
| Containers & Packaging Total | | | 2,945,880 | | |
| Metals & Mining – 1.0% | |
| Alcoa, Inc. | | | 55,500 | | | | 1,253,190 | | |
Freeport-McMoRan Copper &
Gold, Inc. | | | 33,900 | | | | 1,927,215 | | |
| Metals & Mining Total | | | 3,180,405 | | |
| Materials Total | | | 8,133,609 | | |
See Accompanying Notes to Financial Statements.
54
Columbia Contrarian Core Fund
September 30, 2008
| Common Stocks (continued) | |
| | | Shares | | Value ($) | |
| Telecommunication Services – 3.6% | |
| Diversified Telecommunication Services – 3.6% | |
| AT&T, Inc. | | | 229,500 | | | | 6,407,640 | | |
| Verizon Communications, Inc. | | | 159,900 | | | | 5,131,191 | | |
| Diversified Telecommunication Services Total | | | 11,538,831 | | |
| Telecommunication Services Total | | | 11,538,831 | | |
| Utilities – 1.7% | |
| Electric Utilities – 1.7% | |
| Entergy Corp. | | | 18,700 | | | | 1,664,487 | | |
| FPL Group, Inc. | | | 74,900 | | | | 3,767,470 | | |
| Electric Utilities Total | | | 5,431,957 | | |
| Utilities Total | | | 5,431,957 | | |
Total Common Stocks
(cost of $296,493,796) | | | 320,987,949 | | |
| Short-Term Obligation – 0.6% | |
| | | Par ($) | | | |
Repurchase agreement with
Fixed Income Clearing Corp.,
dated 09/30/08, due 10/01/08
at 0.200%, collateralized by a
U.S. Treasury Obligation
maturing 02/29/12,
market value $1,940,844
(repurchase proceeds $1,898,011) | | | 1,898,000 | | | | 1,898,000 | | |
Total Short-Term Obligation
(cost of $1,898,000) | | | 1,898,000 | | |
Total Investments – 100.2%
(cost of $298,391,796) (b) | | | 322,885,949 | | |
| Other Assets & Liabilities, Net – (0.2)% | | | (601,945 | ) | |
| Net Assets – 100.0% | | | 322,284,004 | | |
Notes to Investment Portfolio:
(a) Non-income producing security.
(b) Cost for federal income tax purposes is $299,198,808.
At September 30, 2008, the Fund held investments in the following sectors:
| Sector (Unaudited) | | % of
Net Assets | |
| Financials | | | 16.6 | | |
| Health Care | | | 16.1 | | |
| Information Technology | | | 15.6 | | |
| Energy | | | 13.4 | | |
| Industrials | | | 11.6 | | |
| Consumer Staples | | | 9.6 | | |
| Consumer Discretionary | | | 8.9 | | |
| Telecommunication Services | | | 3.6 | | |
| Materials | | | 2.5 | | |
| Utilities | | | 1.7 | | |
| | | | 99.6 | | |
| Short-Term Obligation | | | 0.6 | | |
| Other Assets & Liabilities, Net | | | (0.2 | ) | |
| | | | 100.0 | | |
| Acronym | | Name | |
| ADR | | American Depositary Receipt | |
|
See Accompanying Notes to Financial Statements.
55
Investment Portfolio – Columbia Small Cap Core Fund
September 30, 2008
| Common Stocks – 93.2% | |
| | | Shares | | Value ($) | |
| Consumer Discretionary – 12.1% | |
| Auto Components – 1.3% | |
| ArvinMeritor, Inc. | | | 144,798 | | | | 1,888,166 | | |
| Cooper Tire & Rubber Co. | | | 213,096 | | | | 1,832,626 | | |
| Dorman Products, Inc. (a) | | | 354,930 | | | | 4,447,273 | | |
| Hawk Corp., Class A (a) | | | 26,596 | | | | 535,377 | | |
| Auto Components Total | | | 8,703,442 | | |
| Diversified Consumer Services – 1.3% | |
Nobel Learning
Communities, Inc. (a) | | | 165,966 | | | | 2,638,860 | | |
| Regis Corp. | | | 233,720 | | | | 6,427,300 | | |
| Diversified Consumer Services Total | | | 9,066,160 | | |
| Hotels, Restaurants & Leisure – 1.7% | |
| CEC Entertainment, Inc. (a) | | | 183,507 | | | | 6,092,432 | | |
| Morgans Hotel Group Co. (a) | | | 204,831 | | | | 2,234,706 | | |
| O'Charleys, Inc. | | | 345,362 | | | | 3,021,918 | | |
| Hotels, Restaurants & Leisure Total | | | 11,349,056 | | |
| Household Durables – 0.3% | |
| Jarden Corp. (a) | | | 83,292 | | | | 1,953,197 | | |
| Household Durables Total | | | 1,953,197 | | |
| Internet & Catalog Retail – 0.1% | |
Valuevision Media, Inc.,
Class A (a) | | | 293,427 | | | | 542,840 | | |
| Internet & Catalog Retail Total | | | 542,840 | | |
| Leisure Equipment & Products – 1.5% | |
| Callaway Golf Co. | | | 153,447 | | | | 2,158,999 | | |
| RC2 Corp. (a) | | | 195,947 | | | | 3,918,940 | | |
Steinway Musical
Instruments, Inc. (a) | | | 147,764 | | | | 4,184,677 | | |
| Leisure Equipment & Products Total | | | 10,262,616 | | |
| Media – 0.5% | |
| Scholastic Corp. | | | 103,586 | | | | 2,660,088 | | |
Sinclair Broadcast Group, Inc.,
Class A | | | 154,723 | | | | 779,804 | | |
| Media Total | | | 3,439,892 | | |
| Specialty Retail – 3.8% | |
| Buckle, Inc. | | | 49,221 | | | | 2,733,734 | | |
| Collective Brands, Inc. (a) | | | 324,407 | | | | 5,939,892 | | |
| Monro Muffler Brake, Inc. | | | 237,599 | | | | 5,479,033 | | |
| Penske Auto Group, Inc. | | | 102,500 | | | | 1,175,675 | | |
| Rent-A-Center, Inc. (a) | | | 276,682 | | | | 6,164,475 | | |
| Stage Stores, Inc. | | | 322,028 | | | | 4,398,903 | | |
| Specialty Retail Total | | | 25,891,712 | | |
| | | Shares | | Value ($) | |
| Textiles, Apparel & Luxury Goods – 1.6% | |
| Quiksilver, Inc. (a) | | | 189,605 | | | | 1,088,333 | | |
| Rocky Brands, Inc. (a) | | | 107,199 | | | | 356,972 | | |
| Unifirst Corp. (b) | | | 212,019 | | | | 9,135,899 | | |
| Textiles, Apparel & Luxury Goods Total | | | 10,581,204 | | |
| Consumer Discretionary Total | | | 81,790,119 | | |
| Consumer Staples – 1.9% | |
| Food & Staples Retailing – 1.0% | |
| Casey's General Stores, Inc. | | | 114,404 | | | | 3,451,569 | | |
| Pantry, Inc. (a) | | | 147,516 | | | | 3,125,864 | | |
| Food & Staples Retailing Total | | | 6,577,433 | | |
| Food Products – 0.6% | |
| Corn Products International, Inc. | | | 125,401 | | | | 4,047,944 | | |
| Food Products Total | | | 4,047,944 | | |
| Household Products – 0.3% | |
| Central Garden & Pet Co. (a) | | | 120,583 | | | | 709,028 | | |
Central Garden & Pet Co.,
Class A (a) | | | 241,166 | | | | 1,434,938 | | |
| Household Products Total | | | 2,143,966 | | |
| Personal Products – 0.0% | |
| Langer, Inc. (a) | | | 264,203 | | | | 237,783 | | |
| Personal Products Total | | | 237,783 | | |
| Consumer Staples Total | | | 13,007,126 | | |
| Energy – 3.7% | |
| Energy Equipment & Services – 2.8% | |
| Gulfmark Offshore, Inc. (a) | | | 114,691 | | | | 5,147,332 | | |
| Newpark Resources, Inc. (a) | | | 415,440 | | | | 3,032,712 | | |
| Oceaneering International, Inc. (a) | | | 36,570 | | | | 1,949,912 | | |
| Superior Well Services, Inc. (a) | | | 82,380 | | | | 2,085,038 | | |
| Tetra Technologies, Inc. (a) | | | 471,781 | | | | 6,534,167 | | |
| Energy Equipment & Services Total | | | 18,749,161 | | |
| Oil, Gas & Consumable Fuels – 0.9% | |
| EXCO Resources, Inc. (a) | | | 167,187 | | | | 2,728,492 | | |
| GeoMet, Inc. (a) | | | 113,417 | | | | 616,988 | | |
| Kodiak Oil & Gas Corp. (a) | | | 148,258 | | | | 222,387 | | |
| Petroquest Energy, Inc. (a) | | | 83,354 | | | | 1,279,484 | | |
| Quest Resource Corp. (a) | | | 216,756 | | | | 576,571 | | |
| Warren Resources, Inc. (a) | | | 73,552 | | | | 734,049 | | |
| Oil, Gas & Consumable Fuels Total | | | 6,157,971 | | |
| Energy Total | | | 24,907,132 | | |
See Accompanying Notes to Financial Statements.
56
Columbia Small Cap Core Fund
September 30, 2008
| Common Stocks (continued) | |
| | | Shares | | Value ($) | |
| Financials – 9.9% | |
| Capital Markets – 0.3% | |
Waddell & Reed Financial, Inc.,
Class A | | | 86,607 | | | | 2,143,523 | | |
| Capital Markets Total | | | 2,143,523 | | |
| Commercial Banks – 1.8% | |
Boston Private Financial
Holdings, Inc. | | | 46,950 | | | | 410,343 | | |
| Oriental Financial Group | | | 313,309 | | | | 5,595,699 | | |
| Taylor Capital Group, Inc. | | | 195,582 | | | | 2,345,028 | | |
| Webster Financial Corp. | | | 156,870 | | | | 3,960,967 | | |
| Commercial Banks Total | | | 12,312,037 | | |
| Consumer Finance – 0.2% | |
| QC Holdings, Inc. | | | 177,170 | | | | 1,211,843 | | |
| Consumer Finance Total | | | 1,211,843 | | |
| Insurance – 3.3% | |
Darwin Professional
Underwriters, Inc. (a) | | | 105,691 | | | | 3,288,047 | | |
Delphi Financial Group, Inc.,
Class A | | | 94,100 | | | | 2,638,564 | | |
| First Mercury Financial Corp. (a) | | | 206,217 | | | | 2,938,592 | | |
| Hilb Rogal & Hobbs Co. | | | 17,256 | | | | 806,545 | | |
| Horace Mann Educators Corp. | | | 208,017 | | | | 2,677,179 | | |
| National Interstate Corp. | | | 72,821 | | | | 1,749,889 | | |
| NYMAGIC, Inc. | | | 80,124 | | | | 2,023,131 | | |
| Phoenix Companies, Inc. | | | 127,255 | | | | 1,175,836 | | |
| RAM Holdings Ltd. (a) | | | 251,956 | | | | 423,286 | | |
| State Auto Financial Corp. | | | 143,254 | | | | 4,164,394 | | |
| Insurance Total | | | 21,885,463 | | |
| Real Estate Investment Trusts (REITs) – 2.5% | |
| Acadia Realty Trust | | | 145,004 | | | | 3,665,701 | | |
American Campus
Communities, Inc. | | | 97,932 | | | | 3,317,936 | | |
| DiamondRock Hospitality Co. | | | 258,924 | | | | 2,356,209 | | |
| DuPont Fabros Technology, Inc. | | | 139,800 | | | | 2,131,950 | | |
| First Potomac Realty Trust | | | 239,848 | | | | 4,122,987 | | |
| Gramercy Capital Corp. | | | 206,785 | | | | 535,573 | | |
| Sunstone Hotel Investors, Inc. | | | 74,293 | | | | 1,002,956 | | |
| Real Estate Investment Trusts (REITs) Total | | | 17,133,312 | | |
| Thrifts & Mortgage Finance – 1.8% | |
| Abington Bancorp, Inc. | | | 176,921 | | | | 1,790,440 | | |
| Dime Community Bancshares | | | 154,367 | | | | 2,349,466 | | |
| Encore Bancshares, Inc. (a) | | | 22,025 | | | | 396,450 | | |
| First Niagara Financial Group, Inc. | | | 119,759 | | | | 1,886,204 | | |
| Flagstar BanCorp, Inc. | | | 217,148 | | | | 647,101 | | |
| | | Shares | | Value ($) | |
| Jefferson Bancshares, Inc. | | | 219,422 | | | | 2,051,596 | | |
| NewAlliance Bancshares, Inc. | | | 196,389 | | | | 2,951,727 | | |
| Thrifts & Mortgage Finance Total | | | 12,072,984 | | |
| Financials Total | | | 66,759,162 | | |
| Health Care – 16.4% | |
| Biotechnology – 0.3% | |
| BioMarin Pharmaceuticals, Inc. (a) | | | 74,541 | | | | 1,974,591 | | |
| Biotechnology Total | | | 1,974,591 | | |
| Health Care Equipment & Supplies – 5.5% | |
| Analogic Corp. | | | 74,306 | | | | 3,697,467 | | |
| Cooper Companies, Inc. | | | 71,074 | | | | 2,470,532 | | |
| Datascope Corp. | | | 120,584 | | | | 6,225,752 | | |
| Greatbatch, Inc. (a) | | | 113,953 | | | | 2,796,407 | | |
| Invacare Corp. | | | 314,951 | | | | 7,602,917 | | |
| STAAR Surgical Co. (a) | | | 610,327 | | | | 2,740,368 | | |
| Symmetry Medical, Inc. (a) | | | 218,558 | | | | 4,056,436 | | |
| Thoratec Corp. (a) | | | 115,887 | | | | 3,042,034 | | |
| West Pharmaceutical Services, Inc. | | | 98,440 | | | | 4,805,841 | | |
| Health Care Equipment & Supplies Total | | | 37,437,754 | | |
| Health Care Providers & Services – 6.5% | |
| Air Methods Corp. (a) | | | 140,129 | | | | 3,967,052 | | |
| LifePoint Hospitals, Inc. (a) | | | 169,095 | | | | 5,434,713 | | |
| Magellan Health Services, Inc. (a) | | | 91,426 | | | | 3,753,952 | | |
| Owens & Minor, Inc. | | | 70,752 | | | | 3,431,472 | | |
| Providence Service Corp. (a) | | | 426,005 | | | | 4,174,849 | | |
| PSS World Medical, Inc. (a) | | | 143,202 | | | | 2,792,439 | | |
| Psychiatric Solutions, Inc. (a) | | | 101,145 | | | | 3,838,453 | | |
| Res-Care, Inc. (a) | | | 759,384 | | | | 13,775,226 | | |
| U.S. Physical Therapy, Inc. (a) | | | 138,507 | | | | 2,404,481 | | |
| Health Care Providers & Services Total | | | 43,572,637 | | |
| Health Care Technology – 0.0% | |
| Mediware Information Systems (a) | | | 11,614 | | | | 63,993 | | |
| Health Care Technology Total | | | 63,993 | | |
| Life Sciences Tools & Services – 1.1% | |
| Cambrex Corp. (a) | | | 435,103 | | | | 2,675,884 | | |
| Strategic Diagnostics, Inc. (a) | | | 476,278 | | | | 771,570 | | |
| Varian, Inc. (a) | | | 86,981 | | | | 3,731,485 | | |
| Life Sciences Tools & Services Total | | | 7,178,939 | | |
| Pharmaceuticals – 3.0% | |
| Acusphere, Inc. (a) | | | 366,691 | | | | 128,342 | | |
| Adolor Corp. (a) | | | 160,860 | | | | 554,967 | | |
| Hi-Tech Pharmacal Co., Inc. (a) | | | 211,765 | | | | 2,079,532 | | |
| KV Pharmaceutical Co., Class A (a) | | | 279,589 | | | | 6,349,466 | | |
| Noven Pharmaceuticals, Inc. (a) | | | 164,896 | | | | 1,925,985 | | |
See Accompanying Notes to Financial Statements.
57
Columbia Small Cap Core Fund
September 30, 2008
| Common Stocks (continued) | |
| | | Shares | | Value ($) | |
| Obagi Medical Products, Inc. (a) | | | 395,931 | | | | 3,951,391 | | |
Valeant Pharmaceuticals
International (a) | | | 273,310 | | | | 5,594,656 | | |
| Pharmaceuticals Total | | | 20,584,339 | | |
| Health Care Total | | | 110,812,253 | | |
| Industrials – 20.3% | |
| Aerospace & Defense – 2.9% | |
| AAR Corp. (a) | | | 336,794 | | | | 5,587,413 | | |
| Argon ST, Inc. (a) | | | 127,031 | | | | 2,983,958 | | |
| Ladish Co., Inc. (a) | | | 87,637 | | | | 1,774,649 | | |
| LMI Aerospace, Inc. (a) | | | 71,907 | | | | 1,446,050 | | |
| Moog, Inc., Class A (a) | | | 170,941 | | | | 7,329,950 | | |
| Aerospace & Defense Total | | | 19,122,020 | | |
| Air Freight & Logistics – 0.4% | |
| Pacer International, Inc. | | | 169,838 | | | | 2,797,232 | | |
| Air Freight & Logistics Total | | | 2,797,232 | | |
| Building Products – 1.7% | |
| Insteel Industries, Inc. | | | 57,424 | | | | 780,392 | | |
| NCI Building Systems, Inc. (a) | | | 334,819 | | | | 10,630,503 | | |
| Building Products Total | | | 11,410,895 | | |
| Commercial & Professional Services – 1.5% | |
| Clean Harbors, Inc. (a) | | | 44,560 | | | | 3,010,028 | | |
| Consolidated Graphics, Inc. (a) | | | 100,444 | | | | 3,046,466 | | |
| McGrath Rentcorp | | | 145,268 | | | | 4,186,624 | | |
| Commercial & Professional Services Total | | | 10,243,118 | | |
| Construction & Engineering – 2.8% | |
| EMCOR Group, Inc. (a) | | | 305,968 | | | | 8,053,078 | | |
| MasTec, Inc. (a) | | | 309,117 | | | | 4,108,165 | | |
| Northwest Pipe Co. (a) | | | 114,681 | | | | 5,002,385 | | |
| Sterling Construction Co., Inc. (a) | | | 107,162 | | | | 1,736,024 | | |
| Construction & Engineering Total | | | 18,899,652 | | |
| Electrical Equipment – 2.9% | |
| AZZ, Inc. (a) | | | 58,832 | | | | 2,433,880 | | |
| Baldor Electric Co. | | | 146,554 | | | | 4,222,221 | | |
| BTU International, Inc. (a) | | | 268,842 | | | | 2,365,809 | | |
| GrafTech International Ltd. (a) | | | 309,746 | | | | 4,680,262 | | |
| LSI Industries, Inc. | | | 435,588 | | | | 3,602,313 | | |
| Powell Industries, Inc. (a) | | | 59,041 | | | | 2,409,463 | | |
| Electrical Equipment Total | | | 19,713,948 | | |
| Machinery – 2.8% | |
Albany International Corp.,
Class A | | | 162,464 | | | | 4,440,141 | | |
| Flanders Corp. (a) | | | 476,926 | | | | 3,004,634 | | |
| Key Technology, Inc. (a)(b) | | | 150,933 | | | | 3,577,112 | | |
| | | Shares | | Value ($) | |
| Miller Industries, Inc. (a) | | | 150,482 | | | | 1,115,072 | | |
| Nordson Corp. | | | 41,764 | | | | 2,051,030 | | |
| Oshkosh Corp. | | | 77,712 | | | | 1,022,690 | | |
| Tennant Co. | | | 113,192 | | | | 3,877,958 | | |
| Machinery Total | | | 19,088,637 | | |
| Professional Services – 2.9% | |
| FTI Consulting, Inc. (a) | | | 61,362 | | | | 4,432,791 | | |
| Kforce, Inc. (a) | | | 763,037 | | | | 7,790,608 | | |
| MPS Group, Inc. (a) | | | 284,082 | | | | 2,863,547 | | |
| Navigant Consulting, Inc. (a) | | | 110,678 | | | | 2,201,385 | | |
| Spherion Corp. (a) | | | 427,145 | | | | 2,080,196 | | |
| Professional Services Total | | | 19,368,527 | | |
| Road & Rail – 1.3% | |
| Arkansas Best Corp. | | | 53,192 | | | | 1,792,039 | | |
| Frozen Food Express Industries | | | 132,197 | | | | 715,186 | | |
| Kansas City Southern (a) | | | 86,315 | | | | 3,828,933 | | |
| Werner Enterprises, Inc. | | | 120,809 | | | | 2,622,763 | | |
| Road & Rail Total | | | 8,958,921 | | |
| Trading Companies & Distributors – 1.1% | |
| Kaman Corp. | | | 130,695 | | | | 3,722,194 | | |
| Rush Enterprises, Inc., Class A (a) | | | 120,130 | | | | 1,537,664 | | |
| Rush Enterprises, Inc., Class B (a) | | | 159,851 | | | | 2,007,728 | | |
| Trading Companies & Distributors Total | | | 7,267,586 | | |
| Industrials Total | | | 136,870,536 | | |
| Information Technology – 21.3% | |
| Communications Equipment – 1.5% | |
| ADC Telecommunications, Inc. (a) | | | 269,170 | | | | 2,274,486 | | |
| ADTRAN, Inc. | | | 161,346 | | | | 3,144,634 | | |
| Globecomm Systems, Inc. (a) | | | 217,539 | | | | 1,901,291 | | |
| Performance Technologies, Inc. (a)(b) | | | 619,141 | | | | 2,711,838 | | |
| Communications Equipment Total | | | 10,032,249 | | |
| Computers & Peripherals – 2.4% | |
| Avid Technology, Inc. (a) | | | 71,328 | | | | 1,716,152 | | |
| Hypercom Corp. (a) | | | 424,215 | | | | 1,688,376 | | |
| iGO, Inc. (a) | | | 428,053 | | | | 453,736 | | |
| Imation Corp. | | | 220,204 | | | | 4,974,408 | | |
| Presstek, Inc. (a) | | | 396,137 | | | | 2,234,213 | | |
| Rimage Corp. (a) | | | 230,354 | | | | 3,215,742 | | |
| STEC, Inc. (a) | | | 300,549 | | | | 2,314,227 | | |
| Computers & Peripherals Total | | | 16,596,854 | | |
| Electronic Equipment, Instruments & Components – 5.2% | |
| Agilysys, Inc. | | | 93,645 | | | | 944,878 | | |
| Benchmark Electronics, Inc. (a) | | | 911,000 | | | | 12,826,880 | | |
| FARO Technologies, Inc. (a) | | | 270,406 | | | | 5,508,170 | | |
See Accompanying Notes to Financial Statements.
58
Columbia Small Cap Core Fund
September 30, 2008
| Common Stocks (continued) | |
| | | Shares | | Value ($) | |
| Gerber Scientific, Inc. (a) | | | 170,971 | | | | 1,562,675 | | |
| Keithley Instruments, Inc. | | | 246,594 | | | | 2,063,992 | | |
| LeCroy Corp. (a) | | | 122,148 | | | | 939,318 | | |
| Merix Corp. (a) | | | 79,278 | | | | 101,476 | | |
| Newport Corp. (a) | | | 263,656 | | | | 2,842,212 | | |
| NU Horizons Electronics Corp. (a) | | | 166,162 | | | | 664,648 | | |
| Plexus Corp. (a) | | | 237,432 | | | | 4,914,842 | | |
| Technitrol, Inc. | | | 213,623 | | | | 3,159,484 | | |
Electronic Equipment, Instruments &
Components Total | | | 35,528,575 | | |
| Internet Software & Services – 1.3% | |
| EarthLink, Inc. (a) | | | 708,940 | | | | 6,025,990 | | |
| S1 Corp. (a) | | | 324,260 | | | | 1,984,471 | | |
| Selectica, Inc. (a) | | | 715,735 | | | | 722,893 | | |
| Internet Software & Services Total | | | 8,733,354 | | |
| IT Services – 2.6% | |
| Analysts International Corp. (a) | | | 856,765 | | | | 959,577 | | |
| Computer Task Group, Inc. (a) | | | 663,206 | | | | 4,310,839 | | |
| infoGROUP, Inc. | | | 326,007 | | | | 2,154,906 | | |
| Integral Systems, Inc. (a) | | | 167,898 | | | | 3,487,241 | | |
| NCI, Inc., Class A (a) | | | 72,368 | | | | 2,061,041 | | |
| Startek, Inc. (a) | | | 81,954 | | | | 526,145 | | |
| TNS, Inc. (a) | | | 201,301 | | | | 3,899,200 | | |
| IT Services Total | | | 17,398,949 | | |
| Semiconductors & Semiconductor Equipment – 3.8% | |
| ATMI, Inc. (a) | | | 204,551 | | | | 3,677,827 | | |
| Cirrus Logic, Inc. (a) | | | 434,092 | | | | 2,365,801 | | |
| Exar Corp. (a) | | | 196,713 | | | | 1,506,822 | | |
Fairchild Semiconductor
International, Inc. (a) | | | 421,587 | | | | 3,747,908 | | |
| Hi/Fn, Inc. (a) | | | 294,786 | | | | 943,315 | | |
| International Rectifier Corp. (a) | | | 60,596 | | | | 1,152,536 | | |
| IXYS Corp. (a) | | | 193,929 | | | | 1,762,815 | | |
| ON Semiconductor Corp. (a) | | | 639,506 | | | | 4,323,061 | | |
| Pericom Semiconductor Corp. (a) | | | 246,157 | | | | 2,584,648 | | |
| RF Micro Devices, Inc. (a) | | | 342,149 | | | | 999,075 | | |
| Ultratech, Inc. (a) | | | 194,130 | | | | 2,348,973 | | |
Semiconductors & Semiconductor
Equipment Total | | | 25,412,781 | | |
| Software – 4.5% | |
| Bottomline Technologies, Inc. (a) | | | 192,412 | | | | 2,001,085 | | |
| Epicor Software Corp. (a) | | | 310,023 | | | | 2,446,081 | | |
| Lawson Software, Inc. (a) | | | 520,925 | | | | 3,646,475 | | |
| Mentor Graphics Corp. (a) | | | 362,924 | | | | 4,119,187 | | |
| MSC.Software Corp. (a) | | | 358,302 | | | | 3,833,831 | | |
| PLATO Learning, Inc. (a) | | | 262,046 | | | | 744,211 | | |
| Progress Software Corp. (a) | | | 254,290 | | | | 6,608,997 | | |
| | | Shares | | Value ($) | |
| Sonic Solutions (a) | | | 248,744 | | | | 1,094,474 | | |
| Sybase, Inc. (a) | | | 184,587 | | | | 5,652,054 | | |
| Software Total | | | 30,146,395 | | |
| Information Technology Total | | | 143,849,157 | | |
| Materials – 4.0% | |
| Chemicals – 2.7% | |
| H.B. Fuller Co. | | | 332,114 | | | | 6,931,219 | | |
| Sensient Technologies Corp. | | | 248,486 | | | | 6,989,911 | | |
| Spartech Corp. | | | 446,607 | | | | 4,421,409 | | |
| Chemicals Total | | | 18,342,539 | | |
| Containers & Packaging – 0.8% | |
| Greif, Inc., Class A | | | 86,190 | | | | 5,655,788 | | |
| Containers & Packaging Total | | | 5,655,788 | | |
| Paper & Forest Products – 0.5% | |
| Glatfelter Co. | | | 237,822 | | | | 3,220,110 | | |
| Paper & Forest Products Total | | | 3,220,110 | | |
| Materials Total | | | 27,218,437 | | |
| Telecommunication Services – 0.3% | |
| Diversified Telecommunication Services – 0.3% | |
General Communication, Inc.,
Class A (a) | | | 197,142 | | | | 1,825,535 | | |
| Diversified Telecommunication Services Total | | | 1,825,535 | | |
| Telecommunication Services Total | | | 1,825,535 | | |
| Utilities – 3.3% | |
| Electric Utilities – 0.4% | |
| Otter Tail Corp. | | | 81,900 | | | | 2,516,787 | | |
| Electric Utilities Total | | | 2,516,787 | | |
| Gas Utilities – 1.7% | |
| New Jersey Resources Corp. | | | 126,299 | | | | 4,532,871 | | |
| Northwest Natural Gas Co. | | | 36,786 | | | | 1,912,872 | | |
| South Jersey Industries, Inc. | | | 139,390 | | | | 4,976,223 | | |
| Gas Utilities Total | | | 11,421,966 | | |
| Water Utilities – 1.2% | |
| American States Water Co. | | | 114,859 | | | | 4,422,071 | | |
| California Water Service Group | | | 102,773 | | | | 3,956,761 | | |
| Water Utilities Total | | | 8,378,832 | | |
| Utilities Total | | | 22,317,585 | | |
Total Common Stocks
(cost of $619,711,191) | | | 629,357,042 | | |
See Accompanying Notes to Financial Statements.
59
Columbia Small Cap Core Fund
September 30, 2008
| Short-Term Obligation – 8.6% | |
| | | Par ($) | | Value ($) | |
Repurchase agreement with
Fixed Income Clearing Corp.,
dated 09/30/08, due 10/01/08
at 0.200%, collateralized by
U.S. Treasury Obligations with
various maturities to 02/29/12,
market value $58,885,713
(repurchase proceeds
$57,731,321) | | | 57,731,000 | | | | 57,731,000 | | |
Total Short-Term Obligation
(cost of $57,731,000) | | | 57,731,000 | | |
Total Investments – 101.8%
(cost of $677,442,191) (c) | | | 687,088,042 | | |
| Other Assets & Liabilities, Net – (1.8)% | | | (11,939,956 | ) | |
| Net Assets – 100.0% | | | 675,148,086 | | |
Notes to Investment Portfolio:
(a) Non-income producing security.
(b) An affiliate may include any company in which the Fund owns five percent or more of its outstanding voting shares. Transactions in these affiliated companies during the year ended September 30, 2008, are as follows:
| Security name: | | | Key Technology, Inc. | | |
| Shares as of 09/30/07: | | | 152,265 | | |
| Shares purchased: | | | 43,640 | | |
| Shares sold: | | | (44,972 | ) | |
| Shares as of 09/30/08: | | | 150,933 | | |
| Net realized gain: | | $ | 1,139,629 | | |
| Dividend income earned: | | $ | – | | |
| Value at end of period: | | $ | 3,577,112 | | |
| Security name: | | | Performance Technologies, Inc. | | |
| Shares as of 09/30/07: | | | 751,700 | | |
| Shares purchased: | | | – | | |
| Shares sold: | | | (132,559 | ) | |
| Shares as of 09/30/08: | | | 619,141 | | |
| Net realized loss: | | $ | (676,601 | ) | |
| Dividend income earned: | | $ | – | | |
| Value at end of period: | | $ | 2,711,838 | | |
| Security name: | | | Unifirst Corp. | | |
| Shares as of 09/30/07: | | | 329,613 | | |
| Shares purchased: | | | 100,000 | | |
| Shares sold: | | | (217,594 | ) | |
| Shares as of 09/30/08: | | | 212,019 | | |
| Net realized gain: | | $ | 2,692,377 | | |
| Dividend income earned: | | $ | 47,886 | | |
| Value at end of period: | | $ | 9,135,899 | | |
(c) Cost for federal income tax purposes is $678,455,600.
At September 30, 2008, the Fund held investments in the following sectors:
| Sector (Unaudited) | | % of
Net Assets | |
| Information Technology | | | 21.3 | | |
| Industrials | | | 20.3 | | |
| Health Care | | | 16.4 | | |
| Consumer Discretionary | | | 12.1 | | |
| Financials | | | 9.9 | | |
| Materials | | | 4.0 | | |
| Energy | | | 3.7 | | |
| Utilities | | | 3.3 | | |
| Consumer Staples | | | 1.9 | | |
| Telecommunication Services | | | 0.3 | | |
| | | | 93.2 | | |
| Short-Term Obligation | | | 8.6 | | |
| Other Assets & Liabilities, Net | | | (1.8 | ) | |
| | | | 100.0 | | |
See Accompanying Notes to Financial Statements.
60
This page intentionally left blank.
Statements of Assets and Liabilities – Stock Funds
September 30, 2008
| | | ($) | | ($) | | ($) | | ($) | | ($) | |
| | | Columbia
Asset
Allocation Fund | | Columbia
Large Cap
Growth Fund | | Columbia
Disciplined
Value Fund | | Columbia
Contrarian
Core Fund | | Columbia
Small Cap
Core Fund | |
| Assets | |
| Unaffiliated investments, at identified cost | | | 272,164,672 | | | | 1,438,406,397 | | | | 354,293,127 | | | | 298,391,796 | | | | 665,571,747 | | |
| Affiliated investments, at identified cost | | | — | | | | — | | | | — | | | | — | | | | 11,870,444 | | |
| Total investments, at identified cost | | | 272,164,672 | | | | 1,438,406,397 | | | | 354,293,127 | | | | 298,391,796 | | | | 677,442,191 | | |
| Unaffiliated investments, at value | | | 261,824,196 | | | | 1,393,747,279 | | | | 332,727,042 | | | | 322,885,949 | | | | 671,663,193 | | |
| Affiliated investments, at value | | | — | | | | — | | | | — | | | | — | | | | 15,424,849 | | |
Total investments, at value (including
securities on loan of $9,307,789, $—,
$—, $—, and $—, respectively) | | | 261,824,196 | | | | 1,393,747,279 | | | | 332,727,042 | | | | 322,885,949 | | | | 687,088,042 | | |
| Cash | | | — | | | | 613 | | | | 8,864 | | | | 11,520 | | | | 59,020 | | |
| Cash collateral for futures contracts | | | 965,000 | | | | — | | | | — | | | | — | | | | — | | |
Foreign currency (cost of $5,641,
$—, $—, $— and $—, respectively) | | | 5,526 | | | | — | | | | — | | | | — | | | | — | | |
Unrealized appreciation on forward foreign
currency exchange contracts | | | 104,491 | | | | — | | | | — | | | | — | | | | — | | |
| Receivable for: | |
| Investments sold | | | 3,508,614 | | | | 43,005,796 | | | | — | | | | 3,705,257 | | | | 57,431 | | |
| Fund shares sold | | | 13,397 | | | | 2,442,899 | | | | 2,442,827 | | | | 97,414 | | | | 207,383 | | |
| Interest | | | 941,519 | | | | 147 | | | | 24 | | | | 11 | | | | 321 | | |
| Dividends | | | 291,489 | | | | 1,237,235 | | | | 877,821 | | | | 413,747 | | | | 402,379 | | |
| Foreign tax reclaim | | | 41,748 | | | | — | | | | — | | | | — | | | | — | | |
| Futures variation margin | | | 192,521 | | | | — | | | | 240,667 | | | | — | | | | — | | |
| Securities lending income | | | 10,272 | | | | 5,519 | | | | 8,965 | | | | 14,046 | | | | — | | |
Expense reimbursement due
from Investment Advisor | | | — | | | | — | | | | — | | | | 10,142 | | | | — | | |
| Regulatory settlements | | | — | | | | 1,078,423 | | | | — | | | | — | | | | — | | |
| Trustees' deferred compensation plan | | | 46,506 | | | | 186,231 | | | | 43,553 | | | | 51,250 | | | | 78,887 | | |
| Other assets | | | 1,041 | | | | 5,817 | | | | 1,617 | | | | 1,328 | | | | 3,898 | | |
| Total Assets | | | 267,946,320 | | | | 1,441,709,959 | | | | 336,351,380 | | | | 327,190,664 | | | | 687,897,361 | | |
| Liabilities | |
| Payable to custodian bank | | | 83,497 | | | | — | | | | — | | | | — | | | | — | | |
| Collateral on securities loaned | | | 9,660,703 | | | | — | | | | — | | | | — | | | | — | | |
Unrealized depreciation on forward foreign
currency exchange contracts | | | 58,579 | | | | — | | | | — | | | | — | | | | — | | |
Written options at value (premium $3,896,
$—, $—, $— and $—, respectively) | | | 4,670 | | | | — | | | | — | | | | — | | | | — | | |
| Payable for: | |
| Investments purchased | | | 2,503,403 | | | | 38,005,085 | | | | — | | | | 3,604,418 | | | | 9,242,551 | | |
Investments purchased on a delayed
delivery basis | | | 2,625,097 | | | | — | | | | — | | | | — | | | | — | | |
| Fund shares repurchased | | | 521,266 | | | | 1,819,819 | | | | 1,042,880 | | | | 801,767 | | | | 2,159,680 | | |
| Investment advisory fee | | | 143,356 | | | | 627,206 | | | | 202,969 | | | | 197,719 | | | | 444,227 | | |
| Administration fee | | | 14,777 | | | | 62,276 | | | | 19,468 | | | | 18,925 | | | | 40,581 | | |
| Transfer agent fee | | | 77,811 | | | | 413,698 | | | | 113,938 | | | | 90,835 | | | | 561,100 | | |
| Pricing and bookkeeping fees | | | 12,742 | | | | 11,785 | | | | 7,897 | | | | 7,598 | | | | 14,700 | | |
| Trustees' fees | | | 3,336 | | | | 841 | | | | 989 | | | | 489 | | | | 927 | | |
| Distribution and service fees | | | 42,814 | | | | 163,048 | | | | 33,168 | | | | 43,001 | | | | 94,105 | | |
| Custody fee | | | 34,696 | | | | 8,390 | | | | 3,221 | | | | 3,087 | | | | 7,340 | | |
| Chief compliance officer expenses | | | 147 | | | | 300 | | | | 187 | | | | 184 | | | | 273 | | |
| Trustees' deferred compensation plan | | | 46,506 | | | | 186,231 | | | | 43,553 | | | | 51,250 | | | | 78,887 | | |
| Other liabilities | | | 365,069 | | | | 197,768 | | | | 90,736 | | | | 87,387 | | | | 104,904 | | |
| Total Liabilities | | | 16,198,469 | | | | 41,496,447 | | | | 1,559,006 | | | | 4,906,660 | | | | 12,749,275 | | |
| Net Assets | | | 251,747,851 | | | | 1,400,213,512 | | | | 334,792,374 | | | | 322,284,004 | | | | 675,148,086 | | |
| Net Assets Consist of | |
| Paid-in capital | | | 272,412,280 | | | | 1,632,684,938 | | | | 403,330,740 | | | | 298,648,805 | | | | 615,347,576 | | |
Undistributed (overdistributed)
net investment income | | | (158,517 | ) | | | 2,551,815 | | | | 279,605 | | | | 1,911,330 | | | | (80,111 | ) | |
| Accumulated net realized gain (loss) | | | (10,018,780 | ) | | | (190,364,123 | ) | | | (46,822,547 | ) | | | (2,770,284 | ) | | | 50,234,770 | | |
| Unrealized appreciation (depreciation) on: | |
| Investments | | | (10,340,476 | ) | | | (44,659,118 | ) | | | (21,566,085 | ) | | | 24,494,153 | | | | 9,645,851 | | |
| Foreign currency translations | | | 35,179 | | | | — | | | | — | | | | — | | | | — | | |
| Futures contracts | | | (181,061 | ) | | | — | | | | (429,339 | ) | | | — | | | | — | | |
| Written options | | | (774 | ) | | | — | | | | — | | | | — | | | | — | | |
| Net Assets | | | 251,747,851 | | | | 1,400,213,512 | | | | 334,792,374 | | | | 322,284,004 | | | | 675,148,086 | | |
See Accompanying Notes to Financial Statements.
62
Statements of Assets and Liabilities – Stock Funds
September 30, 2008 (continued)
| | | Columbia
Asset
Allocation Fund | | Columbia
Large Cap
Growth Fund | | Columbia
Disciplined
Value Fund | | Columbia
Contrarian
Core Fund | | Columbia
Small Cap
Core Fund | |
| Class A | |
| Net assets | | $ | 7,266,416 | | | $ | 156,585,276 | | | $ | 16,170,625 | | | $ | 11,186,616 | | | $ | 115,245,812 | | |
| Shares outstanding | | | 578,256 | | | | 8,001,372 | | | | 1,536,378 | | | | 940,901 | | | | 8,149,877 | | |
| Net asset value per share (a) | | $ | 12.57 | | | $ | 19.57 | | | $ | 10.53 | | | $ | 11.89 | | | $ | 14.14 | | |
| Maximum sales charge | | | 5.75 | % | | | 5.75 | % | | | 5.75 | % | | | 5.75 | % | | | 5.75 | % | |
| Maximum offering price per share (b) | | $ | 13.34 | | | $ | 20.76 | | | $ | 11.17 | | | $ | 12.62 | | | $ | 15.00 | | |
| Class B | |
| Net assets | | $ | 4,698,581 | | | $ | 58,609,202 | | | $ | 3,913,965 | | | $ | 3,629,014 | | | $ | 23,084,822 | | |
| Shares outstanding | | | 373,814 | | | | 3,229,152 | | | | 394,498 | | | | 325,844 | | | | 1,779,376 | | |
Net asset value and offering
price per share (a) | | $ | 12.57 | | | $ | 18.15 | | | $ | 9.92 | | | $ | 11.14 | | | $ | 12.97 | | |
| Class C | |
| Net assets | | $ | 1,496,442 | | | $ | 21,208,266 | | | $ | 2,800,811 | | | $ | 1,717,679 | | | $ | 24,756,189 | | |
| Shares outstanding | | | 119,025 | | | | 1,167,881 | | | | 283,200 | | | | 154,087 | | | | 1,906,102 | | |
Net asset value and offering
price per share (a) | | $ | 12.57 | | | $ | 18.16 | | | $ | 9.89 | | | $ | 11.15 | | | $ | 12.99 | | |
| Class E | |
| Net assets | | | — | | | $ | 14,781,671 | | | | — | | | | — | | | | — | | |
| Shares outstanding | | | — | | | | 756,806 | | | | — | | | | — | | | | — | | |
| Net asset value per share (a) | | | — | | | $ | 19.53 | | | | — | | | | — | | | | — | | |
| Maximum sales charge | | | — | | | | 4.50 | % | | | — | | | | — | | | | — | | |
| Maximum offering price per share (b) | | | — | | | $ | 20.45 | | | | — | | | | — | | | | — | | |
| Class F | |
| Net assets | | | — | | | $ | 380,475 | | | | — | | | | — | | | | — | | |
| Shares outstanding | | | — | | | | 20,973 | | | | — | | | | — | | | | — | | |
Net asset value and offering
price per share (a) | | | — | | | $ | 18.14 | | | | — | | | | — | | | | — | | |
| Class T | |
| Net assets | | $ | 130,862,613 | | | $ | 169,295,210 | | | $ | 89,694,481 | | | $ | 132,271,508 | | | $ | 98,298,656 | | |
| Shares outstanding | | | 10,398,854 | | | | 8,717,819 | | | | 8,521,808 | | | | 11,206,360 | | | | 7,051,000 | | |
| Net asset value per share (a) | | $ | 12.58 | | | $ | 19.42 | | | $ | 10.53 | | | $ | 11.80 | | | $ | 13.94 | | |
| Maximum sales charge | | | 5.75 | % | | | 5.75 | % | | | 5.75 | % | | | 5.75 | % | | | 5.75 | % | |
| Maximum offering price per share (b) | | $ | 13.35 | | | $ | 20.60 | | | $ | 11.17 | | | $ | 12.52 | | | $ | 14.79 | | |
| Class Z | |
| Net assets | | $ | 107,423,799 | | | $ | 979,353,412 | | | $ | 222,212,492 | | | $ | 173,479,187 | | | $ | 413,762,607 | | |
| Shares outstanding | | | 8,536,185 | | | | 48,909,526 | | | | 20,584,674 | | | | 14,489,683 | | | | 28,697,951 | | |
Net asset value, offering and redemption
price per share | | $ | 12.58 | | | $ | 20.02 | | | $ | 10.80 | | | $ | 11.97 | | | $ | 14.42 | | |
(a) Redemption price per share is equal to net asset value less any applicable contingent deferred sales charge.
(b) On sales of $50,000 or more the offering price is reduced.
See Accompanying Notes to Financial Statements.
63
Statements of Operations – Stock Funds
For the Year Ended September 30, 2008
| | | ($) | | ($) | | ($) | | ($) | | ($) | |
| | | Columbia
Asset
Allocation Fund | | Columbia
Large Cap
Growth Fund | | Columbia
Disciplined
Value Fund | | Columbia
Contrarian
Core Fund | | Columbia
Small Cap
Core Fund | |
| Investment Income | |
| Income | |
| Dividends | | | 3,697,974 | | | | 15,993,211 | | | | 10,715,921 | | | | 6,241,140 | | | | 6,070,215 | | |
| Dividends from affiliates | | | — | | | | — | | | | — | | | | — | | | | 47,886 | | |
| Interest | | | 6,718,818 | | | | 1,152,480 | | | | 128,863 | | | | 85,682 | | | | 605,279 | | |
| Securities lending | | | 218,567 | | | | 591,413 | | | | 155,256 | | | | 161,039 | | | | — | | |
| Foreign tax withheld | | | (106,398 | ) | | | (13,056 | ) | | | — | | | | (20,012 | ) | | | (27,971 | ) | |
| Total Investment Income | | | 10,528,961 | | | | 17,724,048 | | | | 11,000,040 | | | | 6,467,849 | | | | 6,695,409 | | |
| Expenses | |
| Investment advisory fee | | | 1,992,133 | | | | 8,656,167 | | | | 2,955,744 | | | | 2,721,935 | | | | 6,765,818 | | |
| Administration fee | | | 205,343 | | | | 865,130 | | | | 283,214 | | | | 260,528 | | | | 625,431 | | |
| Distribution fee: | |
| Class B | | | 43,876 | | | | 858,333 | | | | 42,280 | | | | 32,466 | | | | 209,953 | | |
| Class C | | | 12,712 | | | | 208,759 | | | | 31,358 | | | | 11,935 | | | | 236,875 | | |
| Class E | | | — | | | | 17,431 | | | | — | | | | — | | | | — | | |
| Class F | | | — | | | | 10,541 | | | | — | | | | — | | | | — | | |
| Service fee: | |
| Class A | | | 20,619 | | | | 426,118 | | | | 59,632 | | | | 29,261 | | | | 345,533 | | |
| Class B | | | 14,625 | | | | 286,111 | | | | 14,093 | | | | 10,822 | | | | 69,984 | | |
| Class C | | | 4,237 | | | | 69,587 | | | | 10,452 | | | | 3,978 | | | | 78,958 | | |
| Class E | | | — | | | | 43,579 | | | | — | | | | — | | | | — | | |
| Class F | | | — | | | | 3,514 | | | | — | | | | — | | | | — | | |
| Shareholder service fee—Class T | | | 476,538 | | | | 644,907 | | | | 340,268 | | | | 478,944 | | | | 337,290 | | |
| Transfer agent fee | | | 380,251 | | | | 2,898,548 | | | | 699,871 | | | | 471,292 | | | | 1,330,054 | | |
| Pricing and bookkeeping fees | | | 144,921 | | | | 143,202 | | | | 104,609 | | | | 99,144 | | | | 155,166 | | |
| Trustees' fees | | | 31,713 | | | | 95,003 | | | | 36,674 | | | | 32,773 | | | | 62,529 | | |
| Custody fee | | | 203,562 | | | | 55,664 | | | | 19,198 | | | | 19,638 | | | | 47,957 | | |
| Chief compliance officer expenses | | | 681 | | | | 1,197 | | | | 751 | | | | 738 | | | | 963 | | |
| Other expenses | | | 250,868 | | | | 769,469 | | | | 271,804 | | | | 260,084 | | | | 361,464 | | |
| Expenses before interest expense | | | 3,782,079 | | | | 16,053,260 | | | | 4,869,948 | | | | 4,433,538 | | | | 10,627,975 | | |
| Interest expense | | | — | | | | — | | | | 3,344 | | | | 224 | | | | — | | |
| Total Expenses | | | 3,782,079 | | | | 16,053,260 | | | | 4,873,292 | | | | 4,433,762 | | | | 10,627,975 | | |
Fees waived or expenses reimbursed by
Investment Advisor | | | — | | | | — | | | | — | | | | (382,426 | ) | | | — | | |
| Expense reductions | | | (24,756 | ) | | | (140,312 | ) | | | (15,947 | ) | | | (26,028 | ) | | | (10,145 | ) | |
| Net Expenses | | | 3,757,323 | | | | 15,912,948 | | | | 4,857,345 | | | | 4,025,308 | | | | 10,617,830 | | |
| Net Investment Income (Loss) | | | 6,771,638 | | | | 1,811,100 | | | | 6,142,695 | | | | 2,442,541 | | | | (3,922,421 | ) | |
See Accompanying Notes to Financial Statements.
64
Statements of Operations – Stock Funds
For the Year Ended September 30, 2008 (continued)
| | | ($) | | ($) | | ($) | | ($) | | ($) | |
| | | Columbia
Asset
Allocation Fund | | Columbia
Large Cap
Growth Fund | | Columbia
Disciplined
Value Fund | | Columbia
Contrarian
Core Fund | | Columbia
Small Cap
Core Fund | |
Net Realized and Unrealized Gain (Loss)
on Investments, Foreign Currency,
Futures Contracts, Foreign Capital
Gains Tax and Written Options | |
| Net realized gain (loss) on: | |
| Unaffiliated investments | | | (5,775,462 | ) | | | (7,970,706 | ) | | | (44,515,457 | ) | | | 3,542,460 | | | | 88,930,232 | | |
| Affiliated investments | | | — | | | | — | | | | — | | | | — | | | | 3,155,405 | | |
| Foreign currency transactions | | | (447,152 | ) | | | — | | | | — | | | | — | | | | — | | |
| Futures contracts | | | (960,000 | ) | | | — | | | | (896,732 | ) | | | — | | | | — | | |
| Written options | | | 76,543 | | | | — | | | | — | | | | — | | | | — | | |
| Net realized gain (loss) | | | (7,106,071 | ) | | | (7,970,706 | ) | | | (45,412,189 | ) | | | 3,542,460 | | | | 92,085,637 | | |
Net change in unrealized appreciation
(depreciation) on: | |
| Investments | | | (50,833,926 | ) | | | (388,568,864 | ) | | | (86,251,662 | ) | | | (65,572,460 | ) | | | (219,195,085 | ) | |
| Foreign currency translations | | | (34,221 | ) | | | — | | | | — | | | | — | | | | — | | |
| Futures contracts | | | (298,243 | ) | | | — | | | | (752,241 | ) | | | — | | | | — | | |
| Written options | | | (21,519 | ) | | | — | | | | — | | | | — | | | | — | | |
Net change in unrealized appreciation
(depreciation) | | | (51,187,909 | ) | | | (388,568,864 | ) | | | (87,003,903 | ) | | | (65,572,460 | ) | | | (219,195,085 | ) | |
| Net Loss | | | (58,293,980 | ) | | | (396,539,570 | ) | | | (132,416,092 | ) | | | (62,030,000 | ) | | | (127,109,448 | ) | |
| Net Decrease Resulting from Operations | | | (51,522,342 | ) | | | (394,728,470 | ) | | | (126,273,397 | ) | | | (59,587,459 | ) | | | (131,031,869 | ) | |
See Accompanying Notes to Financial Statements.
65
Statements of Changes in Net Assets – Stock Funds
| Increase (Decrease) in Net Assets | | Columbia Asset Allocation Fund | | Columbia Large Cap Growth Fund | | Columbia Disciplined Value Fund | |
| | | Year Ended September 30, | | Year Ended September 30, | | Year Ended September 30, | |
| | | 2008 ($) | | 2007 ($)(a) | | 2008 ($) | | 2007 ($)(a) | | 2008 ($) | | 2007 ($)(a) | |
| Operations | |
| Net investment income (loss) | | | 6,771,638 | | | | 6,957,563 | | | | 1,811,100 | | | | 2,296,070 | | | | 6,142,695 | | | | 5,366,845 | | |
Net realized gain (loss) on investments,
foreign currency transactions, futures
contracts and written options | | | (7,106,071 | ) | | | 31,742,370 | | | | (7,970,706 | ) | | | 206,032,477 | | | | (45,412,189 | ) | | | 60,559,515 | | |
Net change in unrealized appreciation
(depreciation) on investments, foreign
currency translations, futures contracts
and written options | | | (51,187,909 | ) | | | 8,276,416 | | | | (388,568,864 | ) | | | 164,464,746 | | | | (87,003,903 | ) | | | 1,428,627 | | |
| Net increase (decrease) resulting from operations | | | (51,522,342 | ) | | | 46,976,349 | | | | (394,728,470 | ) | | | 372,793,293 | | | | (126,273,397 | ) | | | 67,354,987 | | |
| Distributions to Shareholders | |
| From net investment income: | |
| Class A | | | (197,762 | ) | | | (141,020 | ) | | | — | | | | (171,462 | ) | | | (308,780 | ) | | | (233,862 | ) | |
| Class B | | | (91,484 | ) | | | (81,090 | ) | | | — | | | | (12 | ) | | | (31,729 | ) | | | (15,898 | ) | |
| Class C | | | (26,950 | ) | | | (18,822 | ) | | | — | | | | — | | | | (20,476 | ) | | | (7,895 | ) | |
| Class E | | | — | | | | — | | | | — | | | | (15,174 | ) | | | — | | | | — | | |
| Class G | | | — | | | | (72,881 | ) | | | — | | | | — | | | | — | | | | (5,638 | ) | |
| Class T | | | (3,560,124 | ) | | | (3,452,173 | ) | | | — | | | | (259,486 | ) | | | (1,411,835 | ) | | | (1,299,456 | ) | |
| Class Z | | | (3,298,884 | ) | | | (3,349,133 | ) | | | (2,224,336 | ) | | | (2,241,107 | ) | | | (4,202,294 | ) | | | (3,815,099 | ) | |
| From net realized gains: | |
| Class A | | | (723,894 | ) | | | (419,073 | ) | | | (11,577,199 | ) | | | (2,031,714 | ) | | | (3,659,576 | ) | | | (1,417,443 | ) | |
| Class B | | | (545,891 | ) | | | (451,652 | ) | | | (11,130,619 | ) | | | (3,678,918 | ) | | | (870,037 | ) | | | (588,081 | ) | |
| Class C | | | (160,133 | ) | | | (88,154 | ) | | | (2,290,476 | ) | | | (527,182 | ) | | | (639,638 | ) | | | (255,406 | ) | |
| Class E | | | — | | | | — | | | | (1,232,359 | ) | | | (221,051 | ) | | | — | | | | — | | |
| Class F | | | — | | | | — | | | | (188,065 | ) | | | (85,616 | ) | | | — | | | | — | | |
| Class G | | | — | | | | (614,482 | ) | | | — | | | | (393,409 | ) | | | — | | | | (197,222 | ) | |
| Class T | | | (14,928,189 | ) | | | (11,761,474 | ) | | | (16,307,165 | ) | | | (3,400,942 | ) | | | (15,296,653 | ) | | | (12,494,021 | ) | |
| Class Z | | | (12,207,866 | ) | | | (10,241,990 | ) | | | (85,740,579 | ) | | | (18,366,994 | ) | | | (36,691,117 | ) | | | (25,738,056 | ) | |
| Total distributions to shareholders | | | (35,741,177 | ) | | | (30,691,944 | ) | | | (130,690,798 | ) | | | (31,393,067 | ) | | | (63,132,135 | ) | | | (46,068,077 | ) | |
| Net Capital Share Transactions | | | (2,597,208 | ) | | | (26,064,041 | ) | | | (11,914,912 | ) | | | (210,406,249 | ) | | | (5,902,983 | ) | | | 63,281,717 | | |
| Increase from regulatory settlements | | | — | | | | — | | | | 1,089,186 | | | | — | | | | — | | | | — | | |
| Net increase (decrease) in net assets | | | (89,860,727 | ) | | | (9,779,636 | ) | | | (536,244,994 | ) | | | 130,993,977 | | | | (195,308,515 | ) | | | 84,568,627 | | |
| Net Assets | |
| Beginning of period | | | 341,608,578 | | | | 351,388,214 | | | | 1,936,458,506 | | | | 1,805,464,529 | | | | 530,100,889 | | | | 445,532,262 | | |
| End of period | | | 251,747,851 | | | | 341,608,578 | | | | 1,400,213,512 | | | | 1,936,458,506 | | | | 334,792,374 | | | | 530,100,889 | | |
Undistributed (overdistributed) net investment
income at end of period | | | (158,517 | ) | | | 405,073 | | | | 2,551,815 | | | | 1,979,558 | | | | 279,605 | | | | 195,356 | | |
(a) Class G shares reflect activity for the period October 1, 2006 through August 8, 2007. On August 8, 2007, Class G shares converted to Class T shares.
See Accompanying Notes to Financial Statements.
66
| Increase (Decrease) in Net Assets | | Columbia Contrarian Core Fund | | Columbia Small Cap Core Fund | |
| | | Year Ended September 30, | | Year Ended September 30, | |
| | | 2008 ($) | | 2007 ($)(a) | | 2008 ($) | | 2007 ($)(a) | |
| Operations | |
| Net investment income (loss) | | | 2,442,541 | | | | 1,878,037 | | | | (3,922,421 | ) | | | 4,370,779 | | |
Net realized gain (loss) on investments,
foreign currency transactions, futures
contracts and written options | | | 3,542,460 | | | | 53,774,757 | | | | 92,085,637 | | | | 233,156,788 | | |
Net change in unrealized appreciation
(depreciation) on investments, foreign
currency translations, futures contracts
and written options | | | (65,572,460 | ) | | | 25,296,904 | | | | (219,195,085 | ) | | | (65,844,556 | ) | |
| Net increase (decrease) resulting from operations | | | (59,587,459 | ) | | | 80,949,698 | | | | (131,031,869 | ) | | | 171,683,011 | | |
| Distributions to Shareholders | |
| From net investment income: | |
| Class A | | | (41,459 | ) | | | — | | | | (313,396 | ) | | | — | | |
| Class B | | | — | | | | — | | | | — | | | | — | | |
| Class C | | | — | | | | — | | | | — | | | | — | | |
| Class E | | | — | | | | — | | | | — | | | | — | | |
| Class G | | | — | | | | — | | | | — | | | | — | | |
| Class T | | | (523,167 | ) | | | (319 | ) | | | (184,037 | ) | | | — | | |
| Class Z | | | (1,372,481 | ) | | | (565,065 | ) | | | (3,485,596 | ) | | | — | | |
| From net realized gains: | |
| Class A | | | (1,125,847 | ) | | | (859,588 | ) | | | (30,396,930 | ) | | | (20,681,734 | ) | |
| Class B | | | (466,120 | ) | | | (429,883 | ) | | | (6,593,541 | ) | | | (4,457,286 | ) | |
| Class C | | | (131,887 | ) | | | (79,050 | ) | | | (7,737,478 | ) | | | (5,252,814 | ) | |
| Class E | | | — | | | | — | | | | — | | | | — | | |
| Class F | | | — | | | | — | | | | — | | | | — | | |
| Class G | | | — | | | | (295,968 | ) | | | — | | | | (747,564 | ) | |
| Class T | | | (16,463,774 | ) | | | (13,657,644 | ) | | | (24,251,745 | ) | | | (14,911,569 | ) | |
| Class Z | | | (22,118,426 | ) | | | (20,205,123 | ) | | | (144,889,355 | ) | | | (98,828,377 | ) | |
| Total distributions to shareholders | | | (42,243,161 | ) | | | (36,092,640 | ) | | | (217,852,078 | ) | | | (144,879,344 | ) | |
| Net Capital Share Transactions | | | (17,037,006 | ) | | | (48,864,435 | ) | | | (201,619,486 | ) | | | (148,719,232 | ) | |
| Increase from regulatory settlements | | | — | | | | — | | | | — | | | | — | | |
| Net increase (decrease) in net assets | | | (118,867,626 | ) | | | (4,007,377 | ) | | | (550,503,433 | ) | | | (121,915,565 | ) | |
| Net Assets | |
| Beginning of period | | | 441,151,630 | | | | 445,159,007 | | | | 1,225,651,519 | | | | 1,347,567,084 | | |
| End of period | | | 322,284,004 | | | | 441,151,630 | | | | 675,148,086 | | | | 1,225,651,519 | | |
Undistributed (overdistributed) net investment
income at end of period | | | 1,911,330 | | | | 1,506,399 | | | | (80,111 | ) | | | 3,917,490 | | |
See Accompanying Notes to Financial Statements.
67
Statements of Changes in Net Assets – Capital Stock Activity
| | | Columbia Asset Allocation Fund | |
| | | Year Ended
September 30, 2008 | | Year Ended
September 30, 2007(a) | |
| | | Shares | | Dollars ($) | | Shares | | Dollars ($) | |
| Class A | |
| Subscriptions | | | 197,474 | | | | 2,903,127 | | | | 180,161 | | | | 2,928,368 | | |
| Distributions reinvested | | | 58,632 | | | | 883,969 | | | | 33,719 | | | | 534,132 | | |
| Redemptions | | | (172,671 | ) | | | (2,495,559 | ) | | | (84,203 | ) | | | (1,366,725 | ) | |
| Net increase | | | 83,435 | | | | 1,291,537 | | | | 129,677 | | | | 2,095,775 | | |
| Class B | |
| Subscriptions | | | 100,624 | | | | 1,491,826 | | | | 57,038 | | | | 928,170 | | |
| Distributions reinvested | | | 38,828 | | | | 589,166 | | | | 30,743 | | | | 485,525 | | |
| Redemptions | | | (135,789 | ) | | | (1,949,904 | ) | | | (140,335 | ) | | | (2,280,263 | ) | |
| Net increase (decrease) | | | 3,663 | | | | 131,088 | | | | (52,554 | ) | | | (866,568 | ) | |
| Class C | |
| Subscriptions | | | 40,510 | | | | 586,522 | | | | 37,410 | | | | 605,097 | | |
| Distributions reinvested | | | 11,064 | | | | 167,904 | | | | 5,867 | | | | 92,767 | | |
| Redemptions | | | (40,020 | ) | | | (572,939 | ) | | | (15,578 | ) | | | (254,058 | ) | |
| Net increase (decrease) | | | 11,554 | | | | 181,487 | | | | 27,699 | | | | 443,806 | | |
| Class E | |
| Subscriptions | | | — | | | | — | | | | — | | | | — | | |
| Distributions reinvested | | | — | | | | — | | | | — | | | | — | | |
| Redemptions | | | — | | | | — | | | | — | | | | — | | |
| Net increase | | | — | | | | — | | | | — | | | | — | | |
| Class F | |
| Subscriptions | | | — | | | | — | | | | — | | | | — | | |
| Distributions reinvested | | | — | | | | — | | | | — | | | | — | | |
| Redemptions | | | — | | | | — | | | | — | | | | — | | |
| Net decrease | | | — | | | | — | | | | — | | | | — | | |
| Class G | |
| Subscriptions | | | — | | | | — | | | | 10,686 | | | | 173,323 | | |
| Distributions reinvested | | | — | | | | — | | | | 42,811 | | | | 674,160 | | |
| Redemptions | | | — | | | | — | | | | (701,470 | ) | | | (11,433,096 | ) | |
| Net decrease | | | — | | | | — | | | | (647,973 | ) | | | (10,585,613 | ) | |
| Class T | |
| Subscriptions | | | 74,641 | | | | 1,095,793 | | | | 702,659 | | | | 11,474,453 | | |
| Distributions reinvested | | | 1,192,504 | | | | 18,031,577 | | | | 935,483 | | | | 14,819,321 | | |
| Redemptions | | | (1,612,931 | ) | | | (23,705,569 | ) | | | (1,799,843 | ) | | | (29,320,832 | ) | |
| Net decrease | | | (345,786 | ) | | | (4,578,199 | ) | | | (161,701 | ) | | | (3,027,058 | ) | |
| Class Z | |
| Subscriptions | | | 1,182,443 | | | | 17,148,685 | | | | 353,527 | | | | 5,738,177 | | |
| Distributions reinvested | | | 900,520 | | | | 13,588,996 | | | | 746,248 | | | | 11,817,739 | | |
| Redemptions | | | (2,140,627 | ) | | | (30,360,802 | ) | | | (1,945,955 | ) | | | (31,680,299 | ) | |
| Net increase (decrease) | | | (57,664 | ) | | | 376,879 | | | | (846,180 | ) | | | (14,124,383 | ) | |
(a) On August 8, 2007, Class G shares converted to Class T shares.
See Accompanying Notes to Financial Statements.
68
| | | Columbia Large Cap Growth Fund | |
| | | Year Ended
September 30, 2008 | | Year Ended
September 30, 2007(a) | |
| | | Shares | | Dollars ($) | | Shares | | Dollars ($) | |
| Class A | |
| Subscriptions | | | 3,052,442 | | | | 71,281,501 | | | | 2,150,850 | | | | 52,455,831 | | |
| Distributions reinvested | | | 400,865 | | | | 10,342,317 | | | | 83,467 | | | | 1,963,964 | | |
| Redemptions | | | (1,708,127 | ) | | | (39,787,035 | ) | | | (1,597,266 | ) | | | (38,734,036 | ) | |
| Net increase | | | 1,745,180 | | | | 41,836,783 | | | | 637,051 | | | | 15,685,759 | | |
| Class B | |
| Subscriptions | | | 89,653 | | | | 1,994,153 | | | | 141,434 | | | | 3,235,215 | | |
| Distributions reinvested | | | 427,139 | | | | 10,285,500 | | | | 152,226 | | | | 3,382,434 | | |
| Redemptions | | | (3,985,922 | ) | | | (86,976,811 | ) | | | (4,384,260 | ) | | | (100,253,074 | ) | |
| Net increase (decrease) | | | (3,469,130 | ) | | | (74,697,158 | ) | | | (4,090,600 | ) | | | (93,635,425 | ) | |
| Class C | |
| Subscriptions | | | 130,752 | | | | 2,970,379 | | | | 148,057 | | | | 3,369,513 | | |
| Distributions reinvested | | | 76,612 | | | | 1,845,584 | | | | 19,670 | | | | 437,270 | | |
| Redemptions | | | (305,949 | ) | | | (6,640,695 | ) | | | (375,109 | ) | | | (8,595,097 | ) | |
| Net increase (decrease) | | | (98,585 | ) | | | (1,824,732 | ) | | | (207,382 | ) | | | (4,788,314 | ) | |
| Class E | |
| Subscriptions | | | 97,348 | | | | 2,306,175 | | | | 135,163 | | | | 3,269,615 | | |
| Distributions reinvested | | | 47,726 | | | | 1,229,898 | | | | 10,039 | | | | 236,225 | | |
| Redemptions | | | (68,432 | ) | | | (1,626,700 | ) | | | (52,081 | ) | | | (1,262,052 | ) | |
| Net increase | | | 76,642 | | | | 1,909,373 | | | | 93,121 | | | | 2,243,788 | | |
| Class F | |
| Subscriptions | | | 3,297 | | | | 72,377 | | | | 3,845 | | | | 89,595 | | |
| Distributions reinvested | | | 7,813 | | | | 188,065 | | | | 3,853 | | | | 85,616 | | |
| Redemptions | | | (106,218 | ) | | | (2,348,463 | ) | | | (144,360 | ) | | | (3,293,578 | ) | |
| Net decrease | | | (95,108 | ) | | | (2,088,021 | ) | | | (136,662 | ) | | | (3,118,367 | ) | |
| Class G | |
| Subscriptions | | | — | | | | — | | | | 23,676 | | | | 520,721 | | |
| Distributions reinvested | | | — | | | | — | | | | 18,127 | | | | 390,277 | | |
| Redemptions | | | — | | | | — | | | | (1,251,512 | ) | | | (28,305,066 | ) | |
| Net decrease | | | — | | | | — | | | | (1,209,709 | ) | | | (27,394,068 | ) | |
| Class T | |
| Subscriptions | | | 136,148 | | | | 3,185,655 | | | | 1,131,841 | | | | 27,907,744 | | |
| Distributions reinvested | | | 623,267 | | | | 15,961,865 | | | | 152,970 | | | | 3,576,443 | | |
| Redemptions | | | (1,255,111 | ) | | | (29,455,246 | ) | | | (1,558,937 | ) | | | (37,510,316 | ) | |
| Net decrease | | | (495,696 | ) | | | (10,307,726 | ) | | | (274,126 | ) | | | (6,026,129 | ) | |
| Class Z | |
| Subscriptions | | | 5,946,708 | | | | 141,918,882 | | | | 4,619,814 | | | | 116,161,518 | | |
| Distributions reinvested | | | 2,365,715 | | | | 62,336,591 | | | | 639,489 | | | | 15,328,552 | | |
| Redemptions | | | (7,096,396 | ) | | | (170,998,904 | ) | | | (9,108,657 | ) | | | (224,863,563 | ) | |
| Net increase (decrease) | | | 1,216,027 | | | | 33,256,569 | | | | (3,849,354 | ) | | | (93,373,493 | ) | |
See Accompanying Notes to Financial Statements.
69
Statements of Changes in Net Assets – Capital Stock Activity
| | | Columbia Disciplined Value Fund | |
| | | Year Ended
September 30, 2008 | | Year Ended
September 30, 2007(a) | |
| | | Shares | | Dollars ($) | | Shares | | Dollars ($) | |
| Class A | |
| Subscriptions | | | 405,173 | | | | 5,404,894 | | | | 1,770,526 | | | | 28,466,004 | | |
| Distributions reinvested | | | 251,100 | | | | 3,493,211 | | | | 95,435 | | | | 1,468,403 | | |
| Redemptions | | | (1,246,088 | ) | | | (16,101,999 | ) | | | (549,769 | ) | | | (8,693,199 | ) | |
| Net increase (decrease) | | | (589,815 | ) | | | (7,203,894 | ) | | | 1,316,192 | | | | 21,241,208 | | |
| Class B | |
| Subscriptions | | | 48,749 | | | | 624,153 | | | | 236,879 | | | | 3,614,659 | | |
| Distributions reinvested | | | 59,953 | | | | 790,418 | | | | 35,787 | | | | 519,467 | | |
| Redemptions | | | (211,203 | ) | | | (2,524,882 | ) | | | (132,031 | ) | | | (2,016,449 | ) | |
| Net increase (decrease) | | | (102,501 | ) | | | (1,110,311 | ) | | | 140,635 | | | | 2,117,677 | | |
| Class C | |
| Subscriptions | | | 89,813 | | | | 1,116,398 | | | | 362,864 | | | | 5,520,702 | | |
| Distributions reinvested | | | 42,444 | | | | 557,859 | | | | 14,638 | | | | 212,086 | | |
| Redemptions | | | (214,878 | ) | | | (2,553,953 | ) | | | (132,329 | ) | | | (2,045,973 | ) | |
| Net increase (decrease) | | | (82,621 | ) | | | (879,696 | ) | | | 245,173 | | | | 3,686,815 | | |
| Class G | |
| Subscriptions | | | — | | | | — | | | | 4,135 | | | | 62,375 | | |
| Distributions reinvested | | | — | | | | — | | | | 13,962 | | | | 202,665 | | |
| Redemptions | | | — | | | | — | | | | (161,554 | ) | | | (2,454,028 | ) | |
| Net decrease | | | — | | | | — | | | | (143,457 | ) | | | (2,188,988 | ) | |
| Class T | |
| Subscriptions | | | 59,829 | | | | 756,203 | | | | 226,408 | | | | 3,619,440 | | |
| Distributions reinvested | | | 1,185,592 | | | | 16,464,091 | | | | 885,893 | | | | 13,590,075 | | |
| Redemptions | | | (1,326,278 | ) | | | (16,955,125 | ) | | | (1,272,443 | ) | | | (20,448,954 | ) | |
| Net increase (decrease) | | | (80,857 | ) | | | 265,169 | | | | (160,142 | ) | | | (3,239,439 | ) | |
| Class Z | |
| Subscriptions | | | 4,055,288 | | | | 53,584,460 | | | | 5,854,266 | | | | 95,800,402 | | |
| Distributions reinvested | | | 1,351,091 | | | | 19,295,848 | | | | 1,029,907 | | | | 16,143,481 | | |
| Redemptions | | | (5,288,025 | ) | | | (69,854,559 | ) | | | (4,267,841 | ) | | | (70,279,439 | ) | |
| Net increase (decrease) | | | 118,354 | | | | 3,025,749 | | | | 2,616,332 | | | | 41,664,444 | | |
(a) On August 8, 2007, Class G shares converted to Class T shares.
See Accompanying Notes to Financial Statements.
70
| | | Columbia Contrarian Core Fund | |
| | | Year Ended
September 30, 2008 | | Year Ended
September 30, 2007(a) | |
| | | Shares | | Dollars ($) | | Shares | | Dollars ($) | |
| Class A | |
| Subscriptions | | | 251,873 | | | | 3,365,188 | | | | 109,489 | | | | 1,588,680 | | |
| Distributions reinvested | | | 77,223 | | | | 1,125,917 | | | | 58,967 | | | | 820,227 | | |
| Redemptions | | | (165,492 | ) | | | (2,251,895 | ) | | | (145,340 | ) | | | (2,104,833 | ) | |
| Net increase (decrease) | | | 163,604 | | | | 2,239,210 | | | | 23,116 | | | | 304,074 | | |
| Class B | |
| Subscriptions | | | 61,049 | | | | 772,905 | | | | 28,278 | | | | 385,523 | | |
| Distributions reinvested | | | 30,457 | | | | 418,472 | | | | 29,021 | | | | 384,244 | | |
| Redemptions | | | (92,569 | ) | | | (1,164,528 | ) | | | (150,431 | ) | | | (2,083,969 | ) | |
| Net increase (decrease) | | | (1,063 | ) | | | 26,849 | | | | (93,132 | ) | | | (1,314,202 | ) | |
| Class C | |
| Subscriptions | | | 101,333 | | | | 1,290,847 | | | | 42,484 | | | | 585,336 | | |
| Distributions reinvested | | | 7,977 | | | | 109,683 | | | | 3,798 | | | | 50,326 | | |
| Redemptions | | | (52,521 | ) | | | (692,498 | ) | | | (16,427 | ) | | | (222,745 | ) | |
| Net increase (decrease) | | | 56,789 | | | | 708,032 | | | | 29,855 | | | | 412,917 | | |
| Class G | |
| Subscriptions | | | — | | | | — | | | | 7,669 | | | | 103,973 | | |
| Distributions reinvested | | | — | | | | — | | | | 21,030 | | | | 275,701 | | |
| Redemptions | | | — | | | | — | | | | (291,409 | ) | | | (4,075,162 | ) | |
| Net decrease | | | — | | | | — | | | | (262,710 | ) | | | (3,695,488 | ) | |
| Class T | |
| Subscriptions | | | 107,254 | | | | 1,482,245 | | | | 320,798 | | | | 4,720,903 | | |
| Distributions reinvested | | | 1,125,256 | | | | 16,293,706 | | | | 945,404 | | | | 13,074,931 | | |
| Redemptions | | | (1,538,327 | ) | | | (20,983,001 | ) | | | (1,837,204 | ) | | | (26,532,644 | ) | |
| Net increase (decrease) | | | (305,817 | ) | | | (3,207,050 | ) | | | (571,002 | ) | | | (8,736,810 | ) | |
| Class Z | |
| Subscriptions | | | 684,939 | | | | 9,231,408 | | | | 602,902 | | | | 8,796,060 | | |
| Distributions reinvested | | | 1,341,183 | | | | 19,648,343 | | | | 1,241,550 | | | | 17,344,450 | | |
| Redemptions | | | (3,271,455 | ) | | | (45,683,798 | ) | | | (4,264,614 | ) | | | (61,975,436 | ) | |
| Net increase (decrease) | | | (1,245,333 | ) | | | (16,804,047 | ) | | | (2,420,162 | ) | | | (35,834,926 | ) | |
See Accompanying Notes to Financial Statements.
71
Statements of Changes in Net Assets – Capital Stock Activity
| | | Columbia Small Cap Core Fund | |
| | | Year Ended
September 30, 2008 | | Year Ended
September 30, 2007(a) | |
| | | Shares | | Dollars ($) | | Shares | | Dollars ($) | |
| Class A | |
| Subscriptions | | | 922,622 | | | | 14,115,438 | | | | 903,461 | | | | 18,016,706 | | |
| Distributions reinvested | | | 1,853,851 | | | | 29,216,697 | | | | 1,030,696 | | | | 19,562,596 | | |
| Redemptions | | | (3,448,586 | ) | | | (53,363,614 | ) | | | (2,767,533 | ) | | | (55,090,029 | ) | |
| Net decrease | | | (672,113 | ) | | | (10,031,479 | ) | | | (833,376 | ) | | | (17,510,727 | ) | |
| Class B | |
| Subscriptions | | | 13,702 | | | | 197,333 | | | | 16,187 | | | | 299,632 | | |
| Distributions reinvested | | | 418,959 | | | | 6,095,850 | | | | 230,550 | | | | 4,124,545 | | |
| Redemptions | | | (569,202 | ) | | | (8,150,007 | ) | | | (418,303 | ) | | | (7,865,585 | ) | |
| Net decrease | | | (136,541 | ) | | | (1,856,824 | ) | | | (171,566 | ) | | | (3,441,408 | ) | |
| Class C | |
| Subscriptions | | | 57,885 | | | | 832,429 | | | | 53,482 | | | | 989,340 | | |
| Distributions reinvested | | | 473,257 | | | | 6,890,619 | | | | 259,493 | | | | 4,647,523 | | |
| Redemptions | | | (879,920 | ) | | | (12,565,729 | ) | | | (524,194 | ) | | | (9,807,888 | ) | |
| Net decrease | | | (348,778 | ) | | | (4,842,681 | ) | | | (211,219 | ) | | | (4,171,025 | ) | |
| Class G | |
| Subscriptions | | | — | | | | — | | | | 2,236 | | | | 41,439 | | |
| Distributions reinvested | | | — | | | | — | | | | 40,261 | | | | 713,430 | | |
| Redemptions | | | — | | | | — | | | | (392,499 | ) | | | (7,264,706 | ) | |
| Net decrease | | | — | | | | — | | | | (350,002 | ) | | | (6,509,837 | ) | |
| Class T | |
| Subscriptions | | | 187,496 | | | | 2,838,894 | | | | 502,935 | | | | 9,881,160 | | |
| Distributions reinvested | | | 1,454,898 | | | | 22,609,113 | | | | 731,833 | | | | 13,736,501 | | |
| Redemptions | | | (1,486,975 | ) | | | (22,864,774 | ) | | | (1,280,343 | ) | | | (25,169,851 | ) | |
| Net increase (decrease) | | | 155,419 | | | | 2,583,233 | | | | (45,575 | ) | | | (1,552,190 | ) | |
| Class Z | |
| Subscriptions | | | 4,643,406 | | | | 72,532,539 | | | | 4,363,649 | | | | 88,313,789 | | |
| Distributions reinvested | | | 6,363,669 | | | | 102,073,253 | | | | 3,359,060 | | | | 64,661,908 | | |
| Redemptions | | | (23,349,696 | ) | | | (362,077,527 | ) | | | (13,263,308 | ) | | | (268,509,742 | ) | |
| Net decrease | | | (12,342,621 | ) | | | (187,471,735 | ) | | | (5,540,599 | ) | | | (115,534,045 | ) | |
(a) On August 8, 2007, Class G shares converted to Class T shares.
See Accompanying Notes to Financial Statements.
72
Financial Highlights – Columbia Asset Allocation Fund
Selected data for a share outstanding throughout each period is as follows:
| | | Year Ended September 30, | |
| Class A Shares | | 2008 | | 2007 | | 2006 | | 2005 | | 2004 (a) | �� |
| Net Asset Value, Beginning of Period | | $ | 16.80 | | | $ | 16.06 | | | $ | 16.47 | | | $ | 15.06 | | | $ | 14.01 | | |
| Income from Investment Operations: | |
| Net investment income (b) | | | 0.31 | | | | 0.32 | | | | 0.22 | | | | 0.27 | (c) | | | 0.21 | | |
Net realized and unrealized gain (loss) on investments,
foreign currency transactions, futures contracts,
foreign capital gains tax and written options | | | (2.76 | ) | | | 1.86 | | | | 0.92 | | | | 1.41 | | | | 1.11 | | |
| Total from investment operations | | | (2.45 | ) | | | 2.18 | | | | 1.14 | | | | 1.68 | | | | 1.32 | | |
| Less Distributions to Shareholders: | |
| From net investment income | | | (0.34 | ) | | | (0.33 | ) | | | (0.31 | ) | | | (0.27 | ) | | | (0.27 | ) | |
| From net realized gains | | | (1.44 | ) | | | (1.11 | ) | | | (1.24 | ) | | | — | | | | — | | |
| Total distributions to shareholders | | | (1.78 | ) | | | (1.44 | ) | | | (1.55 | ) | | | (0.27 | ) | | | (0.27 | ) | |
| Net Asset Value, End of Period | | $ | 12.57 | | | $ | 16.80 | | | $ | 16.06 | | | $ | 16.47 | | | $ | 15.06 | | |
| Total return (d) | | | (16.23 | )% | | | 14.24 | % | | | 7.39 | %(e)(f) | | | 11.20 | %(f) | | | 9.46 | %(f) | |
| Ratios to Average Net Assets/Supplemental Data: | |
| Net expenses | | | 1.29 | %(g) | | | 1.32 | %(h) | | | 1.31 | %(h) | | | 1.35 | %(h) | | | 1.43 | %(h) | |
| Waiver/Reimbursement | | | — | | | | — | | | | 0.01 | % | | | 0.01 | % | | | — | %(i) | |
| Net investment income | | | 2.17 | %(g) | | | 1.98 | %(h) | | | 1.38 | %(h) | | | 1.66 | %(h) | | | 1.43 | %(h) | |
| Portfolio turnover rate | | | 94 | % | | | 100 | % | | | 98 | % | | | 86 | % | | | 75 | % | |
| Net assets, end of period (000's) | | $ | 7,266 | | | $ | 8,314 | | | $ | 5,863 | | | $ | 4,206 | | | $ | 2,901 | | |
(a) On October 13, 2003, the Liberty Asset Allocation Fund was renamed the Columbia Asset Allocation Fund.
(b) Per share data was calculated using the average shares outstanding during the period.
(c) Net investment income per share reflects a special dividend. The effect of this dividend amounted to $0.02 per share.
(d) Total return at net asset value assuming all distributions reinvested and no initial sales charge or contingent deferred sales charge.
(e) Total return includes a voluntary reimbursement by the investment advisor for a realized investment loss due to a trading error. This reimbursement increased total return and net asset value by less than 0.01% and less than $0.01, respectively.
(f) Had the investment advisor and/or any of its affiliates not waived fees or reimbursed a portion of expenses, total return would have been reduced.
(g) The benefits derived from expense reductions had an impact of 0.01%.
(h) The benefits derived from expense reductions had an impact of less than 0.01%.
(i) Rounds to less than 0.01%.
See Accompanying Notes to Financial Statements.
73
Financial Highlights – Columbia Asset Allocation Fund
Selected data for a share outstanding throughout each period is as follows:
| | | Year Ended September 30, | |
| Class B Shares | | 2008 | | 2007 | | 2006 | | 2005 | | 2004 (a) | |
| Net Asset Value, Beginning of Period | | $ | 16.80 | | | $ | 16.06 | | | $ | 16.47 | | | $ | 15.06 | | | $ | 14.00 | | |
| Income from Investment Operations: | |
| Net investment income (b) | | | 0.20 | | | | 0.20 | | | | 0.17 | | | | 0.15 | (c) | | | 0.10 | | |
Net realized and unrealized gain (loss) on investments,
foreign currency transactions, futures contracts,
foreign capital gains tax and written options | | | (2.76 | ) | | | 1.86 | | | | 0.85 | | | | 1.41 | | | | 1.11 | | |
| Total from investment operations | | | (2.56 | ) | | | 2.06 | | | | 1.02 | | | | 1.56 | | | | 1.21 | | |
| Less Distributions to Shareholders: | |
| From net investment income | | | (0.23 | ) | | | (0.21 | ) | | | (0.19 | ) | | | (0.15 | ) | | | (0.15 | ) | |
| From net realized gains | | | (1.44 | ) | | | (1.11 | ) | | | (1.24 | ) | | | — | | | | — | | |
| Total distributions to shareholders | | | (1.67 | ) | | | (1.32 | ) | | | (1.43 | ) | | | (0.15 | ) | | | (0.15 | ) | |
| Net Asset Value, End of Period | | $ | 12.57 | | | $ | 16.80 | | | $ | 16.06 | | | $ | 16.47 | | | $ | 15.06 | | |
| Total return (d) | | | (16.88 | )% | | | 13.40 | % | | | 6.59 | %(e)(f) | | | 10.37 | %(f) | | | 8.68 | %(f) | |
| Ratios to Average Net Assets/Supplemental Data: | |
| Net expenses | | | 2.04 | %(g) | | | 2.07 | %(h) | | | 2.06 | %(h) | | | 2.10 | %(h) | | | 2.18 | %(h) | |
| Waiver/Reimbursement | | | — | | | | — | | | | 0.01 | % | | | 0.01 | % | | | — | %(i) | |
| Net investment income | | | 1.40 | %(g) | | | 1.21 | %(h) | | | 1.08 | %(h) | | | 0.91 | %(h) | | | 0.68 | %(h) | |
| Portfolio turnover rate | | | 94 | % | | | 100 | % | | | 98 | % | | | 86 | % | | | 75 | % | |
| Net assets, end of period (000's) | | $ | 4,699 | | | $ | 6,219 | | | $ | 6,788 | | | $ | 7,166 | | | $ | 4,926 | | |
(a) On October 13, 2003, the Liberty Asset Allocation Fund was renamed the Columbia Asset Allocation Fund.
(b) Per share data was calculated using the average shares outstanding during the period.
(c) Net investment income per share reflects a special dividend. The effect of this dividend amounted to $0.02 per share.
(d) Total return at net asset value assuming all distributions reinvested and no contingent deferred sales charge.
(e) Total return includes a voluntary reimbursement by the investment advisor for a realized investment loss due to a trading error. This reimbursement increased total return and net asset value by less than 0.01% and less than $0.01, respectively.
(f) Had the investment advisor and/or any of its affiliates not waived fees or reimbursed a portion of expenses, total return would have been reduced.
(g) The benefits derived from expense reductions had an impact of 0.01%.
(h) The benefits derived from expense reductions had an impact of less than 0.01%.
(i) Rounds to less than 0.01%.
See Accompanying Notes to Financial Statements.
74
Financial Highlights – Columbia Asset Allocation Fund
Selected data for a share outstanding throughout each period is as follows:
| | | Year Ended September 30, | |
| Class C Shares | | 2008 | | 2007 | | 2006 | | 2005 | | 2004 (a) | |
| Net Asset Value, Beginning of Period | | $ | 16.81 | | | $ | 16.06 | | | $ | 16.47 | | | $ | 15.06 | | | $ | 14.00 | | |
| Income from Investment Operations: | |
| Net investment income (b) | | | 0.21 | | | | 0.20 | | | | 0.16 | | | | 0.14 | (c) | | | 0.10 | | |
Net realized and unrealized gain (loss) on investments,
foreign currency transactions, futures contracts,
foreign capital gains tax and written options | | | (2.78 | ) | | | 1.87 | | | | 0.86 | | | | 1.42 | | | | 1.11 | | |
| Total from investment operations | | | (2.57 | ) | | | 2.07 | | | | 1.02 | | | | 1.56 | | | | 1.21 | | |
| Less Distributions to Shareholders: | |
| From net investment income | | | (0.23 | ) | | | (0.21 | ) | | | (0.19 | ) | | | (0.15 | ) | | | (0.15 | ) | |
| From net realized gains | | | (1.44 | ) | | | (1.11 | ) | | | (1.24 | ) | | | — | | | | — | | |
| Total distributions to shareholders | | | (1.67 | ) | | | (1.32 | ) | | | (1.43 | ) | | | (0.15 | ) | | | (0.15 | ) | |
| Net Asset Value, End of Period | | $ | 12.57 | | | $ | 16.81 | | | $ | 16.06 | | | $ | 16.47 | | | $ | 15.06 | | |
| Total return (d) | | | (16.93 | )% | | | 13.46 | % | | | 6.59 | %(e)(f) | | | 10.37 | %(f) | | | 8.67 | %(f) | |
| Ratios to Average Net Assets/Supplemental Data: | |
| Net expenses | | | 2.04 | %(g) | | | 2.07 | %(h) | | | 2.06 | %(h) | | | 2.10 | %(h) | | | 2.19 | %(h) | |
| Waiver/Reimbursement | | | — | | | | — | | | | 0.01 | % | | | 0.01 | % | | | — | %(i) | |
| Net investment income | | | 1.41 | %(g) | | | 1.23 | %(h) | | | 0.98 | %(h) | | | 0.91 | %(h) | | | 0.69 | %(h) | |
| Portfolio turnover rate | | | 94 | % | | | 100 | % | | | 98 | % | | | 86 | % | | | 75 | % | |
| Net assets, end of period (000's) | | $ | 1,496 | | | $ | 1,806 | | | $ | 1,281 | | | $ | 704 | | | $ | 514 | | |
(a) On October 13, 2003, the Liberty Asset Allocation Fund was renamed the Columbia Asset Allocation Fund.
(b) Per share data was calculated using the average shares outstanding during the period.
(c) Net investment income per share reflects a special dividend. The effect of this dividend amounted to $0.02 per share.
(d) Total return at net asset value assuming all distributions reinvested and no contingent deferred sales charge.
(e) Total return includes a voluntary reimbursement by the investment advisor for a realized investment loss due to a trading error. This reimbursement increased total return and net asset value by less than 0.01% and less than $0.01, respectively.
(f) Had the investment advisor and/or any of its affiliates not waived fees or reimbursed a portion of expenses, total return would have been reduced.
(g) The benefits derived from expense reductions had an impact of 0.01%.
(h) The benefits derived from expense reductions had an impact of less than 0.01%.
(i) Rounds to less than 0.01%.
See Accompanying Notes to Financial Statements.
75
Financial Highlights – Columbia Asset Allocation Fund
Selected data for a share outstanding throughout each period is as follows:
| | | Year Ended September 30, | |
| Class T Shares | | 2008 | | 2007 (a) | | 2006 | | 2005 | | 2004 (b) | |
| Net Asset Value, Beginning of Period | | $ | 16.82 | | | $ | 16.08 | | | $ | 16.48 | | | $ | 15.07 | | | $ | 14.01 | | |
| Income from Investment Operations: | |
| Net investment income (c) | | | 0.31 | | | | 0.31 | | | | 0.28 | | | | 0.26 | (d) | | | 0.21 | | |
Net realized and unrealized gain (loss) on investments,
foreign currency transactions, futures contracts,
foreign capital gains tax and written options | | | (2.78 | ) | | | 1.86 | | | | 0.87 | | | | 1.41 | | | | 1.11 | | |
| Total from investment operations | | | (2.47 | ) | | | 2.17 | | | | 1.15 | | | | 1.67 | | | | 1.32 | | |
| Less Distributions to Shareholders: | |
| From net investment income | | | (0.33 | ) | | | (0.32 | ) | | | (0.31 | ) | | | (0.26 | ) | | | (0.26 | ) | |
| From net realized gains | | | (1.44 | ) | | | (1.11 | ) | | | (1.24 | ) | | | — | | | | — | | |
| Total distributions to shareholders | | | (1.77 | ) | | | (1.43 | ) | | | (1.55 | ) | | | (0.26 | ) | | | (0.26 | ) | |
| Net Asset Value, End of Period | | $ | 12.58 | | | $ | 16.82 | | | $ | 16.08 | | | $ | 16.48 | | | $ | 15.07 | | |
| Total return (e) | | | (16.32 | )% | | | 14.17 | % | | | 7.39 | %(f)(g) | | | 11.14 | %(g) | | | 9.47 | %(g) | |
| Ratios to Average Net Assets/Supplemental Data: | |
| Net expenses | | | 1.34 | %(h) | | | 1.37 | %(i) | | | 1.36 | %(i) | | | 1.40 | %(i) | | | 1.49 | %(i) | |
| Waiver/Reimbursement | | | — | | | | — | | | | 0.01 | % | | | 0.01 | % | | | — | %(j) | |
| Net investment income | | | 2.10 | %(h) | | | 1.92 | %(i) | | | 1.78 | %(i) | | | 1.62 | %(i) | | | 1.37 | %(i) | |
| Portfolio turnover rate | | | 94 | % | | | 100 | % | | | 98 | % | | | 86 | % | | | 75 | % | |
| Net assets, end of period (000's) | | $ | 130,863 | | | $ | 180,757 | | | $ | 175,348 | | | $ | 184,795 | | | $ | 183,438 | | |
(a) On August 8, 2007, the Class G shares were exchanged for Class T shares.
(b) On October 13, 2003, the Liberty Asset Allocation Fund was renamed the Columbia Asset Allocation Fund.
(c) Per share data was calculated using the average shares outstanding during the period.
(d) Net investment income per share reflects a special dividend. The effect of this dividend amounted to $0.02 per share.
(e) Total return at net asset value assuming all distributions reinvested and no initial sales charge or contingent deferred sales charge.
(f) Total return includes a voluntary reimbursement by the investment advisor for a realized investment loss due to a trading error. This reimbursement increased total return and net asset value by less than 0.01% and less than $0.01, respectively.
(g) Had the investment advisor and/or any of its affiliates not waived fees or reimbursed a portion of expenses, total return would have been reduced.
(h) The benefits derived from expense reductions had an impact of 0.01%.
(i) The benefits derived from expense reductions had an impact of less than 0.01%.
(j) Rounds to less than 0.01%.
See Accompanying Notes to Financial Statements.
76
Financial Highlights – Columbia Asset Allocation Fund
Selected data for a share outstanding throughout each period is as follows:
| | | Year Ended September 30, | |
| Class Z Shares | | 2008 | | 2007 | | 2006 | | 2005 | | 2004 (a) | |
| Net Asset Value, Beginning of Period | | $ | 16.82 | | | $ | 16.07 | | | $ | 16.48 | | | $ | 15.06 | | | $ | 14.01 | | |
| Income from Investment Operations: | |
| Net investment income (b) | | | 0.35 | | | | 0.36 | | | | 0.33 | | | | 0.31 | (c) | | | 0.25 | | |
Net realized and unrealized gain (loss) on investments,
foreign currency transactions, futures contracts,
foreign capital gains tax and written options | | | (2.77 | ) | | | 1.87 | | | | 0.85 | | | | 1.42 | | | | 1.11 | | |
| Total from investment operations | | | (2.42 | ) | | | 2.23 | | | | 1.18 | | | | 1.73 | | | | 1.36 | | |
| Less Distributions to Shareholders: | |
| From net investment income | | | (0.38 | ) | | | (0.37 | ) | | | (0.35 | ) | | | (0.31 | ) | | | (0.31 | ) | |
| From net realized gains | | | (1.44 | ) | | | (1.11 | ) | | | (1.24 | ) | | | — | | | | — | | |
| Total distributions to shareholders | | | (1.82 | ) | | | (1.48 | ) | | | (1.59 | ) | | | (0.31 | ) | | | (0.31 | ) | |
| Net Asset Value, End of Period | | $ | 12.58 | | | $ | 16.82 | | | $ | 16.07 | | | $ | 16.48 | | | $ | 15.06 | | |
| Total return (d) | | | (16.06 | )% | | | 14.58 | % | | | 7.65 | %(e)(f) | | | 11.54 | %(f) | | | 9.75 | %(f) | |
| Ratios to Average Net Assets/Supplemental Data: | |
| Net expenses | | | 1.04 | %(g) | | | 1.07 | %(h) | | | 1.06 | %(h) | | | 1.10 | %(h) | | | 1.19 | %(h) | |
| Waiver/Reimbursement | | | — | | | | — | | | | 0.01 | % | | | 0.01 | % | | | — | %(i) | |
| Net investment income | | | 2.40 | %(g) | | | 2.21 | %(h) | | | 2.09 | %(h) | | | 1.92 | %(h) | | | 1.67 | %(h) | |
| Portfolio turnover rate | | | 94 | % | | | 100 | % | | | 98 | % | | | 86 | % | | | 75 | % | |
| Net assets, end of period (000's) | | $ | 107,424 | | | $ | 144,513 | | | $ | 151,703 | | | $ | 167,278 | | | $ | 191,556 | | |
(a) On October 13, 2003, the Liberty Asset Allocation Fund was renamed the Columbia Asset Allocation Fund.
(b) Per share data was calculated using the average shares outstanding during the period.
(c) Net investment income per share reflects a special dividend. The effect of this dividend amounted to $0.02 per share.
(d) Total return at net asset value assuming all distributions reinvested.
(e) Total return includes a voluntary reimbursement by the investment advisor for a realized investment loss due to a trading error. This reimbursement increased total return and net asset value by less than 0.01% and less than $0.01, respectively.
(f) Had the investment advisor and/or any of its affiliates not waived fees or reimbursed a portion of expenses, total return would have been reduced.
(g) The benefits derived from expense reductions had an impact of 0.01%.
(h) The benefits derived from expense reductions had an impact of less than 0.01%.
(i) Rounds to less than 0.01%.
See Accompanying Notes to Financial Statements.
77
Financial Highlights – Columbia Large Cap Growth Fund
Selected data for a share outstanding throughout each period is as follows:
| | | Year Ended September 30, | |
| Class A Shares | | 2008 | | 2007 | | 2006 | | 2005 | | 2004 (a) | |
| Net Asset Value, Beginning of Period | | $ | 26.76 | | | $ | 22.27 | | | $ | 21.11 | | | $ | 18.57 | | | $ | 17.59 | | |
| Income from Investment Operations: | |
| Net investment income (loss) (b) | | | 0.01 | | | | 0.02 | | | | 0.01 | | | | 0.05 | (c) | | | (0.08 | ) | |
| Net realized and unrealized gain (loss) on investments | | | (5.40 | ) | | | 4.87 | | | | 1.19 | | | | 2.51 | | | | 1.06 | | |
| Total from investment operations | | | (5.39 | ) | | | 4.89 | | | | 1.20 | | | | 2.56 | | | | 0.98 | | |
| Less Distributions to Shareholders: | |
| From net investment income | | | — | | | | (0.03 | ) | | | (0.04 | ) | | | (0.02 | ) | | | — | | |
| From net realized gains | | | (1.81 | ) | | | (0.37 | ) | | | — | | | | — | | | | — | | |
| Total distributions to shareholders | | | (1.81 | ) | | | (0.40 | ) | | | (0.04 | ) | | | (0.02 | ) | | | — | | |
| Increase from regulatory settlements | | | 0.01 | | | | — | | | | — | | | | — | | | | — | | |
| Net Asset Value, End of Period | | $ | 19.57 | | | $ | 26.76 | | | $ | 22.27 | | | $ | 21.11 | | | $ | 18.57 | | |
| Total return (d) | | | (21.73 | )% | | | 22.19 | % | | | 5.69 | %(e) | | | 13.80 | %(e) | | | 5.57 | %(e) | |
| Ratios to Average Net Assets/Supplemental Data: | |
| Net expenses before interest expense | | | 1.02 | %(f) | | | 1.00 | %(g) | | | 1.01 | %(g) | | | 1.11 | %(g) | | | 1.28 | %(g) | |
| Interest expense | | | — | | | | — | %(h) | | | — | %(h) | | | — | | | | — | | |
| Net expenses | | | 1.02 | %(f) | | | 1.00 | %(g) | | | 1.01 | %(g) | | | 1.11 | %(g) | | | 1.28 | %(g) | |
| Waiver/Reimbursement | | | — | | | | — | | | | — | %(h) | | | — | %(h) | | | — | %(h) | |
| Net investment income (loss) | | | 0.01 | %(f) | | | 0.07 | %(g) | | | 0.07 | %(g) | | | 0.25 | %(g) | | | (0.40 | )%(g) | |
| Portfolio turnover rate | | | 164 | % | | | 151 | % | | | 171 | % | | | 113 | % | | | 126 | % | |
| Net assets, end of period (000's) | | $ | 156,585 | | | $ | 167,408 | | | $ | 125,124 | | | $ | 10,422 | | | $ | 3,867 | | |
(a) On October 13, 2003, the Liberty Equity Growth Fund was renamed the Columbia Large Cap Growth Fund.
(b) Per share data was calculated using the average shares outstanding during the period.
(c) Net investment income per share reflects a special dividend. The effect of this dividend amounted to $0.09 per share.
(d) Total return at net asset value assuming all distributions reinvested and no initial sales charge or contingent deferred sales charge.
(e) Had the investment advisor and/or any of its affiliates not waived fees or reimbursed a portion of expenses, total return would have been reduced.
(f) The benefits derived from expense reductions had an impact of 0.01%.
(g) The benefits derived from expense reductions had an impact of less than 0.01%.
(h) Rounds to less than 0.01%.
See Accompanying Notes to Financial Statements.
78
Financial Highlights – Columbia Large Cap Growth Fund
Selected data for a share outstanding throughout each period is as follows:
| | | Year Ended September 30, | |
| Class B Shares | | 2008 | | 2007 | | 2006 | | 2005 | | 2004 (a) | |
| Net Asset Value, Beginning of Period | | $ | 25.12 | | | $ | 21.05 | | | $ | 20.07 | | | $ | 17.76 | | | $ | 16.96 | | |
| Income from Investment Operations: | |
| Net investment loss (b) | | | (0.17 | ) | | | (0.16 | ) | | | (0.13 | ) | | | (0.09 | )(c) | | | (0.21 | ) | |
| Net realized and unrealized gain (loss) on investments | | | (5.00 | ) | | | 4.60 | | | | 1.11 | | | | 2.40 | | | | 1.01 | | |
| Total from investment operations | | | (5.17 | ) | | | 4.44 | | | | 0.98 | | | | 2.31 | | | | 0.80 | | |
| Less Distributions to Shareholders: | |
| From net realized gains | | | (1.81 | ) | | | (0.37 | ) | | | — | | | | — | | | | — | | |
| Increase from regulatory settlements | | | 0.01 | | | | — | | | | — | | | | — | | | | — | | |
| Net Asset Value, End of Period | | $ | 18.15 | | | $ | 25.12 | | | $ | 21.05 | | | $ | 20.07 | | | $ | 17.76 | | |
| Total return (d) | | | (22.31 | )% | | | 21.31 | % | | | 4.88 | %(e) | | | 13.01 | %(e) | | | 4.72 | %(e) | |
| Ratios to Average Net Assets/Supplemental Data: | |
| Net expenses before interest expense | | | 1.77 | %(f) | | | 1.75 | %(g) | | | 1.76 | %(g) | | | 1.86 | %(g) | | | 2.03 | %(g) | |
| Interest expense | | | — | | | | — | %(h) | | | — | %(h) | | | — | | | | — | | |
| Net expenses | | | 1.77 | %(f) | | | 1.75 | %(g) | | | 1.76 | %(g) | | | 1.86 | %(g) | | | 2.03 | %(g) | |
| Waiver/Reimbursement | | | — | | | | — | | | | — | %(h) | | | — | %(h) | | | — | %(h) | |
| Net investment loss | | | (0.77 | )%(f) | | | (0.69 | )%(g) | | | (0.72 | )%(g) | | | (0.48 | )%(g) | | | (1.15 | )%(g) | |
| Portfolio turnover rate | | | 164 | % | | | 151 | % | | | 171 | % | | | 113 | % | | | 126 | % | |
| Net assets, end of period (000's) | | $ | 58,609 | | | $ | 168,284 | | | $ | 227,160 | | | $ | 7,799 | | | $ | 3,195 | | |
(a) On October 13, 2003, the Liberty Equity Growth Fund was renamed the Columbia Large Cap Growth Fund.
(b) Per share data was calculated using the average shares outstanding during the period.
(c) Net investment loss per share reflects a special dividend. The effect of this dividend amounted to $0.09 per share.
(d) Total return at net asset value assuming all distributions reinvested and no contingent deferred sales charge.
(e) Had the investment advisor and/or any of its affiliates not waived fees or reimbursed a portion of expenses, total return would have been reduced.
(f) The benefits derived from expense reductions had an impact of 0.01%.
(g) The benefits derived from expense reductions had an impact of less than 0.01%.
(h) Rounds to less than 0.01%.
See Accompanying Notes to Financial Statements.
79
Financial Highlights – Columbia Large Cap Growth Fund
Selected data for a share outstanding throughout each period is as follows:
| | | Year Ended September 30, | |
| Class C Shares | | 2008 | | 2007 | | 2006 | | 2005 | | 2004 (a) | |
| Net Asset Value, Beginning of Period | | $ | 25.14 | | | $ | 21.06 | | | $ | 20.10 | | | $ | 17.79 | | | $ | 16.98 | | |
| Income from Investment Operations: | |
| Net investment loss (b) | | | (0.16 | ) | | | (0.16 | ) | | | (0.13 | ) | | | (0.09 | )(c) | | | (0.21 | ) | |
| Net realized and unrealized gain (loss) on investments | | | (5.02 | ) | | | 4.61 | | | | 1.09 | | | | 2.40 | | | | 1.02 | | |
| Total from investment operations | | | (5.18 | ) | | | 4.45 | | | | 0.96 | | | | 2.31 | | | | 0.81 | | |
| Less Distributions to Shareholders: | |
| From net realized gains | | | (1.81 | ) | | | (0.37 | ) | | | — | | | | — | | | | — | | |
| Increase from regulatory settlements | | | 0.01 | | | | — | | | | — | | | | — | | | | — | | |
| Net Asset Value, End of Period | | $ | 18.16 | | | $ | 25.14 | | | $ | 21.06 | | | $ | 20.10 | | | $ | 17.79 | | |
| Total return (d) | | | (22.33 | )% | | | 21.34 | % | | | 4.78 | %(e) | | | 12.98 | %(e) | | | 4.77 | %(e) | |
| Ratios to Average Net Assets/Supplemental Data: | |
| Net expenses before interest expense | | | 1.77 | %(f) | | | 1.75 | %(g) | | | 1.76 | %(g) | | | 1.86 | %(g) | | | 2.03 | %(g) | |
| Interest expense | | | — | | | | — | %(h) | | | — | %(h) | | | — | | | | — | | |
| Net expenses | | | 1.77 | %(f) | | | 1.75 | %(g) | | | 1.76 | %(g) | | | 1.86 | %(g) | | | 2.03 | %(g) | |
| Waiver/Reimbursement | | | — | | | | — | | | | — | %(h) | | | — | %(h) | | | — | %(h) | |
| Net investment loss | | | (0.75 | )%(f) | | | (0.68 | )%(g) | | | (0.69 | )%(g) | | | (0.45 | )%(g) | | | (1.15 | )%(g) | |
| Portfolio turnover rate | | | 164 | % | | | 151 | % | | | 171 | % | | | 113 | % | | | 126 | % | |
| Net assets, end of period (000's) | | $ | 21,208 | | | $ | 31,834 | | | $ | 31,046 | | | $ | 1,419 | | | $ | 780 | | |
(a) On October 13, 2003, the Liberty Equity Growth Fund was renamed the Columbia Large Cap Growth Fund.
(b) Per share data was calculated using the average shares outstanding during the period.
(c) Net investment loss per share reflects a special dividend. The effect of this dividend amounted to $0.09 per share.
(d) Total return at net asset value assuming all distributions reinvested and no contingent deferred sales charge.
(e) Had the investment advisor and/or any of its affiliates not waived fees or reimbursed a portion of expenses, total return would have been reduced.
(f) The benefits derived from expense reductions had an impact of 0.01%.
(g) The benefits derived from expense reductions had an impact of less than 0.01%.
(h) Rounds to less than 0.01%.
See Accompanying Notes to Financial Statements.
80
Financial Highlights – Columbia Large Cap Growth Fund
Selected data for a share outstanding throughout each period is as follows:
| | | Year Ended September 30, | | Period Ended
September 30, | |
| Class E Shares | | 2008 | | 2007 | | 2006 (a) | |
| Net Asset Value, Beginning of Period | | $ | 26.74 | | | $ | 22.27 | | | $ | 22.13 | | |
| Income from Investment Operations: | |
| Net investment loss (b) | | | (0.02 | ) | | | (0.01 | ) | | | — | (c) | |
| Net realized and unrealized gain (loss) on investments | | | (5.39 | ) | | | 4.87 | | | | 0.14 | | |
| Total from investment operations | | | (5.41 | ) | | | 4.86 | | | | 0.14 | | |
| Less Distributions to Shareholders: | |
| From net investment income | | | — | | | | (0.02 | ) | | | — | | |
| From net realized gains | | | (1.81 | ) | | | (0.37 | ) | | | — | | |
| Total distributions to shareholders | | | (1.81 | ) | | | (0.39 | ) | | | — | | |
| Increase from regulatory settlements | | | 0.01 | | | | — | | | | — | | |
| Net Asset Value, End of Period | | $ | 19.53 | | | $ | 26.74 | | | $ | 22.27 | | |
| Total return (d) | | | (21.82 | )% | | | 22.07 | % | | | 0.63 | %(e)(f) | |
| Ratios to Average Net Assets/Supplemental Data: | |
| Net expenses before interest expense | | | 1.12 | %(g) | | | 1.10 | %(i) | | | 1.12 | %(h)(i) | |
| Interest expense | | | — | | | | — | %(j) | | | — | %(h)(j) | |
| Net expenses | | | 1.12 | %(g) | | | 1.10 | %(i) | | | 1.12 | %(h)(i) | |
| Waiver/Reimbursement | | | — | | | | — | | | | — | | |
| Net investment loss | | | (0.09 | )%(g) | | | (0.03 | )%(i) | | | (0.23 | )%(h)(i) | |
| Portfolio turnover rate | | | 164 | % | | | 151 | % | | | 171 | %(f) | |
| Net assets, end of period (000's) | | $ | 14,782 | | | $ | 18,185 | | | $ | 13,071 | | |
(a) Class E shares commenced operations on September 22, 2006. Per share data and total return reflect activity from that date.
(b) Per share data was calculated using the average shares outstanding during the period.
(c) Rounds to less than $0.01 per share.
(d) Total return at net asset value assuming all distributions reinvested and no contingent deferred sales charge.
(e) Had the investment advisor and/or any of its affiliates not waived fees or reimbursed a portion of expenses, total return would have been reduced.
(f) Not annualized.
(g) The benefits derived from expense reductions had an impact of 0.01%.
(h) Annualized.
(i) The benefits derived from expense reductions had an impact of less than 0.01%.
(j) Rounds to less than 0.01%.
See Accompanying Notes to Financial Statements.
81
Financial Highlights – Columbia Large Cap Growth Fund
Selected data for a share outstanding throughout each period is as follows:
| | | Year Ended September 30, | | Period Ended
September 30, | |
| Class F Shares | | 2008 | | 2007 | | 2006 (a) | |
| Net Asset Value, Beginning of Period | | $ | 25.11 | | | $ | 21.05 | | | $ | 20.93 | | |
| Income from Investment Operations: | |
| Net investment loss (b) | | | (0.18 | ) | | | (0.16 | ) | | | — | (c) | |
| Net realized and unrealized gain (loss) on investments | | | (4.99 | ) | | | 4.59 | | | | 0.12 | | |
| Total from investment operations | | | (5.17 | ) | | | 4.43 | | | | 0.12 | | |
| Less Distributions to Shareholders: | |
| From net realized gains | | | (1.81 | ) | | | (0.37 | ) | | | — | | |
| Increase from regulatory settlements | | | 0.01 | | | | — | | | | — | | |
| Net Asset Value, End of Period | | $ | 18.14 | | | $ | 25.11 | | | $ | 21.05 | | |
| Total return (d) | | | (22.31 | )% | | | 21.26 | % | | | 0.57 | %(e)(f) | |
| Ratios to Average Net Assets/Supplemental Data: | |
| Net expenses before interest expense | | | 1.77 | %(g) | | | 1.75 | %(i) | | | 1.77 | %(h)(i) | |
| Interest expense | | | — | | | | — | %(j) | | | — | %(h)(j) | |
| Net expenses | | | 1.77 | %(g) | | | 1.75 | %(i) | | | 1.77 | %(h)(i) | |
| Waiver/Reimbursement | | | — | | | | — | | | | — | | |
| Net investment loss | | | (0.80 | )%(g) | | | (0.70 | )%(i) | | | (0.88 | )%(h)(i) | |
| Portfolio turnover rate | | | 164 | % | | | 151 | % | | | 171 | %(f) | |
| Net assets, end of period (000's) | | $ | 380 | | | $ | 2,915 | | | $ | 5,319 | | |
(a) Class F shares commenced operations on September 22, 2006. Per share data and total return reflect activity from that date.
(b) Per share data was calculated using the average shares outstanding during the period.
(c) Rounds to less than $0.01 per share.
(d) Total return at net asset value assuming all distributions reinvested and no contingent deferred sales charge.
(e) Had the investment advisor and/or any of its affiliates not waived fees or reimbursed a portion of expenses, total return would have been reduced.
(f) Not annualized.
(g) The benefits derived from expense reductions had an impact of 0.01%.
(h) Annualized.
(i) The benefits derived from expense reductions had an impact of less than 0.01%.
(j) Rounds to less than 0.01%.
See Accompanying Notes to Financial Statements.
82
Financial Highlights – Columbia Large Cap Growth Fund
Selected data for a share outstanding throughout each period is as follows:
| | | Year Ended September 30, | |
| Class T Shares | | 2008 | | 2007 (a) | | 2006 | | 2005 | | 2004 (b) | |
| Net Asset Value, Beginning of Period | | $ | 26.58 | | | $ | 22.13 | | | $ | 20.98 | | | $ | 18.46 | | | $ | 17.50 | | |
| Income from Investment Operations: | |
| Net investment income (loss) (c) | | | (0.01 | ) | | | 0.01 | | | | 0.01 | | | | 0.07 | (d) | | | (0.09 | ) | |
| Net realized and unrealized gain (loss) on investments | | | (5.35 | ) | | | 4.84 | | | | 1.17 | | | | 2.47 | | | | 1.05 | | |
| Total from investment operations | | | (5.36 | ) | | | 4.85 | | | | 1.18 | | | | 2.54 | | | | 0.96 | | |
| Less Distributions to Shareholders: | |
| From net investment income | | | — | | | | (0.03 | ) | | | (0.03 | ) | | | (0.02 | ) | | | — | | |
| From net realized gains | | | (1.81 | ) | | | (0.37 | ) | | | — | | | | — | | | | — | | |
| Total distributions to shareholders | | | (1.81 | ) | | | (0.40 | ) | | | (0.03 | ) | | | (0.02 | ) | | | — | | |
| Increase from regulatory settlements | | | 0.01 | | | | — | | | | — | | | | — | | | | — | | |
| Net Asset Value, End of Period | | $ | 19.42 | | | $ | 26.58 | | | $ | 22.13 | | | $ | 20.98 | | | $ | 18.46 | | |
| Total return (e) | | | (21.76 | )% | | | 22.14 | % | | | 5.63 | %(f) | | | 13.76 | %(f) | | | 5.49 | %(f) | |
| Ratios to Average Net Assets/Supplemental Data: | |
| Net expenses before interest expense | | | 1.07 | %(g) | | | 1.05 | %(h) | | | 1.06 | %(h) | | | 1.16 | %(h) | | | 1.35 | %(h) | |
| Interest expense | | | — | | | | — | %(i) | | | — | %(i) | | | — | | | | — | | |
| Net expenses | | | 1.07 | %(g) | | | 1.05 | %(h) | | | 1.06 | %(h) | | | 1.16 | %(h) | | | 1.35 | %(h) | |
| Waiver/Reimbursement | | | — | | | | — | | | | — | %(i) | | | — | %(i) | | | — | %(i) | |
| Net investment income (loss) | | | (0.05 | )%(g) | | | 0.02 | %(h) | | | 0.06 | %(h) | | | 0.33 | %(h) | | | (0.47 | )%(h) | |
| Portfolio turnover rate | | | 164 | % | | | 151 | % | | | 171 | % | | | 113 | % | | | 126 | % | |
| Net assets, end of period (000's) | | $ | 169,295 | | | $ | 244,901 | | | $ | 209,952 | | | $ | 218,095 | | | $ | 219,129 | | |
(a) On August 8, 2007, Class G shares were converted to Class T shares.
(b) On October 13, 2003, the Liberty Equity Growth Fund was renamed the Columbia Large Cap Growth Fund.
(c) Per share data was calculated using the average shares outstanding during the period.
(d) Net investment income per share reflects a special dividend. The effect of this dividend amounted to $0.09 per share.
(e) Total return at net asset value assuming all distributions reinvested and no initial sales charge or contingent deferred sales charge.
(f) Had the investment advisor and/or any of its affiliates not waived fees or reimbursed a portion of expenses, total return would have been reduced.
(g) The benefits derived from expense reductions had an impact of 0.01%.
(h) The benefits derived from expense reductions had an impact of less than 0.01%.
(i) Rounds to less than 0.01%.
See Accompanying Notes to Financial Statements.
83
Financial Highlights – Columbia Large Cap Growth Fund
Selected data for a share outstanding throughout each period is as follows:
| | | Year Ended September 30, | |
| Class Z Shares | | 2008 | | 2007 | | 2006 | | 2005 | | 2004 (a) | |
| Net Asset Value, Beginning of Period | | $ | 27.32 | | | $ | 22.68 | | | $ | 21.50 | | | $ | 18.87 | | | $ | 17.84 | | |
| Income from Investment Operations: | |
| Net investment income (loss) (b) | | | 0.06 | | | | 0.08 | | | | 0.08 | | | | 0.11 | (c) | | | (0.03 | ) | |
| Net realized and unrealized gain (loss) on investments | | | (5.51 | ) | | | 4.97 | | | | 1.19 | | | | 2.55 | | | | 1.07 | | |
| Total from investment operations | | | (5.45 | ) | | | 5.05 | | | | 1.27 | | | | 2.66 | | | | 1.04 | | |
| Less Distributions to Shareholders: | |
| From net investment income | | | (0.05 | ) | | | (0.04 | ) | | | (0.09 | ) | | | (0.03 | ) | | | (0.01 | ) | |
| From net realized gains | | | (1.81 | ) | | | (0.37 | ) | | | — | | | | — | | | | — | | |
| Total distributions to shareholders | | | (1.86 | ) | | | (0.41 | ) | | | (0.09 | ) | | | (0.03 | ) | | | (0.01 | ) | |
| Increase from regulatory settlements | | | 0.01 | | | | — | | | | — | | | | — | | | | — | | |
| Net Asset Value, End of Period | | $ | 20.02 | | | $ | 27.32 | | | $ | 22.68 | | | $ | 21.50 | | | $ | 18.87 | | |
| Total return (d) | | | (21.55 | )% | | | 22.53 | % | | | 5.92 | %(e) | | | 14.12 | %(e) | | | 5.83 | %(e) | |
| Ratios to Average Net Assets/Supplemental Data: | |
| Net expenses before interest expense | | | 0.77 | %(f) | | | 0.75 | %(g) | | | 0.76 | %(g) | | | 0.86 | %(g) | | | 1.03 | %(g) | |
| Interest expense | | | — | | | | — | %(h) | | | — | %(h) | | | — | | | | — | | |
| Net expenses | | | 0.77 | %(f) | | | 0.75 | %(g) | | | 0.76 | %(g) | | | 0.86 | %(g) | | | 1.03 | %(g) | |
| Waiver/Reimbursement | | | — | | | | — | | | | — | %(h) | | | — | %(h) | | | — | %(h) | |
| Net investment income (loss) | | | 0.25 | %(f) | | | 0.32 | %(g) | | | 0.35 | %(g) | | | 0.53 | %(g) | | | (0.15 | )%(g) | |
| Portfolio turnover rate | | | 164 | % | | | 151 | % | | | 171 | % | | | 113 | % | | | 126 | % | |
| Net assets, end of period (000's) | | $ | 979,353 | | | $ | 1,302,932 | | | $ | 1,169,103 | | | $ | 1,242,736 | | | $ | 634,710 | | |
(a) On October 13, 2003, the Liberty Equity Growth Fund was renamed the Columbia Large Cap Growth Fund.
(b) Per share data was calculated using the average shares outstanding during the period.
(c) Net investment income per share reflects a special dividend. The effect of this dividend amounted to $0.09 per share.
(d) Total return at net asset value assuming all distributions reinvested.
(e) Had the investment advisor and/or any of its affiliates not waived fees or reimbursed a portion of expenses, total return would have been reduced.
(f) The benefits derived from expense reductions had an impact of 0.01%.
(g) The benefits derived from expense reductions had an impact of less than 0.01%.
(h) Rounds to less than 0.01%.
See Accompanying Notes to Financial Statements.
84
Financial Highlights – Columbia Disciplined Value Fund
Selected data for a share outstanding throughout each period is as follows:
| | | Year Ended September 30, | |
| Class A Shares | | 2008 | | 2007 | | 2006 | | 2005 | | 2004 (a) | |
| Net Asset Value, Beginning of Period | | $ | 16.32 | | | $ | 15.70 | | | $ | 14.60 | | | $ | 12.71 | | | $ | 11.02 | | |
| Income from Investment Operations: | |
| Net investment income (b) | | | 0.17 | | | | 0.14 | | | | 0.17 | | | | 0.17 | (c) | | | 0.17 | | |
Net realized and unrealized gain (loss)
on investments and futures contracts | | | (3.96 | ) | | | 2.10 | | | | 2.18 | | | | 1.88 | | | | 1.75 | | |
| Total from investment operations | | | (3.79 | ) | | | 2.24 | | | | 2.35 | | | | 2.05 | | | | 1.92 | | |
| Less Distributions to Shareholders: | |
| From net investment income | | | (0.17 | ) | | | (0.16 | ) | | | (0.18 | ) | | | (0.16 | ) | | | (0.23 | ) | |
| From net realized gains | | | (1.83 | ) | | | (1.46 | ) | | | (1.07 | ) | | | — | | | | — | | |
| Total distributions to shareholders | | | (2.00 | ) | | | (1.62 | ) | | | (1.25 | ) | | | (0.16 | ) | | | (0.23 | ) | |
| Net Asset Value, End of Period | | $ | 10.53 | | | $ | 16.32 | | | $ | 15.70 | | | $ | 14.60 | | | $ | 12.71 | | |
| Total return (d) | | | (26.09 | )% | | | 15.00 | % | | | 17.19 | %(e) | | | 16.21 | %(e) | | | 17.53 | % | |
| Ratios to Average Net Assets/Supplemental Data: | |
| Net expenses before interest expense (f) | | | 1.28 | % | | | 1.24 | % | | | 1.21 | % | | | 1.23 | % | | | 1.31 | % | |
| Interest expense | | | — | %(g) | | | — | | | | — | %(g) | | | — | | | | — | | |
| Net expenses (f) | | | 1.28 | % | | | 1.24 | % | | | 1.21 | % | | | 1.23 | % | | | 1.31 | % | |
| Waiver/Reimbursement | | | — | | | | — | | | | — | %(g) | | | 0.01 | % | | | — | | |
| Net investment income (f) | | | 1.32 | % | | | 0.89 | % | | | 1.15 | % | | | 1.21 | % | | | 1.34 | % | |
| Portfolio turnover rate | | | 78 | % | | | 91 | % | | | 81 | % | | | 94 | % | | | 101 | % | |
| Net assets, end of period (000's) | | $ | 16,171 | | | $ | 34,706 | | | $ | 12,717 | | | $ | 4,269 | | | $ | 2,511 | | |
(a) On October 13, 2003, the Liberty Equity Value Fund was renamed the Columbia Disciplined Value Fund.
(b) Per share data was calculated using the average shares outstanding during the period.
(c) Net investment income per share reflects a special dividend. The effect of this dividend amounted to $0.02 per share.
(d) Total return at net asset value assuming all distributions reinvested and no initial sales charge or contingent deferred sales charge.
(e) Had the investment advisor and/or any of its affiliates not waived fees or reimbursed a portion of expenses, total return would have been reduced.
(f) The benefits derived from expense reductions had an impact of less than 0.01%.
(g) Rounds to less than 0.01%.
See Accompanying Notes to Financial Statements.
85
Financial Highlights – Columbia Disciplined Value Fund
Selected data for a share outstanding throughout each period is as follows:
| | | Year Ended September 30, | |
| Class B Shares | | 2008 | | 2007 | | 2006 | | 2005 | | 2004 (a) | |
| Net Asset Value, Beginning of Period | | $ | 15.47 | | | $ | 14.96 | | | $ | 13.96 | | | $ | 12.16 | | | $ | 10.49 | | |
| Income from Investment Operations: | |
| Net investment income (b) | | | 0.07 | | | | 0.03 | | | | 0.06 | | | | 0.06 | (c) | | | 0.07 | | |
Net realized and unrealized gain (loss)
on investments and futures contracts | | | (3.72 | ) | | | 1.98 | | | | 2.08 | | | | 1.80 | | | | 1.67 | | |
| Total from investment operations | | | (3.65 | ) | | | 2.01 | | | | 2.14 | | | | 1.86 | | | | 1.74 | | |
| Less Distributions to Shareholders: | |
| From net investment income | | | (0.07 | ) | | | (0.04 | ) | | | (0.07 | ) | | | (0.06 | ) | | | (0.07 | ) | |
| From net realized gains | | | (1.83 | ) | | | (1.46 | ) | | | (1.07 | ) | | | — | | | | — | | |
| Total distributions to shareholders | | | (1.90 | ) | | | (1.50 | ) | | | (1.14 | ) | | | (0.06 | ) | | | (0.07 | ) | |
| Net Asset Value, End of Period | | $ | 9.92 | | | $ | 15.47 | | | $ | 14.96 | | | $ | 13.96 | | | $ | 12.16 | | |
| Total return (d) | | | (26.59 | )% | | | 14.12 | % | | | 16.35 | %(e) | | | 15.30 | %(e) | | | 16.64 | % | |
| Ratios to Average Net Assets/Supplemental Data: | |
| Net expenses before interest expense (f) | | | 2.03 | % | | | 1.99 | % | | | 1.96 | % | | | 1.98 | % | | | 2.06 | % | |
| Interest expense | | | — | %(g) | | | — | | | | — | %(g) | | | — | | | | — | | |
| Net expenses (f) | | | 2.03 | % | | | 1.99 | % | | | 1.96 | % | | | 1.98 | % | | | 2.06 | % | |
| Waiver/Reimbursement | | | — | | | | — | | | | — | %(g) | | | 0.01 | % | | | — | | |
| Net investment income (f) | | | 0.56 | % | | | 0.19 | % | | | 0.43 | % | | | 0.46 | % | | | 0.60 | % | |
| Portfolio turnover rate | | | 78 | % | | | 91 | % | | | 81 | % | | | 94 | % | | | 101 | % | |
| Net assets, end of period (000's) | | $ | 3,914 | | | $ | 7,690 | | | $ | 5,332 | | | $ | 3,974 | | | $ | 2,370 | | |
(a) On October 13, 2003, the Liberty Equity Value Fund was renamed the Columbia Disciplined Value Fund.
(b) Per share data was calculated using the average shares outstanding during the period.
(c) Net investment income per share reflects a special dividend. The effect of this dividend amounted to $0.02 per share.
(d) Total return at net asset value assuming all distributions reinvested and no contingent deferred sales charge.
(e) Had the investment advisor and/or any of its affiliates not waived fees or reimbursed a portion of expenses, total return would have been reduced.
(f) The benefits derived from expense reductions had an impact of less than 0.01%.
(g) Rounds to less than 0.01%.
See Accompanying Notes to Financial Statements.
86
Financial Highlights – Columbia Disciplined Value Fund
Selected data for a share outstanding throughout each period is as follows:
| | | Year Ended September 30, | |
| Class C Shares | | 2008 | | 2007 | | 2006 | | 2005 | | 2004 (a) | |
| Net Asset Value, Beginning of Period | | $ | 15.44 | | | $ | 14.93 | | | $ | 13.94 | | | $ | 12.14 | | | $ | 10.47 | | |
| Income from Investment Operations: | |
| Net investment income (b) | | | 0.07 | | | | 0.02 | | | | 0.05 | | | | 0.06 | (c) | | | 0.07 | | |
Net realized and unrealized gain (loss)
on investments and futures contracts | | | (3.72 | ) | | | 1.99 | | | | 2.08 | | | | 1.80 | | | | 1.67 | | |
| Total from investment operations | | | (3.65 | ) | | | 2.01 | | | | 2.13 | | | | 1.86 | | | | 1.74 | | |
| Less Distributions to Shareholders: | |
| From net investment income | | | (0.07 | ) | | | (0.04 | ) | | | (0.07 | ) | | | (0.06 | ) | | | (0.07 | ) | |
| From net realized gains | | | (1.83 | ) | | | (1.46 | ) | | | (1.07 | ) | | | — | | | | — | | |
| Total distributions to shareholders | | | (1.90 | ) | | | (1.50 | ) | | | (1.14 | ) | | | (0.06 | ) | | | (0.07 | ) | |
| Net Asset Value, End of Period | | $ | 9.89 | | | $ | 15.44 | | | $ | 14.93 | | | $ | 13.94 | | | $ | 12.14 | | |
| Total return (d) | | | (26.64 | )% | | | 14.15 | % | | | 16.30 | %(e) | | | 15.33 | %(e) | | | 16.67 | % | |
| Ratios to Average Net Assets/Supplemental Data: | |
| Net expenses before interest expense (f) | | | 2.03 | % | | | 1.99 | % | | | 1.96 | % | | | 1.98 | % | | | 2.07 | % | |
| Interest expense | | | — | %(g) | | | — | | | | — | %(g) | | | — | | | | — | | |
| Net expenses (f) | | | 2.03 | % | | | 1.99 | % | | | 1.96 | % | | | 1.98 | % | | | 2.07 | % | |
| Waiver/Reimbursement | | | — | | | | — | | | | — | %(g) | | | 0.01 | % | | | — | | |
| Net investment income (f) | | | 0.55 | % | | | 0.14 | % | | | 0.39 | % | | | 0.49 | % | | | 0.63 | % | |
| Portfolio turnover rate | | | 78 | % | | | 91 | % | | | 81 | % | | | 94 | % | | | 101 | % | |
| Net assets, end of period (000's) | | $ | 2,801 | | | $ | 5,650 | | | $ | 1,801 | | | $ | 453 | | | $ | 291 | | |
(a) On October 13, 2003, the Liberty Equity Value Fund was renamed the Columbia Disciplined Value Fund.
(b) Per share data was calculated using the average shares outstanding during the period.
(c) Net investment income per share reflects a special dividend. The effect of this dividend amounted to $0.02 per share.
(d) Total return at net asset value assuming all distributions reinvested and no contingent deferred sales charge.
(e) Had the investment advisor and/or any of its affiliates not waived fees or reimbursed a portion of expenses, total return would have been reduced.
(f) The benefits derived from expense reductions had an impact of less than 0.01%.
(g) Rounds to less than 0.01%.
See Accompanying Notes to Financial Statements.
87
Financial Highlights – Columbia Disciplined Value Fund
Selected data for a share outstanding throughout each period is as follows:
| | | Year Ended September 30, | |
| Class T Shares | | 2008 | | 2007 (a) | | 2006 | | 2005 | | 2004 (b) | |
| Net Asset Value, Beginning of Period | | $ | 16.33 | | | $ | 15.70 | | | $ | 14.60 | | | $ | 12.72 | | | $ | 11.00 | | |
| Income from Investment Operations: | |
| Net investment income (c) | | | 0.16 | | | | 0.15 | | | | 0.17 | | | | 0.17 | (d) | | | 0.16 | | |
Net realized and unrealized gain (loss)
on investments and futures contracts | | | (3.97 | ) | | | 2.09 | | | | 2.18 | | | | 1.86 | | | | 1.76 | | |
| Total from investment operations | | | (3.81 | ) | | | 2.24 | | | | 2.35 | | | | 2.03 | | | | 1.92 | | |
| Less Distributions to Shareholders: | |
| From net investment income | | | (0.16 | ) | | | (0.15 | ) | | | (0.18 | ) | | | (0.15 | ) | | | (0.20 | ) | |
| From net realized gains | | | (1.83 | ) | | | (1.46 | ) | | | (1.07 | ) | | | — | | | | — | | |
| Total distributions to shareholders | | | (1.99 | ) | | | (1.61 | ) | | | (1.25 | ) | | | (0.15 | ) | | | (0.20 | ) | |
| Net Asset Value, End of Period | | $ | 10.53 | | | $ | 16.33 | | | $ | 15.70 | | | $ | 14.60 | | | $ | 12.72 | | |
| Total return (e) | | | (26.18 | )% | | | 15.01 | % | | | 17.13 | %(f) | | | 16.06 | %(f) | | | 17.54 | % | |
| Ratios to Average Net Assets/Supplemental Data: | |
| Net expenses before interest expense (g) | | | 1.33 | % | | | 1.29 | % | | | 1.26 | % | | | 1.28 | % | | | 1.38 | % | |
| Interest expense | | | — | %(h) | | | — | | | | — | %(h) | | | — | | | | — | | |
| Net expenses (g) | | | 1.33 | % | | | 1.29 | % | | | 1.26 | % | | | 1.28 | % | | | 1.38 | % | |
| Waiver/Reimbursement | | | — | | | | — | | | | — | %(h) | | | 0.01 | % | | | — | | |
| Net investment income (g) | | | 1.27 | % | | | 0.91 | % | | | 1.15 | % | | | 1.22 | % | | | 1.31 | % | |
| Portfolio turnover rate | | | 78 | % | | | 91 | % | | | 81 | % | | | 94 | % | | | 101 | % | |
| Net assets, end of period (000's) | | $ | 89,694 | | | $ | 140,443 | | | $ | 137,595 | | | $ | 134,792 | | | $ | 133,094 | | |
(a) On August 8, 2007, the Class G shares were converted to Class T shares.
(b) On October 13, 2003, the Liberty Equity Value Fund was renamed the Columbia Disciplined Value Fund.
(c) Per share data was calculated using the average shares outstanding during the period.
(d) Net investment income per share reflects a special dividend. The effect of this dividend amounted to $0.02 per share.
(e) Total return at net asset value assuming all distributions reinvested and no initial sales charge or contingent deferred sales charge.
(f) Had the investment advisor and/or any of its affiliates not waived fees or reimbursed a portion of expenses, total return would have been reduced.
(g) The benefits derived from expense reductions had an impact of less than 0.01%.
(h) Rounds to less than 0.01%.
See Accompanying Notes to Financial Statements.
88
Financial Highlights – Columbia Disciplined Value Fund
Selected data for a share outstanding throughout each period is as follows:
| | | Year Ended September 30, | |
| Class Z Shares | | 2008 | | 2007 | | 2006 | | 2005 | | 2004 (a) | |
| Net Asset Value, Beginning of Period | | $ | 16.69 | | | $ | 16.02 | | | $ | 14.87 | | | $ | 12.95 | | | $ | 11.24 | | |
| Income from Investment Operations: | |
| Net investment income (b) | | | 0.21 | | | | 0.20 | | | | 0.22 | | | | 0.21 | (c) | | | 0.20 | | |
Net realized and unrealized gain (loss)
on investments and futures contracts | | | (4.07 | ) | | | 2.13 | | | | 2.22 | | | | 1.91 | | | | 1.79 | | |
| Total from investment operations | | | (3.86 | ) | | | 2.33 | | | | 2.44 | | | | 2.12 | | | | 1.99 | | |
| Less Distributions to Shareholders: | |
| From net investment income | | | (0.20 | ) | | | (0.20 | ) | | | (0.22 | ) | | | (0.20 | ) | | | (0.28 | ) | |
| From net realized gains | | | (1.83 | ) | | | (1.46 | ) | | | (1.07 | ) | | | — | | | | — | | |
| Total distributions to shareholders | | | (2.03 | ) | | | (1.66 | ) | | | (1.29 | ) | | | (0.20 | ) | | | (0.28 | ) | |
| Net Asset Value, End of Period | | $ | 10.80 | | | $ | 16.69 | | | $ | 16.02 | | | $ | 14.87 | | | $ | 12.95 | | |
| Total return (d) | | | (25.92 | )% | | | 15.29 | % | | | 17.50 | %(e) | | | 16.43 | %(e) | | | 17.86 | % | |
| Ratios to Average Net Assets/Supplemental Data: | |
| Net expenses before interest expense (f) | | | 1.03 | % | | | 0.99 | % | | | 0.96 | % | | | 0.98 | % | | | 1.06 | % | |
| Interest expense | | | — | %(g) | | | — | | | | — | %(g) | | | — | | | | — | | |
| Net expenses (f) | | | 1.03 | % | | | 0.99 | % | | | 0.96 | % | | | 0.98 | % | | | 1.06 | % | |
| Waiver/Reimbursement | | | — | | | | — | | | | — | %(g) | | | 0.01 | % | | | — | | |
| Net investment income (f) | | | 1.58 | % | | | 1.20 | % | | | 1.45 | % | | | 1.53 | % | | | 1.62 | % | |
| Portfolio turnover rate | | | 78 | % | | | 91 | % | | | 81 | % | | | 94 | % | | | 101 | % | |
| Net assets, end of period (000's) | | $ | 222,212 | | | $ | 341,612 | | | $ | 285,941 | | | $ | 283,187 | | | $ | 283,469 | | |
(a) On October 13, 2003, the Liberty Equity Value Fund was renamed the Columbia Disciplined Value Fund.
(b) Per share data was calculated using the average shares outstanding during the period.
(c) Net investment income per share reflects a special dividend. The effect of this dividend amounted to $0.02 per share.
(d) Total return at net asset value assuming all distributions reinvested.
(e) Had the investment advisor and/or any of its affiliates not waived fees or reimbursed a portion of expenses, total return would have been reduced.
(f) The benefits derived from expense reductions had an impact of less than 0.01%.
(g) Rounds to less than 0.01%.
See Accompanying Notes to Financial Statements.
89
Financial Highlights – Columbia Contrarian Core Fund
Selected data for a share outstanding throughout each period is as follows:
| | | Year Ended September 30, | |
| Class A Shares (k) | | 2008 | | 2007 | | 2006 | | 2005 (a) | | 2004 (b) | |
| Net Asset Value, Beginning of Period | | $ | 15.51 | | | $ | 14.03 | | | $ | 13.59 | | | $ | 12.01 | | | $ | 11.22 | | |
| Income from Investment Operations: | |
| Net investment income (loss) (c) | | | 0.07 | | | | 0.05 | | | | — | (d) | | | 0.07 | (e) | | | — | (d) | |
Net realized and unrealized gain (loss)
on investments | | | (2.17 | ) | | | 2.60 | | | | 1.21 | | | | 1.93 | | | | 0.80 | | |
| Total from investment operations | | | (2.10 | ) | | | 2.65 | | | | 1.21 | | | | 2.00 | | | | 0.80 | | |
| Less Distributions to Shareholders: | |
| From net investment income | | | (0.05 | ) | | | — | | | | (0.01 | ) | | | (0.07 | ) | | | (0.01 | ) | |
| From net realized gains | | | (1.47 | ) | | | (1.17 | ) | | | (0.76 | ) | | | (0.35 | ) | | | — | | |
| Total distributions to shareholders | | | (1.52 | ) | | | (1.17 | ) | | | (0.77 | ) | | | (0.42 | ) | | | (0.01 | ) | |
| Net Asset Value, End of Period | | $ | 11.89 | | | $ | 15.51 | | | $ | 14.03 | | | $ | 13.59 | | | $ | 12.01 | | |
| Total return (f)(g) | | | (15.35 | )% | | | 19.82 | % | | | 9.24 | % | | | 16.98 | % | | | 7.09 | % | |
| Ratios to Average Net Assets/Supplemental Data: | |
| Net expenses before interest expense | | | 1.14 | %(h) | | | 1.14 | %(j) | | | 1.14 | %(j) | | | 1.14 | %(j) | | | 1.14 | %(j) | |
| Interest expense | | | — | %(i) | | | — | | | | — | | | | — | | | | — | | |
| Net expenses | | | 1.14 | %(h) | | | 1.14 | %(j) | | | 1.14 | %(j) | | | 1.24 | %(j) | | | 1.35 | %(j) | |
| Waiver/Reimbursement | | | 0.10 | % | | | 0.10 | % | | | 0.12 | % | | | 0.09 | % | | | — | %(i) | |
| Net investment income (loss) | | | 0.53 | %(h) | | | 0.32 | %(j) | | | — | %(i)(j) | | | 0.59 | %(j) | | | (0.02 | )%(j) | |
| Portfolio turnover rate | | | 106 | % | | | 88 | % | | | 63 | % | | | 105 | % | | | 115 | % | |
| Net assets, end of period (000's) | | $ | 11,187 | | | $ | 12,054 | | | $ | 10,578 | | | $ | 10,393 | | | $ | 9,304 | | |
(a) On September 23, 2005, the Columbia Large Cap Core Fund was renamed the Columbia Common Stock Fund.
(b) On October 13, 2003, the Liberty Large Cap Core Fund was renamed the Columbia Large Cap Core Fund.
(c) Per share data was calculated using the average shares outstanding during the period.
(d) Rounds to less than $0.01 per share.
(e) Net investment income per share reflects a special dividend. The effect of this dividend amounted to $0.05 per share.
(f) Total return at net asset value assuming all distributions reinvested and no initial sales charge or contingent deferred sales charge.
(g) Had the investment advisor and/or any of its affiliates not waived fees or reimbursed a portion of expenses, total return would have been reduced.
(h) The benefits derived from expense reductions had an impact of 0.01%.
(i) Rounds to less than 0.01%.
(j) The benefits derived from expense reductions had an impact of less than 0.01%.
(k) On November 14, 2008, the Columbia Common Stock Fund was renamed the Columbia Contrarian Core Fund.
See Accompanying Notes to Financial Statements.
90
Financial Highlights – Columbia Contrarian Core Fund
Selected data for a share outstanding throughout each period is as follows:
| | | Year Ended September 30, | |
| Class B Shares (j) | | 2008 | | 2007 | | 2006 | | 2005 (a) | | 2004 (b) | |
| Net Asset Value, Beginning of Period | | $ | 14.67 | | | $ | 13.42 | | | $ | 13.12 | | | $ | 11.68 | | | $ | 10.99 | | |
| Income from Investment Operations: | |
| Net investment loss (c) | | | (0.03 | ) | | | (0.06 | ) | | | (0.10 | ) | | | (0.04 | )(d) | | | (0.09 | ) | |
Net realized and unrealized gain (loss)
on investments | | | (2.03 | ) | | | 2.48 | | | | 1.16 | | | | 1.88 | | | | 0.78 | | |
| Total from investment operations | | | (2.06 | ) | | | 2.42 | | | | 1.06 | | | | 1.84 | | | | 0.69 | | |
| Less Distributions to Shareholders: | |
| From net investment income | | | — | | | | — | | | | — | | | | (0.05 | ) | | | — | | |
| From net realized gains | | | (1.47 | ) | | | (1.17 | ) | | | (0.76 | ) | | | (0.35 | ) | | | — | | |
| Total distributions to shareholders | | | (1.47 | ) | | | (1.17 | ) | | | (0.76 | ) | | | (0.40 | ) | | | — | | |
| Net Asset Value, End of Period | | $ | 11.14 | | | $ | 14.67 | | | $ | 13.42 | | | $ | 13.12 | | | $ | 11.68 | | |
| Total return (e)(f) | | | (15.96 | )% | | | 18.94 | % | | | 8.40 | % | | | 16.02 | % | | | 6.28 | % | |
| Ratios to Average Net Assets/Supplemental Data: | |
| Net expenses before interest expense | | | 1.89 | %(g) | | | 1.89 | %(i) | | | 1.89 | %(i) | | | 1.99 | %(i) | | | 2.09 | %(i) | |
| Interest expense | | | — | %(h) | | | — | | | | — | | | | — | | | | — | | |
| Net expenses | | | 1.89 | %(g) | | | 1.89 | %(i) | | | 1.89 | %(i) | | | 1.99 | %(i) | | | 2.09 | %(i) | |
| Waiver/Reimbursement | | | 0.10 | % | | | 0.10 | % | | | 0.12 | % | | | 0.09 | % | | | — | %(h) | |
| Net investment loss | | | (0.22 | )%(g) | | | (0.44 | )%(i) | | | (0.75 | )%(i) | | | (0.31 | )%(i) | | | (0.76 | )%(i) | |
| Portfolio turnover rate | | | 106 | % | | | 88 | % | | | 63 | % | | | 105 | % | | | 115 | % | |
| Net assets, end of period (000's) | | $ | 3,629 | | | $ | 4,796 | | | $ | 5,637 | | | $ | 6,628 | | | $ | 3,425 | | |
(a) On September 23, 2005, the Columbia Large Cap Core Fund was renamed the Columbia Common Stock Fund.
(b) On October 13, 2003, the Liberty Large Cap Core Fund was renamed the Columbia Large Cap Core Fund.
(c) Per share data was calculated using the average shares outstanding during the period.
(d) Net investment loss per share reflects a special dividend. The effect of this dividend amounted to $0.05 per share.
(e) Total return at net asset value assuming all distributions reinvested and no contingent deferred sales charge.
(f) Had the investment advisor and/or any of its affiliates not waived fees or reimbursed a portion of expenses, total return would have been reduced.
(g) The benefits derived from expense reductions had an impact of 0.01%.
(h) Rounds to less than 0.01%.
(i) The benefits derived from expense reductions had an impact of less than 0.01%.
(j) On November 14, 2008, the Columbia Common Stock Fund was renamed the Columbia Contrarian Core Fund.
See Accompanying Notes to Financial Statements.
91
Financial Highlights – Columbia Contrarian Core Fund
Selected data for a share outstanding throughout each period is as follows:
| | | Year Ended September 30, | |
| Class C Shares (j) | | 2008 | | 2007 | | 2006 | | 2005 (a) | | 2004 (b) | |
| Net Asset Value, Beginning of Period | | $ | 14.68 | | | $ | 13.43 | | | $ | 13.13 | | | $ | 11.68 | | | $ | 10.99 | | |
| Income from Investment Operations: | |
| Net investment loss (c) | | | (0.03 | ) | | | (0.06 | ) | | | (0.10 | ) | | | (0.03 | )(d) | | | (0.09 | ) | |
Net realized and unrealized gain (loss)
on investments | | | (2.03 | ) | | | 2.48 | | | | 1.16 | | | | 1.88 | | | | 0.78 | | |
| Total from investment operations | | | (2.06 | ) | | | 2.42 | | | | 1.06 | | | | 1.85 | | | | 0.69 | | |
| Less Distributions to Shareholders: | |
| From net investment income | | | — | | | | — | | | | — | | | | (0.05 | ) | | | — | | |
| From net realized gains | | | (1.47 | ) | | | (1.17 | ) | | | (0.76 | ) | | | (0.35 | ) | | | — | | |
| Total distributions to shareholders | | | (1.47 | ) | | | (1.17 | ) | | | (0.76 | ) | | | (0.40 | ) | | | — | | |
| Net Asset Value, End of Period | | $ | 11.15 | | | $ | 14.68 | | | $ | 13.43 | | | $ | 13.13 | | | $ | 11.68 | | |
| Total return (e)(f) | | | (15.95 | )% | | | 18.93 | % | | | 8.40 | % | | | 16.10 | % | | | 6.28 | % | |
| Ratios to Average Net Assets/Supplemental Data: | |
| Net expense before interest expense | | | 1.89 | %(g) | | | 1.89 | %(i) | | | 1.89 | %(i) | | | 1.99 | %(i) | | | 2.09 | %(i) | |
| Interest expense | | | — | %(h) | | | — | | | | — | | | | — | | | | — | | |
| Net expenses | | | 1.89 | %(g) | | | 1.89 | %(i) | | | 1.89 | %(i) | | | 1.99 | %(i) | | | 2.09 | %(i) | |
| Waiver/Reimbursement | | | 0.10 | % | | | 0.10 | % | | | 0.12 | % | | | 0.09 | % | | | — | %(h) | |
| Net investment loss | | | (0.21 | )%(g) | | | (0.41 | )%(i) | | | (0.75 | )%(i) | | | (0.25 | )%(i) | | | (0.74 | )%(i) | |
| Portfolio turnover rate | | | 106 | % | | | 88 | % | | | 63 | % | | | 105 | % | | | 115 | % | |
| Net assets, end of period (000's) | | $ | 1,718 | | | $ | 1,428 | | | $ | 906 | | | $ | 605 | | | $ | 345 | | |
(a) On September 23, 2005, the Columbia Large Cap Core Fund was renamed the Columbia Common Stock Fund.
(b) On October 13, 2003, the Liberty Large Cap Core Fund was renamed the Columbia Large Cap Core Fund.
(c) Per share data was calculated using the average shares outstanding during the period.
(d) Net investment loss per share reflects a special dividend. The effect of this dividend amounted to $0.05 per share.
(e) Total return at net asset value assuming all distributions reinvested and no contingent deferred sales charge.
(f) Had the investment advisor and/or any of its affiliates not waived fees or reimbursed a portion of expenses, total return would have been reduced.
(g) The benefits derived from expense reductions had an impact of 0.01%.
(h) Rounds to less than 0.01%.
(i) The benefits derived from expense reductions had an impact of less than 0.01%.
(j) On November 14, 2008, the Columbia Common Stock Fund was renamed the Columbia Contrarian Core Fund.
See Accompanying Notes to Financial Statements.
92
Financial Highlights – Columbia Contrarian Core Fund
Selected data for a share outstanding throughout each period is as follows:
| | | Year Ended September 30, | |
| Class T Shares (l) | | 2008 | | 2007 (a) | | 2006 | | 2005 (b) | | 2004 (c) | |
| Net Asset Value, Beginning of Period | | $ | 15.40 | | | $ | 13.95 | | | $ | 13.52 | | | $ | 11.95 | | | $ | 11.18 | | |
| Income from Investment Operations: | |
| Net investment income (loss) (d) | | | 0.06 | | | | 0.04 | | | | (0.01 | ) | | | 0.07 | (e) | | | (0.01 | ) | |
Net realized and unrealized gain (loss)
on investments | | | (2.15 | ) | | | 2.58 | | | | 1.21 | | | | 1.92 | | | | 0.78 | | |
| Total from investment operations | | | (2.09 | ) | | | 2.62 | | | | 1.20 | | | | 1.99 | | | | 0.77 | | |
| Less Distributions to Shareholders: | |
| From net investment income | | | (0.04 | ) | | | — | (f) | | | (0.01 | ) | | | (0.07 | ) | | | — | (f) | |
| From net realized gains | | | (1.47 | ) | | | (1.17 | ) | | | (0.76 | ) | | | (0.35 | ) | | | — | | |
| Total distributions to shareholders | | | (1.51 | ) | | | (1.17 | ) | | | (0.77 | ) | | | (0.42 | ) | | | — | (f) | |
| Net Asset Value, End of Period | | $ | 11.80 | | | $ | 15.40 | | | $ | 13.95 | | | $ | 13.52 | | | $ | 11.95 | | |
| Total return (g)(h) | | | (15.37 | )% | | | 19.70 | % | | | 9.16 | % | | | 16.97 | % | | | 6.92 | % | |
| Ratios to Average Net Assets/Supplemental Data: | |
| Net expenses before interest expense | | | 1.19 | %(i) | | | 1.19 | %(k) | | | 1.19 | %(k) | | | 1.29 | %(k) | | | 1.40 | %(k) | |
| Interest expense | | | — | %(j) | | | — | | | | — | | | | — | | | | — | | |
| Net expenses | | | 1.19 | %(i) | | | 1.19 | %(k) | | | 1.19 | %(k) | | | 1.29 | %(k) | | | 1.40 | %(k) | |
| Waiver/Reimbursement | | | 0.10 | % | | | 0.10 | % | | | 0.12 | % | | | 0.09 | % | | | — | %(j) | |
| Net investment income (loss) | | | 0.48 | %(i) | | | 0.27 | %(k) | | | (0.05 | )%(k) | | | 0.57 | %(k) | | | (0.07 | )%(k) | |
| Portfolio turnover rate | | | 106 | % | | | 88 | % | | | 63 | % | | | 105 | % | | | 115 | % | |
| Net assets, end of period (000's) | | $ | 132,272 | | | $ | 177,345 | | | $ | 168,506 | | | $ | 180,345 | | | $ | 179,310 | | |
(a) On August 8, 2007, the Class G shares were converted into Class T shares.
(b) On September 23, 2005, the Columbia Large Cap Core Fund was renamed the Columbia Common Stock Fund.
(c) On October 13, 2003, the Liberty Large Cap Core Fund was renamed the Columbia Large Cap Core Fund.
(d) Per share data was calculated using the average shares outstanding during the period.
(e) Net investment income per share reflects a special dividend. The effect of this dividend amounted to $0.05 per share.
(f) Rounds to less than $0.01 per share.
(g) Total return at net asset value assuming all distributions reinvested and no initial sales charge or contingent deferred sales charge.
(h) Had the investment advisor and/or any of its affiliates not waived fees or reimbursed a portion of expenses, total return would have been reduced.
(i) The benefits derived from expense reductions had an impact of 0.01%.
(j) Rounds to less than 0.01%.
(k) The benefits derived from expense reductions had an impact of less than 0.01%.
(l) On November 14, 2008, the Columbia Common Stock Fund was renamed the Columbia Contrarian Core Fund.
See Accompanying Notes to Financial Statements.
93
Financial Highlights – Columbia Contrarian Core Fund
Selected data for a share outstanding throughout each period is as follows:
| | | Year Ended September 30, | |
| Class Z Shares (j) | | 2008 | | 2007 | | 2006 | | 2005 (a) | | 2004 (b) | |
| Net Asset Value, Beginning of Period | | $ | 15.60 | | | $ | 14.10 | | | $ | 13.66 | | | $ | 12.05 | | | $ | 11.25 | | |
| Income from Investment Operations: | |
| Net investment income (c) | | | 0.11 | | | | 0.08 | | | | 0.03 | | | | 0.09 | (d) | | | 0.03 | | |
Net realized and unrealized gain (loss)
on investments | | | (2.18 | ) | | | 2.62 | | | | 1.21 | | | | 1.95 | | | | 0.79 | | |
| Total from investment operations | | | (2.07 | ) | | | 2.70 | | | | 1.24 | | | | 2.04 | | | | 0.82 | | |
| Less Distributions to Shareholders: | |
| From net investment income | | | (0.09 | ) | | | (0.03 | ) | | | (0.04 | ) | | | (0.08 | ) | | | (0.02 | ) | |
| From net realized gains | | | (1.47 | ) | | | (1.17 | ) | | | (0.76 | ) | | | (0.35 | ) | | | — | | |
| Total distributions to shareholders | | | (1.56 | ) | | | (1.20 | ) | | | (0.80 | ) | | | (0.43 | ) | | | (0.02 | ) | |
| Net Asset Value, End of Period | | $ | 11.97 | | | $ | 15.60 | | | $ | 14.10 | | | $ | 13.66 | | | $ | 12.05 | | |
| Total return (e)(f) | | | (15.11 | )% | | | 20.13 | % | | | 9.45 | % | | | 17.25 | % | | | 7.28 | % | |
| Ratios to Average Net Assets/Supplemental Data: | |
| Net expenses before interest expense | | | 0.89 | %(g) | | | 0.89 | %(i) | | | 0.89 | %(i) | | | 0.99 | %(i) | | | 1.07 | %(i) | |
| Interest expense | | | — | %(h) | | | — | | | | — | | | | — | | | | — | | |
| Net expenses | | | 0.89 | %(g) | | | 0.89 | %(i) | | | 0.89 | %(i) | | | 0.99 | %(i) | | | 1.07 | %(i) | |
| Waiver/Reimbursement | | | 0.10 | % | | | 0.10 | % | | | 0.12 | % | | | 0.09 | % | | | — | %(h) | |
| Net investment income | | | 0.77 | %(g) | | | 0.57 | %(i) | | | 0.25 | %(i) | | | 0.67 | %(i) | | | 0.26 | %(i) | |
| Portfolio turnover rate | | | 106 | % | | | 88 | % | | | 63 | % | | | 105 | % | | | 115 | % | |
| Net assets, end of period (000's) | | $ | 173,479 | | | $ | 245,529 | | | $ | 256,039 | | | $ | 310,472 | | | $ | 175,124 | | |
(a) On September 23, 2005, the Columbia Large Cap Core Fund was renamed the Columbia Common Stock Fund.
(b) On October 13, 2003, the Liberty Large Cap Core Fund was renamed the Columbia Large Cap Core Fund.
(c) Per share data was calculated using the average shares outstanding during the period.
(d) Net investment income per share reflects a special dividend. The effect of this dividend amounted to $0.05 per share.
(e) Total return at net asset value assuming all distributions reinvested.
(f) Had the investment advisor and/or any of its affiliates not waived fees or reimbursed a portion of expenses, total return would have been reduced.
(g) The benefits derived from expense reductions had an impact of 0.01%.
(h) Rounds to less than 0.01%.
(i) The benefits derived from expense reductions had an impact of less than 0.01%.
(j) On November 14, 2008, the Columbia Common Stock Fund was renamed the Columbia Contrarian Core Fund.
See Accompanying Notes to Financial Statements.
94
Financial Highlights – Columbia Small Cap Core Fund
Selected data for a share outstanding throughout each period is as follows:
| | | Year Ended September 30, | |
| Class A Shares | | 2008 | | 2007 | | 2006 | | 2005 (a) | | 2004 (b) | |
| Net Asset Value, Beginning of Period | | $ | 20.01 | | | $ | 19.72 | | | $ | 19.32 | | | $ | 17.54 | | | $ | 15.30 | | |
| Income from Investment Operations: | |
| Net investment income (loss) (c) | | | (0.09 | ) | | | 0.04 | (d) | | | (0.06 | ) | | | (0.06 | ) | | | (0.07 | ) | |
Net realized and unrealized gain (loss)
on investments | | | (2.11 | ) | | | 2.46 | | | | 1.91 | | | | 2.91 | | | | 2.75 | | |
| Total from investment operations | | | (2.20 | ) | | | 2.50 | | | | 1.85 | | | | 2.85 | | | | 2.68 | | |
| Less Distributions to Shareholders: | |
| From net investment income | | | (0.03 | ) | | | — | | | | — | | | | — | | | | — | | |
| From net realized gains | | | (3.64 | ) | | | (2.21 | ) | | | (1.45 | ) | | | (1.07 | ) | | | (0.44 | ) | |
| Total distributions to shareholders | | | (3.67 | ) | | | (2.21 | ) | | | (1.45 | ) | | | (1.07 | ) | | | (0.44 | ) | |
| Net Asset Value, End of Period | | $ | 14.14 | | | $ | 20.01 | | | $ | 19.72 | | | $ | 19.32 | | | $ | 17.54 | | |
| Total return (e) | | | (12.86 | )% | | | 13.30 | % | | | 10.08 | %(f) | | | 16.69 | %(f) | | | 17.73 | %(f) | |
| Ratios to Average Net Assets/Supplemental Data: | |
| Net expenses before interest expense (g) | | | 1.25 | % | | | 1.21 | % | | | 1.16 | % | | | 1.13 | % | | | 1.15 | % | |
| Interest expense | | | — | | | | — | | | | — | %(h) | | | — | | | | — | | |
| Net expenses (g) | | | 1.25 | % | | | 1.21 | % | | | 1.16 | % | | | 1.13 | % | | | 1.15 | % | |
| Waiver/Reimbursement | | | — | | | | — | | | | — | %(h) | | | — | %(h) | | | — | %(h) | |
| Net investment income (loss) (g) | | | (0.56 | )% | | | 0.22 | % | | | (0.30 | )% | | | (0.31 | )% | | | (0.40 | )% | |
| Portfolio turnover rate | | | 25 | % | | | 44 | % | | | 14 | % | | | 16 | % | | | 26 | % | |
| Net assets, end of period (000's) | | $ | 115,246 | | | $ | 176,504 | | | $ | 190,390 | | | $ | 211,527 | | | $ | 211,502 | | |
(a) On October 7, 2005, the Columbia Small Cap Fund was renamed the Columbia Small Cap Core Fund.
(b) On October 13, 2003, the Liberty Small Cap Fund was renamed the Columbia Small Cap Fund.
(c) Per share data was calculated using the average shares outstanding during the period.
(d) Net investment income per share reflects a special dividend. The effect of this dividend amounted to $0.07 per share.
(e) Total return at net asset value assuming all distributions reinvested and no initial sales charge or contingent deferred sales charge.
(f) Had the investment advisor and/or any of its affiliates not waived fees or reimbursed a portion of expenses, total return would have been reduced.
(g) The benefits derived from expense reductions had an impact of less than 0.01%.
(h) Rounds to less than 0.01%.
See Accompanying Notes to Financial Statements.
95
Financial Highlights – Columbia Small Cap Core Fund
Selected data for a share outstanding throughout each period is as follows:
| | | Year Ended September 30, | |
| Class B Shares | | 2008 | | 2007 | | 2006 | | 2005 (a) | | 2004 (b) | |
| Net Asset Value, Beginning of Period | | $ | 18.75 | | | $ | 18.73 | | | $ | 18.56 | | | $ | 16.89 | | | $ | 14.75 | | |
| Income from Investment Operations: | |
| Net investment loss (c) | | | (0.19 | ) | | | (0.10 | )(d) | | | (0.19 | ) | | | (0.19 | ) | | | (0.19 | ) | |
Net realized and unrealized gain (loss)
on investments | | | (1.95 | ) | | | 2.33 | | | | 1.81 | | | | 2.81 | | | | 2.67 | | |
| Total from investment operations | | | (2.14 | ) | | | 2.23 | | | | 1.62 | | | | 2.62 | | | | 2.48 | | |
| Less Distributions to Shareholders: | |
| From net realized gains | | | (3.64 | ) | | | (2.21 | ) | | | (1.45 | ) | | | (0.95 | ) | | | (0.34 | ) | |
| Net Asset Value, End of Period | | $ | 12.97 | | | $ | 18.75 | | | $ | 18.73 | | | $ | 18.56 | | | $ | 16.89 | | |
| Total return (e) | | | (13.53 | )% | | | 12.49 | % | | | 9.17 | %(f) | | | 15.87 | %(f) | | | 16.96 | %(f) | |
| Ratios to Average Net Assets/Supplemental Data: | |
| Net expenses before interest expense (g) | | | 2.00 | % | | | 1.96 | % | | | 1.91 | % | | | 1.88 | % | | | 1.90 | % | |
| Interest expense | | | — | | | | — | | | | — | %(h) | | | — | | | | — | | |
| Net expenses (g) | | | 2.00 | % | | | 1.96 | % | | | 1.91 | % | | | 1.88 | % | | | 1.90 | % | |
| Waiver/Reimbursement | | | — | | | | — | | | | — | %(h) | | | — | %(h) | | | — | %(h) | |
| Net investment loss (g) | | | (1.31 | )% | | | (0.53 | )% | | | (1.05 | )% | | | (1.06 | )% | | | (1.15 | )% | |
| Portfolio turnover rate | | | 25 | % | | | 44 | % | | | 14 | % | | | 16 | % | | | 26 | % | |
| Net assets, end of period (000's) | | $ | 23,085 | | | $ | 35,918 | | | $ | 39,109 | | | $ | 42,439 | | | $ | 40,170 | | |
(a) On October 7, 2005, the Columbia Small Cap Fund was renamed the Columbia Small Cap Core Fund.
(b) On October 13, 2003, the Liberty Small Cap Fund was renamed the Columbia Small Cap Fund.
(c) Per share data was calculated using the average shares outstanding during the period.
(d) Net investment loss per share reflects a special dividend. The effect of this dividend amounted to $0.06 per share.
(e) Total return at net asset value assuming all distributions reinvested and no contingent deferred sales charge.
(f) Had the investment advisor and/or any of its affiliates not waived fees or reimbursed a portion of expenses, total return would have been reduced.
(g) The benefits derived from expense reductions had an impact of less than 0.01%.
(h) Rounds to less than 0.01%.
See Accompanying Notes to Financial Statements.
96
Financial Highlights – Columbia Small Cap Core Fund
Selected data for a share outstanding throughout each period is as follows:
| | | Year Ended September 30, | |
| Class C Shares | | 2008 | | 2007 | | 2006 | | 2005 (a) | | 2004 (b) | |
| Net Asset Value, Beginning of Period | | $ | 18.76 | | | $ | 18.75 | | | $ | 18.57 | | | $ | 16.91 | | | $ | 14.77 | | |
| Income from Investment Operations: | |
| Net investment loss (c) | | | (0.19 | ) | | | (0.10 | )(d) | | | (0.19 | ) | | | (0.19 | ) | | | (0.19 | ) | |
Net realized and unrealized gain (loss)
on investments | | | (1.94 | ) | | | 2.32 | | | | 1.82 | | | | 2.80 | | | | 2.67 | | |
| Total from investment operations | | | (2.13 | ) | | | 2.22 | | | | 1.63 | | | | 2.61 | | | | 2.48 | | |
| Less Distributions to Shareholders: | |
| From net realized gains | | | (3.64 | ) | | | (2.21 | ) | | | (1.45 | ) | | | (0.95 | ) | | | (0.34 | ) | |
| Net Asset Value, End of Period | | $ | 12.99 | | | $ | 18.76 | | | $ | 18.75 | | | $ | 18.57 | | | $ | 16.91 | | |
| Total return (e) | | | (13.46 | )% | | | 12.41 | % | | | 9.23 | %(f) | | | 15.79 | %(f) | | | 16.94 | %(f) | |
| Ratios to Average Net Assets/Supplemental Data: | |
| Net expenses before interest expense (g) | | | 2.00 | % | | | 1.96 | % | | | 1.91 | % | | | 1.88 | % | | | 1.90 | % | |
| Interest expense | | | — | | | | — | | | | — | %(h) | | | — | | | | — | | |
| Net expenses (g) | | | 2.00 | % | | | 1.96 | % | | | 1.91 | % | | | 1.88 | % | | | 1.90 | % | |
| Waiver/Reimbursement | | | — | | | | — | | | | — | %(h) | | | — | %(h) | | | — | %(h) | |
| Net investment loss (g) | | | (1.29 | )% | | | (0.53 | )% | | | (1.05 | )% | | | (1.06 | )% | | | (1.15 | )% | |
| Portfolio turnover rate | | | 25 | % | | | 44 | % | | | 14 | % | | | 16 | % | | | 26 | % | |
| Net assets, end of period (000's) | | $ | 24,756 | | | $ | 42,312 | | | $ | 46,241 | | | $ | 56,163 | | | $ | 64,686 | | |
(a) On October 7, 2005, the Columbia Small Cap Fund was renamed the Columbia Small Cap Core Fund.
(b) On October 13, 2003, the Liberty Small Cap Fund was renamed the Columbia Small Cap Fund.
(c) Per share data was calculated using the average shares outstanding during the period.
(d) Net investment loss per share reflects a special dividend. The effect of this dividend amounted to $0.06 per share.
(e) Total return at net asset value assuming all distributions reinvested and no contingent deferred sales charge.
(f) Had the investment advisor and/or any of its affiliates not waived fees or reimbursed a portion of expenses, total return would have been reduced.
(g) The benefits derived from expense reductions had an impact of less than 0.01%.
(h) Rounds to less than 0.01%.
See Accompanying Notes to Financial Statements.
97
Financial Highlights – Columbia Small Cap Core Fund
Selected data for a share outstanding throughout each period is as follows:
| | | Year Ended September 30, | |
| Class T Shares | | 2008 | | 2007 (a) | | 2006 | | 2005 (b) | | 2004 (c) | |
| Net Asset Value, Beginning of Period | | $ | 19.78 | | | $ | 19.53 | | | $ | 19.15 | | | $ | 17.40 | | | $ | 15.16 | | |
| Income from Investment Operations: | |
| Net investment income (loss) (d) | | | (0.10 | ) | | | 0.03 | (e) | | | (0.07 | ) | | | (0.07 | ) | | | (0.08 | ) | |
Net realized and unrealized gain (loss)
on investments | | | (2.08 | ) | | | 2.43 | | | | 1.90 | | | | 2.88 | | | | 2.74 | | |
| Total from investment operations | | | (2.18 | ) | | | 2.46 | | | | 1.83 | | | | 2.81 | | | | 2.66 | | |
| Less Distributions to Shareholders: | |
| From net investment income | | | (0.02 | ) | | | — | | | | — | | | | — | | | | — | | |
| From net realized gains | | | (3.64 | ) | | | (2.21 | ) | | | (1.45 | ) | | | (1.06 | ) | | | (0.42 | ) | |
| Total distributions to shareholders | | | (3.66 | ) | | | (2.21 | ) | | | (1.45 | ) | | | (1.06 | ) | | | (0.42 | ) | |
| Net Asset Value, End of Period | | $ | 13.94 | | | $ | 19.78 | | | $ | 19.53 | | | $ | 19.15 | | | $ | 17.40 | | |
| Total return (f) | | | (12.90 | )% | | | 13.22 | % | | | 10.04 | %(g) | | | 16.58 | %(g) | | | 17.73 | %(g) | |
| Ratios to Average Net Assets/Supplemental Data: | |
| Net expenses before interest expense (h) | | | 1.30 | % | | | 1.26 | % | | | 1.21 | % | | | 1.18 | % | | | 1.21 | % | |
| Interest expense | | | — | | | | — | | | | — | %(i) | | | — | | | | — | | |
| Net expenses (h) | | | 1.30 | % | | | 1.26 | % | | | 1.21 | % | | | 1.18 | % | | | 1.21 | % | |
| Waiver/Reimbursement | | | — | | | | — | | | | — | %(i) | | | — | %(i) | | | — | %(i) | |
| Net investment income (loss) (h) | | | (0.63 | )% | | | 0.17 | % | | | (0.35 | )% | | | (0.36 | )% | | | (0.45 | )% | |
| Portfolio turnover rate | | | 25 | % | | | 44 | % | | | 14 | % | | | 16 | % | | | 26 | % | |
| Net assets, end of period (000's) | | $ | 98,299 | | | $ | 136,381 | | | $ | 135,538 | | | $ | 150,042 | | | $ | 146,752 | | |
(a) On August 8, 2007, Class G shares were converted to Class T shares.
(b) On October 7, 2005, the Columbia Small Cap Fund was renamed the Columbia Small Cap Core Fund.
(c) On October 13, 2003, the Liberty Small Cap Fund was renamed the Columbia Small Cap Fund.
(d) Per share data was calculated using the average shares outstanding during the period.
(e) Net investment income per share reflects a special dividend. The effect of this dividend amounted to $0.07 per share.
(f) Total return at net asset value assuming all distributions reinvested and no initial sales charge or contingent deferred sales charge.
(g) Had the investment advisor and/or any of its affiliates not waived fees or reimbursed a portion of expenses, total return would have been reduced.
(h) The benefits derived from expense reductions had an impact of less than 0.01%.
(i) Rounds to less than 0.01%.
See Accompanying Notes to Financial Statements.
98
Financial Highlights – Columbia Small Cap Core Fund
Selected data for a share outstanding throughout each period is as follows:
| | | Year Ended September 30, | |
| Class Z Shares | | 2008 | | 2007 | | 2006 | | 2005 (a) | | 2004 (b) | |
| Net Asset Value, Beginning of Period | | $ | 20.33 | | | $ | 19.96 | | | $ | 19.54 | | | $ | 17.73 | | | $ | 15.45 | | |
| Income from Investment Operations: | |
| Net investment income (loss) (c) | | | (0.04 | ) | | | 0.09 | (d) | | | (0.01 | ) | | | (0.01 | ) | | | (0.03 | ) | |
Net realized and unrealized gain (loss)
on investments | | | (2.15 | ) | | | 2.49 | | | | 1.93 | | | | 2.94 | | | | 2.80 | | |
| Total from investment operations | | | (2.19 | ) | | | 2.58 | | | | 1.92 | | | | 2.93 | | | | 2.77 | | |
| Less Distributions to Shareholders: | |
| From net investment income | | | (0.08 | ) | | | — | | | | — | | | | — | | | | — | | |
| From net realized gains | | | (3.64 | ) | | | (2.21 | ) | | | (1.50 | ) | | | (1.12 | ) | | | (0.49 | ) | |
| Total distributions to shareholders | | | (3.72 | ) | | | (2.21 | ) | | | (1.50 | ) | | | (1.12 | ) | | | (0.49 | ) | |
| Net Asset Value, End of Period | | $ | 14.42 | | | $ | 20.33 | | | $ | 19.96 | | | $ | 19.54 | | | $ | 17.73 | | |
| Total return (e) | | | (12.60 | )% | | | 13.56 | % | | | 10.32 | %(f) | | | 16.96 | %(f) | | | 18.12 | %(f) | |
| Ratios to Average Net Assets/Supplemental Data: | |
| Net expenses before interest expense (g) | | | 1.00 | % | | | 0.96 | % | | | 0.91 | % | | | 0.88 | % | | | 0.90 | % | |
| Interest expense | | | — | | | | — | | | | — | %(h) | | | — | | | | — | | |
| Net expenses (g) | | | 1.00 | % | | | 0.96 | % | | | 0.91 | % | | | 0.88 | % | | | 0.90 | % | |
| Waiver/Reimbursement | | �� | — | | | | — | | | | — | %(h) | | | — | %(h) | | | — | %(h) | |
| Net investment income (loss) (g) | | | (0.27 | )% | | | 0.46 | % | | | (0.05 | )% | | | (0.06 | )% | | | (0.15 | )% | |
| Portfolio turnover rate | | | 25 | % | | | 44 | % | | | 14 | % | | | 16 | % | | | 26 | % | |
| Net assets, end of period (000's) | | $ | 413,763 | | | $ | 834,537 | | | $ | 929,791 | | | $ | 1,058,362 | | | $ | 1,101,312 | | |
(a) On October 7, 2005, the Columbia Small Cap Fund was renamed the Columbia Small Cap Core Fund.
(b) On October 13, 2003, the Liberty Small Cap Fund was renamed the Columbia Small Cap Fund.
(c) Per share data was calculated using the average shares outstanding during the period.
(d) Net investment income per share reflects a special dividend. The effect of this dividend amounted to $0.07 per share.
(e) Total return at net asset value assuming all distributions reinvested.
(f) Had the investment advisor and/or any of its affiliates not waived fees or reimbursed a portion of expenses, total return would have been reduced.
(g) The benefits derived from expense reductions had an impact of less than 0.01%.
(h) Rounds to less than 0.01%.
See Accompanying Notes to Financial Statements.
99
Notes to Financial Statements – Stock Funds
September 30, 2008
Note 1. Organization
Columbia Funds Series Trust I (the "Trust") is a Massachusetts business trust registered under the Investment Company Act of 1940, as amended (the "1940 Act"), as an open-end management investment company. Information presented in these financial statements pertains to the following diversified funds (individually referred to as a "Fund", collectively referred to as the "Funds"), each a series of the Trust:
Columbia Asset Allocation Fund
Columbia Large Cap Growth Fund
Columbia Disciplined Value Fund
Columbia Contrarian Core Fund
Columbia Small Cap Core Fund
Effective November 14, 2008, Columbia Common Stock Fund changed its name to Columbia Contrarian Core Fund.
Investment Objectives
Columbia Asset Allocation Fund seeks total return, consisting of current income and long-term capital appreciation. Columbia Large Cap Growth Fund and Columbia Small Cap Core Fund each seek long-term capital appreciation. Columbia Disciplined Value Fund seeks total return, consisting primarily of long-term capital appreciation and secondarily of current income. Columbia Contrarian Core Fund seeks total return, consisting of long-term capital appreciation and current income.
Fund Shares
The Trust may issue an unlimited number of shares, and each Fund offers the following classes of shares: Class A, Class B, Class C, Class T and Class Z. Columbia Large Cap Growth Fund also offers Class E and Class F shares. Each share class has its own expense structure and sales charges, as applicable. Columbia Large Cap Growth Fund's Class E and Class F shares and Columbia Small Cap Core Fund are closed to new investors and new accounts.
Class A, Class E and Class T shares are subject to a front-end sales charge based on the amount of initial investment. Class A and Class T shares purchased without an initial sales charge in accounts aggregating $1 million to $50 million at the time of purchase are subject to a 1.00% contingent deferred sales charge ("CDSC") on shares sold within one year after purchase. Class E shares purchased without an initial sales charge in accounts aggregating $500,000 to $5 million at the time of purchase are subject to a 1.00% CDSC if the shares are sold within one year after purchase. Class B and Class F shares are subject to a maximum CDSC of 5.00% based upon the holding period after purchase. Class B and Class F shares will generally convert to Class A and Class E shares, respectively, eight years after purchase. Class C shares are subject to a 1.00% CDSC on shares sold within one year after purchase. Class Z shares are offered conti nuously at net asset value. There are certain restrictions on the purchase of Class Z shares, as described in each Fund's prospectus.
Note 2. Significant Accounting Policies
The preparation of financial statements in accordance with accounting principles generally accepted in the United States of America ("GAAP") requires management to make certain estimates and assumptions that affect the reported amounts of assets and liabilities, the disclosure of contingent assets and liabilities at the date of the financial statements and the reported amounts of revenue and expenses during the reporting period. Actual results could differ from those estimates. The following is a summary of significant accounting policies consistently followed by the Funds in the preparation of their financial statements.
Security Valuation
Equity securities and securities of certain investment companies are valued at the last sale price on the principal exchange on which they trade, except for securities traded on the NASDAQ, which are valued at the NASDAQ official close price. Unlisted securities or listed securities for which there were no sales during the day are valued at the closing bid price on such exchanges or over-the-counter markets.
Debt securities generally are valued by pricing services approved by the Trust's Board of Trustees, based upon market transactions for normal, institutional-size trading units of similar securities. The services may use various pricing techniques which take into account appropriate factors such as yield, quality, coupon rate, maturity, type of issue, trading characteristics and other data, as well as broker quotes. Debt securities for which quotations are readily available are valued at an over-the-counter or exchange bid quotation. Certain debt securities, which tend to be more thinly traded and of lesser quality, are priced based on fundamental analysis of the financial condition of the issuer and the estimated value of any collateral. Valuations developed through pricing techniques may vary from the actual amounts realized upon sale of the
100
Stock Funds, September 30, 2008 (continued)
securities, and the potential variation may be greater for those securities valued using fundamental analysis.
Short-term debt obligations maturing within 60 days are valued at amortized cost, which approximates market value.
Futures contracts are valued at the settlement price established each day by the board of trade or exchange on which they are traded.
Options are valued at the last reported sale price, or in the absence of a sale, the mean between the last quoted bid and ask price.
Forward foreign currency exchange contracts are valued at the prevailing forward exchange rate of the underlying currencies.
Foreign securities are generally valued at the last sale price on the foreign exchange or market on which they trade. If any foreign share prices are not readily available as a result of limited share activity, the securities are valued at the last sale price of the local shares in the principal market in which such securities are normally traded.
Generally, trading in foreign securities is substantially completed each day at various times prior to the close of the New York Stock Exchange ("NYSE"). The values of such securities used in computing the net asset values of the Funds' shares are determined as of such times. Foreign currency exchange rates are generally determined at 4:00 p.m. Eastern (U.S.) time. Occasionally events affecting the values of such foreign securities and such exchange rates may occur between the times at which they are determined and the close of the customary trading session of the NYSE, which would not be reflected in the computation of the Funds' net asset values. If events materially affecting the values of such foreign securities occur and it is determined that market quotations are not reliable, then these foreign securities will be valued at their fair value using procedures approved by the Board of Trustees. The Funds may use a systematic fair valuation model provided by an independent third party to value securities principally traded in foreign markets in order to adjust for possible stale pricing that may occur between the close of the foreign exchanges and the time for valuation. Investments for which market quotations are not readily available, or that have quotations which management believes are not reliable, are valued at fair value as determined in good faith under consistently applied procedures established by and under the general supervision of the Board of Trustees. If a security is valued at fair value, such value is likely to be different from the last quoted market price for the security.
In September 2006, Statement of Financial Accounting Standards No. 157, Fair Value Measurements ("SFAS 157"), was issued. SFAS 157 is effective for fiscal years beginning after November 15, 2007. SFAS 157 defines fair value, establishes a framework for measuring fair value and expands disclosures about fair value measurements. Management is evaluating the impact the application of SFAS 157 will have on each Fund's financial statement disclosures.
Security Transactions
Security transactions are accounted for on the trade date. Cost is determined and gains (losses) are based upon the specific identification method for both financial statement and federal income tax purposes.
In March 2008, Statement of Financial Accounting Standards No. 161, Disclosures about Derivative Instruments and Hedging Activities-an amendment of FASB Statement No. 133 ("SFAS 161"), was issued. SFAS 161 is effective for fiscal years and interim periods beginning after November 15, 2008. SFAS 161 requires additional discussion about the reporting entity's derivative instruments and hedging activities, by providing for qualitative disclosures about the objectives and strategies for using derivatives, quantitative data about the fair value of and gains and losses on derivative contracts, and details of credit-risk-related contingent features in their hedged positions. Management is evaluating the impact the application of SFAS 161 will have on the Funds' financial statement disclo sures.
Futures Contracts
The Funds may invest in futures for both hedging and non-hedging purposes, including, for example, to seek to enhance returns or as a substitute for a position in an underlying asset.
The use of futures contracts involves certain risks, which include: (1) imperfect correlation between the price movement of the instruments and the underlying securities, (2) inability to close out positions due to differing trading hours, or the temporary absence of a liquid market, for either the instruments or the underlying securities, or (3) an inaccurate prediction by Columbia Management Advisors, LLC ("Columbia"), the Funds' investment advisor, of the future direction of interest rates. Any of these risks may involve amounts exceeding the variation margin recorded in the Funds' Statements of Assets and Liabilities at any given time.
101
Stock Funds, September 30, 2008 (continued)
Upon entering into a futures contract, a Fund pledges cash or securities with the broker in an amount sufficient to meet the initial margin requirement. Subsequent payments are made or received by a Fund equal to the daily change in the contract value and are recorded as variation margin receivable or payable and offset in unrealized gains or losses. A Fund recognizes a realized gain or loss when the contract is closed or expires.
Options
Each Fund may write call and put options on securities it owns or in which it may invest. Writing put options tends to increase a Fund's exposure to the underlying instrument. Writing call options tends to decrease a Fund's exposure to the underlying instrument. When a Fund writes a call or put option, an amount equal to the premium received is recorded as a liability and subsequently marked-to-market to reflect the current value of the option written. Premiums received from writing options which expire are treated as realized gains. Premiums received from writing options which are exercised or closed are added to the proceeds or offset against the amounts paid on the underlying security transaction to determine the realized gain or loss. Each Fund, as a writer of an option, has no control over whether the underlying security may be sold (call) or purchased (put) and as a result bears the market risk of an unfavorable change in the price of the security underlying the written option. There is the risk that the Funds may not be able to enter into a closing transaction because of an illiquid market. The Funds' custodian will set aside cash or liquid portfolio securities equal to the amount of the written options contract commitment in a segregated account.
Each Fund may also purchase put and call options. Purchasing call options tends to increase a Fund's exposure to the underlying instrument. Purchasing put options tends to decrease a Fund's exposure to the underlying instrument. The Funds may pay a premium, which is included in the Funds' Statements of Assets and Liabilities as an investment and subsequently marked-to-market to reflect the current value of the option. The risk associated with purchasing put and call options is limited to the premium paid. Premiums paid for purchasing options which expire are treated as realized losses. Premiums paid for purchasing options which are exercised are added to the amounts paid (call) or offset against the proceeds (put) on the underlying security transaction to determine the realized gain or loss. If a Fund enters into a closing transaction, the Fund will realize a gain or loss, depending on whether the proceeds from the closing trans action are greater or less than the cost of the option.
Forward Foreign Currency Exchange Contracts
Forward foreign currency exchange contracts are agreements to exchange one currency for another at a future date at a specified price. These contracts are used to minimize the exposure to foreign exchange rate fluctuations during the period between trade and settlement date of the contract. Certain Funds may utilize forward foreign currency exchange contracts in connection with the settlement of purchases and sales of securities. Certain Funds may also enter into these contracts to hedge certain other foreign currency denominated assets. Contracts to buy generally are used to acquire exposure to foreign currencies, while contracts to sell are generally used to hedge the Funds' investments against currency fluctuations. Forward foreign currency exchange contracts are valued daily at the current exchange rate of the underlying currency, resulting in unrealized gains (losses) which become realized at the time the forward foreign cu rrency exchange contracts are closed or mature. Realized and unrealized gains (losses) arising from such transactions are included in net realized and unrealized gains (losses) on foreign currency transactions. The use of forward foreign currency exchange contracts does not eliminate fluctuations in the prices of the Funds' portfolio securities. While the maximum potential loss from such contracts is the aggregate face value in U.S. dollars at the time the contract was opened, exposure is typically limited to the change in value of the contract (in U.S. dollars) over the period it remains open. The Funds could also be exposed to risk that counterparties of the contracts may be unable to fulfill the terms of the contracts.
Repurchase Agreements
Each Fund may engage in repurchase agreement transactions with institutions that Columbia has determined are creditworthy. Each Fund, through its custodian, receives delivery of the underlying securities collateralizing a repurchase agreement. Columbia is responsible for determining that the collateral is at least equal, at all times, to the value of the repurchase obligation including interest. A repurchase agreement transaction involves certain risks in the event of default or insolvency of the counterparty. These risks include possible delays or restrictions on each Fund's ability to
102
Stock Funds, September 30, 2008 (continued)
dispose of the underlying securities and a possible decline in the value of the underlying securities during the period while the Funds seek to assert their rights.
Delayed Delivery Securities
Each Fund may trade securities on other than normal settlement terms, including securities purchased or sold on a "when-issued" basis. This may increase the risk if the other party to the transaction fails to deliver and causes the Funds to subsequently invest at less advantageous prices. Each Fund holds until the settlement date, in a segregated account, cash or liquid securities in an amount equal to the delayed delivery commitment.
Treasury Inflation Protected Securities
Columbia Asset Allocation Fund may invest in treasury inflation protected securities ("TIPS"). The principal amount of TIPS is adjusted periodically for inflation based on a monthly published index. Interest payments are based on the inflation-adjusted principal at the time the interest is paid. These adjustments are recorded as interest income on the Statements of Operations.
Foreign Currency Transactions
The values of all assets and liabilities quoted in foreign currencies are translated into U.S. dollars at that day's exchange rates. Net realized and unrealized gains (losses) on foreign currency transactions include gains (losses) arising from the fluctuation in exchange rates between trade and settlement dates on securities transactions, gains (losses) arising from the disposition of foreign currency and currency gains (losses) between the accrual and payment dates on dividends, interest income and foreign withholding taxes.
For financial statement purposes, the Funds do not distinguish that portion of gains (losses) on investments which is due to changes in foreign exchange rates from that which is due to changes in market prices of the investments. Such fluctuations are included with the net realized and unrealized gains (losses) on investments on the Statements of Operations.
Income Recognition
Interest income is recorded on the accrual basis. Premium and discount are amortized and accreted, respectively, on all debt securities, unless otherwise noted. Corporate actions and dividend income are recorded on the ex-date except for certain foreign securities which are recorded as soon after the ex-date as the Funds become aware of such, net of any non-reclaimable tax withholdings. Awards from class action litigation are recorded as a reduction of cost if the Funds still own the applicable securities on the payment date. If the Funds no longer own the applicable securities, the proceeds are recorded as realized gains. Distributions received from real estate investment trusts (REITs) in excess of their income are recorded as a reduction of the cost of the related investments. If the Funds no longer own the applicable securities, any distributions received in excess of income are recorded as realized gains.
Expenses
General expenses of the Trust are allocated to the Funds and other series of the Trust based upon relative net assets or other expense allocation methodologies determined by the nature of the expense. Expenses directly attributable to a Fund are charged to such Fund.
Determination of Class Net Asset Value
All income, expenses (other than class-specific expenses, as shown on the Statements of Operations) and realized and unrealized gains (losses) are allocated to each class of the Funds on a daily basis, based on the relative net assets of each class, for purposes of determining the net asset value of each class.
Federal Income Tax Status
Each Fund intends to qualify each year as a "regulated investment company" under Subchapter M of the Internal Revenue Code, as amended, and will distribute substantially all of its tax-exempt or taxable income, if any, for its tax year, and as such will not be subject to federal income taxes. In addition, each Fund intends to distribute in each calendar year substantially all of its net investment income, capital gains and certain other amounts, if any, such that each Fund should not be subject to federal excise tax. Therefore, no federal income or excise tax provision is recorded.
Distributions to Shareholders
Distributions from net investment income for Columbia Asset Allocation Fund and Columbia Disciplined Value Fund, if any, are declared and distributed quarterly. Distributions from net investment income for Columbia Large Cap Growth Fund,
103
Stock Funds, September 30, 2008 (continued)
Columbia Contrarian Core Fund and Columbia Small Cap Core Fund, if any, are declared and distributed annually. Net realized capital gains, if any, are distributed at least annually for all Funds. Income distributions and capital gain distributions are determined in accordance with federal income tax regulations which may differ from GAAP.
Indemnification
In the normal course of business, each Fund enters into contracts that contain a variety of representations and warranties and which provide general indemnities. A Fund's maximum exposure under these arrangements is unknown because this would involve future claims against a Fund. Also, under the Trust's organizational documents and by contract, the Trustees and officers of the Trust are indemnified against certain liabilities that may arise out of actions relating to their duties to the Trust. However, based on experience, the Funds expect the risk of loss due to these representations, warranties and indemnities to be minimal.
Note 3. Federal Tax Information
The timing and character of income and capital gain distributions are determined in accordance with income tax regulations, which may differ from GAAP. Reclassifications are made to each Fund's capital accounts for permanent tax differences to reflect income and gains available for distribution (or available capital loss carryforwards) under income tax regulations.
For the year ended September 30, 2008, permanent book and tax basis differences resulting primarily from differing treatments for net operating losses, foreign currency transactions, Section 988 bond bifurcation, redemption based payments treated as dividends paid deduction, paydown reclassifications, passive foreign investment company (PFIC) adjustments, distribution reclassifications, redemption in-kind capital gains, regulatory settlement agreements and market discount adjustments were identified and reclassified among the components of the Funds' net assets as follows:
| | | Undistributed
(Overdistributed)
Net Investment
Income | | Accumulated
Net Realized
Gain (Loss) | | Paid-In Capital | |
| Columbia Asset Allocation Fund | | $ | (160,024 | ) | | $ | 160,024 | | | $ | — | | |
| Columbia Large Cap Growth Fund | | | 985,493 | | | | 103,693 | | | | (1,089,186 | ) | |
| Columbia Disciplined Value Fund | | | (83,332 | ) | | | 83,332 | | | | — | | |
| Columbia Contrarian Core Fund | | | (100,503 | ) | | | 100,504 | | | | (1 | ) | |
| Columbia Small Cap Core Fund | | | 3,907,849 | | | | (18,021,697 | ) | | | 14,113,848 | | |
Net investment income and net realized gains (losses), as disclosed on the Statements of Operations, and net assets were not affected by these reclassifications.
The tax character of distributions paid during the years ended September 30, 2008 and September 30, 2007 was as follows:
| | | September 30, 2008 | |
| | | Ordinary
Income* | | Long-Term
Capital Gains | |
| Columbia Asset Allocation Fund | | $ | 16,866,926 | | | $ | 18,874,251 | | |
| Columbia Large Cap Growth Fund | | | 45,787,868 | | | | 84,902,930 | | |
| Columbia Disciplined Value Fund | | | 30,074,083 | | | | 33,058,052 | | |
| Columbia Contrarian Core Fund | | | 4,007,433 | | | | 38,235,728 | | |
| Columbia Small Cap Core Fund | | | 15,046,065 | | | | 202,806,013 | | |
104
Stock Funds, September 30, 2008 (continued)
| | | September 30, 2007 | |
| | | Ordinary
Income* | | Long-Term
Capital Gains | |
| Columbia Asset Allocation Fund | | $ | 11,955,479 | | | $ | 18,736,465 | | |
| Columbia Large Cap Growth Fund | | | 2,687,241 | | | | 28,705,826 | | |
| Columbia Disciplined Value Fund | | | 16,400,131 | | | | 29,667,946 | | |
| Columbia Contrarian Core Fund | | | 5,594,148 | | | | 30,498,492 | | |
| Columbia Small Cap Core Fund | | | 11,054,727 | | | | 133,824,617 | | |
* For tax purposes short-term capital gains distributions, if any, are considered ordinary income distributions.
As of September 30, 2008, the components of distributable earnings on a tax basis were as follows:
| | | Undistributed
Ordinary
Income | | Undistributed
Long-Term
Capital Gains | | Net Unrealized
Appreciation
(Depreciation)* | |
| Columbia Asset Allocation Fund | | $ | 43,975 | | | $ | — | | | $ | (12,302,407 | ) | |
| Columbia Large Cap Growth Fund | | | 2,727,575 | | | | — | | | | (52,048,165 | ) | |
| Columbia Disciplined Value Fund | | | 321,631 | | | | — | | | | (22,050,952 | ) | |
| Columbia Contrarian Core Fund | | | 1,954,801 | | | | — | | | | 23,687,141 | | |
| Columbia Small Cap Core Fund | | | — | | | | 51,248,182 | | | | 8,632,442 | | |
* The differences between book-basis and tax-basis net unrealized appreciation/depreciation are primarily due to deferral of losses from wash sales, PFIC adjustments, discount accretion/premium amortization on debt securities and identified straddle loss deferrals.
Unrealized appreciation and depreciation at September 30, 2008, based on cost of investments for federal income tax purposes, excluding any unrealized appreciation and depreciation from changes in the value of other assets and liabilities resulting from changes in exchange rates, were:
| | | Unrealized
Appreciation | | Unrealized
Depreciation | | Net Unrealized
Appreciation
(Depreciation) | |
| Columbia Asset Allocation Fund | | $ | 15,275,281 | | | $ | (27,577,688 | ) | | $ | (12,302,407 | ) | |
| Columbia Large Cap Growth Fund | | | 94,130,298 | | | | (146,178,463 | ) | | | (52,048,165 | ) | |
| Columbia Disciplined Value Fund | | | 31,629,520 | | | | (53,680,472 | ) | | | (22,050,952 | ) | |
| Columbia Contrarian Core Fund | | | 44,927,455 | | | | (21,240,314 | ) | | | 23,687,141 | | |
| Columbia Small Cap Core Fund | | | 141,290,366 | | | | (132,657,924 | ) | | | 8,632,442 | | |
The following capital loss carryforwards, determined as of September 30, 2008, may be available to reduce taxable income arising from future net realized gains on investments, if any, to the extent permitted by the Internal Revenue Code:
| | | Year of Expiration | |
| | | 2009 | | 2010 | | 2011 | | Total | |
| Columbia Large Cap Growth Fund | | $ | 66,817,318 | | | $ | 75,033,010 | | | $ | 5,529,590 | | | $ | 147,379,918 | | |
| Columbia Contrarian Core Fund | | | — | | | | 1,963,275 | | | | — | | | | 1,963,275 | | |
105
Stock Funds, September 30, 2008 (continued)
Of the capital loss carryforwards attributable to Columbia Contrarian Core Fund, $1,963,275 (expiring September 30, 2010) remains from the Columbia Large Cap Core Fund merger with Columbia Contrarian Core Fund.
In addition Columbia Contrarian Core Fund utilized carryforwards of $2,914,806 during the year ended September 30, 2008 to offset current year gains.
Of the capital loss carryforwards attributable to Columbia Large Cap Growth Fund, $87,651,082 ($57,827,432 expiring September 30, 2009 and $29,823,650 expiring September 30, 2010) remain from the Columbia Large Cap Growth Fund merger with Columbia Growth Fund. In addition, the acquiring fund, Columbia Large Cap Growth Fund, utilized carryforwards of $1,819,868 to offset current year gains. The availability of a portion of the remaining capital loss carryforwards from the Columbia Large Cap Growth Fund may be limited in a given year.
Of the capital loss carryforwards attributable to Columbia Large Cap Growth Fund, $17,979,772 ($8,989,886 expiring September 30, 2009 and $8,989,886 expiring September 30, 2010) remain from the Columbia Large Cap Growth Fund merger with Columbia Tax Managed Growth Fund. In addition, the acquiring fund, Columbia Large Cap Growth Fund, utilized carryforwards of $8,989,886 to offset current year gains. The availability of a portion of the remaining capital loss carryforwards from the Columbia Large Cap Growth Fund may be limited in a given year.
Of the capital loss carryforwards attributable to Columbia Large Cap Growth Fund, $41,749,064 ($36,219,474 expiring September 30, 2010 and $5,529,590 expiring September 30, 2011) remain from the Columbia Large Cap Growth Fund merger with Columbia Growth Stock Fund. In addition, the acquiring fund, Columbia Large Cap Growth Fund, utilized carryforwards of $20,244,176 to offset current year gains. The availability of a portion of the remaining capital loss carryforwards from the Columbia Large Cap Growth Fund may be limited in a given year.
Under current tax rules, certain currency and capital losses realized after October 31 may be deferred and treated as occurring on the first day of the following fiscal year. As of September 30, 2008, Columbia Asset Allocation Fund, Columbia Large Cap Growth Fund and Columbia Disciplined Value Fund had post-October capital losses of $8,634,566, $35,595,157 and $46,767,021, respectively, attributed to security transactions which were deferred to October 1, 2008.
Under Financial Accounting Standards Board ("FASB") Interpretation No. 48, Accounting for Uncertainty in Income Taxes, an Interpretation of FASB Statement No. 109 ("FIN 48"), management determines whether a tax position of the Funds is more likely than not to be sustained upon examination by the applicable taxing authority, including resolution of any related appeals or litigation processes, based on the technical merits of the position. The tax benefit to be recognized is measured as the largest amount of benefit that is greater than fifty percent likely of being realized upon ultimate settlement. Management has evaluated the known implications of FIN 48 on its computation of net assets for each Fund. As a result of this evaluation, management has concluded that FIN 48 did not ha ve any effect on the Funds' financial statements. However, management's conclusions regarding FIN 48 may be subject to review and adjustment at a later date based on factors including, but not limited to, further implementation guidance from the FASB, new tax laws, regulations, and administrative interpretations (including relevant court decisions). The Funds' federal tax returns for the prior three fiscal years remain subject to examination by the Internal Revenue Service. The Funds are not aware of any tax positions for which it is reasonably possible that the total amounts of unrecognized tax benefits will significantly change in the next twelve months.
Note 4. Fees and Compensation Paid to Affiliates
Investment Advisory Fee
Columbia, an indirect, wholly owned subsidiary of Bank of America Corporation ("BOA"), provides investment advisory services to the Funds. In rendering investment advisory services to the Funds, Columbia may use the portfolio management and research resources of Columbia Management Pte. Ltd., an affiliate of Columbia. Columbia receives a monthly investment advisory fee based on each Fund's average daily net assets at the following annual rates:
First
$200 | | $200 Million
to $500
Million | | $500 Million
to $1
Million | | $1 Billion
to $1.5
Billion | | $1.5 Billion
to $2
Billion | | $2 Billion
to $3
Billion | | $3 Billion
to $6
Billion | | Over
Billion | | $6 Billion | |
| Columbia Asset | |
| Allocation Fund | | | 0.650 | % | | | 0.650 | % | | | 0.600 | % | | | 0.550 | % | | | 0.500 | % | | | 0.500 | % | | | 0.480 | % | | | 0.460 | % | |
| Columbia Large Cap | |
| Growth Fund | | | 0.700 | % | | | 0.575 | % | | | 0.450 | % | | | 0.450 | % | | | 0.450 | % | | | 0.450 | % | | | 0.450 | % | | | 0.450 | % | |
106
Stock Funds, September 30, 2008 (continued)
| | | First
$200
Million | | $200 Million
to $500
Million | | $500 Million
to $1
Billion | | $1 Billion
to $1.5
Billion | | $1.5 Billion
to $2
Billion | | $2 Billion
to $3
Billion | | $3 Billion
to $6
Billion | | Over
$6 Billion | |
| Columbia Disciplined | |
| Value Fund | | | 0.700 | % | | | 0.700 | % | | | 0.650 | % | | | 0.600 | % | | | 0.550 | % | | | 0.550 | % | | | 0.530 | % | | | 0.510 | % | |
| Columbia Contrarian | |
| Core Fund | | | 0.700 | % | | | 0.700 | % | | | 0.650 | % | | | 0.600 | % | | | 0.550 | % | | | 0.550 | % | | | 0.530 | % | | | 0.510 | % | |
| Columbia Small Cap | |
| Core Fund | | | 0.750 | % | | | 0.750 | % | | | 0.700 | % | | | 0.650 | % | | | 0.600 | % | | | 0.550 | % | | | 0.550 | % | | | 0.550 | % | |
For the year ended September 30, 2008, the effective investment advisory fee rates for the Funds, as a percentage of each Fund's average daily net assets, were as follows:
| | | Effective
Fee Rate | |
| Columbia Asset Allocation Fund | | | 0.65 | % | |
| Columbia Large Cap Growth Fund | | | 0.50 | % | |
| Columbia Disciplined Value Fund | | | 0.70 | % | |
| Columbia Contrarian Core Fund | | | 0.70 | % | |
| Columbia Small Cap Core Fund | | | 0.73 | % | |
Administration Fee
Columbia provides administrative and other services to the Funds. Columbia receives a monthly administration fee from each Fund, except Columbia Large Cap Growth Fund, at the annual rate of 0.067% of each Fund's average daily net assets. Columbia receives a monthly administration fee from Columbia Large Cap Growth Fund at the annual rate of 0.050% of the Fund's average daily net assets.
Pricing and Bookkeeping Fees
The Funds have entered into a Financial Reporting Services Agreement (the "Financial Reporting Services Agreement") with State Street Bank & Trust Company ("State Street") and Columbia pursuant to which State Street provides financial reporting services to the Funds. The Funds have also entered into an Accounting Services Agreement (collectively with the Financial Reporting Services Agreement, the "State Street Agreements") with State Street and Columbia pursuant to which State Street provides accounting services to the Funds. Under the State Street Agreements, each Fund pays State Street an annual fee of $38,000 paid monthly plus an additional monthly fee based on an annualized percentage rate of average daily net assets of each Fund for the month. The aggregate fee per Fund will not exceed $140,000 per year (exclusive of out-of-pocket expenses and charges). The Funds also reimburse State Street for certain out-of-pocket ex penses and charges.
The Funds have entered into a Pricing and Bookkeeping Oversight and Services Agreement (the "Services Agreement") with Columbia. Under the Services Agreement, Columbia provides services related to Fund expenses and the requirements of the Sarbanes-Oxley Act of 2002, and provides oversight of the accounting and financial reporting services provided by State Street. Under the Services Agreement, the Funds reimburse Columbia for out-of-pocket expenses.
For the year ended September 30, 2008, the amounts charged to the Funds by affiliates included in the Statements of Operations under "Pricing and bookkeeping fees" were as follows:
| | | Amounts
Charged
by Affiliates | |
| Columbia Asset Allocation Fund | | $ | 3,106 | | |
| Columbia Large Cap Growth Fund | | | 3,106 | | |
| Columbia Disciplined Value Fund | | | 3,106 | | |
| Columbia Contrarian Core Fund | | | 3,106 | | |
| Columbia Small Cap Core Fund | | | 3,106 | | |
107
Stock Funds, September 30, 2008 (continued)
Transfer Agent Fee
Columbia Management Services, Inc. (the "Transfer Agent"), an affiliate of Columbia and an indirect, wholly owned subsidiary of BOA, provides shareholder services to the Funds and has contracted with Boston Financial Data Services ("BFDS") to serve as sub-transfer agent. The Transfer Agent is entitled to receive a fee for its services, paid monthly, at the annual rate of $17.34 per open account plus reimbursement of certain sub-transfer agent fees paid by the Transfer Agent (exclusive of BFDS fees), calculated based on assets held in omnibus accounts and intended to recover the cost of payments to other parties (including affiliates of BOA) for services to those accounts. Prior to November 1, 2007, the annual rate was $17.00 per open account. The Transfer Agent pays the fees of BFDS for services as sub-transfer agent and is not entitled to reimbursement for such fees from the Funds. The Transfer Agent may also retain, as additio nal compensation for its services, fees for wire, telephone and redemption orders, Individual Retirement Account ("IRA") trustee agent fees and account transcript fees due to the Transfer Agent from shareholders of the Funds and credits (net of bank charges) earned with respect to balances in accounts the Transfer Agent maintains in connection with its services to the Funds. The Transfer Agent also receives reimbursement for certain out-of-pocket expenses.
An annual minimum account balance fee of $20 may apply to certain accounts with a value below each Fund's initial minimum investment requirements to reduce the impact of small accounts on transfer agent fees. These minimum account balance fees are recorded as part of expense reductions on the Statements of Operations. For the year ended September 30, 2008, these minimum account balance fees reduced total expenses as follows:
| | | Minimum
Account
Balance Fees | |
| Columbia Asset Allocation Fund | | $ | 17,106 | | |
| Columbia Large Cap Growth Fund | | | 136,055 | | |
| Columbia Disciplined Value Fund | | | 15,528 | | |
| Columbia Contrarian Core Fund | | | 25,653 | | |
| Columbia Small Cap Core Fund | | | 6,830 | | |
Underwriting Discounts, Service and Distribution Fees
Columbia Management Distributors, Inc. (the "Distributor"), an affiliate of Columbia and an indirect, wholly owned subsidiary of BOA, is the principal underwriter of the Funds' shares. For the year ended September 30, 2008, the Distributor has retained net underwriting discounts and net CDSC fees as follows:
| | | Front-End Sales Charge | | CDSC | |
| | | Class A | | Class E | | Class T | | Class A | | Class B | | Class C | | Class E | | Class T | |
| Columbia Asset Allocation Fund | | $ | 6,253 | | | $ | — | | | $ | 3,295 | | | $ | — | | | $ | 6,556 | | | $ | 136 | | | $ | — | | | $ | — | | |
| Columbia Large Cap Growth Fund | | | 15,920 | | | | — | | | | 8,731 | | | | 795 | | | | 88,380 | | | | 3,369 | | | | 75 | | | | 4,712 | | |
| Columbia Disciplined Value Fund | | | 13,189 | | | | — | | | | 2,074 | | | | 161 | | | | 11,168 | | | | 2,542 | | | | — | | | | — | | |
| Columbia Contrarian Core Fund | | | 6,075 | | | | — | | | | 4,121 | | | | 11 | | | | 6,252 | | | | 217 | | | | — | | | | — | | |
| Columbia Small Cap Core Fund | | | 1,180 | | | | — | | | | 2,334 | | | | — | | | | 59,022 | | | | 339 | | | | — | | | | 451 | | |
The Funds have adopted distribution and shareholder servicing plans (the "Plans") pursuant to Rule 12b-1 under the 1940 Act, which require the payment of distribution and service fees. The fees are intended to compensate the Distributor and/or eligible
108
Stock Funds, September 30, 2008 (continued)
selling and/or servicing agents for selling shares of the Funds and providing services to investors. Payments under the Plans, which are calculated daily and paid monthly, are based on the average daily net assets of each Fund at the following annual rates:
| | | Distribution Fee | |
| | | Class A | | Class B | | Class C | | Class E | | Class F | |
| Columbia Asset Allocation Fund | | | 0.10 | % | | | 0.75 | % | | | 0.75 | % | | | —- | | | | — | | |
| Columbia Large Cap Growth Fund | | | 0.10 | % | | | 0.75 | % | | | 0.75 | % | | | 0.10 | % | | | 0.75 | % | |
| Columbia Disciplined Value Fund | | | 0.10 | % | | | 0.75 | % | | | 0.75 | % | | | -— | | | | — | | |
| Columbia Contrarian Core Fund | | | 0.10 | % | | | 0.75 | % | | | 0.75 | % | | | -— | | | | — | | |
| Columbia Small Cap Core Fund | | | 0.10 | % | | | 0.75 | % | | | 0.75 | % | | | -— | | | | — | | |
| | | Service Fee | |
| | | Class A | | Class B | | Class C | | Class E | | Class F | |
| Columbia Asset Allocation Fund | | | 0.25 | % | | | 0.25 | % | | | 0.25 | % | | | — | | | | — | | |
| Columbia Large Cap Growth Fund | | | 0.25 | % | | | 0.25 | % | | | 0.25 | % | | | 0.25 | % | | | 0.25 | % | |
| Columbia Disciplined Value Fund | | | 0.25 | % | | | 0.25 | % | | | 0.25 | % | | | — | | | | — | | |
| Columbia Contrarian Core Fund | | | 0.25 | % | | | 0.25 | % | | | 0.25 | % | | | — | | | | — | | |
| Columbia Small Cap Core Fund | | | 0.25 | % | | | 0.25 | % | | | 0.25 | % | | | — | | | | — | | |
The Funds may pay distribution and service (12b-1) fees at the maximum annual rate of 0.35% of each Fund's average daily net assets attributable to Class A shares (comprised of up to 0.10% for distribution services and up to 0.25% for shareholder services), but limited such fees to an aggregate of not more than 0.25% for Class A shares during the current fiscal year. For the year ended September 30, 2008, the distribution and service fees were 0.00% and 0.25%, respectively, of each Fund's average daily net assets.
Shareholder Services Fees
The Funds have adopted a shareholder services plan that permits them to pay for certain services provided to Class T shareholders by service organizations. The Funds may pay shareholder services fees (which are included in other expenses) of up to 0.25% of each Fund's average daily net assets attributable to Class T shares for shareholder liaison services and up to 0.25% of each Fund's average daily net assets attributable to Class T shares for administrative support services, provided, however, that the aggregate fee shall not exceed 0.30% of each Fund's average daily net assets attributable to Class T shares. For the year ended September 30, 2008, the shareholder services fee was 0.30% of each Fund's average daily net assets attributable to Class T shares.
Fee Waivers and Expense Reimbursements
Columbia and/or some of the Funds' other services providers have voluntarily agreed to waive fees and/or reimburse Columbia Contrarian Core Fund for certain expenses so that total expenses (exclusive of distribution and service fees, brokerage commissions, interest, taxes and extraordinary expenses, but inclusive of custodial charges relating to overdrafts, if any), after giving effect to any balance credits from the Fund's custodian, will not exceed 0.89% of the Fund's average daily net assets. This arrangement may be modified or terminated by Columbia at any time.
Fees Paid to Officers and Trustees
All officers of the Funds are employees of Columbia or its affiliates and, with the exception of the Funds' Chief Compliance Officer, receive no compensation from the Funds. The Board of Trustees has appointed a Chief Compliance Officer to the Funds in accordance with federal securities regulations. The Funds, along with other affiliated funds, pay their pro-rata share of the expenses associated with the
109
Stock Funds, September 30, 2008 (continued)
Chief Compliance Officer. Each Fund's expenses for the Chief Compliance Officer will not exceed $15,000 per year.
The Trust's eligible Trustees may participate in a deferred compensation plan which may be terminated at any time. Obligations of the plan will be paid solely out of the Funds' assets.
As a result of fund mergers, certain Funds assumed the liabilities of the deferred compensation plan of the acquired fund. The deferred compensation plan of the acquired fund may be terminated at any time. Any payments to plan participants are paid solely out of the Fund's assets.
Note 5. Custody Credits
Each Fund has an agreement with its custodian bank under which custody fees may be reduced by balance credits. These credits are recorded as part of expense reductions on the Statements of Operations. The Funds could have invested a portion of the assets utilized in connection with the expense offset arrangement in an income-producing asset if they had not entered into such an agreement.
For the year ended September 30, 2008, these custody credits reduced total expenses as follows:
| | | Custody
Credits | |
| Columbia Asset Allocation Fund | | $ | 7,650 | | |
| Columbia Large Cap Growth Fund | | | 4,257 | | |
| Columbia Disciplined Value Fund | | | 419 | | |
| Columbia Contrarian Core Fund | | | 375 | | |
| Columbia Small Cap Core Fund | | | 3,315 | | |
Note 6. Portfolio Information
For the year ended September 30, 2008, the cost of purchases and proceeds from sales of securities, excluding short-term obligations, were as follows:
| | | U.S Government Securities | | Other Investment Securities | |
| | | Purchases | | Sales | | Purchases | | Sales | |
| Columbia Asset Allocation Fund | | $ | 38,046,776 | | | $ | 39,009,535 | | | $ | 274,171,465 | | | $ | 299,274,588 | | |
| Columbia Large Cap Growth Fund | | | — | | | | — | | | | 2,777,511,758 | | | | 2,905,962,964 | | |
| Columbia Disciplined Value Fund | | | — | | | | — | | | | 328,204,767 | | | | 389,517,480 | | |
| Columbia Contrarian Core Fund | | | — | | | | — | | | | 409,209,733 | | | | 463,351,604 | | |
| Columbia Small Cap Core Fund | | | — | | | | — | | | | 225,429,974 | | | | 626,724,082 | | |
Note 7. Redemption in-Kind
Sales of securities for Columbia Small Cap Core Fund include the value of securities delivered through an in-kind redemption of certain Fund shares on July 31, 2008. Any realized gain on securities delivered through an in-kind redemption of Fund shares is not taxable to the Columbia Small Cap Core Fund. The value of securities and realized loss on securities delivered through an in-kind redemption of Fund shares aggregated $148,899,666 and $991,257, respectively. Prior to the in-kind redemption, the shareholders owned 17.6% of Columbia Small Cap Core Fund.
Note 8. Regulatory Settlements
As of September 30, 2008, Columbia Large Cap Growth Fund was entitled to receive payments of $1,089,186 relating to certain regulatory settlements the Fund had participated in during the year. The payments have been included in "Increase from regulatory settlements" on the Statements of Changes in Net Assets.
Note 9. Line of Credit
The Funds and other affiliated funds participated in a $350,000,000 committed, unsecured revolving line of credit and a $150,000,000 uncommitted, unsecured line of credit,
110
Stock Funds, September 30, 2008 (continued)
both provided by State Street. Borrowings are available for short-term liquidity or temporary or emergency purposes.
Interest on the committed line of credit is charged to each participating fund based on the fund's borrowings at a rate per annum equal to the Federal Funds Rate plus 0.50%. In addition, a commitment fee of 0.10% per annum is accrued and apportioned among the participating funds. Interest on the uncommitted line of credit is charged to each participating fund based on the fund's borrowings at a rate per annum equal to the Federal Funds Rate plus 0.375%. State Street charges an annual operations agency fee of $40,000 for the committed line of credit and may charge an annual administration fee of $15,000 for the uncommitted line of credit. The commitment fee, the operations agency fee and the administration fee are accrued and apportioned among the participating funds pro rata based on their relative net assets.
For the year ended September 30, 2008, the average daily loan balance outstanding on days where borrowing existed, and the weighted average interest rate of each Fund were as follows:
| | | Average
Borrowings | | Weighted
Average
Interest
Rate | |
| Columbia Disciplined Value Fund | | $ | 1,687,500 | | | | 3.48 | % | |
| Columbia Contrarian Core Fund | | | 1,000,000 | | | | 2.69 | | |
Note 10. Securities Lending
Each Fund may lend its securities to certain approved brokers, dealers and other financial institutions. Each loan is collateralized by cash, in an amount at least equal to the market value of the securities loaned plus accrued income from the investment of collateral. The market value of the loaned securities is determined at the close of business of the Funds and any additional required collateral is delivered to the Funds on the next business day. The collateral received is invested and the income generated by the investment of the collateral, net of any fees remitted to State Street as the lending agent and borrower rebates, is paid to the Funds. Generally, in the event of borrower default, the Funds have the right to use the collateral to offset any losses incurred. In the event the Funds are delayed or prevented from exercising their right to dispose of the collateral, there may be a potential loss to the Funds. The Funds bear the risk of loss with respect to the investment of collateral.
Note 11. Shares of Beneficial Interest
As of September 30, 2008, the Funds had shareholders whose shares were beneficially owned by participant accounts over which BOA and/or any of its affiliates had either sole or joint investment discretion. The percentages of shares of beneficial interest outstanding held therein are as follows:
| | | % of Shares
Outstanding
Held | |
| Columbia Large Cap Growth Fund | | | 28.3 | | |
| Columbia Disciplined Value Fund | | | 52.7 | | |
| Columbia Contrarian Core Fund | | | 19.9 | | |
| Columbia Small Cap Core Fund | | | 29.5 | | |
As of September 30, 2008, the Columbia Small Cap Core Fund had one shareholder that held 8.7% of the shares outstanding over which BOA and/or any of its affiliates did not have investment discretion.
Subscription and redemption activity of these accounts may have a significant effect on the operations of the Funds.
Note 12. Significant Risks and Contingencies
Sector Focus Risk
Certain Funds may focus their investments in certain sectors, subjecting them to greater risk than a fund that is less focused.
High-Yield Securities Risk
Investing in high-yield securities may involve greater credit risk and considerations not typically associated with investing in U.S. Government bonds and other higher quality fixed income securities. These securities are non-investment grade securities, often referred to as "junk" bonds. Economic downturns may disrupt the high yield market and impair the ability of issuers to repay principal and interest. Also, an increase in interest rates would likely have an adverse impact on the value of such obligations. Moreover, high-yield securities may be less liquid to the extent that there is no established secondary market.
111
Stock Funds, September 30, 2008 (continued)
Foreign Securities Risk
There are certain additional risks involved when investing in foreign securities. These risks may involve foreign currency exchange rate fluctuations, adverse political and economic developments and the possible prevention of currency exchange or other foreign governmental laws or restrictions. In addition, the liquidity of foreign securities may be more limited than that of domestic securities.
Investments in emerging market countries are subject to additional risk. The risk of foreign investments is typically increased in less developed countries. These countries are also more likely to experience high levels of inflation, deflation or currency devaluation which could hurt their economies and securities markets.
Asset-Backed Securities Risk
Investing in asset-backed securities is subject to certain risks. For example, the value of asset-backed securities may be affected by, among other factors, changes in: interest rates, the market's assessment of the quality of underlying assets, the creditworthiness of the servicer for the underlying assets, information concerning the originator of the underlying assets, or the creditworthiness or rating of the entities that provide any supporting letters of credit, surety bonds, derivative instruments, or other credit enhancement. The value of asset-backed securities also will be affected by the exhaustion, termination or expiration of any credit enhancement.
Mortgage-Backed Securities Risk
The value of the mortgage-backed securities may be affected by changes in interest rates, factors concerning the interests in and structure of the issuer or the originator of the mortgages, the creditworthiness of the entities that provide any supporting letters of credit, surety bonds or other credit enhancements or the quality of the underlying assets or the market's assessment thereof. Mortgage-backed securities are subject to prepayment risk, which is the possibility that the underlying mortgage may be refinanced or prepaid prior to maturity during periods of declining or low interest rates, causing a Fund to have to reinvest the money received in securities that have lower yields. In addition, the impact of prepayments on the value of mortgage-backed securities may be difficult to predict and may result in greater volatility.
Legal Proceedings
On February 9, 2005, Columbia Management Advisors, Inc. (which has since merged into Banc of America Capital Management, LLC (now named Columbia Management Advisors, LLC)) ("Columbia") and Columbia Funds Distributor, Inc. (which has been renamed Columbia Management Distributors, Inc.) (the "Distributor") (collectively, the "Columbia Group") entered into an Assurance of Discontinuance with the New York Attorney General ("NYAG") (the "NYAG Settlement") and consented to the entry of a cease-and-desist order by the Securities and Exchange Commission ("SEC") (the "SEC Order") on matters relating to mutual fund trading.
Under the terms of the SEC Order, the Columbia Group agreed, among other things, to: pay $70 million in disgorgement and $70 million in civil money penalties; cease and desist from violations of the antifraud provisions and certain other provisions of the federal securities laws; maintain certain compliance and ethics oversight structures; retain an independent consultant to review the Columbia Group's applicable supervisory, compliance, control and other policies and procedures; and retain an independent distribution consultant (see below). The Columbia Funds have also voluntarily undertaken to implement certain governance measures designed to maintain the independence of their boards of trustees. The NYAG Settlement also, among other things, requires Columbia and its affiliates to reduce management fees for certain Columbia Funds (including the former Nations Funds) and other mutual funds collectively by $32 million per year f or five years, for a projected total of $160 million in management fee reductions.
Pursuant to the procedures set forth in the SEC Order, the $140 million in settlement amounts described above is being distributed in accordance with a distribution plan that was developed by an independent distribution consultant and approved by the SEC on April 6, 2007. Distributions under the distribution plan began in late June 2007.
A copy of the SEC Order is available on the SEC website at http://www.sec.gov. A copy of the NYAG Settlement is available as part of the Bank of America Corporation Form 8-K filing on February 10, 2005.
In connection with the events described above, various parties have filed suit against certain funds, the Trustees of the
112
Stock Funds, September 30, 2008 (continued)
Columbia Funds, FleetBoston Financial Corporation and its affiliated entities and/or Bank of America and its affiliated entities.
On February 20, 2004, the Judicial Panel on Multidistrict Litigation transferred these cases and cases against other mutual fund companies based on similar allegations to the United States District Court in Maryland for consolidated or coordinated pretrial proceedings (the "MDL"). Subsequently, additional related cases were transferred to the MDL. On September 29, 2004, the plaintiffs in the MDL filed amended and consolidated complaints. One of these amended complaints is a putative class action that includes claims under the federal securities laws and state common law, and that names Columbia, the Distributor, the Trustees of the Columbia Funds, Bank of America Corporation and others as defendants. Another of the amended complaints is a derivative action purportedly on behalf of the Columbia Funds that asserts claims under federal securities laws and state common law.
On February 25, 2005, Columbia and other defendants filed motions to dismiss the claims in the pending cases. On March 1, 2006, for reasons stated in the court's memoranda dated November 3, 2005, the U.S. District Court for the District of Maryland granted in part and denied in part the defendants' motions to dismiss. The court dismissed all of the class action claims pending against the Columbia Funds Trusts. As to Columbia and the Distributor, the claims under the Securities Act of 1933, the claims under Sections 34(b) and 36(a) of the Investment Company Act of 1940 ("ICA") and the state law claims were dismissed. The claims under Sections 10(b) and 20(a) of the Securities Exchange Act of 1934 and claims under Section 36(b) of the ICA were not dismissed.
On March 21, 2005, a purported class action was filed in Massachusetts state court alleging that certain conduct, including market timing, entitled Class B shareholders in certain Columbia funds to an exemption from contingent deferred sales charges upon early redemption ("the CDSC Lawsuit"). The CDSC Lawsuit was removed to federal court in Massachusetts and transferred to the MDL.
On September 14, 2007, the plaintiffs and the Columbia defendants named in the MDL, including the Columbia Funds, entered into a stipulation of settlement with respect to all Columbia-related claims in the MDL described above, including the CDSC Lawsuit. The settlement is subject to court approval.
In 2004, the Columbia Funds' adviser and distributor and certain affiliated entities and individuals were named as defendants in certain purported shareholder class and derivative actions making claims, including claims under the Investment Company and the Investment Advisers Acts of 1940 and state law. Certain Columbia Funds were named as nominal defendants. The suits allege, inter alia, that the fees and expenses paid by the funds are excessive and that the advisers and their affiliates inappropriately used fund assets to distribute the funds and for other improper purposes. On March 2, 2005, the actions were consolidated in the Massachusetts federal court as In re Columbia Entities Litigation. The plaintiffs filed a consolidated amended complaint on June 9, 2005. On November 30, 2005, the judge dismissed all claims by plaintiffs and entered final judgment in favor of the defendants. The plaintiffs appealed to the United States Court of Appeals for the First Circuit on December 30, 2005. A stipulation and settlement agreement dated January 19, 2007 was filed in the First Circuit on February 14, 2007, with a joint stipulation of dismissal and motion for remand to obtain district court approval of the settlement. That joint motion was granted and the appeal was dismissed. On March 6, 2007, the case was remanded to the District Court. The settlement, approved by the District Court on September 18, 2007, became effective October 19, 2007. Pursuant to the settlement, the funds' adviser and/or its affiliates made certain payments, including plaintiffs' attorneys' fees and costs of notice to class members.
Note 13. Subsequent Event
On October 16, 2008 the uncommitted and committed lines of credit discussed in Note 8 were terminated and amended, respectively. The Funds and other affiliated funds now participate in a $280,000,000 committed, unsecured revolving line of credit. The maximum amount that may be borrowed by any fund is limited to the lesser of $200,000,000 and a Fund's borrowing limit set forth in a Fund's registration statement. Interest is charged to each participating fund based on the fund's borrowings at a rate per annum equal to the greater of the Federal Funds Rate plus 0.50% and the overnight LIBOR Rate plus 0.50%. In addition, an annual operations agency fee of $20,000, an amendment fee of 0.02% and a commitment fee of 0.12% per annum are accrued and apportioned among the participating funds pro rata based on their relative net assets.
113
Report of Independent Registered Public Accounting Firm
To the Trustees and the Shareholders of Columbia Funds Series Trust I
In our opinion, the accompanying statements of assets and liabilities, including the investment portfolios, and the related statements of operations and of changes in net assets and the financial highlights present fairly, in all material respects, the financial position of Columbia Asset Allocation Fund, Columbia Large Cap Growth Fund, Columbia Disciplined Value Fund, Columbia Contrarian Core Fund (formerly Columbia Common Stock Fund) and Columbia Small Cap Core Fund (constituting part of Columbia Funds Series Trust I, hereafter collectively referred to as the "Funds") at September 30, 2008, the results of each of their operations for the year then ended, the changes in each of their net assets for each of the two years in the period then ended, and the financial highlights for each of the five years in the period then ended, in conformity with accounting principles generally accepted in the United States of America. These fina ncial statements and financial highlights (hereafter referred to as "financial statements") are the responsibility of the Funds' management. Our responsibility is to express an opinion on these financial statements based on our audits. We conducted our audits of these financial statements in accordance with the standards of the Public Company Accounting Oversight Board (United States). Those standards require that we plan and perform the audit to obtain reasonable assurance about whether the financial statements are free of material misstatement. An audit includes examining, on a test basis, evidence supporting the amounts and disclosures in the financial statements, assessing the accounting principles used and significant estimates made by management, and evaluating the overall financial statement presentation. We believe that our audits, which included confirmation of securities at September 30, 2008 by correspondence with the custodian and brokers, provide a reasonable basis for our opinion.
PricewaterhouseCoopers LLP
Boston, Massachusetts
November 21, 2008
114
Federal Income Tax Information (Unaudited)
Columbia Asset Allocation Fund
For the fiscal year ended September 30, 2008, the Fund designates long-term capital gains of $1,600,995.
For non-corporate shareholders 25.68% or the maximum amount allowable under the Jobs and Growth Tax Relief Reconciliation Act of 2003, of ordinary income distributed by the Fund for the period October 1, 2007 to September 30, 2008 may represent qualified dividend income. Final information will be provided in your 2008 Form 1099-DIV.
14.68% of the ordinary income distributed by the Fund, for the year ended September 30, 2008, qualifies for the corporate dividends received deduction.
Columbia Large Cap Growth Fund
For non-corporate shareholders 37.82% or the maximum amount allowable under the Jobs and Growth Tax Relief Reconciliation Act of 2003, of ordinary income distributed by the Fund for the period October 1, 2007 to September 30, 2008 may represent qualified dividend income. Final information will be provided in your 2008 Form 1099-DIV.
36.65% of the ordinary income distributed by the Fund, for the year ended September 30, 2008, qualifies for the corporate dividends received deduction.
Columbia Disciplined Value Fund
For the fiscal year ended September 30, 2008, the Fund designates long-term capital gains of $800,164.
For non-corporate shareholders 42.06% or the maximum amount allowable under the Jobs and Growth Tax Relief Reconciliation Act of 2003, of ordinary income distributed by the Fund for the period October 1, 2007 to September 30, 2008 may represent qualified dividend income. Final information will be provided in your 2008 Form 1099-DIV.
42.07% of the ordinary income distributed by the Fund, for the year ended September 30, 2008, qualifies for the corporate dividends received deduction.
Columbia Contrarian Core Fund
For non-corporate shareholders 100.00% or the maximum amount allowable under the Jobs and Growth Tax Relief Reconciliation Act of 2003, of ordinary income distributed by the Fund for the period October 1, 2007 to September 30, 2008 may represent qualified dividend income. Final information will be provided in your 2008 Form 1099-DIV.
100.00% of the ordinary income distributed by the Fund, for the year ended September 30, 2008, qualifies for the corporate dividends received deduction.
Columbia Small Cap Core Fund
For the fiscal year ended September 30, 2008, the Fund designates long-term capital gains of $92,491,754.
For non-corporate shareholders 61.89% or the maximum amount allowable under the Jobs and Growth Tax Relief Reconciliation Act of 2003, of ordinary income distributed by the Fund for the period October 1, 2007 to September 30, 2008 may represent qualified dividend income. Final information will be provided in your 2008 Form 1099-DIV.
69.16% of the ordinary income distributed by the Fund, for the year ended September 30, 2008, qualifies for the corporate dividends received deduction.
115
Fund Governance
The Trustees serve terms of indefinite duration. The names, addresses and ages of the Trustees and officers of the Funds in Columbia Funds Series Trust I, the year each was first elected or appointed to office, their principal business occupations during at least the last five years, the number of Funds overseen by each Trustee and other directorships they hold are shown below. Each officer listed below serves as an officer of each Fund in the Columbia Funds Complex.
Independent Trustees
Name, Address and Year of Birth,
Position with Funds, Year First
Elected or Appointed to Office | | Principal Occupation(s) During Past Five Years, Number of Funds in Columbia
Funds Complex Overseen by Trustee, Other Directorships Held
| |
| John D. Collins (Born 1938) | |
|
c/o Columbia Management Advisors, LLC
One Financial Center
Boston, MA 02111
Trustee1 (since 2007) | | Retired. Consultant, KPMG, LLP (accounting and tax firm) from July 1999 to June 2000; Partner, KPMG, LLP from March 1962 to June 1999. Oversees 80, Mrs. Fields Famous Brands LLC (consumer products); Suburban Propane Partners, L.P.; and Montpelier Re (underwriting firm) | |
|
| Rodman L. Drake (Born 1943) | |
|
c/o Columbia Management Advisors, LLC
One Financial Center
Boston, MA 02111
Trustee1 (since 2007) | | Co-Founder of Baringo Capital LLC (private equity) since 2002; President, Continuation Investments Group, Inc. from 1997 to 2001. Oversees 80, Jackson Hewitt Tax Service Inc. (tax preparation services); Crystal Capital River Inc. (real estate investment trust); Student Loan Corporation (student loan provider); Celgene Corporation (global biotechnology company); Apex Silver Mines Ltd. (mining); and Hyperion Brookfield Total Return Fund, Inc. and Hyperion Brookfield Strategic Mortgage Income Fund, Inc. (exchange-traded funds) | |
|
| Douglas A. Hacker (Born 1955) | |
|
c/o Columbia Management Advisors, LLC
One Financial Center
Boston, MA 02111
Trustee (since 1996) | | Independent business executive since May 2006; Executive Vice President—Strategy of United Airlines (airline) from December 2002 to May 2006; President of UAL Loyalty Services (airline marketing company) from September 2001 to December 2002; Executive Vice President and Chief Financial Officer of United Airlines from July 1999 to September 2001. Oversees 80, Nash Finch Company (food distributor); Aircastle Limited (aircraft leasing) | |
|
| Janet Langford Kelly (Born 1957) | |
|
c/o Columbia Management Advisors, LLC
One Financial Center
Boston, MA 02111
Trustee (since 1996) | | Senior Vice President, General Counsel and Corporate Secretary, ConocoPhillips (integrated energy company) since September 2007; Deputy General Counsel—Corporate Legal Services, ConocoPhillips from August 2006 to August 2007; Partner, Zelle, Hofmann, Voelbel, Mason & Gette LLP (law firm) from March 2005 to July 2006; Adjunct Professor of Law, Northwestern University, from September 2004 to June 2006; Director, UAL Corporation (airline) from February 2006 to July 2006; Chief Administrative Officer and Senior Vice President, Kmart Holding Corporation (consumer goods), from September 2003 to March 2004; Executive Vice President—Corporate Development and Administration, General Counsel and Secretary, Kellogg Company (food manufacturer), from September 1999 to August 2003. Oversees 80, None | |
|
116
Fund Governance (continued)
Independent Trustees (continued)
Name, Address and Year of Birth,
Position with Funds, Year First
Elected or Appointed to Office | | Principal Occupation(s) During Past Five Years, Number of Funds in Columbia
Funds Complex Overseen by Trustee, Other Directorships Held
| |
| Charles R. Nelson (Born 1942) | |
|
c/o Columbia Management Advisors, LLC
One Financial Center
Boston, MA 02111
Trustee (since 1981) | | Professor of Economics, University of Washington, since January 1976; Ford and Louisa Van Voorhis Professor of Political Economy, University of Washington, since September 1993; Director, Institute for Economic Research, University of Washington from September 2001 to June 2003; Adjunct Professor of Statistics, University of Washington, since September 1980; Associate Editor, Journal of Money Credit and Banking, since September 1993; Consultant on econometric and statistical matters. Oversees 80, None | |
|
| John J. Neuhauser (Born 1943) | |
|
c/o Columbia Management Advisors, LLC
One Financial Center
Boston, MA 02111
Trustee (since 1985) | | President, Saint Michael's College, since August 2007; University Professor, Boston College from November 2005 to August 2007; Academic Vice President and Dean of Faculties, Boston College from August 1999 to October 2005. Oversees 80, Liberty All-Star Equity Fund and Liberty All-Star Growth Fund, Inc. (closed-end funds) | |
|
| Jonathan Piel (Born 1938) | |
|
c/o Columbia Management Advisors, LLC
One Financial Center
Boston, MA 02111
Trustee1 (since 2007) | | Cable television producer and website designer; The Editor, Scientific American from 1984 to 1994; Vice President, Scientific American, Inc., from 1984 to 1994; Member, Advisory Board, Stone Age Institute, Bloomington, Indiana (research institute that explores the effect of technology on human evolution); Member, Board of Directors of the National Institute of Social Sciences, New York City; and Member, Board of Trustees of the William Alanson White Institute, New York City (institution for training psychoanalysts). Oversees 80, None | |
|
| Patrick J. Simpson (Born 1944) | |
|
c/o Columbia Management Advisors, LLC
One Financial Center
Boston, MA 02111
Trustee (since 2000) | | Partner, Perkins Coie LLP (law firm). Oversees 80, None | |
|
| Thomas C. Theobald (Born 1937) | |
|
c/o Columbia Management Advisors, LLC
One Financial Center
Boston, MA 02111
Trustee and
Chairman of the Board (since 1996) | | Partner and Senior Advisor, Chicago Growth Partners (private equity investing) since September 2004; Managing Director, William Blair Capital Partners (private equity investing) from September 1994 to September 2004. Oversees 80, Anixter International (network support equipment distributor); Ventas, Inc. (real estate investment trust); Jones Lang LaSalle (real estate management services); Ambac Financial Group (financial guaranty insurance) | |
|
117
Fund Governance (continued)
Independent Trustees (continued)
Name, Address and Year of Birth,
Position with Funds, Year First
Elected or Appointed to Office | | Principal Occupation(s) During Past Five Years, Number of Funds in Columbia
Funds Complex Overseen by Trustee, Other Directorships Held
| |
| Anne-Lee Verville (Born 1945) | |
|
c/o Columbia Management Advisors, LLC
One Financial Center
Boston, MA 02111
Trustee (since 1998) | | Retired since 1997 (formerly General Manager—Global Education Industry (from 1994 to 1997), President—Application Systems Division (from 1991 to 1994), Chief Financial Officer—US Marketing & Services (from 1988 to 1991), and Chief Information Officer (from 1987 to 1988), IBM Corporation (computer and technology)). Oversees 80, None | |
|
Interested Trustee
| William E. Mayer (Born 1940) | |
|
c/o Columbia Management Advisors, LLC
One Financial Center
Boston, MA 02111
Trustee2 (since 1994) | | Partner, Park Avenue Equity Partners (private equity) since February 1999; Dean and Professor, College of Business, University of Maryland from 1992 to 1997. Oversees 80, Lee Enterprises (print media), WR Hambrecht + Co. (financial service provider); BlackRock Kelso Capital Corporation (investment company) | |
|
1 Messrs. Drake, Piel and Collins have served as directors/trustees of the Excelsior Funds since 1996, 1996 and 2005, respectively. The Excelsior Funds consisted of 27 portfolios managed by affiliates of Columbia Management Advisors, LLC. Effective December 12, 2007, the Board elected Messrs. Drake, Piel and Collins as Trustees of the Trust.
2 Mr. Mayer is an "interested person" (as defined in the Investment Company Act of 1940) by reason of his affiliation with WR Hambrecht + Co., a registered broker/dealer that may execute portfolio transactions for or engage in principal transactions with the Funds or other funds or accounts advised/managed by the Advisor or other Bank of America affiliates.
The Statement of Additional Information includes additional information about the Trustees of the Funds and is available, without charge, upon request by calling 1-800-345-6611.
118
Fund Governance (continued)
Officers
Name, Address and Year of Birth,
Position with Columbia Funds,
Year First Elected or
Appointed to Office | | Principal Occupation(s) During Past Five Years | |
| Christopher L. Wilson (Born 1957) | |
|
One Financial Center
Boston, MA 02111
President (since 2004) | | President—Columbia Funds, since October 2004; Managing Director—Columbia Management Advisors, LLC, since September 2005; Senior Vice President—Columbia Management Distributors, Inc., since January 2005; Director—Columbia Management Services, Inc., since January 2005; Director—Bank of America Global Liquidity Funds, plc and Banc of America Capital Management (Ireland), Limited, since May 2005; Director—FIM Funding, Inc., since January 2005; President and Chief Executive Officer—CDC IXIS AM Services, Inc. (investment management), from September 1998 through August 2004; and a senior officer or director of various other Bank of America affiliated entities, including other registered and unregistered funds. | |
|
| James R. Bordewick, Jr. (Born 1959) | |
|
One Financial Center
Boston, MA 02111
Senior Vice President, Secretary and Chief Legal Officer (since 2006) | | Associate General Counsel, Bank of America since April 2005; Senior Vice President and Associate General Counsel, MFS Investment Management (investment management) prior to April 2005. | |
|
| J. Kevin Connaughton (Born 1964) | |
|
One Financial Center
Boston, MA 02111
Senior Vice President and
Chief Financial Officer (since 2000) | | Managing Director of Columbia Management Advisors, LLC since December 2004; Treasurer—Columbia Funds, from October 2003 to May 2008; Treasurer—the Liberty Funds, Stein Roe Funds and Liberty All-Star Funds, December 2000—December 2006; Senior Vice President—Columbia Management Advisors, LLC, from April 2003 to December 2004; President—Columbia Funds, Liberty Funds and Stein Roe Funds, February 2004 to October 2004; Treasurer—Galaxy Funds, September 2002 to December 2005; Treasurer, December 2002 to December 2004, and President, February 2004 to December 2004-Columbia Management Multi-Strategy Hedge Fund, LLC; and a senior officer of various other Bank of America-affiliated entities, including other registered and unregistered funds. | |
|
| Linda J. Wondrack (Born 1964) | |
|
One Financial Center
Boston, MA 02111
Senior Vice President and
Chief Compliance Officer (since 2007) | | Director (Columbia Management Group LLC and Investment Product Group Compliance), Bank of America since June 2005; Director of Corporate Compliance and Conflicts Officer, MFS Investment Management (investment management), August 2004 to May 2005; Managing Director, Deutsche Asset Management (investment management) prior to August 2004. | |
|
| Michael G. Clarke (Born 1969) | |
|
One Financial Center
Boston, MA 02111
Treasurer (since 2008) | | Director of Fund Administration of the Advisor since January 2006; Managing Director of the Advisor September 2004 to December 2005; Vice President Fund Administration June 2002 to September 2004. | |
|
119
Fund Governance (continued)
Officers (continued)
Name, Address and Year of Birth,
Position with Columbia Funds,
Year First Elected or
Appointed to Office | | Principal Occupation(s) During Past Five Years | |
| Jeffrey R. Coleman (Born 1969) | |
|
One Financial Center
Boston, MA 02111
Deputy Treasurer (since 2006) | | Director of Fund Administration of the Advisor since January 2006; Fund Controller of the Advisor from October 2004 to January 2006; Vice President of CDC IXIS Asset Management Services, Inc. (investment management) from August 2000 to September 2004. | |
|
| Joseph F. DiMaria (Born 1968) | |
|
One Financial Center
Boston, MA 02111
Chief Accounting Officer (since 2008) | | Director of Fund Administration of the Advisor since January 2006; Head of Tax/Compliance and Assistant Treasurer of the Advisor from November 2004 to December 2005; Director of Trustee Administration (Sarbanes-Oxley) of the Advisor from May 2003 to October 2004. | |
|
| Julian Quero (Born 1967) | |
|
One Financial Center
Boston, MA 02111
Deputy Treasurer (since 2008) | | Senior Tax Manager of the Advisor since August 2006; Senior Compliance Manager of the Advisor from April 2002 to August 2006. | |
|
| Barry S. Vallan (Born 1969) | |
|
One Financial Center
Boston, MA 02111
Controller (since 2006) | | Vice President—Fund Treasury of the Advisor since October 2004; Vice President—Trustee Reporting of the Advisor from April 2002 to October 2004. | |
|
120
Important Information About This Report – Stock Funds
The funds mail one shareholder report to each shareholder address. If you would like more than one report, please call shareholder services at 1-800-345-6611 and additional reports will be sent to you. This report has been prepared for shareholders of the Stock Funds.
A description of the policies and procedures that each fund uses to determine how to vote proxies and a copy of each fund's voting records are available (i) at www.columbiamanagement.com; (ii) on the Securities and Exchange Commission's website at www.sec.gov; and (iii) without charge, upon request, by calling 1-800-368-0346. Information regarding how each fund voted proxies relating to portfolio securities during the 12-month period ended June 30 is available from the SEC's website. Information regarding how each fund voted proxies relating to portfolio securities is also available from the funds' website, www.columbiamanagement.com.
Each fund files a complete schedule of portfolio holdings with the SEC for the first and third quarters of each fiscal year on Form N-Q. Each fund's Form N-Q is available on the SEC's website at www.sec.gov and may be reviewed and copied at the SEC's Public Reference Room in Washington, D.C. Information on the operation of the Public Reference Room may be obtained by calling 1-800-SEC-0330.
Please read and consider the investment objectives, risks, charges and expenses for any fund carefully before investing. For a prospectus which contains this and other important information about a fund, contact your Columbia Management representative or financial advisor or go to www.columbiafunds.com.
Columbia Management Group, LLC ("Columbia Management") is the investment management division of Bank of America Corporation. Columbia Management entities furnish investment management services and products for institutional and individual investors. Columbia Funds are distributed by Columbia Management Distributors, Inc., member of FINRA, SIPC, part of Columbia Management and an affiliate of Bank of America Corporation.
| Transfer Agent | |
|
Columbia Management Services, Inc.
P.O. Box 8081
Boston, MA 02266-8081
1-800-345-6611 | |
|
| Distributor | |
|
Columbia Management
Distributors, Inc.
One Financial Center
Boston, MA 02111 | |
|
| Investment Advisor | |
|
Columbia Management Advisors, LLC
100 Federal Street
Boston, MA 02110 | |
|
121
Columbia Management®
Stock Funds
Annual Report, September 30, 2008
PRSRT STD
U.S. Postage
PAID
Holliston, MA
Permit NO. 20
©2008 Columbia Management Distributors, Inc.
One Financial Center, Boston, MA 02111-2621
800-345-6611 www.columbiafunds.com
SHC-42/156371-0908 (11/08) 08/62590

Annual Report
September 30, 2008
Columbia Dividend Income Fund
| | |
| NOT FDIC INSURED | | May Lose Value |
| NOT BANK ISSUED | | No Bank Guarantee |
Table of contents
The views expressed in this report reflect the current views of the respective parties. These views are not guarantees of future performance and involve certain risks, uncertainties and assumptions that are difficult to predict, so actual outcomes and results may differ significantly from the views expressed. These views are subject to change at any time based upon economic, market or other conditions and the respective parties disclaim any responsibility to update such views. These views may not be relied on as investment advice and, because investment decisions for a Columbia Fund are based on numerous factors, may not be relied on as an indication of trading intent on behalf of any particular Columbia Fund. References to specific securities should not be construed as a recommendation or investment advice.
President’s Message

Dear Shareholder:
We are pleased to provide this shareholder report for your Columbia Fund and hope you will find the portfolio management details, discussions and performance information helpful in monitoring your investments. As we’ve seen this past year, the financial markets can be quite volatile, with significant short-term price fluctuations. It’s important to keep these ups and downs in perspective, particularly in light of your long-term investment strategy.
Staying the course with your long-term strategy typically involves riding out short-term price fluctuations, though we recognize that at times this can be tough. To support your efforts and give you the information you need to make prudent decisions, Columbia Management offers several valuable online resources. We encourage you to visit www.columbiamanagement.com/investor, where you can receive the most up-to-date information, including:
| n | | Daily pricing and performance. View pricing and performance from a link in Fund Tracker on the homepage. This listing of funds is updated nightly with the current net asset value and the amount and percentage change from the prior day. |
| n | | News & Commentary. This tab provides links to quarterly fund commentaries and information from our investment strategies group, including trends in the economy and market impact. |
If you would like more details on individual funds, select a fund from the dropdown menu on the top right side of the homepage for access to:
| n | | Monthly and quarterly performance information. |
| n | | Portfolio holdings. Full holdings are updated monthly for money market funds except for Columbia Cash Reserves and Columbia Money Market Reserves which are updated weekly, monthly for equity funds and quarterly for most other funds. |
| n | | Quarterly fact sheets. Accessible from the Literature tab in each fund page. |
By registering on the site, you’ll receive secured, 24-hour access to*:
| n | | Mutual fund account details with balances, dividend and transaction information |
| n | | Fund Tracker to customize your homepage with current net asset values for the funds that interest you |
| n | | On-line transactions including purchases, exchanges and redemptions |
| n | | Account maintenance for updating your address and dividend payment options |
| n | | Electronic delivery of prospectuses and shareholder reports |
I encourage you to visit our website for access to the product information and tools described above. These valuable online resources can help you monitor your investments and provide direct access to your account. All of these tools, and more, can be found on www.columbiamanagement.com/investor.
While your financial advisor is a great resource for investment guidance, you can also access our website or call our service representatives at 800.345.6611 for additional assistance. We thank you for investing with Columbia Management and look forward to helping with your ongoing investment needs.
Sincerely,

Christopher L. Wilson
President, Columbia Funds
| * | Some restrictions apply. Shareholders who purchase shares through certain third-party organizations may not have the ability to register for online access. |
Fund Profile – Columbia Dividend Income Fund
Performance data quoted represents past performance and current performance may be lower or higher. Past performance is no guarantee of future results. The investment return and principal value will fluctuate so that shares, when redeemed, may be worth more or less than the original cost. Please visit www.columbiafunds.com for daily and most recent month-end performance updates.
Summary
1 year return as of 09/30/08
| | |
| |
 | | –19.06% Class A shares |
| | (without sales charge) |
| |
| | –22.10% Russell 1000 Index |
Morningstar Style Box
Equity Style
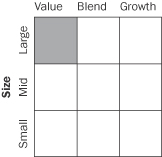
The Morningstar Style Box reveals a fund’s investment strategy. For equity funds the vertical axis shows the market capitalization of the stocks owned, and the horizontal axis shows investment style (value, blend or growth). All of these numbers are drawn from the data most recently provided by the fund and entered into Morningstar’s database as of month end. Although the data is gathered from reliable sources, Morningstar cannot guarantee completeness and accuracy. Information shown is as of 06/30/08.
Summary
| n | | For the 12-month period that ended September 30, 2008, the fund’s Class A shares returned negative 19.06% without sales charge. |
n | | In a difficult market environment, the fund held up better than its benchmark, the Russell 1000 Index,1 and the average return of its peer group, the Lipper Equity Income Funds Classification.2 The fund’s dividend distribution rose 15% during the period. |
| n | | A large commitment to consumer staples and reduced exposure to energy and materials companies helped comparative results. |
Portfolio Management
Scott L. Davis has co-managed the fund since November 2001 and has been with the advisor or its predecessors or affiliate organizations since 1985.
Richard Dahlberg has co-managed the fund since October 2003 and has been with the advisor or its predecessors or affiliate organizations since 2003.
1 | The Russell 1000 Index measures the performance of 1,000 of the largest US companies, based on market capitalization. Indices are not investments, do not incur fees or expenses and are not professionally managed. It is not possible to invest directly in an index. Securities in the fund may not match those in an index. |
2 | Lipper Inc., a widely respected data provider in the industry, calculates an average total return (assuming reinvestment of distributions) for mutual funds with investment objectives similar to those of the fund. Lipper makes no adjustment for the effect of sales loads. |
1
Economic Update – Columbia Dividend Income Fund
The pace of economic growth slowed during the 12-month period that began October 1, 2007 and ended September 30, 2008 as a growing number of factors weighed on consumers and businesses alike. The economy stayed clear of a recession, with an uptick in growth in the first half of 2008. However, it was widely expected that growth would slow to zero or negative near the end of the period as the most severe housing downturn in decades showed no sign of abating and job growth continued to slide. Inventories of homes for sale rose, home prices declined and tighter credit standards, the result of continued turmoil in the subprime mortgage market, made it more difficult for homebuyers to qualify for loans. Food prices rose, raising concerns about inflation, and energy prices soared to record highs before backing down sharply in the last months of the period. Consumer confidence declined sharply through June, then improved modestly in August and September. However, The Conference Board’s consumer confidence survey revealed that consumer appraisal of the economic environment continues to erode. Consumer confidence is surveyed monthly by The Conference Board.
As growth weakened, businesses began to pull back on hiring, which further dimmed the outlook for consumers. Job losses were reported for nine consecutive months in 2008, and the unemployment rate spiked to 6.1%. The slowdown in manufacturing activity was one of the last major indicators to turn negative. Federal tax rebates, which began to arrive in May, helped bolster consumer spending during the early summer months, but consumer spending turned negative later in the period.
In an effort to inspire confidence in the capital markets, loosen the reins on credit and shore up economic growth, the Federal Reserve Board (the Fed) brought a key short-term rate — the federal funds rate — down from 4.75% to 2.0% during the 12-month period. After seven rate cuts, the Fed remains concerned about inflation; but a weak economic outlook began to shift its priorities.1
Stocks retreat as economic storm clouds gather
Against a shifting economic backdrop, the U.S. stock market lost 21.98% for the 12-month period, as measured by the S&P 500 Index. Small-cap stocks held up better than large- and mid-cap stocks, as measured by their respective Russell indices.2 Value stocks held up better than growth stocks in the small- and mid-cap range while growth stocks lost less than value stocks among large caps. As the dollar rebounded modestly against the euro, investors reaped even lower returns from investments outside the U.S. The MSCI EAFE Index, a broad gauge of stock market performance in foreign developed markets, lost 30.50% (in U.S. dollars) for the period. Emerging stock markets, which have had a strong run over the past several years, were also caught in the downdraft. The MSCI Emerging Markets Index returned negative 33.01% (in U.S. dollars).3
Past performance is no guarantee of future results.
1 | On October 8, the Fed lowered the federal funds rate to 1.5% and on October 29, the Fed lowered the federal funds rate to 1.0%. |
2 | The Russell 1000 Index measures the performance of 1,000 of the largest US companies, based on market capitalization. The Russell Midcap Index measures the performance of the 800 smallest companies in the Russell 1000 Index, as ranked by total market capitalization. The Russell 2000 Index measures the performance of the 2,000 smallest of 3,000 largest U.S. companies based on market capitalization. |
3 | The MSCI Emerging Markets Index is a widely accepted index composed of a sample of companies from 25 countries representing the global emerging stock markets. |
| | Indices | are not investments, do not incur fees or expenses and are not professionally managed. It is not possible to invest directly in an index. Securities in the fund may not match those in an index. |
Summary
For the 12-month period that ended September 30, 2008
| | n | | The broad U.S. stock market, as measured by the S&P 500 Index, returned negative 21.98%. Developed stock markets outside the United States returned negative 30.50%, as measured (in U.S. dollars) by the MSCI EAFE Index. | |
| | |
| S&P Index | | MSCI Index |
| |

| |
|
–21.98% | | –30.50% |
| | n | | Despite volatility in many segments of the bond market, the Lehman Brothers U.S. Aggregate Bond Index delivered a modest return. High-yield bonds lost significant ground, as measured by the Merrill Lynch U.S. High Yield Cash Pay Index. | |
| | |
Lehman Index | | Merrill Lynch Index |
| |

| |
|
3.65% | | –11.62% |
The Standard & Poor’s (S&P) 500 Index tracks the performance of 500 widely held, large-capitalization U.S. stocks.
The Morgan Stanley Capital International (MSCI) Europe, Australasia, Far East (EAFE) Index is a free float-adjusted market capitalization index that is designed to measure developed market equity performance excluding the US and Canada.
The Lehman Brothers U.S. Aggregate Bond Index is a market value-weighted index that tracks the daily price, coupon, pay-downs and total return performance of fixed-rate, publicly placed, dollar-denominated and non-convertible investment-grade debt issues with at least $250 million par amount outstanding and with at least one year to final maturity.
The Merrill Lynch U.S. High Yield, Cash Pay Index tracks the performance of non-investment-grade corporate bonds.
2
Economic Update (continued) – Columbia Dividend Income Fund
Bonds delivered modest gains
The U.S. bond market seesawed during the 12-month period but delivered a modest gain as investors sought the relative safety of the highest quality sectors. After a weak start, bond prices in many sectors rose and yields declined as economic growth slowed and stock market volatility increased. Although the benchmark 10-year U.S. Treasury yield edged back above 4.0% in 2008, it slipped back to 3.83% at the end of the period, nearly one full percentage point below where it was one year ago. In this environment, the Lehman Brothers U.S. Aggregate Bond Index returned 3.65%. High-yield bonds took a beating. The Merrill Lynch U.S. High Yield, Cash Pay Index returned negative 11.62%.
Past performance is no guarantee of future results.
3
Performance Information – Columbia Dividend Income Fund
Performance data quoted represents past performance and current performance may be lower or higher. Past performance is no guarantee of future results. The investment return and principal value will fluctuate so that shares, when redeemed, may be worth more or less than the original cost. Please visit www.columbiafunds.com for daily and most recent month-end performance updates.
| | |
| Annual operating expense ratio (%)* |
| |
Class A | | 1.12 |
Class B | | 1.87 |
Class C | | 1.87 |
Class R | | 1.33 |
Class T | | 1.17 |
Class Z | | 0.87 |
| | |
Annual operating expense ratio
after contractual waivers (%)* |
| |
Class A | | 1.05 |
Class B | | 1.80 |
Class C | | 1.80 |
Class R | | 1.30 |
Class T | | 1.10 |
Class Z | | 0.80 |
| * | The annual operating expense ratio and annual operating expense ratio after contractual waivers are as stated in the fund’s prospectus that is current as of the date of this report. The contractual waiver expires 01/31/09. Differences in expense ratios disclosed elsewhere in this report may result from including fee waivers and expense reimbursements as well as different time periods used in calculating the ratios. |
|
| Growth of a $10,000 investment 10/01/98 – 09/30/08 |
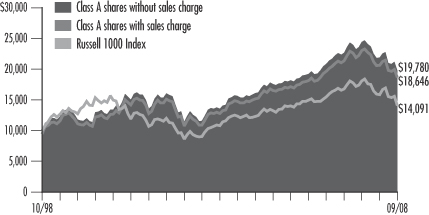
The chart above shows the growth in value of a hypothetical $10,000 investment in Class A shares of Columbia Dividend Income Fund during the stated time period, and does not reflect the deduction of taxes that a shareholder may pay on fund distributions or on the redemption of fund shares. The Russell 1000 Index measures the performance of 1,000 of the largest US companies, based on market capitalization. Indices are not investments, do not incur fees or expenses and are not professionally managed. It is not possible to invest directly in an index. Securities in the fund may not match those in an index.
| | | | |
| Performance of a $10,000 investment 10/01/98 – 09/30/08 ($) |
| | |
| Sales charge | | without | | with |
Class A | | 19,780 | | 18,646 |
Class B | | 18,337 | | 18,337 |
Class C | | 18,323 | | 18,323 |
Class R | | 19,754 | | n/a |
Class T | | 19,716 | | 18,585 |
Class Z | | 20,494 | | n/a |
| | | | | | | | | | | | | | | | | | | | |
| Average annual total return as of 09/30/08 (%) |
| | | | | | |
| Share Class | | A | | B | | C | | R | | T | | Z |
| Inception | | 11/25/02 | | 11/25/02 | | 11/25/02 | | 03/28/08 | | 03/04/98 | | 03/04/98 |
| Sales charge | | without | | with | | without | | with | | without | | with | | without | | without | | with | | without |
1-year | | –19.06 | | –23.73 | | –19.71 | | –23.62 | | –19.72 | | –20.50 | | –19.17 | | –19.10 | | –23.77 | | –18.90 |
5-year | | 7.83 | | 6.57 | | 7.00 | | 6.70 | | 7.01 | | 7.01 | | 7.80 | | 7.77 | | 6.51 | | 8.10 |
10-year | | 7.06 | | 6.43 | | 6.25 | | 6.25 | | 6.24 | | 6.24 | | 7.04 | | 7.02 | | 6.39 | | 7.44 |
The “with sales charge” returns include the maximum initial sales charge of 5.75% for Class A and Class T shares, the applicable contingent deferred sales charge of 5.00% in the first year, declining to 1.00% in the sixth year and eliminated thereafter for Class B shares and 1.00% for Class C shares for the first year only. The “without sales charge” returns do not include the effect of sales charges. If they had, returns would be lower.
Performance results reflect any fee waivers or reimbursements of fund expenses by the investment advisor and/or any of its affiliates. Absent these fee waivers or expense reimbursement arrangements, performance results would have been lower.
All results shown assume reinvestment of distributions. Class Z shares are sold at net asset value with no distribution and service (Rule 12b-1) fees. Class R shares are sold at net asset value with distribution and service (Rule 12b-1) fees. Class R and Class Z shares have limited eligibility and the investment minimum requirements may vary. Please see the fund’s prospectus for details. Performance for different share classes will vary based on differences in sales charges and fees associated with each class.
The tables do not reflect the deduction of taxes that a shareholder may pay on fund distributions or on the redemption of fund shares.
Class A, Class B and Class C are newer classes of shares. Their performance information includes returns of Retail A Shares (for Class A) and Retail B Shares (for Class B and Class C) of the Galaxy Strategic Equity Fund (the “Galaxy Fund”) for periods prior to November 25, 2002, the date on which Class A, Class B and Class C shares were initially offered by the Fund. The returns for Class T shares include the returns of Retail A shares of the Galaxy Fund for periods prior to November 25, 2002, the date on which Class T shares were initially offered by the Fund. The returns for Class Z shares include returns of Trust shares of the Galaxy Fund for periods prior to November 25, 2002, the date on which Class Z shares were initially offered by the Fund. The returns have not been restated to reflect any differences in expenses between the predecessor shares and the newer classes of shares. If differences in expenses had been reflected, the returns shown for periods prior to the inception of the newer classes of shares would have been lower. Retail A Shares, Retail B Shares and Trust shares of the Galaxy Fund were initially offered on March 4, 1998. The returns for Class R shares include the returns of Class A shares prior to March 28, 2008, the date on which Class R shares commenced operations. If differences in expenses had been reflected, the returns would have been lower, since Class R shares are subject to higher distribution and service (Rule 12b-1) fees.
4
Understanding Your Expenses – Columbia Dividend Income Fund
Estimating your actual expenses
To estimate the expenses that you paid over the period, first you will need your account balance at the end of the period:
| | n | | For shareholders who receive their account statements from Columbia Management Services, Inc., your account balance is available online at www.columbiafunds.com or by calling Shareholder Services at 800.345.6611. | |
| | n | | For shareholders who receive their account statements from their financial intermediary, contact your financial intermediary firm to obtain your account balance. | |
| | 1. | Divide your ending account balance by $1,000. For example, if an account balance was $8,600 at the end of the period, the result would be 8.6. | |
| | 2. | In the section of the table below titled “Expenses paid during the period,” locate the amount for your share class. You will find this number in the column labeled “Actual.” Multiply this number by the result from step 1. Your answer is an estimate of the expenses you paid on your account during the period. | |
If the value of your account falls below the minimum initial investment requirement applicable to you, your account generally will be subject to a $20 annual fee. This fee is not included in the accompanying table. If you are subject to the fee, keep it in mind when you are estimating the ongoing expenses of investing in the fund and when comparing the expenses of this fund with other funds.
As a fund shareholder, you incur two types of costs. There are transaction costs, which generally include sales charges on purchases and may include redemption fees or exchange fees. There are also ongoing costs, which generally include investment advisory fees, distribution and service (Rule 12b-1) fees and other fund expenses. The information on this page is intended to help you understand the ongoing costs of investing in the fund and to compare these costs with the ongoing costs of investing in other mutual funds.
Analyzing your fund’s expenses by share class
To illustrate these ongoing costs, we have provided an example and calculated the expenses paid by investors in each share class during the period. The information in the following table is based on an initial investment of $1,000, which is invested at the beginning of the period and held for the entire period. Expense information is calculated two ways and each method provides you with different information. The amount listed in the “actual” column is calculated using the fund’s actual operating expenses and total return for the period. The amount listed in the “hypothetical” column for each share class assumes that the return each year is 5% before expenses and is calculated based on the fund’s actual operating expenses. You should not use the hypothetical account values and expenses to estimate either your actual account balance at the end of the period or the expenses you paid during this period.
Compare with other funds
Since all mutual funds are required to include the same hypothetical calculations about expenses in shareholder reports, you can use this information to compare the ongoing costs of investing in the fund with other funds. To do so, compare the 5% hypothetical example with the 5% hypothetical examples that appear in the shareholder reports of other funds. As you compare hypothetical examples of other funds, it is important to note that hypothetical examples are meant to highlight the ongoing costs of investing in a fund and do not reflect any transaction costs, such as sales charges, redemption fees or exchange fees.
| | | | | | | | | | | | | | |
| 04/01/08 – 09/30/08 |
| | | | |
| | | Account value at the
beginning of the period ($) | | Account value at the
end of the period ($) | | Expenses paid
during the period ($) | | Fund’s annualized
expense ratio (%) |
| | | Actual | | Hypothetical | | Actual | | Hypothetical | | Actual | | Hypothetical | | Actual |
Class A | | 1,000.00 | | 1,000.00 | | 905.10 | | 1,019.75 | | 5.00 | | 5.30 | | 1.05 |
Class B | | 1,000.00 | | 1,000.00 | | 901.50 | | 1,016.00 | | 8.56 | | 9.07 | | 1.80 |
Class C | | 1,000.00 | | 1,000.00 | | 901.40 | | 1,016.00 | | 8.56 | | 9.07 | | 1.80 |
Class R | | 1,000.00 | | 1,000.00 | | 903.90 | | 1,018.50 | | 6.19 | | 6.56 | | 1.30 |
Class T | | 1,000.00 | | 1,000.00 | | 904.90 | | 1,019.50 | | 5.24 | | 5.55 | | 1.10 |
Class Z | | 1,000.00 | | 1,000.00 | | 906.30 | | 1,021.00 | | 3.81 | | 4.04 | | 0.80 |
Expenses paid during the period are equal to the annualized expense ratio for the share class, multiplied by the average account value over the period, then multiplied by the number of days in the fund’s most recent fiscal half-year and divided by 366.
Had the investment advisor and/or any of its affiliates not waived fees or reimbursed a portion of expenses, account value at the end of the period would have been reduced.
It is important to note that the expense amounts shown in the table are meant to highlight only ongoing costs of investing in the fund and do not reflect any transaction costs, such as sales charges, redemption fees or exchange fees. Therefore, the hypothetical examples provided may not help you determine the relative total costs of owning shares of different funds. If these transaction costs were included, your costs would have been higher.
5
Portfolio Managers’ Report – Columbia Dividend Income Fund
Performance data quoted represents past performance and current performance may be lower or higher. Past performance is no guarantee of future results. The investment return and principal value will fluctuate so that shares, when redeemed, may be worth more or less than the original cost. Please visit www.columbiafunds.com for daily and most recent month-end performance updates.
| | |
| Net asset value per share | | |
| |
as of 09/30/08 ($) | | |
Class A | | 12.01 |
Class B | | 11.75 |
Class C | | 11.74 |
Class R | | 12.01 |
Class T | | 12.01 |
Class Z | | 12.01 |
| | |
Distributions declared per share |
| |
10/01/07 – 09/30/08 ($) | | |
Class A | | 0.47 |
Class B | | 0.37 |
Class C | | 0.37 |
Class R | | 0.14 |
Class T | | 0.46 |
Class Z | | 0.50 |
For the 12-month period that ended September 30, 2008, the fund’s Class A shares returned negative 19.06% without sales charge. The fund’s benchmark, the Russell 1000 Index, returned negative 22.10% for the same period.1 The average return of the fund’s peer group, the Lipper Equity Income Funds Classification, was negative 20.75%.2 The fund’s Class A shares dividend distribution rose by 15% from $0.27 to $0.31.
A spreading credit crisis brought sharp declines in equity markets, with few sectors able to withstand the selling pressure. Although results were undeniably negative, the fund held up better than both its index and peer group average return thanks to its larger stakes in such consumer basics as tobacco, food and drug makers, areas that have typically been more resilient during economic downturns. The fund had less exposure than the index in energy, materials and homebuilding, which also aided its relative return.
Consumer staples were period’s standout
As the credit crisis began to affect the broader economy, fund returns were positive among companies that make or sell products that are in demand regardless of the economy’s direction. Shares of Wal-Mart Stores, Inc. climbed as the result of solid operating results and increased traffic from cash-short consumers. Food makers General Mills, Inc. and H. J. Heinz Co. reported growth in revenues and earnings. Both companies were more successful than their competitors in passing along rising costs. Among consumer discretionary holdings, continued earnings growth and a dividend increase boosted shares of McDonald’s Corp. Shares of well-capitalized bank holdings also contributed, with U.S. Bancorp, Wells Fargo & Co. and PNC Financial Services Group, Inc. all registering solid gains.
Economic woes and credit fears fueled declines
Size and stability were no protection against the market’s slide. Although General Electric Co.’s industrial businesses are moving ahead well, shares suffered a severe decline due to concerns about GE’s financing arm. AT&T, Inc. fell as a weak economy threatened earnings growth. In addition, the slump in housing starts may cut into phone installations in upcoming quarters. Nokia Oyj fell by nearly half despite outstanding operating results and increased market share as investors have grown cautious about cellphone sales in a possible global slowdown. Wachovia Corp. and Hartford Financial Services Group, Inc. were caught in the powerful selloff that swept the financial sector. Hartford’s bond holdings came under scrutiny, but a capital infusion from Germany’s Allianz Bank (not in the portfolio) helped shore up its balance sheet and stabilize shares. We sold Wachovia before the end of the period.
Our decision to underweight energy companies at first seemed premature. However, that decision was rewarded when oil prices fell steeply from record levels. The fall in metals prices had little impact on fund results because of our decision to downplay materials stocks.
1 | The Russell 1000 Index measures the performance of 1,000 of the largest US companies, based on market capitalization. Indices are not investments, do not incur fees or expenses and are not professionally managed. It is not possible to invest directly in an index. Securities in the fund may not match those in an index. |
2 | Lipper Inc., a widely respected data provider in the industry, calculates an average total return (assuming reinvestment of distributions) for mutual funds with investment objectives similar to those of the fund. Lipper makes no adjustment for the effect of sales loads. |
6
Portfolio Managers’ Report (continued) – Columbia Dividend Income Fund
| | |
| Sectors |
| |
as of 09/30/08 (%) | | |
Financials | | 17.3 |
Consumer Staples | | 14.4 |
Health Care | | 12.0 |
Information Technology | | 10.2 |
Energy | | 9.8 |
Consumer Discretionary | | 8.6 |
Industrials | | 7.0 |
| Telecommunication Services | | 6.9 |
Utilities | | 4.1 |
Materials | | 3.0 |
| | |
| Holdings discussed in this report |
| |
as of 09/30/08 (%) | | |
Wal-Mart Stores, Inc. | | 2.0 |
General Mills, Inc. | | 0.6 |
H.J. Heinz Co. | | 1.1 |
McDonald’s Corp | | 2.6 |
U.S. Bancorp | | 1.7 |
Wells Fargo & Co. | | 1.1 |
| PNC Financial Services Group, Inc. | | 0.5 |
General Electric Co. | | 2.5 |
AT&T, Inc. | | 3.8 |
Nokia Oyj | | 0.8 |
| Hartford Financial Services Group, Inc. | | 0.7 |
The fund is actively managed and the composition of its portfolio will change over time. Information provided is calculated as a percentage of net assets.
Looking ahead
We believe that the economy has the potential to break out of recessionary mode some time in 2009. The extreme volatility and severe price drops that we have seen recently may present compelling investment opportunities but markets must first work through this crisis of confidence. Well-financed companies with strong balance sheets, ample free cash flow and the ability to raise dividends tend to be superior performers over time. Falling prices have boosted dividend yields, and high dividend yields have historically presented better chances of strong returns than periods when dividends are low. While valuations appear attractive in many cases, we are taking care to avoid companies that are overextended or subject to large debt maturities in the near future.
Portfolio holdings and characteristics are subject to change periodically and may not be representative of current holdings and characteristics. The outlook for the fund may differ from that presented for other Columbia Funds.
Equity investments are affected by stock market fluctuations that occur in response to economic and business developments.
Dividend payments by an issuer are not guaranteed, and are paid only when declared by an issuer’s board of directors. The amount of a dividend payment, if any, can vary over time.
Value stocks are securities of companies that may have experienced adverse business or industry developments or may be subject to special risks that have caused the stocks to be out of favor. The market value of a portfolio security may not meet the manager’s future value assessment of such security, or may decline.
7
Investment Portfolio – Columbia Dividend Income Fund
September 30, 2008
Common Stocks – 90.8%
| | | | | | |
| | | | | Shares | | Value ($) |
| Consumer Discretionary – 8.6% |
| Hotels, Restaurants & Leisure – 2.6% | | McDonald’s Corp. | | 455,000 | | 28,073,500 |
| | | | | | |
| | Hotels, Restaurants & Leisure Total | | | | 28,073,500 |
| | | |
| Household Durables – 0.2% | | Newell Rubbermaid, Inc. | | 125,000 | | 2,157,500 |
| | | | | | |
| | Household Durables Total | | | | 2,157,500 |
| | | |
| Media – 2.2% | | CBS Corp., Class B | | 440,000 | | 6,415,200 |
| | McGraw-Hill Companies, Inc. | | 130,000 | | 4,109,300 |
| | Meredith Corp. | | 265,000 | | 7,430,600 |
| | Pearson PLC | | 360,000 | | 3,924,000 |
| | Time Warner, Inc. | | 100,000 | | 1,311,000 |
| | | | | | |
| | Media Total | | | | 23,190,100 |
| | | |
| Multiline Retail – 0.4% | | Macy’s, Inc. | | 200,000 | | 3,596,000 |
| | | | | | |
| | Multiline Retail Total | | | | 3,596,000 |
| | | |
| Specialty Retail – 3.2% | | Home Depot, Inc. | | 325,000 | | 8,414,250 |
| | Sherwin-Williams Co. | | 255,000 | | 14,575,800 |
| | Staples, Inc. | | 250,000 | | 5,625,000 |
| | TJX Companies, Inc. | | 180,000 | | 5,493,600 |
| | | | | | |
| | Specialty Retail Total | | | | 34,108,650 |
| | | | | | |
| Consumer Discretionary Total | | | | | | 91,125,750 |
| | | | | | |
| Consumer Staples – 14.4% | | | | | | |
| Beverages – 3.9% | | Anheuser-Busch Companies, Inc. | | 176,000 | | 11,418,880 |
| | Coca-Cola Co. | | 140,000 | | 7,403,200 |
| | Diageo PLC, ADR | | 265,000 | | 18,247,900 |
| | PepsiCo, Inc. | | 70,000 | | 4,988,900 |
| | | | | | |
| | Beverages Total | | | | 42,058,880 |
| | | |
| Food & Staples Retailing – 2.0% | | Wal-Mart Stores, Inc. | | 350,000 | | 20,961,500 |
| | | | | | |
| | Food & Staples Retailing Total | | | | 20,961,500 |
| | | |
| Food Products – 2.8% | | ConAgra Foods, Inc. | | 265,000 | | 5,156,900 |
| | General Mills, Inc. | | 86,800 | | 5,964,896 |
| | H.J. Heinz Co. | | 235,000 | | 11,742,950 |
| | Nestle SA, ADR, Registered Shares | | 150,000 | | 6,448,155 |
| | | | | | |
| | Food Products Total | | | | 29,312,901 |
| | | |
| Household Products – 3.6% | | Kimberly-Clark Corp. | | 210,000 | | 13,616,400 |
| | Procter & Gamble Co. | | 356,000 | | 24,809,640 |
| | | | | | |
| | Household Products Total | | | | 38,426,040 |
| | | |
| Tobacco – 2.1% | | Altria Group, Inc. | | 300,000 | | 5,952,000 |
| | Philip Morris International, Inc. | | 340,000 | | 16,354,000 |
| | | | | | |
| | Tobacco Total | | | | 22,306,000 |
| | | | | | |
| Consumer Staples Total | | | | | | 153,065,321 |
See Accompanying Notes to Financial Statements.
8
Columbia Dividend Income Fund
September 30, 2008
Common Stocks (continued)
| | | | | | |
| | | | | Shares | | Value ($) |
| Energy – 9.8% | | | | | | |
| Energy Equipment & Services – 0.4% | | Halliburton Co. | | 130,000 | | 4,210,700 |
| | | | | | |
| | Energy Equipment & Services Total | | | | 4,210,700 |
| | | |
| Oil, Gas & Consumable Fuels – 9.4% | | BP PLC, ADR | | 170,000 | | 8,528,900 |
| | Chevron Corp. | | 325,000 | | 26,806,000 |
| | ConocoPhillips | | 135,000 | | 9,888,750 |
| | Exxon Mobil Corp. | | 540,000 | | 41,936,400 |
| | Occidental Petroleum Corp. | | 90,000 | | 6,340,500 |
| | Royal Dutch Shell PLC, ADR | | 120,000 | | 7,081,200 |
| | | | | | |
| | Oil, Gas & Consumable Fuels Total | | | | 100,581,750 |
| | | | | | |
| Energy Total | | | | | | 104,792,450 |
| | | | | | |
| Financials – 16.4% | | | | | | |
| Capital Markets – 1.5% | | Bank of New York Mellon Corp. | | 305,000 | | 9,936,900 |
| | Federated Investors, Inc., Class B | | 220,000 | | 6,347,000 |
| | | | | | |
| | Capital Markets Total | | | | 16,283,900 |
| | | |
| Commercial Banks – 3.6% | | PNC Financial Services Group, Inc. | | 76,000 | | 5,677,200 |
| | SunTrust Banks, Inc. | | 74,000 | | 3,329,260 |
| | U.S. Bancorp | | 514,000 | | 18,514,280 |
| | Wells Fargo & Co. | | 300,000 | | 11,259,000 |
| | | | | | |
| | Commercial Banks Total | | | | 38,779,740 |
| | | |
| Consumer Finance – 0.3% | | Discover Financial Services | | 200,000 | | 2,764,000 |
| | | | | | |
| | Consumer Finance Total | | | | 2,764,000 |
| | | |
| Diversified Financial Services – 2.3% | | Citigroup, Inc. | | 550,000 | | 11,280,500 |
| | JPMorgan Chase & Co. | | 280,000 | | 13,076,000 |
| | | | | | |
| | Diversified Financial Services Total | | | | 24,356,500 |
| | | |
| Insurance – 8.3% | | Arthur J. Gallagher & Co. | | 516,000 | | 13,240,560 |
| | Chubb Corp. | | 180,000 | | 9,882,000 |
| | Hartford Financial Services Group, Inc. | | 188,000 | | 7,706,120 |
| | Lincoln National Corp. | | 440,000 | | 18,836,400 |
| | MetLife, Inc. | | 134,475 | | 7,530,600 |
| | Principal Financial Group, Inc. | | 302,000 | | 13,133,980 |
| | RenaissanceRe Holdings Ltd. | | 45,000 | | 2,340,000 |
| | Unum Group | | 605,000 | | 15,185,500 |
| | | | | | |
| | Insurance Total | | | | 87,855,160 |
| | | |
Real Estate Investment Trusts (REITs) – 0.4% | | Kimco Realty Corp. | | 75,000 | | 2,770,500 |
| | Rayonier, Inc. | | 32,000 | | 1,515,200 |
| | | | | | |
| | Real Estate Investment Trusts (REITs) Total | | | | 4,285,700 |
| | | | | | |
| Financials Total | | | | | | 174,325,000 |
See Accompanying Notes to Financial Statements.
9
Columbia Dividend Income Fund
September 30, 2008
Common Stocks (continued)
| | | | | | |
| | | | | Shares | | Value ($) |
| Health Care – 10.4% | | | | | | |
| Pharmaceuticals – 10.4% | | Abbott Laboratories | | 331,000 | | 19,058,980 |
| | Bristol-Myers Squibb Co. | | 245,000 | | 5,108,250 |
| | GlaxoSmithKline PLC, ADR | | 200,000 | | 8,692,000 |
| | Johnson & Johnson | | 330,000 | | 22,862,400 |
| | Merck & Co., Inc. | | 380,000 | | 11,992,800 |
| | Novartis AG, ADR | | 225,000 | | 11,889,000 |
| | Pfizer, Inc. | | 1,220,000 | | 22,496,800 |
| | Wyeth | | 250,000 | | 9,235,000 |
| | | | | | |
| | Pharmaceuticals Total | | | | 111,335,230 |
| | | | | | |
| Health Care Total | | | | 111,335,230 |
| | | | | | |
| Industrials – 7.0% | | | | | | |
| Aerospace & Defense – 2.5% | | Boeing Co. | | 106,000 | | 6,079,100 |
| | Honeywell International, Inc. | | 105,000 | | 4,362,750 |
| | Raytheon Co. | | 95,000 | | 5,083,450 |
| | United Technologies Corp. | | 182,000 | | 10,930,920 |
| | | | | | |
| | Aerospace & Defense Total | | | | 26,456,220 |
| | | |
Commercial & Professional Services – 1.0% | | Waste Management, Inc. | | 345,000 | | 10,864,050 |
| | | | | | |
| | Commercial & Professional Services Total | | | | 10,864,050 |
| | | |
| Industrial Conglomerates – 2.5% | | General Electric Co. | | 1,045,000 | | 26,647,500 |
| | | | | | |
| | Industrial Conglomerates Total | | | | 26,647,500 |
| | | |
| Machinery – 1.0% | | Deere & Co. | | 112,000 | | 5,544,000 |
| | Dover Corp. | | 120,000 | | 4,866,000 |
| | | | | | |
| | Machinery Total | | | | 10,410,000 |
| | | | | | |
| Industrials Total | | | | 74,377,770 |
| | | | | | |
| Information Technology – 10.2% | | | | |
| Communications Equipment – 0.8% | | Nokia Oyj, ADR | | 445,000 | | 8,299,250 |
| | | | | | |
| | Communications Equipment Total | | | | 8,299,250 |
| | | |
| Computers & Peripherals – 4.4% | | Hewlett-Packard Co. | | 400,000 | | 18,496,000 |
| | International Business Machines Corp. | | 243,000 | | 28,421,280 |
| | | | | | |
| | Computers & Peripherals Total | | | | 46,917,280 |
| | | |
| IT Services – 0.7% | | Automatic Data Processing, Inc. | | 185,000 | | 7,908,750 |
| | | | | | |
| | IT Services Total | | | | 7,908,750 |
| | | |
| Office Electronics – 0.4% | | Canon, Inc., ADR | | 110,000 | | 4,152,500 |
| | | | | | |
| | Office Electronics Total | | | | 4,152,500 |
| | | |
| Semiconductors & Semiconductor Equipment – 2.3% | | Intel Corp. | | 900,000 | | 16,857,000 |
| | Taiwan Semiconductor Manufacturing Co., Ltd., ADR | | 787,952 | | 7,383,110 |
| | | | | | |
| | Semiconductors & Semiconductor Equipment Total | | | | 24,240,110 |
See Accompanying Notes to Financial Statements.
10
Columbia Dividend Income Fund
September 30, 2008
Common Stocks (continued)
| | | | | | |
| | | | | Shares | | Value ($) |
| Information Technology (continued) | | | | |
| Software – 1.6% | | Microsoft Corp. | | 625,000 | | 16,681,250 |
| | | | | | |
| | Software Total | | | | 16,681,250 |
| | | | | | |
| Information Technology Total | | | | 108,199,140 |
| | | | | | |
| Materials – 3.0% |
| Chemicals – 2.6% | | Dow Chemical Co. | | 180,000 | | 5,720,400 |
| | E.I. Du Pont de Nemours & Co. | | 222,000 | | 8,946,600 |
| | Eastman Chemical Co. | | 67,000 | | 3,689,020 |
| | International Flavors & Fragrances, Inc. | | 130,000 | | 5,129,800 |
| | RPM International, Inc. | | 250,000 | | 4,835,000 |
| | | | | | |
| | Chemicals Total | | | | 28,320,820 |
| | | |
| Containers & Packaging – 0.4% | | Packaging Corp. of America | | 180,000 | | 4,172,400 |
| | | | | | |
| | Containers & Packaging Total | | | | 4,172,400 |
| | | | | | |
| Materials Total | | | | 32,493,220 |
| | | | | | |
| Telecommunication Services – 6.9% | | | | |
| Diversified Telecommunication Services – 6.9% | | AT&T, Inc. | | 1,465,000 | | 40,902,800 |
| | Verizon Communications, Inc. | | 942,000 | | 30,228,780 |
| | Windstream Corp. | | 250,000 | | 2,735,000 |
| | | | | | |
| | Diversified Telecommunication Services Total | | | | 73,866,580 |
| | | | | | |
| Telecommunication Services Total | | | | 73,866,580 |
| | | | | | |
| Utilities – 4.1% |
| Electric Utilities – 2.4% | | American Electric Power Co., Inc. | | 100,000 | | 3,703,000 |
| | Entergy Corp. | | 40,000 | | 3,560,400 |
| | Exelon Corp. | | 80,000 | | 5,009,600 |
| | FirstEnergy Corp. | | 75,000 | | 5,024,250 |
| | FPL Group, Inc. | | 90,000 | | 4,527,000 |
| | PPL Corp. | | 90,000 | | 3,331,800 |
| | | | | | |
| | Electric Utilities Total | | | | 25,156,050 |
| | | |
| Gas Utilities – 0.4% | | National Fuel Gas Co. | | 108,000 | | 4,555,440 |
| | | | | | |
| | Gas Utilities Total | | | | 4,555,440 |
| | | |
| Multi-Utilities – 1.3% | | Dominion Resources, Inc. | | 140,000 | | 5,989,200 |
| | PG&E Corp. | | 112,000 | | 4,194,400 |
| | Public Service Enterprise Group, Inc. | | 130,000 | | 4,262,700 |
| | | | | | |
| | Multi-Utilities Total | | | | 14,446,300 |
| | | | | | |
| Utilities Total | | | | 44,157,790 |
| | Total Common Stocks
(Cost of $933,116,302) | | | | 967,738,251 |
See Accompanying Notes to Financial Statements.
11
Columbia Dividend Income Fund
September 30, 2008
Convertible Preferred Stocks – 2.5%
| | | | | | |
| | | | | Shares | | Value ($) |
| Financials – 0.9% | | | | | | |
| Insurance – 0.9% | | Metlife, Inc., 6.375% | | 550,000 | | 6,886,000 |
| | XL Capital Ltd., 7.000% | | 395,000 | | 2,725,500 |
| | | | | | |
| | Insurance Total | | | | 9,611,500 |
| | | | | | |
| Financials Total | | | | | | 9,611,500 |
| | | | | | |
| Health Care – 1.6% | | | | | | |
| Pharmaceuticals – 1.6% | | Schering-Plough Corp., 6.000% | | 100,000 | | 17,302,000 |
| | | | | | |
| | Pharmaceuticals Total | | | | 17,302,000 |
| | | | | | |
| Health Care Total | | | | | | 17,302,000 |
| | Total Convertible Preferred Stocks
(Cost of $42,762,979) | | | | 26,913,500 |
| | | | | Par ($) | | |
| Short-Term Obligation – 6.2% | | | | | | |
| | Repurchase agreement with Fixed Income Clearing Corp., dated 09/30/08, due 10/01/08 at 0.200%, collateralized by a U.S. Treasury Obligation maturing 02/28/09, market value $67,567,088 (repurchase proceeds $66,238,368) | | 66,238,000 | | 66,238,000 |
| | |
| | Total Short-Term Obligation (Cost of $66,238,000) | | 66,238,000 |
| |
| | |
| | Total Investments – 99.5% (Cost of $1,042,117,281)(a) | | 1,060,889,751 |
| |
| | |
| | Other Assets & Liabilities, Net – 0.5% | | 5,097,620 |
| |
| | |
| | Net Assets – 100.0% | | 1,065,987,371 |
Notes to Investment Portfolio:
| | (a) | Cost for federal income tax purposes is $1,042,404,300. |
At September 30, 2008, the Fund held investments in the following sectors:
| | |
Sector (Unaudited) | | % of Net Assets |
Financials | | 17.3 |
Consumer Staples | | 14.4 |
Health Care | | 12.0 |
Information Technology | | 10.2 |
Energy | | 9.8 |
Consumer Discretionary | | 8.6 |
Industrials | | 7.0 |
Telecommunication Services | | 6.9 |
Utilities | | 4.1 |
Materials | | 3.0 |
| | |
| | 93.3 |
Short-Term Obligation | | 6.2 |
Other Assets & Liabilities, Net | | 0.5 |
| | |
| | 100.0 |
| | |
| | |
Acronym | | Name |
ADR | | American Depositary Receipt |
See Accompanying Notes to Financial Statements.
12
Statement of Assets and Liabilities – Columbia Dividend Income Fund
September 30, 2008
| | | | | |
| | | | | ($) | |
| Assets | | Investments, at cost | | 1,042,117,281 | |
| | | | | |
| | Investments, at value | | 1,060,889,751 | |
| | Cash | | 510 | |
| | Receivable for: | | | |
| | Investments sold | | 2,645,724 | |
| | Fund shares sold | | 3,195,057 | |
| | Interest | | 368 | |
| | Dividends | | 2,818,899 | |
| | Securities lending | | 11,485 | |
| | Expense reimbursement due from investment advisor | | 136,291 | |
| | Trustees’ deferred compensation plan | | 85,290 | |
| | Other assets | | 14,138 | |
| | | |
| | Total Assets | | 1,069,797,513 | |
| | |
| Liabilities | | Payable for: | | | |
| | Fund shares repurchased | | 2,578,310 | |
| | Distributions | | 6,049 | |
| | Investment advisory fee | | 620,108 | |
| | Administration fee | | 61,782 | |
| | Transfer agent fee | | 153,463 | |
| | Pricing and bookkeeping fees | | 11,791 | |
| | Trustees’ fees | | 4,589 | |
| | Custody fee | | 4,925 | |
| | Distribution and service fees | | 118,100 | |
| | Chief compliance officer expenses | | 248 | |
| | Trustees’ deferred compensation plan | | 85,290 | |
| | Other liabilities | | 165,487 | |
| | | |
| | Total Liabilities | | 3,810,142 | |
| |
| | | |
| | Net Assets | | 1,065,987,371 | |
| | |
| Net Assets Consist of | | Paid-in capital | | 1,164,353,946 | |
| | Undistributed net investment income | | 180,736 | |
| | Accumulated net realized loss | | (117,319,781 | ) |
| | Net unrealized appreciation on investments | | 18,772,470 | |
| | | |
| | Net Assets | | 1,065,987,371 | |
See Accompanying Notes to Financial Statements.
13
Statement of Assets and Liabilities (continued) – Columbia Dividend Income Fund
September 30, 2008
| | | | | | |
| | | | | | |
| Class A | | Net assets | | $ | 278,122,057 | |
| | Shares outstanding | | | 23,159,199 | |
| | Net asset value per share | | $ | 12.01 | (a) |
| | Maximum sales charge | | | 5.75 | % |
| | Maximum offering price per share ($12.01/0.9425) | | $ | 12.74 | (b) |
| | |
| Class B | | Net assets | | $ | 31,306,675 | |
| | Shares outstanding | | | 2,663,670 | |
| | Net asset value and offering price per share | | $ | 11.75 | (a) |
| | |
| Class C | | Net assets | | $ | 12,634,967 | |
| | Shares outstanding | | | 1,075,779 | |
| | Net asset value and offering price per share | | $ | 11.74 | (a) |
| | |
| Class R | | Net assets | | $ | 10,952 | |
| | Shares outstanding | | | 912 | |
| | Net asset value, offering and redemption price per share | | $ | 12.01 | |
| | |
| Class T | | Net assets | | $ | 72,212,886 | |
| | Shares outstanding | | | 6,013,114 | |
| | Net asset value per share | | $ | 12.01 | (a) |
| | Maximum sales charge | | | 5.75 | % |
| | Maximum offering price per share ($12.01/0.9425) | | $ | 12.74 | (b) |
| | |
| Class Z | | Net assets | | $ | 671,699,834 | |
| | Shares outstanding | | | 55,923,283 | |
| | Net asset value, offering and redemption price per share | | $ | 12.01 | |
| (a) | Redemption price per share is equal to net asset value less any applicable contingent deferred sales charge. |
| (b) | On sales of $50,000 or more the offering price is reduced. |
See Accompanying Notes to Financial Statements.
14
Statement of Operations – Columbia Dividend Income Fund
For the Year Ended September 30, 2008
| | | | | |
| | | | | ($) | |
| Investment Income | | Dividends | | 35,327,202 | |
| | Interest | | 1,837,491 | |
| | Securities lending | | 308,901 | |
| | Foreign taxes withheld | | (272,066 | ) |
| | | |
| | Total Investment Income | | 37,201,528 | |
| | |
| Expenses | | Investment advisory fee | | 7,520,664 | |
| | Administration fee | | 756,060 | |
| | Distribution fee: | | | |
| | Class B | | 312,812 | |
| | Class C | | 119,680 | |
| | Class R (a) | | 30 | |
| | Service fee: | | | |
| | Class A | | 820,130 | |
| | Class B | | 104,271 | |
| | Class C | | 39,894 | |
| | Shareholder service fee – Class T | | 260,529 | |
| | Transfer agent fee | | 754,354 | |
| | Pricing and bookkeeping fees | | 147,623 | |
| | Trustees’ fees | | 50,147 | |
| | Custody fee | | 48,348 | |
| | Chief compliance officer expenses | | 987 | |
| | Other expenses | | 358,573 | |
| | | |
| | Total Expenses | | 11,294,102 | |
| | |
| | Fees waived and/or expenses reimbursed by investment advisor | | (591,255 | ) |
| | Expense reductions | | (17,920 | ) |
| | | |
| | Net Expenses | | 10,684,927 | |
| |
| | | |
| | Net Investment Income | | 26,516,601 | |
| | |
| Net Realized and Unrealized Gain (Loss) on Investments | | Net realized loss on investments | | (31,537,547 | ) |
| | Net change in unrealized appreciation (depreciation) on investments | | (226,151,392 | ) |
| | | |
| | Net Loss | | (257,688,939 | ) |
| |
| | | |
| | Net Decrease Resulting from Operations | | (231,172,338 | ) |
| (a) | Class R shares commenced operations on March 28, 2008. |
See Accompanying Notes to Financial Statements.
15
Statement of Changes in Net Assets – Columbia Dividend Income Fund
| | | | | | | | |
| | | | | Year Ended September 30, | |
| Increase (Decrease) in Net Assets: | | 2008 ($) (a) | | | 2007 ($) (b) | |
| Operations | | Net investment income | | 26,516,601 | | | 20,990,003 | |
| | Net realized gain (loss) on investments | | (31,537,547 | ) | | 52,204,503 | |
| | Net change in unrealized appreciation (depreciation) on investments | | (226,151,392 | ) | | 96,436,179 | |
| | | | | | | | |
| | Net Increase (Decrease) Resulting from Operations | | (231,172,338 | ) | | 169,630,685 | |
| | | |
| Distributions to Shareholders | | From net investment income: | | | | | | |
| | Class A | | (7,344,786 | ) | | (6,559,689 | ) |
| | Class B | | (618,508 | ) | | (627,109 | ) |
| | Class C | | (239,863 | ) | | (207,843 | ) |
| | Class G | | — | | | (18,799 | ) |
| | Class R | | (125 | ) | | — | |
| | Class T | | (1,886,431 | ) | | (1,779,633 | ) |
| | Class Z | | (16,590,521 | ) | | (11,419,554 | ) |
| | From net realized gains: | | | | | | |
| | Class A | | (3,801,052 | ) | | (3,228,881 | ) |
| | Class B | | (529,218 | ) | | (551,026 | ) |
| | Class C | | (204,324 | ) | | (153,342 | ) |
| | Class G | | — | | | (14,208 | ) |
| | Class T | | (1,011,104 | ) | | (896,721 | ) |
| | Class Z | | (6,242,104 | ) | | (4,555,801 | ) |
| | | | | | | | |
| | Total Distributions to Shareholders | | (38,468,036 | ) | | (30,012,606 | ) |
| | | |
| | Net Increase from Share Transactions | | 195,920,032 | | | 13,798,283 | |
| | | |
| | | | | | | | |
| | Total Increase (Decrease) in Net Assets | | (73,720,342 | ) | | 153,416,362 | |
| | | |
| Net Assets | | Beginning of period | | 1,139,707,713 | | | 986,291,351 | |
| | End of period | | 1,065,987,371 | | | 1,139,707,713 | |
| | Undistributed net investment income at end of period | | 180,736 | | | 295,363 | |
| (a) | Class R shares commenced operations on March 28, 2008. |
| (b) | Class G shares were converted into Class T shares on August 8, 2007. |
See Accompanying Notes to Financial Statements.
16
Statement of Changes in Net Assets (continued) – Capital Stock Activity
| | | | | | | | | | | | |
| | | Columbia Dividend Income Fund | |
| | | Year Ended September 30, | |
| | | 2008 (a) | | | 2007 (b) | |
| | | Shares | | | Dollars ($) | | | Shares | | | Dollars ($) | |
Class A | | | | | | | | | | | | |
Subscriptions | | 3,040,373 | | | 41,888,249 | | | 3,060,561 | | | 44,656,130 | |
Distributions reinvested | | 671,595 | | | 9,255,016 | | | 551,501 | | | 7,960,088 | |
Redemptions | | (4,675,333 | ) | | (64,381,794 | ) | | (5,182,515 | ) | | (74,776,534 | ) |
| | | | | | | | | | | | |
Net Decrease | | (963,365 | ) | | (13,238,529 | ) | | (1,570,453 | ) | | (22,160,316 | ) |
| | | | |
Class B | | | | | | | | | | | | |
Subscriptions | | 236,708 | | | 3,185,642 | | | 547,509 | | | 7,686,326 | |
Distributions reinvested | | 70,180 | | | 965,509 | | | 70,794 | | | 991,944 | |
Redemptions | | (1,165,286 | ) | | (15,738,910 | ) | | (1,471,587 | ) | | (20,975,485 | ) |
| | | | | | | | | | | | |
Net Decrease | | (858,398 | ) | | (11,587,759 | ) | | (853,284 | ) | | (12,297,215 | ) |
| | | | |
Class C | | | | | | | | | | | | |
Subscriptions | | 244,503 | | | 3,295,088 | | | 656,579 | | | 9,234,448 | |
Distributions reinvested | | 27,268 | | | 374,494 | | | 21,013 | | | 296,011 | |
Redemptions | | (568,860 | ) | | (7,771,162 | ) | | (288,373 | ) | | (4,120,077 | ) |
| | | | | | | | | | | | |
Net Increase (Decrease) | | (297,089 | ) | | (4,101,580 | ) | | 389,219 | | | 5,410,382 | |
| | | | |
Class G | | | | | | | | | | | | |
Subscriptions | | — | | | — | | | 1,877 | | | 26,709 | |
Distributions reinvested | | — | | | — | | | 2,220 | | | 30,873 | |
Redemptions | | — | | | — | | | (123,772 | ) | | (1,802,734 | ) |
| | | | | | | | | | | | |
Net Decrease | | — | | | — | | | (119,675 | ) | | (1,745,152 | ) |
| | | | |
Class R | | | | | | | | | | | | |
Subscriptions | | 761 | | | 10,178 | | | — | | | — | |
Proceeds received in connection with merger | | 141 | | | 1,894 | | | — | | | — | |
Distributions reinvested | | 10 | | | 125 | | | — | | | — | |
| | | | | | | | | | | | |
Net Increase | | 912 | | | 12,197 | | | — | | | — | |
| | | | |
Class T | | | | | | | | | | | | |
Subscriptions | | 60,101 | | | 834,348 | | | 161,555 | | | 2,383,858 | |
Distributions reinvested | | 202,390 | | | 2,793,219 | | | 178,792 | | | 2,580,193 | |
Redemptions | | (823,169 | ) | | (11,391,329 | ) | | (951,668 | ) | | (13,833,052 | ) |
| | | | | | | | | | | | |
Net Decrease | | (560,678 | ) | | (7,763,762 | ) | | (611,321 | ) | | (8,869,001 | ) |
| | | | |
Class Z | | | | | | | | | | | | |
Subscriptions | | 15,600,509 | | | 213,411,245 | | | 10,996,789 | | | 160,853,172 | |
Proceeds received in connection with merger | | 12,606,624 | | | 168,957,597 | | | — | | | — | |
Distributions reinvested | | 319,451 | | | 4,324,304 | | | 213,453 | | | 3,082,200 | |
Redemptions | | (11,343,303 | ) | | (154,093,681 | ) | | (7,548,346 | ) | | (110,475,787 | ) |
| | | | | | | | | | | | |
Net Increase | | 17,183,281 | | | 232,599,465 | | | 3,661,896 | | | 53,459,585 | |
| (a) | Class R shares commenced operations on March 28, 2008. |
| (b) | Class G shares were converted into Class T shares on August 8, 2007. |
See Accompanying Notes to Financial Statements.
17
Financial Highlights – Columbia Dividend Income Fund
Selected data for a share outstanding throughout each period is as follows:
| | | | | | | | | | | | | | | | | | | | |
| | | Year Ended September 30, | |
| Class A Shares | | 2008 | | | 2007 | | | 2006 | | | 2005 | | | 2004 (a) | |
Net Asset Value, Beginning of Period | | $ | 15.35 | | | $ | 13.45 | | | $ | 12.01 | | | $ | 10.80 | | | $ | 9.26 | |
| | | | | |
Income from Investment Operations: | | | | | | | | | | | | | | | | | | | | |
Net investment income (b) | | | 0.31 | | | | 0.28 | | | | 0.26 | | | | 0.25 | | | | 0.18 | |
Net realized and unrealized gain (loss) on investments | | | (3.18 | ) | | | 2.02 | | | | 1.45 | | | | 1.16 | | | | 1.53 | |
| | | | | | | | | | | | | | | | | | | | |
Total from Investment Operations | | | (2.87 | ) | | | 2.30 | | | | 1.71 | | | | 1.41 | | | | 1.71 | |
| | | | | |
Less Distributions to Shareholders: | | | | | | | | | | | | | | | | | | | | |
From net investment income | | | (0.31 | ) | | | (0.27 | ) | | | (0.27 | ) | | | (0.20 | ) | | | (0.17 | ) |
From net realized gains | | | (0.16 | ) | | | (0.13 | ) | | | — | | | | — | | | | — | |
| | | | | | | | | | | | | | | | | | | | |
Total Distributions to Shareholders | | | (0.47 | ) | | | (0.40 | ) | | | (0.27 | ) | | | (0.20 | ) | | | (0.17 | ) |
| | | | | |
Net Asset Value, End of Period | | $ | 12.01 | | | $ | 15.35 | | | $ | 13.45 | | | $ | 12.01 | | | $ | 10.80 | |
Total return (c)(d) | | | (19.06 | )% | | | 17.31 | % | | | 14.45 | % | | | 13.10 | % | | | 18.60 | % |
| | | | | |
Ratios to Average Net Assets/Supplemental Data: | | | | | | | | | | | | | | | | | | | | |
Net expenses (e) | | | 1.05 | % | | | 1.05 | % | | | 1.05 | % | | | 1.05 | % | | | 1.36 | % |
Waiver/Reimbursement | | | 0.06 | % | | | 0.07 | % | | | 0.12 | % | | | 0.18 | % | | | 0.06 | % |
Net investment income (e) | | | 2.24 | % | | | 1.90 | % | | | 2.19 | % | | | 2.11 | % | | | 1.71 | % |
Portfolio turnover rate | | | 16 | % | | | 21 | % | | | 52 | % | | | 18 | % | | | 44 | % |
Net assets, end of period (000’s) | | $ | 278,122 | | | $ | 370,358 | | | $ | 345,595 | | | $ | 27,534 | | | $ | 7,319 | |
| (a) | On October 13, 2003, Liberty Strategic Equity Fund was renamed Columbia Strategic Equity Fund. On October 27, 2003, Columbia Strategic Equity Fund was renamed Columbia Dividend Income Fund. |
| (b) | Per share data was calculated using the average shares outstanding during the period. |
| (c) | Total return at net asset value assuming all distributions reinvested and no initial sales charge or contingent deferred sales charge. |
| (d) | Had the investment advisor and/or any of its affiliates not waived fees or reimbursed a portion of expenses, total return would have been reduced. |
| (e) | The benefits derived from expense reductions had an impact of less than 0.01%. |
See Accompanying Notes to Financial Statements.
18
Financial Highlights – Columbia Dividend Income Fund
Selected data for a share outstanding throughout each period is as follows:
| | | | | | | | | | | | | | | | | | | | |
| | | Year Ended September 30, | |
| Class B Shares | | 2008 | | | 2007 | | | 2006 | | | 2005 | | | 2004 (a) | |
Net Asset Value, Beginning of Period | | $ | 15.03 | | | $ | 13.17 | | | $ | 11.77 | | | $ | 10.59 | | | $ | 9.08 | |
| | | | | |
Income from Investment Operations: | | | | | | | | | | | | | | | | | | | | |
Net investment income (b) | | | 0.20 | | | | 0.16 | | | | 0.16 | | | | 0.16 | | | | 0.10 | |
Net realized and unrealized gain (loss) on investments | | | (3.11 | ) | | | 1.99 | | | | 1.42 | | | | 1.13 | | | | 1.50 | |
| | | | | | | | | | | | | | | | | | | | |
Total from Investment Operations | | | (2.91 | ) | | | 2.15 | | | | 1.58 | | | | 1.29 | | | | 1.60 | |
| | | | | |
Less Distributions to Shareholders: | | | | | | | | | | | | | | | | | | | | |
From net investment income | | | (0.21 | ) | | | (0.16 | ) | | | (0.18 | ) | | | (0.11 | ) | | | (0.09 | ) |
From net realized gains | | | (0.16 | ) | | | (0.13 | ) | | | — | | | | — | | | | — | |
| | | | | | | | | | | | | | | | | | | | |
Total Distributions to Shareholders | | | (0.37 | ) | | | (0.29 | ) | | | (0.18 | ) | | | (0.11 | ) | | | (0.09 | ) |
| | | | | |
Net Asset Value, End of Period | | $ | 11.75 | | | $ | 15.03 | | | $ | 13.17 | | | $ | 11.77 | | | $ | 10.59 | |
Total return (c)(d) | | | (19.71 | )% | | | 16.49 | % | | | 13.55 | % | | | 12.23 | % | | | 17.69 | % |
| | | | | |
Ratios to Average Net Assets/Supplemental Data: | | | | | | | | | | | | | | | | | | | | |
Net expenses (e) | | | 1.80 | % | | | 1.80 | % | | | 1.80 | % | | | 1.80 | % | | | 2.11 | % |
Waiver/Reimbursement | | | 0.06 | % | | | 0.07 | % | | | 0.12 | % | | | 0.18 | % | | | 0.06 | % |
Net investment income (e) | | | 1.48 | % | | | 1.16 | % | | | 1.30 | % | | | 1.36 | % | | | 0.94 | % |
Portfolio turnover rate | | | 16 | % | | | 21 | % | | | 52 | % | | | 18 | % | | | 44 | % |
Net assets, end of period (000’s) | | $ | 31,307 | | | $ | 52,937 | | | $ | 57,644 | | | $ | 17,359 | | | $ | 8,808 | |
| (a) | On October 13, 2003, Liberty Strategic Equity Fund was renamed Columbia Strategic Equity Fund. On October 27, 2003, Columbia Strategic Equity Fund was renamed Columbia Dividend Income Fund. |
| (b) | Per share data was calculated using the average shares outstanding during the period. |
| (c) | Total return at net asset value assuming all distributions reinvested and no contingent deferred sales charge. |
| (d) | Had the investment advisor and/or any of its affiliates not waived fees or reimbursed a portion of expenses, total return would have been reduced. |
| (e) | The benefits derived from expense reductions had an impact of less than 0.01%. |
See Accompanying Notes to Financial Statements.
19
Financial Highlights – Columbia Dividend Income Fund
Selected data for a share outstanding throughout each period is as follows:
| | | | | | | | | | | | | | | | | | | | |
| | | Year Ended September 30, | |
| Class C Shares | | 2008 | | | 2007 | | | 2006 | | | 2005 | | | 2004 (a) | |
Net Asset Value, Beginning of Period | | $ | 15.02 | | | $ | 13.17 | | | $ | 11.76 | | | $ | 10.58 | | | $ | 9.07 | |
| | | | | |
Income from Investment Operations: | | | | | | | | | | | | | | | | | | | | |
Net investment income (b) | | | 0.20 | | | | 0.16 | | | | 0.16 | | | | 0.16 | | | | 0.10 | |
Net realized and unrealized gain (loss) on investments | | | (3.11 | ) | | | 1.98 | | | | 1.43 | | | | 1.13 | | | | 1.50 | |
| | | | | | | | | | | | | | | | | | | | |
Total from Investment Operations | | | (2.91 | ) | | | 2.14 | | | | 1.59 | | | | 1.29 | | | | 1.60 | |
| | | | | |
Less Distributions to Shareholders: | | | | | | | | | | | | | | | | | | | | |
From net investment income | | | (0.21 | ) | | | (0.16 | ) | | | (0.18 | ) | | | (0.11 | ) | | | (0.09 | ) |
From net realized gains | | | (0.16 | ) | | | (0.13 | ) | | | — | | | | — | | | | — | |
| | | | | | | | | | | | | | | | | | | | |
Total Distributions to Shareholders | | | (0.37 | ) | | | (0.29 | ) | | | (0.18 | ) | | | (0.11 | ) | | | (0.09 | ) |
| | | | | |
Net Asset Value, End of Period | | $ | 11.74 | | | $ | 15.02 | | | $ | 13.17 | | | $ | 11.76 | | | $ | 10.58 | |
Total return (c)(d) | | | (19.72 | )% | | | 16.42 | % | | | 13.64 | % | | | 12.24 | % | | | 17.70 | % |
| | | | | |
Ratios to Average Net Assets/Supplemental Data: | | | | | | | | | | | | | | | | | | | | |
Net expenses (e) | | | 1.80 | % | | | 1.80 | % | | | 1.80 | % | | | 1.80 | % | | | 2.11 | % |
Waiver/Reimbursement | | | 0.06 | % | | | 0.07 | % | | | 0.12 | % | | | 0.18 | % | | | 0.06 | % |
Net investment income (e) | | | 1.48 | % | | | 1.14 | % | | | 1.29 | % | | | 1.36 | % | | | 0.94 | % |
Portfolio turnover rate | | | 16 | % | | | 21 | % | | | 52 | % | | | 18 | % | | | 44 | % |
Net assets, end of period (000’s) | | $ | 12,635 | | | $ | 20,622 | | | $ | 12,950 | | | $ | 3,959 | | | $ | 2,027 | |
| (a) | On October 13, 2003, Liberty Strategic Equity Fund was renamed Columbia Strategic Equity Fund. On October 27, 2003, Columbia Strategic Equity Fund was renamed Columbia Dividend Income Fund. |
| (b) | Per share data was calculated using the average shares outstanding during the period. |
| (c) | Total return at net asset value assuming all distributions reinvested and no contingent deferred sales charge. |
| (d) | Had the investment advisor and/or any of its affiliates not waived fees or reimbursed a portion of expenses, total return would have been reduced. |
| (e) | The benefits derived from expense reductions had an impact of less than 0.01%. |
See Accompanying Notes to Financial Statements.
20
Financial Highlights – Columbia Dividend Income Fund
Selected data for a share outstanding throughout the period is as follows:
| | | | |
| Class R Shares | | Period Ended
September 30,
2008 (a) | |
Net Asset Value, Beginning of Period | | $ | 13.39 | |
| |
Income from Investment Operations: | | | | |
Net investment income (b) | | | 0.14 | |
Net realized and unrealized loss on investments | | | (1.38 | ) |
| | | | |
Total from Investment Operations | | | (1.24 | ) |
| |
Less Distributions to Shareholders: | | | | |
From net investment income | | | (0.14 | ) |
| |
Net Asset Value, End of Period | | $ | 12.01 | |
Total return (c)(d)(e) | | | (9.28 | )% |
| |
Ratios to Average Net Assets/Supplemental Data: | | | | |
Net expenses (f)(g) | | | 1.30 | % |
Waiver/Reimbursement (g) | | | 0.06 | % |
Net investment income (f)(g) | | | 2.10 | % |
Portfolio turnover rate (e) | | | 16 | % |
Net assets, end of period (000’s) | | $ | 11 | |
| (a) | Class R shares commenced operations on March 28, 2008. Per share data and total return reflect activity from that date. |
| (b) | Per share data was calculated using the average shares outstanding during the period. |
| (c) | Total return at net asset value assuming all distributions reinvested. |
| (d) | Had the investment advisor and/or any of its affiliates not waived fees or reimbursed a portion of expenses, total return would have been reduced. |
| (f) | The benefits derived from expense reductions had an impact of less than 0.01%. |
See Accompanying Notes to Financial Statements.
21
Financial Highlights – Columbia Dividend Income Fund
Selected data for a share outstanding throughout each period is as follows:
| | | | | | | | | | | | | | | | | | | | |
| | | Year Ended September 30, | |
| Class T Shares | | 2008 | | | 2007 | | | 2006 | | | 2005 | | | 2004 (a) | |
Net Asset Value, Beginning of Period | | $ | 15.35 | | | $ | 13.45 | | | $ | 12.01 | | | $ | 10.80 | | | $ | 9.26 | |
| | | | | |
Income from Investment Operations: | | | | | | | | | | | | | | | | | | | | |
Net investment income (b) | | | 0.30 | | | | 0.27 | | | | 0.25 | | | | 0.24 | | | | 0.17 | |
Net realized and unrealized gain (loss) on investments | | | (3.18 | ) | | | 2.02 | | | | 1.46 | | | | 1.16 | | | | 1.54 | |
| | | | | | | | | | | | | | | | | | | | |
Total from Investment Operations | | | (2.88 | ) | | | 2.29 | | | | 1.71 | | | | 1.40 | | | | 1.71 | |
| | | | | |
Less Distributions to Shareholders: | | | | | | | | | | | | | | | | | | | | |
From net investment income | | | (0.30 | ) | | | (0.26 | ) | | | (0.27 | ) | | | (0.19 | ) | | | (0.17 | ) |
From net realized gains | | | (0.16 | ) | | | (0.13 | ) | | | — | | | | — | | | | — | |
| | | | | | | | | | | | | | | | | | | | |
Total Distributions to Shareholders | | | (0.46 | ) | | | (0.39 | ) | | | (0.27 | ) | | | (0.19 | ) | | | (0.17 | ) |
| | | | | |
Net Asset Value, End of Period | | $ | 12.01 | | | $ | 15.35 | | | $ | 13.45 | | | $ | 12.01 | | | $ | 10.80 | |
Total return (c)(d) | | | (19.10 | )% | | | 17.25 | % | | | 14.39 | % | | | 13.04 | % | | | 18.50 | % |
| | | | | |
Ratios to Average Net Assets/Supplemental Data: | | | | | | | | | | | | | | | | | | | | |
Net expenses (e) | | | 1.10 | % | | | 1.10 | % | | | 1.10 | % | | | 1.10 | % | | | 1.45 | % |
Waiver/Reimbursement | | | 0.06 | % | | | 0.07 | % | | | 0.12 | % | | | 0.18 | % | | | 0.04 | % |
Net investment income (e) | | | 2.19 | % | | | 1.85 | % | | | 1.96 | % | | | 2.06 | % | | | 1.64 | % |
Portfolio turnover rate | | | 16 | % | | | 21 | % | | | 52 | % | | | 18 | % | | | 44 | % |
Net assets, end of period (000’s) | | $ | 72,213 | | | $ | 100,932 | | | $ | 96,651 | | | $ | 99,148 | | | $ | 100,803 | |
| (a) | On October 13, 2003, Liberty Strategic Equity Fund was renamed Columbia Strategic Equity Fund. On October 27, 2003, Columbia Strategic Equity Fund was renamed Columbia Dividend Income Fund. |
| (b) | Per share data was calculated using the average shares outstanding during the period. |
| (c) | Total return at net asset value assuming all distributions reinvested and no initial sales charge or contingent deferred sales charge. |
| (d) | Had the investment advisor and/or any of its affiliates not waived fees or reimbursed a portion of expenses, total return would have been reduced. |
| (e) | The benefits derived from expense reductions had an impact of less than 0.01%. |
See Accompanying Notes to Financial Statements.
22
Financial Highlights – Columbia Dividend Income Fund
Selected data for a share outstanding throughout each period is as follows:
| | | | | | | | | | | | | | | | | | | | |
| | | Year Ended September 30, | |
| Class Z Shares | | 2008 | | | 2007 | | | 2006 | | | 2005 | | | 2004 (a) | |
Net Asset Value, Beginning of Period | | $ | 15.36 | | | $ | 13.45 | | | $ | 12.01 | | | $ | 10.80 | | | $ | 9.26 | |
| | | | | |
Income from Investment Operations: | | | | | | | | | | | | | | | | | | | | |
Net investment income (b) | | | 0.34 | | | | 0.31 | | | | 0.28 | | | | 0.28 | | | | 0.21 | |
Net realized and unrealized gain (loss) on investments | | | (3.19 | ) | | | 2.04 | | | | 1.47 | | | | 1.16 | | | | 1.53 | |
| | | | | | | | | | | | | | | | | | | | |
Total from Investment Operations | | | (2.85 | ) | | | 2.35 | | | | 1.75 | | | | 1.44 | | | | 1.74 | |
| | | | | |
Less Distributions to Shareholders: | | | | | | | | | | | | | | | | | | | | |
From net investment income | | | (0.34 | ) | | | (0.31 | ) | | | (0.31 | ) | | | (0.23 | ) | | | (0.20 | ) |
From net realized gains | | | (0.16 | ) | | | (0.13 | ) | | | — | | | | — | | | | — | |
| | | | | | | | | | | | | | | | | | | | |
Total Distributions to Shareholders | | | (0.50 | ) | | | (0.44 | ) | | | (0.31 | ) | | | (0.23 | ) | | | (0.20 | ) |
| | | | | |
Net Asset Value, End of Period | | $ | 12.01 | | | $ | 15.36 | | | $ | 13.45 | | | $ | 12.01 | | | $ | 10.80 | |
Total return (c)(d) | | | (18.90 | )% | | | 17.67 | % | | | 14.73 | % | | | 13.38 | % | | | 18.93 | % |
| | | | | |
Ratios to Average Net Assets/Supplemental Data: | | | | | | | | | | | | | | | | | | | | |
Net expenses (e) | | | 0.80 | % | | | 0.80 | % | | | 0.80 | % | | | 0.80 | % | | | 1.10 | % |
Waiver/Reimbursement | | | 0.06 | % | | | 0.07 | % | | | 0.12 | % | | | 0.18 | % | | | 0.05 | % |
Net investment income (e) | | | 2.51 | % | | | 2.15 | % | | | 2.27 | % | | | 2.37 | % | | | 1.98 | % |
Portfolio turnover rate | | | 16 | % | | | 21 | % | | | 52 | % | | | 18 | % | | | 44 | % |
Net assets, end of period (000’s) | | $ | 671,700 | | | $ | 594,859 | | | $ | 471,876 | | | $ | 358,125 | | | $ | 90,269 | |
| (a) | On October 13, 2003, Liberty Strategic Equity Fund was renamed Columbia Strategic Equity Fund. On October 27, 2003, Columbia Strategic Equity Fund was renamed Columbia Dividend Income Fund. |
| (b) | Per share data was calculated using the average shares outstanding during the period. |
| (c) | Total return at net asset value assuming all distributions reinvested. |
| (d) | Had the investment advisor and/or any of its affiliates not waived fees or reimbursed a portion of expenses, total return would have been reduced. |
| (e) | The benefits derived from expense reductions had an impact of less than 0.01%. |
See Accompanying Notes to Financial Statements.
23
Notes to Financial Statements – Columbia Dividend Income Fund
September 30, 2008
Note 1. Organization
Columbia Dividend Income Fund (the “Fund”), a series of Columbia Funds Series Trust I (the “Trust”), is a diversified portfolio. The Trust is a Massachusetts business trust registered under the Investment Company Act of 1940, as amended (the “1940 Act”), as an open-end management investment company.
Investment Objective
The Fund seeks total return, consisting of current income and capital appreciation.
Fund Shares
The Trust may issue an unlimited number of shares, and the Fund offers five classes of shares: Class A, Class B, Class C, Class R, Class T and Class Z. Class R shares commenced operations on March 28, 2008. Each share class has its own expense structure and sales charges, as applicable. Effective August 8, 2007, the Class G shares were converted into Class T shares of the Fund.
Class A and Class T shares are subject to a front-end sales charge based on the amount of initial investment. Class A and Class T shares purchased without an initial sales charge in accounts aggregating $1 million to $50 million at the time of purchase are subject to a 1.00% contingent deferred sales charge (“CDSC”) on shares sold within one year after purchase. Class B shares are subject to a maximum CDSC of 5.00% based upon the holding period after purchase. Class B shares will generally convert to Class A shares eight years after purchase. Class C shares are subject to a 1.00% CDSC on shares sold within one year after purchase. Class R and Class Z shares are offered continuously at net asset value. There are certain restrictions on the purchase of Class R and Class Z shares, as described in the Fund’s prospectus.
Note 2. Significant Accounting Policies
The preparation of financial statements in accordance with accounting principles generally accepted in the United States of America (“GAAP”) requires management to make certain estimates and assumptions that affect the reported amounts of assets and liabilities, the disclosure of contingent assets and liabilities at the date of the financial statements and the reported amounts of revenue and expenses during the reporting period. Actual results could differ from those estimates. The following is a summary of significant accounting policies consistently followed by the Fund in the preparation of its financial statements.
Security Valuation
Equity securities are valued at the last sale price on the principal exchange on which they trade, except for securities traded on the NASDAQ, which are valued at the NASDAQ official close price. Unlisted securities or listed securities for which there were no sales during the day are valued at the closing bid price on such exchanges or over-the-counter markets.
Short-term debt obligations maturing within 60 days are valued at amortized cost, which approximates market value.
Investments for which market quotations are not readily available, or that have quotations which management believes are not reliable, are valued at fair value as determined in good faith under consistently applied procedures established by and under the general supervision of the Board of Trustees. If a security is valued at fair value, such value is likely to be different from the last quoted market price for the security.
In September 2006, Statement of Financial Accounting Standards No. 157, Fair Value Measurements (“SFAS 157”), was issued. SFAS 157 is effective for fiscal years beginning after November 15, 2007. SFAS 157 defines fair value, establishes a framework for measuring fair value and expands disclosures about fair value measurements. Management is evaluating the impact the application of SFAS 157 will have on the Fund’s financial statement disclosures.
Security Transactions
Security transactions are accounted for on the trade date. Cost is determined and gains (losses) are based upon the specific identification method for both financial statement and federal income tax purposes.
In March 2008, Statement of Financial Accounting Standards No. 161, Disclosures about Derivative Instruments and Hedging Activities-an amendment of FASB Statement No. 133 (“SFAS 161”), was issued. SFAS 161 is effective for fiscal years and interim periods beginning after November 15, 2008. SFAS 161 requires additional discussion about the reporting entity’s derivative instruments and hedging activities, by providing for qualitative disclosures about the objectives and strategies for using derivatives, quantitative data about the fair value of and gains and losses on derivative contracts, and details of credit-risk-related contingent features in their hedged positions. Management is evaluating the impact the application of SFAS 161 will have on the Fund’s financial statement disclosures.
24
Columbia Dividend Income Fund
September 30, 2008
Repurchase Agreements
The Fund may engage in repurchase agreement transactions with institutions that Columbia Management Advisors, LLC (“Columbia”), the Fund’s investment advisor, has determined are creditworthy. The Fund, through its custodian, receives delivery of the underlying securities collateralizing a repurchase agreement. Columbia is responsible for determining that the collateral is at least equal, at all times, to the value of the repurchase obligation including interest. A repurchase agreement transaction involves certain risks in the event of default or insolvency of the counterparty. These risks include possible delays in or restrictions on the Fund’s ability to dispose of the underlying securities and a possible decline in the value of the underlying securities during the period while the Fund seeks to assert its rights.
Income Recognition
Interest income is recorded on the accrual basis. Corporate actions and dividend income are recorded on the ex-date. Distributions received from real estate investment trusts (REITs) in excess of their income are recorded as a reduction of the cost of the related investments. If the Fund no longer owns the applicable securities, any distributions received in excess of income are recorded as realized gains. Awards from class action litigation are recorded as a reduction of cost if the Fund still owns the applicable securities on the payment date. If the Fund no longer owns the applicable securities, the proceeds are recorded as realized gains.
Expenses
General expenses of the Trust are allocated to the Fund and the other series of the Trust based upon relative net assets or other expense allocation methodologies determined by the nature of the expense. Expenses directly attributable to the Fund are charged to the Fund.
Determination of Class Net Asset Value
All income, expenses (other than class-specific expenses, as shown on the Statement of Operations) and realized and unrealized gains (losses) are allocated to each class of the Fund on a daily basis, based on the relative net assets of each class, for purposes of determining the net asset value of each class.
Federal Income Tax Status
The Fund intends to qualify each year as a “regulated investment company” under Subchapter M of the Internal Revenue Code, as amended, and will distribute substantially all of its tax exempt or taxable income, if any, for its tax year, and as such will not be subject to federal income taxes. In addition, the Fund intends to distribute in each calendar year substantially all of its net investment income, capital gains and certain other amounts, if any, such that the Fund should not be subject to federal excise tax. Therefore, no federal income or excise tax provision is recorded.
Distributions to Shareholders
Distributions of net investment income are declared and distributed quarterly. Net realized capital gains, if any, are distributed at least annually. Income distributions and capital gain distributions are determined in accordance with federal income tax regulations which may differ from GAAP.
Indemnification
In the normal course of business, the Fund enters into contracts that contain a variety of representations and warranties and which provide general indemnities. The Fund’s maximum exposure under these arrangements is unknown because this would involve future claims against the Fund. Also, under the Trust’s organizational documents and by contract, the Trustees and officers of the Trust are indemnified against certain liabilities that may arise out of actions relating to their duties to the Trust. However, based on experience, the Fund expects the risk of loss due to these representations, warranties and indemnities to be minimal.
Note 3. Federal Tax Information
The timing and character of income and capital gain distributions are determined in accordance with income tax regulations, which may differ from GAAP. Reclassifications are made to the Fund’s capital accounts for permanent tax differences to reflect income and gains available for distribution (or available capital loss carryforwards) under income tax regulations.
25
Columbia Dividend Income Fund
September 30, 2008
For the year ended September 30, 2008, permanent book and tax basis differences were identified and reclassified among the components of the Fund’s net assets as follows:
| | | | |
| | | | | |
Undistributed Net Investment
Income | | Accumulated Net Realized
Loss | | Paid-In Capital |
| $49,006 | | $(809,001) | | $759,995 |
Net investment income and net realized gains (losses), as disclosed on the Statement of Operations, and net assets were not affected by this reclassification.
The tax character of distributions paid during the years ended September 30, 2008 and September 30, 2007 was as follows:
| | | | | | |
| | | September 30,
2008 | | September 30,
2007 |
| Distributions paid from: | | | | |
Ordinary Income* | | $ | 26,591,941 | | $ | 20,612,627 |
Long-Term Capital Gains | | | 11,876,095 | | | 9,399,979 |
| * | For tax purposes short-term capital gain distributions, if any, are considered ordinary income distributions. |
As of September 30, 2008, the components of distributable earnings on a tax basis were as follows:
| | | | |
| | | | | |
Undistributed
Ordinary Income | | Undistributed Long-Term Capital Gains | | Net Unrealized Appreciation* |
| $457,717 | | $— | | $18,485,451 |
| * | The differences between book-basis and tax-basis net unrealized appreciation/depreciation are primarily due to deferral of losses from such sales. |
Unrealized appreciation and depreciation at September 30, 2008, based on cost of investments for federal income tax purposes were:
| | | | |
| | | | |
Unrealized appreciation | | $ | 139,853,309 | |
Unrealized depreciation | | | (121,367,858 | ) |
Net unrealized appreciation | | $ | 18,485,451 | |
The following capital loss carryforwards, determined as of September 30, 2008, may be available to reduce taxable income arising from future net realized gains on investments, if any, to the extent permitted by the Internal Revenue Code:
| | | |
| | | |
| Year of Expiration | | Capital Loss Carryforward |
| 2009 | | $ | 57,057,645 |
| 2010 | | | 17,403,024 |
| 2011 | | | 1,266,110 |
| 2013 | | | 990,327 |
| 2014 | | | 2,808,003 |
| | | |
| Total | | $ | 79,525,109 |
Of the capital loss carryforwards attributable to the Fund, $76,717,106 ($57,057,645 of which expires September 30, 2009, $17,403,024 of which expires September 30, 2010, $1,266,110 of which expires September 30, 2011 and $990,327 of which expires September 30, 2013)) was acquired from fund mergers. The availability of a portion of the remaining capital loss carryforwards acquired as part of a fund merger may be limited in a given year.
Capital loss carryforwards of $5,077,617 were utilized to offset current year gains. Any capital loss carryforwards acquired as part of a merger that are permanently lost due to provisions under the Internal Revenue Code are included as being expired. Expired capital loss carryforwards are recorded as a reduction of paid-in capital.
Under current tax rules, certain currency and capital losses realized after October 31 may be deferred and treated as occurring on the first day of the following fiscal year. As of September 30, 2008, the Fund deferred post-October capital losses of $37,507,653 attributed to security transactions to October 1, 2008.
Under Financial Accounting Standards Board (“FASB”) Interpretation No. 48, Accounting for Uncertainty in Income Taxes – an Interpretation of FASB Statement No. 109 (“FIN 48”) management determines whether a tax position of the Fund is more likely than not to be sustained upon examination by the applicable taxing authority, including resolution of any related appeals or litigation processes, based on the technical merits of the position. The tax benefit to be recognized is measured as the largest amount of benefit that is greater than fifty percent likely of being realized upon ultimate
26
Columbia Dividend Income Fund
September 30, 2008
settlement. Management has evaluated the known implications of FIN 48 on its computation of net assets for the Fund. As a result of this evaluation, management has concluded that FIN 48 did not have any effect on the Fund’s financial statements. However, management’s conclusions regarding FIN 48 may be subject to review and adjustment at a later date based on factors including, but not limited to, further implementation guidance from the FASB, new tax laws, regulations, and administrative interpretations (including relevant court decisions). The Fund’s federal tax returns for the prior three fiscal years remain subject to examination by the Internal Revenue Service. The Fund is not aware of any tax positions for which it is reasonably possible that the total amounts of unrecognized tax benefits will significantly change in the next twelve months.
Note 4. Fees and Compensation Paid to Affiliates
Investment Advisory Fee
Columbia, an indirect, wholly owned subsidiary of Bank of America Corporation (“BOA”), provides investment advisory services to the Fund. In rendering investment advisory services to the Fund, Columbia may use the portfolio management and research services of Columbia Management Pte. Ltd., an affiliate of Columbia. Columbia receives a monthly investment advisory fee based on the Fund’s average daily net assets at the following annual rates:
| | |
| | | |
| Average Daily Net Assets | | Annual Fee Rate |
First $500 million | | 0.70% |
$500 million to $1 billion | | 0.65% |
$1 billion to $1.5 billion | | 0.60% |
$1.5 billion to $3 billion | | 0.55% |
$3 billion to $6 billion | | 0.53% |
Over $6 billion | | 0.51% |
For the year ended September 30, 2008, the Fund’s effective investment advisory fee rate was 0.67% of the Fund’s average daily net assets.
Administration Fee
Columbia provides administrative and other services to the Fund for a monthly administration fee at the annual rate of 0.067% of the Fund’s average daily net assets.
Pricing and Bookkeeping Fees
The Fund has entered into a Financial Reporting Services Agreement (the “Financial Reporting Services Agreement”) with State Street Bank & Trust Company (“State Street”) and Columbia pursuant to which State Street provides financial reporting services to the Fund. The Fund has also entered into an Accounting Services Agreement (collectively with the Financial Reporting Services Agreement, the “State Street Agreements”) with State Street and Columbia pursuant to which State Street provides accounting services to the Fund. Under the State Street Agreements, the Fund pays State Street an annual fee of $38,000 paid monthly plus an additional monthly fee based on an annualized percentage rate of average daily net assets of the Fund for the month. The aggregate fee will not exceed $140,000 per year (exclusive of out-of-pocket expenses and charges). The Fund also reimburses State Street for certain out-of-pocket expenses and charges.
The Fund has entered into a Pricing and Bookkeeping Oversight and Services Agreement (the “Services Agreement”) with Columbia. Under the Services Agreement, Columbia provides services related to Fund expenses and the requirements of the Sarbanes-Oxley Act of 2002, and provides oversight of the accounting and financial reporting services provided by State Street. Under the Services Agreement, the Fund reimburses Columbia for out-of-pocket expenses. Prior to January 1, 2008, the Fund also reimbursed Columbia for accounting oversight services, services related to Fund expenses and the requirements of the Sarbanes-Oxley Act of 2002.
For the year ended September 30, 2008, the amount charged to the Fund by affiliates included in the Statement of Operations under “Pricing and bookkeeping fees” aggregated to $3,106.
Transfer Agent Fee
Columbia Management Services, Inc. (the “Transfer Agent”), an affiliate of Columbia and an indirect, wholly owned subsidiary of BOA, provides shareholder services to the Fund and has contracted with Boston Financial Data Services (“BFDS”) to serve as sub-transfer agent. The Transfer Agent is entitled to receive a fee for its services, paid monthly, at the annual rate of $17.34 per open account plus reimbursement of certain sub-transfer agent fees paid by the Transfer Agent (exclusive of BFDS fees), calculated based on assets held in
27
Columbia Dividend Income Fund
September 30, 2008
omnibus accounts and intended to recover the cost of payments to other parties (including affiliates of BOA) for services to those accounts. Prior to November 1, 2007, the annual rate was $17.00 per open account. The Transfer Agent pays the fees of BFDS for services as sub-transfer agent and is not entitled to reimbursement for such fees from the Fund. The Transfer Agent may also retain, as additional compensation for its services, fees for wire, telephone and redemption orders, IRA trustee agent fees and account transcript fees due to the Transfer Agent from shareholders of the Fund and credits (net of bank charges) earned with respect to balances in accounts the Transfer Agent maintains in connection with its services to the Fund. The Transfer Agent also receives reimbursement for certain out-of-pocket expenses.
An annual minimum account balance fee of $20 may apply to certain accounts with a value below the Fund’s initial minimum investment requirements to reduce the impact of small accounts on transfer agent fees. These minimum account balance fees are recorded as part of expense reductions on the Statement of Operations. For the year ended September 30, 2008, these minimum account balance fees reduced total expenses by $17,163.
Underwriting Discounts, Service and Distribution Fees
Columbia Management Distributors, Inc. (the “Distributor”), an affiliate of Columbia and an indirect, wholly owned subsidiary of BOA, is the principal underwriter of the Fund’s shares. For the year ended September 30, 2008, the Distributor has retained net underwriting discounts of $48,889 and $1,246 on sales of the Fund’s Class A and Class T shares, respectively. For the same period, the Distributor received net CDSC fees of $347, $46,255 and $3,049 on Class A, Class B and Class C share redemptions, respectively.
The Fund has adopted Rule 12b-1 plans (the “Plans”) which require the payment of monthly service and distribution fees to the Distributor based on the average daily net assets of the applicable class of the Fund at the following annual rates:
| | | | | | |
| Distribution Fee |
| Class A | | Class B | | Class C | | Class R |
| 0.10% | | 0.75% | | 0.75% | | 0.50% |
| | | | |
| Service Fee |
| Class A | | Class B | | Class C |
| 0.25% | | 0.25% | | 0.25% |
The Fund may pay distribution and service fees up to a maximum annual rate of 0.35% of the Fund’s average daily net assets attributable to Class A shares (comprised of up to 0.10% for distribution services and up to 0.25% for shareholder services), but limited such fees to an aggregate fee of not more than 0.25% for Class A shares during the current fiscal year. For the year ended September 30, 2008, the distribution and service fees were 0.00% and 0.25%, respectively, of the Fund’s average daily net assets.
The CDSC and the distribution fees received from the Plans are used principally as repayment to the Distributor for amounts paid by the Distributor to dealers who sold such shares.
Shareholder Services Fees
The Fund has adopted a shareholder services plan that permits it to pay for certain services provided to Class T shareholders by service organizations. The Fund may pay shareholder services fees (which are included in other expenses) of up to 0.25% of the Fund’s average daily net assets attributable to Class T shares for shareholder liaison services and up to 0.25% of the Fund’s average daily net assets attributable to Class T shares for administrative support services, provided, however, that the aggregate fee shall not exceed 0.30% of the Fund’s average daily net assets attributable to Class T shares. For the year ended September 30, 2008, the shareholder services fee was 0.30% of the Fund’s average daily net assets attributable to Class T shares.
Fee Waivers and Expense Reimbursements
Columbia has contractually agreed to waive fees and/or reimburse the Fund for certain expenses through January 31, 2009, so that total expenses (exclusive of distribution and service fees, brokerage commissions, interest, taxes and extraordinary expenses, but inclusive of custodial charges relating to overdrafts, if any), after giving effect to any balance credits from the Fund’s custodian, will not exceed 0.80% of the Fund’s average daily net assets. There is no guarantee that this expense limitation will continue after January 31, 2009.
28
Columbia Dividend Income Fund
September 30, 2008
Fees Paid to Officers and Trustees
All officers of the Fund are employees of Columbia or its affiliates and, with the exception of the Fund’s Chief Compliance Officer, receive no compensation from the Fund. The Board of Trustees has appointed a Chief Compliance Officer to the Fund in accordance with federal securities regulations. The Fund, along with other affiliated funds, pays its pro-rata share of the expenses associated with the Chief Compliance Officer. The Fund’s expenses for the Chief Compliance Officer will not exceed $15,000 per year.
The Fund’s eligible Trustees may participate in a deferred compensation plan which may be terminated at any time. Obligations of the plan will be paid solely out of the Fund’s assets.
Note 5. Custody Credits
The Fund has an agreement with its custodian bank under which custody fees may be reduced by balance credits. These credits are recorded as part of expense reductions on the Statement of Operations. The Fund could have invested a portion of the assets utilized in connection with the expense offset arrangement in an income-producing asset if it had not entered into such an agreement.
For the year ended September 30, 2008, these custody credits reduced total expenses by $757 for the Fund.
Note 6. Portfolio Information
For the year ended September 30, 2008, the cost of purchases and proceeds from sales of securities, excluding short-term obligations, were $192,832,000 and $175,390,757, respectively.
Note 7. Line of Credit
The Fund and other affiliated funds participate in a $350,000,000 committed, unsecured revolving line of credit and a $150,000,000 uncommitted, unsecured line of credit, both provided by State Street. Borrowings are available for short-term liquidity or temporary or emergency purposes.
Interest on the committed line of credit is charged to each participating fund based on the fund’s borrowings at a rate per annum equal to the Federal Funds Rate plus 0.50%. In addition, a commitment fee of 0.10% per annum is accrued and apportioned among the participating funds pro rata based on their relative net assets. Interest on the uncommitted line of credit is charged to each participating fund based on the fund’s borrowings at a rate per annum equal to the Federal Funds Rate plus 0.375%. State Street charges an annual operations agency fee of $40,000 for the committed line of credit and may charge an annual administration fee of $15,000 for the uncommitted line of credit. The commitment fee, the operations agency fee and the administration fee are accrued and apportioned among the participating funds pro rata based on their relative net assets.
For the year ended September 30, 2008, the Fund did not borrow under these arrangements.
Note 8. Securities Lending
The Fund may lend its securities to certain approved brokers, dealers and other financial institutions. Each loan is collateralized by cash, in an amount at least equal to the market value of the securities loaned plus accrued income from the investment of collateral. The market value of the loaned securities is determined at the close of business of the Fund and any additional required collateral is delivered to the Fund on the next business day. The collateral received is invested and the income generated by the investment of the collateral, net of any fees remitted to State Street as the lending agent and borrower rebates, is paid to the Fund. Generally, in the event of borrower default, the Fund has the right to use the collateral to offset any losses incurred. In the event the Fund is delayed or prevented from exercising its right to dispose of the collateral, there may be a potential loss to the Fund. The Fund bears the risk of loss with respect to the investment of collateral.
Note 9. Shares of Beneficial Interest
52.7% of the Fund’s outstanding shares were beneficially owned by one participant account over which BOA and/or its affiliates had either sole or joint investment discretion.
Subscription and redemption activity of this account may have a significant effect on the operations of the Fund.
Note 10. Significant Risks and Contingencies
Legal Proceedings
On February 9, 2005, Columbia Management Advisors, Inc. (which has since merged into Banc of America Capital
29
Columbia Dividend Income Fund
September 30, 2008
Management, LLC (now named Columbia Management Advisors, LLC)) (“Columbia”) and Columbia Funds Distributor, Inc. (which has been renamed Columbia Management Distributors, Inc.) (the “Distributor”) (collectively, the “Columbia Group”) entered into an Assurance of Discontinuance with the New York Attorney General (“NYAG”) (the “NYAG Settlement”) and consented to the entry of a cease-and-desist order by the Securities and Exchange Commission (“SEC”) (the “SEC Order”) on matters relating to mutual fund trading.
Under the terms of the SEC Order, the Columbia Group agreed, among other things, to: pay $70 million in disgorgement and $70 million in civil money penalties; cease and desist from violations of the antifraud provisions and certain other provisions of the federal securities laws; maintain certain compliance and ethics oversight structures; retain an independent consultant to review the Columbia Group’s applicable supervisory, compliance, control and other policies and procedures; and retain an independent distribution consultant (see below). The Columbia Funds have also voluntarily undertaken to implement certain governance measures designed to maintain the independence of their boards of trustees. The NYAG Settlement also, among other things, requires Columbia and its affiliates to reduce management fees for certain Columbia Funds (including the former Nations Funds) and other mutual funds collectively by $32 million per year for five years, for a projected total of $160 million in management fee reductions.
Pursuant to the procedures set forth in the SEC Order, the $140 million in settlement amounts described above is being distributed in accordance with a distribution plan that was developed by an independent distribution consultant and approved by the SEC on April 6, 2007. Distributions under the distribution plan began in late June 2007.
A copy of the SEC Order is available on the SEC website at http://www.sec.gov. A copy of the NYAG Settlement is available as part of the Bank of America Corporation Form 8-K filing on February 10, 2005.
In connection with the events described above, various parties have filed suit against certain funds, the Trustees of the Columbia Funds, FleetBoston Financial Corporation and its affiliated entities and/or Bank of America and its affiliated entities.
On February 20, 2004, the Judicial Panel on Multidistrict Litigation transferred these cases and cases against other mutual fund companies based on similar allegations to the United States District Court in Maryland for consolidated or coordinated pretrial proceedings (the “MDL”). Subsequently, additional related cases were transferred to the MDL. On September 29, 2004, the plaintiffs in the MDL filed amended and consolidated complaints. One of these amended complaints is a putative class action that includes claims under the federal securities laws and state common law, and that names Columbia, the Distributor, the Trustees of the Columbia Funds, Bank of America Corporation and others as defendants. Another of the amended complaints is a derivative action purportedly on behalf of the Columbia Funds that asserts claims under federal securities laws and state common law.
On February 25, 2005, Columbia and other defendants filed motions to dismiss the claims in the pending cases. On March 1, 2006, for reasons stated in the court’s memoranda dated November 3, 2005, the U.S. District Court for the District of Maryland granted in part and denied in part the defendants’ motions to dismiss. The court dismissed all of the class action claims pending against the Columbia Funds Trusts. As to Columbia and the Distributor, the claims under the Securities Act of 1933, the claims under Sections 34(b) and 36(a) of the Investment Company Act of 1940 (“ICA”) and the state law claims were dismissed. The claims under Sections 10(b) and 20(a) of the Securities Exchange Act of 1934 and claims under Section 36(b) of the ICA were not dismissed.
On March 21, 2005, a purported class action was filed in Massachusetts state court alleging that certain conduct, including market timing, entitled Class B shareholders in certain Columbia funds to an exemption from contingent deferred sales charges upon early redemption (“the CDSC Lawsuit”). The CDSC Lawsuit was removed to federal court in Massachusetts and transferred to the MDL.
On September 14, 2007, the plaintiffs and the Columbia defendants named in the MDL, including the Columbia Funds, entered into a stipulation of settlement with respect to all Columbia-related claims in the MDL described above, including the CDSC Lawsuit. The settlement is subject to court approval.
In 2004, the Columbia Funds’ adviser and distributor and certain affiliated entities and individuals were named as
30
Columbia Dividend Income Fund
September 30, 2008
defendants in certain purported shareholder class and derivative actions making claims, including claims under the Investment Company and the Investment Advisers Acts of 1940 and state law. Certain Columbia Funds were named as nominal defendants. The suits allege, inter alia, that the fees and expenses paid by the funds are excessive and that the advisers and their affiliates inappropriately used fund assets to distribute the funds and for other improper purposes. On March 2, 2005, the actions were consolidated in the Massachusetts federal court as In re Columbia Entities Litigation. The plaintiffs filed a consolidated amended complaint on June 9, 2005. On November 30, 2005, the judge dismissed all claims by plaintiffs and entered final judgment in favor of the defendants. The plaintiffs appealed to the United States Court of Appeals for the First Circuit on December 30, 2005. A stipulation and settlement agreement dated January 19, 2007 was filed in the First Circuit on February 14, 2007, with a joint stipulation of dismissal and motion for remand to obtain district court approval of the settlement. That joint motion was granted and the appeal was dismissed. On March 6, 2007, the case was remanded to the District Court. The settlement, approved by the District Court on September 18, 2007, became effective October 19, 2007. Pursuant to the settlement, the funds’ adviser and/or its affiliates made certain payments, including plaintiffs’ attorneys’ fees and costs of notice to class members.
Note 11. Business Combinations and Mergers
Effective March 31, 2008, Equity Income Fund, a series of Excelsior Funds Trust, merged into Columbia Dividend Income Fund. Columbia Dividend Income Fund received a tax-free transfer of assets from Equity Income Fund as follows:
| | | | |
| | | | | |
Shares Issued | | Net Assets Received | | Unrealized Appreciation1 |
| 12,606,765 | | $168,959,491 | | $15,594,333 |
| | | | | |
| | | | | |
Net Assets of Columbia Dividend
Income Fund Prior to
Combination | | Net Assets of Equity Income Fund
Immediately Prior to
Combination | | Net Assets of Columbia Dividend
Income Fund
Immediately After
Combination |
| $1,020,836,297 | | $168,959,491 | | $1,189,795,788 |
1 | Unrealized appreciation is included in the Net Assets Received. |
Note 12. Subsequent Event
On October 16, 2008 the uncommitted and committed lines of credit discussed in Note 7 were terminated and amended, respectively. The Fund and other affiliated funds participate in a $280,000,000 committed, unsecured revolving line of credit. The maximum amount that may be borrowed by any fund is limited to the lesser of $200,000,000 and the Fund’s borrowing limit set forth in the Fund’s registration statement. Interest is charged to each participating fund based on the fund’s borrowings at a rate per annum equal to the greater of the Federal Funds Rate plus 0.50% and the overnight LIBOR Rate plus 0.50%. In addition, an annual operations agency fee of $20,000, an amendment fee of 0.02% and a commitment fee of 0.12% per annum are accrued and apportioned among the participating funds pro rata based on their relative net assets.
31
Report of Independent Registered Public Accounting Firm
To the Trustees of Columbia Funds Series Trust I and the Shareholders of Columbia Dividend Income Fund
In our opinion, the accompanying statement of assets and liabilities, including the investment portfolio, and the related statements of operations and of changes in net assets and the financial highlights present fairly, in all material respects, the financial position of Columbia Dividend Income Fund (the “Fund”) (a series of Columbia Funds Series Trust I) at September 30, 2008, the results of its operations for the year then ended, the changes in its net assets for each of the two years in the period then ended, and the financial highlights for each of the five years in the period then ended, in conformity with accounting principles generally accepted in the United States of America. These financial statements and financial highlights (hereafter referred to as “financial statements”) are the responsibility of the Fund’s management. Our responsibility is to express an opinion on these financial statements based on our audits. We conducted our audits of these financial statements in accordance with the standards of the Public Company Accounting Oversight Board (United States). Those standards require that we plan and perform the audit to obtain reasonable assurance about whether the financial statements are free of material misstatement. An audit includes examining, on a test basis, evidence supporting the amounts and disclosures in the financial statements, assessing the accounting principles used and significant estimates made by management, and evaluating the overall financial statement presentation. We believe that our audits, which included confirmation of securities at September 30, 2008 by correspondence with the custodian and brokers, provide a reasonable basis for our opinion.
PricewaterhouseCoopers LLP
Boston, Massachusetts
November 21, 2008
32
Federal Income Tax Information (Unaudited) – Columbia Dividend Income Fund
For the fiscal year ended September 30, 2008, the Fund designates long-term capital gains of $141,572.
For non-corporate shareholders, 100.00%, or the maximum amount allowable under the Jobs and Growth Tax Relief Reconciliation Act of 2003, of income earned by the Fund for the period October 1, 2007 to September 30, 2008 may represent qualified dividend income. Final information will be provided in your 2008 Form 1099-DIV.
100.00% of the ordinary income distributed by the Fund for the year ended September 30, 2008, qualifies for the corporate dividends received deduction.
33
Fund Governance
The Trustees serve terms of indefinite duration. The names, addresses and ages of the Trustees and officers of the Funds in Columbia Funds Series Trust I, the year each was first elected or appointed to office, their principal business occupations during at least the last five years, the number of Funds overseen by each Trustee and other directorships they hold are shown below. Each officer listed below serves as an officer of each Fund in the Columbia Funds Complex.
Independent Trustees
| | |
Name, Address and Year of Birth,
Position with Funds, Year First
Elected or Appointed to Office | | Principal Occupation(s) During Past Five Years, Number of Funds in Columbia Funds
Complex Overseen by Trustee, Other Directorships Held |
| |
| John D. Collins (Born 1938) | | |
c/o Columbia Management Advisors, LLC One Financial Center Boston, MA 02111 Trustee1 (since 2007) | | Retired. Consultant, KPMG, LLP (accounting and tax firm) from July 1999 to June 2000; Partner, KPMG, LLP from March 1962 to June 1999. Oversees 80, Mrs. Fields Famous Brands LLC (consumer products); Suburban Propane Partners, L.P.; and Montpelier Re (underwriting firm) |
| |
| Rodman L. Drake (Born 1943) | | |
c/o Columbia Management Advisors, LLC One Financial Center Boston, MA 02111 Trustee1 (since 2007) | | Co-Founder of Baringo Capital LLC (private equity) since 2002; President, Continuation Investments Group, Inc. from 1997 to 2001. Oversees 80, Jackson Hewitt Tax Service Inc. (tax preparation services); Crystal Capital River Inc. (real estate investment trust); Student Loan Corporation (student loan provider); Celgene Corporation (global biotechnology company); Apex Silver Mines Ltd. (mining); and Hyperion Brookfield Total Return Fund, Inc. and Hyperion Brookfield Strategic Mortgage Income Fund, Inc. (exchange-traded funds) |
| |
| Douglas A. Hacker (Born 1955) | | |
c/o Columbia Management Advisors, LLC One Financial Center Boston, MA 02111 Trustee (since 1996) | | Independent business executive since May 2006; Executive Vice President–Strategy of United Airlines (airline) from December 2002 to May 2006; President of UAL Loyalty Services (airline marketing company) from September 2001 to December 2002; Executive Vice President and Chief Financial Officer of United Airlines from July 1999 to September 2001. Oversees 80, Nash Finch Company (food distributor); Aircastle Limited (aircraft leasing) |
| |
| Janet Langford Kelly (Born 1957) | | |
c/o Columbia Management Advisors, LLC One Financial Center Boston, MA 02111 Trustee (since 1996) | | Senior Vice President, General Counsel and Corporate Secretary, ConocoPhillips (integrated energy company) since September 2007; Deputy General Counsel–Corporate Legal Services, ConocoPhillips from August 2006 to August 2007; Partner, Zelle, Hofmann, Voelbel, Mason & Gette LLP (law firm) from March 2005 to July 2006; Adjunct Professor of Law, Northwestern University, from September 2004 to June 2006; Director, UAL Corporation (airline) from February 2006 to July 2006; Chief Administrative Officer and Senior Vice President, Kmart Holding Corporation (consumer goods), from September 2003 to March 2004; Executive Vice President–Corporate Development and Administration, General Counsel and Secretary, Kellogg Company (food manufacturer), from September 1999 to August 2003. Oversees 80, None |
34
Fund Governance (continued)
Independent Trustees (continued)
| | |
Name, Address and Year of Birth,
Position with Funds, Year First
Elected or Appointed to Office | | Principal Occupation(s) During Past Five Years, Number of Funds in Columbia Funds
Complex Overseen by Trustee, Other Directorships Held |
| |
| Charles R. Nelson (Born 1942) | | |
c/o Columbia Management Advisors, LLC One Financial Center Boston, MA 02111 Trustee (since 1981) | | Professor of Economics, University of Washington, since January 1976; Ford and Louisa Van Voorhis Professor of Political Economy, University of Washington, since September 1993; Director, Institute for Economic Research, University of Washington from September 2001 to June 2003; Adjunct Professor of Statistics, University of Washington, since September 1980; Associate Editor, Journal of Money Credit and Banking, since September 1993; Consultant on econometric and statistical matters. Oversees 80, None |
| |
| John J. Neuhauser (Born 1943) | | |
c/o Columbia Management Advisors, LLC One Financial Center Boston, MA 02111 Trustee (since 1985) | | President, Saint Michael’s College, since August 2007; University Professor, Boston College from November 2005 to August 2007; Academic Vice President and Dean of Faculties, Boston College from August 1999 to October 2005. Oversees 80, Liberty All-Star Equity Fund and Liberty All-Star Growth Fund, Inc. (closed-end funds) |
| |
| Jonathan Piel (Born 1938) | | |
c/o Columbia Management Advisors, LLC One Financial Center Boston, MA 02111 Trustee1 (since 2007) | | Cable television producer and website designer; The Editor, Scientific American from 1984 to 1994; Vice President, Scientific American, Inc., from 1984 to 1994; Member, Advisory Board, Stone Age Institute, Bloomington, Indiana (research institute that explores the effect of technology on human evolution); Member, Board of Directors of the National Institute of Social Sciences, New York City; and Member, Board of Trustees of the William Alanson White Institute, New York City (institution for training psychoanalysts). Oversees 80, None |
| |
| Patrick J. Simpson (Born 1944) | | |
c/o Columbia Management Advisors, LLC One Financial Center Boston, MA 02111 Trustee (since 2000) | | Partner, Perkins Coie LLP (law firm). Oversees 80, None |
| |
| Thomas C. Theobald (Born 1937) | | |
c/o Columbia Management Advisors, LLC One Financial Center Boston, MA 02111 Trustee and Chairman of the Board (since 1996) | | Partner and Senior Advisor, Chicago Growth Partners (private equity investing) since September 2004; Managing Director, William Blair Capital Partners (private equity investing) from September 1994 to September 2004. Oversees 80, Anixter International (network support equipment distributor); Ventas, Inc. (real estate investment trust); Jones Lang LaSalle (real estate management services); Ambac Financial Group (financial guaranty insurance) |
| |
| Anne-Lee Verville (Born 1945) | | |
c/o Columbia Management Advisors, LLC One Financial Center Boston, MA 02111 Trustee (since 1998) | | Retired since 1997 (formerly General Manager–Global Education Industry (from 1994 to 1997), President–Application Systems Division (from 1991 to 1994), Chief Financial Officer–US Marketing & Services (from 1988 to 1991), and Chief Information Officer (from 1987 to 1988), IBM Corporation (computer and technology)). Oversees 80, None |
35
Fund Governance (continued)
Interested Trustee
| | |
Name, Address and Year of Birth,
Position with Funds, Year First
Elected or Appointed to Office | | Principal Occupation(s) During Past Five Years, Number of Funds in Columbia Funds
Complex Overseen by Trustee, Other Directorships Held |
| |
| William E. Mayer (Born 1940) | | |
c/o Columbia Management Advisors, LLC One Financial Center Boston, MA 02111 Trustee2 (since 1994) | | Partner, Park Avenue Equity Partners (private equity) since February 1999; Dean and Professor, College of Business, University of Maryland from 1992 to 1997. Oversees 80, Lee Enterprises (print media), WR Hambrecht + Co. (financial service provider); BlackRock Kelso Capital Corporation (investment company) |
1 | Messrs. Drake, Piel and Collins have served as directors/trustees of the Excelsior Funds since 1996, 1996 and 2005, respectively. The Excelsior Funds consisted of 27 portfolios managed by affiliates of Columbia Management Advisors, LLC. Effective December 12, 2007, the Board elected Messrs. Drake, Piel and Collins as Trustees of the Trust. |
2 | Mr. Mayer is an “interested person” (as defined in the Investment Company Act of 1940) by reason of his affiliation with WR Hambrecht + Co., a registered broker/dealer that may execute portfolio transactions for or engage in principal transactions with the Funds or other funds or accounts advised/managed by the Advisor or other Bank of America affiliates. |
The Statement of Additional Information includes additional information about the Trustees of the Funds and is available, without charge, upon request by calling 1-800-345-6611.
36
Fund Governance (continued)
Officers
| | |
Name, Address and Year of Birth,
Position with Columbia Funds, Year
First Elected or Appointed to Office | | Principal Occupation(s) During Past Five Years |
| |
| Christopher L. Wilson (Born 1957) | | |
One Financial Center Boston, MA 02111 President (since 2004) | | President–Columbia Funds, since October 2004; Managing Director–Columbia Management Advisors, LLC, since September 2005; Senior Vice President–Columbia Management Distributors, Inc., since January 2005; Director–Columbia Management Services, Inc., since January 2005; Director–Bank of America Global Liquidity Funds, plc and Banc of America Capital Management (Ireland), Limited, since May 2005; Director–FIM Funding, Inc., since January 2005; President and Chief Executive Officer–CDC IXIS AM Services, Inc. (investment management), from September 1998 through August 2004; and a senior officer or director of various other Bank of America affiliated entities, including other registered and unregistered funds. |
| |
| James R. Bordewick, Jr. (Born 1959) | | |
One Financial Center Boston, MA 02111 Senior Vice President, Secretary and Chief Legal Officer (since 2006) | | Associate General Counsel, Bank of America since April 2005; Senior Vice President and Associate General Counsel, MFS Investment Management (investment management) prior to April 2005. |
| |
| J. Kevin Connaughton (Born 1964) | | |
One Financial Center Boston, MA 02111 Senior Vice President and Chief Financial Officer (since 2000) | | Managing Director of Columbia Management Advisors, LLC since December 2004; Treasurer–Columbia Funds, from October 2003 to May 2008; Treasurer–the Liberty Funds, Stein Roe Funds and Liberty All-Star Funds, December 2000–December 2006; Senior Vice President–Columbia Management Advisors, LLC, from April 2003 to December 2004; President–Columbia Funds, Liberty Funds and Stein Roe Funds, February 2004 to October 2004; Treasurer–Galaxy Funds, September 2002 to December 2005; Treasurer, December 2002 to December 2004, and President, February 2004 to December 2004–Columbia Management Multi-Strategy Hedge Fund, LLC; and a senior officer of various other Bank of America-affiliated entities, including other registered and unregistered funds. |
| |
| Linda J. Wondrack (Born 1964) | | |
One Financial Center Boston, MA 02111 Senior Vice President and Chief Compliance Officer (since 2007) | | Director (Columbia Management Group LLC and Investment Product Group Compliance), Bank of America since June 2005; Director of Corporate Compliance and Conflicts Officer, MFS Investment Management (investment management), August 2004 to May 2005; Managing Director, Deutsche Asset Management (investment management) prior to August 2004. |
37
Fund Governance (continued)
Officers (continued)
| | |
Name, Address and Year of Birth,
Position with Columbia Funds, Year
First Elected or Appointed to Office | | Principal Occupation(s) During Past Five Years |
| |
| Michael G. Clarke (Born 1969) | | |
One Financial Center Boston, MA 02111 Treasurer (since 2008) | | Director of Fund Administration of the Advisor since January 2006; Managing Director of the Advisor September 2004 to December 2005; Vice President Fund Administration June 2002 to September 2004. |
| |
| Jeffrey R. Coleman (Born 1969) | | |
One Financial Center Boston, MA 02111 Deputy Treasurer (since 2006) | | Director of Fund Administration of the Advisor since January 2006; Fund Controller of the Advisor from October 2004 to January 2006; Vice President of CDC IXIS Asset Management Services, Inc. (investment management) from August 2000 to September 2004. |
| |
| Joseph F. DiMaria (Born 1968) | | |
One Financial Center Boston, MA 02111 Chief Accounting Officer (since 2008) | | Director of Fund Administration of the Advisor since January 2006; Head of Tax/Compliance and Assistant Treasurer of the Advisor from November 2004 to December 2005; Director of Trustee Administration (Sarbanes-Oxley) of the Advisor from May 2003 to October 2004. |
| |
| Julian Quero (Born 1967) | | |
One Financial Center Boston, MA 02111 Deputy Treasurer (since 2008) | | Senior Tax Manager of the Advisor since August 2006; Senior Compliance Manager of the Advisor from April 2002 to August 2006. |
| |
| Barry S. Vallan (Born 1969) | | |
One Financial Center Boston, MA 02111 Controller (since 2006) | | Vice President–Fund Treasury of the Advisor since October 2004; Vice President–Trustee Reporting of the Advisor from April 2002 to October 2004 |
38
[THIS PAGE INTENTIONALLY LEFT BLANK]
39
[THIS PAGE INTENTIONALLY LEFT BLANK]
40
Important Information About This Report – Columbia Dividend Income Fund
Transfer Agent
Columbia Management Services, Inc.
P.O. Box 8081
Boston, MA 02266-8081
1-800-345-6611
Distributor
Columbia Management
Distributors, Inc.
One Financial Center
Boston, MA 02111
Investment Advisor
Columbia Management Advisors, LLC
100 Federal Street
Boston, MA 02110
The fund mails one shareholder report to each shareholder address. If you would like more than one report, please call shareholder services at 1-800-345-6611 and additional reports will be sent to you. This report has been prepared for shareholders of Columbia Dividend Income Fund.
A description of the policies and procedures that the fund uses to determine how to vote proxies and a copy of the fund’s voting records are available (i) at www.columbiamanagement.com; (ii) on the Securities and Exchange Commission’s website at www.sec.gov; and (iii) without charge, upon request, by calling 1-800-368-0346. Information regarding how the fund voted proxies relating to portfolio securities during the 12-month period ended June 30 is available from the SEC’s website. Information regarding how the fund voted proxies relating to portfolio securities is also available from the fund’s website, www.columbiamanagement.com.
The fund files a complete schedule of portfolio holdings with the SEC for the first and third quarters of each fiscal year on Form N-Q. The fund’s Form N-Q is available on the SEC’s website at www.sec.gov and may be reviewed and copied at the SEC’s Public Reference Room in Washington, D.C. Information on the operation of the Public Reference Room may be obtained by calling 1-800-SEC-0330.
Please read and consider the investment objectives, risks, charges and expenses for any fund carefully before investing. For a prospectus which contains this and other important information about the fund, contact your Columbia Management representative or financial advisor or go to www.columbiafunds.com.
Columbia Management Group, LLC (“Columbia Management”) is the investment management division of Bank of America Corporation. Columbia Management entities furnish investment management services and products for institutional and individual investors. Columbia Funds are distributed by Columbia Management Distributors, Inc., member of FINRA, SIPC, part of Columbia Management and an affiliate of Bank of America Corporation.
41

Columbia Dividend Income Fund
Annual Report, September 30, 2008
©2008 Columbia Management Distributors, Inc.
One Financial Center, Boston, MA 02111-2621
800.345.6611 www.columbiafunds.com
SHC-42/156372-0908 (11/08) 08/62594

Annual Report
September 30, 2008
Columbia Liberty Fund
| | |
| NOT FDIC INSURED | | May Lose Value |
| NOT BANK ISSUED | | No Bank Guarantee |
Table of contents
The views expressed in this report reflect the current views of the respective parties. These views are not guarantees of future performance and involve certain risks, uncertainties and assumptions that are difficult to predict, so actual outcomes and results may differ significantly from the views expressed. These views are subject to change at any time based upon economic, market or other conditions and the respective parties disclaim any responsibility to update such views. These views may not be relied on as investment advice and, because investment decisions for a Columbia Fund are based on numerous factors, may not be relied on as an indication of trading intent on behalf of any particular Columbia Fund. References to specific securities should not be construed as a recommendation or investment advice.
President’s Message

Dear Shareholder:
We are pleased to provide this shareholder report for your Columbia Fund and hope you will find the portfolio management details, discussions and performance information helpful in monitoring your investments. As we’ve seen this past year, the financial markets can be quite volatile, with significant short-term price fluctuations. It’s important to keep these ups and downs in perspective, particularly in light of your long-term investment strategy.
Staying the course with your long-term strategy typically involves riding out short-term price fluctuations, though we recognize that at times this can be tough. To support your
efforts and give you the information you need to make prudent decisions, Columbia Management offers several valuable online resources. We encourage you to visit www.columbiamanagement.com/investor, where you can receive the most up-to-date information, including:
| n | | Daily pricing and performance. View pricing and performance from a link in Fund Tracker on the homepage. This listing of funds is updated nightly with the current net asset value and the amount and percentage change from the prior day. |
| n | | News & Commentary. This tab provides links to quarterly fund commentaries and information from our investment strategies group, including trends in the economy and market impact. |
If you would like more details on individual funds, select a fund from the dropdown menu on the top right side of the homepage for access to:
| n | | Monthly and quarterly performance information. |
| n | | Portfolio holdings. Full holdings are updated monthly for money market funds except for Columbia Cash Reserves and Columbia Money Market Reserves which are updated weekly, monthly for equity funds and quarterly for most other funds. |
| n | | Quarterly fact sheets. Accessible from the Literature tab in each fund page. |
By registering on the site, you’ll receive secured, 24-hour access to*:
| n | | Mutual fund account details with balances, dividend and transaction information |
| n | | Fund Tracker to customize your homepage with current net asset values for the funds that interest you |
| n | | On-line transactions including purchases, exchanges and redemptions |
| n | | Account maintenance for updating your address and dividend payment options |
| n | | Electronic delivery of prospectuses and shareholder reports |
I encourage you to visit our website for access to the product information and tools described above. These valuable online resources can help you monitor your investments and provide direct access to your account. All of these tools, and more, can be found on www.columbiamanagement.com/investor.
While your financial advisor is a great resource for investment guidance, you can also access our website or call our service representatives at 800.345.6611 for additional assistance. We thank you for investing with Columbia Management and look forward to helping with your ongoing investment needs.
Sincerely,

Christopher L. Wilson
President, Columbia Funds
| * | Some restrictions apply. Shareholders who purchase shares through certain third-party organizations may not have the ability to register for online access. |
Fund Profile – Columbia Liberty Fund
Performance data quoted represents past performance and current performance may be lower or higher. Past performance is no guarantee of future results. The investment return and principal value will fluctuate so that shares, when redeemed, may be worth more or less than the original cost. Please visit www.columbiafunds.com for daily and most recent month-end performance updates.
Summary
1-year return as of 09/30/08
| | |
| |
 | | –15.83% Class A shares |
| | (without sales charge) |
| |
| | –21.98% S&P 500 Index2 |
| |
 | | +3.65% Lehman Brothers U.S. Aggregate Bond Index2 |
Summary
| n | | For the 12-month period ended September 30, 2008, the fund’s Class A shares returned negative 15.83% without sales charge. |
n | | In a difficult environment for both stocks and bonds, the fund held up better than its peer group, the Lipper Mixed Asset Target Allocation Growth Classification.1 |
| n | | The fund did well to lower its exposure to equities, especially international equities. However, below average performance by the fund’s underlying investment strategies relative to their benchmarks detracted from the fund’s return. |
Portfolio Management
Vikram Kuriyan, PhD has co-managed the fund since August 2005 and has been with the advisor or its predecessors or affiliate organizations since 2000.
Karen A. Wurdack, PhD has co-managed the fund since August 2005 and has been with the advisor or its predecessors or affiliate organizations since 1993.
Colin Moore has co-managed the fund since February 2008 and has been with the advisor or its predecessors or affiliate organizations since 2002.
1 | Lipper Inc., a widely respected data provider in the industry, calculates an average total return (assuming reinvestment of distributions) for mutual funds with investment objectives similar to those of the fund. Lipper makes no adjustment for the effect of sales loads. |
2 | The Standard & Poor’s (S&P) 500 Index tracks the performance of 500 widely held, large-capitalization US stocks. The Lehman Brothers U.S. Aggregate Bond Index is a market value-weighted index that tracks the daily price, coupon, pay-downs and total return performance of fixed-rate, publicly placed, dollar-denominated and non-convertible investment-grade debt issues with at least $250 million par amount outstanding and with at least one year to final maturity. Indices are not investments, do not incur fees or expenses and are not professionally managed. It is not possible to invest directly in an index. Securities in the fund may not match those in an index. |
1
Economic Update – Columbia Liberty Fund
The pace of economic growth slowed during the 12-month period that began October 1, 2007 and ended September 30, 2008 as a growing number of factors weighed on consumers and businesses alike. The economy stayed clear of a recession, with an uptick in growth in the first half of 2008. However, it was widely expected that growth would slow to zero or negative near the end of the period as the most severe housing downturn in decades showed no sign of abating and job growth continued to slide. Inventories of homes for sale rose, home prices declined and tighter credit standards, the result of continued turmoil in the subprime mortgage market, made it more difficult for homebuyers to qualify for loans. Food prices rose, raising concerns about inflation, and energy prices soared to record highs before backing down sharply in the last months of the period. Consumer confidence declined sharply through June, then improved modestly in August and September. However, The Conference Board’s consumer confidence survey revealed that consumer appraisal of the economic environment continues to erode. Consumer confidence is surveyed monthly by The Conference Board.
As growth weakened, businesses began to pull back on hiring, which further dimmed the outlook for consumers. Job losses were reported for nine consecutive months in 2008, and the unemployment rate spiked to 6.1%. The slowdown in manufacturing activity was one of the last major indicators to turn negative. Federal tax rebates, which began to arrive in May, helped bolster consumer spending during the early summer months, but consumer spending turned negative later in the period.
In an effort to inspire confidence in the capital markets, loosen the reins on credit and shore up economic growth, the Federal Reserve Board (the Fed) brought a key short-term rate — the federal funds rate—down from 4.75% to 2.0% during the 12-month period. After seven rate cuts, the Fed remains concerned about inflation; but a weak economic outlook began to shift its priorities.1
Stocks retreat as economic storm clouds gather
Against a shifting economic backdrop, the U.S. stock market lost 21.98% for the 12-month period, as measured by the S&P 500 Index. Small- cap stocks held up better than large- and mid-cap stocks, as measured by their respective Russell indices.2 Value stocks held up better than growth stocks in the small- and mid-cap range while growth stocks lost less than value stocks among large caps. As the dollar rebounded modestly against the Euro, investors reaped even lower returns from investments outside the U.S. The MSCI EAFE Index, a broad gauge of stock market performance in foreign developed markets, lost
Past performance is no guarantee of future results.
1 | On October 8, the Fed lowered the federal funds rate to 1.5% and on October 29, the Fed lowered the federal funds rate to 1.0%. |
2 | The Russell 1000 Index measures the performance of 1,000 of the largest US companies, based on market capitalization. The Russell Midcap Index measures the performance of the 800 smallest companies in the Russell 1000 Index, as ranked by total market capitalization. The Russell 2000 Index measures the performance of the 2,000 smallest of 3,000 largest U.S. companies based on market capitalization. |
| | Indices are not investments, do not incur fees or expenses and are not professionally managed. It is not possible to invest directly in an index. Securities in the fund may not match those in an index. |
Summary
For the 12-month period that ended September 30, 2008
| | n | | The broad U.S. stock market, as measured by the S&P 500 Index, returned negative 21.98%. Developed stock markets outside the United States returned negative 30.50%, as measured (in U.S. dollars) by the MSCI EAFE Index. | |
| | |
| S&P Index | | MSCI Index |
| |

| |
|
–21.98% | | –30.50% |
| | n | | Despite volatility in many segments of the bond market, the Lehman Brothers U.S. Aggregate Bond Index delivered a modest return. High-yield bonds lost significant ground, as measured by the Merrill Lynch U.S. High Yield Cash Pay Index. | |
| | |
Lehman
Index | | Merrill Lynch Index |
| |

| |
|
3.65% | | –11.62% |
The Standard & Poor’s (S&P) 500 Index tracks the performance of 500 widely held, large-capitalization US stocks.
The Morgan Stanley Capital International (MSCI) Europe, Australasia, Far East (EAFE) Index is a free float-adjusted market capitalization index that is designed to measure developed market equity performance excluding the US and Canada.
The Lehman Brothers U.S. Aggregate Bond Index is a market value-weighted index that tracks the daily price, coupon, pay-downs and total return performance of fixed-rate, publicly placed, dollar-denominated and non-convertible investment-grade debt issues with at least $250 million par amount outstanding and with at least one year to final maturity.
The Merrill Lynch U.S. High Yield, Cash Pay Index tracks the performance of non-investment-grade corporate bonds.
2
Economic Update (continued) – Columbia Liberty Fund
30.50% (in U.S. dollars) for the period. Emerging stock markets, which have had a strong run over the past several years, were also caught in the downdraft. The MSCI Emerging Markets Index returned negative 33.01% (in U.S. dollars).3
Bonds delivered modest gains
The U.S. bond market seesawed during the 12-month period but delivered a modest gain as investors sought the relative safety of the highest quality sectors. After a weak start, bond prices in many sectors rose and yields declined as economic growth slowed and stock market volatility increased. Although the benchmark 10-year U.S. Treasury yield edged back above 4.0% in 2008, it slipped back to 3.83% at the end of the period, nearly one full percentage point below where it was one year ago. In this environment, the Lehman Brothers U.S. Aggregate Bond Index returned 3.65%. High-yield bonds took a beating. The Merrill Lynch U.S. High Yield Cash, Pay Index returned negative 11.62%.
3 | The MSCI Emerging Markets Index is a widely accepted index composed of a sample of companies from 25 countries representing the global emerging stock markets. Indices are not investments, do not incur fees or expenses and are not professionally managed. It is not possible to invest directly in an index. Securities in the fund may not match those in an index. |
Past performance is no guarantee of future results.
3
Performance Information – Columbia Liberty Fund
Performance data quoted represents past performance and current performance may be lower or higher. Past performance is no guarantee of future results. The investment return and principal value will fluctuate so that shares, when redeemed, may be worth more or less than the original cost. Please visit www.columbiafunds.com for daily and most recent month-end performance updates.
| | |
| Annual operating expense ratio (%)* |
| |
Class A | | 1.04 |
Class B | | 1.79 |
Class C | | 1.79 |
Class Z | | 0.80 |
| * | The annual operating expense ratio is as stated in the fund’s prospectus that is current as of the date of this report. Differences in expense ratios disclosed elsewhere in this report may result from including fee waivers and expense reimbursements as well as different time periods used in calculating the ratios. |
|
| Growth of a $10,000 investment 10/01/98 – 09/30/08 |
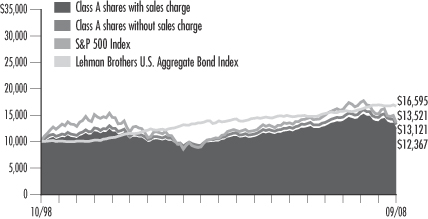
The chart above shows the growth in value of a hypothetical $10,000 investment in Class A shares of Columbia Liberty Fund during the stated time period, and does not reflect the deduction of taxes that a shareholder may pay on fund distributions or on the redemption of fund shares. The Standard and Poor’s (S&P) 500 Index tracks the performance of 500 widely held, large-capitalization US stocks. The Lehman Brothers U.S. Aggregate Bond Index is a market value-weighted index that tracks the daily price, coupon, pay-downs and total return performance of fixed-rate, publicly placed, dollar-denominated and non-convertible investment-grade debt issues with at least $250 million par amount outstanding and with at least one year to final maturity. Indices are not investments, do not incur fees or expenses and are not professionally managed. It is not possible to invest directly in an index. Securities in the fund may not match those in an index.
| | | | |
| Performance of a $10,000 investment 10/01/98 – 09/30/08 ($) |
| | |
| Sales charge | | without | | with |
Class A | | 13,121 | | 12,367 |
Class B | | 12,176 | | 12,176 |
Class C | | 12,157 | | 12,157 |
Class Z | | 13,999 | | n/a |
| | | | | | | | | | | | | | |
| Average annual total return as of 09/30/08 (%) | | | | |
| | | | |
| Share class | | A | | B | | C | | Z |
| Inception | | 04/30/82 | | 05/05/92 | | 08/01/97 | | 07/31/95 |
| Sales charge | | without | | with | | without | | with | | without | | with | | without |
1-year | | –15.83 | | –20.67 | | –16.51 | | –20.25 | | –16.46 | | –17.20 | | –15.67 |
5-year | | 4.77 | | 3.53 | | 3.98 | | 3.63 | | 3.96 | | 3.96 | | 5.00 |
10-year | | 2.75 | | 2.15 | | 1.99 | | 1.99 | | 1.97 | | 1.97 | | 3.42 |
The “with sales charge” returns include the maximum initial sales charge of 5.75% for Class A shares, the applicable contingent deferred sales charge of 5.00% in the first year, declining to 1.00% in the sixth year and eliminated thereafter for Class B shares and 1.00% for Class C shares for the first year only. The “without sales charge” returns do not include the effect of sales charges. If they had, returns would be lower.
Performance results reflect any fee waivers or reimbursements of fund expenses by the investment advisor and/or any of its affiliates. Absent these fee waivers or expense reimbursement arrangements, performance results would have been lower.
All results shown assume reinvestment of distributions. Class Z shares are sold at net asset value with no distribution and service (Rule 12b-1) fees. Class Z shares have limited eligibility and the investment minimum requirements may vary. Please see the fund’s prospectus for details. Performance for different share classes will vary based on differences in sales charges and fees associated with each class.
The tables do not reflect the deduction of taxes that a shareholder may pay on fund distributions or on the redemption of fund shares.
4
Understanding Your Expenses – Columbia Liberty Fund
As a fund shareholder, you incur two types of costs. There are transaction costs, which generally include sales charges on purchases and may include redemption fees or exchange fees. There are also ongoing costs, which generally include investment advisory fees, distribution and service (Rule 12b-1) fees and other fund expenses. The information on this page is intended to help you understand the ongoing costs of investing in the fund and to compare these costs with the ongoing costs of investing in other mutual funds.
Analyzing your fund’s expenses by share class
To illustrate these ongoing costs, we have provided an example and calculated the expenses paid by investors in each share class during the period. The information in the following table is based on an initial investment of $1,000, which is invested at the beginning of the period and held for the entire period. Expense information is calculated two ways and each method provides you with different information. The amount listed in the “actual” column is calculated using the fund’s actual operating expenses and total return for the period. The amount listed in the “hypothetical” column for each share class assumes that the return each year is 5% before expenses and is calculated based on the fund’s actual operating expenses. You should not use the hypothetical account values and expenses to estimate either your actual account balance at the end of the period or the expenses you paid during this period.
Compare with other funds
Since all mutual funds are required to include the same hypothetical calculations about expenses in shareholder reports, you can use this information to compare the ongoing costs of investing in the fund with other funds. To do so, compare the 5% hypothetical example with the 5% hypothetical examples that appear in the shareholder reports of other funds. As you compare hypothetical examples of other funds, it is important to note that hypothetical examples are meant to highlight the ongoing costs of investing in a fund and do not reflect any transaction costs, such as sales charges, redemption fees or exchange fees.
| | | | | | | | | | | | | | |
| 04/01/08 – 09/30/08 |
| | | | |
| | | Account value at the
beginning of the period ($) | | Account value at the
end of the period ($) | | Expenses paid
during the period ($) | | Fund’s annualized
expense ratio (%) |
| | | Actual | | Hypothetical | | Actual | | Hypothetical | | Actual | | Hypothetical | | Actual |
Class A | | 1,000.00 | | 1,000.00 | | 908.00 | | 1,019.95 | | 4.82 | | 5.10 | | 1.01 |
Class B | | 1,000.00 | | 1,000.00 | | 904.80 | | 1,016.20 | | 8.38 | | 8.87 | | 1.76 |
Class C | | 1,000.00 | | 1,000.00 | | 904.60 | | 1,016.20 | | 8.38 | | 8.87 | | 1.76 |
Class Z | | 1,000.00 | | 1,000.00 | | 909.40 | | 1,021.15 | | 3.68 | | 3.89 | | 0.77 |
Expenses paid during the period are equal to the annualized expense ratio for the share class, multiplied by the average account value over the period, then multiplied by the number of days in the fund’s most recent fiscal half-year and divided by 366.
It is important to note that the expense amounts shown in the table are meant to highlight only ongoing costs of investing in the fund and do not reflect any transaction costs, such as sales charges, redemption fees or exchange fees. Therefore, the hypothetical examples provided may not help you determine the relative total costs of owning shares of different funds. If these transaction costs were included, your costs would have been higher.
Estimating your actual expenses
To estimate the expenses that you paid over the period, first you will need your account balance at the end of the period:
| | n | | For shareholders who receive their account statements from Columbia Management Services, Inc., your account balance is available online at www.columbiafunds.com or by calling Shareholder Services at 800.345.6611. | |
| | n | | For shareholders who receive their account statements from their financial intermediary, contact your financial intermediary to obtain your account balance. | |
| | 1. | Divide your ending account balance by $1,000. For example, if an account balance was $8,600 at the end of the period, the result would be 8.6. | |
| | 2. | In the section of the table below titled “Expenses paid during the period,” locate the amount for your share class. You will find this number in the column labeled “Actual.” Multiply this number by the result from step 1. Your answer is an estimate of the expenses you paid on your account during the period. | |
If the value of your account falls below the minimum initial investment requirement applicable to you, your account generally will be subject to a $20 annual fee. This fee is not included in the accompanying table. If you are subject to the fee, keep it in mind when you are estimating the ongoing expenses of investing in the fund and when comparing the expenses of this fund with other funds.
5
Portfolio Managers’ Report – Columbia Liberty Fund
Performance data quoted represents past performance and current performance may be lower or higher. Past performance is no guarantee of future results. The investment return and principal value will fluctuate so that shares, when redeemed, may be worth more or less than the original cost. Please visit www.columbiafunds.com for daily and most recent month-end performance updates.
| | |
| Net asset value per share |
| |
as of 09/30/08 ($) | | |
Class A | | 7.15 |
Class B | | 7.18 |
Class C | | 7.16 |
Class Z | | 7.68 |
| | |
| Distributions declared per share |
| |
10/01/07 – 09/30/08 ($) | | |
Class A | | 1.13 |
Class B | | 1.02 |
Class C | | 1.02 |
Class Z | | 1.17 |
For the 12-month period that ended September 30, 2008, the fund’s Class A shares returned negative 15.83% without sales charge. The S&P 500 Index returned negative 21.98% while the Lehman Brothers U.S. Aggregate Bond Index returned 3.65%.1 The fund held up better than its peer group, the Lipper Mixed Asset Target Allocation Growth Classification, which averaged a return of negative 17.90%.2 We believe that good portfolio positioning helped the fund’s performance relative to its peer group while disappointing performance from the portfolio’s underlying investment strategies detracted from return relative to their respective benchmarks.
Portfolio positioning helped stem losses in a difficult environment
The world’s stock markets were battered as a worldwide credit crisis and weakening economic growth undermined investor confidence. Many segments of the U.S. bond market also came under pressure. In this environment, we made some key changes to the fund’s allocations that helped stem losses and others that produced mixed results. For example, we reduced the fund’s exposure to international equities, which helped performance because international equities underperformed the U.S. stock market. Within the domestic equity portion of the portfolio, we reduced the fund’s exposure to large-cap growth stocks and added to a position in large-cap value stocks. Value generally underperformed growth during the period, which hampered returns, but the fund’s position in value stocks held up better than its benchmark. Within the fixed-income portion of the portfolio, we added to the fund’s position in investment grade bonds. The shift helped the fund capture some positive performance. Investment grade bonds were the only major market segment other than cash to generate a positive return for the period.
A period of transition for U.S. and global economies
The economic landscape weakened considerably near the end of the period as a credit crisis and rising unemployment weighed on consumer demand. However, the Federal Reserve and the U.S. Treasury have taken steps to restore confidence in the capital markets and we believe that they will continue to pursue options to prevent a protracted economic downturn. In this environment, we believe that investors who are focused on their goals have the potential to benefit from the broad diversification offered by Columbia Liberty Fund, even though diversification does not ensure a profit or guarantee against a loss.
Portfolio holdings and characteristics are subject to change and may not be representative of current holdings and characteristics. The outlook for the fund may differ from that presented for other Columbia Funds.
1 | The Standard & Poor’s (S&P) 500 Index tracks the performance of 500 widely held, large-capitalization US stocks. The Lehman Brothers U.S. Aggregate Bond Index is a market value-weighted index that tracks the daily price, coupon, pay-downs and total return performance of fixed-rate, publicly placed, dollar-denominated and non-convertible investment-grade debt issues with at least $250 million par amount outstanding and with at least one year to final maturity. Indices are not investments, do not incur fees or expenses and are not professionally managed. It is not possible to invest directly in an index. Securities in the fund may not match those in an index. |
2 | Lipper Inc., a widely respected data provider in the industry, calculates an average total return (assuming reinvestment of distributions) for mutual funds with investment objectives similar to those of the fund. Lipper makes no adjustment for the effect of sales loads. |
6
Portfolio Managers’ Report (continued) – Columbia Liberty Fund
| | |
| Top 5 equity sectors |
| |
as of 09/30/08 (%) | | |
Financials | | 9.5 |
Information Technology | | 9.2 |
Consumer Staples | | 7.4 |
Health Care | | 7.2 |
Industrials | | 7.0 |
| | |
| | | |
| Top 10 equity holdings | |
| |
as of 09/30/08 (%) | | | |
JPMorgan Chase & Co. | | 1.5 | |
Johnson & Johnson | | 1.3 | |
Exxon Mobil Corp. | | 1.2 | |
Hewlett-Packard Co. | | 1.0 | |
Procter & Gamble Co. | | 0.9 | |
Wells Fargo & Co. | | 0.8 | |
AT&T, Inc. | | 0.8 | |
Microsoft Corp. | | 0.8 | |
Wal-Mart Stores, Inc. | | 0.8 | |
Amgen, Inc. | | 0.7 | |
| | | |
| Portfolio structure | |
| |
as of 09/30/08 (%) | | | |
Common Stocks | | 58.2 | |
Mortgage-Backed Securities | | 13.2 | |
Corporate Fixed-Income Bonds & Notes | | 7.5 | |
Government & Agency Obligations | | 4.7 | |
Commercial Mortgage-Backed Securities | | 4.6 | |
Collateralized Mortgage Obligations | | 4.0 | |
Asset-Backed Securities | | 2.0 | |
Preferred Stock | | 0.2 | |
Convertible Preferred Stock | | 0.1 | |
Rights | | 0.0 | * |
Cash, Net Receivables & Payables | | 5.5 | |
| * | Represents less than 0.1%. |
The fund is actively managed and the composition of its portfolio will change over time. Information provided is calculated as a percentage of net assets.
Equity investments are affected by stock market fluctuations that occur in response to economic and business developments.
Investing in fixed-income securities may involve certain risks, including the credit quality of individual issuers, possible prepayments, market or economic developments and yield and share price fluctuations due to changes in interest rates. When interest rates go up, bond prices typically drop, and vice versa.
International investing may involve certain risks, including currency fluctuations, risks associated with possible differences in financial accounting standards and other monetary and political risks. Significant levels of foreign taxes, including potentially confiscatory levels of taxation and withholding taxes, may also apply to some foreign investments.
7
Investment Portfolio – Columbia Liberty Fund
September 30, 2008
Common Stocks – 58.2%
| | | | | | |
| | | | | Shares | | Value ($) |
| Consumer Discretionary – 5.2% | | | | | | |
| Automobiles – 0.4% | | Suzuki Motor Corp. | | 30,000 | | 557,084 |
| | Toyota Motor Corp. | | 22,700 | | 963,777 |
| | |
| | Automobiles Total | | | | 1,520,861 |
| | | |
Diversified Consumer
Services – 0.1% | | Apollo Group, Inc., Class A (a) | | 8,100 | | 480,330 |
| | |
| | Diversified Consumer Services Total | | | | 480,330 |
| | | |
Hotels, Restaurants &
Leisure – 0.9% | | Carnival Corp. | | 46,100 | | 1,629,635 |
| | Hotel Leela Venture Ltd. | | 68,230 | | 42,576 |
| | McDonald’s Corp. | | 33,306 | | 2,054,980 |
| | |
| | Hotels, Restaurants & Leisure Total | | | | 3,727,191 |
| | | |
| Media – 0.8% | | Comcast Corp., Class A | | 54,500 | | 1,069,835 |
| | DIRECTV Group, Inc. (a) | | 33,300 | | 871,461 |
| | Focus Media Holding Ltd., ADR (a) | | 22,300 | | 635,773 |
| | McGraw-Hill Companies, Inc. | | 12,100 | | 382,481 |
| | WPP Group PLC | | 73,659 | | 597,777 |
| | |
| | Media Total | | | | 3,557,327 |
| | | |
| Multiline Retail – 0.7% | | Kohl’s Corp. (a) | | 44,400 | | 2,045,952 |
| | Macy’s, Inc. | | 53,900 | | 969,122 |
| | |
| | Multiline Retail Total | | | | 3,015,074 |
| | | |
| Specialty Retail – 1.3% | | Best Buy Co., Inc. | | 18,100 | | 678,750 |
| | Dick’s Sporting Goods, Inc. (a) | | 22,200 | | 434,676 |
| | Esprit Holdings Ltd. | | 64,400 | | 395,669 |
| | Lowe’s Companies, Inc. | | 78,600 | | 1,862,034 |
| | Staples, Inc. | | 59,500 | | 1,338,750 |
| | Urban Outfitters, Inc. (a) | | 23,500 | | 748,945 |
| | |
| | Specialty Retail Total | | | | 5,458,824 |
| | | |
Textiles, Apparel & Luxury
Goods – 1.0% | | Adidas AG | | 14,577 | | 782,877 |
| | Compagnie Financiere Richemont SA | | 18,846 | | 837,030 |
| | NIKE, Inc., Class B | | 8,900 | | 595,410 |
| | Polo Ralph Lauren Corp. | | 8,100 | | 539,784 |
| | V.F. Corp. | | 22,100 | | 1,708,551 |
| | |
| | Textiles, Apparel & Luxury Goods Total | | | | 4,463,652 |
| | | | | | |
| Consumer Discretionary Total | | | | | | 22,223,259 |
| | | | | | |
| Consumer Staples – 7.4% | | | | | | |
| Beverages – 1.6% | | Anheuser-Busch Companies, Inc. | | 11,100 | | 720,168 |
| | Carlsberg A/S | | 19,384 | | 1,481,907 |
| | Coca-Cola Co. | | 25,600 | | 1,353,728 |
| | Diageo PLC, ADR | | 19,426 | | 1,337,675 |
| | PepsiCo, Inc. | | 25,600 | | 1,824,512 |
| | |
| | Beverages Total | | | | 6,717,990 |
See Accompanying Notes to Financial Statements.
8
Columbia Liberty Fund
September 30, 2008
Common Stocks (continued)
| | | | | | |
| | | | | Shares | | Value ($) |
| Consumer Staples (continued) | | | | | | |
| Food & Staples Retailing – 1.5% | | BJ’s Wholesale Club, Inc. (a) | | 13,300 | | 516,838 |
| | CVS Caremark Corp. | | 23,200 | | 780,912 |
| | Kroger Co. | | 33,900 | | 931,572 |
| | Sysco Corp. | | 33,400 | | 1,029,722 |
| | Wal-Mart Stores, Inc. | | 54,300 | | 3,252,027 |
| | |
| | Food & Staples Retailing Total | | | | 6,511,071 |
| | | |
| Food Products – 1.1% | | Cadbury PLC, ADR | | 1,318 | | 53,959 |
| | ConAgra Foods, Inc. | | 76,100 | | 1,480,906 |
| | General Mills, Inc. | | 8,800 | | 604,736 |
| | Groupe Danone | | 12,140 | | 860,236 |
| | H.J. Heinz Co. | | 15,300 | | 764,541 |
| | Smithfield Foods, Inc. (a) | | 19,200 | | 304,896 |
| | Tyson Foods, Inc., Class A | | 35,800 | | 427,452 |
| | |
| | Food Products Total | | | | 4,496,726 |
| | | |
| Household Products – 1.2% | | Kimberly-Clark Corp. | | 10,700 | | 693,788 |
| | Procter & Gamble Co. | | 52,000 | | 3,623,880 |
| | Reckitt Benckiser Group PLC | | 16,466 | | 797,254 |
| | |
| | Household Products Total | | | | 5,114,922 |
| | | |
| Personal Products – 0.6% | | Avon Products, Inc. | | 63,923 | | 2,657,279 |
| | |
| | Personal Products Total | | | | 2,657,279 |
| | | |
| Tobacco – 1.4% | | Japan Tobacco, Inc. | | 308 | | 1,159,573 |
| | Lorillard, Inc. | | 24,600 | | 1,750,290 |
| | Philip Morris International, Inc. | | 57,554 | | 2,768,348 |
| | |
| | Tobacco Total | | | | 5,678,211 |
| | | | | | |
| Consumer Staples Total | | | | | | 31,176,199 |
| | | | | | |
| Energy – 6.6% | | | | | | |
| Energy Equipment & Services – 1.7% | | Halliburton Co. | | 46,034 | | 1,491,041 |
| | Nabors Industries Ltd. (a) | | 25,100 | | 625,492 |
| | Saipem SpA | | 26,576 | | 786,271 |
| | Schlumberger Ltd. | | 22,800 | | 1,780,452 |
| | Smith International, Inc. | | 9,000 | | 527,760 |
| | Transocean, Inc. (a) | | 11,541 | | 1,267,664 |
| | Weatherford International Ltd. (a) | | 29,200 | | 734,088 |
| | |
| | Energy Equipment & Services Total | | | | 7,212,768 |
| | | |
Oil, Gas & Consumable
Fuels – 4.9% | | Chevron Corp. | | 22,100 | | 1,822,808 |
| | ConocoPhillips | | 30,227 | | 2,214,128 |
| | Devon Energy Corp. | | 12,500 | | 1,140,000 |
| | El Paso Corp. | | 134,100 | | 1,711,116 |
| | Exxon Mobil Corp. | | 66,302 | | 5,149,013 |
| | Hess Corp. | | 28,800 | | 2,363,904 |
| | Newfield Exploration Co. (a) | | 15,600 | | 499,044 |
| | Occidental Petroleum Corp. | | 32,200 | | 2,268,490 |
See Accompanying Notes to Financial Statements.
9
Columbia Liberty Fund
September 30, 2008
Common Stocks (continued)
| | | | | | |
| | | | | Shares | | Value ($) |
| Energy (continued) | | | | | | |
| | Petroleo Brasileiro SA, ADR | | 24,217 | | 1,064,337 |
| | Total SA | | 18,049 | | 1,088,913 |
| | Ultra Petroleum Corp. (a) | | 8,800 | | 486,992 |
| | Valero Energy Corp. | | 34,700 | | 1,051,410 |
| | |
| | Oil, Gas & Consumable Fuels Total | | | | 20,860,155 |
| | | | | | |
| Energy Total | | | | | | 28,072,923 |
| | | | | | |
| Financials – 9.5% | | | | | | |
| Capital Markets – 1.1% | | Goldman Sachs Group, Inc. | | 14,000 | | 1,792,000 |
| | Janus Capital Group, Inc. | | 31,500 | | 764,820 |
| | State Street Corp. | | 21,100 | | 1,200,168 |
| | TD Ameritrade Holding Corp. (a) | | 29,500 | | 477,900 |
| | Waddell & Reed Financial, Inc., Class A | | 26,200 | | 648,450 |
| | |
| | Capital Markets Total | | | | 4,883,338 |
| | | |
| Commercial Banks – 3.9% | | Banco Santander SA | | 50,368 | | 762,449 |
| | BNP Paribas | | 7,585 | | 729,172 |
| | Citigroup, Inc. | | 132,439 | | 2,716,324 |
| | Mitsubishi UFJ Financial Group, Inc. | | 173,800 | | 1,506,609 |
| | National Bank of Greece SA | | 26,780 | | 1,100,840 |
| | PNC Financial Services Group, Inc. | | 24,029 | | 1,794,966 |
| | Raiffeisen International Bank Holding AG | | 11,088 | | 806,163 |
| | SunTrust Banks, Inc. | | 28,800 | | 1,295,712 |
| | U.S. Bancorp | | 73,513 | | 2,647,938 |
| | Wells Fargo & Co. | | 87,696 | | 3,291,231 |
| | |
| | Commercial Banks Total | | | | 16,651,404 |
| | | |
Diversified Financial
Services – 1.7% | | IntercontinentalExchange, Inc. (a) | | 4,100 | | 330,788 |
| | JPMorgan Chase & Co. | | 139,828 | | 6,529,968 |
| | |
| | Diversified Financial Services Total | | | | 6,860,756 |
| | | |
| Insurance – 1.7% | | ACE Ltd. | | 48,400 | | 2,619,892 |
| | Aon Corp. | | 25,100 | | 1,128,496 |
| | Hartford Financial Services Group, Inc. | | 2,293 | | 93,990 |
| | Lincoln National Corp. | | 21,400 | | 916,134 |
| | Marsh & McLennan Companies, Inc. | | 43,200 | | 1,372,032 |
| | Prudential Financial, Inc. | | 7,100 | | 511,200 |
| | Prudential PLC | | 71,252 | | 655,857 |
| | |
| | Insurance Total | | | | 7,297,601 |
| | | |
| Real Estate Investment Trusts (REITs) – 0.6% | | General Growth Properties, Inc. | | 2,097 | | 31,665 |
| | Plum Creek Timber Co., Inc. | | 26,300 | | 1,311,318 |
| | Rayonier, Inc. | | 26,500 | | 1,254,775 |
| | |
| | Real Estate Investment Trusts (REITs) Total | | | | 2,597,758 |
| | | |
| Real Estate Management & Development – 0.2% | | Mitsubishi Estate Co., Ltd. | | 36,000 | | 707,461 |
| | |
| | Real Estate Management & Development Total | | | | 707,461 |
See Accompanying Notes to Financial Statements.
10
Columbia Liberty Fund
September 30, 2008
Common Stocks (continued)
| | | | | | |
| | | | | Shares | | Value ($) |
| Financials (continued) | | | | | | |
| Thrifts & Mortgage Finance – 0.3% | | Housing Development Finance Corp., Ltd. | | 26,525 | | 1,217,536 |
| | |
| | Thrifts & Mortgage Finance Total | | | | 1,217,536 |
| | | | | | |
| Financials Total | | | | | | 40,215,854 |
| | | | | | |
| Health Care – 7.2% | | | | | | |
| Biotechnology – 1.4% | | Amgen, Inc. (a) | | 49,000 | | 2,904,230 |
| | Celgene Corp. (a) | | 14,900 | | 942,872 |
| | Genentech, Inc. (a) | | 7,700 | | 682,836 |
| | Genzyme Corp. (a) | | 10,800 | | 873,612 |
| | Gilead Sciences, Inc. (a) | | 11,500 | | 524,170 |
| | |
| | Biotechnology Total | | | | 5,927,720 |
| | | |
| Health Care Equipment & Supplies – 0.6% | | Baxter International, Inc. | | 11,000 | | 721,930 |
| | Covidien Ltd. | | 11,500 | | 618,240 |
| | Medtronic, Inc. | | 19,100 | | 956,910 |
| | |
| | Health Care Equipment & Supplies Total | | | | 2,297,080 |
| | | |
Health Care Providers &
Services – 1.2% | | CIGNA Corp. | | 29,997 | | 1,019,298 |
| | Express Scripts, Inc. (a) | | 8,200 | | 605,324 |
| | Humana, Inc. (a) | | 18,300 | | 753,960 |
| | Medco Health Solutions, Inc. (a) | | 57,200 | | 2,574,000 |
| | |
| | Health Care Providers & Services Total | | | | 4,952,582 |
| | | |
Life Sciences Tools &
Services – 1.1% | | Covance, Inc. (a) | | 7,300 | | 645,393 |
| | Qiagen N.V. (a) | | 88,319 | | 1,753,891 |
| | Thermo Fisher Scientific, Inc. (a) | | 43,016 | | 2,365,880 |
| | |
| | Life Sciences Tools & Services Total | | | | 4,765,164 |
| | | |
| Pharmaceuticals – 2.9% | | Abbott Laboratories | | 38,500 | | 2,216,830 |
| | Johnson & Johnson | | 78,400 | | 5,431,552 |
| | Merck & Co., Inc. | | 23,900 | | 754,284 |
| | Novartis AG, Registered Shares | | 28,432 | | 1,487,147 |
| | Roche Holding AG, Genusschein Shares | | 6,022 | | 938,751 |
| | Schering-Plough Corp. | | 46,000 | | 849,620 |
| | Teva Pharmaceutical Industries Ltd., ADR | | 17,000 | | 778,430 |
| | |
| | Pharmaceuticals Total | | | | 12,456,614 |
| | | | | | |
| Health Care Total | | | | | | 30,399,160 |
| | | | | | |
| Industrials – 7.0% | | | | | | |
| Aerospace & Defense – 1.9% | | Goodrich Corp. | | 14,600 | | 607,360 |
| | Honeywell International, Inc. | | 30,300 | | 1,258,965 |
| | L-3 Communications Holdings, Inc. | | 15,350 | | 1,509,212 |
| | Lockheed Martin Corp. | | 7,900 | | 866,393 |
| | Raytheon Co. | | 25,300 | | 1,353,803 |
| | Rolls-Royce Group PLC (a) | | 73,302 | | 440,101 |
| | United Technologies Corp. | | 31,116 | | 1,868,827 |
| | |
| | Aerospace & Defense Total | | | | 7,904,661 |
See Accompanying Notes to Financial Statements.
11
Columbia Liberty Fund
September 30, 2008
Common Stocks (continued)
| | | | | | |
| | | | | Shares | | Value ($) |
| Industrials (continued) | | | | | | |
| Air Freight & Logistics – 0.2% | | FedEx Corp. | | 9,800 | | 774,592 |
| | |
| | Air Freight & Logistics Total | | | | 774,592 |
| | | |
Commercial Services &
Supplies – 0.3% | | Dun & Bradstreet Corp. | | 6,100 | | 575,596 |
| | Waste Management, Inc. | | 21,800 | | 686,482 |
| | |
| | Commercial Services & Supplies Total | | | | 1,262,078 |
| | | |
| Construction & Engineering – 0.7% | | FLSmidth & Co. A/S | | 16,913 | | 860,167 |
| | KBR, Inc. | | 44,900 | | 685,623 |
| | Maire Tecnimont SpA | | 91,124 | | 318,383 |
| | Midas Holdings Ltd. | | 784,855 | | 230,530 |
| | Quanta Services, Inc. (a) | | 34,500 | | 931,845 |
| | |
| | Construction & Engineering Total | | | | 3,026,548 |
| | | |
| Electrical Equipment – 1.1% | | ABB Ltd., Registered Shares (a) | | 51,025 | | 978,899 |
| | Alstom | | 9,306 | | 701,764 |
| | Cooper Industries Ltd., Class A | | 22,800 | | 910,860 |
| | Dongfang Electrical Machinery Co., Ltd., Class H | | 284,000 | | 757,471 |
| | First Solar, Inc. (a) | | 1,900 | | 358,929 |
| | Vestas Wind Systems A/S (a) | | 13,689 | | 1,191,682 |
| | |
| | Electrical Equipment Total | | | | 4,899,605 |
| | | |
| Industrial Conglomerates – 0.7% | | General Electric Co. | | 90,410 | | 2,305,455 |
| | McDermott International, Inc. (a) | | 26,528 | | 677,790 |
| | |
| | Industrial Conglomerates Total | | | | 2,983,245 |
| | | |
| Machinery – 0.9% | | Caterpillar, Inc. | | 11,600 | | 691,360 |
| | Eaton Corp. | | 13,800 | | 775,284 |
| | Illinois Tool Works, Inc. | | 19,200 | | 853,440 |
| | Jain Irrigation Systems Ltd. | | 40,000 | | 340,698 |
| | SPX Corp. | | 13,900 | | 1,070,300 |
| | |
| | Machinery Total | | | | 3,731,082 |
| | | |
| Road & Rail – 0.6% | | Central Japan Railway Co. | | 124 | | 1,170,306 |
| | Union Pacific Corp. | | 22,900 | | 1,629,564 |
| | |
| | Road & Rail Total | | | | 2,799,870 |
| | | |
Trading Companies &
Distributors – 0.3% | | Mitsui & Co., Ltd. | | 30,000 | | 370,700 |
| | W.W. Grainger, Inc. | | 9,800 | | 852,306 |
| | |
| | Trading Companies & Distributors Total | | | | 1,223,006 |
| | | |
| Transportation Infrastructure – 0.3% | | Koninklijke Vopak NV | | 8,647 | | 408,356 |
| | Macquarie Infrastructure Group | | 396,645 | | 755,950 |
| | |
| | Transportation Infrastructure Total | | | | 1,164,306 |
| | | | | | |
| Industrials Total | | | | | | 29,768,993 |
| | | | | | |
See Accompanying Notes to Financial Statements.
12
Columbia Liberty Fund
September 30, 2008
Common Stocks (continued)
| | | | | | |
| | | | | Shares | | Value ($) |
| Information Technology – 9.2% | | | | |
| Communications Equipment – 1.4% | | Cisco Systems, Inc. (a) | | 102,435 | | 2,310,934 |
| | Corning, Inc. | | 32,800 | | 512,992 |
| | QUALCOMM, Inc. | | 66,300 | | 2,848,911 |
| | |
| | Communications Equipment Total | | | | 5,672,837 |
| | | |
| Computers & Peripherals – 2.4% | | Apple, Inc. (a) | | 14,500 | | 1,648,070 |
| | EMC Corp. (a) | | 157,900 | | 1,888,484 |
| | Hewlett-Packard Co. | | 94,300 | | 4,360,432 |
| | International Business Machines Corp. | | 20,700 | | 2,421,072 |
| | |
| | Computers & Peripherals Total | | | | 10,318,058 |
| | | |
| Electronic Equipment, Instruments & Components – 0.2% | | FLIR Systems, Inc. (a) | | 15,700 | | 603,194 |
| | |
| | Electronic Equipment, Instruments & Components Total | | | | 603,194 |
| | | |
Internet Software &
Services – 0.6% | | Equinix, Inc. (a) | | 9,300 | | 645,978 |
| | Google, Inc., Class A (a) | | 4,916 | | 1,968,956 |
| | |
| | Internet Software & Services Total | | | | 2,614,934 |
| | | |
| IT Services – 0.6% | | Accenture Ltd., Class A | | 25,400 | | 965,200 |
| | MasterCard, Inc., Class A | | 3,000 | | 531,990 |
| | Visa, Inc., Class A | | 19,383 | | 1,189,922 |
| | |
| | IT Services Total | | | | 2,687,112 |
| | | |
| Semiconductors & Semiconductor Equipment – 1.3% | | Broadcom Corp., Class A (a) | | 31,700 | | 590,571 |
| | Intel Corp. | | 126,900 | | 2,376,837 |
| | Intersil Corp., Class A | | 28,300 | | 469,214 |
| | Lam Research Corp. (a) | | 24,800 | | 780,952 |
| | Microchip Technology, Inc. | | 19,800 | | 582,714 |
| | Tokyo Electron Ltd. | | 13,700 | | 610,328 |
| | |
| | Semiconductors & Semiconductor Equipment Total | | | | 5,410,616 |
| | | |
| Software – 2.7% | | Activision Blizzard, Inc. (a) | | 78,200 | | 1,206,626 |
| | Adobe Systems, Inc. (a) | | 28,300 | | 1,117,001 |
| | Autonomy Corp. PLC (a) | | 35,358 | | 650,069 |
| | BMC Software, Inc. (a) | | 50,100 | | 1,434,363 |
| | Microsoft Corp. | | 122,975 | | 3,282,203 |
| | Nintendo Co., Ltd. | | 2,900 | | 1,207,226 |
| | Oracle Corp. (a) | | 108,300 | | 2,199,573 |
| | Salesforce.com, Inc. (a) | | 9,500 | | 459,800 |
| | |
| | Software Total | | | | 11,556,861 |
| | | | | | |
| Information Technology Total | | | | | | 38,863,612 |
| | | | | | |
| Materials – 2.4% | | | | | | |
| Chemicals – 1.2% | | E.I. Du Pont de Nemours & Co. | | 26,600 | | 1,071,980 |
| | Linde AG | | 12,294 | | 1,318,420 |
| | Monsanto Co. | | 9,864 | | 976,339 |
| | Praxair, Inc. | | 10,700 | | 767,618 |
See Accompanying Notes to Financial Statements.
13
Columbia Liberty Fund
September 30, 2008
Common Stocks (continued)
| | | | | | |
| | | | | Shares | | Value ($) |
| Materials (continued) | | | | |
| Chemicals (continued) | | Sumitomo Chemical Co., Ltd. | | 95,000 | | 414,009 |
| | Umicore | | 23,664 | | 734,624 |
| | |
| | Chemicals Total | | | | 5,282,990 |
| | | |
| Metals & Mining – 0.9% | | Alcoa, Inc. | | 27,300 | | 616,434 |
| | Allegheny Technologies, Inc. | | 3,800 | | 112,290 |
| | BHP Billiton Ltd. | | 24,983 | | 641,913 |
| | Freeport-McMoRan Copper & Gold, Inc. | | 29,000 | | 1,648,650 |
| | Goldcorp, Inc. | | 9,000 | | 284,670 |
| | Nucor Corp. | | 12,400 | | 489,800 |
| | |
| | Metals & Mining Total | | | | 3,793,757 |
| | | |
| Paper & Forest Products – 0.3% | | Weyerhaeuser Co. | | 17,900 | | 1,084,382 |
| | |
| | Paper & Forest Products Total | | | | 1,084,382 |
| | | | | | |
| Materials Total | | | | | | 10,161,129 |
| | | | | | |
| Telecommunication Services – 1.4% | | | | | | |
| Diversified Telecommunication Services – 1.1% | | AT&T, Inc. | | 117,915 | | 3,292,187 |
| | Verizon Communications, Inc. | | 39,002 | | 1,251,574 |
| | |
| | Diversified Telecommunication Services Total | | | | 4,543,761 |
| | | |
| Wireless Telecommunication Services – 0.3% | | China Unicom Ltd. | | 304,000 | | 460,261 |
| | NII Holdings, Inc. (a) | | 24,200 | | 917,664 |
| | |
| | Wireless Telecommunication Services Total | | | | 1,377,925 |
| | | | | | |
| Telecommunication Services Total | | | | | | 5,921,686 |
| | | | | | |
| Utilities – 2.3% | | | | | | |
| Electric Utilities – 1.5% | | Electricite de France | | 16,251 | | 1,177,527 |
| | Entergy Corp. | | 12,400 | | 1,103,724 |
| | Exelon Corp. | | 15,800 | | 989,396 |
| | Fortum Oyj | | 34,819 | | 1,174,784 |
| | FPL Group, Inc. | | 22,100 | | 1,111,630 |
| | PPL Corp. | | 21,300 | | 788,526 |
| | |
| | Electric Utilities Total | | | | 6,345,587 |
| | | |
| Independent Power Producers & Energy Traders – 0.1% | | Huaneng Power International, Inc., Class H | | 580,000 | | 388,295 |
| | |
| | Independent Power Producers & Energy Traders Total | | | | 388,295 |
| | | |
| Multi-Utilities – 0.6% | | PG&E Corp. | | 22,448 | | 840,678 |
| | Public Service Enterprise Group, Inc. | | 28,946 | | 949,139 |
| | Suez SA | | 18,233 | | 895,148 |
| | |
| | Multi-Utilities Total | | | | 2,684,965 |
See Accompanying Notes to Financial Statements.
14
Columbia Liberty Fund
September 30, 2008
Common Stocks (continued)
| | | | | | |
| | | | | Shares | | Value ($) |
| Utilities (continued) | | | | | | |
| Water Utilities – 0.1% | | Epure International Ltd. | | 1,431,000 | | 349,682 |
| | |
| | Water Utilities Total | | | | 349,682 |
| | | | | | |
| Utilities Total | | | | | | 9,768,529 |
| | Total Common Stocks
(Cost of $254,513,035) | | | | 246,571,344 |
| | | | | Par ($) | | |
| Mortgage-Backed Securities – 13.2% | | | | |
| Federal Home Loan Mortgage Corp. | | 5.000% 03/01/38 | | 1,673,831 | | 1,631,526 |
| | 5.500% 01/01/21 | | 1,327,304 | | 1,339,552 |
| | 5.500% 07/01/21 | | 2,880,137 | | 2,903,115 |
| | 5.500% 12/01/37 | | 2,514,234 | | 2,502,877 |
| | 6.000% 02/01/09 | | 37,138 | | 37,458 |
| | 6.500% 07/01/14 | | 33,066 | | 34,259 |
| | 6.500% 12/01/14 | | 32,421 | | 33,591 |
| | 6.500% 06/01/29 | | 31,522 | | 32,633 |
| | 6.500% 01/01/30 | | 76,198 | | 78,885 |
| | 6.500% 11/01/37 | | 2,943,232 | | 3,021,245 |
| | 7.000% 11/01/29 | | 44,435 | | 46,790 |
| | 7.000% 01/01/30 | | 8,147 | | 8,578 |
| | 8.000% 07/01/20 | | 23,216 | | 24,886 |
| | TBA,
5.000% 10/14/38 | | 4,908,000 | | 4,780,696 |
| | | |
| Federal National Mortgage Association | | 5.000% 05/01/37 | | 2,027,387 | | 1,976,982 |
| | 5.500% 04/01/36 | | 1,495,518 | | 1,492,735 |
| | 5.500% 05/01/36 | | 2,720,036 | | 2,714,975 |
| | 5.500% 11/01/36 | | 5,852,501 | | 5,841,611 |
| | 5.500% 05/01/37 | | 901,801 | | 900,072 |
| | 5.500% 06/01/38 | | 2,353,476 | | 2,348,729 |
| | 6.000% 11/01/35 | | 350,534 | | 355,561 |
| | 6.000% 09/01/36 | | 2,880,987 | | 2,921,405 |
| | 6.000% 11/01/36 | | 6,870,826 | | 6,967,219 |
| | 6.000% 07/01/37 | | 2,642,374 | | 2,679,296 |
| | 6.000% 06/01/38 | | 2,956,661 | | 2,997,679 |
| | 6.500% 10/01/08 | | 348 | | 350 |
| | 6.500% 11/01/08 | | 5,365 | | 5,378 |
| | 6.500% 12/01/08 | | 1,160 | | 1,165 |
| | 6.500% 01/01/09 | | 1,704 | | 1,710 |
| | 6.500% 02/01/09 | | 45,659 | | 46,016 |
| | 6.500% 04/01/09 | | 78,480 | | 80,063 |
| | 6.500% 04/01/11 | | 124,642 | | 129,301 |
| | 6.500% 05/01/11 | | 431,422 | | 447,549 |
| | 6.500% 11/01/25 | | 3 | | 3 |
| | 6.500% 08/01/34 | | 351,987 | | 362,370 |
| | 6.500% 11/01/36 | | 1,761,850 | | 1,808,591 |
| | 6.500% 08/01/37 | | 1,811,543 | | 1,859,500 |
| | 6.500% 06/01/38 | | 1,639,552 | | 1,682,956 |
| | 7.000% 08/15/23 | | 136,279 | | 144,152 |
| | 7.000% 07/01/32 | | 23,141 | | 24,318 |
See Accompanying Notes to Financial Statements.
15
Columbia Liberty Fund
September 30, 2008
Mortgage-Backed Securities (continued)
| | | | | | |
| | | | | Par ($) | | Value ($) |
| | | | | |
| | 7.000% 01/01/37 | | 88,095 | | 92,012 |
| | 7.000% 07/01/37 | | 582,029 | | 608,805 |
| | | |
| Government National Mortgage Association | | 5.500% 05/15/38 | | 985,993 | | 988,499 |
| | |
| | Total Mortgage-Backed Securities
(Cost of $55,505,671) | | | | 55,955,093 |
| | | | | | |
| Corporate Fixed-Income Bonds & Notes – 7.5% | | | | |
| Basic Materials – 0.2% | | | | | | |
| Chemicals – 0.1% | | | | | | |
| EI Du Pont de Nemours & Co. | | 5.000% 07/15/13 | | 425,000 | | 418,596 |
| | |
| | Chemicals Total | | | | 418,596 |
| | | |
Iron/Steel – 0.1%
Nucor Corp. | | 5.850% 06/01/18 | | 555,000 | | 528,597 |
| | |
| | Iron/Steel Total | | | | 528,597 |
| | | | | | |
| Basic Materials Total | | 947,193 |
| | | | | | |
| Communications – 0.9% | | | | |
| Media – 0.4% | | | | | | |
| Comcast Corp. | | 7.050% 03/15/33 | | 600,000 | | 538,123 |
| | | |
| News America, Inc. | | 6.550% 03/15/33 | | 495,000 | | 443,648 |
| | | |
| Time Warner Cable, Inc. | | 7.300% 07/01/38 | | 625,000 | | 555,975 |
| | | |
| Viacom, Inc. | | 6.125% 10/05/17 | | 225,000 | | 204,114 |
| | |
| | Media Total | | | | 1,741,860 |
| | |
| Telecommunication Services – 0.5% | | | | |
| AT&T, Inc. | | 5.100% 09/15/14 | | 490,000 | | 458,292 |
| | | |
| British Telecommunications PLC | | 5.150% 01/15/13 | | 400,000 | | 373,309 |
| | | |
| New Cingular Wireless Services, Inc. | | 8.750% 03/01/31 | | 475,000 | | 525,189 |
| | | |
| Telefonica Emisones SAU | | 5.984% 06/20/11 | | 475,000 | | 469,794 |
| | | |
| Vodafone Group PLC | | 5.000% 12/16/13 | | 450,000 | | 424,803 |
| | |
| | Telecommunication Services Total | | | | 2,251,387 |
| | | | | | |
| Communications Total | | | | | | 3,993,247 |
| | | | | | |
| Consumer Cyclical – 0.3% | | | | | | |
| Lodging – 0.1% | | | | | | |
| Marriott International, Inc. | | 5.625% 02/15/13 | | 400,000 | | 377,290 |
| | |
| | Lodging Total | | | | 377,290 |
See Accompanying Notes to Financial Statements.
16
Columbia Liberty Fund
September 30, 2008
Corporate Fixed-Income Bonds & Notes (continued)
| | | | | | |
| | | | | Par ($) | | Value ($) |
| Consumer Cyclical (continued) | | | | | | |
| Retail – 0.2% | | | | | | |
| CVS Caremark Corp. | | 5.750% 06/01/17 | | 450,000 | | 420,521 |
| | | |
| Wal-Mart Stores, Inc. | | 5.800% 02/15/18 | | 500,000 | | 488,456 |
| | |
| | Retail Total | | | | 908,977 |
| | | | | | |
| Consumer Cyclical Total | | | | | | 1,286,267 |
| | | | | | |
| Consumer Non-Cyclical – 0.5% | | | | | | |
| Beverages – 0.1% | | | | | | |
| Diageo Capital PLC | | 5.750% 10/23/17 | | 400,000 | | 383,844 |
| | |
| | Beverages Total | | | | 383,844 |
| | | |
| Food – 0.2% | | | | | | |
| ConAgra Foods, Inc. | | 6.750% 09/15/11 | | 417,000 | | 432,315 |
| | | |
| Kraft Foods, Inc. | | 6.500% 08/11/17 | | 440,000 | | 423,369 |
| | |
| | Food Total | | | | 855,684 |
| | | |
| Household Products/Wares – 0.1% | | | | | | |
| Fortune Brands, Inc. | | 5.375% 01/15/16 | | 500,000 | | 453,895 |
| | |
| | Household Products/Wares Total | | | | 453,895 |
| | | |
| Pharmaceuticals – 0.1% | | | | | | |
| Wyeth | | 5.500% 02/01/14 | | 480,000 | | 475,810 |
| | |
| | Pharmaceuticals Total | | | | 475,810 |
| | | | | | |
| Consumer Non-Cyclical Total | | | | | | 2,169,233 |
| | | | | | |
| Energy – 0.8% | | | | | | |
| Oil & Gas – 0.4% | | | | | | |
| Canadian Natural Resources Ltd. | | 5.700% 05/15/17 | | 400,000 | | 349,676 |
| | | |
| Nexen, Inc. | | 5.875% 03/10/35 | | 475,000 | | 355,652 |
| | | |
| Talisman Energy, Inc. | | 6.250% 02/01/38 | | 485,000 | | 376,689 |
| | | |
| Valero Energy Corp. | | 6.875% 04/15/12 | | 400,000 | | 410,738 |
| | |
| | Oil & Gas Total | | | | 1,492,755 |
| | | |
| Oil & Gas Services – 0.2% | | | | | | |
| Halliburton Co. | | 5.900% 09/15/18 | | 550,000 | | 542,661 |
| | | |
| Weatherford International Ltd. | | 5.150% 03/15/13 | | 340,000 | | 327,436 |
| | |
| | Oil & Gas Services Total | | | | 870,097 |
| | | |
| Pipelines – 0.2% | | | | | | |
| Plains All American Pipeline LP/PAA Finance Corp. | | 6.650% 01/15/37 | | 480,000 | | 393,180 |
See Accompanying Notes to Financial Statements.
17
Columbia Liberty Fund
September 30, 2008
Corporate Fixed-Income Bonds & Notes (continued)
| | | | | | |
| | | | | Par ($) | | Value ($) |
| Energy (continued) | | | | | | |
| Pipelines (continued) | | | | | | |
| TransCanada Pipelines Ltd. | | 6.350% 05/15/67 (b) | | 640,000 | | 506,293 |
| | |
| | Pipelines Total | | | | 899,473 |
| | | | | | |
| Energy Total | | | | | | 3,262,325 |
| | | | | | |
| Financials – 3.0% | | | | | | |
| Banks – 1.3% | | | | | | |
| Bank of New York Mellon Corp. | | 5.125% 08/27/13 | | 675,000 | | 643,506 |
| | | |
| Credit Suisse/New York NY | | 6.000% 02/15/18 | | 650,000 | | 566,281 |
| | | |
| Deutsche Bank AG | | 4.875% 05/20/13 | | 625,000 | | 596,984 |
| | | |
| HSBC Capital Funding LP | | 9.547% 12/31/49 (b)(c)(d) | | 1,150,000 | | 1,055,700 |
| | | |
| JPMorgan Chase & Co. | | 6.000% 01/15/18 | | 800,000 | | 729,498 |
| | | |
| SunTrust Preferred Capital I | | 5.853% 12/15/11 (b) | | 560,000 | | 308,000 |
| | | |
| USB Capital IX | | 6.189% 04/15/49 (b) | | 1,000,000 | | 490,000 |
| | | |
| Wachovia Corp. | | 4.875% 02/15/14 | | 950,000 | | 583,106 |
| | | |
| Wells Fargo & Co. | | 5.250% 10/23/12 | | 600,000 | | 575,910 |
| | |
| | Banks Total | | | | 5,548,985 |
| | |
| Diversified Financial Services – 1.1% | | | | |
| AGFC Capital Trust I | | 6.000% 01/15/67 (b)(c) | | 725,000 | | 194,741 |
| | | |
| American Express Credit Corp. | | 5.875% 05/02/13 | | 650,000 | | 599,072 |
| | | |
| Capital One Financial Corp. | | 5.500% 06/01/15 | | 875,000 | | 718,935 |
| | | |
| Citicorp Lease Pass-Through Trust | | 8.040% 12/15/19 (c)(d) | | 1,360,000 | | 1,186,190 |
| | | |
| General Electric Capital Corp. | | 5.000% 01/08/16 | | 105,000 | | 88,918 |
| | | |
| Goldman Sachs Group, Inc. | | 6.345% 02/15/34 | | 800,000 | | 525,657 |
| | | |
| Lehman Brothers Holdings, Inc. | | 5.750% 07/18/11 (e)(g) | | 750,000 | | 93,750 |
| | | |
| Merrill Lynch & Co., Inc. | | 6.050% 08/15/12 | | 725,000 | | 679,784 |
| | | |
| Morgan Stanley | | 6.750% 04/15/11 | | 700,000 | | 518,080 |
| | |
| | Diversified Financial Services Total | | | | 4,605,127 |
| | | |
| Insurance – 0.4% | | | | | | |
| Chubb Corp. | | 5.750% 05/15/18 | | 475,000 | | 440,186 |
| | | |
| Principal Life Income Funding Trusts | | 5.300% 04/24/13 | | 425,000 | | 423,666 |
See Accompanying Notes to Financial Statements.
18
Columbia Liberty Fund
September 30, 2008
Corporate Fixed-Income Bonds & Notes (continued)
| | | | | | |
| | | | | Par ($) | | Value ($) |
| Financials (continued) | | | | | | |
| Insurance (continued) | | | | | | |
| Prudential Financial, Inc. | | 6.000% 12/01/17 | | 410,000 | | 365,473 |
| | | |
| UnitedHealth Group, Inc. | | 5.250% 03/15/11 | | 400,000 | | 397,676 |
| | |
| | Insurance Total | | | | 1,627,001 |
| | | |
| Real Estate Investment Trusts (REITs) – 0.2% | | | | | | |
| Health Care Property Investors, Inc. | | 6.450% 06/25/12 | | 500,000 | | 468,868 |
| | | |
| Simon Property Group LP | | 5.750% 12/01/15 | | 450,000 | | 425,285 |
| | | | | | |
| | Real Estate Investment Trusts (REITs) Total | | | | 894,153 |
| | | | | | |
| Financials Total | | | | | | 12,675,266 |
| | | | | | |
| Industrials – 0.5% | | | | | | |
| Aerospace & Defense – 0.1% | | | | | | |
| United Technologies Corp. | | 5.375% 12/15/17 | | 500,000 | | 483,311 |
| | | | | | |
| | Aerospace & Defense Total | | | | 483,311 |
| | | |
| Machinery – 0.1% | | | | | | |
| Caterpillar Financial Services Corp. | | 5.450% 04/15/18 | | 575,000 | | 514,417 |
| | | | | | |
| | Machinery Total | | | | 514,417 |
| | | |
| Transportation – 0.3% | | | | | | |
| Burlington Northern Santa Fe Corp. | | 6.200% 08/15/36 | | 415,000 | | 381,126 |
| | | |
| Union Pacific Corp. | | 6.650% 01/15/11 | | 400,000 | | 412,129 |
| | | |
| United Parcel Service, Inc. | | 4.500% 01/15/13 | | 345,000 | | 348,729 |
| | | | | | |
| | Transportation Total | | | | 1,141,984 |
| | | | | | |
| Industrials Total | | | | | | 2,139,712 |
| | | | | | |
| Technology – 0.3% | | | | | | |
| Networking Equipment – 0.2% | | | | | | |
| Cisco Systems, Inc. | | 5.250% 02/22/11 | | 565,000 | | 576,771 |
| | | | | | |
| | Networking Equipment Total | | | | 576,771 |
| | | |
| Software – 0.1% | | | | | | |
| Oracle Corp. | | 6.500% 04/15/38 | | 575,000 | | 522,755 |
| | | | | | |
| | Software Total | | | | 522,755 |
| | | | | | |
| Technology Total | | | | | | 1,099,526 |
| | | | | | |
| Utilities – 1.0% | | | | | | |
| Electric – 0.8% | | | | | | |
| Commonwealth Edison Co. | | 5.950% 08/15/16 | | 600,000 | | 566,646 |
| | | |
| Consolidated Edison Co. of New York | | 5.850% 04/01/18 | | 500,000 | | 474,695 |
See Accompanying Notes to Financial Statements.
19
Columbia Liberty Fund
September 30, 2008
Corporate Fixed-Income Bonds & Notes (continued)
| | | | | | |
| | | | | Par ($) | | Value ($) |
| Utilities (continued) | | | | | | |
| Electric (continued) | | | | | | |
| Indiana Michigan Power Co. | | 5.650% 12/01/15 | | 723,000 | | 667,721 |
| | | |
| Pacific Gas & Electric Co. | | 5.800% 03/01/37 | | 585,000 | | 498,999 |
| | | |
| Progress Energy, Inc. | | 7.750% 03/01/31 | | 425,000 | | 436,496 |
| | | |
| Southern California Edison Co. | | 5.000% 01/15/14 | | 600,000 | | 587,027 |
| | |
| | Electric Total | | | | 3,231,584 |
| | | |
| Gas – 0.2% | | | | | | |
| Atmos Energy Corp. | | 6.350% 06/15/17 | | 400,000 | | 376,400 |
| | | |
| Sempra Energy | | 4.750% 05/15/09 | | 550,000 | | 550,027 |
| | |
| | Gas Total | | | | 926,427 |
| | | | | | |
| Utilities Total | | | | | | 4,158,011 |
| | Total Corporate Fixed-Income Bonds & Notes
(Cost of $36,669,728) | | | | 31,730,780 |
| | | | | | |
| Government & Agency Obligations – 4.7% | | | | |
| Foreign Government Obligations – 0.6% | | | | |
| Province of Ontario | | 3.125% 09/08/10 | | 750,000 | | 755,468 |
| | | |
| Province of Quebec | | 5.000% 07/17/09 | | 1,000,000 | | 1,017,680 |
| | | |
| United Mexican States | | 7.500% 04/08/33 | | 875,000 | | 955,937 |
| | | | | | |
| Foreign Government Obligations Total | | | | 2,729,085 |
| | | | | | |
| U.S. Government Agencies – 1.0% | | | | | | |
| Federal Home Loan Bank | | 5.500% 08/13/14 | | 3,055,000 | | 3,216,790 |
| | | |
| Federal National Mortgage Association | | 5.000% 10/15/11 | | 700,000 | | 731,412 |
| | 5.375% 08/15/09 (f) | | 95,000 | | 96,804 |
| | | | | | |
| U.S. Government Agencies Total | | | | | | 4,045,006 |
| | | | | | |
| U.S. Government Obligations – 3.1% | | | | | | |
| U.S. Treasury Bonds | | 5.375% 02/15/31 | | 9,371,000 | | 10,648,530 |
| | 7.250% 05/15/16 | | 300,000 | | 371,367 |
| | | |
| U.S. Treasury Inflation Indexed Bond | | 3.500% 01/15/11 | | 1,895,415 | | 1,971,084 |
| | | | | | |
| U.S. Government Obligations Total | | | | | | 12,990,981 |
| | Total Government & Agency Obligations
(Cost of $18,923,618) | | | | 19,765,072 |
| | | | | | |
See Accompanying Notes to Financial Statements.
20
Columbia Liberty Fund
September 30, 2008
Commercial Mortgage-Backed Securities – 4.6%
| | | | | | |
| | | | | Par ($) | | Value ($) |
| | | | | |
| Citigroup/Deutsche Bank Commercial Mortgage Trust | | 5.366% 12/11/49 (b) | | 1,010,000 | | 767,212 |
| | | |
| CS First Boston Mortgage Securities Corp. | | 4.577% 04/15/37 | | 2,769,000 | | 2,700,932 |
| | | |
| First Union – Chase Commercial Mortgage | | 6.645% 06/15/31 | | 1,178,413 | | 1,175,704 |
| | | |
| First Union National Bank Commercial Mortgage Trust | | 6.141% 02/12/34 | | 5,000,000 | | 4,962,163 |
| | | |
| JPMorgan Chase Commercial Mortgage Securities Corp. | | 4.780% 07/15/42 | | 630,000 | | 523,931 |
| | 5.447% 06/12/47 | | 1,023,000 | | 885,064 |
| | 5.525% 04/15/43 (b) | | 2,902,000 | | 2,361,172 |
| | | |
| LB-UBS Commercial Mortgage Trust | | 6.510% 12/15/26 | | 2,921,074 | | 2,939,759 |
| | | |
| Morgan Stanley Capital I | | 5.560% 03/12/44 (b) | | 2,800,000 | | 2,498,923 |
| | | |
| Wachovia Bank Commercial Mortgage Trust | | 3.989% 06/15/35 | | 830,000 | | 746,934 |
| | |
| | Total Commercial Mortgage-Backed Securities
(Cost of $21,477,122) | | | | 19,561,794 |
| | | | | | |
| Collateralized Mortgage Obligations – 4.0% | | | | |
| Agency – 1.2% | | | | | | |
| Federal Home Loan Mortgage Corp. | | 5.000% 12/15/15 | | 15,365 | | 15,350 |
| | 6.000% 02/15/28 | | 2,459,337 | | 2,517,563 |
| | 4.500% 08/15/28 | | 380,000 | | 380,289 |
| Federal National Mortgage Association | | 5.000% 12/25/15 | | 1,966,425 | | 1,978,860 |
| | | | | | |
| Agency Total | | | | | | 4,892,062 |
| | | | | | |
| Non-Agency – 2.8% | | | | | | |
| Bear Stearns Adjustable Rate Mortgage Trust | | 5.509% 02/25/47 (b) | | 1,278,291 | | 892,851 |
| | | |
| Countrywide Alternative Loan Trust | | 5.250% 03/25/35 | | 1,663,141 | | 1,357,884 |
| | 5.250% 08/25/35 | | 418,415 | | 389,722 |
| | 5.500% 10/25/35 | | 1,249,387 | | 1,161,059 |
| | | |
| JPMorgan Mortgage Trust | | 6.042% 10/25/36 (b) | | 2,339,013 | | 2,021,405 |
| | | |
| Lehman Mortgage Trust | | 6.500% 01/25/38 | | 1,798,685 | | 1,538,439 |
| | | |
| Residential Asset Securitization Trust | | 4.500% 08/25/34 | | 1,662,601 | | 1,591,136 |
| | | |
| WaMu Mortgage Pass-Through Certificates | | 5.711% 02/25/37 (b) | | 3,184,543 | | 2,344,276 |
See Accompanying Notes to Financial Statements.
21
Columbia Liberty Fund
September 30, 2008
Collateralized Mortgage Obligations (continued)
| | | | | | |
| | | | | Par ($) | | Value ($) |
| Non-Agency (continued) | | | | | | |
| Washington Mutual Alternative Mortgage Pass-Through Certificates | | 5.500% 07/25/35 | | 634,663 | | 551,247 |
| | | | | | |
| Non-Agency Total | | | | | | 11,848,019 |
| | Total Collateralized Mortgage Obligations
(Cost of $19,170,966) | | | | 16,740,081 |
| | | | | | |
| Asset-Backed Securities – 2.0% | | | | | | |
| Citicorp Residential Mortgage Securities, Inc. | | 6.080% 06/25/37 | | 1,050,000 | | 952,436 |
| | | |
| Consumer Funding LLC | | 5.430% 04/20/15 | | 1,820,000 | | 1,828,517 |
| | | |
| Ford Credit Auto Owner Trust | | 5.470% 06/15/12 | | 1,470,000 | | 1,417,600 |
| | | |
| Franklin Auto Trust | | 5.360% 05/20/16 | | 1,890,000 | | 1,830,573 |
| | | |
| Green Tree Financial Corp. | | 6.870% 01/15/29 | | 333,907 | | 323,558 |
| | | |
| USAA Auto Owner Trust | | 4.500% 10/15/13 | | 2,139,000 | | 2,062,724 |
| | |
| | Total Asset-Backed Securities
(Cost of $8,803,376) | | | | 8,415,408 |
| | | | | | |
| Preferred Stock – 0.2% | | | | | | |
| | | | | Shares | | |
| Financials – 0.2% | | | | | | |
| Insurance – 0.2% | | Unipol Gruppo Finanziario SpA | | 515,015 | | 867,487 |
| | |
| | Insurance Total | | | | 867,487 |
| | |
| | Financials Total | | | | 867,487 |
| | |
| | Total Preferred Stock
(Cost of $1,578,482) | | | | 867,487 |
| | | | | | |
| Convertible Preferred Stock – 0.1% | | | | | | |
| Health Care – 0.1% | | | | | | |
| Pharmaceuticals – 0.1% | | Schering-Plough Corp.,
6.000% | | 2,200 | | 380,644 |
| | |
| | Pharmaceuticals Total | | | | 380,644 |
| | |
| | Health Care Total | | | | 380,644 |
| | |
| | Total Convertible Preferred Stock
(Cost of $583,418) | | | | 380,644 |
| | | | | | |
See Accompanying Notes to Financial Statements.
22
Columbia Liberty Fund
September 30, 2008
Rights – 0.0%
| | | | | | | |
| | | | | Units | | Value ($) | |
| Utilities – 0.0% | | | | | | | |
| Multi-Utilities – 0.0% | | | | | | | |
| Suez Environnement SA | | Expires 06/10/22 | | 24,041 | | 147,030 | |
| | | |
| | Multi-Utilities Total | | | | 147,030 | |
| | | |
| | Utilities Total | | | | 147,030 | |
| | | |
| | Total Rights
(Cost of $170,889) | | | | 147,030 | |
| | | | | | | |
| | | | | Par ($) | | | |
| Short-Term Obligation – 5.9% | | | | | | | |
| | Repurchase agreement with Fixed Income Clearing Corp., dated 09/30/08, due 10/01/08 at 1.400%, collateralized by U.S. Government Agency Obligations with various maturities to 04/18/36, market value $25,502,350 (repurchase proceeds $24,991,972) | | 24,991,000 | | 24,991,000 | |
| | | |
| | Total Short-Term Obligation (Cost of $24,991,000) | | 24,991,000 | |
| |
| | | |
| | Total Investments – 100.4% (Cost of $442,387,305) (h) | | 425,125,733 | |
| |
| | | |
| | Other Assets & Liabilities, Net – (0.4)% | | | | (1,613,219 | ) |
| |
| | | |
| | Net Assets – 100.0% | | | | 423,512,514 | |
Notes to Investment Portfolio:
| | (a) | Non-income producing security. |
| | (b) | The interest rate shown on floating rate or variable rate securities reflects the rate at September 30, 2008. |
| | (c) | Security exempt from registration pursuant to Rule 144A under the Securities Act of 1933. These securities may be resold in transactions exempt from registration, normally to qualified institutional buyers. At September 30, 2008, these securities, which are not illiquid, amounted to $2,436,631, which represents 0.6% of net assets. |
| | (d) | Denotes a restricted security, which is subject to restrictions on resale under federal securities laws or in transactions exempt from registration. At September 30, 2008, the value of these securities amounted to $2,241,890, which represents 0.5% of net assets. |
| | | | | | | | | | | |
Security | | Acquisition
Date(s) | | Par | | Acquisition
Cost | | Market
Value |
Citicorp Lease Pass-Through Trust 8.040% 12/15/19 | | 01/06/2000 &
04/12/2001 | | $ | 1,360,000 | | $ | 1,371,414 | | $ | 1,186,190 |
HSBC Capital Funding LP
9.547% 12/31/49 | | 01/02/2003 | | | 1,150,000 | | | 1,406,864 | | | 1,055,700 |
| | | | | | | | | | | |
| | | | | | | | | | $ | 2,241,890 |
| | | | | | | | | | | |
| | (e) | The issuer filed for bankruptcy protection under Chapter 11. Income is not being accrued. At September 30, 2008, the value of this security was less than 0.1% of net assets. |
| | (f) | A portion of this security with a market value of $81,519 is pledged as collateral for open futures contracts. |
| | (g) | Represents fair value as determined in good faith under procedures approved by the Board of Trustees. |
| | (h) | Cost for federal income tax purposes is $445,095,462. |
At September 30, 2008, the Fund held the following open long futures contracts:
| | | | | | | | | | | | | | |
Type | | Number of
Contracts | | Value | | Aggregate
Face Value | | Expiration
Date | | Unrealized
Depreciation | |
S&P 500 Index Futures | | 22 | | $ | 6,420,700 | | $ | 6,693,330 | | Dec-08 | | $ | (272,630 | ) |
At September 30, 2008, the Fund held the following open short futures contracts:
| | | | | | | | | | | | | | |
Type | | Number of
Contracts | | Value | | Aggregate
Face Value | | Expiration
Date | | Unrealized
Depreciation | |
2-Year U.S. Treasury Notes | | 41 | | $ | 8,750,937 | | $ | 8,722,715 | | Dec-08 | | $ | (28,222 | ) |
See Accompanying Notes to Financial Statements.
23
Columbia Liberty Fund
September 30, 2008
For the year ended September 30, 2008, transactions in written option contracts were as follows:
| | | | | | | |
| | | Number of
contracts | | | Premium
received | |
Options outstanding at September 30, 2007 | | 198 | | | $ | 35,802 | |
Options written | | 285 | | | | 80,941 | |
Options expired | | (161 | ) | | | (30,292 | ) |
Options bought back | | (249 | ) | | | (70,260 | ) |
Options exercised | | (73 | ) | | | (16,191 | ) |
| | | | | | | |
Options outstanding at September 30, 2008 | | — | | | $ | — | |
| | | | | | | |
At September 30, 2008, the asset allocation of the Fund is as follows:
| | | |
Asset Allocation (Unaudited) | | % of Net Assets | |
Common Stocks | | 58.2 | |
Mortgage-Backed Securities | | 13.2 | |
Corporate Fixed-Income Bonds & Notes | | 7.5 | |
Government & Agency Obligations | | 4.7 | |
Commercial Mortgage-Backed Securities | | 4.6 | |
Collateralized Mortgage Obligations | | 4.0 | |
Asset-Backed Securities | | 2.0 | |
Preferred Stock | | 0.2 | |
Convertible Preferred Stock | | 0.1 | |
Rights | | 0.0 | * |
| | | |
| | 94.5 | |
Short-Term Obligation | | 5.9 | |
Other Assets & Liabilities, Net | | (0.4 | ) |
| | | |
| | 100.0 | |
| | | |
* Represents less than 0.1%
| | |
Acronym | | Name |
| ADR | | American Depositary Receipt |
| TBA | | To Be Announced |
See Accompanying Notes to Financial Statements.
24
Statement of Assets and Liabilities – Columbia Liberty Fund
September 30, 2008
| | | | | |
| | | | | ($) | |
| Assets | | Investments, at cost | | 442,387,305 | |
| | | | | |
| | Investments, at value | | 425,125,733 | |
| | Cash | | 8,623 | |
| | Cash collateral for futures contracts | | 915,000 | |
| | Foreign currency (cost of $456,798) | | 441,175 | |
| | Receivable for: | | | |
| | Investments sold | | 4,314,163 | |
| | Fund shares sold | | 19,166 | |
| | Interest | | 1,186,035 | |
| | Dividends | | 349,685 | |
| | Securities lending | | 5,527 | |
| | Foreign tax reclaims | | 16,208 | |
| | Futures variation margin | | 317,269 | |
| | Trustees’ deferred compensation plan | | 82,820 | |
| | Other assets | | 1,798 | |
| | | |
| | Total Assets | | 432,783,202 | |
| | |
| Liabilities | | Payable for: | | | |
| | Investments purchased | | 8,012,803 | |
| | Fund shares repurchased | | 649,492 | |
| | Investment advisory fee | | 201,079 | |
| | Transfer agent fee | | 81,506 | |
| | Pricing and bookkeeping fees | | 11,713 | |
| | Trustees’ fees | | 100 | |
| | Custody fee | | 19,382 | |
| | Distribution and service fees | | 106,038 | |
| | Chief compliance officer expenses | | 200 | |
| | Trustees’ deferred compensation plan | | 82,820 | |
| | Other liabilities | | 105,555 | |
| | | |
| | Total Liabilities | | 9,270,688 | |
| |
| | | |
| | Net Assets | | 423,512,514 | |
| | |
| Net Assets Consist of | | Paid-in capital | | 455,733,653 | |
| | Undistributed net investment income | | 301,747 | |
| | Accumulated net realized loss | | (14,952,705 | ) |
| | Net unrealized depreciation on: | | | |
| | Investments | | (17,261,572 | ) |
| | Foreign currency translations | | (7,757 | ) |
| | Futures contracts | | (300,852 | ) |
| | | |
| | Net Assets | | 423,512,514 | |
See Accompanying Notes to Financial Statements.
25
Statement of Assets and Liabilities (continued) – Columbia Liberty Fund
September 30, 2008
| | | | | | |
| | | | | | |
| Class A | | Net assets | | $ | 394,883,539 | |
| | Shares outstanding | | | 55,236,011 | |
| | Net asset value per share | | $ | 7.15 | (a) |
| | Maximum sales charge | | | 5.75 | % |
| | Maximum offering price per share ($7.15/0.9425) | | $ | 7.59 | (b) |
| | |
| Class B | | | | | | |
| | Net assets | | $ | 23,671,856 | |
| | Shares outstanding | | | 3,295,325 | |
| | Net asset value and offering price per share | | $ | 7.18 | (a) |
| | |
| Class C | | | | | | |
| | Net assets | | $ | 4,112,473 | |
| | Shares outstanding | | | 574,130 | |
| | Net asset value and offering price per share | | $ | 7.16 | (a) |
| | |
| Class Z | | | | | | |
| | Net assets | | $ | 844,646 | |
| | Shares outstanding | | | 109,959 | |
| | Net asset value, offering and redemption price per share | | $ | 7.68 | |
| (a) | Redemption price per share is equal to net asset value less any applicable contingent deferred sales charge. |
| (b) | On sales of $50,000 or more the offering price is reduced. |
See Accompanying Notes to Financial Statements.
26
Statement of Operations – Columbia Liberty Fund
For the Year Ended September 30, 2008
| | | | | |
| | | | | ($) | |
| Investment Income | | Dividends | | 5,930,012 | |
| | Interest | | 10,620,378 | |
| | Securities lending | | 172,762 | |
| | Foreign taxes withheld | | (126,479 | ) |
| | | |
| | Total Investment Income | | 16,596,673 | |
| | |
| Expenses | | Investment advisory fee | | 2,844,040 | |
| | Distribution fee: | | | |
| | Class B | | 270,917 | |
| | Class C | | 37,130 | |
| | Service fee: | | | |
| | Class A | | 1,132,815 | |
| | Class B | | 85,963 | |
| | Class C | | 11,816 | |
| | Transfer agent fee | | 664,974 | |
| | Pricing and bookkeeping fees | | 147,227 | |
| | Trustees’ fees | | 38,751 | |
| | Custody fee | | 125,041 | |
| | Chief compliance officer expenses | | 783 | |
| | Other expenses | | 322,176 | |
| | | |
| | Expenses before interest expense | | 5,681,633 | |
| | |
| | Interest expense | | 698 | |
| | | |
| | Total Expenses | | 5,682,331 | |
| | |
| | Expense reductions | | (31,576 | ) |
| | | |
| | Net Expenses | | 5,650,755 | |
| |
| | | |
| | Net Investment Income | | 10,945,918 | |
| | |
| Net Realized and Unrealized Gain (Loss) on Investments, Foreign Currency, Futures Contracts and Written Options | | Net realized loss on: | | | |
| | Investments | | (6,719,144 | ) |
| | Foreign currency transactions | | (98,070 | ) |
| | Futures contracts | | (996,272 | ) |
| | Written options | | (8,050 | ) |
| | | |
| | Net realized loss | | (7,821,536 | ) |
| | |
| | Net change in unrealized appreciation (depreciation) on: | | | |
| | Investments | | (87,056,997 | ) |
| | Foreign currency translations | | (25,930 | ) |
| | Futures contracts | | (431,055 | ) |
| | Written options | | 35,888 | |
| | | |
| | Net change in unrealized appreciation (depreciation) | | (87,478,094 | ) |
| | | |
| | Net Loss | | (95,299,630 | ) |
| |
| | | |
| | Net Decrease Resulting from Operations | | (84,353,712 | ) |
See Accompanying Notes to Financial Statements.
27
Statement of Changes in Net Assets – Columbia Liberty Fund
| | | | | | | | |
| | | Year Ended September 30, | |
| Increase (Decrease) in Net Assets: | | | | 2008 ($) | | | 2007 ($) | |
| Operations | | Net investment income | | 10,945,918 | | | 11,786,895 | |
| | Net realized gain (loss) on investments, foreign currency transactions, futures contracts and written options | | (7,821,536 | ) | | 60,030,015 | |
| | Net change in unrealized appreciation (depreciation) on investments, foreign currency translations, futures contracts and written options | | (87,478,094 | ) | | 13,499,756 | |
| | | |
| | Net Increase (Decrease) Resulting from Operations | | (84,353,712 | ) | | 85,316,666 | |
| | | |
| Distributions to Shareholders | | From net investment income: | | | | | | |
| | Class A | | (11,104,201 | ) | | (11,622,190 | ) |
| | Class B | | (319,877 | ) | | (984,487 | ) |
| | Class C | | (50,399 | ) | | (78,730 | ) |
| | Class Z | | (23,222 | ) | | (26,841 | ) |
| | From net realized gains: | | | | | | |
| | Class A | | (50,512,404 | ) | | (14,916,474 | ) |
| | Class B | | (4,495,161 | ) | | (2,301,523 | ) |
| | Class C | | (525,979 | ) | | (152,017 | ) |
| | Class Z | | (76,984 | ) | | (32,922 | ) |
| | | |
| | Total Distributions to Shareholders | | (67,108,227 | ) | | (30,115,184 | ) |
| | | |
| | Net Decrease from Share Transactions | | (14,970,215 | ) | | (72,100,446 | ) |
| |
| | | |
| | Total Decrease in Net Assets | | (166,432,154 | ) | | (16,898,964 | ) |
| | | |
| Net Assets | | Beginning of period | | 589,944,668 | | | 606,843,632 | |
| | End of period | | 423,512,514 | | | 589,944,668 | |
| | Undistributed net investment income at end of period | | 301,747 | | | 735,936 | |
See Accompanying Notes to Financial Statements.
28
Statement of Changes in Net Assets (continued) – Capital Stock Activity
| | | | | | | | | | | | | | |
| | | Columbia Liberty Fund | |
| | | Year Ended September 30, | |
| | | 2008 | | | | | 2007 | |
| | | Shares | | | Dollars ($) | | | | | Shares | | | Dollars ($) | |
Class A | | | | | | | | | | | | | | |
Subscriptions | | 2,207,022 | | | 18,516,910 | | | | | 3,864,114 | | | 35,415,415 | |
Distributions reinvested | | 6,558,485 | | | 56,303,542 | | | | | 2,644,997 | | | 23,863,700 | |
Redemptions | | (8,818,413 | ) | | (73,218,546 | ) | | | | (9,814,938 | ) | | (90,136,099 | ) |
| | | | | | | | | | | | | | |
Net Increase (Decrease) | | (52,906 | ) | | 1,601,906 | | | | | (3,305,827 | ) | | (30,856,984 | ) |
| | | | | |
Class B | | | | | | | | | | | | | | |
Subscriptions | | 111,331 | | | 919,752 | | | | | 151,133 | | | 1,384,043 | |
Distributions reinvested | | 532,903 | | | 4,631,736 | | | | | 349,538 | | | 3,134,950 | |
Redemptions | | (2,674,631 | ) | | (22,456,168 | ) | | | | (4,944,465 | ) | | (45,222,882 | ) |
| | | | | | | | | | | | | | |
Net Decrease | | (2,030,397 | ) | | (16,904,680 | ) | | | | (4,443,794 | ) | | (40,703,889 | ) |
| | | | | |
Class C | | | | | | | | | | | | | | |
Subscriptions | | 82,775 | | | 692,833 | | | | | 84,154 | | | 768,688 | |
Distributions reinvested | | 63,240 | | | 546,221 | | | | | 24,015 | | | 215,233 | |
Redemptions | | (139,553 | ) | | (1,145,539 | ) | | | | (120,150 | ) | | (1,098,493 | ) |
| | | | | | | | | | | | | | |
Net Increase (Decrease) | | 6,462 | | | 93,515 | | | | | (11,981 | ) | | (114,572 | ) |
| | | | | |
Class Z | | | | | | | | | | | | | | |
Subscriptions | | 21,569 | | | 191,142 | | | | | 10,783 | | | 106,778 | |
Distributions reinvested | | 10,734 | | | 98,502 | | | | | 4,000 | | | 38,540 | |
Redemptions | | (5,649 | ) | | (50,600 | ) | | | | (57,272 | ) | | (570,319 | ) |
| | | | | | | | | | | | | | |
Net Increase (Decrease) | | 26,654 | | | 239,044 | | | | | (42,489 | ) | | (425,001 | ) |
See Accompanying Notes to Financial Statements.
29
Financial Highlights – Columbia Liberty Fund
Selected data for a share outstanding throughout each period is as follows:
| | | | | | | | | | | | | | | | | | | | |
| | | Year Ended September 30, | |
| Class A Shares | | 2008 | | | 2007 | | | 2006 | | | 2005 | | | 2004 | |
Net Asset Value, Beginning of Period | | $ | 9.63 | | | $ | 8.79 | | | $ | 8.36 | | | $ | 7.68 | | | $ | 7.22 | |
| | | | | |
Income from Investment Operations: | | | | | | | | | | | | | | | | | | | | |
Net investment income (a) | | | 0.18 | | | | 0.19 | | | | 0.18 | | | | 0.15 | | | | 0.13 | |
Net realized and unrealized gain (loss) on investments, foreign currency, futures contracts and written options | | | (1.53 | ) | | | 1.12 | | | | 0.44 | | | | 0.70 | | | | 0.51 | |
| | | | | | | | | | | | | | | | | | | | |
Total from Investment Operations | | | (1.35 | ) | | | 1.31 | | | | 0.62 | | | | 0.85 | | | | 0.64 | |
| | | | | |
Less Distributions to Shareholders: | | | | | | | | | | | | | | | | | | | | |
From net investment income | | | (0.20 | ) | | | (0.21 | ) | | | (0.19 | ) | | | (0.17 | ) | | | (0.18 | ) |
From net realized gains | | | (0.93 | ) | | | (0.26 | ) | | | — | | | | — | | | | — | |
| | | | | | | | | | | | | | | | | | | | |
Total Distributions to Shareholders | | | (1.13 | ) | | | (0.47 | ) | | | (0.19 | ) | | | (0.17 | ) | | | (0.18 | ) |
| | | | | |
Net Asset Value, End of Period | | $ | 7.15 | | | $ | 9.63 | | | $ | 8.79 | | | $ | 8.36 | | | $ | 7.68 | |
Total return (b) | | | (15.83 | )% | | | 15.29 | % | | | 7.47 | %(c)(d) | | | 11.12 | %(c) | | | 8.92 | % |
| | | | | |
Ratios to Average Net Assets/Supplemental Data: | | | | | | | | | | | | | | | | | | | | |
Net expenses before interest expense | | | 1.03 | %(e) | | | 1.04 | %(f) | | | 1.03 | %(f) | | | 1.13 | %(f) | | | 1.13 | %(f) |
Interest expense | | | — | %(g) | | | — | | | | — | | | | — | | | | — | |
Net expenses | | | 1.03 | %(e) | | | 1.04 | %(f) | | | 1.03 | %(f) | | | 1.13 | %(f) | | | 1.13 | %(f) |
Waiver/Reimbursement | | | — | | | | — | | | | 0.01 | % | | | 0.01 | % | | | — | |
Net investment income | | | 2.18 | %(e) | | | 2.06 | %(f) | | | 2.07 | %(f) | | | 1.88 | %(f) | | | 1.73 | %(f) |
Portfolio turnover rate | | | 88 | % | | | 106 | % | | | 98 | % | | | 83 | % | | | 74 | % |
Net assets, end of period (000’s) | | $ | 394,884 | | | $ | 532,413 | | | $ | 514,826 | | | $ | 545,773 | | | $ | 574,954 | |
| (a) | Per share data was calculated using the average shares outstanding during the period. |
| (b) | Total return at net asset value assuming all distributions reinvested and no initial sales charge or contingent deferred sales charge. |
| (c) | Had the investment advisor and/or any of its affiliates not waived fees or reimbursed a portion of expenses, total return would have been reduced. |
| (d) | Total return includes a voluntary reimbursement by the investment advisor for a realized investment loss due to a trading error. This reimbursement had an impact of less than 0.01%. |
| (e) | The benefits derived from expense reductions had an impact of 0.01%. |
| (f) | The benefits derived from expense reductions had an impact of less than 0.01%. |
| (g) | Rounds to less than 0.01%. |
See Accompanying Notes to Financial Statements.
30
Financial Highlights – Columbia Liberty Fund
Selected data for a share outstanding throughout each period is as follows:
| | | | | | | | | | | | | | | | | | | | |
| | | Year Ended September 30, | |
| Class B Shares | | 2008 | | | 2007 | | | 2006 | | | 2005 | | | 2004 | |
Net Asset Value, Beginning of Period | | $ | 9.62 | | | $ | 8.78 | | | $ | 8.36 | | | $ | 7.68 | | | $ | 7.21 | |
| | | | | |
Income from Investment Operations: | | | | | | | | | | | | | | | | | | | | |
Net investment income (a) | | | 0.12 | | | | 0.12 | | | | 0.11 | | | | 0.09 | | | | 0.07 | |
Net realized and unrealized gain (loss) on investments, foreign currency, futures contracts and written options | | | (1.54 | ) | | | 1.12 | | | | 0.43 | | | | 0.70 | | | | 0.52 | |
| | | | | | | | | | | | | | | | | | | | |
Total from Investment Operations | | | (1.42 | ) | | | 1.24 | | | | 0.54 | | | | 0.79 | | | | 0.59 | |
| | | | | |
Less Distributions to Shareholders: | | | | | | | | | | | | | | | | | | | | |
From net investment income | | | (0.09 | ) | | | (0.14 | ) | | | (0.12 | ) | | | (0.11 | ) | | | (0.12 | ) |
From net realized gains | | | (0.93 | ) | | | (0.26 | ) | | | — | | | | — | | | | — | |
| | | | | | | | | | | | | | | | | | | | |
Total Distributions to Shareholders | | | (1.02 | ) | | | (0.40 | ) | | | (0.12 | ) | | | (0.11 | ) | | | (0.12 | ) |
| | | | | |
Net Asset Value, End of Period | | $ | 7.18 | | | $ | 9.62 | | | $ | 8.78 | | | $ | 8.36 | | | $ | 7.68 | |
Total return (b) | | | (16.51 | )% | | | 14.46 | % | | | 6.55 | %(c)(d) | | | 10.30 | %(c) | | | 8.22 | % |
| | | | | |
Ratios to Average Net Assets/Supplemental Data: | | | | | | | | | | | | | | | | | | | | |
Net expenses before interest expense | | | 1.78 | %(e) | | | 1.79 | %(f) | | | 1.78 | %(f) | | | 1.88 | %(f) | | | 1.88 | %(f) |
Interest expense | | | — | %(g) | | | — | | | | — | | | | — | | | | — | |
Net expenses | | | 1.78 | %(e) | | | 1.79 | %(f) | | | 1.78 | %(f) | | | 1.88 | %(f) | | | 1.88 | %(f) |
Waiver/Reimbursement | | | — | | | | — | | | | 0.01 | % | | | 0.01 | % | | | — | |
Net investment income | | | 1.39 | %(e) | | | 1.28 | %(f) | | | 1.31 | %(f) | | | 1.14 | %(f) | | | 0.97 | %(f) |
Portfolio turnover rate | | | 88 | % | | | 106 | % | | | 98 | % | | | 83 | % | | | 74 | % |
Net assets, end of period (000’s) | | $ | 23,672 | | | $ | 51,229 | | | $ | 85,766 | | | $ | 130,724 | | | $ | 171,775 | |
| (a) | Per share data was calculated using the average shares outstanding during the period. |
| (b) | Total return at net asset value assuming all distributions reinvested and no contingent deferred sales charge. |
| (c) | Had the investment advisor and/or any of its affiliates not waived fees or reimbursed a portion of expenses, total return would have been reduced. |
| (d) | Total return includes a voluntary reimbursement by the investment advisor for a realized investment loss due to a trading error. This reimbursement had an impact of less than 0.01%. |
| (e) | The benefits derived from expense reductions had an impact of 0.01%. |
| (f) | The benefits derived from expense reductions had an impact of less than 0.01%. |
| (g) | Rounds to less than 0.01%. |
See Accompanying Notes to Financial Statements.
31
Financial Highlights – Columbia Liberty Fund
Selected data for a share outstanding throughout each period is as follows:
| | | | | | | | | | | | | | | | | | | | |
| | | Year Ended September 30, | |
| Class C Shares | | 2008 | | | 2007 | | | 2006 | | | 2005 | | | 2004 | |
Net Asset Value, Beginning of Period | | $ | 9.59 | | | $ | 8.76 | | | $ | 8.34 | | | $ | 7.66 | | | $ | 7.20 | |
| | | | | |
Income from Investment Operations: | | | | | | | | | | | | | | | | | | | | |
Net investment income (a) | | | 0.12 | | | | 0.12 | | | | 0.11 | | | | 0.09 | | | | 0.07 | |
Net realized and unrealized gain (loss) on investments, foreign currency, futures contracts and written options | | | (1.53 | ) | | | 1.11 | | | | 0.43 | | | | 0.70 | | | | 0.51 | |
| | | | | | | | | | | | | | | | | | | | |
Total from Investment Operations | | | (1.41 | ) | | | 1.23 | | | | 0.54 | | | | 0.79 | | | | 0.58 | |
| | | | | |
Less Distributions to Shareholders: | | | | | | | | | | | | | | | | | | | | |
From net investment income | | | (0.09 | ) | | | (0.14 | ) | | | (0.12 | ) | | | (0.11 | ) | | | (0.12 | ) |
From net realized gains | | | (0.93 | ) | | | (0.26 | ) | | | — | | | | — | | | | — | |
| | | | | | | | | | | | | | | | | | | | |
Total Distributions to Shareholders | | | (1.02 | ) | | | (0.40 | ) | | | (0.12 | ) | | | (0.11 | ) | | | (0.12 | ) |
| | | | | |
Net Asset Value, End of Period | | $ | 7.16 | | | $ | 9.59 | | | $ | 8.76 | | | $ | 8.34 | | | $ | 7.66 | |
Total return (b) | | | (16.46 | )% | | | 14.38 | % | | | 6.56 | %(c)(d) | | | 10.33 | %(c) | | | 8.09 | % |
| | | | | |
Ratios to Average Net Assets/Supplemental Data: | | | | | | | | | | | | | | | | | | | | |
Net expenses before interest expense | | | 1.78 | %(e) | | | 1.79 | %(f) | | | 1.78 | %(f) | | | 1.88 | %(f) | | | 1.88 | %(f) |
Interest expense | | | — | %(g) | | | — | | | | — | | | | — | | | | — | |
Net expenses | | | 1.78 | %(e) | | | 1.79 | %(f) | | | 1.78 | %(f) | | | 1.88 | %(f) | | | 1.88 | %(f) |
Waiver/Reimbursement | | | — | | | | — | | | | 0.01 | % | | | 0.01 | % | | | — | |
Net investment income | | | 1.43 | %(e) | | | 1.31 | %(f) | | | 1.31 | %(f) | | | 1.13 | %(f) | | | 0.97 | %(f) |
Portfolio turnover rate | | | 88 | % | | | 106 | % | | | 98 | % | | | 83 | % | | | 74 | % |
Net assets, end of period (000’s) | | $ | 4,112 | | | $ | 5,447 | | | $ | 5,076 | | | $ | 5,478 | | | $ | 6,033 | |
| (a) | Per share data was calculated using the average shares outstanding during the period. |
| (b) | Total return at net asset value assuming all distributions reinvested and no contingent deferred sales charge. |
| (c) | Had the investment advisor and/or any of its affiliates not waived fees or reimbursed a portion of expenses, total return would have been reduced. |
| (d) | Total return includes a voluntary reimbursement by the investment advisor for a realized investment loss due to a trading error. This reimbursement had an impact of less than 0.01%. |
| (e) | The benefits derived from expense reductions had an impact of 0.01%. |
| (f) | The benefits derived from expense reductions had an impact of less than 0.01%. |
| (g) | Rounds to less than 0.01%. |
See Accompanying Notes to Financial Statements.
32
Financial Highlights – Columbia Liberty Fund
Selected data for a share outstanding throughout each period is as follows:
| | | | | | | | | | | | | | | | | | | | |
| | | Year Ended September 30, | |
| Class Z Shares | | 2008 | | | 2007 | | | 2006 | | | 2005 | | | 2004 | |
Net Asset Value, Beginning of Period | | $ | 10.28 | | | $ | 9.34 | | | $ | 8.88 | | | $ | 8.15 | | | $ | 7.65 | |
| | | | | |
Income from Investment Operations: | | | | | | | | | | | | | | | | | | | | |
Net investment income (a) | | | 0.22 | | | | 0.22 | | | | 0.21 | | | | 0.18 | | | | 0.16 | |
Net realized and unrealized gain (loss) on investments, foreign currency, futures contracts and written options | | | (1.65 | ) | | | 1.21 | | | | 0.46 | | | | 0.74 | | | | 0.54 | |
| | | | | | | | | | | | | | | | | | | | |
Total from Investment Operations | | | (1.43 | ) | | | 1.43 | | | | 0.67 | | | | 0.92 | | | | 0.70 | |
| | | | | |
Less Distributions to Shareholders: | | | | | | | | | | | | | | | | | | | | |
From net investment income | | | (0.24 | ) | | | (0.23 | ) | | | (0.21 | ) | | | (0.19 | ) | | | (0.20 | ) |
From net realized gains | | | (0.93 | ) | | | (0.26 | ) | | | — | | | | — | | | | — | |
| | | | | | | | | | | | | | | | | | | | |
Total Distributions to Shareholders | | | (1.17 | ) | | | (0.49 | ) | | | (0.21 | ) | | | (0.19 | ) | | | (0.20 | ) |
| | | | | |
Net Asset Value, End of Period | | $ | 7.68 | | | $ | 10.28 | | | $ | 9.34 | | | $ | 8.88 | | | $ | 8.15 | |
Total return (b) | | | (15.67 | )% | | | 15.72 | % | | | 7.60 | %(c)(d) | | | 11.33 | %(c) | | | 9.19 | % |
| | | | | |
Ratios to Average Net Assets/Supplemental Data: | | | | | | | | | | | | | | | | | | | | |
Net expenses before interest expense | | | 0.79 | %(e) | | | 0.80 | %(f) | | | 0.79 | %(f) | | | 0.90 | %(f) | | | 0.90 | %(f) |
Interest expense | | | — | %(g) | | | — | | | | — | | | | — | | | | — | |
Net expenses | | | 0.79 | %(e) | | | 0.80 | %(f) | | | 0.79 | %(f) | | | 0.90 | %(f) | | | 0.90 | %(f) |
Waiver/Reimbursement | | | — | | | | — | | | | 0.01 | % | | | 0.01 | % | | | — | |
Net investment income | | | 2.44 | %(e) | | | 2.29 | %(f) | | | 2.34 | %(f) | | | 2.11 | %(f) | | | 1.99 | %(f) |
Portfolio turnover rate | | | 88 | % | | | 106 | % | | | 98 | % | | | 83 | % | | | 74 | % |
Net assets, end of period (000’s) | | $ | 845 | | | $ | 856 | | | $ | 1,175 | | | $ | 700 | | | $ | 641 | |
| (a) | Per share data was calculated using the average shares outstanding during the period. |
| (b) | Total return at net asset value assuming all distributions reinvested. |
| (c) | Had the investment advisor and/or any of its affiliates not waived fees or reimbursed a portion of expenses, total return would have been reduced. |
| (d) | Total return includes a voluntary reimbursement by the investment advisor for a realized investment loss due to a trading error. This reimbursement had an impact of less than 0.01%. |
| (e) | The benefits derived from expense reductions had an impact of 0.01%. |
| (f) | The benefits derived from expense reductions had an impact of less than 0.01%. |
| (g) | Rounds to less than 0.01%. |
See Accompanying Notes to Financial Statements.
33
Notes to Financial Statements – Columbia Liberty Fund
September 30, 2008
Note 1. Organization
Columbia Liberty Fund (the “Fund”), a series of Columbia Funds Series Trust I (the “Trust”), is a diversified portfolio. The Trust is a Massachusetts business trust registered under the Investment Company Act of 1940, as amended (the “1940 Act”), as an open-end management investment company.
Investment Objective
The Fund seeks total return, consisting of current income and long-term capital appreciation.
Fund Shares
The Trust may issue an unlimited number of shares, and the Fund offers four classes of shares: Class A, Class B, Class C and Class Z. Each share class has its own expense structure and sales charges, as applicable.
Class A shares are subject to a maximum front-end sales charge of 5.75% based on the amount of initial investment. Class A shares purchased without an initial sales charge in accounts aggregating $1 million to $50 million at the time of purchase are subject to a 1.00% contingent deferred sales charge (“CDSC”) on shares sold within one year after purchase. Class B shares are subject to a maximum CDSC of 5.00% based upon the holding period after purchase. Class B shares will generally convert to Class A shares eight years after purchase. Class C shares are subject to a 1.00% CDSC on shares sold within one year after purchase. Class Z shares are offered continuously at net asset value. There are certain restrictions on the purchase of Class Z shares, as described in the Fund’s prospectus.
Note 2. Significant Accounting Policies
The preparation of financial statements in accordance with accounting principles generally accepted in the United States of America (“GAAP”) requires management to make certain estimates and assumptions that affect the reported amounts of assets and liabilities, the disclosure of contingent assets and liabilities at the date of the financial statements and the reported amounts of revenue and expenses during the reporting period. Actual results could differ from those estimates. The following is a summary of significant accounting policies consistently followed by the Fund in the preparation of its financial statements.
Security Valuation
Debt securities generally are valued by pricing services approved by the Trust’s Board of Trustees, based upon market transactions for normal, institutional-size trading units of similar securities. The services may use various pricing techniques which take into account appropriate factors such as yield, quality, coupon rate, maturity, type of issue, trading characteristics and other data, as well as broker quotes. Debt securities for which quotations are readily available are valued at an over-the-counter or exchange bid quotation. Certain debt securities, which tend to be more thinly traded and of lesser quality, are priced based on fundamental analysis of the financial condition of the issuer and the estimated value of any collateral. Valuations developed through pricing techniques may vary from the actual amounts realized upon sale of the securities, and the potential variation may be greater for those securities valued using fundamental analysis
Equity securities are valued at the last sale price on the principal exchange on which they trade, except for securities traded on the NASDAQ, which are valued at the NASDAQ official close price. Unlisted securities or listed securities for which there were no sales during the day are valued at the closing bid price on such exchanges or over-the-counter markets.
Short-term debt obligations maturing within 60 days are valued at amortized cost, which approximates market value.
Futures contracts are valued at the settlement price established each day by the board of trade or exchange on which they are traded.
Options are valued at the last reported sale price, or in the absence of a sale, at the last quoted bid price.
Foreign securities are generally valued at the last sale price on the foreign exchange or market on which they trade. If any foreign share prices are not readily available as a result of limited share activity, the securities are valued at the last sale price of the local shares in the principal market in which such securities are normally traded.
Generally, trading in foreign securities is substantially completed each day at various times prior to the close of the New York Stock Exchange (“NYSE”). The values of such securities used in computing the net asset value of the
34
Columbia Liberty Fund
September 30, 2008
Fund’s shares are determined as of such times. Foreign currency exchange rates are generally determined at 4:00 p.m. Eastern (U.S.) time. Occasionally events affecting the values of such foreign securities and such exchange rates may occur between the times at which they are determined and the close of the customary trading session of the NYSE, which would not be reflected in the computation of the Fund’s net asset value. If events materially affecting the values of such foreign securities occur and it is determined that market quotations are not reliable, then these foreign securities will be valued at their fair value using procedures approved by the Board of Trustees. The Fund may use a systematic fair valuation model provided by an independent third party to value securities principally traded in foreign markets in order to adjust for possible stale pricing that may occur between the close of the foreign exchanges and the time for valuation.
Investments for which market quotations are not readily available, or that have quotations which Columbia believes are not reliable, are valued at fair value as determined in good faith under consistently applied procedures established by and under the general supervision of the Board of Trustees. If a security is valued at fair value, such value is likely to be different from the last quoted market price for the security.
In September 2006, Statement of Financial Accounting Standards No. 157, Fair Value Measurements (“SFAS 157”), was issued. SFAS 157 is effective for fiscal years beginning after November 15, 2007. SFAS 157 defines fair value, establishes a framework for measuring fair value and expands disclosures about fair value measurements. Management is evaluating the impact the application of SFAS 157 will have on the Fund’s financial statement disclosures.
Security Transactions
Security transactions are accounted for on the trade date. Cost is determined and gains (losses) are based upon the specific identification method for both financial statement and federal income tax purposes.
In March 2008, Statement of Financial Accounting Standards No. 161, Disclosures about Derivative Instruments and Hedging Activities-an amendment of FASB Statement No. 133, (“SFAS 161”) was issued. SFAS 161 is effective for fiscal years and interim periods beginning after November 15, 2008. SFAS 161 requires additional discussion about the reporting entity’s derivative instruments and hedging activities, by providing for qualitative disclosures about the objectives and strategies for using derivatives, quantitative data about the fair value of and gains and losses on derivative contracts, and details of credit-risk-related contingent features in their hedged positions. Management is evaluating the impact the application of SFAS 161 will have on the Fund’s financial statement disclosures.
Futures Contracts
The Fund may invest in futures for both hedging and non-hedging purposes, including, for example, to seek to enhance returns or as a substitute for a position in an underlying asset.
The use of futures contracts involves certain risks, which include: (1) imperfect correlation between the price movement of the instruments and the underlying securities, (2) inability to close out positions due to differing trading hours, or the temporary absence of a liquid market, for either the instruments or the underlying securities, or (3) an inaccurate prediction by Columbia Management Advisors, LLC (“Columbia”), the Fund’s investment advisor, of the future direction of interest rates. Any of these risks may involve amounts exceeding the variation margin recorded in the Fund’s Statement of Assets and Liabilities at any given time.
Upon entering into a futures contract, the Fund pledges cash or securities with the broker in an amount sufficient to meet the initial margin requirement. Subsequent payments are made or received by the Fund equal to the daily change in the contract value and are recorded as variation margin receivable or payable and offset in unrealized gains or losses. The Fund recognizes a realized gain or loss when the contract is closed or expires.
Options
The Fund may write call and put options on securities it owns or in which it may invest. Writing put options tends to increase the Fund’s exposure to the underlying instrument. Writing call options tends to decrease the Fund’s exposure to the underlying instrument. When the Fund writes a call or put option, an amount equal to the premium received is recorded as a liability and subsequently marked-to-market to reflect the current value of the option written. Premiums received from writing options which expire are treated as realized gains. Premiums received from writing options which are exercised or
35
Columbia Liberty Fund
September 30, 2008
closed are added to the proceeds or offset against the amounts paid on the underlying security transaction to determine the realized gain or loss. The Fund, as a writer of an option, has no control over whether the underlying security may be sold (call) or purchased (put) and as a result bears the market risk of an unfavorable change in the price of the security underlying the written option. There is the risk that the Fund may not be able to enter into a closing transaction because of an illiquid market. The Fund’s custodian will set aside cash or liquid portfolio securities equal to the amount of the written options contract commitment in a segregated account.
The Fund may also purchase put and call options. Purchasing call options tends to increase the Fund’s exposure to the underlying instrument. Purchasing put options tends to decrease the Fund’s exposure to the underlying instrument. The Fund may pay a premium, which is included in the Fund’s Statement of Assets and Liabilities as an investment and subsequently marked-to-market to reflect the current value of the option. The risk associated with purchasing put and call options is limited to the premium paid. Premiums paid for purchasing options which expire are treated as realized losses. Premiums paid for purchasing options which are exercised are added to the amounts paid (call) or offset against the proceeds (put) on the underlying security to determine the realized gain or loss. If a Fund enters into a closing transaction, the Fund will realize a gain or loss, depending on whether the proceeds from the closing transaction are greater or less than the cost of the option.
Repurchase Agreements
The Fund may engage in repurchase agreement transactions with institutions that Columbia has determined are creditworthy. The Fund, through its custodian, receives delivery of the underlying securities collateralizing a repurchase agreement. Columbia is responsible for determining that the collateral is at least equal, at all times, to the value of the repurchase obligation including interest. A repurchase agreement transaction involves certain risks in the event of default or insolvency of the counterparty. These risks include possible delays or restrictions on the Fund’s ability to dispose of the underlying securities and a possible decline in the value of the underlying securities during the period while the Fund seeks to assert its rights.
Foreign Currency Transactions
The values of all assets and liabilities quoted in foreign currencies are translated into U.S. dollars at that day’s exchange rates. Net realized and unrealized gains (losses) on foreign currency transactions include gains (losses) arising from the fluctuation in exchange rates between trade and settlement dates on securities transactions, gains (losses) arising from the disposition of foreign currency and currency gains (losses) between the accrual and payment dates on dividends, interest income and foreign withholding taxes.
For financial statement purposes, the Fund does not distinguish that portion of gains (losses) on investments which is due to changes in foreign exchange rates from that which is due to changes in market prices of the investments. Such fluctuations are included with the net realized and unrealized gains (losses) on investments on the Statement of Operations.
Income Recognition
Interest income is recorded on the accrual basis. Premium and discount are amortized and accreted, respectively, on all debt securities, unless otherwise noted. Corporate actions and dividend income are recorded on the ex-date except for certain foreign securities which are recorded as soon after the ex-date as the Fund becomes aware of such, net of any non-reclaimable tax withholdings. Distributions received from real estate investment trusts (REITs) in excess of their income are recorded as a reduction of the cost of the related investments. If the Fund no longer owns the applicable securities, any distributions received in excess of income are recorded as realized gains. Awards from class action litigation are recorded as a reduction of cost if the Fund still owns the applicable securities on the payment date. If the Fund no longer owns the applicable securities, the proceeds are recorded as realized gains. The value of additional securities received as an income payment is recorded as income and as the cost basis of such securities.
Expenses
General expenses of the Trust are allocated to the Fund and the other series of the Trust based upon relative net assets or other expense allocation methodologies determined by the nature of the expense. Expenses directly attributable to the Fund are charged to the Fund.
36
Columbia Liberty Fund
September 30, 2008
Determination of Class Net Asset Value
All income, expenses (other than class-specific expenses, as shown on the Statement of Operations) and realized and unrealized gains (losses) are allocated to each class of the Fund on a daily basis, based on the relative net assets of each class, for purposes of determining the net asset value of each class.
Federal Income Tax Status
The Fund intends to qualify each year as a “regulated investment company” under Subchapter M of the Internal Revenue Code, as amended, and will distribute substantially all of its taxable income, if any, for its tax year, and as such will not be subject to federal income taxes. In addition, the Fund intends to distribute in each calendar year substantially all of its net investment income, capital gains and certain other amounts, if any, such that the Fund should not be subject to federal excise tax. Therefore, no federal income or excise tax provision is recorded.
Distributions to Shareholders
Distributions of net investment income are declared and distributed quarterly. Net realized capital gains, if any, are distributed at least annually. Income distributions and capital gain distributions are determined in accordance with federal income tax regulations which may differ from GAAP.
Indemnification
In the normal course of business, the Fund enters into contracts that contain a variety of representations and warranties and which provide general indemnities. The Fund’s maximum exposure under these arrangements is unknown because this would involve future claims against the Fund. Also, under the Trust’s organizational documents and by contract, the Trustees and officers of the Trust are indemnified against certain liabilities that may arise out of actions relating to their duties to the Trust. However, based on experience, the Fund expects the risk of loss due to these representations, warranties and indemnities to be minimal.
Note 3. Federal Tax Information
The timing and character of income and capital gain distributions are determined in accordance with income tax regulations, which may differ from GAAP. Reclassifications are made to the Fund’s capital accounts for permanent tax differences to reflect income and gains available for distribution (or available capital loss carryforwards) under income tax regulations.
For the year ended September 30, 2008, permanent book and tax basis differences resulting primarily from differing treatments for paydown reclassifications, PFIC adjustments, Section 988 currency gain/loss, distribution reclassifications, market discount reclassifications and discount accretion/premium amortization on debt securities were identified and reclassified among the components of the Fund’s net assets as follows:
| | | | |
| | | | | |
Undistributed Net Investment
Income | | Accumulated Net Realized
Loss | | Paid-In Capital |
| $117,592 | | $(117,591) | | $(1) |
Net investment income and net realized gains (losses), as disclosed on the Statement of Operations, and net assets were not affected by these reclassification.
The tax character of distributions paid during the years ended September 30, 2008 and September 30, 2007 was as follows:
| | | | | | |
| | | September 30,
2008 | | September 30,
2007 |
| Distributions paid from: | | |
Ordinary Income* | | $ | 30,729,193 | | $ | 14,676,237 |
Long-Term Capital Gains | | | 36,379,034 | | | 15,438,947 |
| * | For tax purposes short-term capital gains distributions, if any, are considered ordinary income distributions. |
As of September 30, 2008, the components of distributable earnings on a tax basis were as follows:
| | | | |
| | | | | |
Undistributed
Ordinary Income | | Undistributed Long-term Capital Gains | | Net Unrealized Depreciation* |
| $645,654 | | $— | | $(19,969,729) |
| * | The differences between book-basis and tax-basis net unrealized (depreciation) are primarily due to deferral of losses from wash sales deferral of losses from wash sales and discount accretion/premium amortization adjustments. |
Unrealized appreciation and depreciation at September 30, 2008, based on cost of investments for federal income tax purposes, were:
| | | | |
| | | | |
Unrealized appreciation | | $ | 26,511,160 | |
Unrealized depreciation | | | (46,480,889 | ) |
Net unrealized depreciation | | $ | (19,969,729 | ) |
37
Columbia Liberty Fund
September 30, 2008
Under current tax rules, certain losses realized after October 31 may be deferred and treated as occurring on the first day of the following fiscal year. As of September 30, 2008, post-October capital losses of $12,776,596 attributed to security transactions were deferred to October 1, 2008.
Under Financial Accounting Standards Board (“FASB”) Interpretation No. 48, Accounting for Uncertainty in Income Taxes, an Interpretation of FASB Statement No. 109 (“FIN 48”) management determines whether a tax position of the Fund is more likely than not to be sustained upon examination by the applicable taxing authority, including resolution of any related appeals or litigation processes, based on the technical merits of the position. The tax benefit to be recognized is measured as the largest amount of benefit that is greater than fifty percent likely of being realized upon ultimate settlement. Management has evaluated the known implications of FIN 48 on its computation of net assets for the Fund. As a result of this evaluation, management has concluded that FIN 48 did not have any effect on the Fund’s financial statements. However, management’s conclusions regarding FIN 48 may be subject to review and adjustment at a later date based on factors including, but not limited to, further implementation guidance from the FASB, new tax laws, regulations, and administrative interpretations (including relevant court decisions). The Fund’s federal tax returns for the prior three fiscal years remain subject to examination by the Internal Revenue Service. The Fund is not aware of any tax positions for which it is reasonably possible that the total amounts of unrecognized tax benefits will significantly change in the next twelve months.
Note 4. Fees and Compensation Paid to Affiliates
Investment Advisory Fee
Columbia, an indirect, wholly owned subsidiary of Bank of America Corporation (“BOA”), provides investment advisory services to the Fund. In rendering investment advisory services to the Fund, Columbia may use the portfolio management and research resources of Columbia Management, Pte. Ltd., an affiliate of Columbia. Columbia receives a monthly investment advisory fee based on the Fund’s average daily net asset at the following annual rates:
| | |
| | | |
| Average Daily Net Assets | | Annual Fee Rate |
First $1 billion | | 0.55% |
$1 billion to $1.5 billion | | 0.50% |
Over $1.5 billion | | 0.45% |
For the year ended September 30, 2008, the Fund’s effective investment advisory fee rate was 0.55% of the Fund’s average daily net assets.
Sub-Advisory Fee
Nordea Investment Management North America, Inc. (“NIMNAI”) has been retained by Columbia to serve as the investment sub-advisor and to manage a portion of the Fund’s assets. As the sub-advisor, NIMNAI is responsible for daily investment operations, including placing all orders for the purchase and sale of portfolio securities for foreign stocks of the Fund. Columbia, from the investment advisory fee it receives, pays NIMNAI a monthly sub-advisory fee.
Pricing and Bookkeeping Fees
The Fund has entered into a Financial Reporting Services Agreement (the “Financial Reporting Services Agreement”) with State Street Bank & Trust Company (“State Street”) and Columbia pursuant to which State Street provides financial reporting services to the Fund. The Fund has also entered into an Accounting Services Agreement (collectively with the Financial Reporting Services Agreement, the “State Street Agreements”) with State Street and Columbia pursuant to which State Street provides accounting services to the Fund. Under the State Street Agreements, the Fund pays State Street an annual fee of $38,000 paid monthly plus an additional monthly fee based on an annualized percentage rate of average daily net assets of the Fund for the month. The aggregate fee will not exceed $140,000 per year (exclusive of out-of-pocket expenses and charges). The Fund also reimburses State Street for certain out-of-pocket expenses and charges.
The Fund has entered into a Pricing and Bookkeeping Oversight and Services Agreement (the “Services Agreement”) with Columbia. Under the Services Agreement, Columbia provides services related to Fund expenses and the requirements of the Sarbanes-Oxley Act of 2002, and provides oversight of the accounting and financial reporting services provided by State Street. Under the Services Agreement, the
38
Columbia Liberty Fund
September 30, 2008
Fund reimburses Columbia for out-of-pocket expenses. Prior to January 1, 2008, the Fund also reimbursed Columbia for accounting oversight services, services related to Fund expenses and the requirements of the Sarbanes-Oxley Act of 2002.
For the year ended September 30, 2008, the amount charged to the Fund by affiliates included in the Statement of Operations under “Pricing and bookkeeping fees” aggregated to $3,106.
Transfer Agent Fee
Columbia Management Services, Inc. (the “Transfer Agent”), an affiliate of Columbia and an indirect, wholly owned subsidiary of BOA, provides shareholder services to the Fund and has contracted with Boston Financial Data Services (“BFDS”) to serve as sub-transfer agent. The Transfer Agent is entitled to receive a fee for its services, paid monthly, at the annual rate of $17.34 per open account plus reimbursement of certain sub-transfer agent fees paid by the Transfer Agent (exclusive of BFDS fees), calculated based on assets held in omnibus accounts and intended to recover the cost of payments to other parties (including affiliates of BOA) for services to those accounts. Prior to November 1, 2007, the annual rate was $17.00 per open account. The Transfer Agent pays the fees of BFDS for services as sub-transfer agent and is not entitled to reimbursement for such fees from the Fund. The Transfer Agent may also retain, as additional compensation for its services, fees for wire, telephone and redemption orders, IRA trustee agent fees and account transcript fees due to the Transfer Agent from shareholders of the Fund and credits (net of bank charges) earned with respect to balances in accounts the Transfer Agent maintains in connection with its services to the Fund. The Transfer Agent also receives reimbursement for certain out-of-pocket expenses.
An annual minimum account balance fee of $20 may apply to certain accounts with a value below the Fund’s initial minimum investment requirements to reduce the impact of small accounts on transfer agent fees. These minimum account balance fees are recorded as part of expense reductions on the Statement of Operations. For the year ended September 30, 2008, these minimum account balance fees reduced total expenses by $25,339.
Underwriting Discounts, Service and Distribution Fees
Columbia Management Distributors, Inc. (the “Distributor”), an affiliate of Columbia and an indirect, wholly owned subsidiary of BOA, is the principal underwriter of the Fund’s shares. For the year ended September 30, 2008, the Distributor has retained net underwriting discounts of $14,466 on sales of the Fund’s Class A shares and net CDSC fees of $316, $30,876 and $798 on Class A, Class B and Class C share redemptions, respectively.
The Fund has adopted Rule 12b-1 plans (the “Plans”) for Class A, Class B and Class C shares, which require the payment of a monthly service fee to the Distributor. The annual service fee portion of the Plans may equal up to 0.15% net assets attributable to shares issued prior to April 1, 1989 and 0.25% on net assets attributable to shares issued thereafter. This arrangement results in a rate of service fee for all shares that is a blend between the 0.15% and 0.25% annual rates. For the year ended September 30, 2008, the Class A, Class B and Class C shares’ effective service fee rate was 0.24%.
The Plans also requires the payment of a monthly distribution fee to the Distributor at the annual rate of 0.75% of the average daily net assets attributable to Class B and Class C shares only.
The CDSC and the distribution fees received from the Plans are used principally as repayment to the Distributor for amounts paid by the Distributor to dealers who sold such shares.
Fees Paid to Officers and Trustees
All officers of the Fund are employees of Columbia or its affiliates and, with the exception of the Fund’s Chief Compliance Officer, receive no compensation from the Fund. The Board of Trustees has appointed a Chief Compliance Officer to the Fund in accordance with federal securities regulations. The Fund, along with other affiliated funds, pays its pro-rata share of the expenses associated with the Chief Compliance Officer. The Fund’s expenses for the Chief Compliance Officer will not exceed $15,000 per year.
The Trust’s eligible Trustees may participate in a deferred compensation plan which may be terminated at any time. Obligations of the plan will be paid solely out of the Fund’s assets.
39
Columbia Liberty Fund
September 30, 2008
Note 5. Custody Credits
The Fund has an agreement with its custodian bank under which custody fees may be reduced by balance credits. These credits are recorded as part of expense reductions on the Statement of Operations. The Fund could have invested a portion of the assets utilized in connection with the expense offset arrangement in an income-producing asset if it had not entered into such an agreement.
For the year ended September 30, 2008, these custody credits reduced total expenses by $6,237 for the Fund.
Note 6. Portfolio Information
For the year ended September 30, 2008, the cost of purchases and proceeds from sales of securities, excluding short-term obligations, were $436,185,384 and $484,339,833, respectively, of which $54,107,803 and $69,306,118, respectively, were U.S. Government securities.
Note 7. Line of Credit
The Fund and other affiliated funds participate in a $350,000,000 committed, unsecured revolving line of credit and a $150,000,000 uncommitted, unsecured line of credit, both provided by State Street. Borrowings are available for short-term liquidity or temporary or emergency purposes.
Interest on the committed line of credit is charged to each participating fund based on the fund’s borrowings at a rate per annum equal to the Federal Funds Rate plus 0.50%. In addition, a commitment fee of 0.10% per annum is accrued and apportioned among the participating funds. Interest on the uncommitted line of credit is charged to each participating fund based on the fund’s borrowings at a rate per annum equal to the Federal Funds Rate plus 0.375%. State Street charges an annual operations agency fee of $40,000 for the committed line of credit and may charge an annual administration fee of $15,000 for the uncommitted line of credit. The commitment fee, the operations agency fee and the administration fee are accrued and apportioned among the participating funds pro rata based on their relative net assets.
For the year ended September 30, 2008, the average daily loan balance outstanding on days where borrowing existed was $1,000,000 at a weighted average interest rate of 5.025%.
Note 8. Securities Lending
The Fund may lend its securities to certain approved brokers, dealers and other financial institutions. Each loan is collateralized by cash, in an amount at least equal to the market value of the securities loaned plus accrued income from the investment of collateral. The market value of the loaned securities is determined at the close of business of the Fund and any additional required collateral is delivered to the Fund on the next business day. The collateral received is invested and the income generated by the investment of the collateral, net of any fees remitted to State Street as the lending agent and borrower rebates, is paid to the Fund. Generally, in the event of borrower default, the Fund has the right to use the collateral to offset any losses incurred. In the event the Fund is delayed or prevented from exercising its right to dispose of the collateral, there may be a potential loss to the Fund. The Fund bears the risk of loss with respect to the investment of collateral.
Note 9. Shares of Beneficial Interest
As of September 30, 2008, 15.7% of the Fund’s shares outstanding were beneficially owned by one participant account over which BOA and/or its affiliates had either sole or joint investment discretion.
Subscription and redemption activity of this account may have a significant effect on the operations of the Fund.
Note 10. Significant Risks and Contingencies
Mortgage-Backed Securities Risk
The value of the mortgage-backed securities may be affected by changes in interest rates, factors concerning the interests in and structure of the issuer or the originator of the mortgages, the creditworthiness of the entities that provide any supporting letters of credit, surety bonds or other credit enhancements or the quality of the underlying assets or the market’s assessment thereof. Mortgage-backed securities are subject to prepayment risk, which is the possibility that the underlying mortgage may be refinanced or prepaid prior to maturity during periods of declining or low interest rates, causing the Fund to have to reinvest the money received in securities that have lower yields. In addition, the impact of prepayments on the value of mortgage-backed securities may be difficult to predict and may result in greater volatility.
40
Columbia Liberty Fund
September 30, 2008
Legal Proceedings
On February 9, 2005, Columbia Management Advisors, Inc. (which has since merged into Banc of America Capital Management, LLC (now named Columbia Management Advisors, LLC)) (“Columbia”) and Columbia Funds Distributor, Inc. (which has been renamed Columbia Management Distributors, Inc.) (the “Distributor”) (collectively, the “Columbia Group”) entered into an Assurance of Discontinuance with the New York Attorney General (“NYAG”) (the “NYAG Settlement”) and consented to the entry of a cease-and-desist order by the Securities and Exchange Commission (“SEC”) (the “SEC Order”) on matters relating to mutual fund trading.
Under the terms of the SEC Order, the Columbia Group agreed, among other things, to: pay $70 million in disgorgement and $70 million in civil money penalties; cease and desist from violations of the antifraud provisions and certain other provisions of the federal securities laws; maintain certain compliance and ethics oversight structures; retain an independent consultant to review the Columbia Group’s applicable supervisory, compliance, control and other policies and procedures; and retain an independent distribution consultant (see below). The Columbia Funds have also voluntarily undertaken to implement certain governance measures designed to maintain the independence of their boards of trustees. The NYAG Settlement also, among other things, requires Columbia and its affiliates to reduce management fees for certain Columbia Funds (including the former Nations Funds) and other mutual funds collectively by $32 million per year for five years, for a projected total of $160 million in management fee reductions.
Pursuant to the procedures set forth in the SEC Order, the $140 million in settlement amounts described above is being distributed in accordance with a distribution plan that was developed by an independent distribution consultant and approved by the SEC on April 6, 2007. Distributions under the distribution plan began in late June 2007.
A copy of the SEC Order is available on the SEC website at http://www.sec.gov. A copy of the NYAG Settlement is available as part of the Bank of America Corporation Form 8-K filing on February 10, 2005.
In connection with the events described above, various parties have filed suit against certain funds, the Trustees of the Columbia Funds, FleetBoston Financial Corporation and its affiliated entities and/or Bank of America and its affiliated entities.
On February 20, 2004, the Judicial Panel on Multidistrict Litigation transferred these cases and cases against other mutual fund companies based on similar allegations to the United States District Court in Maryland for consolidated or coordinated pretrial proceedings (the “MDL”). Subsequently, additional related cases were transferred to the MDL. On September 29, 2004, the plaintiffs in the MDL filed amended and consolidated complaints. One of these amended complaints is a putative class action that includes claims under the federal securities laws and state common law, and that names Columbia, the Distributor, the Trustees of the Columbia Funds, Bank of America Corporation and others as defendants. Another of the amended complaints is a derivative action purportedly on behalf of the Columbia Funds that asserts claims under federal securities laws and state common law.
On February 25, 2005, Columbia and other defendants filed motions to dismiss the claims in the pending cases. On March 1, 2006, for reasons stated in the court’s memoranda dated November 3, 2005, the U.S. District Court for the District of Maryland granted in part and denied in part the defendants’ motions to dismiss. The court dismissed all of the class action claims pending against the Columbia Funds Trusts. As to Columbia and the Distributor, the claims under the Securities Act of 1933, the claims under Sections 34(b) and 36(a) of the Investment Company Act of 1940 (“ICA”) and the state law claims were dismissed. The claims under Sections 10(b) and 20(a) of the Securities Exchange Act of 1934 and claims under Section 36(b) of the ICA were not dismissed.
On March 21, 2005, a purported class action was filed in Massachusetts state court alleging that certain conduct, including market timing, entitled Class B shareholders in certain Columbia funds to an exemption from contingent deferred sales charges upon early redemption (“the CDSC Lawsuit”). The CDSC Lawsuit was removed to federal court in Massachusetts and transferred to the MDL.
On September 14, 2007, the plaintiffs and the Columbia defendants named in the MDL, including the Columbia Funds, entered into a stipulation of settlement with respect to all Columbia-related claims in the MDL described above,
41
Columbia Liberty Fund
September 30, 2008
including the CDSC Lawsuit. The settlement is subject to court approval.
In 2004, the Columbia Funds’ adviser and distributor and certain affiliated entities and individuals were named as defendants in certain purported shareholder class and derivative actions making claims, including claims under the Investment Company and the Investment Advisers Acts of 1940 and state law. Certain Columbia Funds were named as nominal defendants. The suits allege, inter alia, that the fees and expenses paid by the funds are excessive and that the advisers and their affiliates inappropriately used fund assets to distribute the funds and for other improper purposes. On March 2, 2005, the actions were consolidated in the Massachusetts federal court as In re Columbia Entities Litigation. The plaintiffs filed a consolidated amended complaint on June 9, 2005. On November 30, 2005, the judge dismissed all claims by plaintiffs and entered final judgment in favor of the defendants. The plaintiffs appealed to the United States Court of Appeals for the First Circuit on December 30, 2005. A stipulation and settlement agreement dated January 19, 2007 was filed in the First Circuit on February 14, 2007, with a joint stipulation of dismissal and motion for remand to obtain district court approval of the settlement. That joint motion was granted and the appeal was dismissed. On March 6, 2007, the case was remanded to the District Court. The settlement, approved by the District Court on September 18, 2007, became effective October 19, 2007. Pursuant to the settlement, the funds’ adviser and/or its affiliates made certain payments, including plaintiffs’ attorneys’ fees and costs of notice to class members.
Note 11. Subsequent Event
On October 16, 2008 the uncommitted and committed lines of credit discussed in Note 7 were terminated and amended, respectively. The Fund and other affiliated funds participate in a $280,000,000 committed, unsecured revolving line of credit. The maximum amount that may be borrowed by any fund is limited to the lesser of $200,000,000 and the Fund’s borrowing limit set forth in the Fund’s registration statement. Interest is charge to each participating fund based on the fund’s borrowings at a rate per annum equal to the greater of the Federal Funds Rate plus 0.50% and the overnight LIBOR Rate plus 0.50%. In addition, an annual operations agency fee of $20,000, an amendment fee of 0.20% and a commitment fee of 0.12% per annum are accrued and apportioned among the participating funds pro rata based on their relative net assets.
42
Report of Independent Registered Public Accounting Firm
To the Trustees of the Columbia Funds Series Trust I and the Shareholders of Columbia Liberty Fund
In our opinion, the accompanying statement of assets and liabilities, including the investment portfolio, and the related statements of operations and of changes in net assets and the financial highlights present fairly, in all material respects, the financial position of Columbia Liberty Fund (the “Fund”) (a series of Columbia Funds Series Trust I), at September 30, 2008, the results of its operations for the year then ended, the changes in its net assets for each of the two years in the period then ended and the financial highlights for each of the five years in the period then ended, in conformity with accounting principles generally accepted in the United States of America. These financial statements and financial highlights (hereafter referred to as “financial statements”) are the responsibility of the Fund’s management. Our responsibility is to express an opinion on these financial statements based on our audits. We conducted our audits of these financial statements in accordance with the standards of the Public Company Accounting Oversight Board (United States). Those standards require that we plan and perform the audit to obtain reasonable assurance about whether the financial statements are free of material misstatement. An audit includes examining, on a test basis, evidence supporting the amounts and disclosures in the financial statements, assessing the accounting principles used and significant estimates made by management, and evaluating the overall financial statement presentation. We believe that our audits, which included confirmation of securities at September 30, 2008 by correspondence with the custodian and brokers, provide a reasonable basis for our opinion.
PricewaterhouseCoopers LLP
Boston, Massachusetts
November 21, 2008
43
Federal Income Tax Information (Unaudited) – Columbia Liberty Fund
For the fiscal year ended September 30, 2008, the Fund designates long-term capital gains of $3,260,358.
21.43% of the ordinary income distributed by the Fund, for the year ended September 30, 2008, qualifies for the corporate dividends received deduction.
For non-corporate shareholders, 26.86%, or the maximum amount allowable under the Jobs and Growth Tax Relief Reconciliation Act of 2003, of income distributed by the Fund for the period October 1, 2007 to September 30, 2008 may represent qualified dividend income. Final information will be provided in your 2008 Form 1099-DIV.
44
Fund Governance
The Trustees serve terms of indefinite duration. The names, addresses and ages of the Trustees and officers of the Funds in Columbia Funds Series Trust I, the year each was first elected or appointed to office, their principal business occupations during at least the last five years, the number of Funds overseen by each Trustee and other directorships they hold are shown below. Each officer listed below serves as an officer of each Fund in the Columbia Funds Complex.
Independent Trustees
| | |
Name, Address and Year of Birth,
Position with Funds, Year First
Elected or Appointed to Office | | Principal Occupation(s) During Past Five Years, Number of Funds in Columbia Funds
Complex Overseen by Trustee, Other Directorships Held |
| |
| John D. Collins (Born 1938) | | |
c/o Columbia Management Advisors, LLC One Financial Center Boston, MA 02111 Trustee1 (since 2007) | | Retired. Consultant, KPMG, LLP (accounting and tax firm) from July 1999 to June 2000; Partner, KPMG, LLP from March 1962 to June 1999. Oversees 80, Mrs. Fields Famous Brands LLC (consumer products); Suburban Propane Partners, L.P.; and Montpelier Re (underwriting firm) |
| |
| Rodman L. Drake (Born 1943) | | |
c/o Columbia Management Advisors, LLC One Financial Center Boston, MA 02111 Trustee1 (since 2007) | | Co-Founder of Baringo Capital LLC (private equity) since 2002; President, Continuation Investments Group, Inc. from 1997 to 2001. Oversees 80, Jackson Hewitt Tax Service Inc. (tax preparation services); Crystal Capital River Inc. (real estate investment trust); Student Loan Corporation (student loan provider); Celgene Corporation (global biotechnology company); Apex Silver Mines Ltd. (mining); and Hyperion Brookfield Total Return Fund, Inc. and Hyperion Brookfield Strategic Mortgage Income Fund, Inc. (exchange-traded funds) |
| |
| Douglas A. Hacker (Born 1955) | | |
c/o Columbia Management Advisors, LLC One Financial Center Boston, MA 02111 Trustee (since 1996) | | Independent business executive since May 2006; Executive Vice President–Strategy of United Airlines (airline) from December 2002 to May 2006; President of UAL Loyalty Services (airline marketing company) from September 2001 to December 2002; Executive Vice President and Chief Financial Officer of United Airlines from July 1999 to September 2001. Oversees 80, Nash Finch Company (food distributor); Aircastle Limited (aircraft leasing) |
| |
| Janet Langford Kelly (Born 1957) | | |
c/o Columbia Management Advisors, LLC One Financial Center Boston, MA 02111 Trustee (since 1996) | | Senior Vice President, General Counsel and Corporate Secretary, ConocoPhillips (integrated energy company) since September 2007; Deputy General Counsel–Corporate Legal Services, ConocoPhillips from August 2006 to August 2007; Partner, Zelle, Hofmann, Voelbel, Mason & Gette LLP (law firm) from March 2005 to July 2006; Adjunct Professor of Law, Northwestern University, from September 2004 to June 2006; Director, UAL Corporation (airline) from February 2006 to July 2006; Chief Administrative Officer and Senior Vice President, Kmart Holding Corporation (consumer goods), from September 2003 to March 2004; Executive Vice President–Corporate Development and Administration, General Counsel and Secretary, Kellogg Company (food manufacturer), from September 1999 to August 2003. Oversees 80, None |
45
Fund Governance (continued)
Independent Trustees (continued)
| | |
Name, Address and Year of Birth,
Position with Funds, Year First
Elected or Appointed to Office | | Principal Occupation(s) During Past Five Years, Number of Funds in Columbia Funds
Complex Overseen by Trustee, Other Directorships Held |
| |
| Charles R. Nelson (Born 1942) | | |
c/o Columbia Management Advisors, LLC One Financial Center Boston, MA 02111 Trustee (since 1981) | | Professor of Economics, University of Washington, since January 1976; Ford and Louisa Van Voorhis Professor of Political Economy, University of Washington, since September 1993; Director, Institute for Economic Research, University of Washington from September 2001 to June 2003; Adjunct Professor of Statistics, University of Washington, since September 1980; Associate Editor, Journal of Money Credit and Banking, since September 1993; Consultant on econometric and statistical matters. Oversees 80, None |
| |
| John J. Neuhauser (Born 1943) | | |
c/o Columbia Management Advisors, LLC One Financial Center Boston, MA 02111 Trustee (since 1985) | | President, Saint Michael’s College, since August 2007; University Professor, Boston College from November 2005 to August 2007; Academic Vice President and Dean of Faculties, Boston College from August 1999 to October 2005. Oversees 80, Liberty All-Star Equity Fund and Liberty All-Star Growth Fund, Inc. (closed-end funds) |
| |
| Jonathan Piel (Born 1938) | | |
c/o Columbia Management Advisors, LLC One Financial Center Boston, MA 02111 Trustee1 (since 2007) | | Cable television producer and website designer; The Editor, Scientific American from 1984 to 1994; Vice President, Scientific American, Inc., from 1984 to 1994; Member, Advisory Board, Stone Age Institute, Bloomington, Indiana (research institute that explores the effect of technology on human evolution); Member, Board of Directors of the National Institute of Social Sciences, New York City; and Member, Board of Trustees of the William Alanson White Institute, New York City (institution for training psychoanalysts). Oversees 80, None |
| |
| Patrick J. Simpson (Born 1944) | | |
c/o Columbia Management Advisors, LLC One Financial Center Boston, MA 02111 Trustee (since 2000) | | Partner, Perkins Coie LLP (law firm). Oversees 80, None |
| |
| Thomas C. Theobald (Born 1937) | | |
c/o Columbia Management Advisors, LLC One Financial Center Boston, MA 02111 Trustee and Chairman of the Board (since 1996) | | Partner and Senior Advisor, Chicago Growth Partners (private equity investing) since September 2004; Managing Director, William Blair Capital Partners (private equity investing) from September 1994 to September 2004. Oversees 80, Anixter International (network support equipment distributor); Ventas, Inc. (real estate investment trust); Jones Lang LaSalle (real estate management services); Ambac Financial Group (financial guaranty insurance) |
| |
| Anne-Lee Verville (Born 1945) | | |
c/o Columbia Management Advisors, LLC One Financial Center Boston, MA 02111 Trustee (since 1998) | | Retired since 1997 (formerly General Manager–Global Education Industry (from 1994 to 1997), President–Application Systems Division (from 1991 to 1994), Chief Financial Officer–US Marketing & Services (from 1988 to 1991), and Chief Information Officer (from 1987 to 1988), IBM Corporation (computer and technology)). Oversees 80, None |
46
Fund Governance (continued)
Interested Trustee (continued)
| | |
Name, Address and Year of Birth,
Position with Funds, Year First
Elected or Appointed to Office | | Principal Occupation(s) During Past Five Years, Number of Funds in Columbia Funds
Complex Overseen by Trustee, Other Directorships Held |
| |
| William E. Mayer (Born 1940) | | |
c/o Columbia Management Advisors, LLC One Financial Center Boston, MA 02111 Trustee2 (since 1994) | | Partner, Park Avenue Equity Partners (private equity) since February 1999; Dean and Professor, College of Business, University of Maryland from 1992 to 1997. Oversees 80, Lee Enterprises (print media), WR Hambrecht + Co. (financial service provider); BlackRock Kelso Capital Corporation (investment company) |
1 | Messrs. Drake, Piel and Collins have served as directors/trustees of the Excelsior Funds since 1996, 1996 and 2005, respectively. The Excelsior Funds consisted of 27 portfolios managed by affiliates of Columbia Management Advisors, LLC. Effective December 12, 2007, the Board elected Messrs. Drake, Piel and Collins as Trustees of the Trust. |
2 | Mr. Mayer is an “interested person” (as defined in the Investment Company Act of 1940) by reason of his affiliation with WR Hambrecht + Co., a registered broker/dealer that may execute portfolio transactions for or engage in principal transactions with the Funds or other funds or accounts advised/managed by the Advisor or other Bank of America affiliates. |
The Statement of Additional Information includes additional information about the Trustees of the Funds and is available, without charge, upon request by calling 1-800-345-6611.
47
Fund Governance (continued)
Officers
| | |
Name, Address and Year of Birth,
Position with Columbia Funds, Year
First Elected or Appointed to Office | | Principal Occupation(s) During Past Five Years |
| |
| Christopher L. Wilson (Born 1957) | | |
One Financial Center Boston, MA 02111 President (since 2004) | | President–Columbia Funds, since October 2004; Managing Director–Columbia Management Advisors, LLC, since September 2005; Senior Vice President–Columbia Management Distributors, Inc., since January 2005; Director–Columbia Management Services, Inc., since January 2005; Director–Bank of America Global Liquidity Funds, plc and Banc of America Capital Management (Ireland), Limited, since May 2005; Director–FIM Funding, Inc., since January 2005; President and Chief Executive Officer–CDC IXIS AM Services, Inc. (investment management), from September 1998 through August 2004; and a senior officer or director of various other Bank of America affiliated entities, including other registered and unregistered funds. |
| |
| James R. Bordewick, Jr. (Born 1959) | | |
One Financial Center Boston, MA 02111 Senior Vice President, Secretary and Chief Legal Officer (since 2006) | | Associate General Counsel, Bank of America since April 2005; Senior Vice President and Associate General Counsel, MFS Investment Management (investment management) prior to April 2005. |
| |
| J. Kevin Connaughton (Born 1964) | | |
One Financial Center Boston, MA 02111 Senior Vice President and Chief Financial Officer (since 2000) | | Managing Director of Columbia Management Advisors, LLC since December 2004; Treasurer–Columbia Funds, from October 2003 to May 2008; Treasurer–the Liberty Funds, Stein Roe Funds and Liberty All-Star Funds, December 2000–December 2006; Senior Vice President–Columbia Management Advisors, LLC, from April 2003 to December 2004; President–Columbia Funds, Liberty Funds and Stein Roe Funds, February 2004 to October 2004; Treasurer–Galaxy Funds, September 2002 to December 2005; Treasurer, December 2002 to December 2004, and President, February 2004 to December 2004–Columbia Management Multi-Strategy Hedge Fund, LLC; and a senior officer of various other Bank of America-affiliated entities, including other registered and unregistered funds. |
| |
| Linda J. Wondrack (Born 1964) | | |
One Financial Center Boston, MA 02111 Senior Vice President and Chief Compliance Officer (since 2007) | | Director (Columbia Management Group LLC and Investment Product Group Compliance), Bank of America since June 2005; Director of Corporate Compliance and Conflicts Officer, MFS Investment Management (investment management), August 2004 to May 2005; Managing Director, Deutsche Asset Management (investment management) prior to August 2004. |
| |
| Michael G. Clarke (Born 1969) | | |
One Financial Center Boston, MA 02111 Treasurer (since 2008) | | Director of Fund Administration of the Advisor since January 2006; Managing Director of the Advisor September 2004 to December 2005; Vice President Fund Administration June 2002 to September 2004. |
| |
| Jeffrey R. Coleman (Born 1969) | | |
One Financial Center Boston, MA 02111 Deputy Treasurer (since 2006) | | Director of Fund Administration of the Advisor since January 2006; Fund Controller of the Advisor from October 2004 to January 2006; Vice President of CDC IXIS Asset Management Services, Inc. (investment management) from August 2000 to September 2004. |
48
Fund Governance (continued)
Officers (continued)
| | |
Name, Address and Year of Birth,
Position with Columbia Funds, Year
First Elected or Appointed to Office | | Principal Occupation(s) During Past Five Years |
| |
| Joseph F. DiMaria (Born 1968) | | |
One Financial Center Boston, MA 02111 Chief Accounting Officer (since 2008) | | Director of Fund Administration of the Advisor since January 2006; Head of Tax/Compliance and Assistant Treasurer of the Advisor from November 2004 to December 2005; Director of Trustee Administration (Sarbanes-Oxley) of the Advisor from May 2003 to October 2004. |
| |
| Julian Quero (Born 1967) | | |
One Financial Center Boston, MA 02111 Deputy Treasurer (since 2008) | | Senior Tax Manager of the Advisor since August 2006; Senior Compliance Manager of the Advisor from April 2002 to August 2006. |
| |
| Barry S. Vallan (Born 1969) | | |
One Financial Center Boston, MA 02111 Controller (since 2006) | | Vice President–Fund Treasury of the Advisor since October 2004; Vice President–Trustee Reporting of the Advisor from April 2002 to October 2004 |
49
[THIS PAGE INTENTIONALLY LEFT BLANK]
50
[THIS PAGE INTENTIONALLY LEFT BLANK]
51
[THIS PAGE INTENTIONALLY LEFT BLANK]
52
Important Information About This Report
Transfer Agent
Columbia Management Services, Inc.
P.O. Box 8081
Boston, MA 02266-8081
1-800-345-6611
Distributor
Columbia Management
Distributors, Inc.
One Financial Center
Boston, MA 02111
Investment Advisor
Columbia Management Advisors, LLC
100 Federal Street
Boston, MA 02110
The fund mails one shareholder report to each shareholder address. If you would like more than one report, please call shareholder services at 1-800-345-6611 and additional reports will be sent to you. This report has been prepared for shareholders of Columbia Liberty Fund.
A description of the policies and procedures that the fund uses to determine how to vote proxies and a copy of the fund’s voting records are available (i) at www.columbiamanagement.com; (ii) on the Securities and Exchange Commission’s website at www.sec.gov; and (iii) without charge, upon request, by calling 1-800-368-0346. Information regarding how the fund voted proxies relating to portfolio securities during the 12-month period ended June 30 is available from the SEC’s website. Information regarding how the fund voted proxies relating to portfolio securities is also available from the fund’s website, www.columbiamanagement.com.
The fund files a complete schedule of portfolio holdings with the SEC for the first and third quarters of each fiscal year on Form N-Q. The fund’s Form N-Q is available on the SEC’s website at www.sec.gov and may be reviewed and copied at the SEC’s Public Reference Room in Washington, D.C. Information on the operation of the Public Reference Room may be obtained by calling 1-800-SEC-0330.
Please read and consider the investment objectives, risks, charges and expenses for any fund carefully before investing. For a prospectus which contains this and other important information about the fund, contact your Columbia Management representative or financial advisor or go to www.columbiafunds.com.
Columbia Management Group, LLC (“Columbia Management”) is the investment management division of Bank of America Corporation. Columbia Management entities furnish investment management services and products for institutional and individual investors. Columbia Funds are distributed by Columbia Management Distributors, Inc., member of FINRA, SIPC, part of Columbia Management and an affiliate of Bank of America Corporation.
53

Columbia Liberty Fund
Annual Report, September 30, 2008
©2008 Columbia Management Distributors, Inc.
One Financial Center, Boston, MA 02111-2621
800.345.6611 www.columbiafunds.com
SHC-42/156366-0908 (11/08) 08/63251
Item 2. Code of Ethics.
(a) The registrant has, as of the end of the period covered by this report, adopted a code of ethics that applies to the registrant’s principal executive officer, principal financial officer, principal accounting officer or controller, or persons performing similar functions, regardless of whether these individuals are employed by the registrant or a third party.
(b) During the period covered by this report, there were not any amendments to a provision of the code of ethics adopted in 2(a) above.
(c) During the period covered by this report, there were no waivers, including any implicit waivers, from a provision of the code of ethics described in 2(a) above that relates to one or more of the items set forth in paragraph (b) of this item’s instructions.
Item 3. Audit Committee Financial Expert.
The registrant’s Board of Trustees has determined that Douglas A. Hacker, John D. Collins and Anne-Lee Verville, each of whom are members of the registrant’s Board of Trustees and Audit Committee, each qualify as an audit committee financial expert. Mr. Hacker, Mr. Collins and Ms. Verville are each independent trustees, as defined in paragraph (a)(2) of this item’s instructions.
Item 4. Principal Accountant Fees and Services.
Fee information below is disclosed for the seven series of the registrant whose reports to stockholders are included in this annual filing. Fee information for fiscal year ended September 30, 2008 also includes fees for one series that was merged into the registrant during the period.
(a) Audit Fees. Aggregate Audit Fees billed by the principal accountant for professional services rendered during the fiscal years ended September 30, 2008 and September 30, 2007 are approximately as follows:
2008 | | 2007 | |
$ | 238,500 | | $ | 222,200 | |
| | | | | |
Audit Fees include amounts related to the audit of the registrant’s annual financial statements or services that are normally provided by the accountant in connection with statutory and regulatory filings or engagements for those fiscal years.
(b) Audit-Related Fees. Aggregate Audit-Related Fees billed to the registrant by the principal accountant for professional services rendered during the fiscal years ended September 30, 2008 and September 30, 2007 are approximately as follows:
2008 | | 2007 | |
$ | 44,000 | | $ | 30,800 | |
| | | | | |
Audit-Related Fees include amounts for assurance and related services by the principal accountant that are reasonably related to the performance of the audit of the registrant’s financial statements and are not reported in Audit Fees above. In both fiscal years 2008 and 2007, Audit-Related Fees consist of agreed-upon procedures performed for semi-annual shareholder reports. Fiscal year 2008 also includes Audit-Related Fees for agreed-upon procedures related to a fund merger and a fund accounting and custody conversion.
During the fiscal years ended September 30, 2008 and September 30, 2007, there were no Audit-Related Fees billed by the registrant’s principal accountant to the registrant’s investment adviser (not including any sub-adviser whose role is primarily portfolio management and is subcontracted with or overseen by another investment adviser) and any entity controlling, controlled by, or under common control with the adviser that provides ongoing services to the registrant for an engagement that related directly to the operations and financial reporting of the registrant.
(c) Tax Fees. Aggregate Tax Fees billed by the principal accountant to the registrant for professional services rendered during the fiscal years ended September 30, 2008 and September 30, 2007 are approximately as follows:
2008 | | 2007 | |
$ | 64,000 | | $ | 44,200 | |
| | | | | |
Tax Fees include amounts for the review of annual tax returns, the review of required shareholder distribution calculations and typically include amounts for professional services by the principal accountant for tax compliance, tax advice and tax planning. Both fiscal years 2008 and 2007 also include tax fees for assistance with foreign tax filings. Fiscal year 2008 also includes tax fees for agreed-upon procedures related to a fund merger and the review of a final tax return.
During the fiscal years ended September 30, 2008 and September 30, 2007, there were no Tax Fees billed by the registrant’s principal accountant to the registrant’s investment adviser (not including any sub-adviser whose role is primarily portfolio management and is subcontracted with or overseen by another investment adviser) and any entity controlling, controlled by, or under common control with the adviser that provides ongoing services to the registrant for an engagement that related directly to the operations and financial reporting of the registrant.
(d) All Other Fees. Aggregate All Other Fees billed by the principal accountant to the registrant for professional services rendered during the fiscal years ended September 30, 2008 and September 30, 2007 are approximately as follows:
All Other Fees include amounts for products and services provided by the principal accountant, other than the services reported in paragraphs (a) through (c) above.
Aggregate All Other Fees billed by the registrant’s principal accountant to the registrant’s investment adviser (not including any sub-adviser whose role is primarily portfolio management and is subcontracted with or overseen by another investment adviser) and any entity controlling, controlled by, or under common control with the adviser that provides ongoing services to the registrant for an engagement that related directly to the operations and financial reporting of the registrant during the fiscal years ended September 30, 2008 and September 30, 2007 are approximately as follows:
2008 | | 2007 | |
$ | 1,096,300 | | $ | 1,308,500 | |
| | | | | |
In both fiscal years 2008 and 2007, All Other Fees consist of fees billed for internal control examinations of the registrant’s transfer agent and investment advisor.
(e)(1) Audit Committee Pre-Approval Policies and Procedures
The registrant’s Audit Committee is required to pre-approve the engagement of the registrant’s independent accountants to provide audit and non-audit services to the registrant and non-audit services to its investment adviser (not including any sub-adviser whose role is primarily portfolio management and is subcontracted with or overseen by another investment adviser) or any entity controlling, controlled by or under common control with such investment adviser that provides ongoing services to the registrant (“Adviser Affiliates”), if the engagement relates directly to the operations and financial reporting of the registrant.
The Audit Committee has adop ted a Policy for Engagement of Independent Accountants for Audit and Non-Audit Services (“Policy”). The Policy sets forth the understanding of the Audit Committee regarding the engagement of the registrant’s independent accountants to provide (i) audit and permissible audit-related, tax and other services to the registrant (collectively “Fund Services”); (ii) non-audit services to the registrant’s investment adviser (not including any sub-adviser whose role is primarily portfolio management and is subcontracted with or overseen by another investment adviser) and Adviser Affiliates, if the engagement relates directly to the operations or financial reporting of a Fund (collectively “Fund-related Adviser Services”); and (iii) certain other audit and non-audit services to the registrant’s investment adviser (not including any sub-adviser whose role is primarily portfolio management and is
subcontracted with or overseen by another investment adviser) and Adviser Affiliates. Unless a type of service receives general pre-approval under the Policy, it requires specific pre-approval by the Audit Committee if it is to be provided by the independent accountants. Pre-approval of non-audit services to the registrant, the registrant’s investment adviser (not including any sub-adviser whose role is primarily portfolio management and is subcontracted with or overseen by another investment adviser) and Adviser Affiliates may be waived provided that the “de minimis” requirements set forth under paragraph (c)(7)(i)(C) of Rule 2-01 of Regulation S-X are met.
Under the Policy, the Audit Committee may delegate pre-approval authority to any pre-designated member or members who are Independent Trustees/Directors. The member(s) to whom such authority is delegated must report, for informational purposes only, any pre-approval decisions to the Audit Committee at its next regular meeting. The Audit Committee’s responsibilities with respect to the pre-approval of services performed by the independent accountants may not be delegated to management.
The Policy requires the Fund Treasurer and/or Director of Board Administration to submit to the Audit Committee, on an annual basis, a schedule of the types of services that are subject to general pre-approval. The schedule(s) provide a description of each type of service that is subject to general pre-approval and, where possible, will provide estimated fee caps for each instance of providing each service. The Audit Committees will review and approve the types of services and review the projected fees for the next fiscal year and may add to, or subtract from, the list of general pre-approved services from time to time based on subsequent determinations. That approval acknowledges that the Audit Committee is in agreement with the specific types of services that the independent accountants will be permitted to perform.
The Fund Treasurer and/or Director of Board Administration shall report to the Audit Committee at each of its regular meetings regarding all Fund Services or Fund-related Adviser Services initiated since the last such report was rendered, including a general description of the services, actual billed and projected fees, and the means by which such Fund Services or Fund-related Adviser Services were pre-approved by the Audit Committee.
*****
(e)(2) The percentage of services described in paragraphs (b) through (d) of this Item approved pursuant to the “de minimis” exception under paragraph (c)(7)(i)(C) of Rule 2-01 of Regulation S-X during both fiscal years ended September 30, 2008 and September 30, 2007 was zero.
(f) Not applicable.
(g) The aggregate non-audit fees billed by the registrant’s accountant for services rendered to the registrant, and rendered to the registrant’s investment adviser (not including any sub-adviser whose role is primarily portfolio management and is
subcontracted with or overseen by another investment adviser), and any entity controlling, controlled by, or under common control with the adviser that provides ongoing services to the registrant for the fiscal years ended September 30, 2008 and September 30, 2007 are approximately as follows:
2008 | | 2007 | |
$ | 1,204,300 | | $ | 1,383,500 | |
| | | | | |
(h) The registrant’s Audit Committee of the Board of Directors has considered whether the provision of non-audit services that were rendered to the registrant’s adviser (not including any sub-adviser whose role is primarily portfolio management and is subcontracted with or overseen by another investment adviser), and any entity controlling, controlled by, or under common control with the investment adviser that provides ongoing services to the registrant that were not pre-approved pursuant to paragraph (c)(7)(ii) of Rule 2-01 of Regulation S-X, is compatible with maintaining the principal accountant’s independence.
Item 5. Audit Committee of Listed Registrants.
Not applicable.
Item 6. Investments
(a) The registrant’s “Schedule I – Investments in securities of unaffiliated issuers” (as set forth in 17 CFR 210.12-12) is included in Item 1 of this Form N-CSR.
(b) Not applicable.
Item 7. Disclosure of Proxy Voting Policies and Procedures for Closed-End Management Investment Companies.
Not applicable.
Item 8. Portfolio Managers of Closed-End Management Investment Companies.
Not applicable.
Item 9. Purchases of Equity Securities by Closed-End Management Investment Company and Affiliated Purchasers.
Not applicable.
Item 10. Submission of Matters to a Vote of Security Holders.
There have not been any material changes to the procedures by which shareholders may recommend nominees to the registrant’s board of directors, since those procedures were
last disclosed in response to requirements of Item 407(c)(2)(iv) of Regulation S-K (as required by Item 22(b)(15) of Schedule 14A) or this Item.
Item 11. Controls and Procedures.
(a) The registrant’s principal executive officer and principal financial officers, based on their evaluation of the registrant’s disclosure controls and procedures as of a date within 90 days of the filing of this report, have concluded that such controls and procedures are adequately designed to ensure that information required to be disclosed by the registrant in Form N-CSR is accumulated and communicated to the registrant’s management, including the principal executive officer and principal financial officer, or persons performing similar functions, as appropriate to allow timely decisions regarding required disclosure.
(b) There was no change in the registrant’s internal control over financial reporting that occurred during the registrant’s second fiscal quarter of the period covered by this report that has materially affected, or is reasonably likely to materially affect, the registrant’s internal control over financial reporting.
Item 12. Exhibits.
(a)(1) Code of ethics required to be disclosed under Item 2 of Form N-CSR attached hereto as Exhibit 99.CODE ETH.
(a)(2) Certifications pursuant to Rule 30a-2(a) under the Investment Company Act of 1940 (17 CFR 270.30a-2(a)) attached hereto as Exhibit 99.CERT.
(a)(3) Not applicable.
(b) Certification pursuant to Rule 30a-2(b) under the Investment Company Act of 1940 (17 CFR 270.30a-2(b)) attached hereto as Exhibit 99.906CERT.
SIGNATURES
Pursuant to the requirements of the Securities Exchange Act of 1934 and the Investment Company Act of 1940, the registrant has duly caused this report to be signed on its behalf by the undersigned, thereunto duly authorized.
(registrant) | | Columbia Funds Series Trust I | |
| | |
| | |
By (Signature and Title) | | /s/ Christopher L. Wilson | |
| | Christopher L. Wilson, President | |
| | | |
| | | |
Date | | November 26, 2008 | |
| | | | | |
Pursuant to the requirements of the Securities Exchange Act of 1934 and the Investment Company Act of 1940, this report has been signed below by the following persons on behalf of the registrant and in the capacities and on the dates indicated.
By (Signature and Title) | | /s/ Christopher L. Wilson | |
| Christopher L. Wilson, President | |
| | |
| | |
Date | | November 26, 2008 | |
| | |
| | |
By (Signature and Title) | | /s/ J. Kevin Connaughton | |
| J. Kevin Connaughton, Chief Financial Officer | |
| | |
| | |
Date | | November 26, 2008 | |
| | | | |