UNITED STATES
SECURITIES AND EXCHANGE COMMISSION
Washington, D.C. 20549
FORM N-CSR
CERTIFIED SHAREHOLDER REPORT OF REGISTERED
MANAGEMENT INVESTMENT COMPANIES
| | |
Investment Company Act file number | | 811-4367 |
Columbia Funds Series Trust I
|
| (Exact name of registrant as specified in charter) |
| | |
| One Financial Center, Boston, Massachusetts | | 02111 |
| (Address of principal executive offices) | | (Zip code) |
James R. Bordewick, Jr., Esq.
Columbia Management Advisors, LLC
One Financial Center
Boston, MA 02111
|
| (Name and address of agent for service) |
Registrant’s telephone number, including area code: 1-617-426-3750
Date of fiscal year end: March 31
Date of reporting period: March 31, 2009
Form N-CSR is to be used by management investment companies to file reports with the Commission not later than 10 days after the transmission to stockholders of any report that is required to be transmitted to stockholders under Rule 30e-1 under the Investment Company Act of 1940 (17 CFR 270.30e-1). The Commission may use the information provided on Form N-CSR in its regulatory, disclosure review, inspection, and policymaking roles.
A registrant is required to disclose the information specified by Form N-CSR, and the Commission will make this information public. A registrant is not required to respond to the collection of information contained in Form N-CSR unless the Form displays a currently valid Office of Management and Budget (“OMB”) control number. Please direct comments concerning the accuracy of the information collection burden estimate and any suggestions for reducing the burden to Secretary, Securities and Exchange Commission, 450 Fifth Street, NW, Washington, DC 20549-0609. The OMB has reviewed this collection of information under the clearance requirements of 44 U.S.C. § 3507.
Item 1. Reports to Stockholders.

Annual Report
March 31, 2009
Columbia U.S. Treasury
Index Fund
| | |
| NOT FDIC INSURED | | May Lose Value |
| NOT BANK ISSUED | | No Bank Guarantee |
Table of contents
The views expressed in this report reflect the current views of the respective parties. These views are not guarantees of future performance and involve certain risks, uncertainties and assumptions that are difficult to predict so actual outcomes and results may differ significantly from the views expressed. These views are subject to change at any time based upon economic, market or other conditions and the respective parties disclaim any responsibility to update such views. These views may not be relied on as investment advice and, because investment decisions for a Columbia Fund are based on numerous factors, may not be relied on as an indication of trading intent on behalf of any particular Columbia Fund. References to specific securities should not be construed as a recommendation or investment advice.
President’s Message

Dear Shareholder:
Recent events have shown great volatility in the markets and uncertainty in the economy. During these challenging times, it becomes even more important to focus on long-term horizons and key investment tools that can help manage volatility. This may be the time to reflect on your investment goals and evaluate your portfolio to ensure you are positioned for any potential market rebound.
A long-term financial plan can serve as a road map and guide you through the necessary steps designed to meet your financial goals. Your financial plan should take into account your investment goals, time horizon, overall financial situation, risk tolerance and willingness to ride
out market volatility. Your investment professional can be a key resource as you work through this process. The knowledge and experience of an investment professional can help as you create or reevaluate your investment strategy.
The importance of diversification
Although diversification does not ensure a profit or guarantee against loss, a diversified portfolio can be a strategy for successful long-term investing. Diversification refers to the mix of investments within a portfolio. A mutual fund can contribute to portfolio diversification given that a mutual fund’s portfolio represents several investments. Additionally, the way you allocate your money among stocks, bonds and cash, and geographically between foreign and domestic investments, can help to reduce risks. Diversification can result in multiple investments where the positive performance of certain holdings can offset any negative performance from other holdings. Having a diversified portfolio doesn’t mean that the value of the portfolio will never go down, but rather helps strike a balance between risk and reward.
Reevaluate your strategy
An annual review of your investments is a key opportunity to determine if your investment needs have changed or if you need minor adjustments to rebalance your portfolio. Life events like a birth, marriage, home improvement, or change in employment can have a major affect on your spending and goals. Ask yourself how your spending or goals have changed and factor this into your financial plan. Are you using automated investments or payroll deductions to help keep your savings on track? Are you able to set aside additional savings or increase your 401(k) plan contributions? If during your review you find that your investments in any one category (e.g., stocks, bonds or cash) have grown too large based on your diversification plan, you may want to consider redirecting future investments to get back on track.
History has shown that the U.S. stock market has been remarkably resilient.¹ Volatility can lead to opportunity. Patience and a commitment to your long-term financial plan may position you to potentially benefit over your investment horizon. We appreciate your business and continued support of Columbia Funds.
Sincerely,

J. Kevin Connaughton
President, Columbia Funds
The board of trustees elected J. Kevin Connaughton president of Columbia Funds on January 16, 2009.
1 | The Dow Jones Industrial Average is the most widely used indicator of the overall condition of the stock market. The Dow Jones Industrial Average Index is a price-weighted average of 30 actively traded blue-chip stocks as selected by the editors of the Wall Street Journal. Indices are not available for investment, and do not reflect sales charges, fees, brokerage commissions, taxes or other expenses of investing. It is not possible to invest directly in an index. |
Fund Profile – Columbia U.S. Treasury Index Fund
Performance data quoted represents past performance and current performance may be lower or higher. Past performance is no guarantee of future results. The investment return and principal value will fluctuate so that shares, when redeemed, may be worth more or less than the original cost. Please visit www.columbiafunds.com for daily and most recent month-end performance updates.
Summary
1-year return as of 03/31/09
| | |
| |
 | | +7.13% Class A shares |
| | (without sales charge) |
| |
| | +7.50% Citigroup Bond U.S. Treasury Index |
Morningstar Style Box™
Fixed Income Maturity
The Morningstar Style Box™ reveals a fund’s investment strategy. For fixed-income funds, the vertical axis shows the average credit quality of the bonds owned, and the horizontal axis shows interest rate sensitivity as measured by a bond’s duration (short, intermediate or long). Information shown is based on the most recent data provided by Morningstar.
Summary
| n | | For the 12-month period that ended March 31, 2009, the fund’s Class A shares returned 7.13% without sales charge. |
| n | | U.S. Treasury securities were one of the best-performing asset classes in the capital markets during the reporting period. |
| n | | Aggressive action by the Federal Reserve Board led to lower short-term rates and resulted in strong performance by securities with shorter maturities. |
Portfolio Management
Jonathan P. Carlson has managed the fund since March 2008 and has been associated with the advisor or its predecessors or affiliate organizations since 2007.
The Citigroup Bond U.S. Treasury Index is composed of all US Treasury notes and bonds with remaining maturities of at least one year and outstanding principal of at least $25 million that are included in the Citigroup Broad Investment-Grade Bond Index. Securities in the Citigroup Bond U.S. Treasury Index are weighted by market value, that is, the price per bond or note multiplied by the number of bonds or notes outstanding. Indices are not available for investment, and do not reflect sales charges, fees, brokerage commissions, taxes or other expenses of investing. Securities in the fund may not match those in an index.
1
Economic Update – Columbia U.S. Treasury Index Fund
Economic growth ground to a halt during the 12-month period that began April 1, 2008 and ended March 31, 2009. The National Bureau of Economic Research reported that the U.S. economy had slipped into recession late in 2007 and the downturn was even sharper than anticipated.
A host of factors weighed on consumers and businesses alike. The most severe housing downturn in decades showed few signs of abating as inventories of homes for sale rose, home prices declined and tighter credit standards, the result of continued turmoil in the subprime mortgage market, made it more difficult for homebuyers to qualify for loans.
The labor market has contracted for 15 consecutive months, driving the unemployment rate to 8.5%. More than five million jobs have been lost since the recession commenced late in 2007, with nearly two-thirds of the decrease occurring in the most recent five months. Manufacturing activity slowed and consumer spending declined, resulting in one of the weakest holiday seasons in decades.
However, in March there were a few signs that this severe recession is no longer intensifying. Weekly chain store sales and mortgage purchase applications gained some momentum near the end of the period. The trade deficit has narrowed more than expected, raising hopes that first quarter real Gross Domestic Product will contract at a rate well below the fourth quarter’s negative 6.3%.
A weakening economy and turmoil in the financial markets took a toll on consumer confidence, which continued to set new all-time lows during the period. However, the monthly Conference Board gauge was nearly unchanged in March, another indication that the worst could be behind us. Consumer confidence is surveyed monthly by the Conference Board.
In an effort to restore confidence in the capital markets, loosen the reins on credit and shore up economic growth, the Federal Reserve Board (the Fed) brought a key short-term rate — the federal funds rate — down from 2.25% to a target between zero and 0.25% during the 12-month period — a record low. However, the Fed’s efforts went largely unrewarded. The one bright spot during this period of uncertainty was lower energy and commodity prices. With oil trading near $50 per barrel at the end of the period, gasoline prices have come down from $4 per gallon or more last summer to just over $2 per gallon in recent months.
Some bond sectors delivered positive returns
The U.S. bond market seesawed during the 12-month period, but several sectors managed to deliver modest gains as investors sought refuge from the volatile stock market. Treasury prices rose and yields declined as the economy faltered and stock market volatility increased. The benchmark 10-year U.S. Treasury yield ended the period at 2.70%. In this environment, the Barclays Capital U.S. Aggregate Bond Index returned 3.13%. High-yield bond prices fell sharply as economic prospects weakened and default fears rose. The Merrill Lynch U.S. High Yield, Cash Pay Index returned negative 19.95%. The municipal market suffered a setback early in 2008, then rebounded in the first quarter of 2009. The Barclays Capital Municipal Bond Index returned 2.27% for the 12-month period.
Summary
For the 12-month period that ended March 31, 2009
| | n | | Despite volatility in many segments of the bond market, the Barclays Capital U.S. Aggregate Bond Index delivered a modest gain. High-yield bonds lost ground, as measured by the Merrill Lynch U.S. High Yield, Cash Pay Index. Municipals recovered from an early setback, as measured by the Barclays Capital Municipal Bond Index. | |
| | |
| Barclays Aggregate Index | | Merrill Lynch Index |
| |

| | 
|
3.13% | | 19.95% |
| | |
| Barclays Municipal Index | | |
| |
| | |
2.27% | | |
| | n | | The broad U.S. stock market, as measured by the S&P 500 Index, returned negative 38.09%. Stock markets outside the United States returned negative 46.51%, as measured (in U.S. dollars) by the MSCI EAFE Index. | |
| | |
| S&P Index | | MSCI Index |
| |
| |
|
38.09% | | 46.51% |
The Standard & Poor’s (S&P) 500 Index tracks the performance of 500 widely held, large-capitalization US stocks.
The Morgan Stanley Capital International (MSCI) Europe, Australasia, Far East (EAFE) Index is a free float-adjusted market capitalization index that is designed to measure developed market equity performance, excluding the US and Canada.
2
Economic Update (continued) – Columbia U.S. Treasury Index Fund
Stocks retreated as economic outlook darkened
Against a weakening economic backdrop, the U.S. stock market lost 38.09% for the 12-month period, as measured by the S&P 500 Index. Losses affected the stocks of companies of all sizes and investment style categories, although growth stocks held up better than value stocks, as measured by their respective Russell indices.1 Stock markets outside the U.S. experienced even greater losses. The MSCI EAFE Index, a broad gauge of stock market performance in foreign developed markets, lost 46.51% (in U.S. dollars) for the period. Emerging stock markets, which generally have had a strong run over the past several years, were also caught in the downdraft. As investors backed away from risk, the MSCI Emerging Markets Index2 returned negative 47.07% (in U.S. dollars).
Past performance is no guarantee of future results.
1 | The Russell 1000 Growth Index measures the performance of those Russell 1000 Index companies with higher price-to-book ratios and higher forecasted growth values. The Russell 1000 Value Index measures the performance of those companies in the Russell 1000 Index with lower price-to-book ratios and lower forecasted growth values. The Russell 2000 Growth Index measures the performance of those Russell 2000 Index companies with higher price-to-book ratios and higher forecasted growth values. The Russell 2000 Value Index measures the performance of those Russell 2000 Index companies with lower price-to-book ratios and lower forecasted growth values. The Russell 3000 Growth Index measures the performance of those Russell 3000 Index companies with higher price-to book ratios and higher forecasted growth values. The Russell 3000 Value Index measures the performance of those Russell 3000 Index companies with lower price-to-book ratios and lower forecasted growth values. The Russell Midcap Growth Index measures the performance of those Russell Midcap companies with higher price-to-book ratios and higher forecasted growth values. The Russell Midcap Value Index measures the performance of those Russell Midcap Index companies with lower price-to-book ratios and lower forecasted growth values. |
2 | The MSCI Emerging Markets Index is a widely accepted index composed of a sample of companies from 25 countries representing the global emerging stock markets. |
Indices are not available for investment, and do not reflect sales charges, fees, brokerage commissions, taxes or other expenses of investing. Securities in the fund may not match those in an index.
The Barclays Capital U.S. Aggregate Bond Index (formerly the Lehman Brothers U.S. Aggregate Bond Index) is a market value-weighted index that tracks the daily price, coupon, pay-downs and total return performance of fixed-rate, publicly placed, dollar-denominated and non-convertible investment grade debt issues with at least $250 million par amount outstanding and with at least one year to final maturity.
The Merrill Lynch U.S. High Yield, Cash Pay Index tracks the performance of non-investment-grade corporate bonds. As of 01/01/2009, Merrill Lynch & Co., Inc. is a wholly owned subsidiary of Bank of America Corporation and an affiliate of Columbia Management.
The Barclays Capital Municipal Bond Index (formerly the Lehman Brothers Municipal Bond Index) is considered representative of the broad market for investment-grade, tax-exempt bonds with maturities of at least one year.
Indices are not available for investment, and do not reflect sales charges, fees, brokerage commissions, taxes or other expenses of investing. Securities in the fund may not match those in an index.
3
Performance Information – Columbia U.S. Treasury Index Fund
Performance data quoted represents past performance and current performance may be lower or higher. Past performance is no guarantee of future results. The investment return and principal value will fluctuate so that shares, when redeemed, may be worth more or less than the original cost. Please visit www.columbiafunds.com for daily and most recent month-end performance updates.
| | |
| Annual operating expense ratio (%)* |
| |
Class A | | 0.66 |
Class B | | 1.41 |
Class C | | 1.41 |
Class Z | | 0.41 |
| | |
Annual operating expense ratio
after contractual waivers (%)* |
| |
Class A | | 0.55 |
Class B | | 1.30 |
Class C | | 1.30 |
Class Z | | 0.30 |
| * | The annual operating expense ratio and annual operating expense ratio after contractual waivers are as stated in the fund’s prospectus that is current as of the date of this report. The contractual waiver expires 07/31/09. Differences in expense ratios disclosed elsewhere in this report may result from including fee waivers and expense reimbursements as well as different time periods used in calculating the ratios. |
|
| Performance of a $10,000 investment 04/01/99 – 03/31/09 |
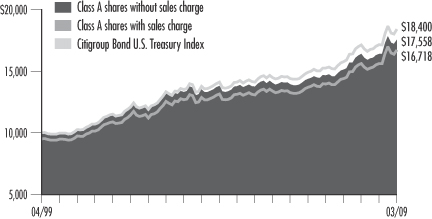
The chart above shows the change in value of a hypothetical $10,000 investment in Class A shares of Columbia U.S. Treasury Index Fund during the stated period, and does not reflect the deduction of taxes that a shareholder may pay on fund distributions or on the redemption of fund shares. The Citigroup Bond U.S. Treasury Index is composed of all US Treasury notes and bonds with remaining maturities of at least one year and outstanding principal of at least $25 million that are included in the Citigroup Broad Investment-Grade Bond Index. Securities in the Citigroup Bond U.S. Treasury Index are weighted by market value, that is, the price per bond or note multiplied by the number of bonds or notes outstanding. Indices are not available for investment, and do not reflect sales charges, fees, brokerage commissions, taxes or other expenses of investing. Securities in the fund may not match those in an index.
| | | | |
| Performance of a $10,000 investment 04/01/99 – 03/31/09 ($) |
| | |
| Sales charge | | without | | with |
Class A | | 17,558 | | 16,718 |
Class B | | 16,747 | | 16,747 |
Class C | | 16,903 | | 16,903 |
Class Z | | 17,830 | | n/a |
| | | | |
| Average annual total return as of 03/31/09 (%) |
| | | | | | | | | | | | | | |
| | | | |
| Share class | | A | | B | | C | | Z |
| Inception | | 11/25/02 | | 11/25/02 | | 11/25/02 | | 06/04/91 |
| Sales charge | | without | | with | | without | | with | | without | | with | | without |
1-year | | 7.13 | | 2.05 | | 6.32 | | 1.32 | | 6.48 | | 5.48 | | 7.40 |
5-year | | 4.93 | | 3.91 | | 4.15 | | 3.81 | | 4.30 | | 4.30 | | 5.18 |
10-year | | 5.79 | | 5.27 | | 5.29 | | 5.29 | | 5.39 | | 5.39 | | 5.95 |
The “with sales charge” returns include the maximum initial sales charge of 4.75% for Class A shares and the applicable contingent deferred sales charge of 5.00% in the first year, declining to 1.00% in the sixth year and eliminated thereafter for Class B shares and 1.00% for Class C shares for the first year only. The “without sales charge” returns do not include the effect of sales charges. If they had, returns would be lower.
Performance results reflect any fee waivers or reimbursements of fund expenses by the investment advisor and/or any of its affiliates. Absent these fee waivers or expense reimbursement arrangements, performance results would have been lower.
All results shown assume reinvestment of distributions. Class Z shares are sold at net asset value with no distribution and service (Rule 12b-1) fees. Class Z shares have limited eligibility and the investment minimum requirements may vary. Please see the fund’s prospectus for details. Performance for different share classes will vary based on differences in sales charges and fees associated with each class.
Class A, Class B and Class C are newer classes of shares. Their performance information includes returns of the Trust shares of the Galaxy II U.S. Treasury Index Fund (the “Galaxy Fund”) for periods prior to November 25, 2002, the date on which Class A, Class B and Class C shares were initially offered by the Fund. The returns for Class Z shares include returns of Trust shares of the Galaxy Fund for periods prior to November 25, 2002, the date on which Class Z shares were initially offered by the Fund. The returns have not been restated to reflect any differences in expenses between the predecessor shares and the newer classes of shares. If differences in expenses had been reflected, the returns shown for periods prior to the inception of the newer classes of shares would have been lower. Trust shares of the Galaxy Fund were initially offered on June 4, 1991.
The tables do not reflect the deduction of taxes that a shareholder may pay on fund distributions or on the redemption of fund shares.
4
Understanding Your Expenses – Columbia U.S. Treasury Index Fund
Estimating your actual expenses
To estimate the expenses that you paid over the period, first you will need your account balance at the end of the period:
| | n | | For shareholders who receive their account statements from Columbia Management Services, Inc., your account balance is available online at www.columbiafunds.com or by calling Shareholder Services at 800.345.6611. | |
| | n | | For shareholders who receive their account statements from their financial intermediary, contact your financial intermediary to obtain your account balance. | |
| | 1. | Divide your ending account balance by $1,000. For example, if an account balance was $8,600 at the end of the period, the result would be 8.6. | |
| | 2. | In the section of the table below titled “Expenses paid during the period,” locate the amount for your share class. You will find this number in the column labeled “Actual.” Multiply this number by the result from step 1. Your answer is an estimate of the expenses you paid on your account during the period. | |
If the value of your account falls below the minimum initial investment requirement applicable to you, your account generally will be subject to a $20 annual fee. This fee is not included in the accompanying table. If you are subject to the fee, keep it in mind when you are estimating the ongoing expenses of investing in the fund and when comparing the expenses of this fund with other funds.
As a fund shareholder, you incur two types of costs. There are transaction costs, which generally include sales charges on purchases and may include redemption fees or exchange fees. There are also ongoing costs, which generally include investment advisory fees, distribution and service (Rule 12b-1) fees and other fund expenses. The information on this page is intended to help you understand the ongoing costs of investing in the fund and to compare these costs with the ongoing costs of investing in other mutual funds.
Analyzing your fund’s expenses by share class
To illustrate these ongoing costs, we have provided an example and calculated the expenses paid by investors in each share class during the period. The information in the following table is based on an initial investment of $1,000, which is invested at the beginning of the period and held for the entire period. Expense information is calculated two ways and each method provides you with different information. The amount listed in the “Actual” column is calculated using the fund’s actual operating expenses and total return for the period. The amount listed in the “Hypothetical” column for each share class assumes that the return each year is 5% before expenses and is calculated based on the fund’s actual operating expenses. You should not use the hypothetical account values and expenses to estimate either your actual account balance at the end of the period or the expenses you paid during this period.
Compare with other funds
Since all mutual funds are required to include the same hypothetical calculations about expenses in shareholder reports, you can use this information to compare the ongoing costs of investing in the fund with other funds. To do so, compare the 5% hypothetical example with the 5% hypothetical examples that appear in the shareholder reports of other funds. As you compare hypothetical examples of other funds, it is important to note that hypothetical examples are meant to highlight the ongoing costs of investing in a fund and do not reflect any transaction costs, such as sales charges, redemption fees or exchange fees.
| | | | | | | | | | | | | | |
| | | Account value at the beginning of the period ($) | | Account value at the end of the period ($) | | Expenses paid during
the period ($) | | Fund’s annualized expense ratio (%) |
| | | Actual | | Hypothetical | | Actual | | Hypothetical | | Actual | | Hypothetical | | Actual |
Class A | | 1,000.00 | | 1,000.00 | | 1,070.71 | | 1,022.19 | | 2.84 | | 2.77 | | 0.55 |
Class B | | 1,000.00 | | 1,000.00 | | 1,066.62 | | 1,018.45 | | 6.70 | | 6.54 | | 1.30 |
Class C | | 1,000.00 | | 1,000.00 | | 1,067.41 | | 1,019.20 | | 5.93 | | 5.79 | | 1.15 |
Class Z | | 1,000.00 | | 1,000.00 | | 1,072.00 | | 1,023.44 | | 1.55 | | 1.51 | | 0.30 |
Expenses paid during the period are equal to the annualized expense ratio for the share class, multiplied by the average account value over the period, then multiplied by the number of days in the fund’s most recent fiscal half-year and divided by 365.
Had the investment advisor and/or any of its affiliates not waived fees or reimbursed a portion of expenses, account value at the end of the period would have been reduced.
It is important to note that the expense amounts shown in the table are meant to highlight only ongoing costs of investing in the fund and do not reflect any transaction costs, such as sales charges, redemption fees or exchange fees. Therefore, the hypothetical examples provided may not help you determine the relative total costs of owning shares of different funds. If these transaction costs were included, your costs would have been higher.
5
Portfolio Manager’s Report – Columbia U.S. Treasury Index Fund
Performance data quoted represents past performance and current performance may be lower or higher. Past performance is no guarantee of future results. The investment return and principal value will fluctuate so that shares, when redeemed, may be worth more or less than the original cost. Please visit www.columbiafunds.com for daily and most recent month-end performance updates.
| | |
| Net asset value per share |
| |
as of 03/31/09 ($) | | |
Class A | | 11.64 |
Class B | | 11.64 |
Class C | | 11.64 |
Class Z | | 11.64 |
| | |
| Distributions declared per share |
| |
04/01/08 – 03/31/09 ($) | | |
Class A | | 0.41 |
Class B | | 0.33 |
Class C | | 0.34 |
Class Z | | 0.44 |
For the 12-month period that ended March 31, 2009, the fund’s Class A shares returned 7.13% without sales charge. The fund’s Class Z shares returned 7.40%. The Citigroup Bond U.S. Treasury Index1 posted a total return of 7.50% over the same period. The fund incurs expenses while the index does not, and expenses generally accounted for the difference between the fund’s return and that of the index, although the fund made a small increment back through its profitable participation in a government securities lending program during the period.
The fund’s return was below the average return of the funds in its peer group, the Lipper General U.S. Treasury Funds Classification2, which was 9.06%. Some actively managed funds in the peer group opted to emphasize shorter maturities rather than mirror the index, and this strategy boosted returns.
During the past 12 months, U.S. Treasury securities easily outperformed all other segments within the domestic fixed-income markets. The single biggest reason for this outperformance was a flight-to-quality mindset triggered by a financial crisis that characterized the period. The fall of Bear Stearns, which was acquired by JPMorgan, occurred just prior to the beginning of the period and was followed six months later by the bankruptcy of Lehman Brothers. These highly publicized failures caused widespread concern about the viability of the collateral underlying financial assets, and investors responded by flocking to the safety of the Treasury market. Treasury yields were pushed to record lows compared to alternatives such as corporate bonds and most asset-backed securities — and Treasury prices rose.
In this ultra-cautious environment, lending was reduced to a standstill, liquidity all but dried up and the overall economy sank into recession. In response, policymakers at the Federal Reserve Board (the Fed) accelerated their campaign to bring short-term interest rates down. At the beginning of the period, the federal funds rate — an overnight intrabank lending rate that influences other short-term rates — stood at 2.25%. By the end of the year, the Fed had intervened a total of four times to lower this rate as far as it could go, to an unprecedented range of zero to 0.25%.
Holders of Treasury securities were the beneficiaries of this swift decline in rates, and longer-term Treasury securities returned the most to investors. Because the fund was positioned to track the index as closely as possible in terms of maturities and coupons, it did not produce excess returns.
Looking ahead
The federal government’s efforts to stimulate the economy did not end with the Fed. The Treasury initiated significant programs to encourage lending by bailing out or
1 | The Citigroup Bond U.S. Treasury Index is composed of all US Treasury notes and bonds with remaining maturities of at least one year and outstanding principal of at least $25 million that are included in the Citigroup Broad Investment-Grade Bond Index. Securities in the Citigroup Bond U.S. Treasury Index are weighted by market value, that is, the price per bond or note multiplied by the number of bonds or notes outstanding. Indices are not available for investment, and do not reflect sales charges, fees, brokerage commissions, taxes or other expenses of investing. Securities in the fund may not match those in an index. |
2 | Lipper Inc., a widely respected data provider in the industry, calculates an average total return (assuming reinvestment of distributions) for mutual funds with investment objectives similar to those of the fund. Lipper makes no adjustment for the effect of sales loads. |
6
Portfolio Manager’s Report (continued) – Columbia U.S. Treasury Index Fund
| | |
| Maturity breakdown |
| |
as of 03/31/09 (%) | | |
0–1 year | | 0.8 |
1–5 years | | 58.3 |
5–10 years | | 25.1 |
10–20 years | | 10.6 |
Over 20 years | | 5.2 |
| | |
| Asset allocation |
| |
as of 03/31/09 (%) | | |
Government obligations | | 99.8 |
Cash and equivalents | | 0.2 |
Maturity breakdown and asset allocation are calculated as a percentage of total investments, excluding securities lending collateral. The fund is actively managed and the composition of its portfolio will change over time.
propping up distressed financial institutions. While these programs have undoubtedly produced near-term benefits, they also come with a big price tag, and we will monitor their inflationary potential in the months ahead.
Portfolio holdings and characteristics are subject to change periodically and may not be representative of current holdings and characteristics. The outlook for the fund may differ from that presented for other Columbia Funds.
The value of the fund may be affected by interest rate changes and the creditworthiness of issuers held in the fund. When interest rates go up, bond prices typically drop, and vice versa.
The fund is subject to indexing risk. Your investment in the fund will typically decline in value when its index declines. Since the fund is designed to track its index before fees and expenses, the fund cannot purchase other securities that may help offset declines in its index. In addition, because the fund may not hold all the issues included in its index, may not always be fully invested and bears advisory, administrative and other expenses and transaction costs in trading securities, the fund’s performance may fail to match the performance of its index, after taking expenses into account. Security prices in a market, sector or industry may fall, reducing the value of your investment. Fund shares are not guaranteed or backed by the U.S. government or any agency.
7
Investment Portfolio – Columbia U.S. Treasury Index Fund
March 31, 2009
Government & Agency Obligations – 97.7%
| | | | | | |
| | | | | Par ($) | | Value ($) |
| U.S. Treasury Bonds – 18.2% | | | | | | |
| | 3.500% 02/15/ 39 | | 1,605,000 | | 1,585,949 |
| | 4.375% 02/15/38(a) | | 7,445,000 | | 8,457,058 |
| | 4.500% 02/15/36(a) | | 4,710,000 | | 5,426,806 |
| | 5.000% 05/15/37(a) | | 1,870,000 | | 2,326,396 |
| | 5.250% 02/15/29 | | 2,680,000 | | 3,300,168 |
| | 5.375% 02/15/31(a) | | 2,795,000 | | 3,523,883 |
| | 5.500% 08/15/28(a) | | 8,205,000 | | 10,354,964 |
| | 6.000% 02/15/26(a) | | 535,000 | | 704,863 |
| | 6.125% 11/15/27(a) | | 5,160,000 | | 6,936,975 |
| | 6.875% 08/15/25(a) | | 2,005,000 | | 2,874,043 |
| | 7.250% 08/15/22(a) | | 3,210,000 | | 4,534,125 |
| | 7.500% 11/15/16 | | 7,115,000 | | 9,552,442 |
| | 7.875% 02/15/21 | | 9,310,000 | | 13,500,952 |
| | 8.125% 08/15/21 | | 735,000 | | 1,092,508 |
| | 8.750% 05/15/17(a) | | 1,020,000 | | 1,471,350 |
| | |
| | U.S. Treasury Bonds Total | | | | 75,642,482 |
| | | | | | |
| U.S. Treasury Notes – 79.5% | | | | | | |
| | 0.875% 02/28/11(a) | | 11,000,000 | | 11,021,010 |
| | 1.250% 11/30/10 | | 6,000,000 | | 6,048,540 |
| | 1.375% 02/15/12(a) | | 13,000,000 | | 13,105,625 |
| | 1.750% 01/31/14(a) | | 16,605,000 | | 16,717,914 |
| | 1.875% 02/28/14(a) | | 10,000,000 | | 10,109,400 |
| | 2.000% 09/30/10 | | 12,175,000 | | 12,418,025 |
| | 2.000% 11/30/13(a) | | 5,015,000 | | 5,118,434 |
| | 2.375% 08/31/10(a) | | 11,520,000 | | 11,802,148 |
| | 2.500% 03/31/13(a) | | 6,390,000 | | 6,675,556 |
| | 2.625% 05/31/10 | | 7,000,000 | | 7,163,240 |
| | 2.750% 07/31/10 | | 10,315,000 | | 10,606,316 |
| | 2.875% 06/30/10 | | 3,085,000 | | 3,171,044 |
| | 2.875% 01/31/13(a) | | 7,100,000 | | 7,510,465 |
| | 3.125% 04/30/13(a) | | 960,000 | | 1,027,275 |
| | 3.125% 09/30/13(a) | | 14,305,000 | | 15,319,768 |
| | 3.375% 11/30/12(a) | | 3,735,000 | | 4,007,831 |
| | 3.500% 02/15/18(a) | | 5,670,000 | | 6,084,619 |
| | 3.625% 12/31/12 | | 6,590,000 | | 7,142,427 |
| | 3.750% 11/15/18(a) | | 5,415,000 | | 5,902,783 |
| | 3.875% 02/15/13 | | 8,990,000 | | 9,848,266 |
| | 3.875% 05/15/18 | | 8,480,000 | | 9,354,500 |
| | 4.000% 02/15/14 | | 3,500,000 | | 3,894,023 |
| | 4.000% 02/15/15(a) | | 5,520,000 | | 6,174,639 |
| | 4.000% 08/15/18 | | 17,560,000 | | 19,513,550 |
| | 4.125% 05/15/15(a) | | 2,230,000 | | 2,518,680 |
| | 4.250% 09/30/12(a) | | 1,115,000 | | 1,227,284 |
| | 4.250% 08/15/14(a) | | 5,855,000 | | 6,627,128 |
| | 4.250% 11/15/17 | | 8,150,000 | | 9,245,156 |
| | 4.375% 12/15/10(a) | | 2,810,000 | | 2,984,858 |
| | 4.500% 05/15/10 | | 1,840,000 | | 1,920,428 |
| | 4.500% 09/30/11 | | 12,030,000 | | 13,078,872 |
| | 4.500% 04/30/12 | | 15,170,000 | | 16,677,519 |
| | 4.500% 02/15/16(a) | | 8,890,000 | | 10,256,838 |
| | 4.500% 05/15/17 | | 4,900,000 | | 5,641,507 |
| | 4.625% 12/31/11 | | 7,500,000 | | 8,233,005 |
See Accompanying Notes to Financial Statements.
8
Columbia U.S. Treasury Index Fund
March 31, 2009
Government & Agency Obligations – (continued)
| | | | | | | |
| | | | | Par ($) | | Value ($) | |
| U.S. Treasury Notes – (continued) | | | | | |
| | 4.750% 05/15/14(a) | | 2,775,000 | | 3,204,259 | |
| | 4.750% 08/15/17(a) | | 5,850,000 | | 6,842,675 | |
| | 4.875% 04/30/11 | | 8,610,000 | | 9,330,416 | |
| | 4.875% 02/15/12 | | 1,500,000 | | 1,661,718 | |
| | 5.125% 06/30/11 | | 8,350,000 | | 9,154,990 | |
| | 5.750% 08/15/10(a) | | 11,915,000 | | 12,762,550 | |
| | | |
| | U.S. Treasury Notes Total | | | | 331,105,281 | |
| |
| | | |
| | Total Government & Agency Obligations
(cost of $380,647,180) | | | | 406,747,763 | |
| | | | | Shares | | | |
| Securities Lending Collateral – 18.9% | | | |
| | State Street Navigator Securities Lending Prime Portfolio (b) (7 day yield of 0.943%) | | 78,621,094 | | 78,621,094 | |
| | | |
| | Total Securities Lending Collateral
(cost of $78,621,094) | | | | 78,621,094 | |
| | | | | Par ($) | | | |
| Short-Term Obligation – 0.2% | | | |
| | Repurchase agreement with Fixed Income Clearing Corp., dated 03/31/09 due 04/01/09, at 0.100%, collateralized by a U.S. Treasury Obligation maturing 11/15/24, market value $772,044 (repurchase proceeds $754,002) | | 754,000 | | 754,000 | |
| | | |
| | Total Short-Term Obligation
(cost of $754,000) | | | | 754,000 | |
| |
| | | |
| | Total Investments – 116.8%
(cost of $460,022,274)(c) | | | | 486,122,857 | |
| |
| | | |
| | Obligation to Return Collateral for
Securities Loaned – (18.9)% | | | | (78,621,094 | ) |
| |
| | | |
| | Other Assets & Liabilities, Net – 2.1% | | | | 8,870,601 | |
| |
| | | |
| | Net Assets – 100.0% | | | �� | 416,372,364 | |
Notes to Investment Portfolio:
On April 1, 2008, the Fund adopted Statement of Financial Accounting Standards No. 157, Fair Value Measurements (“SFAS 157”). SFAS 157 establishes a hierarchy that prioritizes the inputs to valuation techniques used to measure fair value giving the highest priority to unadjusted quoted prices in active markets for identical securities (level 1 measurements) and the lowest priority to unobservable inputs (level 3 measurements) when market prices are not readily available or reliable. The three levels of the fair value hierarchy under SFAS 157 are described below:
| | • | | Level 1 – quoted prices in active markets for identical securities |
| | • | | Level 2 – prices determined using other significant observable inputs (including quoted prices for similar securities, interest rates, prepayment speeds, credit risk and others) |
| | • | | Level 3 – prices determined using significant unobservable inputs. In situations where quoted prices or observable inputs are unavailable or less reliable, unobservable inputs may be used. Unobservable inputs may include management’s own assumptions about the factors market participants would use in pricing an investment. |
The inputs or methodology used for valuing securities are not necessarily an indication of the risk associated with investing in those securities.
See Accompanying Notes to Financial Statements.
9
Columbia U.S. Treasury Index Fund
March 31, 2009
The following table summarizes the inputs used, as of March 31, 2009 in valuing the Fund’s assets:
| | | | | | |
Valuation Inputs | | Investments in Securities | | Other Financial Instruments |
| | |
| Level 1 – Quoted Prices | | $ | 485,368,857 | | $ | — |
| Level 2 – Other Significant Observable Inputs | | | 754,000 | | | — |
| Level 3 – Significant Unobservable Inputs | | | — | | | — |
| | | | | | |
| Total | | $ | 486,122,857 | | $ | — |
| | (a) | All or a portion of this security was on loan at March 31, 2009. The total market value of securities on loan at March 31, 2009 is $77,401,460. |
| | (b) | Investment made with cash collateral received from securities lending activity. |
| | (c) | Cost for federal income tax purposes is $462,480,349. |
At March 31, 2009, the Fund held investments in the following:
| | | |
Holdings by Revenue Source (Unaudited) | | % of Net Assets | |
| |
| U.S. Treasury Notes | | 79.5 | |
| U.S. Treasury Bonds | | 18.2 | |
| | | |
| | 97.7 | |
| Securities Lending Collateral | | 18.9 | |
| Short-Term Obligation | | 0.2 | |
| Obligation to Return Collateral for Securities Loaned | | (18.9 | ) |
| Other Assets & Liabilities, Net | | 2.1 | |
| | | |
| | 100.0 | |
See Accompanying Notes to Financial Statements.
10
Statement of Assets and Liabilities – Columbia U.S. Treasury Index Fund
March 31, 2009
| | | | | | |
| | | | | ($) | |
| | |
| Assets | | Investments, at cost | | | 460,022,274 | |
| | | | | | |
| | Investments at value (including securities on loan of $77,401,460) | | | 486,122,857 | |
| | Cash | | | 37,579 | |
| | Receivable for: | | | | |
| | Investments sold | | | 16,699,224 | |
| | Fund shares sold | | | 5,067,936 | |
| | Interest | | | 2,801,765 | |
| | Securities lending | | | 59,194 | |
| | Expense reimbursement due from investment advisor | | | 37,363 | |
| | Trustees’ deferred compensation plan | | | 12,316 | |
| | | |
| | Total Assets | | | 510,838,234 | |
| | |
| Liabilities | | Collateral on securities loaned | | | 78,621,094 | |
| | Payable for: | | | | |
| | Investments purchased | | | 14,330,795 | |
| | Fund shares repurchased | | | 829,461 | |
| | Distributions | | | 484,817 | |
| | Investment advisory fee | | | 34,748 | |
| | Administration fee | | | 104,245 | |
| | Trustees’ fees | | | 99 | |
| | Distribution and service fees | | | 47,925 | |
| | Trustees’ deferred compensation plan | | | 12,316 | |
| | Other liabilities | | | 370 | |
| | | |
| | Total Liabilities | | | 94,465,870 | |
| |
| | | |
| | Net Assets | | | 416,372,364 | |
| | |
| Net Assets Consist of | | Paid-in capital | | | 392,322,625 | |
| | Overdistributed net investment income | | | (1,601,721 | ) |
| | Accumulated net realized loss | | | (449,123 | ) |
| | Net unrealized appreciation on investments | | | 26,100,583 | |
| | | |
| | Net Assets | | | 416,372,364 | |
| | | | | | |
| | |
| Class A | | Net assets | | $ | 79,113,524 | |
| | Shares outstanding | | | 6,796,248 | |
| | Net asset value per share | | $ | 11.64 | (a) |
| | Maximum sales charge | | | 4.75 | % |
| | Maximum offering price per share ($11.64/0.9525) | | $ | 12.22 | (b) |
| | |
| Class B | | | | | | |
| | Net assets | | $ | 10,178,659 | |
| | Shares outstanding | | | 874,493 | |
| | Net asset value and offering price per share | | $ | 11.64 | (a) |
| | |
| Class C | | | | | | |
| | Net assets | | $ | 32,439,906 | |
| | Shares outstanding | | | 2,787,039 | |
| | Net asset value and offering price per share | | $ | 11.64 | (a) |
| | |
| Class Z | | | | | | |
| | Net assets | | $ | 294,640,275 | |
| | Shares outstanding | | | 25,313,896 | |
| | Net asset value, offering and redemption price per share | | $ | 11.64 | |
| (a) | Redemption price per share is equal to net asset value less any applicable contingent deferred sales charge. |
| (b) | On sales of $50,000 or more the offering price is reduced. |
See Accompanying Notes to Financial Statements.
11
Statement of Operations – Columbia U.S. Treasury Index Fund
For the Year Ended March 31, 2009
| | | | | |
| | | | | ($) | |
| Investment Income | | Interest | | 11,729,094 | |
| | Securities lending | | 1,140,513 | |
| | | |
| | Total Investment Income | | 12,869,607 | |
| | | | | |
| Expenses | | Investment advisory fee | | 360,167 | |
| | Administration fee | | 1,080,502 | |
| | Distribution fee: | | | |
| | Class B | | 47,453 | |
| | Class C | | 139,454 | |
| | Service fee: | | | |
| | Class A | | 119,818 | |
| | Class B | | 15,817 | |
| | Class C | | 46,488 | |
| | Sub-account services fee – Class Z | | (17,399 | ) |
| | Trustees’ fees | | 19,771 | |
| | Other expenses | | 1,581 | |
| | | |
| | Expenses before interest expense | | 1,813,652 | |
| | Interest expense | | 51 | |
| |
| | | |
| | Total Expenses | | 1,813,703 | |
| | |
| | Fees waived or expenses reimbursed by investment advisor | | (380,634 | ) |
| | Fees waived by distributor – Class C | | (27,883 | ) |
| | Expense reductions | | (2,640 | ) |
| | | |
| | Net Expenses | | 1,402,546 | |
| |
| | | |
| | Net Investment Income | | 11,467,061 | |
| | |
| Net Realized and Unrealized Gain (Loss) on Investments | | Net realized gain on investments | | 4,990,291 | |
| | Net change in unrealized appreciation (depreciation) on investments | | 10,008,567 | |
| | | |
| | Net Gain | | 14,998,858 | |
| |
| | | |
| | Net Increase Resulting from Operations | | 26,465,919 | |
See Accompanying Notes to Financial Statements.
12
Statement of Changes in Net Assets – Columbia U.S. Treasury Index Fund
| | | | | | | | |
| | | | | Year Ended March 31, | |
| Increase (Decrease) in Net Assets | | 2009 ($) | | | 2008 ($) | |
| Operations | | Net investment income | | 11,467,061 | | | 7,729,604 | |
| | Net realized gain on investments | | 4,990,291 | | | 604,694 | |
| | Net change in unrealized appreciation (depreciation) on investments | | 10,008,567 | | | 14,980,045 | |
| | | |
| | Net increase resulting from operations | | 26,465,919 | | | 23,314,343 | |
| | | |
| Distributions to Shareholders | | From net investment income: | | | | | | |
| | Class A | | (1,679,605 | ) | | (308,037 | ) |
| | Class B | | (176,569 | ) | | (77,747 | ) |
| | Class C | | (535,850 | ) | | (78,863 | ) |
| | Class Z | | (11,238,690 | ) | | (7,912,065 | ) |
| | | |
| | Total distributions to shareholders | | (13,630,714 | ) | | (8,376,712 | ) |
| | | |
| | Net Capital Stock Transactions | | 91,137,254 | | | 151,633,626 | |
| | | | | | | | |
| | Total increase in net assets | | 103,972,459 | | | 166,571,257 | |
| | | |
| Net Assets | | Beginning of period | | 312,399,905 | | | 145,828,648 | |
| | End of period | | 416,372,364 | | | 312,399,905 | |
| | Overdistributed net investment income, at end of period | | (1,601,721 | ) | | (1,437,319 | ) |
| | | |
See Accompanying Notes to Financial Statements.
13
Statement of Changes in Net Assets (continued) – Columbia U.S. Treasury Index Fund
| | | | | | | | | | | | |
| | | Capital Stock Activity | |
| | | Year Ended
March 31, 2009 | | | Year Ended
March 31, 2008 | |
| | | Shares | | | Dollars ($) | | | Shares | | | Dollars ($) | |
Class A | | | | | | | | | | | | |
Subscriptions | | 10,949,753 | | | 124,386,787 | | | 2,068,103 | | | 22,533,567 | |
Distributions reinvested | | 109,889 | | | 1,251,843 | | | 17,864 | | | 195,426 | |
Redemptions | | (5,844,659 | ) | | (67,488,577 | ) | | (1,001,977 | ) | | (10,677,347 | ) |
| | | | | | | | | | | | |
Net increase | | 5,214,983 | | | 58,150,053 | | | 1,083,990 | | | 12,051,646 | |
Class B | | | | | | | | | | | | |
Subscriptions | | 842,126 | | | 9,545,620 | | | 273,790 | | | 2,978,155 | |
Distributions reinvested | | 13,789 | | | 156,456 | | | 6,008 | | | 65,149 | |
Redemptions | | (301,843 | ) | | (3,434,104 | ) | | (100,731 | ) | | (1,088,695 | ) |
| | | | | | | | | | | | |
Net increase | | 554,072 | | | 6,267,972 | | | 179,067 | | | 1,954,609 | |
Class C | | | | | | | | | | | | |
Subscriptions | | 3,253,184 | | | 36,876,432 | | | 600,119 | | | 6,606,640 | |
Distributions reinvested | | 39,088 | | | 445,060 | | | 6,275 | | | 68,744 | |
Redemptions | | (1,100,021 | ) | | (12,591,972 | ) | | (104,011 | ) | | (1,122,634 | ) |
| | | | | | | | | | | | |
Net increase | | 2,192,251 | | | 24,729,520 | | | 502,383 | | | 5,552,750 | |
Class Z | | | | | | | | | | | | |
Subscriptions | | 15,939,555 | | | 180,155,451 | | | 17,230,256 | | | 187,705,635 | |
Distributions reinvested | | 574,256 | | | 6,414,532 | | | 452,207 | | | 4,907,934 | |
Redemptions | | (16,430,119 | ) | | (184,580,274 | ) | | (5,571,947 | ) | | (60,538,948 | ) |
| | | | | | | | | | | | |
Net increase | | 83,692 | | | 1,989,709 | | | 12,110,516 | | | 132,074,621 | |
See Accompanying Notes to Financial Statements.
14
Financial Highlights – Columbia U.S. Treasury Index Fund
Selected data for a share outstanding throughout each period is as follows:
| | | | | | | | | | | | | | | | | | | | |
| | | Year Ended March 31, | |
| Class A Shares | | 2009 | | | 2008 | | | 2007 | | | 2006 | | | 2005 | |
Net Asset Value, Beginning of Period | | $ | 11.27 | | | $ | 10.53 | | | $ | 10.45 | | | $ | 10.72 | | | $ | 11.18 | |
| | | | | |
Income from Investment Operations: | | | | | | | | | | | | | | | | | | | | |
Net investment income (a) | | | 0.33 | | | | 0.43 | | | | 0.42 | | | | 0.39 | | | | 0.35 | |
Net realized and unrealized gain (loss) on investments | | | 0.45 | | | | 0.78 | | | | 0.12 | | | | (0.24 | ) | | | (0.41 | ) |
| | | | | | | | | | | | | | | | | | | | |
Total from investment operations | | | 0.78 | | | | 1.21 | | | | 0.54 | | | | 0.15 | | | | (0.06 | ) |
| | | | | |
Less Distributions to Shareholders: | | | | | | | | | | | | | | | | | | | | |
From net investment income | | | (0.41 | ) | | | (0.47 | ) | | | (0.46 | ) | | | (0.42 | ) | | | (0.40 | ) |
| | | | | |
Net Asset Value, End of Period | | $ | 11.64 | | | $ | 11.27 | | | $ | 10.53 | | | $ | 10.45 | | | $ | 10.72 | |
Total return (b) | | | 7.13 | %(c) | | | 11.77 | %(c)(d) | | | 5.30 | %(c) | | | 1.38 | %(c) | | | (0.48 | )% |
| | | | | |
Ratios to Average Net Assets/Supplemental Data: | | | | | | | | | | | | | | | | | | | | |
Net expenses before interest expense | | | 0.55 | %(e) | | | 0.57 | %(e) | | | 0.60 | % | | | 0.63 | % | | | 0.66 | % |
Interest expense | | | — | %(f) | | | — | %(f) | | | — | %(f) | | | — | %(f) | | | — | |
Net expenses | | | 0.55 | %(e) | | | 0.57 | %(e) | | | 0.60 | % | | | 0.63 | % | | | 0.66 | % |
Waiver/Reimbursement | | | 0.11 | % | | | 0.09 | % | | | 0.06 | % | | | 0.03 | % | | | — | |
Net investment income | | | 2.91 | %(e) | | | 3.94 | %(e) | | | 4.05 | % | | | 3.60 | % | | | 3.22 | % |
Portfolio turnover rate | | | 126 | % | | | 47 | % | | | 39 | % | | | 36 | % | | | 44 | % |
Net assets, end of period (000’s) | | $ | 79,114 | | | $ | 17,817 | | | $ | 5,235 | | | $ | 3,208 | | | $ | 3,314 | |
| (a) | Per share data was calculated using the average shares outstanding during the period. |
| (b) | Total return at net asset value assuming all distributions reinvested and no initial sales charge or contingent deferred sales charge. |
| (c) | Had the investment advisor and/or any of its affiliates not waived fees or reimbursed a portion of expenses, total return would have been reduced. |
| (d) | Total return includes a voluntary reimbursement by the investment advisor for a realized investment loss due to a trading error. This reimbursement increased total return and net asset value per share by less than 0.01% and less than $0.01, respectively. |
| (e) | The benefits derived from expense reductions had an impact of less than 0.01%. |
| (f) | Rounds to less than 0.01%. |
See Accompanying Notes to Financial Statements.
15
Financial Highlights – Columbia U.S. Treasury Index Fund
Selected data for a share outstanding throughout each period is as follows:
| | | | | | | | | | | | | | | | | | | | |
| | | Year Ended March 31, | |
| Class B Shares | | 2009 | | | 2008 | | | 2007 | | | 2006 | | | 2005 | |
Net Asset Value, Beginning of Period | | $ | 11.27 | | | $ | 10.53 | | | $ | 10.45 | | | $ | 10.72 | | | $ | 11.18 | |
| | | | | |
Income from Investment Operations: | | | | | | | | | | | | | | | | | | | | |
Net investment income (a) | | | 0.25 | | | | 0.35 | | | | 0.35 | | | | 0.31 | | | | 0.27 | |
Net realized and unrealized gain (loss) on investments | | | 0.45 | | | | 0.78 | | | | 0.11 | | | | (0.24 | ) | | | (0.41 | ) |
| | | | | | | | | | | | | | | | | | | | |
Total from investment operations | | | 0.70 | | | | 1.13 | | | | 0.46 | | | | 0.07 | | | | (0.14 | ) |
| | | | | |
Less Distributions to Shareholders: | | | | | | | | | | | | | | | | | | | | |
From net investment income | | | (0.33 | ) | | | (0.39 | ) | | | (0.38 | ) | | | (0.34 | ) | | | (0.32 | ) |
| | | | | |
Net Asset Value, End of Period | | $ | 11.64 | | | $ | 11.27 | | | $ | 10.53 | | | $ | 10.45 | | | $ | 10.72 | |
Total return (b) | | | 6.32 | %(c) | | | 10.95 | %(c)(d) | | | 4.52 | %(c) | | | 0.62 | %(c) | | | (1.23 | )% |
| | | | | |
Ratios to Average Net Assets/Supplemental Data: | | | | | | | | | | | | | | | | | | | | |
Net expenses before interest expense | | | 1.30 | %(e) | | | 1.32 | %(e) | | | 1.35 | % | | | 1.38 | % | | | 1.41 | % |
Interest expense | | | — | %(f) | | | — | %(f) | | | — | %(f) | | | — | %(f) | | | — | |
Net expenses | | | 1.30 | %(e) | | | 1.32 | %(e) | | | 1.35 | % | | | 1.38 | % | | | 1.41 | % |
Waiver/Reimbursement | | | 0.11 | % | | | 0.09 | % | | | 0.06 | % | | | 0.03 | % | | | — | |
Net investment income | | | 2.19 | %(e) | | | 3.25 | %(e) | | | 3.31 | % | | | 2.85 | % | | | 2.48 | % |
Portfolio turnover rate | | | 126 | % | | | 47 | % | | | 39 | % | | | 36 | % | | | 44 | % |
Net assets, end of period (000’s) | | $ | 10,179 | | | $ | 3,610 | | | $ | 1,488 | | | $ | 1,615 | | | $ | 1,451 | |
| (a) | Per share data was calculated using the average shares outstanding during the period. |
| (b) | Total return at net asset value assuming all distributions reinvested and no contingent deferred sales charge. |
| (c) | Had the investment advisor and/or any of its affiliates not waived fees or reimbursed a portion of expenses, total return would have been reduced. |
| (d) | Total return includes a voluntary reimbursement by the investment advisor for a realized investment loss due to a trading error. This reimbursement increased total return and net asset value per share by less than 0.01% and less than $0.01, respectively. |
| (e) | The benefits derived from expense reductions had an impact of less than 0.01%. |
| (f) | Rounds to less than 0.01%. |
See Accompanying Notes to Financial Statements.
16
Financial Highlights – Columbia U.S. Treasury Index Fund
Selected data for a share outstanding throughout each period is as follows:
| | | | | | | | | | | | | | | | | | | | |
| | | Year Ended March 31, | |
| Class C Shares | | 2009 | | | 2008 | | | 2007 | | | 2006 | | | 2005 | |
Net Asset Value, Beginning of Period | | $ | 11.27 | | | $ | 10.53 | | | $ | 10.45 | | | $ | 10.72 | | | $ | 11.18 | |
| | | | | |
Income from Investment Operations: | | | | | | | | | | | | | | | | | | | | |
Net investment income (a) | | | 0.26 | | | | 0.36 | | | | 0.36 | | | | 0.32 | | | | 0.29 | |
Net realized and unrealized gain (loss) on investments | | | 0.45 | | | | 0.78 | | | | 0.12 | | | | (0.23 | ) | | | (0.41 | ) |
| | | | | | | | | | | | | | | | | | | | |
Total from investment operations | | | 0.71 | | | | 1.14 | | | | 0.48 | | | | 0.09 | | | | (0.12 | ) |
| | | | | |
Less Distributions to Shareholders: | | | | | | | | | | | | | | | | | | | | |
From net investment income | | | (0.34 | ) | | | (0.40 | ) | | | (0.40 | ) | | | (0.36 | ) | | | (0.34 | ) |
| | | | | |
Net Asset Value, End of Period | | $ | 11.64 | | | $ | 11.27 | | | $ | 10.53 | | | $ | 10.45 | | | $ | 10.72 | |
Total return (b)(c) | | | 6.48 | % | | | 11.09 | %(d) | | | 4.67 | % | | | 0.77 | % | | | (1.07 | )% |
| | | | | |
Ratios to Average Net Assets/Supplemental Data: | | | | | | | | | | | | | | | | | | | | |
Net expenses before interest expense | | | 1.15 | %(e) | | | 1.17 | %(e) | | | 1.20 | % | | | 1.23 | % | | | 1.26 | % |
Interest expense | | | — | %(f) | | | — | %(f) | | | — | %(f) | | | — | %(f) | | | — | |
Net expenses | | | 1.15 | %(e) | | | 1.17 | %(e) | | | 1.20 | % | | | 1.23 | % | | | 1.26 | % |
Waiver/Reimbursement | | | 0.26 | % | | | 0.24 | % | | | 0.21 | % | | | 0.18 | % | | | 0.15 | % |
Net investment income | | | 2.28 | %(e) | | | 3.30 | %(e) | | | 3.44 | % | | | 3.01 | % | | | 2.67 | % |
Portfolio turnover rate | | | 126 | % | | | 47 | % | | | 39 | % | | | 36 | % | | | 44 | % |
Net assets, end of period (000’s) | | $ | 32,440 | | | $ | 6,702 | | | $ | 973 | | | $ | 1,060 | | | $ | 869 | |
| (a) | Per share data was calculated using the average shares outstanding during the period. |
| (b) | Total return at net asset value assuming all distributions reinvested and no contingent deferred sales charge. |
| (c) | Had the investment advisor and/or any of its affiliates not waived fees or reimbursed a portion of expenses, total return would have been reduced. |
| (d) | Total return includes a voluntary reimbursement by the investment advisor for a realized investment loss due to a trading error. This reimbursement increased total return and net asset value per share by less than 0.01% and less than $0.01, respectively. |
| (e) | The benefits derived from expense reductions had an impact of less than 0.01%. |
| (f) | Rounds to less than 0.01%. |
See Accompanying Notes to Financial Statements.
17
Financial Highlights – Columbia U.S. Treasury Index Fund
Selected data for a share outstanding throughout each period is as follows:
| | | | | | | | | | | | | | | | | | | | |
| | | Year Ended March 31, | |
| Class Z Shares | | 2009 | | | 2008 | | | 2007 | | | 2006 | | | 2005 | |
Net Asset Value, Beginning of Period | | $ | 11.27 | | | $ | 10.53 | | | $ | 10.45 | | | $ | 10.72 | | | $ | 11.18 | |
| | | | | |
Income from Investment Operations: | | | | | | | | | | | | | | | | | | | | |
Net investment income (a) | | | 0.37 | | | | 0.46 | | | | 0.45 | | | | 0.41 | | | | 0.38 | |
Net realized and unrealized gain (loss) on investments | | | 0.44 | | | | 0.77 | | | | 0.12 | | | | (0.23 | ) | | | (0.41 | ) |
| | | | | | | | | | | | | | | | | | | | |
Total from investment operations | | | 0.81 | | | | 1.23 | | | | 0.57 | | | | 0.18 | | | | (0.03 | ) |
| | | | | |
Less Distributions to Shareholders: | | | | | | | | | | | | | | | | | | | | |
From net investment income | | | (0.44 | ) | | | (0.49 | ) | | | (0.49 | ) | | | (0.45 | ) | | | (0.43 | ) |
| | | | | |
Net Asset Value, End of Period | | $ | 11.64 | | | $ | 11.27 | | | $ | 10.53 | | | $ | 10.45 | | | $ | 10.72 | |
Total return (b)(c) | | | 7.40 | % | | | 12.04 | %(d) | | | 5.53 | % | | | 1.62 | % | | | (0.25 | )% |
| | | | | |
Ratios to Average Net Assets/Supplemental Data: | | | | | | | | | | | | | | | | | | | | |
Net expenses before interest expense | | | 0.30 | %(e)(f) | | | 0.33 | %(e) | | | 0.38 | % | | | 0.39 | % | | | 0.42 | % |
Interest expense | | | — | %(g) | | | — | %(g) | | | — | %(g) | | | — | %(g) | | | — | |
Net expenses | | | 0.30 | %(e)(f) | | | 0.33 | %(e) | | | 0.38 | % | | | 0.39 | % | | | 0.42 | % |
Waiver/Reimbursement | | | 0.11 | % | | | 0.09 | % | | | 0.07 | % | | | 0.04 | % | | | 0.01 | % |
Net investment income | | | 3.31 | %(e) | | | 4.24 | %(e) | | | 4.28 | % | | | 3.83 | % | | | 3.47 | % |
Portfolio turnover rate | | | 126 | % | | | 47 | % | | | 39 | % | | | 36 | % | | | 44 | % |
Net assets, end of period (000’s) | | $ | 294,640 | | | $ | 284,271 | | | $ | 138,132 | | | $ | 136,609 | | | $ | 151,969 | |
| (a) | Per share data was calculated using the average shares outstanding during the period. |
| (b) | Total return at net asset value assuming all distributions reinvested. |
| (c) | Had the investment advisor and/or any of its affiliates not waived fees or reimbursed a portion of expenses, total return would have been reduced. |
| (d) | Total return includes a voluntary reimbursement by the investment advisor for a realized investment loss due to a trading error. This reimbursement increased total return and net asset value per share by less than 0.01% and less than $0.01, respectively. |
| (e) | The benefits derived from expense reductions had an impact of less than 0.01%. |
| (f) | During the year ended March 31, 2009, Class Z shares experienced a one-time reduction in its expense of one basis point as a result of expenses accrued in a prior period. The ratios disclosed above reflect the actual rate at which expenses were incurred throughout the period without the reduction. |
| (g) | Rounds to less than 0.01%. |
See Accompanying Notes to Financial Statements.
18
Notes to Financial Statements – Columbia U.S. Treasury Index Fund
March 31, 2009
Note 1. Organization
Columbia U.S. Treasury Index Fund (the “Fund”), a series of Columbia Funds Series Trust I (the “Trust”) is a diversified portfolio. The Trust is a Massachusetts business trust registered under the Investment Company Act of 1940, as amended (the “1940 Act”), as an open-end management investment company.
Investment Objective
The Fund seeks total return that corresponds to the total return of the Citigroup Bond U.S. Treasury Index, before fees and expenses.
Fund Shares
The Trust may issue an unlimited number of shares, and the Fund offers four classes of shares: Class A, Class B, Class C and Class Z. Each share class has its own expense structure and sales charges, as applicable. Beginning on or about June 22, 2009, the Fund will no longer accept investment in Class B shares from new or existing investors in the Fund’s Class B shares, except in connection with the reinvestment of any dividend and/or capital gain distributions in Class B shares of the Fund and exchanges by existing Class B shareholders of the other Columbia Funds.
Class A shares are subject to a maximum front-end sales charge of 4.75% based on the amount of initial investment. Class A shares purchased without an initial sales charge in accounts aggregating $1 million to $50 million at the time of purchase are subject to a 1.00% contingent deferred sales charge (“CDSC”) if the shares are sold within one year after purchase. Class B shares are subject to a maximum CDSC of 5.00% based upon the holding period after purchase. Class B shares will convert to Class A shares eight years after purchase. Class C shares are subject to a 1.00% CDSC on shares sold within one year after purchase. Class Z shares are offered continuously at net asset value. There are certain restrictions on the purchase of Class Z shares, as described in the Fund’s prospectus.
Note 2. Significant Accounting Policies
The preparation of financial statements in accordance with accounting principles generally accepted in the United States of America (“GAAP”) requires management to make certain estimates and assumptions that affect the reported amounts of assets and liabilities, the disclosure of contingent assets and liabilities at the date of the financial statements and the reported amounts of revenue and expenses during the reporting period. Actual results could differ from those estimates. The following is a summary of significant accounting policies consistently followed by the Fund in the preparation of its financial statements.
Security Valuation
Debt securities generally are valued by pricing services approved by the Trust’s Board of Trustees, based upon market transactions for normal, institutional-size trading units of similar securities. The services may use various pricing techniques which take into account appropriate factors such as yield, quality, coupon rate, maturity, type of issue, trading characteristics and other data, as well as broker quotes. Debt securities for which quotations are readily available are valued at an over-the-counter or exchange bid quotation.
Short-term investments maturing in 60 days or less are valued at amortized cost, which approximates market value.
Investments for which market quotations are not readily available, or that have quotations which management believes are not reliable, are valued at fair value as determined in good faith under consistently applied procedures established by and under the general supervision of the Board of Trustees. If a security is valued at fair value, such value is likely to be different from the last quoted market price for the security. The determination of fair value often requires significant judgment. To determine fair value, management may use assumptions including but not limited to future cash flows and estimated risk premiums. Multiple inputs from various sources may be used to determine value.
Security Transactions
Security transactions are accounted for on the trade date. Cost is determined and gains (losses) are based upon the specific identification method for both financial statement and federal income tax purposes.
Repurchase Agreements
The Fund may engage in repurchase agreement transactions with institutions that Columbia Management Advisors, LLC (“Columbia”), the Fund’s investment advisor, has determined are creditworthy. The Fund, through its
19
Columbia U.S. Treasury Index Fund
March 31, 2009
custodian, receives delivery of the underlying securities collateralizing a repurchase agreement. Columbia is responsible for determining that the collateral is at least equal, at all times, to the value of the repurchase obligation including interest. A repurchase agreement transaction involves certain risks in the event of default or insolvency of the counterparty. These risks include possible delays in or restrictions on the Fund’s ability to dispose of the underlying securities and a possible decline in the value of the underlying securities during the period while the Fund seeks to assert its rights.
Income Recognition
Interest income is recorded on the accrual basis. Premium and discount are amortized and accreted, respectively, on all debt securities, unless otherwise noted.
Expenses
General expenses of the Trust are allocated to the Fund and other series of the Trust based upon relative net assets or other expense allocation methodologies determined by the nature of the expense. Expenses directly attributable to the Fund are charged to the Fund.
Determination of Class Net Asset Value
All income, expenses (other than class-specific expenses, as shown on the Statement of Operations) and realized and unrealized gains (losses) are allocated to each class of the Fund on a daily basis for purposes of determining the net asset value of each class. Income and expenses are allocated to each class based on the settled shares method, while realized and unrealized gains (losses) are allocated based on the relative net assets of each class.
Federal Income Tax Status
The Fund intends to qualify each year as a “regulated investment company” under Subchapter M of the Internal Revenue Code, as amended, and will distribute substantially all of its taxable income, if any, for its tax year, and as such will not be subject to federal income taxes. In addition, the Fund intends to distribute in each calendar year substantially all of its net investment income, capital gains and certain other amounts, if any, such that the Fund should not be subject to federal excise tax. Therefore, no provision is made for federal income or excise taxes.
Distributions to Shareholders
Distributions from net investment income are declared daily and paid monthly. Net realized capital gains, if any, are distributed at least annually. Income distributions and capital gain distributions are determined in accordance with federal income tax regulations which may differ from GAAP.
Indemnification
In the normal course of business, the Fund enters into contracts that contain a variety of representations and warranties and which provide general indemnities. The Fund’s maximum exposure under these arrangements is unknown because this would involve future claims against the Fund. Also, under the Trust’s organizational documents and by contract, the Trustees and officers of the Trust are indemnified against certain liabilities that may arise out of actions relating to their duties to the Trust. However, based on experience, the Fund expects the risk of loss due to these representations, warranties and indemnities to be minimal.
Note 3. Federal Tax Information
The timing and character of income and capital gain distributions are determined in accordance with income tax regulations, which may differ from GAAP. Reclassifications are made to the Fund’s capital accounts for permanent tax differences to reflect income and gains available for distribution (or available capital loss carryforwards) under income tax regulations.
For the year ended March 31, 2009, permanent book and tax basis differences resulting primarily from differing treatments for discount accretion/premium amortization on debt securities and market discount reclasses were identified and reclassified among the components of the Fund’s net assets as follows:
| | | | |
| | | | | |
Overdistributed Net Investment
Income | | Accumulated Net Realized
Gain | | Paid-In Capital |
| $1,999,251 | | $(1,999,253) | | $2 |
Net investment income and net realized gains (losses), as disclosed on the Statement of Operations, and net assets were not affected by this reclassification.
20
Columbia U.S. Treasury Index Fund
March 31, 2009
The tax character of distributions paid during the years ended March 31, 2009 and March 31, 2008 was as follows:
| | | | | | |
| | | March 31, 2009 | | March 31, 2008 |
| Distributions paid from: | | |
| Ordinary Income* | | $ | 13,626,250 | | $ | 8,376,712 |
| Long-Term Capital Gains | | | 4,464 | | | — |
| * | For tax purposes short-term capital gains distributions, if any, are considered ordinary income distributions. |
As of March 31, 2009, the components of distributable earnings on a tax basis were as follows:
| | |
| | | |
Undistributed Ordinary Income | | Net
Unrealized Appreciation* |
| $913,422 | | $23,642,508 |
| * | The differences between book-basis and tax-basis net unrealized appreciation are primarily due to deferral of losses from wash sales and differing treatment for discount accretion/premium amortization on debt securities. |
Unrealized appreciation and depreciation, as determined as of March 31, 2009, based on cost of investments for federal income tax purposes were:
| | | | |
| | | | |
Unrealized appreciation | | $ | 23,650,040 | |
Unrealized depreciation | | | (7,532 | ) |
Net unrealized appreciation | | $ | 23,642,508 | |
Capital loss carryforwards of $3,392,172 were utilized during the year ended March 31, 2009. Expired capital loss carryforwards are recorded as a reduction of paid-in capital.
Under Financial Accounting Standards Board (“FASB”) Interpretation No. 48, Accounting for Uncertainty in Income Taxes - an Interpretation of FASB Statement No. 109 (“FIN 48”), management determines whether a tax position of the Fund is more likely than not to be sustained upon examination by the applicable taxing authority, including resolution of any related appeals or litigation processes, based on the technical merits of the position. The tax benefit to be recognized is measured as the largest amount of benefit that is greater than fifty percent likely of being realized upon ultimate settlement. Management has evaluated the known implications of FIN 48 on the computation of net assets for the Fund. As a result of this evaluation, management has concluded that FIN 48 did not have any effect on the Fund’s financial statements. However, management’s conclusions regarding FIN 48 may be subject to review and adjustment at a later date based on factors including, but not limited to, further implementation guidance from the FASB, new tax laws, regulations, and administrative interpretations (including relevant court decisions). The Fund’s federal tax returns for the prior three fiscal years remain subject to examination by the Internal Revenue Service. The Fund is not aware of any tax positions for which it is reasonably possible that the total amounts of unrecognized tax benefit will significantly change in the next twelve months.
Note 4. Fees and Compensation Paid to Affiliates
Investment Advisory Fee
Columbia, an indirect, wholly owned subsidiary of Bank of America Corporation (“BOA”) provides investment advisory services to the Fund. In rendering investment advisory services to the Fund, Columbia may use the portfolio management and research resources of Columbia Management Pte. Ltd., an affiliate of Columbia. Columbia receives a monthly investment advisory fee at the annual rate of 0.10% of the Fund’s average daily net assets.
Administration Fee
Columbia provides administrative services to the Fund pursuant to an administrative services agreement. Columbia, from the administration fee it receives from the Fund, pays all expenses of the Fund, except the fees and expenses of the Trustees who are not interested persons, service and distribution fees, brokerage fees and commissions, annual sub-account fees payable with respect to shares of the Fund held by defined contribution plans, interest on borrowings, taxes and such extraordinary, non-recurring expenses as may arise, including litigation. Columbia receives a monthly administration fee for its services as administrator at the annual rate of 0.30% of the average daily net assets of the Fund.
Underwriting Discounts, Service and Distribution Fees
Columbia Management Distributors, Inc. (the “Distributor”), an affiliate of Columbia and an indirect, wholly owned
21
Columbia U.S. Treasury Index Fund
March 31, 2009
subsidiary of BOA, is the principal underwriter of the Fund’s shares. For the year ended March 31, 2009, the Distributor retained net underwriting discounts of $68,223 on sales of the Fund’s Class A shares and net CDSC fees of $2, $19,230 and $36,124 on Class A, Class B and Class C share redemptions, respectively.
The Fund has adopted plans pursuant to Rule 12b-1 under the 1940 Act (the “Plans”) which require the payment of a monthly service fee to the Distributor at the maximum annual rate of 0.25% of the average daily net assets attributable to Class A, Class B and Class C shares of the Fund. The Plans also require the payment of a monthly distribution fee to the Distributor at the maximum annual rate of 0.75% of the average daily net assets attributable to Class B and Class C shares only. The Distributor has voluntarily agreed to waive a portion of the distribution fee for Class C shares so that the combined distribution and service fees do not exceed 0.85% annually of the average daily net assets attributable to Class C shares. This arrangement may be modified or terminated by the Distributor at any time.
The CDSC and the distribution fees received from the Plans are used principally as repayment to the Distributor for amounts paid by the Distributor to dealers who sold such shares.
Minimum Account Balance Fee
An annual minimum account balance fee of $20 may apply to certain accounts with a value below the Fund’s initial minimum investment requirements to reduce the impact of small accounts on transfer agent fees. These minimum account balance fees are recorded as a reduction of total expenses on the Statement of Operations. For the year ended March 31, 2009, these minimum account balance fees reduced total expenses by $2,640.
Fee Waivers and Expense Reimbursements
Columbia has contractually agreed to bear a portion of the Fund’s expenses through July 31, 2009, so that the Fund’s ordinary operating expenses (excluding any distribution and service fees, brokerage commissions, interest, taxes and extraordinary expenses, but including custodian charges relating to overdrafts, if any), after giving effect to any balance credits from the Fund’s custodian, do not exceed 0.30% of the Fund’s average daily net assets on an annualized basis. Effective August 1, 2009, Columbia has voluntarily agreed to bear a portion of the Fund’s expenses so that the Fund’s ordinary operating expenses (excluding any distribution and service fees, brokerage commissions, interest, taxes and extraordinary expenses, but including custodian charges relating to overdrafts, if any), after giving effect to any balance credits from the Fund’s custodian, do not exceed the annual rate of 0.20% of the Fund’s average daily net assets.
Fees Paid to Officers and Trustees
All officers of the Fund are employees of Columbia or its affiliates and receive no compensation from the Fund. The Board of Trustees has appointed a Chief Compliance Officer to the Fund in accordance with federal securities regulations.
The Trust’s eligible Trustees may participate in a deferred compensation plan which may be terminated at any time. Obligations of the plan will be paid solely out of the Fund’s assets.
Other
The Fund entered into a sub-account services agreement which was terminated prior to the beginning of the current fiscal year. The negative “Sub-account services fee – Class Z” on the Statement of Operations is the result of a reversal of expenses accrued in the prior period.
Note 5. Portfolio Information
For the year ended March 31, 2009, the cost of purchases and proceeds from sales of securities, excluding short-term obligations, for the Fund were $532,614,703 and $447,165,831, respectively, all of which were U.S. Government securities.
Note 6. Line of Credit
The Fund and other affiliated funds participate in a $280,000,000 committed, unsecured revolving line of credit provided by State Street. The maximum amount that may be borrowed by any fund is limited to the lesser of $200,000,000 and the Fund’s borrowing limit set forth in the Fund’s registration statement. Borrowings are available for short-term liquidity or temporary or emergency purposes.
Interest is charged to each participating fund based on the fund’s borrowings at a rate per annum equal to the greater of the Federal Funds Rate plus 0.50% or the overnight LIBOR Rate plus 0.50%. In addition, an annual operations agency fee
22
Columbia U.S. Treasury Index Fund
March 31, 2009
of $20,000, an amendment fee of 0.02% and a commitment fee of 0.12% per annum are accrued and apportioned among the participating funds pro rata based on their relative net assets.
Prior to October 16, 2008, the Fund and other affiliated funds participated in a $350,000,000 committed, unsecured revolving line of credit and a $150,000,000 uncommitted, unsecured line of credit, both provided by State Street. Interest on the committed line of credit was charged to each participating fund based on the fund’s borrowings at a rate per annum equal to the Federal Funds Rate plus 0.50%. In addition, a commitment fee of 0.10% per annum was accrued and apportioned among the participating funds pro rata based on their relative net assets. Interest on the uncommitted line of credit was charged to each participating fund based on the fund’s borrowings at a rate per annum equal to the Federal Funds Rate plus 0.375%. State Street charged an annual operations agency fee of $40,000 for the committed line of credit and was able to charge an annual administration fee of $15,000 for the uncommitted line of credit. The commitment fee, the operations agency fee and the administration fee were accrued and apportioned among the participating funds pro rata based on their relative net assets.
For the year ended March 31, 2009, the average daily loan balance outstanding on days where borrowing existed was $3,000,000 at a weighted average interest rate of 0.62%.
Note 7. Securities Lending
The Fund may lend its securities to certain approved brokers, dealers and other financial institutions. Each loan is collateralized by cash, in an amount at least equal to the market value of the securities loaned plus accrued income from the investment of collateral. The market value of the loaned securities is determined at the close of business of the Fund and any additional required collateral is delivered to the Fund on the next business day. The collateral received is invested and the income generated by the investment of the collateral, net of any fees remitted to State Street as the lending agent and borrower rebates, is paid to the Fund. Generally, in the event of borrower default, the Fund has the right to use the collateral to offset any losses incurred. In the event the Fund is delayed in or prevented from exercising its right to dispose of the collateral, there may be a potential loss to the Fund. The Fund bears the risk of loss with respect to the investment of collateral.
Note 8. Shares of Beneficial Interest
As of March 31, 2009, 34.7% of the Fund’s shares outstanding were beneficially owned by one participant account over which BOA and/or any of its affiliates had either sole or joint investment discretion.
Subscription and redemption activity of this account may have a significant effect on the operations of the Fund.
Note 9. Significant Risks and Contingencies
Legal Proceedings
Columbia Management Advisors, LLC and Columbia Management Distributors, Inc. (collectively, the “Columbia Group”) are subject to a settlement agreement with the New York Attorney General (“NYAG”) (the “NYAG Settlement”) and a settlement order with the SEC (the “SEC Order”) on matters relating to mutual fund trading, each dated February 9, 2005. Under the terms of the SEC Order, the Columbia Group (or predecessor entities) agreed, among other things, to: pay disgorgement and civil money penalties collectively totaling $140 million; cease and desist from violations of the antifraud provisions and certain other provisions of the federal securities laws; maintain certain compliance and ethics oversight structures; and retain an independent consultant to review the Columbia Group’s applicable supervisory, compliance, control and other policies and procedures. The NYAG Settlement, among other things, requires Columbia Management Advisors, LLC and its affiliates to reduce management fees for certain funds in the Columbia family of mutual funds in a projected total of $160 million over five years through November 30, 2009 and to make certain disclosures to investors relating to expenses. In connection with the Columbia Group providing services to the Columbia Funds, the Columbia Funds have voluntarily undertaken to implement certain governance measures designed to maintain the independence of their boards of trustees and certain special consulting and compliance measures.
Pursuant to the SEC Order and related procedures, the $140 million in settlement amounts described above has been substantially distributed in accordance with a distribution plan that was developed by an independent distribution consultant and approved by the SEC on April 6, 2007.
In connection with the events described above, various parties have filed suit against certain funds, the Trustees of
23
Columbia U.S. Treasury Index Fund
March 31, 2009
the Columbia Funds, FleetBoston Financial Corporation and its affiliated entities and/or Bank of America and its affiliated entities.
On February 20, 2004, the Judicial Panel on Multidistrict Litigation transferred these cases and cases against other mutual fund companies based on similar allegations to the United States District Court in Maryland for consolidated or coordinated pretrial proceedings (the “MDL”). Subsequently, additional related cases were transferred to the MDL. On September 29, 2004, the plaintiffs in the MDL filed amended and consolidated complaints. One of these amended complaints is a putative class action that includes claims under the federal securities laws and state common law, and that names Columbia Management Advisors, Inc. (which has since merged into Banc of America Capital Management, LLC (now named Columbia Management Advisors, LLC)) (“Columbia”), Columbia Funds Distributor, Inc. (now named Columbia Management Distributors, Inc.) (the “Distributor”), the Trustees of the Columbia Funds, Bank of America Corporation and others as defendants. Another of the amended complaints is a derivative action purportedly on behalf of the Columbia Funds that asserts claims under federal securities laws and state common law.
On February 25, 2005, Columbia and other defendants filed motions to dismiss the claims in the pending cases. On March 1, 2006, for reasons stated in the court’s memoranda dated November 3, 2005, the United States District Court for the District of Maryland granted in part and denied in part the defendants’ motions to dismiss. The court dismissed all of the class action claims pending against the Columbia Funds Trusts. As to Columbia and the Distributor, the claims under the Securities Act of 1933, the claims under Sections 34(b) and 36(a) of the Investment Company Act of 1940 (“ICA”) and the state law claims were dismissed. The claims under Sections 10(b) and 20(a) of the Securities Exchange Act of 1934 and claims under Section 36(b) of the ICA were not dismissed.
On March 21, 2005, a purported class action was filed in Massachusetts state court alleging that certain conduct, including market timing, entitled Class B shareholders in certain Columbia Funds to an exemption from contingent deferred sales charges upon early redemption (the “CDSC Lawsuit”). The CDSC Lawsuit was removed to federal court in Massachusetts and transferred to the MDL.
On September 14, 2007, the plaintiffs and the Columbia defendants named in the MDL, including the Columbia Funds, entered into a stipulation of settlement with respect to all Columbia-related claims in the MDL described above, including the CDSC Lawsuit. The settlement is subject to court approval.
24
Report of Independent Registered Public Accounting Firm
To the Trustees of Columbia Funds Series Trust I and the Shareholders of Columbia U.S. Treasury Index Fund
In our opinion, the accompanying statement of assets and liabilities, including the investment portfolio, and the related statements of operations and of changes in net assets and the financial highlights present fairly, in all material respects, the financial position of Columbia U.S. Treasury Index Fund (the “Fund”) (a series of Columbia Funds Series Trust I) at March 31, 2009, and the results of its operations, the changes in its net assets and the financial highlights for the periods indicated, in conformity with accounting principles generally accepted in the United States of America. These financial statements and financial highlights (hereafter referred to as “financial statements”) are the responsibility of the Fund’s management. Our responsibility is to express an opinion on these financial statements based on our audits. We conducted our audits of these financial statements in accordance with the standards of the Public Company Accounting Oversight Board (United States). Those standards require that we plan and perform the audit to obtain reasonable assurance about whether the financial statements are free of material misstatement. An audit includes examining, on a test basis, evidence supporting the amounts and disclosures in the financial statements, assessing the accounting principles used and significant estimates made by management, and evaluating the overall financial statement presentation. We believe that our audits, which included confirmation of securities at March 31, 2009 by correspondence with the custodian, provide a reasonable basis for our opinion.
PricewaterhouseCoopers LLP
Boston, Massachusetts
May 22, 2009
25
Federal Income Tax Information (Unaudited) – Columbia U.S. Treasury Fund
The Fund hereby designates as a capital gain dividend with respect to the taxable year ended March 31, 2009, $5,000 or, if subsequently determined to be different, the net capital gain of such year.
26
Fund Governance
The Trustees serve terms of indefinite duration. The names, addresses and ages of the Trustees and officers of the Funds in the Columbia Funds Complex, the year each was first elected or appointed to office, their principal business occupations during at least the last five years, the number of Funds overseen by each Trustee and other directorships they hold are shown below. Each officer listed below serves as an officer of each Fund in the Columbia Funds Complex.
Independent Trustees
| | |
Name, Address and Year of Birth,
Position with Funds, Year First
Elected or Appointed to Office | | Principal Occupation(s) During Past Five Years, Number of Funds in the Columbia
Funds Complex Overseen by Trustee, Other Directorships Held |
| |
| John D. Collins (Born 1938) | | |
c/o Columbia Management Advisors, LLC One Financial Center Boston, MA 02111 Trustee (since 2007) | | Retired. Consultant, KPMG, LLP (accounting and tax firm) from July 1999 to June 2000; Partner, KPMG, LLP from March 1962 to June 1999. Oversees 79, Mrs. Fields Famous Brands LLC (consumer products); Suburban Propane Partners, L.P.; and Montpelier Re (underwriting firm) |
| |
| Rodman L. Drake (Born 1943) | | |
c/o Columbia Management Advisors, LLC One Financial Center Boston, MA 02111 Trustee (since 2007) | | Co-Founder of Baringo Capital LLC (private equity) since 2002; President, Continuation Investments Group, Inc. from 1997 to 2001. Oversees 79, Jackson Hewitt Tax Service Inc. (tax preparation services); Crystal Capital River Inc. (real estate investment trust); Student Loan Corporation (student loan provider); Celgene Corporation (global biotechnology company); and The Helios Funds (exchange-traded funds) |
| |
| Douglas A. Hacker (Born 1955) | | |
c/o Columbia Management Advisors, LLC One Financial Center Boston, MA 02111 Trustee (since 1996) | | Independent business executive since May 2006; Executive Vice President–Strategy of United Airlines (airline) from December 2002 to May 2006; President of UAL Loyalty Services (airline marketing company) from September 2001 to December 2002; Executive Vice President and Chief Financial Officer of United Airlines from July 1999 to September 2001. Oversees 79, Nash Finch Company (food distributor); Aircastle Limited (aircraft leasing) |
| |
| Janet Langford Kelly (Born 1957) | | |
c/o Columbia Management Advisors, LLC One Financial Center Boston, MA 02111 Trustee (since 1996) | | Senior Vice President, General Counsel and Corporate Secretary, ConocoPhillips (integrated energy company) since September 2007; Deputy General Counsel–Corporate Legal Services, ConocoPhillips from August 2006 to August 2007; Partner, Zelle, Hofmann, Voelbel, Mason & Gette LLP (law firm) from March 2005 to July 2006; Adjunct Professor of Law, Northwestern University, from September 2004 to June 2006; Director, UAL Corporation (airline) from February 2006 to July 2006; Oversees 79, None |
| |
| Charles R. Nelson (Born 1942) | | |
c/o Columbia Management Advisors, LLC One Financial Center Boston, MA 02111 Trustee (since 1981) | | Professor of Economics, University of Washington, since January 1976; Ford and Louisa Van Voorhis Professor of Political Economy, University of Washington, since September 1993; Director, Institute for Economic Research, University of Washington from September 2001 to June 2003; Adjunct Professor of Statistics, University of Washington, since September 1980; Associate Editor, Journal of Money Credit and Banking, since September 1993; Consultant on econometric and statistical matters. Oversees 79, None |
27
Fund Governance (continued)
Independent Trustees (continued)
| | |
Name, Address and Year of Birth,
Position with Funds, Year First
Elected or Appointed to Office | | Principal Occupation(s) During Past Five Years, Number of Funds in the Columbia
Funds Complex Overseen by Trustee, Other Directorships Held |
| |
| John J. Neuhauser (Born 1943) | | |
c/o Columbia Management Advisors, LLC One Financial Center Boston, MA 02111 Trustee (since 1985) | | President, Saint Michael’s College, since August 2007; University Professor, Boston College from November 2005 to August 2007; Academic Vice President and Dean of Faculties, Boston College from August 1999 to October 2005. Oversees 79, Liberty All-Star Equity Fund and Liberty All-Star Growth Fund, Inc. (closed-end funds) |
| |
| Jonathan Piel (Born 1938) | | |
c/o Columbia Management Advisors, LLC One Financial Center Boston, MA 02111 Trustee (since 2007) | | Cable television producer and website designer; The Editor, Scientific American from 1984 to 1994; Vice President, Scientific American, Inc., from 1984 to 1994; Member, Advisory Board, Stone Age Institute, Bloomington, Indiana (research institute that explores the effect of technology on human evolution); Member, Board of Directors of the National Institute of Social Sciences, New York City; and Member, Board of Trustees of the William Alanson White Institute, New York City (institution for training psychoanalysts). Oversees 79, None |
| |
| Patrick J. Simpson (Born 1944) | | |
c/o Columbia Management Advisors, LLC One Financial Center Boston, MA 02111 Trustee (since 2000) | | Partner, Perkins Coie LLP (law firm). Oversees 79, None |
| |
| Thomas C. Theobald (Born 1937) | | |
c/o Columbia Management Advisors, LLC One Financial Center Boston, MA 02111 Trustee and Chairman of the Board (since 1996) | | Partner and Senior Advisor, Chicago Growth Partners (private equity investing) since September 2004; Managing Director, William Blair Capital Partners (private equity investing) from September 1994 to September 2004. Oversees 79, Anixter International (network support equipment distributor); Ventas, Inc. (real estate investment trust); Jones Lang LaSalle (real estate management services); Ambac Financial Group (financial guaranty insurance) |
| |
| Anne-Lee Verville (Born 1945) | | |
c/o Columbia Management Advisors, LLC One Financial Center Boston, MA 02111 Trustee (since 1998) | | Retired since 1997 (formerly General Manager–Global Education Industry (from 1994 to 1997), President–Application Systems Division (from 1991 to 1994), Chief Financial Officer–US Marketing & Services (from 1988 to 1991), and Chief Information Officer (from 1987 to 1988), IBM Corporation (computer and technology)). Oversees 79, None |
Interested Trustee
| | |
| |
| William E. Mayer1 (Born 1940) | | |
c/o Columbia Management Advisors, LLC One Financial Center Boston, MA 02111 Trustee (since 1994) | | Partner, Park Avenue Equity Partners (private equity) since February 1999; Dean and Professor, College of Business, University of Maryland from 1992 to 1997. Oversees 79, Lee Enterprises (print media), WR Hambrecht + Co. (financial service provider); BlackRock Kelso Capital Corporation (investment company) |
1 | Mr. Mayer is an “interested person” (as defined in the Investment Company Act of 1940) by reason of his affiliation with WR Hambrecht + Co., a registered broker/dealer that may execute portfolio transactions for or engage in principal transactions with the Funds or other funds or accounts advised/managed by the Advisor or other Bank of America affiliates. |
The Statement of Additional Information includes additional information about the Trustees of the Funds and is available, without charge, upon request by calling 1-800-345-6611.
28
Fund Governance (continued)
Officers
| | |
Name, Address and Year of Birth,
Position with Funds, Year First
Elected or Appointed to Office | | Principal Occupation(s) During Past Five Years |
| |
| J. Kevin Connaughton (Born 1964) | | |
One Financial Center Boston, MA 02111 President (since 2009) | | Managing Director of Columbia Management Advisors, LLC since December 2004; Senior Vice President and Chief Financial Officer–Columbia Funds, from June 2008 to January 2009; Treasurer–Columbia Funds, from October 2003 to May 2008; Treasurer–the Liberty Funds, Stein Roe Funds and Liberty All-Star Funds, December 2000–December 2006; Senior Vice President–Columbia Management Advisors, LLC, from April 2003 to December 2004; President–Columbia Funds, Liberty Funds and Stein Roe Funds, February 2004 to October 2004; Treasurer–Galaxy Funds, September 2002 to December 2005; Treasurer, December 2002 to December 2004, and President, February 2004 to December 2004–Columbia Management Multi-Strategy Hedge Fund, LLC; and a senior officer of various other Bank of America-affiliated entities, including other registered and unregistered funds. |
|
| James R. Bordewick, Jr. (Born 1959) |
One Financial Center Boston, MA 02111 Senior Vice President, Secretary and Chief Legal Officer (since 2006) | | Associate General Counsel, Bank of America since April 2005; Senior Vice President and Associate General Counsel, MFS Investment Management (investment management) prior to April 2005. |
| |
| Linda J. Wondrack (Born 1964) | | |
One Financial Center Boston, MA 02111 Senior Vice President and Chief Compliance Officer (since 2007) | | Director (Columbia Management Group LLC and Investment Product Group Compliance), Bank of America since June 2005; Director of Corporate Compliance and Conflicts Officer, MFS Investment Management (investment management), August 2004 to May 2005; Managing Director, Deutsche Asset Management (investment management) prior to August 2004. |
| |
| Michael G. Clarke (Born 1969) | | |
One Financial Center Boston, MA 02111 Senior Vice President and Chief Financial Officer (since 2009) | | Director of Fund Administration of the Advisor since January 2006; Managing Director of the Advisor September 2004 to December 2005; Vice President Fund Administration June 2002 to September 2004. |
| |
| Jeffrey R. Coleman (Born 1969) | | |
One Financial Center Boston, MA 02111 Deputy Treasurer (since 2008) | | Director of Fund Administration of the Advisor since January 2006; Fund Controller of the Advisor from October 2004 to January 2006; Vice President of CDC IXIS Asset Management Services, Inc. (investment management) from August 2000 to September 2004. |
| |
| Joseph F. DiMaria (Born 1968) | | |
One Financial Center Boston, MA 02111 Chief Accounting Officer and Treasurer (since 2009) | | Director of Fund Administration of the Advisor since January 2006; Head of Tax/Compliance and Assistant Treasurer of the Advisor from November 2004 to December 2005; Director of Trustee Administration (Sarbanes-Oxley) of the Advisor from May 2003 to October 2004. |
29
Fund Governance (continued)
Officers (continued)
| | |
Name, Address and Year of Birth,
Position with Funds, Year First
Elected or Appointed to Office | | Principal Occupation(s) During Past Five Years |
| |
| Julian Quero (Born 1967) | | |
One Financial Center Boston, MA 02111 Deputy Treasurer (since 2008) | | Senior Tax Manager of the Advisor since August 2006; Senior Compliance Manager of the Advisor from April 2002 to August 2006. |
| |
| Barry S. Vallan (Born 1969) | | |
One Financial Center Boston, MA 02111 Controller (since 2006) | | Vice President–Fund Treasury of the Advisor since October 2004; Vice President–Trustee Reporting of the Advisor from April 2002 to October 2004 |
30
Board Consideration and Approval of Advisory Agreements
The Advisory Fees and Expenses Committee of the Board of Trustees meets several times annually to review the advisory agreements (collectively, the “Agreements”) of the funds for which the Trustees serve as trustees (each a “fund”) and to determine whether to recommend that the full Board approve the continuation of the Agreements for an additional one-year period. After the Committee has made its recommendation, the full Board, including the Independent Trustees, determines whether to approve the continuation of the Agreements. In addition, the full Board, including the Independent Trustees, considers matters bearing on the Agreements at most of its other meetings throughout the year and meets regularly with senior management of the funds and Columbia, the funds' investment adviser, including the senior manager of each investment area within Columbia. Through the Board’s Investment Oversight Committees, Trustees also meet with selected fund portfolio managers, research analysts and traders at various times throughout the year.
The Trustees receive and review all materials that they, their legal counsel or Columbia believe to be reasonably necessary for the Trustees to evaluate the Agreements and to determine whether to approve the continuation of the Agreements. Those materials generally include, among other items, (i) information on the investment performance of each fund relative to the performance of peer groups of mutual funds and the fund’s performance benchmarks, and additional information assessing performance on a risk-adjusted basis, (ii) information on each fund’s advisory fees and other expenses, including information comparing the fund’s expenses to those of peer groups of mutual funds and information about any applicable expense caps and fee “breakpoints,” (iii) information about the profitability of the Agreements to Columbia, including potential “fall-out” or ancillary benefits that Columbia and its affiliates may receive as a result of their relationships with the funds and (iv) information obtained through Columbia’s response to a questionnaire prepared at the request of the Trustees by counsel to the funds and independent legal counsel to the Independent Trustees. The Trustees also consider other information such as (v) Columbia’s financial results and financial condition, (vi) each fund’s investment objective and strategies and the size, education and experience of Columbia’s investment staffs and their use of technology, external research and trading cost measurement tools, (vii) the allocation of the funds’ brokerage and the use of “soft” commission dollars to pay for research products and services, (viii) Columbia’s resources devoted to, and its record of compliance with, the funds’ investment policies and restrictions, policies on personal securities transactions and other compliance policies and legal and regulatory requirements, (ix) Columbia’s response to various legal and regulatory proceedings since 2003 and to the recent period of volatility in the securities markets and (x) the economic outlook generally and for the mutual fund industry in particular. In addition, the Advisory Fees and Expenses Committee confers with the funds’ independent fee consultant and reviews materials relating to the funds’ relationships with Columbia provided by the independent fee consultant. Throughout the process, the Trustees have the opportunity to ask questions of and to request additional materials from Columbia and to consult with the independent fee consultant and independent legal counsel to the Independent Trustees.
The Board of Trustees most recently approved the continuation of the Agreements at its October, 2008 meeting, following meetings of the Advisory Fees and Expenses Committee held in February, April, August, September and October, 2008. In considering whether to approve the continuation of the Agreements, the Trustees, including the Independent Trustees, did not identify any single factor as determinative, and each weighed various factors as he or she deemed appropriate. The Trustees considered the following matters in connection with their approval of the continuation of the Agreements:
The nature, extent and quality of the services provided to the funds under the Agreements. The Trustees considered the nature, extent and quality of the services provided by Columbia and its affiliates to the funds and the resources dedicated to the funds by Columbia and its affiliates. Among other things, the Trustees considered (i) Columbia’s ability (including its personnel and other resources, compensation programs for personnel involved in fund management, reputation and other attributes) to attract, motivate and retain highly qualified research, advisory and supervisory investment professionals; (ii) the portfolio management services provided by those investment professionals; and (iii) the trade execution services provided on behalf of the funds. For each fund, the Trustees also considered the benefits to shareholders of investing in a mutual fund that is
31
part of a family of funds offering exposure to a variety of asset classes and investment disciplines and providing a variety of fund and shareholder services. After reviewing those and related factors, the Trustees concluded, within the context of their overall conclusions regarding each of the Agreements, that the nature, extent and quality of services provided supported the continuation of the Agreements.
Investment performance of the funds and Columbia. The Trustees reviewed information about the performance of each fund over various time periods, including information prepared by an independent third-party data provider that compared the performance of each fund to the performance of peer groups of mutual funds and performance benchmarks. The Trustees also reviewed a description of the third party’s methodology for identifying each fund’s peer group for purposes of performance and expense comparisons. The Trustees also considered additional information that the Advisory Fees and Expenses Committee requested from Columbia relating to funds that presented relatively weaker performance and/or relatively higher expenses. In the case of each fund whose performance lagged that of a relevant peer group for certain (although not necessarily all) periods, the Trustees concluded that other factors relevant to performance were sufficient, in light of other considerations, to warrant continuation of the fund’s Agreements. Those factors varied from fund to fund, but included one or more of the following: (i) that the fund’s performance, although lagging in certain recent periods, was stronger over the longer term; (ii) that the underperformance was attributable, to a significant extent, to investment decisions that were reasonable and consistent with the fund’s investment strategy and policies and that the fund was performing within a reasonable range of expectations, given those investment decisions, market conditions and the fund’s investment strategy; (iii) that the fund’s performance was competitive when compared to other relevant performance benchmarks or peer groups; (iv) that Columbia had taken or was taking steps designed to help improve the fund’s investment performance, including, but not limited to, replacing portfolio managers or modifying investment strategies; and (v) that Columbia proposed to waive advisory fees or cap the expenses of the fund.
The Trustees noted that, through April 30, 2008, Columbia U.S. Treasury Index Fund’s performance was in the fourth quintile (where the best performance would be in the first quintile) for the one-, three-, five- and ten-year periods, of the peer group selected by an independent third-party data provider for purposes of performance comparisons.
The Trustees also considered Columbia’s performance and reputation generally, the funds’ performance as a fund family generally, and Columbia’s historical responsiveness to Trustee concerns about performance and Columbia’s willingness to take steps intended to improve performance. After reviewing those and related factors, the Trustees concluded, within the context of their overall conclusions regarding each of the Agreements, that the performance of each fund and Columbia was sufficient, in light of other considerations, to warrant the continuation of the Agreement(s) pertaining to that fund.
The costs of the services provided and profits realized by Columbia and its affiliates from their relationships with the funds. The Trustees considered the fees charged to the funds for advisory services as well as the total expense levels of the funds. That information included comparisons (provided by management and by an independent third-party data provider) of each fund’s advisory fees and total expense levels to those of the fund’s peer groups and information about the advisory fees charged by Columbia to comparable institutional accounts. In considering the fees charged to those accounts, the Trustees took into account, among other things, management’s representations about the differences between managing mutual funds as compared to other types of accounts, including differences in the services provided, differences in the risk profile of such business for Columbia, and the additional resources required to manage mutual funds effectively. In evaluating each fund’s advisory fees, the Trustees also took into account the demands, complexity and quality of the investment management of the fund. The Trustees considered existing advisory fee breakpoints, and Columbia’s use of advisory fee waivers and expense caps, which benefited a number of the funds. The Trustees also noted management’s stated justification for the fees charged to the funds, which included information about the investment performance of the funds and the services provided to the funds.
The Trustees considered that Columbia U.S. Treasury Index Fund's total expenses and actual management fees were in the fifth quintile (where the lowest fees and expenses would be in the first quintile) of the peer group selected by an
32
independent third-party data provider for purposes of expense comparisons.
The Trustees also considered the compensation directly or indirectly received by Columbia and its affiliates from their relationships with the funds. The Trustees reviewed information provided by management as to the profitability to Columbia and its affiliates of their relationships with each fund, and information about the allocation of expenses used to calculate profitability. When reviewing profitability, the Trustees also considered court cases in which adviser profitability was an issue in whole or in part, the performance of the relevant funds, the expense level of each fund, and whether Columbia had implemented breakpoints and/or expense caps with respect to the fund.
After reviewing those and related factors, the Trustees concluded, within the context of their overall conclusions regarding each of the Agreements, that the advisory fees charged to each fund, and the related profitability to Columbia and its affiliates of their relationships with the fund, supported the continuation of the Agreement(s) pertaining to that fund.
Economies of Scale. The Trustees considered the existence of any economies of scale in the provision by Columbia of services to each fund, to groups of related funds, and to Columbia’s investment advisory clients as a whole and whether those economies were shared with the funds through breakpoints in the investment advisory fees or other means, such as fee waivers/expense reductions and additional investments by Columbia in investment, trading and compliance resources. The Trustees noted that many of the funds benefited from breakpoints, fee waivers/expense caps, or both. In considering those issues, the Trustees also took note of the costs of the services provided (both on an absolute and a relative basis) and the profitability to Columbia and its affiliates of their relationships with the funds, as discussed above.
After reviewing those and related factors, the Trustees concluded, within the context of their overall conclusions regarding each of the Agreements, that the extent to which economies of scale were shared with the funds supported the continuation of the Agreements.
Other Factors. The Trustees also considered other factors, which included but were not limited to the following:
| n | | the extent to which each fund had operated in accordance with its investment objective and investment restrictions, the nature and scope of the compliance programs of the funds and Columbia and the compliance-related resources that Columbia and its affiliates were providing to the funds; |
| n | | the nature, quality, cost and extent of administrative and shareholder services overseen and performed by Columbia and its affiliates, both under the Agreements and under separate agreements for the provision of transfer agency and administrative services; |
| n | | so-called “fall-out benefits” to Columbia and its affiliates, such as the engagement of its affiliates to provide distribution, brokerage and transfer agency services to the funds, and the benefits of research made available to Columbia by reason of brokerage commissions generated by the funds’ securities transactions, as well as possible conflicts of interest associated with those fall-out and other benefits, and the reporting, disclosure and other processes in place to disclose and monitor those possible conflicts of interest; and |
| n | | the report provided by the funds’ independent fee consultant, which included information about and analysis of the funds’ fees, expenses and performance. |
Based on their evaluation of all factors that they deemed to be material, including those factors described above, and assisted by the advice of independent counsel and the independent fee consultant, the Trustees, including the Independent Trustees, approved the continuance of each of the Agreements through October 31, 2009.
33
Summary of Management Fee Evaluation by Independent Fee Consultant
EXCERPTS FROM REPORT OF INDEPENDENT FEE CONSULTANT TO THE FUNDS SUPERVISED BY THE COLUMBIA ATLANTIC BOARD
Prepared Pursuant to the February 9, 2005 Assurance of Discontinuance among the Office of Attorney General of New York State, Columbia Management Advisors, LLC, and Columbia Management Distributors, Inc. November 3, 2008
I. Overview
On February 9, 2005, Columbia Management Advisors, LLC (“CMA”) and Columbia Management Distributors, Inc.1 (“CMD”) agreed to the New York Attorney General’s Assurance of Discontinuance (“AOD”). Among other things, the AOD stipulates that CMA may manage or advise a Columbia Fund (“Columbia Fund” and, together with some or all of, such funds the “Columbia Funds”) only if the Independent Members of the Columbia Fund’s Board of Trustees appoint a Senior Officer or retain an Independent Fee Consultant (“IFC”) who is to manage the process by which proposed management fees are negotiated. The AOD further stipulates that the Senior Officer or IFC is to prepare a written annual evaluation of the fee negotiation process.
With effect from January 1, 2007, the Independent Members of the Board of Trustees for certain Columbia Funds known collectively as the “Atlantic Funds” (together with the other members of that Board, the “Trustees”) retained me as IFC for the Atlantic Funds.2 In this capacity, I have prepared the fourth annual written evaluation of the fee negotiation process. As was the case with last year’s report (the “2007 Report”) my immediate predecessor as IFC, John Rea, provided invaluable assistance in the preparation of this year’s report.
A. Role of the Independent Fee Consultant
The AOD charges the IFC with “managing the process by which proposed management fees…to be charged the Columbia Fund are negotiated so that they are negotiated in a
manner which is at arms’ length and reasonable and consistent with this Assurance of Discontinuance.” The AOD also provides that CMA “may manage or advise a Columbia Fund only if the reasonableness of the proposed management fees is determined by the Board of Trustees…using…an annual independent written evaluation prepared by or under the direction of…the Independent Fee Consultant.” Therefore, the AOD makes clear that the IFC does not supplant the Trustees in negotiating management fees with CMA, nor does the IFC substitute his or her judgment for that of the Trustees with respect to the reasonableness of proposed fees or any other matter that is committed to the business judgment of the Trustees.
B. Elements Involved in Managing the Fee Negotiation Process
In preparing the report required by the AOD, the IFC must consider at least the following six factors set forth in the AOD:
| 1. | The nature and quality of CMA’s services, including the Fund’s performance; |
| 2. | Management fees (including any components thereof) charged by other mutual fund companies for like services; |
| 3. | Possible economies of scale as the Fund grows larger; |
| 4. | Management fees (including any components thereof) charged to institutional and other clients of CMA for like services; |
| 5. | Costs to CMA and its affiliates of supplying services pursuant to the management fee agreements, excluding any intra-corporate profit; and |
| 6. | Profit margins of CMA and its affiliates from supplying such services. |
C. Organization of the Annual Evaluation
This report, like last year’s, focuses on the six factors and contains a section for each factor except that CMA’s costs and profits from managing the Funds have been combined into a single section. In addition to a discussion of these factors, the report offers recommendations to improve the fee review process in future years. A review of the status of
1 | CMA and CMD are subsidiaries of Columbia Management Group, LLC (“CMG”), and are the successors to the entities named in the AOD. |
2 | I have no material relationship with Bank of America, CMG or any of its affiliates, aside from serving as IFC, and I am aware of no material relationship with any of their affiliates. I retained John Rea, an independent economic consultant, to assist me with this report. |
| | Unless otherwise stated or required by the context, this report covers only the Nations Funds, which are also referred as the “Funds.” |
34
recommendations made in the 2007 Report is being provided separately with the materials for the October meeting.
II. Summary of Findings
A. General
| 1. | Based upon my examination of the information supplied by CMG in the light of the six factors set forth in the AOD, I conclude that the Trustees have the relevant information necessary to evaluate the reasonableness of the proposed management fees for each Atlantic Fund. |
| 2. | In my view, the process by which the proposed management fees of the Funds have been negotiated in 2008 thus far has been, to the extent practicable, at arms’ length and reasonable and consistent with the AOD. |
B. Nature and Quality of Services, Including Performance
| 3. | The performance of the Funds has been relatively strong in recent years. Based upon 1-, 3-, 5-, and 10-year returns through April 30, 2008, at least half of all the Funds were in the first and second performance quintiles in each of the four performance periods and, at most, only 11% were in the fifth quintile in any one performance period. Both equity and fixed-income funds posted strong performance relative to comparable funds. |
| 4. | Performance rankings were similar in 2007 and 2008, although last year’s were slightly stronger. Despite the stability in the distribution of rankings in the two years, at least half the Funds changed quintile rankings between the two years in at least one of the 1-, 3-, and 5-year performance periods. |
| 5. | The performance of the actively managed equity Funds against their benchmarks was very strong. At least 57% and as many as 73% posted net returns exceeding their benchmarks over the 1-, 3-, and 5-year periods. In contrast, gross and net returns of fixed-income Funds typically fell short of their benchmarks. |
| 6. | Atlantic equity Funds’ overall performance adjusted for risk also was strong. Based upon 3-year returns, nearly 80% of the equity Funds had a combination of risk-adjusted and unadjusted returns that placed them in the top half of their performance universes. Only about one-fifth of the fixed income Funds posted high returns and low risk relative to comparable funds. About two-thirds of the fixed-income Funds took on more risk than the typical fund in their performance universes. |
| 7. | The industry-standard procedure used by Lipper that includes all share classes in the performance universe tends to bias a Fund’s ranking upward within that universe. The bias occurs because either no-12b-1 fee or low-12b-1 fee share classes of the Atlantic Funds are compared with funds in performance universes that include all share classes of multi-class funds with 12b-1 fees of up to 100 basis points. Correcting this bias by limiting the performance universe to classes of comparable funds with low or no 12b-1 fees (a “filtered universe”) lowers the relative performance for the Funds, but their performance, on the whole, remains strong. The filtering process, however, did identify two Funds for further review that had not been designated review funds using unfiltered universes. |
| 8. | A small number of Funds have consistently underperformed over the past four years. The exact number depends on the criteria used to evaluate longer-term performance. For example, the one-year returns of one Fund have been in the fourth or fifth performance quintiles in each of the past four years; there are six Funds whose three-year returns have been in the fourth or fifth quintile over the past four years. |
| 9. | The services performed by CMG professionals beyond portfolio management, such as compliance, legal, information technology, risk management, finance and fund administration, are critical to the success of the Funds and appear to be of high quality. |
C. Management Fees Charged by Other Mutual Fund Companies
| 10. | The Funds’ management fees and total expenses are generally low relative to those of their peers. Only 21% of the Funds ranked in the two most expensive quintiles for actual management fees, and only 23% in those quintiles for total expenses. |
| 11. | The highest concentration of low-expense Funds is found among the equity and tax-exempt fixed income Funds. The 12 former Excelsior Funds have relatively high fees and expenses, with half of those Funds ranking in either the fourth or fifth quintiles. The higher actual management fee |
35
| | rankings of certain Excelsior Funds are due in part to fee schedules that are higher than standard Columbia Fund fee schedules at current asset levels. After discussion with the Trustees, CMA is proposing to lower the management fees on three of these Funds. |
| 12. | The distribution of expense rankings is similar in 2007 and 2008, while management fee rankings improved markedly in 2008. Part of the improvement reflects expense limitations introduced last year for the state intermediate municipal bond Funds. |
| 13. | The management fees of the Atlantic Funds are generally in line with those of Columbia Funds supervised by the Nations Board of Trustees (the “Nations Funds”). In investment categories in which the Atlantic Funds have higher average fees, the difference principally arises out of differences in asset size. |
D. Trustees’ Fee and Performance Evaluation Process
| 14. | The Trustees’ evaluation process identified 17 Funds in 2008 for further review based upon their relative performance or expenses or both. When compared in filtered universes, two more Funds met the criteria for further review. CMG provided further information about those Funds to assist the Trustees in their evaluation. |
E. Potential Economies of Scale
| 15. | CMG presented to the Trustees its analysis of the sources and sharing of potential economies of scale. CMG views economies of scale as arising at the complex level and would regard estimates of scale economies for individual funds as unreliable. In its analysis, CMG did not identify specific sources of economies of scale or provide any estimates of any economies of scale that might arise from future asset growth. CMG’s analysis included measures taken by the Trustees and CMG that seek to share any potential economies of scale through breakpoints in management fee schedules, expense reimbursements, fee waivers, enhanced shareholder services, fund mergers, and operational consolidation. |
| 16. | An examination of the contractual fee schedules for five Atlantic Funds shows that they are generally in line with those of their competitors, in terms of number and extent of fee breakpoints. A similar examination last year of five different Funds led to the same conclusion. |
F. Management Fees Charged to Institutional Clients
| 17. | CMG has provided Trustees with comparisons of mutual fund management fees and institutional fees based upon standardized fee schedules and upon actual fees. The results show that, consistent with industry practice, institutional fees are generally lower than the Funds’ management fees. However, because the services provided and risks borne by the manager are more extensive for mutual funds compared to institutional accounts, the differences are of limited value in assisting the Trustees in their review of the reasonableness of the Funds’ management fees. |
G. Revenues, Expenses, and Profits
| 18. | The activity-based cost allocation methodology (“ABC”) employed by CMG to allocate costs, both direct and indirect, for purposes of calculating Fund profitability is thoughtful and detailed. This year, CMG proposed a change to the method by which indirect expenses are allocated. Under this “hybrid” method, indirect costs relating to fund management are allocated among the Funds 50% by assets and 50% per Fund. Allocating indirect expenses equally to each Fund has an intuitive logic, as each Fund regardless of size has certain expenses, such as preparing and printing prospectuses and financial statements. |
| 19. | The materials provided on CMG’s revenues and expenses with respect to the Funds and the methodology underlying their construction form a sufficient basis for Trustees to evaluate the expenses and profitability of the Funds. |
| 20. | In 2007, CMG’s complex-wide pre-tax margins on the Atlantic Funds were slightly below industry medians, based on limited data available for publicly held mutual fund managers. However, as is to be expected in a complex now comprising 75 Funds (including former Excelsior Funds), some Atlantic Funds have relatively high pre-tax profit margins, when calculated solely with respect to management revenues and expenses, while other Atlantic Funds operate at a loss. There is a positive relationship between fund size and profitability, with smaller funds generally operating at a loss. |
| 21. | CMG pays a fixed percentage of its management fee revenues to an affiliate, U.S. Trust, Bank of America |
36
| | Private Wealth Management, to compensate it for services it performs with respect to Atlantic Fund assets held for the benefit of its customers. Based on our analysis of the services provided by this affiliate, we have concluded that all payments other than those for sub-transfer agent or sub-accounting services should be treated as a distribution expense. |
III. Recommendations
| 1) | Criteria for review. The Trustees may wish to consider modifying the criteria for classifying a fund as a “Review Fund” to include criteria that focus exclusively on performance without regard to expense or fee levels. For example, a fund whose one-year or three-year performance was median or below for four consecutive years could be treated as a Review Fund. When we applied such criteria to the Funds, several additional Funds would have been added to the list of Review Funds. |
| 2) | Profitability data. CMG should present to the Trustees each year the profitability of each Fund, each investment style and each complex (of which Atlantic is one) calculated as follows: |
| | a. | Management-only profitability should be calculated without reference to any Private Bank expense. |
| | b. | Profitability excluding distribution (which essentially covers the management and transfer agency functions) should be adjusted by removing from the expense calculation any portion of the Private Bank payment not attributable to the performance by the Private Bank of sub-transfer agency or sub-accounting functions. |
| | c. | Total profitability, including distribution: No adjustment for Private Bank expenses should be made, because all such expenses represent legitimate fund expenses to be taken into account in calculating CMG’s profit margin including distribution. |
| | d. | Distribution only: This should include all Private Bank expenses other than those attributable to sub-transfer agency services. |
Therefore, the following data need not be provided:
| | 1. | Adjusting total profitability data for Private Bank expenses |
| | 2. | Adjusting profitability excluding distribution by backing out all Private Bank expenses. |
| 3) | Potential economies of scale. CMG and the IFC should continue to work on methods for more precisely quantifying to the extent possible the sources and magnitude of any economies of scale as CMG’s mutual fund assets under management increase, to the extent that the data allows for meaningful year-over-year comparisons. The framework suggested in Section IV.D.4 may prove to be a useful model for such an analysis. |
| 4) | Competitive breakpoint analysis. As part of the annual fee evaluation process, the breakpoints of a select group of Atlantic Funds (which would differ each year) should continue to be compared to those of industry rivals to ensure that the Funds’ breakpoint schedules remain within industry norms. As breakpoint schedules change relatively little each year, performing such a comparison for each Atlantic Fund each year would not be an efficient use of Trustee and CMG resources. |
| 5) | Cost allocation methodology. CMG’s point that the current ABC system of allocating indirect expenses creates anomalous results in several cases, including sub-advised Funds, is well-taken. We would like to work with CMG over the forthcoming year on alternatives to the current system of allocating indirect expenses that (1) resolve the anomalies, (2) limit the amount of incremental effort on CMG’s part and (3) remain faithful to the general principle that expenses should be allocated by time and effort to the extent reasonably possible. |
| 6) | Management fee disparities. CMG and the Atlantic Trustees, as part of any future study of management fees, should analyze the differences in management fee schedules, principally arising out of the reorganization of the former Excelsior Funds as Atlantic Funds. As part of that analysis, CMG should provide an explanation for any significant fee differences among comparable funds across fund families managed by CMA, such as differences in the management styles of different Funds included the same Lipper category. Finally, whenever CMG proposes a management fee change or an expense cap for any mutual fund managed by CMA that is comparable to any Atlantic Fund, CMG should provide the Trustees with sufficient information about the proposal to allow the Trustees to assess the applicability of the proposed change to the relevant Atlantic Fund or Funds. |
37
| 7) | Tax-exempt Fund expense data. The expense rankings of certain tax-exempt Funds were adversely affected by including certain investment-related interest expenses that Lipper excluded in calculating the expense ratios of competitors. We recommend that CMG follow the Lipper practice and exclude such interest expenses from data submitted to Lipper to avoid unfairly disadvantaging the tax-exempt Funds. |
| 8) | Reduction of volume of paper documents submitted. The effort to rationalize and simplify the data presented to the Trustees and the process by which that data was prepared and organized was regarded as a success by all parties. We should continue to look for opportunities to reduce and simplify the presentation of 15(c) data, especially in the area of Fund profitability. The Fund “Dashboard” volume presents a large volume of Fund data on a single page. If it is continued, the Trustees may wish to consider receiving the underlying Lipper data on CD, rather than the current paper volumes. |
Respectfully submitted,
Steven E. Asher
38
[THIS PAGE INTENTIONALLY LEFT BLANK]
39
[THIS PAGE INTENTIONALLY LEFT BLANK]
40
Important Information About This Report – Columbia U.S. Treasury Index Fund
The fund mails one shareholder report to each shareholder address. If you would like more than one report, please call shareholder services at 1-800-345-6611 and additional reports will be sent to you. This report has been prepared for shareholders of Columbia U.S. Treasury Index Fund.
A description of the policies and procedures that the fund uses to determine how to vote proxies and a copy of the fund’s voting records are available (i) at www.columbiamanagement.com; (ii) on the Securities and Exchange Commission’s website at www.sec.gov, and (iii) without charge, upon request, by calling 1-800-368-0346. Information regarding how the fund voted proxies relating to portfolio securities during the 12-month period ended June 30 is available from the SEC’s website. Information regarding how the fund voted proxies relating to portfolio securities is also available from the fund’s website, www.columbiamanagement.com.
The fund files a complete schedule of portfolio holdings with the SEC for the first and third quarters of each fiscal year on Form N-Q. The fund’s Form N-Q is available on the SEC’s website at www.sec.gov and may be reviewed and copied at the SEC’s Public Reference Room in Washington, D.C. Information on the operation of the Public Reference Room may be obtained by calling
1-800-SEC-0330.
Please read and consider the investment objectives, risks, charges and expenses for any fund carefully before investing. For a prospectus which contains this and other important information about a fund, contact your Columbia Management representative or financial advisor or go to www.columbiamanagement.com.
Columbia Management Group, LLC (“Columbia Management”) is the investment management division of Bank of America Corporation. Columbia Management entities furnish investment management services and products for institutional and individual investors. Columbia Funds are distributed by Columbia Management Distributors, Inc., member of FINRA, SIPC, part of Columbia Management and an affiliate of Bank of America Corporation.
Transfer Agent
Columbia Management Services, Inc.
P.O. Box 8081
Boston, MA 02266-8081
1-800-345-6611
Distributor
Columbia Management
Distributors, Inc.
One Financial Center
Boston, MA 02111
Investment Advisor
Columbia Management Advisors, LLC
100 Federal Street
Boston, MA 02110
41

One Financial Center
Boston, MA 02111-2621
Columbia U.S. Treasury Index Fund
Annual Report, March 31, 2009
©2009 Columbia Management Distributors, Inc.
One Financial Center, Boston, MA 02111-2621
800.345.6611 www.columbiafunds.com
SHC-42/10818-0309 (05/09) 09/78776

Annual Report
March 31, 2009
Columbia World Equity Fund
| | |
| NOT FDIC INSURED | | May Lose Value |
| NOT BANK ISSUED | | No Bank Guarantee |
Table of contents
The views expressed in this report reflect the current views of the respective parties. These views are not guarantees of future performance and involve certain risks, uncertainties and assumptions that are difficult to predict, so actual outcomes and results may differ significantly from the views expressed. These views are subject to change at any time based upon economic, market or other conditions and the respective parties disclaim any responsibility to update such views. These views may not be relied on as investment advice and, because investment decisions for a Columbia Fund are based on numerous factors, may not be relied on as an indication of trading intent on behalf of any particular Columbia Fund. References to specific securities should not be construed as a recommendation or investment advice.
President’s Message

Dear Shareholder:
Recent events have shown great volatility in the markets and uncertainty in the economy. During these challenging times, it becomes even more important to focus on long-term horizons and key investment tools that can help manage volatility. This may be the time to reflect on your investment goals and evaluate your portfolio to ensure you are positioned for any potential market rebound.
A long-term financial plan can serve as a road map and guide you through the necessary steps designed to meet your financial goals. Your financial plan should take into account your investment goals, time horizon, overall financial situation, risk tolerance and willingness to ride out market volatility. Your investment professional can be a key resource as you work through this process. The knowledge and experience of an investment professional can help as you create or reevaluate your investment strategy.
The importance of diversification
Although diversification does not ensure a profit or guarantee against loss, a diversified portfolio can be a strategy for successful long-term investing. Diversification refers to the mix of investments within a portfolio. A mutual fund can contribute to portfolio diversification given that a mutual fund’s portfolio represents several investments. Additionally, the way you allocate your money among stocks, bonds and cash, and geographically between foreign and domestic investments, can help to reduce risks. Diversification can result in multiple investments where the positive performance of certain holdings can offset any negative performance from other holdings. Having a diversified portfolio doesn’t mean that the value of the portfolio will never go down, but rather helps strike a balance between risk and reward.
Reevaluate your strategy
An annual review of your investments is a key opportunity to determine if your investment needs have changed or if you need minor adjustments to rebalance your portfolio. Life events like a birth, marriage, home improvement, or change in employment can have a major affect on your spending and goals. Ask yourself how your spending or goals have changed and factor this into your financial plan. Are you using automated investments or payroll deductions to help keep your savings on track? Are you able to set aside additional savings or increase your 401(k) plan contributions? If during your review you find that your investments in any one category (e.g., stocks, bonds or cash) have grown too large based on your diversification plan, you may want to consider redirecting future investments to get back on track.
History has shown that the U.S. stock market has been remarkably resilient¹. Volatility can lead to opportunity. Patience and a commitment to your long-term financial plan may position you to potentially benefit over your investment horizon. We appreciate your business and continued support of Columbia Funds.
Sincerely,

J. Kevin Connaughton
President, Columbia Funds
The Board of Trustees elected J. Kevin Connaughton president of Columbia Funds on January 16, 2009.
1 | The Dow Jones Industrial Average is the most widely used indicator of the overall condition of the stock market. The Dow Jones Industrial Average Index is a price-weighted average of 30 actively traded blue-chip stocks as selected by the editors of the Wall Street Journal. Indices are not investments, do not incur fees or expenses and are not professionally managed. It is not possible to invest directly in an index. |
Fund Profile – Columbia World Equity Fund
Performance data quoted represents past performance and current performance may be lower or higher. Past performance is no guarantee of future results. The investment return and principal value will fluctuate so that shares, when redeemed, may be worth more or less than the original cost. Please visit www.columbiafunds.com for daily and most recent month-end performance updates.
Summary
1-year return as of 03/31/09
| | |
| |
 | | –42.79% Class A shares |
| | (without sales charge) |
| |
| | –42.58% MSCI World Index |
Morningstar Style Box™
Equity Style
The Morningstar Style BoxTM reveals a fund’s investment strategy. For equity funds, the vertical axis shows the market capitalization of the stocks owned and the horizontal axis shows a fund’s investment style (value, blend or growth). Information shown is based on the most recent data provided by Morningstar.
The Morgan Stanley Capital International (MSCI) World Index tracks the performance of global stocks.
Indices are not available for investment, and do not reflect sales charges, fees, brokerage commissions, taxes or other expenses of investing. Securities in the fund may not match those in an index.
Summary
| n | | For the 12-month period that ended March 31, 2009, the fund’s Class A shares returned negative 42.79% without sales charge. |
n | | In an environment of declining economic growth and falling stock prices, the fund, its benchmark and the average fund in its peer group, the Lipper Global Multi-Cap Core Classification,1 all lost 40% or more. |
| n | | An overweight in industrials and an underweight in the telecommunications sector, which experienced less of a decline than other areas, held back return. Underweighting large U.S. and European banks was helpful as was an emphasis on insurance companies that had little exposure to credit risk and declined less than other financial companies. |
Portfolio Management
Fred Copper has co-managed the fund since 2005 and has been with the advisor or its predecessors or affiliate organizations since 2005.
Colin Moore has co-managed the fund since 2004 and has been with the advisor or its predecessors or affiliate organizations since 2002.
1 | Lipper Inc., a widely respected data provider in the industry, calculates an average total return (assuming reinvestment of distributions) for mutual funds with investment objectives similar to those of the fund. Lipper makes no adjustment for the effect of sales loads. |
1
Economic Update – Columbia World Equity Fund
Summary
For the 12-month period that ended March 31, 2009
| | n | | Stock markets across the world fell sharply, as measured in U.S. dollars by the MSCI World Index and the MSCI EAFE Index. A rising dollar further depressed losses from investments in foreign markets. | |
| | |
| MSCI World Index | | MSCI EAFE Index |
| |

| |
|
–42.58% | | –46.51% |
The Morgan Stanley Capital International (MSCI) World Index tracks the performance of global stocks.
The Morgan Stanley Capital International (MSCI) Europe, Australasia, Far East (EAFE) Index is a free float-adjusted market capitalization index that is designed to measure developed market equity performance excluding the U.S. and Canada.
Indices are not available for investment, and do not reflect sales charges, fees, brokerage commissions, taxes or other expenses of investing. Securities in the fund may not match those in an index.
Economic growth slowed around the world during the 12-month period that began April 1, 2008 and ended March 31, 2009. Most major developed economies slipped into recession by 2008, with little relief in sight for the first half of 2009. In the United States, the downturn was even sharper than some anticipated. Fourth quarter 2008 growth was reported at negative 6.3% — the worst quarter on record for the U.S. economy since 1982. The United Kingdom, Germany, Japan, South Korea and Singapore are also in recession. Although emerging markets have largely avoided recession, the global slowdown has taken the steam out of their economic growth as exports to developed markets fell off sharply.
Troubles in global financial system
Troubles that began in the U.S. subprime mortgage market spread across Europe and entangled the world’s financial systems during the 12-month period. A meltdown within the U.S. financial sector claimed several major institutions and led others to seek bailouts, restructuring or both. Central banks around the world stepped in to infuse liquidity as credit dried up in 2008. Conditions have since eased, but more rigorous lending standards have severely limited access to credit in both developed and emerging markets, further hampering economic growth.
In the United States, unemployment has risen sharply over the past year, putting pressure on consumer spending. Western Europe and Japan, which rely heavily on exports, have experienced sharp declines in export trade. A weak housing market prevails in the United States and the United Kingdom. Even China’s economy has exhibited signs of weakness. In the last quarter of 2008, annualized gross domestic product fell to 6.8%, compared to more than 13% in 2007.1 An estimated 20 million jobs have been lost in China, according to moodys.com. India reports a loss of 3 million jobs due to shrinking exports.
Many central banks have reduced short-term borrowing rates while governments have increased spending in an effort to stimulate economic growth. However, these efforts may not be rewarded until later this year or next. The only other spark in this otherwise dark outlook is that commodity prices have fallen, easing one heavy burden on consumer budgets.
1 | UBS Investment Research, Asian Economic Monitor, March 2009. |
2
Economic Update (continued) – Columbia World Equity Fund
Stock markets experience sharp declines
Against this weak economic backdrop, the U.S. stock market lost 38.09% for the 12-month period, as measured by the S&P 500 Index.2 Losses extended across all market caps and both growth and value stocks, although growth stocks held up slightly better than value stocks, as measured by their respective Russell indices.3 Stock markets outside the United States suffered even greater losses. The MSCI World Index4, which includes the U.S. market, returned negative 42.58%. The MSCI EAFE Index5, a broad gauge of stock market performance in foreign developed markets, lost 46.51% (in U.S. dollars) for the period. Emerging stock markets, which have generally had a strong run over the past several years, were also caught in the downdraft. As investors backed away from risk, the MSCI Emerging Markets Index6 returned negative 47.07% (in U.S. dollars). However, foreign stock market performance showed some improvement in the final months of the period, outperforming U.S. stocks for the first time in a year. Emerging market indexes generally experienced larger gains in March than the major market indices.
Past performance is no guarantee of future results.
2 | The Standard & Poor’s (S&P) 500 Index tracks the performance of 500 widely held, large-capitalization U.S. stocks. |
3 | The Russell 1000 Growth Index measures the performance of those Russell 1000 Index companies with higher price-to-book ratios and higher forecasted growth values. The Russell 1000 Value Index measures the performance of those companies in the Russell 1000 Index with lower price-to-book ratios and lower forecasted growth values. The Russell 2000 Growth Index measures the performance of those Russell 2000 Index companies with higher price-to-book ratios and higher forecasted growth values. The Russell 2000 Value Index measures the performance of those Russell 2000 Index companies with lower price-to-book ratios and lower forecasted growth values. The Russell 3000 Growth Index measures the performance of those Russell 3000 Index companies with higher price-to-book ratios and higher forecasted growth values. The Russell 3000 Value Index measures the performance of those Russell 3000 Index companies with lower price-to-book ratios and lower forecasted growth values. The Russell Midcap Growth Index measures the performance of those Russell Midcap companies with higher price-to-book ratios and higher forecasted growth values. The Russell Midcap Value Index measures the performance of those Russell Midcap Index companies with lower price-to-book ratios and lower forecasted growth values. |
4 | The Morgan Stanley Capital International (MSCI) World Index tracks the performance of global stocks. |
5 | The Morgan Stanley Capital International (MSCI) Europe, Australasia, Far East (EAFE) Index is a free float-adjusted market capitalization index that is designed to measure developed market equity performance excluding the U.S. and Canada. |
6 | The MSCI Emerging Markets Index is a widely accepted index composed of a sample of companies from 25 countries representing the global emerging stock markets. |
Indices are not available for investment, and do not reflect sales charges, fees, brokerage commissions, taxes or other expenses of investing. Securities in the fund may not match those in an index.
3
Performance Information – Columbia World Equity Fund
Performance data quoted represents past performance and current performance may be lower or higher. Past performance is no guarantee of future results. The investment return and principal value will fluctuate so that shares, when redeemed, may be worth more or less than the original cost. Please visit www.columbiafunds.com for daily and most recent month-end performance updates.
| | |
| Annual operating expense ratio (%)* |
| |
Class A | | 1.42 |
Class B | | 2.17 |
Class C | | 2.17 |
| * | The annual operating expense ratio is as stated in the fund’s prospectus that is current as of the date of this report and includes the expenses incurred by the investment companies in which the fund invests. Differences in expense ratios disclosed elsewhere in this report may result from including fee waivers and expense reimbursements as well as different time periods used in calculating the ratios. |
|
| Performance of a $10,000 investment 04/01/99 – 03/31/09 ($) |
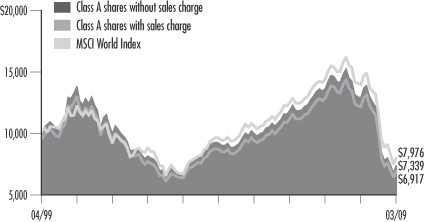
The chart above shows the change in value of a hypothetical $10,000 investment in Class A shares of Columbia World Equity Fund during the stated time period, and does not reflect the deduction of taxes that a shareholder may pay on fund distributions or on the redemption of fund shares. The Morgan Stanley Capital International (MSCI) World Index tracks the performance of global stocks. Indices are not available for investment, and do not reflect sales charges, fees, brokerage commissions, taxes or other expenses of investing. Securities in the fund may not match those in an index.
| | | | |
| Performance of a $10,000 investment 04/01/99 – 03/31/09 ($) |
| Sales charge | | without | | with |
Class A | | 7,339 | | 6,917 |
Class B | | 6,795 | | 6,795 |
Class C | | 6,786 | | 6,786 |
| | | | | | | | | | | | |
| Average annual total return as of 03/31/09 (%) | | | | | | |
| | | |
| Share class | | A | | B | | C |
| Inception | | 10/15/91 | | 03/27/95 | | 03/27/95 |
| Sales charge | | without | | with | | without | | with | | without | | with |
1-year | | –42.79 | | –46.08 | | –43.26 | | –46.07 | | –43.25 | | –43.81 |
5-year | | –4.34 | | –5.47 | | –5.06 | | –5.39 | | –5.07 | | –5.07 |
10-year | | –3.05 | | –3.62 | | –3.79 | | –3.79 | | –3.80 | | –3.80 |
The “with sales charge” returns include the maximum initial sales charge of 5.75% for Class A shares and the applicable contingent deferred sales charge of 5.00% in the first year, declining to 1.00% in the sixth year and eliminated thereafter for Class B shares and 1.00% for Class C shares for the first year only. The “without sales charge” returns do not include the effect of sales charges. If they had, returns would be lower.
Performance results reflect any fee waivers or reimbursements of fund expenses by the investment advisor and/or any of its affiliates. Absent these fee waivers or expense reimbursement arrangements, performance results would have been lower.
All results shown assume reinvestment of distributions. Please see the fund’s prospectus for details. Performance for different share classes will vary based on differences in sales charges and fees associated with each class.
The table does not reflect the deduction of taxes that a shareholder may pay on fund distributions or on the redemption of fund shares.
4
Understanding Your Expenses – Columbia World Equity Fund
Estimating your actual expenses
To estimate the expenses that you paid over the period, first you will need your account balance at the end of the period:
| | n | | For shareholders who receive their account statements from Columbia Management Services, Inc., your account balance is available online at www.columbiafunds.com or by calling Shareholder Services at 800.345.6611. | |
| | n | | For shareholders who receive their account statements from their financial intermediary, contact your financial intermediary to obtain your account balance. | |
| | 1. | Divide your ending account balance by $1,000. For example, if an account balance was $8,600 at the end of the period, the result would be 8.6. | |
| | 2. | In the section of the table below titled “Expenses paid during the period,” locate the amount for your share class. You will find this number in the column labeled “Actual.” Multiply this number by the result from step 1. Your answer is an estimate of the expenses you paid on your account during the period. | |
If the value of your account falls below the minimum initial investment requirement applicable to you, your account generally will be subject to a $20 annual fee. This fee is not included in the accompanying table. If you are subject to the fee, keep it in mind when you are estimating the ongoing expenses of investing in the fund and when comparing the expenses of this fund with other funds.
As a fund shareholder, you incur two types of costs. There are transaction costs, which generally include sales charges on purchases and may include redemption fees or exchange fees. There are also ongoing costs, which generally include investment advisory fees, distribution and service (Rule 12b-1) fees and other fund expenses. The information on this page is intended to help you understand the ongoing costs of investing in the fund and to compare these costs with the ongoing costs of investing in other mutual funds.
Analyzing your fund’s expenses by share class
To illustrate these ongoing costs, we have provided an example and calculated the expenses paid by investors in each share class during the period. The information in the following table is based on an initial investment of $1,000, which is invested at the beginning of the period and held for the entire period. Expense information is calculated two ways and each method provides you with different information. The amount listed in the “Actual” column is calculated using the fund’s actual operating expenses and total return for the period. The amount listed in the “Hypothetical” column for each share class assumes that the return each year is 5% before expenses and is calculated based on the fund’s actual operating expenses. You should not use the hypothetical account values and expenses to estimate either your actual account balance at the end of the period or the expenses you paid during this period.
Compare with other funds
Since all mutual funds are required to include the same hypothetical calculations about expenses in shareholder reports, you can use this information to compare the ongoing costs of investing in the fund with other funds. To do so, compare the 5% hypothetical example with the 5% hypothetical examples that appear in the shareholder reports of other funds. As you compare hypothetical examples of other funds, it is important to note that hypothetical examples are meant to highlight the ongoing costs of investing in a fund and do not reflect any transaction costs, such as sales charges, redemption fees or exchange fees.
| | | | | | | | | | | | | | |
| 10/01/08 – 03/31/09 | | | | | | | | |
| | | | |
| | | Account value at the
beginning of the period ($) | | Account value at the
end of the period ($) | | Expenses paid
during the period ($) | | Fund’s annualized
expense ratio (%) |
| | | Actual | | Hypothetical | | Actual | | Hypothetical | | Actual | | Hypothetical | | Actual |
Class A | | 1,000.00 | | 1,000.00 | | 694.89 | | 1,016.55 | | 7.10 | | 8.45 | | 1.68 |
Class B | | 1,000.00 | | 1,000.00 | | 692.10 | | 1,012.81 | | 10.25 | | 12.19 | | 2.43 |
Class C | | 1,000.00 | | 1,000.00 | | 691.80 | | 1,012.81 | | 10.25 | | 12.19 | | 2.43 |
Expenses paid during the period are equal to the annualized expense ratio for the share class, multiplied by the average account value over the period, then multiplied by the number of days in the fund’s most recent fiscal half-year and divided by 365.
Had the investment advisor and/or any of its affiliates not waived fees or reimbursed a portion of expenses, account value at the end of the period would have been reduced.
It is important to note that the expense amounts shown in the table are meant to highlight only ongoing costs of investing in the fund and do not reflect any transaction costs, such as sales charges, redemption fees or exchange fees. Therefore, the hypothetical examples provided may not help you determine the relative total costs of owning shares of different funds. If these transaction costs were included, your costs would have been higher.
5
Portfolio Managers’ Report – Columbia World Equity Fund
Performance data quoted represents past performance and current performance may be lower or higher. Past performance is no guarantee of future results. The investment return and principal value will fluctuate so that shares, when redeemed, may be worth more or less than the original cost. Please visit www.columbiafunds.com for daily and most recent month-end performance updates.
| | |
Net asset value per share |
| |
as of 03/31/09 ($) | | |
Class A | | 7.47 |
Class B | | 7.08 |
Class C | | 7.07 |
| | |
| Distributions declared per share |
| |
04/01/08 – 03/31/09 ($) | | |
Class A | | 0.11 |
Class B | | 0.11 |
Class C | | 0.11 |
| | |
| Holdings discussed in this report |
| |
as of 03/31/09 (%) | | |
Columbia Greater China Fund, Class Z | | 3.0 |
Petroleo Brasileiro | | 1.0 |
SunPower | | 0.7 |
First Solar | | 1.4 |
Gamesa, Tecnologica | | 0.6 |
Vestas Wind Systems A/S | | 0.5 |
Misys | | 1.3 |
Your fund is actively managed and the composition of its portfolio will change over time. Information provided is calculated as a percentage of net assets.
For the 12-month period that ended March 31, 2009, the fund’s Class A shares returned negative 42.79% without sales charge. The fund’s benchmark, the MSCI World Index1, returned negative 42.58%. The average return of funds in its peer group, the Lipper Global Multi-Cap Core Classification2, was negative 40.10% over the same period. Going into the period, the fund was positioned aggressively, with an overweight in industrials, which did poorly because of slowing economic growth. An underweight in the telecommunications sector, which declined less than other areas, also held back return. Underweighting large U.S. and European banks, which were at the center of the global financial crisis, was helpful as was an emphasis on insurance companies that had little exposure to the credit crisis and that declined less than other financial companies.
Emerging markets and the United States were a focus
While an emphasis on emerging markets hurt performance, we believe that over the long term emerging markets have the potential to outperform most developed markets. To demonstrate our conviction, we added substantially to the fund’s emerging markets weight during the period. Part of this increase came from a 3% allocation of the fund to the Columbia Greater China Fund, Class Z. China has been aggressive in seeking solutions to its economic problems. It has huge cash reserves and debt levels that are well below those of developed countries. We believe that China is in a good position to take whatever steps are necessary to restore economic growth. Our emphasis on emerging markets also includes Brazil, where energy company Petroleo Brasileiro is a relatively large holding.
During the period, we added to U.S. investments, increasing the United States overweight in the portfolio. The current global economic crisis began in the United States, and we believe that the aggressive actions of the Federal Reserve Board and the U.S. federal government should help the United States lead the world out of the crisis. We have positioned the portfolio to potentially take advantage of this situation and have boosted investment in certain materials, biotechnology and financial companies.
Alternative energy was a theme
We maintained a relatively large position in companies involved with solar and wind power. While the decline in oil prices and a downturn in capital spending for alternative energy projects hurt these stocks over the 12-month reporting period, we believe that these companies should benefit over the long term from a new global emphasis on energy efficiency and from rising energy prices as the economy recovers. The fund’s alternative energy investments included: SunPower and First Solar in the United States and wind power companies Gamesa, Tecnologica in Spain and Vestas Wind Systems in Denmark.
1 | The Morgan Stanley Capital International (MSCI) World Index tracks the performance of global stocks. Indices are not available for investment, and do not reflect sales charges, fees, brokerage commissions, taxes or other expenses of investing. Securities in the fund may not match those in an index. |
2 | Lipper Inc., a widely respected data provider in the industry, calculates an average total return (assuming reinvestment of distributions) for mutual funds with investment objectives similar to those of the fund. Lipper makes no adjustment for the effect of sales loads. |
6
Portfolio Managers’ Report (continued) – Columbia World Equity Fund
| | |
| Top 5 countries | | |
| |
as of 03/31/09 (%) | | |
United States | | 57.2 |
Japan | | 6.6 |
Switzerland | | 5.2 |
United Kingdom | | 4.4 |
France | | 3.3 |
| | |
| Top 5 sectors | | |
| |
as of 03/31/09 (%) | | |
Financials | | 17.0 |
Information Technology | | 15.9 |
Health Care | | 11.4 |
Consumer Staples | | 10.0 |
Energy | | 9.9 |
| | |
| Top 10 holdings | | |
| |
as of 03/31/09 (%) | | |
Columbia Greater China Fund, Class Z | | 3.0 |
Monsanto | | 2.5 |
Amgen | | 2.0 |
McDonald’s | | 1.7 |
Morgan Stanley | | 1.6 |
Seven & i Holdings | | 1.6 |
International Business Machines | | 1.6 |
Novo Nordisk | | 1.5 |
Hewlett-Packard | | 1.5 |
Oracle | | 1.5 |
The fund is actively managed and the composition of its portfolio will change over time. Information provided is calculated as a percentage of net assets.
Technology holdings rebounded
As stock prices rose during the last few weeks of the period, certain technology companies made solid gains, including Misys, a UK-based software company. Misys’ products are used widely in the financial services and health care industries. Overall, technology companies benefited on two fronts: First, they have been disciplined in cutting costs, outsourcing the most capital intensive parts of their businesses and maintaining some of their earnings power. Second, investors are often attracted to technology stocks when it appears that the economy may be stabilizing. During an economic recovery, many companies boost their technology spending to increase productivity.
Using market pullbacks to purchase attractively valued stocks
We believe that the stock market rally at the end of March reflected investor confidence in the willingness of governments to solve the global financial crisis. The rally may also be an indication that the deceleration in economic growth may be slowing. While we may see another substantial equity market sell-off in the short term, we believe that such a downturn would produce more attractive buying opportunities. As we look ahead, we will continue to select stocks on a case-by-case basis across all sectors and geographic regions, emphasizing high quality companies with good balance sheets and solid business prospects.
Portfolio holdings and characteristics are subject to change periodically and may not be representative of current holdings and characteristics. The outlook for the fund may differ from those presented for other Columbia Funds.
Equity investments are affected by stock market fluctuations that occur in response to economic and business developments.
International investing may involve certain risks, including currency fluctuations, risks associated with possible differences in financial accounting standards and other monetary and political risks. Significant levels of foreign taxes, including potentially confiscatory levels of taxation and withholding taxes, may also apply to some foreign investments.
7
Investment Portfolio – Columbia World Equity Fund
March 31, 2009
Common Stocks – 93.8%
| | | | | | |
| | | | | Shares | | Value ($) |
| Consumer Discretionary – 6.1% | | | | | | |
| Distributors – 0.5% | | Genuine Parts Co. | | 6,297 | | 188,028 |
| | |
| | Distributors Total | | | | 188,028 |
| | | |
Diversified Consumer
Services – 0.5% | | Apollo Group, Inc., Class A (a) | | 2,582 | | 202,248 |
| | |
| | Diversified Consumer Services Total | | | | 202,248 |
| | | |
Hotels, Restaurants &
Leisure – 1.7% | | McDonald’s Corp. | | 12,261 | | 669,083 |
| | |
| | Hotels, Restaurants & Leisure Total | | | | 669,083 |
| | | |
| Media – 1.1% | | Comcast Corp., Class A | | 31,050 | | 423,522 |
| | |
| | Media Total | | | | 423,522 |
| | | |
| Multiline Retail – 0.6% | | Dollar Tree, Inc. (a) | | 4,770 | | 212,503 |
| | |
| | Multiline Retail Total | | | | 212,503 |
| | | |
| Specialty Retail – 1.7% | | Home Depot, Inc. | | 8,780 | | 206,857 |
| | Staples, Inc. | | 10,330 | | 187,076 |
| | TJX Companies, Inc. | | 9,990 | | 256,144 |
| | |
| | Specialty Retail Total | | | | 650,077 |
| | | | | | |
| Consumer Discretionary Total | | | | | | 2,345,461 |
| | | | | | |
| Consumer Staples – 10.0% | | | | | | |
| Beverages – 1.1% | | Coca-Cola Co. | | 9,756 | | 428,776 |
| | |
| | Beverages Total | | | | 428,776 |
| | | |
| Food & Staples Retailing – 2.9% | | Seven & i Holdings Co., Ltd. | | 28,400 | | 619,730 |
| | Wal-Mart Stores, Inc. | | 9,475 | | 493,648 |
| | |
| | Food & Staples Retailing Total | | | | 1,113,378 |
| | | |
| Food Products – 4.3% | | Campbell Soup Co. | | 6,958 | | 190,371 |
| | Nestle SA, Registered Shares | | 12,262 | | 414,515 |
| | Toyo Suisan Kaisha Ltd. | | 28,000 | | 572,814 |
| | Unilever PLC | | 24,311 | | 459,753 |
| | |
| | Food Products Total | | | | 1,637,453 |
| | | |
| Household Products – 0.7% | | Kimberly-Clark Corp. | | 5,820 | | 268,360 |
| | |
| | Household Products Total | | | | 268,360 |
| | | |
| Personal Products – 0.5% | | Avon Products, Inc. | | 10,371 | | 199,434 |
| | |
| | Personal Products Total | | | | 199,434 |
| | | |
| Tobacco – 0.5% | | KT&G Corp. | | 3,297 | | 181,386 |
| | |
| | Tobacco Total | | | | 181,386 |
| | | | | | |
| Consumer Staples Total | | | | | | 3,828,787 |
See Accompanying Notes to Financial Statements.
8
Columbia World Equity Fund
March 31, 2009
Common Stocks (continued)
| | | | | | |
| | | | | Shares | | Value ($) |
| Energy – 9.9% | | | | | | |
Energy Equipment &
Services – 2.9% | | Shinko Plantech Co. Ltd. | | 46,800 | | 286,989 |
| | Subsea 7, Inc. (a) | | 63,550 | | 407,578 |
| | Transocean Ltd. (a) | | 7,183 | | 422,648 |
| | |
| | Energy Equipment & Services Total | | | | 1,117,215 |
| | | |
Oil, Gas & Consumable
Fuels – 7.0% | | Apache Corp. | | 2,652 | | 169,967 |
| | BP PLC | | 59,198 | | 400,493 |
| | Hess Corp. | | 4,373 | | 237,016 |
| | Peabody Energy Corp. | | 9,150 | | 229,116 |
| | Petroleo Brasileiro SA, ADR | | 12,790 | | 389,711 |
| | Total SA | | 9,063 | | 450,638 |
| | Valero Energy Corp. | | 19,803 | | 354,474 |
| | XTO Energy, Inc. | | 14,751 | | 451,676 |
| | |
| | Oil, Gas & Consumable Fuels Total | | | | 2,683,091 |
| | | | | | |
| Energy Total | | | | | | 3,800,306 |
| | | | | | |
| Financials – 17.0% | | | | | | |
| Capital Markets – 5.3% | | Credit Suisse Group AG, Registered Shares | | 14,826 | | 451,436 |
| | Morgan Stanley (b) | | 27,480 | | 625,720 |
| | Northern Trust Corp. | | 3,437 | | 205,601 |
| | State Street Corp. | | 12,221 | | 376,162 |
| | T. Rowe Price Group, Inc. | | 13,257 | | 382,597 |
| | |
| | Capital Markets Total | | | | 2,041,516 |
| | | |
| Commercial Banks – 8.3% | | Banco Bradesco SA, ADR | | 33,785 | | 334,472 |
| | Banco Santander SA | | 76,983 | | 530,831 |
| | Bank of China Ltd., Class H | | 861,000 | | 286,607 |
| | Barclays PLC | | 153,330 | | 325,608 |
| | Credit Agricole SA | | 36,532 | | 403,435 |
| | National Bank of Canada | | 12,400 | | 395,958 |
| | PNC Financial Services Group, Inc. | | 17,786 | | 520,952 |
| | U.S. Bancorp | | 25,508 | | 372,672 |
| | |
| | Commercial Banks Total | | | | 3,170,535 |
| | | |
Diversified Financial
Services – 1.2% | | JPMorgan Chase & Co. | | 17,177 | | 456,565 |
| | |
| | Diversified Financial Services Total | | | | 456,565 |
| | | |
| Insurance – 2.2% | | ACE Ltd. | | 11,789 | | 476,275 |
| | Axis Capital Holdings Ltd. | | 15,944 | | 359,378 |
| | |
| | Insurance Total | | | | 835,653 |
| | | | | | |
| Financials Total | | | | | | 6,504,269 |
| | | | | | |
| Health Care – 11.4% | | | | | | |
| Biotechnology – 3.5% | | Amgen, Inc. (a) | | 15,214 | | 753,397 |
| | Cephalon, Inc. (a) | | 2,702 | | 184,006 |
| | Gilead Sciences, Inc. (a) | | 8,251 | | 382,187 |
| | |
| | Biotechnology Total | | | | 1,319,590 |
See Accompanying Notes to Financial Statements.
9
Columbia World Equity Fund
March 31, 2009
Common Stocks (continued)
| | | | | | |
| | | | | Shares | | Value ($) |
| Health Care (continued) | | | | | | |
Health Care Equipment &
Supplies – 0.6% | | Baxter International, Inc. | | 4,757 | | 243,653 |
| | |
| | Health Care Equipment & Supplies Total | | | | 243,653 |
| | | |
Health Care Providers &
Services – 1.3% | | Express Scripts, Inc. (a) | | 4,241 | | 195,807 |
| | McKesson Corp. | | 8,557 | | 299,837 |
| | |
| | Health Care Providers & Services Total | | | | 495,644 |
| | | |
Life Sciences Tools &
Services – 1.2% | | Thermo Fisher Scientific, Inc. (a) | | 13,210 | | 471,201 |
| | |
| | Life Sciences Tools & Services Total | | | | 471,201 |
| | | |
| Pharmaceuticals – 4.8% | | Abbott Laboratories | | 7,061 | | 336,810 |
| | Novo Nordisk A/S, Class B | | 12,375 | | 592,665 |
| | Sanofi-Aventis SA | | 7,467 | | 420,437 |
| | Takeda Pharmaceutical Co., Ltd. | | 8,300 | | 285,094 |
| | Teva Pharmaceutical Industries Ltd., ADR | | 4,596 | | 207,050 |
| | |
| | Pharmaceuticals Total | | | | 1,842,056 |
| | | | | | |
| Health Care Total | | | | | | 4,372,144 |
| | | | | | |
| Industrials – 9.6% | | | | | | |
| Aerospace & Defense – 2.2% | | Lockheed Martin Corp. | | 2,517 | | 173,749 |
| | Precision Castparts Corp. | | 3,355 | | 200,964 |
| | United Technologies Corp. | | 10,563 | | 453,998 |
| | |
| | Aerospace & Defense Total | | | | 828,711 |
| | | |
Commercial Services &
Supplies – 0.4% | | Republic Services, Inc. | | 8,057 | | 138,178 |
| | |
| | Commercial Services & Supplies Total | | | | 138,178 |
| | | |
| Construction & Engineering – 1.4% | | Foster Wheeler AG (a) | | 13,510 | | 236,020 |
| | Toyo Engineering Corp. | | 104,000 | | 301,540 |
| | |
| | Construction & Engineering Total | | | | 537,560 |
| | | |
| Electrical Equipment – 3.7% | | Emerson Electric Co. | | 5,942 | | 169,822 |
| | First Solar, Inc. (a) | | 4,113 | | 545,795 |
| | Gamesa Corp., Tecnologica SA | | 18,723 | | 240,296 |
| | SunPower Corp., Class A (a) | | 10,983 | | 261,176 |
| | Vestas Wind Systems A/S (a) | | 4,046 | | 177,534 |
| | |
| | Electrical Equipment Total | | | | 1,394,623 |
| | | |
| Industrial Conglomerates – 1.0% | | General Electric Co. | | 39,150 | | 395,806 |
| | |
| | Industrial Conglomerates Total | | | | 395,806 |
| | | |
| Machinery – 0.4% | | Parker Hannifin Corp. | | 4,938 | | 167,793 |
| | |
| | Machinery Total | | | | 167,793 |
| | | |
| Professional Services – 0.5% | | Dun & Bradstreet Corp. | | 2,524 | | 194,348 |
| | |
| | Professional Services Total | | | | 194,348 |
| | | | | | |
| Industrials Total | | | | | | 3,657,019 |
See Accompanying Notes to Financial Statements.
10
Columbia World Equity Fund
March 31, 2009
Common Stocks (continued)
| | | | | | |
| | | | | Shares | | Value ($) |
| Information Technology – 15.9% | | | | | | |
| Communications Equipment – 1.7% | | Alvarion Ltd. (a) | | 124,574 | | 384,395 |
| | Brocade Communications Systems, Inc. (a) | | 79,498 | | 274,268 |
| | |
| | Communications Equipment Total | | | | 658,663 |
| | | |
| Computers & Peripherals – 4.0% | | Apple, Inc. (a) | | 3,206 | | 337,015 |
| | Hewlett-Packard Co. | | 18,448 | | 591,443 |
| | International Business Machines Corp. | | 6,203 | | 601,008 |
| | |
| | Computers & Peripherals Total | | | | 1,529,466 |
| | | |
Electronic Equipment, Instruments
& Components – 0.6% | | Venture Corp., Ltd. | | 65,000 | | 215,392 |
| | |
| | Electronic Equipment, Instruments & Components Total | | | | 215,392 |
| | | |
| IT Services – 3.0% | | Accenture Ltd., Class A | | 18,410 | | 506,091 |
| | CGI Group, Inc., Class A (a) | | 40,200 | | 324,584 |
| | MasterCard, Inc., Class A | | 1,495 | | 250,383 |
| | Redecard SA | | 6,200 | | 74,969 |
| | |
| | IT Services Total | | | | 1,156,027 |
| | | |
| Office Electronics – 1.2% | | Canon, Inc. | | 16,000 | | 455,827 |
| | |
| | Office Electronics Total | | | | 455,827 |
| | | |
Semiconductors & Semiconductor
Equipment – 1.4% | | ASML Holding N.V., N.Y. Registered Shares | | 30,880 | | 540,709 |
| | |
| | Semiconductors & Semiconductor Equipment Total | | | | 540,709 |
| | | |
| Software – 4.0% | | BMC Software, Inc. (a) | | 13,826 | | 456,258 |
| | Misys PLC | | 271,759 | | 491,316 |
| | Oracle Corp. (a) | | 32,349 | | 584,546 |
| | |
| | Software Total | | | | 1,532,120 |
| | | | | | |
| Information Technology Total | | | | | | 6,088,204 |
| | | | | | |
| Materials – 8.7% | | | | | | |
| Chemicals – 6.8% | | BASF SE | | 5,681 | | 172,014 |
| | Calgon Carbon Corp. (a) | | 39,442 | | 558,893 |
| | Linde AG | | 5,765 | | 392,007 |
| | Monsanto Co. | | 11,453 | | 951,744 |
| | Praxair, Inc. | | 7,780 | | 523,516 |
| | |
| | Chemicals Total | | | | 2,598,174 |
| | | |
| Metals & Mining – 1.9% | | Cia Vale do Rio Doce | | 25,600 | | 342,106 |
| | Freeport-McMoRan Copper & Gold, Inc. | | 10,671 | | 406,672 |
| | |
| | Metals & Mining Total | | | | 748,778 |
| | | | | | |
| Materials Total | | | | | | 3,346,952 |
| | | | | | |
| Telecommunication Services – 1.7% | | | | | | |
Diversified Telecommunication
Services – 1.7% | | Telefónica O2 Czech Republic AS | | 18,368 | | 361,626 |
| | Telekomunikacja Polska SA | | 55,339 | | 299,104 |
| | |
| | Diversified Telecommunication Services Total | | | | 660,730 |
| | | | | | |
| Telecommunication Services Total | | | | | | 660,730 |
See Accompanying Notes to Financial Statements.
11
Columbia World Equity Fund
March 31, 2009
Common Stocks (continued)
| | | | | | | |
| | | | | Shares | | Value ($) | |
| Utilities – 3.5% | | | | | | | |
| Electric Utilities – 0.8% | | E.ON AG | | 11,328 | | 314,703 | |
| | | |
| | Electric Utilities Total | | | | 314,703 | |
| | | |
| Independent Power Producers & Energy Traders – 0.9% | | Energy Development Corp. | | 4,228,000 | | 341,215 | |
| | | |
| | Independent Power Producers & Energy Traders Total | | | | 341,215 | |
| | | |
| Multi-Utilities – 0.8% | | Public Service Enterprise Group, Inc. | | 10,120 | | 298,236 | |
| | | |
| | Multi-Utilities Total | | | | 298,236 | |
| | | |
| Water Utilities – 1.0% | | Hyflux Ltd. | | 352,000 | | 381,867 | |
| | | |
| | Water Utilities Total | | | | 381,867 | |
| | | | | | | |
| Utilities Total | | | | | | 1,336,021 | |
| | Total Common Stocks
(cost of $46,264,325) | | | | 35,939,893 | |
| | | | | | | |
| Investment Companies – 4.4% | | | | | | | |
| | Columbia Greater China Fund, Class Z (a)(c) | | 33,994 | | 1,137,432 | |
| | WisdomTree India Earnings Fund | | 50,474 | | 552,186 | |
| | | |
| | Total Investment Companies
(cost of $2,221,845) | | | | 1,689,618 | |
| | | | | | | |
| Short-Term Obligation – 2.0% | | | | Par ($) | | | |
| | Repurchase agreement with Fixed Income Clearing Corp., dated 03/31/09, due 04/01/09 at 0.100%, collateralized by a U.S. Treasury Obligation maturing 11/15/24, market value $772,044 (repurchase proceeds $756,002) | | 756,000 | | 756,000 | |
| | | |
| | Total Short-Term Obligation (cost of $756,000) | | | | 756,000 | |
| |
| | | |
| | Total Investments – 100.2% (cost of $49,242,170) (d) | | 38,385,511 | |
| |
| | | |
| | Other Assets & Liabilities, Net – (0.2)% | | | | (92,106 | ) |
| |
| | | |
| | Net Assets – 100.0% | | | | 38,293,405 | |
Notes to Investment Portfolio:
On April 1, 2008, the Fund adopted Statement of Financial Accounting Standards No. 157, Fair Value Measurements (“SFAS 157”). SFAS 157 establishes a hierarchy that prioritizes the inputs to valuation techniques used to measure fair value giving the highest priority to unadjusted quoted prices in active markets for identical securities (level 1 measurements) and the lowest priority to unobservable inputs (level 3 measurements) when market prices are not readily available or reliable. The three levels of the fair value hierarchy under SFAS 157 are described below:
| | • | | Level 1 – quoted prices in active markets for identical securities |
| | • | | Level 2 – prices determined using other significant observable inputs (including quoted prices for similar securities, interest rates, prepayment speeds, credit risk and others) |
| | • | | Level 3 – prices determined using significant unobservable inputs. In situations where quoted prices or observable inputs are unavailable or less reliable, unobservable inputs may be used. Unobservable inputs may include management’s own assumptions about the factors market participants would use in pricing an investment. |
The inputs or methodology used for valuing securities are not necessarily an indication of the risk associated with investing in those securities.
See Accompanying Notes to Financial Statements.
12
Columbia World Equity Fund
March 31, 2009
The following table summarizes the inputs used, as of March 31, 2009, in valuing the Fund’s assets:
| | | | | | | |
Valuation Inputs | | Investments in
Securities | | Other Financial
Instruments* | |
Level 1 – Quoted Prices | | $ | 26,010,667 | | $ | (1,140 | ) |
Level 2 – Other Significant Observable Inputs | | | 12,374,844 | | | (110,499 | ) |
Level 3 – Significant Unobservable Inputs | | | — | | | — | |
Total | | $ | 38,385,511 | | $ | (111,639 | ) |
* Other financial instruments consist of forward foreign currency exchange contracts and written option contracts which are not included in the investment portfolio.
| | (a) | Non-income producing security. |
| | (b) | All or a portion of this security is pledged as collateral for open written option contracts. The total market value of security pledged as collateral at March 31, 2009 is $173,052. |
| | (c) | Investments in an affiliate during the year ended March 31, 2009: Security name: Columbia Greater China Fund, Class Z |
| | | |
Shares as of 03/31/08: | | | — |
Shares purchased: | | | 33,994 |
Shares sold: | | | — |
Shares as of 03/31/09: | | | 33,994 |
Net realized gain(loss): | | $ | — |
Capital gain distribution received: | | $ | 8,228 |
Dividend income earned: | | $ | — |
Value at end of period: | | $ | 1,137,432 |
| | (d) | Cost for federal income tax purposes is $49,253,159. |
Forward foreign currency exchange contracts outstanding on March 31, 2009 are:
| | | | | | | | | | | | |
Forward Currency
Contracts to Buy | | Value | | Aggregate
Face Value | | Settlement
Date | | Unrealized
Appreciation (Depreciation) | |
AUD | | $ | 994,354 | | $ | 922,809 | | 04/30/09 | | $ | 71,545 | |
CAD | | | 785,252 | | | 805,336 | | 04/30/09 | | | (20,084 | ) |
CHF | | | 204,804 | | | 200,223 | | 04/30/09 | | | 4,581 | |
CHF | | | 823,613 | | | 810,065 | | 04/30/09 | | | 13,548 | |
DKK | | | 179,126 | | | 168,596 | | 04/30/09 | | | 10,530 | |
DKK | | | 142,410 | | | 137,132 | | 04/30/09 | | | 5,278 | |
EUR | | | 1,918,372 | | | 1,843,844 | | 04/30/09 | | | 74,528 | |
EUR | | | 249,760 | | | 240,880 | | 04/30/09 | | | 8,880 | |
EUR | | | 151,450 | | | 153,518 | | 04/30/09 | | | (2,068 | ) |
GBP | | | 1,838,162 | | | 1,874,359 | | 04/30/09 | | | (36,197 | ) |
GBP | | | 68,877 | | | 67,471 | | 04/30/09 | | | 1,406 | |
ILS | | | 67,791 | | | 67,496 | | 04/30/09 | | | 295 | |
ILS | | | 110,218 | | | 114,430 | | 04/30/09 | | | (4,212 | ) |
JPY | | | 1,639,464 | | | 1,810,266 | | 04/30/09 | | | (170,802 | ) |
JPY | | | 185,495 | | | 190,949 | | 04/30/09 | | | (5,454 | ) |
SEK | | | 203,381 | | | 200,472 | | 04/30/09 | | | 2,909 | |
SGD | | | 414,574 | | | 405,734 | | 04/30/09 | | | 8,840 | |
| | | | | | | | | | | | |
| | | | | | | | | | $ | (36,477 | ) |
| | | | | | | | | | | | |
| | | | | | | | | | | | |
Forward Currency
Contracts to Sell | | Value | | Aggregate
Face Value | | Settlement
Date | | Unrealized
Appreciation (Depreciation) | |
CHF | | $ | 524,757 | | $ | 506,512 | | 04/30/09 | | $ | (18,245 | ) |
CZK | | | 387,947 | | | 361,630 | | 04/30/09 | | | (26,317 | ) |
DKK | | | 1,002,927 | | | 962,868 | | 04/30/09 | | | (40,059 | ) |
EUR | | | 197,948 | | | 189,431 | | 04/30/09 | | | (8,517 | ) |
EUR | | | 143,479 | | | 135,007 | | 04/30/09 | | | (8,472 | ) |
ILS | | | 428,075 | | | 443,637 | | 04/30/09 | | | 15,562 | |
ILS | | | 368,818 | | | 377,593 | | 04/30/09 | | | 8,775 | |
JPY | | | 265,626 | | | 279,836 | | 04/30/09 | | | 14,210 | |
JPY | | | 135,016 | | | 137,375 | | 04/30/09 | | | 2,359 | |
KRW | | | 200,475 | | | 200,332 | | 04/30/09 | | | (143 | ) |
NOK | | | 249,381 | | | 242,988 | | 04/30/09 | | | (6,393 | ) |
PHP | | | 276,166 | | | 277,582 | | 04/30/09 | | | 1,416 | |
PLN | | | 337,004 | | | 320,135 | | 04/30/09 | | | (16,869 | ) |
SGD | | | 917,844 | | | 926,515 | | 04/30/09 | | | 8,671 | |
| | | | | | | | | | | | |
| | | | | | | | | | $ | (74,022 | ) |
| | | | | | | | | | | | |
See Accompanying Notes to Financial Statements.
13
Columbia World Equity Fund
March 31, 2009
The Fund was invested in the following countries at March 31, 2009:
| | | | | | |
Summary of Securities
by Country (Unaudited) | | Value | | % of Total Investments | |
United States* | | $ | 21,964,132 | | 57.2 | |
Japan | | | 2,521,994 | | 6.6 | |
Switzerland | | | 2,000,893 | | 5.2 | |
United Kingdom | | | 1,677,171 | | 4.4 | |
France | | | 1,274,510 | | 3.3 | |
Brazil | | | 1,141,258 | | 3.0 | |
China | | | 1,056,629 | | 2.8 | |
Germany | | | 878,724 | | 2.3 | |
Spain | | | 771,127 | | 2.0 | |
Denmark | | | 770,199 | | 2.0 | |
Canada | | | 720,542 | | 1.9 | |
Singapore | | | 597,258 | | 1.5 | |
Israel | | | 591,445 | | 1.5 | |
Netherlands | | | 540,709 | | 1.5 | |
Norway | | | 407,578 | | 1.1 | |
Czech Republic | | | 361,626 | | 0.9 | |
Philippines | | | 341,215 | | 0.9 | |
Poland | | | 299,104 | | 0.8 | |
Hong Kong | | | 275,519 | | 0.6 | |
Republic of Korea | | | 181,386 | | 0.5 | |
Singapore | | | 12,492 | | 0.0 | ** |
| | | | | | |
| | $ | 38,385,511 | | 100.0 | |
| | | | | | |
* Includes short-term obligation.
** Rounds to less than 0.1%.
Certain securities are listed by country of underlying exposure but may trade predominantly on another exchange.
For the year ended March 31, 2009, transactions in written option contracts were as follows:
| | | | | | | |
| | | Number of
Contracts | | | Premium
Received | |
Options outstanding at March 31, 2008 | | — | | | $ | — | |
Options written | | 571 | | | | 72,547 | |
Options terminated in closing purchase transactions | | (82 | ) | | | (18,688 | ) |
Options exercised | | (40 | ) | | | (11,880 | ) |
Options expired | | (373 | ) | | | (34,417 | ) |
| | | | | | | |
Options outstanding at March 31, 2009 | | 76 | | | $ | 7,562 | |
| | | | | | | |
At March 31, 2009, the Fund held the following open written call option contracts:
| | | | | | | | | | | | | |
Name of Issuer | | Strike
Price | | Number of Contracts | | Expiration
Date | | Premium | | Value |
Morgan Stanley | | $ | 30 | | 76 | | 04/18/09 | | $ | 7,562 | | $ | 1,140 |
| | |
Acronym | | Name |
| ADR | | American Depositary Receipt |
| AUD | | Australian Dollar |
| CAD | | Canadian Dollar |
| CHF | | Swiss Franc |
| CZK | | Czech Koruna |
| DKK | | Danish Krone |
| EUR | | Euro |
| GBP | | Pound Sterling |
| ILS | | Israeli Shekel |
| JPY | | Japanese Yen |
| KRW | | South Korean Won |
| NOK | | Norwegian Krone |
| PHP | | Philippine Peso |
| PLN | | Polish Zloty |
| SEK | | Swedish Krona |
| SGD | | Singapore Dollar |
See Accompanying Notes to Financial Statements.
14
Statement of Assets and Liabilities – Columbia World Equity Fund
March 31, 2009
| | | | | |
| | | | | ($) | |
| Assets | | Unaffiliated investments, at cost | | 47,977,170 | |
| | Affiliated investments, at cost | | 1,265,000 | |
| | | | | |
| | Total investments, at cost | | 49,242,170 | |
| | |
| | Unaffiliated investments, at value | | 37,248,079 | |
| | Affiliated investments, at value | | 1,137,432 | |
| | | | | |
| | Total investments, at value | | 38,385,511 | |
| | Cash | | 608 | |
| | Foreign currency (cost of $8,358) | | 8,268 | |
| | Unrealized appreciation on forward foreign currency exchange contracts | | 253,333 | |
| | Receivable for: | | | |
| | Fund shares sold | | 10,327 | |
| | Dividends | | 87,911 | |
| | Interest | | 2 | |
| | Foreign tax reclaims | | 43,230 | |
| | Expense reimbursement due from investment advisor | | 8,741 | |
| | Trustees’ deferred compensation plan | | 18,166 | |
| | Prepaid expenses | | 1,727 | |
| | | |
| | Total Assets | | 38,817,824 | |
| | |
| Liabilities | | Unrealized depreciation on forward foreign currency exchange contracts | | 363,832 | |
| | Written options, at value (premium of $7,562) | | 1,140 | |
| | Payable for: | | | |
| | Fund shares repurchased | | 31,470 | |
| | Investment advisory fee | | 12,069 | |
| | Administration fee | | 7,524 | |
| | Transfer agent fee | | 18,855 | |
| | Trustees’ fees | | 104 | |
| | Audit fee | | 30,850 | |
| | Pricing and bookkeeping fees | | 6,494 | |
| | Custody fee | | 3,100 | |
| | Distribution and service fees | | 8,746 | |
| | Reports to shareholders | | 19,626 | |
| | Chief compliance officer expenses | | 151 | |
| | Trustees’ deferred compensation plan | | 18,166 | |
| | Other liabilities | | 2,292 | |
| | | |
| | Total Liabilities | | 524,419 | |
| |
| | | |
| | Net Assets | | 38,293,405 | |
| | |
| Net Assets Consist of | | Paid-in capital | | 64,556,863 | |
| | Undistributed net investment income | | 139,954 | |
| | Accumulated net realized loss | | (15,444,289 | ) |
| | Net unrealized appreciation (depreciation) on: | | | |
| | Investments | | (10,856,659 | ) |
| | Foreign currency translations | | (108,886 | ) |
| | Written options | | 6,422 | |
| | | |
| | Net Assets | | 38,293,405 | |
See Accompanying Notes to Financial Statements.
15
Statement of Assets and Liabilities (continued) – Columbia World Equity Fund
March 31, 2009
| | | | | | |
| | | | | | |
| Class A | | Net assets | | $ | 36,672,275 | |
| | Shares outstanding | | | 4,909,619 | |
| | Net asset value per share | | $ | 7.47 | (a)(c) |
| | Maximum sales charge | | | 5.75 | % |
| | Maximum offering price per share ($7.47/0.9425) | | $ | 7.93 | (b) |
| | |
| Class B | | | | | | |
| | Net assets | | $ | 1,071,122 | |
| | Shares outstanding | | | 151,212 | |
| | Net asset value and offering price per share | | $ | 7.08 | (a)(c) |
| | |
| Class C | | | | | | |
| | Net assets | | $ | 550,008 | |
| | Shares outstanding | | | 77,762 | |
| | Net asset value and offering price per share | | $ | 7.07 | (a)(c) |
| (a) | Redemption price per share is equal to net asset value less any applicable contingent deferred sales charge. |
| (b) | On sales of $50,000 or more the offering price is reduced. |
| (c) | Redemption price per share is equal to net asset value less any applicable redemption fees. |
See Accompanying Notes to Financial Statements.
16
Statement of Operations – Columbia World Equity Fund
For the Year Ended March 31, 2009
| | | | | |
| | | | | ($) | |
| Investment Income | | Dividends | | 1,561,874 | |
| | Interest | | 4,600 | |
| | Foreign tax withheld | | (105,440 | ) |
| | | |
| | Total Investment Income | | 1,461,034 | |
| | |
| Expenses | | Investment advisory fee | | 233,500 | |
| | Administration fee | | 145,963 | |
| | Distribution fee: | | | |
| | Class B | | 16,279 | |
| | Class C | | 5,732 | |
| | Service fee: | | | |
| | Class A | | 139,250 | |
| | Class B | | 5,411 | |
| | Class C | | 1,914 | |
| | Transfer agent fee | | 160,147 | |
| | Pricing and bookkeeping fees | | 58,173 | |
| | Trustees’ fees | | 14,086 | |
| | Custody fee | | 35,333 | |
| | Reports to shareholders | | 78,009 | |
| | Chief compliance officer expenses | | 646 | |
| | Other expenses | | 102,399 | |
| | | |
| | Total Expenses | | 996,842 | |
| | |
| | Fees waived or expenses reimbursed by investment advisor and/or administrator | | (38,530 | ) |
| | Expense reductions | | (9,553 | ) |
| | | |
| | Net Expenses | | 948,759 | |
| |
| | | |
| | Net Investment Income | | 512,275 | |
| | |
| Net Realized and Unrealized Gain (Loss) on Capital Gains Distributions Received, Investments, Written Options and Foreign Currency | | Net realized gain (loss) on: | | | |
| | Capital gains distributions received from affiliated investments | | 8,228 | |
| | Investments | | (15,485,048 | ) |
| | Foreign currency transactions and forward foreign currency exchange contracts | | (445,526 | ) |
| | Written options | | 42,107 | |
| | | |
| | Net realized loss | | (15,880,239 | ) |
| | |
| | Net change in unrealized appreciation (depreciation) on: | | | |
| | Investments | | (16,002,340 | ) |
| | Foreign currency translations and forward foreign currency exchange contracts | | 26,954 | |
| | Written options | | 6,422 | |
| | | |
| | Net change in unrealized appreciation (depreciation) | | (15,968,964 | ) |
| | | |
| | Net Loss | | (31,849,203 | ) |
| |
| | | |
| | Net Decrease Resulting from Operations | | (31,336,928 | ) |
See Accompanying Notes to Financial Statements.
17
Statement of Changes in Net Assets – Columbia World Equity Fund
| | | | | | | | |
| | | | | Year Ended March 31, | |
| Increase (Decrease) in Net Assets: | | | | 2009 ($) | | | 2008 ($) | |
| Operations | | Net investment income | | 512,275 | | | 820,899 | |
| | Net realized gain (loss) on capital gains distributions received from affiliated investments, investments, foreign currency transactions, forward foreign currency exchange contracts and written options | | (15,880,239 | ) | | 5,405,703 | |
| | Net change in unrealized appreciation (depreciation) on investments, foreign currency translations, forward foreign currency exchange contracts and written options | | (15,968,964 | ) | | (10,457,726 | ) |
| | | |
| | Net decrease resulting from operations | | (31,336,928 | ) | | (4,231,124 | ) |
| | | |
| Distributions to Shareholders | | From net investment income: | | | | | | |
| | Class A | | — | | | (1,231,695 | ) |
| | Class B | | — | | | (42,238 | ) |
| | Class C | | — | | | (8,382 | ) |
| | From net realized gains: | | | | | | |
| | Class A | | (582,318 | ) | | (7,868,035 | ) |
| | Class B | | (25,588 | ) | | (620,542 | ) |
| | Class C | | (8,137 | ) | | (107,829 | ) |
| | | |
| | Total distributions to shareholders | | (616,043 | ) | | (9,878,721 | ) |
| | | |
| | Net Capital Stock Transactions | | (8,550,215 | ) | | (2,970,315 | ) |
| | | |
| | Redemption fees | | 792 | | | 1,039 | |
| | | |
| | Increase from regulatory settlements | | 48,532 | | | — | |
| | | |
| | Total decrease in net assets | | (40,453,862 | ) | | (17,079,121 | ) |
| | | |
| Net Assets | | Beginning of period | | 78,747,267 | | | 95,826,388 | |
| | End of period | | 38,293,405 | | | 78,747,267 | |
| | Undistributed net investment income at end of period | | 139,954 | | | 82,199 | |
See Accompanying Notes to Financial Statements.
18
Statement of Changes in Net Assets (continued) – Columbia World Equity Fund
| | | | | | | | | | | | | | |
| | | Capital Stock Activity | |
| | | Year Ended March 31, 2009 | | | | | Year Ended March 31, 2008 | |
| | | Shares | | | Dollars ($) | | | | | Shares | | | Dollars ($) | |
Class A | | | | | | | | | | | | | | |
Subscriptions | | 181,694 | | | 2,033,077 | | | | | 296,743 | | | 4,467,572 | |
Distributions reinvested | | 40,238 | | | 549,246 | | | | | 562,830 | | | 8,522,253 | |
Redemptions | | (943,205 | ) | | (9,634,107 | ) | | | | (800,619 | ) | | (11,967,581 | ) |
| | | | | | | | | | | | | | |
Net increase (decrease) | | (721,273 | ) | | (7,051,784 | ) | | | | 58,954 | | | 1,022,244 | |
| | | | | |
Class B | | | | | | | | | | | | | | |
Subscriptions | | 11,761 | | | 102,983 | | | | | 13,140 | | | 194,792 | |
Distributions reinvested | | 1,850 | | | 24,091 | | | | | 41,442 | | | 605,328 | |
Redemptions | | (152,893 | ) | | (1,604,608 | ) | | | | (332,258 | ) | | (4,810,118 | ) |
| | | | | | | | | | | | | | |
Net decrease | | (139,282 | ) | | (1,477,534 | ) | | | | (277,676 | ) | | (4,009,998 | ) |
| | | | | |
Class C | | | | | | | | | | | | | | |
Subscriptions | | 18,357 | | | 168,432 | | | | | 16,659 | | | 238,491 | |
Distributions reinvested | | 544 | | | 7,069 | | | | | 6,974 | | | 101,362 | |
Redemptions | | (19,765 | ) | | (196,398 | ) | | | | (22,086 | ) | | (322,414 | ) |
| | | | | | | | | | | | | | |
Net increase (decrease) | | (864 | ) | | (20,897 | ) | | | | 1,547 | | | 17,439 | |
See Accompanying Notes to Financial Statements.
19
Financial Highlights – Columbia World Equity Fund
Selected data for a share outstanding throughout each period is as follows:
| | | | | | | | | | | | | | | | | | | | |
| | | Year Ended March 31, | |
| Class A Shares | | 2009 | | | 2008 | | | 2007 | | | 2006 | | | 2005 | |
Net Asset Value, Beginning of Period | | $ | 13.16 | | | $ | 15.48 | | | $ | 14.14 | | | $ | 11.92 | | | $ | 11.09 | |
| | | | | |
Income from Investment Operations: | | | | | | | | | | | | | | | | | | | | |
Net investment income (a) | | | 0.10 | | | | 0.14 | | | | 0.12 | | | | 0.10 | | | | 0.07 | (b) |
Net realized and unrealized gain (loss) on capital gain distributions received from affiliated investments, investments, foreign currency and written options | | | (5.69 | ) | | | (0.81 | ) | | | 1.97 | | | | 2.18 | | | | 0.81 | |
| | | | | | | | | | | | | | | | | | | | |
Total from investment operations | | | (5.59 | ) | | | (0.67 | ) | | | 2.09 | | | | 2.28 | | | | 0.88 | |
| | | | | |
Less Distributions to Shareholders: | | | | | | | | | | | | | | | | | | | | |
From net investment income | | | — | | | | (0.22 | ) | | | (0.18 | ) | | | (0.06 | ) | | | (0.05 | ) |
From net realized gains | | | (0.11 | ) | | | (1.43 | ) | | | (0.57 | ) | | | — | | | | — | |
| | | | | | | | | | | | | | | | | | | | |
Total distributions to shareholders | | | (0.11 | ) | | | (1.65 | ) | | | (0.75 | ) | | | (0.06 | ) | | | (0.05 | ) |
| | | | | |
Redemption Fees: | | | | | | | | | | | | | | | | | | | | |
Redemption fees added to paid-in-capital (c) | | | — | | | | — | | | | — | | | | — | | | | — | |
Increase from regulatory settlements | | | 0.01 | | | | — | | | | — | | | | — | | | | — | |
| | | | | |
Net Asset Value, End of Period | | $ | 7.47 | | | $ | 13.16 | | | $ | 15.48 | | | $ | 14.14 | | | $ | 11.92 | |
Total return (d) | | | (42.79 | )%(e) | | | (5.47 | )%(f) | | | 15.11 | % | | | 19.15 | %(e) | | | 7.99 | % |
| | | | | |
Ratios to Average Net Assets/Supplemental Data: | | | | | | | | | | | | | | | | | | | | |
Net expenses | | | 1.58 | %(g) | | | 1.40 | %(h) | | | 1.47 | %(h) | | | 1.51 | %(h) | | | 1.56 | %(h) |
Waiver/Reimbursement | | | 0.06 | % | | | — | | | | — | | | | 0.03 | % | | | — | |
Net investment income | | | 0.91 | %(g) | | | 0.94 | %(h) | | | 0.80 | %(h) | | | 0.76 | %(h) | | | 0.59 | %(h) |
Portfolio turnover rate | | | 154 | % | | | 69 | % | | | 85 | % | | | 62 | % | | | 68 | % |
Net assets, end of period (000’s) | | $ | 36,672 | | | $ | 74,106 | | | $ | 86,237 | | | $ | 81,746 | | | $ | 78,479 | |
| (a) | Per share data was calculated using the average shares outstanding during the period. |
| (b) | Net investment income per share reflects a special dividend. The effect of this dividend amounted to $0.03 per share. |
| (c) | Rounds to less than $0.01 per share. |
| (d) | Total return at net asset value assuming all distributions reinvested and no initial sales charge or contingent deferred sales charge. |
| (e) | Had the investment advisor and/or any of its affiliates not waived fees or reimbursed a portion of expenses, total return would have been reduced. |
| (f) | Total return includes a voluntary reimbursement by the investment advisor for a realized investment loss due to a trading error. This reimbursement increased total return and net asset value per share by less than 0.01% and less than $0.01, respectively. |
| (g) | The benefits derived from expense reductions had an impact of 0.02%. |
| (h) | The benefits derived from expense reductions had an impact of less than 0.01%. |
See Accompanying Notes to Financial Statements.
20
\
Financial Highlights – Columbia World Equity Fund
Selected data for a share outstanding throughout each period is as follows:
| | | | | | | | | | | | | | | | | | | | |
| | | Year Ended March 31, | |
| Class B Shares | | 2009 | | | 2008 | | | 2007 | | | 2006 | | | 2005 | |
Net Asset Value, Beginning of Period | | $ | 12.58 | | | $ | 14.86 | | | $ | 13.58 | | | $ | 11.48 | | | $ | 10.71 | |
| | | | | |
Income from Investment Operations: | | | | | | | | | | | | | | | | | | | | |
Net investment income (loss) (a) | | | 0.03 | | | | 0.03 | | | | 0.02 | | | | — | (b) | | | (0.02 | )(c) |
Net realized and unrealized gain (loss) on capital gain distributions received from affiliated investments, investments, foreign currency and written options | | | (5.43 | ) | | | (0.77 | ) | | | 1.87 | | | | 2.10 | | | | 0.79 | |
| | | | | | | | | | | | | | | | | | | | |
Total from investment operations | | | (5.40 | ) | | | (0.74 | ) | | | 1.89 | | | | 2.10 | | | | 0.77 | |
| | | | | |
Less Distributions to Shareholders: | | | | | | | | | | | | | | | | | | | | |
From net investment income | | | — | | | | (0.11 | ) | | | (0.04 | ) | | | — | | | | — | |
From net realized gains | | | (0.11 | ) | | | (1.43 | ) | | | (0.57 | ) | | | — | | | | — | |
| | | | | | | | | | | | | | | | | | | | |
Total distributions to shareholders | | | (0.11 | ) | | | (1.54 | ) | | | (0.61 | ) | | | — | | | | — | |
| | | | | |
Redemption Fees: | | | | | | | | | | | | | | | | | | | | |
Redemption fees added to paid-in-capital (b) | | | — | | | | — | | | | — | | | | — | | | | — | |
Increase from regulatory settlements | | | 0.01 | | | | — | | | | — | | | | — | | | | — | |
| | | | | |
Net Asset Value, End of Period | | $ | 7.08 | | | $ | 12.58 | | | $ | 14.86 | | | $ | 13.58 | | | $ | 11.48 | |
Total return (d) | | | (43.26 | )%(e) | | | (6.12 | )%(f) | | | 14.17 | % | | | 18.29 | %(e) | | | 7.19 | % |
| | | | | |
Ratios to Average Net Assets/Supplemental Data: | | | | | | | | | | | | | | | | | | | | |
Net expenses | | | 2.33 | %(g) | | | 2.15 | %(h) | | | 2.22 | %(h) | | | 2.26 | %(h) | | | 2.31 | %(h) |
Waiver/Reimbursement | | | 0.06 | % | | | — | | | | — | | | | 0.03 | % | | | — | |
Net investment income (loss) | | | 0.25 | %(g) | | | 0.23 | %(h) | | | 0.11 | %(h) | | | 0.01 | %(h) | | | (0.16 | )%(h) |
Portfolio turnover rate | | | 154 | % | | | 69 | % | | | 85 | % | | | 62 | % | | | 68 | % |
Net assets, end of period (000’s) | | $ | 1,071 | | | $ | 3,654 | | | $ | 8,445 | | | $ | 13,513 | | | $ | 16,129 | |
| (a) | Per share data was calculated using the average shares outstanding during the period. |
| (b) | Rounds to less than $0.01 per share. |
| (c) | Net investment loss per share reflects a special dividend. The effect of this dividend amounted to $0.03 per share. |
| (d) | Total return at net asset value assuming all distributions reinvested and no contingent deferred sales charge. |
| (e) | Had the investment advisor and/or any of its affiliates not waived fees or reimbursed a portion of expenses, total return would have been reduced. |
| (f) | Total return includes a voluntary reimbursement by the investment advisor for a realized investment loss due to a trading error. This reimbursement increased total return and net asset value per share by less than 0.01% and less than $0.01, respectively. |
| (g) | The benefits derived from expense reductions had an impact of 0.02%. |
| (h) | The benefits derived from expense reductions had an impact of less than 0.01%. |
See Accompanying Notes to Financial Statements.
21
Financial Highlights – Columbia World Equity Fund
Selected data for a share outstanding throughout each period is as follows:
| | | | | | | | | | | | | | | | | | | | |
| | | Year Ended March 31, | |
| Class C Shares | | 2009 | | | 2008 | | | 2007 | | | 2006 | | | 2005 | |
Net Asset Value, Beginning of Period | | $ | 12.56 | | | $ | 14.84 | | | $ | 13.56 | | | $ | 11.47 | | | $ | 10.70 | |
| | | | | |
Income from Investment Operations: | | | | | | | | | | | | | | | | | | | | |
Net investment income (loss) (a) | | | 0.02 | | | | 0.03 | | | | — | (b) | | | — | (b) | | | (0.02 | )(c) |
Net realized and unrealized gain (loss) on capital gain distributions received from affiliated investments, investments, foreign currency and written options | | | (5.41 | ) | | | (0.77 | ) | | | 1.89 | | | | 2.09 | | | | 0.79 | |
| | | | | | | | | | | | | | | | | | | | |
Total from investment operations | | | (5.39 | ) | | | (0.74 | ) | | | 1.89 | | | | 2.09 | | | | 0.77 | |
| | | | | |
Less Distributions to Shareholders: | | | | | | | | | | | | | | | | | | | | |
From net investment income | | | — | | | | (0.11 | ) | | | (0.04 | ) | | | — | | | | — | |
From net realized gains | | | (0.11 | ) | | | (1.43 | ) | | | (0.57 | ) | | | — | | | | — | |
| | | | | | | | | | | | | | | | | | | | |
Total distributions to shareholders | | | (0.11 | ) | | | (1.54 | ) | | | (0.61 | ) | | | — | | | | — | |
| | | | | |
Redemption Fees: | | | | | | | | | | | | | | | | | | | | |
Redemption fees added to paid-in-capital (b) | | | — | | | | — | | | | — | | | | — | | | | — | |
Increase from regulatory settlements | | | 0.01 | | | | — | | | | — | | | | — | | | | — | |
| | | | | |
Net Asset Value, End of Period | | $ | 7.07 | | | $ | 12.56 | | | $ | 14.84 | | | $ | 13.56 | | | $ | 11.47 | |
Total return (d) | | | (43.25 | )%(e) | | | (6.12 | )%(f) | | | 14.19 | % | | | 18.22 | %(e) | | | 7.20 | % |
| | | | | |
Ratios to Average Net Assets/Supplemental Data: | | | | | | | | | | | | | | | | | | | | |
Net expenses | | | 2.33 | %(g) | | | 2.15 | %(h) | | | 2.22 | %(h) | | | 2.26 | %(h) | | | 2.31 | %(h) |
Waiver/Reimbursement | | | 0.06 | % | | | — | | | | — | | | | 0.03 | % | | | — | |
Net investment income (loss) | | | 0.15 | %(g) | | | 0.21 | %(h) | | | 0.02 | %(h) | | | — | %(h)(i) | | | (0.16 | )%(h) |
Portfolio turnover rate | | | 154 | % | | | 69 | % | | | 85 | % | | | 62 | % | | | 68 | % |
Net assets, end of period (000’s) | | $ | 550 | | | $ | 987 | | | $ | 1,144 | | | $ | 1,287 | | | $ | 1,076 | |
| (a) | Per share data was calculated using the average shares outstanding during the period. |
| (b) | Rounds to less than $0.01 per share. |
| (c) | Net investment loss per share reflects a special dividend. The effect of this dividend amounted to $0.03 per share. |
| (d) | Total return at net asset value assuming all distributions reinvested and no contingent deferred sales charge. |
| (e) | Had the investment advisor and/or any of its affiliates not waived fees or reimbursed a portion of expenses, total return would have been reduced. |
| (f) | Total return includes a voluntary reimbursement by the investment advisor for a realized investment loss due to a trading error. This reimbursement increased total return and net asset value per share by less than 0.01% and less than $0.01, respectively. |
| (g) | The benefits derived from expense reductions had an impact of 0.02%. |
| (h) | The benefits derived from expense reductions had an impact of less than 0.01%. |
| (i) | Rounds to less than 0.01%. |
See Accompanying Notes to Financial Statements.
22
Notes to Financial Statements – Columbia World Equity Fund
March 31, 2009
Note 1. Organization
Columbia World Equity Fund (the “Fund”), a series of Columbia Funds Series Trust I (the “Trust”), is a diversified portfolio. The Trust is a Massachusetts business trust registered under the Investment Company Act of 1940, as amended (the “1940 Act”), as an open-end management investment company.
Investment Objective
The Fund seeks long-term capital appreciation.
Fund Shares
The Trust may issue an unlimited number of shares, and the Fund offers three classes of shares: Class A, Class B and Class C. Each share class has its own expense structure and sales charges, as applicable. Beginning on or about June 22, 2009, the Fund will no longer accept investments in Class B shares from new or existing investors in the Fund’s Class B shares, except in connection with the reinvestment of any dividend and/or capital gain distributions in Class B shares of the Fund and exchanges by existing Class B shareholders of the other Columbia Funds.
Class A shares are subject to a maximum front-end sales charge of 5.75% based on the amount of initial investment. Class A shares purchased without an initial sales charge in accounts aggregating $1 million to $50 million at the time of purchase are subject to a 1.00% contingent deferred sales charge (“CDSC”) if the shares are sold within one year after purchase. Class B shares are subject to a maximum CDSC of 5.00% based upon the holding period after purchase. Class B shares will convert to Class A shares eight years after purchase. Class C shares are subject to a 1.00% CDSC on shares sold within one year after purchase.
Note 2. Significant Accounting Policies
The preparation of financial statements in accordance with accounting principles generally accepted in the United States of America (“GAAP”) requires management to make certain estimates and assumptions that affect the reported amounts of assets and liabilities, the disclosure of contingent assets and liabilities at the date of the financial statements and the reported amounts of revenue and expenses during the reporting period. Actual results could differ from those estimates. The following is a summary of significant accounting policies consistently followed by the Fund in the preparation of its financial statements.
Security Valuation
Equity securities and securities of certain investment companies are valued at the last sale price on the principal exchange on which they trade, except for securities traded on the NASDAQ, which are valued at the NASDAQ official close price. Unlisted securities or listed securities for which there were no sales during the day are valued at the closing bid price on such exchanges or over-the-counter markets.
Short-term investments maturing in 60 days or less are valued at amortized cost, which approximates market value.
Investments in other open-end investment companies are valued at net asset value.
Written options are valued at the last reported sale price, or in the absence of a sale, at the last quoted ask price.
Forward foreign currency exchange contracts are valued at the prevailing forward exchange rate of the underlying currencies.
Foreign securities are generally valued at the last sale price on the foreign exchange or market on which they trade. If any foreign share prices are not readily available as a result of limited share activity, the securities are valued at the last sale price of the local shares in the principal market in which such securities are normally traded.
Generally, trading in foreign securities is substantially completed each day at various times prior to the close of the New York Stock Exchange (“NYSE”). The values of such securities used in computing the net asset value of the Fund’s shares are determined as of such times. Foreign currency exchange rates are generally determined at 4:00 p.m. Eastern (U.S.) time. Occasionally, events affecting the values of such foreign securities and such exchange rates may occur between the times at which they are determined and the close of the customary trading session of the NYSE, which would not be reflected in the computation of the Fund’s net asset value. If events materially affecting the values of such foreign securities occur and it is determined that market quotations are not reliable, then these foreign securities will be valued at their fair value using procedures approved by the Board of Trustees.
The Fund may use a systematic fair valuation model provided by an independent third party to value securities principally traded in foreign markets in order to adjust for possible stale
23
Columbia World Equity Fund
March 31, 2009
pricing that may occur between the close of the foreign exchanges and the time for valuation.
Investments for which market quotations are not readily available, or that have quotations which management believes are not reliable, are valued at fair value as determined in good faith under consistently applied procedures established by and under the general supervision of the Board of Trustees. If a security is valued at fair value, such value is likely to be different from the last quoted market price for the security. The determination of fair value often requires significant judgment. To determine fair value, management may use assumptions including but not limited to future cash flows and estimated risk premiums. Multiple inputs from various sources may be used to determine value.
Security Transactions
Security transactions are accounted for on the trade date. Cost is determined and gains (losses) are based upon the specific identification method for both financial statement and federal income tax purposes.
In March 2008, Statement of Financial Accounting Standards No. 161, Disclosures about Derivative Instruments and Hedging Activities-an amendment of FASB Statement No. 133 (“SFAS 161”), was issued. SFAS 161 is effective for fiscal years and interim periods beginning after November 15, 2008. SFAS 161 requires additional discussion about the reporting entity’s derivative instruments and hedging activities, by providing for qualitative disclosures about the objectives and strategies for using derivatives, quantitative data about the fair value of and gains and losses on derivative contracts, and details of credit-risk-related contingent features in their derivative contracts. Management is evaluating the impact the application of SFAS 161 will have on the Fund’s financial statement disclosures.
Options
The Fund may write call and put options on securities it owns or in which it may invest. Writing put options tends to increase the Fund’s exposure to the underlying instrument. Writing call options tends to decrease the Fund’s exposure to the underlying instrument. When the Fund writes a call or put option, an amount equal to the premium received is recorded as a liability and subsequently marked-to-market to reflect the current value of the option written. Premiums received from writing options which expire are treated as realized gains. Premiums received from writing options which are exercised or closed are added to the proceeds or offset against the amounts paid on the underlying security transaction to determine the realized gain or loss. The Fund, as a writer of an option, has no control over whether the underlying security may be sold (call) or purchased (put) and as a result bears the market risk of an unfavorable change in the price of the security underlying the written option. There is the risk that the Fund may not be able to enter into a closing transaction because of an illiquid market. The Fund’s custodian will set aside cash or liquid portfolio securities equal to the amount of the written options contract commitment in a separate account.
The Fund may also purchase put and call options. Purchasing call options tends to increase the Fund’s exposure to the underlying instrument. Purchasing put options tends to decrease the Fund’s exposure to the underlying instrument. The Fund may pay a premium, which is included in the Fund’s Statement of Assets and Liabilities as an investment and subsequently marked-to-market to reflect the current value of the option. The risk associated with purchasing put and call options is limited to the premium paid. Premiums paid for purchasing options which expire are treated as realized losses. Premiums paid for purchasing options which are exercised are added to the amounts paid (call) or offset against the proceeds (put) on the underlying security to determine the realized gain or loss. If the Fund enters into a closing transaction, the Fund will realize a gain or loss, depending on whether the proceeds from the closing transaction are greater or less than the cost of the option.
Forward Foreign Currency Exchange Contracts
Forward foreign currency exchange contracts are agreements to exchange one currency for another at a future date at a specified price. These contracts are used to minimize the exposure to foreign exchange rate fluctuations during the period between trade and settlement date of the contract. The Fund may utilize forward foreign currency exchange contracts in connection with the settlement of purchases and sales of securities. The Fund may also enter into these contracts to hedge certain other foreign currency denominated assets. Contracts to buy generally are used to acquire exposure to foreign currencies, while contracts to sell
24
Columbia World Equity Fund
March 31, 2009
are generally used to hedge the Fund’s investments against currency fluctuations. Forward foreign currency exchange contracts are valued daily at the current exchange rate of the underlying currency, resulting in unrealized gains (losses) which become realized at the time the forward foreign currency exchange contracts are closed or mature. Realized and unrealized gains (losses) arising from such transactions are included in net realized and unrealized gains (losses) on foreign currency transactions. The use of forward foreign currency exchange contracts does not eliminate fluctuations in the prices of the Fund’s portfolio securities. While the maximum potential loss from such contracts is the aggregate face value in U.S. dollars at the time the contract was opened, exposure is typically limited to the change in value of the contract (in U.S. dollars) over the period it remains open. The Fund could also be exposed to risk that counterparties of the contracts may be unable to fulfill the terms of the contracts.
Repurchase Agreements
The Fund may engage in repurchase agreement transactions with institutions that Columbia Management Advisors, LLC (“Columbia”), the Fund’s investment advisor, has determined are creditworthy. The Fund, through its custodian, receives delivery of the underlying securities collateralizing a repurchase agreement. Columbia is responsible for determining that the collateral is at least equal, at all times, to the value of the repurchase obligation including interest. A repurchase agreement transaction involves certain risks in the event of default or insolvency of the counterparty. These risks include possible delays in or restrictions on the Fund’s ability to dispose of the underlying securities and a possible decline in the value of the underlying securities during the period while the Fund seeks to assert its rights.
Foreign Currency Transactions and Translations
The values of all assets and liabilities quoted in foreign currencies are translated into U.S. dollars at that day’s exchange rates. Net realized and unrealized gains (losses) on foreign currency transactions and translations include gains (losses) arising from the fluctuation in exchange rates between trade and settlement dates on securities transactions, gains (losses) arising from the disposition of foreign currency and currency gains (losses) between the accrual and payment dates on dividends, interest income and foreign withholding taxes.
For financial statement purposes, the Fund does not distinguish that portion of gains (losses) on investments which is due to changes in foreign exchange rates from that which is due to changes in market prices of the investments. Such fluctuations are included with the net realized and unrealized gains (losses) on investments on the Statement of Operations.
Income Recognition
Interest income is recorded on the accrual basis.
Corporate actions and dividend income are recorded on the ex-date except for certain foreign securities which are recorded as soon after the ex-date as the Fund becomes aware of such, net of any non-reclaimable tax withholdings.
Expenses
General expenses of the Trust are allocated to the Fund and other series of the Trust based upon relative net assets or other expense allocation methodologies determined by the nature of the expense. Expenses directly attributable to the Fund are charged to the Fund.
Determination of Class Net Asset Value
All income, expenses (other than class-specific expenses, as shown on the Statement of Operations) and realized and unrealized gains (losses) are allocated to each class of the Fund on a daily basis, based on the relative net assets of each class, for purposes of determining the net asset value of each class.
Federal Income Tax Status
The Fund intends to qualify each year as a “regulated investment company” under Subchapter M of the Internal Revenue Code, as amended, and will distribute substantially all of its taxable income, if any, for its tax year, and as such will not be subject to federal income taxes. In addition, the Fund intends to distribute in each calendar year substantially all of its net investment income, capital gains and certain other amounts, if any, such that the Fund should not be subject to federal excise tax. Therefore, no provision is made for federal income or excise taxes.
Distributions to Shareholders
Distributions from net investment income, if any, are declared and paid annually. Net realized capital gains, if any,
25
Columbia World Equity Fund
March 31, 2009
are distributed at least annually. Income distributions and capital gain distributions are determined in accordance with federal income tax regulations which may differ from GAAP.
Indemnification
In the normal course of business, the Fund enters into contracts that contain a variety of representations and warranties and which provide general indemnities. The Fund’s maximum exposure under these arrangements is unknown because this would involve future claims against the Fund. Also, under the Trust’s organizational documents and by contract, the Trustees and officers of the Trust are indemnified against certain liabilities that may arise out of actions relating to their duties to the Trust. However, based on experience, the Fund expects the risk of loss due to these representations, warranties and indemnities to be minimal.
Note 3. Federal Tax Information
The timing and character of income and capital gain distributions are determined in accordance with income tax regulations, which may differ from GAAP. Reclassifications are made to the Fund’s capital accounts for permanent tax differences to reflect income and gains available for distribution (or available capital loss carryforwards) under income tax regulations.
For the year ended March 31, 2009, permanent book and tax differences resulting primarily from differing treatments for distribution reclasses and foreign currency transactions were identified and reclassified among the components of the Fund’s net assets as follows:
| | | | |
| | | | | |
Undistributed Net Investment Income | | Accumulated Net Realized
Loss | | Paid-In Capital |
| $(454,520) | | $454,528 | | $(8) |
Net investment income and net realized gains (losses), as disclosed on the Statement of Operations, and net assets were not affected by this reclassification.
The tax character of distributions paid during the years ended March 31, 2009 and March 31, 2008 was as follows:
| | | | | | |
| | | March 31, 2009 | | March 31, 2008 |
| Distributions paid from: | | |
Ordinary Income* | | $ | 9,003 | | $ | 2,750,752 |
Long-Term Capital Gains | | | 607,040 | | | 7,127,969 |
| * | For tax purposes short-term capital gains distributions, if any, are considered ordinary income distributions. |
As of March 31, 2009, the components of distributable earnings on a tax basis were as follows:
| | | | | | | |
| | | | | | |
Undistributed
Ordinary Income | | Undistributed Long-term Capital Gains | | Net Unrealized Depreciation* | |
| $66,745 | | $ | — | | $ | (10,867,648 | ) |
| * | The differences between book-basis and tax-basis net unrealized appreciation/depreciation are primarily due to deferral of losses from wash sales. |
Unrealized appreciation and depreciation at March 31, 2009, based on cost of investments for federal income tax purposes, were:
| | | | |
| | | | |
Unrealized appreciation | | $ | 2,420,291 | |
Unrealized depreciation | | | (13,287,939 | ) |
| | | | |
Net unrealized depreciation | | $ | (10,867,648 | ) |
The following capital loss carryforwards may be available to reduce taxable income arising from future net realized gains on investments, if any, to the extent permitted by the Internal Revenue Code:
| | |
| | | |
| Year of Expiration | | Capital Loss Carryforward |
| 2017 | | $7,698,220 |
Under current tax rules, certain currency (and capital) losses realized after October 31 may be deferred and treated as occurring on the first day of the following fiscal year. As of March 31, 2009, post-October capital losses of $7,735,077 attributed to security transactions were deferred to April 1, 2009.
26
Columbia World Equity Fund
March 31, 2009
Under Financial Accounting Standards Board (“FASB”) Interpretation No. 48, Accounting for Uncertainty in Income Taxes—an Interpretation of FASB Statement No. 109 (“FIN 48”), management determines whether a tax position of the Fund is more likely than not to be sustained upon examination by the applicable taxing authority, including resolution of any related appeals or litigation processes, based on the technical merits of the position. The tax benefit to be recognized is measured as the largest amount of benefit that is greater than fifty percent likely of being realized upon ultimate settlement. Management has evaluated the known implications of FIN 48 on its computation of net assets for the Fund. As a result of this evaluation, management has concluded that FIN 48 did not have any effect on the Fund’s financial statements. However, management’s conclusions regarding FIN 48 may be subject to review and adjustment at a later date based on factors including, but not limited to, further implementation guidance from the FASB, new tax laws, regulations, and administrative interpretations (including relevant court decisions). The Fund’s federal tax returns for the prior three fiscal years remain subject to examination by the Internal Revenue Service. The Fund is not aware of any tax positions for which it is reasonably possible that the total amounts of unrecognized tax benefits will significantly change in the next twelve months.
Note 4. Fees and Compensation Paid to Affiliates
Investment Advisory Fee
Columbia, an indirect, wholly owned subsidiary of Bank of America Corporation (“BOA”) provides investment advisory services to the Fund. In rendering investment advisory services to the Fund, Columbia may use the portfolio management and research resources of Columbia Management Pte. Ltd., an affiliate of Columbia. Columbia receives a monthly investment advisory fee based on the Fund’s average daily net assets at the following annual rates:
| | | |
| | | | |
| Average Daily Net Assets | | Annual Fee Rate | |
First $1 billion | | 0.40 | % |
Over $1 billion | | 0.35 | % |
Columbia has voluntarily agreed to waive its investment advisory fee charged to the Fund on its assets that are invested in Columbia Greater China Fund. Columbia, in its discretion, may revise or discontinue this arrangement at any time.
For the year ended March 31, 2009, the Fund’s effective investment advisory fee rate was 0.40% of the Fund’s average daily net assets.
Administration Fee
Columbia provides administrative and other services to the Fund for a monthly administration fee at the annual rate of 0.25% of the Fund’s average daily net assets. Columbia has voluntarily agreed to waive its administration fee charged to the Fund on its assets that are invested in Columbia Greater China Fund. Columbia, in its discretion, may revise or discontinue this arrangement at any time.
Pricing and Bookkeeping Fees
The Fund has entered into a Financial Reporting Services Agreement (the “Financial Reporting Services Agreement”) with State Street Bank & Trust Company (“State Street”) and Columbia pursuant to which State Street provides financial reporting services to the Fund. The Fund has also entered into an Accounting Services Agreement (collectively with the Financial Reporting Services Agreement, the “State Street Agreements”) with State Street and Columbia pursuant to which State Street provides accounting services to the Fund. Under the State Street Agreements, the Fund pays State Street an annual fee of $38,000 paid monthly plus an additional monthly fee based on an annualized percentage rate of average daily net assets of the Fund for the month. The aggregate fee will not exceed $140,000 per year (exclusive of out-of-pocket expenses and charges). The Fund also reimburses State Street for certain out-of-pocket expenses and charges.
The Fund has entered into a Pricing and Bookkeeping Oversight and Services Agreement (the “Services Agreement”) with Columbia. Under the Services Agreement, Columbia provides services related to Fund expenses and the requirements of the Sarbanes-Oxley Act of 2002, and provides oversight of the accounting and financial reporting services provided by State Street. Under the Services Agreement, the Fund reimburses Columbia for out-of-pocket expenses.
Transfer Agent Fee
Columbia Management Services, Inc. (the “Transfer Agent”), an affiliate of Columbia and an indirect, wholly owned
27
Columbia World Equity Fund
March 31, 2009
subsidiary of BOA, provides shareholder services to the Fund and has contracted with Boston Financial Data Services (“BFDS”) to serve as sub-transfer agent. The Transfer Agent is entitled to receive a fee for its services, paid monthly, at the annual rate of $17.34 per open account plus reimbursement of certain sub-transfer agent fees paid by the Transfer Agent (exclusive of BFDS fees), calculated based on assets held in omnibus accounts and intended to recover the cost of payments to other parties (including affiliates of BOA) for services to those accounts. The Transfer Agent pays the fees of BFDS for services as sub-transfer agent and is not entitled to reimbursement for such fees from the Fund.
The Transfer Agent may also retain, as additional compensation for its services, fees for wire, telephone and redemption orders, Individual Retirement Account (“IRA”) trustee agent fees and account transcript fees due to the Transfer Agent from shareholders of the Fund and credits (net of bank charges) earned with respect to balances in accounts the Transfer Agent maintains in connection with its services to the Fund. The Transfer Agent also receives reimbursement for certain out-of-pocket expenses.
An annual minimum account balance fee of $20 may apply to certain accounts with a value below the Fund’s initial minimum investment requirements to reduce the impact of small accounts on transfer agent fees. These minimum account balance fees are recorded as part of expense reductions on the Statement of Operations. For the year ended March 31, 2009, these minimum account balance fees reduced total expenses by $9,526.
Underwriting Discounts, Service and Distribution Fees
Columbia Management Distributors, Inc. (the “Distributor”), an affiliate of Columbia and an indirect, wholly owned subsidiary of BOA, is the principal underwriter of the Fund’s shares. For the year ended March 31, 2009, the Distributor has retained net underwriting discounts of $1,829 on sales of the Fund’s Class A shares and received net CDSC fees of $104, $2,659 and $76 on Class A, Class B and Class C share redemptions, respectively.
The Fund has adopted plans pursuant to Rule 12b-1 under the 1940 Act (the “Plans”) which require the payment of a monthly service fee to the Distributor at the maximum annual rate of 0.25% of the average daily net assets attributable to Class A, Class B and Class C shares of the Fund. The Plans also require the payment of a monthly distribution fee to the Distributor at the maximum annual rate of 0.75% of the average daily net assets attributable to Class B and Class C shares only.
The CDSC and the distribution fees received from the Plans are used principally as repayment to the Distributor for amounts paid by the Distributor to dealers who sold such shares.
Fee Waivers and Expense Reimbursements
Effective January 1, 2009, Columbia has voluntarily agreed to reimburse a portion of the Fund’s expenses so that the Fund’s ordinary operating expenses (excluding any distribution and service fees, brokerage commissions, interest, taxes and extraordinary expenses, but including custodian charges relating to overdrafts, if any), after giving effect to any balance credits from the Fund’s custodian, do not exceed 1.15% of the Fund’s average daily net assets on an annualized basis. Columbia, in its discretion, may revise or discontinue this arrangement at any time.
Fees Paid to Officers and Trustees
All officers of the Fund are employees of Columbia or its affiliates and, with the exception of the Fund’s Chief Compliance Officer, receive no compensation from the Fund. The Board of Trustees has appointed a Chief Compliance Officer to the Fund in accordance with federal securities regulations. The Fund, along with other affiliated funds, pays its pro-rata share of the expenses associated with the Chief Compliance Officer. The Fund’s expenses for the Chief Compliance Officer will not exceed $15,000 per year.
The Trust’s eligible Trustees may participate in a deferred compensation plan which may be terminated at any time. Obligations of the plan will be paid solely out of the Fund’s assets.
Note 5. Custody Credits
The Fund has an agreement with its custodian bank under which custody fees may be reduced by balance credits. These credits are recorded as part of expense reductions on the Statement of Operations. The Fund could have invested a portion of the assets utilized in connection with the expense offset arrangement in an income-producing asset if it had not entered into such an agreement.
28
Columbia World Equity Fund
March 31, 2009
For the year ended March 31, 2009, these custody credits reduced total expenses by $27 for the Fund.
Note 6. Portfolio Information
For the year ended March 31, 2009, the cost of purchases and proceeds from sales of securities, excluding short-term obligations, for the Fund were $89,797,708 and $97,776,137, respectively.
Note 7. Redemption Fees
The Fund may impose a 2.00% redemption fee on the proceeds of fund shares that are redeemed within 60 days of purchase. The redemption fee is designed to offset brokerage commissions and other costs associated with short term trading of the portfolio. The redemption fees, which are retained by the Fund, are accounted for as an addition to paid-in capital and are allocated to each class based on the relative net assets at the time of the redemption. For the year ended March 31, 2009, the Fund assessed redemption fees of $753, $29 and $10 for Class A, Class B and Class C shares, respectively, of the Fund.
Note 8. Regulatory Settlements
As of March 31, 2009, the Fund was entitled to receive payments of $48,532 relating to certain regulatory settlements the Fund had participated in during the year. The payments have been included in “Increase from regulatory settlements” on the Statement of Changes in Net Assets.
Note 9. Line of Credit
The Fund and other affiliated funds participate in a $280,000,000 committed, unsecured revolving line of credit provided by State Street. The maximum amount that may be borrowed by any fund is limited to the lesser of $200,000,000 and the Fund’s borrowing limit set forth in the Fund’s registration statement. Borrowings are available for short-term liquidity or temporary or emergency purposes.
Interest is charged to each participating fund based on the fund’s borrowings at a rate per annum equal to the greater of the Federal Funds Rate plus 0.50% or the overnight LIBOR Rate plus 0.50%. In addition, an annual operations agency fee of $20,000, an amendment fee of 0.02% and a commitment fee of 0.12% per annum are accrued and apportioned among the participating funds pro rata based on their relative net assets. Prior to October 16, 2008, the Fund and other affiliated funds participated in a $350,000,000 committed, unsecured revolving line of credit and a $150,000,000 uncommitted, unsecured line of credit, both provided by State Street. Interest on the committed line of credit was charged to each participating fund based on the fund’s borrowings at a rate per annum equal to the Federal Funds Rate plus 0.50%. In addition, a commitment fee of 0.10% per annum was accrued and apportioned among the participating funds pro rata based on their relative net assets. Interest on the uncommitted line of credit was charged to each participating fund based on the fund’s borrowings at a rate per annum equal to the Federal Funds Rate plus 0.375%. State Street charged an annual operations agency fee of $40,000 for the committed line of credit and was able to charge an annual administration fee of $15,000 for the uncommitted line of credit. The commitment fee, the operations agency fee and the administration fee were accrued and apportioned among the participating funds pro rata based on their relative net assets.
For the year ended March 31, 2009, the Fund did not borrow under these arrangements.
Note 10. Significant Risks and Contingencies
Foreign Securities Risk
There are certain additional risks involved when investing in foreign securities. These risks may involve foreign currency exchange rate fluctuations, adverse political and economic developments and the possible prevention of currency exchange or other foreign governmental laws or restrictions. In addition, the liquidity of foreign securities may be more limited than that of domestic securities.
Investments in emerging market countries are subject to additional risk. The risk of foreign investments is typically increased in less developed countries. These countries are also more likely to experience high levels of inflation, deflation or currency devaluation which could hurt their economies and securities markets.
Legal Proceedings
Columbia Management Advisors, LLC and Columbia Management Distributors, Inc. (collectively, the “Columbia Group”) are subject to a settlement agreement with the New York Attorney General (“NYAG”) (the “NYAG Settlement”) and a settlement order with the SEC (the “SEC Order”) on matters relating to mutual fund trading, each dated
29
Columbia World Equity Fund
March 31, 2009
February 9, 2005. Under the terms of the SEC Order, the Columbia Group (or predecessor entities) agreed, among other things, to: pay disgorgement and civil money penalties collectively totaling $140 million; cease and desist from violations of the antifraud provisions and certain other provisions of the federal securities laws; maintain certain compliance and ethics oversight structures; and retain an independent consultant to review the Columbia Group’s applicable supervisory, compliance, control and other policies and procedures. The NYAG Settlement, among other things, requires Columbia Management Advisors, LLC and its affiliates to reduce management fees for certain funds in the Columbia family of mutual funds in a projected total of $160 million over five years through November 30, 2009 and to make certain disclosures to investors relating to expenses. In connection with the Columbia Group providing services to the Columbia Funds, the Columbia Funds have voluntarily undertaken to implement certain governance measures designed to maintain the independence of their boards of trustees and certain special consulting and compliance measures.
Pursuant to the SEC Order and related procedures, the $140 million in settlement amounts described above has been substantially distributed in accordance with a distribution plan that was developed by an independent distribution consultant and approved by the SEC on April 6, 2007.
In connection with the events described above, various parties have filed suit against certain funds, the Trustees of the Columbia Funds, FleetBoston Financial Corporation and its affiliated entities and/or Bank of America and its affiliated entities.
On February 20, 2004, the Judicial Panel on Multidistrict Litigation transferred these cases and cases against other mutual fund companies based on similar allegations to the United States District Court in Maryland for consolidated or coordinated pretrial proceedings (the “MDL”). Subsequently, additional related cases were transferred to the MDL. On September 29, 2004, the plaintiffs in the MDL filed amended and consolidated complaints. One of these amended complaints is a putative class action that includes claims under the federal securities laws and state common law, and that names Columbia Management Advisors, Inc. (which has since merged into Banc of America Capital Management, LLC (now named Columbia Management Advisors, LLC)) (“Columbia”), Columbia Funds Distributor, Inc. (now named Columbia Management Distributors, Inc.) (the “Distributor”), the Trustees of the Columbia Funds, Bank of America Corporation and others as defendants. Another of the amended complaints is a derivative action purportedly on behalf of the Columbia Funds that asserts claims under federal securities laws and state common law.
On February 25, 2005, Columbia and other defendants filed motions to dismiss the claims in the pending cases. On March 1, 2006, for reasons stated in the court’s memoranda dated November 3, 2005, the United States District Court for the District of Maryland granted in part and denied in part the defendants’ motions to dismiss. The court dismissed all of the class action claims pending against the Columbia Funds Trusts. As to Columbia and the Distributor, the claims under the Securities Act of 1933, the claims under Sections 34(b) and 36(a) of the Investment Company Act of 1940 (“ICA”) and the state law claims were dismissed. The claims under Sections 10(b) and 20(a) of the Securities Exchange Act of 1934 and claims under Section 36(b) of the ICA were not dismissed.
On March 21, 2005, a purported class action was filed in Massachusetts state court alleging that certain conduct, including market timing, entitled Class B shareholders in certain Columbia Funds to an exemption from contingent deferred sales charges upon early redemption (the “CDSC Lawsuit”). The CDSC Lawsuit was removed to federal court in Massachusetts and transferred to the MDL.
On September 14, 2007, the plaintiffs and the Columbia defendants named in the MDL, including the Columbia Funds, entered into a stipulation of settlement with respect to all Columbia-related claims in the MDL described above, including the CDSC Lawsuit. The settlement is subject to court approval.
30
Report of Independent Registered Public Accounting Firm
To the Trustees of Columbia Funds Series Trust I and the Shareholders of Columbia World Equity Fund
In our opinion, the accompanying statement of assets and liabilities, including the investment portfolio, and the related statements of operations and of changes in net assets and the financial highlights present fairly, in all material respects, the financial position of Columbia World Equity Fund (the “Fund”) (a series of Columbia Funds Series Trust I) at March 31, 2009, and the results of its operations, the changes in its net assets and the financial highlights for the periods indicated, in conformity with accounting principles generally accepted in the United States of America. These financial statements and financial highlights (hereafter referred to as “financial statements”) are the responsibility of the Portfolio’s management. Our responsibility is to express an opinion on these financial statements based on our audits. We conducted our audits of these financial statements in accordance with the standards of the Public Company Accounting Oversight Board (United States). Those standards require that we plan and perform the audit to obtain reasonable assurance about whether the financial statements are free of material misstatement. An audit includes examining, on a test basis, evidence supporting the amounts and disclosures in the financial statements, assessing the accounting principles used and significant estimates made by management, and evaluating the overall financial statement presentation. We believe that our audits, which included confirmation of securities at March 31, 2009 by correspondence with the custodian and brokers, provide a reasonable basis for our opinion.
PricewaterhouseCoopers LLP
Boston, Massachusetts
May 22, 2009
31
Federal Income Tax Information – (Unaudited) – Columbia World Equity Fund
Foreign taxes paid during the fiscal year ended March 31, 2009, of $103,428 ($0.02 per share) are expected to be passed through to shareholders. This entire amount will be eligible for shareholders to claim as a foreign tax credit.
Gross income derived from sources within foreign countries amounted was $1,122,582 ($0.22 per share) for the fiscal year ended March 31, 2009.
32
Fund Governance
The Trustees serve terms of indefinite duration. The names, addresses and ages of the Trustees and officers of the Funds in Columbia Funds Series Trust I, the year each was first elected or appointed to office, their principal business occupations during at least the last five years, the number of Funds overseen by each Trustee and other directorships they hold are shown below. Each officer listed below serves as an officer of each Fund in the Columbia Funds Complex.
Independent Trustees
| | |
Name, Address and Year of Birth,
Position with Funds, Year First
Elected or Appointed to Office | | Principal Occupation(s) During Past Five Years, Number of Portfolios in Columbia
Funds Complex Overseen by Trustee, Other Directorships Held |
| |
| John D. Collins (Born 1938) | | |
c/o Columbia Management Advisors, LLC
One Financial Center
Boston, MA 02111
Trustee (since 2007) | | Retired. Consultant, KPMG, LLP (accounting and tax firm) from July 1999 to June 2000; Partner, KPMG, LLP from March 1962 to June 1999. Oversees 79, Mrs. Fields Famous Brands LLC (consumer products); Suburban Propane Partners, L.P.; and Montpelier Re (underwriting firm) |
| |
| Rodman L. Drake (Born 1943) | | |
c/o Columbia Management Advisors, LLC
One Financial Center
Boston, MA 02111
Trustee (since 2007) | | Co-Founder of Baringo Capital LLC (private equity) since 2002; President, Continuation Investments Group, Inc. from 1997 to 2001. Oversees 79, Jackson Hewitt Tax Service Inc. (tax preparation services); Crystal Capital River Inc. (real estate investment trust); Student Loan Corporation (student loan provider); Celgene Corporation (global biotechnology company); Apex Silver Mines Ltd. (mining); and Hyperion Brookfield Total Return Fund, Inc. and Hyperion Brookfield Strategic Mortgage Income Fund, Inc. (exchange-traded funds) |
| |
| Douglas A. Hacker (Born 1955) | | |
c/o Columbia Management Advisors, LLC
One Financial Center
Boston, MA 02111
Trustee (since 1996) | | Independent business executive since May 2006; Executive Vice President–Strategy of United Airlines (airline) from December 2002 to May 2006; President of UAL Loyalty Services (airline marketing company) from September 2001 to December 2002; Executive Vice President and Chief Financial Officer of United Airlines from July 1999 to September 2001. Oversees 79, Nash Finch Company (food distributor); Aircastle Limited (aircraft leasing) |
| |
| Janet Langford Kelly (Born 1957) | | |
c/o Columbia Management Advisors, LLC
One Financial Center
Boston, MA 02111
Trustee (since 1996) | | Senior Vice President, General Counsel and Corporate Secretary, ConocoPhillips (integrated energy company) since September 2007; Deputy General Counsel–Corporate Legal Services, ConocoPhillips from August 2006 to August 2007; Partner, Zelle, Hofmann, Voelbel, Mason & Gette LLP (law firm) from March 2005 to July 2006; Adjunct Professor of Law, Northwestern University, from September 2004 to June 2006; Director, UAL Corporation (airline) from February 2006 to July 2006. Oversees 79, None |
33
Fund Governance (continued)
Independent Trustees (continued)
| | |
Name, Address and Year of Birth,
Position with Funds, Year First
Elected or Appointed to Office | | Principal Occupation(s) During Past Five Years, Number of Portfolios in Columbia
Funds Complex Overseen by Trustee, Other Directorships Held |
| |
| Charles R. Nelson (Born 1942) | | |
c/o Columbia Management Advisors, LLC
One Financial Center
Boston, MA 02111
Trustee (since 1981) | | Professor of Economics, University of Washington, since January 1976; Ford and Louisa Van Voorhis Professor of Political Economy, University of Washington, since September 1993; Director, Institute for Economic Research, University of Washington from September 2001 to June 2003; Adjunct Professor of Statistics, University of Washington, since September 1980; Associate Editor, Journal of Money Credit and Banking, since September 1993; Consultant on econometric and statistical matters. Oversees 79, None |
| |
| John J. Neuhauser (Born 1943) | | |
c/o Columbia Management Advisors, LLC
One Financial Center
Boston, MA 02111
Trustee (since 1985) | | President, Saint Michael’s College, since August 2007; University Professor, Boston College from November 2005 to August 2007; Academic Vice President and Dean of Faculties, Boston College from August 1999 to October 2005. Oversees 79, Liberty All-Star Equity Fund and Liberty All-Star Growth Fund, Inc. (closed-end funds) |
| |
| Jonathan Piel (Born 1938) | | |
c/o Columbia Management Advisors, LLC
One Financial Center
Boston, MA 02111
Trustee (since 2007) | | Cable television producer and website designer; The Editor, Scientific American from 1984 to 1994; Vice President, Scientific American, Inc., from 1984 to 1994; Member, Advisory Board, Stone Age Institute, Bloomington, Indiana (research institute that explores the effect of technology on human evolution); Member, Board of Directors of the National Institute of Social Sciences, New York City; and Member, Board of Trustees of the William Alanson White Institute, New York City (institution for training psychoanalysts). Oversees 79, None |
| |
| Patrick J. Simpson (Born 1944) | | |
c/o Columbia Management Advisors, LLC
One Financial Center
Boston, MA 02111
Trustee (since 2000) | | Partner, Perkins Coie LLP (law firm). Oversees 79, None |
| |
| Thomas C. Theobald (Born 1937) | | |
c/o Columbia Management Advisors, LLC
One Financial Center
Boston, MA 02111
Trustee and Chairman of the Board (since 1996) | | Partner and Senior Advisor, Chicago Growth Partners (private equity investing) since September 2004; Managing Director, William Blair Capital Partners (private equity investing) from September 1994 to September 2004. Oversees 79, Anixter International (network support equipment distributor); Ventas, Inc. (real estate investment trust); Jones Lang LaSalle (real estate management services); Ambac Financial Group (financial guaranty insurance) |
| |
| Anne-Lee Verville (Born 1945) | | |
c/o Columbia Management Advisors, LLC
One Financial Center
Boston, MA 02111
Trustee (since 1998) | | Retired since 1997 (formerly General Manager–Global Education Industry (from 1994 to 1997), President–Application Systems Division (from 1991 to 1994), Chief Financial Officer–US Marketing & Services (from 1988 to 1991), and Chief Information Officer (from 1987 to 1988), IBM Corporation (computer and technology)). Oversees 79, None |
34
Fund Governance (continued)
Interested Trustee
| | |
Name, Address and Year of Birth,
Position with Funds, Year First
Elected or Appointed to Office | | Principal Occupation(s) During Past Five Years, Number of Portfolios in Columbia
Funds Complex Overseen by Trustee, Other Directorships Held |
| |
| William E. Mayer (Born 1940) | | |
c/o Columbia Management Advisors, LLC
One Financial Center
Boston, MA 02111
Trustee1 (since 1994) | | Partner, Park Avenue Equity Partners (private equity) since February 1999; Dean and Professor, College of Business, University of Maryland from 1992 to 1997. Oversees 79, Lee Enterprises (print media), WR Hambrecht + Co. (financial service provider); BlackRock Kelso Capital Corporation (investment company) |
1 | Mr. Mayer is deemed to be an “interested person” (as defined in the Investment Company Act of 1940) of the Columbia Funds by reason of his affiliation with WR Hambrecht + Co., a registered broker/dealer that may execute portfolio transactions for or engage in principal transactions with the Funds or other funds or accounts advised/managed by the Advisor or other Bank of America affiliates. |
The Statement of Additional Information includes additional information about the Trustees of the Funds and is available, without charge, upon request by calling 1-800-345-6611.
35
Fund Governance (continued)
Officers
| | |
Name, Address and Year of Birth,
Position with Columbia Funds, Year
First Elected or Appointed to Office | | Principal Occupation(s) During Past Five Years |
| |
| J. Kevin Connaughton (Born 1964) | | |
One Financial Center
Boston, MA 02111
President (since 2009) | | Managing Director of Columbia Management Advisors, LLC since December 2004; Senior Vice President and Chief Financial Officer–Columbia Funds, from June 2008 to January 2009; Treasurer–Columbia Funds, from October 2003 to May 2008; Treasurer–the Liberty Funds, Stein Roe Funds and Liberty All-Star Funds, December 2000–December 2006; Senior Vice President–Columbia Management Advisors, LLC, from April 2003 to December 2004; President–Columbia Funds, Liberty Funds and Stein Roe Funds, February 2004 to October 2004; Treasurer–Galaxy Funds, September 2002 to December 2005; Treasurer, December 2002 to December 2004, and President, February 2004 to December 2004–Columbia Management Multi-Strategy Hedge Fund, LLC; and a senior officer of various other Bank of America-affiliated entities, including other registered and unregistered funds. |
| |
| James R. Bordewick, Jr. (Born 1959) | | |
One Financial Center
Boston, MA 02111
Senior Vice President, Secretary and Chief Legal Officer (since 2006) | | Associate General Counsel, Bank of America since April 2005; Senior Vice President and Associate General Counsel, MFS Investment Management (investment management) prior to April 2005. |
| |
| Linda J. Wondrack (Born 1964) | | |
One Financial Center
Boston, MA 02111
Senior Vice President and
Chief Compliance Officer
(since 2007) | | Director (Columbia Management Group LLC and Investment Product Group Compliance), Bank of America since June 2005; Director of Corporate Compliance and Conflicts Officer, MFS Investment Management (investment management), August 2004 to May 2005; Managing Director, Deutsche Asset Management (investment management) prior to August 2004. |
| |
| Michael G. Clarke (Born 1969) | | |
One Financial Center
Boston, MA 02111
Senior Vice President and
Chief Financial Officer (since 2009) | | Director of Fund Administration of the Advisor since January 2006; Managing Director of the Advisor September 2004 to December 2005; Vice President Fund Administration June 2002 to September 2004. |
| |
| Jeffrey R. Coleman (Born 1969) | | |
One Financial Center
Boston, MA 02111
Deputy Treasurer (since 2006) | | Director of Fund Administration of the Advisor since January 2006; Fund Controller of the Advisor from October 2004 to January 2006; Vice President of CDC IXIS Asset Management Services, Inc. (investment management) from August 2000 to September 2004. |
| |
| Joseph F. DiMaria (Born 1968) | | |
One Financial Center
Boston, MA 02111
Chief Accounting Officer and Treasurer (since 2009) | | Director of Fund Administration of the Advisor since January 2006; Head of Tax/Compliance and Assistant Treasurer of the Advisor from November 2004 to December 2005; Director of Trustee Administration (Sarbanes-Oxley) of the Advisor from May 2003 to October 2004. |
| |
| Julian Quero (Born 1967) | | |
One Financial Center
Boston, MA 02111
Deputy Treasurer (since 2008) | | Senior Tax Manager of the Advisor since August 2006; Senior Compliance Manager of the Advisor from April 2002 to August 2006. |
36
Fund Governance (continued)
Officers (continued)
| | |
Name, Address and Year of Birth,
Position with Columbia Funds, Year
First Elected or Appointed to Office | | Principal Occupation(s) During Past Five Years |
| |
| Barry S. Vallan (Born 1969) | | |
One Financial Center
Boston, MA 02111
Controller (since 2006) | | Vice President–Fund Treasury of the Advisor since October 2004; Vice President–Trustee Reporting of the Advisor from April 2002 to October 2004 |
37
Board Consideration and Approval of Advisory Agreements
The Advisory Fees and Expenses Committee of the Board of Trustees meets several times annually to review the advisory agreements (collectively, the “Agreements”) of the funds for which the Trustees serve as trustees (each a “fund”) and to determine whether to recommend that the full Board approve the continuation of the Agreements for an additional one-year period. After the Committee has made its recommendation, the full Board, including the Independent Trustees, determines whether to approve the continuation of the Agreements. In addition, the full Board, including the Independent Trustees, considers matters bearing on the Agreements at most of its other meetings throughout the year and meets regularly with senior management of the funds and Columbia, the funds’ investment adviser, including the senior manager of each investment area within Columbia. Through the Board’s Investment Oversight Committees, Trustees also meet with selected fund portfolio managers, research analysts and traders at various times throughout the year.
The Trustees receive and review all materials that they, their legal counsel or Columbia believe to be reasonably necessary for the Trustees to evaluate the Agreements and to determine whether to approve the continuation of the Agreements. Those materials generally include, among other items, (i) information on the investment performance of each fund relative to the performance of peer groups of mutual funds and the fund’s performance benchmarks, and additional information assessing performance on a risk-adjusted basis, (ii) information on each fund’s advisory fees and other expenses, including information comparing the fund’s expenses to those of peer groups of mutual funds and information about any applicable expense caps and fee “breakpoints,” (iii) information about the profitability of the Agreements to Columbia, including potential “fall-out” or ancillary benefits that Columbia and its affiliates may receive as a result of their relationships with the funds and (iv) information obtained through Columbia’s response to a questionnaire prepared at the request of the Trustees by counsel to the funds and independent legal counsel to the Independent Trustees. The Trustees also consider other information such as (v) Columbia’s financial results and financial condition, (vi) each fund’s investment objective and strategies and the size, education and experience of Columbia’s investment staffs and their use of technology, external research and trading cost measurement tools, (vii) the allocation of the funds’ brokerage and the use of “soft” commission dollars to pay for research products and services, (viii) Columbia’s resources devoted to, and its record of compliance with, the funds’ investment policies and restrictions, policies on personal securities transactions and other compliance policies and legal and regulatory requirements, (ix) Columbia’s response to various legal and regulatory proceedings since 2003 and to the recent period of volatility in the securities markets and (x) the economic outlook generally and for the mutual fund industry in particular. In addition, the Advisory Fees and Expenses Committee confers with the funds’ independent fee consultant and reviews materials relating to the funds’ relationships with Columbia provided by the independent fee consultant. Throughout the process, the Trustees have the opportunity to ask questions of and to request additional materials from Columbia and to consult with the independent fee consultant and independent legal counsel to the Independent Trustees.
The Board of Trustees most recently approved the continuation of the Agreements at its October, 2008 meeting, following meetings of the Advisory Fees and Expenses Committee held in February, April, August, September and October, 2008. In considering whether to approve the continuation of the Agreements, the Trustees, including the Independent Trustees, did not identify any single factor as determinative, and each weighed various factors as he or she deemed appropriate. The Trustees considered the following matters in connection with their approval of the continuation of the Agreements:
The nature, extent and quality of the services provided to the funds under the Agreements. The Trustees considered the nature, extent and quality of the services provided by Columbia and its affiliates to the funds and the resources dedicated to the funds by Columbia and its affiliates. Among other things, the Trustees considered (i) Columbia’s ability (including its personnel and other resources, compensation programs for personnel involved in fund management, reputation and other attributes) to attract, motivate and retain highly qualified research, advisory and supervisory investment professionals; (ii) the portfolio management services provided by those investment professionals; and (iii) the trade execution services provided on behalf of the funds. For each fund, the Trustees also considered the benefits to shareholders of investing in a mutual fund that is
38
part of a family of funds offering exposure to a variety of asset classes and investment disciplines and providing a variety of fund and shareholder services. After reviewing those and related factors, the Trustees concluded, within the context of their overall conclusions regarding each of the Agreements, that the nature, extent and quality of services provided supported the continuation of the Agreements.
Investment performance of the funds and Columbia. The Trustees reviewed information about the performance of each fund over various time periods, including information prepared by an independent third-party data provider that compared the performance of each fund to the performance of peer groups of mutual funds and performance benchmarks. The Trustees also reviewed a description of the third party’s methodology for identifying each fund’s peer group for purposes of performance and expense comparisons. The Trustees also considered additional information that the Advisory Fees and Expenses Committee requested from Columbia relating to funds that presented relatively weaker performance and/or relatively higher expenses. In the case of each fund whose performance lagged that of a relevant peer group for certain (although not necessarily all) periods, the Trustees concluded that other factors relevant to performance were sufficient, in light of other considerations, to warrant continuation of the fund’s Agreements. Those factors varied from fund to fund, but included one or more of the following: (i) that the fund’s performance, although lagging in certain recent periods, was stronger over the longer term; (ii) that the underperformance was attributable, to a significant extent, to investment decisions that were reasonable and consistent with the fund’s investment strategy and policies and that the fund was performing within a reasonable range of expectations, given those investment decisions, market conditions and the fund’s investment strategy; (iii) that the fund’s performance was competitive when compared to other relevant performance benchmarks or peer groups; (iv) that Columbia had taken or was taking steps designed to help improve the fund’s investment performance, including, but not limited to, replacing portfolio managers or modifying investment strategies; and (v) that Columbia proposed to waive advisory fees or cap the expenses of the fund.
The Trustees noted that, through April 30, 2008, Columbia World Equity Fund’s performance was in the fourth quintile (where the best performance would be in the first quintile) for the one-, five- and ten-year periods, and in the third quintile for the three-year period, of the peer group selected by an independent third-party data provider for purposes of performance comparisons.
The Trustees also considered Columbia’s performance and reputation generally, the funds’ performance as a fund family generally, and Columbia’s historical responsiveness to Trustee concerns about performance and Columbia’s willingness to take steps intended to improve performance. After reviewing those and related factors, the Trustees concluded, within the context of their overall conclusions regarding each of the Agreements, that the performance of each fund and Columbia was sufficient, in light of other considerations, to warrant the continuation of the Agreement(s) pertaining to that fund.
The costs of the services provided and profits realized by Columbia and its affiliates from their relationships with the funds. The Trustees considered the fees charged to the funds for advisory services as well as the total expense levels of the funds. That information included comparisons (provided by management and by an independent third-party data provider) of each fund’s advisory fees and total expense levels to those of the fund’s peer groups and information about the advisory fees charged by Columbia to comparable institutional accounts. In considering the fees charged to those accounts, the Trustees took into account, among other things, management’s representations about the differences between managing mutual funds as compared to other types of accounts, including differences in the services provided, differences in the risk profile of such business for Columbia, and the additional resources required to manage mutual funds effectively. In evaluating each fund’s advisory fees, the Trustees also took into account the demands, complexity and quality of the investment management of the fund. The Trustees considered existing advisory fee breakpoints, and Columbia’s use of advisory fee waivers and expense caps, which benefited a number of the funds. The Trustees also noted management’s stated justification for the fees charged to the funds, which included information about the investment performance of the funds and the services provided to the funds.
The Trustees considered that Columbia World Equity Fund’s total expenses were in the second quintile and actual management fees were in the first quintile (where the lowest fees and expenses would be in the first quintile) of the peer
39
group selected by an independent third-party data provider for purposes of expense comparisons.
The Trustees also considered the compensation directly or indirectly received by Columbia and its affiliates from their relationships with the funds. The Trustees reviewed information provided by management as to the profitability to Columbia and its affiliates of their relationships with each fund, and information about the allocation of expenses used to calculate profitability. When reviewing profitability, the Trustees also considered court cases in which adviser profitability was an issue in whole or in part, the performance of the relevant funds, the expense level of each fund, and whether Columbia had implemented breakpoints and/or expense caps with respect to the fund.
After reviewing those and related factors, the Trustees concluded, within the context of their overall conclusions regarding each of the Agreements, that the advisory fees charged to each fund, and the related profitability to Columbia and its affiliates of their relationships with the fund, supported the continuation of the Agreement(s) pertaining to that fund.
Economies of Scale. The Trustees considered the existence of any economies of scale in the provision by Columbia of services to each fund, to groups of related funds, and to Columbia’s investment advisory clients as a whole and whether those economies were shared with the funds through breakpoints in the investment advisory fees or other means, such as fee waivers/expense reductions and additional investments by Columbia in investment, trading and compliance resources. The Trustees noted that many of the funds benefited from breakpoints, fee waivers/expense caps, or both. In considering those issues, the Trustees also took note of the costs of the services provided (both on an absolute and a relative basis) and the profitability to Columbia and its affiliates of their relationships with the funds, as discussed above.
After reviewing those and related factors, the Trustees concluded, within the context of their overall conclusions regarding each of the Agreements, that the extent to which economies of scale were shared with the funds supported the continuation of the Agreements.
Other Factors. The Trustees also considered other factors, which included but were not limited to the following:
| n | | the extent to which each fund had operated in accordance with its investment objective and investment restrictions, the nature and scope of the compliance programs of the funds and Columbia and the compliance-related resources that Columbia and its affiliates were providing to the funds; |
| n | | the nature, quality, cost and extent of administrative and shareholder services overseen and performed by Columbia and its affiliates, both under the Agreements and under separate agreements for the provision of transfer agency and administrative services; |
| n | | so-called “fall-out benefits” to Columbia and its affiliates, such as the engagement of its affiliates to provide distribution, brokerage and transfer agency services to the funds, and the benefits of research made available to Columbia by reason of brokerage commissions generated by the funds’ securities transactions, as well as possible conflicts of interest associated with those fall-out and other benefits, and the reporting, disclosure and other processes in place to disclose and monitor those possible conflicts of interest; and |
| n | | the report provided by the funds’ independent fee consultant, which included information about and analysis of the funds’ fees, expenses and performance. |
Based on their evaluation of all factors that they deemed to be material, including those factors described above, and assisted by the advice of independent counsel and the independent fee consultant, the Trustees, including the Independent Trustees, approved the continuance of each of the Agreements through October 31, 2009.
40
Summary of Management Fee Evaluation by Independent Fee Consultant
EXCERPTS FROM REPORT OF INDEPENDENT FEE CONSULTANT TO THE FUNDS SUPERVISED BY THE COLUMBIA ATLANTIC BOARD
Prepared Pursuant to the February 9, 2005 Assurance of Discontinuance among the Office of Attorney General of New York State, Columbia Management Advisors, LLC, and Columbia Management Distributors, Inc. November 3, 2008
I. Overview
On February 9, 2005, Columbia Management Advisors, LLC (“CMA”) and Columbia Management Distributors, Inc.1 (“CMD”) agreed to the New York Attorney General’s Assurance of Discontinuance (“AOD”). Among other things, the AOD stipulates that CMA may manage or advise a Columbia Fund (“Columbia Fund” and, together with some or all of, such funds the “Columbia Funds”) only if the Independent Members of the Columbia Fund’s Board of Trustees appoint a Senior Officer or retain an Independent Fee Consultant (“IFC”) who is to manage the process by which proposed management fees are negotiated. The AOD further stipulates that the Senior Officer or IFC is to prepare a written annual evaluation of the fee negotiation process.
With effect from January 1, 2007, the Independent Members of the Board of Trustees for certain Columbia Funds known collectively as the “Atlantic Funds” (together with the other members of that Board, the “Trustees”) retained me as IFC for the Atlantic Funds.2 In this capacity, I have prepared the fourth annual written evaluation of the fee negotiation process. As was the case with last year’s report (the “2007 Report”) my immediate predecessor as IFC, John Rea, provided invaluable assistance in the preparation of this year’s report.
A. Role of the Independent Fee Consultant
The AOD charges the IFC with “managing the process by which proposed management fees…to be charged the Columbia Fund are negotiated so that they are negotiated in a manner which is at arms’ length and reasonable and consistent with this Assurance of Discontinuance.” The AOD also provides that CMA “may manage or advise a Columbia Fund only if the reasonableness of the proposed management fees is determined by the Board of Trustees…using…an annual independent written evaluation prepared by or under the direction of…the Independent Fee Consultant.” Therefore, the AOD makes clear that the IFC does not supplant the Trustees in negotiating management fees with CMA, nor does the IFC substitute his or her judgment for that of the Trustees with respect to the reasonableness of proposed fees or any other matter that is committed to the business judgment of the Trustees.
B. Elements Involved in Managing the Fee Negotiation Process
In preparing the report required by the AOD, the IFC must consider at least the following six factors set forth in the AOD:
| 1. | The nature and quality of CMA’s services, including the Fund’s performance; |
| 2. | Management fees (including any components thereof) charged by other mutual fund companies for like services; |
| 3. | Possible economies of scale as the Fund grows larger; |
| 4. | Management fees (including any components thereof) charged to institutional and other clients of CMA for like services; |
| 5. | Costs to CMA and its affiliates of supplying services pursuant to the management fee agreements, excluding any intra-corporate profit; and |
| 6. | Profit margins of CMA and its affiliates from supplying such services. |
C. Organization of the Annual Evaluation
This report, like last year’s, focuses on the six factors and contains a section for each factor except that CMA’s costs and profits from managing the Funds have been combined into a single section. In addition to a discussion of these factors, the report offers recommendations to improve the fee review process in future years. A review of the status of
1 | CMA and CMD are subsidiaries of Columbia Management Group, LLC (“CMG”), and are the successors to the entities named in the AOD. |
2 | I have no material relationship with Bank of America, CMG or any of its affiliates, aside from serving as IFC, and I am aware of no material relationship with any of their affiliates. I retained John Rea, an independent economic consultant, to assist me with this report. |
| | Unless otherwise stated or required by the context, this report covers only the Atlantic Funds, which are also referred as the “Funds.” |
41
recommendations made in the 2007 Report is being provided separately with the materials for the October meeting.
II. Summary of Findings
A. General
| 1. | Based upon my examination of the information supplied by CMG in the light of the six factors set forth in the AOD, I conclude that the Trustees have the relevant information necessary to evaluate the reasonableness of the proposed management fees for each Atlantic Fund. |
| 2. | In my view, the process by which the proposed management fees of the Funds have been negotiated in 2008 thus far has been, to the extent practicable, at arms’ length and reasonable and consistent with the AOD. |
B. Nature and Quality of Services, Including Performance
| 3. | The performance of the Funds has been relatively strong in recent years. Based upon 1-, 3-, 5-, and 10-year returns through April 30, 2008, at least half of all the Funds were in the first and second performance quintiles in each of the four performance periods and, at most, only 11% were in the fifth quintile in any one performance period. Both equity and fixed-income funds posted strong performance relative to comparable funds. |
| 4. | Performance rankings were similar in 2007 and 2008, although last year’s were slightly stronger. Despite the stability in the distribution of rankings in the two years, at least half the Funds changed quintile rankings between the two years in at least one of the 1-, 3-, and 5-year performance periods. |
| 5. | The performance of the actively managed equity Funds against their benchmarks was very strong. At least 57% and as many as 73% posted net returns exceeding their benchmarks over the 1-, 3-, and 5-year periods. In contrast, gross and net returns of fixed-income Funds typically fell short of their benchmarks. |
| 6. | Atlantic equity Funds’ overall performance adjusted for risk also was strong. Based upon 3-year returns, nearly 80% of the equity Funds had a combination of risk-adjusted and unadjusted returns that placed them in the top half of their performance universes. Only about one-fifth of the fixed income Funds posted high returns and low risk relative to comparable funds. About two-thirds of the fixed-income Funds took on more risk than the typical fund in their performance universes. |
| 7. | The industry-standard procedure used by Lipper that includes all share classes in the performance universe tends to bias a Fund’s ranking upward within that universe. The bias occurs because either no-12b-1 fee or low-12b-1 fee share classes of the Atlantic Funds are compared with funds in performance universes that include all share classes of multi-class funds with 12b-1 fees of up to 100 basis points. Correcting this bias by limiting the performance universe to classes of comparable funds with low or no 12b-1 fees (a “filtered universe”) lowers the relative performance for the Funds, but their performance, on the whole, remains strong. The filtering process, however, did identify two Funds for further review that had not been designated review funds using unfiltered universes. |
| 8. | A small number of Funds have consistently underperformed over the past four years. The exact number depends on the criteria used to evaluate longer-term performance. For example, the one-year returns of one Fund have been in the fourth or fifth performance quintiles in each of the past four years; there are six Funds whose three-year returns have been in the fourth or fifth quintile over the past four years. |
| 9. | The services performed by CMG professionals beyond portfolio management, such as compliance, legal, information technology, risk management, finance and fund administration, are critical to the success of the Funds and appear to be of high quality. |
C. Management Fees Charged by Other Mutual Fund Companies
| 10. | The Funds’ management fees and total expenses are generally low relative to those of their peers. Only 21% of the Funds ranked in the two most expensive quintiles for actual management fees, and only 23% in those quintiles for total expenses. |
| 11. | The highest concentration of low-expense Funds is found among the equity and tax-exempt fixed income Funds. The 12 former Excelsior Funds have relatively high fees and expenses, with half of those Funds ranking in either the fourth or fifth quintiles. The higher actual management fee |
42
| | rankings of certain Excelsior Funds are due in part to fee schedules that are higher than standard Columbia Fund fee schedules at current asset levels. After discussion with the Trustees, CMA is proposing to lower the management fees on three of these Funds. |
| 12. | The distribution of expense rankings is similar in 2007 and 2008, while management fee rankings improved markedly in 2008. Part of the improvement reflects expense limitations introduced last year for the state intermediate municipal bond Funds. |
| 13. | The management fees of the Atlantic Funds are generally in line with those of Columbia Funds supervised by the Nations Board of Trustees (the “Nations Funds”). In investment categories in which the Atlantic Funds have higher average fees, the difference principally arises out of differences in asset size. |
D. Trustees’ Fee and Performance Evaluation Process
| 14. | The Trustees’ evaluation process identified 17 Funds in 2008 for further review based upon their relative performance or expenses or both. When compared in filtered universes, two more Funds met the criteria for further review. CMG provided further information about those Funds to assist the Trustees in their evaluation. |
E. Potential Economies of Scale
| 15. | CMG presented to the Trustees its analysis of the sources and sharing of potential economies of scale. CMG views economies of scale as arising at the complex level and would regard estimates of scale economies for individual funds as unreliable. In its analysis, CMG did not identify specific sources of economies of scale or provide any estimates of any economies of scale that might arise from future asset growth. CMG’s analysis included measures taken by the Trustees and CMG that seek to share any potential economies of scale through breakpoints in management fee schedules, expense reimbursements, fee waivers, enhanced shareholder services, fund mergers, and operational consolidation. |
| 16. | An examination of the contractual fee schedules for five Atlantic Funds shows that they are generally in line with those of their competitors, in terms of number and extent of fee breakpoints. A similar examination last year of five different Funds led to the same conclusion. |
F. Management Fees Charged to Institutional Clients
| 17. | CMG has provided Trustees with comparisons of mutual fund management fees and institutional fees based upon standardized fee schedules and upon actual fees. The results show that, consistent with industry practice, institutional fees are generally lower than the Funds’ management fees. However, because the services provided and risks borne by the manager are more extensive for mutual funds compared to institutional accounts, the differences are of limited value in assisting the Trustees in their review of the reasonableness of the Funds’ management fees. |
G. Revenues, Expenses, and Profits
| 18. | The activity-based cost allocation methodology (“ABC”) employed by CMG to allocate costs, both direct and indirect, for purposes of calculating Fund profitability is thoughtful and detailed. This year, CMG proposed a change to the method by which indirect expenses are allocated. Under this “hybrid” method, indirect costs relating to fund management are allocated among the Funds 50% by assets and 50% per Fund. Allocating indirect expenses equally to each Fund has an intuitive logic, as each Fund regardless of size has certain expenses, such as preparing and printing prospectuses and financial statements. |
| 19. | The materials provided on CMG’s revenues and expenses with respect to the Funds and the methodology underlying their construction form a sufficient basis for Trustees to evaluate the expenses and profitability of the Funds. |
| 20. | In 2007, CMG’s complex-wide pre-tax margins on the Atlantic Funds were slightly below industry medians, based on limited data available for publicly held mutual fund managers. However, as is to be expected in a complex now comprising 75 Funds (including former Excelsior Funds), some Atlantic Funds have relatively high pre-tax profit margins, when calculated solely with respect to management revenues and expenses, while other Atlantic Funds operate at a loss. There is a positive relationship between fund size and profitability, with smaller funds generally operating at a loss. |
| 21. | CMG pays a fixed percentage of its management fee revenues to an affiliate, U.S. Trust, Bank of America |
43
| | Private Wealth Management, to compensate it for services it performs with respect to Atlantic Fund assets held for the benefit of its customers. Based on our analysis of the services provided by this affiliate, we have concluded that all payments other than those for sub-transfer agent or sub-accounting services should be treated as a distribution expense. |
III. Recommendations
| 1) | Criteria for review. The Trustees may wish to consider modifying the criteria for classifying a fund as a “Review Fund” to include criteria that focus exclusively on performance without regard to expense or fee levels. For example, a fund whose one-year or three-year performance was median or below for four consecutive years could be treated as a Review Fund. When we applied such criteria to the Funds, several additional Funds would have been added to the list of Review Funds. |
| 2) | Profitability data. CMG should present to the Trustees each year the profitability of each Fund, each investment style and each complex (of which Atlantic is one) calculated as follows: |
| | a. | Management-only profitability should be calculated without reference to any Private Bank expense. |
| | b. | Profitability excluding distribution (which essentially covers the management and transfer agency functions) should be adjusted by removing from the expense calculation any portion of the Private Bank payment not attributable to the performance by the Private Bank of sub-transfer agency or sub-accounting functions. |
| | c. | Total profitability, including distribution: No adjustment for Private Bank expenses should be made, because all such expenses represent legitimate fund expenses to be taken into account in calculating CMG’s profit margin including distribution. |
| | d. | Distribution only: This should include all Private Bank expenses other than those attributable to sub-transfer agency services. |
Therefore, the following data need not be provided:
| | 1. | Adjusting total profitability data for Private Bank expenses |
| | 2. | Adjusting profitability excluding distribution by backing out all Private Bank expenses. |
| 3) | Potential economies of scale. CMG and the IFC should continue to work on methods for more precisely quantifying to the extent possible the sources and magnitude of any economies of scale as CMG’s mutual fund assets under management increase, to the extent that the data allows for meaningful year-over-year comparisons. The framework suggested in Section IV.D.4 may prove to be a useful model for such an analysis. |
| 4) | Competitive breakpoint analysis. As part of the annual fee evaluation process, the breakpoints of a select group of Atlantic Funds (which would differ each year) should continue to be compared to those of industry rivals to ensure that the Funds’ breakpoint schedules remain within industry norms. As breakpoint schedules change relatively little each year, performing such a comparison for each Atlantic Fund each year would not be an efficient use of Trustee and CMG resources. |
| 5) | Cost allocation methodology. CMG’s point that the current ABC system of allocating indirect expenses creates anomalous results in several cases, including sub-advised Funds, is well-taken. We would like to work with CMG over the forthcoming year on alternatives to the current system of allocating indirect expenses that (1) resolve the anomalies, (2) limit the amount of incremental effort on CMG’s part and (3) remain faithful to the general principle that expenses should be allocated by time and effort to the extent reasonably possible. |
| 6) | Management fee disparities. CMG and the Atlantic Trustees, as part of any future study of management fees, should analyze the differences in management fee schedules, principally arising out of the reorganization of the former Excelsior Funds as Atlantic Funds. As part of that analysis, CMG should provide an explanation for any significant fee differences among comparable funds across fund families managed by CMA, such as differences in the management styles of different Funds included the same Lipper category. Finally, whenever CMG proposes a management fee change or an expense cap for any mutual fund managed by CMA that is comparable to any Atlantic Fund, CMG should provide the Trustees with sufficient information about the proposal to allow the Trustees to assess the applicability of the proposed change to the relevant Atlantic Fund or Funds. |
44
| 7) | Tax-exempt Fund expense data. The expense rankings of certain tax-exempt Funds were adversely affected by including certain investment-related interest expenses that Lipper excluded in calculating the expense ratios of competitors. We recommend that CMG follow the Lipper practice and exclude such interest expenses from data submitted to Lipper to avoid unfairly disadvantaging the tax-exempt Funds. |
| 8) | Reduction of volume of paper documents submitted. The effort to rationalize and simplify the data presented to the Trustees and the process by which that data was prepared and organized was regarded as a success by all parties. We should continue to look for opportunities to reduce and simplify the presentation of 15(c) data, especially in the area of Fund profitability. The Fund “Dashboard” volume presents a large volume of Fund data on a single page. If it is continued, the Trustees may wish to consider receiving the underlying Lipper data on CD, rather than the current paper volumes. |
Respectfully submitted,
Steven E. Asher
45
[THIS PAGE INTENTIONALLY LEFT BLANK]
46
[THIS PAGE INTENTIONALLY LEFT BLANK]
47
[THIS PAGE INTENTIONALLY LEFT BLANK]
48
Important Information About This Report
Transfer Agent
Columbia Management Services, Inc.
P.O. Box 8081
Boston, MA 02266-8081
1-800-345-6611
Distributor
Columbia Management
Distributors, Inc.
One Financial Center
Boston, MA 02111
Investment Advisor
Columbia Management Advisors, LLC
100 Federal Street
Boston, MA 02110
The fund mails one shareholder report to each shareholder address. If you would like more than one report, please call shareholder services at 1-800-345-6611 and additional reports will be sent to you. This report has been prepared for shareholders of Columbia World Equity Fund.
A description of the policies and procedures that the fund uses to determine how to vote proxies and a copy of the fund’s voting records are available (i) at www.columbiamanagement.com; (ii) on the Securities and Exchange Commission’s website at www.sec.gov, and (iii) without charge, upon request, by calling 1-800-368-0346. Information regarding how the fund voted proxies relating to fund securities during the 12-month period ended June 30 is available from the SEC’s website. Information regarding how the fund voted proxies relating to fund securities is also available from the fund’s website, columbiamanagement.com.
The fund files a complete schedule of portfolio holdings with the SEC for the first and third quarters of each fiscal year on Form N-Q. The fund’s Form N-Q is available on the SEC’s website at www.sec.gov and may be reviewed and copied at the SEC’s Public Reference Room in Washington, D.C. Information on the operation of the Public Reference Room may be obtained by calling
1-800-SEC-0330.
Please read and consider the investment objectives, risks, charges and expenses for any fund carefully before investing. For a prospectus which contains this and other important information about the fund, contact your Columbia Management representative or financial advisor or go to www.columbiamanagement.com.
Columbia Management Group, LLC (“Columbia Management”) is the investment management division of Bank of America Corporation. Columbia Management entities furnish investment management services and products for institutional and individual investors. Columbia Funds are distributed by Columbia Management Distributors, Inc., member of FINRA, SIPC, part of Columbia Management and an affiliate of Bank of America Corporation.
49

One Financial Center
Boston, MA 02111-2621
Columbia World Equity Fund
Annual Report, March 31, 2009
©2009 Columbia Management Distributors, Inc.
One Financial Center, Boston, MA 02111-2621
800.345.6611 www.columbiafunds.com
SHC-42/10642-0309 (05/09) 09/78326

Annual Report
March 31, 2009
Columbia Income Fund
| | |
| NOT FDIC INSURED | | May Lose Value |
| NOT BANK ISSUED | | No Bank Guarantee |
Table of contents
The views expressed in this report reflect the current views of the respective parties. These views are not guarantees of future performance and involve certain risks, uncertainties and assumptions that are difficult to predict, so actual outcomes and results may differ significantly from the views expressed. These views are subject to change at any time based upon economic, market or other conditions and the respective parties disclaim any responsibility to update such views. These views may not be relied on as investment advice and, because investment decisions for a Columbia Fund are based on numerous factors, may not be relied on as an indication of trading intent on behalf of any particular Columbia Fund. References to specific securities should not be construed as a recommendation or investment advice.
President’s Message

Dear Shareholder:
Recent events have shown great volatility in the markets and uncertainty in the economy. During these challenging times, it becomes even more important to focus on long-term horizons and key investment tools that can help manage volatility. This may be the time to reflect on your investment goals and evaluate your portfolio to ensure you are positioned for any potential market rebound.
A long-term financial plan can serve as a road map and guide you through the necessary steps designed to meet your financial goals. Your financial plan should take into account your investment goals, time horizon, overall financial situation, risk tolerance and willingness to ride out market volatility. Your investment professional can be a key resource as you work through this process. The knowledge and experience of an investment professional can help as you create or reevaluate your investment strategy.
The importance of diversification
Although diversification does not ensure a profit or guarantee against loss, a diversified portfolio can be a strategy for successful long-term investing. Diversification refers to the mix of investments within a portfolio. A mutual fund can contribute to portfolio diversification given that a mutual fund’s portfolio represents several investments. Additionally, the way you allocate your money among stocks, bonds and cash, and geographically between foreign and domestic investments, can help to reduce risks. Diversification can result in multiple investments where the positive performance of certain holdings can offset any negative performance from other holdings. Having a diversified portfolio doesn’t mean that the value of the portfolio will never go down, but rather helps strike a balance between risk and reward.
Reevaluate your strategy
An annual review of your investments is a key opportunity to determine if your investment needs have changed or if you need minor adjustments to rebalance your portfolio. Life events like a birth, marriage, home improvement, or change in employment can have a major affect on your spending and goals. Ask yourself how your spending or goals have changed and factor this into your financial plan. Are you using automated investments or payroll deductions to help keep your savings on track? Are you able to set aside additional savings or increase your 401(k) plan contributions? If during your review you find that your investments in any one category (e.g., stocks, bonds or cash) have grown too large based on your diversification plan, you may want to consider redirecting future investments to get back on track.
History has shown that the U.S. stock market has been remarkably resilient¹. Volatility can lead to opportunity. Patience and a commitment to your long-term financial plan may position you to potentially benefit over your investment horizon. We appreciate your business and continued support of Columbia Funds.
Sincerely,

J. Kevin Connaughton
President, Columbia Funds
The board of trustees elected J. Kevin Connaughton president of Columbia Funds on January 16, 2009.
1 | The Dow Jones Industrial Average is the most widely used indicator of the overall condition of the stock market. The Dow Jones Industrial Average Index is a price-weighted average of 30 actively traded blue-chip stocks as selected by the editors of the Wall Street Journal. Indices are not investments, do not incur fees or expenses and are not professionally managed. It is not possible to invest directly in an index. |
Fund Profile – Columbia Income Fund
Summary
| n | | For the 12-month period that ended March 31, 2009, the fund’s Class A shares returned negative 10.77% without sales charge. |
n | | The fund’s return was less than the returns of its benchmarks, the Barclays Capital U.S. Intermediate Government/Credit Bond Index (formerly Lehman Brothers U.S. Intermediate Government/Credit Index)1 and the Barclays Capital U.S. Intermediate Credit Bond Index (formerly Lehman Brothers U.S. Intermediate Credit Bond Index),1 and the average return of its peer group, the Lipper Corporate Debt Funds BBB-Rated Classification.2 |
| n | | Exposure to corporate and high-yield issues undercut the fund’s performance as concerned investors fled to Treasury obligations amid a deepening credit crisis. |
Portfolio Management
Carl W. Pappo, lead manager of the fund, has co-managed the fund since 2005 and has been with the advisor or its predecessors or affiliate organizations since 1993.
Kevin L. Cronk has co-managed the fund since 2003 and has been with the advisor or its predecessors or affiliate organizations since 1999.
1 | The Barclays Capital U.S. Intermediate Government/Credit Bond Index is an index that tracks the performance of intermediate term U.S. government and corporate bonds. The Barclays Capital U.S. Intermediate Credit Bond Index is the intermediate component of the U.S Credit Index. The U.S. Credit Index includes publicly issued U.S. corporate and foreign debentures and secured notes that meet specified maturity, liquidity, and quality requirements. Indices are not available for investment, and do not reflect sales charges, fees, brokerage commissions, taxes or other expenses of investing. Securities in the fund may not match those in an index. |
2 | Lipper Inc., a widely respected data provider in the industry, calculates an average total return (assuming reinvestment of distributions) for mutual funds with investment objectives similar to those of the fund. Lipper makes no adjustment for the effect of sales loads. |
Performance data quoted represents past performance and current performance may be lower or higher. Past performance is no guarantee of future results. The investment return and principal value will fluctuate so that shares, when redeemed, may be worth more or less than the original cost. Please visit www.columbiafunds.com for daily and most recent month-end performance updates.
Summary
1-year return as of 03/31/09
| | |
| |
 | | –10.77% Class A shares (without sales charge) |
| |
 | | +1.96% Barclays Capital U.S. Intermediate Government/Credit Bond Index |
| |
| | –4.05% Barclays Capital U.S. Intermediate Credit Bond Index |
Morningstar Style Box™
Fixed Income Maturity
The Morningstar Style Box™ reveals a fund’s investment strategy. For fixed-income funds the vertical axis shows the average credit quality of the bonds owned and the horizontal axis shows interest rate sensitivity as measured by a bond’s duration (short, intermediate or long). Information shown is based on the most recent data provided by Morningstar.
1
Economic Update – Columbia Income Fund
Economic growth ground to a halt during the 12-month period that began April 1, 2008 and ended March 31, 2009. The National Bureau of Economic Research reported that the U.S. economy had slipped into recession late in 2007 and the downturn was even sharper than some anticipated.
A host of factors weighed on consumers and businesses alike. The most severe housing downturn in decades showed few signs of abating as inventories of homes for sale rose, home prices declined and tighter credit standards, the result of continued turmoil in the subprime mortgage market, made it more difficult for homebuyers to qualify for loans. The labor market has contracted for 15 consecutive months, driving the unemployment rate to 8.5%. More than five million jobs have been lost since the recession commenced late in 2007, with nearly two-thirds of the decrease occurring in the most recent five months. Manufacturing activity slowed and consumer spending declined, resulting in one of the weakest holiday seasons in decades.
However, in March there were a few signs that this severe recession is no longer intensifying. Weekly chain store sales and mortgage purchase applications gained some momentum near the end of the period. The trade deficit has narrowed more than expected, raising hopes that first quarter real GDP will contract at a rate well below the fourth quarter’s negative 6.3%.
A weakening economy and turmoil in the financial markets took a toll on consumer confidence, which continued to set new all-time lows during the period. However, the monthly Conference Board gauge was nearly unchanged in March, another indication that the worst could be behind us.
In an effort to restore confidence in the capital markets, loosen the reins on credit and shore up economic growth, the Federal Reserve Board (the Fed) brought a key short-term rate — the federal funds rate — down from 2.25% to a target between zero and 0.25% during the 12-month period — a record low. However, the Fed’s efforts went largely unrewarded. The one bright spot during this period of uncertainty was lower energy and commodity prices. With oil trading near $50 per barrel at the end of the period, gasoline prices have come down from $4 per gallon or more last summer to just over $2 per gallon in recent months.
Some bond market segments delivered positive returns
The U.S. bond market seesawed during the 12-month period, but several sectors managed to deliver modest gains as investors sought refuge from the volatile stock market. Treasury prices rose and yields declined as the economy faltered and stock market volatility increased. The benchmark 10-year U.S. Treasury yield ended the period at 2.70%. In this environment, the Barclays Capital U.S. Aggregate Bond Index (formerly the Lehman Brothers U.S. Aggregate Bond Index) 1 returned 3.13%. High-yield bond prices fell sharply as economic prospects weakened and default fears rose.
1 | The Barclays Capital U.S. Aggregate Bond Index is as market value-weighted index that tracks the daily price, coupon, pay-downs and total return performance of fixed-rate, publicly placed, dollar-denominated and non-convertible investment-grade debt issues with at least $250 million par amount outstanding and with at least one year to final maturity. |
Summary
For the 12-month period that ended March 31, 2009
| | n | | Despite volatility in many segments of the bond market, the Barclays Capital U.S. Aggregate Bond Index delivered a modest gain. High-yield bonds lost ground, as measured by The Merrill Lynch U.S. High Yield, Cash Pay Index. Municipals recovered from an early setback, as measured by the Barclays Capital Municipal Bond Index. | |
| | |
Barclays
Aggregate Index | | Merrill Lynch
Index |
| |

| | 
|
3.13% | | –19.95% |
| | |
Barclays
Municipal Index | | |
| |
| | |
2.27% | | |
| | n | | The broad U.S. stock market, as measured by the S&P 500 Index, returned negative 38.09%. Developed stock markets outside the United States returned negative 46.51%, as measured (in U.S. dollars) by the MSCI EAFE Index. | |
| | |
| S&P Index | | MSCI Index |
| |
| |
|
–38.09% | | –46.51% |
The Standard & Poor’s (S&P) 500 Index tracks the performance of 500 widely held, large-capitalization U.S. stocks.
The Morgan Stanley Capital International (MSCI) Europe, Australasia, Far East (EAFE) Index is a free float-adjusted market capitalization index that is designed to measure developed market equity performance, excluding the U.S. and Canada.
2
Economic Update (continued) – Columbia Income Fund
The Merrill Lynch U.S. High Yield, Cash Pay Index2 returned negative 19.95%. The municipal market suffered a setback early in 2008, then rebounded in the first quarter of 2009. The Barclays Capital Municipal Bond Index (formerly the Lehman Brothers Municipal Bond Index)3 returned 2.27% for the 12-month period.
Stocks retreat as economic outlook darkens
Against a weakening economic backdrop, the U.S. stock market lost 38.09% for the 12-month period, as measured by the S&P 500 Index.4 Losses affected the stocks of companies of all sizes and investment style categories, although growth stocks held up better than value stocks, as measured by their respective Russell indices.5 Stock markets outside the U.S. suffered even greater losses. The MSCI EAFE Index6, a broad gauge of stock market performance in foreign developed markets, lost 46.51% (in U.S. dollars) for the period. Emerging stock markets, which generally have had a strong run over the past several years, were also caught in the downdraft. As investors backed away from risk, the MSCI Emerging Markets Index7 returned negative 47.07% (in U.S. dollars).
Past performance is no guarantee of future results.
2 | The Merrill Lynch U.S. High Yield, Cash Pay Index tracks the performance of non-investment-grade corporate bonds. As of 01/01/2009, Merrill Lynch & Co., Inc. is a wholly-owned subsidiary of Bank of America Corporation and an affiliate of Columbia Management. |
3 | The Barlcays Capital Municipal Bond Index is considered representative of the broad market for investment-grade, tax-exempt bonds with maturities of at least one year. |
4 | The Standard & Poor’s (S&P) 500 Index tracks the performance of 500 widely held, large-capitalization U.S. stocks. |
5 | The Russell 1000 Growth Index measures the performance of those Russell 1000 Index companies with higher price-to-book ratios and higher forecasted growth values. The Russell 1000 Value Index measures the performance of those companies in the Russell 1000 Index with lower price-to-book ratios and lower forecasted growth values. The Russell 2000 Growth Index measures the performance of those Russell 2000 Index companies with higher price-to-book ratios and higher forecasted growth values. The Russell 2000 Value Index measures the performance of those Russell 2000 Index companies with lower price-to-book ratios and lower forecasted growth values. The Russell 3000 Growth Index measures the performance of those Russell 3000 Index companies with higher price-to-book ratios and higher forecasted growth values. The Russell 3000 Value Index measures the performance of those Russell 3000 Index companies with lower price-to-book ratios and lower forecasted growth values. The Russell Midcap Growth Index measures the performance of those Russell Midcap companies with higher price-to-book ratios and higher forecasted growth values. The Russell Midcap Value Index measures the performance of those Russell Midcap Index companies with lower price-to-book ratios and lower forecasted growth values. |
6 | The Morgan Stanley Capital International (MSCI) Europe, Australasia, Far East (EAFE) Index is a free float-adjusted market capitalization index that is designed to measure developed market equity performance excluding the U.S. and Canada. |
7 | The MSCI Emerging Markets Index is a widely accepted index composed of a sample of companies from 25 countries representing the global emerging stock markets. |
| | Indices are not available for investment, and do not reflect sales charges, fees, brokerage commissions, taxes or other expenses of investing. Securities in the fund may not match those in an index. |
3
Performance Information – Columbia Income Fund
Performance data quoted represents past performance and current performance may be lower or higher. Past performance is no guarantee of future results. The investment return and principal value will fluctuate so that shares, when redeemed, may be worth more or less than the original cost. Please visit www.columbiafunds.com for daily and most recent month-end performance updates.
| | |
| Annual operating expense ratio (%)* |
| |
Class A | | 1.02 |
Class B | | 1.77 |
Class C | | 1.77 |
Class Z | | 0.77 |
| * | The annual operating expense ratio is as stated in the fund’s prospectus that is current as of the date of this report. Differences in expense ratios disclosed elsewhere in this report may result from including fee waivers and expense reimbursements as well as different time periods used in calculating the ratios. |
|
| Performance of a $10,000 investment 04/01/99 – 03/31/09 |
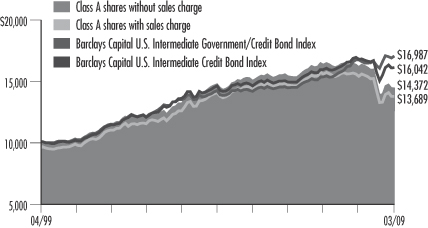
The chart above shows the change in value of a hypothetical $10,000 investment in Class A shares of Columbia Income Fund during the stated time period, and does not reflect the deduction of taxes that a shareholder may pay on fund distributions or on the redemption of fund shares. The Barclays Capital U.S. Intermediate Government/Credit Bond Index is an index that tracks the performance of intermediate term U.S. government and corporate bonds. The Barclays Capital U.S. Intermediate Credit Bond Index is the intermediate component of the U.S. Credit Index. The U.S. Credit Index includes publicly issued U.S. corporate and foreign debentures and secured notes that meet specified maturity, liquidity and quality requirements. Indices are not available for investment, and do not reflect sales charges, fees, brokerage commissions, taxes or other expenses of investing. Securities in the fund may not match those in an index.
| | | | |
| Performance of a $10,000 investment 04/01/99 – 03/31/09 ($) |
| | |
| Sales charge | | without | | with |
Class A | | 14,372 | | 13,689 |
Class B | | 13,665 | | 13,665 |
Class C | | 13,802 | | 13,802 |
Class Z | | 14,739 | | n/a |
| | | | | | | | | | | | | | |
| Average annual total return as of 03/31/09 (%) |
| | | | |
| Share class | | A | | B | | C | | Z |
| Inception | | 07/31/00 | | 07/15/02 | | 07/15/02 | | 03/05/86 |
| Sales charge | | without | | with | | without | | with | | without | | with | | without |
1-year | | –10.77 | | –14.99 | | –11.44 | | –15.64 | | –11.31 | | –12.15 | | –10.55 |
5-year | | –0.47 | | –1.43 | | –1.21 | | –1.52 | | –1.06 | | –1.06 | | –0.21 |
10-year | | 3.69 | | 3.19 | | 3.17 | | 3.17 | | 3.27 | | 3.27 | | 3.96 |
The “with sales charge” returns include the maximum initial sales charge of 4.75% for Class A shares and the applicable contingent deferred sales charge of 5.00% in the first year, declining to 1.00% in the sixth year and eliminated thereafter for Class B shares and 1.00% for Class C shares for the first year only. The “without sales charge” returns do not include the effect of sales charges. If they had, returns would be lower.
Performance results reflect any fee waivers or reimbursements of fund expenses by the investment advisor and/or any of its affiliates. Absent these fee waivers or expense reimbursement arrangements, performance results would have been lower.
All results shown assume reinvestment of distributions. Class Z shares are sold at net asset value with no distribution and service (Rule 12b-1) fees. Class Z shares have limited eligibility and the investment minimum requirements may vary. Please see the fund’s prospectus for details. Performance for different share classes will vary based on differences in sales charges and fees associated with each class.
The table does not reflect the deduction of taxes that a shareholder may pay on fund distributions or on the redemption of fund shares.
Class A, Class B and Class C are newer classes of shares. Class A share performance information includes the performance of Class Z shares (the oldest existing share class) for periods prior to their inception. Class B and Class C share performance information includes returns of Class A shares for the period from July 31, 2000 through July 14, 2002, and the returns of Class Z shares for periods prior thereto. These returns reflect differences in sales charges, but have not been restated to reflect any differences in expenses (such as distribution and service (Rule 12b-1) fees) between Class Z shares and the newer classes of shares or between Class A shares and Class B and Class C shares. If differences in expenses had been reflected, the returns shown for periods prior to the inception of the newer classes of shares would have been lower, since the newer classes of shares are subject to varying distribution and service (Rule 12b-1) fees. Class A shares were initially offered on July 31, 2000, Class B and Class C shares were initially offered on July 15, 2002, and Class Z shares were initially offered on March 5, 1986.
4
Understanding Your Expenses – Columbia Income Fund
Estimating your actual expenses
To estimate the expenses that you paid over the period, first you will need your account balance at the end of the period:
| | n | | For shareholders who receive their account statements from Columbia Management Services, Inc., your account balance is available online at www.columbiafunds.com or by calling Shareholder Services at 800.345.6611. | |
| | n | | For shareholders who receive their account statements from their financial intermediary, contact your financial intermediary to obtain your account balance. | |
| | 1. | Divide your ending account balance by $1,000. For example, if an account balance was $8,600 at the end of the period, the result would be 8.6. | |
| | 2. | In the section of the table below titled “Expenses paid during the period,” locate the amount for your share class. You will find this number in the column labeled “Actual.” Multiply this number by the result from step 1. Your answer is an estimate of the expenses you paid on your account during the period. | |
If the value of your account falls below the minimum initial investment requirement applicable to you, your account generally will be subject to a $20 annual fee. This fee is not included in the accompanying table. If you are subject to the fee, keep it in mind when you are estimating the ongoing expenses of investing in the fund and when comparing the expenses of this fund with other funds.
As a fund shareholder, you incur two types of costs. There are transaction costs, which generally include sales charges on purchases and may include redemption fees or exchange fees. There are also ongoing costs, which generally include investment advisory fees, distribution and service (Rule 12b-1) fees and other fund expenses. The information on this page is intended to help you understand the ongoing costs of investing in the fund and to compare these costs with the ongoing costs of investing in other mutual funds.
Analyzing your fund’s expenses by share class
To illustrate these ongoing costs, we have provided an example and calculated the expenses paid by investors in each share class during the period. The information in the following table is based on an initial investment of $1,000, which is invested at the beginning of the period and held for the entire period. Expense information is calculated two ways and each method provides you with different information. The amount listed in the “Actual” column is calculated using the fund’s actual operating expenses and total return for the period. The amount listed in the “Hypothetical” column for each share class assumes that the return each year is 5% before expenses and is calculated based on the fund’s actual operating expenses. You should not use the hypothetical account values and expenses to estimate either your actual account balance at the end of the period or the expenses you paid during this period.
Compare with other funds
Since all mutual funds are required to include the same hypothetical calculations about expenses in shareholder reports, you can use this information to compare the ongoing cost of investing in the fund with other funds. To do so, compare the 5% hypothetical example with the 5% hypothetical examples that appear in the shareholder reports of other funds. As you compare hypothetical examples of other funds, it is important to note that hypothetical examples are meant to highlight the ongoing cost of investing in a fund and do not reflect any transaction costs, such as sales charges, redemption fees or exchange fees.
| | | | | | | | | | | | | | |
| 10/01/08 – 03/31/09 |
| | | Account value at the
beginning of the period ($) | | Account value at the
end of the period ($) | | Expenses paid
during the period ($) | | Fund’s annualized
expense ratio (%) |
| | | Actual | | Hypothetical | | Actual | | Hypothetical | | Actual | | Hypothetical | | Actual |
Class A | | 1,000.00 | | 1,000.00 | | 969.48 | | 1,019.90 | | 4.96 | | 5.09 | | 1.01 |
Class B | | 1,000.00 | | 1,000.00 | | 965.89 | | 1,016.16 | | 8.63 | | 8.85 | | 1.76 |
Class C | | 1,000.00 | | 1,000.00 | | 966.59 | | 1,016.90 | | 7.89 | | 8.10 | | 1.61 |
Class Z | | 1,000.00 | | 1,000.00 | | 970.58 | | 1,021.14 | | 3.73 | | 3.83 | | 0.76 |
Expenses paid during the period are equal to the annualized expense ratio for the share class, multiplied by the average account value over the period, then multiplied by the number of days in the portfolio’s most recent fiscal half-year and divided by 365.
Had the investment advisor and/or any of its affiliates not waived fees or reimbursed a portion of Class C expenses, Class C account value at the end of the period would have been reduced.
It is important to note that the expense amounts shown in the table are meant to highlight only ongoing costs of investing in the fund and do not reflect any transaction costs, such as sales charges, redemption fees or exchange fees. Therefore, the hypothetical examples provided may not help you determine the relative total costs of owning shares of different funds. If these transaction costs were included, your costs would have been higher.
5
Portfolio Managers’ Report – Columbia Income Fund
Performance data quoted represents past performance and current performance may be lower or higher. Past performance is no guarantee of future results. The investment return and principal value will fluctuate so that shares, when redeemed, may be worth more or less than the original cost. Please visit www.columbiafunds.com for daily and most recent month-end performance updates.
| | |
| Net asset value per share |
| |
as of 03/31/09 ($) | | |
Class A | | 7.61 |
Class B | | 7.61 |
Class C | | 7.61 |
Class Z | | 7.61 |
| | |
| Distributions declared per share |
| |
04/01/08 – 03/31/09 ($) | | |
Class A | | 0.50 |
Class B | | 0.43 |
Class C | | 0.45 |
Class Z | | 0.52 |
For the 12-month period that ended March 31, 2009, the fund’s Class A shares returned negative 10.77% without sales charge. The fund’s return was less than the returns of its benchmarks, the Barclays Capital U.S. Intermediate Government/Credit Bond Index1 and the Barclays Capital U.S. Intermediate Credit Bond Index,1 which were 1.96% and negative 4.05%, respectively, for the same period. The fund also lagged slightly behind the funds in its peer group, the Lipper Corporate Debt Funds BBB-Rated Classification,2 which had an average return of negative 10.40% for the 12-month period. The fund had more exposure than the Barclays Capital U.S. Intermediate Government/Credit Bond Index, which we consider to be the fund’s primary benchmark, to corporate bonds and a position in high-yield bonds, which are not included in the benchmark. We also believe the fund had more exposure to corporate and high-yield bonds than the average fund in its peer group. This positioning detracted from performance because, in general, lower quality assets were laggards over the period.
Credit fears drove investors to Treasuries
The fund’s large commitment to investment grade corporates and its exposure to high-yield bonds, both consistent with its established strategy, were the chief source of its underperformance during this period. As the recession deepened over the summer and fall, market participants rushed to unload investment grade corporate bonds and high-yield issues in an effort to shed risk. Money flowed instead into U.S. Treasury and agency obligations, where investors accepted yields that hovered around zero in return for greater security. Treasuries were the strongest sector during this period, but the fund’s Treasury holdings were minimal.
The collapse of several prominent firms and questions about the health of the banking system eroded confidence in the financial sector for much of the year. However, the fund benefited from strong security selection among higher quality regional banks and insurance company obligations; both Bank of New York Mellon Corp. and Northern Trust were positive contributors. We added well-capitalized financial holdings, including MetLife and New York Life Global Funding in the last quarter of 2008.
Some underweights helped comparative results
Although the economic slowdown pressured consumer-sensitive and industrial holdings, the fund’s less-than-benchmark (Barclays Capital U.S. Intermediate Government/Credit Bond Index) weights in these sectors aided relative performance. As part of a general move to more defensive positioning, we were overweight among
1 | The Barclays Capital U.S. Intermediate Government/Credit Bond Index is an index that tracks the performance of intermediate term U.S. government and corporate bonds. The Barclays Capital U.S. Intermediate Credit Bond Index is the intermediate component of the U.S Credit Index. The U.S. Credit Index includes publicly issued U.S. corporate and foreign debentures and secured notes that meet specified maturity, liquidity and quality requirements. Indices are not available for investment, and do not reflect sales charges, fees, brokerage commissions, taxes or other expenses of investing. Securities in the fund may not match those in an index. |
2 | Lipper Inc., a widely respected data provider in the industry, calculates an average total return (assuming reinvestment of distributions) for mutual funds with investment objectives similar to those of the fund. Lipper makes no adjustment for the effect of sales loads. |
6
Portfolio Managers’ Report (continued) – Columbia Income Fund
| | | |
| Portfolio structure | |
as of 03/31/09 (%) | | | |
Corporate fixed-income bonds & notes | | 85.5 | |
Asset-backed securities | | 6.4 | |
Commercial mortgage-backed securities | | 3.4 | |
Government & agency obligations | | 2.6 | |
Mortgage-backed securities | | 0.9 | |
Collateralized mortgage obligations | | 0.3 | |
Convertible bonds | | 0.1 | |
Municipal bond | | 0.0 | * |
Warrants | | 0.0 | * |
Preferred stock | | 0.0 | * |
Short-term obligation | | 0.6 | |
Other assets & liabilities, net | | 0.2 | |
| * | Represents less than 0.1% |
| | |
| Quality breakdown |
as of 03/31/09 (%) | | |
AAA | | 11.2 |
AA | | 12.0 |
A | | 30.5 |
BBB | | 31.7 |
BB | | 6.5 |
B | | 5.7 |
CCC | | 1.9 |
CC | | 0.1 |
C | | 0.1 |
Not Rated | | 0.3 |
| | |
| Maturity breakdown |
as of 03/31/09 (%) | | |
0-1 year | | 5.5 |
1-5 years | | 37.6 |
5-10 years | | 33.5 |
10-20 years | | 5.0 |
Over 20 years | | 18.4 |
Portfolio structure is calculated as a percentage of net assets. Quality and maturity breakdowns are calculated as a percentage of total investments. Ratings shown in the quality breakdown represent the rating assigned to a particular bond by one of the following nationally-recognized rating agencies: Standard and Poor’s, a division of the McGraw-Hill Companies, Inc., Moody’s Investors Service, Inc. or Fitch Ratings Ltd.
| | |
| 30-day SEC yields |
as of 03/31/09 (%) | | |
Class A | | 6.99 |
Class B | | 6.67 |
Class C | | 6.82 |
Class Z | | 7.68 |
The 30-day SEC yields reflect the fund’s earning power net of expenses, expressed as an annualized percentage of the public offering price per share at the end of the period.
The fund is actively managed and the composition of its portfolio will change over time.
utilities. Declines in this traditionally defensive sector were less than those in other sectors. Securities of pipeline companies suffered as energy prices fell sharply from a year ago.
There were no significant changes in the fund’s sector weights. Investment grade corporate bond holdings account for approximately 70% of the portfolio, or twice that of the Intermediate Government/Credit benchmark. We modestly increased the fund’s exposure to high-yield issues late in the period.
Looking ahead
We do not anticipate a sudden reversal of the current economic slowdown. In fact, we believe that the contraction could deepen if businesses remain cautious and consumers, battered by falling home values and rising unemployment, continue to curtail spending. We expect further volatility in corporate sectors as we transition to an environment of lower earnings and tempered expectations. However, corporate and high-yield bonds have now retreated to a point where their high yields and lowered valuations appear to factor in a slow recovery and we believe they offer opportunity.
Portfolio holdings and characteristics are subject to change periodically and may not be representative of current holdings and characteristics. The outlook for the fund may differ from those presented for other Columbia Funds.
Investing in fixed-income securities may involve certain risks, including the credit quality of individual issuers, possible prepayments, market or economic developments and yield and share price fluctuations due to changes in interest rates. When interest rates go up, bond prices typically drop, and vice versa.
Investments in high-yield or “junk” bonds offer the potential for higher income than investments in investment-grade bonds, but they are also subject to a higher degree of risk. Changes in economic conditions or other circumstances may adversely affect a high-yield bond issuer’s ability to make principal and interest payments in a timely manner or at all.
7
Investment Portfolio – Columbia Income Fund
March 31, 2009
Corporate Fixed-Income Bonds & Notes – 85.5%
| | | | | | | |
| | | | | Par ($) (a) | | Value ($) |
| Basic Materials – 2.4% | | | | | | |
| Chemicals – 0.5% | | | | | | | |
| Chemtura Corp. | | 6.875% 06/01/16 (b) | | | 205,000 | | 92,250 |
| | | |
| Huntsman International LLC | | 6.875% 11/15/13 (c) | | EUR | 170,000 | | 70,017 |
| | 7.875% 11/15/14 | | | 475,000 | | 194,750 |
| | | |
| INEOS Group Holdings PLC | | 8.500% 02/15/16 (c) | | | 405,000 | | 23,288 |
| | | |
| Lubrizol Corp. | | 6.500% 10/01/34 | | | 1,310,000 | | 1,000,381 |
| | | |
| Mosaic Co. | | 7.625% 12/01/16 (c) | | | 300,000 | | 294,000 |
| | | |
| NOVA Chemicals Corp. | | 6.500% 01/15/12 | | | 355,000 | | 308,850 |
| | | |
| Terra Capital, Inc. | | 7.000% 02/01/17 | | | 275,000 | | 253,000 |
| | |
| | Chemicals Total | | | | | 2,236,536 |
| | | |
| Forest Products & Paper – 0.2% | | | | | | | |
| Cascades, Inc. | | 7.250% 02/15/13 | | | 240,000 | | 133,800 |
| | | |
| Domtar Corp. | | 7.125% 08/15/15 | | | 205,000 | | 137,350 |
| | | |
| Georgia-Pacific Corp. | | 8.000% 01/15/24 | | | 635,000 | | 504,825 |
| | | |
| NewPage Corp. | | 10.000% 05/01/12 | | | 110,000 | | 38,225 |
| | | |
| Westvaco Corp. | | 8.200% 01/15/30 | | | 25,000 | | 19,709 |
| | |
| | Forest Products & Paper Total | | | | | 833,909 |
| | | |
| Iron/Steel – 1.2% | | | | | | | |
| Nucor Corp. | | 5.000% 06/01/13 | | | 2,780,000 | | 2,909,320 |
| | | |
| | 5.850% 06/01/18 | | | 1,710,000 | | 1,707,445 |
| | | |
| Russel Metals, Inc. | | 6.375% 03/01/14 | | | 145,000 | | 116,725 |
| | | |
| Steel Dynamics, Inc. | | 7.750% 04/15/16 (c) | | | 405,000 | | 277,425 |
| | | |
| United States Steel Corp. | | 7.000% 02/01/18 | | | 805,000 | | 549,345 |
| | |
| | Iron/Steel Total | | | | | 5,560,260 |
| | | |
| Metals & Mining – 0.5% | | | | | | | |
| FMG Finance Ltd. | | 10.625% 09/01/16 (c) | | | 615,000 | | 516,600 |
| | | |
| Freeport-McMoRan Copper & Gold, Inc. | | 8.375% 04/01/17 | | | 1,550,000 | | 1,449,250 |
| | | |
| Noranda Aluminium Holding Corp. | | PIK,
8.345% 11/15/14 (d) | | | 340,000 | | 59,139 |
| | |
| | Metals & Mining Total | | | | | 2,024,989 |
| | | | | | | |
| Basic Materials Total | | | | | | | 10,655,694 |
See Accompanying Notes to Financial Statements.
8
Columbia Income Fund
March 31, 2009
Corporate Fixed-Income Bonds & Notes (continued)
| | | | | | |
| | | | | Par ($) (a) | | Value ($) |
| Communications – 13.6% | | | | | | |
| Media – 4.8% | | | | | | |
| Cablevision Systems Corp. | | 8.000% 04/15/12 | | 670,000 | | 651,575 |
| | | |
| Charter Communications Holdings II LLC | | 10.250% 09/15/10 (e) | | 655,000 | | 589,500 |
| | | |
| Charter Communications Operating LLC/Charter Communications Operating Capital | | 8.375% 04/30/14 (c)(e) | | 165,000 | | 145,200 |
| | 10.875% 09/15/14 (c)(e) | | 200,000 | | 194,000 |
| | | |
| CMP Susquehanna Corp. | | 3.522% 05/15/14 (f) | | 30,000 | | 13,500 |
| | | |
| Comcast Corp. | | 5.700% 05/15/18 | | 3,535,000 | | 3,315,660 |
| | 6.950% 08/15/37 | | 3,830,000 | | 3,566,542 |
| | | |
| CSC Holdings, Inc. | | 7.625% 04/01/11 | | 90,000 | | 89,325 |
| | 8.625% 02/15/19 (c) | | 165,000 | | 158,812 |
| | | |
| DirecTV Holdings LLC | | 6.375% 06/15/15 | | 730,000 | | 688,025 |
| | | |
| EchoStar DBS Corp. | | 6.625% 10/01/14 | | 820,000 | | 733,900 |
| | | |
| Local TV Finance LLC | | PIK,
9.250% 06/15/15 (c) | | 230,000 | | 16,735 |
| | | |
| Quebecor Media, Inc. | | 7.750% 03/15/16 | | 720,000 | | 547,200 |
| | | |
| R.H. Donnelley Corp. | | 8.875% 10/15/17 | | 1,005,000 | | 55,275 |
| | | |
| Time Warner, Inc. | | 6.875% 05/01/12 (g) | | 5,980,000 | | 6,086,444 |
| | | |
| TL Acquisitions, Inc. | | 10.500% 01/15/15 (c) | | 830,000 | | 425,375 |
| | | |
| Viacom, Inc. | | 5.750% 04/30/11 | | 3,120,000 | | 3,039,376 |
| | 6.875% 04/30/36 | | 1,611,000 | | 1,175,397 |
| | |
| | Media Total | | | | 21,491,841 |
| | | |
| Telecommunication Services – 8.8% | | | | | | |
| AT&T, Inc. | | 4.950% 01/15/13 | | 2,255,000 | | 2,287,596 |
| | 5.625% 06/15/16 | | 1,645,000 | | 1,648,607 |
| | 6.550% 02/15/39 | | 1,960,000 | | 1,777,685 |
| | | |
| British Telecommunications PLC | | 5.150% 01/15/13 | | 3,575,000 | | 3,317,986 |
| | 5.950% 01/15/18 | | 3,400,000 | | 2,767,206 |
| | | |
| Cisco Systems, Inc. | | 5.900% 02/15/39 | | 2,800,000 | | 2,572,688 |
| | | |
| Citizens Communications Co. | | 7.875% 01/15/27 | | 610,000 | | 411,750 |
| | | |
| Cricket Communications, Inc. | | 9.375% 11/01/14 | | 615,000 | | 585,788 |
| | | |
| Crown Castle International Corp. | | 9.000% 01/15/15 | | 225,000 | | 225,563 |
| | | |
| Digicel Group Ltd. | | 8.875% 01/15/15 (c) | | 855,000 | | 551,475 |
See Accompanying Notes to Financial Statements.
9
Columbia Income Fund
March 31, 2009
Corporate Fixed-Income Bonds & Notes (continued)
| | | | | | |
| | | | | Par ($) (a) | | Value ($) |
| Communications (continued) | | | | | | |
| Hellas Telecommunications Luxembourg II | | 6.844% 01/15/15 (c)(d) | | 245,000 | | 40,425 |
| | | |
| Inmarsat Finance PLC | | 7.625% 06/30/12 | | 150,000 | | 145,688 |
| | 10.375% 11/15/12 | | 530,000 | | 543,250 |
| | | |
| Intelsat Jackson Holdings Ltd. | | 11.250% 06/15/16 | | 1,215,000 | | 1,178,550 |
| | | |
| Lucent Technologies, Inc. | | 6.450% 03/15/29 | | 775,000 | | 294,500 |
| | | |
| MetroPCS Wireless, Inc. | | 9.250% 11/01/14 | | 615,000 | | 596,550 |
| | | |
| Nextel Communications, Inc. | | 7.375% 08/01/15 | | 585,000 | | 310,050 |
| | | |
| Nordic Telephone Co. Holdings ApS | | 8.875% 05/01/16 (c) | | 385,000 | | 359,975 |
| | | |
| Orascom Telecom Finance SCA | | 7.875% 02/08/14 (c) | | 220,000 | | 140,800 |
| | | |
| Qwest Communications International, Inc. | | 7.500% 02/15/14 | | 670,000 | | 579,550 |
| | | |
| Qwest Corp. | | 7.500% 10/01/14 | | 720,000 | | 655,200 |
| | 7.500% 06/15/23 | | 190,000 | | 143,450 |
| | | |
| Syniverse Technologies, Inc. | | 7.750% 08/15/13 | | 280,000 | | 235,200 |
| | | |
| Telefonica Emisiones SAU | | 6.221% 07/03/17 | | 760,000 | | 778,859 |
| | 6.421% 06/20/16 | | 3,125,000 | | 3,231,041 |
| | | |
| Time Warner Telecom Holdings, Inc. | | 9.250% 02/15/14 | | 335,000 | | 323,275 |
| | | |
| Verizon Communications, Inc. | | 8.950% 03/01/39 | | 2,000,000 | | 2,298,388 |
| | | |
| Verizon Wireless Capital LLC | | 5.550% 02/01/14 (c) | | 6,760,000 | | 6,765,651 |
| | 8.500% 11/15/18 (c) | | 2,095,000 | | 2,393,162 |
| | | |
| Virgin Media Finance PLC | | 8.750% 04/15/14 | | 425,000 | | 401,625 |
| | | |
| West Corp. | | 11.000% 10/15/16 | | 540,000 | | 359,100 |
| | | |
| Wind Acquisition Financial SA | | 10.750% 12/01/15 (c) | | 65,000 | | 64,350 |
| | PIK, | | | | |
| | 8.393% 12/21/11 (h) | | 669,580 | | 457,623 |
| | | |
| Windstream Corp. | | 8.625% 08/01/16 | | 865,000 | | 849,862 |
| | |
| | Telecommunication Services Total | | | | 39,292,468 |
| | | | | | |
| Communications Total | | | | | | 60,784,309 |
| | | | | | |
| Consumer Cyclical – 4.9% | | | | | | |
| Airlines – 0.5% | | | | | | |
| Continental Airlines, Inc. | | 7.461% 04/01/15 | | 3,490,322 | | 2,443,225 |
| | |
| | Airlines Total | | | | 2,443,225 |
See Accompanying Notes to Financial Statements.
10
Columbia Income Fund
March 31, 2009
Corporate Fixed-Income Bonds & Notes (continued)
| | | | | | |
| | | | | Par ($) (a) | | Value ($) |
| Consumer Cyclical (continued) | | | | |
| Apparel – 0.1% | | | | | | |
| Levi Strauss & Co. | | 9.750% 01/15/15 | | 495,000 | | 425,700 |
| | |
| | Apparel Total | | | | 425,700 |
| | | |
| Auto Manufacturers – 0.1% | | | | | | |
| Ford Motor Co. | | 7.450% 07/16/31 | | 650,000 | | 206,375 |
| | | |
| General Motors Corp. | | 7.200% 01/15/11 | | 390,000 | | 62,400 |
| | 8.375% 07/15/33 | | 810,000 | | 97,200 |
| | |
| | Auto Manufacturers Total | | | | 365,975 |
| | | |
| Auto Parts & Equipment – 0.1% | | | | | | |
| Commercial Vehicle Group, Inc. | | 8.000% 07/01/13 | | 250,000 | | 55,000 |
| | | |
| Cooper-Standard Automotive, Inc. | | 7.000% 12/15/12 | | 55,000 | | 6,600 |
| | | |
| Goodyear Tire & Rubber Co. | | 8.625% 12/01/11 | | 88,000 | | 73,040 |
| | 9.000% 07/01/15 | | 430,000 | | 331,100 |
| | | |
| Hayes Lemmerz Finance Luxembourg SA | | 8.250% 06/15/15 | | EUR 340,000 | | 45,172 |
| | | |
| TRW Automotive, Inc. | | 7.000% 03/15/14 (c) | | 305,000 | | 128,100 |
| | |
| | Auto Parts & Equipment Total | | | | 639,012 |
| | | |
| Entertainment – 0.1% | | | | | | |
| Six Flags, Inc. | | 9.625% 06/01/14 | | 259,000 | | 23,310 |
| | | |
| WMG Acquisition Corp. | | 7.375% 04/15/14 | | 285,000 | | 195,938 |
| | | |
| WMG Holdings Corp. | | (i) 12/15/14 (9.500% 12/15/09) | | 385,000 | | 138,600 |
| | |
| | Entertainment Total | | | | 357,848 |
| | | |
| Home Builders – 0.2% | | | | | | |
| D.R. Horton, Inc. | | 5.625% 09/15/14 | | 340,000 | | 266,900 |
| | 5.625% 01/15/16 | | 185,000 | | 140,600 |
| | | |
| KB Home | | 5.875% 01/15/15 | | 585,000 | | 453,083 |
| | |
| | Home Builders Total | | | | 860,583 |
| | | |
| Lodging – 0.4% | | | | | | |
| Boyd Gaming Corp. | | 6.750% 04/15/14 | | 425,000 | | 246,500 |
| | | |
| Harrah’s Operating Co., Inc. | | 10.000% 12/15/18 (c) | | 77,000 | | 23,100 |
| | 10.750% 02/01/16 | | 339,000 | | 64,410 |
| | | |
| Jacobs Entertainment, Inc. | | 9.750% 06/15/14 | | 335,000 | | 198,488 |
| | | |
| Majestic Star LLC | | 9.750% 01/15/11 (b) | | 480,000 | | 33,600 |
| | | |
| Mashantucket Western Pequot Tribe | | 8.500% 11/15/15 (c) | | 485,000 | | 82,450 |
See Accompanying Notes to Financial Statements.
11
Columbia Income Fund
March 31, 2009
Corporate Fixed-Income Bonds & Notes (continued)
| | | | | | |
| | | | | Par ($) (a) | | Value ($) |
| Consumer Cyclical (continued) | | | | | | |
| MGM Mirage | | 7.500% 06/01/16 | | 945,000 | | 330,750 |
| | | |
| Seminole Indian Tribe of Florida | | 7.804% 10/01/20 (c) | | 565,000 | | 441,005 |
| | | |
| Snoqualmie Entertainment Authority | | 5.384% 02/01/14 (c)(d) | | 70,000 | | 17,500 |
| | 9.125% 02/01/15 (c) | | 240,000 | | 62,400 |
| | | |
| Starwood Hotels & Resorts Worldwide, Inc. | | 6.750% 05/15/18 | | 300,000 | | 198,000 |
| | |
| | Lodging Total | | | | 1,698,203 |
| | | |
| Retail – 3.3% | | | | | | |
| AmeriGas Partners LP | | 7.125% 05/20/16 | | 465,000 | | 437,100 |
| | 7.250% 05/20/15 | | 105,000 | | 98,700 |
| | | |
| Best Buy Co., Inc. | | 6.750% 07/15/13 | | 3,760,000 | | 3,577,411 |
| | | |
| CVS Pass-Through Trust | | 5.298% 01/11/27 (c) | | 2,008,566 | | 1,457,803 |
| | 6.036% 12/10/28 (c) | | 2,434,904 | | 1,829,855 |
| | | |
| Dollar General Corp. | | PIK,
11.875% 07/15/17 | | 570,000 | | 560,025 |
| | | |
| GameStop Corp./GameStop, Inc. | | 8.000% 10/01/12 | | 290,000 | | 292,900 |
| | | |
| Hanesbrands, Inc. | | 5.698% 12/15/14 (d) | | 160,000 | | 106,400 |
| | | |
| Inergy LP/Inergy Finance Corp. | | 8.250% 03/01/16 | | 190,000 | | 180,500 |
| | 8.750% 03/01/15 (c) | | 220,000 | | 212,300 |
| | | |
| Macy’s Retail Holdings, Inc. | | 5.350% 03/15/12 | | 645,000 | | 506,296 |
| | | |
| McDonald’s Corp. | | 5.000% 02/01/19 | | 440,000 | | 457,633 |
| | 5.700% 02/01/39 | | 2,460,000 | | 2,384,284 |
| | | |
| New Albertsons, Inc. | | 8.000% 05/01/31 | | 325,000 | | 265,687 |
| | | |
| Phillips-Van Heusen Corp. | | 7.250% 02/15/11 | | 135,000 | | 129,937 |
| | 8.125% 05/01/13 | | 190,000 | | 180,500 |
| | | |
| Rite Aid Corp. | | 9.500% 06/15/17 | | 500,000 | | 115,000 |
| | | |
| Starbucks Corp. | | 6.250% 08/15/17 | | 2,225,000 | | 2,075,113 |
| | |
| | Retail Total | | | | 14,867,444 |
| | | |
| Textiles – 0.1% | | | | | | |
| INVISTA | | 9.250% 05/01/12 (c) | | 240,000 | | 214,800 |
| | |
| | Textiles Total | | | | 214,800 |
| | | | | | |
| Consumer Cyclical Total | | | | | | 21,872,790 |
See Accompanying Notes to Financial Statements.
12
Columbia Income Fund
March 31, 2009
Corporate Fixed-Income Bonds & Notes (continued)
| | | | | | |
| | | | | Par ($) (a) | | Value ($) |
| Consumer Non-Cyclical – 8.9% | | | | |
| Agriculture – 0.1% | | | | | | |
| Reynolds American, Inc. | | 7.625% 06/01/16 | | 325,000 | | 287,742 |
| | |
| | Agriculture Total | | | | 287,742 |
| | | |
| Beverages – 2.1% | | | | | | |
| Anheuser-Busch InBev Worldwide, Inc. | | 7.750% 01/15/19 (c)(g) | | 5,705,000 | | 5,688,461 |
| | | |
| Bottling Group LLC | | 5.125% 01/15/19 | | 1,470,000 | | 1,479,457 |
| | | |
| Constellation Brands, Inc. | | 8.125% 01/15/12 | | 548,000 | | 548,000 |
| | | |
| Cott Beverages, Inc. | | 8.000% 12/15/11 | | 330,000 | | 186,450 |
| | | |
| SABMiller PLC | | 6.200% 07/01/11 (c) | | 1,500,000 | | 1,512,447 |
| | |
| | Beverages Total | | | | 9,414,815 |
| | |
| Biotechnology – 0.7% | | | | |
| Bio-Rad Laboratories, Inc. | | 7.500% 08/15/13 | | 400,000 | | 384,000 |
| | | |
| Genentech, Inc. | | 4.400% 07/15/10 | | 2,900,000 | | 2,941,679 |
| | |
| | Biotechnology Total | | | | 3,325,679 |
| | |
| Commercial Services – 0.6% | | | | |
| ACE Cash Express, Inc. | | 10.250% 10/01/14 (c) | | 220,000 | | 55,000 |
| | | |
| ARAMARK Corp. | | 8.500% 02/01/15 | | 500,000 | | 460,000 |
| | | |
| Ashtead Holdings PLC | | 8.625% 08/01/15 (c) | | 365,000 | | 208,050 |
| | | |
| Corrections Corp. of America | | 6.250% 03/15/13 | | 315,000 | | 301,612 |
| | | |
| GEO Group, Inc. | | 8.250% 07/15/13 | | 480,000 | | 445,200 |
| | | |
| Iron Mountain, Inc. | | 8.000% 06/15/20 | | 450,000 | | 418,500 |
| | | |
| Rental Service Corp. | | 9.500% 12/01/14 | | 290,000 | | 142,100 |
| | | |
| Service Corp. International | | 6.750% 04/01/16 | | 325,000 | | 282,750 |
| | 7.375% 10/01/14 | | 175,000 | | 162,750 |
| | | |
| United Rentals North America, Inc. | | 6.500% 02/15/12 | | 385,000 | | 308,000 |
| | |
| | Commercial Services Total | | | | 2,783,962 |
| | |
| Food – 1.9% | | | | |
| Campbell Soup Co. | | 4.500% 02/15/19 | | 2,140,000 | | 2,133,039 |
| | | |
| ConAgra Foods, Inc. | | 7.000% 10/01/28 | | 2,560,000 | | 2,475,625 |
| | | |
| Dean Foods Co. | | 7.000% 06/01/16 | | 590,000 | | 560,500 |
| | | |
| Del Monte Corp. | | 6.750% 02/15/15 | | 350,000 | | 329,000 |
| | | |
| Kroger Co. | | 8.000% 09/15/29 | | 1,716,000 | | 1,844,370 |
See Accompanying Notes to Financial Statements.
13
Columbia Income Fund
March 31, 2009
Corporate Fixed-Income Bonds & Notes (continued)
| | | | | | |
| | | | | Par ($) (a) | | Value ($) |
| Consumer Non-Cyclical (continued) | | | | |
| Pinnacle Foods Finance LLC | | 9.250% 04/01/15 | | 650,000 | | 516,750 |
| | | |
| Reddy Ice Holdings, Inc. | | 10.500% 11/01/12 | | 280,000 | | 134,400 |
| | | |
| Tyson Foods, Inc. | | 10.500% 03/01/14 (c) | | 285,000 | | 290,700 |
| | |
| | Food Total | | | | 8,284,384 |
| | |
| Healthcare Products – 0.2% | | | | |
| Biomet, Inc. | | PIK,
10.375% 10/15/17 | | 1,075,000 | | 908,375 |
| | |
| | Healthcare Products Total | | | | 908,375 |
| | |
| Healthcare Services – 1.1% | | | | |
| Community Health Systems, Inc. | | 8.875% 07/15/15 | | 835,000 | | 789,075 |
| | | |
| DaVita, Inc. | | 7.250% 03/15/15 | | 520,000 | | 499,850 |
| | | |
| HCA, Inc. | | 9.250% 11/15/16 | | 295,000 | | 268,450 |
| | PIK,
9.625% 11/15/16 | | 1,685,000 | | 1,282,518 |
| | | |
| HealthSouth Corp. | | 10.750% 06/15/16 | | 225,000 | | 220,500 |
| | | |
| U.S. Oncology Holdings, Inc. | | PIK,
6.904% 03/15/12 (d) | | 329,000 | | 196,352 |
| | | |
| U.S. Oncology, Inc. | | 9.000% 08/15/12 | | 200,000 | | 194,000 |
| | | |
| WellPoint, Inc. | | 7.000% 02/15/19 | | 1,485,000 | | 1,485,800 |
| | |
| | Healthcare Services Total | | | | 4,936,545 |
| | |
| Household Products/Wares – 0.3% | | | | |
| American Greetings Corp. | | 7.375% 06/01/16 | | 255,000 | | 124,950 |
| | | |
| Clorox Co. | | 5.950% 10/15/17 | | 1,030,000 | | 1,017,122 |
| | | |
| Jostens IH Corp. | | 7.625% 10/01/12 | | 275,000 | | 260,562 |
| | |
| | Household Products/Wares Total | | | | 1,402,634 |
| | |
| Pharmaceuticals – 1.9% | | | | |
| Abbott Laboratories | | 5.600% 05/15/11 | | 1,000,000 | | 1,072,239 |
| | | |
| Elan Finance PLC | | 5.234% 11/15/11 (d) | | 265,000 | | 217,300 |
| | 8.875% 12/01/13 | | 280,000 | | 224,000 |
| | | |
| Novartis Securities Investment Ltd. | | 5.125% 02/10/19 | | 3,525,000 | | 3,579,010 |
| | | |
| Omnicare, Inc. | | 6.750% 12/15/13 | | 440,000 | | 399,300 |
| | | |
| Warner Chilcott Corp. | | 8.750% 02/01/15 | | 635,000 | | 609,600 |
| | | |
| Wyeth | | 6.500% 02/01/34 | | 2,500,000 | | 2,539,978 |
| | |
| | Pharmaceuticals Total | | | | 8,641,427 |
| | |
| Consumer Non-Cyclical Total | | | | | | 39,985,563 |
See Accompanying Notes to Financial Statements.
14
Columbia Income Fund
March 31, 2009
Corporate Fixed-Income Bonds & Notes (continued)
| | | | | | |
| | | | | Par ($) (a) | | Value ($) |
| Energy – 10.6% | | | | | | |
| Coal – 0.2% | | | | | | |
| Arch Western Finance LLC | | 6.750% 07/01/13 | | 460,000 | | 420,900 |
| | | |
| Massey Energy Co. | | 6.875% 12/15/13 | | 660,000 | | 574,200 |
| | |
| | Coal Total | | | | 995,100 |
| | | |
| Oil & Gas – 5.6% | | | | | | |
| Canadian Natural Resources Ltd. | | 6.250% 03/15/38 | | 1,825,000 | | 1,405,706 |
| | | |
| Chesapeake Energy Corp. | | 6.375% 06/15/15 | | 870,000 | | 732,975 |
| | 9.500% 02/15/15 | | 90,000 | | 87,525 |
| | | |
| Cimarex Energy Co. | | 7.125% 05/01/17 | | 355,000 | | 285,775 |
| | | |
| Compton Petroleum Corp. | | 7.625% 12/01/13 | | 275,000 | | 86,625 |
| | | |
| Devon Energy Corp. | | 6.300% 01/15/19 | | 1,150,000 | | 1,122,026 |
| | | |
| Forest Oil Corp. | | 8.500% 02/15/14 (c) | | 320,000 | | 296,800 |
| | | |
| Frontier Oil Corp. | | 8.500% 09/15/16 | | 230,000 | | 226,550 |
| | | |
| Gazprom International SA | | 7.201% 02/01/20 | | 105,148 | | 92,530 |
| | 7.201% 02/01/20 (c) | | 2,102,955 | | 1,850,601 |
| | | |
| Hess Corp. | | 7.300% 08/15/31 | | 3,275,000 | | 2,848,942 |
| | | |
| KCS Energy, Inc. | | 7.125% 04/01/12 | | 100,000 | | 90,500 |
| | | |
| Marathon Oil Corp. | | 6.000% 07/01/12 | | 320,000 | | 325,129 |
| | 7.500% 02/15/19 | | 1,035,000 | | 1,042,751 |
| | | |
| Newfield Exploration Co. | | 6.625% 04/15/16 | | 890,000 | | 796,550 |
| | | |
| Nexen, Inc. | | 5.875% 03/10/35 | | 2,200,000 | | 1,455,566 |
| | | |
| OPTI Canada, Inc. | | 8.250% 12/15/14 | | 545,000 | | 243,888 |
| | | |
| PetroHawk Energy Corp. | | 7.875% 06/01/15 (c) | | 710,000 | | 624,800 |
| | | |
| Pioneer Natural Resources Co. | | 5.875% 07/15/16 | | 370,000 | | 273,016 |
| | | |
| Pride International, Inc. | | 7.375% 07/15/14 | | 160,000 | | 157,600 |
| | | |
| Qatar Petroleum | | 5.579% 05/30/11 (c) | | 583,380 | | 581,052 |
| | | |
| Quicksilver Resources, Inc. | | 7.125% 04/01/16 | | 890,000 | | 422,750 |
| | | |
| Range Resources Corp. | | 7.500% 05/15/16 | | 515,000 | | 475,087 |
| | | |
| Ras Laffan Liquefied Natural Gas Co., Ltd. | | 3.437% 09/15/09 (c) | | 266,900 | | 262,568 |
| | | |
| Ras Laffan Liquefied Natural Gas Co., Ltd. III | | 5.832% 09/30/16 (c) | | 640,000 | | 604,077 |
| | 5.838% 09/30/27 (c) | | 1,200,000 | | 919,068 |
See Accompanying Notes to Financial Statements.
15
Columbia Income Fund
March 31, 2009
Corporate Fixed-Income Bonds & Notes (continued)
| | | | | | |
| | | | | Par ($) (a) | | Value ($) |
| Energy (continued) | | | | | | |
| Southwestern Energy Co. | | 7.500% 02/01/18 (c) | | 770,000 | | 743,050 |
| | | |
| Talisman Energy, Inc. | | 5.850% 02/01/37 | | 1,825,000 | | 1,231,718 |
| | 6.250% 02/01/38 | | 1,790,000 | | 1,262,716 |
| | | |
| Tesoro Corp. | | 6.625% 11/01/15 | | 360,000 | | 284,400 |
| | | |
| United Refining Co. | | 10.500% 08/15/12 | | 270,000 | | 156,600 |
| | | |
| Valero Energy Corp. | | 6.625% 06/15/37 | | 3,665,000 | | 2,590,712 |
| | 6.875% 04/15/12 | | 1,415,000 | | 1,428,092 |
| | |
| | Oil & Gas Total | | | | 25,007,745 |
| | | |
| Oil & Gas Services – 0.7% | | | | | | |
| Seitel, Inc. | | 9.750% 02/15/14 | | 215,000 | | 95,138 |
| | | |
| Smith International, Inc. | | 9.750% 03/15/19 | | 1,480,000 | | 1,545,959 |
| | | |
| Weatherford International Ltd. | | 7.000% 03/15/38 | | 1,780,000 | | 1,294,097 |
| | |
| | Oil & Gas Services Total | | | | 2,935,194 |
| | | |
| Pipelines – 4.1% | | | | | | |
| Atlas Pipeline Partners LP | | 8.125% 12/15/15 | | 220,000 | | 125,400 |
| | | |
| El Paso Corp. | | 6.875% 06/15/14 | | 350,000 | | 311,751 |
| | 7.250% 06/01/18 | | 300,000 | | 255,000 |
| | | |
| Enbridge Energy Partners LP | | 7.500% 04/15/38 | | 1,925,000 | | 1,534,560 |
| | | |
| Energy Transfer Partners LP | | 6.000% 07/01/13 | | 5,245,000 | | 4,959,100 |
| | | |
| Kinder Morgan Energy Partners LP | | 6.950% 01/15/38 | | 1,765,000 | | 1,510,319 |
| | | |
| Kinder Morgan Finance Co. ULC | | 5.700% 01/05/16 | | 490,000 | | 411,600 |
| | | |
| MarkWest Energy Partners LP | | 6.875% 11/01/14 | | 55,000 | | 38,775 |
| | 8.500% 07/15/16 | | 390,000 | | 278,850 |
| | | |
| ONEOK Partners LP | | 6.850% 10/15/37 | | 1,090,000 | | 835,533 |
| | | |
| Plains All American Pipeline LP | | 6.500% 05/01/18 | | 4,750,000 | | 4,105,539 |
| | | |
| Plains All American Pipeline LP/PAA Finance Corp. | | 6.650% 01/15/37 | | 2,635,000 | | 1,909,859 |
| | | |
| TransCanada Pipelines Ltd. | | 6.350% 05/15/67 (d) | | 2,775,000 | | 1,581,750 |
| | | |
| Williams Companies, Inc. | | 7.625% 07/15/19 | | 195,000 | | 182,325 |
| | 7.875% 09/01/21 | | 145,000 | | 134,125 |
| | 8.125% 03/15/12 | | 285,000 | | 289,275 |
| | |
| | Pipelines Total | | | | 18,463,761 |
| | | | | | |
| Energy Total | | | | | | 47,401,800 |
See Accompanying Notes to Financial Statements.
16
Columbia Income Fund
March 31, 2009
Corporate Fixed-Income Bonds & Notes (continued)
| | | | | | |
| | | | | Par ($) (a) | | Value ($) |
| Financials – 27.3% | | | | | | |
| Banks – 16.7% | | | | | | |
| American Express Centurion Bank | | 4.375% 07/30/09 | | 2,980,000 | | 2,948,460 |
| | | |
| ANZ National International Ltd. | | 6.200% 07/19/13 (c) | | 7,105,000 | | 6,851,117 |
| | | |
| Bank of New York Mellon Corp. | | 5.125% 08/27/13 | | 445,000 | | 455,461 |
| | | |
| Barclays Bank PLC | | 7.375% 06/15/49 (c)(d) | | 3,215,000 | | 1,080,079 |
| | | |
| Capital One Capital IV | | 6.745% 02/17/37 (d) | | 3,625,000 | | 1,236,143 |
| | | |
| Capital One Financial Corp. | | 5.700% 09/15/11 | | 3,750,000 | | 3,376,444 |
| | | |
| Chinatrust Commercial Bank | | 5.625% 12/29/49 (c)(d) | | 825,000 | | 374,021 |
| | | |
| Citigroup, Inc. | | 4.125% 02/22/10 | | 3,835,000 | | 3,701,573 |
| | | |
| | 6.500% 08/19/13 | | 6,000,000 | | 5,513,490 |
| | | |
| Comerica Bank | | 5.200% 08/22/17 | | 2,200,000 | | 1,525,731 |
| | | |
| | 5.750% 11/21/16 | | 2,985,000 | | 2,208,303 |
| | | |
| Goldman Sachs Capital II | | 5.793% 12/29/49 (d) | | 605,000 | | 251,886 |
| | | |
| Goldman Sachs Group, Inc. | | 6.750% 10/01/37 | | 300,000 | | 202,902 |
| | | |
| HSBC Bank USA | | 3.875% 09/15/09 | | 3,290,000 | | 3,250,451 |
| | | |
| HSBC Capital Funding LP | | 9.547% 12/31/49 (c)(d) | | 2,700,000 | | 1,842,407 |
| | | |
| JPMorgan Chase Capital XVII | | 5.850% 08/01/35 | | 1,950,000 | | 1,136,737 |
| | | |
| JPMorgan Chase Capital XX | | 6.550% 09/29/36 | | 3,700,000 | | 2,375,470 |
| | | |
| KeyBank NA | | 5.800% 07/01/14 | | 1,655,000 | | 1,384,138 |
| | | |
| Keycorp | | 6.500% 05/14/13 | | 4,300,000 | | 4,196,091 |
| | | |
| Lloyds TSB Group PLC | | 6.267% 12/31/49 (c)(d) | | 2,915,000 | | 626,725 |
| | | |
| M&I Marshall & Ilsley Bank | | 5.300% 09/08/11 | | 1,765,000 | | 1,631,033 |
| | | |
| Merrill Lynch & Co., Inc. | | 5.700% 05/02/17 (g)(j) | | 10,285,000 | | 6,089,892 |
| | 6.050% 08/15/12 (j) | | 670,000 | | 574,898 |
| | 7.750% 05/14/38 (j) | | 2,635,000 | | 1,564,199 |
| | | |
| Morgan Stanley | | 5.950% 12/28/17 | | 880,000 | | 799,395 |
| | | |
| National City Bank of Cleveland | | 6.200% 12/15/11 | | 575,000 | | 564,907 |
| | | |
| National City Bank of Kentucky | | 6.300% 02/15/11 | | 1,020,000 | | 1,001,992 |
| | | |
| National City Corp. | | 6.875% 05/15/19 | | 1,840,000 | | 1,557,794 |
| | | |
| Northern Trust Co. | | 6.500% 08/15/18 | | 4,825,000 | | 5,069,579 |
| | | |
| Northern Trust Corp. | | 5.500% 08/15/13 | | 2,005,000 | | 2,098,429 |
See Accompanying Notes to Financial Statements.
17
Columbia Income Fund
March 31, 2009
Corporate Fixed-Income Bonds & Notes (continued)
| | | | | | |
| | | | | Par ($) (a) | | Value ($) |
| Financials (continued) | | | | | | |
| Regions Financing Trust II | | 6.625% 05/15/47 (d) | | 1,115,000 | | 403,883 |
| | | |
| Royal Bank of Scotland Group PLC | | 6.990% 10/29/49 (c)(d) | | 2,335,000 | | 1,027,400 |
| | | |
| SunTrust Preferred Capital I | | 5.853% 12/31/49 (d) | | 5,000,000 | | 1,250,000 |
| | | |
| Union Planters Corp. | | 4.375% 12/01/10 | | 2,515,000 | | 2,403,845 |
| | | |
| USB Capital IX | | 6.189% 04/15/42 (d) | | 2,540,000 | | 1,003,300 |
| | | |
| Wachovia Capital Trust III | | 5.800% 03/15/42 (d) | | 3,340,000 | | 1,202,400 |
| | | |
| Wachovia Corp. | | 4.375% 06/01/10 | | 1,225,000 | | 1,190,503 |
| | 5.500% 05/01/13 | | 795,000 | | 733,032 |
| | |
| | Banks Total | | | | 74,704,110 |
| | |
| Diversified Financial Services – 4.4% | | | | |
| CDX North America High Yield | | 8.875% 06/29/13 (c) | | 1,900,000 | | 1,510,500 |
| | | |
| Eaton Vance Corp. | | 6.500% 10/02/17 | | 2,605,000 | | 2,234,856 |
| | | |
| Ford Motor Credit Co. | | 7.800% 06/01/12 | | 705,000 | | 477,797 |
| | 8.000% 12/15/16 | | 295,000 | | 193,883 |
| | | |
| Fund American Companies, Inc. | | 5.875% 05/15/13 | | 1,557,000 | | 1,195,366 |
| | | |
| General Electric Capital Corp. | | 1.440% 12/15/09 (d) | | 2,410,000 | | 2,349,063 |
| | 5.450% 01/15/13 | | 3,090,000 | | 2,975,701 |
| | 6.875% 01/10/39 | | 5,025,000 | | 4,098,340 |
| | | |
| GMAC LLC | | 6.875% 09/15/11 (c) | | 569,000 | | 404,343 |
| | 8.000% 11/01/31 (c) | | 825,000 | | 396,957 |
| | | |
| International Lease Finance Corp. | | 4.750% 07/01/09 | | 1,505,000 | | 1,414,840 |
| | 4.875% 09/01/10 | | 925,000 | | 675,719 |
| | | |
| Lehman Brothers Holdings, Inc. | | 5.625% 01/24/13 (f)(k) | | 8,075,000 | | 1,029,562 |
| | 6.875% 05/02/18 (f)(k) | | 600,000 | | 76,500 |
| | | |
| Nuveen Investments, Inc. | | 10.500% 11/15/15 (c) | | 420,000 | | 117,600 |
| | | |
| PF Export Receivables Master Trust | | 3.748% 06/01/13 (c) | | 541,680 | | 573,146 |
| | |
| | Diversified Financial Services Total | | | | 19,724,173 |
| | |
| Insurance – 4.7% | | | | |
| Asurion Corp. | | 7.033% 07/02/15 (d)(h) | | 365,000 | | 280,796 |
| | | |
| Crum & Forster Holdings Corp. | | 7.750% 05/01/17 | | 490,000 | | 382,200 |
| | | |
| HUB International Holdings, Inc. | | 10.250% 06/15/15 (c) | | 340,000 | | 161,500 |
| | | |
| ING Groep NV | | 5.775% 12/29/49 (d) | | 2,679,000 | | 736,725 |
See Accompanying Notes to Financial Statements.
18
Columbia Income Fund
March 31, 2009
Corporate Fixed-Income Bonds & Notes (continued)
| | | | | | |
| | | | | Par ($) (a) | | Value ($) |
| Financials (continued) | | | | | | |
| Liberty Mutual Group, Inc. | | 7.500% 08/15/36 (c) | | 4,010,000 | | 2,252,726 |
| | 10.750% 06/15/58 (c)(d) | | 2,200,000 | | 1,078,000 |
| | | |
| MetLife, Inc. | | 7.717% 02/15/19 | | 1,750,000 | | 1,569,157 |
| | | |
| Metropolitan Life Global Funding I | | 5.125% 04/10/13 (c) | | 1,400,000 | | 1,278,607 |
| | | |
| New York Life Global Funding | | 4.650% 05/09/13 (c)(g) | | 6,940,000 | | 6,758,040 |
| | | |
| Principal Life Income Funding Trusts | | 5.300% 04/24/13 | | 5,875,000 | | 5,397,280 |
| | | |
| Prudential Financial, Inc. | | 4.750% 06/13/15 | | 1,075,000 | | 781,783 |
| | | |
| USI Holdings Corp. | | 9.750% 05/15/15 (c) | | 215,000 | | 96,750 |
| | |
| | Insurance Total | | | | 20,773,564 |
| | | |
| Real Estate – 0.4% | | | | | | |
| Prudential Property | | 6.625% 04/01/09 (c) | | 1,800,000 | | 1,800,000 |
| | |
| | Real Estate Total | | | | 1,800,000 |
| | | |
| Real Estate Investment Trusts (REITs) – 0.8% | | | | | | |
| Health Care Property Investors, Inc. | | 7.072% 06/08/15 | | 745,000 | | 553,197 |
| | | |
| Highwoods Properties, Inc. | | 5.850% 03/15/17 | | 830,000 | | 513,251 |
| | | |
| Hospitality Properties Trust | | 5.625% 03/15/17 | | 2,040,000 | | 983,766 |
| | | |
| Host Marriott Corp. | | 6.750% 06/01/16 | | 385,000 | | 281,050 |
| | | |
| Liberty Property LP | | 5.500% 12/15/16 | | 2,155,000 | | 1,392,128 |
| | |
| | Real Estate Investment Trusts (REITs) Total | | | | 3,723,392 |
| | | |
| Savings & Loans – 0.3% | | | | | | |
| Washington Mutual Bank | | 5.125% 01/15/15 (b) | | 6,350,000 | | 635 |
| | | |
| Washington Mutual Preferred Funding Delaware | | 6.534% 03/29/49 (b)(c) | | 1,075,000 | | 107 |
| | | |
| World Savings Bank | | 4.500% 06/15/09 | | 1,505,000 | | 1,502,964 |
| | |
| | Savings & Loans Total | | | | 1,503,706 |
| | | | | | |
| Financials Total | | | | | | 122,228,945 |
| | | | | | |
| Industrials – 5.7% | | | | | | |
| Aerospace & Defense – 1.0% | | | | | | |
| BE Aerospace, Inc. | | 8.500% 07/01/18 | | 580,000 | | 483,575 |
| | | |
| Boeing Co. | | 6.000% 03/15/19 | | 1,610,000 | | 1,653,604 |
| | | |
| L-3 Communications Corp. | | 6.375% 10/15/15 | | 570,000 | | 537,225 |
| | | |
| Moog, Inc. | | 7.250% 06/15/18 (c) | | 160,000 | | 147,600 |
See Accompanying Notes to Financial Statements.
19
Columbia Income Fund
March 31, 2009
Corporate Fixed-Income Bonds & Notes (continued)
| | | | | | |
| | | | | Par ($) (a) | | Value ($) |
| Industrials (continued) | | | | | | |
| Raytheon Co. | | 5.500% 11/15/12 | | 1,000,000 | | 1,050,859 |
| | | |
| Sequa Corp. | | 11.750% 12/01/15 (c) | | 245,000 | | 36,750 |
| | | |
| Systems 2001 Asset Trust | | 6.664% 09/15/13 (c) | | 461,132 | | 419,796 |
| | |
| | Aerospace & Defense Total | | | | 4,329,409 |
| | | |
| Air Transportation – 0.1% | | | | | | |
| Air 2 US | | 8.027% 10/01/19 (c) | | 494,577 | | 272,017 |
| | |
| | Air Transportation Total | | | | 272,017 |
| | |
| Electrical Components & Equipment – 0.1% | | | | |
| Belden, Inc. | | 7.000% 03/15/17 | | 305,000 | | 250,100 |
| | | |
| General Cable Corp. | | 3.810% 04/01/15 (d) | | 170,000 | | 120,275 |
| | 7.125% 04/01/17 | | 225,000 | | 184,500 |
| | |
| | Electrical Components & Equipment Total | | | | 554,875 |
| | | |
| Electronics – 0.1% | | | | | | |
| Flextronics International Ltd. | | 6.250% 11/15/14 | | 485,000 | | 409,825 |
| | |
| | Electronics Total | | | | 409,825 |
| | |
| Engineering & Construction – 0.0% | | | | |
| Esco Corp. | | 8.625% 12/15/13 (c) | | 270,000 | | 205,200 |
| | |
| | Engineering & Construction Total | | | | 205,200 |
| | | |
| Environmental Control – 0.2% | | | | | | |
| Allied Waste North America, Inc. | | 7.875% 04/15/13 | | 750,000 | | 746,250 |
| | |
| | Environmental Control Total | | | | 746,250 |
| | | |
| Machinery – 0.9% | | | | | | |
| Caterpillar Financial Services Corp. | | 4.250% 02/08/13 | | 2,625,000 | | 2,469,802 |
| | 5.450% 04/15/18 | | 385,000 | | 330,309 |
| | 6.200% 09/30/13 | | 300,000 | | 300,288 |
| John Deere Capital Corp. | | 4.950% 12/17/12 | | 890,000 | | 893,330 |
| | |
| | Machinery Total | | | | 3,993,729 |
| | |
| Machinery-Construction & Mining – 0.5% | | | | |
| Caterpillar, Inc. | | 8.250% 12/15/38 | | 1,700,000 | | 1,841,942 |
| Terex Corp. | | 8.000% 11/15/17 | | 505,000 | | 409,050 |
| | |
| | Machinery-Construction & Mining Total | | | | 2,250,992 |
| | | |
| Machinery-Diversified – 0.1% | | | | | | |
| Manitowoc Co., Inc. | | 7.125% 11/01/13 | | 560,000 | | 392,000 |
| | | |
| Westinghouse Air Brake Technologies Corp. | | 6.875% 07/31/13 | | 170,000 | | 161,500 |
| | |
| | Machinery-Diversified Total | | | | 553,500 |
See Accompanying Notes to Financial Statements.
20
Columbia Income Fund
March 31, 2009
Corporate Fixed-Income Bonds & Notes (continued)
| | | | | | |
| | | | | Par ($) (a) | | Value ($) |
| Industrials (continued) | | | | | | |
| Miscellaneous Manufacturing – 0.3% | | | | |
| American Railcar Industries, Inc. | | 7.500% 03/01/14 | | 315,000 | | 218,925 |
| | | |
| Bombardier, Inc. | | 6.300% 05/01/14 (c) | | 610,000 | | 430,050 |
| | | |
| Koppers Holdings, Inc. | | (i) 11/15/14 (9.875% 11/15/09) | | 395,000 | | 321,925 |
| | | |
| TriMas Corp. | | 9.875% 06/15/12 | | 255,000 | | 124,950 |
| | | |
| Trinity Industries, Inc. | | 6.500% 03/15/14 | | 410,000 | | 332,100 |
| | |
| | Miscellaneous Manufacturing Total | | | | 1,427,950 |
| | | |
| Packaging & Containers – 0.4% | | | | | | |
| Berry Plastics Holding Corp. | | 8.875% 09/15/14 | | 260,000 | | 145,600 |
| | | |
| Crown Americas LLC & Crown Americas Capital Corp. | | 7.750% 11/15/15 | | 430,000 | | 432,150 |
| | | |
| Owens-Brockway Glass Container, Inc. | | 6.750% 12/01/14 | | 175,000 | | 168,000 |
| | 8.250% 05/15/13 | | 350,000 | | 351,750 |
| | | |
| Silgan Holdings, Inc. | | 6.750% 11/15/13 | | 140,000 | | 131,600 |
| | | |
| Solo Cup Co. | | 8.500% 02/15/14 | | 735,000 | | 536,550 |
| | |
| | Packaging & Containers Total | | | | 1,765,650 |
| | | |
| Transportation – 2.0% | | | | | | |
| BNSF Funding Trust I | | 6.613% 12/15/55 (d) | | 1,730,000 | | 1,254,250 |
| | | |
| Bristow Group, Inc. | | 7.500% 09/15/17 | | 300,000 | | 225,000 |
| | | |
| Burlington Northern Santa Fe Corp. | | 6.200% 08/15/36 | | 645,000 | | 588,253 |
| | 7.950% 08/15/30 | | 945,000 | | 1,033,631 |
| | | |
| Navios Maritime Holdings, Inc. | | 9.500% 12/15/14 | | 390,000 | | 222,300 |
| | | |
| PHI, Inc. | | 7.125% 04/15/13 | | 315,000 | | 194,119 |
| | | |
| Ship Finance International Ltd. | | 8.500% 12/15/13 | | 220,000 | | 149,600 |
| | | |
| Stena AB | | 7.500% 11/01/13 | | 450,000 | | 337,500 |
| | | |
| TFM SA de CV | | 9.375% 05/01/12 | | 460,000 | | 418,600 |
| | | |
| Union Pacific Corp. | | 5.700% 08/15/18 | | 2,410,000 | | 2,293,929 |
| | 6.650% 01/15/11 | | 2,010,000 | | 2,095,085 |
| | |
| | Transportation Total | | | | 8,812,267 |
| | | | | | |
| Industrials Total | | | | | | 25,321,664 |
See Accompanying Notes to Financial Statements.
21
Columbia Income Fund
March 31, 2009
Corporate Fixed-Income Bonds & Notes (continued)
| | | | | | |
| | | | | Par ($) (a) | | Value ($) |
| Technology – 1.8% | | | | | | |
| Computers – 0.1% | | | | | | |
| Sungard Data Systems, Inc. | | 9.125% 08/15/13 | | 525,000 | | 456,750 |
| | |
| | Computers Total | | | | 456,750 |
| | |
| Semiconductors – 0.1% | | | | |
| Amkor Technology, Inc. | | 9.250% 06/01/16 | | 275,000 | | 211,750 |
| | | |
| Freescale Semiconductor, Inc. | | 12.500% 12/15/14 | | 193,738 | | 77,957 |
| | |
| | Semiconductors Total | | | | 289,707 |
| | |
| Software – 1.6% | | | | |
| Oracle Corp. | | 5.000% 01/15/11 (g) | | 2,200,000 | | 2,306,460 |
| | | |
| | 6.500% 04/15/38 (g) | | 4,860,000 | | 4,847,248 |
| | |
| | Software Total | | | | 7,153,708 |
| | | | | | |
| Technology Total | | | | 7,900,165 |
| | | | | | |
| Utilities – 10.3% | | | | |
| Electric – 9.0% | | | | |
| AES Corp. | | 7.750% 03/01/14 | | 155,000 | | 138,725 |
| | 8.000% 10/15/17 | | 415,000 | | 355,863 |
| | | |
| Alabama Power Co. | | 1.439% 08/25/09 (d) | | 2,540,000 | | 2,506,500 |
| | | |
| American Electric Power Co., Inc. | | 5.250% 06/01/15 | | 1,825,000 | | 1,707,353 |
| | | |
| CMS Energy Corp. | | 6.875% 12/15/15 | | 305,000 | | 282,421 |
| | | |
| Commonwealth Edison Co. | | 5.900% 03/15/36 | | 690,000 | | 565,040 |
| | 5.950% 08/15/16 | | 1,515,000 | | 1,450,817 |
| | 6.150% 09/15/17 | | 2,100,000 | | 1,995,680 |
| | 6.950% 07/15/18 | | 2,710,000 | | 2,536,332 |
| | | |
| Consolidated Edison Co. of New York, Inc. | | 6.750% 04/01/38 | | 3,585,000 | | 3,509,159 |
| | | |
| Dominion Resources Inc. | | 8.875% 01/15/19 | | 2,000,000 | | 2,264,190 |
| | | |
| Dynegy Holdings, Inc. | | 7.125% 05/15/18 | | 735,000 | | 389,550 |
| | | |
| Edison Mission Energy | | 7.000% 05/15/17 | | 380,000 | | 277,400 |
| | | |
| Energy Future Holdings Corp. | | PIK,
11.250% 11/01/17 | | 1,040,000 | | 390,650 |
| | | |
| Exelon Generation Co. LLC | | 6.200% 10/01/17 | | 1,000,000 | | 894,182 |
| | | |
| FPL Energy American Wind LLC | | 6.639% 06/20/23 (c) | | 1,029,143 | | 891,711 |
| | | |
| FPL Energy National Wind LLC | | 5.608% 03/10/24 (c) | | 180,994 | | 147,402 |
| | | |
| Intergen NV | | 9.000% 06/30/17 (c) | | 640,000 | | 579,200 |
See Accompanying Notes to Financial Statements.
22
Columbia Income Fund
March 31, 2009
Corporate Fixed-Income Bonds & Notes (continued)
| | | | | | |
| | | | | Par ($) (a) | | Value ($) |
| Utilities (continued) | | | | |
| Ipalco Enterprises, Inc. | | 7.250% 04/01/16 (c) | | 330,000 | | 292,050 |
| | | |
| Kansas City Power & Light Co. | | 7.150% 04/01/19 | | 3,915,000 | | 3,932,704 |
| | | |
| MidAmerican Energy Holdings Co. | | 5.875% 10/01/12 | | 2,700,000 | | 2,803,073 |
| | | |
| Mirant Americas Generation LLC | | 8.500% 10/01/21 | | 685,000 | | 506,900 |
| | | |
| Mirant North America LLC | | 7.375% 12/31/13 | | 130,000 | | 117,650 |
| | | |
| NRG Energy, Inc. | | 7.375% 02/01/16 | | 630,000 | | 585,900 |
| | 7.375% 01/15/17 | | 60,000 | | 55,800 |
| | | |
| NSG Holdings LLC/NSG Holdings, Inc. | | 7.750% 12/15/25 (c) | | 290,000 | | 229,100 |
| | | |
| Oncor Electric Delivery Co. | | 5.950% 09/01/13 (c) | | 3,460,000 | | 3,352,076 |
| | 7.250% 01/15/33 | | 1,800,000 | | 1,662,422 |
| | | |
| Progress Energy, Inc. | | 7.100% 03/01/11 | | 2,360,000 | | 2,446,595 |
| | | |
| Southern Power Co. | | 6.375% 11/15/36 | | 600,000 | | 493,729 |
| | | |
| Tenaska Alabama II Partners LP | | 6.125% 03/30/23 (c) | | 1,004,334 | | 779,976 |
| | | |
| Texas Competitive Electric Holdings Co. LLC | | PIK,
10.500% 11/01/16 | | 1,295,000 | | 422,494 |
| | | |
| Windsor Financing LLC | | 5.881% 07/15/17 (c) | | 1,872,858 | | 1,655,924 |
| | |
| | Electric Total | | | | 40,218,568 |
| | | |
| Gas – 1.3% | | | | | | |
| Atmos Energy Corp. | | 6.350% 06/15/17 | | 1,585,000 | | 1,422,119 |
| | 8.500% 03/15/19 | | 2,145,000 | | 2,190,081 |
| | | |
| Centerpoint Energy, Inc. | | 5.950% 02/01/17 | | 65,000 | | 53,906 |
| | 6.500% 05/01/18 | | 115,000 | | 96,243 |
| | | |
| Nakilat, Inc. | | 6.067% 12/31/33 (c) | | 1,385,000 | | 936,980 |
| | | |
| Southern California Gas Co. | | 1.431% 12/01/09 (d) | | 1,055,000 | | 1,051,087 |
| | |
| | Gas Total | | | | 5,750,416 |
| | | | | | |
| Utilities Total | | | | | | 45,968,984 |
| | Total Corporate Fixed-Income Bonds & Notes
(cost of $463,632,796) | | | | 382,119,914 |
| | | | | | |
| Asset-Backed Securities – 6.4% | | | | |
| AmeriCredit Automobile Receivables Trust | | 3.930% 10/06/11 | | 1,194,342 | | 1,140,664 |
| | | |
| Bay View Auto Trust | | 4.550% 02/25/14 | | 245,744 | | 246,301 |
| | 5.310% 06/25/14 | | 1,110,000 | | 986,240 |
See Accompanying Notes to Financial Statements.
23
Columbia Income Fund
March 31, 2009
Asset-Backed Securities (continued)
| | | | | | |
| | | | | Par ($) (a) | | Value ($) |
| | | | | | | |
| Capital Auto Receivables Asset Trust | | 5.500% 04/20/10 (c) | | 1,250,000 | | 1,238,526 |
| | | |
| Capital One Auto Finance Trust | | 0.606% 12/15/11 (d) | | 1,101,730 | | 1,017,201 |
| | | |
| Citicorp Residential Mortgage Securities, Inc. | | 5.892% 03/25/37 (d) | | 3,300,000 | | 2,130,937 |
| | 6.080% 06/25/37 (d) | | 4,000,000 | | 3,001,454 |
| | | |
| Citigroup Mortgage Loan Trust, Inc. | | 5.517% 08/25/35 (d) | | 1,200,000 | | 117,126 |
| | 5.598% 03/25/36 (d) | | 953,838 | | 739,866 |
| | 5.666% 08/25/35 (d) | | 1,000,000 | | 61,666 |
| | | |
| Countrywide Asset-Backed Certificates | | 0.632% 06/25/21 (d)(f) | | 688,574 | | 571,517 |
| | | |
| Ford Credit Auto Owner Trust | | 5.470% 09/15/12 | | 4,000,000 | | 2,778,630 |
| | 5.680% 06/15/12 | | 1,500,000 | | 1,169,530 |
| | 5.690% 11/15/12 | | 3,000,000 | | 2,322,407 |
| | | |
| GE Equipment Small Ticket LLC | | 4.620% 12/22/14 (c) | | 126,629 | | 124,134 |
| | 5.120% 06/22/15 (c) | | 503,967 | | 467,643 |
| | | |
| Green Tree Financial Corp. | | 6.870% 01/15/29 | | 454,574 | | 352,845 |
| | | |
| GS Auto Loan Trust | | 4.980% 11/15/13 | | 114,483 | | 114,205 |
| | | |
| Harley-Davidson Motorcycle Trust | | 5.540% 04/15/15 | | 1,400,000 | | 634,777 |
| | | |
| Honda Auto Receivables Owner Trust | | 4.470% 01/18/12 | | 2,645,000 | | 2,677,319 |
| | | |
| JPMorgan Auto Receivables Trust | | 5.610% 12/15/14 (c) | | 1,482,086 | | 1,453,211 |
| | | |
| Residential Asset Mortgage Products, Inc. | | 4.120% 06/25/33 (d) | | 280,619 | | 147,953 |
| | | |
| Santander Drive Auto Receivables Trust | | 1.106% 06/15/11 (d) | | 31,454 | | 31,338 |
| | | |
| Small Business Administration Participation Certificates | | 5.570% 03/01/26 | | 925,113 | | 1,010,006 |
| | | |
| USAA Auto Owner Trust | | 4.280% 10/15/12 | | 2,000,000 | | 2,020,111 |
| | | |
| Wachovia Auto Loan Owner Trust | | 5.650% 02/20/13 | | 2,500,000 | | 1,070,554 |
| | | |
| WFS Financial Owner Trust | | 4.760% 05/17/13 | | 1,200,000 | | 820,770 |
| | |
| | Total Asset-Backed Securities
(cost of $38,228,734) | | | | 28,446,931 |
| | |
| Commercial Mortgage-Backed Securities – 3.4% | | | | |
| Bear Stearns Commercial Mortgage Securities | | 5.718% 09/11/38 (d) | | 3,750,000 | | 3,197,306 |
See Accompanying Notes to Financial Statements.
24
Columbia Income Fund
March 31, 2009
Commercial Mortgage-Backed Securities (continued)
| | | | | | |
| | | | | Par ($) (a) | | Value ($) |
| | | | | |
| GMAC Commercial Mortgage Securities, Inc. | | 5.486% 05/10/40 (d) | | 2,030,000 | | 1,959,893 |
| | | |
| Morgan Stanley Dean Witter Capital I | | 5.980% 01/15/39 | | 1,875,000 | | 1,829,255 |
| | | |
| Wachovia Bank Commercial Mortgage Trust | | 5.741% 05/15/43 (d) | | 11,425,000 | | 8,332,591 |
| | |
| | Total Commercial Mortgage-Backed Securities
(cost of $17,348,114) | | | | 15,319,045 |
| | |
| Government & Agency Obligations – 2.6% | | | | |
| | | | | | |
| Foreign Government Obligations – 0.2% | | | | |
| Federal Republic of Brazil | | 6.000% 01/17/17 | | 1,000,000 | | 997,500 |
| | | | | | |
| Foreign Government Obligations Total | | | | 997,500 |
| | | | | | |
| U.S. Government Obligations – 2.4% | | | | |
| U.S. Treasury Bonds | | 4.500% 05/15/38 (l) | | 1,895,000 | | 2,212,413 |
| | | |
| U.S. Treasury Notes | | 0.875% 02/28/11 | | 305,000 | | 305,583 |
| | 1.875% 02/28/14 (l) | | 3,545,000 | | 3,583,782 |
| | 2.750% 02/15/19 (l)(m) | | 4,635,000 | | 4,660,353 |
| | | | | | |
| U.S. Government Obligations Total | | | | | | 10,762,131 |
| | Total Government & Agency Obligations
(cost of $11,613,711) | | | | 11,759,631 |
| | |
| Mortgage-Backed Securities – 0.9% | | | | |
| Federal National Mortgage Association | | TBA,
4.500% 12/01/39 (n) | | 4,000,000 | | 4,087,500 |
| | | |
| Government National Mortgage Association | | 10.000% 10/15/17 | | 3,497 | | 3,835 |
| | 10.000% 01/15/19 | | 288 | | 316 |
| | 10.500% 01/15/16 | | 2,610 | | 2,913 |
| | 10.500% 04/15/20 | | 1,821 | | 2,032 |
| | 10.500% 05/15/20 | | 6,628 | | 7,397 |
| | 11.500% 05/15/13 | | 3,491 | | 3,924 |
| | 12.500% 11/15/10 | | 1,043 | | 1,102 |
| | 12.500% 10/15/13 | | 1,238 | | 1,352 |
| | 12.500% 11/15/13 | | 2,289 | | 2,612 |
| | 12.500% 12/15/13 | | 6,033 | | 6,884 |
| | 14.000% 08/15/11 | | 1,034 | | 1,151 |
| | |
| | Total Mortgage-Backed Securities
(cost of $4,068,379) | | | | 4,121,018 |
See Accompanying Notes to Financial Statements.
25
Columbia Income Fund
March 31, 2009
Collateralized Mortgage Obligations – 0.3%
| | | | | | |
| | | | | Par ($) (a) | | Value ($) |
| Non-Agency – 0.3% | | | | | | |
| Citicorp Mortgage Securities, Inc. | | 5.961% 05/25/37 (d) | | 1,467,594 | | 451,817 |
| | | |
| Countrywide Alternative Loan Trust | | 5.500% 09/25/35 | | 2,105,264 | | 164,997 |
| | | |
| First Horizon Alternative Mortgage Securities | | 5.977% 05/25/36 (d) | | 970,223 | | 25,780 |
| | | |
| Nomura Asset Acceptance Corp. | | 0.622% 08/25/36 (d) | | 204,800 | | 170,475 |
| | | |
| Sequoia Mortgage Trust | | 5.903% 07/20/37 (d) | | 1,162,070 | | 361,042 |
| | | |
| Wachovia Mortgage Loan Trust LLC | | 5.414% 05/20/36 (d) | | 495,222 | | 66,781 |
| | | | | | |
| Non-Agency Total | | | | | | 1,240,892 |
| | Total Collateralized Mortgage Obligations
(cost of $6,219,487) | | | | 1,240,892 |
| | | | | | |
Convertible Bonds – 0.1% | | | | | | |
| | | | | | |
| Communications – 0.0% | | | | | | |
| Telecommunication Services – 0.0% | | | | | | |
| Virgin Media, Inc. | | 6.500% 11/15/16 (c) | | 465,000 | | 249,937 |
| | |
| | Telecommunication Services Total | | | | 249,937 |
| | | | | | |
| Communications Total | | | | | | 249,937 |
| | | | | | |
| Financials – 0.1% | | | | | | |
| Diversified Financial Services – 0.1% | | | | |
| Countrywide Financial Corp. | | 0.000% 04/15/37 (c)(d)(j) | | 400,000 | | 389,438 |
| | |
| | Diversified Financial Services Total | | | | 389,438 |
| | | | | | |
| Financials Total | | | | | | 389,438 |
| | Total Convertible Bonds
(cost of $573,731) | | | | 639,375 |
| | | | | | |
Municipal Bond – 0.0% | | | | | | |
| | | | | | |
| Virginia – 0.0% | | | | | | |
| VA Tobacco Settlement Financing Corp. | | Series 2007 A1, 6.706% 06/01/46 | | 420,000 | | 206,812 |
| | | | | | |
| Virginia Total | | | | | | 206,812 |
| | Total Municipal Bond
(cost of $419,964) | | | | 206,812 |
See Accompanying Notes to Financial Statements.
26
Columbia Income Fund
March 31, 2009
Warrants – 0.0%
| | | | | | | |
| | | | | Shares | | Value ($) | |
| Financials – 0.0% | | | | | | | |
| CNB Capital Trust I | | Expires 03/23/19 (c)(f)(o) | | 8,101 | | 81 | |
| | | | | | | |
| Financials Total | | | | | | 81 | |
| | Total Warrants
(cost of $81) | | | | 81 | |
| | | | | | | |
Preferred Stock – 0.0% | | | | | | | |
| | | | | | | |
| Communications – 0.0% | | | | | | | |
| CMP Susquehanna Radio Holdings | | Series A (f) | | 7,089 | | 71 | |
| | | | | | | |
| Communications Total | | | | | | 71 | |
| | Total Preferred Stock
(cost of $71) | | | | 71 | |
| | |
| Securities Lending Collateral – 1.8% | | | | | |
| | State Street Navigator Securities Lending Prime Portfolio (p) (7 day yield of 0.943%) | | 7,833,688 | | 7,833,688 | |
| | | |
| | Total Securities Lending Collateral
(cost of $7,833,688) | | | | 7,833,688 | |
| | | |
| | | | | Par ($) | | | |
| Short-Term Obligation – 0.6% | | | | | | | |
| | Repurchase agreement with Fixed Income Clearing Corp., dated 03/31/09, due 04/01/09 at 0.140%, collateralized by a U.S. Government Agency Obligation maturing 02/24/11, market value $2,545,425 (repurchase proceeds $2,494,010) | | 2,494,000 | | 2,494,000 | |
| | | |
| | Total Short-Term Obligation (cost of $2,494,000) | | | | 2,494,000 | |
| |
| | | |
| | Total Investments – 101.6%
(cost of $552,432,756) (q) | | | | 454,181,458 | |
| |
| | | |
| | Obligation to Return Collateral for Securities Loaned – (1.8)% | | (7,833,688 | ) |
| |
| | | |
| | Other Assets & Liabilities, Net – 0.2% | | | | 969,493 | |
| |
| | | |
| | Net Assets – 100.0% | | | | 447,317,263 | |
Notes to Investment Portfolio:
On April 1, 2008, the Fund adopted Statement of Financial Accounting Standards No. 157, Fair Value Measurements (“SFAS 157”). SFAS 157 establishes a hierarchy that prioritizes the inputs to valuation techniques used to measure fair value giving the highest priority to unadjusted quoted prices in active markets for identical securities (level 1 measurements) and the lowest priority to unobservable inputs (level 3 measurements) when market prices are not readily available or reliable. The three levels of the fair value hierarchy under SFAS 157 are described below:
| | • | | Level 1 – quoted prices in active markets for identical securities |
| | • | | Level 2 – prices determined using other significant observable inputs (including quoted prices for similar securities, interest rates, prepayment speeds, credit risk and others) |
| | • | | Level 3 – prices determined using significant unobservable inputs. In situations where quoted prices or observable inputs are unavailable or less reliable, unobservable inputs may be used. Unobservable inputs may include management’s own assumptions about the factors market participants would use in pricing an investment. |
See Accompanying Notes to Financial Statements.
27
Columbia Income Fund
March 31, 2009
The inputs or methodology used for valuing securities are not necessarily an indication of the risk associated with investing in those securities.
The following table summarizes the inputs used, as of March 31, 2009 in valuing the Fund’s assets:
| | | | | | | |
Valuation Inputs | | Investments in
Securities | | Other Financial
Instruments* | |
Level 1 – Quoted Prices | | $ | 22,683,319 | | $ | 479,435 | |
Level 2 – Other Significant Observable Inputs | | | 428,197,727 | | | (555,753 | ) |
Level 3 – Significant Unobservable Inputs | | | 3,300,412 | | | — | |
| | | | | | | |
Total | | $ | 454,181,458 | | $ | (76,318 | ) |
| | | | | | | |
| | * | Other financial instruments consist of forward foreign currency exchange contracts, futures contracts and credit default swap contracts which are not included in the investment portfolio. |
The following table reconciles asset balances for the year ended March 31, 2009 in which significant unobservable inputs (Level 3) were used in determining value:
| | | | | | | |
| | | Investments
in Securities | | | Other Financial
Instruments |
Balance as of March 31, 2008 | | $ | 1,355,831 | | | $ | — |
Accretion of discounts/Amortization of Premiums | | | — | | | | — |
Realized loss | | | (29,534 | ) | | | — |
Change in unrealized depreciation | | | (837,457 | ) | | | — |
Net sales | | | (1,738,104 | ) | | | — |
Transfers in to and/or out of Level 3 | | | 4,549,676 | | | | — |
| | | | | | | |
Balance as of March 31, 2009 | | $ | 3,300,412 | | | $ | — |
| | | | | | | |
The change in unrealized losses attributable to securities owned at March 31, 2009 which were valued using significant unobservable inputs (Level 3) amounted to $837,457. This amount is included in net change in unrealized depreciation on the Statement of Changes in Net Assets.
The information in the above reconciliation represents fiscal year to date activity for any securities identified as using Level 3 inputs at either the beginning or the end of the current fiscal period.
| | (a) | Principal amount is stated in United States dollars unless otherwise noted. |
| | (b) | The issuer is in default of certain debt covenants. Income is not being accrued. At March 31, 2009, the value of these securities amounted to $126,592, which represents 0.0% of net assets. |
| | (c) | Security exempt from registration pursuant to Rule 144A under the Securities Act of 1933. These securities may be resold in transactions exempt from registration, normally to qualified institutional buyers. At March 31, 2009, these securities, which are not illiquid except for the following, amounted to $73,072,104, which represents 16.3% of net assets. |
| | | | | | | | | | |
Security | | Acquisition Date | | Par/Units | | Cost | | Value |
ACE Cash Express, Inc.
10.250% 10/01/14 | | 09/26/06 | | 220,000 | | $ | 222,025 | | $ | 55,000 |
Countrywide Financial Corp.
0.000% 04/15/37 | | 10/31/07 | | 400,000 | | | 357,420 | | | 389,438 |
Local TV Finance LLC, PIK
9.250% 06/15/15 | | 05/02/07 | | 230,000 | | | 234,463 | | | 16,735 |
Orascom Telecom Finance SCA
7.875% 02/08/14 | | 02/01/07 | | 220,000 | | | 220,000 | | | 140,800 |
Seminole Indian Tribe of Florida
7.804% 10/01/20 | | 09/26/07 | | 565,000 | | | 573,813 | | | 441,005 |
Systems 2001 Asset Trust
6.664% 09/15/13 | | 06/04/01 | | 461,132 | | | 461,132 | | | 419,796 |
| | | | | | | | | | |
| | | | | | | | | $ | 1,462,774 |
| | | | | | | | | | |
| | (d) | The interest rate shown on floating rate or variable rate securities reflects the rate at March 31, 2009. |
| | (e) | The issuer is in default of certain debt covenants. Income is being accrued. At March 31, 2009, the value of these securities amounted to $928,700, which represents 0.2% of net assets. |
| | (f) | Represents fair value as determined in good faith under procedures approved by the Board of Trustees. |
| | (g) | A portion of this security is pledged as collateral for credit default swaps. At March 31, 2009, the total market value of securities pledged amounted to $11,514,874. |
| | (h) | Loan participation agreement. |
| | (i) | Step bond. These securities are currently not paying a coupon. Shown parenthetically is the next interest rate to be paid and the date these securities will begin accruing at this rate. |
See Accompanying Notes to Financial Statements.
28
Columbia Income Fund
March 31, 2009
| | (j) | Investments in affiliates during the year ended March 31, 2009: |
Security name: Merrill Lynch & Co., Inc., 5.700%, 05/02/17
| | | |
Par as of 03/31/08: | | $ | 10,285,000 |
Par purchased: | | $ | — |
Par sold: | | $ | — |
Par as of 03/31/09: | | $ | 10,285,000 |
Net realized gain (loss): | | $ | — |
Interest income earned: | | $ | 586,245 |
Value at end of period: | | $ | 6,089,892 |
Security name: Merrill Lynch & Co., Inc., 6.050%, 08/15/12
| | | |
Par as of 03/31/08: | | $ | 670,000 |
Par purchased: | | $ | — |
Par sold: | | $ | — |
Par as of 03/31/09: | | $ | 670,000 |
Net realized gain (loss): | | $ | — |
Interest income earned: | | $ | 40,535 |
Value at end of period: | | $ | 574,898 |
Security name: Merrill Lynch & Co., Inc., 7.750%, 05/14/38
| | | | |
Par as of 03/31/08: | | $ | — | |
Par purchased: | | $ | 3,580,000 | |
Par sold: | | $ | (945,000 | ) |
Par as of 03/31/09: | | $ | 2,635,000 | |
Net realized gain (loss): | | $ | (8,156 | ) |
Interest income earned: | | $ | 180,838 | |
Value at end of period: | | $ | 1,564,199 | |
Security name: Countrywide Financial Corp., 0.000%, 04/15/37
| | | |
Par as of 03/31/08: | | $ | 400,000 |
Par purchased: | | $ | — |
Par sold: | | $ | — |
Par as of 03/31/09: | | $ | 400,000 |
Net realized gain (loss): | | $ | — |
Interest income earned: | | $ | 1,466 |
Value at end of period: | | $ | 389,438 |
| | | As of 01/01/2009, Merrill Lynch & Co., Inc. is a wholly owned subsidiary of Bank of America Corporation and an affiliate of Columbia Management. |
| | (k) | The issuer has filed for bankruptcy protection under Chapter 11 and is in default of certain debt covenants. Income is not being accrued. At March 31, 2009, the value of these securities amounted to $1,106,062, which represents 0.2% of net assets. |
| | (l) | All or a portion of this security was on loan at March 31, 2009. The total market value of securities on loan at March 31, 2009 is $7,723,464. |
| | (m) | A portion of this security is pledged as collateral for open futures contracts. At March 31, 2009, the total market value of this security pledged amounted to $1,005,470. |
| | (n) | Security purchased on a delayed delivery basis. |
| | (o) | Non-income producing security. |
| | (p) | Investment made with cash collateral received from securities lending activity. |
| | (q) | Cost for federal income tax purposes is $553,501,701. |
At March 31, 2009, the Fund had entered into the following forward foreign currency exchange contract:
| | | | | | | | | | | | |
Forward Foreign Currency
Exchange Contract to Sell | | Value | | Aggregate
Face Value | | Settlement
Date | | Unrealized
Depreciation | |
EUR | | $ | 152,781 | | $ | 150,052 | | 04/23/09 | | $ | (2,729 | ) |
| | | | | | | | | | | | |
At March 31, 2009, the Fund held the following open long futures contracts:
| | | | | | | | | | | | | |
Type | | Number of
Contracts | | Value | | Aggregate
Face Value | | Expiration
Date | | Unrealized
Appreciation |
5 Year U.S. Treasury Notes | | 250 | | $ | 29,691,406 | | $ | 29,270,344 | | June-2009 | | $ | 421,062 |
10 Year U.S. Treasury Notes | | 20 | | | 2,481,563 | | | 2,423,190 | | June-2009 | | | 58,373 |
| | | | | | | | | | | | | |
| | | | | | | | | | | | $ | 479,435 |
| | | | | | | | | | | | | |
See Accompanying Notes to Financial Statements.
29
Columbia Income Fund
March 31, 2009
At March 31, 2009, the Fund had entered into the following credit default swap contracts:
| | | | | | | | | | | | | | | | |
Swap
Counterparty | | Referenced
Obligation | | Receive
Buy/Sell
Protection | | Fixed
Rate | | | Expiration
Date | | Notional
Amount | | Value of
Contract | |
| | Limited Brands, Inc. | | | | | | | | | | | | | | |
Morgan Stanley | | 6.125% 12/01/12 | | Buy | | 5.270 | % | | 12/20/13 | | $ | 5,500,000 | | $ | (117,165 | ) |
| | The Home Depot , Inc. | | | | | | | | | | | | | | |
Morgan Stanley | | 5.875 12/16/36 | | Buy | | 3.350 | % | | 12/20/13 | | | 3,000,000 | | | (199,427 | ) |
| | Macy’s, Inc. | | | | | | | | | | | | | | |
JPMorgan | | 7.450% 07/15/17 | | Buy | | 3.600 | % | | 12/20/13 | | | 4,775,000 | | | 495,870 | |
| | Limited Brands, Inc. | | | | | | | | | | | | | | |
Barclays Capital | | 6.125% 12/01/12 | | Buy | | 6.150 | % | | 03/20/14 | | | 5,500,000 | | | (316,432 | ) |
| | The Home Depot, Inc. | | | | | | | | | | | | | | |
Barclays Capital | | 5.875% 12/16/36 | | Buy | | 2.930 | % | | 12/20/13 | | | 8,020,000 | | | (388,470 | ) |
| | Time Warner, Inc. | | | | | | | | | | | | | | |
Barclays Capital | | 5.875% 11/15/16 | | Buy | | 1.200 | % | | 03/20/14 | | | 5,000,000 | | | (27,400 | ) |
| | | | | | | | | | | | | | | | |
| | | | | | | | | | | | | | $ | (553,024 | ) |
| | | | | | | | | | | | | | | | |
At March 31, 2009, the asset allocation of the Fund is as follows:
| | | |
Asset Allocation (Unaudited) | | % of Net Assets | |
Corporate Fixed-Income Bonds & Notes | | 85.5 | |
Asset-Backed Securities | | 6.4 | |
Commercial Mortgage-Backed Securities | | 3.4 | |
Government & Agency Obligations | | 2.6 | |
Mortgage-Backed Securities | | 0.9 | |
Collateralized Mortgage Obligations | | 0.3 | |
Convertible Bonds | | 0.1 | |
Municipal Bond | | 0.0 | * |
Warrants | | 0.0 | * |
Preferred Stock | | 0.0 | * |
| | | |
| | 99.2 | |
Securities Lending Collateral | | 1.8 | |
Short-Term Obligation | | 0.6 | |
Obligation to Return Collateral for Securities Loaned | | (1.8 | ) |
Other Assets & Liabilities, Net | | 0.2 | |
| | | |
| | 100.0 | |
| | | |
* Represents less than 0.1%
| | |
Acronym | | Name |
| EUR | | Euro |
| PIK | | Payment-In-Kind |
| TBA | | To Be Announced |
See Accompanying Notes to Financial Statements.
30
Statement of Assets and Liabilities – Columbia Income Fund
March 31, 2009
| | | | | |
| | | | | ($) | |
| Assets | | Unaffiliated investments, at identified cost | | 538,642,933 | |
| | Affiliated investments, at identified cost | | 13,789,823 | |
| | | | | |
| | Total investments, at identified cost | | 552,432,756 | |
| | |
| | Unaffiliated investments, at value | | 445,563,031 | |
| | Affiliated investments, at value | | 8,618,427 | |
| | | | | |
| | Total investments, at value (including securities on loan of $7,723,464) | | 454,181,458 | |
| | Cash | | 80,715 | |
| | Cash collateral for open credit default swap contracts | | 960,000 | |
| | Open credit default swap contracts | | 495,870 | |
| | Receivable for: | | | |
| | Investments sold | | 3,741,851 | |
| | Fund shares sold | | 319,801 | |
| | Interest | | 8,131,752 | |
| | Futures variation margin | | 74,609 | |
| | Securities lending | | 2,303 | |
| | Trustees’ deferred compensation plan | | 31,187 | |
| | Other assets | | 88,122 | |
| | | |
| | Total Assets | | 468,107,668 | |
| | |
| Liabilities | | Collateral on securities loaned | | 7,833,688 | |
| | Open credit default swap contracts | | 1,048,894 | |
| | Unrealized depreciation on forward foreign currency exchange contracts | | 2,729 | |
| | Expense reimbursement due to investment advisor | | 1,348 | |
| | Payable for: | | | |
| | Investments purchased | | 5,322,282 | |
| | Investments purchased on a delayed delivery basis | | 4,044,125 | |
| | Fund shares repurchased | | 797,006 | |
| | Distributions | | 1,256,011 | |
| | Investment advisory fee | | 157,893 | |
| | Administration fee | | 49,115 | |
| | Transfer agent fee | | 121,903 | |
| | Pricing and bookkeeping fees | | 19,328 | |
| | Trustees’ fees | | 942 | |
| | Custody fee | | 5,365 | |
| | Distribution and service fees | | 28,967 | |
| | Chief compliance officer expenses | | 222 | |
| | Trustees’ deferred compensation plan | | 31,187 | |
| | Other liabilities | | 69,400 | |
| | | |
| | Total Liabilities | | 20,790,405 | |
| |
| | | |
| | Net Assets | | 447,317,263 | |
| | |
| Net Assets Consist of | | Paid-in capital | | 595,403,343 | |
| | Overdistributed net investment income | | (118,929 | ) |
| | Accumulated net realized loss | | (49,135,356 | ) |
| | Net unrealized appreciation (depreciation) on: | | | |
| | Investments | | (98,251,298 | ) |
| | Foreign currency translations | | (2,612 | ) |
| | Futures contracts | | 479,435 | |
| | Credit default swap contracts | | (1,057,320 | ) |
| |
| | | |
| | Net Assets | | 447,317,263 | |
See Accompanying Notes to Financial Statements.
31
Statement of Assets and Liabilities (continued) – Columbia Income Fund
March 31, 2009
| | | | | | |
| | | | | | |
| Class A | | Net assets | | $ | 71,289,736 | |
| | Shares outstanding | | | 9,365,279 | |
| | Net asset value per share | | $ | 7.61 | (a) |
| | Maximum sales charge | | | 4.75 | % |
| | Maximum offering price per share ($7.61/0.9525) | | $ | 7.99 | (b) |
| | |
| Class B | | Net assets | | $ | 7,705,301 | |
| | Shares outstanding | | | 1,012,235 | |
| | Net asset value and offering price per share | | $ | 7.61 | (a) |
| | |
| Class C | | Net assets | | $ | 9,974,095 | |
| | Shares outstanding | | | 1,310,291 | |
| | Net asset value and offering price per share | | $ | 7.61 | (a) |
| | |
| Class Z | | Net assets | | $ | 358,348,131 | |
| | Shares outstanding | | | 47,075,796 | |
| | Net asset value, offering and redemption price per share | | $ | 7.61 | |
| (a) | Redemption price per share is equal to net asset value less any applicable contingent deferred sales charge. |
| (b) | On sales of $50,000 or more the offering price is reduced. |
See Accompanying Notes to Financial Statements.
32
Statement of Operations – Columbia Income Fund
For the Year Ended March 31, 2009
| | | | | |
| | | | | ($) | |
| Investment Income | | Interest | | 35,100,810 | |
| | Interest from affiliates | | 809,084 | |
| | Dollar roll fee income | | 287,917 | |
| | Securities lending | | 178,119 | |
| | Dividends | | 2,056 | |
| | | |
| | Total Investment Income | | 36,377,986 | |
| | |
| Expenses | | Investment advisory fee | | 2,165,208 | |
| | Administration fee | | 675,654 | |
| | Distribution fee: | | | |
| | Class B | | 80,800 | |
| | Class C | | 87,319 | |
| | Service fee: | | | |
| | Class A | | 217,695 | |
| | Class B | | 26,933 | |
| | Class C | | 29,109 | |
| | Transfer agent fee | | 732,382 | |
| | Pricing and bookkeeping fees | | 156,839 | |
| | Trustees’ fees | | 31,262 | |
| | Custody fee | | 28,793 | |
| | Chief compliance officer expenses | | 830 | |
| | Other expenses | | 250,121 | |
| | | |
| | Expenses before interest expense | | 4,482,945 | |
| | Interest expense | | 6,009 | |
| | | |
| | Total Expenses | | 4,488,954 | |
| | |
| | Fees waived by distributor – Class C | | (17,457 | ) |
| | Expense reductions | | (5,959 | ) |
| | | |
| | Net Expenses | | 4,465,538 | |
| |
| | | |
| | Net Investment Income | | 31,912,448 | |
| | | | | |
| | |
| Net Realized and Unrealized Gain (Loss) on Investments, Futures Contracts, Credit Default Swap Contracts and Foreign Currency | | Net realized gain (loss) on: | | | |
| | Unaffiliated investments | | (29,443,344 | ) |
| | Affiliated investments | | (8,156 | ) |
| | Foreign currency transactions and forward foreign currency exchange contracts | | 69,060 | |
| | Futures contracts | | (199,867 | ) |
| | Credit default swap contracts | | 5,168,741 | |
| | | |
| | Net realized loss | | (24,413,566 | ) |
| | |
| | Net change in unrealized appreciation (depreciation) on: | | | |
| | Investments | | (66,346,987 | ) |
| | Foreign currency translations and forward foreign currency exchange contracts | | 15,220 | |
| | Futures contracts | | 1,239,701 | |
| | Credit default swap contracts | | (515,582 | ) |
| | | |
| | Net change in unrealized appreciation (depreciation) | | (65,607,648 | ) |
| | | |
| | Net Loss | | (90,021,214 | ) |
| |
| | | |
| | Net Decrease Resulting from Operations | | (58,108,766 | ) |
See Accompanying Notes to Financial Statements.
33
Statement of Changes in Net Assets – Columbia Income Fund
| | | | | | | | |
| | | | | Year Ended March 31, | |
| Increase (Decrease) in Net Assets | | | | 2009 ($) | | | 2008 ($) | |
| Operations | | Net investment income | | 31,912,448 | | | 37,690,392 | |
| | Net realized loss on investments, futures contracts, credit default swap contracts, foreign currency transactions and forward foreign currency exchange contracts | | (24,413,566 | ) | | (6,847,177 | ) |
| | Net change in unrealized appreciation (depreciation) on investments, futures contracts, credit default swap contracts, foreign currency translations and forward foreign currency exchange contracts | | (65,607,648 | ) | | (37,362,054 | ) |
| | | |
| | Net Decrease resulting from Operations | | (58,108,766 | ) | | (6,518,839 | ) |
| | | |
| Distributions to Shareholders | | From net investment income: | | | | | | |
| | Class A | | (5,169,722 | ) | | (6,625,348 | ) |
| | Class B | | (556,058 | ) | | (814,800 | ) |
| | Class C | | (622,081 | ) | | (777,396 | ) |
| | Class Z | | (25,490,177 | ) | | (29,885,664 | ) |
| | | |
| | Total Distributions to Shareholders | | (31,838,038 | ) | | (38,103,208 | ) |
| | Net Capital Stock Transactions | | (78,349,180 | ) | | (8,897,009 | ) |
| | | |
| | Total Decrease in Net Assets | | (168,295,984 | ) | | (53,519,056 | ) |
| | | |
| Net Assets | | Beginning of period | | 615,613,247 | | | 669,132,303 | |
| | End of period | | 447,317,263 | | | 615,613,247 | |
| | Overdistibuted net investment income at end of period | | (118,929 | ) | | (923,418 | ) |
| | | |
See Accompanying Notes to Financial Statements.
34
Statement of Changes in Net Assets (continued) – Capital Stock Activity
| | | | | | | | | | | | | | |
| | | Columbia Income Fund | |
| | | Year Ended
March 31, 2009 | | | | | Year Ended
March 31, 2008 | |
| | | Shares | | | Dollars ($) | | | | | Shares | | | Dollars ($) | |
Class A | | | | | | | | | | | | | | |
Subscriptions | | 1,672,484 | | | 13,725,492 | | | | | 3,044,325 | | | 28,766,291 | |
Distributions reinvested | | 499,154 | | | 4,101,884 | | | | | 546,374 | | | 5,132,017 | |
Redemptions | | (4,756,912 | ) | | (39,543,987 | ) | | | | (4,374,899 | ) | | (40,939,933 | ) |
| | | | | | | | | | | | | | |
Net decrease | | (2,585,274 | ) | | (21,716,611 | ) | | | | (784,200 | ) | | (7,041,625 | ) |
| | | | | |
Class B | | | | | | | | | | | | | | |
Subscriptions | | 133,478 | | | 1,086,874 | | | | | 284,100 | | | 2,678,095 | |
Distributions reinvested | | 46,038 | | | 379,391 | | | | | 60,948 | | | 572,916 | |
Redemptions | | (744,251 | ) | | (6,164,399 | ) | | | | (844,118 | ) | | (7,935,596 | ) |
| | | | | | | | | | | | | | |
Net decrease | | (564,735 | ) | | (4,698,134 | ) | | | | (499,070 | ) | | (4,684,585 | ) |
| | | | | |
Class C | | | | | | | | | | | | | | |
Subscriptions | | 295,094 | | | 2,413,848 | | | | | 445,193 | | | 4,197,472 | |
Distributions reinvested | | 51,655 | | | 424,724 | | | | | 57,921 | | | 543,977 | |
Redemptions | | (637,660 | ) | | (5,300,043 | ) | | | | (622,181 | ) | | (5,848,281 | ) |
| | | | | | | | | | | | | | |
Net decrease | | (290,911 | ) | | (2,461,471 | ) | | | | (119,067 | ) | | (1,106,832 | ) |
| | | | | |
Class Z | | | | | | | | | | | | | | |
Subscriptions | | 15,447,889 | | | 121,886,461 | | | | | 14,600,212 | | | 138,115,929 | |
Distributions reinvested | | 1,315,745 | | | 10,754,554 | | | | | 1,255,010 | | | 11,785,891 | |
Redemptions | | (22,493,647 | ) | | (182,113,979 | ) | | | | (15,611,513 | ) | | (145,965,787 | ) |
| | | | | | | | | | | | | | |
Net increase (decrease) | | (5,730,013 | ) | | (49,472,964 | ) | | | | 243,709 | | | 3,936,033 | |
See Accompanying Notes to Financial Statements.
35
Financial Highlights – Columbia Income Fund
Selected data for a share outstanding throughout each period is as follows:
| | | | | | | | | | | | | | | | | | | | |
| | | Year Ended March 31, | |
| Class A Shares | | 2009 | | | 2008 | | | 2007 | | | 2006 | | | 2005 | |
Net Asset Value, Beginning of Period | | $ | 9.06 | | | $ | 9.68 | | | $ | 9.62 | | | $ | 9.89 | | | $ | 10.21 | |
| | | | | |
Income from Investment Operations: | | | | | | | | | | | | | | | | | | | | |
Net investment income (a) | | | 0.50 | | | | 0.51 | | | | 0.49 | | | | 0.45 | | | | 0.47 | |
Net realized and unrealized gain (loss) on investments, foreign currency, futures contracts and credit default swap contracts | | | (1.45 | ) | | | (0.62 | ) | | | 0.08 | | | | (0.21 | ) | | | (0.27 | ) |
| | | | | | | | | | | | | | | | | | | | |
Total from investment operations | | | (0.95 | ) | | | (0.11 | ) | | | 0.57 | | | | 0.24 | | | | 0.20 | |
| | | | | |
Less Distributions to Shareholders: | | | | | | | | | | | | | | | | | | | | |
From net investment income | | | (0.50 | ) | | | (0.51 | ) | | | (0.51 | ) | | | (0.51 | ) | | | (0.52 | ) |
| | | | | |
Net Asset Value, End of Period | | $ | 7.61 | | | $ | 9.06 | | | $ | 9.68 | | | $ | 9.62 | | | $ | 9.89 | |
Total return (b) | | | (10.77 | )% | | | (1.15 | )% | | | 6.04 | %(c) | | | 2.39 | % | | | 2.00 | % |
| | | | | |
Ratios to Average Net Assets/Supplemental Data: | | | | | | | | | | | | | | | | | | | | |
Net expenses before interest expense (d) | | | 1.03 | % | | | 1.00 | % | | | 0.97 | % | | | 1.01 | % | | | 0.97 | % |
Interest expense | | | — | %(e) | | | — | %(e) | | | — | | | | — | | | | — | |
Net expenses (d) | | | 1.03 | % | | | 1.00 | % | | | 0.97 | % | | | 1.01 | % | | | 0.97 | % |
Net investment income (d) | | | 5.95 | % | | | 5.41 | % | | | 5.13 | % | | | 4.57 | % | | | 4.66 | % |
Portfolio turnover rate | | | 147 | % | | | 193 | % | | | 142 | % | | | 147 | % | | | 36 | % |
Net assets, end of period (000’s) | | $ | 71,290 | | | $ | 108,294 | | | $ | 123,330 | | | $ | 100,295 | | | $ | 96,568 | |
| (a) | Per share data was calculated using the average shares outstanding during the period. |
| (b) | Total return at net asset value assuming all distributions reinvested and no initial sales charge or contingent deferred sales charge. |
| (c) | Total return includes a voluntary reimbursement by the investment advisor for a realized investment loss due to a trading error. This reimbursement increased total return and net asset value per share by less than 0.01% and less than $0.01, respectively. |
| (d) | The benefits derived from expense reductions had an impact of less than 0.01%. |
| (e) | Rounds to less than 0.01%. |
See Accompanying Notes to Financial Statements.
36
Financial Highlights – Columbia Income Fund
Selected data for a share outstanding throughout each period is as follows:
| | | | | | | | | | | | | | | | | | | | |
| | | Year Ended March 31, | |
| Class B Shares | | 2009 | | | 2008 | | | 2007 | | | 2006 | | | 2005 | |
Net Asset Value, Beginning of Period | | $ | 9.06 | | | $ | 9.68 | | | $ | 9.62 | | | $ | 9.89 | | | $ | 10.21 | |
| | | | | |
Income from Investment Operations: | | | | | | | | | | | | | | | | | | | | |
Net investment income (a) | | | 0.43 | | | | 0.44 | | | | 0.42 | | | | 0.38 | | | | 0.39 | |
Net realized and unrealized gain (loss) on investments, foreign currency, futures contracts and credit default swap contracts | | | (1.45 | ) | | | (0.62 | ) | | | 0.07 | | | | (0.22 | ) | | | (0.27 | ) |
| | | | | | | | | | | | | | | | | | | | |
Total from investment operations | | | (1.02 | ) | | | (0.18 | ) | | | 0.49 | | | | 0.16 | | | | 0.12 | |
| | | | | |
Less Distributions to Shareholders: | | | | | | | | | | | | | | | | | | | | |
From net investment income | | | (0.43 | ) | | | (0.44 | ) | | | (0.43 | ) | | | (0.43 | ) | | | (0.44 | ) |
| | | | | |
Net Asset Value, End of Period | | $ | 7.61 | | | $ | 9.06 | | | $ | 9.68 | | | $ | 9.62 | | | $ | 9.89 | |
Total return (b) | | | (11.44 | )% | | | (1.88 | )% | | | 5.26 | %(c) | | | 1.63 | % | | | 1.25 | % |
Ratios to Average Net Assets/Supplemental Data: | | | | | | | | | | | | | | | | | | | | |
Net expenses before interest expense (d) | | | 1.78 | % | | | 1.75 | % | | | 1.72 | % | | | 1.76 | % | | | 1.72 | % |
Interest expense | | | — | %(e) | | | — | %(e) | | | — | | | | — | | | | — | |
Net expenses (d) | | | 1.78 | % | | | 1.75 | % | | | 1.72 | % | | | 1.76 | % | | | 1.72 | % |
Net investment income (d) | | | 5.17 | % | | | 4.67 | % | | | 4.38 | % | | | 3.83 | % | | | 3.91 | % |
Portfolio turnover rate | | | 147 | % | | | 193 | % | | | 142 | % | | | 147 | % | | | 36 | % |
Net assets, end of period (000’s) | | $ | 7,705 | | | $ | 14,290 | | | $ | 20,105 | | | $ | 23,649 | | | $ | 25,375 | |
| (a) | Per share data was calculated using the average shares outstanding during the period. |
| (b) | Total return at net asset value assuming all distributions reinvested and no contingent deferred sales charge. |
| (c) | Total return includes a voluntary reimbursement by the investment advisor for a realized investment loss due to a trading error. This reimbursement increased total return and net asset value per share by less than 0.01% and less than $0.01, respectively. |
| (d) | The benefits derived from expense reductions had an impact of less than 0.01%. |
| (e) | Rounds to less than 0.01%. |
See Accompanying Notes to Financial Statements.
37
Financial Highlights – Columbia Income Fund
Selected data for a share outstanding throughout each period is as follows:
| | | | | | | | | | | | | | | | | | | | |
| | | Year Ended March 31, | |
| Class C Shares | | 2009 | | | 2008 | | | 2007 | | | 2006 | | | 2005 | |
Net Asset Value, Beginning of Period | | $ | 9.06 | | | $ | 9.68 | | | $ | 9.62 | | | $ | 9.89 | | | $ | 10.21 | |
| | | | | |
Income from Investment Operations: | | | | | | | | | | | | | | | | | | | | |
Net investment income (a) | | | 0.45 | | | | 0.45 | | | | 0.44 | | | | 0.39 | | | | 0.41 | |
Net realized and unrealized gain (loss) on investments, foreign currency, futures contracts and credit default swap contracts | | | (1.45 | ) | | | (0.61 | ) | | | 0.07 | | | | (0.21 | ) | | | (0.27 | ) |
| | | | | | | | | | | | | | | | | | | | |
Total from investment operations | | | (1.00 | ) | | | (0.16 | ) | | | 0.51 | | | | 0.18 | | | | 0.14 | |
| | | | | |
Less Distributions to Shareholders: | | | | | | | | | | | | | | | | | | | | |
From net investment income | | | (0.45 | ) | | | (0.46 | ) | | | (0.45 | ) | | | (0.45 | ) | | | (0.46 | ) |
| | | | | |
Net Asset Value, End of Period | | $ | 7.61 | | | $ | 9.06 | | | $ | 9.68 | | | $ | 9.62 | | | $ | 9.89 | |
Total return (b)(c) | | | (11.31 | )% | | | (1.74 | )% | | | 5.41 | %(d) | | | 1.78 | % | | | 1.40 | % |
| | | | | |
Ratios to Average Net Assets/Supplemental Data: | | | | | | | | | | | | | | | | | | | | |
Net expenses before interest expense (e) | | | 1.63 | % | | | 1.60 | % | | | 1.57 | % | | | 1.61 | % | | | 1.57 | % |
Interest expense | | | — | %(f) | | | — | %(f) | | | — | | | | — | | | | — | |
Net expenses (e) | | | 1.63 | % | | | 1.60 | % | | | 1.57 | % | | | 1.61 | % | | | 1.57 | % |
Waiver/Reimbursement | | | 0.15 | % | | | 0.15 | % | | | 0.15 | % | | | 0.15 | % | | | 0.15 | % |
Net investment income (e) | | | 5.35 | % | | | 4.81 | % | | | 4.52 | % | | | 3.96 | % | | | 4.06 | % |
Portfolio turnover rate | | | 147 | % | | | 193 | % | | | 142 | % | | | 147 | % | | | 36 | % |
Net assets, end of period (000’s) | | $ | 9,974 | | | $ | 14,510 | | | $ | 16,660 | | | $ | 13,042 | | | $ | 10,895 | |
| (a) | Per share data was calculated using the average shares outstanding during the period. |
| (b) | Total return at net asset value assuming all distributions reinvested and no contingent deferred sales charge. |
| (c) | Had the investment adviser and/or its affiliates not waived fees or reimbursed a portion of expenses, total return would have been reduced. |
| (d) | Total return includes a voluntary reimbursement by the investment advisor for a realized investment loss due to a trading error. This reimbursement increased total return and net asset value per share by less than 0.01% and less than $0.01, respectively. |
| (e) | The benefits derived from expense reductions had an impact of less than 0.01%. |
| (f) | Rounds to less than 0.01%. |
See Accompanying Notes to Financial Statements.
38
Financial Highlights – Columbia Income Fund
Selected data for a share outstanding throughout each period is as follows:
| | | | | | | | | | | | | | | | | | | | |
| | | Year Ended March 31, | |
| Class Z Shares | | 2009 | | | 2008 | | | 2007 | | | 2006 | | | 2005 | |
Net Asset Value, Beginning of Period | | $ | 9.06 | | | $ | 9.68 | | | $ | 9.62 | | | $ | 9.89 | | | $ | 10.21 | |
| | | | | |
Income from Investment Operations: | | | | | | | | | | | | | | | | | | | | |
Net investment income (a) | | | 0.52 | | | | 0.53 | | | | 0.52 | | | | 0.48 | | | | 0.49 | |
Net realized and unrealized gain (loss) on investments, foreign currency, futures contracts and credit default swap contracts | | | (1.45 | ) | | | (0.61 | ) | | | 0.07 | | | | (0.22 | ) | | | (0.26 | ) |
| | | | | | | | | | | | | | | | | | | | |
Total from investment operations | | | (0.93 | ) | | | (0.08 | ) | | | 0.59 | | | | 0.26 | | | | 0.23 | |
| | | | | |
Less Distributions to Shareholders: | | | | | | | | | | | | | | | | | | | | |
From net investment income | | | (0.52 | ) | | | (0.54 | ) | | | (0.53 | ) | | | (0.53 | ) | | | (0.55 | ) |
| | | | | |
Net Asset Value, End of Period | | $ | 7.61 | | | $ | 9.06 | | | $ | 9.68 | | | $ | 9.62 | | | $ | 9.89 | |
Total return (b) | | | (10.55 | )% | | | (0.90 | )% | | | 6.31 | %(c) | | | 2.64 | % | | | 2.33 | % |
| | | | | |
Ratios to Average Net Assets/
Supplemental Data: | | | | | | | | | | | | | | | | | | | | |
Net expenses before interest expense (d) | | | 0.78 | % | | | 0.75 | % | | | 0.72 | % | | | 0.76 | % | | | 0.72 | % |
Interest expense | | | — | %(e) | | | — | %(e) | | | — | | | | — | | | | — | |
Net expenses (d) | | | 0.78 | % | | | 0.75 | % | | | 0.72 | % | | | 0.76 | % | | | 0.72 | % |
Net investment income (d) | | | 6.22 | % | | | 5.66 | % | | | 5.39 | % | | | 4.82 | % | | | 4.91 | % |
Portfolio turnover rate | | | 147 | % | | | 193 | % | | | 142 | % | | | 147 | % | | | 36 | % |
Net assets, end of period (000’s) | | $ | 358,348 | | | $ | 478,519 | | | $ | 509,037 | | | $ | 351,529 | | | $ | 533,965 | |
| (a) | Per share data was calculated using the average shares outstanding during the period. |
| (b) | Total return at net asset value assuming all distributions reinvested. |
| (c) | Total return includes a voluntary reimbursement by the investment advisor for a realized investment loss due to a trading error. This reimbursement increased total return and net asset value per share by less than 0.01% and less than $0.01, respectively. |
| (d) | The benefits derived from expense reductions had an impact of less than 0.01%. |
| (e) | Rounds to less than 0.01%. |
See Accompanying Notes to Financial Statements.
39
Notes to Financial Statements – Columbia Income Fund
March 31, 2009
Note 1. Organization
Columbia Income Fund (the “Fund”), a series of Columbia Funds Series Trust I (the “Trust”), is a diversified portfolio. The Trust is a Massachusetts business trust registered under the Investment Company Act of 1940, as amended (the “1940 Act”), as an open-end management investment company.
Investment Objective
The Fund seeks total return, consisting primarily of current income and secondarily of capital appreciation.
Fund Shares
The Trust may issue an unlimited number of shares, and the Fund offers four classes of shares: Class A, Class B, Class C and Class Z. Each share class has its own expense structure and sales charges, as applicable. Beginning on or about June 22, 2009, the Fund will no longer accept investment in Class B shares from new or existing investors in the Fund’s Class B shares, except in connection with the reinvestment of any dividend and/or capital gain distributions in Class B shares of the Fund and exchanges by existing Class B shareholders of the other Columbia Funds.
Class A shares are subject to a maximum front-end sales charge of 4.75% based on the amount of initial investment. Class A shares purchased without an initial sales charge in accounts aggregating $1 million to $50 million at the time of purchase are subject to a 1.00% contingent deferred sales charge (“CDSC”) if the shares are sold within one year after purchase. Class B shares are subject to a maximum CDSC of 5.00% based upon the holding period after purchase. Class B shares will convert to Class A shares eight years after purchase. Class C shares are subject to a 1.00% CDSC on shares sold within one year after purchase. Class Z shares are offered continuously at net asset value. There are certain restrictions on the purchase of Class Z shares, as described in the Fund’s prospectus.
Note 2. Significant Accounting Policies
The preparation of financial statements in accordance with accounting principles generally accepted in the United States of America (“GAAP”) requires management to make certain estimates and assumptions that affect the reported amounts of assets and liabilities, the disclosure of contingent assets and liabilities at the date of the financial statements and the reported amounts of revenue and expenses during the reporting period. Actual results could differ from those estimates. The following is a summary of significant accounting policies consistently followed by the Fund in the preparation of its financial statements.
Security Valuation
Debt securities generally are valued by pricing services approved by the Trust’s Board of Trustees, based upon market transactions for normal, institutional-size trading units of similar securities. The services may use various pricing techniques which take into account appropriate factors such as yield, quality, coupon rate, maturity, type of issue, trading characteristics and other data, as well as broker quotes. Debt securities for which quotations are readily available are valued at an over-the-counter or exchange bid quotation.
Certain debt securities, which tend to be more thinly traded and of lesser quality, are priced based on fundamental analysis of the financial condition of the issuer and the estimated value of any collateral. Valuations developed through pricing techniques may vary from the actual amounts realized upon sale of the securities, and the potential variation may be greater for those securities valued using fundamental analysis.
Equity securities are valued at the last sale price on the principal exchange on which they trade, except for securities traded on the NASDAQ, which are valued at the NASDAQ official close price. Unlisted securities or listed securities for which there were no sales during the day are valued at the closing bid price on such exchanges or over-the-counter markets.
Short-term investments maturing in 60 days or less are valued at amortized cost, which approximates market value.
Futures contracts are valued at the settlement price established each day by the board of trade or exchange on which they are traded.
Forward foreign currency exchange contracts are valued at the prevailing forward exchange rate of the underlying currencies.
Credit default swap contracts are marked to market daily based upon quotations from market makers. Quotations obtained from independent pricing services use information provided by market makers.
40
Columbia Income Fund
March 31, 2009
Foreign securities are generally valued at the last sale price on the foreign exchange or market on which they trade. If any foreign share prices are not readily available as a result of limited share activity, the securities are valued at the last sale price of the local shares in the principal market in which such securities are normally traded.
Generally, trading in foreign securities is substantially completed each day at various times prior to the close of the New York Stock Exchange (“NYSE”). The values of such securities used in computing the net asset value of the Fund’s shares are determined as of such times. Foreign currency exchange rates are generally determined at 4:00 p.m. Eastern (U.S.) time. Occasionally, events affecting the values of such foreign securities and such exchange rates may occur between the times at which they are determined and the close of the customary trading session of the NYSE, which would not be reflected in the computation of the Fund’s net asset value. If events materially affecting the values of such foreign securities occur and it is determined that market quotations are not reliable, then these foreign securities will be valued at their fair value using procedures approved by the Board of Trustees.
Investments for which market quotations are not readily available, or that have quotations which management believes are not reliable, are valued at fair value as determined in good faith under consistently applied procedures established by and under the general supervision of the Board of Trustees. If a security is valued at fair value, such value is likely to be different from the last quoted market price for the security. The determination of fair value often requires significant judgment. To determine fair value, management may use assumptions including but not limited to future cash flows and estimated risk premiums. Multiple inputs from various sources may be used to determine value.
Security Transactions
Security transactions are accounted for on the trade date. Cost is determined and gains (losses) are based upon the specific identification method for both financial statement and federal income tax purposes.
In March 2008, Statement of Financial Accounting Standards No. 161, Disclosures about Derivative Instruments and Hedging Activities-an amendment of FASB Statement No. 133 (“SFAS 161”), was issued. SFAS 161 is effective for fiscal years and interim periods beginning after November 15, 2008. SFAS 161 requires additional discussion about the reporting entity’s derivative instruments and hedging activities, by providing for qualitative disclosures about the objectives and strategies for using derivatives, quantitative data about the fair value of and gains and losses on derivative contracts, and details of credit-risk-related contingent features in their derivative contracts. Management is evaluating the impact the application of SFAS 161 will have on the Fund’s financial statement disclosures.
Futures Contracts
The Fund may invest in futures contracts for both hedging and non-hedging purposes, including, for example, to seek to enhance returns or as a substitute for a position in an underlying asset.
The use of futures contracts involves certain risks, which include: (1) imperfect correlation between the price movement of the instruments and the underlying securities, (2) inability to close out positions due to differing trading hours, or the temporary absence of a liquid market, for either the instruments or the underlying securities, or (3) an inaccurate prediction of the future direction of interest rates by Columbia Management Advisors, LLC (“Columbia”), the Fund’s investment advisor. Any of these risks may involve amounts exceeding the variation margin recorded in the Fund’s Statement of Assets and Liabilities at any given time.
Upon entering into a futures contract, the Fund pledges cash or securities with the broker in an amount sufficient to meet the initial margin requirement. Subsequent payments are made or received by the Fund equal to the daily change in the contract value and are recorded as variation margin receivable or payable and offset in unrealized gains or losses. The Fund recognizes a realized gain or loss when the contract is closed or expires.
Forward Foreign Currency Exchange Contracts
Forward foreign currency exchange contracts are agreements to exchange one currency for another at a future date at a specified price. These contracts are used to minimize the exposure to foreign exchange rate fluctuations during the period between trade and settlement date of the contract. The Fund may utilize forward foreign currency exchange
41
Columbia Income Fund
March 31, 2009
contracts in connection with the settlement of purchases and sales of securities. The Fund may also enter into these contracts to hedge certain other foreign currency denominated assets. Contracts to buy generally are used to acquire exposure to foreign currencies, while contracts to sell are generally used to hedge the Fund’s investments against currency fluctuations. Forward foreign currency exchange contracts are valued daily at the current exchange rate of the underlying currency, resulting in unrealized gains (losses) which become realized at the time the forward foreign currency exchange contracts are closed or mature. Realized and unrealized gains (losses) arising from such transactions are included in net realized and unrealized gains (losses) on foreign currency transactions. The use of forward foreign currency exchange contracts does not eliminate fluctuations in the prices of the Fund’s portfolio securities. While the maximum potential loss from such contracts is the aggregate face value in U.S. dollars at the time the contract was opened, exposure is typically limited to the change in value of the contract (in U.S. dollars) over the period it remains open. The Fund could also be exposed to risk that counterparties of the contracts may be unable to fulfill the terms of the contracts.
Repurchase Agreements
The Fund may engage in repurchase agreement transactions with institutions that Columbia has determined are creditworthy. The Fund, through its custodian, receives delivery of the underlying securities collateralizing a repurchase agreement. Columbia is responsible for determining that the collateral is at least equal, at all times, to the value of the repurchase obligation including interest. A repurchase agreement transaction involves certain risks in the event of default or insolvency of the counterparty. These risks include possible delays in or restrictions on the Fund’s ability to dispose of the underlying securities and a possible decline in the value of the underlying securities during the period while the Fund seeks to assert its rights.
Mortgage Dollar Roll Transactions
The Fund may enter into mortgage “dollar rolls” in which the Fund sells securities for delivery in the current month and simultaneously contracts with the same counterparty to repurchase similar (same type, coupon and maturity) but not identical securities on a specified future date not exceeding 120 days. During the roll period, the Fund loses the right to receive principal and interest paid on the securities sold. However, the Fund would benefit to the extent of any difference between the price received for the securities sold and the lower forward price for the future purchase (often referred to as the “drop”) or fee income plus the interest earned on the cash proceeds of the securities sold until the settlement date of the forward purchase. Unless such benefits exceed the income, capital appreciation and gain or loss due to mortgage prepayments that would have been realized on the securities sold as part of the mortgage dollar roll, the use of this technique will diminish the investment performance of the Fund compared with what such performance would have been without the use of mortgage dollar rolls. All cash proceeds will be invested in instruments that are permissible investments for the Fund. The Fund will hold and maintain in a segregated account until the settlement date, cash or liquid securities in an amount equal to the forward purchase price.
The Fund’s policy is to record the components of mortgage dollar rolls using “to be announced” mortgage-backed securities. For financial reporting and tax purposes, the Fund treats mortgage dollar rolls as two separate transactions, one involving the purchase of a security and a separate transaction involving a sale. The Fund does not currently enter into mortgage dollar rolls that are accounted for as financing transactions.
Mortgage dollar rolls involve certain risks. If the broker-dealer to whom the Fund sells the securities becomes insolvent, the Fund’s right to purchase or repurchase the mortgage-related securities may be restricted and the instruments which the Fund is required to repurchase may be worth less than instruments which the Fund originally held. Successful use of mortgage dollar rolls may depend upon the investment advisor’s ability to predict correctly interest rates and mortgage prepayments. For these reasons, there is no assurance that mortgage dollar rolls can be successfully employed.
Delayed Delivery Securities
The Fund may trade securities on other than normal settlement terms, including securities purchased or sold on a “when-issued” basis. This may increase the risk if the other party to the transaction fails to deliver and causes the Fund to subsequently invest at less advantageous prices. The Fund holds until the settlement date, in a segregated account, cash or liquid securities in an amount equal to the delayed delivery commitment.
42
Columbia Income Fund
March 31, 2009
Credit Default Swaps
The Fund may engage in credit default swap transactions for hedging purposes or to seek to increase total return. Credit default swaps are agreements in which one party pays fixed periodic payments to a counterparty in consideration for a guarantee from the counterparty to make a specific payment should a negative credit event take place. The Fund may receive an upfront payment as the protection seller or make an upfront payment as the protection buyer.
If the Fund is a seller of protection and a credit event occurs, as defined under the terms of that particular swap agreement, the Fund will either (i) pay to the buyer of protection an amount equal to the notional amount of the swap and take delivery of the referenced obligation or underlying securities comprising the referenced index or (ii) pay a net settlement amount in the form of cash or securities equal to the notional amount of the swap less the recovery value of the referenced obligation or underlying securities comprising the referenced index. Recovery values are assumed by market makers considering either industry standard recovery rates or entity specific factors and considerations until a credit event occurs. If a credit event has occurred, the recovery value is determined by a facilitated auction whereby a minimum number of allowable broker bids, together with a specified valuation method, are used to calculate the settlement value.
If the Fund is a buyer of protection and a credit event occurs, as defined under the terms of that particular swap agreement, the Fund will either (i) receive from the seller of protection an amount equal to the notional amount of the swap and deliver the referenced obligation or underlying securities compromising the referenced index or (ii) receive a net settlement amount in the form of cash or securities equal to the notional amount of the swap less the recovery value of the referenced obligation or underlying securities compromising the referenced index.
Credit default swaps are marked to market daily based on quotations from market makers and any change is recorded as unrealized appreciation/depreciation on the Fund’s Statement of Assets and Liabilities. Periodic payments received or made are recorded as a realized gain or loss and premiums received or made are amortized on the Statement of Operations.
Short Sales
The Fund may sell securities or commodity futures contracts it does not own in anticipation of a decline in the fair value of that security or futures contract. When a Fund sells a security or futures contract short, it must borrow the security or futures contract sold short and deliver it to the broker-dealer through which it made the short sale. A gain, limited to the price at which the Fund sold the security or futures contract short, or a loss, unlimited in size, will be recognized upon the termination of the short sale.
Foreign Currency Transactions and Translations
The values of all assets and liabilities quoted in foreign currencies are translated into U.S. dollars at that day’s exchange rates. Net realized and unrealized gains (losses) on foreign currency transactions and translations include gains (losses) arising from the fluctuation in exchange rates between trade and settlement dates on securities transactions, gains (losses) arising from the disposition of foreign currency and currency gains (losses) between the accrual and payment dates on dividends, interest income and foreign withholding taxes.
For financial statement purposes, the Fund does not distinguish that portion of gains (losses) on investments which is due to changes in foreign exchange rates from that which is due to changes in market prices of the investments. Such fluctuations are included with the net realized and unrealized gains (losses) on investments on the Statement of Operations.
Income Recognition
Interest income is recorded on an accrual basis and includes accretion of discounts, amortization of premiums and paydown gains and losses. Fee income attributable to mortgage dollar roll transactions is recorded on the accrual basis over the term of the transaction. The value of additional securities received as an income payment is recorded as income and as the cost basis of such securities. Corporate actions and dividend income are recorded on the ex-date.
Expenses
General expenses of the Trust are allocated to the Fund and other series of the Trust based upon relative net assets or other expense allocation methodologies determined by the
43
Columbia Income Fund
March 31, 2009
nature of the expense. Expenses directly attributable to the Fund are charged to the Fund.
Determination of Class Net Asset Value
All income, expenses (other than class-specific expenses, as shown on the Statement of Operations) and realized and unrealized gains (losses) are allocated to each class of the Fund on a daily basis for purposes of determining the net asset value of each class. Income and expenses are allocated to each class based on the settled shares method, while realized and unrealized gains (losses) are allocated based on the relative net assets of each class.
Federal Income Tax Status
The Fund intends to qualify each year as a “regulated investment company” under Subchapter M of the Internal Revenue Code, as amended, and will distribute substantially all of its tax exempt or taxable income, if any, for its tax year, and as such will not be subject to federal income taxes. In addition, the Fund intends to distribute in each calendar year substantially all of its net investment income, capital gains and certain other amounts, if any, such that the Fund should not be subject to federal excise tax. Therefore, no federal income or excise tax provision is recorded.
Distributions to Shareholders
Distributions from net investment income are declared daily and paid monthly. Net realized capital gains, if any, are distributed at least annually. Income distributions and capital gain distributions are determined in accordance with federal income tax regulations which may differ from GAAP.
Indemnification
In the normal course of business, the Fund enters into contracts that contain a variety of representations and warranties and which provide general indemnities. The Fund’s maximum exposure under these arrangements is unknown because this would involve future claims against the Fund. Also, under the Trust’s organizational documents and by contract, the Trustees and officers of the Trust are indemnified against certain liabilities that may arise out of actions relating to their duties to the Trust. However, based on experience, the Fund expects the risk of loss due to these representations, warranties and indemnities to be minimal.
Note 3. Federal Tax Information
The timing and character of income and capital gain distributions are determined in accordance with income tax regulations, which may differ from GAAP. Reclassifications are made to the Fund’s capital accounts for permanent tax differences to reflect income and gains available for distribution (or available capital loss carryforwards) under income tax regulations.
For the year ended March 31, 2009, permanent book and tax differences resulting primarily from differing treatments for discount accretion/premium amortization on debt securities, paydown gain/loss reclass, expired capital loss carryforwards, market discount reclassifications and Section 988 currency reclasses were identified and reclassified among the components of the Fund’s net assets as follows:
| | | | |
| |
Overdistributed Net Investment
Income | | Accumulated Net Realized
Loss | | Paid-In Capital |
| $730,079 | | $7,889,962 | | $(8,620,041) |
Net investment income and net realized gains (losses), as disclosed on the Statement of Operations, and net assets were not affected by this reclassification.
The tax character of distributions paid during the years ended March 31, 2009 and March 31, 2008 was as follows:
| | | | | | |
| | | March 31, 2009 | | March 31, 2008 |
| Distributions paid from: | | |
Ordinary Income* | | $ | 31,838,038 | | $ | 38,103,208 |
Long-Term Capital Gains | | | — | | | — |
| * | For tax purposes short-term capital gain distributions, if any, are considered ordinary income distributions. |
As of March 31, 2009, the components of distributable earnings on a tax basis were as follows:
| | | | | |
| |
Undistributed
Ordinary Income | | Undistributed Long-Term Capital Gains | | Net Unrealized Depreciation* |
| $2,193,965 | | $ | — | | $(99,320,243) |
| * | The differences between book-basis and tax-basis net unrealized depreciation are primarily due to deferral of losses from wash sales. |
44
Columbia Income Fund
March 31, 2009
Unrealized appreciation and depreciation at March 31, 2009, based on cost of investments for federal income tax purposes were:
| | | | |
| | |
Unrealized appreciation | | $ | 6,838,209 | |
Unrealized depreciation | | | (106,158,452 | ) |
Net unrealized depreciation | | $ | (99,320,243 | ) |
The following capital loss carryforwards determined as of March 31, 2009, may be available to reduce taxable income arising from future net realized gains on investments, if any, to the extent permitted by the Internal Revenue Code:
| | | |
| |
| Year of Expiration | | Capital Loss Carryforward |
| 2010 | | $ | 1,393,345 |
| 2011 | | | 2,985,140 |
| 2014 | | | 3,731,648 |
| 2015 | | | 6,709,359 |
| 2016 | | | 4,172,850 |
| 2017 | | | 15,893,321 |
| | | |
| Total | | $ | 34,885,663 |
Capital loss carryforwards of $8,620,038 expired during the year ended March 31, 2009. Any capital loss carryforwards acquired as part of a merger that are permanently lost due to provisions under the Internal Revenue Code are included as being expired. Expired capital loss carryforwards are recorded as a reduction of paid-in capital.
Under current tax rules, certain capital losses realized after October 31 may be deferred and treated as occurring on the first day of the following fiscal year. As of March 31, 2009, post-October capital losses of $13,392,575 attributed to security transactions were deferred to April 1, 2009.
Under Financial Accounting Standards Board (“FASB”) Interpretation No. 48, Accounting for Uncertainty in Income Taxes — an Interpretation of FASB Statement No. 109 (“FIN 48”), management determines whether a tax position of the Fund is more likely than not to be sustained upon examination by the applicable taxing authority, including resolution of any related appeals or litigation processes, based on the technical merits of the position. The tax benefit to be recognized is measured as the largest amount of benefit that is greater than fifty percent likely of being realized upon ultimate settlement. Management has evaluated the known implications of FIN 48 on its computation of net assets for the Fund. As a result of this evaluation, management has concluded that FIN 48 did not have any effect on the Fund’s financial statements. However, management’s conclusions regarding FIN 48 may be subject to review and adjustment at a later date based on factors including, but not limited to, further implementation guidance from the FASB, new tax laws, regulations, and administrative interpretations (including relevant court decisions). The Fund’s federal tax returns for the prior three fiscal years remain subject to examination by the Internal Revenue Service. The Fund is not aware of any tax positions for which it is reasonably possible that the total amounts of unrecognized tax benefits will significantly change in the next twelve months.
Note 4. Fees and Compensation Paid to Affiliates
Investment Advisory Fee
Columbia, an indirect, wholly owned subsidiary of Bank of America Corporation (“BOA”) provides investment advisory services to the Fund. In rendering investment advisory service to the Fund, Columbia may use the portfolio management and research services of Columbia Management Pte. Ltd., an affiliate of Columbia. Columbia receives a monthly investment advisory fee based on the Fund’s average daily net assets at the following annual rates:
| | | |
| | |
| Average Daily Net Assets | | Annual Fee Rate | |
First $500 million | | 0.420 | % |
$500 million to $1 billion | | 0.375 | % |
$1 billion to $1.5 billion | | 0.370 | % |
$1.5 billion to $3 billion | | 0.340 | % |
$3 billion to $6 billion | | 0.330 | % |
Over $6 billion | | 0.320 | % |
For the year ended March 31, 2009, the Fund’s effective investment advisory fee rate was 0.42% of the Fund’s average daily net assets.
Administration Fee
Columbia provides administrative and other services to the Fund for a monthly administration fee based on the Fund’s average daily net assets at the following annual rates:
45
Columbia Income Fund
March 31, 2009
| | | |
| | |
| Average Daily Net Assets | | Annual Fee Rate | |
First $100 million | | 0.150 | % |
$100 million to $1 billion | | 0.125 | % |
Over $1 billion | | 0.100 | % |
For the year ended March 31, 2009, the Fund’s effective administration fee rate was 0.13% of the Fund’s average daily net assets.
Pricing and Bookkeeping Fees
The Fund has entered into a Financial Reporting Services Agreement (the “Financial Reporting Services Agreement”) with State Street Bank and Trust Company (“State Street”) and Columbia pursuant to which State Street provides financial reporting services to the Fund. The Fund has also entered into an Accounting Services Agreement (collectively with the Financial Reporting Services Agreement, the “State Street Agreements”) with State Street and Columbia pursuant to which State Street provides accounting services to the Fund. Under the State Street Agreements, the Fund pays State Street an annual fee of $38,000 paid monthly plus an additional monthly fee based on an annualized percentage rate of average daily net assets of the Fund for the month. The aggregate fee will not exceed $140,000 per year (exclusive of out-of-pocket expenses and charges). The Fund also reimburses State Street for certain out-of-pocket expenses and charges.
The Fund has entered into a Pricing and Bookkeeping Oversight and Services Agreement (the “Services Agreement”) with Columbia. Under the Services Agreement, Columbia provides services related to Fund expenses and the requirements of the Sarbanes-Oxley Act of 2002, and provides oversight of the accounting and financial reporting services provided by State Street. Under the Services Agreement, the Fund reimburses Columbia for out-of-pocket expenses.
Transfer Agent Fee
Columbia Management Services, Inc. (the “Transfer Agent”), an affiliate of Columbia and an indirect, wholly owned subsidiary of BOA, provides shareholder services to the Fund and has contracted with Boston Financial Data Services (“BFDS”) to serve as sub-transfer agent. The Transfer Agent is entitled to receive a fee for its services, paid monthly, at the annual rate of $17.34 per open account plus reimbursement of certain sub-transfer agent fees paid by the Transfer Agent (exclusive of BFDS fees), calculated based on assets held in omnibus accounts and intended to recover the cost of payments to other parties (including affiliates of BOA) for services to those accounts. The Transfer Agent pays the fees of BFDS for services as sub-transfer agent and is not entitled to reimbursement for such fees from the Fund.
The Transfer Agent may also retain, as additional compensation for its services, fees for wire, telephone and redemption orders, Individual Retirement Account (“IRA”) trustee agent fees and account transcript fees due to the Transfer Agent from shareholders of the Fund and credits (net of bank charges) earned with respect to balances in accounts the Transfer Agent maintains in connection with its services to the Fund. The Transfer Agent also receives reimbursement for certain out-of-pocket expenses.
An annual minimum account balance fee of $20 may apply to certain accounts with a value below the Fund’s initial minimum investment requirements to reduce the impact of small accounts on transfer agent fees. These minimum account balance fees are recorded as part of expense reductions on the Statement of Operations. For the year ended March 31, 2009, these minimum account balance fees reduced total expenses by $3,816.
Underwriting Discounts, Service and Distribution Fees
Columbia Management Distributors, Inc. (the “Distributor”), an affiliate of Columbia and an indirect, wholly owned subsidiary of BOA, is the principal underwriter of the Fund’s shares. For the year ended March 31, 2009, the Distributor has retained net underwriting discounts of $4,822 on sales of the Fund’s Class A shares and received net CDSC fees of $37, $19,621 and $1,809 on Class A, Class B and Class C share redemptions, respectively.
The Fund has adopted plans pursuant to Rule 12b-1 under the 1940 Act (the “Plans”) which require the payment of a monthly service fee to the Distributor at the maximum annual rate of 0.25% of the average daily net assets attributable to Class A, Class B and Class C shares of the Fund. The Plans also requires the payment of a monthly distribution fee to the Distributor at the maximum annual rate of 0.75% of the average daily net assets attributable to Class B and Class C shares only. The Distributor has voluntarily agreed to waive a
46
Columbia Income Fund
March 31, 2009
portion of the Fund’s distribution and service fees for the Class C shares so that the combined fee will not exceed 0.85% annually of Class C average daily net assets. This arrangement may be modified or terminated by the Distributor at any time.
The CDSC and the distribution fees received from the Plans are used principally as repayment to the Distributor for amounts paid by the Distributor to dealers who sold such shares.
Fee Waivers and Expense Reimbursements
Effective January 1, 2009, Columbia has voluntarily agreed to reimburse a portion of the Fund’s expenses so that the Fund’s ordinary operating expenses (excluding any distribution and service fees, brokerage commissions, interest, taxes and extraordinary expenses, but including custodian charges relating to overdrafts, if any), after giving effect to any balance credits from the Fund’s custodian, do not exceed 0.70% of the Fund’s average daily net assets on an annualized basis. Columbia, in its discretion, may revise or discontinue this arrangement at any time.
Fees Paid to Officers and Trustees
All officers of the Fund are employees of Columbia or its affiliates and, with the exception of the Fund’s Chief Compliance Officer, receive no compensation from the Fund. The Board of Trustees has appointed a Chief Compliance Officer to the Fund in accordance with federal securities regulations. The Fund, along with other affiliated funds, pays its pro-rata share of the expenses associated with the Chief Compliance Officer. The Fund’s expenses for the Chief Compliance Officer will not exceed $15,000 per year.
The Trust’s eligible Trustees may participate in a deferred compensation plan which may be terminated at any time. Obligations of the plan will be paid solely out of the Fund’s assets.
Note 5. Custody Credits
The Fund has an agreement with its custodian bank under which custody fees may be reduced by balance credits. These credits are recorded as part of expense reductions on the Statement of Operations. The Fund could have invested a portion of the assets utilized in connection with the expense offset arrangement in an income-producing asset if it had not entered into such an agreement.
For the year ended March 31, 2009, these custody credits reduced total expenses by $2,143 for the Fund.
Note 6. Portfolio Information
For the year ended March 31, 2009, the cost of purchases and proceeds from sales of securities, excluding short-term obligations, for the Fund were $752,560,392 and $775,332,652, respectively, of which $341,138,455 and $377,112,449, respectively, were U.S. Government securities.
Note 7. Line of Credit
The Fund and other affiliated funds participate in a $280,000,000 committed, unsecured revolving line of credit provided by State Street. The maximum amount that may be borrowed by any fund is limited to the lesser of $200,000,000 and the Fund’s borrowing limit set forth in the Fund’s registration statement. Borrowings are available for short-term liquidity or temporary or emergency purposes.
Interest is charged to each participating fund based on the fund’s borrowings at a rate per annum equal to the greater of the Federal Funds Rate plus 0.50% or the overnight LIBOR Rate plus 0.50%. In addition, an annual operations agency fee of $20,000, an amendment fee of 0.02% and a commitment fee of 0.12% per annum are accrued and apportioned among the participating funds pro rata based on their relative net assets. Prior to October 16, 2008, the Fund and other affiliated funds participated in a $350,000,000 committed, unsecured revolving line of credit and a $150,000,000 uncommitted, unsecured line of credit, both provided by State Street. Interest on the committed line of credit was charged to each participating fund based on the fund’s borrowings at a rate per annum equal to the Federal Funds Rate plus 0.50%. In addition, a commitment fee of 0.10% per annum was accrued and apportioned among the participating funds pro rata based on their relative net assets. Interest on the uncommitted line of credit was charged to each participating fund based on the fund’s borrowings at a rate per annum equal to the Federal Funds Rate plus 0.375%. State Street charged an annual operations agency fee of $40,000 for the committed line of credit and was able to charge an annual administration fee of $15,000 for the uncommitted line of credit. The commitment fee, the operations agency fee and the administration fee were accrued and apportioned among the participating funds pro rata based on their relative net assets.
47
Columbia Income Fund
March 31, 2009
For the year ended March 31, 2009, the average daily loan balance outstanding on days where borrowing existed was $3,217,857 at a weighted average interest rate of 1.212%
Note 8. Securities Lending
The Fund may lend its securities to certain approved brokers, dealers and other financial institutions. Each loan is collateralized by cash, in an amount at least equal to the market value of the securities loaned plus accrued income from the investment of collateral. The market value of the loaned securities is determined at the close of business of the Fund and any additional required collateral is delivered to the Fund on the next business day. The collateral received is invested and the income generated by the investment of the collateral, net of any fees remitted to State Street as the lending agent and borrower rebates, is paid to the Fund. Generally, in the event of borrower default, the Fund has the right to use the collateral to offset any losses incurred. In the event the Fund is delayed or prevented from exercising its right to dispose of the collateral, there may be a potential loss to the Fund. The Fund bears the risk of loss with respect to the investment of collateral.
Note 9. Shares of Beneficial Interest
As of March 31, 2009, 41.7% of the Fund’s shares outstanding were beneficially owned by one participant account over which BOA and/or any of its affiliates had either sole or joint investment discretion.
As of March 31, 2009, the Fund had two shareholders that collectively held 17.6% of the shares outstanding, over which BOA and/or any of its affiliates did not have investment discretion.
Subscription and redemption activity of these accounts may have a significant effect on the operations of the Fund.
Note 10. Significant Risks and Contingencies
Sector Focus Risk
The Fund may focus its investments in certain sectors, subjecting it to greater risk than a fund that is less focused.
High-Yield Securities Risk
Investing in high-yield securities may involve greater credit risk and considerations not typically associated with investing in U.S. Government bonds and other higher quality fixed income securities. These securities are non-investment grade securities, often referred to as “junk” bonds. Economic downturns may disrupt the high yield market and impair the ability of issuers to repay principal and interest. Also, an increase in interest rates would likely have an adverse impact on the value of such obligations. Moreover, high-yield securities may be less liquid to the extent that there is no established secondary market.
Asset-Backed Securities Risk
The value of asset-backed securities may be affected by, among other factors, changes in interest rates, the market’s assessment of the quality of underlying assets, the creditworthiness of the servicer for the underlying assets, factors concerning the interests in and structure of the issuer or the originator of the underlying assets, or the creditworthiness or rating of the entities that provide any supporting letters of credit, surety bonds, derivative instruments, or other credit enhancement. The value of asset-backed securities also will be affected by the exhaustion, termination or expiration of any credit enhancement. Most asset-backed securities are subject to prepayment risk, which is the possibility that the underlying debt may be refinanced or prepaid prior to maturity during periods of declining or low interest rates, causing the Fund to have to reinvest the money received in securities that have lower yields. In addition, the impact of prepayments on the value of asset-backed securities may be difficult to predict and may result in greater volatility.
Legal Proceedings
Columbia Management Advisors, LLC and Columbia Management Distributors, Inc. (collectively, the “Columbia Group”) are subject to a settlement agreement with the New York Attorney General (“NYAG”) (the “NYAG Settlement”) and a settlement order with the SEC (the “SEC Order”) on matters relating to mutual fund trading, each dated February 9, 2005. Under the terms of the SEC Order, the Columbia Group (or predecessor entities) agreed, among other things, to: pay disgorgement and civil money penalties collectively totaling $140 million; cease and desist from violations of the antifraud provisions and certain other provisions of the federal securities laws; maintain certain compliance and ethics oversight structures; and retain an independent consultant to review the Columbia Group’s applicable supervisory, compliance, control and other policies
48
Columbia Income Fund
March 31, 2009
and procedures. The NYAG Settlement, among other things, requires Columbia Management Advisors, LLC and its affiliates to reduce management fees for certain funds in the Columbia family of mutual funds in a projected total of $160 million over five years through November 30, 2009 and to make certain disclosures to investors relating to expenses. In connection with the Columbia Group providing services to the Columbia Funds, the Columbia Funds have voluntarily undertaken to implement certain governance measures designed to maintain the independence of their boards of trustees and certain special consulting and compliance measures.
Pursuant to the SEC Order and related procedures, the $140 million in settlement amounts described above has been substantially distributed in accordance with a distribution plan that was developed by an independent distribution consultant and approved by the SEC on April 6, 2007.
In connection with the events described above, various parties have filed suit against certain funds, the Trustees of the Columbia Funds, FleetBoston Financial Corporation and its affiliated entities and/or Bank of America and its affiliated entities.
On February 20, 2004, the Judicial Panel on Multidistrict Litigation transferred these cases and cases against other mutual fund companies based on similar allegations to the United States District Court in Maryland for consolidated or coordinated pretrial proceedings (the “MDL”). Subsequently, additional related cases were transferred to the MDL. On September 29, 2004, the plaintiffs in the MDL filed amended and consolidated complaints. One of these amended complaints is a putative class action that includes claims under the federal securities laws and state common law, and that names Columbia Management Advisors, Inc. (which has since merged into Banc of America Capital Management, LLC (now named Columbia Management Advisors, LLC)) (“Columbia”), Columbia Funds Distributor, Inc. (now named Columbia Management Distributors, Inc.) (the “Distributor”), the Trustees of the Columbia Funds, Bank of America Corporation and others as defendants. Another of the amended complaints is a derivative action purportedly on behalf of the Columbia Funds that asserts claims under federal securities laws and state common law.
On February 25, 2005, Columbia and other defendants filed motions to dismiss the claims in the pending cases. On March 1, 2006, for reasons stated in the court’s memoranda dated November 3, 2005, the United States District Court for the District of Maryland granted in part and denied in part the defendants’ motions to dismiss. The court dismissed all of the class action claims pending against the Columbia Funds Trusts. As to Columbia and the Distributor, the claims under the Securities Act of 1933, the claims under Sections 34(b) and 36(a) of the Investment Company Act of 1940 (“ICA”) and the state law claims were dismissed. The claims under Sections 10(b) and 20(a) of the Securities Exchange Act of 1934 and claims under Section 36(b) of the ICA were not dismissed.
On March 21, 2005, a purported class action was filed in Massachusetts state court alleging that certain conduct, including market timing, entitled Class B shareholders in certain Columbia Funds to an exemption from contingent deferred sales charges upon early redemption (the “CDSC Lawsuit”). The CDSC Lawsuit was removed to federal court in Massachusetts and transferred to the MDL.
On September 14, 2007, the plaintiffs and the Columbia defendants named in the MDL, including the Columbia Funds, entered into a stipulation of settlement with respect to all Columbia-related claims in the MDL described above, including the CDSC Lawsuit. The settlement is subject to court approval.
49
Report of Independent Registered Public Accounting Firm
To the Trustees of Columbia Funds Series Trust I and the Shareholders of Columbia Income Fund
In our opinion, the accompanying statement of assets and liabilities, including the investment portfolio, and the related statement of operations and of changes in net assets and the financial highlights present fairly, in all material respects, the financial position of Columbia Income Fund (the “Fund”) (a series of Columbia Funds Series Trust I) at March 31, 2009, and the results of its operations for the year then ended, the changes in its net assets for the two years in the period then ended and the financial highlights for the five years in the period then ended, in conformity with accounting principles generally accepted in the United States of America. These financial statements and financial highlights (hereafter referred to as “financial statements”) are the responsibility of the Fund’s management. Our responsibility is to express an opinion on these financial statements based on our audits. We conducted our audits of these financial statements in accordance with the standards of the Public Company Accounting Oversight Board (United States). Those standards require that we plan and perform the audit to obtain reasonable assurance about whether the financial statements are free of material misstatement. An audit includes examining, on a test basis, evidence supporting the amounts and disclosures in the financial statements, assessing the accounting principles used and significant estimates made by management, and evaluating the overall financial statement presentation. We believe that our audits, which included confirmation of securities at March 31, 2009 by correspondence with the custodian and brokers, provide a reasonable basis for our opinion.
PricewaterhouseCoopers LLP
Boston, Massachusetts
May 22, 2009
50
Fund Governance – Columbia Income Fund
The Trustees serve terms of indefinite duration. The names, addresses and ages of the Trustees and officers of the Funds in Columbia Funds Series Trust I, the year each was first elected or appointed to office, their principal business occupations during at least the last five years, the number of Funds overseen by each Trustee and other directorships they hold are shown below. Each officer listed below serves as an officer of each Fund in the Columbia Funds Complex.
Independent Trustees
| | |
Name, address and year of birth,
Position with funds, Year first
elected or appointed to office | | Principal occupation(s) during past five years, Number of funds in Columbia Funds
Complex overseen by trustee, Other directorships held |
| |
| John D. Collins (Born 1938) | | |
c/o Columbia Management Advisors, LLC One Financial Center Boston, MA 02111
Trustee (since 2007) | | Retired. Consultant, KPMG, LLP (accounting and tax firm) from July 1999 to June 2000; Partner, KPMG, LLP from March 1962 to June 1999. Oversees 79, Mrs. Fields Famous Brands LLC (consumer products); Suburban Propane Partners, L.P.; and Montpelier Re (underwriting firm) |
| |
| Rodman L. Drake (Born 1943) | | |
c/o Columbia Management Advisors, LLC One Financial Center Boston, MA 02111 Trustee (since 2007) | | Co-Founder of Baringo Capital LLC (private equity) since 2002; President, Continuation Investments Group, Inc. from 1997 to 2001. Oversees 79, Jackson Hewitt Tax Service Inc. (tax preparation services); Crystal Capital River Inc. (real estate investment trust); Student Loan Corporation (student loan provider); Celgene Corporation (global biotechnology company); Apex Silver Mines Ltd. (mining); and Hyperion Brookfield Total Return Fund, Inc. and Hyperion Brookfield Strategic Mortgage Income Fund, Inc. (exchange-traded funds) |
| |
| Douglas A. Hacker (Born 1955) | | |
c/o Columbia Management Advisors, LLC One Financial Center Boston, MA 02111 Trustee (since 1996) | | Independent business executive since May 2006; Executive Vice President–Strategy of United Airlines (airline) from December 2002 to May 2006; President of UAL Loyalty Services (airline marketing company) from September 2001 to December 2002; Executive Vice President and Chief Financial Officer of United Airlines from July 1999 to September 2001. Oversees 79, Nash Finch Company (food distributor); Aircastle Limited (aircraft leasing) |
|
| Janet Langford Kelly (Born 1957) |
c/o Columbia Management Advisors, LLC One Financial Center Boston, MA 02111 Trustee (since 1996) | | Senior Vice President, General Counsel and Corporate Secretary, ConocoPhillips (integrated energy company) since September 2007; Deputy General Counsel – Corporate Legal Services, ConocoPhillips from August 2006 to August 2007; Partner, Zelle, Hofmann, Voelbel, Mason & Gette LLP (law firm) from March 2005 to July 2006; Adjunct Professor of Law, Northwestern University, from September 2004 to June 2006; Director, UAL Corporation (airline) from February 2006 to July 2006. Oversees 79, None |
| |
| Charles R. Nelson (Born 1942) | | |
c/o Columbia Management Advisors, LLC One Financial Center Boston, MA 02111 Trustee (since 1981) | | Professor of Economics, University of Washington, since January 1976; Ford and Louisa Van Voorhis Professor of Political Economy, University of Washington, since September 1993; Director, Institute for Economic Research, University of Washington from September 2001 to June 2003; Adjunct Professor of Statistics, University of Washington, since September 1980; Associate Editor, Journal of Money Credit and Banking, since September 1993; Consultant on econometric and statistical matters. Oversees 79, None |
51
Fund Governance (continued) – Columbia Income Fund
Independent Trustees (continued)
| | |
Name, address and year of birth,
Position with funds, Year first
elected or appointed to office | | Principal occupation(s) during past five years, Number of funds in Columbia Funds
Complex overseen by trustee, Other directorships held |
| |
| John J. Neuhauser (Born 1943) | | |
c/o Columbia Management Advisors, LLC One Financial Center Boston, MA 02111 Trustee (since 1985) | | President, Saint Michael’s College, since August 2007; University Professor, Boston College from November 2005 to August 2007; Academic Vice President and Dean of Faculties, Boston College from August 1999 to October 2005. Oversees 79, Liberty All-Star Equity Fund and Liberty All-Star Growth Fund, Inc. (closed-end funds) |
| |
| Jonathan Piel (Born 1938) | | |
c/o Columbia Management Advisors, LLC One Financial Center Boston, MA 02111 Trustee (since 2007) | | Cable television producer and website designer; The Editor, Scientific American from 1984 to 1994; Vice President, Scientific American, Inc., from 1984 to 1994; Member, Advisory Board, Stone Age Institute, Bloomington, Indiana (research institute that explores the effect of technology on human evolution); Member, Board of Directors of the National Institute of Social Sciences, New York City; and Member, Board of Trustees of the William Alanson White Institute, New York City (institution for training psychoanalysts). Oversees 79, None |
| |
| Patrick J. Simpson (Born 1944) | | |
c/o Columbia Management Advisors, LLC
One Financial Center
Boston, MA 02111
Trustee (since 2000) | | Partner, Perkins Coie LLP (law firm). Oversees 79, None |
| |
| Thomas C. Theobald (Born 1937) | | |
c/o Columbia Management Advisors, LLC
One Financial Center
Boston, MA 02111
Trustee and Chairman of the Board (since 1996) | | Partner and Senior Advisor, Chicago Growth Partners (private equity investing) since September 2004; Managing Director, William Blair Capital Partners (private equity investing) from September 1994 to September 2004. Oversees 79, Anixter International (network support equipment distributor); Ventas, Inc. (real estate investment trust); Jones Lang LaSalle (real estate management services); Ambac Financial Group (financial guaranty insurance) |
| |
| Anne-Lee Verville (Born 1945) | | |
c/o Columbia Management Advisors, LLC
One Financial Center
Boston, MA 02111
Trustee (since 1998) | | Retired since 1997 (formerly General Manager – Global Education Industry (from 1994 to 1997), President – Application Systems Division (from 1991 to 1994), Chief Financial Officer – US Marketing & Services (from 1988 to 1991), and Chief Information Officer (from 1987 to 1988), IBM Corporation (computer and technology)). Oversees 79, None |
52
Fund Governance (continued) – Columbia Income Fund
Interested Trustee
| | |
Name, address and year of birth,
Position with funds, Year first
elected or appointed to office | | Principal occupation(s) during past five years, Number of funds in Columbia Funds
Complex overseen by trustee, Other directorships held |
| |
| William E. Mayer (Born 1940) | | |
c/o Columbia Management Advisors, LLC
One Financial Center
Boston, MA 02111
Trustee1 (since 1994) | | Partner, Park Avenue Equity Partners (private equity) since February 1999; Dean and Professor, College of Business, University of Maryland from 1992 to 1997. Oversees 79, Lee Enterprises (print media), WR Hambrecht + Co. (financial service provider); BlackRock Kelso Capital Corporation (investment company) |
1 | Mr. Mayer is deemed to be an “interested person” (as defined in the Investment Company Act of 1940) of the Columbia Funds by reason of his affiliation with WR Hambrecht + Co., a registered broker/dealer that may execute portfolio transactions for or engage in principal transactions with the Funds or other funds or accounts advised/managed by the Advisor or other Bank of America affiliates. |
The Statement of Additional Information includes additional information about the Trustees of the Funds and is available, without charge, upon request by calling 1-800-345-6611.
53
Fund Governance (continued) – Columbia Income Fund
Officers
| | |
Name, address and year of birth,
Position with Columbia Funds, Year
first elected or appointed to office | | Principal occupation(s) during past five years |
| |
| J. Kevin Connaughton (Born 1964) | | |
One Financial Center Boston, MA 02111 President (since 2009) | | Managing Director of Columbia Management Advisors, LLC since December 2004; Senior Vice President and Chief Financial Officer – Columbia Funds, from June 2008 to January 2009; Treasurer – Columbia Funds, from October 2003 to May 2008; Treasurer – the Liberty Funds, Stein Roe Funds and Liberty All-Star Funds, December 2000 – December 2006; Senior Vice President – Columbia Management Advisors, LLC, from April 2003 to December 2004; President – Columbia Funds, Liberty Funds and Stein Roe Funds, February 2004 to October 2004; Treasurer – Galaxy Funds, September 2002 to December 2005; Treasurer, December 2002 to December 2004, and President, February 2004 to December 2004 – Columbia Management Multi-Strategy Hedge Fund, LLC; and a senior officer of various other Bank of America-affiliated entities, including other registered and unregistered funds. |
| |
| James R. Bordewick, Jr. (Born 1959) | | |
One Financial Center Boston, MA 02111 Senior Vice President, Secretary and Chief Legal Officer (since 2006) | | Associate General Counsel, Bank of America since April 2005; Senior Vice President and Associate General Counsel, MFS Investment Management (investment management) prior to April 2005. |
| |
| Linda J. Wondrack (Born 1964) | | |
One Financial Center Boston, MA 02111 Senior Vice President and Chief Compliance Officer (since 2007) | | Director (Columbia Management Group LLC and Investment Product Group Compliance), Bank of America since June 2005; Director of Corporate Compliance and Conflicts Officer, MFS Investment Management (investment management), August 2004 to May 2005; Managing Director, Deutsche Asset Management (investment management) prior to August 2004. |
| |
| Michael G. Clarke (Born 1969) | | |
One Financial Center Boston, MA 02111 Senior Vice President and Chief Financial Officer (since 2009) | | Director of Fund Administration of the Advisor since January 2006; Managing Director of the Advisor September 2004 to December 2005; Vice President Fund Administration June 2002 to September 2004. |
| |
| Jeffrey R. Coleman (Born 1969) | | |
One Financial Center Boston, MA 02111 Deputy Treasurer (since 2006) | | Director of Fund Administration of the Advisor since January 2006; Fund Controller of the Advisor from October 2004 to January 2006; Vice President of CDC IXIS Asset Management Services, Inc. (investment management) from August 2000 to September 2004. |
| |
| Joseph F. DiMaria (Born 1968) | | |
One Financial Center Boston, MA 02111 Chief Accounting Officer and Treasurer (since 2009) | | Director of Fund Administration of the Advisor since January 2006; Head of Tax/Compliance and Assistant Treasurer of the Advisor from November 2004 to December 2005; Director of Trustee Administration (Sarbanes-Oxley) of the Advisor from May 2003 to October 2004. |
54
Fund Governance (continued) – Columbia Income Fund
Officers (continued)
| | |
Name, address and year of birth,
Position with Columbia Funds, Year
first elected or appointed to office | | Principal occupation(s) during past five years |
| |
| Julian Quero (Born 1967) | | |
One Financial Center Boston, MA 02111 Deputy Treasurer (since 2008) | | Senior Tax Manager of the Advisor since August 2006; Senior Compliance Manager of the Advisor from April 2002 to August 2006. |
| |
| Barry S. Vallan (Born 1969) | | |
One Financial Center Boston, MA 02111 Controller (since 2006) | | Vice President – Fund Treasury of the Advisor since October 2004; Vice President – Trustee Reporting of the Advisor from April 2002 to October 2004 |
55
Board Consideration and Approval of Advisory Agreements
The Advisory Fees and Expenses Committee of the Board of Trustees meets several times annually to review the advisory agreements (collectively, the “Agreements”) of the funds for which the Trustees serve as trustees (each a “fund”) and to determine whether to recommend that the full Board approve the continuation of the Agreements for an additional one-year period. After the Committee has made its recommendation, the full Board, including the Independent Trustees, determines whether to approve the continuation of the Agreements. In addition, the full Board, including the Independent Trustees, considers matters bearing on the Agreements at most of its other meetings throughout the year and meets regularly with senior management of the funds and Columbia, the funds’ investment adviser, including the senior manager of each investment area within Columbia. Through the Board’s Investment Oversight Committees, Trustees also meet with selected fund portfolio managers, research analysts and traders at various times throughout the year.
The Trustees receive and review all materials that they, their legal counsel or Columbia, the funds’ investment adviser, believe to be reasonably necessary for the Trustees to evaluate the Agreements and to determine whether to approve the continuation of the Agreements. Those materials generally include, among other items, (i) information on the investment performance of each fund relative to the performance of peer groups of mutual funds and the fund’s performance benchmarks, and additional information assessing performance on a risk-adjusted basis, (ii) information on each fund’s advisory fees and other expenses, including information comparing the fund’s expenses to those of peer groups of mutual funds and information about any applicable expense caps and fee “breakpoints,” (iii) information about the profitability of the Agreements to Columbia, including potential “fall-out” or ancillary benefits that Columbia and its affiliates may receive as a result of their relationships with the funds and (iv) information obtained through Columbia’s response to a questionnaire prepared at the request of the Trustees by counsel to the funds and independent legal counsel to the Independent Trustees. The Trustees also consider other information such as (v) Columbia’s financial results and financial condition, (vi) each fund’s investment objective and strategies and the size, education and experience of Columbia’s investment staffs and their use of technology, external research and trading cost measurement tools, (vii) the allocation of the funds’ brokerage and the use of “soft” commission dollars to pay for research products and services, (viii) Columbia’s resources devoted to, and its record of compliance with, the funds’ investment policies and restrictions, policies on personal securities transactions and other compliance policies and legal and regulatory requirements, (ix) Columbia’s response to various legal and regulatory proceedings since 2003 and to the recent period of volatility in the securities markets and (x) the economic outlook generally and for the mutual fund industry in particular. In addition, the Advisory Fees and Expenses Committee confers with the funds’ independent fee consultant and reviews materials relating to the funds’ relationships with Columbia provided by the independent fee consultant. Throughout the process, the Trustees have the opportunity to ask questions of and to request additional materials from Columbia and to consult with the independent fee consultant and independent legal counsel to the Independent Trustees.
The Board of Trustees most recently approved the continuation of the Agreements at its October, 2008 meeting, following meetings of the Advisory Fees and Expenses Committee held in February, April, August, September and October, 2008. In considering whether to approve the continuation of the Agreements, the Trustees, including the Independent Trustees, did not identify any single factor as determinative, and each weighed various factors as he or she deemed appropriate. The Trustees considered the following matters in connection with their approval of the continuation of the Agreements:
The nature, extent and quality of the services provided to the funds under the Agreements. The Trustees considered the nature, extent and quality of the services provided by Columbia and its affiliates to the funds and the resources dedicated to the funds by Columbia and its affiliates. Among other things, the Trustees considered (i) Columbia’s ability (including its personnel and other resources, compensation programs for personnel involved in fund management, reputation and other attributes) to attract, motivate and retain highly qualified research, advisory and supervisory investment professionals; (ii) the portfolio management services provided by those investment professionals; and (iii) the trade execution services provided on behalf of the funds. For each fund, the Trustees also considered the benefits to shareholders of investing in a mutual fund that is part of a
56
family of funds offering exposure to a variety of asset classes and investment disciplines and providing a variety of fund and shareholder services. After reviewing those and related factors, the Trustees concluded, within the context of their overall conclusions regarding each of the Agreements, that the nature, extent and quality of services provided supported the continuation of the Agreements.
Investment performance of the funds and Columbia. The Trustees reviewed information about the performance of each fund over various time periods, including information prepared by an independent third-party data provider that compared the performance of each fund to the performance of peer groups of mutual funds and performance benchmarks. The Trustees also reviewed a description of the third party’s methodology for identifying each fund’s peer group for purposes of performance and expense comparisons. The Trustees also considered additional information that the Advisory Fees and Expenses Committee requested from Columbia relating to funds that presented relatively weaker performance and/or relatively higher expenses. In the case of each fund whose performance lagged that of a relevant peer group for certain (although not necessarily all) periods, the Trustees concluded that other factors relevant to performance were sufficient, in light of other considerations, to warrant continuation of the fund’s Agreements. Those factors varied from fund to fund, but included one or more of the following: (i) that the fund’s performance, although lagging in certain recent periods, was stronger over the longer term; (ii) that the underperformance was attributable, to a significant extent, to investment decisions that were reasonable and consistent with the fund’s investment strategy and policies and that the fund was performing within a reasonable range of expectations, given those investment decisions, market conditions and the fund’s investment strategy; (iii) that the fund’s performance was competitive when compared to other relevant performance benchmarks or peer groups; (iv) that Columbia had taken or was taking steps designed to help improve the fund’s investment performance, including, but not limited to, replacing portfolio managers or modifying investment strategies; and (v) that Columbia proposed to waive advisory fees or cap the expenses of the fund.
The Trustees noted that, through April 30, 2008, Columbia Income Fund’s performance was in the fifth quintile (where the best performance would be in the first quintile) for the one- and three-year periods, and in the third quintile for the five- and ten-year periods, of the peer group selected by an independent third-party data provider for purposes of performance comparisons.
The Trustees also considered Columbia’s performance and reputation generally, the funds’ performance as a fund family generally, and Columbia’s historical responsiveness to Trustee concerns about performance and Columbia’s willingness to take steps intended to improve performance. After reviewing those and related factors, the Trustees concluded, within the context of their overall conclusions regarding each of the Agreements, that the performance of each fund and Columbia was sufficient, in light of other considerations, to warrant the continuation of the Agreement(s) pertaining to that fund.
The costs of the services provided and profits realized by Columbia and its affiliates from their relationships with the funds. The Trustees considered the fees charged to the funds for advisory services as well as the total expense levels of the funds. That information included comparisons (provided by management and by an independent third-party data provider) of each fund’s advisory fees and total expense levels to those of the fund’s peer groups and information about the advisory fees charged by Columbia to comparable institutional accounts. In considering the fees charged to those accounts, the Trustees took into account, among other things, management’s representations about the differences between managing mutual funds as compared to other types of accounts, including differences in the services provided, differences in the risk profile of such business for Columbia, and the additional resources required to manage mutual funds effectively. In evaluating each fund’s advisory fees, the Trustees also took into account the demands, complexity and quality of the investment management of the fund. The Trustees considered existing advisory fee breakpoints, and Columbia’s use of advisory fee waivers and expense caps, which benefited a number of the funds. The Trustees also noted management’s stated justification for the fees charged to the funds, which included information about the investment performance of the funds and the services provided to the funds.
The Trustees considered that Columbia Income Fund’s total expenses were in the fourth quintile and actual management fees were in the fifth quintile (where the lowest fees and
57
expenses would be in the first quintile) of the peer group selected by an independent third-party data provider for purposes of expense comparisons.
The Trustees also considered the compensation directly or indirectly received by Columbia and its affiliates from their relationships with the funds. The Trustees reviewed information provided by management as to the profitability to Columbia and its affiliates of their relationships with each fund, and information about the allocation of expenses used to calculate profitability. When reviewing profitability, the Trustees also considered court cases in which adviser profitability was an issue in whole or in part, the performance of the relevant funds, the expense level of each fund, and whether Columbia had implemented breakpoints and/or expense caps with respect to the fund.
After reviewing those and related factors, the Trustees concluded, within the context of their overall conclusions regarding each of the Agreements, that the advisory fees charged to each fund, and the related profitability to Columbia and its affiliates of their relationships with the fund, supported the continuation of the Agreement(s) pertaining to that fund.
Economies of Scale. The Trustees considered the existence of any economies of scale in the provision by Columbia of services to each fund, to groups of related funds, and to Columbia’s investment advisory clients as a whole and whether those economies were shared with the funds through breakpoints in the investment advisory fees or other means, such as fee waivers/expense reductions and additional investments by Columbia in investment, trading and compliance resources. The Trustees noted that many of the funds benefited from breakpoints, fee waivers/expense caps, or both. In considering those issues, the Trustees also took note of the costs of the services provided (both on an absolute and a relative basis) and the profitability to Columbia and its affiliates of their relationships with the funds, as discussed above.
After reviewing those and related factors, the Trustees concluded, within the context of their overall conclusions regarding each of the Agreements, that the extent to which economies of scale were shared with the funds supported the continuation of the Agreements.
Other Factors. The Trustees also considered other factors, which included but were not limited to the following:
| n | | the extent to which each fund had operated in accordance with its investment objective and investment restrictions, the nature and scope of the compliance programs of the funds and Columbia and the compliance-related resources that Columbia and its affiliates were providing to the funds; |
| n | | the nature, quality, cost and extent of administrative and shareholder services overseen and performed by Columbia and its affiliates, both under the Agreements and under separate agreements for the provision of transfer agency and administrative services; |
| n | | so-called “fall-out benefits” to Columbia and its affiliates, such as the engagement of its affiliates to provide distribution, brokerage and transfer agency services to the funds, and the benefits of research made available to Columbia by reason of brokerage commissions generated by the funds’ securities transactions, as well as possible conflicts of interest associated with those fall-out and other benefits, and the reporting, disclosure and other processes in place to disclose and monitor those possible conflicts of interest; and |
| n | | the report provided by the funds’ independent fee consultant, which included information about and analysis of the funds’ fees, expenses and performance. |
Based on their evaluation of all factors that they deemed to be material, including those factors described above, and assisted by the advice of independent counsel and the independent fee consultant, the Trustees, including the Independent Trustees, approved the continuance of each of the Agreements through October 31, 2009.
58
Summary of Management Fee Evaluation by Independent Fee Consultant
EXCERPTS FROM REPORT OF INDEPENDENT FEE CONSULTANT TO THE FUNDS SUPERVISED BY THE COLUMBIA ATLANTIC BOARD
Prepared Pursuant to the February 9, 2005 Assurance of Discontinuance among the Office of Attorney General of New York State, Columbia Management Advisors, LLC, and Columbia Management Distributors, Inc. November 3, 2008
I. Overview
On February 9, 2005, Columbia Management Advisors, LLC (“CMA”) and Columbia Management Distributors, Inc.1 (“CMD”) agreed to the New York Attorney General’s Assurance of Discontinuance (“AOD”). Among other things, the AOD stipulates that CMA may manage or advise a Columbia Fund (“Columbia Fund” and, together with some or all of, such funds the “Columbia Funds”) only if the Independent Members of the Columbia Fund’s Board of Trustees appoint a Senior Officer or retain an Independent Fee Consultant (“IFC”) who is to manage the process by which proposed management fees are negotiated. The AOD further stipulates that the Senior Officer or IFC is to prepare a written annual evaluation of the fee negotiation process.
With effect from January 1, 2007, the Independent Members of the Board of Trustees for certain Columbia Funds known collectively as the “Atlantic Funds” (together with the other members of that Board, the “Trustees”) retained me as IFC for the Atlantic Funds.2 In this capacity, I have prepared the fourth annual written evaluation of the fee negotiation process. As was the case with last year’s report (the “2007 Report”) my immediate predecessor as IFC, John Rea, provided invaluable assistance in the preparation of this year’s report.
A. Role of the Independent Fee Consultant
The AOD charges the IFC with “managing the process by which proposed management fees…to be charged the Columbia Fund are negotiated so that they are negotiated in a manner which is at arms’ length and reasonable and consistent with this Assurance of Discontinuance.” The AOD also provides that CMA “may manage or advise a Columbia Fund only if the reasonableness of the proposed management fees is determined by the Board of Trustees…using…an annual independent written evaluation prepared by or under the direction of…the Independent Fee Consultant.” Therefore, the AOD makes clear that the IFC does not supplant the Trustees in negotiating management fees with CMA, nor does the IFC substitute his or her judgment for that of the Trustees with respect to the reasonableness of proposed fees or any other matter that is committed to the business judgment of the Trustees.
B. Elements Involved in Managing the Fee Negotiation Process
In preparing the report required by the AOD, the IFC must consider at least the following six factors set forth in the AOD:
| 1. | The nature and quality of CMA’s services, including the Fund’s performance; |
| 2. | Management fees (including any components thereof) charged by other mutual fund companies for like services; |
| 3. | Possible economies of scale as the Fund grows larger; |
| 4. | Management fees (including any components thereof) charged to institutional and other clients of CMA for like services; |
| 5. | Costs to CMA and its affiliates of supplying services pursuant to the management fee agreements, excluding any intra-corporate profit; and |
| 6. | Profit margins of CMA and its affiliates from supplying such services. |
C. Organization of the Annual Evaluation
This report, like last year’s, focuses on the six factors and contains a section for each factor except that CMA’s costs and profits from managing the Funds have been combined into a single section. In addition to a discussion of these factors, the report offers recommendations to improve the fee review process in future years. A review of the status of
1 | CMA and CMD are subsidiaries of Columbia Management Group, LLC (“CMG”), and are the successors to the entities named in the AOD. |
2 | I have no material relationship with Bank of America, CMG or any of its affiliates, aside from serving as IFC, and I am aware of no material relationship with any of their affiliates. I retained John Rea, an independent economic consultant, to assist me with this report. |
| | Unless otherwise stated or required by the context, this report covers only the Atlantic Funds, which are also referred as the “Funds.” |
59
recommendations made in the 2007 Report is being provided separately with the materials for the October meeting.
II. Summary of Findings
A. General
| 1. | Based upon my examination of the information supplied by CMG in the light of the six factors set forth in the AOD, I conclude that the Trustees have the relevant information necessary to evaluate the reasonableness of the proposed management fees for each Atlantic Fund. |
| 2. | In my view, the process by which the proposed management fees of the Funds have been negotiated in 2008 thus far has been, to the extent practicable, at arms’ length and reasonable and consistent with the AOD. |
B. Nature and Quality of Services, Including Performance
| 3. | The performance of the Funds has been relatively strong in recent years. Based upon 1-, 3-, 5-, and 10-year returns through April 30, 2008, at least half of all the Funds were in the first and second performance quintiles in each of the four performance periods and, at most, only 11% were in the fifth quintile in any one performance period. Both equity and fixed-income funds posted strong performance relative to comparable funds. |
| 4. | Performance rankings were similar in 2007 and 2008, although last year’s were slightly stronger. Despite the stability in the distribution of rankings in the two years, at least half the Funds changed quintile rankings between the two years in at least one of the 1-, 3-, and 5-year performance periods. |
| 5. | The performance of the actively managed equity Funds against their benchmarks was very strong. At least 57% and as many as 73% posted net returns exceeding their benchmarks over the 1-, 3-, and 5-year periods. In contrast, gross and net returns of fixed-income Funds typically fell short of their benchmarks. |
| 6. | Atlantic equity Funds’ overall performance adjusted for risk also was strong. Based upon 3-year returns, nearly 80% of the equity Funds had a combination of risk-adjusted and unadjusted returns that placed them in the top half of their performance universes. Only about one-fifth of the fixed income Funds posted high returns and low risk relative to comparable funds. About two-thirds of the fixed-income Funds took on more risk than the typical fund in their performance universes. |
| 7. | The industry-standard procedure used by Lipper that includes all share classes in the performance universe tends to bias a Fund’s ranking upward within that universe. The bias occurs because either no-12b-1 fee or low-12b-1 fee share classes of the Atlantic Funds are compared with funds in performance universes that include all share classes of multi-class funds with 12b-1 fees of up to 100 basis points. Correcting this bias by limiting the performance universe to classes of comparable funds with low or no 12b-1 fees (a “filtered universe”) lowers the relative performance for the Funds, but their performance, on the whole, remains strong. The filtering process, however, did identify two Funds for further review that had not been designated review funds using unfiltered universes. |
| 8. | A small number of Funds have consistently underperformed over the past four years. The exact number depends on the criteria used to evaluate longer-term performance. For example, the one-year returns of one Fund have been in the fourth or fifth performance quintiles in each of the past four years; there are six Funds whose three-year returns have been in the fourth or fifth quintile over the past four years. |
| 9. | The services performed by CMG professionals beyond portfolio management, such as compliance, legal, information technology, risk management, finance and fund administration, are critical to the success of the Funds and appear to be of high quality. |
C. Management Fees Charged by Other Mutual Fund Companies
| 10. | The Funds’ management fees and total expenses are generally low relative to those of their peers. Only 21% of the Funds ranked in the two most expensive quintiles for actual management fees, and only 23% in those quintiles for total expenses. |
| 11. | The highest concentration of low-expense Funds is found among the equity and tax-exempt fixed income Funds. The 12 former Excelsior Funds have relatively high fees and expenses, with half of those Funds ranking in either the fourth or fifth quintiles. The higher actual management fee |
60
| | rankings of certain Excelsior Funds are due in part to fee schedules that are higher than standard Columbia Fund fee schedules at current asset levels. After discussion with the Trustees, CMA is proposing to lower the management fees on three of these Funds. |
| 12. | The distribution of expense rankings is similar in 2007 and 2008, while management fee rankings improved markedly in 2008. Part of the improvement reflects expense limitations introduced last year for the state intermediate municipal bond Funds. |
| 13. | The management fees of the Atlantic Funds are generally in line with those of Columbia Funds supervised by the Nations Board of Trustees (the “Nations Funds”). In investment categories in which the Atlantic Funds have higher average fees, the difference principally arises out of differences in asset size. |
D. Trustees’ Fee and Performance Evaluation Process
| 14. | The Trustees’ evaluation process identified 17 Funds in 2008 for further review based upon their relative performance or expenses or both. When compared in filtered universes, two more Funds met the criteria for further review. CMG provided further information about those Funds to assist the Trustees in their evaluation. |
E. Potential Economies of Scale
| 15. | CMG presented to the Trustees its analysis of the sources and sharing of potential economies of scale. CMG views economies of scale as arising at the complex level and would regard estimates of scale economies for individual funds as unreliable. In its analysis, CMG did not identify specific sources of economies of scale or provide any estimates of any economies of scale that might arise from future asset growth. CMG’s analysis included measures taken by the Trustees and CMG that seek to share any potential economies of scale through breakpoints in management fee schedules, expense reimbursements, fee waivers, enhanced shareholder services, fund mergers, and operational consolidation. |
| 16. | An examination of the contractual fee schedules for five Atlantic Funds shows that they are generally in line with those of their competitors, in terms of number and extent of fee breakpoints. A similar examination last year of five different Funds led to the same conclusion. |
F. Management Fees Charged to Institutional Clients
| 17. | CMG has provided Trustees with comparisons of mutual fund management fees and institutional fees based upon standardized fee schedules and upon actual fees. The results show that, consistent with industry practice, institutional fees are generally lower than the Funds’ management fees. However, because the services provided and risks borne by the manager are more extensive for mutual funds compared to institutional accounts, the differences are of limited value in assisting the Trustees in their review of the reasonableness of the Funds’ management fees. |
G. Revenues, Expenses, and Profits
| 18. | The activity-based cost allocation methodology (“ABC”) employed by CMG to allocate costs, both direct and indirect, for purposes of calculating Fund profitability is thoughtful and detailed. This year, CMG proposed a change to the method by which indirect expenses are allocated. Under this “hybrid” method, indirect costs relating to fund management are allocated among the Funds 50% by assets and 50% per Fund. Allocating indirect expenses equally to each Fund has an intuitive logic, as each Fund regardless of size has certain expenses, such as preparing and printing prospectuses and financial statements. |
| 19. | The materials provided on CMG’s revenues and expenses with respect to the Funds and the methodology underlying their construction form a sufficient basis for Trustees to evaluate the expenses and profitability of the Funds. |
| 20. | In 2007, CMG’s complex-wide pre-tax margins on the Atlantic Funds were slightly below industry medians, based on limited data available for publicly held mutual fund managers. However, as is to be expected in a complex now comprising 75 Funds (including former Excelsior Funds), some Atlantic Funds have relatively high pre-tax profit margins, when calculated solely with respect to management revenues and expenses, while other Atlantic Funds operate at a loss. There is a positive relationship between fund size and profitability, with smaller funds generally operating at a loss. |
| 21. | CMG pays a fixed percentage of its management fee revenues to an affiliate, U.S. Trust, Bank of America |
61
| | Private Wealth Management, to compensate it for services it performs with respect to Atlantic Fund assets held for the benefit of its customers. Based on our analysis of the services provided by this affiliate, we have concluded that all payments other than those for sub-transfer agent or sub-accounting services should be treated as a distribution expense. |
III. Recommendations
| 1) | Criteria for review. The Trustees may wish to consider modifying the criteria for classifying a fund as a “Review Fund” to include criteria that focus exclusively on performance without regard to expense or fee levels. For example, a fund whose one-year or three-year performance was median or below for four consecutive years could be treated as a Review Fund. When we applied such criteria to the Funds, several additional Funds would have been added to the list of Review Funds. |
| 2) | Profitability data. CMG should present to the Trustees each year the profitability of each Fund, each investment style and each complex (of which Atlantic is one) calculated as follows: |
| | a. | Management-only profitability should be calculated without reference to any Private Bank expense. |
| | b. | Profitability excluding distribution (which essentially covers the management and transfer agency functions) should be adjusted by removing from the expense calculation any portion of the Private Bank payment not attributable to the performance by the Private Bank of sub-transfer agency or sub-accounting functions. |
| | c. | Total profitability, including distribution: No adjustment for Private Bank expenses should be made, because all such expenses represent legitimate fund expenses to be taken into account in calculating CMG’s profit margin including distribution. |
| | d. | Distribution only: This should include all Private Bank expenses other than those attributable to sub-transfer agency services. |
Therefore, the following data need not be provided:
| | 1. | Adjusting total profitability data for Private Bank expenses. |
| | 2. | Adjusting profitability excluding distribution by backing out all Private Bank expenses. |
| 3) | Potential economies of scale. CMG and the IFC should continue to work on methods for more precisely quantifying to the extent possible the sources and magnitude of any economies of scale as CMG’s mutual fund assets under management increase, to the extent that the data allows for meaningful year-over-year comparisons. The framework suggested in Section IV.D.4 may prove to be a useful model for such an analysis. |
| 4) | Competitive breakpoint analysis. As part of the annual fee evaluation process, the breakpoints of a select group of Atlantic Funds (which would differ each year) should continue to be compared to those of industry rivals to ensure that the Funds’ breakpoint schedules remain within industry norms. As breakpoint schedules change relatively little each year, performing such a comparison for each Atlantic Fund each year would not be an efficient use of Trustee and CMG resources. |
| 5) | Cost allocation methodology. CMG’s point that the current ABC system of allocating indirect expenses creates anomalous results in several cases, including sub-advised Funds, is well-taken. We would like to work with CMG over the forthcoming year on alternatives to the current system of allocating indirect expenses that (1) resolve the anomalies, (2) limit the amount of incremental effort on CMG’s part and (3) remain faithful to the general principle that expenses should be allocated by time and effort to the extent reasonably possible. |
| 6) | Management fee disparities. CMG and the Atlantic Trustees, as part of any future study of management fees, should analyze the differences in management fee schedules, principally arising out of the reorganization of the former Excelsior Funds as Atlantic Funds. As part of that analysis, CMG should provide an explanation for any significant fee differences among comparable funds across fund families managed by CMA, such as differences in the management styles of different Funds included the same Lipper category. Finally, whenever CMG proposes a management fee change or an expense cap for any mutual fund managed by CMA that is comparable to any Atlantic Fund, CMG should provide the Trustees with sufficient information about the proposal to allow the Trustees to assess the applicability of the proposed change to the relevant Atlantic Fund or Funds. |
62
| 7) | Tax-exempt Fund expense data. The expense rankings of certain tax-exempt Funds were adversely affected by including certain investment-related interest expenses that Lipper excluded in calculating the expense ratios of competitors. We recommend that CMG follow the Lipper practice and exclude such interest expenses from data submitted to Lipper to avoid unfairly disadvantaging the tax-exempt Funds. |
| 8) | Reduction of volume of paper documents submitted. The effort to rationalize and simplify the data presented to the Trustees and the process by which that data was prepared and organized was regarded as a success by all parties. We should continue to look for opportunities to reduce and simplify the presentation of 15(c) data, especially in the area of Fund profitability. The Fund “Dashboard” volume presents a large volume of Fund data on a single page. If it is continued, the Trustees may wish to consider receiving the underlying Lipper data on CD, rather than the current paper volumes. |
Respectfully submitted,
Steven E. Asher
63
[THIS PAGE INTENTIONALLY LEFT BLANK]
64
Important Information About This Report – Columbia Income Fund
Transfer Agent
Columbia Management Services, Inc.
P.O. Box 8081
Boston, MA 02266-8081
1-800-345-6611
Distributor
Columbia Management
Distributors, Inc.
One Financial Center
Boston, MA 02111
Investment Advisor
Columbia Management Advisors, LLC
100 Federal Street
Boston, MA 02110
The fund mails one shareholder report to each shareholder address. If you would like more than one report, please call shareholder services at 1-800-345-6611 and additional reports will be sent to you. This report has been prepared for shareholders of Columbia Income Fund.
A description of the policies and procedures that the fund uses to determine how to vote proxies and a copy of the fund’s voting records are available (i) at www.columbiamanagement.com; (ii) on the Securities and Exchange Commission’s website at www.sec.gov, and (iii) without charge, upon request, by calling 1-800-368-0346. Information regarding how the fund voted proxies relating to portfolio securities during the 12-month period ended June 30 is available from the SEC’s website. Information regarding how the fund voted proxies relating to portfolio securities is also available from the fund’s website, www.columbiamanagement.com
The fund files a complete schedule of portfolio holdings with the SEC for the first and third quarters of each fiscal year on Form N-Q. The fund’s Form N-Q is available on the SEC’s website at www.sec.gov and may be reviewed and copied at the SEC’s Public Reference Room in Washington, DC. Information on the operation of the Public Reference Room may be obtained by calling
1-800-SEC-0330.
Please read and consider the investment objectives, risks, charges and expenses for any fund carefully before investing. For a prospectus which contains this and other important information about the fund, contact your Columbia Management representative or financial advisor or go to www.columbiamanagement.com.
Columbia Management Group, LLC (“Columbia Management”) is the investment management division of Bank of America Corporation. Columbia Management entities furnish investment management services and products for institutional and individual investors. Columbia Funds are distributed by Columbia Management Distributors, Inc., member of FINRA, SIPC, part of Columbia Management and an affiliate of Bank of America Corporation.
65

One Financial Center
Boston, MA 02111-2621
Columbia Income Fund
Annual Report, March 31, 2009
©2009 Columbia Management Distributors, Inc.
One Financial Center, Boston, MA 02111-2621
800.345.6611 www.columbiafunds.com
SHC-42/10643-0309 (05/09) 09/79012

Annual Report
March 31, 2009
Columbia Intermediate Bond Fund
| | |
| NOT FDIC INSURED | | May Lose Value |
| NOT BANK ISSUED | | No Bank Guarantee |
Table of Contents
The views expressed in this report reflect the current views of the respective parties. These views are not guarantees of future performance and involve certain risks, uncertainties and assumptions that are difficult to predict so actual outcomes and results may differ significantly from the views expressed. These views are subject to change at any time based upon economic, market or other conditions and the respective parties disclaim any responsibility to update such views. These views may not be relied on as investment advice and, because investment decisions for a Columbia Fund are based on numerous factors, may not be relied on as an indication of trading intent on behalf of any particular Columbia Fund. References to specific securities should not be construed as a recommendation or investment advice.
President’s Message

Dear Shareholder:
Recent events have shown great volatility in the markets and uncertainty in the economy. During these challenging times, it becomes even more important to focus on long-term horizons and key investment tools that can help manage volatility. This may be the time to reflect on your investment goals and evaluate your portfolio to ensure you are positioned for any potential market rebound.
A long-term financial plan can serve as a road map and guide you through the necessary steps designed to meet your financial goals. Your financial plan should take into account your investment goals, time horizon, overall financial situation, risk tolerance and willingness to ride out market volatility. Your investment professional can be a key resource as you work through this process. The knowledge and experience of an investment professional can help as you create or reevaluate your investment strategy.
The importance of diversification
Although diversification does not ensure a profit or guarantee against loss, a diversified portfolio can be a strategy for successful long-term investing. Diversification refers to the mix of investments within a portfolio. A mutual fund can contribute to portfolio diversification given that a mutual fund’s portfolio represents several investments. Additionally, the way you allocate your money among stocks, bonds and cash, and geographically between foreign and domestic investments, can help to reduce risks. Diversification can result in multiple investments where the positive performance of certain holdings can offset any negative performance from other holdings. Having a diversified portfolio doesn’t mean that the value of the portfolio will never go down, but rather helps strike a balance between risk and reward.
Reevaluate your strategy
An annual review of your investments is a key opportunity to determine if your investment needs have changed or if you need minor adjustments to rebalance your portfolio. Life events like a birth, marriage, home improvement, or change in employment can have a major affect on your spending and goals. Ask yourself how your spending or goals have changed and factor this into your financial plan. Are you using automated investments or payroll deductions to help keep your savings on track? Are you able to set aside additional savings or increase your 401(k) plan contributions? If during your review you find that your investments in any one category (e.g., stocks, bonds or cash) have grown too large based on your diversification plan, you may want to consider redirecting future investments to get back on track.
History has shown that the U.S. stock market has been remarkably resilient¹. Volatility can lead to opportunity. Patience and a commitment to your long-term financial plan may position you to potentially benefit over your investment horizon. We appreciate your business and continued support of Columbia Funds.
Sincerely,

J. Kevin Connaughton
President, Columbia Funds
The board of trustees elected J. Kevin Connaughton president of Columbia Funds on January 16, 2009.
1 | The Dow Jones Industrial Average is the most widely used indicator of the overall condition of the stock market. The Dow Jones Industrial Average Index is a price-weighted average of 30 actively traded blue-chip stocks as selected by the editors of the Wall Street Journal. Indices are not investments, do not incur fees or expenses and are not professionally managed. It is not possible to invest directly in an index. |
Fund Profile – Columbia Intermediate Bond Fund
Summary
| n | | For the 12-month period that ended March 31, 2009, the fund’s Class A shares returned negative 6.34% without sales charge. |
n | | The fund’s return was less than the return of its benchmark, the Barclays Capital U.S. Aggregate Bond Index1 (formerly Lehman Brothers U.S. Aggregate Bond Index), and the average return of its peer group, the Lipper Intermediate Investment Grade Debt Classification.2 |
| n | | Exposure to corporate and high-yield issues undercut the fund’s performance as concerned investors fled to Treasury obligations amid a deepening credit crisis. |
Portfolio Management
Carl W. Pappo, lead manager for the fund, has co-managed the fund since March 2005 and has been with the advisor or its predecessors since 1993.
Kevin L. Cronk has co-managed the fund since November 2006 and has been with the advisor or its predecessors since 1999.
Lee Reddin has co-managed the fund since June 2007 and has been with the advisor or its predecessors since 2000.
1 | The Barclays Capital U.S. Aggregate Bond Index is a market value-weighted index that tracks the daily price, coupon, pay-downs and total return performance of fixed-rate, publicly placed, dollar-denominated and non-convertible investment grade debt issues with at least $250 million par amount outstanding and with at least one year to final maturity. Indices are not available for investment, and do not reflect sales charges, fees, brokerage commissions, taxes or other expenses of investing. Securities in the fund may not match those in an index. |
2 | Lipper Inc., a widely respected data provider in the industry, calculates an average total return (assuming reinvestment of distributions) for mutual funds with investment objectives similar to those of the fund. Lipper makes no adjustment for the effect of sales loads. |
Performance data quoted represents past performance and current performance may be lower or higher. Past performance is no guarantee of future results. The investment return and principal value will fluctuate so that shares, when redeemed, may be worth more or less than the original cost. Please visit www.columbiafunds.com for daily and most recent month-end performance updates.
Summary
1-year return as of 03/31/09
| | |
| |
 | | –6.34% Class A shares
(without sales charge) |
| |
 | | +3.13% Barclays Capital U.S.
Aggregate Bond Index |
|
Morningstar Style Box |
|
Fixed Income Maturity |
|
The Morningstar Style Box™ reveals a fund’s investment strategy. For fixed-income funds the vertical axis shows the average credit quality of the bonds owned, and the horizontal axis shows interest rate sensitivity as measured by a bond’s duration (short, intermediate or long). Information shown is based on the most recent data provided by Morningstar.
1
Economic Update – Columbia Intermediate Bond Fund
Economic growth ground to a halt during the 12-month period that began April 1, 2008 and ended March 31, 2009. The National Bureau of Economic Research reported that the U.S. economy had slipped into recession late in 2007 and the downturn was even sharper than some anticipated.
A host of factors weighed on consumers and businesses alike. The most severe housing downturn in decades showed few signs of abating as inventories of homes for sale rose, home prices declined and tighter credit standards, the result of continued turmoil in the subprime mortgage market, made it more difficult for homebuyers to qualify for loans. The labor market has contracted for 15 consecutive months, driving the unemployment rate to 8.5%. More than five million jobs have been lost since the recession commenced late in 2007, with nearly two-thirds of the decrease occurring in the most recent five months. Manufacturing activity slowed and consumer spending declined, resulting in one of the weakest holiday seasons in decades.
However, in March there were a few signs that this severe recession is no longer intensifying. Weekly chain store sales and mortgage purchase applications gained some momentum near the end of the period. The trade deficit has narrowed more than expected, raising hopes that first quarter real GDP will contract at a rate well below the fourth quarter’s negative 6.3%.
A weakening economy and turmoil in the financial markets took a toll on consumer confidence, which continued to set new all-time lows during the period. However, the monthly Conference Board gauge was nearly unchanged in March, another indication that the worst could be behind us.
In an effort to restore confidence in the capital markets, loosen the reins on credit and shore up economic growth, the Federal Reserve Board (the Fed) brought a key short-term rate — the federal funds rate — down from 2.25% to a target between zero and 0.25% during the 12-month period — a record low. However, the Fed’s efforts went largely unrewarded. The one bright spot during this period of uncertainty was lower energy and commodity prices. With oil trading near $50 per barrel at the end of the period, gasoline prices have come down from $4 per gallon or more last summer to just over $2 per gallon in recent months.
Some bond market segments delivered positive returns
The U.S. bond market seesawed during the 12-month period, but several sectors managed to deliver modest gains as investors sought refuge from the volatile stock market. Treasury prices rose and yields declined as the economy faltered and stock market volatility increased. The benchmark 10-year U.S. Treasury yield ended the period at 2.70%. In this environment, the Barclays Capital U.S. Aggregate Bond Index1 (formerly the Lehman Brothers U.S. Aggregate Bond Index) returned 3.13%. High-yield bond prices fell sharply as economic prospects weakened and default fears rose.
1 | The Barclays Capital U.S. Aggregate Bond Index is a market value-weighted index that tracks the daily price, coupon, pay-downs and total return performance of fixed-rate, publicly placed, dollar-denominated, and non-convertible investment-grade debt with at least $250 million par amount outstanding and with at least one year to final maturity. |
Summary
For the 12-month period that ended March 31, 2009
| | n | | Despite volatility in many segments of the bond market, the Barclays Capital U.S. Aggregate Bond Index delivered a modest gain. High-yield bonds lost ground, as measured by the Merrill Lynch U.S. High Yield, Cash Pay Index. Municipals recovered from an early setback, as measured by the Barclays Capital Municipal Bond Index. | |
| | |
Barclays
Aggregate Index | | Merrill Lynch Index |
| |

| | 
|
3.13% | | 19.95% |
Barclays
Municipal Index | | |
| |
| | |
2.27% | | |
| | n | | The broad U.S. stock market, as measured by the S&P 500 Index, returned negative 38.09%. Developed stock markets outside the United States returned negative 46.51%, as measured (in U.S. dollars) by the MSCI EAFE Index. | |
| | |
| S&P Index | | MSCI Index |
| |
| |
|
38.09% | | 46.51% |
| | |
| | |
2
Economic Update (continued) – Columbia Intermediate Bond Fund
The Merrill Lynch U.S. High Yield, Cash Pay Index2 returned negative 19.95%. The municipal market suffered a setback early in 2008, then rebounded in the first quarter of 2009. The Barclays Capital Municipal Bond Index3 returned 2.27% for the 12-month period.
Stocks retreat as economic outlook darkens
Against a weakening economic backdrop, the U.S. stock market lost 38.09% for the 12-month period, as measured by the S&P 500 Index.4 Losses affected the stocks of companies of all sizes and investment style categories, although growth stocks held up better than value stocks, as measured by their respective Russell indices.5 Stock markets outside the U.S. suffered even greater losses. The MSCI EAFE Index6, a broad gauge of stock market performance in foreign developed markets, lost 46.51% (in U.S. dollars) for the period. Emerging stock markets, which generally have had a strong run over the past several years, were also caught in the downdraft. As investors backed away from risk, the MSCI Emerging Markets Index7 returned negative 47.07% (in U.S. dollars).
Past performance is no guarantee of future results.
2 | The Merrill Lynch U.S. High Yield, Cash Pay Index tracks the performance of non-investment-grade corporate bonds. As of 01/01/2009, Merrill Lynch & Co., Inc. is a wholly-owned subsidiary of Bank of America Corporation and an affiliate of Columbia Management. |
3 | The Barlcays Capital Municipal Bond Index is considered representative of the broad market for investment-grade, tax-exempt bonds with maturities of at least one year. |
4 | The Standard & Poor’s (S&P) 500 Index tracks the performance of 500 widely held, large-capitalization U.S. stocks. |
5 | The Russell 1000 Growth Index measures the performance of those Russell 1000 Index companies with higher price-to-book ratios and higher forecasted growth values. The Russell 1000 Value Index measures the performance of those companies in the Russell 1000 Index with lower price-to-book ratios and lower forecasted growth values. The Russell 2000 Growth Index measures the performance of those Russell 2000 Index companies with higher price-to-book ratios and higher forecasted growth values. The Russell 2000 Value Index measures the performance of those Russell 2000 Index companies with lower price-to-book ratios and lower forecasted growth values. The Russell 3000 Growth Index measures the performance of those Russell 3000 Index companies with higher price-to-book ratios and higher forecasted growth values. The Russell 3000 Value Index measures the performance of those Russell 3000 Index companies with lower price-to-book ratios and lower forecasted growth values. The Russell Midcap Growth Index measures the performance of those Russell Midcap companies with higher price-to-book ratios and higher forecasted growth values. The Russell Midcap Value Index measures the performance of those Russell Midcap Index companies with lower price-to-book ratios and lower forecasted growth values. |
6 | The Morgan Stanley Capital International (MSCI) Europe, Australasia, Far East (EAFE) Index is a free float-adjusted market capitalization index that is designed to measure developed market equity performance, excluding the U.S. and Canada. |
7 | The Morgan Stanley Capital International (MSCI) Emerging Markets Index is a widely accepted index composed of a sample of companies from 25 countries representing the global emerging stock markets. |
Indices are not available for investment, and do not reflect sales charges, fees, brokerage commissions, taxes or other expenses of investing. Securities in the fund may not match those in an index.
3
Performance Information – Columbia Intermediate Bond Fund
Performance data quoted represents past performance and current performance may be lower or higher. Past performance is no guarantee of future results. The investment return and principal value will fluctuate so that shares, when redeemed, may be worth more or less than the original cost. Please visit www.columbiafunds.com for daily and most recent month-end performance updates.
| | |
| Annual operating expense ratio (%)* |
| |
Class A | | 1.00 |
Class B | | 1.65 |
Class C | | 1.65 |
Class R | | 1.15 |
Class Z | | 0.65 |
| * | The annual operating expense ratio is as stated in the fund’s prospectus that is current as of the date of this report. Differences in expense ratios disclosed elsewhere in this report may result from including fee waivers and expense reimbursements as well as different time periods used in calculating the ratios. |
|
Performance of a $10,000 investment 04/01/99 – 03/31/09 |
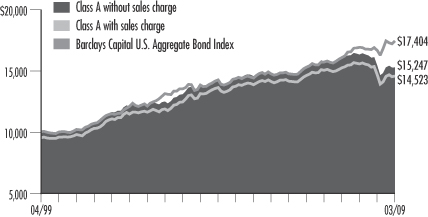
The chart above shows the change in value of a hypothetical $10,000 investment in Class A shares of Columbia Intermediate Bond Fund during the stated time period, and does not reflect the deduction of taxes that a shareholder may pay on fund distributions or on the redemption of fund shares. The Barclays Capital U.S. Aggregate Bond Index is a market value-weighted index that tracks the daily price, coupon, pay-downs and total return performance of fixed-rate, publicly placed, dollar denominated and non-convertible investment-grade debt issues with a least $250 million par amount outstanding and with at least one year to final maturity. Indices are not available for investment, and do not reflect sales charges, fees, brokerage commissions, taxes or other expenses of investing. Securities in the fund may not match those in an index.
| | | | |
| Performance of a $10,000 investment 04/01/99 – 03/31/09 ($) |
| | |
| Sales charge | | without | | with |
Class A | | 15,247 | | 14,523 |
Class B | | 14,454 | | 14,454 |
Class C | | 14,608 | | 14,608 |
Class R | | 15,126 | | n/a |
Class Z | | 15,591 | | n/a |
| | | | |
| Average annual total return as of 3/31/09 (%) |
| | | | | | | | | | | | | | | | |
| | | | | |
| Share class | | A | | B | | C | | R | | Z |
| Inception | | 07/31/00 | | 02/01/02 | | 02/01/02 | | 01/23/06 | | 12/05/78 |
| Sales charge | | without | | with | | without | | with | | without | | with | | without | | without |
1-year | | –6.34 | | –9.36 | | –7.04 | | –9.70 | | –6.91 | | –7.79 | | –6.58 | | –6.11 |
5-year | | 1.31 | | 0.34 | | 0.56 | | 0.56 | | 0.71 | | 0.71 | | 1.15 | | 1.57 |
10-year | | 4.31 | | 3.80 | | 3.75 | | 3.75 | | 3.86 | | 3.86 | | 4.23 | | 4.54 |
The “with sales charge” returns include the maximum initial sales charge of 3.25% for Class A shares and the applicable contingent deferred sales charge of 3.00% in the first year, declining to 1.00% in the fourth year and eliminated thereafter for Class B shares and 1.00% for Class C shares for the first year only. The “without sales charge” returns do not include the effect of sales charges. If they had, returns would be lower. Prior to August 22, 2005, new purchases of Class A shares had a maximum initial sales charge of 4.75%. The 5 & 10 year average annual returns with sales charge as of 03/31/09 include the previous sales charge of 4.75%. The 1-year return with sales charge as of 03/31/09 includes the new sales charge of 3.25%
Performance results reflect any fee waivers or reimbursements of fund expenses by the investment advisor and/or any of its affiliates. Absent these fee waivers or expense reimbursement arrangements, performance results would have been lower.
All results shown assume reinvestment of distributions. Class Z shares are sold at net asset value with no distribution and service (Rule 12b-1) fees. Class R shares are sold at net asset value with distribution and service (12b-1) fees. Class Z and R shares have limited eligibility and the investment minimum requirements may vary. Please see the fund’s prospectus for details. Performance for different share classes will vary based on differences in sales charges and fees associated with each class.
The tables do not reflect the deduction of taxes that a shareholder may pay on fund distributions or on the redemption of fund shares.
Class A share performance information includes returns of Class Z shares (the oldest existing share class) for periods prior to July 31, 2000. Class B and Class C share performance information includes returns of Class A shares for the period from July 31, 2000 through February 1, 2002, and the returns of Class Z shares for periods prior thereto. Class R share performance information includes returns of Class A shares for the period from July 31, 2000 through January 22, 2006, and the returns of Class Z shares for periods prior thereto. These returns shown for these share classes reflect any differences in sales charges, but have not been restated to reflect any differences in expenses, such as distribution and service (Rule 12b-1) fees, between Class Z or Class A shares, as applicable, and the corresponding newer share classes. If differences in expenses had been reflected, the returns shown for periods prior to the inception of the newer classes of shares would have been lower. Class A shares were initially offered on July 31, 2000; Class B and Class C shares were initially offered on February 1, 2002; Class R shares were initially offered on January 23, 2006; and Class Z shares were initially offered on December 5, 1978.
4
Understanding Your Expenses – Columbia Intermediate Bond Fund
Estimating your actual expenses
To estimate the expenses that you paid over the period, first you will need your account balance at the end of the period:
| | n | | For shareholders who receive their account statements from Columbia Management Services, Inc., your account balance is available online at www.columbiafunds.com or by calling Shareholder Services at 800.345.6611. | |
| | n | | For shareholders who receive their account statements from their financial intermediary, contact your financial intermediary to obtain your account balance. | |
| | 1. | Divide your ending account balance by $1,000. For example, if an account balance was $8,600 at the end of the period, the result would be 8.6. | |
| | 2. | In the section of the table below titled “Expenses paid during the period,” locate the amount for your share class. You will find this number in the column labeled “Actual.” Multiply this number by the result from step 1. Your answer is an estimate of the expenses you paid on your account during the period. | |
If the value of your account falls below the minimum initial investment requirement applicable to you, your account generally will be subject to a $20 annual fee. This fee is not included in the accompanying table. If you are subject to the fee, keep it in mind when you are estimating the ongoing expenses of investing in the fund and when comparing the expenses of this fund with other funds.
As a fund shareholder, you incur two types of costs. There are transaction costs, which generally include sales charges on purchases and may include redemption fees or exchange fees. There are also ongoing costs, which generally include investment advisory fees, distribution and service (12b-1) fees and other fund expenses. The information on this page is intended to help you understand the ongoing costs of investing in the fund and to compare these costs with the ongoing costs of investing in other mutual funds.
Analyzing your fund’s expenses by share class
To illustrate these ongoing costs, we have provided an example and calculated the expenses paid by investors in each share class during the period. The information in the following table is based on an initial investment of $1,000, which is invested at the beginning of the period and held for the entire period. Expense information is calculated two ways and each method provides you with different information. The amount listed in the “Actual” column is calculated using the fund’s actual operating expenses and total return for the period. The amount listed in the “Hypothetical” column for each share class assumes that the return each year is 5% before expenses and is calculated based on the fund’s actual operating expenses. You should not use the hypothetical account values and expenses to estimate either your actual account balance at the end of the period or the expenses you paid during this period.
Compare with other funds
Since all mutual funds are required to include the same hypothetical calculations about expenses in shareholder reports, you can use this information to compare the ongoing costs of investing in the fund with other funds. To do so, compare the 5% hypothetical example with the 5% hypothetical examples that appear in the shareholder reports of other funds. As you compare hypothetical examples of other funds, it is important to note that hypothetical examples are meant to highlight the ongoing costs of investing in a fund and do not reflect any transaction costs, such as sales charges, redemption fees or exchange fees.
| | | | | | | | | | | | | | |
| | | | |
| | | Account value at the
beginning of the period ($) | | Account value at the
end of the period ($) | | Expenses paid
during the period ($) | | Fund’s annualized
expense ratio (%) |
| | | Actual | | Hypothetical | | Actual | | Hypothetical | | Actual | | Hypothetical | | Actual |
Class A | | 1,000.00 | | 1,000.00 | | 994.02 | | 1,020.29 | | 4.62 | | 4.68 | | 0.93 |
Class B | | 1,000.00 | | 1,000.00 | | 990.28 | | 1,016.55 | | 8.34 | | 8.45 | | 1.68 |
Class C | | 1,000.00 | | 1,000.00 | | 991.02 | | 1,017.30 | | 7.59 | | 7.70 | | 1.53 |
Class R | | 1,000.00 | | 1,000.00 | | 992.82 | | 1,019.05 | | 5.86 | | 5.94 | | 1.18 |
Class Z | | 1,000.00 | | 1,000.00 | | 995.21 | | 1,021.54 | | 3.38 | | 3.43 | | 0.68 |
Expenses paid during the period are equal to the annualized expense ratio for the share class, multiplied by the average account value over the period, then multiplied by the number of days in the fund’s most recent fiscal half-year and divided by 365.
Had the investment advisor and/or any of its affiliates not waived fees or reimbursed a portion of expenses for Class A shares and Class C shares, the Class A and Class C account values at the end of the period would have been reduced.
It is important to note that the expense amounts shown in the table are meant to highlight only ongoing costs of investing in the fund and do not reflect any transaction costs, such as sales charges, redemption fees or exchange fees. Therefore, the hypothetical examples provided may not help you determine the relative total costs of owning shares of different funds. If these transaction costs were included, your costs would have been higher.
5
Portfolio Managers’ Report – Columbia Intermediate Bond Fund
Performance data quoted represents past performance and current performance may be lower or higher. Past performance is no guarantee of future results. The investment return and principal value will fluctuate so that shares, when redeemed, may be worth more or less than the original cost. Please visit www.columbiafunds.com for daily and most recent month-end performance updates.
| | |
| Net asset value per share |
| |
as of 03/31/09 ($) | | |
Class A | | 7.72 |
Class B | | 7.72 |
Class C | | 7.72 |
Class R | | 7.72 |
Class Z | | 7.72 |
| | |
| Distributions declared per share |
| |
04/01/08 – 03/31/09 ($) | | |
Class A | | 0.45 |
Class B | | 0.39 |
Class C | | 0.40 |
Class R | | 0.43 |
Class Z | | 0.47 |
| | |
| Portfolio structure |
| |
as of 03/31/09 (%) | | |
Corporate Bonds | | 51.5 |
Mortgage-Backed Securities | | 25.6 |
Asset-Backed Securities | | 7.2 |
Commercial Mortgage- Backed Securities | | 6.3 |
Treasuries | | 5.9 |
Collateralized Mortgage Obligations | | 2.6 |
Municipal Bonds | | 0.7 |
For the 12-month period that ended March 31, 2009, the fund’s Class A shares returned negative 6.34% without sales charge. The fund’s return trailed the 3.13% return of its benchmark, the Barclays Capital U.S. Aggregate Bond Index, for the same period. Fees accounted for a portion of the fund’s shortfall relative to its benchmark. The fund incurs fees while the index does not. The fund’s exposure to high-yield bonds also detracted from relative performance. There are no high-yield bonds in the index. We believe that the fund had more exposure to high-yield bonds than the average fund in its peer group, which detracted from return against that comparative measure as well.
Investors flocked to Treasuries
A deepening recession and frozen credit markets drove investors to the safety of Treasuries, driving down prices on corporate bonds across all quality ranges, with the most severe declines occurring among lower quality bonds. The fund’s large commitments to investment grade corporates and its exposure to high-yield bonds, both consistent with its established strategy, were the chief sources of its underperformance during this period. However, it is worth noting that these sectors have also been a source of considerable returns for investors over the longer term and we believe that they will rebound when economic growth picks up and investor confidence is restored.
Financials sector delivers mixed results
During the period, several leading financial firms collapsed or were forced into mergers, raising investor skepticism, especially toward major banks. In this environment, the fund benefited by focusing on higher quality regional banks and insurance company obligations, including both Bank of New York, Inc. and Northern Trust Corp., which were positive contributors. Late last year, we also found opportunity among well-capitalized financial companies, including MetLife, Inc. and New York Life Global Funding. Both made positive contributions to performance.
Cautious positioning aided relative returns
Over the period, we transitioned the portfolio to a more defensive stance, overweighting utility companies, which declined less than other sectors. Securities of pipeline companies suffered as energy prices declined sharply.
During the period, there were no major changes to sector weights, although we reduced exposure to commercial mortgage backed securities and made a modest increase in the fund’s allocation to Treasury issues. At the end of the period, investment grade corporate bond holdings accounted for approximately 46% of the portfolio — twice that of the benchmark.
Looking ahead
We believe that an upturn in the economy, when it comes, will be gradual and that further contraction is possible. Businesses are reluctant to spend or hire, and consumers, struggling with foreclosures and unemployment, are saving and not spending. Corporate bonds are likely to experience continued volatility while the
6
Portfolio Managers’ Report (continued) – Columbia Intermediate Bond Fund
outlook for earnings remains uncertain. However, we believe corporate and high-yield bonds have now retreated to a point where their increased yields and lowered valuations appear to factor in a slow recovery and any improvement in the environment could boost their prospects going forward.
Investing in fixed-income securities may involve certain risks, including the credit quality of individual issuers, possible prepayments, market or economic developments and yield and share price fluctuations due to changes in interest rates. When interest rates go up, bond prices typically drop, and vice versa.
Investments in high-yield securities (commonly know as “junk” bonds) offer the potential for high current income and attractive total return but involve certain risks. Changes in economic conditions or other circumstances may adversely affect a high-yield bond issuer’s ability to make principal and interest payments. Rising interest rates tend to lower the value of all bonds. High-yield bonds issued by foreign entities have greater potential risks, including less regulation, currency fluctuation, economic instability and political developments.
| | |
| Quality breakdown |
| |
as of 03/31/09 (%) | | |
AAA | | 45.8 |
AA | | 8.3 |
A | | 19.0 |
BBB | | 20.6 |
BB | | 2.6 |
B | | 2.6 |
CCC and below | | 0.9 |
Not Rated | | 0.2 |
| | |
| Maturity breakdown |
| |
as of 03/31/09 (%) | | |
0-1 year | | 4.4 |
1-5 years | | 58.7 |
5-10 years | | 21.3 |
10-20 years | | 3.0 |
Over 20 years | | 12.6 |
Portfolio structure is calculated as a percentage of net assets. Quality and maturity breakdowns are calculated as a percentage of total investments. Ratings shown in the quality breakdown represent one of the following nationally-recognized rating agencies: Standard and Poor’s, a division of the McGraw-Hill Companies, Inc., Moody’s Investors Service, Inc. or Fitch Ratings Ltd.
| | |
| 30-day SEC yields |
| |
30-day as of 03/31/09 (%) | | |
Class A | | 5.83 |
Class B | | 5.37 |
Class C | | 5.52 |
Class R | | 5.87 |
Class Z | | 6.37 |
The 30-day SEC yields reflect the fund’s earning power net of expenses, expressed as an annualized percentage of the public offering price per share at the end of the period. Had the investment advisor and/or its affiliates not waived fees or reimbursed a portion of expenses for Class A and Class C shares, the 30-day SEC yields would have been lower.
| | |
| Holdings discussed in this report |
| |
as of 03/31/09 (%) | | |
Bank of New York, Inc. | | 0.3 |
Northern Trust Corp. | | 1.1 |
MetLife, Inc. | | 0.3 |
New York Life Global Funding | | 1.1 |
Your fund is actively managed and the composition of its portfolio will change over time. Information provided is calculated as a percentage of net assets.
7
Investment Portfolio – Columbia Intermediate Bond Fund
March 31, 2009
Corporate Fixed-Income Bonds & Notes – 51.5%
| | | | | | | |
| | | | | Par ($) (a) | | Value ($) |
| Basic Materials – 1.2% | | | | | | |
| Chemicals – 0.2% | | | | | | | |
| Chemtura Corp. | | 6.875% 06/01/16 (b) | | | 395,000 | | 177,750 |
| | | |
| Huntsman International LLC | | 6.875% 11/15/13 (c) | | EUR | 205,000 | | 84,433 |
| | 7.875% 11/15/14 | | | 1,020,000 | | 418,200 |
| | | |
| INEOS Group Holdings PLC | | 8.500% 02/15/16 (c) | | | 1,025,000 | | 58,937 |
| | | |
| Lubrizol Corp. | | 6.500% 10/01/34 | | | 2,475,000 | | 1,890,034 |
| | | |
| Mosaic Co. | | 7.625% 12/01/16 (c) | | | 525,000 | | 514,500 |
| | | |
| NOVA Chemicals Corp. | | 6.500% 01/15/12 | | | 585,000 | | 508,950 |
| | | |
| Terra Capital, Inc. | | 7.000% 02/01/17 | | | 535,000 | | 492,200 |
| | |
| | Chemicals Total | | | | | 4,145,004 |
| | |
| Forest Products & Paper – 0.1% | | | | | |
| Cascades, Inc. | | 7.250% 02/15/13 | | | 415,000 | | 231,363 |
| | | |
| Domtar Corp. | | 7.125% 08/15/15 | | | 360,000 | | 241,200 |
| | | |
| Georgia-Pacific Corp. | | 8.000% 01/15/24 | | | 1,095,000 | | 870,525 |
| | | |
| NewPage Corp. | | 10.000% 05/01/12 | | | 280,000 | | 97,300 |
| | | |
| Westvaco Corp. | | 8.200% 01/15/30 | | | 40,000 | | 31,534 |
| | |
| | Forest Products & Paper Total | | | | | 1,471,922 |
| | | |
| Iron/Steel – 0.7% | | | | | | | |
| Nucor Corp. | | 5.000% 06/01/13 | | | 7,845,000 | | 8,209,933 |
| | 5.850% 06/01/18 | | | 4,800,000 | | 4,792,829 |
| | | |
| Russel Metals, Inc. | | 6.375% 03/01/14 | | | 355,000 | | 285,775 |
| | | |
| Steel Dynamics, Inc. | | 7.750% 04/15/16 (c) | | | 1,105,000 | | 756,925 |
| | | |
| United States Steel Corp. | | 7.000% 02/01/18 | | | 1,060,000 | | 723,361 |
| | |
| | Iron/Steel Total | | | | | 14,768,823 |
| | | |
| Metals & Mining – 0.2% | | | | | | | |
| FMG Finance Ltd. | | 10.625% 09/01/16 (c) | | | 1,050,000 | | 882,000 |
| | | |
| Freeport-McMoRan Copper & Gold, Inc. | | 8.375% 04/01/17 | | | 2,365,000 | | 2,211,275 |
| | | |
| Noranda Aluminium Holding Corp. | | PIK,
8.345% 11/15/14 (d) | | | 670,000 | | 116,219 |
| | |
| | Metals & Mining Total | | | | | 3,209,494 |
| | | | | | | |
| Basic Materials Total | | | | | | 23,595,243 |
See Accompanying Notes to Financial Statements.
8
Columbia Intermediate Bond Fund
March 31, 2009
Corporate Fixed-Income Bonds & Notes (continued)
| | | | | | |
| | | | | Par ($) (a) | | Value ($) |
| Communications – 6.7% | | | | | | |
| Media – 2.9% | | | | | | |
| Cablevision Systems Corp. | | 8.000% 04/15/12 | | 1,295,000 | | 1,259,387 |
| | | |
| Charter Communications Holdings II LLC | | 10.250% 09/15/10 (e) | | 775,000 | | 697,500 |
| | | |
| Charter Communications Operating LLC/Charter Communications Operating Capital | | 8.375% 04/30/14 (c)(e) | | 280,000 | | 246,400 |
| | 10.875% 09/15/14 (c)(e) | | 355,000 | | 344,350 |
| | | |
| CMP Susquehanna Corp. | | 9.875% 05/15/14 (k) | | 38,000 | | 17,100 |
| | | |
| Comcast Corp. | | 5.700% 05/15/18 | | 10,420,000 | | 9,773,460 |
| | 6.300% 11/15/17 | | 2,230,000 | | 2,169,841 |
| | 6.950% 08/15/37 | | 13,950,000 | | 12,990,407 |
| | | |
| CSC Holdings, Inc. | | 7.625% 04/01/11 | | 325,000 | | 322,563 |
| | 8.625% 02/15/19 (c) | | 305,000 | | 293,563 |
| | | |
| DirecTV Holdings LLC | | 6.375% 06/15/15 | | 1,270,000 | | 1,196,975 |
| | | |
| EchoStar DBS Corp. | | 6.625% 10/01/14 | | 1,440,000 | | 1,288,800 |
| | | |
| Local TV Finance LLC | | PIK,
9.250% 06/15/15 (c) | | 600,000 | | 43,658 |
| | | |
| Quebecor Media, Inc. | | 7.750% 03/15/16 | | 1,270,000 | | 965,200 |
| | | |
| R.H. Donnelley Corp. | | 8.875% 10/15/17 | | 985,000 | | 54,175 |
| | | |
| Time Warner, Inc. | | 6.875% 05/01/12 (f) | | 17,599,000 | | 17,912,262 |
| | | |
| TL Acquisitions, Inc. | | 10.500% 01/15/15 (c) | | 1,425,000 | | 730,313 |
| | | |
| Viacom, Inc. | | 5.750% 04/30/11 | | 6,535,000 | | 6,366,129 |
| | |
| | Media Total | | | | 56,672,083 |
| | | |
| Telecommunication Services – 3.8% | | | | | | |
| AT&T, Inc. | | 4.950% 01/15/13 | | 13,080,000 | | 13,269,071 |
| | 5.625% 06/15/16 | | 5,295,000 | | 5,306,612 |
| | 6.550% 02/15/39 | | 4,005,000 | | 3,632,463 |
| | | |
| British Telecommunications PLC | | 5.150% 01/15/13 | | 3,360,000 | | 3,118,443 |
| | 5.950% 01/15/18 | | 5,100,000 | | 4,150,808 |
| | | |
| Cisco Systems, Inc. | | 5.900% 02/15/39 | | 7,710,000 | | 7,084,079 |
| | | |
| Citizens Communications Co. | | 7.875% 01/15/27 | | 1,060,000 | | 715,500 |
| | | |
| Cricket Communications, Inc. | | 9.375% 11/01/14 | | 1,075,000 | | 1,023,938 |
| | | |
| Crown Castle International Corp. | | 9.000% 01/15/15 | | 400,000 | | 401,000 |
| | | |
| Digicel Group Ltd. | | 8.875% 01/15/15 (c) | | 1,475,000 | | 951,375 |
See Accompanying Notes to Financial Statements.
9
Columbia Intermediate Bond Fund
March 31, 2009
Corporate Fixed-Income Bonds & Notes (continued)
| | | | | | |
| | | | | Par ($) (a) | | Value ($) |
| Communications (continued) | | | | | | |
| Hellas Telecommunications Luxembourg II | | 6.844% 01/15/15 (c)(d) | | 250,000 | | 41,250 |
| | | |
| Inmarsat Finance PLC | | (g) 11/15/12 (10.375% 11/15/09) | | 1,000,000 | | 1,025,000 |
| | | |
| Intelsat Jackson Holdings Ltd. | | 11.250% 06/15/16 | | 2,075,000 | | 2,012,750 |
| | | |
| Lucent Technologies, Inc. | | 6.450% 03/15/29 | | 1,345,000 | | 511,100 |
| | | |
| MetroPCS Wireless, Inc. | | 9.250% 11/01/14 | | 1,125,000 | | 1,091,250 |
| | | |
| Nextel Communications, Inc. | | 7.375% 08/01/15 | | 1,260,000 | | 667,800 |
| | | |
| Nordic Telephone Co. Holdings ApS | | 8.875% 05/01/16 (c) | | 800,000 | | 748,000 |
| | | |
| Orascom Telecom Finance SCA | | 7.875% 02/08/14 (c) | | 280,000 | | 179,200 |
| | | |
| Qwest Communications International, Inc. | | 7.500% 02/15/14 | | 1,975,000 | | 1,708,375 |
| | | |
| Qwest Corp. | | 7.500% 10/01/14 | | 360,000 | | 327,600 |
| | 7.500% 06/15/23 | | 515,000 | | 388,825 |
| | | |
| Syniverse Technologies, Inc. | | 7.750% 08/15/13 | | 485,000 | | 407,400 |
| | | |
| Telefonica Emisiones SAU | | 6.221% 07/03/17 | | 2,880,000 | | 2,951,467 |
| | 6.421% 06/20/16 | | 4,340,000 | | 4,487,269 |
| | | |
| Time Warner Telecom Holdings, Inc. | | 9.250% 02/15/14 | | 590,000 | | 569,350 |
| | | |
| Verizon Communications, Inc. | | 6.250% 04/01/37 | | 1,825,000 | | 1,623,409 |
| | | |
| Verizon Wireless Capital LLC | | 5.550% 02/01/14 (c) | | 3,355,000 | | 3,357,805 |
| | 8.500% 11/15/18 (c) | | 5,830,000 | | 6,659,731 |
| | | |
| Virgin Media Finance PLC | | 8.750% 04/15/14 | | 735,000 | | 694,575 |
| | | |
| West Corp. | | 11.000% 10/15/16 | | 930,000 | | 618,450 |
| | | |
| Wind Acquisition Financial SA | | 10.750% 12/01/15 (c) | | 305,000 | | 301,950 |
| | PIK,
8.393% 12/21/11 (d)(h) | | 980,088 | | 669,840 |
| | | |
| Windstream Corp. | | 8.625% 08/01/16 | | 1,505,000 | | 1,478,662 |
| | |
| | Telecommunication Services Total | | | | 72,174,347 |
| | | | | | |
| Communications Total | | | | | | 128,846,430 |
See Accompanying Notes to Financial Statements.
10
Columbia Intermediate Bond Fund
March 31, 2009
Corporate Fixed-Income Bonds & Notes (continued)
| | | | | | | |
| | | | | Par ($) (a) | | Value ($) |
| Consumer Cyclical – 2.5% | | | | | | |
| Airlines – 0.2% | | | | | | | |
| Continental Airlines, Inc. | | 6.940% 10/15/13 | | | 580,189 | | 491,710 |
| | 7.461% 04/01/15 | | | 4,845,331 | | 3,391,732 |
| | |
| | Airlines Total | | | | | 3,883,442 |
| | | |
| Apparel – 0.0% | | | | | | | |
| Levi Strauss & Co. | | 9.750% 01/15/15 | | | 895,000 | | 769,700 |
| | |
| | Apparel Total | | | | | 769,700 |
| | |
| Auto Manufacturers – 0.0% | | | | | |
| Ford Motor Co. | | 7.450% 07/16/31 | | | 1,270,000 | | 403,225 |
| | | |
| General Motors Corp. | | 7.200% 01/15/11 | | | 735,000 | | 117,600 |
| | 8.375% 07/15/33 | | | 1,405,000 | | 168,600 |
| | |
| | Auto Manufacturers Total | | | | | 689,425 |
| | |
| Auto Parts & Equipment – 0.1% | | | | | |
| Commercial Vehicle Group, Inc. | | 8.000% 07/01/13 | | | 435,000 | | 95,700 |
| | | |
| Cooper-Standard Automotive, Inc. | | 7.000% 12/15/12 | | | 155,000 | | 18,600 |
| | | |
| Goodyear Tire & Rubber Co. | | 8.625% 12/01/11 | | | 188,000 | | 156,040 |
| | 9.000% 07/01/15 | | | 704,000 | | 542,080 |
| | | |
| Hayes Lemmerz Finance Luxembourg SA | | 8.250% 06/15/15 | | EUR | 440,000 | | 58,458 |
| | | |
| TRW Automotive, Inc. | | 7.000% 03/15/14 (c) | | | 475,000 | | 199,500 |
| | |
| | Auto Parts & Equipment Total | | | | | 1,070,378 |
| | | |
| Entertainment – 0.0% | | | | | | | |
| Six Flags, Inc. | | 9.625% 06/01/14 | | | 287,000 | | 25,830 |
| | | |
| WMG Acquisition Corp. | | 7.375% 04/15/14 | | | 870,000 | | 598,125 |
| | | |
| WMG Holdings Corp. | | (g) 12/15/14 (9.500% 12/15/09) | | | 485,000 | | 174,600 |
| | |
| | Entertainment Total | | | | | 798,555 |
| | | |
| Home Builders – 0.1% | | | | | | | |
| D.R. Horton, Inc. | | 5.625% 09/15/14 | | | 1,250,000 | | 981,250 |
| | | |
| KB Home | | 5.875% 01/15/15 | | | 965,000 | | 747,393 |
| | |
| | Home Builders Total | | | | | 1,728,643 |
| | | |
| Lodging – 0.1% | | | | | | | |
| Boyd Gaming Corp. | | 6.750% 04/15/14 | | | 425,000 | | 246,500 |
| | 7.125% 02/01/16 | | | 250,000 | | 135,000 |
| | | |
| Harrah’s Operating Co., Inc. | | 10.000% 12/15/18 (c) | | | 189,000 | | 56,700 |
| | 10.750% 02/01/16 | | | 825,000 | | 156,750 |
| | | |
| Jacobs Entertainment, Inc. | | 9.750% 06/15/14 | | | 425,000 | | 251,812 |
| | | |
| Majestic Star LLC | | 9.750% 01/15/11 (b) | | | 580,000 | | 40,600 |
See Accompanying Notes to Financial Statements.
11
Columbia Intermediate Bond Fund
March 31, 2009
Corporate Fixed-Income Bonds & Notes (continued)
| | | | | | |
| | | | | Par ($) (a) | | Value ($) |
| Consumer Cyclical (continued) | | | | | | |
| Mashantucket Western Pequot Tribe | | 8.500% 11/15/15 (c) | | 1,395,000 | | 237,150 |
| | | |
| MGM Mirage | | 7.500% 06/01/16 | | 1,495,000 | | 523,250 |
| | | |
| Seminole Indian Tribe of Florida | | 7.804% 10/01/20 (c) | | 570,000 | | 444,908 |
| | | |
| Snoqualmie Entertainment Authority | | 5.384% 02/01/14 (c)(d) | | 90,000 | | 22,500 |
| | 9.125% 02/01/15 (c) | | 640,000 | | 166,400 |
| | | |
| Starwood Hotels & Resorts Worldwide, Inc. | | 6.750% 05/15/18 | | 515,000 | | 339,900 |
| | |
| | Lodging Total | | | | 2,621,470 |
| | | |
| Retail – 2.0% | | | | | | |
| AmeriGas Partners LP | | 7.125% 05/20/16 | | 475,000 | | 446,500 |
| | 7.250% 05/20/15 | | 595,000 | | 559,300 |
| | | |
| Best Buy Co., Inc. | | 6.750% 07/15/13 | | 10,615,000 | | 10,099,525 |
| | | |
| CVS Pass-Through Trust | | 5.298% 01/11/27 (c) | | 5,448,896 | | 3,954,770 |
| | 6.036% 12/10/28 (c) | | 5,618,280 | | 4,222,193 |
| | | |
| Dollar General Corp. | | PIK,
11.875% 07/15/17 | | 955,000 | | 938,287 |
| | | |
| GameStop Corp./GameStop, Inc. | | 8.000% 10/01/12 | | 535,000 | | 540,350 |
| | | |
| Hanesbrands, Inc. | | 5.698% 12/15/14 (d) | | 450,000 | | 299,250 |
| | | |
| Inergy LP/Inergy Finance Corp. | | 8.250% 03/01/16 | | 335,000 | | 318,250 |
| | 8.750% 03/01/15 (c) | | 410,000 | | 395,650 |
| | | |
| Macy’s Retail Holdings, Inc. | | 5.350% 03/15/12 | | 1,250,000 | | 981,194 |
| | | |
| McDonald’s Corp. | | 5.000% 02/01/19 | | 1,250,000 | | 1,300,094 |
| | 5.700% 02/01/39 | | 6,475,000 | | 6,275,706 |
| | | |
| New Albertsons, Inc. | | 8.000% 05/01/31 | | 625,000 | | 510,938 |
| | | |
| Phillips-Van Heusen Corp. | | 8.125% 05/01/13 | | 640,000 | | 608,000 |
| | | |
| Rite Aid Corp. | | 9.500% 06/15/17 | | 1,190,000 | | 273,700 |
| | | |
| Starbucks Corp. | | 6.250% 08/15/17 | | 6,275,000 | | 5,852,285 |
| | |
| | Retail Total | | | | 37,575,992 |
| | | |
| Textiles – 0.0% | | | | | | |
| INVISTA | | 9.250% 05/01/12 (c) | | 445,000 | | 398,275 |
| | |
| | Textiles Total | | | | 398,275 |
| | | | | | |
| Consumer Cyclical Total | | | | | | 49,535,880 |
See Accompanying Notes to Financial Statements.
12
Columbia Intermediate Bond Fund
March 31, 2009
Corporate Fixed-Income Bonds & Notes (continued)
| | | | | | |
| | | | | Par ($) (a) | | Value ($) |
| Consumer Non-Cyclical – 5.4% | | | | | | |
| Agriculture – 0.0% | | | | | | |
| Reynolds American, Inc. | | 7.625% 06/01/16 | | 620,000 | | 548,923 |
| | |
| | Agriculture Total | | | | 548,923 |
| | | |
| Beverages – 1.4% | | | | | | |
| Anheuser-Busch InBev Worldwide, Inc. | | 7.750% 01/15/19 (c)(f) | | 17,265,000 | | 17,214,949 |
| | | |
| Bottling Group LLC | | 5.125% 01/15/19 | | 4,150,000 | | 4,176,697 |
| | | |
| Constellation Brands, Inc. | | 8.125% 01/15/12 | | 765,000 | | 765,000 |
| | | |
| Cott Beverages, Inc. | | 8.000% 12/15/11 | | 540,000 | | 305,100 |
| | | |
| SABMiller PLC | | 6.200% 07/01/11 (c) | | 4,860,000 | | 4,900,328 |
| | |
| | Beverages Total | | | | 27,362,074 |
| | | |
| Biotechnology – 0.3% | | | | | | |
| Bio-Rad Laboratories, Inc. | | 7.500% 08/15/13 | | 390,000 | | 374,400 |
| | | |
| Genentech, Inc. | | 4.400% 07/15/10 | | 5,200,000 | | 5,274,734 |
| | |
| | Biotechnology Total | | | | 5,649,134 |
| | |
| Commercial Services – 0.2% | | | | |
| ACE Cash Express, Inc. | | 10.250% 10/01/14 (c) | | 280,000 | | 70,000 |
| | | |
| ARAMARK Corp. | | 8.500% 02/01/15 | | 845,000 | | 777,400 |
| | | |
| Ashtead Holdings PLC | | 8.625% 08/01/15 (c) | | 695,000 | | 396,150 |
| | | |
| Corrections Corp. of America | | 6.250% 03/15/13 | | 440,000 | | 421,300 |
| | | |
| GEO Group, Inc. | | 8.250% 07/15/13 | | 805,000 | | 746,637 |
| | | |
| Iron Mountain, Inc. | | 8.000% 06/15/20 | | 830,000 | | 771,900 |
| | | |
| Rental Service Corp. | | 9.500% 12/01/14 | | 775,000 | | 379,750 |
| | | |
| Service Corp. International | | 6.750% 04/01/16 | | 320,000 | | 278,400 |
| | 7.000% 06/15/17 | | 750,000 | | 637,500 |
| | | |
| United Rentals North America, Inc. | | 6.500% 02/15/12 | | 380,000 | | 304,000 |
| | |
| | Commercial Services Total | | | | 4,783,037 |
| | | |
| Food – 1.4% | | | | | | |
| Campbell Soup Co. | | 4.500% 02/15/19 | | 6,025,000 | | 6,005,401 |
| | | |
| ConAgra Foods, Inc. | | 7.000% 10/01/28 | | 9,420,000 | | 9,109,526 |
| | | |
| Dean Foods Co. | | 7.000% 06/01/16 | | 780,000 | | 741,000 |
| | | |
| Del Monte Corp. | | 6.750% 02/15/15 | | 790,000 | | 742,600 |
| | | |
| Kraft Foods, Inc. | | 6.500% 08/11/17 | | 6,380,000 | | 6,569,728 |
See Accompanying Notes to Financial Statements.
13
Columbia Intermediate Bond Fund
March 31, 2009
Corporate Fixed-Income Bonds & Notes (continued)
| | | | | | |
| | | | | Par ($) (a) | | Value ($) |
| Consumer Non-Cyclical (continued) | | | | |
| Kroger Co. | | 8.000% 09/15/29 | | 1,435,000 | | 1,542,350 |
| | | |
| Pinnacle Foods Finance LLC | | 9.250% 04/01/15 | | 1,135,000 | | 902,325 |
| | | |
| Reddy Ice Holdings, Inc. | | (g) 11/01/12 (10.500% 11/01/09) | | 340,000 | | 163,200 |
| | | |
| Tyson Foods, Inc. | | 10.500% 03/01/14 (c) | | 500,000 | | 510,000 |
| | |
| | Food Total | | | | 26,286,130 |
| | |
| Healthcare Products – 0.1% | | | | |
| Biomet, Inc. | | PIK,
10.375% 10/15/17 | | 1,870,000 | | 1,580,150 |
| | |
| | Healthcare Products Total | | | | 1,580,150 |
| | |
| Healthcare Services – 0.5% | | | | |
| DaVita, Inc. | | 7.250% 03/15/15 | | 560,000 | | 538,300 |
| | | |
| HCA, Inc. | | 9.250% 11/15/16 | | 430,000 | | 391,300 |
| | PIK,
9.625% 11/15/16 | | 3,890,000 | | 2,960,830 |
| | | |
| Healthsouth Corp. | | 10.750% 06/15/16 | | 390,000 | | 382,200 |
| | | |
| U.S. Oncology Holdings, Inc. | | PIK,
6.904% 03/15/12 (d) | | 418,000 | | 249,467 |
| | | |
| US Oncology, Inc. | | 9.000% 08/15/12 | | 360,000 | | 349,200 |
| | | |
| WellPoint, Inc. | | 7.000% 02/15/19 | | 4,150,000 | | 4,152,237 |
| | |
| | Healthcare Services Total | | | | 9,023,534 |
| | |
| Household Products/Wares – 0.4% | | | | |
| American Greetings Corp. | | 7.375% 06/01/16 | | 460,000 | | 225,400 |
| | | |
| Clorox Co. | | 5.950% 10/15/17 | | 2,220,000 | | 2,192,243 |
| | | |
| Fortune Brands, Inc. | | 5.125% 01/15/11 | | 5,705,000 | | 5,599,058 |
| | | |
| Jostens IH Corp. | | 7.625% 10/01/12 | | 475,000 | | 450,063 |
| | |
| | Household Products/Wares Total | | | | 8,466,764 |
| | | |
| Pharmaceuticals – 1.1% | | | | | | |
| Abbott Laboratories | | 5.600% 05/15/11 | | 1,000,000 | | 1,072,239 |
| | | |
| Elan Finance PLC | | 5.234% 11/15/11 (d) | | 205,000 | | 168,100 |
| | 8.875% 12/01/13 | | 765,000 | | 612,000 |
| | | |
| Novartis Securities Investment Ltd. | | 5.125% 02/10/19 | | 9,710,000 | | 9,858,777 |
| | | |
| Omnicare, Inc. | | 6.750% 12/15/13 | | 760,000 | | 689,700 |
| | | |
| Warner Chilcott Corp. | | 8.750% 02/01/15 | | 935,000 | | 897,600 |
See Accompanying Notes to Financial Statements.
14
Columbia Intermediate Bond Fund
March 31, 2009
Corporate Fixed-Income Bonds & Notes (continued)
| | | | | | |
| | | | | Par ($) (a) | | Value ($) |
| Consumer Non-Cyclical (continued) | | | | | | |
| Wyeth | | 5.500% 02/01/14 | | 1,640,000 | | 1,722,682 |
| | 5.500% 02/15/16 | | 5,985,000 | | 6,087,242 |
| | |
| | Pharmaceuticals Total | | | | 21,108,340 |
| | | | | | |
| Consumer Non-Cyclical Total | | | | 104,808,086 |
| | | | |
| Energy – 6.2% | | | | | | |
| Coal – 0.1% | | | | | | |
| Arch Western Finance LLC | | 6.750% 07/01/13 | | 795,000 | | 727,425 |
| | | |
| Massey Energy Co. | | 6.875% 12/15/13 | | 1,360,000 | | 1,183,200 |
| | |
| | Coal Total | | | | 1,910,625 |
| | | |
| Oil & Gas – 2.7% | | | | | | |
| Canadian Natural Resources Ltd. | | 6.250% 03/15/38 | | 2,835,000 | | 2,183,659 |
| | | |
| Chesapeake Energy Corp. | | 6.375% 06/15/15 | | 1,550,000 | | 1,305,875 |
| | 9.500% 02/15/15 | | 160,000 | | 155,600 |
| | | |
| Cimarex Energy Co. | | 7.125% 05/01/17 | | 635,000 | | 511,175 |
| | | |
| Compton Petroleum Corp. | | 7.625% 12/01/13 | | 700,000 | | 220,500 |
| | | |
| Devon Energy Corp. | | 6.300% 01/15/19 | | 2,675,000 | | 2,609,931 |
| | | |
| Frontier Oil Corp. | | 8.500% 09/15/16 | | 440,000 | | 433,400 |
| | | |
| Gazprom International SA | | 7.201% 02/01/20 (c) | | 4,506,332 | | 3,965,573 |
| | 7.201% 02/01/20 | | 244,093 | | 214,802 |
| | | |
| Hess Corp. | | 7.300% 08/15/31 | | 3,975,000 | | 3,457,876 |
| | | |
| KCS Energy, Inc. | | 7.125% 04/01/12 | | 245,000 | | 221,725 |
| | | |
| Marathon Oil Corp. | | 7.500% 02/15/19 | | 2,925,000 | | 2,946,905 |
| | | |
| Newfield Exploration Co. | | 6.625% 04/15/16 | | 1,170,000 | | 1,047,150 |
| | | |
| Nexen, Inc. | | 5.875% 03/10/35 | | 8,210,000 | | 5,431,908 |
| | | |
| OPTI Canada, Inc. | | 8.250% 12/15/14 | | 990,000 | | 443,025 |
| | | |
| PetroHawk Energy Corp. | | 7.875% 06/01/15 (c) | | 1,185,000 | | 1,042,800 |
| | | |
| Pioneer Natural Resources Co. | | 5.875% 07/15/16 | | 645,000 | | 475,933 |
| | | |
| Pride International, Inc. | | 7.375% 07/15/14 | | 360,000 | | 354,600 |
| | | |
| Qatar Petroleum | | 5.579% 05/30/11 (c) | | 1,363,998 | | 1,358,556 |
| | | |
| Quicksilver Resources, Inc. | | 7.125% 04/01/16 | | 1,410,000 | | 669,750 |
| | | |
| Range Resources Corp. | | 7.500% 05/15/16 | | 810,000 | | 747,225 |
See Accompanying Notes to Financial Statements.
15
Columbia Intermediate Bond Fund
March 31, 2009
Corporate Fixed-Income Bonds & Notes (continued)
| | | | | | |
| | | | | Par ($) (a) | | Value ($) |
| Energy (continued) | | | | | | |
| Ras Laffan Liquefied Natural Gas Co., Ltd. | | 3.437% 09/15/09 (c) | | 900,000 | | 885,393 |
| | | |
| Ras Laffan Liquefied Natural Gas Co., Ltd. II | | 5.298% 09/30/20 (c) | | 3,400,000 | | 2,898,704 |
| | | |
| Ras Laffan Liquefied Natural Gas Co., Ltd. III | | 5.832% 09/30/16 (c) | | 2,230,000 | | 2,104,830 |
| | | |
| Southwestern Energy Co. | | 7.500% 02/01/18 (c) | | 1,255,000 | | 1,211,075 |
| | | |
| Talisman Energy, Inc. | | 5.850% 02/01/37 | | 4,150,000 | | 2,800,893 |
| | | |
| Tesoro Corp. | | 6.625% 11/01/15 | | 730,000 | | 576,700 |
| | | |
| United Refining Co. | | 10.500% 08/15/12 | | 435,000 | | 252,300 |
| | | |
| Valero Energy Corp. | | 6.625% 06/15/37 | | 8,045,000 | | 5,686,842 |
| | 6.875% 04/15/12 | | 5,425,000 | | 5,475,192 |
| | |
| | Oil & Gas Total | | | | 51,689,897 |
| | | |
| Oil & Gas Services – 1.0% | | | | | | |
| Seitel, Inc. | | 9.750% 02/15/14 | | 320,000 | | 141,600 |
| | | |
| Smith International, Inc. | | 9.750% 03/15/19 | | 4,240,000 | | 4,428,964 |
| | | |
| Weatherford International Ltd. | | 5.150% 03/15/13 | | 8,640,000 | | 8,038,846 |
| | 7.000% 03/15/38 | | 8,415,000 | | 6,117,882 |
| | |
| | Oil & Gas Services Total | | | | 18,727,292 |
| | |
| Oil, Gas & Consumable Fuels – 0.0% | | | | |
| Forest Oil Corp. | | 8.500% 02/15/14 (c) | | 580,000 | | 537,950 |
| | |
| | Oil, Gas & Consumable Fuels Total | | | | 537,950 |
| | | |
| Pipelines – 2.4% | | | | | | |
| Atlas Pipeline Partners LP | | 8.125% 12/15/15 | | 790,000 | | 450,300 |
| | | |
| El Paso Corp. | | 6.875% 06/15/14 | | 750,000 | | 668,039 |
| | 7.250% 06/01/18 | | 395,000 | | 335,750 |
| | | |
| Enbridge Energy Partners LP | | 7.500% 04/15/38 | | 4,875,000 | | 3,886,223 |
| | | |
| Energy Transfer Partners LP | | 6.000% 07/01/13 | | 13,665,000 | | 12,920,135 |
| | | |
| Kinder Morgan Energy Partners LP | | 6.950% 01/15/38 | | 3,945,000 | | 3,375,756 |
| | | |
| Kinder Morgan Finance Co. ULC | | 5.700% 01/05/16 | | 895,000 | | 751,800 |
| | | |
| MarkWest Energy Partners LP | | 8.500% 07/15/16 | | 765,000 | | 546,975 |
| | | |
| ONEOK Partners LP | | 6.850% 10/15/37 | | 2,205,000 | | 1,690,230 |
| | | |
| Plains All American Pipeline LP | | 6.500% 05/01/18 | | 15,665,000 | | 13,539,635 |
See Accompanying Notes to Financial Statements.
16
Columbia Intermediate Bond Fund
March 31, 2009
Corporate Fixed-Income Bonds & Notes (continued)
| | | | | | |
| | | | | Par ($) (a) | | Value ($) |
| Energy (continued) | | | | | | |
| Plains All American Pipeline LP/PAA Finance Corp. | | 6.650% 01/15/37 | | 2,840,000 | | 2,058,443 |
| | | |
| TransCanada Pipelines Ltd. | | 6.350% 05/15/67 (d) | | 10,470,000 | | 5,967,900 |
| | | |
| Williams Companies, Inc. | | 7.625% 07/15/19 | | 310,000 | | 289,850 |
| | 7.875% 09/01/21 | | 230,000 | | 212,750 |
| | 8.125% 03/15/12 | | 245,000 | | 248,675 |
| | |
| | Pipelines Total | | | | 46,942,461 |
| | | | | | |
| Energy Total | | | | | | 119,808,225 |
| | | | | | |
| Financials – 18.9% | | | | | | |
| Banks – 12.2% | | | | | | |
| American Express Centurion Bank | | 4.375% 07/30/09 | | 2,990,000 | | 2,958,354 |
| | | |
| ANZ National International Ltd. | | 6.200% 07/19/13 (c) | | 12,960,000 | | 12,496,900 |
| | | |
| Bank of New York Mellon Corp. | | 4.500% 04/01/13 (f) | | 570,000 | | 564,865 |
| | 5.125% 08/27/13 | | 5,015,000 | | 5,132,893 |
| | | |
| Barclays Bank PLC | | 7.375% 06/15/49 (c)(d) | | 6,185,000 | | 2,077,851 |
| | | |
| Capital One Capital IV | | 6.745% 02/17/37 (d) | | 5,150,000 | | 1,756,176 |
| | | |
| Capital One Financial Corp. | | 5.700% 09/15/11 | | 12,840,000 | | 11,560,943 |
| | | |
| Chinatrust Commercial Bank | | 5.625% 12/29/49 (c)(d) | | 2,350,000 | | 1,065,394 |
| | | |
| Citicorp Lease Pass-Through Trust | | 8.040% 12/15/19 (c) | | 12,075,000 | | 11,336,831 |
| | | |
| Citigroup, Inc. | | 6.500% 08/19/13 (f) | | 6,490,000 | | 5,963,758 |
| | | |
| Comerica Bank | | 5.200% 08/22/17 | | 5,445,000 | | 3,776,184 |
| | 5.750% 11/21/16 | | 1,660,000 | | 1,228,068 |
| | | |
| Deutsche Bank AG | | 4.875% 05/20/13 (f) | | 16,960,000 | | 16,635,386 |
| | | |
| Goldman Sachs Capital II | | 5.793% 12/29/49 (d) | | 1,245,000 | | 518,345 |
| | | |
| Goldman Sachs Group, Inc. | | 1.700% 03/15/11 (q) | | 7,268,000 | | 7,293,903 |
| | 6.750% 10/01/37 | | 1,035,000 | | 700,013 |
| | | |
| HSBC Bank USA | | 3.875% 09/15/09 | | 12,810,000 | | 12,656,011 |
| | | |
| HSBC Capital Funding LP | | 9.547% 12/31/49 (c)(d) | | 10,500,000 | | 7,164,916 |
| | | |
| HSBC Holdings PLC | | 6.800% 06/01/38 | | 5,640,000 | | 4,795,872 |
| | | |
| JPMorgan Chase Capital XVII | | 5.850% 08/01/35 | | 7,550,000 | | 4,401,212 |
| | | |
| JPMorgan Chase Capital XX | | 6.550% 09/29/36 | | 21,525,000 | | 13,819,459 |
| | | |
| KeyBank NA | | 5.800% 07/01/14 | | 3,850,000 | | 3,219,897 |
See Accompanying Notes to Financial Statements.
17
Columbia Intermediate Bond Fund
March 31, 2009
Corporate Fixed-Income Bonds & Notes (continued)
| | | | | | |
| | | | | Par ($) (a) | | Value ($) |
| Financials (continued) | | | | | | |
| Keycorp | | 6.500% 05/14/13 | | 20,005,000 | | 19,521,579 |
| | | |
| Lloyds TSB Group PLC | | 6.267% 12/31/49 (c)(d) | | 5,475,000 | | 1,177,125 |
| | | |
| M&I Marshall & Ilsley Bank | | 5.300% 09/08/11 | | 4,070,000 | | 3,761,079 |
| | | |
| Merrill Lynch & Co., Inc. | | 5.450% 02/05/13 (i) | | 15,000,000 | | 12,296,400 |
| | 5.700% 05/02/17 (f)(i) | | 9,940,000 | | 5,885,613 |
| | 6.050% 08/15/12 (i) | | 1,500,000 | | 1,287,086 |
| | 6.150% 04/25/13 (i) | | 5,090,000 | | 4,278,639 |
| | 7.750% 05/14/38 (i) | | 5,160,000 | | 3,063,100 |
| | | |
| Morgan Stanley | | 5.950% 12/28/17 | | 2,570,000 | | 2,334,596 |
| | | |
| National City Bank of Cleveland | | 6.200% 12/15/11 | | 1,590,000 | | 1,562,091 |
| | | |
| National City Bank of Kentucky | | 6.300% 02/15/11 | | 2,830,000 | | 2,780,036 |
| | | |
| National City Corp. | | 4.900% 01/15/15 | | 625,000 | | 574,984 |
| | 6.875% 05/15/19 | | 2,535,000 | | 2,146,199 |
| | | |
| Northern Trust Co. | | 6.500% 08/15/18 | | 14,950,000 | | 15,707,815 |
| | | |
| Northern Trust Corp. | | 5.500% 08/15/13 | | 5,525,000 | | 5,782,454 |
| | | |
| Regions Financing Trust II | | 6.625% 05/15/47 (d) | | 2,480,000 | | 898,323 |
| | | |
| Royal Bank of Scotland Group PLC | | 6.990% 10/29/49 (c)(d) | | 6,540,000 | | 2,877,600 |
| | | |
| SunTrust Preferred Capital I | | 5.853% 12/31/49 (d) | | 2,000,000 | | 500,000 |
| | | |
| Union Planters Corp. | | 4.375% 12/01/10 | | 5,970,000 | | 5,706,144 |
| | | |
| USB Capital IX | | 6.189% 04/15/42 (d) | | 10,850,000 | | 4,285,750 |
| | | |
| Wachovia Capital Trust III | | 5.800% 03/15/42 (d) | | 14,365,000 | | 5,171,400 |
| | | |
| Wachovia Corp. | | 5.500% 05/01/13 | | 2,765,000 | | 2,549,477 |
| | 5.750% 02/01/18 | | 1,175,000 | | 1,040,904 |
| | |
| | Banks Total | | | | 236,311,625 |
| | |
| Diversified Financial Services – 2.4% | | | | |
| CDX North America High Yield | | 8.875% 06/29/13 (c) | | 4,750,000 | | 3,776,250 |
| | | |
| Citigroup, Inc. | | 4.125% 02/22/10 | | 10,925,000 | | 10,544,897 |
| | | |
| Eaton Vance Corp. | | 6.500% 10/02/17 | | 8,845,000 | | 7,588,214 |
| | | |
| Ford Motor Credit Co. | | 5.700% 01/15/10 | | 2,000,000 | | 1,713,122 |
| | 7.800% 06/01/12 | | 1,235,000 | | 836,992 |
| | 8.000% 12/15/16 | | 555,000 | | 364,763 |
| | | |
| Fund American Companies, Inc. | | 5.875% 05/15/13 | | 4,535,000 | | 3,481,687 |
See Accompanying Notes to Financial Statements.
18
Columbia Intermediate Bond Fund
March 31, 2009
Corporate Fixed-Income Bonds & Notes (continued)
| | | | | | |
| | | | | Par ($) (a) | | Value ($) |
| Financials (continued) | | | | | | |
| General Electric Capital Corp. | | 5.450% 01/15/13 | | 2,915,000 | | 2,807,174 |
| | 6.875% 01/10/39 | | 3,150,000 | | 2,569,109 |
| | | |
| GMAC LLC | | 6.875% 09/15/11 (c) | | 1,120,000 | | 795,894 |
| | 8.000% 11/01/31 (c) | | 1,433,000 | | 689,502 |
| | | |
| International Lease Finance Corp. | | 4.750% 07/01/09 | | 1,485,000 | | 1,396,038 |
| | 4.875% 09/01/10 | | 5,260,000 | | 3,842,467 |
| | | |
| Lehman Brothers Holdings, Inc. | | 5.625% 01/24/13 (j)(k) | | 23,065,000 | | 2,940,787 |
| | 6.875% 05/02/18 (j)(k) | | 1,685,000 | | 214,838 |
| | | |
| Nuveen Investments, Inc. | | 10.500% 11/15/15 (c) | | 810,000 | | 226,800 |
| | | |
| PF Export Receivables Master Trust | | 3.748% 06/01/13 (c) | | 1,696,013 | | 1,794,534 |
| | |
| | Diversified Financial Services Total | | | | 45,583,068 |
| | | |
| Insurance – 3.6% | | | | | | |
| Asurion Corp. | | 7.033% 07/02/15 (d)(h) | | 810,000 | | 623,135 |
| | | |
| Berkshire Hathaway Finance Corp. | | 4.850% 01/15/15 | | 5,000,000 | | 5,048,635 |
| | | |
| Crum & Forster Holdings Corp. | | 7.750% 05/01/17 | | 555,000 | | 432,900 |
| | | |
| Hartford Life Global Funding Trusts | | 1.490% 09/15/09 (d) | | 5,825,000 | | 5,492,736 |
| | | |
| HUB International Holdings, Inc. | | 10.250% 06/15/15 (c) | | 250,000 | | 118,750 |
| | | |
| ING Groep NV | | 5.775% 12/29/49 (d) | | 5,515,000 | | 1,516,625 |
| | | |
| Liberty Mutual Group, Inc. | | 7.500% 08/15/36 (c) | | 6,805,000 | | 3,822,893 |
| | 10.750% 06/15/58 (c)(d) | | 7,985,000 | | 3,912,650 |
| | | |
| MetLife, Inc. | | 7.717% 02/15/19 | | 630,000 | | 564,897 |
| | | |
| Metropolitan Life Global Funding I | | 5.125% 04/10/13 (c) | | 8,700,000 | | 7,945,632 |
| | | |
| New York Life Global Funding | | 4.650% 05/09/13 (c) | | 21,305,000 | | 20,746,404 |
| | | |
| Principal Life Income Funding Trusts | | 5.300% 04/24/13 | | 17,865,000 | | 16,412,325 |
| | | |
| Prudential Financial, Inc. | | 4.750% 06/13/15 | | 3,210,000 | | 2,334,440 |
| | | |
| USI Holdings Corp. | | 9.750% 05/15/15 (c) | | 280,000 | | 126,000 |
| | |
| | Insurance Total | | | | 69,098,022 |
| | |
| Real Estate Investment Trusts (REITs) – 0.6% | | | | |
| Health Care Property Investors, Inc. | | 5.625% 05/01/17 | | 3,765,000 | | 2,401,773 |
| | 7.072% 06/08/15 | | 2,530,000 | | 1,878,641 |
| | | |
| Highwoods Properties, Inc. | | 5.850% 03/15/17 | | 2,005,000 | | 1,239,842 |
| | | |
| Hospitality Properties Trust | | 5.625% 03/15/17 | | 6,740,000 | | 3,250,284 |
See Accompanying Notes to Financial Statements.
19
Columbia Intermediate Bond Fund
March 31, 2009
Corporate Fixed-Income Bonds & Notes (continued)
| | | | | | |
| | | | | Par ($) (a) | | Value ($) |
| Financials (continued) | | | | | | |
| Host Hotels & Resorts LP | | 6.750% 06/01/16 | | 670,000 | | 489,100 |
| | | |
| Liberty Property LP | | 5.500% 12/15/16 | | 5,075,000 | | 3,278,445 |
| | |
| | Real Estate Investment Trusts (REITs) Total | | | | 12,538,085 |
| | | |
| Savings & Loans – 0.1% | | | | | | |
| Washington Mutual Bank | | 5.125% 01/15/15 (b) | | 20,444,000 | | 2,044 |
| | | |
| Washington Mutual Preferred Funding Delaware | | 6.534% 03/29/49 (c)(d)(e) | | 2,725,000 | | 273 |
| | | |
| World Savings Bank | | 4.500% 06/15/09 | | 1,485,000 | | 1,482,991 |
| | |
| | Savings & Loans Total | | | | 1,485,308 |
| | | | | | |
| Financials Total | | | | | | 365,016,108 |
| | | | | | |
| Health Care – 0.1% | | | | | | |
| Health Services – 0.1% | | | | | | |
| Community Health Systems, Inc. | | 8.875% 07/15/15 | | 1,440,000 | | 1,360,800 |
| | |
| | Health Services Total | | | | 1,360,800 |
| | | | | | |
| Health Care Total | | | | | | 1,360,800 |
| | | | | | |
| Industrials – 3.9% | | | | | | |
| Aerospace & Defense – 0.6% | | | | |
| BE Aerospace, Inc. | | 8.500% 07/01/18 | | 940,000 | | 783,725 |
| | | |
| Boeing Co. | | 6.000% 03/15/19 | | 4,700,000 | | 4,827,290 |
| | | |
| L-3 Communications Corp. | | 6.375% 10/15/15 | | 825,000 | | 777,563 |
| | | |
| Moog, Inc. | | 7.250% 06/15/18 (c) | | 265,000 | | 244,463 |
| | | |
| Raytheon Co. | | 5.500% 11/15/12 | | 800,000 | | 840,687 |
| | 7.200% 08/15/27 | | 1,730,000 | | 1,903,605 |
| | | |
| Sequa Corp. | | 11.750% 12/01/15 (c) | | 920,000 | | 138,000 |
| | | |
| Systems 2001 Asset Trust | | 6.664% 09/15/13 (c) | | 1,443,815 | | 1,314,392 |
| | |
| | Aerospace & Defense Total | | | | 10,829,725 |
| | | |
| Air Transportation – 0.1% | | | | | | |
| Air 2 US | | 8.027% 10/01/19 (c) | | 2,322,052 | | 1,277,128 |
| | |
| | Air Transportation Total | | | | 1,277,128 |
| | |
| Electrical Components & Equipment – 0.1% | | | | |
| Belden, Inc. | | 7.000% 03/15/17 | | 565,000 | | 463,300 |
| | | |
| General Cable Corp. | | 3.810% 04/01/15 (d) | | 220,000 | | 155,650 |
| | 7.125% 04/01/17 | | 715,000 | | 586,300 |
| | |
| | Electrical Components & Equipment Total | | | | 1,205,250 |
See Accompanying Notes to Financial Statements.
20
Columbia Intermediate Bond Fund
March 31, 2009
Corporate Fixed-Income Bonds & Notes (continued)
| | | | | | |
| | | | | Par ($) (a) | | Value ($) |
| Industrials (continued) | | | | | | |
| Electronics – 0.0% | | | | | | |
| Flextronics International Ltd. | | 6.250% 11/15/14 | | 855,000 | | 722,475 |
| | |
| | Electronics Total | | | | 722,475 |
| | |
| Engineering & Construction – 0.0% | | | | |
| Esco Corp. | | 8.625% 12/15/13 (c) | | 235,000 | | 178,600 |
| | |
| | Engineering & Construction Total | | | | 178,600 |
| | |
| Environmental Control – 0.0% | | | | |
| Allied Waste North America, Inc. | | 7.875% 04/15/13 | | 430,000 | | 427,850 |
| | |
| | Environmental Control Total | | | | 427,850 |
| | | |
| Machinery – 1.1% | | | | | | |
| Caterpillar Financial Services Corp. | | 4.250% 02/08/13 | | 8,735,000 | | 8,218,561 |
| | 5.450% 04/15/18 | | 4,000,000 | | 3,431,784 |
| | 6.200% 09/30/13 | | 835,000 | | 835,802 |
| | | |
| Caterpillar, Inc. | | 8.250% 12/15/38 | | 4,625,000 | | 5,011,164 |
| | | |
| John Deere Capital Corp. | | 4.950% 12/17/12 | | 3,285,000 | | 3,297,289 |
| | |
| | Machinery Total | | | | 20,794,600 |
| | |
| Machinery-Construction & Mining – 0.0% | | | | |
| Terex Corp. | | 8.000% 11/15/17 | | 875,000 | | 708,750 |
| | |
| | Machinery-Construction & Mining Total | | | | 708,750 |
| | |
| Machinery-Diversified – 0.0% | | | | |
| Manitowoc Co., Inc. | | 7.125% 11/01/13 | | 785,000 | | 549,500 |
| | | |
| Westinghouse Air Brake Technologies Corp. | | 6.875% 07/31/13 | | 360,000 | | 342,000 |
| | |
| | Machinery-Diversified Total | | | | 891,500 |
| | |
| Miscellaneous Manufacturing – 0.1% | | | | |
| American Railcar Industries, Inc. | | 7.500% 03/01/14 | | 370,000 | | 257,150 |
| | | |
| Bombardier, Inc. | | 6.300% 05/01/14 (c) | | 1,055,000 | | 743,775 |
| | | |
| Koppers Holdings, Inc. | | (g) 11/15/14 (9.875% 11/15/09) | | 580,000 | | 472,700 |
| | | |
| TriMas Corp. | | 9.875% 06/15/12 | | 650,000 | | 318,500 |
| | | |
| Trinity Industries, Inc. | | 6.500% 03/15/14 | | 575,000 | | 465,750 |
| | |
| | Miscellaneous Manufacturing Total | | | | 2,257,875 |
| | | |
| Packaging & Containers – 0.2% | | | | | | |
| Berry Plastics Holding Corp. | | 8.875% 09/15/14 | | 505,000 | | 282,800 |
| | | |
| Crown Americas LLC & Crown Americas Capital Corp. | | 7.750% 11/15/15 | | 1,020,000 | | 1,025,100 |
| | | |
| Owens-Brockway Glass Container, Inc. | | 6.750% 12/01/14 | | 825,000 | | 792,000 |
See Accompanying Notes to Financial Statements.
21
Columbia Intermediate Bond Fund
March 31, 2009
Corporate Fixed-Income Bonds & Notes (continued)
| | | | | | |
| | | | | Par ($) (a) | | Value ($) |
| Industrials (continued) | | | | | | |
| Silgan Holdings, Inc. | | 6.750% 11/15/13 | | 235,000 | | 220,900 |
| | | |
| Solo Cup Co. | | 8.500% 02/15/14 | | 1,045,000 | | 762,850 |
| | |
| | Packaging & Containers Total | | | | 3,083,650 |
| | | |
| Transportation – 1.7% | | | | | | |
| BNSF Funding Trust I | | 6.613% 12/15/55 (d) | | 4,401,000 | | 3,190,725 |
| | | |
| Bristow Group, Inc. | | 7.500% 09/15/17 | | 560,000 | | 420,000 |
| | | |
| Burlington Northern Santa Fe Corp. | | 6.200% 08/15/36 | | 1,440,000 | | 1,313,309 |
| | 7.125% 12/15/10 | | 3,900,000 | | 4,083,967 |
| | 7.950% 08/15/30 | | 2,375,000 | | 2,597,749 |
| | | |
| Navios Maritime Holdings, Inc. | | 9.500% 12/15/14 | | 730,000 | | 416,100 |
| | | |
| Norfolk Southern Corp. | | 6.200% 04/15/09 | | 10,000,000 | | 10,002,280 |
| | | |
| PHI, Inc. | | 7.125% 04/15/13 | | 420,000 | | 258,825 |
| | | |
| Ship Finance International Ltd. | | 8.500% 12/15/13 | | 620,000 | | 421,600 |
| | | |
| Stena AB | | 7.500% 11/01/13 | | 615,000 | | 461,250 |
| | | |
| TFM SA de CV | | 9.375% 05/01/12 | | 825,000 | | 750,750 |
| | | |
| Union Pacific Corp. | | 5.700% 08/15/18 | | 4,875,000 | | 4,640,210 |
| | 6.650% 01/15/11 | | 4,595,000 | | 4,789,511 |
| | |
| | Transportation Total | | | | 33,346,276 |
| | | | | | |
| Industrials Total | | | | | | 75,723,679 |
| | | | | | |
| Technology – 1.4% | | | | | | |
| Computers – 0.0% | | | | | | |
| Sungard Data Systems, Inc. | | 9.125% 08/15/13 | | 895,000 | | 778,650 |
| | |
| | Computers Total | | | | 778,650 |
| | | |
| Semiconductors – 0.0% | | | | | | |
| Amkor Technology, Inc. | | 9.250% 06/01/16 | | 480,000 | | 369,600 |
| | | |
| Freescale Semiconductor, Inc. | | PIK,
9.125% 12/15/14 | | 2,235,000 | | 221,955 |
| | |
| | Semiconductors Total | | | | 591,555 |
| | | |
| Software – 1.4% | | | | | | |
| Oracle Corp. | | 4.950% 04/15/13 | | 6,000,000 | | 6,340,734 |
| | 5.000% 01/15/11 | | 7,210,000 | | 7,558,899 |
| | 6.500% 04/15/38 | | 12,425,000 | | 12,392,397 |
| | |
| | Software Total | | | | 26,292,030 |
| | | | | | |
| Technology Total | | | | | | 27,662,235 |
See Accompanying Notes to Financial Statements.
22
Columbia Intermediate Bond Fund
March 31, 2009
Corporate Fixed-Income Bonds & Notes (continued)
| | | | | | |
| | | | | Par ($) (a) | | Value ($) |
| Utilities – 5.2% | | | | | | |
| Electric – 4.3% | | | | | | |
| AES Corp. | | 7.750% 03/01/14 | | 800,000 | | 716,000 |
| | 8.000% 10/15/17 | | 480,000 | | 411,600 |
| | | |
| American Electric Power Co., Inc. | | 5.250% 06/01/15 | | 7,973,000 | | 7,459,029 |
| | | |
| CMS Energy Corp. | | 6.875% 12/15/15 | | 495,000 | | 458,356 |
| | | |
| Commonwealth Edison Co. | | 5.900% 03/15/36 | | 4,565,000 | | 3,738,269 |
| | 5.950% 08/15/16 | | 6,495,000 | | 6,219,839 |
| | 6.150% 09/15/17 | | 600,000 | | 570,194 |
| | 6.950% 07/15/18 | | 6,020,000 | | 5,634,214 |
| | | |
| Consolidated Edison Co. of New York, Inc. | | 6.750% 04/01/38 | | 17,160,000 | | 16,796,980 |
| | | |
| Dynegy Holdings, Inc. | | 7.125% 05/15/18 | | 1,290,000 | | 683,700 |
| | | |
| Edison Mission Energy | | 7.000% 05/15/17 | | 690,000 | | 503,700 |
| | | |
| Energy Future Holdings Corp. | | PIK,
11.250% 11/01/17 | | 1,790,000 | | 672,369 |
| | | |
| Exelon Generation Co. LLC | | 6.200% 10/01/17 | | 2,120,000 | | 1,895,666 |
| | | |
| FPL Energy American Wind LLC | | 6.639% 06/20/23 (c) | | 3,176,534 | | 2,752,340 |
| | | |
| FPL Energy National Wind LLC | | 5.608% 03/10/24 (c) | | 618,784 | | 503,938 |
| | | |
| Intergen NV | | 9.000% 06/30/17 (c) | | 1,110,000 | | 1,004,550 |
| | | |
| Ipalco Enterprises, Inc. | | 7.250% 04/01/16 (c) | | 600,000 | | 531,000 |
| | | |
| MidAmerican Energy Holdings Co. | | 5.875% 10/01/12 | | 5,500,000 | | 5,709,962 |
| | | |
| Mirant North America LLC | | 7.375% 12/31/13 | | 245,000 | | 221,725 |
| | | |
| NRG Energy, Inc. | | 7.375% 02/01/16 | | 955,000 | | 888,150 |
| | | |
| NSG Holdings LLC/NSG Holdings, Inc. | | 7.750% 12/15/25 (c) | | 525,000 | | 414,750 |
| | | |
| Oglethorpe Power Corp. | | 6.974% 06/30/11 | | 844,000 | | 864,442 |
| | | |
| Oncor Electric Delivery Co. | | 5.950% 09/01/13 (c) | | 6,535,000 | | 6,331,160 |
| | | |
| Pepco Holdings, Inc. | | 1.886% 06/01/10 (d) | | 5,000,000 | | 4,669,725 |
| | | |
| Progress Energy, Inc. | | 7.100% 03/01/11 | | 5,196,000 | | 5,386,657 |
| | | |
| Southern California Edison Co. | | 5.000% 01/15/16 | | 4,500,000 | | 4,531,568 |
| | | |
| Southern Power Co. | | 6.375% 11/15/36 | | 1,385,000 | | 1,139,690 |
| | | |
| Tenaska Alabama II Partners LP | | 6.125% 03/30/23 (c) | | 2,963,886 | | 2,301,783 |
See Accompanying Notes to Financial Statements.
23
Columbia Intermediate Bond Fund
March 31, 2009
Corporate Fixed-Income Bonds & Notes (continued)
| | | | | | |
| | | | | Par ($) (a) | | Value ($) |
| Utilities (continued) | | | | | | |
| Texas Competitive Electric Holdings Co. LLC | | PIK, | | | | |
| | 10.500% 11/01/16 | | 2,080,000 | | 678,600 |
| | |
| | Electric Total | | | | 83,689,956 |
| | | |
| Gas – 0.8% | | | | | | |
| Atmos Energy Corp. | | 6.350% 06/15/17 | | 4,065,000 | | 3,647,264 |
| | 8.500% 03/15/19 | | 5,910,000 | | 6,034,211 |
| | | |
| Centerpoint Energy, Inc. | | 5.950% 02/01/17 | | 115,000 | | 95,372 |
| | 6.500% 05/01/18 | | 200,000 | | 167,378 |
| | | |
| Nakilat, Inc. | | 6.067% 12/31/33 (c) | | 3,300,000 | | 2,232,516 |
| | | |
| Southern California Gas Co. | | 1.431% 12/01/09 (d) | | 3,390,000 | | 3,377,427 |
| | |
| | Gas Total | | | | 15,554,168 |
| | |
| Other Industrial Development Bonds – 0.1% | | | | |
| Mirant Americas Generation LLC | | 8.500% 10/01/21 | | 1,030,000 | | 762,200 |
| | |
| | Other Industrial Development Bonds Total | | | | 762,200 |
| | | | | | |
| Utilities Total | | | | | | 100,006,324 |
| | Total Corporate Fixed-Income Bonds & Notes
(cost of $1,183,097,181) | | | | 996,363,010 |
| | | | | | |
| Mortgage-Backed Securities – 25.6% | | | | |
| Federal Home Loan Mortgage Corp. | | 5.000% 08/01/35 | | 35,788,296 | | 37,003,491 |
| | 6.000% 11/01/37 | | 12,686,460 | | 13,277,793 |
| | 12.000% 07/01/20 | | 70,366 | | 75,330 |
| | | |
| Federal National Mortgage Association | | 5.000% 02/01/36 | | 69,242,501 | | 71,606,483 |
| | 5.000% 05/01/36 | | 26,997,635 | | 27,919,351 |
| | 5.000% 03/01/37 | | 14,192,438 | | 14,660,656 |
| | 5.000% 04/01/38 | | 82,652,966 | | 85,379,739 |
| | 5.000% 01/01/39 | | 39,480,233 | | 40,782,711 |
| | 5.500% 02/01/37 | | 3,521,433 | | 3,658,516 |
| | 5.500% 05/01/38 | | 41,220,094 | | 42,824,715 |
| | 5.500% 06/01/38 | | 24,561,319 | | 25,517,445 |
| | 6.000% 04/01/09 | | 4,147 | | 4,165 |
| | 6.000% 01/01/14 | | 199,972 | | 210,299 |
| | 6.000% 01/01/24 | | 113,235 | | 119,179 |
| | 6.000% 03/01/24 | | 129,094 | | 135,926 |
| | 6.000% 02/01/37 | | 37,692,412 | | 39,455,195 |
| | 6.000% 03/01/38 | | 25,895,806 | | 27,077,110 |
| | 6.500% 10/01/28 | | 607,979 | | 648,346 |
| | 6.500% 12/01/31 | | 668,246 | | 710,109 |
| | 6.500% 08/01/36 | | 15,195,365 | | 16,026,212 |
| | TBA: | | | | |
| | 4.500% 12/01/39 | | 30,000,000 | | 30,656,250 |
| | 5.000% 12/01/39 | | 17,250,000 | | 17,799,844 |
See Accompanying Notes to Financial Statements.
24
Columbia Intermediate Bond Fund
March 31, 2009
Mortgage-Backed Securities (continued)
| | | | | | |
| | | | | Par ($) (a) | | Value ($) |
| | | | | |
| Government National Mortgage Association | | 4.625% 07/20/25 (d) | | 59,470 | | 59,835 |
| | 9.000% 06/15/16 | | 2,105 | | 2,271 |
| | 9.000% 08/15/16 | | 1,576 | | 1,700 |
| | 9.000% 10/15/16 | | 3,550 | | 3,830 |
| | |
| | Total Mortgage-Backed Securities
(cost of $474,481,101) | | | | 495,616,501 |
| | | | | | |
| Asset-Backed Securities – 7.2% | | | | | | |
| Bay View Auto Trust | | 5.310% 06/25/14 | | 3,500,000 | | 3,109,764 |
| | | |
| Capital Auto Receivables Asset Trust | | 5.310% 06/15/12 | | 9,000,000 | | 6,725,225 |
| | 5.500% 04/20/10 (c) | | 4,400,000 | | 4,359,613 |
| | | |
| Capital One Auto Finance Trust | | 0.606% 12/15/11 (d) | | 17,260,437 | | 15,936,149 |
| | | |
| Carmax Auto Owner Trust | | 4.730% 09/17/12 | | 2,900,000 | | 2,357,170 |
| | | |
| Citicorp Residential Mortgage Securities, Inc. | | 5.892% 03/25/37 (d) | | 11,000,000 | | 7,103,125 |
| | 6.080% 06/25/37 (d) | | 11,000,000 | | 8,253,997 |
| | | |
| Citigroup Mortgage Loan Trust, Inc. | | 5.517% 08/25/35 (d) | | 3,775,000 | | 368,457 |
| | 5.598% 03/25/36 (d) | | 2,718,440 | | 2,108,618 |
| | 5.666% 08/25/35 (d) | | 2,330,000 | | 143,682 |
| | | |
| Countrywide Asset-Backed Certificates | | 0.632% 06/25/21 (d)(k) | | 1,475,517 | | 1,224,679 |
| | 5.813% 05/25/37 (d) | | 8,019,562 | | 2,256,656 |
| | | |
| Discover Card Master Trust | | 5.100% 10/15/13 | | 7,000,000 | | 6,869,027 |
| | | |
| Ford Credit Auto Owner Trust | | 0.886% 06/15/10 (d) | | 2,180,417 | | 2,170,622 |
| | 5.160% 04/15/13 | | 5,000,000 | | 4,642,601 |
| | 5.680% 06/15/12 | | 5,422,000 | | 4,227,462 |
| | 5.690% 11/15/12 | | 6,000,000 | | 4,644,814 |
| | | |
| Franklin Auto Trust | | 5.360% 05/20/16 | | 4,720,000 | | 4,524,136 |
| | | |
| GE Capital Credit Card Master Note Trust | | 4.130% 06/15/13 | | 9,725,000 | | 9,544,741 |
| | | |
| GE Equipment Small Ticket LLC | | 4.620% 12/22/14 (c) | | 771,552 | | 756,353 |
| | 5.120% 06/22/15 (c) | | 2,015,869 | | 1,870,571 |
| | | |
| Green Tree Financial Corp. | | 6.870% 01/15/29 | | 1,276,895 | | 991,137 |
| | | |
| Harley-Davidson Motorcycle Trust | | 5.540% 04/15/15 | | 4,600,000 | | 2,085,697 |
| | | |
| Honda Auto Receivables Owner Trust | | 4.470% 01/18/12 | | 10,375,000 | | 10,501,772 |
| | | |
| JPMorgan Auto Receivables Trust | | 5.610% 12/15/14 (c) | | 3,532,305 | | 3,463,486 |
See Accompanying Notes to Financial Statements.
25
Columbia Intermediate Bond Fund
March 31, 2009
Asset-Backed Securities (continued)
| | | | | | |
| | | | | Par ($) (a) | | Value ($) |
| | | | | |
| Origen Manufactured Housing | | 3.790% 12/15/17 | | 199,072 | | 192,909 |
| | | |
| Renaissance Home Equity Loan Trust | | 5.355% 11/25/35 (d) | | 4,750,000 | | 1,086,214 |
| | | |
| Santander Drive Auto Receivables Trust | | 1.106% 06/15/11 (d) | | 47,181 | | 47,007 |
| | | |
| Small Business Administration Participation Certificates | | 4.570% 06/01/25 | | 3,333,808 | | 3,487,642 |
| | 5.390% 12/01/25 | | 866,227 | | 931,727 |
| | 5.570% 03/01/26 | | 3,192,624 | | 3,485,596 |
| | 5.780% 08/01/27 | | 5,448,689 | | 5,960,598 |
| | | |
| USAA Auto Owner Trust | | 4.280% 10/15/12 | | 8,180,000 | | 8,262,256 |
| | | |
| Wachovia Auto Loan Owner Trust | | 5.650% 02/20/13 | | 8,000,000 | | 3,425,772 |
| | | |
| WFS Financial Owner Trust | | 4.760% 05/17/13 | | 4,000,000 | | 2,735,899 |
| | |
| | Total Asset-Backed Securities
(cost of $178,057,183) | | | | 139,855,174 |
| | | | | | |
| Commercial Mortgage-Backed Securities – 6.3% | | | | |
| Bear Stearns Commercial Mortgage Securities | | 5.422% 09/11/42 | | 8,862,506 | | 8,668,995 |
| | 4.750% 02/13/46 (d) | | 12,000,000 | | 9,236,107 |
| | 5.742% 09/11/42 (d) | | 1,500,000 | | 1,123,363 |
| | 5.718% 09/11/38 (d) | | 1,290,000 | | 1,099,873 |
| | | |
| First Union National Bank Commercial Mortgage Trust | | 5.585% 02/12/34 | | 1,062,217 | | 1,055,864 |
| | 6.141% 02/12/34 | | 8,000,000 | | 7,939,334 |
| | | |
| GE Capital Commercial Mortgage Corp. | | 5.189% 07/10/39 (d) | | 14,000,000 | | 11,580,388 |
| | | |
| GMAC Commercial Mortgage Securities, Inc. | | 5.486% 05/10/40 (d) | | 8,970,000 | | 8,660,217 |
| | | |
| JPMorgan Chase Commercial Mortgage Securities Corp. | | 5.814% 06/12/43 (d) | | 7,950,000 | | 5,623,315 |
| | 5.440% 06/12/47 | | 4,800,000 | | 3,097,921 |
| | | |
| LB-UBS Commercial Mortgage Trust | | 6.510% 12/15/26 | | 4,762,450 | | 4,769,699 |
| | 4.853% 09/15/31 | | 5,270,000 | | 4,981,342 |
| | | |
| Morgan Stanley Capital I | | 5.208% 11/14/42 (d) | | 5,555,000 | | 4,338,290 |
| | | |
| Morgan Stanley Dean Witter Capital I | | 4.180% 03/12/35 | | 5,761,170 | | 5,553,612 |
| | 5.980% 01/15/39 | | 8,915,000 | | 8,697,501 |
| | | |
| Structured Asset Securities Corp. | | I.O.,
2.171% 02/25/28 (d) | | 3,052,910 | | 141 |
See Accompanying Notes to Financial Statements.
26
Columbia Intermediate Bond Fund
March 31, 2009
Commercial Mortgage-Backed Securities (continued)
| | | | | | |
| | | | | Par ($) (a) | | Value ($) |
| | | | | | | |
| Wachovia Bank Commercial Mortgage Trust | | 3.989% 06/15/35 | | 11,930,000 | | 10,274,566 |
| | 5.466% 01/15/45 (d) | | 10,000,000 | | 4,543,716 |
| | 4.980% 11/15/34 | | 6,110,000 | | 5,777,467 |
| | 5.741% 05/15/43 (d) | | 5,190,000 | | 4,128,118 |
| | 5.903% 02/15/51 (d) | | 13,000,000 | | 5,838,664 |
| | 5.037% 03/15/42 | | 5,000,000 | | 4,683,420 |
| | |
| | Total Commercial Mortgage-Backed Securities
(cost of $143,202,497) | | | | 121,671,913 |
Government & Agency Obligations – 5.9% | | | | |
| U.S. Government Obligations – 5.9% | | | | |
| U.S. Treasury Bonds | | 4.500% 05/15/38 (l)(m) | | 27,145,000 | | 31,691,788 |
| | | |
| U.S. Treasury Inflation Indexed Bonds | | 2.000% 07/15/14 | | 13,999,750 | | 14,454,742 |
| | | |
| U.S. Treasury Notes | | 0.875% 12/31/10 | | 4,020,000 | | 4,027,381 |
| | 0.875% 02/28/11 | | 3,785,000 | | 3,792,229 |
| | 1.375% 03/15/12 (l) | | 7,510,000 | | 7,562,217 |
| | 1.875% 02/28/14 (l) | | 43,995,000 | | 44,476,305 |
| | 2.750% 02/15/19 (l) | | 7,370,000 | | 7,410,314 |
U.S. Government Obligations Total | | | | | | 113,414,976 |
| | Total Government & Agency Obligations
(cost of $110,686,007) | | | | 113,414,976 |
| | | | | | |
Collateralized Mortgage Obligations – 2.6% | | | | |
| Agency – 1.2% | | | | | | |
| Federal Home Loan Mortgage Corp. | | 4.000% 03/15/19 | | 7,075,000 | | 7,297,752 |
| | 5.000% 03/15/28 | | 15,000,000 | | 15,547,121 |
| | | |
| Federal National Mortgage Association | | 9.250% 03/25/18 | | 79,395 | | 87,799 |
Agency Total | | | | | | 22,932,672 |
| | | | | | |
| Non-Agency – 1.4% | | | | | | |
| American Home Mortgage Investment Trust | | 0.632% 06/25/36 (d) | | 2,785,862 | | 2,408,974 |
| | | |
| American Mortgage Trust | | 8.445% 09/27/22 | | 9,649 | | 5,853 |
| | | |
| Countrywide Alternative Loan Trust | | 5.500% 09/25/35 | | 6,397,475 | | 501,394 |
| | | |
| GSMPS Mortgage Loan Trust | | 7.750% 09/19/27 (c)(d) | | 687,518 | | 687,079 |
| | | |
| JPMorgan Mortgage Trust | | 5.730% 05/25/36 (d) | | 9,016,653 | | 4,686,709 |
| | | |
| Nomura Asset Acceptance Corp. | | 0.622% 08/25/36 (d) | | 3,891,201 | | 3,239,016 |
| | 5.515% 01/25/36 (d) | | 8,060,000 | | 4,495,756 |
| | 6.138% 03/25/47 | | 9,500,000 | | 5,050,092 |
See Accompanying Notes to Financial Statements.
27
Columbia Intermediate Bond Fund
March 31, 2009
Collateralized Mortgage Obligations (continued)
| | | | | | |
| | | | | Par ($) (a) | | Value ($) |
| Non-Agency (continued) | | | | | | |
| Wells Fargo Mortgage Backed Securities Trust | | 6.301% 10/25/37 (d) | | 8,474,114 | | 5,514,782 |
| Non-Agency Total | | | | | | 26,589,655 |
| | Collateralized Mortgage Obligations Total
(cost of $70,459,119) | | | | 49,522,327 |
Municipal Bonds – 0.7% | | | | | | |
| California – 0.3% | | | | | | |
| CA Los Angeles Community College District | | Series 2008 F-1,
5.000% 08/01/33 | | 6,200,000 | | 5,971,468 |
| California Total | | | | | | 5,971,468 |
| | | | | | |
| New York – 0.4% | | | | | | |
| NY Triborough Bridge & Tunnel Authority | | Series 2008 C,
5.000% 11/15/38 | | 7,500,000 | | 7,263,150 |
| New York Total | | | | | | 7,263,150 |
| | | | | | |
| Virginia – 0.0% | | | | | | |
| VA Tobacco Settlement Financing Corp. | | Series 2007 A1,
6.706% 06/01/46 | | 545,000 | | 268,363 |
| Virginia Total | | | | | | 268,363 |
| | Total Municipal Bonds
(cost of $14,112,316) | | | | 13,502,981 |
Common Stock – 0.0% | | | | Shares | | |
| Industrials – 0.0% | | | | | | |
| Airlines – 0.0% | | | | | | |
| | UAL Corp. (n) | | 1,493 | | 6,689 |
| | |
| | Airlines Total | | | | 6,689 |
| | | | | | |
| Industrials Total | | | | | | 6,689 |
| | Total Common Stock
(cost of $53,240) | | | | 6,689 |
Preferred Stock – 0.0% | | | | | | |
| Communications – 0.0% | | | | | | |
| Media – 0.0% | | | | | | |
| | CMP Susquehanna Radio Holdings Corp. 0.00% (d)(k) | | 8,862 | | 89 |
| | |
| | Media Total | | | | 89 |
| | | | | | |
| Communications Total | | | | | | 89 |
| | Total Preferred Stock
(cost of $89) | | | | 89 |
See Accompanying Notes to Financial Statements.
28
Columbia Intermediate Bond Fund
March 31, 2009
Warrants – 0.0%
| | | | | | | |
| | | | | Units | | Value ($) | |
| Financials – 0.0% | | | | | | | |
| Banks – 0.0% | | | | | | | |
| | CNB Capital Trust I (k)(n) | | 10,127 | | 101 | |
| | | | | | | |
| | Banks Total | | | | 101 | |
| | | | | | | |
| Financials Total | | | | | | 101 | |
| | Total Warrants
(cost of $101) | | | | 101 | |
Convertible Bond – 0.0% | | | | Par ($)(a) | | | |
| Consumer Discretionary – 0.0% | | | | | |
| Media – 0.0% | | | | | | | |
| Virgin Media, Inc. | | 6.500% 11/15/16 (c) | | 780,000 | | 419,250 | |
| | | | | | | |
| | Media Total | | | | 419,250 | |
| | | |
| | Total Convertible Bond
(cost of $360,573) | | | | 419,250 | |
| | | | | Shares | | | |
| Securities Lending Collateral – 2.1% | | | | | |
| | State Street Navigator Securities Lending Prime Portfolio (o) (7 day yield of 0.943%) | | 41,273,474 | | 41,273,474 | |
| | | | | | | |
| | Total Securities Lending Collateral
(cost of $41,273,474) | | | | 41,273,474 | |
| | | | | Par ($)(a) | | | |
| Short-Term Obligation – 1.7% | | | | | |
| | Repurchase agreement with Fixed Income Clearing Corp., dated 03/31/09, due 04/01/09 at 0.140%, collateralized by a U.S. Government Agency Obligation maturing 01/15/13, market value $32,851,500 (repurchase proceeds $32,206,125) | | 32,206,000 | | 32,206,000 | |
| | | |
| | Total Short-Term Obligation (cost of $32,206,000) | | 32,206,000 | |
| | |
| | | | | |
| | Total Investments – 103.6% (cost of $2,247,988,881) (p) | | 2,003,852,485 | |
| | |
| | | | | |
| | Obligation to Return Collateral for Securities Loaned – (2.1)% | | (41,273,474 | ) |
| | |
| | | | | |
| | Other Assets & Liabilities, Net – (1.5)% | | (27,786,444 | ) |
| | |
| | | | | |
| | Net Assets – 100.0% | | 1,934,792,567 | |
See Accompanying Notes to Financial Statements.
29
Columbia Intermediate Bond Fund
March 31, 2009
Notes to Investment Portfolio:
| | (a) | Principal amount is stated in U.S. dollars unless otherwise noted. |
| | (b) | The issuer is in default of certain debt covenants. Income is not being accrued. At March 31, 2009, the value of these securities amounted to $220,394, which represents 0.01% of net assets. |
| | (c) | Security exempt from registration pursuant to Rule 144A under the Securities Act of 1933. These securities may be resold in transactions exempt from registration, normally to qualified institutional buyers. At March 31, 2009, these securities, which are not illiquid, except for the following, amounted to $177,065,690, which represents 9.2% of net assets. |
| | | | | | | | | | | |
Security | | Acquisition Date | | Par/Unit | | Cost | | Value |
ACE Cash Express, Inc.
10.250% 10/01/14 | | 02/11/06 | | $ | 280,000 | | $ | 284,200 | | $ | 70,000 |
Capital Auto Receivables Asset Trust,
5.500% 04/20/10 | | 08/30/06 | | | 4,400,000 | | | 4,399,025 | | | 4,359,613 |
GE Equipment Small Ticket LLC:
4.620% 12/22/14 | | 09/01/05-09/09/08 | | | 771,552 | | | 770,239 | | | 756,353 |
5.120% 06/22/15 | | 12/15/05 | | | 2,015,869 | | | 2,015,861 | | | 1,870,571 |
JPMorgan Auto Receivables Trust,
5.610% 12/15/14 | | 09/20/06 | | | 3,532,305 | | | 3,532,000 | | | 3,463,486 |
Local TV Finance LLC, PIK,
9.250% 06/15/15 | | 05/07/07 | | | 600,000 | | | 542,019 | | | 43,658 |
Orascom Telecom Finance SCA
7.875% 02/08/14 | | 02/01/07 | | | 280,000 | | | 280,000 | | | 179,200 |
Ras Laffan Liquefied Natural Gas Co., Ltd. II,
5.298% 09/30/20 | | 01/07/08 | | | 3,400,000 | | | 3,247,748 | | | 2,898,704 |
Seminole Indian Tribe of Florida
7.804% 10/01/20 | | 09/26/07 | | | 570,000 | | | 578,930 | | | 444,908 |
Systems 2001 Asset Trust,
6.664% 09/15/13 | | 10/17/02 | | | 1,443,815 | | | 1,443,815 | | | 1,314,392 |
| | | | | | | | | | | |
| | | | | | | | | | $ | 15,400,885 |
| | | | | | | | | | | |
| | (d) | The interest rate shown on floating rate or variable rate securities reflects the rate at March 31, 2009. |
| | (e) | The issuer is in default of certain debt covenants. Income is being accrued. At March 31, 2009, the value of these securities amounted to $1,288,253, which represents 0.1% of net assets. |
| | (f) | A portion of this security is pledged as collateral for credit default swap contracts. At March 31, 2009, the total market value of securities pledged amounted to $15,834,366, which represents 0.8% of net assets. |
| | (g) | Step bond. This security is currently not paying coupon. Shown parenthetically is the next coupon rate to be paid and the date the security will begin accruing at this rate. |
| | (h) | Loan participation agreement. |
| | (i) | Investments in affiliates during the twelve months ended March 31, 2009: |
Security name: Merrill Lynch & Co., Inc.
5.450% 02/05/13
5.700% 05/02/17
6.050% 08/15/12
6.150% 04/25/13
7.750% 05/14/38
| | | | |
Par as of 03/31/08: | | $ | 26,440,000 | |
Par purchased: | | $ | 13,210,000 | |
Par sold: | | $ | (2,960,000 | ) |
Par as of 03/31/09: | | $ | 36,690,000 | |
Net realized gain/loss: | | $ | (83,718 | ) |
Interest income earned: | | $ | 2,237,276 | |
Value at end of period: | | $ | 26,810,838 | |
As of 01/01/2009, Merrill Lynch & Co., Inc. is a wholly owned subsidiary of Bank of America Corporation and an affiliate of Columbia Management.
| | (j) | The issuer has filed for bankruptcy protection under Chapter 11, and is in default of certain debt covenants. Income is not being accrued. At March 31, 2009, the value of this security amounted to $3,155,625, which represents 0.2% of net assets. |
| | (k) | Represents fair value as determined in good faith under procedures approved by the Board of Trustees. The value of these securities amounted to $4,397,594, which represents 0.2% of net assets. |
| | (l) | All or a portion of this security was on loan at March 31, 2009. The total market value of securities on loan at March 31, 2009 is $40,125,180. |
| | (m) | The security or a portion of the security is pledged as collateral for open futures contracts. At March 31, 2009, the total market value of securities pledged amounted to $4,903,500, which represents 0.3% of net assets. |
See Accompanying Notes to Financial Statements.
30
Columbia Intermediate Bond Fund
March 31, 2009
| | (o) | Investment made with cash collateral received from securities lending activity. |
| | (p) | Cost for federal income tax purposes is $2,253,420,664. |
| | (q) | Security is guaranteed by the Federal Deposit Insurance Company. |
At March 31, 2009, the Fund had entered into the following credit default swap contracts:
| | | | | | | | | | | | | | | | |
Swap
Counterparty | | Referenced
Obligation | | Receive
Buy/Sell
Protection | | Fixed
Rate | | | Expiration
Date | | Notional
Amount | | Value of
Contract | |
JPMorgan | | Macy’s Inc.
7.450%07/15/17 | | Buy | | 3.600 | % | | 12/20/13 | | $ | 12,840,000 | | $ | 1,333,395 | |
Barclays Capital | | Home Depot, Inc.
5.875% 12/16/36 | | Buy | | 2.930 | % | | 12/20/13 | | | 21,545,000 | | | (1,043,589 | ) |
Morgan Stanley | | Limited Brands, Inc.
6.125% 12/01/12 | | Buy | | 5.270 | % | | 12/20/13 | | | 17,500,000 | | | (372,797 | ) |
Morgan Stanley | | Home Depot, Inc.
5.875% 12/16/36 | | Buy | | 3.350 | % | | 12/20/13 | | | 8,000,000 | | | (531,805 | ) |
Barclays Capital | | Limited Brands, Inc.
6.125% 12/01/12 | | Buy | | 6.150 | % | | 03/20/14 | | | 17,500,000 | | | (1,006,827 | ) |
Barclays Capital | | Time Warner, Inc.
5.875% 11/15/16 | | Buy | | 1.200 | % | | 03/20/14 | | | 15,685,000 | | | (85,954 | ) |
| | | | | | | | | | | | | | | | |
| | | | | | | | | | | | | | $ | (1,707,577 | ) |
| | | | | | | | | | | | | | | | |
Forward foreign currency exchange contracts outstanding on March 31, 2009 are:
| | | | | | | | | | | | |
Forward Foreign Currency
Contract to Sell | | Value | | Aggregate
Face Value | | Settlement
Date | | Unrealized
Depreciation | |
EUR | | $ | 192,637 | | $ | 189,196 | | 04/23/09 | | $ | (3,441 | ) |
At March 31, 2009, the Fund held the following open short futures contracts:
| | | | | | | | | | | | | | |
Type | | Number of
Contracts | | Value | | Aggregate
Face Value | | Expiration
Date | | Unrealized
Depreciation | |
5-Year U.S. Treasury Notes | | 535 | | $ | 63,539,609 | | $ | 62,534,746 | | Jun-2009 | | $ | (1,004,863 | ) |
30-Year U.S. Treasury Bonds | | 175 | | | 22,698,047 | | | 22,164,275 | | Jun-2009 | | | (533,772 | ) |
| | | | | | | | | | | | | | |
| | | | | | | | | | | | $ | (1,538,635 | ) |
| | | | | | | | | | | | | | |
On April 1, 2008, the Fund adopted Statement of Financial Accounting Standards No. 157, Fair Value Measurements (“SFAS 157”). SFAS 157 establishes a hierarchy that prioritizes the inputs to valuation techniques used to measure fair value giving the highest priority to unadjusted quoted prices in active markets for identical securities (level 1 measurements) and the lowest priority to unobservable inputs (level 3 measurements) when market prices are not readily available or reliable. The three levels of the fair value hierarchy under SFAS 157 are described below:
| | • | | Level 1 – quoted prices in active markets for identical securities |
| | • | | Level 2 – prices determined using other significant observable inputs (including quoted prices for similar securities, interest rates, prepayment speeds, credit risk and others) |
| | • | | Level 3 – prices determined using significant unobservable inputs. In situations where quoted prices or observable inputs are unavailable or less reliable, unobservable inputs may be used. Unobservable inputs may include management’s own assumptions about the factors market participants would use in pricing an investment. |
The inputs or methodology used for valuing securities are not necessarily an indication of the risk associated with investing in those securities.
The following table summarizes the inputs used, as of March 31, 2009 in valuing the Fund’s assets:
| | | | | | | |
Valuation Inputs | | Investments in
Securities | | Other Financial
Instruments* | |
Level 1 – Quoted Prices | | $ | 203,151,232 | | $ | (1,538,635 | ) |
Level 2 – Other Significant Observable Inputs | | | 1,794,790,425 | | | (1,711,018 | ) |
Level 3 – Significant Unobservable Inputs | | | 5,910,828 | | | — | |
| | | | | | | |
Total | | $ | 2,003,852,485 | | $ | (3,249,653 | ) |
| | | | | | | |
| | * | Other financial instruments consist of futures contracts, forward foreign currency exchange contracts and credit default swap contracts which are not included in the investment portfolio. |
The Fund’s assets assigned to the Level 2 input category include certain foreign securities for which a third party statistical pricing service may be employed for purposes of fair market valuation.
See Accompanying Notes to Financial Statements.
31
Columbia Intermediate Bond Fund
March 31, 2009
The following table reconciles asset balances for the year ended March 31, 2009 in which significant unobservable inputs (Level 3) were used in determining value:
| | | | | | | |
| | | Investments
in Securities | | | Other Financial Instruments |
Balance as of March 31, 2008 | | $ | 12,967,628 | | | $ | — |
Accretion of discounts/amortization of premiums | | | — | | | | — |
Realized gain | | | 9,190 | | | | — |
Change in unrealized depreciation | | | (1,670,189 | ) | | | — |
Net sales | | | (5,786,288 | ) | | | — |
Transfers in and/or out of Level 3 | | | 390,487 | | | | — |
| | | | | | | |
Balance as of March 31, 2009 | | $ | 5,910,828 | | | $ | — |
| | | | | | | |
The change in unrealized losses attributable to securities owned at March 31, 2009 which were valued using significant unobservable inputs (Level 3) amounted to $1,670,189. This amount is included in net change in unrealized depreciation on the Statement of Changes in Net Assets.
The information in the above reconciliation represents fiscal year to date activity for any securities identified as using Level 3 inputs at either the beginning or the end of the current fiscal period.
At March 31, 2009, the asset allocation of the Fund is as follows:
| | | |
Asset Allocation (Unaudited) | | % of Net Assets | |
Corporate Fixed-Income Bonds & Notes | | 51.5 | |
Mortgage-Backed Securities | | 25.6 | |
Asset-Backed Securities | | 7.2 | |
Commercial Mortgage-Backed Securities | | 6.3 | |
Government & Agency Obligations | | 5.9 | |
Collateralized Mortgage Obligations | | 2.6 | |
Municipal Bonds | | 0.7 | |
Common Stock | | 0.0 | * |
Preferred Stock | | 0.0 | * |
Warrants | | 0.0 | * |
Convertible Bond | | 0.0 | * |
| | | |
| | 99.8 | |
Securities Lending Collateral | | 2.1 | |
Short-Term Obligation | | 1.7 | |
Obligation to Return Collateral for Securities Loaned | | (2.1 | ) |
Other Assets & Liabilities, Net | | (1.5 | ) |
| | | |
| | 100.0 | |
| | | |
* Represent less than 0.1%.
| | |
Acronym | | Name |
| EUR | | Euro |
| I.O. | | Interest Only |
| PIK | | Payment-In-Kind |
| TBA | | To Be Announced |
See Accompanying Notes to Financial Statements.
32
Statement of Assets and Liabilities – Columbia Intermediate Bond Fund
March 31, 2009
| | | | | |
| | | | | ($) | |
| Assets | | Unaffiliated investments, at identified cost | | 2,211,783,286 | |
| | Affiliated investments, at identified cost | | 36,205,595 | |
| | | | | |
| | Total investments, at identified cost | | 2,247,988,881 | |
| | Unaffiliated investments at value (including securities on loan of $40,125,180) | | 1,977,041,647 | |
| | Affiliated investments, at value | | 26,810,838 | |
| | | | | |
| | Total investments, at value | | 2,003,852,485 | |
| | Cash | | 90,308 | |
| | Cash collateral for open credit default swap contracts | | 3,260,000 | |
| | Open credit default swap contracts | | 1,333,395 | |
| | Receivable for: | | | |
| | Investments sold | | 10,906,928 | |
| | Fund shares sold | | 985,120 | |
| | Interest | | 23,746,783 | |
| | Securities lending | | 34,178 | |
| | Trustees’ deferred compensation plan | | 59,516 | |
| | Other assets | | 495,908 | |
| | | |
| | Total Assets | | 2,044,764,621 | |
| | |
| Liabilities | | Collateral on securities loaned | | 41,273,474 | |
| | Open credit default swap contracts | | 3,040,972 | |
| | Unrealized depreciation on forward foreign currency exchange contracts | | 3,441 | |
| | Payable for: | | | |
| | Investments purchased | | 55,361,502 | |
| | Fund shares repurchased | | 3,762,849 | |
| | Futures variation margin | | 277,539 | |
| | Distributions | | 4,615,310 | |
| | Investment advisory fee | | 532,997 | |
| | Administration fee | | 247,069 | |
| | Transfer agent fee | | 498,382 | |
| | Pricing and bookkeeping fees | | 23,422 | |
| | Trustees’ fees | | 608 | |
| | Custody fee | | 9,935 | |
| | Distribution and service fees | | 88,236 | |
| | Chief compliance officer expenses | | 339 | |
| | Trustees’ deferred compensation plan | | 59,516 | |
| | Deferred dollar roll income | | 53,568 | |
| | Other liabilities | | 122,895 | |
| | | |
| | Total Liabilities | | 109,972,054 | |
| |
| | | |
| | Net Assets | | 1,934,792,567 | |
| | |
| Net Assets Consist of | | Paid-in capital | | 2,271,538,389 | |
| | Undistributed net investment income | | 8,446,917 | |
| | Accumulated net realized loss | | (95,923,487 | ) |
| | Net unrealized appreciation (depreciation) on: | | | |
| | Investments | | (244,136,396 | ) |
| | Foreign currency translations | | (3,288 | ) |
| | Credit default swap contracts | | (3,590,933 | ) |
| | Futures contracts | | (1,538,635 | ) |
| | | |
| | Net Assets | | 1,934,792,567 | |
See Accompanying Notes to Financial Statements.
33
Statement of Assets and Liabilities (continued) – Columbia Intermediate Bond Fund
March 31, 2009
| | | | | | |
| | | | | | |
| Class A | | Net assets | | $ | 153,434,524 | |
| | Shares outstanding | | | 19,884,124 | |
| | Net asset value per share | | $ | 7.72 | (a) |
| | Maximum sales charge | | | 3.25 | % |
| | Maximum offering price per share ($7.72/0.9675) | | $ | 7.98 | (b) |
| | |
| Class B | | | | | | |
| | Net assets | | $ | 37,247,353 | |
| | Shares outstanding | | | 4,826,978 | |
| | Net asset value and offering price per share | | $ | 7.72 | (a) |
| | |
| Class C | | | | | | |
| | Net assets | | $ | 31,371,822 | |
| | Shares outstanding | | | 4,065,546 | |
| | Net asset value and offering price per share | | $ | 7.72 | (a) |
| | |
| Class R | | | | | | |
| | Net assets | | $ | 1,819,247 | |
| | Shares outstanding | | | 235,757 | |
| | Net asset value, offering and redemption price per share | | $ | 7.72 | |
| | |
| Class Z | | | | | | |
| | Net assets | | $ | 1,710,919,621 | |
| | Shares outstanding | | | 221,720,590 | |
| | Net asset value, offering and redemption price per share | | $ | 7.72 | |
| (a) | Redemption price per share is equal to net asset value less any applicable contingent deferred sales charge. |
| (b) | On sales of $50,000 or more the offering price is reduced. |
See Accompanying Notes to Financial Statements.
34
Statement of Operations – Columbia Intermediate Bond Fund
For the Year Ended March 31, 2009
| | | | | |
| | | | | ($) | |
| Investment Income | | Interest | | 132,111,121 | |
| | Interest from affiliates | | 2,237,276 | |
| | Dividends | | 5,015 | |
| | Dollar roll fee income | | 4,328,515 | |
| | Securities lending | | 1,202,627 | |
| | | |
| | Total Investment Income | | 139,884,554 | |
| | |
| Expenses | | Investment advisory fee | | 7,167,840 | |
| | Administration fee | | 3,373,301 | |
| | Distribution fees: | | | |
| | Class A | | 179,854 | |
| | Class B | | 345,233 | |
| | Class C | | 248,923 | |
| | Class R | | 8,627 | |
| | Service fees: | | | |
| | Class A | | 449,801 | |
| | Class B | | 115,078 | |
| | Class C | | 82,971 | |
| | Transfer agent fee | | 2,973,276 | |
| | Pricing and bookkeeping fees | | 188,898 | |
| | Trustees’ fees | | 86,395 | |
| | Custody fee | | 106,587 | |
| | Chief compliance officer expenses | | 1,449 | |
| | Other expenses | | 602,174 | |
| | | |
| | Expenses before interest expense | | 15,930,407 | |
| | Interest expense | | 7,356 | |
| | | |
| | Total Expenses | | 15,937,763 | |
| | |
| | Fees waived by distributor: | | | |
| | Class A | | (179,854 | ) |
| | Class C | | (49,793 | ) |
| | Expense reductions | | (21,209 | ) |
| | | |
| | Net Expenses | | 15,686,907 | |
| |
| | | |
| | Net Investment Income | | 124,197,647 | |
| | |
| Net Realized and Unrealized Gain (Loss) on Investments, Futures Contracts, Credit Default Swap Contracts and Foreign Currency | | Net realized gain (loss) on: | | | |
| | Unaffiliated investments | | (97,725,076 | ) |
| | Affiliated investments | | (83,718 | ) |
| | Foreign currency translations and forward foreign currency exchange contracts | | 3,245,172 | |
| | Futures contracts | | 4,118,058 | |
| | Credit default swap contracts | | 6,626,636 | |
| | | |
| | Net realized loss | | (83,818,928 | ) |
| | |
| | Net change in unrealized appreciation (depreciation) on: | | | |
| | Investments | | (194,872,413 | ) |
| | Foreign currency translations and forward foreign currency exchange contracts | | (132,488 | ) |
| | Credit default swap contracts | | (2,612,080 | ) |
| | Futures contracts | | 2,531,652 | |
| | | |
| | Net change in unrealized appreciation (depreciation) | | (195,085,329 | ) |
| | | |
| | Net Loss | | (278,904,257 | ) |
| |
| | | |
| | Net Decrease Resulting from Operations | | (154,706,610 | ) |
See Accompanying Notes to Financial Statements.
35
Statement of Changes in Net Assets – Columbia Intermediate Bond Fund
| | | | | | | | |
| | | | | Year Ended March 31, | |
| Increase (Decrease) in Net Assets | | | | 2009 ($) | | | 2008 ($) | |
| Operations | | Net investment income | | 124,197,647 | | | 122,461,555 | |
| | Net realized gain (loss) on investments, futures contracts, credit default swap contracts, foreign currency transactions and forward foreign currency exchange contracts | | (83,818,928 | ) | | 23,752,665 | |
| | Net change in unrealized appreciation (depreciation) on investments, futures contracts, credit default swap contracts, foreign currency translations and forward foreign currency exchange contracts | | (195,085,329 | ) | | (58,480,497 | ) |
| | | |
| | Net increase (decrease) resulting from operations | | (154,706,610 | ) | | 87,733,723 | |
| | | |
| Distributions to Shareholders | | From net investment income: | | | | | | |
| | Class A | | (9,455,771 | ) | | (10,248,129 | ) |
| | Class B | | (2,075,339 | ) | | (2,477,719 | ) |
| | Class C | | (1,548,169 | ) | | (1,551,311 | ) |
| | Class R | | (86,795 | ) | | (38,402 | ) |
| | Class Z | | (109,356,195 | ) | | (109,228,776 | ) |
| | From net realized gains: | | | | | | |
| | Class A | | (428,610 | ) | | — | |
| | Class B | | (112,718 | ) | | — | |
| | Class C | | (77,526 | ) | | — | |
| | Class R | | (3,556 | ) | | — | |
| | Class Z | | (4,770,651 | ) | | — | |
| | | |
| | Total distributions to shareholders | | (127,915,330 | ) | | (123,544,337 | ) |
| | | |
| | Net Capital Stock Transactions | | (344,521,048 | ) | | 397,683,596 | |
| | | |
| | Total increase (decrease) in net assets | | (627,142,988 | ) | | 361,872,982 | |
| | | |
| Net Assets | | Beginning of period | | 2,561,935,555 | | | 2,200,062,573 | |
| | End of period | | 1,934,792,567 | | | 2,561,935,555 | |
| | Undistributed net investment income at end of period | | 8,446,917 | | | 962,983 | |
See Accompanying Notes to Financial Statements.
36
Statement of Changes in Net Assets – Capital Stock Activity
| | | | | | | | | | | | |
| | | Columbia Intermediate Bond Fund | |
| | | Year Ended
March 31, 2009 | | | Year Ended
March 31, 2008 | |
| | | Shares | | | Dollars ($) | | | Shares | | | Dollars ($) | |
Class A | | | | | | | | | | | | |
Subscriptions | | 5,724,124 | | | 46,402,459 | | | 8,143,527 | | | 71,253,112 | |
Distributions reinvested | | 1,139,701 | | | 9,237,323 | | | 1,074,959 | | | 9,416,750 | |
Redemptions | | (10,781,223 | ) | | (86,748,875 | ) | | (8,730,434 | ) | | (76,416,628 | ) |
| | | | | | | | | | | | |
Net increase (decrease) | | (3,917,398 | ) | | (31,109,093 | ) | | 488,052 | | | 4,253,234 | |
| | | | |
Class B | | | | | | | | | | | | |
Subscriptions | | 609,747 | | | 4,920,689 | | | 892,657 | | | 7,824,124 | |
Distributions reinvested | | 204,400 | | | 1,659,409 | | | 213,564 | | | 1,870,860 | |
Redemptions | | (2,429,542 | ) | | (19,594,906 | ) | | (1,858,381 | ) | | (16,263,983 | ) |
| | | | | | | | | | | | |
Net decrease | | (1,615,395 | ) | | (13,014,808 | ) | | (752,160 | ) | | (6,568,999 | ) |
| | | | |
Class C | | | | | | | | | | | | |
Subscriptions | | 1,157,218 | | | 9,303,741 | | | 1,592,648 | | | 13,951,796 | |
Distributions reinvested | | 137,760 | | | 1,115,502 | | | 120,083 | | | 1,052,004 | |
Redemptions | | (1,498,243 | ) | | (12,062,419 | ) | | (1,453,994 | ) | | (12,724,736 | ) |
| | | | | | | | | | | | |
Net increase (decrease) | | (203,265 | ) | | (1,643,176 | ) | | 258,737 | | | 2,279,064 | |
| | | | |
Class R | | | | | | | | | | | | |
Subscriptions | | 108,792 | | | 860,902 | | | 193,694 | | | 1,694,684 | |
Distributions reinvested | | 5,099 | | | 41,108 | | | 2,515 | | | 22,032 | |
Redemptions | | (62,638 | ) | | (496,769 | ) | | (16,414 | ) | | (143,297 | ) |
| | | | | | | | | | | | |
Net increase | | 51,253 | | | 405,241 | | | 179,795 | | | 1,573,419 | |
| | | | |
Class Z | | | | | | | | | | | | |
Subscriptions | | 48,434,868 | | | 396,931,752 | | | 91,154,234 | | | 797,818,906 | |
Distributions reinvested | | 6,663,306 | | | 54,039,194 | | | 6,095,203 | | | 53,398,979 | |
Redemptions | | (92,954,379 | ) | | (750,130,158 | ) | | (51,960,178 | ) | | (455,071,007 | ) |
| | | | | | | | | | | | |
Net increase (decrease) | | (37,856,205 | ) | | (299,159,212 | ) | | 45,289,259 | | | 396,146,878 | |
See Accompanying Notes to Financial Statements.
37
Financial Highlights – Columbia Intermediate Bond Fund
Selected data for a share outstanding throughout each period is as follows:
| | | | | | | | | | | | | | | | | | | | |
| | | Year Ended March 31, | |
| Class A Shares | | 2009 | | | 2008 | | | 2007 | | | 2006 | | | 2005 | |
Net Asset Value, Beginning of Period | | $ | 8.71 | | | $ | 8.84 | | | $ | 8.74 | | | $ | 8.96 | | | $ | 9.27 | |
| | | | | |
Income from Investment Operations: | | | | | | | | | | | | | | | | | | | | |
Net investment income (a) | | | 0.43 | | | | 0.43 | | | | 0.42 | | | | 0.39 | | | | 0.39 | |
Net realized and unrealized gain (loss) on investments, foreign currency, futures contracts and credit default swap contracts | | | (0.97 | ) | | | (0.13 | ) | | | 0.11 | | | | (0.20 | ) | | | (0.25 | ) |
| | | | | | | | | | | | | | | | | | | | |
Total from investment operations | | | (0.54 | ) | | | 0.30 | | | | 0.53 | | | | 0.19 | | | | 0.14 | |
| | | | | |
Less Distributions to Shareholders: | | | | | | | | | | | | | | | | | | | | |
From net investment income | | | (0.43 | ) | | | (0.43 | ) | | | (0.43 | ) | | | (0.41 | ) | | | (0.42 | ) |
From net realized gains | | | (0.02 | ) | | | — | | | | — | | | | — | | | | (0.03 | ) |
| | | | | | | | | | | | | | | | | | | | |
Total distributions to shareholders | | | (0.45 | ) | | | (0.43 | ) | | | (0.43 | ) | | | (0.41 | ) | | | (0.45 | ) |
| | | | | |
Net Asset Value, End of Period | | $ | 7.72 | | | $ | 8.71 | | | $ | 8.84 | | | $ | 8.74 | | | $ | 8.96 | |
Total return (b)(c) | | | (6.34 | )% | | | 3.48 | % | | | 6.21 | %(d) | | | 2.12 | % | | | 1.55 | % |
| | | | | |
Ratios to Average Net Assets/Supplemental Data: | | | | | | | | | | | | | | | | | | | | |
Net expenses before interest expense (e) | | | 0.89 | % | | | 0.88 | % | | | 0.87 | % | | | 0.89 | % | | | 0.94 | % |
Interest expense | | | — | %(f) | | | — | | | | — | | | | — | | | | — | |
Net expenses (e) | | | 0.89 | % | | | 0.88 | % | | | 0.87 | % | | | 0.89 | % | | | 0.94 | % |
Waiver/Reimbursement | | | 0.10 | % | | | 0.10 | % | | | 0.10 | % | | | 0.10 | % | | | 0.10 | % |
Net investment income (e) | | | 5.33 | % | | | 4.88 | % | | | 4.83 | % | | | 4.36 | % | | | 4.31 | % |
Portfolio turnover rate | | | 137 | % | | | 266 | % | | | 150 | % | | | 126 | % | | | 40 | % |
Net assets, end of period (000’s) | | $ | 153,435 | | | $ | 207,215 | | | $ | 206,147 | | | $ | 199,376 | | | $ | 168,213 | |
| (a) | Per share data was calculated using the average shares outstanding during the period. |
| (b) | Total return at net asset value assuming all distributions reinvested and no initial sales charge or contingent deferred sales charge. |
| (c) | Had the investment advisor and/or any of its affiliates not waived fees or reimbursed a portion of expenses, total return would have been reduced. |
| (d) | Total return includes a voluntary reimbursement by the investment advisor for a realized investment loss due to a trading error. This reimbursement increased total return and net asset value per share by less than 0.01% and less than $0.01, respectively. |
| (e) | The benefits derived from expense reductions had an impact of less than 0.01%. |
| (f) | Rounds to less than 0.01%. |
See Accompanying Notes to Financial Statements.
38
Financial Highlights – Columbia Intermediate Bond Fund
Selected data for a share outstanding throughout each period is as follows:
| | | | | | | | | | | | | | | | | | | | |
| | | Year Ended March 31, | |
| Class B Shares | | 2009 | | | 2008 | | | 2007 | | | 2006 | | | 2005 | |
Net Asset Value, Beginning of Period | | $ | 8.71 | | | $ | 8.84 | | | $ | 8.74 | | | $ | 8.96 | | | $ | 9.27 | |
| | | | | |
Income from Investment Operations: | | | | | | | | | | | | | | | | | | | | |
Net investment income (a) | | | 0.37 | | | | 0.36 | | | | 0.36 | | | | 0.32 | | | | 0.32 | |
Net realized and unrealized gain (loss) on investments, foreign currency, futures contracts and credit default swap contracts | | | (0.97 | ) | | | (0.12 | ) | | | 0.10 | | | | (0.20 | ) | | | (0.25 | ) |
| | | | | | | | | | | | | | | | | | | | |
Total from investment operations | | | (0.60 | ) | | | 0.24 | | | | 0.46 | | | | 0.12 | | | | 0.07 | |
| | | | | |
Less Distributions to Shareholders: | | | | | | | | | | | | | | | | | | | | |
From net investment income | | | (0.37 | ) | | | (0.37 | ) | | | (0.36 | ) | | | (0.34 | ) | | | (0.35 | ) |
From net realized gains | | | (0.02 | ) | | | — | | | | — | | | | — | | | | (0.03 | ) |
| | | | | | | | | | | | | | | | | | | | |
Total distributions to shareholders | | | (0.39 | ) | | | (0.37 | ) | | | (0.36 | ) | | | (0.34 | ) | | | (0.38 | ) |
| | | | | |
Net Asset Value, End of Period | | $ | 7.72 | | | $ | 8.71 | | | $ | 8.84 | | | $ | 8.74 | | | $ | 8.96 | |
Total return (b) | | | (7.04 | )% | | | 2.72 | % | | | 5.42 | %(c) | | | 1.36 | % | | | 0.80 | % |
| | | | | |
Ratios to Average Net Assets/Supplemental Data: | | | | | | | | | | | | | | | | | | | | |
Net expenses before interest expense (d) | | | 1.64 | % | | | 1.63 | % | | | 1.62 | % | | | 1.64 | % | | | 1.69 | % |
Interest expense | | | — | %(e) | | | — | | | | — | | | | — | | | | — | |
Net expenses (d) | | | 1.64 | % | | | 1.63 | % | | | 1.62 | % | | | 1.64 | % | | | 1.69 | % |
Net investment income (d) | | | 4.59 | % | | | 4.14 | % | | | 4.08 | % | | | 3.61 | % | | | 3.56 | % |
Portfolio turnover rate | | | 137 | % | | | 266 | % | | | 150 | % | | | 126 | % | | | 40 | % |
Net assets, end of period (000’s) | | $ | 37,247 | | | $ | 56,087 | | | $ | 63,617 | | | $ | 74,332 | | | $ | 89,564 | |
| (a) | Per share data was calculated using the average shares outstanding during the period. |
| (b) | Total return at net asset value assuming all distributions reinvested and no contingent deferred sales charge. |
| (c) | Total return includes a voluntary reimbursement by the investment advisor for a realized investment loss due to a trading error. This reimbursement increased total return and net asset value per share by less than 0.01% and less than $0.01, respectively. |
| (d) | The benefits derived from expense reductions had an impact of less than 0.01%. |
| (e) | Rounds to less than 0.01%. |
See Accompanying Notes to Financial Statements.
39
Financial Highlights – Columbia Intermediate Bond Fund
Selected data for a share outstanding throughout each period is as follows:
| | | | | | | | | | | | | | | | | | | | |
| | | Year Ended March 31, | |
| Class C Shares | | 2009 | | | 2008 | | | 2007 | | | 2006 | | | 2005 | |
Net Asset Value, Beginning of Period | | $ | 8.71 | | | $ | 8.84 | | | $ | 8.74 | | | $ | 8.96 | | | $ | 9.27 | |
| | | | | |
Income from Investment Operations: | | | | | | | | | | | | | | | | | | | | |
Net investment income (a) | | | 0.39 | | | | 0.37 | | | | 0.37 | | | | 0.34 | | | | 0.34 | |
Net realized and unrealized gain (loss) on investments, foreign currency, futures contracts and credit default swap contracts | | | (0.98 | ) | | | (0.12 | ) | | | 0.11 | | | | (0.20 | ) | | | (0.26 | ) |
| | | | | | | | | | | | | | | | | | | | |
Total from investment operations | | | (0.59 | ) | | | 0.25 | | | | 0.48 | | | | 0.14 | | | | 0.08 | |
| | | | | |
Less Distributions to Shareholders: | | | | | | | | | | | | | | | | | | | | |
From net investment income | | | (0.38 | ) | | | (0.38 | ) | | | (0.38 | ) | | | (0.36 | ) | | | (0.36 | ) |
From net realized gains | | | (0.02 | ) | | | — | | | | — | | | | — | | | | (0.03 | ) |
| | | | | | | | | | | | | | | | | | | | |
Total distributions to shareholders | | | (0.40 | ) | | | (0.38 | ) | | | (0.38 | ) | | | (0.36 | ) | | | (0.39 | ) |
| | | | | |
Net Asset Value, End of Period | | $ | 7.72 | | | $ | 8.71 | | | $ | 8.84 | | | $ | 8.74 | | | $ | 8.96 | |
Total return (b)(c) | | | (6.91 | )% | | | 2.87 | % | | | 5.58 | %(d) | | | 1.51 | % | | | 0.95 | % |
| | | | | |
Ratios to Average Net Assets/Supplemental Data: | | | | | | | | | | | | | | | | | | | | |
Net expenses before interest expense (e) | | | 1.49 | % | | | 1.48 | % | | | 1.47 | % | | | 1.49 | % | | | 1.54 | % |
Interest expense | | | — | %(f) | | | — | | | | — | | | | — | | | | — | |
Net expenses (e) | | | 1.49 | % | | | 1.48 | % | | | 1.47 | % | | | 1.49 | % | | | 1.54 | % |
Waiver/Reimbursement | | | 0.15 | % | | | 0.15 | % | | | 0.15 | % | | | 0.15 | % | | | 0.15 | % |
Net investment income (e) | | | 4.74 | % | | | 4.28 | % | | | 4.23 | % | | | 3.76 | % | | | 3.71 | % |
Portfolio turnover rate | | | 137 | % | | | 266 | % | | | 150 | % | | | 126 | % | | | 40 | % |
Net assets, end of period (000’s) | | $ | 31,372 | | | $ | 37,164 | | | $ | 35,458 | | | $ | 39,641 | | | $ | 46,693 | |
| (a) | Per share data was calculated using the average shares outstanding during the period. |
| (b) | Total return at net asset value assuming all distributions reinvested and no contingent deferred sales charge. |
| (c) | Had the investment advisor and/or any of its affiliates not waived fees or reimbursed a portion of expenses, total return would have been reduced. |
| (d) | Total return includes a voluntary reimbursement by the investment advisor for a realized investment loss due to a trading error. This reimbursement increased total return and net asset value per share by less than 0.01% and less than $0.01, respectively. |
| (e) | The benefits derived from expense reductions had an impact of less than 0.01%. |
| (f) | Rounds to less than 0.01%. |
See Accompanying Notes to Financial Statements.
40
Financial Highlights – Columbia Intermediate Bond Fund
Selected data for a share outstanding throughout each period is as follows:
| | | | | | | | | | | | | | | | |
| | | Year Ended March 31, | | | Period Ended
March 31,
2006 (a) | |
| Class R Shares | | 2009 | | | 2008 | | | 2007 | | |
Net Asset Value, Beginning of Period | | $ | 8.71 | | | $ | 8.84 | | | $ | 8.74 | | | $ | 8.91 | |
| | | | |
Income from Investment Operations: | | | | | | | | | | | | | | | | |
Net investment income (b) | | | 0.41 | | | | 0.40 | | | | 0.39 | | | | 0.06 | |
Net realized and unrealized gain (loss) on investments, foreign currency, futures contracts and credit default swap contracts | | | (0.97 | ) | | | (0.12 | ) | | | 0.12 | | | | (0.15 | ) |
| | | | | | | | | | | | | | | | |
Total from investment operations | | | (0.56 | ) | | | 0.28 | | | | 0.51 | | | | (0.09 | ) |
| | | | |
Less Distributions to Shareholders: | | | | | | | | | | | | | | | | |
From net investment income | | | (0.41 | ) | | | (0.41 | ) | | | (0.41 | ) | | | (0.08 | ) |
From net realized gains | | | (0.02 | ) | | | — | | | | — | | | | — | |
| | | | | | | | | | | | | | | | |
Total distributions to shareholders | | | (0.43 | ) | | | (0.41 | ) | | | (0.41 | ) | | | (0.08 | ) |
| | | | |
Net Asset Value, End of Period | | $ | 7.72 | | | $ | 8.71 | | | $ | 8.84 | | | $ | 8.74 | |
Total return (c) | | | (6.58 | )% | | | 3.24 | % | | | 5.94 | %(d) | | | (1.06 | )%(e) |
| | | | |
Ratios to Average Net Assets/Supplemental Data: | | | | | | | | | | | | | | | | |
Net expenses before interest expense (f) | | | 1.14 | % | | | 1.13 | % | | | 1.12 | % | | | 1.30 | %(g) |
Interest expense | | | — | %(h) | | | — | | | | — | | | | — | |
Net expenses (f) | | | 1.14 | % | | | 1.13 | % | | | 1.12 | % | | | 1.30 | %(g) |
Net investment income (f) | | | 5.11 | % | | | 4.60 | % | | | 4.45 | % | | | 3.25 | %(g) |
Portfolio turnover rate | | | 137 | % | | | 266 | % | | | 150 | % | | | 126 | %(e) |
Net assets, end of period (000’s) | | $ | 1,819 | | | $ | 1,606 | | | $ | 42 | | | $ | 10 | |
| (a) | Class R shares were initially offered on January 23, 2006. |
| (b) | Per share data was calculated using the average shares outstanding during the period. |
| (c) | Total return at net asset value assuming all distributions reinvested. |
| (d) | Total return includes a voluntary reimbursement by the investment advisor for a realized investment loss due to a trading error. This reimbursement increased total return and net asset value per share by less than 0.01% and less than $0.01, respectively. |
| (f) | The benefits derived from expense reductions had an impact of less than 0.01%. |
| (h) | Rounds to less than 0.01%. |
See Accompanying Notes to Financial Statements.
41
Financial Highlights – Columbia Intermediate Bond Fund
Selected data for a share outstanding throughout each period is as follows:
| | | | | | | | | | | | | | | | | | | | |
| | | Year Ended March 31, | |
| Class Z Shares | | 2009 | | | 2008 | | | 2007 | | | 2006 | | | 2005 | |
Net Asset Value, Beginning of Period | | $ | 8.71 | | | $ | 8.84 | | | $ | 8.74 | | | $ | 8.96 | | | $ | 9.27 | |
| | | | | |
Income from Investment Operations: | | | | | | | | | | | | | | | | | | | | |
Net investment income (a) | | | 0.45 | | | | 0.45 | | | | 0.45 | | | | 0.41 | | | | 0.41 | |
Net realized and unrealized gain (loss) on investments, foreign currency, futures contracts and credit default swap contracts | | | (0.97 | ) | | | (0.13 | ) | | | 0.10 | | | | (0.20 | ) | | | (0.25 | ) |
| | | | | | | | | | | | | | | | | | | | |
Total from investment operations | | | (0.52 | ) | | | 0.32 | | | | 0.55 | | | | 0.21 | | | | 0.16 | |
| | | | | |
Less Distributions to Shareholders: | | | | | | | | | | | | | | | | | | | | |
From net investment income | | | (0.45 | ) | | | (0.45 | ) | | | (0.45 | ) | | | (0.43 | ) | | | (0.44 | ) |
From net realized gains | | | (0.02 | ) | | | — | | | | — | | | | — | | | | (0.03 | ) |
| | | | | | | | | | | | | | | | | | | | |
Total distributions to shareholders | | | (0.47 | ) | | | (0.45 | ) | | | (0.45 | ) | | | (0.43 | ) | | | (0.47 | ) |
| | | | | |
Net Asset Value, End of Period | | $ | 7.72 | | | $ | 8.71 | | | $ | 8.84 | | | $ | 8.74 | | | $ | 8.96 | |
Total return (b) | | | (6.11 | )% | | | 3.74 | % | | | 6.48 | %(c) | | | 2.37 | % | | | 1.80 | % |
| | | | | |
Ratios to Average Net Assets/Supplemental Data: | | | | | | | | | | | | | | | | | | | | |
Net expenses before interest expense (d) | | | 0.64 | % | | | 0.63 | % | | | 0.62 | % | | | 0.64 | % | | | 0.69 | % |
Interest expense | | | — | %(e) | | | — | | | | — | | | | — | | | | — | |
Net expenses (d) | | | 0.64 | % | | | 0.63 | % | | | 0.62 | % | | | 0.64 | % | | | 0.69 | % |
Net investment income (d) | | | 5.58 | % | | | 5.13 | % | | | 5.08 | % | | | 4.63 | % | | | 4.56 | % |
Portfolio turnover rate | | | 137 | % | | | 266 | % | | | 150 | % | | | 126 | % | | | 40 | % |
Net assets, end of period (000’s) | | $ | 1,710,920 | | | $ | 2,259,863 | | | $ | 1,894,798 | | | $ | 1,379,320 | | | $ | 877,193 | |
| (a) | Per share data was calculated using the average shares outstanding during the period. |
| (b) | Total return at net asset value assuming all distributions reinvested. |
| (c) | Total return includes a voluntary reimbursement by the investment advisor for a realized investment loss due to a trading error. This reimbursement increased total return and net asset value per share by less than 0.01% and less than $0.01, respectively. |
| (d) | The benefits derived from expense reductions had an impact of less than 0.01%. |
| (e) | Rounds to less than 0.01%. |
See Accompanying Notes to Financial Statements.
42
Notes to Financial Statements – Columbia Intermediate Bond Fund
March 31, 2009
Note 1. Organization
Columbia Intermediate Bond Fund (the “Fund”), a series of Columbia Funds Series Trust I (the “Trust”), is a diversified portfolio. The Trust is a Massachusetts business trust registered under the Investment Company Act of 1940, as amended (the “1940 Act”), as an open-end management investment company.
Investment Objective
The Fund seeks total return, consisting of current income and capital appreciation.
Fund Shares
The Trust may issue an unlimited number of shares, and the Fund offers five classes of shares: Class A, Class B, Class C, Class R and Class Z. Each share class has its own expense structure and sales charges, as applicable. Beginning on or about June 22, 2009, the Fund will no longer accept investment in Class B shares from new or existing investors in the Fund’s Class B shares, except in connection with the reinvestment of any dividend and/or capital gain distributions in Class B shares of the Fund and exchanges by existing Class B shareholders of the other Columbia Funds.
Class A shares are subject to a maximum front-end sales charge of 3.25% based on the amount of initial investment. Class A shares purchased without an initial sales charge in accounts aggregating $1 million to $50 million at the time of purchase are subject to a 1.00% contingent deferred sales charge (“CDSC”) if the shares are sold within one year after purchase. Class B shares are subject to a maximum CDSC of 3.00% based upon the holding period after purchase. Class B shares will convert to Class A shares eight years after purchase. Class C shares are subject to a 1.00% CDSC on shares sold within one year after purchase. Class R and Class Z shares are offered continuously at net asset value. There are certain restrictions on the purchase of Class R and Class Z shares, as described in the Fund’s prospectuses.
Note 2. Significant Accounting Policies
The preparation of financial statements in accordance with accounting principles generally accepted in the United States of America (“GAAP”) requires management to make certain estimates and assumptions that affect the reported amounts of assets and liabilities, the disclosure of contingent assets and liabilities at the date of the financial statements and the reported amounts of revenue and expenses during the reporting period. Actual results could differ from those estimates. The following is a summary of significant accounting policies consistently followed by the Fund in the preparation of its financial statements.
Security Valuation
Debt securities generally are valued by pricing services approved by the Trust’s Board of Trustees, based upon market transactions for normal, institutional-size trading units of similar securities. The services may use various pricing techniques which take into account appropriate factors such as yield, quality, coupon rate, maturity, type of issue, trading characteristics and other data, as well as broker quotes. Debt securities for which quotations are readily available are valued at an over-the-counter or exchange bid quotation.
Certain debt securities, which tend to be more thinly traded and of lesser quality, are priced based on fundamental analysis of the financial condition of the issuer and the estimated value of any collateral. Valuations developed through pricing techniques may vary from the actual amounts realized upon sale of the securities, and the potential variation may be greater for those securities valued using fundamental analysis.
Equity securities are valued at the last sale price on the principal exchange on which they trade, except for securities traded on the NASDAQ, which are valued at the NASDAQ official close price. Unlisted securities or listed securities for which there were no sales during the day are valued at the closing bid price on such exchanges or over-the-counter markets.
Short-term investments maturing in 60 days or less are valued at amortized cost, which approximates market value.
Futures contracts are valued at the settlement price established each day by the board of trade or exchange on which they are traded.
Forward foreign currency exchange contracts are valued at the prevailing forward exchange rate of the underlying currencies.
Credit default swap contracts are marked to market daily based upon quotations from market makers. Quotations obtained from independent pricing services use information provided by market makers.
43
Columbia Intermediate Bond Fund
March 31, 2009
Foreign securities are generally valued at the last sale price on the foreign exchange or market on which they trade. If any foreign share prices are not readily available as a result of limited share activity, the securities are valued at the last sale price of the local shares in the principal market in which such securities are normally traded.
Generally, trading in foreign securities is substantially completed each day at various times prior to the close of the New York Stock Exchange (“NYSE”). The values of such securities used in computing the net asset value of the Fund’s shares are determined as of such times. Foreign currency exchange rates are generally determined at 4:00 p.m. Eastern (U.S.) time. Occasionally, events affecting the values of such foreign securities and such exchange rates may occur between the times at which they are determined and the close of the customary trading session of the NYSE, which would not be reflected in the computation of the Fund’s net asset value. If events materially affecting the values of such foreign securities occur and it is determined that market quotations are not reliable, then these foreign securities will be valued at their fair value using procedures approved by the Board of Trustees.
Investments for which market quotations are not readily available, or that have quotations which management believes are not reliable, are valued at fair value as determined in good faith under consistently applied procedures established by and under the general supervision of the Board of Trustees. If a security is valued at fair value, such value is likely to be different from the last quoted market price for the security. The determination of fair value often requires significant judgment. To determine fair value, management may use assumptions including but not limited to future cash flows and estimated risk premiums. Multiple inputs from various sources may be used to determine value.
Security Transactions
Security transactions are accounted for on the trade date. Cost is determined and gains (losses) are based upon the specific identification method for both financial statement and federal income tax purposes.
In March 2008, Statement of Financial Accounting Standards No. 161, Disclosures about Derivative Instruments and Hedging Activities-an amendment of FASB Statement No. 133 (“SFAS 161”), was issued. SFAS 161 is effective for fiscal years and interim periods beginning after November 15, 2008. SFAS 161 requires additional discussion about the reporting entity’s derivative instruments and hedging activities, by providing for qualitative disclosures about the objectives and strategies for using derivatives, quantitative data about the fair value of and gains and losses on derivative contracts, and details of credit-risk-related contingent features in their derivative contracts. Management is evaluating the impact the application of SFAS 161 will have on the Fund’s financial statement disclosures.
Futures Contracts
The Fund may invest in futures contracts for both hedging and non-hedging purposes, including, for example, to seek to enhance returns or as a substitute for a position in an underlying asset.
The use of futures contracts involves certain risks, which include: (1) imperfect correlation between the price movement of the instruments and the underlying securities, (2) inability to close out positions due to differing trading hours, or the temporary absence of a liquid market, for either the instruments or the underlying securities, or (3) an inaccurate prediction of the future direction of interest rates by Columbia Management Advisors, LLC (“Columbia”), the Fund’s investment advisor. Any of these risks may involve amounts exceeding the variation margin recorded in the Fund’s Statement of Assets and Liabilities at any given time.
Upon entering into a futures contract, the Fund pledges cash or securities with the broker in an amount sufficient to meet the initial margin requirement. Subsequent payments are made or received by the Fund equal to the daily change in the contract value and are recorded as variation margin receivable or payable and offset in unrealized gains or losses. The Fund recognizes a realized gain or loss when the contract is closed or expires.
Forward Foreign Currency Exchange Contracts
Forward foreign currency exchange contracts are agreements to exchange one currency for another at a future date at a specified price. These contracts are used to minimize the exposure to foreign exchange rate fluctuations during the period between trade and settlement date of the contract. The Fund may utilize forward foreign currency exchange contracts in connection with the settlement of purchases and
44
Columbia Intermediate Bond Fund
March 31, 2009
sales of securities. The Fund may also enter into these contracts to hedge certain other foreign currency denominated assets. Contracts to buy generally are used to acquire exposure to foreign currencies, while contracts to sell are generally used to hedge the Fund’s investments against currency fluctuations. Forward foreign currency exchange contracts are valued daily at the current exchange rate of the underlying currency, resulting in unrealized gains (losses) which become realized at the time the forward foreign currency exchange contracts are closed or mature. Realized and unrealized gains (losses) arising from such transactions are included in net realized and unrealized gains (losses) on foreign currency transactions. The use of forward foreign currency exchange contracts does not eliminate fluctuations in the prices of the Fund’s portfolio securities. While the maximum potential loss from such contracts is the aggregate face value in U.S. dollars at the time the contract was opened, exposure is typically limited to the change in value of the contract (in U.S. dollars) over the period it remains open. The Fund could also be exposed to risk that counterparties of the contracts may be unable to fulfill the terms of the contracts.
Repurchase Agreements
The Fund may engage in repurchase agreement transactions with institutions that Columbia has determined are creditworthy. The Fund, through its custodian, receives delivery of the underlying securities collateralizing a repurchase agreement. Columbia is responsible for determining that the collateral is at least equal, at all times, to the value of the repurchase obligation including interest. A repurchase agreement transaction involves certain risks in the event of default or insolvency of the counterparty. These risks include possible delays in or restrictions on the Fund’s ability to dispose of the underlying securities and a possible decline in the value of the underlying securities during the period while the Fund seeks to assert its rights.
Mortgage Dollar Roll Transactions
The Fund may enter into mortgage “dollar rolls” in which the Fund sells securities for delivery in the current month and simultaneously contracts with the same counterparty to repurchase similar (same type, coupon and maturity) but not identical securities on a specified future date not exceeding 120 days. During the roll period, the Fund loses the right to receive principal and interest paid on the securities sold. However, the Fund would benefit to the extent of any difference between the price received for the securities sold and the lower forward price for the future purchase (often referred to as the “drop”) or fee income plus the interest earned on the cash proceeds of the securities sold until the settlement date of the forward purchase. Unless such benefits exceed the income, capital appreciation and gain or loss due to mortgage prepayments that would have been realized on the securities sold as part of the mortgage dollar roll, the use of this technique will diminish the investment performance of the Fund compared with what such performance would have been without the use of mortgage dollar rolls. All cash proceeds will be invested in instruments that are permissible investments for the Fund. The Fund will hold and maintain in a segregated account until the settlement date, cash or liquid securities in an amount equal to the forward purchase price.
The Fund’s policy is to record the components of mortgage dollar rolls using “to be announced” mortgage-backed securities. For financial reporting and tax purposes, the Fund treats mortgage dollar rolls as two separate transactions, one involving the purchase of a security and a separate transaction involving a sale. The Fund does not currently enter into mortgage dollar rolls that are accounted for as financing transactions.
Mortgage dollar rolls involve certain risks. If the broker-dealer to whom the Fund sells the securities becomes insolvent, the Fund’s right to purchase or repurchase the mortgage-related securities may be restricted and the instruments which the Fund is required to repurchase may be worth less than instruments which the Fund originally held. Successful use of mortgage dollar rolls may depend upon the investment advisor’s ability to predict correctly interest rates and mortgage prepayments. For these reasons, there is no assurance that mortgage dollar rolls can be successfully employed.
Delayed Delivery Securities
The Fund may trade securities on other than normal settlement terms, including securities purchased or sold on a “when-issued” basis. This may increase the risk if the other party to the transaction fails to deliver and causes the Fund to subsequently invest at less advantageous prices. The Fund holds until the settlement date, in a segregated account, cash or liquid securities in an amount equal to the delayed delivery commitment.
45
Columbia Intermediate Bond Fund
March 31, 2009
Credit Default Swaps
The Fund may engage in credit default swap transactions for hedging purposes or to seek to increase total return. Credit default swaps are agreements in which one party pays fixed periodic payments to a counterparty in consideration for a guarantee from the counterparty to make a specific payment should a negative credit event take place. The Fund may receive an upfront payment as the protection seller or make an upfront payment as the protection buyer.
If the Fund is a buyer of protection and a credit event occurs, as defined under the terms of that particular swap agreement, the Fund will either (i) receive from the seller of protection an amount equal to the notional amount of the swap and deliver the referenced obligation or underlying securities compromising the referenced index or (ii) receive a net settlement amount in the form of cash or securities equal to the notional amount of the swap less the recovery value of the referenced obligation or underlying securities compromising the referenced index.
If the Fund is a seller of protection and a credit event occurs, as defined under the terms of that particular swap agreement, the Fund will either (i) pay to the buyer of protection an amount equal to the notional amount of the swap and take delivery of the referenced obligation or underlying securities comprising the referenced index or (ii) pay a net settlement amount in the form of cash or securities equal to the notional amount of the swap less the recovery value of the referenced obligation or underlying securities comprising the referenced index. Recovery values are assumed by market makers considering either industry standard recovery rates or entity specific factors and considerations until a credit event occurs. If a credit event has occurred, the recovery value is determined by a facilitated auction whereby a minimum number of allowable broker bids, together with a specified valuation method, are used to calculate the settlement value.
Credit default swaps are marked to market daily based on quotations from market makers and any change is recorded as unrealized appreciation/depreciation on the Fund Statement of Assets and Liabilities. Periodic payments received or made are recorded as a realized gain or loss and premiums received or made are amortized on the Statement of Operations.
Stripped Securities
Stripped mortgage-backed securities are derivative multi-class mortgage securities structured so that one class receives most, if not all, of the principal from the underlying mortgage assets, while the other class receives most, if not all, of the interest and the remainder of the principal. If the underlying mortgage assets experience greater than anticipated prepayments of principal, the Fund may fail to fully recoup its initial investment in an interest-only security. The market value of these securities can be extremely volatile in response to changes in interest rates. Credit risk reflects the risk that the Fund may not receive all or part of its principal because the issuer or credit enhancer has defaulted on its obligation.
Foreign Currency Transactions and Translations
The values of all assets and liabilities quoted in foreign currencies are translated into U.S. dollars at that day’s exchange rates. Net realized and unrealized gains (losses) on foreign currency transactions and translations include gains (losses) arising from the fluctuation in exchange rates between trade and settlement dates on securities transactions, gains (losses) arising from the disposition of foreign currency and currency gains (losses) between the accrual and payment dates on dividends, interest income and foreign withholding taxes.
For financial statement purposes, the Fund does not distinguish that portion of gains (losses) on investments which is due to changes in foreign exchange rates from that which is due to changes in market prices of the investments. Such fluctuations are included with the net realized and unrealized gains (losses) on investments on the Statement of Operations.
Income Recognition
Interest income is recorded on an accrual basis and includes accretion of discounts, amortization of premiums and paydown gains and losses. Fee income attributable to mortgage dollar roll transactions is recorded on the accrual basis over the term of the transaction. The value of additional securities received as an income payment is recorded as income and as the cost basis of such securities.
46
Columbia Intermediate Bond Fund
March 31, 2009
Expenses
General expenses of the Trust are allocated to the Fund and the other series of the Trust based upon relative net assets or other expense allocation methodologies determined by the nature of the expense. Expenses directly attributable to the Fund are charged to the Fund.
Determination of Class Net Asset Value
All income, expenses (other than class-specific expenses, as shown on the Statement of Operations) and realized and unrealized gains (losses) are allocated to each class of the Fund on a daily basis for purposes of determining the net asset value of each class. Income and expenses are allocated to each class based on the settled shares method, while realized and unrealized gains (losses) are allocated based on the relative net assets of each class.
Federal Income Tax Status
The Fund intends to qualify each year as a “regulated investment company” under Subchapter M of the Internal Revenue Code, as amended, and will distribute substantially all of its tax exempt or taxable income, if any, for its tax year, and as such will not be subject to federal income taxes. In addition, the Fund intends to distribute in each calendar year substantially all of its net investment income, capital gains and certain other amounts, if any, such that the Fund should not be subject to federal excise tax. Therefore, no federal income or excise tax provision is recorded.
Distributions to Shareholders
Distributions from net investment income are declared daily and paid monthly. Net realized capital gains, if any, are distributed at least annually. Income distributions and capital gain distributions are determined in accordance with federal income tax regulations which may differ from GAAP.
Indemnification
In the normal course of business, the Fund enters into contracts that contain a variety of representations and warranties and which provide general indemnities. The Fund’s maximum exposure under these arrangements is unknown because this would involve future claims against the Fund. Also, under the Trust’s organizational documents and by contract, the Trustees and officers of the Trust are indemnified against certain liabilities that may arise out of actions relating to their duties to the Trust. However, based on experience, the Fund expects the risk of loss due to these representations, warranties and indemnities to be minimal.
Note 3. Federal Tax Information
The timing and character of income and capital gain distributions are determined in accordance with income tax regulations, which may differ from GAAP. Reclassifications are made to the Fund’s capital accounts for permanent tax differences to reflect income and gains available for distribution (or available capital loss carryforwards) under income tax regulations.
For the year ended March 31, 2009, permanent book and tax basis differences resulting primarily from differing treatments for section 988 adjustments, distribution adjustments, market discount accretion/premium amortization on debt securities and paydown adjustments were identified and reclassified among the components of the Fund’s net assets as follows:
| | | | |
| | | | | |
Undistributed Net Investment
Income | | Accumulated Net Realized
Loss | | Paid-In Capital |
| $5,808,556 | | $(5,808,556) | | $— |
Net investment income and net realized gains (losses), as disclosed on the Statement of Operations, and net assets were not affected by this reclassification.
The tax character of distributions paid during the years ended March 31, 2009 and March 31, 2008 was as follows:
| | | | | | |
| | | March 31, 2009 | | March 31, 2008 |
| Distributions paid from: | | |
Ordinary Income* | | $ | 127,915,330 | | $ | 123,544,337 |
| * | For tax purposes short-term capital gains distributions, if any, are considered ordinary income distributions. |
As of March 31, 2009, the components of distributable earnings on a tax basis were as follows:
| | | | |
| | | | | |
Undistributed
Ordinary Income | | Undistributed Long-Term Capital Gains | | Net Unrealized Depreciation* |
| $15,144,237 | | $— | | $(249,568,179) |
| * | The differences between book-basis and tax-basis net unrealized depreciation are primarily due to deferral of losses from wash sales. |
47
Columbia Intermediate Bond Fund
March 31, 2009
Unrealized appreciation and depreciation at March 31, 2009, based on cost of investments for federal income tax purposes were:
| | | | |
| | | | |
Unrealized appreciation | | $ | 38,275,921 | |
Unrealized depreciation | | | (287,844,100 | ) |
Net unrealized depreciation | | $ | (249,568,179 | ) |
The following capital loss carryforwards may be available to reduce taxable income arising from future net realized gains on investments, if any, to the extent permitted by the Internal Revenue Code:
| | |
| | | |
| Year of Expiration | | Capital Loss Carryforward |
| 2017 | | $45,710,830 |
Under current tax rules, certain currency and capital losses realized after October 31 may be deferred and treated as occurring on the first day of the following fiscal year. As of March 31, 2009, post-October capital losses of $47,773,621 attributed to security transactions were deferred to April 1, 2009.
Under Financial Accounting Standards Board (“FASB”) Interpretation No. 48, Accounting for Uncertainty in Income Taxes—an Interpretation of FASB Statement No. 109 (“FIN 48”), management determines whether a tax position of the Fund is more likely than not to be sustained upon examination by the applicable taxing authority, including resolution of any related appeals or litigation processes, based on the technical merits of the position. The tax benefit to be recognized is measured as the largest amount of benefit that is greater than fifty percent likely of being realized upon ultimate settlement. Management has evaluated the known implications of FIN 48 on its computation of net assets for the Fund. As a result of this evaluation, management has concluded that FIN 48 did not have any effect on the Fund’s financial statements. However, management’s conclusions regarding FIN 48 may be subject to review and adjustment at a later date based on factors including, but not limited to, further implementation guidance from the FASB, new tax laws, regulations, and administrative interpretations (including relevant court decisions). The Fund’s federal tax returns for the prior three fiscal years remain subject to examination by the Internal Revenue Service. The Fund is not aware of any tax positions for which it is reasonably possible that the total amounts of unrecognized tax benefits will significantly change in the next twelve months.
Note 4. Fees and Compensation Paid to Affiliates
Investment Advisory Fee
Columbia, an indirect, wholly owned subsidiary of Bank of America Corporation (“BOA”), provides investment advisory services to the Fund. In rendering investment advisory services to the Fund, Columbia may use the portfolio management and research resources of Columbia Management Pte. Ltd., an affiliate of Columbia. Columbia receives a monthly investment advisory fee based on the Fund’s average daily net assets at the following annual rates:
| | |
| | | |
| Average Daily Net Assets | | Annual Fee Rate |
First $1 billion | | 0.35% |
$1 billion to $1.5 billion | | 0.30% |
$1.5 billion to $3 billion | | 0.29% |
$3 billion to $6 billion | | 0.28% |
Over $6 billion | | 0.27% |
For the year ended March 31, 2009, the Fund’s effective investment advisory fee rate was 0.32% of the Fund’s average daily net assets.
Administration Fee
Columbia provides administrative and other services to the Fund for a monthly administration fee at the annual rate of 0.15% of the Fund’s average daily net assets.
Pricing and Bookkeeping Fees
The Fund has entered into a Financial Reporting Services Agreement (the “Financial Reporting Services Agreement”) with State Street Bank & Trust Company (“State Street”) and Columbia pursuant to which State Street provides financial reporting services to the Fund. The Fund has also entered into an Accounting Services Agreement (collectively with the Financial Reporting Services Agreement, the “State Street Agreements”) with State Street and Columbia pursuant to which State Street provides accounting services to the Fund. Under the State Street Agreements, the Fund pays State Street an annual fee of $38,000 paid monthly plus an additional monthly fee based on an annualized percentage rate of average daily net assets of the Fund for the month. The
48
Columbia Intermediate Bond Fund
March 31, 2009
aggregate fee will not exceed $140,000 per year (exclusive of out-of-pocket expenses and charges). The Fund also reimburses State Street for certain out-of-pocket expenses and charges.
The Fund has entered into a Pricing and Bookkeeping Oversight and Services Agreement (the “Services Agreement”) with Columbia. Under the Services Agreement, Columbia provides services related to Fund expenses and the requirements of the Sarbanes-Oxley Act of 2002, and provides oversight of the accounting and financial reporting services provided by State Street. Under the Services Agreement, the Fund reimburses Columbia for out-of-pocket expenses.
Transfer Agent Fee
Columbia Management Services, Inc. (the “Transfer Agent”), an affiliate of Columbia and an indirect, wholly owned subsidiary of BOA, provides shareholder services to the Fund and has contracted with Boston Financial Data Services (“BFDS”) to serve as sub-transfer agent. The Transfer Agent is entitled to receive a fee for its services, paid monthly, at the annual rate of $17.34 per open account plus reimbursement of certain sub-transfer agent fees paid by the Transfer Agent (exclusive of BFDS fees), calculated based on assets held in omnibus accounts and intended to recover the cost of payments to other parties (including affiliates of BOA) for services to those accounts. The Transfer Agent pays the fees of BFDS for services as sub-transfer agent and is not entitled to reimbursement for such fees from the Fund.
The Transfer Agent may also retain, as additional compensation for its services, fees for wire, telephone and redemption orders, Individual Retirement Account (“IRA”) trustee agent fees and account transcript fees due to the Transfer Agent from shareholders of the Fund and credits (net of bank charges) earned with respect to balances in accounts the Transfer Agent maintains in connection with its services to the Fund. The Transfer Agent also receives reimbursement for certain out-of-pocket expenses.
An annual minimum account balance fee of $20 may apply to certain accounts with a value below the Fund’s initial minimum investment requirements to reduce the impact of small accounts on transfer agent fees. These minimum account balance fees are recorded as part of expense reductions on the Statement of Operations. For the year ended March 31, 2009, these minimum account balance fees reduced total expenses by $3,474.
Underwriting Discounts, Service and Distribution Fees
Columbia Management Distributors, Inc. (the “Distributor”), an affiliate of Columbia and an indirect, wholly owned subsidiary of BOA, is the principal underwriter of the Fund’s shares. For the year ended March 31, 2009, the Distributor has retained net underwriting discounts of $7,112 on sales of the Fund’s Class A shares and received net CDSC fees of $2,671, $67,508 and $13,915 on Class A, Class B and Class C share redemptions, respectively.
The Fund has adopted plans pursuant to Rule 12b-1 under the 1940 Act (the “Plans”) which require the payment of a monthly service fee to the Distributor at the maximum annual rate of 0.25% of the average daily net assets attributable to Class A, Class B and Class C shares of the Fund. The Plans also require the payment of a monthly distribution fee to the Distributor at the maximum annual rates of 0.10%, 0.75%, 0.75% and 0.50% of the average daily net assets attributable to Class A, Class B, Class C and Class R shares, respectively. The Distributor has voluntarily agreed to waive a portion of the distribution and service fees for Class A shares of the Fund so that the combined fee will not exceed 0.25% annually of Class A average daily net assets. The Distributor has also voluntarily agreed to waive a portion of the distribution and service fees for Class C shares so that the combined fee will not exceed 0.85% annually of Class C average daily net assets. These arrangements may be modified or terminated by the Distributor at any time.
The CDSC and the distribution fees received from the Plans are used principally as repayment to the Distributor for amounts paid by the Distributor to dealers who sold such shares.
Fee Waivers and Expense Reimbursements
Effective January 1, 2009, Columbia has voluntarily agreed to reimburse a portion of the Fund’s expenses so that the Fund’s ordinary operating expenses (excluding any distribution and service fees, brokerage commissions, interest, taxes and extraordinary expenses, but including custodian charges relating to overdrafts, if any), after giving effect to any balance credits from the Fund’s custodian, do not exceed 0.70% of the Fund’s average daily net assets on an annualized basis. Columbia, in its discretion, may revise or discontinue this arrangement at any time.
49
Columbia Intermediate Bond Fund
March 31, 2009
Fees Paid to Officers and Trustees
All officers of the Fund are employees of Columbia or its affiliates and, with the exception of the Fund’s Chief Compliance Officer, receive no compensation from the Fund. The Board of Trustees has appointed a Chief Compliance Officer to the Fund in accordance with federal securities regulations. The Fund, along with other affiliated funds, pays its pro-rata share of the expenses associated with the Chief Compliance Officer. The Fund’s expenses for the Chief Compliance Officer will not exceed $15,000 per year.
The Trust’s eligible Trustees may participate in a deferred compensation plan which may be terminated at any time. Obligations of the plan will be paid solely out of the Fund’s assets.
Note 5. Custody Credits
The Fund has an agreement with its custodian bank under which custody fees may be reduced by balance credits. These credits are recorded as part of expense reductions on the Statement of Operations. The Fund could have invested a portion of the assets utilized in connection with the expense offset arrangement in an income-producing asset if it had not entered into such an agreement.
For the year ended March 31, 2009, these custody credits reduced total expenses by $17,735 for the Fund.
Note 6. Portfolio Information
For the year ended March 31, 2009, the cost of purchases and proceeds from sales of securities, excluding short-term obligations, for the Fund were $3,592,962,208 and $3,923,286,533, respectively, of which $1,805,198,872 and $2,060,187,475, respectively, were U.S. Government securities.
Note 7. Line of Credit
The Fund and other affiliated funds participate in a $280,000,000 committed, unsecured revolving line of credit provided by State Street. The maximum amount that may be borrowed by any fund is limited to the lesser of $200,000,000 and the Fund’s borrowing limit set forth in the Fund’s registration statement. Borrowings are available for short-term liquidity or temporary or emergency purposes.
Interest is charged to each participating fund based on the fund’s borrowings at a rate per annum equal to the greater of the Federal Funds Rate plus 0.50% or the overnight LIBOR Rate plus 0.50%. In addition, an annual operations agency fee of $20,000, an amendment fee of 0.02% and a commitment fee of 0.12% per annum are accrued and apportioned among the participating funds pro rata based on their relative net assets. Prior to October 16, 2008, the Fund and other affiliated funds participated in a $350,000,000 committed, unsecured revolving line of credit and a $150,000,000 uncommitted, unsecured line of credit, both provided by State Street. Interest on the committed line of credit was charged to each participating fund based on the fund’s borrowings at a rate per annum equal to the Federal Funds Rate plus 0.50%. In addition, a commitment fee of 0.10% per annum was accrued and apportioned among the participating funds pro rata based on their relative net assets. Interest on the uncommitted line of credit was charged to each participating fund based on the fund’s borrowings at a rate per annum equal to the Federal Funds Rate plus 0.375%. State Street charged an annual operations agency fee of $40,000 for the committed line of credit and was able to charge an annual administration fee of $15,000 for the uncommitted line of credit. The commitment fee, the operations agency fee and the administration fee were accrued and apportioned among the participating funds pro rata based on their relative net assets.
For the year ended March 31, 2009, the average daily loan balance outstanding on days where borrowing existed was $6,555,556 at a weighted average interest rate of 1.83%.
Note 8. Securities Lending
The Fund may lend its securities to certain approved brokers, dealers and other financial institutions. Each loan is collateralized by cash, in an amount at least equal to the market value of the securities loaned plus accrued income from the investment of collateral. The market value of the loaned securities is determined at the close of business of the Fund and any additional required collateral is delivered to the Fund on the next business day. The collateral received is invested and the income generated by the investment of the collateral, net of any fees remitted to State Street as the lending agent and borrower rebates, is paid to the Fund. Generally, in the event of borrower default, the Fund has the right to use the collateral to offset any losses incurred. In the event the Fund is delayed or prevented from exercising its right to dispose of the collateral, there may be a potential loss to the Fund. The Fund bears the risk of loss with respect to the investment of collateral.
50
Columbia Intermediate Bond Fund
March 31, 2009
Note 9. Shares of Beneficial Interest
As of March 31, 2009, 47.2% of the Fund’s shares outstanding were beneficially owned by one participant account over which BOA and/or any of its affiliates had either sole or joint investment discretion.
As of March 31, 2009, the Fund had two shareholders that collectively held 15.9% of the shares outstanding, over which BOA and/or any of its affiliates did not have investment discretion.
Subscription and redemption activity of these accounts may have a significant effect on the operations of the Fund.
Note 10. Significant Risks and Contingencies
Sector Focus Risk
The Fund may focus its investments in certain sectors, subjecting it to greater risk than a fund that is less focused.
High-Yield Securities Risk
Investing in high-yield securities may involve greater credit risk and considerations not typically associated with investing in U.S. Government bonds and other higher quality fixed income securities. These securities are non-investment grade securities, often referred to as “junk” bonds. Economic downturns may disrupt the high yield market and impair the ability of issuers to repay principal and interest. Also, an increase in interest rates would likely have an adverse impact on the value of such obligations. Moreover, high-yield securities may be less liquid to the extent that there is no established secondary market.
Asset-Backed Securities Risk
The value of asset-backed securities may be affected by, among other factors, changes in interest rates, the market’s assessment of the quality of underlying assets, the creditworthiness of the servicer for the underlying assets, factors concerning the interests in and structure of the issuer or the originator of the underlying assets, or the creditworthiness or rating of the entities that provide any supporting letters of credit, surety bonds, derivative instruments, or other credit enhancement. The value of asset-backed securities also will be affected by the exhaustion, termination or expiration of any credit enhancement. Most asset-backed securities are subject to prepayment risk, which is the possibility that the underlying debt may be refinanced or prepaid prior to maturity during periods of declining or low interest rates, causing the Fund to have to reinvest the money received in securities that have lower yields. In addition, the impact of prepayments on the value of asset-backed securities may be difficult to predict and may result in greater volatility.
Mortgage-Backed Securities Risk
The value of the mortgage-backed securities may be affected by, among other things, changes in interest rates, factors concerning the interests in and structure of the issuer or the originator of the mortgages, the creditworthiness of the entities that provide any supporting letters of credit, surety bonds or other credit enhancements or the quality of underlying assets or the market’s assessment thereof. Mortgage-backed securities are subject to prepayment risk, which is the possibility that the underlying mortgage may be refinanced or prepaid prior to maturity during periods of declining or low interest rates, causing the Funds to have to reinvest the money received in securities that have lower yields. In addition, the impact of prepayments on the value of mortgage-backed securities may be difficult to predict and may result in greater volatility.
Legal Proceedings
Columbia Management Advisors, LLC and Columbia Management Distributors, Inc. (collectively, the “Columbia Group”) are subject to a settlement agreement with the New York Attorney General (“NYAG”) (the “NYAG Settlement”) and a settlement order with the SEC (the “SEC Order”) on matters relating to mutual fund trading, each dated February 9, 2005. Under the terms of the SEC Order, the Columbia Group (or predecessor entities) agreed, among other things, to: pay disgorgement and civil money penalties collectively totaling $140 million; cease and desist from violations of the antifraud provisions and certain other provisions of the federal securities laws; maintain certain compliance and ethics oversight structures; and retain an independent consultant to review the Columbia Group’s applicable supervisory, compliance, control and other policies and procedures. The NYAG Settlement, among other things, requires Columbia Management Advisors, LLC and its affiliates to reduce management fees for certain funds in the Columbia family of mutual funds in a projected total of $160 million over five years through November 30, 2009 and to make certain disclosures to investors relating to expenses. In
51
Columbia Intermediate Bond Fund
March 31, 2009
connection with the Columbia Group providing services to the Columbia Funds, the Columbia Funds have voluntarily undertaken to implement certain governance measures designed to maintain the independence of their boards of trustees and certain special consulting and compliance measures.
Pursuant to the SEC Order and related procedures, the $140 million in settlement amounts described above has been substantially distributed in accordance with a distribution plan that was developed by an independent distribution consultant and approved by the SEC on April 6, 2007.
In connection with the events described above, various parties have filed suit against certain funds, the Trustees of the Columbia Funds, FleetBoston Financial Corporation and its affiliated entities and/or Bank of America and its affiliated entities.
On February 20, 2004, the Judicial Panel on Multidistrict Litigation transferred these cases and cases against other mutual fund companies based on similar allegations to the United States District Court in Maryland for consolidated or coordinated pretrial proceedings (the “MDL”). Subsequently, additional related cases were transferred to the MDL. On September 29, 2004, the plaintiffs in the MDL filed amended and consolidated complaints. One of these amended complaints is a putative class action that includes claims under the federal securities laws and state common law, and that names Columbia Management Advisors, Inc. (which has since merged into Banc of America Capital Management, LLC (now named Columbia Management Advisors, LLC)) (“Columbia”), Columbia Funds Distributor, Inc. (now named Columbia Management Distributors, Inc.) (the “Distributor”), the Trustees of the Columbia Funds, Bank of America Corporation and others as defendants. Another of the amended complaints is a derivative action purportedly on behalf of the Columbia Funds that asserts claims under federal securities laws and state common law.
On February 25, 2005, Columbia and other defendants filed motions to dismiss the claims in the pending cases. On March 1, 2006, for reasons stated in the court’s memoranda dated November 3, 2005, the United States District Court for the District of Maryland granted in part and denied in part the defendants’ motions to dismiss. The court dismissed all of the class action claims pending against the Columbia Funds Trusts. As to Columbia and the Distributor, the claims under the Securities Act of 1933, the claims under Sections 34(b) and 36(a) of the Investment Company Act of 1940 (“ICA”) and the state law claims were dismissed. The claims under Sections 10(b) and 20(a) of the Securities Exchange Act of 1934 and claims under Section 36(b) of the ICA were not dismissed.
On March 21, 2005, a purported class action was filed in Massachusetts state court alleging that certain conduct, including market timing, entitled Class B shareholders in certain Columbia Funds to an exemption from contingent deferred sales charges upon early redemption (the “CDSC Lawsuit”). The CDSC Lawsuit was removed to federal court in Massachusetts and transferred to the MDL.
On September 14, 2007, the plaintiffs and the Columbia defendants named in the MDL, including the Columbia Funds, entered into a stipulation of settlement with respect to all Columbia-related claims in the MDL described above, including the CDSC Lawsuit. The settlement is subject to court approval.
52
Report of Independent Registered Public Accounting Firm
To the Trustees of Columbia Funds Series Trust I and the Shareholders of Columbia Intermediate Bond Fund
In our opinion, the accompanying statements of assets and liabilities, including the investment portfolio, and the related statements of operations and of changes in net assets and the financial highlights present fairly, in all material respects, the financial position of Columbia Intermediate Bond Fund (the “Fund”) (a series of Columbia Funds Series Trust I) at March 31, 2009, and the results of its operations, the changes in its net assets and the financial highlights for the periods indicated, in conformity with accounting principles generally accepted in the United States of America. These financial statements and financial highlights (hereafter referred to as “financial statements”) are the responsibility of the Fund’s management. Our responsibility is to express an opinion on these financial statements based on our audits. We conducted our audits of these financial statements in accordance with the standards of the Public Company Accounting Oversight Board (United States). Those standards require that we plan and perform the audit to obtain reasonable assurance about whether the financial statements are free of material misstatement. An audit includes examining, on a test basis, evidence supporting the amounts and disclosures in the financial statements, assessing the accounting principles used and significant estimates made by management, and evaluating the overall financial statement presentation. We believe that our audits, which included confirmation of securities at March 31, 2009 by correspondence with the custodian and brokers, provide a reasonable basis for our opinion.
PricewaterhouseCoopers LLP
Boston, Massachusetts
May 22, 2009
53
Fund Governance
The Trustees serve terms of indefinite duration. The names, addresses and ages of the Trustees and officers of the Funds in Columbia Funds Series Trust I, the year each was first elected or appointed to office, their principal business occupations during at least the last five years, the number of Funds overseen by each Trustee and other directorships they hold are shown below. Each officer listed below serves as an officer of each Fund in the Columbia Funds Complex.
Independent Trustees
| | |
Name, address and year of birth,
Position with funds, Year first
elected or appointed to office | | Principal Occupation(s) During Past Five Years, Number of Funds in Columbia Funds
Complex Overseen by Trustee, Other Directorships Held |
| |
| John D. Collins (born 1938) | | |
c/o Columbia Management Advisors, LLC One Financial Center Boston, MA 02111 Trustee (since 2007) | | Retired. Consultant, KPMG, LLP (accounting and tax firm) from July 1999 to June 2000; Partner, KPMG, LLP from March 1962 to June 1999. Oversees 79, Mrs. Fields Famous Brands LLC (consumer products); Suburban Propane Partners, L.P.; and Montpelier Re (underwriting firm) |
| |
| Rodman L. Drake (born 1943) | | |
c/o Columbia Management Advisors, LLC One Financial Center Boston, MA 02111 Trustee (since 2007) | | Co-Founder of Baringo Capital LLC (private equity) since 2002; President, Continuation Investments Group, Inc. from 1997 to 2001. Oversees 79, Jackson Hewitt Tax Service Inc. (tax preparation services); Crystal Capital River Inc. (real estate investment trust); Student Loan Corporation (student loan provider); Celgene Corporation (global biotechnology company); Apex Silver Mines Ltd. (mining); and Helios Total Return Fund, Inc. and Helios Strategic Mortgage Income Fund, Inc. (exchange-traded funds) |
| |
| Douglas A. Hacker (born 1955) | | |
c/o Columbia Management Advisors, LLC One Financial Center Boston, MA 02111 Trustee (since 1996) | | Independent business executive since May 2006; Executive Vice President–Strategy of United Airlines (airline) from December 2002 to May 2006; President of UAL Loyalty Services (airline marketing company) from September 2001 to December 2002; Executive Vice President and Chief Financial Officer of United Airlines from July 1999 to September 2001. Oversees 79, Nash Finch Company (food distributor); Aircastle Limited (aircraft leasing) |
| |
| Janet Langford Kelly (born 1957) | | |
c/o Columbia Management Advisors, LLC One Financial Center Boston, MA 02111 Trustee (since 1996) | | Senior Vice President, General Counsel and Corporate Secretary, ConocoPhillips (integrated energy company) since September 2007; Deputy General Counsel–Corporate Legal Services, ConocoPhillips from August 2006 to August 2007; Partner, Zelle, Hofmann, Voelbel, Mason & Gette LLP (law firm) from March 2005 to July 2006; Adjunct Professor of Law, Northwestern University, from September 2004 to June 2006; Director, UAL Corporation (airline) from February 2006 to July 2006; Oversees 79, None |
| |
| Charles R. Nelson (born 1942) | | |
c/o Columbia Management Advisors, LLC One Financial Center Boston, MA 02111 Trustee (since 1981) | | Professor of Economics, University of Washington, since January 1976; Ford and Louisa Van Voorhis Professor of Political Economy, University of Washington, since September 1993; Adjunct Professor of Statistics, University of Washington, since September 1980; Associate Editor, Journal of Money Credit and Banking, from 1993 to 2008; Consultant on econometric and statistical matters. Oversees 79, None |
54
Fund Governance (continued)
Independent Trustees (continued)
| | |
Name, address and year of birth,
Position with funds, Year first
elected or appointed to office | | Principal Occupation(s) During Past Five Years, Number of Funds in Columbia Funds
Complex Overseen by Trustee, Other Directorships Held |
| |
| John J. Neuhauser (born 1943) | | |
c/o Columbia Management Advisors, LLC One Financial Center Boston, MA 02111 Trustee (since 1985) | | President, Saint Michael’s College, since August 2007; University Professor, Boston College from November 2005 to August 2007; Academic Vice President and Dean of Faculties, Boston College from August 1999 to October 2005. Oversees 79, Liberty All-Star Equity Fund and Liberty All-Star Growth Fund, Inc. (closed-end funds) |
| |
| Jonathan Piel (born 1938) | | |
c/o Columbia Management Advisors, LLC One Financial Center Boston, MA 02111 Trustee (since 2007) | | Cable television producer and website designer; The Editor, Scientific American from 1984 to 1994; Vice President, Scientific American, Inc., from 1984 to 1994; Member, Advisory Board, Stone Age Institute, Bloomington, Indiana (research institute that explores the effect of technology on human evolution); Member, Board of Directors of the National Institute of Social Sciences, New York City; Member, Board of Trustees of the William Alanson White Institute, New York City (institution for training psychoanalysts) and Member, Advisory Board, Mount Sinai Children’s Environmental Health Center, New York; Oversees 79, None |
| |
| Patrick J. Simpson (born 1944) | | |
c/o Columbia Management Advisors, LLC One Financial Center Boston, MA 02111 Trustee (since 2000) | | Partner, Perkins Coie LLP (law firm). Oversees 79, None |
| |
| Thomas C. Theobald (born 1937) | | |
c/o Columbia Management Advisors, LLC One Financial Center Boston, MA 02111 Trustee and Chairman of the Board (since 1996) | | Partner and Senior Advisor, Chicago Growth Partners (private equity investing) since September 2004; Managing Director, William Blair Capital Partners (private equity investing) from September 1994 to September 2004. Oversees 79, Anixter International (network support equipment distributor); Ventas, Inc. (real estate investment trust); Jones Lang LaSalle (real estate management services); Ambac Financial Group (financial guaranty insurance) |
| |
| Anne-Lee Verville (born 1945) | | |
c/o Columbia Management Advisors, LLC One Financial Center Boston, MA 02111 Trustee (since 1998) | | Retired since 1997 (formerly General Manager–Global Education Industry (from 1994 to 1997), President–Application Systems Division (from 1991 to 1994), Chief Financial Officer–US Marketing & Services (from 1988 to 1991), and Chief Information Officer (from 1987 to 1988), IBM Corporation (computer and technology)). Oversees 79, None |
55
Fund Governance (continued)
Interested Trustee
| | |
Name, address and year of birth,
Position with funds, Year first
elected or appointed to office | | Principal Occupation(s) During Past Five Years, Number of Funds in Columbia Funds
Complex Overseen by Trustee, Other Directorships Held |
| |
| William E. Mayer (born 1940) | | |
c/o Columbia Management Advisors, LLC One Financial Center Boston, MA 02111 Trustee1 (since 1994) | | Partner, Park Avenue Equity Partners (private equity) since February 1999; Dean and Professor, College of Business, University of Maryland from 1992 to 1997. Oversees 79, Lee Enterprises (print media), WR Hambrecht + Co. (financial service provider); BlackRock Kelso Capital Corporation (investment company) |
1 | The Funds currently treat Mr. Mayer as an “interested person” (as defined in the Investment Company Act of 1940) by reason of his affiliation with WR Hambrecht + Co., a registered broker/dealer that may execute portfolio transactions for or engage in principal transactions with the Funds or other funds or accounts advised/managed by the Advisor or other Bank of America affiliates. |
The Statement of Additional Information includes additional information about the Trustees of the Funds and is available, without charge, upon request by calling 1-800-345-6611.
56
Fund Governance (continued)
Officers
| | |
Name, address and year of birth,
Position with Columbia Funds, Year
first elected or appointed to office | | Principal occupation(s) during past five years |
| |
| J. Kevin Connaughton (born 1964) | | |
One Financial Center Boston, MA 02111 President (since 2009) | | Managing Director of Columbia Management Advisors, LLC since December 2004; Senior Vice President and Chief Financial Officer–Columbia Funds, from June 2008 to January 2009; Treasurer–Columbia Funds, from October 2003 to May 2008; Treasurer–the Liberty Funds, Stein Roe Funds and Liberty All-Star Funds, December 2000–December 2006; Senior Vice President–Columbia Management Advisors, LLC, from April 2003 to December 2004; President–Columbia Funds, Liberty Funds and Stein Roe Funds, February 2004 to October 2004; Treasurer–Galaxy Funds, September 2002 to December 2005; Treasurer, December 2002 to December 2004, and President, February 2004 to December 2004–Columbia Management Multi-Strategy Hedge Fund, LLC; and a senior officer of various other Bank of America-affiliated entities, including other registered and unregistered funds. |
|
| James R. Bordewick, Jr. (born 1959) |
One Financial Center Boston, MA 02111 Senior Vice President, Secretary and Chief Legal Officer (since 2006) | | Associate General Counsel, Bank of America since April 2005; Senior Vice President and Associate General Counsel, MFS Investment Management (investment management) prior to April 2005. |
| |
| Linda J. Wondrack (born 1964) | | |
One Financial Center Boston, MA 02111 Senior Vice President and Chief Compliance Officer (since 2007) | | Director (Columbia Management Group LLC and Investment Product Group Compliance), Bank of America since June 2005; Director of Corporate Compliance and Conflicts Officer, MFS Investment Management (investment management), August 2004 to May 2005; Managing Director, Deutsche Asset Management (investment management) prior to August 2004. |
| |
| Michael G. Clarke (born 1969) | | |
One Financial Center Boston, MA 02111 Senior Vice President and Chief Financial Officer (since 2009) | | Director of Fund Administration of the Advisor since January 2006; Managing Director of the Advisor September 2004 to December 2005; Vice President Fund Administration June 2002 to September 2004. |
| |
| Jeffrey R. Coleman (born 1969) | | |
One Financial Center Boston, MA 02111 Deputy Treasurer (since 2006) | | Director of Fund Administration of the Advisor since January 2006; Fund Controller of the Advisor from October 2004 to January 2006; Vice President of CDC IXIS Asset Management Services, Inc. (investment management) from August 2000 to September 2004. |
| |
| Joseph F. DiMaria (born 1968) | | |
One Financial Center Boston, MA 02111 Chief Accounting Officer and Treasurer (since 2009) | | Director of Fund Administration of the Advisor since January 2006; Head of Tax/Compliance and Assistant Treasurer of the Advisor from November 2004 to December 2005; Director of Trustee Administration (Sarbanes-Oxley) of the Advisor from May 2003 to October 2004. |
57
Fund Governance (continued)
Officers (continued)
| | |
Name, address and year of birth,
Position with Columbia Funds, Year
first elected or appointed to office | | Principal occupation(s) during past five years |
| |
| Julian Quero (born 1967) | | |
One Financial Center Boston, MA 02111 Deputy Treasurer (since 2008) | | Senior Tax Manager of the Advisor since August 2006; Senior Compliance Manager of the Advisor from April 2002 to August 2006. |
| |
| Barry S. Vallan (born 1969) | | |
One Financial Center Boston, MA 02111 Controller (since 2006) | | Vice President–Fund Treasury of the Advisor since October 2004; Vice President–Trustee Reporting of the Advisor from April 2002 to October 2004 |
58
Board Consideration and Approval of Advisory Agreements
The Advisory Fees and Expenses Committee of the Board of Trustees meets several times annually to review the advisory agreements (collectively, the “Agreements”) of the funds for which the Trustees serve as trustees (each a “fund”) and to determine whether to recommend that the full Board approve the continuation of the Agreements for an additional one-year period. After the Committee has made its recommendation, the full Board, including the Independent Trustees, determines whether to approve the continuation of the Agreements. In addition, the full Board, including the Independent Trustees, considers matters bearing on the Agreements at most of its other meetings throughout the year and meets regularly with senior management of the funds and Columbia, the funds’ investment adviser, including the senior manager of each investment area within Columbia. Through the Board’s Investment Oversight Committees, Trustees also meet with selected fund portfolio managers, research analysts and traders at various times throughout the year.
The Trustees receive and review all materials that they, their legal counsel or Columbia believe to be reasonably necessary for the Trustees to evaluate the Agreements and to determine whether to approve the continuation of the Agreements. Those materials generally include, among other items, (i) information on the investment performance of each fund relative to the performance of peer groups of mutual funds and the fund’s performance benchmarks, and additional information assessing performance on a risk-adjusted basis, (ii) information on each fund’s advisory fees and other expenses, including information comparing the fund’s expenses to those of peer groups of mutual funds and information about any applicable expense caps and fee “breakpoints,” (iii) information about the profitability of the Agreements to Columbia, including potential “fall-out” or ancillary benefits that Columbia and its affiliates may receive as a result of their relationships with the funds and (iv) information obtained through Columbia’s response to a questionnaire prepared at the request of the Trustees by counsel to the funds and independent legal counsel to the Independent Trustees. The Trustees also consider other information such as (v) Columbia’s financial results and financial condition, (vi) each fund’s investment objective and strategies and the size, education and experience of Columbia’s investment staffs and their use of technology, external research and trading cost measurement tools, (vii) the allocation of the funds’ brokerage and the use of “soft” commission dollars to pay for research products and services, (viii) Columbia’s resources devoted to, and its record of compliance with, the funds’ investment policies and restrictions, policies on personal securities transactions and other compliance policies and legal and regulatory requirements, (ix) Columbia’s response to various legal and regulatory proceedings since 2003 and to the recent period of volatility in the securities markets and (x) the economic outlook generally and for the mutual fund industry in particular. In addition, the Advisory Fees and Expenses Committee confers with the funds’ independent fee consultant and reviews materials relating to the funds’ relationships with Columbia provided by the independent fee consultant. Throughout the process, the Trustees have the opportunity to ask questions of and to request additional materials from Columbia and to consult with the independent fee consultant and independent legal counsel to the Independent Trustees.
The Board of Trustees most recently approved the continuation of the Agreements at its October, 2008 meeting, following meetings of the Advisory Fees and Expenses Committee held in February, April, August, September and October, 2008. In considering whether to approve the continuation of the Agreements, the Trustees, including the Independent Trustees, did not identify any single factor as determinative, and each weighed various factors as he or she deemed appropriate. The Trustees considered the following matters in connection with their approval of the continuation of the Agreements:
The nature, extent and quality of the services provided to the funds under the Agreements. The Trustees considered the nature, extent and quality of the services provided by Columbia and its affiliates to the funds and the resources dedicated to the funds by Columbia and its affiliates. Among other things, the Trustees considered (i) Columbia’s ability (including its personnel and other resources, compensation programs for personnel involved in fund management, reputation and other attributes) to attract, motivate and retain highly qualified research, advisory and supervisory investment professionals; (ii) the portfolio management services provided by those investment professionals; and (iii) the trade execution services provided on behalf of the funds. For each fund, the Trustees also considered the benefits to shareholders of investing in a mutual fund that is
59
part of a family of funds offering exposure to a variety of asset classes and investment disciplines and providing a variety of fund and shareholder services. After reviewing those and related factors, the Trustees concluded, within the context of their overall conclusions regarding each of the Agreements, that the nature, extent and quality of services provided supported the continuation of the Agreements.
Investment performance of the funds and Columbia. The Trustees reviewed information about the performance of each fund over various time periods, including information prepared by an independent third-party data provider that compared the performance of each fund to the performance of peer groups of mutual funds and performance benchmarks. The Trustees also reviewed a description of the third party’s methodology for identifying each fund’s peer group for purposes of performance and expense comparisons. The Trustees also considered additional information that the Advisory Fees and Expenses Committee requested from Columbia relating to funds that presented relatively weaker performance and/or relatively higher expenses. In the case of each fund whose performance lagged that of a relevant peer group for certain (although not necessarily all) periods, the Trustees concluded that other factors relevant to performance were sufficient, in light of other considerations, to warrant continuation of the fund’s Agreements. Those factors varied from fund to fund, but included one or more of the following: (i) that the fund’s performance, although lagging in certain recent periods, was stronger over the longer term; (ii) that the underperformance was attributable, to a significant extent, to investment decisions that were reasonable and consistent with the fund’s investment strategy and policies and that the fund was performing within a reasonable range of expectations, given those investment decisions, market conditions and the fund’s investment strategy; (iii) that the fund’s performance was competitive when compared to other relevant performance benchmarks or peer groups; (iv) that Columbia had taken or was taking steps designed to help improve the fund’s investment performance, including, but not limited to, replacing portfolio managers or modifying investment strategies; and (v) that Columbia proposed to waive advisory fees or cap the expenses of the fund.
The Trustees noted that, through April 30, 2008, Columbia Intermediate Bond Fund’s performance was in the fourth quintile (where the best performance would be in the first quintile) for the one-year period, in the third quintile for the three-year period, in the first quintile for the five-year period, and in the second quintile for the ten-year period, of the peer group selected by an independent third-party data provider for purposes of performance comparisons.
The Trustees also considered Columbia’s performance and reputation generally, the funds’ performance as a fund family generally, and Columbia’s historical responsiveness to Trustee concerns about performance and Columbia’s willingness to take steps intended to improve performance. After reviewing those and related factors, the Trustees concluded, within the context of their overall conclusions regarding each of the Agreements, that the performance of each fund and Columbia was sufficient, in light of other considerations, to warrant the continuation of the Agreement(s) pertaining to that fund.
The costs of the services provided and profits realized by Columbia and its affiliates from their relationships with the funds. The Trustees considered the fees charged to the funds for advisory services as well as the total expense levels of the funds. That information included comparisons (provided by management and by an independent third-party data provider) of each fund’s advisory fees and total expense levels to those of the fund’s peer groups and information about the advisory fees charged by Columbia to comparable institutional accounts. In considering the fees charged to those accounts, the Trustees took into account, among other things, management’s representations about the differences between managing mutual funds as compared to other types of accounts, including differences in the services provided, differences in the risk profile of such business for Columbia, and the additional resources required to manage mutual funds effectively. In evaluating each fund’s advisory fees, the Trustees also took into account the demands, complexity and quality of the investment management of the fund. The Trustees considered existing advisory fee breakpoints, and Columbia’s use of advisory fee waivers and expense caps, which benefited a number of the funds. The Trustees also noted management’s stated justification for the fees charged to the funds, which included information about the investment performance of the funds and the services provided to the funds.
The Trustees considered that Columbia Intermediate Bond Fund’s total expenses were in the fifth quintile and actual
60
management fees were in the fourth quintile (where the lowest fees and expenses would be in the first quintile) of the peer group selected by an independent third-party data provider for purposes of expense comparisons.
The Trustees also considered the compensation directly or indirectly received by Columbia and its affiliates from their relationships with the funds. The Trustees reviewed information provided by management as to the profitability to Columbia and its affiliates of their relationships with each fund, and information about the allocation of expenses used to calculate profitability. When reviewing profitability, the Trustees also considered court cases in which adviser profitability was an issue in whole or in part, the performance of the relevant funds, the expense level of each fund, and whether Columbia had implemented breakpoints and/or expense caps with respect to the fund.
After reviewing those and related factors, the Trustees concluded, within the context of their overall conclusions regarding each of the Agreements, that the advisory fees charged to each fund, and the related profitability to Columbia and its affiliates of their relationships with the fund, supported the continuation of the Agreement(s) pertaining to that fund.
Economies of Scale. The Trustees considered the existence of any economies of scale in the provision by Columbia of services to each fund, to groups of related funds, and to Columbia’s investment advisory clients as a whole and whether those economies were shared with the funds through breakpoints in the investment advisory fees or other means, such as fee waivers/expense reductions and additional investments by Columbia in investment, trading and compliance resources. The Trustees noted that many of the funds benefited from breakpoints, fee waivers/expense caps, or both. In considering those issues, the Trustees also took note of the costs of the services provided (both on an absolute and a relative basis) and the profitability to Columbia and its affiliates of their relationships with the funds, as discussed above.
After reviewing those and related factors, the Trustees concluded, within the context of their overall conclusions regarding each of the Agreements, that the extent to which economies of scale were shared with the funds supported the continuation of the Agreements.
Other Factors. The Trustees also considered other factors, which included but were not limited to the following:
| n | | the extent to which each fund had operated in accordance with its investment objective and investment restrictions, the nature and scope of the compliance programs of the funds and Columbia and the compliance-related resources that Columbia and its affiliates were providing to the funds; |
| n | | the nature, quality, cost and extent of administrative and shareholder services overseen and performed by Columbia and its affiliates, both under the Agreements and under separate agreements for the provision of transfer agency and administrative services; |
| n | | so-called “fall-out benefits” to Columbia and its affiliates, such as the engagement of its affiliates to provide distribution, brokerage and transfer agency services to the funds, and the benefits of research made available to Columbia by reason of brokerage commissions generated by the funds’ securities transactions, as well as possible conflicts of interest associated with those fall-out and other benefits, and the reporting, disclosure and other processes in place to disclose and monitor those possible conflicts of interest; and |
| n | | the report provided by the funds’ independent fee consultant, which included information about and analysis of the funds’ fees, expenses and performance. |
Based on their evaluation of all factors that they deemed to be material, including those factors described above, and assisted by the advice of independent counsel and the independent fee consultant, the Trustees, including the Independent Trustees, approved the continuance of each of the Agreements through October 31, 2009.
61
Summary of Management Fee Evaluation by Independent Fee Consultant
EXCERPTS FROM REPORT OF INDEPENDENT FEE CONSULTANT TO THE FUNDS SUPERVISED BY THE COLUMBIA ATLANTIC BOARD
Prepared Pursuant to the February 9, 2005 Assurance of Discontinuance among the Office of Attorney General of New York State, Columbia Management Advisors, LLC, and Columbia Management Distributors, Inc. November 3, 2008
I. Overview
On February 9, 2005, Columbia Management Advisors, LLC (“CMA”) and Columbia Management Distributors, Inc.1 (“CMD”) agreed to the New York Attorney General’s Assurance of Discontinuance (“AOD”). Among other things, the AOD stipulates that CMA may manage or advise a Columbia Fund (“Columbia Fund” and, together with some or all of, such funds the “Columbia Funds”) only if the Independent Members of the Columbia Fund’s Board of Trustees appoint a Senior Officer or retain an Independent Fee Consultant (“IFC”) who is to manage the process by which proposed management fees are negotiated. The AOD further stipulates that the Senior Officer or IFC is to prepare a written annual evaluation of the fee negotiation process.
With effect from January 1, 2007, the Independent Members of the Board of Trustees for certain Columbia Funds known collectively as the “Atlantic Funds” (together with the other members of that Board, the “Trustees”) retained me as IFC for the Atlantic Funds.2 In this capacity, I have prepared the fourth annual written evaluation of the fee negotiation process. As was the case with last year’s report (the “2007 Report”) my immediate predecessor as IFC, John Rea, provided invaluable assistance in the preparation of this year’s report.
A. Role of the Independent Fee Consultant
The AOD charges the IFC with “managing the process by which proposed management fees…to be charged the Columbia Fund are negotiated so that they are negotiated in a manner which is at arms’ length and reasonable and consistent with this Assurance of Discontinuance.” The AOD also provides that CMA “may manage or advise a Columbia Fund only if the reasonableness of the proposed management fees is determined by the Board of Trustees…using…an annual independent written evaluation prepared by or under the direction of…the Independent Fee Consultant.” Therefore, the AOD makes clear that the IFC does not supplant the Trustees in negotiating management fees with CMA, nor does the IFC substitute his or her judgment for that of the Trustees with respect to the reasonableness of proposed fees or any other matter that is committed to the business judgment of the Trustees.
B. Elements Involved in Managing the Fee Negotiation Process
In preparing the report required by the AOD, the IFC must consider at least the following six factors set forth in the AOD:
| 1. | The nature and quality of CMA’s services, including the Fund’s performance; |
| 2. | Management fees (including any components thereof) charged by other mutual fund companies for like services; |
| 3. | Possible economies of scale as the Fund grows larger; |
| 4. | Management fees (including any components thereof) charged to institutional and other clients of CMA for like services; |
| 5. | Costs to CMA and its affiliates of supplying services pursuant to the management fee agreements, excluding any intra-corporate profit; and |
| 6. | Profit margins of CMA and its affiliates from supplying such services. |
C. Organization of the Annual Evaluation
This report, like last year’s, focuses on the six factors and contains a section for each factor except that CMA’s costs and profits from managing the Funds have been combined into a single section. In addition to a discussion of these factors, the report offers recommendations to improve the fee review process in future years. A review of the status of
1 | CMA and CMD are subsidiaries of Columbia Management Group, LLC (“CMG”), and are the successors to the entities named in the AOD. |
2 | I have no material relationship with Bank of America, CMG or any of its affiliates, aside from serving as IFC, and I am aware of no material relationship with any of their affiliates. I retained John Rea, an independent economic consultant, to assist me with this report. |
| | Unless otherwise stated or required by the context, this report covers only the Atlantic Funds, which are also referred as the “Funds.” |
62
recommendations made in the 2007 Report is being provided separately with the materials for the October meeting.
II. Summary of Findings
A. General
| 1. | Based upon my examination of the information supplied by CMG in the light of the six factors set forth in the AOD, I conclude that the Trustees have the relevant information necessary to evaluate the reasonableness of the proposed management fees for each Atlantic Fund. |
| 2. | In my view, the process by which the proposed management fees of the Funds have been negotiated in 2008 thus far has been, to the extent practicable, at arms’ length and reasonable and consistent with the AOD. |
B. Nature and Quality of Services, Including Performance
| 3. | The performance of the Funds has been relatively strong in recent years. Based upon 1-, 3-, 5-, and 10-year returns through April 30, 2008, at least half of all the Funds were in the first and second performance quintiles in each of the four performance periods and, at most, only 11% were in the fifth quintile in any one performance period. Both equity and fixed-income funds posted strong performance relative to comparable funds. |
| 4. | Performance rankings were similar in 2007 and 2008, although last year’s were slightly stronger. Despite the stability in the distribution of rankings in the two years, at least half the Funds changed quintile rankings between the two years in at least one of the 1-, 3-, and 5-year performance periods. |
| 5. | The performance of the actively managed equity Funds against their benchmarks was very strong. At least 57% and as many as 73% posted net returns exceeding their benchmarks over the 1-, 3-, and 5-year periods. In contrast, gross and net returns of fixed-income Funds typically fell short of their benchmarks. |
| 6. | Atlantic equity Funds’ overall performance adjusted for risk also was strong. Based upon 3-year returns, nearly 80% of the equity Funds had a combination of risk-adjusted and unadjusted returns that placed them in the top half of their performance universes. Only about one-fifth of the fixed income Funds posted high returns and low risk relative to comparable funds. About two-thirds of the fixed-income Funds took on more risk than the typical fund in their performance universes. |
| 7. | The industry-standard procedure used by Lipper that includes all share classes in the performance universe tends to bias a Fund’s ranking upward within that universe. The bias occurs because either no-12b-1 fee or low-12b-1 fee share classes of the Atlantic Funds are compared with funds in performance universes that include all share classes of multi-class funds with 12b-1 fees of up to 100 basis points. Correcting this bias by limiting the performance universe to classes of comparable funds with low or no 12b-1 fees (a “filtered universe”) lowers the relative performance for the Funds, but their performance, on the whole, remains strong. The filtering process, however, did identify two Funds for further review that had not been designated review funds using unfiltered universes. |
| 8. | A small number of Funds have consistently underperformed over the past four years. The exact number depends on the criteria used to evaluate longer-term performance. For example, the one-year returns of one Fund have been in the fourth or fifth performance quintiles in each of the past four years; there are six Funds whose three-year returns have been in the fourth or fifth quintile over the past four years. |
| 9. | The services performed by CMG professionals beyond portfolio management, such as compliance, legal, information technology, risk management, finance and fund administration, are critical to the success of the Funds and appear to be of high quality. |
C. Management Fees Charged by Other Mutual Fund Companies
| 10. | The Funds’ management fees and total expenses are generally low relative to those of their peers. Only 21% of the Funds ranked in the two most expensive quintiles for actual management fees, and only 23% in those quintiles for total expenses. |
| 11. | The highest concentration of low-expense Funds is found among the equity and tax-exempt fixed income Funds. The 12 former Excelsior Funds have relatively high fees and expenses, with half of those Funds ranking in either the fourth or fifth quintiles. The higher actual management fee |
63
| | rankings of certain Excelsior Funds are due in part to fee schedules that are higher than standard Columbia Fund fee schedules at current asset levels. After discussion with the Trustees, CMA is proposing to lower the management fees on three of these Funds. |
| 12. | The distribution of expense rankings is similar in 2007 and 2008, while management fee rankings improved markedly in 2008. Part of the improvement reflects expense limitations introduced last year for the state intermediate municipal bond Funds. |
| 13. | The management fees of the Atlantic Funds are generally in line with those of Columbia Funds supervised by the Nations Board of Trustees (the “Nations Funds”). In investment categories in which the Atlantic Funds have higher average fees, the difference principally arises out of differences in asset size. |
D. Trustees’ Fee and Performance Evaluation Process
| 14. | The Trustees’ evaluation process identified 17 Funds in 2008 for further review based upon their relative performance or expenses or both. When compared in filtered universes, two more Funds met the criteria for further review. CMG provided further information about those Funds to assist the Trustees in their evaluation. |
E. Potential Economies of Scale
| 15. | CMG presented to the Trustees its analysis of the sources and sharing of potential economies of scale. CMG views economies of scale as arising at the complex level and would regard estimates of scale economies for individual funds as unreliable. In its analysis, CMG did not identify specific sources of economies of scale or provide any estimates of any economies of scale that might arise from future asset growth. CMG’s analysis included measures taken by the Trustees and CMG that seek to share any potential economies of scale through breakpoints in management fee schedules, expense reimbursements, fee waivers, enhanced shareholder services, fund mergers, and operational consolidation. |
| 16. | An examination of the contractual fee schedules for five Atlantic Funds shows that they are generally in line with those of their competitors, in terms of number and extent of fee breakpoints. A similar examination last year of five different Funds led to the same conclusion. |
F. Management Fees Charged to Institutional Clients
| 17. | CMG has provided Trustees with comparisons of mutual fund management fees and institutional fees based upon standardized fee schedules and upon actual fees. The results show that, consistent with industry practice, institutional fees are generally lower than the Funds’ management fees. However, because the services provided and risks borne by the manager are more extensive for mutual funds compared to institutional accounts, the differences are of limited value in assisting the Trustees in their review of the reasonableness of the Funds’ management fees. |
G. Revenues, Expenses, and Profits
| 18. | The activity-based cost allocation methodology (“ABC”) employed by CMG to allocate costs, both direct and indirect, for purposes of calculating Fund profitability is thoughtful and detailed. This year, CMG proposed a change to the method by which indirect expenses are allocated. Under this “hybrid” method, indirect costs relating to fund management are allocated among the Funds 50% by assets and 50% per Fund. Allocating indirect expenses equally to each Fund has an intuitive logic, as each Fund regardless of size has certain expenses, such as preparing and printing prospectuses and financial statements. |
| 19. | The materials provided on CMG’s revenues and expenses with respect to the Funds and the methodology underlying their construction form a sufficient basis for Trustees to evaluate the expenses and profitability of the Funds. |
| 20. | In 2007, CMG’s complex-wide pre-tax margins on the Atlantic Funds were slightly below industry medians, based on limited data available for publicly held mutual fund managers. However, as is to be expected in a complex now comprising 75 Funds (including former Excelsior Funds), some Atlantic Funds have relatively high pre-tax profit margins, when calculated solely with respect to management revenues and expenses, while other Atlantic Funds operate at a loss. There is a positive relationship between fund size and profitability, with smaller funds generally operating at a loss. |
| 21. | CMG pays a fixed percentage of its management fee revenues to an affiliate, U.S. Trust, Bank of America |
64
| | Private Wealth Management, to compensate it for services it performs with respect to Atlantic Fund assets held for the benefit of its customers. Based on our analysis of the services provided by this affiliate, we have concluded that all payments other than those for sub-transfer agent or sub-accounting services should be treated as a distribution expense. |
III. Recommendations
| 1) | Criteria for review. The Trustees may wish to consider modifying the criteria for classifying a fund as a “Review Fund” to include criteria that focus exclusively on performance without regard to expense or fee levels. For example, a fund whose one-year or three-year performance was median or below for four consecutive years could be treated as a Review Fund. When we applied such criteria to the Funds, several additional Funds would have been added to the list of Review Funds. |
| 2) | Profitability data. CMG should present to the Trustees each year the profitability of each Fund, each investment style and each complex (of which Atlantic is one) calculated as follows: |
| | a. | Management-only profitability should be calculated without reference to any Private Bank expense. |
| | b. | Profitability excluding distribution (which essentially covers the management and transfer agency functions) should be adjusted by removing from the expense calculation any portion of the Private Bank payment not attributable to the performance by the Private Bank of sub-transfer agency or sub-accounting functions. |
| | c. | Total profitability, including distribution: No adjustment for Private Bank expenses should be made, because all such expenses represent legitimate fund expenses to be taken into account in calculating CMG’s profit margin including distribution. |
| | d. | Distribution only: This should include all Private Bank expenses other than those attributable to sub-transfer agency services. |
Therefore, the following data need not be provided:
| | 1. | Adjusting total profitability data for Private Bank expenses |
| | 2. | Adjusting profitability excluding distribution by backing out all Private Bank expenses. |
| 3) | Potential economies of scale. CMG and the IFC should continue to work on methods for more precisely quantifying to the extent possible the sources and magnitude of any economies of scale as CMG’s mutual fund assets under management increase, to the extent that the data allows for meaningful year-over-year comparisons. The framework suggested in Section IV.D.4 may prove to be a useful model for such an analysis. |
| 4) | Competitive breakpoint analysis. As part of the annual fee evaluation process, the breakpoints of a select group of Atlantic Funds (which would differ each year) should continue to be compared to those of industry rivals to ensure that the Funds’ breakpoint schedules remain within industry norms. As breakpoint schedules change relatively little each year, performing such a comparison for each Atlantic Fund each year would not be an efficient use of Trustee and CMG resources. |
| 5) | Cost allocation methodology. CMG’s point that the current ABC system of allocating indirect expenses creates anomalous results in several cases, including sub-advised Funds, is well-taken. We would like to work with CMG over the forthcoming year on alternatives to the current system of allocating indirect expenses that (1) resolve the anomalies, (2) limit the amount of incremental effort on CMG’s part and (3) remain faithful to the general principle that expenses should be allocated by time and effort to the extent reasonably possible. |
| 6) | Management fee disparities. CMG and the Atlantic Trustees, as part of any future study of management fees, should analyze the differences in management fee schedules, principally arising out of the reorganization of the former Excelsior Funds as Atlantic Funds. As part of that analysis, CMG should provide an explanation for any significant fee differences among comparable funds across fund families managed by CMA, such as differences in the management styles of different Funds included the same Lipper category. Finally, whenever CMG proposes a management fee change or an expense cap for any mutual fund managed by CMA that is comparable to any Atlantic Fund, CMG should provide the Trustees with sufficient information about the proposal to allow the Trustees to assess the applicability of the proposed change to the relevant Atlantic Fund or Funds. |
65
| 7) | Tax-exempt Fund expense data. The expense rankings of certain tax-exempt Funds were adversely affected by including certain investment-related interest expenses that Lipper excluded in calculating the expense ratios of competitors. We recommend that CMG follow the Lipper practice and exclude such interest expenses from data submitted to Lipper to avoid unfairly disadvantaging the tax-exempt Funds. |
| 8) | Reduction of volume of paper documents submitted. The effort to rationalize and simplify the data presented to the Trustees and the process by which that data was prepared and organized was regarded as a success by all parties. We should continue to look for opportunities to reduce and simplify the presentation of 15(c) data, especially in the area of Fund profitability. The Fund “Dashboard” volume presents a large volume of Fund data on a single page. If it is continued, the Trustees may wish to consider receiving the underlying Lipper data on CD, rather than the current paper volumes. |
Respectfully submitted,
Steven E. Asher
66
[THIS PAGE INTENTIONALLY LEFT BLANK]
67
[THIS PAGE INTENTIONALLY LEFT BLANK]
68
Important Information About This Report
Transfer Agent
Columbia Management Services, Inc.
P.O. Box 8081
Boston, MA 02266-8081
1-800-345-6611
Distributor
Columbia Management
Distributors, Inc.
One Financial Center
Boston, MA 02111
Investment Advisor
Columbia Management Advisors, LLC
100 Federal Street
Boston, MA 02110
The fund mails one shareholder report to each shareholder address. If you would like more than one report, please call shareholder services at 1-800-345-6611 and additional reports will be sent to you. This report has been prepared for shareholders of Columbia Intermediate Bond Fund.
A description of the policies and procedures that the fund uses to determine how to vote proxies and a copy of the fund’s voting records are available (i) at www.columbiamanagement.com; (ii) on the Securities and Exchange Commission’s website at www.sec.gov, and (iii) without charge, upon request, by calling 1-800-368-0346. Information regarding how the fund voted proxies relating to portfolio securities during the 12-month period ended June 30 is available from the SEC’s website. Information regarding how the fund voted proxies relating to portfolio securities is also available from the fund’s website, www.columbiamanagement.com
The fund files a complete schedule of portfolio holdings with the SEC for the first and third quarters of each fiscal year on Form N-Q. The fund’s Form N-Q is available on the SEC’s website at www.sec.gov and may be reviewed and copied at the SEC’s Public Reference Room in Washington, D.C. Information on the operation of the Public Reference Room may be obtained by calling
1-800-SEC-0330.
Please read and consider the investment objectives, risks, charges and expenses for any fund carefully before investing. For a prospectus which contains this and other important information about the fund, contact your Columbia Management representative or financial advisor or go to www.columbiamanagement.com.
Columbia Management Group, LLC (“Columbia Management”) is the investment management division of Bank of America Corporation. Columbia Management entities furnish investment management services and products for institutional and individual investors. Columbia Funds are distributed by Columbia Management Distributors, Inc., member of FINRA, SIPC, part of Columbia Management and an affiliate of Bank of America Corporation.
69

One Financial Center
Boston, MA 02111-2621
Columbia Intermediate Bond Fund
Annual Report, March 31, 2009
©2009 Columbia Management Distributors, Inc.
One Financial Center, Boston, MA 02111-2621
800.345.6611 www.columbiafunds.com
SHC-42/10644-0309 (05/09) 09/79014

Annual Report
March 31, 2009
Equity Funds
| n | | Columbia Blended Equity Fund |
| n | | Columbia Energy and Natural Resources Fund |
| n | | Columbia Mid Cap Core Fund |
| n | | Columbia Select Large Cap Growth Fund |
| n | | Columbia Select Opportunities Fund |
| n | | Columbia Select Small Cap Fund |
| n | | Columbia Value and Restructuring Fund |
| n | | Columbia Emerging Markets Fund |
| n | | Columbia International Growth Fund |
| n | | Columbia Pacific/Asia Fund |
| | |
| NOT FDIC INSURED | | May Lose Value |
| NOT BANK ISSUED | | No Bank Guarantee |
Table of contents
The views expressed in this report reflect the current views of the respective parties. These views are not guarantees of future performance and involve certain risks, uncertainties and assumptions that are difficult to predict so actual outcomes and results may differ significantly from the views expressed. These views are subject to change at any time based upon economic, market or other conditions and the respective parties disclaim any responsibility to update such views. These views may not be relied on as investment advice and, because investment decisions for a Columbia Fund are based on numerous factors, may not be relied on as an indication of trading intent on behalf of any particular Columbia Fund. References to specific securities should not be construed as a recommendation or investment advice.
President’s Message

Dear Shareholder:
Recent events have shown great volatility in the markets and uncertainty in the economy. During these challenging times, it becomes even more important to focus on long-term horizons and key investment tools that can help manage volatility. This may be the time to reflect on your investment goals and evaluate your portfolio to ensure you are positioned for any potential market rebound.
A long-term financial plan can serve as a road map and guide you through the necessary steps designed to meet your financial goals. Your financial plan should take into account your investment goals, time horizon, overall financial situation, risk tolerance and willingness to ride out market volatility. Your investment professional can be a key resource as you work through this process. The knowledge and experience of an investment professional can help as you create or reevaluate your investment strategy.
The importance of diversification
Although diversification does not ensure a profit or guarantee against loss, a diversified portfolio can be a strategy for successful long-term investing. Diversification refers to the mix of investments within a portfolio. A mutual fund can contribute to portfolio diversification given that a mutual fund’s portfolio represents several investments. Additionally, the way you allocate your money among stocks, bonds and cash, and geographically between foreign and domestic investments, can help to reduce risks. Diversification can result in multiple investments where the positive performance of certain holdings can offset any negative performance from other holdings. Having a diversified portfolio doesn’t mean that the value of the portfolio will never go down, but rather helps strike a balance between risk and reward.
Reevaluate your strategy
An annual review of your investments is a key opportunity to determine if your investment needs have changed or if you need minor adjustments to rebalance your portfolio. Life events like a birth, marriage, home improvement, or change in employment can have a major affect on your spending and goals. Ask yourself how your spending or goals have changed and factor this into your financial plan. Are you using automated investments or payroll deductions to help keep your savings on track? Are you able to set aside additional savings or increase your 401(k) plan contributions? If during your review you find that your investments in any one category (e.g., stocks, bonds or cash) have grown too large based on your diversification plan, you may want to consider redirecting future investments to get back on track.
History has shown that the U.S. stock market has been remarkably resilient¹. Volatility can lead to opportunity. Patience and a commitment to your long-term financial plan may position you to potentially benefit over your investment horizon. We appreciate your business and continued support of Columbia Funds.
Sincerely,

J. Kevin Connaughton
President, Columbia Funds
The board of trustees elected J. Kevin Connaughton president of Columbia Funds on January 16, 2009.
1 | The Dow Jones Industrial Average is the most widely used indicator of the overall condition of the stock market. The Dow Jones Industrial Average Index is a price-weighted average of 30 actively traded blue-chip stocks as selected by the editors of the Wall Street Journal. Indices are not available for investment, and do not reflect sales charges, fees, brokerage commissions, taxes or other expenses of investing. |
Economic Update – Equity Funds
Summary
For the 12-month period that ended March 31, 2009
| | n | | The broad U.S. stock market, as measured by the S&P 500 Index, returned negative 38.09%. Stock markets outside the United States returned negative 46.51%, as measured (in U.S. dollars) by the MSCI EAFE Index. | |
| | |
| S&P Index | | MSCI Index |
| |
[GRAPHIC]
| | 
|
–38.09% | | –46.51% |
| | n | | Despite volatility in many segments of the bond market, the Barclays Capital U.S. Aggregate Bond Index delivered a modest gain. High-yield bonds lost ground, as measured by the Merrill Lynch U.S. High Yield, Cash Pay Index. Municipals recovered from an early setback, as measured by the Barclays Capital Municipal Bond Index. | |
| | |
| Barclays Aggregate Index | | Merrill Lynch Index |
| |

| |
|
3.13% | | –19.95% |
| |
| Barclays Municipal Index | | |
| |
| | |
2.27% | | |
Economic growth ground to a halt during the 12-month period that began April 1, 2008 and ended March 31, 2009. The National Bureau of Economic Research reported that the U.S. economy had slipped into recession late in 2007 and the downturn was even sharper than anticipated.
A host of factors weighed on consumers and businesses alike. The most severe housing downturn in decades showed few signs of abating as inventories of homes for sale rose, home prices declined and tighter credit standards, the result of continued turmoil in the subprime mortgage market, made it more difficult for homebuyers to qualify for loans. The labor market has contracted for 15 consecutive months, driving the unemployment rate to 8.5%. More than five million jobs have been lost since the recession commenced late in 2007, with nearly two-thirds of the decrease occurring in the most recent five months. Manufacturing activity slowed and consumer spending declined, resulting in one of the weakest holiday seasons in decades.
However, in March there were a few signs that this severe recession is no longer intensifying. Weekly chain store sales and mortgage purchase applications gained some momentum near the end of the period. The trade deficit has narrowed more than expected, raising hopes that first quarter real GDP will contract at a rate well below the fourth quarter’s negative 6.3%.
A weakening economy and turmoil in the financial markets took a toll on consumer confidence, which continued to set new all-time lows during the period. However, the monthly Conference Board gauge was nearly unchanged in March, another indication that the worst could be behind us. Consumer confidence is surveyed monthly by the Conference Board.
In an effort to restore confidence in the capital markets, loosen the reins on credit and shore up economic growth, the Federal Reserve Board (the Fed) brought a key short-term rate — the federal funds rate — down from 2.25% to a target between zero and 0.25% during the 12-month period — a record low. However, the Fed’s efforts went largely unrewarded. The one bright spot during this period of uncertainty was lower energy and commodity prices. With oil trading near $50 per barrel at the end of the period, gasoline prices have come down from $4 per gallon or more last summer to just over $2 per gallon in recent months.
1
Economic Update (continued) – Equity Funds
The Standard & Poor’s (S&P) 500 Index tracks the performance of 500 widely held, large-capitalization US stocks.
The Morgan Stanley Capital International (MSCI) Europe, Australasia, Far East (EAFE) Index is a free float-adjusted market capitalization index that is designed to measure developed market equity performance, excluding the US and Canada.
The Barclays Capital U.S. Aggregate Bond Index (formerly the Lehman Brothers U.S. Aggregate Bond Index) is a market value-weighted index that tracks the daily price, coupon, pay-downs and total return performance of fixed-rate, publicly placed, dollar-denominated and non-convertible investment-grade debt issues with at least $250 million par amount outstanding and with at least one year to final maturity.
The Merrill Lynch U.S. High Yield, Cash Pay Index tracks the performance of non-investment-grade corporate bonds. As of 01/01/2009, Merrill Lynch & Co., Inc. is a wholly owned subsidiary of Bank of America Corporation and an affiliate of Columbia Management.
The Barclays Capital Municipal Bond Index is (formerly the Lehman Brothers Municipal Bond Index) considered representative of the broad market for investment-grade, tax-exempt bonds with maturities of at least one year.
Indices are not available for investment, and do not reflect sales charges, fees, brokerage commissions, taxes or other expenses of investing. Securities in the fund may not match those in an index.
Stocks retreated as economic outlook darkened
Against a weakening economic backdrop, the U.S. stock market lost 38.09% for the 12-month period, as measured by the S&P 500 Index. Losses affected the stocks of companies of all sizes and investment style categories, although growth stocks held up better than value stocks, as measured by their respective Russell indices.1 Stock markets outside the U.S. suffered even greater losses. The MSCI EAFE Index, a broad gauge of stock market performance in foreign developed markets, lost 46.51% (in U.S. dollars) for the period. Emerging stock markets, which generally have had a strong run over the past several years, were also caught in the downdraft. As investors backed away from risk, the MSCI Emerging Markets Index2 returned negative 46.90% (in U.S. dollars).
Some bond market segments delivered positive returns
The U.S. bond market seesawed during the 12-month period, but several sectors managed to deliver modest gains as investors sought refuge from the volatile stock market. Treasury prices rose and yields declined as the economy faltered and stock market volatility increased. The benchmark 10-year U.S. Treasury yield ended the period at 2.70%. In this environment, the Barclays Capital U.S. Aggregate Bond Index returned 3.13%. High-yield bond prices fell sharply as economic prospects weakened and default fears rose. The Merrill Lynch U.S. High Yield, Cash Pay Index returned negative 19.95%. The municipal market experienced a setback early in 2008, then rebounded in the first quarter of 2009. The Barclays Capital Municipal Bond Index returned 2.27% for the 12-month period.
Past performance is no guarantee of future results.
1 | The Russell 1000 Growth Index measures the performance of those Russell 1000 Index companies with higher price-to-book ratios and higher forecasted growth values. The Russell 1000 Value Index measures the performance of those companies in the Russell 1000 Index with lower price-to-book ratios and lower forecasted growth values. The Russell 2000 Growth Index measures the performance of those Russell 2000 Index companies with higher price-to-book ratios and higher forecasted growth values. The Russell 2000 Value Index measures the performance of those Russell 2000 Index companies with lower price-to-book ratios and lower forecasted growth values. The Russell 3000 Growth Index measures the performance of those Russell 3000 Index companies with higher price-to book ratios and higher forecasted growth values. The Russell 3000 Value Index measures the performance of those Russell 3000 Index companies with lower price-to-book ratios and lower forecasted growth values. The Russell Midcap Growth Index measures the performance of those Russell Midcap companies with higher price-to-book ratios and higher forecasted growth values. The Russell Midcap Value Index measures the performance of those Russell Midcap Index companies with lower price-to-book ratios and lower forecasted growth values. |
2 | The MSCI Emerging Markets Index is a widely accepted index composed of a sample of companies from 25 countries representing the global emerging stock markets. |
2
Fund Profile – Columbia Blended Equity Fund
Summary
| n | | For the 12-month period that ended March 31, 2009, the fund’s Class A shares returned negative 38.73% without sales charge. |
n | | In a period of contracting economic growth and falling stock prices, the fund, its benchmark, the S&P 500 Index1, and the average fund in its peer group, the Lipper Large-Cap Core Funds Classification2, all lost more than 37% for the period. |
| n | | An emphasis on materials stocks proved detrimental to the fund’s return as commodity prices plummeted during the period. |
Portfolio Management
Peter Santoro has co-managed the fund since February 2009 and has been associated with the advisor or its predecessors or affiliate organizations since 2003.
Dhruv V. Toolsidas has co-managed the fund since March 2008 and has been associated with the advisor or its predecessors or affiliate organizations since 2003.
1 | The Standard & Poor’s (S&P) 500 Index tracks the performance of 500 widely held, large capitalization US stocks. Indices are not available for investment, and do not reflect sales charges, fees, brokerage commissions, taxes or other expenses of investing. Securities in the fund may not match those in an index. |
2 | Lipper Inc., a widely respected data provider in the industry, calculates an average total return (assuming reinvestment of distributions) for mutual funds with investment objectives similar to those of the fund. Lipper makes no adjustment for the effect of sales loads. |
Performance data quoted represents past performance and current performance may be lower or higher. Past performance is no guarantee of future results. The investment return and principal value will fluctuate so that shares, when redeemed, may be worth more or less than the original cost. Please visit www.columbiafunds.com for daily and most recent month-end performance updates.
Summary
1-year return as of 03/31/09
| | |
| |
 | | –38.73% Class A shares
(without sales charge) |
| |
| | –38.09% S&P 500 Index |
|
Morningstar Style BoxTM |
|
Equity Style |
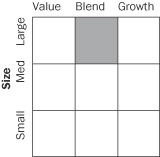
|
The Morningstar Style BoxTM reveals a fund’s investment strategy. For equity funds, the vertical axis shows the market capitalization of the stocks owned, and the horizontal axis shows investment style (value, blend or growth). Information shown is based on the most recent data provided by Morningstar.
3
Performance Information – Columbia Blended Equity Fund
Performance data quoted represents past performance and current performance may be lower or higher. Past performance is no guarantee of future results. The investment return and principal value will fluctuate so that shares, when redeemed, may be worth more or less than the original cost. Please visit www.columbiafunds.com for daily and most recent month-end performance updates.
| | |
| Annual operating expense ratio (%)* |
| |
Class A | | 1.33 |
Class C | | 2.08 |
Class Z | | 1.08 |
| * | The annual operating expense ratio is as stated in the fund’s prospectus that is current as of the date of this report. Differences in expense ratios disclosed elsewhere in this report may result from including fee waivers and expense reimbursements as well as different time periods used in calculating the ratios. |
| | |
| Performance of a $10,000 investment 04/01/99 – 03/31/09 |
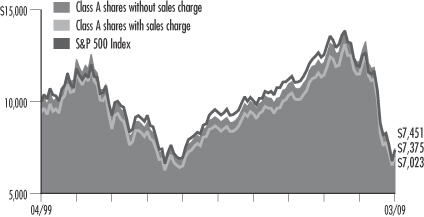
The chart above shows the change in value of a hypothetical $10,000 investment in Class A shares of Columbia Blended Equity Fund during the stated time period, and does not reflect the deduction of taxes that a shareholder may pay on fund distributions or on the redemption of fund shares. The Standard & Poor’s (S&P) 500 Index tracks the performance of 500 widely held, large-capitalization US stocks. Indices are not available for investment, and do not reflect sales charges, fees, brokerage commissions, taxes or other expenses of investing. Securities in the fund may not match those in an index.
| | | | |
| Performance of a $10,000 investment 04/01/99 – 03/31/09 ($) |
| | |
| Sales charge | | without | | with |
Class A | | 7,451 | | 7,023 |
Class C | | 7,394 | | 7,394 |
Class Z | | 7,466 | | n/a |
| | | | | | | | | | |
| Average annual total return as of 03/31/09 (%) |
| | | |
| Share class | | A | | C | | Z |
| Inception | | 03/31/08 | | 03/31/08 | | 04/25/85 |
| Sales charge | | without | | with | | without | | with | | without |
1-year | | –38.73 | | –42.25 | | –39.20 | | –39.76 | | –38.61 |
5-year | | –3.83 | | –4.96 | | –3.97 | | –3.97 | | –3.79 |
10-year | | –2.90 | | –3.47 | | –2.97 | | –2.97 | | –2.88 |
The “with sales charge” returns include the maximum initial sales charge of 5.75% for Class A shares and the applicable contingent deferred sales charge of 1.00% for Class C shares for the first year only. The “without sales charge” returns do not include the effect of sales charges. If they had, returns would be lower.
The Fund commenced operations on March 31, 2008. The returns of the Class A and Class C shares shown for periods prior to March 31, 2008 are those of the Shares class shares of the Blended Equity Fund, the predecessor to the Fund and a series of Excelsior Funds, Inc. (the “Predecessor Fund”). The returns shown reflect applicable sales charges, but have not been adjusted to reflect differences in expenses. If differences in expenses were reflected, the returns shown for the periods prior to March 31, 2008 would be lower. The returns of the Class Z shares shown for periods prior to March 31, 2008 are those of the Shares class shares of the Predecessor Fund. The returns of Class Z shown have not been adjusted to reflect differences in expenses. If differences in expenses were reflected, the returns shown for all periods would be higher.
Inception date refers to the date on which the Fund class commenced operations for Classes A and C and the date on which the Predecessor Fund class commenced operations for Class Z.
Performance results reflect any fee waivers or reimbursements of fund expenses by the investment advisor and/or any of its affiliates. Absent these fee waivers or expense reimbursement arrangements, performance results would have been lower.
All results shown assume reinvestment of distributions. Class Z shares are sold at net asset value with no distribution and service (Rule 12b-1) fees. Class Z shares have limited eligibility and the investment minimum requirements may vary. Please see the fund’s prospectus for details. Performance for different share classes will vary based on differences in sales charges and fees associated with each class.
The tables do not reflect the deduction of taxes that a shareholder may pay on fund distributions or on the redemption of fund shares.
4
Understanding Your Expenses – Columbia Blended Equity Fund
Estimating your actual expenses
To estimate the expenses that you paid over the period, first you will need your account balance at the end of the period:
| | n | | For shareholders who receive their account statements from Columbia Management Services, Inc., your account balance is available online at www.columbiafunds.com or by calling Shareholder Services at 800.345.6611. | |
| | n | | For shareholders who receive their account statements from their financial intermediary, contact your financial intermediary to obtain your account balance. | |
| | 1. | Divide your ending account balance by $1,000. For example, if an account balance was $8,600 at the end of the period, the result would be 8.6. | |
| | 2. | In the section of the table below titled “Expenses paid during the period,” locate the amount for your share class. You will find this number in the column labeled “Actual.” Multiply this number by the result from step 1. Your answer is an estimate of the expenses you paid on your account during the period. | |
If the value of your account falls below the minimum initial investment requirement applicable to you, your account generally will be subject to a $20 annual fee. This fee is not included in the accompanying table. If you are subject to the fee, keep it in mind when you are estimating the ongoing expenses of investing in the fund and when comparing the expenses of this fund with other funds.
As a fund shareholder, you incur two types of costs. There are transaction costs, which generally include sales charges on purchases and may include redemption fees or exchange fees. There are also ongoing costs, which generally include investment advisory fees, distribution and service (Rule 12b-1) fees and other fund expenses. The information on this page is intended to help you understand the ongoing costs of investing in the fund and to compare these costs with the ongoing costs of investing in other mutual funds.
Analyzing your fund’s expenses by share class
To illustrate these ongoing costs, we have provided an example and calculated the expenses paid by investors in each share class during the period. The information in the following table is based on an initial investment of $1,000, which is invested at the beginning of the period and held for the entire period. Expense information is calculated two ways and each method provides you with different information. The amount listed in the “Actual” column is calculated using the fund’s actual operating expenses and total return for the period. The amount listed in the “Hypothetical” column for each share class assumes that the return each year is 5% before expenses and is calculated based on the fund’s actual operating expenses. You should not use the hypothetical account values and expenses to estimate either your actual account balance at the end of the period or the expenses you paid during this period.
Compare with other funds
Since all mutual funds are required to include the same hypothetical calculations about expenses in shareholder reports, you can use this information to compare the ongoing cost of investing in the fund with other funds. To do so, compare the 5% hypothetical example with the 5% hypothetical examples that appear in the shareholder reports of other funds. As you compare hypothetical examples of other funds, it is important to note that hypothetical examples are meant to highlight the ongoing costs of investing in a fund and do not reflect any transaction costs, such as sales charges, redemption fees or exchange fees.
| | | | | | | | | | | | | | |
| 10/01/08 – 03/31/09 | | | | | | | | | | |
| | | | |
| | | Account value at the
beginning of the period ($) | | Account value at the
end of the period ($) | | Expenses paid
during the period ($) | | Fund’s annualized
expense ratio (%) |
| | | Actual | | Hypothetical | | Actual | | Hypothetical | | Actual | | Hypothetical | | Actual |
Class A | | 1,000.00 | | 1,000.00 | | 695.39 | | 1,018.45 | | 5.49 | | 6.54 | | 1.30 |
Class C | | 1,000.00 | | 1,000.00 | | 692.49 | | 1,014.71 | | 8.65 | | 10.30 | | 2.05 |
Class Z | | 1,000.00 | | 1,000.00 | | 695.79 | | 1,019.70 | | 4.44 | | 5.29 | | 1.05 |
Expenses paid during the period are equal to the annualized expense ratio for the share class, multiplied by the average account value over the period, then multiplied by the number of days in the fund’s most recent fiscal half-year and divided by 365.
Had the investment advisor and/or any of its affiliates not waived fees or reimbursed a portion of expenses, account value at the end of the period would have been reduced.
It is important to note that the expense amounts shown in the table are meant to highlight only ongoing costs of investing in the fund and do not reflect any transaction costs, such as sales charges, redemption fees or exchange fees. Therefore, the hypothetical examples provided may not help you determine the relative total costs of owning shares of different funds. If these transaction costs were included, your costs would have been higher.
5
Portfolio Managers’ Report – Columbia Blended Equity Fund
Performance data quoted represents past performance and current performance may be lower or higher. Past performance is no guarantee of future results. The investment return and principal value will fluctuate so that shares, when redeemed, may be worth more or less than the original cost. Please visit www.columbiafunds.com for daily and most recent month-end performance updates.
| | |
| Net asset value per share |
| |
as of 03/31/09 ($) | | |
Class A | | 16.21 |
Class C | | 16.17 |
Class Z | | 16.20 |
| | |
| Distributions declared per share |
| |
04/01/08 – 03/31/09 ($) | | |
Class A | | 2.27 |
Class C | | 2.16 |
Class Z | | 2.32 |
On February 20, 2009, the fund’s portfolio management team changed. Peter Santoro joined Dhruv V. Toolsidas as co-manager of the fund.
For the 12-month period that ended March 31, 2009, the fund’s Class A shares returned negative 38.73% without sales charge. The fund’s benchmark, the S&P 500 Index1, returned negative 38.09% for the same period. The average return of its peer group, the Lipper Large-Cap Core Funds Classification2 was negative 37.32% for the 12-month period. The fund’s modest shortfall relative to its benchmark and peer group average was primarily due to an overweight position in the materials sector and stock selection within that group. An underweight position in consumer staples stocks also hurt as the sector performed better than expected. Positive results from the portion of the fund’s portfolio that is managed using a quantitative strategy helped offset some of these losses as did stock selection in financials and consumer staples.
Financials and consumer staples stocks aided relative returns
A decision to avoid financial companies with severe balance sheet risk, including large banks with extensive exposure to commercial real estate and leveraged derivatives, helped the fund dodge many of the index’s worst performers during the period. The fund owned several stock market exchange holdings, which produced disappointing, negative double-digit returns. However, these held up better than many of the large banks, aiding relative returns. Furthermore, among other positive relative contributors, Goldman Sachs Group benefited from a substantially better risk profile than its peers due to ample liquidity, significantly reduced leverage and little exposure to consumer loans. We continue to believe it is among the best positioned financial companies that can take advantage of the current upheaval in the capital markets. In the technology sector, MasterCard benefited from a lack of credit exposure — it owns only the credit network — and increased domestic use of debit cards along with widening global adoption of credit cards.
Timely investments in the consumer staples sectors also helped stem the fund’s losses. Philip Morris International was rewarded when investor concerns about international pricing and a misperception that it was subject to U.S. domestic litigation were alleviated. Archer Daniels Midland gained market share as many of its ethanol-producing competitors went bankrupt. In addition, Anheuser-Busch was acquired by another company during the period, producing positive results for the fund.
Materials stocks were battered by the global economic slowdown
The fund’s substantial position in materials stocks contributed to the significant loss during the period. Slowing demand from China compounded by a disappointing currency derivative trade hurt Brazilian paper pulp producer Aracruz Celulose S/A.
1 | The Standard & Poor’s (S&P) 500 Index tracks the performance of 500 widely held, large capitalization US stocks. Indices are not available for investment, and do not reflect sales charges, fees, brokerage commissions, taxes or other expenses of investing. Securities in the fund may not match those in an index. |
2 | Lipper Inc., a widely respected data provider in the industry, calculates an average total return (assuming reinvestment of distributions) for mutual funds with investment objectives similar to those of the fund. Lipper makes no adjustment for the effect of sales loads. |
6
Portfolio Managers’ Report (continued) – Columbia Blended Equity Fund
| | |
| Top 5 sectors |
| |
as of 03/31/09 (%) | | |
Health Care | | 17.8 |
Information Technology | | 16.5 |
Financials | | 14.0 |
Consumer Staples | | 11.5 |
Energy | | 10.8 |
| | |
| Top 10 holdings |
| |
as of 03/31/09 (%) | | |
Microsoft | | 5.6 |
Cisco Systems | | 4.7 |
Wal-Mart Stores | | 4.6 |
Johnson & Johnson | | 4.6 |
Abbott Laboratories | | 4.4 |
Exxon Mobil | | 4.3 |
Target | | 4.3 |
State Street | | 3.6 |
Philip Morris International | | 3.2 |
Monsanto | | 3.1 |
| | |
| Holdings discussed in this report |
| |
as of 3/31/09 (%) | | |
Goldman Sachs Group | | 2.3 |
MasterCard | | 1.2 |
Philip Morris International | | 3.2 |
Archer Daniels Midland | | 1.4 |
Nucor | | 1.4 |
Novo Nordisk A/S | | 2.4 |
The fund is actively managed and the composition of its portfolio will change over time. Information provided is calculated as a percentage of net assets.
We eliminated the position. While steel manufacturer Nucor held up better than many of its competitors, its business suffered from a decline in infrastructure and commercial construction projects. Some health care and financials stocks also contributed to fund losses. Novo Nordisk A/S declined on investor concerns about the safety of a diabetes drug the company was developing. Deals made by alternative asset manager American Capital brought the company to the brink of insolvency, and cash flow at Leucadia National dried up, raising concerns of forced liquidation. We sold both stocks.
Positioned for continued volatility
We have positioned the fund for continued market volatility by focusing on high quality companies with strong balance sheets that are well-positioned relative to their industry. In the meantime, we continue to look for subtle changes in stock valuations that may herald positive economic news, as the stock market has historically anticipated economic upturns in advance of proof of an economic recovery. By drawing on three independent research sources — fundamental research, quantitative models and the input of our portfolio management team — and by employing a disciplined valuation process, we seek to identify those companies that are positioned to capitalize on an economic recovery.
Portfolio holdings and characteristics are subject to change periodically and may not be representative of current holdings and characteristics. The outlook for the fund may differ from that presented for other Columbia Funds.
Equity securities are affected by stock market fluctuations that occur in response to economic and business developments.
International investing may involve certain risks, including currency fluctuations, risks associated with possible differences in financial accounting standards and other monetary and political risks. Significant levels of foreign taxes, including potentially confiscatory levels of taxation and withholding taxes, may also apply to some foreign investments.
7
Fund Profile – Columbia Energy and Natural Resources Fund
Performance data quoted represents past performance and current performance may be lower or higher. Past performance is no guarantee of future results. The investment return and principal value will fluctuate so that shares, when redeemed, may be worth more or less than the original cost. Please visit www.columbiafunds.com for daily and most recent month-end performance updates.
Summary
1-year return as of 03/31/09
| | |
| |
| | –45.88% Class A shares
(without sales charge) |
| |
| | –43.83% S&P North American Natural Resources Sector Index |
| |
| | –38.09% S&P 500 Index |
|
Morningstar Style BoxTM |
|
Equity Style |
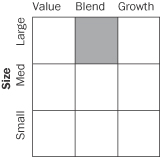
|
The Morningstar Style BoxTM reveals a fund’s investment strategy. For equity funds, the vertical axis shows the market capitalization of the stocks owned, and the horizontal axis shows investment style (value, blend or growth). Information shown is based on the most recent data provided by Morningstar.
Summary
| n | | For the 12-month period that ended March 31, 2009, the fund’s Class A shares returned negative 45.88% without sales charge. |
n | | In a period of unparalleled volatility in commodity markets, the fund, its benchmark, the S&P North American Natural Resources Sector Index1, and the average return of its peer group, the Lipper Natural Resources Funds Classification2, all declined more than 40%. |
| n | | Investments in small oil and natural gas production companies contributed to the fund’s performance shortfall relative to its benchmark as did an underweight in gold production companies. We believe that a move to position the fund more conservatively as the period progressed aided performance relative to competing funds. |
Portfolio Management
Michael E. Hoover has managed the fund since March 2008 and the predecessor fund since December 1995 and has been associated with the advisor or its predecessors or affiliate organizations since 1989.
1 | The Standard & Poor’s (S&P) North American Natural Resources Sector Index is a modified market capitalization-weighted index designed as a benchmark for US traded securities in the natural resources sector. The index includes companies involved in the following categories: extractive industries, energy companies, owners and operators of timber tracts, forestry services, producers of pulp and paper and owners of plantations. Indices are not available for investment, and do not reflect sales charges, fees, brokerage commissions, taxes or other expenses of investing. Securities in the fund may not match those in an index. |
2 | Lipper Inc., a widely respected data provider in the industry, calculates an average total return (assuming reinvestment of distributions) for mutual funds with investment objectives similar to those of the fund. Lipper makes no adjustment for the effect of sales loads. |
8
Performance Information – Columbia Energy and Natural Resources Fund
Performance data quoted represents past performance and current performance may be lower or higher. Past performance is no guarantee of future results. The investment return and principal value will fluctuate so that shares, when redeemed, may be worth more or less than the original cost. Please visit www.columbiafunds.com for daily and most recent month-end performance updates.
| | |
| Annual operating expense ratio (%)* |
| |
Class A | | 1.26 |
Class C | | 2.01 |
Class Z | | 1.01 |
| * | The annual operating expense ratio is as stated in the fund’s prospectus that is current as of the date of this report. Differences in expense ratios disclosed elsewhere in this report may result from including fee waivers and expense reimbursements as well as different time periods used in calculating the ratios. |
| | | | |
| Performance of a $10,000 investment 04/01/99 – 03/31/09 |

The chart above shows the change in value of a hypothetical $10,000 investment in Class A shares of Columbia Energy and Natural Resources Fund during the stated time period, and does not reflect the deduction of taxes that a shareholder may pay on fund distributions or on the redemption of fund shares. The Standard & Poor’s (S&P) North American Natural Resources Sector Index is a modified market capitalization-weighted index designed as a benchmark for US-traded securities in the natural resources sector. The index includes companies involved in the following categories: extractive industries, energy companies, owners and operators of timber tracts, forestry services, producers of pulp and paper, and owners of plantations. The Standard & Poor’s (S&P) 500 Index tracks the performance of 500 widely held, large-capitalization US stocks. Indices are not available for investment, and do not reflect sales charges, fees, brokerage commissions, taxes or other expenses of investing. Securities in the fund may not match those in an index.
| | | | |
| Performance of a $10,000 investment 04/01/99 – 03/31/09 ($) |
| | |
| Sales charge | | without | | with |
Class A | | 28,151 | | 26,538 |
Class C | | 27,846 | | 27,846 |
Class Z | | 28,232 | | n/a |
| | | | | | | | | | |
| Average annual total return as of 03/31/09 (%) |
| | | |
| Share class | | A | | C | | Z |
| Inception | | 09/28/07 | | 09/28/07 | | 12/31/92 |
| Sales charge | | without | | with | | without | | with | | without |
1-year | | –45.88 | | –49.00 | | –46.29 | | –46.82 | | –45.72 |
5-year | | 9.15 | | 7.87 | | 8.91 | | 8.91 | | 9.21 |
10-year | | 10.90 | | 10.25 | | 10.78 | | 10.78 | | 10.94 |
The “with sales charge” returns include the maximum initial sales charge of 5.75% for Class A shares and the applicable contingent deferred sales charge of 1.00% for Class C shares for the first year only. The “without sales charge” returns do not include the effect of sales charges. If they had, returns would be lower.
The Fund commenced operations on March 31, 2008. The returns of the Class A and Class C shares shown include the returns of Class A shares or Class C shares, as applicable, of Energy and Natural Resources Fund, the predecessor to the Fund and a series of Excelsior Funds, Inc. (the “Predecessor Fund”), for periods after September 27, 2007, and include the returns of Shares class shares of the Predecessor Fund for periods prior to September 28, 2007. The returns shown reflect applicable sales charges, but have not been adjusted to reflect differences in expenses. If differences in expenses were reflected, the returns shown for the periods prior to September 28, 2007 would be lower. The returns of the Class Z shares shown for periods prior to March 31, 2008 are those of the Shares class shares of the Predecessor Fund. The returns of Class Z shares shown have not been adjusted to reflect differences in expenses. If differences in expenses were reflected, the returns shown for all periods would be higher.
Inception date refers to the date on which the Fund class commenced operations for Classes A and C and the date on which the Predecessor Fund class commenced operations for Class Z.
Performance results reflect any fee waivers or reimbursements of fund expenses by the investment advisor and/or any of its affiliates. Absent these fee waivers or expense reimbursement arrangements, performance results would have been lower.
All results shown assume the reinvestment of distributions. Class Z shares are sold at net asset value with no distribution and service (Rule 12b-1) fees. Class Z shares have limited eligibility and the investment minimum requirements may vary. Please see the fund’s prospectus for details. Performance for different share classes will vary based on differences in sales charges and fees associated with each class.
The tables do not reflect the deduction of taxes that a shareholder may pay on fund distributions or on the redemption of fund shares.
9
Understanding Your Expenses – Columbia Energy and Natural Resources Fund
Estimating your actual expenses
To estimate the expenses that you paid over the period, first you will need your account balance at the end of the period:
| | n | | For shareholders who receive their account statements from Columbia Management Services, Inc., your account balance is available online at www.columbiafunds.com or by calling Shareholder Services at 800.345.6611. | |
| | n | | For shareholders who receive their account statements from their financial intermediary, contact your financial intermediary to obtain your account balance. | |
| | 1. | Divide your ending account balance by $1,000. For example, if an account balance was $8,600 at the end of the period, the result would be 8.6. | |
| | 2. | In the section of the table below titled “Expenses paid during the period,” locate the amount for your share class. You will find this number in the column labeled “Actual.” Multiply this number by the result from step 1. Your answer is an estimate of the expenses you paid on your account during the period. | |
If the value of your account falls below the minimum initial investment requirement applicable to you, your account generally will be subject to a $20 annual fee. This fee is not included in the accompanying table. If you are subject to the fee, keep it in mind when you are estimating the ongoing expenses of investing in the fund and when comparing the expenses of this fund with other funds.
As a fund shareholder, you incur two types of costs. There are transaction costs, which generally include sales charges on purchases and may include redemption fees or exchange fees. There are also ongoing costs, which generally include investment advisory fees, distribution and service (Rule 12b-1) fees and other fund expenses. The information on this page is intended to help you understand the ongoing costs of investing in the fund and to compare these costs with the ongoing costs of investing in other mutual funds.
Analyzing your fund’s expenses by share class
To illustrate these ongoing costs, we have provided an example and calculated the expenses paid by investors in each share class during the period. The information in the following table is based on an initial investment of $1,000 which is invested at the beginning of the period and held for the entire period. Expense information is calculated two ways and each method provides you with different information. The amount listed in the “Actual” column is calculated using the fund’s actual operating expenses and total return for the period. The amount listed in the “Hypothetical” column for each share class assumes that the return each year is 5% before expenses and is calculated based on the fund’s actual operating expenses. You should not use the hypothetical account values and expenses to estimate either your actual account balance at the end of the period or the expenses you paid during this period.
Compare with other funds
Since all mutual funds are required to include the same hypothetical calculations about expenses in shareholder reports, you can use this information to compare the ongoing costs of investing in the fund with other funds. To do so, compare the 5% hypothetical example with the 5% hypothetical examples that appear in the shareholder reports of other funds. As you compare hypothetical examples of other funds, it is important to note that hypothetical examples are meant to highlight the ongoing costs of investing in a fund and do not reflect any transaction costs, such as sales charges, redemption fees or exchange fees.
| | | | | | | | | | | | | | |
| 10/01/08 – 03/31/09 | | | | | | | | | | |
| | | | |
| | | Account value at the
beginning of the period ($) | | Account value at the
end of the period ($) | | Expenses paid
during the period ($) | | Fund’s annualized
expense ratio (%) |
| | | Actual | | Hypothetical | | Actual | | Hypothetical | | Actual | | Hypothetical | | Actual |
Class A | | 1,000.00 | | 1,000.00 | | 688.21 | | 1,018.75 | | 5.22 | | 6.24 | | 1.24 |
Class C | | 1,000.00 | | 1,000.00 | | 685.51 | | 1,015.01 | | 8.36 | | 10.00 | | 1.99 |
Class Z | | 1,000.00 | | 1,000.00 | | 689.60 | | 1,020.00 | | 4.17 | | 4.99 | | 0.99 |
Expenses paid during the period are equal to the annualized expense ratio for the share class, multiplied by the average account value over the period, then multiplied by the number of days in the fund’s most recent fiscal half-year and divided by 365.
Had the investment advisor and/or any of its affiliates not waived fees or reimbursed a portion of expenses, account value at the end of the period would have been reduced.
It is important to note that the expense amounts shown in the table are meant to highlight only ongoing costs of investing in the fund and do not reflect any transaction costs, such as sales charges, redemption fees or exchange fees. Therefore, the hypothetical examples provided may not help you determine the relative total costs of owning shares of different funds. If these transaction costs were included, your costs would have been higher.
10
Portfolio Manager’s Report – Columbia Energy and Natural Resources Fund
Performance data quoted represents past performance and current performance may be lower or higher. Past performance is no guarantee of future results. The investment return and principal value will fluctuate so that shares, when redeemed, may be worth more or less than the original cost. Please visit www.columbiafunds.com for daily and most recent month-end performance updates.
| | |
| Net asset value per share |
| |
as of 03/31/09 ($) | | |
Class A | | 13.62 |
Class C | | 13.47 |
Class Z | | 13.66 |
| | |
| Distributions declared per share |
| |
04/01/08 – 03/31/09 ($) | | |
Class A | | 0.40 |
Class C | | 0.40 |
Class Z | | 0.40 |
On February 27, 2009, the fund adopted a new benchmark, the Standard & Poor’s (S&P) North American Natural Resources Sector Index.1 We believe that this measure more closely reflects the composition of the portfolio.
For the 12-month period that ended March 31, 2009, the fund’s Class A shares returned negative 45.88% without sales charge. The fund’s performance trailed its new benchmark, the S&P North American Natural Resources Sector Index, which returned negative 43.83% for the same period. The fund’s former benchmark, the S&P 500 Index2, returned negative 38.09%. The fund held up better than the average return in its peer group, the Lipper Natural Resources Funds Classification3, which returned negative 49.87% for the 12-month period. Investments in small oil and natural gas production companies contributed to the fund’s performance shortfall relative to its new benchmark as did an underweight in gold production companies. We believe that a move to position the fund more conservatively as the period progressed aided performance relative to competing funds.
Defensive repositioning
In the face of unprecedented volatility in global commodity markets, we sought to position the fund more defensively to help buffer the effects of dramatic changes in resource-related equities. Nevertheless, investments in small oil and natural gas production companies, which were highly sensitive to changing commodity prices, led to underperformance relative to the fund’s new benchmark. An underweight in gold production companies also detracted from return as these stocks held up better than the overall materials sector.
In the summer of 2008, we began to reposition the fund more conservatively as the U.S. economy weakened and commodity prices began falling. Believing that high gasoline prices could drag the U.S. economy into recession, we increased the fund’s emphasis on major oil companies and regulated utilities, the two most defensive areas in which we invest. We raised the fund’s exposure to these industries from a combined 4.5% of net assets to approximately 38% by the end of 2008. As a result of this shift, the largest positions in the fund were in Exxon Mobil, the major integrated oil company, and three utilities: Southern, Entergy and FPL Group. However, early in 2009, we sold all three utilities as their outlooks dimmed because of reduced power demands from idled automotive and chemical plants.
As part of our defensive repositioning, we also pared back exposure to the most commodity-sensitive groups, notably independent oil and gas producers and oil field service companies, from about 58% of assets to 40%. We sold the fund’s holdings in Williams and Questar, two corporations with integrated natural gas pipelines, and we
1 | The Standard & Poor’s (S&P) North American Natural Resources Sector Index is a modified capitalization-weighted index designed as a benchmark for US-traded securities in the natural resources sector. The index includes companies involved in the following categories: extractive industries, energy companies, owners and operators of timber tracts, forestry services, producers of pulp and paper and owners of plantations. |
2 | The Standard & Poor’s (S&P) 500 Index tracks the performance of 500 widely held, large capitalization U.S. stocks. |
| | Indices are not available for investment, and do not reflect sales charges, fees, brokerage commissions, taxes or other expenses of investing. Securities in the fund may not match those in an index. |
3 | Lipper Inc., a widely respected data provider in the industry, calculates an average total return (assuming reinvestment of distributions) for mutual funds with investment objectives similar to those of the fund. Lipper makes no adjustment for the effect of sales loads. |
11
Portfolio Manager’s Report (continued) – Columbia Energy and Natural Resources Fund
liquidated positions in Ultra Petroleum and Range Resources, two natural gas producers. We also slashed exposure to the natural resource industry, particularly base metals, from 27% to 17% of assets, selling positions in fertilizer companies, mining firms and industrial and engineering companies. These changes helped soften the impact of sharply reversing trends in commodity prices, which surged early in the period, fell sharply from mid-2008 through the end of the year and then recovered somewhat in early 2009.
Large-cap oil companies led performance
Although they generated negative returns, the fund’s investments in large oil companies with strong balance sheets provided the greatest support to relative performance. Exxon Mobil, Chevron and Occidental Petroleum all held up considerably better than the sector overall. In contrast, emerging oil and natural gas production companies, including Oilsands Quest, Rex Energy and Gasco Energy, all detracted significantly from returns.
Looking ahead
We believe that the fund is positioned to withstand pressures from a global recession and credit crisis: Approximately one-third of its holdings are defensive stocks, notably major oil companies and one utility. Another one-third of fund assets are invested in oil-sensitive exploration and production and oil service companies, which should benefit from an economic rebound in the United States. The final one-third of assets are invested in base materials, which have the potential to gain from a recovery in the larger emerging economies.
Despite the shakeout of the past year, we maintain a positive long-term outlook. While the timing of a global recovery is unknown, we believe that the recent downturn is cyclical and longer-term secular growth trends should lead to a recovery. Over the next two decades we expect a middle class to emerge in the developing economies of Brazil, India and China. As the standard of living rises for more than one billion people in these regions, demand should increase for protein-rich food, petroleum, coal and natural gas products, and base metals, notably copper. Companies that produce these basic commodities should be major beneficiaries of a resumption in global growth trends.
Portfolio holdings and characteristics are subject to change periodically and may not be representative of current holdings and characteristics. The outlook for the fund may differ from that presented for other Columbia Funds.
Equity securities are affected by stock market fluctuations that occur in response to economic and business developments.
International investing may involve certain risks, including currency fluctuations, risks associated with possible differences in financial accounting standards and other monetary and political risks. Significant levels of foreign taxes, including potentially confiscatory levels of taxation and withholding taxes, may also apply to some foreign investments.
Energy and natural resources stocks have been volatile. They may be affected by rising interest rates and inflation and can also be affected by factors such as natural events (for example, earthquakes or fires) and international politics.
The fund is non-diversified, which generally means that it may invest a greater percentage of its total assets in the securities of fewer issuers than a “diversified” fund. This increases the risk that a change in the value of any one investment held by the Fund could affect the overall value of the Fund more than it would affect that of a diversified fund holding a greater number of investments. Accordingly, the Fund’s value will likely be more volatile than the value of more diversified funds.
| | |
| Top sectors |
| |
as of 03/31/09 (%) | | |
Energy | | 58.3 |
Materials | | 23.7 |
Utilities | | 3.7 |
Industrials | | 3.3 |
| | |
| Top 10 holdings |
| |
as of 03/31/09 (%) | | |
Exxon Mobil | | 12.3 |
Transocean | | 5.7 |
PG&E | | 3.7 |
Apache | | 3.6 |
Walter Industries | | 3.2 |
Weatherford International | | 3.1 |
BHP Billiton | | 3.1 |
Occidental Petroleum | | 3.1 |
Total SA | | 3.1 |
Scotts Miracle-Gro | | 2.9 |
| | |
| Holdings discussed in this report |
| |
as of 3/31/09 (%) | | |
Exxon Mobil | | 12.3 |
Chevron | | 1.9 |
Occidental Petroleum | | 3.1 |
Gasco Energy | | 0.3 |
Oilsands Quest | | 0.4 |
Rex Energy | | 0.4 |
This fund is actively managed and the composition of its portfolio will change over time. Information provided is calculated as a percentage of net assets.
12
Fund Profile – Columbia Mid Cap Core Fund
Performance data quoted represents past performance and current performance may be lower or higher. Past performance is no guarantee of future results. The investment return and principal value will fluctuate so that shares, when redeemed, may be worth more or less than the original cost. Please visit www.columbiafunds.com for daily and most recent month-end performance updates.
Summary
1-year return as of 03/31/09
| | |
| |
| | –47.44% Class A shares
(without sales charge) |
| |
| | –40.81% Russell Midcap Index |
| |
| | –42.51% Russell Midcap Value Index |
|
Morningstar Style BoxTM |
|
Equity Style |
|
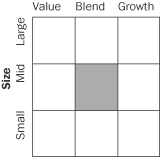
|
The Morningstar Style BoxTM reveals a fund’s investment strategy. For equity funds, the vertical axis shows the market capitalization of the stocks owned, and the horizontal axis shows investment style (value, blend or growth). Information shown is based on the most recent data provided by Morningstar. |
Summary
| n | | For the 12-month period that ended March 31, 2009, the fund’s Class A shares returned negative 47.44% without sales charge. |
n | | The fund underperformed both the Russell Midcap Index and the Russell Midcap Value Index.1 Its return was lower than the average return of its peer group, the Lipper Mid-Cap Value Funds Classification.2 |
| n | | The fund’s outsized exposure to the energy and materials sectors detracted significantly from returns during the period as commodity prices fell sharply. |
Portfolio Management
Peter Santoro has co-managed the fund since November 2008 and has been associated with the advisor or its predecessors or affiliate organizations since 2003.
Craig Leopold has co-managed the fund since November 2008 and has been associated with the advisor or its predecessors or affiliate organizations since 2003.
1 | The Russell Midcap Index measures the performance of the 800 smallest companies in the Russell 1000 Index, as ranked by total market capitalization. The Russell Midcap Value Index measures the performance of those Russell Midcap companies with lower price-to-book ratios and lower forecasted growth values. Indices are not available for investment, and do not reflect sales charges, fees, brokerage commissions, taxes or other expenses of investing. Securities in the fund may not match those in an index. |
2 | Lipper Inc., a widely respected data provider in the industry, calculates an average total return (assuming reinvestment of distributions) for mutual funds with investment objectives similar to those of the fund. Lipper makes no adjustment for the effect of sales loads. |
13
Performance Information – Columbia Mid Cap Core Fund
Performance data quoted represents past performance and current performance may be lower or higher. Past performance is no guarantee of future results. The investment return and principal value will fluctuate so that shares, when redeemed, may be worth more or less than the original cost. Please visit www.columbiafunds.com for daily and most recent month-end performance updates.
| | |
| Annual operating expense ratio (%)* |
| |
Class A | | 1.26 |
Class C | | 2.01 |
Class R | | 1.51 |
Class Z | | 1.01 |
| * | The annual operating expense ratio is as stated in the fund’s prospectus that is current as of the date of this report. Differences in expense ratios disclosed elsewhere in this report may result from including fee waivers and expense reimbursements as well as different time periods used in calculating the ratios. |
|
| Performance of a $10,000 investment 04/01/99 – 03/31/09 |
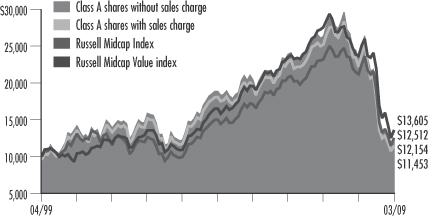
The chart above shows the change in value of a hypothetical $10,000 investment in Class A shares of Columbia Mid Cap Core Fund during the stated time period, and does not reflect the deduction of taxes that a shareholder may pay on fund distributions or on the redemption of fund shares. The Russell Midcap Index measures the performance of the 800 smallest companies in the Russell 1000 Index, as ranked by total market capitalization. The Russell Midcap Value Index measures the performance of those Russell Midcap companies with lower price-to-book ratios and lower forecasted growth values. Indices are not available for investment, and do not reflect sales charges, fees, brokerage commissions, taxes or other expenses of investing. Securities in the fund may not match those in an index.
| | | | |
| Performance of a $10,000 investment 04/01/99 – 03/31/09 ($) |
| | |
| Sales charge | | without | | with |
Class A | | 12,154 | | 11,453 |
Class C | | 12,064 | | 12,064 |
Class R | | 11,921 | | n/a |
Class Z | | 12,183 | | n/a |
| | | | | | | | | | | | |
| Average annual total return as of 3/31/09 (%) |
| | | | |
| Share class | | A | | C | | R | | Z |
| Inception | | 03/31/08 | | 03/31/08 | | 12/31/04 | | 05/31/96 |
| Sales charge | | without | | with | | without | | with | | without | | without |
1-year | | –47.44 | | –50.47 | | –47.83 | | –48.35 | | –47.62 | | –47.32 |
5-year | | –8.42 | | –9.50 | | –8.56 | | -8.56 | | –8.78 | | –8.38 |
10-year | | 1.97 | | 1.37 | | 1.89 | | 1.89 | | 1.77 | | 1.99 |
The “with sales charge” returns include the maximum initial sales charge of 5.75% for Class A shares and the applicable contingent deferred sales charge of 1.00% for Class C shares for the first year only. The “without sales charge” returns do not include the effect of sales charges. If they had, returns would be lower.
The Fund commenced operations on March 31, 2008. The returns of the Class A and Class C shares shown for periods prior to March 31, 2008 are those of the Shares class shares of Mid Cap Value and Restructuring, the predecessor to the Fund and a series of Excelsior Funds Trust (the “Predecessor Fund”). The returns shown reflect applicable sales charges, but have not been adjusted to reflect differences in expenses. If differences in expenses were reflected, the returns shown for the period prior to March 31, 2008 would be lower. The returns of Class R shares shown include the returns of Retirement Shares class shares of the Predecessor Fund for periods after December 30, 2004, and include the returns of Shares class shares of the Predecessor Fund for periods prior to December 31, 2004. The returns shown reflect that Class R shares are sold without sales charges, but have not been adjusted to reflect differences in expenses. If differences in expenses were reflected, the returns shown for all periods would be lower. The returns of the Class Z shares shown for periods prior to March 31, 2008 are those of the Shares class shares of the Predecessor Fund. The returns shown reflect that Class Z shares are sold without sales charges, but have not been adjusted to reflect differences in expenses. If differences in expenses were reflected, the returns shown for all periods would be higher. The inception of the predecessor fund is May 31, 1996.
Performance results reflect any fee waivers or reimbursements of fund expenses by the investment advisor and/or any of its affiliates. Absent these fee waivers or expense reimbursement arrangements, performance results would have been lower.
All results shown assume reinvestment of distributions. Class Z shares are sold at net asset value with no distribution and service (Rule 12b-1) fees. Class R shares are sold at net asset value with distribution and service (Rule 12b-1) fees. Class R shares and Class Z shares have limited eligibility and the investment minimum requirements may vary. Please see the fund’s prospectus for details. Performance for different share classes will vary based on differences in sales charges and fees associated with each class.
The tables do not reflect the deduction of taxes that a shareholder may pay on fund distributions or on the redemption of fund shares.
14
Understanding Your Expenses – Columbia Mid Cap Core Fund
Estimating your actual expenses
To estimate the expenses that you paid over the period, first you will need your account balance at the end of the period:
| | n | | For shareholders who receive their account statements from Columbia Management Services, Inc., your account balance is available online at www.columbiafunds.com or by calling Shareholder Services at 800.345.6611. | |
| | n | | For shareholders who receive their account statements from their financial intermediary, contact your financial intermediary to obtain your account balance. | |
| | 1. | Divide your ending account balance by $1,000. For example, if an account balance was $8,600 at the end of the period, the result would be 8.6. | |
| | 2. | In the section of the table below titled “Expenses paid during the period,” locate the amount for your share class. You will find this number in the column labeled “Actual.” Multiply this number by the result from step 1. Your answer is an estimate of the expenses you paid on your account during the period. | |
If the value of your account falls below the minimum initial investment requirement applicable to you, your account generally will be subject to a $20 annual fee. This fee is not included in the accompanying table. If you are subject to the fee, keep it in mind when you are estimating the ongoing expenses of investing in the fund and when comparing the expenses of this fund with other funds.
As a fund shareholder, you incur two types of costs. There are transaction costs, which generally include sales charges on purchases and may include redemption fees or exchange fees. There are also ongoing costs, which generally include investment advisory fees, distribution and service (Rule 12b-1) fees and other fund expenses. The information on this page is intended to help you understand the ongoing costs of investing in the fund and to compare these costs with the ongoing costs of investing in other mutual funds.
Analyzing your fund’s expenses by share class
To illustrate these ongoing costs, we have provided an example and calculated the expenses paid by investors in each share class during the period. The information in the following table is based on an initial investment of $1,000, which is invested at the beginning of the period and held for the entire period. Expense information is calculated two ways and each method provides you with different information. The amount listed in the “Actual” column is calculated using the fund’s actual operating expenses and total return for the period. The amount listed in the “Hypothetical” column for each share class assumes that the return each year is 5% before expenses and is calculated based on the fund’s actual operating expenses. You should not use the hypothetical account values and expenses to estimate either your actual account balance at the end of the period or the expenses you paid during this period.
Compare with other funds
Since all mutual funds are required to include the same hypothetical calculations about expenses in shareholder reports, you can use this information to compare the ongoing costs of investing in the fund with other funds. To do so, compare the 5% hypothetical example with the 5% hypothetical examples that appear in the shareholder reports of other funds. As you compare hypothetical examples of other funds, it is important to note that hypothetical examples are meant to highlight the ongoing costs of investing in a fund and do not reflect any transaction costs, such as sales charges, redemption fees or exchange fees.
| | | | | | | | | | | | | | |
| 10/01/08 – 03/31/09 | | | | | | | | |
| | | | |
| | | Account value at the
beginning of the period ($) | | Account value at the
end of the period ($) | | Expenses paid
during the period ($) | | Fund’s annualized
expense ratio (%) |
| | | Actual | | Hypothetical | | Actual | | Hypothetical | | Actual | | Hypothetical | | Actual |
Class A | | 1,000.00 | | 1,000.00 | | 656.89 | | 1,018.65 | | 5.20 | | 6.34 | | 1.26 |
Class C | | 1,000.00 | | 1,000.00 | | 654.30 | | 1,014.91 | | 8.29 | | 10.10 | | 2.01 |
Class R | | 1,000.00 | | 1,000.00 | | 655.00 | | 1,017.40 | | 6.23 | | 7.59 | | 1.51 |
Class Z | | 1,000.00 | | 1,000.00 | | 657.59 | | 1,019.90 | | 4.17 | | 5.09 | | 1.01 |
Expenses paid during the period are equal to the annualized expense ratio for the share class, multiplied by the average account value over the period, then multiplied by the number of days in the fund’s most recent fiscal half-year and divided by 365.
Had the investment advisor and/or any of its affiliates not waived fees or reimbursed a portion of expenses, account value at the end of the period would have been reduced.
It is important to note that the expense amounts shown in the table are meant to highlight only ongoing costs of investing in the fund and do not reflect any transaction costs, such as sales charges, redemption fees or exchange fees. Therefore, the hypothetical examples provided may not help you determine the relative total costs of owning shares of different funds. If these transaction costs were included, your costs would have been higher.
15
Portfolio Managers’ Report – Columbia Mid Cap Core Fund
Performance data quoted represents past performance and current performance may be lower or higher. Past performance is no guarantee of future results. The investment return and principal value will fluctuate so that shares, when redeemed, may be worth more or less than the original cost. Please visit www.columbiafunds.com for daily and most recent month-end performance updates.
| | |
| Net asset value per share |
| |
as of 03/31/09 ($) | | |
Class A | | 9.54 |
Class C | | 9.50 |
Class R | | 9.42 |
Class Z | | 9.55 |
| | |
| Distributions declared per share |
| |
04/01/08 – 03/31/09 ($) | | |
Class A | | 0.11 |
Class C | | 0.06 |
Class R | | 0.09 |
Class Z | | 0.12 |
During the third quarter of 2008, the fund’s Board of Trustees voted to change the name of the fund from Columbia Mid Cap Value & Restructuring Fund to Columbia Mid Cap Core Fund effective November 1, 2008. In addition, the fund’s management team changed. Peter Santoro and Craig Leopold were named co-managers of the fund.
For the 12-month period that ended March 31, 2009, the fund’s Class A shares returned negative 47.44% without sales charge. The fund’s return fell behind its benchmarks, the Russell Midcap Index and the Russell Midcap Value Index, which returned negative 40.81% and negative 42.51%, respectively, for the same period.1 The fund also underperformed the average return of the Lipper Mid-Cap Value Funds Classification2, which was negative 39.27% for the 12-month period. Amidst a difficult market environment, falling commodity prices caused oversupply and subsequent cost pressures. These events pressured the fund’s substantial holdings in the energy sector, accounting for much of the fund’s underperformance relative to its benchmarks and peers. This theme also affected the fund’s heavy exposure to the materials sector as the global economy slowed and commodity prices fell.
Materials, health care and financials names hurt returns
Several materials holdings were significant detractors from returns. Brazilian paper pulp producer Aracruz Celulose S/A was hurt by slowing demand from China and a large loss from a currency hedging strategy. Commodity chemical company Celanese, which derives a third of its business from China, was similarly hurt by a downturn in the commodity cycle and slower global economic growth. India-based copper wire and transmission equipment maker Sterlite Industries India also suffered significant losses. In the health care sector, Shire lost ground when sales of its recently released ADHD drug failed to meet expectations. Among financials, the fund’s overweight in Lehman Brothers magnified the stock’s significant underperformance. We sold all five stocks during the period.
Since taking over management of the fund in November, the fund’s new management team has increased the fund’s holdings more than fourfold, resulting in a less concentrated portfolio where a single stock or sector cannot have as large an impact on the fund’s return as in the past. The new team plans to keep sector weights more in line with the index and will concentrate on generating most of the fund’s return from asset selection.
Consumer and technology stocks helped stem losses
Several consumer names helped offset some of the fund’s losses in other sectors, including paint manufacturer Sherwin-Williams, which occupies a defensive niche within the consumer discretionary sector. Car parts and supplies retailer Autozone
1 | The Russell Midcap Index measures the performance of the 800 smallest companies in the Russell 1000 Index, as ranked by total market capitalization. The Russell Midcap Value Index measures the performance of those Russell Midcap companies with lower price-to-book ratios and lower forecasted growth values. Indices are not available for investment, and do not reflect sales charges, fees, brokerage commissions, taxes or other expenses of investing. Securities in the fund may not match those in an index. |
2 | Lipper Inc., a widely respected data provider in the industry, calculates an average total return (assuming reinvestment of distributions) for mutual funds with investment objectives similar to those of the fund. Lipper makes no adjustment for the effect of sales loads. |
16
Portfolio Managers’ Report (continued) – Columbia Mid Cap Core Fund
| | |
| Top 5 sectors |
| |
as of 03/31/09 (%) | | |
Consumer Discretionary | | 16.4 |
Financials | | 16.1 |
Information Technology | | 14.3 |
Industrials | | 11.9 |
Health Care | | 9.3 |
| | |
| Top 10 holdings |
| |
as of 03/31/09 (%) | | |
PG&E | | 1.7 |
iShares Russell Midcap Index Fund | | 1.5 |
Aon | | 1.4 |
Linear Technology | | 1.3 |
Analog Devices | | 1.3 |
Gap | | 1.2 |
Avon | | 1.2 |
TJX Companies | | 1.2 |
Express Scripts | | 1.2 |
Polo Ralph Lauren | | 1.2 |
| | |
Holdings discussed in this report |
| |
as of 3/31/09 (%) | | |
Sherwin-Williams | | 1.0 |
Apollo Group | | 0.8 |
Hansen Natural | | 0.8 |
Dolby Laboratories | | 0.7 |
Corning | | 0.8 |
The fund is actively managed and the composition of its portfolio will change over time. Information provided is calculated as a percentage of net assets.
benefited from increased need for car maintenance items as consumer spending on new automobiles slowed. We sold the stock for a significant gain. On-line education company Apollo Group experienced a rise in demand as unemployed job-seekers sought affordable degree programs. A distribution deal with Coca Cola boosted the stock of energy drink maker Hansen Natural, opening the door for its popular brand to expand overseas.
Positive stock selection in the technology sector also helped stem losses. The strong patent portfolio of Dolby Laboratories benefited from the conversion from analog to digital television and growing use of the Blu-ray disc format. The changeover from analog to digital also boosted glass maker Corning, which was buoyed by strong demand for flat screen TVs and computer screens.
Positioned for volatility, anticipating recovery
We have positioned the fund for continued market volatility by focusing on what we believe are high quality companies with strong balance sheets that are well-positioned relative to their industries. In the meantime, we continue to monitor the market for subtle changes in stock valuations that may herald positive economic news, as the stock market has historically anticipated economic upturns in advance of proof of an economic recovery. As market conditions improve, we expect stocks in the mid-capitalization range may be the first movers as they have generally outperformed larger peers coming out of a recession. By drawing on three independent research sources — fundamental research, quantitative models and the input of our portfolio management team — and by employing a disciplined valuation process, we seek to identify those companies that are best positioned to capitalize on a recovery.
Portfolio holdings and characteristics are subject to change periodically and may not be representative of current holdings and characteristics. The outlook for the fund may differ from that presented for other Columbia Funds.
Equity securities are affected by stock market fluctuations that occur in response to economic and business developments.
Stocks of mid-cap companies pose special risks, including possible illiquidity and greater price volatility than stocks of larger, more established companies.
Value stocks are securities of companies that may have experienced adverse business or industry developments or may be subject to special risks that have caused the stocks to be out of favor. The price of a company’s stock may not approach the value the manager has placed on it.
17
Fund Profile – Columbia Select Large Cap Growth Fund
Summary
| n | | For the 12-month period that ended March 31, 2009, the fund’s Class A shares returned negative 37.52% without sales charge. |
n | | In an environment of weak economic growth and falling stock prices, the fund, its benchmark, the Russell 1000 Growth Index1, and the average return of its peer group, the Lipper Large Cap Growth Funds Classification2, all lost more than 34%. |
| n | | Stock selection in technology and health care accounted for the fund’s shortfall compared to these comparative measures. A decision to underweight energy and avoid materials stocks benefited performance as both sectors were hurt by declining commodity prices. |
Portfolio Management
Thomas M. Galvin, lead manager, has managed the fund since March 2008 and the Predecessor Fund since February 2003 and has been associated with the advisor or its predecessors or affiliate organizations since 2003.
Richard A. Carter has co-managed the fund since March 2009 and has been associated with the advisor or its predecessors or affiliated organizations since 2003.
Todd D. Herget has co-managed the fund since March 2009 and has been associated with the advisor or its predecessors or affiliated organizations since 1998.
1 | The Russell 1000 Growth Index measures the performance of those Russell 1000 Index companies with higher price-to-book ratios and higher forecasted growth values. Indices are not available for investment, and do not reflect sales charges, fees, brokerage commissions, taxes or other expenses of investing. Securities in the fund may not match those in an index. |
2 | Lipper Inc., a widely respected data provider in the industry, calculates an average total return (assuming reinvestment of distributions) for mutual funds with investment objectives similar to those of the fund. Lipper makes no adjustment for the effect of sales loads. |
Performance data quoted represents past performance and current performance may be lower or higher. Past performance is no guarantee of future results. The investment return and principal value will fluctuate so that shares, when redeemed, may be worth more or less than the original cost. Please visit www.columbiafunds.com for daily and most recent month-end performance updates.
Summary
1-year return as of 03/31/09
| | |
| |
| | –37.52% Class A shares (without sales charge) |
| |
| | –34.28% Russell 1000 Growth Index |
|
Morningstar Style BoxTM |
|
Equity Style |
|
The Morningstar Style BoxTM reveals a fund’s investment strategy. For equity funds, the vertical axis shows the market capitalization of the stocks owned, and the horizontal axis shows investment style (value, blend or growth). Information shown is based on the most recent data provided by Morningstar.
18
Performance Information – Columbia Select Large Cap Growth Fund
Performance data quoted represents past performance and current performance may be lower or higher. Past performance is no guarantee of future results. The investment return and principal value will fluctuate so that shares, when redeemed, may be worth more or less than the original cost. Please visit www.columbiafunds.com for daily and most recent month-end performance updates.
| | |
| Annual operating expense ratio (%)* |
| |
Class A | | 1.33 |
Class C | | 2.08 |
Class R | | 1.58 |
Class Z | | 1.08 |
| * | The annual operating expense ratio is as stated in the fund’s prospectus that is current as of the date of this report. Differences in expense ratios disclosed elsewhere in this report may result from including fee waivers and reimbursements as well as different time periods used in calculating the ratios. |
| | |
| Performance of a $10,000 investment 04/01/99 – 03/31/09 |
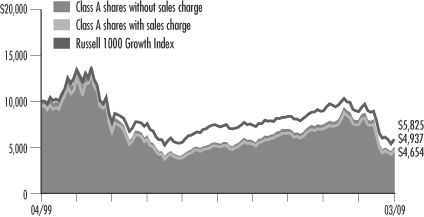
The chart above shows the change in value of a hypothetical $10,000 investment in Class A shares of Columbia Select Large Cap Growth Fund during the stated time period, and does not reflect the deduction of taxes that a shareholder may pay on fund distributions or on the redemption of fund shares. The Russell 1000 Growth Index measures the performance of those Russell 1000 Index companies with higher price-to-book ratios and higher forecasted growth values. Indices are not available for investment, and do not reflect sales charges, fees, brokerage commissions, taxes or other expenses of investing. Securities in the fund may not match those in an index.
| | | | |
| Performance of a $10,000 investment 04/01/99 – 03/31/09 ($) |
| | |
| Sales charge | | without | | with |
Class A | | 4,937 | | 4,654 |
Class C | | 4,881 | | 4,881 |
Class R | | 4,832 | | n/a |
Class Z | | 4,951 | | n/a |
| | | | | | | | | | | | |
| Average annual total return as of 03/31/09 (%) |
| | | | |
| Share class | | A | | C | | R | | Z |
| Inception | | 09/28/07 | | 09/28/07 | | 12/31/04 | | 10/01/97 |
| Sales charge | | without | | with | | without | | with | | without | | without |
1-year | | –37.52 | | –41.12 | | –38.01 | | –38.63 | | –37.69 | | –37.35 |
5-year | | –1.75 | | –2.90 | | –1.97 | | –1.97 | | –2.17 | | –1.69 |
10-year | | –6.81 | | –7.36 | | –6.92 | | –6.92 | | –7.01 | | –6.79 |
The “with sales charge” returns include the maximum initial sales charge of 5.75% for Class A shares and the applicable contingent deferred sales charge of 1.00% for Class C shares for the first year only. The “without sales charge” returns do not include the effect of sales charges. If they had, returns would be lower.
The Fund commenced operations on March 31, 2008. The returns of Class A and Class C shares include the returns of Class A shares or Class C shares, as applicable, of Large Cap Growth Fund, the predecessor to the Fund and a series of Excelsior Funds, Inc. (the “Predecessor Fund”), for periods after September 27, 2007, and also include the returns of Shares class shares of the Predecessor Fund for periods prior to September 28, 2007. The returns shown reflect applicable sales charges, but have not been adjusted to reflect differences in expenses. If differences in expenses had been reflected, the returns shown for the period prior to September 28, 2007 would have been lower. The returns of the Class R shares include the returns of Retirement Shares class shares of the Predecessor Fund for periods after December 30, 2004, and include the returns of Shares class shares of the Predecessor Fund for periods prior to December 31, 2004. The returns shown reflect that Class R shares are sold without sales charges, but have not been adjusted to reflect differences in expenses. If differences in expenses had been reflected, the returns shown for periods prior to the inception of the newer class of shares would have been lower. The returns of the Class Z shares shown for periods prior to March 31, 2008 are those of the Shares class shares of the Predecessor Fund. The returns of Class Z shares shown have not been adjusted to reflect differences in expenses. If differences in expenses had been reflected, the returns shown for periods prior to the inception of the newer class of shares would have been higher.
Inception date refers to the date on which the Predecessor Fund class commenced operations.
Performance results reflect any fee waivers or reimbursements of fund expenses by the investment advisor and/or any of its affiliates. Absent these fee waivers or expense reimbursement arrangements, performance results would have been lower.
All results shown assume reinvestment of distributions. Class Z shares are sold at net asset value with no distribution and service (Rule 12b-1) fees. Class R shares are sold at net asset value with distribution and service (Rule 12b-1) fees. Class R and Class Z shares have limited eligibility and the investment minimum requirements may vary. Please see the fund’s prospectus for details. Performance for different share classes will vary based on differences in sales charges and fees associated with each class.
The tables do not reflect the deduction of taxes that a shareholder may pay on fund distributions or on the redemption of fund shares.
19
Understanding Your Expenses – Columbia Select Large Cap Growth Fund
Estimating your actual expenses
To estimate the expenses that you paid over the period, first you will need your account balance at the end of the period:
| | n | | For shareholders who receive their account statements from Columbia Management Services, Inc., your account balance is available online at www.columbiafunds.com or by calling Shareholder Services at 800.345.6611. | |
| | n | | For shareholders who receive their account statements from their financial intermediary, contact your financial intermediary to obtain your account balance. | |
| | 1. | Divide your ending account balance by $1,000. For example, if an account balance was $8,600 at the end of the period, the result would be 8.6. | |
| | 2. | In the section of the table below titled “Expenses paid during the period,” locate the amount for your share class. You will find this number in the column labeled “Actual.” Multiply this number by the result from step 1. Your answer is an estimate of the expenses you paid on your account during the period. | |
If the value of your account falls below the minimum initial investment requirement applicable to you, your account generally will be subject to a $20 annual fee. This fee is not included in the accompanying table. If you are subject to the fee, keep it in mind when you are estimating the ongoing expenses of investing in the fund and when comparing the expenses of this fund with other funds.
As a fund shareholder, you incur two types of costs. There are transaction costs, which generally include sales charges on purchases and may include redemption fees or exchange fees. There are also ongoing costs, which generally include investment advisory fees, distribution and service (Rule 12b-1) fees and other fund expenses. The information on this page is intended to help you understand the ongoing costs of investing in the fund and to compare these costs with the ongoing costs of investing in other mutual funds.
Analyzing your fund’s expenses by share class
To illustrate these ongoing costs, we have provided an example and calculated the expenses paid by investors in each share class during the period. The information in the following table is based on an initial investment of $1,000, which is invested at the beginning of the period and held for the entire period. Expense information is calculated two ways and each method provides you with different information. The amount listed in the “Actual” column is calculated using the fund’s actual operating expenses and total return for the period. The amount listed in the “Hypothetical” column for each share class assumes that the return each year is 5% before expenses and is calculated based on the fund’s actual operating expenses. You should not use the hypothetical account values and expenses to estimate either your actual account balance at the end of the period or the expenses you paid during this period.
Compare with other funds
Since all mutual funds are required to include the same hypothetical calculations about expenses in shareholder reports, you can use this information to compare the ongoing cost of investing in the fund with other funds. To do so, compare the 5% hypothetical example with the 5% hypothetical examples that appear in the shareholder reports of other funds. As you compare hypothetical examples of other funds, it is important to note that hypothetical examples are meant to highlight the ongoing costs of investing in a fund and do not reflect any transaction costs, such as sales charges, redemption fees or exchange fees.
| | | | | | | | | | | | | | |
| 10/01/08 – 03/31/09 | | | | | | |
| | | | |
| | | Account value at the
beginning of the period ($) | | Account value at the
end of the period ($) | | Expenses paid
during the period ($) | | Fund’s annualized
expense ratio (%) |
| | | Actual | | Hypothetical | | Actual | | Hypothetical | | Actual | | Hypothetical | | Actual |
Class A | | 1,000.00 | | 1,000.00 | | 741.61 | | 1,018.55 | | 5.56 | | 6.44 | | 1.28 |
Class C | | 1,000.00 | | 1,000.00 | | 738.62 | | 1,014.81 | | 8.80 | | 10.20 | | 2.03 |
Class R | | 1,000.00 | | 1,000.00 | | 740.61 | | 1,017.30 | | 6.64 | | 7.70 | | 1.53 |
Class Z | | 1,000.00 | | 1,000.00 | | 742.11 | | 1,019.80 | | 4.47 | | 5.19 | | 1.03 |
Expenses paid during the period are equal to the annualized expense ratio for the share class, multiplied by the average account value over the period, then multiplied by the number of days in the fund’s most recent fiscal half-year and divided by 365.
Had the investment advisor and/or any of its affiliates not waived fees or reimbursed a portion of expenses, account value at the end of the period would have been reduced.
It is important to note that the expense amounts shown in the table are meant to highlight only ongoing costs of investing in the fund and do not reflect any transaction costs, such as sales charges, redemption fees or exchange fees. Therefore, the hypothetical examples provided may not help you determine the relative total costs of owning shares of different funds. If these transaction costs were included, your costs would have been higher.
20
Portfolio Managers’ Report – Columbia Select Large Cap Growth Fund
Performance data quoted represents past performance and current performance may be lower or higher. Past performance is no guarantee of future results. The investment return and principal value will fluctuate so that shares, when redeemed, may be worth more or less than the original cost. Please visit www.columbiafunds.com for daily and most recent month-end performance updates.
| | |
| Net asset value per share |
| |
as of 03/31/09 ($) | | |
Class A | | 7.06 |
Class C | | 6.98 |
Class R | | 6.91 |
Class Z | | 7.08 |
On March 27, 2009, the fund’s portfolio management team changed. Richard A. Carter and Todd D. Herget joined Thomas M. Galvin as co-managers of the fund.
For the 12-month period that ended March 31, 2009, the fund’s Class A shares returned negative 37.52% without sales charge. The fund’s benchmark, the Russell 1000 Growth Index1, returned negative 34.28% for the same period. The average return of the funds in its peer group, the Lipper Large Cap Growth Funds Classification2, was negative 35.29% for the 12-month period. An underweight in consumer staples and stock selection in technology and health care generally accounted for the fund’s shortfall to these comparative measures. A decision to underweight energy and avoid materials stocks benefited performance as both sectors were hurt by declining commodity prices. The fund benefited from an underweight in industrials and managed to offset or limit some losses through good stock selection in the sector. The fund benefited from an overweight in consumer discretionary stocks, but gave up some ground relative to the index through stock selection in the sector.
A challenging period for stock market investors
As the U.S. economy contracted and a housing slump continued, the U.S. stock market experienced one of its most painful periods in recent memories. In this environment, there were only relative victories and limited successes. However, we believe that it is important for investors to keep their long-term perspective and keep in mind that this fund has generated solid, competitive performance over the past decade.
Technology and health care stocks among biggest detractors
In this very difficult market environment, certain areas in which the fund lost ground represent what we believe to be the result of short-term trends. For example, the fund’s significant underweight in consumer staples stocks detracted from performance as investors generally sought out the highest quality companies in a sector that tends to hold up better than most in a weak economic environment. However, the fund generally does not have a lot of exposure to consumer staples because the defensive sector tends to have slower earnings growth than what we target for the fund — two or three times that of the S&P 500. In an environment of robust economic growth, the fund’s avoidance of consumer staples companies has historically been rewarded and we believe that a return to stability in the economy could benefit the fund’s strategy. The fund’s only consumer staples holding is Costco Wholesale.
In the information technology sector, Research In Motion, which makes the Blackberry hand-held communications device, detracted from performance. Despite its weak showing during the past year, we continue to like the company’s long-term prospects. A new product launch resulted in higher advertising and technology costs, which cut into late 2008 profits, but we view this situation as temporary and the company’s long-term prospects as favorable.
1 | The Russell 1000 Growth Index measures the performance of those Russell 1000 Index companies with higher price-to-book ratios and higher forecasted growth values. Indices are not available for investment, and do not reflect sales charges, fees, brokerage commissions, taxes or other expenses of investing. Securities in the fund may not match those in an index. |
2 | Lipper Inc., a widely respected data provider in the industry, calculates an average total return (assuming reinvestment of distributions) for mutual funds with investment objectives similar to those of the fund. Lipper makes no adjustment for the effect of sales loads. |
21
Portfolio Managers’ Report (continued) – Columbia Select Large Cap Growth Fund
In health care, Intuitive Surgical and Covance lost ground but both are companies in which we have a high degree of confidence. Intuitive Surgical makes a robotic surgical device called da Vinci®. The stock suffered on concerns that hospitals are cutting spending on devices such as these, given the weakness in the economy. However, the da Vinci procedure is designed to be less invasive than other surgical methods, helping hospitals treat more patients in less time, and we continue to own the stock because we like the company’s long-term outlook. Likewise, Covance shares declined on concerns that the large pharmaceutical and biotechnology companies for which it performs clinical trials would reduce spending on research services. However, Covance can often do many of these trials much more cheaply than its customers, and we’re comfortable keeping it in the fund, as well.
Sector allocation and stock selection made positive contributions
The biggest contribution to relative returns was a significant underweight in energy and no exposure to materials, both of which were hit by a sharp decline in commodity prices. The fund’s only energy holding is FMC Technologies, an innovative company that makes deep-sea drilling equipment. We bought the stock near the end of 2008, and it has been one of the fund’s best performers so far in 2009.
The fund benefited from underweighting industrials and from good stock selection in the sector. In industrials, the two contributors were First Solar and Expeditors International of Washington. While both stocks were down sharply during the period, they fell less than the average industrial stock in the Russell 1000 Growth Index, which meant that, on a relative basis, they were positive contributors. First Solar has done fairly well this year, partly on hope that the new administration in Washington will spend more on alternative energy. Expeditors International is a freight forwarding and logistics company that has executed well and increased earnings in spite of the weak economy. An overweight in consumer discretionary stocks helped performance, although some of the benefit was offset by stock selection in the sector.
Looking Ahead
Despite signs of a spring thaw in some economic and market indicators, overall growth in the economy and corporate earnings is likely to remain hard to come by for the next 12- months or more. However, sentiment in such areas as credit and housing, as well as business and consumer confidence, has started to change. Recent stock market action suggests that, when it comes to styles and sectors, investors have started to differentiate among winners and losers — a clear shift from the broad sell off we saw in the second half of 2008. Going forward, we will look for opportunities among companies with strong product cycles, as opposed to those that might benefit from shifts in the economy.
Portfolio holdings and characteristics are subject to change periodically and may not be representative of current holdings and characteristics. The outlook for the fund may differ from that presented for other Columbia Funds.
Equity securities are affected by stock market fluctuations that occur in response to economic and business developments.
Investing in growth stocks incurs the possibility of losses because their prices are sensitive to changes in current or expected earnings.
| | |
| Top 5 Sectors |
| |
as of 03/31/09 (%) | | |
Health Care | | 29.9 |
Information Technology | | 25.9 |
Consumer Discretionary | | 14.7 |
Financials | | 8.7 |
Industrials | | 7.3 |
| | |
| Top 10 Holdings |
| |
as of 03/31/09 (%) | | |
QUALCOMM | | 4.7 |
Amazon | | 4.7 |
Illumina | | 4.7 |
Apple | | 4.6 |
Google | | 4.5 |
CME Group | | 4.5 |
MasterCard | | 4.4 |
FMC Technologies | | 4.2 |
Allergan | | 4.1 |
Medco Health Solutions | | 4.1 |
| |
| | |
| Holdings discussed in this report |
| |
as of 3/31/09 (%) | | |
Costco Wholesale | | 3.0 |
Research In Motion | | 4.0 |
Intuitive Surgical | | 3.2 |
Covance | | 3.6 |
FMC Technologies | | 4.2 |
First Solar | | 3.8 |
Expeditors International of Washington | | 3.5 |
The fund is actively managed and the composition of its portfolio will change over time. Information provided is calculated as a percentage of net assets.
22
Fund Profile – Columbia Select Opportunities Fund
Performance data quoted represents past performance and current performance may be lower or higher. Past performance is no guarantee of future results. The investment return and principal value will fluctuate so that shares, when redeemed, may be worth more or less than the original cost. Please visit www.columbiafunds.com for daily and most recent month-end performance updates.
Summary
1-year return as of 03/31/09
| | |
| |
| | –44.24% Class A shares
(without sales charge) |
| |
| | –38.09% S&P 500 Index |
| |
| | –38.27% Russell 1000 Index |
|
Morningstar Style BoxTM |
|
Equity Style |
|
The Morningstar Style BoxTM reveals a fund’s investment strategy. For equity funds, the vertical axis shows the market capitalization of the stocks owned, and the horizontal axis shows investment style (value, blend or growth). Information shown is based on the most recent data provided by Morningstar. |
Summary
| n | | For the 12-month period that ended March 31, 2009, the fund’s Class A shares returned negative 44.24% without sales charge. |
n | | The fund underperformed its benchmarks, the S&P 500 Index and the Russell 1000 Index.1 It also underperformed its peer group average, the Lipper Multi-Cap Core Funds Classification.2 |
| n | | The fund’s sector weights contributed notably to its underperformance relative to its benchmarks. |
Portfolio Management
Emil A. Gjester has co-managed the fund since February 2009 and has been associated with the advisor or its predecessors or affiliate organizations since 1996.
Jonas Patrikson has co-managed the fund since February 2009 and has been associated with the advisor or its predecessors or affiliate organizations since 2004.
Michael T. Welter has co-managed the fund since February 2009 and has been associated with the advisor or its predecessors or affiliate organizations since 2006.
Mary-Ann Ward has co-managed the fund since February 2009 and has been associated with the advisor or its predecessors or affiliate organizations since 1997.
1 | The Standard & Poor’s (S&P) 500 Index tracks the performance of 500 widely held, large capitalization US stocks. The Russell 1000 Index measures the performance of 1,000 of the largest US companies, based on market capitalization. Indices are not available for investment, and do not reflect sales charges, fees, brokerage commissions, taxes or other expenses of investing. Securities in the fund may not match those in an index. |
2 | Lipper Inc., a widely respected data provider in the industry, calculates an average total return (assuming reinvestment of distributions) for mutual funds with investment objectives similar to those of the fund. Lipper makes no adjustment for the effect of sales loads. |
23
Performance Information – Columbia Select Opportunities Fund
Performance data quoted represents past performance and current performance may be lower or higher. Past performance is no guarantee of future results. The investment return and principal value will fluctuate so that shares, when redeemed, may be worth more or less than the original cost. Please visit www.columbiafunds.com for daily and most recent month-end performance updates.
| | |
| Annual operating expense ratio (%)* |
| |
Class A | | 1.23 |
Class C | | 1.98 |
Class Z | | 0.98 |
| | |
Annual operating expense ratio
after contractual waivers (%)* |
| |
Class A | | 1.07 |
Class C | | 1.82 |
Class Z | | 0.82 |
| * | The annual operating expense ratio and annual operating expense ratio after contractual waivers are as stated in the fund’s prospectus that is current as of the date of this report. The contractual waiver expires 07/31/09. Differences in expense ratios disclosed elsewhere in this report may result from including fee waivers and expense reimbursements as well as different time periods used in calculating the ratios. |
| | |
| Performance of a $10,000 investment 03/31/04 – 03/31/09 |
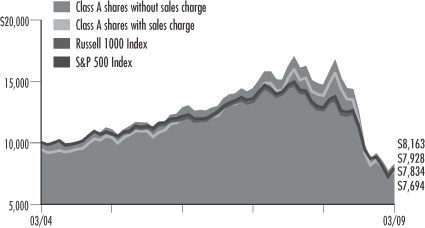
The chart above shows the change in value of a hypothetical $10,000 investment in Class A shares of Columbia Select Opportunities Fund during the stated time period, and does not reflect the deduction of taxes that a shareholder may pay on fund distributions or on the redemption of fund shares. The Standard & Poor’s (S&P) 500 Index tracks the performance of 500 widely held, large capitalization US stocks. The Russell 1000 Index measures the performance of 1,000 of the largest US companies, based on market capitalization. Indices are not available for investment, and do not reflect sales charges, fees, brokerage commissions, taxes or other expenses of investing. Securities in the fund may not match those in an index.
| | | | |
| Performance of a $10,000 investment 03/31/04 – 03/31/09 ($) |
| | |
| Sales charge | | without | | with |
Class A | | 8,163 | | 7,694 |
Class C | | 8,062 | | 8,062 |
Class Z | | 8,184 | | n/a |
| | | | | | | | | | |
| Average annual total return as of 03/31/09 (%) |
| | | |
| Share class | | A | | C | | Z |
| Inception | | 09/28/07 | | 09/28/07 | | 03/31/04 |
| Sales charge | | without | | with | | without | | with | | without |
1-year | | –44.24 | | –47.44 | | –44.69 | | –45.23 | | –44.11 |
5-year | | –3.98 | | –5.11 | | –4.22 | | –4.22 | | –3.93 |
Life | | –3.98 | | –5.11 | | –4.22 | | –4.22 | | –3.93 |
The “with sales charge” returns include the maximum initial sales charge of 5.75% for Class A shares and the applicable contingent deferred sales charge of 1.00% for Class C shares for the first year only. The “without sales charge” returns do not include the effect of sales charges. If they had, returns would be lower. The Fund commenced operations on March 31, 2008. The returns of the Class A and Class C shares shown include the returns of Class A shares or Class C shares, as applicable, of Equity Opportunities Fund, the predecessor to the Fund and a series of Excelsior Funds, Inc. (the “Predecessor Fund”), for periods after September 27, 2007, and include the returns of Shares class shares of the Predecessor Fund for periods prior to September 28, 2007. The returns shown reflect applicable sales charges, but have not been adjusted to reflect differences in expenses. If differences in expenses were reflected, the returns shown for the periods prior to September 28, 2007 would be lower. The returns of the Class Z shares shown for periods prior to March 31, 2008 are those of the Shares class shares of the Predecessor Fund. The returns of Class Z shares shown have not been adjusted to reflect differences in expenses. If differences in expenses were reflected, the returns shown for all periods would be higher.
Inception date refers to the date on which the Predecessor Fund class commenced operations.
Performance results reflect any fee waivers or reimbursements of fund expenses by the investment advisor and/or any of its affiliates. Absent these fee waivers or expense reimbursement arrangements, performance results would have been lower.
All results shown assume reinvestment of distributions. Class Z shares are sold at net asset value with no distribution and service (Rule 12b-1) fees. Class Z shares have limited eligibility and the investment minimum requirements may vary. Please see the fund’s prospectus for details. Performance for different share classes will vary based on differences in sales charges and fees associated with each class.
The tables do not reflect the deduction of taxes that a shareholder may pay on fund distributions or on the redemption of fund shares.
24
Understanding Your Expenses – Columbia Select Opportunities Fund
Estimating your actual expenses
To estimate the expenses that you paid over the period, first you will need your account balance at the end of the period:
| | n | | For shareholders who receive their account statements from Columbia Management Services, Inc., your account balance is available online at www.columbiafunds.com or by calling Shareholder Services at 800.345.6611. | |
| | n | | For shareholders who receive their account statements from their financial intermediary, contact your financial intermediary to obtain your account balance. | |
| | 1. | Divide your ending account balance by $1,000. For example, if an account balance was $8,600 at the end of the period, the result would be 8.6. | |
| | 2. | In the section of the table below titled “Expenses paid during the period,” locate the amount for your share class, You will find this number in the column labeled “Actual”. Multiply this number by the result from step 1. Your answer is an estimate of the expenses you paid on your account during the period. | |
If the value of your account falls below the minimum initial investment requirement applicable to you, your account generally will be subject to a $20 annual fee. This fee is not included in the accompanying table. If you are subject to the fee, keep it in mind when you are estimating the ongoing expenses of investing in the fund and when comparing the expenses of this fund with other funds.
As a fund shareholder, you incur two types of costs. There are transaction costs, which generally include sales charges on purchases and may include redemption fees or exchange fees. There are also ongoing costs, which generally include investment advisory fees, distribution and service (Rule 12b-1) fees and other fund expenses. The information on this page is intended to help you understand the ongoing costs of investing in the fund and to compare these costs with the ongoing costs of investing in other mutual funds.
Analyzing your fund’s expenses by share class
To illustrate these ongoing costs, we have provided an example and calculated the expenses paid by investors in each share class during the period. The information in the following table is based on an initial investment of $1,000, which is invested at the beginning of the period and held for the entire period. Expense information is calculated two ways and each method provides you with different information. The amount listed in the “Actual” column is calculated using the fund’s actual operating expenses and total return for the period. The amount listed in the “Hypothetical” column for each share class assumes that the return each year is 5% before expenses and is calculated based on the fund’s actual operating expenses. You should not use the hypothetical account values and expenses to estimate either your actual account balance at the end of the period or the expenses you paid during this period.
Compare with other funds
Since all mutual funds are required to include the same hypothetical calculations about expenses in shareholder reports, you can use this information to compare the ongoing cost of investing in the fund with other funds. To do so, compare the 5% hypothetical example with the 5% hypothetical examples that appear in the shareholder reports of other funds. As you compare hypothetical examples of other funds, it is important to note that hypothetical examples are meant to highlight the ongoing costs of investing in a fund and do not reflect any transaction costs, such as sales charges, redemption fees or exchange fees.
| | | | | | | | | | | | | | |
| 10/01/08 – 03/31/09 | | |
| | | | |
| | | Account value at the
beginning of the period ($) | | Account value at the
end of the period ($) | | Expenses paid
during the period ($) | | Fund’s annualized
expense ratio (%) |
| | | Actual | | Hypothetical | | Actual | | Hypothetical | | Actual | | Hypothetical | | Actual |
Class A | | 1,000.00 | | 1,000.00 | | 653.90 | | 1,019.60 | | 4.41 | | 5.39 | | 1.07 |
Class C | | 1,000.00 | | 1,000.00 | | 651.31 | | 1,015.86 | | 7.49 | | 9.15 | | 1.82 |
Class Z | | 1,000.00 | | 1,000.00 | | 654.70 | | 1,020.84 | | 3.38 | | 4.13 | | 0.82 |
Expenses paid during the period are equal to the annualized expense ratio for the share class, multiplied by the average account value over the period, then multiplied by the number of days in the fund’s most recent fiscal half-year and divided by 365.
Had the investment advisor and/or any of its affiliates not waived fees or reimbursed a portion of expenses, account value at the end of the period would have been reduced.
It is important to note that the expense amounts shown in the table are meant to highlight only ongoing costs of investing in the fund and do not reflect any transaction costs, such as sales charges, redemption fees or exchange fees. Therefore, the hypothetical examples provided may not help you determine the relative total costs of owning shares of different funds. If these transaction costs were included, your costs would have been higher.
25
Portfolio Managers’ Report – Columbia Select Opportunities Fund
Performance data quoted represents past performance and current performance may be lower or higher. Past performance is no guarantee of future results. The investment return and principal value will fluctuate so that shares, when redeemed, may be worth more or less than the original cost. Please visit www.columbiafunds.com for daily and most recent month-end performance updates.
| | |
| Net asset value per share |
| |
as of 03/31/09 ($) | | |
Class A | | 7.62 |
Class C | | 7.58 |
Class Z | | 7.62 |
| | |
| Distributions declared per share |
| |
04/01/08 – 03/31/09 ($) | | |
Class A | | 0.27 |
Class C | | 0.22 |
Class Z | | 0.29 |
For the 12-month period that ended March 31, 2009, the fund’s Class A shares returned negative 44.24% without sales charge. The fund underperformed its benchmarks, the S&P 500 Index and the Russell 1000 Index, which returned negative 38.09% and negative 38.27%, respectively, for the same period.1 The fund underperformed the average return of the funds in its peer group, the Lipper Multi-Cap Core Funds Classification2, which was negative 38.11% for the 12-month period. The fund’s sector weights contributed notably to its underperformance relative to its benchmarks.
A new management team
In February 2009, the fund’s management team changed. Emil A. Gjester, Jonas Patrikson, Michael T. Welter and Mary-Ann Ward were named co-managers of the fund. During the latter part of the first quarter of 2009, we made several changes to reposition sector weights and stock selection to align the fund with our outlook and strategy.
Portfolio detractors
Certain stocks in the health care sector were disappointing. Novo Nordisk and Senomyx were the two biggest detractors from return in the sector. Among the consumer discretionary holdings that detracted from results were, Sotheby’s, Dillard’s, Lear and Sears. All of these positions were sold. Other disappointments during the period that weighed on results included the fund’s positions in Abitibibowater and Aracruz Celulose in the materials sector, Leucadia National and American Capital in the financials sector and Olam International in the consumer staples sector. All of these positions were sold. In the utilities and energy sector, the fund’s positions in AES and Cimarex Energy detracted from results.
Positive performers in a difficult market
While most stocks struggled during the period, the portfolio included a few companies that made positive contributions to performance. For example, in the consumer staples sector, Anheuser-Busch and Archer Daniels Midland did well. Anheuser-Busch was sold, but Archer Daniels Midland remains in the portfolio. In the technology sector, the fund’s holdings in MasterCard registered positive returns. Granite Construction, in the industrials sector, was also noteworthy. In the materials sector, Franco-Nevada and Newmont Mining registered positive returns. Both positions were sold.
Looking ahead
We believe that problems within the credit markets, coupled with a stressed housing market, will continue to pressure the U.S and global economies. However, recent interest rate cuts and other government action, both at home and abroad, should
1 | The Standard & Poor’s (S&P) 500 Index tracks the performance of 500 widely held, large capitalization US stocks. The Russell 1000 Index measures the performance of 1,000 of the largest US companies, based on market capitalization. Indices are not available for investment, and do not reflect sales charges, fees, brokerage commissions, taxes or other expenses of investing. Securities in the fund may not match those in an index. |
2 | Lipper Inc., a widely respected data provider in the industry, calculates an average total return (assuming reinvestment of distributions) for mutual funds with investment objectives similar to those of the fund. Lipper makes no adjustment for the effect of sales loads. |
26
Portfolio Managers’ Report (continued) – Columbia Select Opportunities Fund
| | |
| Top 5 Sectors |
| |
as of 03/31/09 (%) | | |
Information Technology | | 17.6 |
Financials | | 14.7 |
Energy | | 13.8 |
Industrials | | 12.0 |
Health Care | | 11.8 |
| | |
| Top 10 Holdings |
| |
as of 03/31/09 (%) | | |
Quanta Services | | 4.2 |
Apache | | 3.9 |
Novo Nordisk | | 3.7 |
Goldman Sachs Group | | 3.5 |
Petroleo Brasileiro | | 3.4 |
Berkshire Hathaway | | 2.9 |
Apple | | 2.8 |
Exxon Mobil | | 2.7 |
Johnson & Johnson | | 2.6 |
JPMorgan Chase | | 2.4 |
| | |
| Holdings discussed in this report |
as of 3/31/09 (%) | | |
Novo Nordisk | | 3.7 |
Senomyx | | 0.5 |
AES | | 1.0 |
Cimarex Energy | | 1.7 |
Archer Daniels Midland | | 1.8 |
MasterCard | | 2.1 |
Granite Construction | | 1.6 |
The fund is actively managed and the composition of its portfolio will change over time. Information provided is calculated as a percentage of net assets.
eventually enable the economy to stabilize and perhaps aid its recovery. In this
environment, valuations have become attractive across many sectors and we are finding opportunities to own companies that should be positioned to benefit as the economy recovers. We believe in the long-term growth potential for emerging markets. However, in the near term, we are finding many compelling investments in the United States.
Portfolio holdings and characteristics are subject to change periodically and may not be representative of current holdings and characteristics. The outlook for the fund may differ from that presented for other Columbia Funds.
Equity securities are affected by stock market fluctuations that occur in response to economic and business developments.
27
Fund Profile – Columbia Select Small Cap Fund
Performance data quoted represents past performance and current performance may be lower or higher. Past performance is no guarantee of future results. The investment return and principal value will fluctuate so that shares, when redeemed, may be worth more or less than the original cost. Please visit www.columbiafunds.com for daily and most recent month-end performance updates.
Summary
1-year return as of 03/31/09
| | |
| |
| | –42.02% Class A shares
(without sales charge) |
| |
| | –37.50% Russell 2000 Index |
|
Morningstar Style BoxTM |
|
Equity Style |
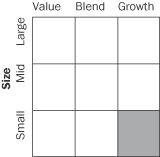
|
The Morningstar Style BoxTM reveals a fund’s investment strategy. For equity funds, the vertical axis shows the market capitalization of the stocks owned, and the horizontal axis shows investment style (value, blend or growth). Information shown is based on the most recent data provided by Morningstar. |
Summary
| n | | For the 12-month period that ended March 31, 2009, the fund’s Class A shares returned negative 42.02% without sales charge. |
n | | The fund trailed its benchmark, the Russell 2000 Index,1 as well as the average return of its peer group, the Lipper Small-Cap Core Funds Classification.2 |
| n | | Stock selection in financials and technology generally accounted for the fund’s underperformance. |
Portfolio Management
Douglas H. Pyle has managed the fund since March 2008 and the Predecessor Fund since August 2001 and has been associated with the advisor or its predecessors or affiliate organizations since 1999.
1 | The Russell 2000 Index measures the performance of the 2,000 smallest of the 3,000 largest US companies, based on market capitalization. Indices are not available for investment, and do not reflect sales charges, fees, brokerage commissions, taxes or other expenses of investing. Securities in the fund may not match those in an index. |
2 | Lipper Inc., a widely respected data provider in the industry, calculates an average total return (assuming reinvestment of distributions) for mutual funds with investment objectives similar to those of the fund. Lipper makes no adjustment for the effect of sales loads. |
28
Performance Information – Columbia Select Small Cap Fund
| | |
| Performance of a $10,000 investment 04/01/99 – 03/31/09 |
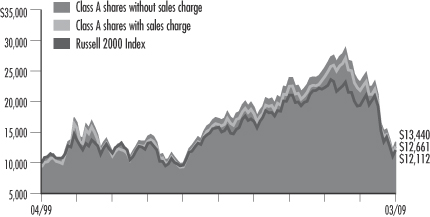
The chart above shows the change in value of a hypothetical $10,000 investment in Class A shares of Columbia Select Small Cap Fund during the stated time period, and does not reflect the deduction of taxes that a shareholder may pay on fund distributions or on the redemption of fund shares. The Russell 2000 Index measures the performance of the 2,000 smallest of the 3,000 largest US companies, based on market capitalization. Indices are not available for investment, and do not reflect sales charges, fees, brokerage commissions, taxes or other expenses of investing. Securities in the fund may not match those in an index.
| | | | |
| Performance of a $10,000 investment 04/01/99 – 03/31/09 ($) |
| Sales charge | | without | | with |
Class A | | 13,440 | | 12,661 |
Class C | | 13,280 | | 13,280 |
Class R | | 13,171 | | n/a |
Class Z | | 13,469 | | n/a |
| | | | | | | | | | | | |
| Average annual total return as of 3/31/09 (%) |
| | | | |
| Share class | | A | | C | | R | | Z |
| Inception | | 09/28/07 | | 09/28/07 | | 12/31/04 | | 12/31/92 |
| Sales charge | | without | | with | | without | | with | | without | | without |
1-year | | –42.02 | | –45.37 | | –42.53 | | –43.09 | | –42.22 | | –41.89 |
5-year | | –4.85 | | –5.97 | | –5.08 | | –5.08 | | –5.23 | | –4.81 |
10-year | | 3.00 | | 2.39 | | 2.88 | | 2.88 | | 2.79 | | 3.02 |
Performance data quoted represents past performance and current performance may be lower or higher. Past performance is no guarantee of future results. The investment return and principal value will fluctuate so that shares, when redeemed, may be worth more or less than the original cost. Please visit www.columbiafunds.com for daily and most recent month-end performance updates.
| | |
| Annual operating expense ratio (%)* |
| |
Class A | | 1.38 |
Class C | | 2.13 |
Class R | | 1.63 |
Class Z | | 1.13 |
| * | The annual operating expense ratio is as stated in the fund’s prospectus that is current as of the date of this report. Differences in expense ratios disclosed elsewhere in this report may result from including fee waivers and expense reimbursements as well as different time periods used in calculating the ratios. |
The “with sales charge” returns include the maximum initial sales charge of 5.75% for Class A shares and the applicable contingent deferred sales charge of 1.00% for Class C shares for the first year only. The “without sales charge” returns do not include the effect of sales charges. If they had, returns would be lower.
The Fund commenced operations on March 31, 2008. The returns of the Class A and Class C shares shown include the returns of Class A shares or Class C shares, as applicable, of Small Cap Fund, the predecessor to the Fund and a series of Excelsior Funds, Inc. (the “Predecessor Fund”), for periods after September 27, 2007, and include the returns of Shares class shares of the Predecessor Fund for periods prior to September 28, 2007. The returns shown reflect applicable sales charges, but have not been adjusted to reflect differences in expenses. If differences in expenses were reflected, the returns shown for the period prior to September 28, 2007 would be lower. The returns of the Class R shares shown include the returns of Retirement Shares class shares of the Predecessor Fund for periods after December 30, 2004, and include the returns of Shares class shares of the Predecessor Fund for periods prior to December 31, 2004. The returns shown reflect that Class R shares are sold without sales charges, but have not been adjusted to reflect differences in expenses. If differences in expenses were reflected, the returns shown for all periods would be lower. The returns of the Class Z shares shown for periods prior to March 31, 2008 are those of the Shares class shares of the Predecessor Fund. The returns of Class Z shares shown have not been adjusted to reflect differences in expenses. If differences in expenses were reflected, the returns shown for all periods would be higher.
Inception date refers to the date on which the Predecessor Fund class commenced operations.
Performance results reflect any fee waivers or reimbursements of fund expenses by the investment advisor and/or any of its affiliates. Absent these fee waivers or expense reimbursement arrangements, performance results would have been lower.
All results shown assume reinvestment of distributions. Class Z shares are sold at net asset value with no distribution and service (Rule 12b-1) fees. Class R shares are sold at net asset value with distribution (Rule 12b-1) fees. Class R and Class Z shares have limited eligibility and the investment minimum requirements may vary. Please see the fund’s prospectus for details. Performance for different share classes will vary based on differences in sales charges and fees associated with each class
The tables do not reflect the deduction of taxes that a shareholder may pay on fund distributions or on the redemption of fund shares.
29
Understanding Your Expenses – Columbia Select Small Cap Fund
Estimating your actual expenses
To estimate the expenses that you paid over the period, first you will need your account balance at the end of the period:
| | n | | For shareholders who receive their account statements from Columbia Management Services, Inc., your account balance is available online at www.columbiafunds.com or by calling Shareholder Services at 800.345.6611. | |
| | n | | For shareholders who receive their account statements from their financial intermediary, contact your financial intermediary to obtain your account balance. | |
| | 1. | Divide your ending account balance by $1,000. For example, if an account balance was $8,600 at the end of the period, the result would be 8.6. | |
| | 2. | In the section of the table below titled “Expenses paid during the period,” locate the amount for your share class, You will find this number in the column labeled “Actual”. Multiply this number by the result from step 1. Your answer is an estimate of the expenses you paid on your account during the period. | |
If the value of your account falls below the minimum initial investment requirement applicable to you, your account generally will be subject to a $20 annual fee. This fee is not included in the accompanying table. If you are subject to the fee, keep it in mind when you are estimating the ongoing expenses of investing in the fund and when comparing the expenses of this fund with other funds.
As a fund shareholder, you incur two types of costs. There are transaction costs, which generally include sales charges on purchases and may include redemption fees or exchange fees. There are also ongoing costs, which generally include investment advisory fees, distribution and service (Rule 12b-1) fees and other fund expenses. The information on this page is intended to help you understand the ongoing costs of investing in the fund and to compare these costs with the ongoing costs of investing in other mutual funds.
Analyzing your fund’s expenses by share class
To illustrate these ongoing costs, we have provided an example and calculated the expenses paid by investors in each share class during the period. The information in the following table is based on an initial investment of $1,000, which is invested at the beginning of the period and held for the entire period. Expense information is calculated two ways and each method provides you with different information. The amount listed in the “Actual” column is calculated using the fund’s actual operating expenses and total return for the period. The amount listed in the “Hypothetical” column for each share class assumes that the return each year is 5% before expenses and is calculated based on the fund’s actual operating expenses. You should not use the hypothetical account values and expenses to estimate either your actual account balance at the end of the period or the expenses you paid during this period.
Compare with other funds
Since all mutual funds are required to include the same hypothetical calculations about expenses in shareholder reports, you can use this information to compare the ongoing cost of investing in the fund with other funds. To do so, compare the 5% hypothetical example with the 5% hypothetical examples that appear in the shareholder reports of other funds. As you compare hypothetical examples of other funds, it is important to note that hypothetical examples are meant to highlight the ongoing costs of investing in a fund and do not reflect any transaction costs, such as sales charges, redemption fees or exchange fees.
| | | | | | | | | | | | | | |
10/01/08 – 03/31/09 | | | | | | | | | | |
| | | | |
| | | Account value at the
beginning of the period ($) | | Account value at the
end of the period ($) | | Expenses paid
during the period ($) | | Fund’s annualized
expense ratio (%) |
| | | Actual | | Hypothetical | | Actual | | Hypothetical | | Actual | | Hypothetical | | Actual |
Class A | | 1,000.00 | | 1,000.00 | | 634.11 | | 1,018.15 | | 5.54 | | 6.84 | | 1.36 |
Class C | | 1,000.00 | | 1,000.00 | | 630.81 | | 1,014.41 | | 8.58 | | 10.60 | | 2.11 |
Class R | | 1,000.00 | | 1,000.00 | | 632.51 | | 1,016.90 | | 6.55 | | 8.10 | | 1.61 |
Class Z | | 1,000.00 | | 1,000.00 | | 634.60 | | 1,019.40 | | 4.52 | | 5.59 | | 1.11 |
Expenses paid during the period are equal to the annualized expense ratio for the share class, multiplied by the average account value over the period, then multiplied by the number of days in the fund’s most recent fiscal half-year and divided by 365.
Had the investment advisor and/or any of its affiliates not waived fees or reimbursed a portion of expenses, account value at the end of the period would have been reduced.
It is important to note that the expense amounts shown in the table are meant to highlight only ongoing costs of investing in the fund and do not reflect any transaction costs, such as sales charges, redemption fees or exchange fees. Therefore, the hypothetical examples provided may not help you determine the relative total costs of owning shares of different funds. If these transaction costs were included, your costs would have been higher.
30
Portfolio Manager’s Report – Columbia Select Small Cap Fund
Performance data quoted represents past performance and current performance may be lower or higher. Past performance is no guarantee of future results. The investment return and principal value will fluctuate so that shares, when redeemed, may be worth more or less than the original cost. Please visit www.columbiafunds.com for daily and most recent month-end performance updates.
| | |
| Net asset value per share |
| |
as of 03/31/09 ($) | | |
Class A | | 9.08 |
Class C | | 8.97 |
Class R | | 8.88 |
Class Z | | 9.10 |
| Distributions declared per share |
| |
04/01/08 – 03/31/09 ($) | | |
Class A | | 0.48 |
Class C | | 0.48 |
Class R | | 0.48 |
Class Z | | 0.48 |
For the 12-month period that ended March 31, 2009, the fund’s Class A shares returned negative 42.02% without sales charge. The fund’s benchmark, the Russell 2000 Index1, returned negative 37.50% for the same period. The fund’s return was lower than the average return of the funds in its peer group, the Lipper Small-Cap Core Funds Classification2, which was negative 38.37% for the 12-month period. Weak performance in the second fiscal quarter of the fund year hurt performance, as did stock selection in financials and technology.
Financial and technology stocks among biggest detractors
In a fund with fewer than 50 stock positions at the end of the period, any disappointments tended to be magnified, particularly in the kind of difficult market we experienced over the past year. In financial services, one of the biggest detractors from the fund’s performance was Assured Guaranty, a Bermuda-based firm that provides credit insurance to public and private borrowers. We liked this firm because it was able to maintain its high credit rating while several key competitors were having financial problems. However, following news of a possible rating downgrade, Assured Guaranty’s stock fell sharply and we sold it. Another detractor was St. Joe, which is the largest landholder in Florida. In time, we believe that the real estate market in Florida, as well as others around the country, will begin to stabilize. Therefore, we continue to own St. Joe, as well as homebuilders Meritage Homes and Ryland Group, which also were negatives for the fund during the year.
Technology was another area of weakness for the fund. Here, the biggest detractor was CommScope , a company that provides infrastructure for wireless and other communications systems. The company had relatively heavy debt at a time when credit markets were drying up. In this environment, CommScope’s share price declined sharply, and we sold it before the end of the period.
Takeovers and software holdings make positive contributions
The biggest positive contributor to fund performance was Philadelphia Consolidated Holdings, an insurance company that was acquired by a Japanese insurer at a high premium. As a result of the gain from this sale, we did some tax-loss selling to avoid a tax bill for shareholders in a period of declining returns. In this regard, we sold GFI Group, a broker of credit default swaps. While we liked the company’s prospects, it lost ground when a takeover bid was called off, and it was caught by the downdraft in financials, making it a logical candidate for tax-loss selling.
Another stock that contributed to positive performance was F5 Networks, a company that provides software and hardware for Internet connectivity systems. The company has done a good job of providing the technology enhancements that companies need to meet growing demand and has thrived despite an overall decline in technology
1 | The Russell 2000 Index measures the performance of the 2,000 smallest of the 3,000 largest US companies, based on market capitalization. Indices are not available for investment, and do not reflect sales charges, fees, brokerage commissions, taxes or other expenses of investing. Securities in the fund may not match those in an index. |
4 | Lipper Inc., a widely respected data provider in the industry, calculates an average total return (assuming reinvestment of distributions) for mutual funds with investment objectives similar to those of the fund. Lipper makes no adjustment for the effect of sales loads. |
31
Portfolio Manager’s Report (continued) – Columbia Select Small Cap Fund
| | |
| Top 5 sectors |
| |
as of 03/31/09 (%) | | |
Information Technology | | 30.1 |
Industrials | | 27.6 |
Financials | | 11.5 |
Consumer Discretionary | | 10.9 |
Consumer Cyclical | | 5.2 |
| | |
| Top 10 holdings |
| |
as of 03/31/09 (%) | | |
Manhattan Associates | | 4.0 |
Greenhill & Co. | | 4.0 |
Forrester Research | | 3.9 |
Aqua America | | 3.6 |
KBW | | 3.5 |
FTI Consulting | | 3.3 |
Regal-Beloit | | 3.2 |
Hewitt Associates | | 3.2 |
F5 Network | | 3.1 |
Shaw Group | | 3.1 |
| | |
Holdings discussed in this report |
as of 3/31/09 (%) | | |
St. Joe | | 1.7 |
Meritage Homes | | 2.2 |
Ryland Group | | 3.1 |
F5 Networks | | 3.1 |
FTI Consulting | | 3.3 |
Hewitt Associates | | 3.2 |
Power Integrations | | 3.1 |
The fund is actively managed and the composition of its portfolio will change over time. Information provided is calculated as a percentage of net assets.
spending. Perhaps more important in this economic climate, F5 has done a good job of managing its expenses and has a strong balance sheet.
Looking Ahead
While the economy and the investment markets still have a long way to go before it can be said that a recovery is taking place, we are pursuing three themes that we believe can benefit from both the current and future economic climates. The first theme focuses on beneficiaries of economic dislocation. For example, FTI Consulting works with managed bankruptcies. The company can re-capture e-mails and review documents in cases of legal disputes. It is currently working on the case of a major Ponzi scheme. Another holding, Hewitt Associates, provides information on executive compensation, a timely issue. The second theme covers housing and building-related companies. If we are at or near a bottom in housing, we believe that companies such as Meritage and Ryland should benefit. The third theme is energy and power conservation. That has led us to companies such as Power Integrations, which makes semiconductors that reduce standstill power for battery chargers. We believe that our pursuit of these themes helps position the fund to benefit from an eventual economic recovery.
Portfolio holdings and characteristics are subject to change periodically and may not be representative of current holdings and characteristics. The outlook for the fund may differ from that presented for other Columbia Funds.
Equity securities are affected by stock market fluctuations that occur in response to economic and business developments.
Stocks of small cap companies pose special risks, including possible illiquidity and greater price volatility than stocks of larger, more established companies.
32
Fund Profile – Columbia Value and Restructuring Fund
Performance data quoted represents past performance and current performance may be lower or higher. Past performance is no guarantee of future results. The investment return and principal value will fluctuate so that shares, when redeemed, may be worth more or less than the original cost. Please visit www.columbiafunds.com for daily and most recent month-end performance updates.
Summary
1-year return as of 03/31/09
| | |
| |
| | –48.51% Class A shares
(without sales charge) |
| |
| | –42.42% Russell 1000 Value Index |
| |
| | –38.09% S&P 500 Index |
|
Morningstar Style BoxTM |
|
Equity Style |
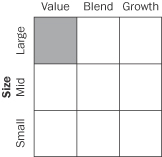
|
The Morningstar Style BoxTM reveals a fund’s investment strategy. For equity funds, the vertical axis shows the market capitalization of the stocks owned, and the horizontal axis shows investment style (value, blend or growth). Information shown is based on the most recent data provided by Morningstar. |
Summary
| n | | For the 12-month period that ended March 31, 2009, the fund’s Class A shares returned negative 48.51% without sales charge. |
n | | In an environment of contracting economic growth and falling stock prices, the fund; its benchmarks, the Russell 1000 Value Index1 and the S&P 500 Index2, and the average return of its peer group, the Lipper Multi-Cap Value Funds Classification3, lost 38% or more. |
| n | | The fund had more exposure than its benchmarks to energy, commodity-linked and interest-rate sensitive companies, which generally accounted for its underperformance. |
Portfolio Management
David J. Williams has co-managed the fund since March 2008 and the Predecessor Fund since December 1992 and has been associated with the advisor or its predecessors or affiliate organizations since 1987.
Guy W. Pope has co-managed the fund since February 2009 and has been associated with the advisor or its predecessors or affiliate organizations since 1993.
J. Nicholas Smith has co-managed the fund since February 2009 and has been associated with the advisor or its predecessors or affiliate organizations since 2005.
1 | The Russell 1000 Value Index measures the performance of those Russell 1000 Index companies with lower price-to-book ratios and lower forecasted growth values. |
2 | The Standard & Poor’s (S&P) 500 Index tracks the performance of 500 widely held, large capitalization US stocks. Indices are not available for investment, and do not reflect sales charges, fees, brokerage commissions, taxes or other expenses of investing. Securities in the fund may not match those in an index. |
3 | Lipper Inc., a widely respected data provider in the industry, calculates an average total return (assuming reinvestment of distributions) for mutual funds with investment objectives similar to those of the fund. Lipper makes no adjustment for the effect of sales loads. |
33
Performance Information – Columbia Value and Restructuring Fund
Performance data quoted represents past performance and current performance may be lower or higher. Past performance is no guarantee of future results. The investment return and principal value will fluctuate so that shares, when redeemed, may be worth more or less than the original cost. Please visit www.columbiafunds.com for daily and most recent month-end performance updates.
| | |
| Annual operating expense ratio (%)* |
| |
Class A | | 1.24 |
Class C | | 1.99 |
Class R | | 1.49 |
Class Z | | 0.99 |
| * | The annual operating expense ratio is as stated in the fund’s prospectus that is current as of the date of this report. Differences in expense ratios disclosed elsewhere in this report may result from including fee waivers and expense reimbursements as well as different time periods used in calculating the ratios. |
| | |
| Performance Growth of a $10,000 investment 04/01/99 – 03/31/09 |
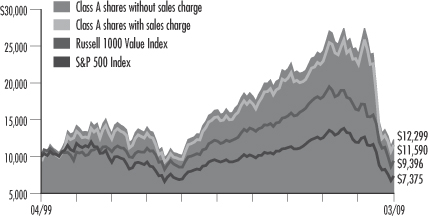
The chart above shows the change in value of a hypothetical $10,000 investment in Class A shares of Columbia Value and Restructuring Fund during the stated time period, and does not reflect the deduction of taxes that a shareholder may pay on fund distributions or on the redemption of fund shares. The Russell 1000 Value Index measures the performance of those Russell 1000 Index companies with lower price-to-book ratios and lower forecasted growth values. The Standard & Poor’s (S&P) 500 Index tracks the performance of 500 widely held, large-capitalization US stocks. Indices are not available for investment, and do not reflect sales charges, fees, brokerage commissions, taxes or other expenses of investing. Securities in the fund may not match those in an index.
| | | | |
| Performance of a $10,000 investment 04/01/99 – 03/31/09 ($) |
| | |
| Sales charge | | without | | with |
Class A | | 12,299 | | 11,590 |
Class C | | 12,166 | | 12,166 |
Class R | | 12,087 | | n/a |
Class Z | | 12,325 | | n/a |
| | | | | | | | | | | | |
| Average annual total return as of 03/31/09 (%) | | | | |
| | | | |
| Share class | | A | | C | | R | | Z |
| Inception | | 09/28/07 | | 09/28/07 | | 12/31/04 | | 12/31/92 |
| Sales charge | | without | | with | | without | | with | | without | | without |
1-year | | –48.51 | | –51.48 | | –48.89 | | –49.40 | | –48.65 | | –48.39 |
5-year | | –5.51 | | –6.63 | | –5.72 | | –5.72 | | –5.84 | | –5.47 |
10-year | | 2.09 | | 1.49 | | 1.98 | | 1.98 | | 1.91 | | 2.11 |
The “with sales charge” returns include the maximum initial sales charge of 5.75% for Class A shares and the applicable contingent deferred sales charge of 1.00% for Class C shares for the first year only. The “without sales charge” returns do not include the effect of sales charges. If they had, returns would be lower. The Fund commenced operations on March 31, 2008. The returns of the Class A and Class C shares shown include the returns of Class A shares or Class C shares, as applicable, of Value and Restructuring Fund, the predecessor to the Fund and a series of Excelsior Funds, Inc. (the “Predecessor Fund”), for periods after September 27, 2007, and include the returns of Shares class shares of the Predecessor Fund for periods prior to September 28, 2007. The returns shown reflect applicable sales charges, but have not been adjusted to reflect differences in expenses. If differences in expenses were reflected, the returns shown for the period prior to September 28, 2007 would be lower. The returns of the Class R shares shown include the returns of Retirement Shares class shares of the Predecessor Fund for periods after December 30, 2004, and include the returns of Shares class shares of the Predecessor Fund for periods prior to December 31, 2004. The returns shown reflect that Class R shares are sold without sales charges, but have not been adjusted to reflect differences in expenses. If differences in expenses were reflected, the returns shown for all periods would be lower. The returns of the Class Z shares shown for periods prior to March 31, 2008 are those of the Shares class shares of the Predecessor Fund. The returns of Class Z shares shown have not been adjusted to reflect differences in expenses. If differences in expenses were reflected, the returns shown for all periods would be higher.
Inception date refers to the date on which the Predecessor Fund class commenced operations.
Performance results reflect any fee waivers or reimbursements of fund expenses by the investment advisor and/or any of its affiliates. Absent these fee waivers or expense reimbursement arrangements, performance results would have been lower.
All results shown assume the reinvestment of distributions. Class Z shares are sold at net asset value with no distribution and service (Rule 12b-1) fees. Class Z shares have limited eligibility and the investment minimum requirements may vary. Please see the fund’s prospectus for details. Performance for different share classes will vary based on differences in sales charges and fees associated with each class.
The tables do not reflect the deduction of taxes that a shareholder may pay on fund distributions or on the redemption of fund shares.
34
Understanding Your Expenses – Columbia Value and Restructuring Fund
Estimating your actual expenses
To estimate the expenses that you paid over the period, first you will need your account balance at the end of the period:
| | n | | For shareholders who receive their account statements from Columbia Management Services, Inc., your account balance is available online at www.columbiafunds.com or by calling Shareholder Services at 800.345.6611. | |
| | n | | For shareholders who receive their account statements from their financial intermediary, contact your financial intermediary to obtain your account balance. | |
| | 1. | Divide your ending account balance by $1,000. For example, if an account balance was $8,600 at the end of the period, the result would be 8.6. | |
| | 2. | In the section of the table below titled “Expenses paid during the period,” locate the amount for your share class. You will find this number in the column labeled “Actual.” Multiply this number by the result from step 1. Your answer is an estimate of the expenses you paid on your account during the period. | |
If the value of your account falls below the minimum initial investment requirement applicable to you, your account generally will be subject to a $20 annual fee. This fee is not included in the accompanying table. If you are subject to the fee, keep it in mind when you are estimating the ongoing expenses of investing in the fund and when comparing the expenses of this fund with other funds.
As a fund shareholder, you incur two types of costs. There are transaction costs, which generally include sales charges on purchases and may include redemption fees or exchange fees. There are also ongoing costs, which generally include investment advisory fees, distribution and service (Rule 12b-1) fees and other fund expenses. The information on this page is intended to help you understand the ongoing costs of investing in the fund and to compare these costs with the ongoing costs of investing in other mutual funds.
Analyzing your fund’s expenses by share class
To illustrate these ongoing costs, we have provided an example and calculated the expenses paid by investors in each share class during the period. The information in the following table is based on an initial investment of $1,000, which is invested at the beginning of the period and held for the entire period. Expense information is calculated two ways and each method provides you with different information. The amount listed in the “Actual” column is calculated using the fund’s actual operating expenses and total return for the period. The amount listed in the “Hypothetical” column for each share class assumes that the return each year is 5% before expenses and is calculated based on the fund’s actual operating expenses. You should not use the hypothetical account values and expenses to estimate either your actual account balance at the end of the period or the expenses you paid during this period.
Compare with other funds
Since all mutual funds are required to include the same hypothetical calculations about expenses in shareholder reports, you can use this information to compare the ongoing cost of investing in the fund with other funds. To do so, compare the 5% hypothetical example with the 5% hypothetical examples that appear in the shareholder reports of other funds. As you compare hypothetical examples of other funds, it is important to note that hypothetical examples are meant to highlight the ongoing costs of investing in a fund and do not reflect any transaction costs, such as sales charges, redemption fees or exchange fees.
| | | | | | | | | | | | | | |
| 10/01/08 – 03/31/09 | | | | | | |
| | | | |
| | | Account value at the
beginning of the period ($) | | Account value at the
end of the period ($) | | Expenses paid
during the period ($) | | Fund’s annualized
expense ratio (%) |
| | | Actual | | Hypothetical | | Actual | | Hypothetical | | Actual | | Hypothetical | | Actual |
Class A | | 1,000.00 | | 1,000.00 | | 626.88 | | 1,019.25 | | 4.62 | | 5.74 | | 1.14 |
Class C | | 1,000.00 | | 1,000.00 | | 624.48 | | 1,015.51 | | 7.65 | | 9.50 | | 1.89 |
Class R | | 1,000.00 | | 1,000.00 | | 625.98 | | 1,018.00 | | 5.63 | | 6.99 | | 1.39 |
Class Z | | 1,000.00 | | 1,000.00 | | 627.52 | | 1,020.49 | | 3.61 | | 4.48 | | 0.89 |
Expenses paid during the period are equal to the annualized expense ratio for the share class, multiplied by the average account value over the period, then multiplied by the number of days in the fund’s most recent fiscal half-year and divided by 365.
Had the investment advisor and/or any of its affiliates not waived fees or reimbursed a portion of expenses, account value at the end of the period would have been reduced.
It is important to note that the expense amounts shown in the table are meant to highlight only ongoing costs of investing in the fund and do not reflect any transaction costs, such as sales charges, redemption fees or exchange fees. Therefore, the hypothetical examples provided may not help you determine the relative total costs of owning shares of different funds. If these transaction costs were included, your costs would have been higher.
35
Portfolio Managers’ Report – Columbia Value and Restructuring Fund
Performance data quoted represents past performance and current performance may be lower or higher. Past performance is no guarantee of future results. The investment return and principal value will fluctuate so that shares, when redeemed, may be worth more or less than the original cost. Please visit www.columbiafunds.com for daily and most recent month-end performance updates.
| | |
Net asset value per share |
| |
as of 03/31/09 ($) | | |
Class A | | 26.51 |
Class C | | 26.51 |
Class R | | 26.50 |
Class Z | | 26.49 |
| | |
Distributions declared per share |
| |
04/01/08 – 03/31/09 ($) | | |
Class A | | 0.53 |
Class C | | 0.22 |
Class R | | 0.42 |
Class Z | | 0.63 |
For the 12-month period that ended March 31, 2009, the fund’s Class A shares returned negative 48.51% without sales charge. The fund underperformed its benchmarks, the Russell 1000 Value Index1 and the S&P 500 Index2, which returned negative 42.42% and negative 38.09%, respectively, and the average return of its peer group, the Lipper Multi-Cap Value Funds Classification3, which was negative 40.11% for the 12-month period.
On February 20, 2009, the fund’s management team changed. Guy W. Pope and J. Nicholas Smith joined David J. Williams as co-managers of the fund.
Slumping market provided opportunity to upgrade
The fund’s long-term focus on lower-priced stocks of companies going through reorganizations was penalized during the 12-month period covered by this report amid increasing worries about the weakening of the global economy. Irrespective of their future potential, out-of-favor stocks generated little interest in the slumping market. In particular, a decision to overweight energy, materials and industrials relative to the fund’s benchmarks hurt performance as the market turned away from companies exposed to volatile commodity prices and the cyclical economic downturn. At the same time, deteriorating credit conditions dampened market enthusiasm for several interest-rate sensitive holdings in the financials sector.
As the period progressed, we took advantage of falling market prices to upgrade the overall quality of portfolio holdings, finding an increasing number of financially stronger companies with solid balance sheets whose prices had fallen to attractive levels. In conducting our analysis of lower-priced, out-of-favor corporations that were undergoing restructuring, we focused on those companies that proactively sought to gain competitive advantage, rather than on enterprises that were reorganizing to avoid bankruptcy and merely survive.
Defensive holdings held up better in downturn
In a highly volatile, risk-averse environment, certain of the fund’s investments in defensive corporations noted for stable earnings held up better than their sector averages — even if most delivered negative returns. These included three health care corporations: pharmaceutical firm Bristol-Myers Squibb; medical supply company Baxter International; and AmerisourceBergen , a pharmacy benefits manager. In consumer staples, strong results came from Dean Foods, a leading dairy, and Lorillard, a tobacco firm. PetroHawk Energy, a natural gas exploration corporation, performed relatively well, as did TJX Companies, a retailer focusing on the more value-conscious consumer. International Business Machines led among technology holdings, as investors were attracted by its strong financial position. Copa Holdings
1 | The Russell 1000 Value Index measures the performance of those Russell 1000 Index companies with lower price-to-book ratios and lower forecasted growth values. |
2 | The Standard & Poor’s (S&P) 500 Index tracks the performance of 500 widely held, large capitalization US stocks. Indices are not available for investment, and do not reflect sales charges, fees, brokerage commissions, taxes or other expenses of investing. Securities in the fund may not match those in an index. |
3 | Lipper Inc., a widely respected data provider in the industry, calculates an average total return (assuming reinvestment of distributions) for mutual funds with investment objectives similar to those of the fund. Lipper makes no adjustment for the effect of sales loads. |
36
Portfolio Managers’ Report (continued) – Columbia Value and Restructuring Fund
SA, a Panamanian airline, performed relatively well as it benefited from falling fuel costs. ACE, a property and casualty reinsurer, outperformed in a difficult period for many financial corporations.
Underperforming stocks sold during portfolio upgrade
Many of the holdings that produced the most disappointing results for the fund were eliminated from the portfolio during the period. They included: Smurfit-Stone Container, in the materials sector; Centex, a homebuilder; and Brazilian airline GOL Linhas Aereas Inteligentes S.A. In the weak-performing financials sector, investments in Genworth Financial and Ambac Financial Group were sold. However, we continued to hold two other underperformers that we believed offered better long-term potential: media company CBS and Dutch airline AerCap Holdings NV.
Quality becomes more important
We believe that the fund’s upgraded portfolio is well positioned for an eventual market recovery. The deep slump in equity prices provided an important opportunity suited to our investment approach, which focuses on stock valuations. Measured by price-to-earnings ratios, stocks in the fund’s upgraded portfolio were priced 20% cheaper than the overall S&P 500 Index, on average, at the end of the past fiscal year. Yet, we estimate these companies have the potential to produce superior earnings growth and better returns on capital than the overall market. Further, we believe that the overall stock market itself is currently among the cheapest of asset classes, making the low valuations of the fund’s holdings even more advantageous, especially given our expectation that corporate earnings have the potential to rebound from their current cyclical lows.
Portfolio holdings and characteristics are subject to change periodically and may not be representative of current holdings and characteristics. The outlook for the fund may differ from that presented for other Columbia Funds.
Equity securities are affected by stock market fluctuations that occur in response to economic and business developments.
Value stocks are securities of companies that may have experienced adverse business or industry developments or may be subject to special risks that have caused the stocks to be out of favor. The price of its stock may not approach the value the managers have placed on it.
| | |
Top 5 sectors |
| |
as of 03/31/09 (%) | | |
Energy | | 23.8 |
Financials | | 16.1 |
Industrials | | 15.1 |
Materials | | 10.8 |
Information Technology | | 8.8 |
| | |
| Top 10 holdings |
| |
as of 03/31/09 (%) | | |
Lorillard | | 5.3 |
Petroleo Brasileiro SA | | 5.1 |
Harris | | 3.4 |
International Business Machines | | 3.4 |
Union Pacific | | 3.4 |
ACE | | 3.2 |
America Movil SAB de CV | | 3.1 |
ConocoPhillips | | 2.6 |
CONSOL Energy | | 2.6 |
Noble Energy | | 2.5 |
| | |
| Holdings discussed in this report |
| |
as of 3/31/09 (%) | | |
Bristol-Myers Squibb | | 2.2 |
Baxter International | | 2.2 |
AmerisourceBergen | | 1.8 |
Dean Foods | | 1.2 |
Lorillard | | 5.3 |
PetroHawk Energy | | 1.7 |
TJX Companies | | 1.9 |
International Business Machines | | 3.4 |
Copa Holdings SA | | 1.3 |
ACE | | 3.2 |
CBS | | 0.3 |
AerCap Holdings NV | | 0.4 |
The fund is actively managed and the composition of its portfolio will change over time. Information provided is calculated as a percentage of net assets.
37
Fund Profile – Columbia Emerging Markets Fund
Performance data quoted represents past performance and current performance may be lower or higher. Past performance is no guarantee of future results. The investment return and principal value will fluctuate so that shares, when redeemed, may be worth more or less than the original cost. Please visit www.columbiafunds.com for daily and most recent month-end performance updates.
Summary
1-year return as of 03/31/09
| | |
| |
| | –49.44% Class A shares
(without sales charge) |
| |
| | –46.90% MSCI Emerging
Markets Index |
| |
| | –46.51% MSCI EAFE Index |
|
Morningstar Style BoxTM |
|
Equity Style |
|
The Morningstar Style BoxTM reveals a fund’s investment strategy. For equity funds, the vertical axis shows the market capitalization of the stocks owned, and the horizontal axis shows investment style (value, blend or growth). Information shown is based on the most recent data provided by Morningstar.
Summary
| n | | For the 12-month period that ended March 31, 2009, the fund’s Class A shares returned negative 49.44% without sales charge. |
n | | In an environment of contracting economic growth and falling stock prices, the fund, its benchmarks, the MSCI Emerging Markets Index and MSCI EAFE Index1 and the average return of its peer group, the Lipper Emerging Markets Fund Classification2, all declined more than 46%. |
| n | | Stock selection generally accounted for the fund’s shortfall relative to its benchmarks. |
Portfolio Management
Dara J. White is lead manager of the fund and has co-managed the fund since March 2008 and the predecessor fund since February 2008 and has been associated with the advisor or its predecessors or affiliate organizations since 2006.
Jasmine (Weili) Huang has co-managed the fund since March 2008 and the predecessor fund since January 2008 and has been associated with the advisor or its predecessors or affiliate organizations since 2003.
Fred Copper has co-managed the fund since March 2008 and the predecessor fund since January 2008 and has been associated with the advisor or its predecessors or affiliate organizations since 2005.
Robert B. Cameron has co-managed the fund since December 2008 and has been associated with the advisor or its predecessors or affiliate organizations since 2008.
1 | The Morgan Stanley Capital International (MSCI) Emerging Markets Index is a widely accepted index composed of a sample of companies from 25 countries representing global emerging stock markets. The Morgan Stanley Capital International (MSCI) Europe, Australasia, Far East (EAFE) Index is a free float-adjusted market capitalization index that is designed to measure developed market equity performance, excluding the US and Canada. Indices are not available for investment, and do not reflect sales charges, fees, brokerage commissions, taxes or other expenses of investing. Securities in the fund may not match those in an index. |
2 | Lipper Inc., a widely respected data provider in the industry, calculates an average total return (assuming reinvestment of distributions) for mutual funds with investment objectives similar to those of the fund. Lipper makes no adjustment for the effect of sales loads. |
38
Performance Information – Columbia Emerging Markets Fund
|
| Performance of a $10,000 investment 04/01/99 – 03/31/09 |
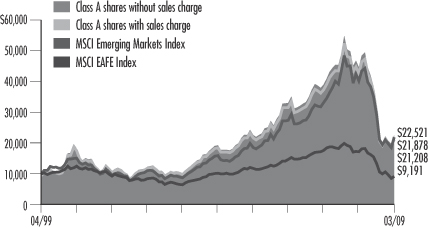
The chart above shows the change in value of a hypothetical $10,000 investment in Class A shares of Columbia Emerging Markets Fund during the stated time period, and does not reflect the deduction of taxes that a shareholder may pay on fund distributions or on the redemption of fund shares. The Morgan Stanley Capital International (MSCI) Emerging Markets Index is a widely accepted index composed of a sample of companies from 25 countries representing global emerging stock markets. The Morgan Stanley Capital International (MSCI) Europe, Australasia, Far East (EAFE) Index is a free float-adjusted market capitalization index that is designed to measure developed market equity performance, excluding the US and Canada. Indices are not available for investment, and do not reflect sales charges, fees, brokerage commissions, taxes or other expenses of investing. Securities in the fund may not match those in an index.
| | | | |
| Performance of a $10,000 investment 04/01/99 – 03/31/09 ($) |
| | |
| Sales charge | | without | | with |
Class A | | 22,521 | | 21,208 |
Class C | | 22,275 | | 22,275 |
Class Z | | 22,528 | | n/a |
| | | | | | | | | | |
| Average annual total return as of 03/31/09 (%) |
| | | |
| Share class | | A | | C | | Z |
| Inception | | 09/28/07 | | 09/28/07 | | 01/02/98 |
| Sales charge | | without | | with | | without | | with | | without |
1-year | | –49.44 | | –52.34 | | –49.82 | | –50.25 | | –49.37 |
5-year | | 3.11 | | 1.89 | | 2.88 | | 2.88 | | 3.12 |
10-year | | 8.46 | | 7.81 | | 8.34 | | 8.34 | | 8.46 |
Performance data quoted represents past performance and current performance may be lower or higher. Past performance is no guarantee of future results. The investment return and principal value will fluctuate so that shares, when redeemed, may be worth more or less than the original cost. Please visit www.columbiafunds.com for daily and most recent month-end performance updates.
| | |
| Annual operating expense ratio (%)* |
| |
Class A | | 1.77 |
Class C | | 2.52 |
Class Z | | 1.52 |
| * | The annual operating expense ratio is as stated in the fund’s prospectus that is current as of the date of this report. Differences in expense ratios disclosed elsewhere in this report may result from including fee waivers and expense reimbursements as well as different time periods used in calculating the ratios. |
The “with sales charge” returns include the maximum initial sales charge of 5.75% for Class A shares and the applicable contingent deferred sales charge of 1.00% for Class C shares for the first year only. The “without sales charge” returns do not include the effect of sales charges. If they had, returns would be lower.
The Fund commenced operations on March 31, 2008. The returns of the Class A and C shares shown include the returns of Class A shares or Class C shares, as applicable, of Emerging Markets Fund, the predecessor to the Fund and a series of Excelsior Funds, Inc. (the “Predecessor Fund”), for periods after September 27, 2007, and include the returns of Shares class shares of the Predecessor Fund for periods prior to September 28, 2007. The returns shown reflect applicable sales charges, but have not been adjusted to reflect differences in expenses. If differences in expenses were reflected, the returns shown for the period prior to September 28, 2007 would be lower. The returns of the Class Z shares shown for periods prior to March 31, 2008 are those of the Shares class shares of the Predecessor Fund. The returns shown reflect that Class Z shares are sold without sales charges, but have not been adjusted to reflect differences in expenses. If differences in expenses were reflected, the returns shown for all periods would be higher. The inception of the Predecessor Fund is January 2, 1998.
Inception date refers to the date on which the Predecessor Fund class commenced operations.
Performance results reflect any fee waivers or reimbursements of fund expenses by the investment advisor and/or any of its affiliates. Absent these fee waivers or expense reimbursement arrangements, performance results would have been lower.
All results shown assume reinvestment of distributions. Class Z shares are sold at net asset value with no distribution and service (Rule 12b-1) fees. Class Z shares have limited eligibility and the investment minimum requirements may vary. Please see the fund’s prospectus for details. Performance for different share classes will vary based on differences in sales charges and fees associated with each class.
The tables do not reflect the deduction of taxes that a shareholder may pay on fund distributions or on the redemption of fund shares.
39
Understanding Your Expenses – Columbia Emerging Markets Fund
Estimating your actual expenses
To estimate the expenses that you paid over the period, first you will need your account balance at the end of the period:
| | n | | For shareholders who receive their account statements from Columbia Management Services, Inc., your account balance is available online at www.columbiafunds.com or by calling Shareholder Services at 800.345.6611. | |
| | n | | For shareholders who receive their account statements from their financial intermediary, contact your financial intermediary to obtain your account balance. | |
| | 1. | Divide your ending account balance by $1,000. For example, if an account balance was $8,600 at the end of the period, the result would be 8.6. | |
| | 2. | In the section of the table below titled “Expenses paid during the period,” locate the amount for your share class. You will find this number in the column labeled “Actual.” Multiply this number by the result from step 1. Your answer is an estimate of the expenses you paid on your account during the period. | |
If the value of your account falls below the minimum initial investment requirement applicable to you, your account generally will be subject to a $20 annual fee. This fee is not included in the accompanying table. If you are subject to the fee, keep it in mind when you are estimating the ongoing expenses of investing in the fund and when comparing the expenses of this fund with other funds.
As a fund shareholder, you incur two types of costs. There are transaction costs, which generally include sales charges on purchases and may include redemption fees or exchange fees. There are also ongoing costs, which generally include investment advisory fees, distribution and service (Rule 12b-1) fees and other fund expenses. The information on this page is intended to help you understand the ongoing costs of investing in the fund and to compare these costs with the ongoing costs of investing in other mutual funds.
Analyzing your fund’s expenses by share class
To illustrate these ongoing costs, we have provided an example and calculated the expenses paid by investors in each share class during the period. The information in the following table is based on an initial investment of $1,000, which is invested at the beginning of the period and held for the entire period. Expense information is calculated two ways and each method provides you with different information. The amount listed in the “Actual” column is calculated using the fund’s actual operating expenses and total return for the period. The amount listed in the “Hypothetical” column for each share class assumes that the return each year is 5% before expenses and is calculated based on the fund’s actual operating expenses. You should not use the hypothetical account values and expenses to estimate either your actual account balance at the end of the period or the expenses you paid during this period.
Compare with other funds
Since all mutual funds are required to include the same hypothetical calculations about expenses in shareholder reports, you can use this information to compare the ongoing costs of investing in the fund with other funds. To do so, compare the 5% hypothetical example with the 5% hypothetical examples that appear in the shareholder reports of other funds. As you compare hypothetical examples of other funds, it is important to note that hypothetical examples are meant to highlight the ongoing costs of investing in a fund and do not reflect any transaction costs, such as sales charges, redemption fees or exchange fees.
| | | | | | | | | | | | | | |
| 10/01/08 – 03/31/09 | | | | | | | | | | |
| | | | |
| | | Account value at the
beginning of the period ($) | | Account value at the
end of the period ($) | | Expenses paid
during the period ($) | | Fund’s annualized
expense ratio (%) |
| | | Actual | | Hypothetical | | Actual | | Hypothetical | | Actual | | Hypothetical | | Actual |
Class A | | 1,000.00 | | 1,000.00 | | 721.32 | | 1,015.21 | | 8.37 | | 9.80 | | 1.95 |
Class C | | 1,000.00 | | 1,000.00 | | 719.52 | | 1,011.47 | | 11.57 | | 13.54 | | 2.70 |
Class Z | | 1,000.00 | | 1,000.00 | | 721.32 | | 1,016.45 | | 7.30 | | 8.55 | | 1.70 |
Expenses paid during the period are equal to the annualized expense ratio for the share class, multiplied by the average account value over the period, then multiplied by the number of days in the fund’s most recent fiscal half-year and divided by 365.
Had the investment advisor and/or any of its affiliates not waived fees or reimbursed a portion of expenses, account value at the end of the period would have been reduced.
It is important to note that the expense amounts shown in the table are meant to highlight only ongoing costs of investing in the fund and do not reflect any transaction costs, such as sales charges, redemption fees or exchange fees. Therefore, the hypothetical examples provided may not help you determine the relative total costs of owning shares of different funds. If these transaction costs were included, your costs would have been higher.
40
Portfolio Managers’ Report – Columbia Emerging Markets Fund
Performance data quoted represents past performance and current performance may be lower or higher. Past performance is no guarantee of future results. The investment return and principal value will fluctuate so that shares, when redeemed, may be worth more or less than the original cost. Please visit www.columbiafunds.com for daily and most recent month-end performance updates.
| | |
| Net asset value per share |
| |
as of 03/31/09 ($) | | |
Class A | | 6.42 |
Class C | | 6.36 |
Class Z | | 6.42 |
| | |
| Distributions declared per share |
| |
04/01/08 – 03/31/09 ($) | | |
Class A | | 2.26 |
Class C | | 2.26 |
Class Z | | 2.26 |
For the 12-month period that ended March 31, 2009, the fund’s Class A shares returned negative 49.44% without sales charge. The fund’s benchmarks, the MSCI Emerging Markets Index and the MSCI EAFE Index, returned negative 46.90% and negative 46.51%, respectively1. The fund held up slightly better than the average fund in its peer group, the Lipper Emerging Markets Funds Classification2, which returned negative 50.27%, for the 12-month period. Stock selection generally accounted for the fund’s shortfall relative to its benchmarks.
A challenging period for emerging stock markets
Emerging market equities were buffeted as the global economy fell into recession during the period. All sectors and all emerging market stock markets produced negative performance, with the deepest losses occurring in economically sensitive areas such as energy, industrials and materials, as well as in economies with the greatest leverage or debt.
Despite the negative environment, we remained focused on stock selection, as we searched for individual companies with the potential to benefit from longer-term trends, including the expansion of the middle class and the spread of industrialization. Country selection helped support results. We had more exposure to China than the MSCI Emerging Market Index, and less exposure than the highly leveraged economies in Eastern Europe, including Russia, Poland and Hungary.
The benefits of country selection were offset, however, by stock selection across a number of different sectors. Poor performance from commodity-based companies, including Brazilian meat products enterprises; Marfrig Frigorificos e Comercio de Alimentos, a beef processor, and Sadia, a chicken processor, hampered the fund’s returns. Both corporations encountered difficulties obtaining access to financing when a crisis crippled credit markets in the fall of 2008. In the energy sector, Indonesian coal-producer Bumi Resources also faced liquidity problems that worsened when global demand for coal shrank. We sold all three positions during the period.
Infrastructure investments helped drive selections in China
The efforts of the Chinese government to stimulate a slowing domestic economy resulted in strong relative performance from two fund holdings: China Vanke , a property company in the financials sector, and China South Locomotive and Rolling Stock, an industrials corporation producing railroad cars.
Among positions in Brazil, All America Latina Logistica, a railroad operator, enjoyed solid positive results. All America Latina Logistica profited from increased shipment of iron ore and agricultural products from inland locations to Brazilian coastal ports. Redecard, an electronic transaction processor, benefited from the migration from cash
1 | The Morgan Stanley Capital International (MSCI) Emerging Markets Index is a widely accepted index composed of a sample of companies from 25 countries representing global emerging stock markets. The Morgan Stanley Capital International (MSCI) Europe, Australasia, Far East (EAFE) Index is a free float-adjusted market capitalization index that is designed to measure developed market equity performance, excluding the US and Canada. Indices are not available for investment, and do not reflect sales charges, fees, brokerage commissions, taxes or other expenses of investing. Securities in the fund may not match those in an index. |
2 | Lipper Inc., a widely respected data provider in the industry, calculates an average total return (assuming reinvestment of distributions) for mutual funds with investment objectives similar to those of the fund. Lipper makes no adjustment for the effect of sales loads. |
41
Portfolio Managers’ Report (continued) – Columbia Emerging Markets Fund
| | |
| Top 5 countries |
| |
as of 03/31/09 (%) | | |
Brazil | | 16.5 |
China | | 14.8 |
South Korea | | 11.0 |
South Africa | | 7.8 |
Taiwan | | 7.5 |
| | |
| Top 10 holdings |
| |
as of 03/31/09 (%) | | |
Petroleo Brasileiro | | 5.1 |
Samsung Electronics | | 3.7 |
Teva Pharmaceuticals Industries | | 3.3 |
China Mobile | | 3.2 |
China Life Insurance | | 2.8 |
Cia Vale do Rio Dolce | | 2.6 |
Taiwan Semiconductor | | 2.6 |
Itau Unibanco Multiplo | | 2.5 |
Chunghwa Telecom | | 2.3 |
Sasol | | 2.3 |
| | |
| Holdings discussed in this report |
| |
as of 3/31/09 (%) | | |
China Vanke | | 1.1 |
China South Locomotive and Rolling Stock | | 0.5 |
All America Latina Logistica | | 0.6 |
Redecard | | 1.3 |
The fund is actively managed and the composition of its portfolio will change over time. Information provided is calculated as a percentage of net assets.
to credit card transactions. Although its shares lost ground, they held up better than the sector overall.
Government stimulus programs should reinvigorate markets
We believe that the implementation of recently introduced government fiscal and monetary stimulus programs in China, India, Brazil and throughout the emerging markets and the developed world should reinvigorate growth. Although we cannot predict when these programs will start to work, recent less negative economic reports may be early signals of stabilization. When stabilization in the developed world occurs, the growth prospects of emerging markets should return to the spotlight.
By market, we intend to focus on those countries that we believe have the ability and the determination to promote growth. We have overweighted China and Brazil, two countries with positive demographic trends, low household debt and growing middle classes eager to improve their standards of living. Conversely, we continue to de-emphasize the more leveraged economies in Eastern Europe.
By company, we intend to maintain our emphasis on corporations that we believe can benefit from longer-term secular trends. We favor firms with relatively low debt, sustainable competitive advantages and solid management teams that have the ability to gain a greater share of their markets. After the dramatic market downfalls of the past year, we seek attractive companies selling at low valuations and with the potential to perform well when demand normalizes, even though we realize that it may take time to exploit these opportunities fully.
Portfolio holdings and characteristics are subject to change periodically and may not be representative of current holdings and characteristics. The outlook for the fund may differ from that presented for other Columbia Funds.
International investing may involve certain risks, including currency fluctuations, risks associated with possible differences in financial accounting standards and other monetary and political risks. Significant levels of foreign taxes, including potentially confiscatory levels of taxation and withholding taxes, may also apply to some foreign investments.
Equity securities are affected by stock market fluctuations that occur in response to economic and business developments.
Investing in emerging markets may involve greater risks than investing in more developed countries. In addition, concentration of investments in a single region may result in greater volatility.
42
Fund Profile – Columbia International Growth Fund
Performance data quoted represents past performance and current performance may be lower or higher. Past performance is no guarantee of future results. The investment return and principal value will fluctuate so that shares, when redeemed, may be worth more or less than the original cost. Please visit www.columbiafunds.com for daily and most recent month-end performance updates.
Summary
1-year return as of 03/31/09
| | |
| |
| | –47.91% Class A shares
(without sales charge) |
| |
| | –45.36% MSCI EAFE Growth Index |
| |
| | –46.18% MSCI All Country World ex U.S. Index |
| |
| | –46.51% MSCI EAFE Index |
|
Morningstar Style BoxTM |
|
Equity Style |
|
The Morningstar Style BoxTM reveals a fund’s investment strategy. For equity funds, the vertical axis shows the market capitalization of the stocks owned, and the horizontal axis shows investment style (value, blend or growth). Information shown is based on the most recent data provided by Morningstar.
Summary
| n | | For the 12-month period that ended March 31, 2009, the fund’s Class A shares returned negative 47.91% without sales charge. |
n | | In an environment of contracting economic growth and falling stock prices, the fund, its benchmark, the MSCI EAFE Growth Index1, and the average return of its peer group, the Lipper International Multi-Cap Growth Funds Classification,2 all lost more than 45%. |
| n | | Throughout most of the period, when compared to it’s benchmark, the fund was overweight in the energy and industrials sectors. This strategy detracted from return. Stock selection in the consumer staples, utilities and financials areas was a plus for the fund. |
Portfolio Management
Timothy R. Anderson, lead manager, has co-managed the fund since March 2008 and the Predecessor Fund since January 2008 and has been associated with the advisor or its predecessors or affiliate organizations since 2006.
Fred Copper has co-managed the fund since March 2008 and the Predecessor Fund since July 2007 and has been associated with the advisor or its predecessors or affiliate organizations since 2005.
Jasmine (Weili) Huang has co-managed the fund since March 2008 and the Predecessor Fund since January 2008 and has been associated with the advisor or its predecessors or affiliate organizations since 2003.
Daisuke Nomoto has co-managed the fund since March 2008 and the Predecessor Fund since January 2008 and has been associated with the advisor or its predecessors or affiliate organizations since 2005.
Paul J. DiGiacomo has co-managed the fund since March 2008 and the Predecessor Fund since January 2008 and has been associated with the advisor or its predecessors or affiliate organizations since 2006.
1 | The Morgan Stanley Capital International (MSCI) Europe, Australasia, Far East (EAFE) Growth Index is a subset of the MSCI EAFE Index, and constituents of the index include securities from Europe, Australasia and the Far East. The index generally represents approximately 50% of the free float-adjusted market capitalization of the MSCI EAFE Index, and consists of those securities classified by Morgan Stanley Capital International (MSCI) as most representing the growth style, such as higher forecasted growth rates, lower book value-to-price ratios, lower forward earnings-to-price ratios and lower dividend yields than securities representing the value style. Indices are not available for investment, and do not reflect sales charges, fees, brokerage commissions, taxes or other expenses of investing. Securities in the fund may not match those in an index. |
2 | Lipper Inc., a widely respected data provider in the industry, calculates an average total return (assuming reinvestment of distributions) for mutual funds with investment objectives similar to those of the fund. Lipper makes no adjustment for the effect of sales loads. |
43
Performance Information – Columbia International Growth Fund
Performance data quoted represents past performance and current performance may be lower or higher. Past performance is no guarantee of future results. The investment return and principal value will fluctuate so that shares, when redeemed, may be worth more or less than the original cost. Please visit www.columbiafunds.com for daily and most recent month-end performance updates.
| | |
| Annual operating expense ratio (%)* |
| |
Class A | | 1.54 |
Class C | | 2.29 |
Class Z | | 1.29 |
| * | The annual operating expense ratio is as stated in the fund’s prospectus that is current as of the date of this report. Differences in expense ratios disclosed elsewhere in this report may result from including fee waivers and expense reimbursements as well as different time periods used in calculating the ratios. |
| | |
| Performance of a $10,000 investment 04/01/99 – 03/31/09 |
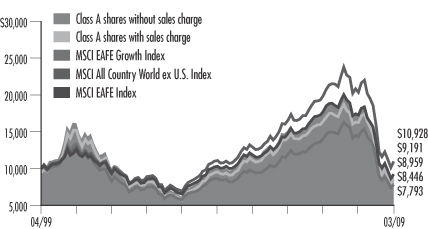
The chart above shows the change in value of a hypothetical $10,000 investment in Class A shares of Columbia International Growth Fund during the stated time period, and does not reflect the deduction of taxes that a shareholder may pay on fund distributions or on the redemption of fund shares. The Morgan Stanley Capital International (MSCI) Europe, Australasia, Far East (EAFE) Growth Index is a subset of the MSCI EAFE Index, and constituents of the index include securities from Europe, Australasia and the Far East. The index generally represents approximately 50% of the free float-adjusted market capitalization of the MSCI EAFE Index, and consists of those securities classified by Morgan Stanley Capital International (MSCI) as most representing the growth style, such as higher forecasted growth rates, lower book value-to-price ratios, lower forward earnings-to-price ratios and lower dividend yields than securities representing the value style. The MSCI All Country (AC) World ex U.S. Index tracks global stock market performance that includes developed and emerging markets but excludes the U.S. The MSCI Europe, Australasia, Far East (EAFE) Index is a free float-adjusted market capitalization index that is designed to measure developed market equity performance, excluding the US and Canada. Indices are not available for investment, and do not reflect sales charges, fees, brokerage commissions, taxes or other expenses of investing. Securities in the fund may not match those in an index.
| | | | |
| Performance of a $10,000 investment 04/01/99 – 03/31/09 ($) |
| | |
| Sales charge | | without | | with |
Class A | | 8,959 | | 8,446 |
Class C | | 8,891 | | 8,891 |
Class Z | | 8,978 | | n/a |
| | | | | | | | | | |
| Average annual total return as of 03/31/09 (%) |
| | | |
| Share class | | A | | C | | Z |
| Inception | | 03/31/08 | | 03/31/08 | | 07/21/87 |
| Sales charge | | without | | with | | without | | with | | without |
1-year | | –47.91 | | –50.92 | | –48.31 | | –48.79 | | –47.80 |
5-year | | –2.42 | | –3.58 | | –2.57 | | –2.57 | | –2.38 |
10-year | | –1.09 | | –1.67 | | –1.17 | | –1.17 | | –1.07 |
The “with sales charge” returns include the maximum initial sales charge of 5.75% for Class A shares and the applicable contingent deferred sales charge of 1.00% for Class C shares for the first year only. The “without sales charge” returns do not include the effect of sales charges. If they had, returns would be lower.
The Fund commenced operations on March 31, 2008. The returns of the Class A and Class C shares shown for periods prior to March 31, 2008 are those of the Shares class shares of International Fund, the predecessor to the Fund and a series of Excelsior Funds, Inc. (the “Predecessor Fund”). The returns shown reflect applicable sales charges, but have not been adjusted to reflect differences in expenses. If differences in expenses were reflected, the returns shown for the periods prior to March 31, 2008 would be lower. The returns of the Class Z shares shown for periods prior to March 31, 2008 are those of the Shares class shares of the Predecessor Fund. The returns of Class Z shown have not been adjusted to reflect differences in expenses. If differences in expenses were reflected, the returns shown for all periods would be higher.
Inception date refers to the date on which the Fund class commenced operations for Classes A and C and the date on which the Predecessor Fund class commenced operations for Class Z.
Performance results reflect any fee waivers or reimbursements of fund expenses by the investment advisor and/or any of its affiliates. Absent these fee waivers or expense reimbursement arrangements, performance results would have been lower.
All results shown assume the reinvestment of distributions. Class Z shares are sold at net asset value with no distribution and service (Rule 12b-1) fees. Class Z shares have limited eligibility and the investment minimum requirements may vary. Please see the fund’s prospectus for details. Performance for different share classes will vary based on differences in sales charges and fees associated with each class.
The tables do not reflect the deduction of taxes that a shareholder may pay on fund distributions or on the redemption of fund shares.
44
Understanding Your Expenses – Columbia International Growth Fund
Estimating your actual expenses
To estimate the expenses that you paid over the period, first you will need your account balance at the end of the period:
| | n | | For shareholders who receive their account statements from Columbia Management Services, Inc., your account balance is available online at www.columbiafunds.com or by calling Shareholder Services at 800.345.6611. | |
| | n | | For shareholders who receive their account statements from their financial intermediary, contact your financial intermediary to obtain your account balance. | |
| | 1. | Divide your ending account balance by $1,000. For example, if an account balance was $8,600 at the end of the period, the result would be 8.6. | |
| | 2. | In the section of the table below titled “Expenses paid during the period,” locate the amount for your share class. You will find this number in the column labeled “Actual.” Multiply this number by the result from step 1. Your answer is an estimate of the expenses you paid on your account during the period. | |
If the value of your account falls below the minimum initial investment requirement applicable to you, your account generally will be subject to a $20 annual fee. This fee is not included in the accompanying table. If you are subject to the fee, keep it in mind when you are estimating the ongoing expenses of investing in the fund and when comparing the expenses of this fund with other funds.
As a fund shareholder, you incur two types of costs. There are transaction costs, which generally include sales charges on purchases and may include redemption fees or exchange fees. There are also ongoing costs, which generally include investment advisory fees, distribution and service (Rule 12b-1) fees and other fund expenses. The information on this page is intended to help you understand the ongoing costs of investing in the fund and to compare these costs with the ongoing costs of investing in other mutual funds.
Analyzing your fund’s expenses by share class
To illustrate these ongoing costs, we have provided an example and calculated the expenses paid by investors in each share class during the period. The information in the following table is based on an initial investment of $1,000, which is invested at the beginning of the period and held for the entire period. Expense information is calculated two ways and each method provides you with different information. The amount listed in the “Actual” column is calculated using the fund’s actual operating expenses and total return for the period. The amount listed in the “Hypothetical” column for each share class assumes that the return each year is 5% before expenses and is calculated based on the fund’s actual operating expenses. You should not use the hypothetical account values and expenses to estimate either your actual account balance at the end of the period or the expenses you paid during this period.
Compare with other funds
Since all mutual funds are required to include the same hypothetical calculations about expenses in shareholder reports, you can use this information to compare the ongoing cost of investing in the fund with other funds. To do so, compare the 5% hypothetical example with the 5% hypothetical examples that appear in the shareholder reports of other funds. As you compare hypothetical examples of other funds, it is important to note that hypothetical examples are meant to highlight the ongoing costs of investing in a fund and do not reflect any transaction costs, such as sales charges, redemption fees or exchange fees.
| | | | | | | | | | | | | | |
| 10/01/08 – 03/31/09 | | | | | | | | | | |
| | | | |
| | | Account value at the
beginning of the period ($) | | Account value at the
end of the period ($) | | Expenses paid
during the period ($) | | Fund’s annualized
expense ratio (%) |
| | | Actual | | Hypothetical | | Actual | | Hypothetical | | Actual | | Hypothetical | | Actual |
Class A | | 1,000.00 | | 1,000.00 | | 682.02 | | 1,016.55 | | 7.05 | | 8.45 | | 1.68 |
Class C | | 1,000.00 | | 1,000.00 | | 679.28 | | 1,012.81 | | 10.17 | | 12.19 | | 2.43 |
Class Z | | 1,000.00 | | 1,000.00 | | 683.02 | | 1,017.80 | | 6.00 | | 7.19 | | 1.43 |
Expenses paid during the period are equal to the annualized expense ratio for the share class, multiplied by the average account value over the period, then multiplied by the number of days in the fund’s most recent fiscal half-year and divided by 365.
Had the investment advisor and/or any of its affiliates not waived fees or reimbursed a portion of expenses, account value at the end of the period would have been reduced.
It is important to note that the expense amounts shown in the table are meant to highlight only ongoing costs of investing in the fund and do not reflect any transaction costs, such as sales charges, redemption fees or exchange fees. Therefore, the hypothetical examples provided may not help you determine the relative total costs of owning shares of different funds. If these transaction costs were included, your costs would have been higher.
45
Portfolio Managers’ Report – Columbia International Growth Fund
Performance data quoted represents past performance and current performance may be lower or higher. Past performance is no guarantee of future results. The investment return and principal value will fluctuate so that shares, when redeemed, may be worth more or less than the original cost. Please visit www.columbiafunds.com for daily and most recent month-end performance updates.
| | |
| Net asset value per share | | |
| |
as of 03/31/09 ($) | | |
Class A | | 9.18 |
Class C | | 9.11 |
Class Z | | 9.20 |
| | |
| Distributions declared per share |
| |
04/01/08 – 03/31/09 ($) | | |
Class A | | 1.17 |
Class C | | 1.17 |
Class Z | | 1.17 |
For the 12-month period that ended March 31, 2009, the fund’s Class A shares returned negative 47.91% without sales charge. The fund’s return was less than the return of its benchmark, the MSCI EAFE Growth Index1, which was negative 45.36% for the same period. The fund underperformed the average return of its peer group, the Lipper International Multi-Cap Growth Funds Classification2, which was negative 46.95%. Throughout most of the period, when compared to it’s benchmark, the fund was overweight in the energy and industrials sectors. This strategy detracted from return. Stock selection in the consumer staples, utilities and financials areas aided return, with some individual stocks rising in value and others losing less than the index overall.
Declining prices held back the fund’s energy holdings
The steep and precipitous fall-off in energy prices, including oil and coal, affected virtually all energy companies. Centennial Coal in Australia and Bumi Resources, a coal company in Indonesia, underperformed, and we sold our positions. Shares of UK-based BG Group PLC, a natural gas company, fell 10% in local currency — 35% in U.S. dollars — but outperformed the index. It remains in the portfolio as a core holding because we believe its long-term business prospects are attractive.
Going into the period, stock selection in the industrials sector emphasized two themes — power generation and engineering. As a result, we had overweights in electrical equipment stocks, such as Harbin Power Equipment in China and engineering company Outotec Oyi in Finland. Because concerns over financing led to project cut-backs, these companies detracted from performance, and we sold them. While some industrial holdings produced positive results, they were not strong enough to offset the downturn in the fund’s position in the sector.
Individual stocks helped curtail losses
In the utilities sector, we focused on some non-traditional companies, such as Fortum Oyj, a hydropower generating company in Scandinavia, and Cia Energetica de Minas Gerais, a Brazilian hydropower generator. Both investments produced solid positive returns. Cia Energetica, in particular, rose in value. The company is benefiting from strong power demand in the region.
When investing in the financials sector, we avoided banks that were at the center of the financial crisis in Europe, preferring financial institutions in Asia that had minimal exposure to problems in the banking system. One example is Sumitomo Trust & Banking in Japan. We also favored insurance companies, such as Brit Insurance Holdings in the UK. While both stocks declined, they declined less than other financial companies.
1 | The Morgan Stanley Capital International (MSCI) Europe, Australasia, Far East (EAFE) Growth Index is a subset of the MSCI EAFE Index, and constituents of the index include securities from Europe, Australasia and the Far East. The index generally represents approximately 50% of the free float-adjusted market capitalization of the MSCI EAFE Index, and consists of those securities classified by Morgan Stanley Capital International (MSCI) as most representing the growth style, such as higher forecasted growth rates, lower book value-to-price ratios, lower forward earnings-to-price ratios and lower dividend yields than securities representing the value style. Indices are not available for investment, and do not reflect sales charges, fees, brokerage commissions, taxes or other expenses of investing. Securities in the fund may not match those in an index. |
2 | Lipper Inc., a widely respected data provider in the industry, calculates an average total return (assuming reinvestment of distributions) for mutual funds with investment objectives similar to those of the fund. Lipper makes no adjustment for the effect of sales loads. |
46
Portfolio Managers’ Report (continued) – Columbia International Growth Fund
| | |
| Top 5 countries | | |
| |
as of 03/31/09 (%) | | |
United Kingdom | | 22.8 |
Japan | | 21.2 |
Switzerland | | 12.2 |
France | | 10.0 |
United States | | 5.1 |
| | |
| Top 10 holdings | | |
| |
as of 03/31/09 (%) | | |
Nestle SA | | 3.8 |
BHP Billiton PLC | | 3.4 |
Total SA | | 3.2 |
BG Group | | 2.7 |
Roche Holdings AG | | 2.7 |
Novartis AG | | 2.6 |
Telefonica SA | | 2.5 |
GlaxoSmithKline PLC | | 2.4 |
Siemens AG | | 2.2 |
BP PLC | | 1.8 |
| |
| | |
| Holdings discussed in this report |
| |
as of 3/31/09 (%) | | |
BG Group PLC | | 2.8 |
Fortum Oyj | | 0.3 |
Cia Energetica de Minas Gerais | | 1.0 |
Sumitomo Trust & Banking | | 0.9 |
Brit Insurance Holdings | | 0.9 |
Wm. Morrison Supermarkets PLC | | 1.5 |
This fund is actively managed and the composition of its portfolio will change over time. Information provided is calculated as a percentage of net assets.
Consumer staples stocks are considered defensive investments during periods of economic weakness, and some holdings in the sector were noteworthy performers. In Japan, Seven & I Holdings, an operator of supermarkets, convenience stores and department stores, and Toyo Suisan Kaisha, a food processing company, generated positive returns. We sold both names before the end of the period. The fund had more exposure than the index to UK-based Wm. Morrison Supermarkets PLC, a discount grocery store, in the consumer staples sector. While the stock lost value during the period, it did better than the average stock in the sector, and because we overweighted the stock, it enhanced return relative to the benchmark. Wm. Morrison Supermarkets remains a core holding in the portfolio.
Rebuilding a position in emerging markets
Early in the fiscal year, we eliminated the fund’s emerging markets position, because we felt that the risk of investing in these developing countries was too great. However, recently we reversed this position and added holdings in China and Brazil, where stock valuations are compelling. We believe that China is attractive for several reasons. It is spending a substantial amount of money to stimulate its economy. Chinese consumers are not overburdened with household debt and discretionary incomes are rising. The country has a healthy banking system, and it is increasing loans for both consumers and businesses. We believe that China’s GDP growth could outpace that of many developed countries for years to come. Brazil is a large exporter of commodities, and should benefit when global demand for commodities picks up. The fund’s investments in both areas are focused on three themes — infrastructure development, banks and technology.
Portfolio holdings and characteristics are subject to change periodically and may not be representative of current holdings and characteristics. The outlook for the fund may differ from that presented for other Columbia Funds.
Equity securities are affected by stock market fluctuations that occur in response to economic and business developments.
International investing involves special risks, including foreign taxation, currency risks, risks associated with possible differences in financial standards and other risks associated with future political and economic developments.
Investing in emerging markets may involve greater risks than investing in more developed countries. In addition, concentration of investments in a single region may result in greater volatility.
47
Fund Profile – Columbia Pacific/Asia Fund
Summary
| n | | For the 12-month period that ended March 31, 2009, the fund’s Class A shares returned negative 40.21% without sales charge. |
n | | In an environment of contracting economic growth and falling stock prices, the fund, its benchmarks — the MSCI AC Asia Pacific Index and the MSCI EAFE Index1 — and the average return of its peer group, the Lipper Pacific Regions Funds Classification2, all declined more than 40%. |
| n | | Individual stock performance was the main driver of return. While many of the fund’s holdings declined, certain utility, consumer and technology stocks produced positive results. |
Portfolio Management
Fred Copper has co-managed the fund since March 2008 and the Predecessor Fund since September 2007 and has been associated with the advisor or its predecessors or affiliate organizations since 2005.
Daisuke Nomoto has co-managed the fund since March 2008 and the Predecessor Fund since September 2007 and has been associated with the advisor or its predecessors or affiliate organizations since 2005.
Jasmine (Weili) Huang has co-managed the fund since March 2008 and the Predecessor Fund since September 2007 and has been associated with the advisor or its predecessors or affiliate organizations since 2003.
1 | The Morgan Stanley Capital International (MSCI) All Country (AC) Asia Pacific Index tracks the performance of stocks traded on stock exchanges in Pacific Basin countries, including Australia, China, Hong Kong, Indonesia, Japan, Korea, Malaysia, New Zealand, Philippines, Singapore, Taiwan and Thailand. The Morgan Stanley Capital International (MSCI) Europe, Australasia, Far East (EAFE) Index is a free float-adjusted market capitalization index that is designed to measure developed market equity performance, excluding the US and Canada. Indices are not available for investment, and do not reflect sales charges, fees, brokerage commissions, taxes or other expenses of investing. Securities in the fund may not match those in an index. |
2 | Lipper Inc., a widely respected data provider in the industry, calculates an average total return (assuming reinvestment of distributions) for mutual funds with investment objectives similar to those of the fund. Lipper makes no adjustment for the effect of sales loads. |
Performance data quoted represents past performance and current performance may be lower or higher. Past performance is no guarantee of future results. The investment return and principal value will fluctuate so that shares, when redeemed, may be worth more or less than the original cost. Please visit www.columbiafunds.com for daily and most recent month-end performance updates.
Summary
1-year return as of 03/31/09
| | |
| | –40.21% Class A shares (without sales charge) |
| | –40.25% MSCI All Country Asia Pacific Index |
| | –46.51% MSCI EAFE Index |
|
Morningstar Style Box™ |
|
Equity Style |
|
The Morningstar Style BoxTM reveals a fund’s investment strategy. For equity funds, the vertical axis shows the market capitalization of the stocks owned, and the horizontal axis shows investment style (value, blend or growth). Information shown is based on the most recent data provided by Morningstar.
48
Performance Information – Columbia Pacific/Asia Fund
| | | | |
| Performance of a $10,000 investment 04/01/99 – 03/31/09 |

The chart above shows the change in value of a hypothetical $10,000 investment in Class A shares of Columbia Pacific/Asia Fund during the stated time period, and does not reflect the deduction of taxes that a shareholder may pay on fund distributions or on the redemption of fund shares. The Morgan Stanley Capital International (MSCI) All Country (AC) Asia Pacific Index tracks the performance of stocks traded on stock exchanges in Pacific Basin countries, including Australia, China, Hong Kong, Indonesia, Japan, Korea, Malaysia, New Zealand, Philippines, Singapore, Taiwan and Thailand. The Morgan Stanley Capital International (MSCI) Europe, Australasia, Far East (EAFE) Index is a free float-adjusted market capitalization index that is designed to measure developed market equity performance, excluding the US and Canada. Indices are not available for investment, and do not reflect sales charges, fees, brokerage commissions, taxes or other expenses of investing. Securities in the fund may not match those in an index.
| | | | |
| Performance of a $10,000 investment 04/01/99 – 03/31/09 ($) |
| | |
| Sales charge | | without | | with |
Class A | | 11,651 | | 10,986 |
Class C | | 11,558 | | 11,558 |
Class Z | | 11,673 | | n/a |
| | | | | | | | | | |
| Average annual total return as of 03/31/09 (%) |
| | | |
| Share class | | A | | C | | Z |
| Inception | | 03/31/08 | | 03/31/08 | | 12/31/92 |
| Sales charge | | without | | with | | without | | with | | without |
1-year | | –40.21 | | –43.62 | | –40.69 | | –41.20 | | –40.10 |
5-year | | –2.96 | | –4.10 | | –3.12 | | –3.12 | | –2.93 |
10-year | | 1.54 | | 0.94 | | 1.46 | | 1.46 | | 1.56 |
Performance data quoted represents past performance and current performance may be lower or higher. Past performance is no guarantee of future results. The investment return and principal value will fluctuate so that shares, when redeemed, may be worth more or less than the original cost. Please visit www.columbiafunds.com for daily and most recent month-end performance updates.
| | |
| Annual operating expense ratio (%)* |
| |
Class A | | 1.51 |
Class C | | 2.26 |
Class Z | | 1.26 |
| * | The annual operating expense ratio is as stated in the fund’s prospectus that is current as of the date of this report. Differences in expense ratios disclosed elsewhere in this report may result from including fee waivers and expense reimbursements as well as different time periods used in calculating the ratios. |
The “with sales charge” returns include the maximum initial sales charge of 5.75% for Class A shares and the applicable contingent deferred sales charge of 1.00% for Class C shares for the first year only. The “without sales charge” returns do not include the effect of sales charges. If they had, returns would be lower.
The Fund commenced operations on March 31, 2008. The returns of the Class A and Class C shares shown for periods prior to March 31, 2008 are those of the Shares class shares of Pacific/Asia Fund, the predecessor to the Fund and a series of Excelsior Funds, Inc. (the “Predecessor Fund”). The returns shown reflect applicable sales charges, but have not been adjusted to reflect differences in expenses. If differences in expenses were reflected, the returns shown for the period prior to March 31, 2008 would be lower. The returns of the Class Z shares shown for periods prior to March 31, 2008 are those of the Shares class shares of the Predecessor Fund. The returns shown reflect that Class Z shares are sold without sales charges, but have not been adjusted to reflect differences in expenses. If differences in expenses were reflected, the returns shown for all periods would be higher. The inception of the predecessor fund is December 31, 1992.
Inception date refers to the date on which the Fund class commenced operations for Classes A and C and the date on which the Predecessor Fund class commenced operations for Class Z.
Performance results reflect any fee waivers or reimbursements of fund expenses by the investment advisor and/or any of its affiliates. Absent these fee waivers or expense reimbursement arrangements, performance results would have been lower.
All results shown assume reinvestment of distributions. Class Z shares are sold at net asset value with no distribution and service (Rule 12b-1) fees. Class Z shares have limited eligibility and the investment minimum requirements may vary. Please see the fund’s prospectus for details. Performance for different share classes will vary based on differences in sales charges and fees associated with each class.
The tables do not reflect the deduction of taxes that a shareholder may pay on fund distributions or on the redemption of fund shares.
49
Understanding Your Expenses – Columbia Pacific/Asia Fund
Estimating your actual expenses
To estimate the expenses that you paid over the period, first you will need your account balance at the end of the period:
| | n | | For shareholders who receive their account statements from Columbia Management Services, Inc., your account balance is available online at www.columbiafunds.com or by calling Shareholder Services at 800.345.6611. | |
| | n | | For shareholders who receive their account statements from their financial intermediary, contact your financial intermediary to obtain your account balance. | |
| | 1. | Divide your ending account balance by $1,000. For example, if an account balance was $8,600 at the end of the period, the result would be 8.6. | |
| | 2. | In the section of the table below titled “Expenses paid during the period,” locate the amount for your share class. You will find this number in the column labeled “Actual.” Multiply this number by the result from step 1. Your answer is an estimate of the expenses you paid on your account during the period. | |
If the value of your account falls below the minimum initial investment requirement applicable to you, your account generally will be subject to a $20 annual fee. This fee is not included in the accompanying table. If you are subject to the fee, keep it in mind when you are estimating the ongoing expenses of investing in the fund and when comparing the expenses of this fund with other funds.
As a fund shareholder, you incur two types of costs. There are transaction costs, which generally include sales charges on purchases and may include redemption fees or exchange fees. There are also ongoing costs, which generally include investment advisory fees, distribution and service (Rule 12b-1) fees and other fund expenses. The information on this page is intended to help you understand the ongoing costs of investing in the fund and to compare these costs with the ongoing costs of investing in other mutual funds.
Analyzing your fund’s expenses by share class
To illustrate these ongoing costs, we have provided an example and calculated the expenses paid by investors in each share class during the period. The information in the following table is based on an initial investment of $1,000 which is invested at the beginning of the period and held for the entire period. Expense information is calculated two ways and each method provides you with different information. The amount listed in the “Actual” column is calculated using the fund’s actual operating expenses and total return for the period. The amount listed in the “Hypothetical” column for each share class assumes that the return each year is 5% before expenses and is calculated based on the fund’s actual operating expenses. You should not use the hypothetical account values and expenses to estimate either your actual account balance at the end of the period or the expenses you paid during this period.
Compare with other funds
Since all mutual funds are required to include the same hypothetical calculations about expenses in shareholder reports, you can use this information to compare the ongoing costs of investing in the fund with other funds. To do so, compare the 5% hypothetical example with the 5% hypothetical examples that appear in the shareholder reports of other funds. As you compare hypothetical examples of other funds, it is important to note that hypothetical examples are meant to highlight the ongoing costs of investing in a fund and do not reflect any transaction costs, such as sales charges, redemption fees or exchange fees.
| | | | | | | | | | | | | | |
| 10/01/08 – 03/31/09 | | | | | | | | | | |
| | | | |
| | | Account value at the
beginning of the period ($) | | Account value at the
end of the period ($) | | Expenses paid
during the period ($) | | Fund’s annualized
expense ratio (%) |
| | | Actual | | Hypothetical | | Actual | | Hypothetical | | Actual | | Hypothetical | | Actual |
Class A | | 1,000.00 | | 1,000.00 | | 747.29 | | 1,015.46 | | 8.28 | | 9.55 | | 1.90 |
Class C | | 1,000.00 | | 1,000.00 | | 743.40 | | 1,011.72 | | 11.52 | | 13.29 | | 2.65 |
Class Z | | 1,000.00 | | 1,000.00 | | 747.69 | | 1,016.70 | | 7.19 | | 8.30 | | 1.65 |
Expenses paid during the period are equal to the annualized expense ratio for the share class, multiplied by the average account value over the period, then multiplied by the number of days in the fund’s most recent fiscal half-year and divided by 365.
Had the investment advisor and/or any of its affiliates not waived fees or reimbursed a portion of expenses, account value at the end of the period would have been reduced.
It is important to note that the expense amounts shown in the table are meant to highlight only ongoing costs of investing in the fund and do not reflect any transaction costs, such as sales charges, redemption fees or exchange fees. Therefore, the hypothetical examples provided may not help you determine the relative total costs of owning shares of different funds. If these transaction costs were included, your costs would have been higher.
50
Portfolio Managers’ Report – Columbia Pacific/Asia Fund
Performance data quoted represents past performance and current performance may be lower or higher. Past performance is no guarantee of future results. The investment return and principal value will fluctuate so that shares, when redeemed, may be worth more or less than the original cost. Please visit www.columbiafunds.com for daily and most recent month-end performance updates.
| | |
| Net asset value per share |
| |
as of 03/31/09 ($) | | |
Class A | | 4.82 |
Class C | | 4.78 |
Class Z | | 4.83 |
| | |
| Distributions declared per share |
| |
04/01/08 – 03/31/09 ($) | | |
Class A | | 1.36 |
Class C | | 1.36 |
Class Z | | 1.36 |
For the 12-month period that ended March 31, 2009, the fund’s Class A shares returned negative 40.21% without sales charge. The fund performed in line with the MSCI AC Asia Pacific Index, which returned negative 40.25% and held up better than the MSCI EAFE Index, which returned negative 46.51% for the same period.1 The fund also did better than the average return of its peer group, the Lipper Pacific Regions Funds Classification2, which returned negative 43.01%. Individual stock performance was the main driver of return during the period. While many of the fund’s holdings declined, certain utility, consumer and technology stocks produced positive results.
Utility and consumer stocks helped limit losses
In an environment of contracting economic growth, stock prices fell in all major world markets. The fund did not escape this downturn, which affected every major sector represented in the fund. However, certain utility and consumer stocks held by the fund helped limit losses.
During periods of economic difficulty, utility stocks are viewed as safe havens because they have predictable revenue streams, and some of the fund’s utility holdings generated positive returns. Energy Development, a geothermal energy producer in the Philippines, was one of the best performing stocks in the portfolio. When we purchased the stock, it had declined dramatically because of credit concerns that we thought were unreasonable. When the credit concerns were lifted, the stock became a significant outperformer. Guangdong Investment, a Hong Kong-based water utility, sold off sharply in 2008, and we thought its decline was unwarranted, given the stability of its cash flows. Over the 12-month period, the stock produced a positive return.
At a time when most consumers sought bargains, certain companies that offered high quality, lower cost items gained market share and saw their stock prices rise. Among consumer discretionary companies, Japan’s Fast Retailing, which provides inexpensive but fashionable apparel, rose because of stronger sales. Dongfeng Motor Group, a large domestic auto producer in China, was also helpful, as auto sales in China were resilient. Certain consumer staples stocks were also noteworthy. Toyo Suisan Kaisha, a manufacturer of processed food in Japan, saw its market share increase and was one of the biggest positive contributors to performance. The company benefited in two ways. First, processed food is relatively inexpensive and provides cheaper alternatives for consumers; and second, agricultural prices declined, which reduced the company’s operating costs.
1 | The Morgan Stanley Capital International (MSCI) All Country (AC) Asia Pacific Index tracks the performance of stocks traded on stock exchanges in Pacific Basin countries, including Australia, China, Hong Kong, Indonesia, Japan, Korea, Malaysia, New Zealand, Philippines, Singapore, Taiwan and Thailand. The Morgan Stanley Capital International (MSCI) Europe, Australasia, Far East (EAFE) Index is a free float-adjusted market capitalization index that is designed to measure developed market equity performance, excluding the US and Canada. Indices are not available for investment, and do not reflect sales charges, fees, brokerage commissions, taxes or other expenses of investing. Securities in the fund may not match those in an index. |
2 | Lipper Inc., a widely respected data provider in the industry, calculates an average total return (assuming reinvestment of distributions) for mutual funds with investment objectives similar to those of the fund. Lipper makes no adjustment for the effect of sales loads. |
51
Portfolio Managers’ Report (continued) – Columbia Pacific/Asia Fund
Technology stocks rebounded
Although technology stocks in the fund lost more than 30% for the period, certain technology companies were relatively strong near the end of the period and helped offset some losses. NetEase.com, an online gaming company in China, led the fund’s technology holdings. In a weak economy, the company provided a low-cost source of entertainment. In the technology sector, we favored companies that might be early beneficiaries of economic stabilization. Semiconductor companies are in this category because they are one of the building blocks of virtually all electronic devices. They often see a pick-up in business as companies begin manufacturing more goods to replenish inventories. Over the period, we held United Microelectronics and Macronix International, two Taiwan-based semiconductor manufacturers. While both companies declined, they rose significantly from their lowest levels; and we believe they have the potential for strong performance in the future.
A focus on emerging markets
We believe that emerging markets have the potential to outperform most developed markets over the long term, and our individual stock selection process has resulted in overweights in China, Thailand and Singapore. In Singapore, for example, we added Epure International, a water utility. Water is becoming a scarce resource, and the delivery and treatment of water is developing as a theme in the portfolio. Epure has had consistent earnings, and it generated a positive return over the period.
Using market pullbacks to purchase attractively valued stocks
We believe that the stock market rally at the end of March reflected the willingness of governments to solve the global financial crisis. The rally may also be an indication that the pace of deceleration in economic growth is slowing. While we may see another substantial equity market sell-off in the short-term, we believe that such a downturn could produce attractive buying opportunities. As we look ahead, we plan to continue to select stocks on a case-by-case basis, emphasizing high quality companies with good balance sheets and solid business prospects.
Portfolio holdings and characteristics are subject to change periodically and may not be representative of current holdings and characteristics. The outlook for the fund may differ from that presented for other Columbia Funds.
Equity securities are affected by stock market fluctuations that occur in response to economic and business developments.
International investing may involve certain risks, including currency fluctuations, risks associated with possible differences in financial accounting standards and other monetary and political risks. Significant levels of foreign taxes, including potentially confiscatory levels of taxation and withholding taxes, may also apply to some foreign investments.
Investing in emerging markets may involve greater risks than investing in more developed countries. In addition, concentration of investments in a single region may result in greater volatility.
| | |
| Top 5 countries |
| |
as of 03/31/09 (%) | | |
Japan | | 48.0 |
Australia | | 10.3 |
South Korea | | 8.2 |
China | | 8.0 |
Taiwan | | 4.5 |
| | |
| Top 10 holdings |
| |
as of 03/31/09 (%) | | |
Toyota Motor | | 2.2 |
BHP Billiton | | 2.2 |
Samsung Electronics | | 2.1 |
Commonwealth Bank of Australia | | 2.1 |
Sumitomo Mitsui Financial Group | | 1.7 |
Nintendo | | 1.7 |
Canon | | 1.6 |
Industrial & Commercial Bank of China | | 1.5 |
Nippon Telegraph & Telephone | | 1.4 |
Takeda Pharmaceutical | | 1.3 |
| | |
| Holdings discussed in this report |
| |
as of 3/31/09 (%) | | |
Energy Development | | 1.0 |
Guangdong Investment | | 1.0 |
Fast Retailing | | 0.6 |
Dongfeng Motor Group | | 0.9 |
Toyo Suisan Kaisha | | 0.5 |
NetEase.com | | 0.8 |
United Microelectronics | | 0.9 |
Macronix International | | 1.0 |
Epure International | | 0.9 |
The fund is actively managed and the composition of its portfolio will change over time. Information provided is calculated as a percentage of net assets.
52
Investment Portfolio – Columbia Blended Equity Fund
March 31, 2009
Common Stocks – 98.0%
| | | | |
| | | Shares | | Value ($) |
| Consumer Discretionary – 9.3% |
| Auto Components – 1.6% | | | | |
BorgWarner, Inc. | | 110,000 | | 2,233,000 |
| | | | |
Auto Components Total | | | | 2,233,000 |
| |
Hotels, Restaurants & Leisure – 0.1% | | |
International Game Technology | | 4,100 | | 37,802 |
Starwood Hotels & Resorts Worldwide, Inc. | | 3,800 | | 48,260 |
| | | | |
Hotels, Restaurants & Leisure Total | | 86,062 |
| | |
Media – 1.9% | | | | |
Interpublic Group of Companies, Inc. (a) | | 1,155 | | 4,759 |
John Wiley & Sons, Inc., Class A | | 90,000 | | 2,680,200 |
| | | | |
Media Total | | | | 2,684,959 |
| | |
Multiline Retail – 4.3% | | | | |
Target Corp. | | 176,400 | | 6,066,396 |
| | | | |
Multiline Retail Total | | | | 6,066,396 |
| | |
Specialty Retail – 0.7% | | | | |
TJX Companies, Inc. | | 37,530 | | 962,269 |
| | | | |
Specialty Retail Total | | | | 962,269 |
| |
Textiles, Apparel & Luxury Goods – 0.7% | | |
Polo Ralph Lauren Corp. | | 23,230 | | 981,467 |
| | | | |
Textiles, Apparel & Luxury Goods Total | | 981,467 |
| | | | |
Consumer Discretionary Total | | 13,014,153 |
| | | | |
| Consumer Staples – 11.5% | | | | |
| Food & Staples Retailing – 4.6% | | | | |
Wal-Mart Stores, Inc. | | 124,000 | | 6,460,400 |
| | | | |
Food & Staples Retailing Total | | | | 6,460,400 |
| | |
Food Products – 2.3% | | | | |
Archer Daniels Midland Co. | | 70,000 | | 1,944,600 |
Kraft Foods, Inc., Class A | | 61,036 | | 1,360,492 |
| | | | |
Food Products Total | | | | 3,305,092 |
| | |
Household Products – 0.7% | | | | |
Colgate-Palmolive Co. | | 16,380 | | 966,092 |
| | | | |
Household Products Total | | | | 966,092 |
| | |
Personal Products – 0.7% | | | | |
Avon Products, Inc. | | 49,760 | | 956,885 |
| | | | |
Personal Products Total | | | | 956,885 |
| | |
Tobacco – 3.2% | | | | |
Philip Morris International, Inc. | | 126,420 | | 4,498,024 |
| | | | |
Tobacco Total | | | | 4,498,024 |
| | | | |
Consumer Staples Total | | 16,186,493 |
| | | | |
| | | Shares | | Value ($) |
| Energy – 10.8% | | | | |
| Oil, Gas & Consumable Fuels – 10.8% | | |
Apache Corp. | | 42,500 | | 2,723,825 |
Chevron Corp. | | 37,100 | | 2,494,604 |
Exxon Mobil Corp. | | 89,222 | | 6,076,018 |
Hess Corp. | | 14,810 | | 802,702 |
Petroleo Brasileiro SA, ADR | | 80,000 | | 2,437,600 |
Royal Dutch Shell PLC, ADR | | 12,100 | | 536,030 |
| | | | |
Oil, Gas & Consumable Fuels Total | | 15,070,779 |
| | | | |
Energy Total | | | | 15,070,779 |
| | | | |
| Financials – 14.0% | | | | |
| Capital Markets – 7.0% | | | | |
Ameriprise Financial, Inc. | | 8,920 | | 182,771 |
Bank of New York Mellon Corp. | | 49,088 | | 1,386,736 |
Goldman Sachs Group, Inc. | | 30,000 | | 3,180,600 |
State Street Corp. | | 164,800 | | 5,072,544 |
| | | | |
Capital Markets Total | | 9,822,651 |
| |
Commercial Banks – 1.8% | | |
PNC Financial Services Group, Inc. | | 10,500 | | 307,545 |
SunTrust Banks, Inc. | | 71,000 | | 833,540 |
U.S. Bancorp | | 13,400 | | 195,774 |
Wells Fargo & Co. | | 87,000 | | 1,238,880 |
| | | | |
Commercial Banks Total | | 2,575,739 |
| |
Consumer Finance – 0.0% | | |
American Express Co. | | 1,100 | | 14,993 |
| | | | |
Consumer Finance Total | | 14,993 |
| |
Diversified Financial Services – 0.9% | | |
JPMorgan Chase & Co. | | 48,280 | | 1,283,283 |
| | | | |
Diversified Financial Services Total | | 1,283,283 |
| |
Insurance – 3.3% | | |
Berkshire Hathaway Inc., Class A (a) | | 39 | | 3,381,300 |
Lincoln National Corp. | | 36,600 | | 244,854 |
MetLife, Inc. | | 40,630 | | 925,145 |
| | | | |
Insurance Total | | | | 4,551,299 |
|
Real Estate Management & Development – 1.0% |
St. Joe Co. (a) | | 80,000 | | 1,339,200 |
| | | | |
Real Estate Management & Development Total | | 1,339,200 |
| | | | |
Financials Total | | | | 19,587,165 |
| | | | |
| Health Care – 17.8% | | | | |
| Biotechnology – 1.9% | | | | |
Amgen, Inc. (a) | | 25,880 | | 1,281,578 |
Genzyme Corp. (a) | | 22,100 | | 1,312,519 |
| | | | |
Biotechnology Total | | | | 2,594,097 |
See Accompanying Notes to Financial Statements.
53
Columbia Blended Equity Fund
March 31, 2009
Common Stocks (continued)
| | | | |
| | | Shares | | Value ($) |
| Health Care Equipment & Supplies – 1.8% |
Becton Dickinson & Co. | | 15,000 | | 1,008,600 |
Hospira, Inc. (a) | | 18,100 | | 558,566 |
Medtronic, Inc. | | 32,240 | | 950,113 |
| | | | |
Health Care Equipment & Supplies Total | | 2,517,279 |
|
Health Care Providers & Services – 0.7% |
Express Scripts, Inc. (a) | | 20,590 | | 950,640 |
| | | | |
Health Care Providers & Services Total | | 950,640 |
| | |
Pharmaceuticals – 13.4% | | | | |
Abbott Laboratories | | 130,100 | | 6,205,770 |
Johnson & Johnson | | 122,478 | | 6,442,343 |
Novo Nordisk A/S, ADR | | 70,000 | | 3,358,600 |
Pfizer, Inc. | | 94,058 | | 1,281,070 |
Schering-Plough Corp. | | 19,100 | | 449,805 |
Wyeth | | 25,310 | | 1,089,342 |
| | | | |
Pharmaceuticals Total | | | | 18,826,930 |
| | | | |
Health Care Total | | | | 24,888,946 |
| | | | |
| Industrials – 9.2% | | | | |
| Aerospace & Defense – 4.0% | | | | |
Bombardier, Inc., Class B | | 900,000 | | 2,097,000 |
Honeywell International, Inc. | | 40,770 | | 1,135,852 |
Lockheed Martin Corp. | | 18,090 | | 1,248,753 |
United Technologies Corp. | | 26,210 | | 1,126,506 |
| | | | |
Aerospace & Defense Total | | | | 5,608,111 |
| |
Commercial Services & Supplies – 1.1% | | |
Waste Management, Inc. | | 59,100 | | 1,512,960 |
| | | | |
Commercial Services & Supplies Total | | 1,512,960 |
| | |
Construction & Engineering – 1.4% | | | | |
Quanta Services, Inc. (a) | | 93,880 | | 2,013,726 |
| | | | |
Construction & Engineering Total | | | | 2,013,726 |
| |
Industrial Conglomerates – 0.9% | | |
General Electric Co. | | 118,610 | | 1,199,147 |
| | | | |
Industrial Conglomerates Total | | 1,199,147 |
| |
Machinery – 1.8% | | |
Dover Corp. | | 51,100 | | 1,348,018 |
Parker Hannifin Corp. | | 36,080 | | 1,225,998 |
| | | | |
Machinery Total | | 2,574,016 |
| | | | |
Industrials Total | | | | 12,907,960 |
| | | | |
| Information Technology – 16.5% | | |
| Communications Equipment – 4.7% | | |
Cisco Systems, Inc. (a) | | 391,365 | | 6,563,191 |
| | | | |
Communications Equipment Total | | 6,563,191 |
| | | | |
| | | Shares | | Value ($) |
| Computers & Peripherals – 4.3% | | |
Apple, Inc. (a) | | 25,000 | | 2,628,000 |
EMC Corp. (a) | | 98,990 | | 1,128,486 |
NCR Corp. (a) | | 1,200 | | 9,540 |
Teradata Corp. (a) | | 141,200 | | 2,290,264 |
| | | | |
Computers & Peripherals Total | | 6,056,290 |
| |
IT Services – 1.2% | | |
MasterCard, Inc., Class A | | 10,000 | | 1,674,800 |
| | | | |
IT Services Total | | 1,674,800 |
|
Semiconductors & Semiconductor Equipment – 0.7% |
Texas Instruments, Inc. | | 57,620 | | 951,306 |
| | | | |
Semiconductors & Semiconductor Equipment Total | | 951,306 |
| |
Software – 5.6% | | |
Microsoft Corp. | | 429,900 | | 7,897,263 |
| | | | |
Software Total | | 7,897,263 |
| | | | |
Information Technology Total | | | | 23,142,850 |
| | | | |
| Materials – 6.7% | | | | |
| Chemicals – 4.7% | | | | |
Huabao International Holdings Ltd. | | 2,750,000 | | 2,263,696 |
Monsanto Co. | | 52,500 | | 4,362,750 |
| | | | |
Chemicals Total | | 6,626,446 |
| |
Metals & Mining – 2.0% | | |
Newmont Mining Corp. | | 17,870 | | 799,861 |
Nucor Corp. | | 50,000 | | 1,908,500 |
| | | | |
Metals & Mining Total | | | | 2,708,361 |
| | | | |
Materials Total | | | | 9,334,807 |
| | | | |
| Telecommunication Services – 0.8% | | |
| Diversified Telecommunication Services – 0.8% |
AT&T, Inc. | | 44,840 | | 1,129,968 |
| | | | |
Diversified Telecommunication Services Total | | 1,129,968 |
| | | | |
Telecommunication Services Total | | 1,129,968 |
| | | | |
| Utilities – 1.4% | | | | |
| Multi-Utilities – 1.4% | | | | |
PG&E Corp. | | 26,840 | | 1,025,825 |
Public Service Enterprise Group, Inc. | | 33,380 | | 983,709 |
| | | | |
Multi-Utilities Total | | | | 2,009,534 |
| | | | |
Utilities Total | | | | 2,009,534 |
| | | | |
Total Common Stocks
(cost of $91,740,883) | | | | 137,272,655 |
See Accompanying Notes to Financial Statements.
54
Columbia Blended Equity Fund
March 31, 2009
Short-Term Obligation – 2.0%
| | | | | |
| | | Par ($) | | Value ($) | |
Repurchase agreement with Fixed Income Clearing Corp., dated 03/31/09, due 04/01/09 at 0.140%, collateralized by a U.S. Government Agency Obligation maturing 01/22/13, market value $2,914,900 (repurchase proceeds $2,855,011) | | 2,855,000 | | 2,855,000 | |
| | | | | |
Total Short-Term Obligation
(cost of $2,855,000) | | | | 2,855,000 | |
| | | | | |
Total Investments – 100.0%
(cost of $94,595,883)(b) | | 140,127,655 | |
| | | | | |
Other Assets & Liabilities, Net – 0.0% | | (16,879 | ) |
| | | | | |
Net Assets – 100.0% | | | | 140,110,776 | |
Notes to Investment Portfolio:
On April 1, 2008, the Fund adopted Statement of Financial Accounting Standards No. 157, Fair Value Measurements (“SFAS 157”). SFAS 157 establishes a hierarchy that prioritizes the inputs to valuation techniques used to measure fair value giving the highest priority to unadjusted quoted prices in active markets for identical securities (level 1 measurements) and the lowest priority to unobservable inputs (level 3 measurements) when market prices are not readily available or reliable. The three levels of the fair value hierarchy under SFAS 157 are described below:
| | • | | Level 1 – quoted prices in active markets for identical securities |
| | • | | Level 2 – prices determined using other significant observable inputs (including quoted prices for similar securities, interest rates, prepayment speeds, credit risk and others) |
| | • | | Level 3 – prices determined using significant unobservable inputs. In situations where quoted prices or observable inputs are unavailable or less reliable, unobservable inputs may be used. Unobservable inputs may include management’s own assumptions about the factors market participants would use in pricing an investment. |
The inputs or methodology used for valuing securities are not necessarily an indication of the risk associated with investing in those securities.
The following table summarizes the inputs used, as of March 31, 2009 in valuing the Fund’s assets:
| | | | | | |
Valuation Inputs | | Investments in
Securities | | Other Financial
Instruments |
Level 1 – Quoted Prices | | $ | 135,008,959 | | $ | — |
Level 2 – Other Significant Observable Inputs | | | 5,118,696 | | | — |
Level 3 – Significant Unobservable Inputs | | | — | | | — |
| | | | | | |
Total | | $ | 140,127,655 | | $ | — |
| | | | | | |
The Fund’s assets assigned to the Level 2 input category include certain foreign securities for which a third party statistical pricing service may be employed for the purposes of fair market valuation.
The following table reconciles asset balances for the year ended March 31, 2009 in which significant unobservable inputs (Level 3) were used in determining value:
| | | | | | | |
| | | Investments
in Securities | | | Other Financial
Instruments |
Balance as of March 31, 2008 | | $ | 2,344,896 | | | $ | — |
Accretion of discounts/Amortization of premiums | | | — | | | | — |
Realized loss | | | (2,167,530 | ) | | | — |
Change in unrealized appreciation | | | 645,952 | | | | — |
Net sales | | | (823,318 | ) | | | — |
Transfers in and/or out of Level 3 | | | — | | | | — |
| | | | | | | |
Balance as of March 31, 2009 | | $ | — | | | $ | — |
| | | | | | | |
The change in unrealized gains attributable to securities owned at March 31, 2009 which were valued using significant unobservable inputs (Level 3) amounted to $645,952. This amount is included in net change in unrealized appreciation (depreciation) on the Statements of Changes in Net Assets.
The information in the above reconciliation represents fiscal year to date activity for any securities identified as using Level 3 inputs at either the beginning or the end of the current fiscal period.
| (a) | Non-income producing security. |
| (b) | Cost for federal income tax purposes is $95,246,009. |
At March 31, 2009, the Fund held investments in the following sectors:
| | |
Sector (Unaudited) | | % of
Net Assets |
Health Care | | 17.8 |
Information Technology | | 16.5 |
Financials | | 14.0 |
Consumer Staples | | 11.5 |
Energy | | 10.8 |
Consumer Discretionary | | 9.3 |
Industrials | | 9.2 |
Materials | | 6.7 |
Utilities | | 1.4 |
Telecommunication Services | | 0.8 |
| | |
| | 98.0 |
Short-Term Obligation | | 2.0 |
Other Assets & Liabilities, Net | | 0.0 |
| | |
| | 100.0 |
| | |
| | |
Acronym | | Name |
| ADR | | American Depositary Receipt |
See Accompanying Notes to Financial Statements.
55
Investment Portfolio – Columbia Energy and Natural Resources Fund
March 31, 2009
Common Stocks – 91.7%
| | | | |
| | | Shares | | Value ($) |
| Consumer Staples – 2.7% | | | | |
| Food Products – 2.7% | | | | |
Archer-Daniels-Midland Co. | | 350,000 | | 9,723,000 |
| | | | |
Food Products Total | | | | 9,723,000 |
| | | | |
Consumer Staples Total | | | | 9,723,000 |
| | | | |
| Energy – 58.3% | | | | |
| Energy Equipment & Services – 15.3% |
Halliburton Co. | | 350,000 | | 5,414,500 |
National-Oilwell Varco, Inc. (a) | | 300,000 | | 8,613,000 |
Pride International, Inc. (a) | | 525,000 | | 9,439,500 |
Transocean Ltd. (a) | | 350,000 | | 20,594,000 |
Weatherford International Ltd. (a) | | 1,025,000 | | 11,346,750 |
| | | | |
Energy Equipment & Services Total | | 55,407,750 |
|
Oil, Gas & Consumable Fuels – 43.0% |
Apache Corp. | | 200,000 | | 12,818,000 |
Chevron Corp. | | 100,000 | | 6,724,000 |
Denbury Resources, Inc. (a) | | 250,000 | | 3,715,000 |
EXCO Resources, Inc. (a) | | 450,000 | | 4,500,000 |
Exxon Mobil Corp. | | 650,000 | | 44,265,000 |
Gasco Energy, Inc. (a) | | 2,300,000 | | 897,000 |
Hess Corp. | | 175,000 | | 9,485,000 |
Noble Energy, Inc. | | 100,000 | | 5,388,000 |
Northern Oil And Gas, Inc. (a) | | 974,435 | | 3,507,966 |
Occidental Petroleum Corp. | | 200,000 | | 11,130,000 |
Oilsands Quest, Inc. (a) | | 1,800,000 | | 1,296,000 |
Peabody Energy Corp. | | 200,000 | | 5,008,000 |
PetroHawk Energy Corp. (a) | | 200,000 | | 3,846,000 |
Petroquest Energy, Inc. (a) | | 250,000 | | 600,000 |
Plains Exploration & Production Co. (a) | | 150,000 | | 2,584,500 |
Rex Energy Corp. (a) | | 500,000 | | 1,435,000 |
Suncor Energy, Inc. | | 400,000 | | 8,884,000 |
Talisman Energy, Inc. | | 200,000 | | 2,100,000 |
Total SA, ADR | | 225,000 | | 11,038,500 |
Walter Industries, Inc. | | 500,000 | | 11,435,000 |
XTO Energy, Inc. | | 150,000 | | 4,593,000 |
| | | | |
Oil, Gas & Consumable Fuels Total | | 155,249,966 |
| | | | |
Energy Total | | | | 210,657,716 |
| | | | |
| Industrials – 3.3% | | | | |
| Marine – 2.4% | | | | |
Genco Shipping & Trading Ltd. | | 700,000 | | 8,638,000 |
| | | | |
Marine Total | | | | 8,638,000 |
| | | | |
| | | Shares | | Value ($) |
| Transportation Infrastructure – 0.9% |
Aegean Marine Petroleum Network, Inc. | | 200,000 | | 3,350,000 |
| | | | |
Transportation Infrastructure Total | | 3,350,000 |
| | | | |
Industrials Total | | | | 11,988,000 |
| | | | |
| Materials – 23.7% | | | | |
| Chemicals – 13.4% | | | | |
Monsanto Co. | | 125,000 | | 10,387,500 |
Mosaic Co. | | 225,000 | | 9,445,500 |
Praxair, Inc. | | 150,000 | | 10,093,500 |
Scotts Miracle-Gro Co., Class A | | 300,000 | | 10,410,000 |
Sociedad Quimica y Minera de Chile SA, ADR | | 300,000 | | 7,968,000 |
| | | | |
Chemicals Total | | | | 48,304,500 |
| | |
Metals & Mining – 10.3% | | | | |
Barrick Gold Corp. | | 300,000 | | 9,726,000 |
BHP Billiton Ltd., ADR | | 250,000 | | 11,150,000 |
Cia Vale do Rio Doce, ADR | | 650,000 | | 8,645,000 |
Freeport-McMoRan Copper & Gold, Inc. | | 200,000 | | 7,622,000 |
| | | | |
Metals & Mining Total | | | | 37,143,000 |
| | | | |
Materials Total | | | | 85,447,500 |
| | | | |
| Utilities – 3.7% | | | | |
| Multi-Utilities – 3.7% | | | | |
PG&E Corp. | | 350,000 | | 13,377,000 |
| | | | |
Multi-Utilities Total | | | | 13,377,000 |
| | | | |
Utilities Total | | | | 13,377,000 |
| | | | |
Total Common Stocks
(cost of $341,003,194) | | | | 331,193,216 |
See Accompanying Notes to Financial Statements.
56
Columbia Energy and Natural Resources Fund
March 31, 2009
Short-Term Obligation – 12.8%
| | | | | |
| | | Par ($) | | Value ($) | |
Repurchase agreement with Fixed Income Clearing Corp., dated 03/31/09, due 04/01/09 at 0.140%, collateralized by a U.S. Government Agency Obligation maturing 01/15/13, market value $47,019,500 (repurchase proceeds $46,096,179) | | 46,096,000 | | 46,096,000 | |
| | | | | |
Total Short-Term Obligation
(cost of $46,096,000) | | | | 46,096,000 | |
| | | | | |
Total Investments – 104.5%
(cost of $387,099,194)(b) | | | | 377,289,216 | |
| | | | | |
Other Assets & Liabilities, Net – (4.5)% | | (16,312,811 | ) |
| | | | | |
Net Assets – 100.0% | | | | 360,976,405 | |
Notes to Investment Portfolio:
On April 1, 2008, the Fund adopted Statement of Financial Accounting Standards No. 157, Fair Value Measurements (“SFAS 157”). SFAS 157 establishes a hierarchy that prioritizes the inputs to valuation techniques used to measure fair value giving the highest priority to unadjusted quoted prices in active markets for identical securities (level 1 measurements) and the lowest priority to unobservable inputs (level 3 measurements) when market prices are not readily available or reliable. The three levels of the fair value hierarchy under SFAS 157 are described below:
| | • | | Level 1 – quoted prices in active markets for identical securities |
| | • | | Level 2 – prices determined using other significant observable inputs (including quoted prices for similar securities, interest rates, prepayment speeds, credit risk and others) |
| | • | | Level 3 – prices determined using significant unobservable inputs. In situations where quoted prices or observable inputs are unavailable or less reliable, unobservable inputs may be used. Unobservable inputs may include management’s own assumptions about the factors market participants would use in pricing an investment. |
The inputs or methodology used for valuing securities are not necessarily an indication of the risk associated with investing in those securities.
The following table summarizes the inputs used, as of March 31, 2009, in valuing the Fund’s assets:
| | | | | | |
Valuation Inputs | | Investments in
Securities | | Other Financial
Instruments |
Level 1 – Quoted Prices | | $ | 331,193,216 | | $ | — |
Level 2 – Other Significant Observable Inputs | | | 46,096,000 | | | — |
Level 3 – Significant Unobservable Inputs | | | — | | | — |
| | | | | | |
Total | | $ | 377,289,216 | | $ | — |
| | | | | | |
| (a) | Non-income producing security. |
| (b) | Cost for federal income tax purposes is $429,325,203. |
At March 31, 2009, the Fund held investments in the following sectors:
| | | |
Sector (Unaudited) | | % of
Net Assets | |
Energy | | 58.3 | |
Materials | | 23.7 | |
Utilities | | 3.7 | |
Industrials | | 3.3 | |
Consumer Staples | | 2.7 | |
| | | |
| | 91.7 | |
Short-Term Obligation | | 12.8 | |
Other Assets & Liabilities, Net | | (4.5 | ) |
| | | |
| | 100.0 | |
| | | |
| | |
Acronym | | Name |
| ADR | | American Depositary Receipt |
See Accompanying Notes to Financial Statements.
57
Investment Portfolio – Columbia Mid Cap Core Fund
March 31, 2009
Common Stocks – 98.2%
| | | | |
| | | Shares | | Value ($) |
| Consumer Discretionary – 16.4% |
| Auto Components – 0.7% | | | | |
Autoliv, Inc. | | 26,180 | | 486,163 |
| | | | |
Auto Components Total | | | | 486,163 |
|
Distributors – 1.0% |
Genuine Parts Co. | | 22,243 | | 664,176 |
| | | | |
Distributors Total | | | | 664,176 |
|
Diversified Consumer Services – 0.8% |
Apollo Group, Inc., Class A (a) | | 6,445 | | 504,837 |
| | | | |
Diversified Consumer Services Total | | 504,837 |
|
Hotels, Restaurants & Leisure – 2.1% |
Burger King Holdings, Inc. | | 14,123 | | 324,123 |
Darden Restaurants, Inc. | | 15,196 | | 520,615 |
Starwood Hotels & Resorts Worldwide, Inc. | | 41,641 | | 528,840 |
| | | | |
Hotels, Restaurants & Leisure Total | | 1,373,578 |
|
Household Durables – 1.3% |
NVR, Inc. (a) | | 506 | | 216,441 |
Stanley Works | | 21,548 | | 627,478 |
| | | | |
Household Durables Total | | | | 843,919 |
|
Leisure Equipment & Products – 0.6% |
Hasbro, Inc. | | 16,424 | | 411,750 |
| | | | |
Leisure Equipment & Products Total | | 411,750 |
|
Media – 1.1% |
DIRECTV Group, Inc. (a) | | 16,900 | | 385,151 |
Liberty Media Corp. – Entertainment, Class A (a) | | 16,317 | | 325,524 |
| | | | |
Media Total | | | | 710,675 |
|
Multiline Retail – 2.4% |
Big Lots, Inc. (a) | | 27,416 | | 569,704 |
Dollar Tree, Inc. (a) | | 8,966 | | 399,435 |
Nordstrom, Inc. | | 33,505 | | 561,209 |
| | | | |
Multiline Retail Total | | | | 1,530,348 |
|
Specialty Retail – 5.2% |
Aeropostale, Inc. (a) | | 13,128 | | 348,680 |
Bed Bath & Beyond, Inc. (a) | | 18,387 | | 455,078 |
Gap, Inc. | | 60,253 | | 782,686 |
O’Reilly Automotive, Inc. (a) | | 11,174 | | 391,202 |
Sherwin-Williams Co. | | 12,574 | | 653,471 |
TJX Companies, Inc. | | 29,825 | | 764,713 |
| | | | |
Specialty Retail Total | | | | 3,395,830 |
|
Textiles, Apparel & Luxury Goods – 1.2% |
Polo Ralph Lauren Corp. | | 17,771 | | 750,825 |
| | | | |
Textiles, Apparel & Luxury Goods Total | | 750,825 |
| | | | |
Consumer Discretionary Total | | | | 10,672,101 |
| | | | |
| | | Shares | | Value ($) |
| Consumer Staples – 6.4% | | | | |
| Beverages – 0.8% |
Hansen Natural Corp. (a) | | 14,510 | | 522,360 |
| | | | |
Beverages Total | | | | 522,360 |
|
Food & Staples Retailing – 1.0% |
BJ’s Wholesale Club, Inc. (a) | | 8,497 | | 271,819 |
Kroger Co. | | 18,400 | | 390,448 |
| | | | |
Food & Staples Retailing Total | | | | 662,267 |
|
Food Products – 1.7% |
Campbell Soup Co. | | 22,212 | | 607,720 |
Dean Foods Co. (a) | | 27,927 | | 504,920 |
| | | | |
Food Products Total | | | | 1,112,640 |
|
Household Products – 1.1% |
Clorox Co. | | 13,539 | | 696,988 |
| | | | |
Household Products Total | | | | 696,988 |
|
Personal Products – 1.8% |
Avon Products, Inc. | | 40,057 | | 770,296 |
Estee Lauder Companies, Inc., Class A | | 15,124 | | 372,807 |
| | | | |
Personal Products Total | | | | 1,143,103 |
| | | | |
Consumer Staples Total | | | | 4,137,358 |
| | | | |
| Energy – 7.2% | | | | |
| Energy Equipment & Services – 2.2% |
Cameron International Corp. (a) | | 16,600 | | 364,038 |
Nabors Industries Ltd. (a) | | 29,919 | | 298,891 |
National-Oilwell Varco, Inc. (a) | | 9,920 | | 284,803 |
Noble Corp. | | 20,077 | | 483,655 |
| | | | |
Energy Equipment & Services Total | | 1,431,387 |
|
Oil, Gas & Consumable Fuels – 5.0% |
Cabot Oil & Gas Corp. | | 17,931 | | 422,633 |
Denbury Resources, Inc. (a) | | 20,826 | | 309,474 |
Hess Corp. | | 7,439 | | 403,194 |
Newfield Exploration Co. (a) | | 15,296 | | 347,219 |
Noble Energy, Inc. | | 7,411 | | 399,305 |
Peabody Energy Corp. | | 15,972 | | 399,939 |
Southwestern Energy Co. (a) | | 16,135 | | 479,048 |
Ultra Petroleum Corp. (a) | | 13,983 | | 501,850 |
| | | | |
Oil, Gas & Consumable Fuels Total | | 3,262,662 |
| | | | |
Energy Total | | 4,694,049 |
| | | | |
| Financials – 16.1% |
| Capital Markets – 4.7% |
Ameriprise Financial, Inc. | | 22,795 | | 467,070 |
Federated Investors, Inc., Class B | | 31,967 | | 711,585 |
See Accompanying Notes to Financial Statements.
58
Columbia Mid Cap Core Fund
March 31, 2009
Common Stocks (continued)
| | | | |
| | | Shares | | Value ($) |
Morgan Stanley | | 23,790 | | 541,698 |
Northern Trust Corp. | | 11,477 | | 686,554 |
State Street Corp. | | 21,775 | | 670,235 |
| | | | |
Capital Markets Total | | 3,077,142 |
| | |
Commercial Banks – 2.1% | | | | |
Cullen/Frost Bankers, Inc. | | 6,718 | | 315,343 |
First Horizon National Corp. | | 37,709 | | 404,999 |
PNC Financial Services Group, Inc. | | 12,396 | | 363,079 |
TCF Financial Corp. | | 23,244 | | 273,349 |
| | | | |
Commercial Banks Total | | 1,356,770 |
|
Insurance – 6.1% |
ACE Ltd. | | 12,077 | | 487,911 |
Aon Corp. | | 21,495 | | 877,426 |
Axis Capital Holdings Ltd. | | 27,045 | | 609,594 |
MetLife, Inc. | | 15,671 | | 356,829 |
Platinum Underwriters Holdings Ltd. | | 12,042 | | 341,511 |
Prudential Financial, Inc. | | 18,214 | | 346,430 |
Reinsurance Group of America, Inc. | | 17,530 | | 567,797 |
RenaissanceRe Holdings Ltd. | | 7,419 | | 366,795 |
| | | | |
Insurance Total | | 3,954,293 |
|
Real Estate Investment Trusts (REITs) – 2.8% |
Alexandria Real Estate Equities, Inc. | | 11,594 | | 422,022 |
Digital Realty Trust, Inc. | | 16,077 | | 533,435 |
Equity Lifestyle Properties, Inc. | | 7,552 | | 287,731 |
National Retail Properties, Inc. | | 17,129 | | 271,323 |
Nationwide Health Properties, Inc. | | 13,003 | | 288,537 |
| | | | |
Real Estate Investment Trusts (REITs) Total | | 1,803,048 |
|
Real Estate Management & Development – 0.4% |
St. Joe Co. (a) | | 14,633 | | 244,956 |
| | | | |
Real Estate Management & Development Total | | 244,956 |
| | | | |
Financials Total | | | | 10,436,209 |
| | | | |
| Health Care – 9.3% | | | | |
| Biotechnology – 1.3% | | | | |
Cephalon, Inc. (a) | | 6,289 | | 428,281 |
Vertex Pharmaceuticals, Inc. (a) | | 15,405 | | 442,586 |
| | | | |
Biotechnology Total | | | | 870,867 |
|
Health Care Equipment & Supplies – 1.8% |
Becton Dickinson & Co. | | 6,782 | | 456,022 |
Boston Scientific Corp. (a) | | 23,839 | | 189,520 |
| | | | |
| | | Shares | | Value ($) |
Hill-Rom Holdings, Inc. | | 30,318 | | 299,845 |
Zimmer Holdings, Inc. (a) | | 6,073 | | 221,664 |
| | | | |
Health Care Equipment & Supplies Total | | 1,167,051 |
| |
Health Care Providers & Services – 4.3% | | |
CIGNA Corp. | | 23,305 | | 409,935 |
Express Scripts, Inc. (a) | | 16,323 | | 753,633 |
Laboratory Corp. of America Holdings (a) | | 10,185 | | 595,721 |
McKesson Corp. | | 18,133 | | 635,380 |
Omnicare, Inc. | | 16,699 | | 408,958 |
| | | | |
Health Care Providers & Services Total | | 2,803,627 |
| |
Life Sciences Tools & Services – 1.1% | | |
Covance, Inc. (a) | | 9,354 | | 333,283 |
Life Technologies Corp. (a) | | 12,003 | | 389,858 |
| | | | |
Life Sciences Tools & Services Total | | | | 723,141 |
| | |
Pharmaceuticals – 0.8% | | | | |
Watson Pharmaceuticals, Inc. (a) | | 15,709 | | 488,707 |
| | | | |
Pharmaceuticals Total | | | | 488,707 |
| | | | |
Health Care Total | | | | 6,053,393 |
| | | | |
| Industrials – 11.9% | | | | |
| Aerospace & Defense – 2.3% | | | | |
Goodrich Corp. | | 13,047 | | 494,351 |
L-3 Communications Holdings, Inc. | | 6,516 | | 441,784 |
Precision Castparts Corp. | | 9,711 | | 581,689 |
| | | | |
Aerospace & Defense Total | | | | 1,517,824 |
| |
Commercial Services & Supplies – 1.2% | | |
Avery Dennison Corp. | | 15,486 | | 345,957 |
Waste Management, Inc. | | 17,148 | | 438,989 |
| | | | |
Commercial Services & Supplies Total | | 784,946 |
| | |
Electrical Equipment – 1.2% | | | | |
Cooper Industries Ltd., Class A | | 18,929 | | 489,504 |
Rockwell Automation, Inc. | | 13,150 | | 287,196 |
| | | | |
Electrical Equipment Total | | | | 776,700 |
| | |
Industrial Conglomerates – 0.4% | | | | |
Tyco International Ltd. | | 12,988 | | 254,045 |
| | | | |
Industrial Conglomerates Total | | | | 254,045 |
| | |
Machinery – 2.8% | | | | |
Flowserve Corp. | | 8,363 | | 469,331 |
Graco, Inc. | | 18,867 | | 322,060 |
Joy Global, Inc. | | 18,809 | | 400,632 |
Parker Hannifin Corp. | | 18,952 | | 643,989 |
| | | | |
Machinery Total | | | | 1,836,012 |
See Accompanying Notes to Financial Statements.
59
Columbia Mid Cap Core Fund
March 31, 2009
Common Stocks (continued)
| | | | |
| | | Shares | | Value ($) |
| Professional Services – 1.2% | | | | |
Dun & Bradstreet Corp. | | 6,242 | | 480,634 |
FTI Consulting, Inc. (a) | | 5,435 | | 268,924 |
| | | | |
Professional Services Total | | | | 749,558 |
| | |
Road & Rail – 1.2% | | | | |
CSX Corp. | | 13,917 | | 359,755 |
Ryder System, Inc. | | 15,501 | | 438,833 |
| | | | |
Road & Rail Total | | | | 798,588 |
| |
Trading Companies & Distributors – 1.6% | | |
W.W. Grainger, Inc. | | 9,466 | | 664,324 |
WESCO International, Inc. (a) | | 18,859 | | 341,725 |
| | | | |
Trading Companies & Distributors Total | | 1,006,049 |
| | | | |
Industrials Total | | | | 7,723,722 |
| | | | |
| Information Technology – 14.3% | | | | |
| Communications Equipment – 2.0% | | | | |
Brocade Communications Systems, Inc. (a) | | 138,228 | | 476,887 |
Corning, Inc. | | 37,176 | | 493,325 |
F5 Networks, Inc. (a) | | 15,454 | | 323,761 |
| | | | |
Communications Equipment Total | | | | 1,293,973 |
| | |
Computers & Peripherals – 1.7% | | | | |
NetApp, Inc. (a) | | 46,304 | | 687,151 |
Sun Microsystems, Inc. (a) | | 9,541 | | 69,840 |
Teradata Corp. (a) | | 19,936 | | 323,362 |
| | | | |
Computers & Peripherals Total | | | | 1,080,353 |
|
Electronic Equipment, Instruments & Components – 1.9% |
Agilent Technologies, Inc. (a) | | 29,800 | | 458,026 |
Avnet, Inc. (a) | | 18,130 | | 317,456 |
Dolby Laboratories, Inc., Class A (a) | | 12,626 | | 430,673 |
| | | | |
Electronic Equipment, Instruments & Components Total | | 1,206,155 |
|
Internet Software & Services – 0.5% |
Akamai Technologies, Inc. (a) | | 16,650 | | 323,010 |
| | | | |
Internet Software & Services Total | | 323,010 |
|
IT Services – 1.4% |
Affiliated Computer Services, Inc., Class A (a) | | 8,753 | | 419,181 |
Computer Sciences Corp. (a) | | 14,127 | | 520,439 |
| | | | |
IT Services Total | | 939,620 |
|
Semiconductors & Semiconductor Equipment – 4.0% |
Analog Devices, Inc. | | 42,850 | | 825,719 |
Linear Technology Corp. | | 36,153 | | 830,796 |
| | | | |
| | | Shares | | Value ($) |
Verigy Ltd. (a) | | 40,543 | | 334,480 |
Xilinx, Inc. | | 32,741 | | 627,318 |
| | | | |
Semiconductors & Semiconductor Equipment Total | | 2,618,313 |
|
Software – 2.8% |
Activision Blizzard, Inc. (a) | | 48,409 | | 506,358 |
Adobe Systems, Inc. (a) | | 9,556 | | 204,403 |
BMC Software, Inc. (a) | | 13,441 | | 443,553 |
Citrix Systems, Inc. (a) | | 14,289 | | 323,503 |
VMware, Inc., Class A (a) | | 15,229 | | 359,709 |
| | | | |
Software Total | | | | 1,837,526 |
| | | | |
Information Technology Total | | | | 9,298,950 |
| | | | |
| Materials – 5.4% | | | | |
| Chemicals – 2.6% | | | | |
Air Products & Chemicals, Inc. | | 10,858 | | 610,763 |
International Flavors & Fragrances, Inc. | | 7,675 | | 233,781 |
Intrepid Potash, Inc. (a) | | 31,356 | | 578,518 |
PPG Industries, Inc. | | 7,618 | | 281,104 |
| | | | |
Chemicals Total | | 1,704,166 |
|
Containers & Packaging – 2.2% |
Crown Holdings, Inc. (a) | | 28,369 | | 644,827 |
Packaging Corp. of America | | 37,594 | | 489,474 |
Sonoco Products Co. | | 14,712 | | 308,658 |
| | | | |
Containers & Packaging Total | | 1,442,959 |
|
Metals & Mining – 0.6% |
Nucor Corp. | | 10,002 | | 381,776 |
| | | | |
Metals & Mining Total | | 381,776 |
| | | | |
Materials Total | | 3,528,901 |
| | | | |
| Telecommunication Services – 2.2% |
| Diversified Telecommunication Services – 1.3% |
CenturyTel, Inc. | | 18,829 | | 529,472 |
Frontier Communications Corp. | | 42,680 | | 306,442 |
| | | | |
Diversified Telecommunication Services Total | | 835,914 |
|
Wireless Telecommunication Services – 0.9% |
NII Holdings, Inc. (a) | | 16,839 | | 252,585 |
Rogers Communications, Inc., Class B | | 13,782 | | 314,643 |
| | | | |
Wireless Telecommunication Services Total | | 567,228 |
| | | | |
Telecommunication Services Total | | 1,403,142 |
See Accompanying Notes to Financial Statements.
60
Columbia Mid Cap Core Fund
March 31, 2009
Common Stocks (continued)
| | | | | |
| | | Shares | | Value ($) | |
| Utilities – 9.0% | |
| Electric Utilities – 2.4% | |
Entergy Corp. | | 7,702 | | 524,429 | |
FPL Group, Inc. | | 11,519 | | 584,359 | |
Northeast Utilities | | 21,644 | | 467,294 | |
| | | | | |
Electric Utilities Total | | | | 1,576,082 | |
|
Gas Utilities – 1.8% | |
Energen Corp. | | 10,681 | | 311,138 | |
Questar Corp. | | 16,061 | | 472,675 | |
UGI Corp. | | 16,668 | | 393,532 | |
| | | | | |
Gas Utilities Total | | 1,177,345 | |
|
Independent Power Producers & Energy Traders – 0.8% | |
NRG Energy, Inc. (a) | | 30,032 | | 528,563 | |
| | | | | |
Independent Power Producers & Energy Traders Total | | 528,563 | |
|
Multi-Utilities – 4.0% | |
NSTAR | | 15,080 | | 480,750 | |
OGE Energy Corp. | | 21,661 | | 515,965 | |
PG&E Corp. | | 27,974 | | 1,069,166 | |
Xcel Energy, Inc. | | 27,007 | | 503,141 | |
| | | | | |
Multi-Utilities Total | | 2,569,022 | |
| | | | | |
Utilities Total | | 5,851,012 | |
| | | | | |
Total Common Stocks
(cost of $66,740,232) | | 63,798,837 | |
| | | |
Investment Company – 1.5% | | | | | |
iShares Russell Midcap Index Fund | | 17,980 | | 971,100 | |
| | | | | |
Total Investment Company
(cost of $961,013) | | | | 971,100 | |
| | | | | |
Short-Term Obligation – 0.7% | | | | | |
| | | Par ($) | | | |
Repurchase agreement with Fixed Income Clearing Corp., dated 03/31/09, due 04/01/09 at 0.140%, collateralized by a U.S. Government Agency Obligation maturing 01/15/13, market value $451,000 (repurchase proceeds $438,002) | | 438,000 | | 438,000 | |
| | | | | |
Total Short-Term Obligation
(cost of $438,000) | | | | 438,000 | |
| | | | | |
Total Investments – 100.4%
(cost of $68,139,245)(b) | | | | 65,207,937 | |
| | | | | |
Other Assets & Liabilities, Net – (0.4)% | | (257,985 | ) |
| | | | | |
Net Assets – 100.0% | | | | 64,949,952 | |
Notes to Investment Portfolio:
On April 1, 2008, the Fund adopted Statement of Financial Accounting Standards No. 157, Fair Value Measurements (“SFAS 157”). SFAS 157 establishes a hierarchy that prioritizes the inputs to valuation techniques used to measure fair value giving the highest priority to unadjusted quoted prices in active markets for identical securities (level 1 measurements) and the lowest priority to unobservable inputs (level 3 measurements) when market prices are not readily available or reliable. The three levels of the fair value hierarchy under SFAS 157 are described below:
| | • | | Level 1 – quoted prices in active markets for identical securities |
| | • | | Level 2 – prices determined using other significant observable inputs (including quoted prices for similar securities, interest rates, prepayment speeds, credit risk and others) |
| | • | | Level 3 – prices determined using significant unobservable inputs. In situations where quoted prices or observable inputs are unavailable or less reliable, unobservable inputs may be used. Unobservable inputs may include management’s own assumptions about the factors market participants would use in pricing an investment. |
The inputs or methodology used for valuing securities are not necessarily an indication of the risk associated with investing in those securities.
The following table summarizes the inputs used, as of March 31, 2009 in valuing the Fund’s assets:
| | | | | | |
Valuation Inputs | | Investments in
Securities | | Other Financial
Instruments |
Level 1 – Quoted Prices | | $ | 64,769,937 | | $ | — |
Level 2 – Other Significant Observable Inputs | | | 438,000 | | | — |
Level 3 – Significant Unobservable Inputs | | | — | | | — |
| | | | | | |
Total | | $ | 65,207,937 | | $ | — |
| | | | | | |
| (a) | Non-income producing security. |
| (b) | Cost for federal income tax purposes is $68,959,018. |
At March 31, 2009, the Fund held investments in the following sectors:
| | | |
Sector (Unaudited) | | % of
Net Assets | |
Consumer Discretionary | | 16.4 | |
Financials | | 16.1 | |
Information Technology | | 14.3 | |
Industrials | | 11.9 | |
Health Care | | 9.3 | |
Utilities | | 9.0 | |
Energy | | 7.2 | |
Consumer Staples | | 6.4 | |
Materials | | 5.4 | |
Telecommunication Services | | 2.2 | |
| | | |
| | 98.2 | |
Investment Company | | 1.5 | |
Short-Term Obligation | | 0.7 | |
Other Assets & Liabilities, Net | | (0.4 | ) |
| | | |
| | 100.0 | |
| | | |
See Accompanying Notes to Financial Statements.
61
Investment Portfolio – Columbia Select Large Cap Growth Fund
March 31, 2009
Common Stocks – 97.4%
| | | | |
| | | Shares | | Value ($) |
| Consumer Discretionary – 14.7% |
| Diversified Consumer Services – 2.8% |
Apollo Group, Inc., Class A (a) | | 297,150 | | 23,275,759 |
| | | | |
Diversified Consumer Services Total | | 23,275,759 |
|
Hotels, Restaurants & Leisure – 4.1% |
Carnival Corp. | | 1,534,831 | | 33,152,350 |
| | | | |
Hotels, Restaurants & Leisure Total | | 33,152,350 |
|
Internet & Catalog Retail – 4.7% |
Amazon.com, Inc. (a) | | 527,025 | | 38,704,716 |
| | | | |
Internet & Catalog Retail Total | | 38,704,716 |
|
Specialty Retail – 3.1% |
GameStop Corp., Class A (a) | | 899,570 | | 25,205,951 |
| | | | |
Specialty Retail Total | | | | 25,205,951 |
| | | | |
Consumer Discretionary Total | | 120,338,776 |
| | | | |
| Consumer Staples – 3.0% | | | | |
| Food & Staples Retailing – 3.0% |
Costco Wholesale Corp. | | 532,802 | | 24,679,389 |
| | | | |
Food & Staples Retailing Total | | 24,679,389 |
| | | | |
Consumer Staples Total | | | | 24,679,389 |
| | | | |
| Energy – 4.2% | | | | |
| Energy Equipment & Services – 4.2% | | |
FMC Technologies, Inc. (a) | | 1,088,459 | | 34,144,959 |
| | | | |
Energy Equipment & Services Total | | 34,144,959 |
| | | | |
Energy Total | | | | 34,144,959 |
| | | | |
| Financials – 8.7% | | | | |
| Capital Markets – 4.2% | | | | |
T. Rowe Price Group, Inc. | | 1,184,803 | | 34,193,415 |
| | | | |
Capital Markets Total | | 34,193,415 |
| |
Diversified Financial Services – 4.5% | | |
CME Group, Inc. | | 150,573 | | 37,099,681 |
| | | | |
Diversified Financial Services Total | | 37,099,681 |
| | | | |
Financials Total | | | | 71,293,096 |
| | | | |
| Health Care – 29.9% | | | | |
| Biotechnology – 7.0% | | | | |
Celgene Corp. (a) | | 599,379 | | 26,612,428 |
Gilead Sciences, Inc. (a) | | 662,042 | | 30,665,785 |
| | | | |
Biotechnology Total | | | | 57,278,213 |
| | | | |
| | | Shares | | Value ($) |
| Health Care Equipment & Supplies – 6.5% |
Alcon, Inc. | | 297,320 | | 27,029,361 |
Intuitive Surgical, Inc. (a) | | 274,654 | | 26,191,006 |
| | | | |
Health Care Equipment & Supplies Total | | 53,220,367 |
|
Health Care Providers & Services – 4.1% |
Medco Health Solutions, Inc. (a) | | 808,230 | | 33,412,228 |
| | | | |
Health Care Providers & Services Total | | 33,412,228 |
|
Life Sciences Tools & Services – 8.2% |
Covance, Inc. (a) | | 824,507 | | 29,377,184 |
Illumina, Inc. (a) | | 1,022,800 | | 38,089,072 |
| | | | |
Life Sciences Tools & Services Total | | 67,466,256 |
|
Pharmaceuticals – 4.1% |
Allergan, Inc. | | 700,022 | | 33,433,051 |
| | | | |
Pharmaceuticals Total | | 33,433,051 |
| | | | |
Health Care Total | | | | 244,810,115 |
| | | | |
| Industrials – 7.3% | | | | |
| Air Freight & Logistics – 3.5% | | | | |
Expeditors International Washington, Inc. | | 1,008,772 | | 28,538,160 |
| | | | |
Air Freight & Logistics Total | | 28,538,160 |
|
Electrical Equipment – 3.8% |
First Solar, Inc. (a) | | 231,066 | | 30,662,458 |
| | | | |
Electrical Equipment Total | | 30,662,458 |
| | | | |
Industrials Total | | | | 59,200,618 |
| | | | |
| Information Technology – 25.9% |
| Communications Equipment – 8.8% |
QUALCOMM, Inc. | | 995,954 | | 38,752,570 |
Research In Motion Ltd. (a) | | 766,485 | | 33,012,509 |
| | | | |
Communications Equipment Total | | 71,765,079 |
| | |
Computers & Peripherals – 4.6% | | | | |
Apple, Inc. (a) | | 360,190 | | 37,863,173 |
| | | | |
Computers & Peripherals Total | | 37,863,173 |
|
Internet Software & Services – 4.5% |
Google, Inc., Class A (a) | | 106,339 | | 37,012,352 |
| | | | |
Internet Software & Services Total | | 37,012,352 |
|
IT Services – 8.0% |
Infosys Technologies Ltd., ADR | | 1,097,718 | | 29,232,231 |
MasterCard, Inc., Class A | | 214,534 | | 35,930,154 |
| | | | |
IT Services Total | | 65,162,385 |
| | | | |
Information Technology Total | | | | 211,802,989 |
See Accompanying Notes to Financial Statements.
62
Columbia Select Large Cap Growth Fund
March 31, 2009
Common Stocks (continued)
| | | | | |
| | | Shares | | Value ($) | |
| Telecommunication Services – 3.7% | |
| Wireless Telecommunication Services – 3.7% | |
America Movil SAB de CV, Series L, ADR | | 1,120,331 | | 30,338,563 | |
| | | | | |
Wireless Telecommunication Services Total | | 30,338,563 | |
| | | | | |
Telecommunication Services Total | | 30,338,563 | |
| | | | | |
Total Common Stocks
(cost of $979,140,081) | | 796,608,505 | |
| | | | | |
Short-Term Obligation – 4.1% | |
| | | Par ($) | | | |
Repurchase agreement with Fixed Income Clearing Corp., dated 03/31/09, due 04/01/09 at 0.140%, collateralized by a U.S. Government Agency Obligation maturing 01/15/13, market value $34,034,000 (repurchase proceeds $33,365,130) | | 33,365,000 | | 33,365,000 | |
| | | | | |
Total Short-Term Obligation
(cost of $33,365,000) | | 33,365,000 | |
| | | | | |
Total Investments – 101.5%
(cost of $1,012,505,081)(b) | | 829,973,505 | |
| | | | | |
Other Assets & Liabilities, Net – (1.5)% | | (12,303,350 | ) |
| | | | | |
Net Assets – 100.0% | | 817,670,155 | |
Notes to Investment Portfolio:
On April 1, 2008, the Fund adopted Statement of Financial Accounting Standards No. 157, Fair Value Measurements (“SFAS 157”). SFAS 157 establishes a hierarchy that prioritizes the inputs to valuation techniques used to measure fair value giving the highest priority to unadjusted quoted prices in active markets for identical securities (level 1 measurements) and the lowest priority to unobservable inputs (level 3 measurements) when market prices are not readily available or reliable. The three levels of the fair value hierarchy under SFAS 157 are described below:
| | • | | Level 1 – quoted prices in active markets for identical securities |
| | • | | Level 2 – prices determined using other significant observable inputs (including quoted prices for similar securities, interest rates, prepayment speeds, credit risk and others) |
| | • | | Level 3 – prices determined using significant unobservable inputs. In situations where quoted prices or observable inputs are unavailable or less reliable, unobservable inputs may be used. Unobservable inputs may include management’s own assumptions about the factors market participants would use in pricing an investment. |
The inputs or methodology used for valuing securities are not necessarily an indication of the risk associated with investing in those securities.
The following table summarizes the inputs used, as of March 31, 2009 in valuing the Fund’s assets:
| | | | | | |
Valuation Inputs | | Investments in
Securities | | Other Financial
Instruments |
Level 1 – Quoted Prices | | $ | 796,608,505 | | $ | — |
Level 2 – Other Significant Observable Inputs | | | 33,365,000 | | | — |
Level 3 – Significant Unobservable Inputs | | | — | | | — |
| | | | | | |
Total | | $ | 829,973,505 | | $ | — |
| | | | | | |
| (a) | Non-income producing security. |
| (b) | Cost for federal income tax purposes is $1,014,403,574. |
At March 31, 2009, the Fund held investments in the following sectors:
| | | |
Sector (Unaudited) | | % of
Net Assets | |
Health Care | | 29.9 | |
Information Technology | | 25.9 | |
Consumer Discretionary | | 14.7 | |
Financials | | 8.7 | |
Industrials | | 7.3 | |
Energy | | 4.2 | |
Telecommunication Services | | 3.7 | |
Consumer Staples | | 3.0 | |
| | | |
| | 97.4 | |
Short-Term Obligation | | 4.1 | |
Other Assets & Liabilities | | (1.5 | ) |
| | | |
| | 100.0 | |
| | | |
| | |
Acronym | | Name |
| ADR | | American Depositary Receipt |
See Accompanying Notes to Financial Statements.
63
Investment Portfolio – Columbia Select Opportunities Fund
March 31, 2009
Common Stocks – 97.6%
| | | | |
| | | Shares | | Value ($) |
| Consumer Discretionary – 9.7% | | | | |
| Auto Components – 2.3% | | | | |
BorgWarner, Inc. | | 157,070 | | 3,188,521 |
| | | | |
Auto Components Total | | | | 3,188,521 |
| |
Hotels, Restaurants & Leisure – 1.8% | | |
Bally Technologies, Inc. (a) | | 29,753 | | 548,050 |
Carnival Corp. | | 33,022 | | 713,275 |
Starbucks Corp. (a) | | 61,038 | | 678,132 |
WMS Industries, Inc. (a) | | 24,126 | | 504,475 |
| | | | |
Hotels, Restaurants & Leisure Total | | 2,443,932 |
| | |
Media – 3.2% | | | | |
Comcast Corp., Class A | | 91,231 | | 1,244,391 |
DIRECTV Group, Inc. (a) | | 37,028 | | 843,868 |
John Wiley & Sons, Inc., Class A | | 78,312 | | 2,332,132 |
| | | | |
Media Total | | | | 4,420,391 |
| | |
Multiline Retail – 1.0% | | | | |
Target Corp. | | 37,823 | | 1,300,733 |
| | | | |
Multiline Retail Total | | | | 1,300,733 |
| | |
Specialty Retail – 1.4% | | | | |
Best Buy Co., Inc. | | 16,900 | | 641,524 |
Lowe’s Companies, Inc. | | 50,456 | | 920,822 |
Urban Outfitters, Inc. (a) | | 19,814 | | 324,355 |
| | | | |
Specialty Retail Total | | | | 1,886,701 |
| | | | |
Consumer Discretionary Total | | | | 13,240,278 |
| | | | |
| Consumer Staples – 7.4% | | | | |
| Beverages – 1.7% | | | | |
Molson Coors Brewing Co., Class B | | 14,013 | | 480,365 |
PepsiCo, Inc. | | 36,387 | | 1,873,203 |
| | | | |
Beverages Total | | | | 2,353,568 |
| | |
Food Products – 2.8% | | | | |
Archer Daniels Midland Co. | | 86,940 | | 2,415,193 |
Kraft Foods, Inc., Class A | | 36,088 | | 804,402 |
Sanderson Farms, Inc. | | 15,671 | | 588,446 |
| | | | |
Food Products Total | | | | 3,808,041 |
| | |
Household Products – 0.9% | | | | |
Procter & Gamble Co. | | 27,338 | | 1,287,347 |
| | | | |
Household Products Total | | | | 1,287,347 |
| | |
Personal Products – 1.5% | | | | |
Avon Products, Inc. | | 47,729 | | 917,828 |
Herbalife Ltd. | | 26,309 | | 394,109 |
Mead Johnson Nutrition Co., Class A (a) | | 23,832 | | 688,030 |
| | | | |
Personal Products Total | | | | 1,999,967 |
| | | | |
| | | Shares | | Value ($) |
Tobacco – 0.5% | | | | |
Philip Morris International, Inc. | | 18,384 | | 654,103 |
| | | | |
Tobacco Total | | | | 654,103 |
| | | | |
Consumer Staples Total | | | | 10,103,026 |
| | | | |
| Energy – 13.8% | | | | |
| Energy Equipment & Services – 1.4% | | |
Core Laboratories N.V. | | 11,547 | | 844,779 |
Schlumberger Ltd. | | 16,691 | | 677,988 |
Wellstream Holdings PLC | | 63,406 | | 393,025 |
| | | | |
Energy Equipment & Services Total | | 1,915,792 |
| |
Oil, Gas & Consumable Fuels – 12.4% | | |
Apache Corp. | | 82,037 | | 5,257,751 |
Cimarex Energy Co. | | 126,597 | | 2,326,853 |
Exxon Mobil Corp. | | 53,574 | | 3,648,389 |
Noble Energy, Inc. | | 12,925 | | 696,399 |
Peabody Energy Corp. | | 14,221 | | 356,094 |
Petroleo Brasileiro SA, ADR | | 150,889 | | 4,597,588 |
| | | | |
Oil, Gas & Consumable Fuels Total | | | | 16,883,074 |
| | | | |
Energy Total | | | | 18,798,866 |
| | | | |
| Financials – 14.7% | | | | |
| Capital Markets – 3.5% | | | | |
Goldman Sachs Group, Inc. | | 44,232 | | 4,689,477 |
| | | | |
Capital Markets Total | | | | 4,689,477 |
| | |
Commercial Banks – 2.0% | | | | |
First Horizon National Corp. | | 80,973 | | 869,650 |
Wells Fargo & Co. | | 128,841 | | 1,834,696 |
| | | | |
Commercial Banks Total | | | | 2,704,346 |
| |
Diversified Financial Services – 6.3% | | |
Hong Kong Exchanges & Clearing Ltd. | | 154,900 | | 1,459,944 |
JPMorgan Chase & Co. | | 124,315 | | 3,304,293 |
NASDAQ OMX Group, Inc. (a) | | 126,002 | | 2,467,119 |
Singapore Exchange Ltd. | | 408,385 | | 1,369,383 |
| | | | |
Diversified Financial Services Total | | 8,600,739 |
| | |
Insurance – 2.9% | | | | |
Berkshire Hathaway Inc., Class A (a) | | 45 | | 3,901,500 |
| | | | |
Insurance Total | | 3,901,500 |
| | | | |
Financials Total | | | | 19,896,062 |
See Accompanying Notes to Financial Statements.
64
Columbia Select Opportunities Fund
March 31, 2009
Common Stocks (continued)
| | | | |
| | | Shares | | Value ($) |
| Health Care – 11.8% | | | | |
| Biotechnology – 1.8% | | | | |
Gilead Sciences, Inc. (a) | | 21,379 | | 990,275 |
OSI Pharmaceuticals, Inc. (a) | | 10,535 | | 403,069 |
Seattle Genetics, Inc. (a) | | 33,619 | | 331,484 |
Senomyx, Inc. (a) | | 398,956 | | 634,340 |
| | | | |
Biotechnology Total | | 2,359,168 |
|
Health Care Equipment & Supplies – 1.4% |
Becton Dickinson & Co. | | 28,226 | | 1,897,916 |
| | | | |
Health Care Equipment & Supplies Total | | 1,897,916 |
|
Health Care Providers & Services – 0.5% |
Aetna, Inc. | | 17,019 | | 414,072 |
AMERIGROUP Corp. (a) | | 9,727 | | 267,882 |
| | | | |
Health Care Providers & Services Total | | 681,954 |
|
Life Sciences Tools & Services – 0.6% |
Life Technologies Corp. (a) | | 16,977 | | 551,413 |
QIAGEN N.V. (a) | | 17,726 | | 282,907 |
| | | | |
Life Sciences Tools & Services Total | | 834,320 |
|
Pharmaceuticals – 7.5% |
Abbott Laboratories | | 35,416 | | 1,689,343 |
Johnson & Johnson | | 67,187 | | 3,534,036 |
Novo Nordisk A/S, ADR | | 103,495 | | 4,965,690 |
| | | | |
Pharmaceuticals Total | | | | 10,189,069 |
| | | | |
Health Care Total | | | | 15,962,427 |
| | | | |
| Industrials – 12.0% | | | | |
| Air Freight & Logistics – 1.9% | | | | |
Expeditors International Washington, Inc. | | 89,840 | | 2,541,574 |
| | | | |
Air Freight & Logistics Total | | 2,541,574 |
|
Building Products – 1.3% |
Simpson Manufacturing Co., Inc. | | 99,801 | | 1,798,414 |
| | | | |
Building Products Total | | 1,798,414 |
|
Construction & Engineering – 5.8% |
Granite Construction, Inc. | | 57,051 | | 2,138,271 |
Quanta Services, Inc. (a) | | 268,230 | | 5,753,534 |
| | | | |
Construction & Engineering Total | | | | 7,891,805 |
|
Electrical Equipment – 2.4% |
American Superconductor Corp. (a) | | 188,685 | | 3,266,137 |
| | | | |
Electrical Equipment Total | | 3,266,137 |
|
Industrial Conglomerates – 0.6% |
General Electric Co. | | 79,009 | | 798,781 |
| | | | |
Industrial Conglomerates Total | | | | 798,781 |
| | | | |
Industrials Total | | | | 16,296,711 |
| | | | |
| | | Shares | | Value ($) |
| Information Technology – 17.6% |
| Communications Equipment – 0.5% | | |
Brocade Communications Systems, Inc. (a) | | 212,015 | | 731,452 |
| | | | |
Communications Equipment Total | | 731,452 |
|
Computers & Peripherals – 6.5% |
Apple, Inc. (a) | | 36,393 | | 3,825,632 |
Hewlett-Packard Co. | | 76,791 | | 2,461,920 |
International Business Machines Corp. | | 26,661 | | 2,583,184 |
| | | | |
Computers & Peripherals Total | | 8,870,736 |
|
Electronic Equipment, Instruments & Components – 0.4% |
LG Display Co., Ltd., ADR | | 51,194 | | 523,202 |
| | | | |
Electronic Equipment, Instruments & Components Total | | 523,202 |
|
Internet Software & Services – 1.4% |
Google, Inc., Class A (a) | | 5,319 | | 1,851,331 |
| | | | |
Internet Software & Services Total | | 1,851,331 |
|
IT Services – 3.8% |
Affiliated Computer Services, Inc., Class A (a) | | 19,379 | | 928,060 |
Fiserv, Inc. (a) | | 21,282 | | 775,942 |
Hewitt Associates, Inc., Class A | | 19,121 | | 569,041 |
MasterCard, Inc., Class A | | 16,829 | | 2,818,521 |
| | | | |
IT Services Total | | 5,091,564 |
|
Semiconductors & Semiconductor Equipment – 1.6% |
Altera Corp. | | 30,157 | | 529,255 |
Intel Corp. | | 83,175 | | 1,251,784 |
Linear Technology Corp. | | 19,860 | | 456,383 |
| | | | |
Semiconductors & Semiconductor Equipment Total | | 2,237,422 |
|
Software – 3.4% |
Microsoft Corp. | | 173,994 | | 3,196,270 |
Nintendo Co., Ltd. | | 2,000 | | 574,835 |
Oracle Corp. | | 44,362 | | 801,621 |
| | | | |
Software Total | | | | 4,572,726 |
| | | | |
Information Technology Total | | | | 23,878,433 |
| | | | |
| Materials – 8.6% | | | | |
| Chemicals – 3.2% | | | | |
Huabao International Holdings Ltd. | | 3,700,286 | | 3,045,935 |
Monsanto Co. | | 15,865 | | 1,318,382 |
| | | | |
Chemicals Total | | | | 4,364,317 |
See Accompanying Notes to Financial Statements.
65
Columbia Select Opportunities Fund
March 31, 2009
Common Stocks (continued)
| | | | |
| | | Shares | | Value ($) |
| Construction Materials – 2.0% | | | | |
Vulcan Materials Co. | | 59,771 | | 2,647,257 |
| | | | |
Construction Materials Total | | | | 2,647,257 |
| | |
Metals & Mining – 3.4% | | | | |
ArcelorMittal, SA | | 20,721 | | 415,249 |
Cliffs Natural Resources, Inc. | | 20,560 | | 373,370 |
Kaiser Aluminum Corp. | | 26,361 | | 609,466 |
Nucor Corp. | | 84,670 | | 3,231,854 |
| | | | |
Metals & Mining Total | | | | 4,629,939 |
| | | | |
Materials Total | | | | 11,641,513 |
| | | | |
| Utilities – 2.0% | | | | |
| Electric Utilities – 0.3% | | | | |
Northeast Utilities | | 21,715 | | 468,827 |
| | | | |
Electric Utilities Total | | | | 468,827 |
|
Independent Power Producers & Energy Traders – 1.0% |
AES Corp. (a) | | 222,349 | | 1,291,848 |
| | | | |
Independent Power Producers & Energy Traders Total | | 1,291,848 |
| | |
Multi-Utilities – 0.7% | | | | |
Public Service Enterprise Group, Inc. | | 33,656 | | 991,842 |
| | | | |
Multi-Utilities Total | | | | 991,842 |
| | | | |
Utilities Total | | | | 2,752,517 |
| | | | |
Total Common Stocks
(cost of $141,091,154) | | | | 132,569,833 |
| | | | |
Short-Term Obligation – 3.0%
| | | | | |
| | | Par ($) | | Value ($) | |
Repurchase agreement with Fixed Income Clearing Corp., dated 03/31/09, due 04/01/09 at 0.140%, collateralized by a U.S. Government Agency Obligation maturing 01/15/13, market value $4,169,000 (repurchase proceeds $4,083,016) | | 4,083,000 | | 4,083,000 | |
| | | | | |
Total Short-Term Obligation
(cost of $4,083,000) | | | | 4,083,000 | |
| | | | | |
Total Investments – 100.6%
(cost of $145,174,154)(b) | | | | 136,652,833 | |
| | | | | |
Other Assets & Liabilities, Net – (0.6)% | | (847,441 | ) |
| | | | | |
Net Assets – 100.0% | | | | 135,805,392 | |
Notes to Investment Portfolio:
On April 1, 2008, the Fund adopted Statement of Financial Accounting Standards No. 157, Fair Value Measurements (“SFAS 157”). SFAS 157 establishes a hierarchy that prioritizes the inputs to valuation techniques used to measure fair value giving the highest priority to unadjusted quoted prices in active markets for identical securities (level 1 measurements) and the lowest priority to unobservable inputs (level 3 measurements) when market prices are not readily available or reliable. The three levels of the fair value hierarchy under SFAS 157 are described below:
| | • | | Level 1 – quoted prices in active markets for identical securities |
| | • | | Level 2 – prices determined using other significant observable inputs (including quoted prices for similar securities, interest rates, prepayment speeds, credit risk and others) |
| | • | | Level 3 – prices determined using significant unobservable inputs. In situations where quoted prices or observable inputs are unavailable or less reliable, unobservable inputs may be used. Unobservable inputs may include management’s own assumptions about the factors market participants would use in pricing an investment. |
The inputs or methodology used for valuing securities are not necessarily an indication of the risk associated with investing in those securities.
The following table summarizes the inputs used, as of March 31, 2009 in valuing the Fund’s assets:
| | | | | | |
Valuation Inputs | | Investments in
Securities | | Other Financial
Instruments |
Level 1 – Quoted Prices | | $ | 125,726,710 | | $ | — |
Level 2 – Other Significant Observable Inputs | | | 10,926,123 | | | — |
Level 3 – Significant Unobservable Inputs | | | — | | | — |
| | | | | | |
Total | | $ | 136,652,833 | | $ | — |
| | | | | | |
The Fund’s assets assigned to the Level 2 input category include certain foreign securities for which a third party statistical pricing service may be employed for the purposes of fair market valuation.
See Accompanying Notes to Financial Statements.
66
Columbia Select Opportunities Fund
March 31, 2009
The following table reconciles asset balances for the year ended March 31, 2009 in which significant unobservable inputs (Level 3) were used in determining value:
| | | | | | | |
| | | Investments in
Securities | | | Other Financial
Instruments |
Balance as of March 31, 2008 | | $ | 6,801,145 | | | $ | — |
Accretion of discounts/Amortization of Premiums | | | — | | | | — |
Realized loss | | | (4,960,916 | ) | | | — |
Change in unrealized appreciation | | | 1,182,930 | | | | — |
Net sales | | | (3,023,159 | ) | | | — |
Transfers in and/or
out of Level 3 | | | — | | | | — |
| | | | | | | |
Balance as of March 31, 2009 | | $ | — | | | $ | — |
| | | | | | | |
The change in unrealized gains attributable to securities owned at March 31, 2009 which were valued using significant unobservable inputs (Level 3) amounted to $1,182,930. This amount is included in net change in unrealized appreciation (depreciation) on the Statements of Changes in Net Assets.
The information in the above reconciliation represents fiscal year to date activity for any securities identified as using Level 3 inputs at either the beginning or the end of the current fiscal period.
| (a) | Non-income producing security. |
| (b) | Cost for federal income tax purposes is $146,231,577. |
At March 31, 2009, the Fund held investments in the following sectors:
| | | |
Sector (Unaudited) | | % of
Net Assets | |
Information Technology | | 17.6 | |
Financials | | 14.7 | |
Energy | | 13.8 | |
Industrials | | 12.0 | |
Health Care | | 11.8 | |
Consumer Discretionary | | 9.7 | |
Materials | | 8.6 | |
Consumer Staples | | 7.4 | |
Utilities | | 2.0 | |
| | | |
| | 97.6 | |
Short-Term Obligation | | 3.0 | |
Other Assets & Liabilities, Net | | (0.6 | ) |
| | | |
| | 100.0 | |
| | | |
| | |
Acronym | | Name |
| ADR | | American Depositary Receipt |
See Accompanying Notes to Financial Statements.
67
Investment Portfolio – Columbia Select Small Cap Fund
March 31, 2009
Common Stocks – 98.1%
| | | | |
| | | Shares | | Value ($) |
| Consumer Cyclical – 5.2% | | | | |
|
Home Builders – 5.2% |
Meritage Home Corp. (a) | | 640,000 | | 7,308,800 |
Ryland Group, Inc. | | 620,000 | | 10,329,200 |
| | | | |
Home Builders Total | | 17,638,000 |
| | | | |
| Consumer Discretionary – 10.9% | | | | |
| Auto Components – 1.0% | | | | |
Drew Industries, Inc. (a) | | 373,000 | | 3,237,640 |
| | | | |
Auto Components Total | | 3,237,640 |
|
Automobiles – 2.7% |
Thor Industries, Inc. | | 580,000 | | 9,059,600 |
| | | | |
Automobiles Total | | 9,059,600 |
|
Specialty Retail – 5.6% |
Hibbett Sports, Inc. (a) | | 540,000 | | 10,378,800 |
Williams-Sonoma, Inc. | | 820,000 | | 8,265,600 |
| | | | |
Specialty Retail Total | | 18,644,400 |
|
Textiles, Apparel & Luxury Goods – 1.6% |
Columbia Sportswear Co. | | 180,000 | | 5,385,600 |
| | | | |
Textiles, Apparel & Luxury Goods Total | | 5,385,600 |
| | | | |
Consumer Discretionary Total | | | | 36,327,240 |
| | | | |
| Consumer Staples – 1.0% |
| Food & Staples Retailing – 1.0% | | | | |
Whole Foods Market, Inc. | | 200,000 | | 3,360,000 |
| | | | |
Food & Staples Retailing Total | | 3,360,000 |
| | | | |
Consumer Staples Total | | 3,360,000 |
| | | | |
| Energy – 5.0% |
| Energy Equipment & Services – 2.2% |
Helmerich & Payne, Inc. | | 320,000 | | 7,286,400 |
| | | | |
Energy Equipment & Services Total | | 7,286,400 |
|
Oil, Gas & Consumable Fuels – 2.8% |
Walter Industries, Inc. | | 420,000 | | 9,605,400 |
| | | | |
Oil, Gas & Consumable Fuels Total | | 9,605,400 |
| | | | |
Energy Total | | | | 16,891,800 |
| | | | |
| Financials – 11.5% | | | | |
| Capital Markets – 8.4% | | | | |
Cowen Group, Inc. (a) | | 600,000 | | 2,922,000 |
Greenhill & Co., Inc. | | 180,000 | | 13,293,000 |
KBW, Inc. (a) | | 580,000 | | 11,803,000 |
| | | | |
Capital Markets Total | | 28,018,000 |
| |
Commercial Banks – 1.4% | | |
Wilmington Trust Corp. | | 500,000 | | 4,845,000 |
| | | | |
Commercial Banks Total | | 4,845,000 |
| | | | |
| | | Shares | | Value ($) |
Real Estate Management & Development – 1.7% |
St. Joe Co. (a) | | 340,000 | | 5,691,600 |
| | | | |
Real Estate Management & Development Total | | 5,691,600 |
| | | | |
Financials Total | | | | 38,554,600 |
| | | | |
| Health Care – 1.5% |
| Health Care Providers & Services – 1.5% |
Molina Healthcare, Inc. (a) | | 260,000 | | 4,945,200 |
| | | | |
Health Care Providers & Services Total | | 4,945,200 |
| | | | |
Health Care Total | | 4,945,200 |
| | | | |
| Industrials – 27.6% | | | | |
| Aerospace & Defense – 4.1% | | | | |
Innovative Solutions & Support, Inc. (b) | | 1,000,000 | | 4,230,000 |
Triumph Group, Inc. | | 245,000 | | 9,359,000 |
| | | | |
Aerospace & Defense Total | | 13,589,000 |
|
Building Products – 3.6% |
Quanex Building Products Corp. | | 400,000 | | 3,040,000 |
Simpson Manufacturing Co., Inc. | | 500,000 | | 9,010,000 |
| | | | |
Building Products Total | | 12,050,000 |
|
Construction & Engineering – 3.1% |
Shaw Group, Inc. (a) | | 380,000 | | 10,415,800 |
| | | | |
Construction & Engineering Total | | 10,415,800 |
|
Electrical Equipment – 3.2% |
Regal-Beloit Corp. | | 350,000 | | 10,724,000 |
| | | | |
Electrical Equipment Total | | 10,724,000 |
|
Machinery – 2.6% |
Kaydon Corp. | | 320,000 | | 8,745,600 |
| | | | |
Machinery Total | | 8,745,600 |
|
Marine – 1.6% |
Diana Shipping, Inc. | | 460,000 | | 5,423,400 |
| | | | |
Marine Total | | 5,423,400 |
|
Professional Services – 8.2% |
FTI Consulting, Inc. (a) | | 220,000 | | 10,885,600 |
MPS Group, Inc. (a) | | 1,240,000 | | 7,378,000 |
Navigant Consulting, Inc. (a) | | 700,000 | | 9,149,000 |
| | | | |
Professional Services Total | | 27,412,600 |
|
Road & Rail – 1.2% |
Kansas City Southern (a) | | 320,000 | | 4,067,200 |
| | | | |
Road & Rail Total | | 4,067,200 |
| | | | |
Industrials Total | | 92,427,600 |
See Accompanying Notes to Financial Statements.
68
Columbia Select Small Cap Fund
March 31, 2009
Common Stocks (continued)
| | | | |
| | | Shares | | Value ($) |
| Information Technology – 30.1% |
| Communications Equipment – 3.1% |
F5 Networks, Inc. (a) | | 500,000 | | 10,475,000 |
| | | | |
Communications Equipment Total | | 10,475,000 |
|
Electronic Equipment, Instruments & Components – 5.7% |
FLIR Systems, Inc. (a) | | 480,000 | | 9,830,400 |
Rogers Corp. (a) | | 490,000 | | 9,251,200 |
| | | | |
Electronic Equipment, Instruments & Components Total | | 19,081,600 |
|
IT Services – 9.7% |
CACI International, Inc., Class A (a) | | 240,000 | | 8,757,600 |
Forrester Research, Inc. (a) | | 630,000 | | 12,952,800 |
Hewitt Associates, Inc., Class A (a) | | 360,000 | | 10,713,600 |
| | | | |
IT Services Total | | 32,424,000 |
|
Semiconductors & Semiconductor Equipment – 7.6% |
Cabot Microelectronics Corp. (a) | | 340,000 | | 8,170,200 |
Power Integrations, Inc. | | 600,000 | | 10,320,000 |
Varian Semiconductor Equipment Associates, Inc. (a) | | 320,000 | | 6,931,200 |
| | | | |
Semiconductors & Semiconductor Equipment Total | | 25,421,400 |
|
Software – 4.0% |
Manhattan Associates, Inc. (a) | | 780,000 | | 13,509,600 |
| | | | |
Software Total | | 13,509,600 |
| | | | |
Information Technology Total | | 100,911,600 |
| | | | |
| Materials – 1.7% |
| Chemicals – 1.7% |
OM Group, Inc. (a) | | 300,000 | | 5,796,000 |
| | | | |
Chemicals Total | | 5,796,000 |
| | | | |
Materials Total | | 5,796,000 |
| | | | |
| Utilities – 3.6% |
| Water Utilities – 3.6% |
Aqua America, Inc. | | 600,000 | | 12,000,000 |
| | | | |
Water Utilities Total | | 12,000,000 |
| | | | |
Utilities Total | | 12,000,000 |
| | | | |
Total Common Stocks
(cost of $416,265,663) | | | | 328,852,040 |
Short-Term Obligation – 2.0%
| | | | | |
| | | Par ($) | | Value ($) | |
Repurchase agreement with Fixed Income Clearing Corp., dated 03/31/09, due 04/01/09 at 0.140%, collateralized by a U.S. Government Agency Obligation maturing 01/15/13, market value $6,737,500 (repurchase proceeds $6,604,026) | | 6,604,000 | | 6,604,000 | |
| | | | | |
Total Short-Term Obligation
(cost of $6,604,000) | | 6,604,000 | |
| | | | | |
Total Investments – 100.1%
(cost of $422,869,663)(c) | | 335,456,040 | |
| | | | | |
Other Assets & Liabilities, Net – (0.1)% | | (219,104 | ) |
| | | | | |
Net Assets – 100.0% | | 335,236,936 | |
Notes to Investment Portfolio:
On April 1, 2008, the Fund adopted Statement of Financial Accounting Standards No. 157, Fair Value Measurements (“SFAS 157”). SFAS 157 establishes a hierarchy that prioritizes the inputs to valuation techniques used to measure fair value giving the highest priority to unadjusted quoted prices in active markets for identical securities (level 1 measurements) and the lowest priority to unobservable inputs (level 3 measurements) when market prices are not readily available or reliable. The three levels of the fair value hierarchy under SFAS 157 are described below:
| | • | | Level 1 – quoted prices in active markets for identical securities |
| | • | | Level 2 – prices determined using other significant observable inputs (including quoted prices for similar securities, interest rates, prepayment speeds, credit risk and others) |
| | • | | Level 3 – prices determined using significant unobservable inputs. In situations where quoted prices or observable inputs are unavailable or less reliable, unobservable inputs may be used. Unobservable inputs may include management’s own assumptions about the factors market participants would use in pricing an investment. |
The inputs or methodology used for valuing securities are not necessarily an indication of the risk associated with investing in those securities.
The following table summarizes the inputs used, as of March 31, 2009 in valuing the Fund’s assets:
| | | | | | |
Valuation Inputs | | Investments in
Securities | | Other Financial
Instruments |
Level 1 – Quoted Prices | | $ | 328,852,040 | | $ | — |
Level 2 – Other Significant Observable Inputs | | | 6,604,000 | | | — |
Level 3 – Significant Unobservable Inputs | | | — | | | — |
| | | | | | |
Total | | $ | 335,456,040 | | $ | — |
| | | | | | |
| (a) | Non-income producing security. |
See Accompanying Notes to Financial Statements.
69
Columbia Select Small Cap Fund
March 31, 2009
| (b) | An affiliate may include any company in which the Fund owns five percent or more of its outstanding voting shares. Transactions in this affiliated company during the twelve months ended March 31, 2009, are as follows: Security name: Innovative Solutions & Support, Inc. |
| | | | |
Shares as of 03/31/08: | | | 1,000,000 | |
Shares purchased: | | | 40,000 | |
Shares sold: | | | (40,000 | ) |
Shares as of 03/31/09: | | | 1,000,000 | |
Net realized loss: | | $ | (286,999 | ) |
Dividend income earned: | | $ | 1,000,000 | |
Value at end of period: | | $ | 4,230,000 | |
| (c) | Cost for federal income tax purposes is $428,093,260. |
At March 31, 2009, the Fund held investments in the following sectors:
| | | |
Sector (Unaudited) | | % of
Net Assets | |
Information Technology | | 30.1 | |
Industrials | | 27.6 | |
Financials | | 11.5 | |
Consumer Discretionary | | 10.9 | |
Consumer Cyclical | | 5.2 | |
Energy | | 5.0 | |
Utilities | | 3.6 | |
Materials | | 1.7 | |
Health Care | | 1.5 | |
Consumer Staples | | 1.0 | |
| | | |
| | 98.1 | |
Short-Term Obligation | | 2.0 | |
Other Assets & Liabilities, Net | | (0.1 | ) |
| | | |
| | 100.0 | |
| | | |
See Accompanying Notes to Financial Statements.
70
Investment Portfolio – Columbia Value and Restructuring Fund
March 31, 2009
Common Stocks – 99.5%
| | | | |
| | | Shares | | Value ($) |
| Consumer Discretionary – 4.6% | | |
| Household Durables – 2.4% | | | | |
Black & Decker Corp. | | 2,825,000 | | 89,157,000 |
Newell Rubbermaid, Inc. | | 3,500,000 | | 22,330,000 |
| | | | |
Household Durables Total | | | | 111,487,000 |
| | |
Media – 0.3% | | | | |
CBS Corp., Class B | | 3,200,000 | | 12,288,000 |
| | | | |
Media Total | | | | 12,288,000 |
| | |
Specialty Retail – 1.9% | | | | |
TJX Companies, Inc. | | 3,400,000 | | 87,176,000 |
| | | | |
Specialty Retail Total | | | | 87,176,000 |
| | | | |
Consumer Discretionary Total | | | | 210,951,000 |
| | | | |
| Consumer Staples – 8.1% | | | | |
| Food Products – 1.2% | | | | |
Dean Foods Co. (a) | | 3,000,000 | | 54,240,000 |
| | | | |
Food Products Total | | | | 54,240,000 |
| | |
Personal Products – 1.6% | | | | |
Avon Products, Inc. | | 3,700,000 | | 71,151,000 |
Mead Johnson Nutrition Co., Class A (a) | | 169,544 | | 4,894,735 |
| | | | |
Personal Products Total | | | | 76,045,735 |
| | |
Tobacco – 5.3% | | | | |
Lorillard, Inc. | | 3,925,000 | | 242,329,500 |
| | | | |
Tobacco Total | | | | 242,329,500 |
| | | | |
Consumer Staples Total | | | | 372,615,235 |
| | | | |
| Energy – 23.8% | | | | |
| Energy Equipment & Services – 0.0% | | |
Hercules Offshore, Inc. (a) | | 1,400,000 | | 2,212,000 |
| | | | |
Energy Equipment & Services Total | | 2,212,000 |
| |
Oil, Gas & Consumable Fuels – 23.8% | | |
Alpha Natural Resources, Inc. (a)(b) | | 3,875,000 | | 68,781,250 |
Anadarko Petroleum Corp. | | 2,425,000 | | 94,308,250 |
ConocoPhillips | | 3,100,000 | | 121,396,000 |
CONSOL Energy, Inc. | | 4,650,000 | | 117,366,000 |
Devon Energy Corp. | | 2,500,000 | | 111,725,000 |
El Paso Corp. | | 5,700,000 | | 35,625,000 |
Foundation Coal Holdings, Inc. | | 1,900,000 | | 27,265,000 |
General Maritime Corp. | | 1,000,000 | | 7,000,000 |
Murphy Oil Corp. | | 1,100,000 | | 49,247,000 |
Noble Energy, Inc. | | 2,150,000 | | 115,842,000 |
PetroHawk Energy Corp. (a) | | 4,050,000 | | 77,881,500 |
Petroleo Brasileiro SA, ADR | | 7,750,000 | | 236,142,500 |
| | | | |
| | | Shares | | Value ($) |
Rosetta Resources, Inc. (a) | | 200,000 | | 990,000 |
Rosetta Resources, Inc. (a)(c)(d) | | 2,750,000 | | 13,612,500 |
W&T Offshore, Inc. | | 2,450,000 | | 15,067,500 |
| | | | |
Oil, Gas & Consumable Fuels Total | | 1,092,249,500 |
| | | | |
Energy Total | | | | 1,094,461,500 |
| | | | |
| Financials – 16.1% | | | | |
| Capital Markets – 5.9% | | | | |
Apollo Investment Corp. (e) | | 3,150,000 | | 10,962,000 |
Goldman Sachs Group, Inc. | | 900,000 | | 95,418,000 |
Invesco Ltd. | | 5,875,000 | | 81,427,500 |
Morgan Stanley | | 3,700,000 | | 84,249,000 |
| | | | |
Capital Markets Total | | | | 272,056,500 |
| | |
Commercial Banks – 1.2% | | | | |
PNC Financial Services Group, Inc. | | 1,900,000 | | 55,651,000 |
| | | | |
Commercial Banks Total | | | | 55,651,000 |
| |
Diversified Financial Services – 2.0% | | |
CIT Group, Inc. | | 5,000,000 | | 14,250,000 |
JPMorgan Chase & Co. | | 2,925,000 | | 77,746,500 |
| | | | |
Diversified Financial Services Total | | 91,996,500 |
| | |
Insurance – 6.3% | | | | |
ACE Ltd. | | 3,650,000 | | 147,460,000 |
Loews Corp. | | 2,150,000 | | 47,515,000 |
MetLife, Inc. | | 2,750,000 | | 62,617,500 |
Tower Group, Inc. | | 1,350,000 | | 33,250,500 |
| | | | |
Insurance Total | | | | 290,843,000 |
|
Real Estate Investment Trusts (REITs) – 0.7% |
DiamondRock Hospitality Co. | | 4,900,000 | | 19,649,000 |
Host Hotels & Resorts, Inc. | | 2,500,000 | | 9,800,000 |
Vintage Wine Trust, Inc. (c)(d) | | 2,140,500 | | 791,985 |
| | | | |
Real Estate Investment Trusts (REITs) Total | | 30,240,985 |
| | | | |
Financials Total | | | | 740,787,985 |
| | | | |
| Health Care – 6.3% | | | | |
| Health Care Equipment & Supplies – 2.2% |
Baxter International, Inc. | | 2,000,000 | | 102,440,000 |
| | | | |
Health Care Equipment & Supplies Total | | 102,440,000 |
| |
Health Care Providers & Services – 1.8% | | |
AmerisourceBergen Corp. | | 2,500,000 | | 81,650,000 |
| | | | |
Health Care Providers & Services Total | | 81,650,000 |
See Accompanying Notes to Financial Statements.
71
Columbia Value and Restructuring Fund
March 31, 2009
Common Stocks (continued)
| | | | |
| | | Shares | | Value ($) |
| Pharmaceuticals – 2.3% | | |
Bristol-Myers Squibb Co. | | 4,700,000 | | 103,024,000 |
| | | | |
Pharmaceuticals Total | | 103,024,000 |
| | | | |
Health Care Total | | | | 287,114,000 |
| | | | |
| Industrials – 15.1% |
| Aerospace & Defense – 3.1% |
AerCap Holdings NV (a)(b) | | 5,000,000 | | 16,250,000 |
Empresa Brasileira de Aeronautica SA, ADR | | 2,850,000 | | 37,819,500 |
United Technologies Corp. | | 2,025,000 | | 87,034,500 |
| | | | |
Aerospace & Defense Total | | 141,104,000 |
|
Airlines – 1.3% |
Copa Holdings SA, Class A | | 2,100,000 | | 60,207,000 |
| | | | |
Airlines Total | | 60,207,000 |
|
Construction & Engineering – 1.1% |
AECOM Technology Corp. (a) | | 1,950,000 | | 50,856,000 |
| | | | |
Construction & Engineering Total | | 50,856,000 |
|
Industrial Conglomerates – 1.4% |
Tyco International Ltd. | | 3,200,000 | | 62,592,000 |
| | | | |
Industrial Conglomerates Total | | 62,592,000 |
|
Machinery – 3.1% |
AGCO Corp. (a) | | 3,600,000 | | 70,560,000 |
Eaton Corp. | | 2,000,000 | | 73,720,000 |
| | | | |
Machinery Total | | 144,280,000 |
|
Road & Rail – 4.6% |
Ryder System, Inc. | | 2,075,000 | | 58,743,250 |
Union Pacific Corp. | | 3,750,000 | | 154,162,500 |
| | | | |
Road & Rail Total | | 212,905,750 |
|
Trading Companies & Distributors – 0.5% |
RSC Holdings, Inc. (a) | | 4,500,000 | | 23,670,000 |
| | | | |
Trading Companies & Distributors Total | | 23,670,000 |
| | | | |
Industrials Total | | 695,614,750 |
| | | | |
| Information Technology – 8.8% |
| Communications Equipment – 5.4% |
CommScope, Inc. (a) | | 2,800,000 | | 31,808,000 |
Harris Corp. | | 5,400,000 | | 156,276,000 |
Nokia Oyj, ADR | | 5,200,000 | | 60,684,000 |
| | | | |
Communications Equipment Total | | 248,768,000 |
| | | | |
| | | Shares | | Value ($) |
Computers & Peripherals – 3.4% |
International Business Machines Corp. | | 1,600,000 | | 155,024,000 |
| | | | |
Computers & Peripherals Total | | 155,024,000 |
| | | | |
Information Technology Total | | 403,792,000 |
| | | | |
| Materials – 10.8% |
| Chemicals – 3.9% |
Celanese Corp., Series A | | 5,175,000 | | 69,189,750 |
Lanxess AG | | 2,150,000 | | 36,648,766 |
PPG Industries, Inc. | | 1,950,000 | | 71,955,000 |
| | | | |
Chemicals Total | | 177,793,516 |
|
Metals & Mining – 6.9% |
Cia Vale do Rio Doce, ADR | | 3,850,000 | | 51,205,000 |
Freeport-McMoRan Copper & Gold, Inc. | | 1,850,000 | | 70,503,500 |
Grupo Mexico SAB de CV, Series B | | 54,560,182 | | 39,750,165 |
Schnitzer Steel Industries, Inc., Class A | | 1,800,000 | | 56,502,000 |
Southern Copper Corp. | | 5,475,000 | | 95,374,500 |
Sterlite Industries India Ltd., ADR | | 800,000 | | 5,656,000 |
| | | | |
Metals & Mining Total | | 318,991,165 |
| | | | |
Materials Total | | | | 496,784,681 |
| | | | |
| Telecommunication Services – 3.8% |
| Diversified Telecommunication Services – 0.7% |
DataPath, Inc. (a)(d) | | 1,842,000 | | 92,100 |
Windstream Corp. | | 3,875,000 | | 31,232,500 |
| | | | |
Diversified Telecommunication Services Total | | 31,324,600 |
|
Wireless Telecommunication Services – 3.1% |
America Movil SAB de CV, Series L, ADR | | 5,325,000 | | 144,201,000 |
| | | | |
Wireless Telecommunication Services Total | | 144,201,000 |
| | | | |
Telecommunication Services Total | | 175,525,600 |
| | | | |
| Utilities – 2.1% |
| Electric Utilities – 2.1% |
Enel SpA | | 6,100,000 | | 29,277,361 |
Entergy Corp. | | 950,000 | | 64,685,500 |
| | | | |
Electric Utilities Total | | 93,962,861 |
| | | | |
Utilities Total | | 93,962,861 |
| | | | |
Total Common Stocks
(cost of $6,030,844,357) | | 4,571,609,612 |
See Accompanying Notes to Financial Statements.
72
Columbia Value and Restructuring Fund
March 31, 2009
Convertible Preferred Stock – 0.2%
| | | | |
| | | Shares | | Value ($) |
| Materials – 0.2% | | | | |
| Chemicals – 0.2% | | | | |
Celanese Corp., 4.250% | | 500,000 | | 10,200,000 |
| | | | |
Chemicals Total | | | | 10,200,000 |
| | | | |
Materials Total | | | | 10,200,000 |
| | | | |
Total Convertible Preferred Stock
(cost of $11,789,117) | | 10,200,000 |
| | | | |
Short-Term Obligation – 0.1% | | | | |
| | | Par ($) | | |
Repurchase agreement with Fixed Income Clearing Corp., dated 03/31/09, due 04/01/09 at 0.140%, collateralized by a U.S. Government Agency Obligation maturing 12/31/09, market value $3,089,475 (repurchase proceeds $3,025,012) | | 3,025,000 | | 3,025,000 |
| | | | |
Total Short-Term Obligation (cost of $3,025,000) | | | | 3,025,000 |
| | | | |
Total Investments – 99.8%
(cost of $6,045,658,474)(f) | | 4,584,834,612 |
| | | | |
Other Assets & Liabilities, Net – 0.2% | | 8,696,460 |
| | | | |
Net Assets – 100.0% | | | | 4,593,531,072 |
Notes to Investment Portfolio:
On April 1, 2008, the Fund adopted Statement of Financial Accounting Standards No. 157, Fair Value Measurements (“SFAS 157”). SFAS 157 establishes a hierarchy that prioritizes the inputs to valuation techniques used to measure fair value giving the highest priority to unadjusted quoted prices in active markets for identical securities (level 1 measurements) and the lowest priority to unobservable inputs (level 3 measurements) when market prices are not readily available or reliable. The three levels of the fair value hierarchy under SFAS 157 are described below:
| | • | | Level 1 – quoted prices in active markets for identical securities |
| | • | | Level 2 – prices determined using other significant observable inputs (including quoted prices for similar securities, interest rates, prepayment speeds, credit risk and others) |
| | • | | Level 3 – prices determined using significant unobservable inputs. In situations where quoted prices or observable inputs are unavailable or less reliable, unobservable inputs may be used. Unobservable inputs may include management’s own assumptions about the factors market participants would use in pricing an investment. |
The inputs or methodology used for valuing securities are not necessarily an indication of the risk associated with investing in those securities.
The following table summarizes the inputs used, as of March 31, 2009 in valuing the Fund’s assets:
| | | | | | |
Valuation Inputs | | Investments in
Securities | | Other Financial
Instruments |
Level 1 – Quoted Prices | | $ | 4,501,386,900 | | $ | — |
Level 2 – Other Significant Observable Inputs | | | 82,655,727 | | | — |
Level 3 – Significant Unobservable Inputs | | | 791,985 | | | — |
| | | | | | |
Total | | $ | 4,584,834,612 | | $ | — |
| | | | | | |
The Fund’s assets assigned to the Level 2 input category include certain foreign securities for which a third party statistical pricing service may be employed for purposes of fair market valuation.
The following table reconciles asset balances for the year ended March 31, 2009 in which significant unobservable inputs (Level 3) were used in determining value:
| | | | | | | |
| | | Investments in
Securities | | | Other Financial
Instruments |
Balance as of March 31, 2008 | | $ | — | | | $ | — |
Accretion of discounts/Amortization of premiums | | | — | | | | — |
Realized gain (loss) | | | — | | | | — |
Change in unrealized appreciation (depreciation) | | | 535,125 | | | | — |
Net sales | | | (14,191,515 | ) | | | — |
Transfers into Level 3 | | | 14,448,375 | | | | — |
| | | | | | | |
Balance as of March 31, 2009 | | $ | 791,985 | | | $ | — |
| | | | | | | |
The change in unrealized gains attributable to securities owned at March 31, 2009 which were valued using significant unobservable inputs (Level 3) amounted to $535,125. This amount is included in net change in unrealized appreciation (depreciation) on the Statements of Changes in Net Assets.
The information in the above reconciliation represents fiscal year to date activity for any securities identified as using Level 3 inputs at either the beginning or the end of the current fiscal period.
| (a) | Non-income producing security. |
| (b) | An affiliate may include any company in which the Fund owns five percent or more of its outstanding voting shares. Transactions in these affiliated companies during the twelve months ended March 31, 2009, are as follows: |
| Security | name: AerCap Holdings NV |
| | | | |
Shares as of 03/31/08: | | | 5,000,000 | |
Shares purchased: | | | 1,100,000 | |
Shares sold: | | | (1,100,000 | ) |
Shares as of 03/31/09: | | | 5,000,000 | |
Net realized gain/loss: | | $ | (22,268,907 | ) |
Dividend income earned: | | $ | — | |
Value at end of period: | | $ | 16,250,000 | |
| Security | name: Alpha Natural Resources, Inc. |
| | | | |
Shares as of 03/31/08: | | | 3,700,000 | |
Shares purchased: | | | 300,000 | |
Shares sold: | | | (125,000 | ) |
Shares as of 03/31/09: | | | 3,875,000 | |
Net realized gain/loss: | | $ | (289,557 | ) |
Dividend income earned: | | $ | — | |
Value at end of period: | | $ | 68,781,250 | |
See Accompanying Notes to Financial Statements.
73
Columbia Value and Restructuring Fund
March 31, 2009
| Security | name: Arlington Tankers Ltd. |
| | | | |
Shares as of 03/31/08: | | | 1,000,000 | |
Shares purchased: | | | — | |
Shares sold: | | | (1,000,000 | ) |
Shares as of 03/31/09: | | | — | |
Net realized gain/loss: | | $ | — | |
Dividend income earned: | | $ | 1,690,000 | |
Value at end of period: | | $ | — | |
| Security | name: Castlepoint Holdings Ltd. |
| | | | |
Shares as of 03/31/08: | | | 3,323,260 | |
Shares purchased: | | | — | |
Shares sold: | | | (3,323,260 | ) |
Shares as of 03/31/09: | | | — | |
Net realized gain/loss: | | $ | 9,548,531 | |
Dividend income earned: | | $ | 493,489 | |
Value at end of period: | | $ | — | |
| Security | name: Omega Navigation Enterprises, Inc., Class A |
| | | | |
Shares as of 03/31/08: | | | 1,000,000 | |
Shares purchased: | | | — | |
Shares sold: | | | (1,000,000 | ) |
Shares as of 03/31/09: | | | — | |
Net realized gain/loss: | | $ | (9,097,896 | ) |
Dividend income earned: | | $ | 1,503,626 | |
Value at end of period: | | $ | — | |
| Security | name: Primus Guaranty Ltd. |
| | | | |
Shares as of 03/31/08: | | | 4,000,000 | |
Shares purchased: | | | — | |
Shares sold: | | | (4,000,000 | ) |
Shares as of 03/31/09: | | | — | |
Net realized gain/loss: | | $ | (45,802,831 | ) |
Dividend income earned: | | $ | — | |
Value at end of period: | | $ | — | |
| Security | name: United Rentals, Inc. |
| | | | |
Shares as of 03/31/08: | | | 4,300,000 | |
Shares purchased: | | | — | |
Shares sold: | | | (4,300,000 | ) |
Shares as of 03/31/09: | | | — | |
Net realized gain/loss: | | $ | (24,076,834 | ) |
Dividend income earned: | | $ | — | |
Value at end of period: | | $ | — | |
| (c) | Represents fair value as determined in good faith under procedures approved by the Board of Trustees. |
| (d) | Security exempt from registration pursuant to Rule 144A under the Securities Act of 1933. These securities may be resold in transactions exempt from registration, normally to qualified institutional buyers. At March 31, 2009, these securities, which are not illiquid, except for those in the following table, amounted to $14,496,585, which represents 0.3% of net assets. |
| | | | | | | | | | |
Security | | Acquisition
Date | | Shares | | Cost | | Value |
DataPath, Inc. | | 06/23/06 | | 1,842,000 | | $ | 20,262,000 | | $ | 92,100 |
Vintage Wine Trust, Inc. | | 03/16/05 –
01/04/07 | | 2,140,500 | | | 5,477,730 | | | 791,985 |
| | | | | | | | | | |
| | | | | | | | | $ | 884,085 |
| | | | | | | | | | |
| (e) | Closed-end Management Investment Company. |
| (f) | Cost for federal income tax purposes is $6,051,048,166. |
At March 31, 2009, the Fund held investments in the following sectors:
| | |
Sector (Unaudited) | | % of
Net Assets |
Energy | | 23.8 |
Financials | | 16.1 |
Industrials | | 15.1 |
Materials | | 11.0 |
Information Technology | | 8.8 |
Consumer Staples | | 8.1 |
Health Care | | 6.3 |
Consumer Discretionary | | 4.6 |
Telecommunication Services | | 3.8 |
Utilities | | 2.1 |
| | |
| | 99.7 |
Short Term Obligation | | 0.1 |
Other Assets & Liabilities, Net | | 0.2 |
| | |
| | 100.0 |
| | |
| | |
Acronym | | Name |
| ADR | | American Depositary Receipt |
See Accompanying Notes to Financial Statements.
74
Investment Portfolio – Columbia Emerging Markets Fund
March 31, 2009
Common Stocks – 85.8%
| | | | |
| | | Shares | | Value ($) |
| Consumer Discretionary – 4.1% |
| Auto Components – 1.2% |
Hyundai Mobis | | 48,250 | | 2,776,577 |
| | | | |
Auto Components Total | | 2,776,577 |
|
Automobiles – 0.6% |
Hero Honda Motors Ltd. | | 65,206 | | 1,377,892 |
| | | | |
Automobiles Total | | 1,377,892 |
|
Diversified Consumer Services – 0.7% |
MegaStudy Co., Ltd. | | 11,313 | | 1,623,445 |
| | | | |
Diversified Consumer Services Total | | 1,623,445 |
|
Hotels, Restaurants & Leisure – 0.8% |
Resorts World Bhd | | 3,364,000 | | 1,974,752 |
| | | | |
Hotels, Restaurants & Leisure Total | | 1,974,752 |
|
Household Durables – 0.6% |
Urbi Desarrollos Urbanos SAB de CV (a) | | 603,000 | | 529,567 |
Woongjin Coway Co., Ltd. | | 41,700 | | 901,377 |
| | | | |
Household Durables Total | | 1,430,944 |
|
Leisure Equipment & Products – 0.2% |
Giant Manufacturing Co., Ltd. | | 300,000 | | 617,481 |
| | | | |
Leisure Equipment & Products Total | | 617,481 |
| | | | |
Consumer Discretionary Total | | 9,801,091 |
| | | | |
| Consumer Staples – 6.6% |
| Beverages – 1.4% |
Cia de Bebidas das Americas, ADR | | 31,200 | | 1,489,800 |
Fomento Economico Mexicano SAB de CV, ADR | | 24,783 | | 624,779 |
Lotte Chilsung Beverage Co., Ltd. | | 1,878 | | 1,167,598 |
| | | | |
Beverages Total | | 3,282,177 |
|
Food & Staples Retailing – 1.0% |
BIM Birlesik Magazalar AS | | 48,000 | | 1,017,591 |
Magnit OAO, GDR (a)(b)(c) | | 40,000 | | 232,000 |
Massmart Holdings Ltd. | | 167,000 | | 1,227,047 |
| | | | |
Food & Staples Retailing Total | | 2,476,638 |
|
Food Products – 1.3% |
PT Bisi International (a) | | 4,704,500 | | 631,066 |
Want Want China Holdings Ltd. | | 5,160,000 | | 2,396,718 |
| | | | |
Food Products Total | | 3,027,784 |
|
Household Products – 1.8% |
Hindustan Unilever Ltd. | | 631,000 | | 2,935,795 |
Hypermarcas SA (a) | | 193,600 | | 1,414,601 |
| | | | |
Household Products Total | | 4,350,396 |
| | | | |
| | | Shares | | Value ($) |
Tobacco – 1.1% |
KT&G Corp. | | 48,768 | | 2,682,989 |
| | | | |
Tobacco Total | | 2,682,989 |
| | | | |
Consumer Staples Total | | 15,819,984 |
| | | | |
| Energy – 11.0% |
| Energy Equipment & Services – 0.2% |
Wellstream Holdings PLC | | 87,800 | | 544,233 |
| | | | |
Energy Equipment & Services Total | | 544,233 |
|
Oil, Gas & Consumable Fuels – 10.8% |
Cairn India Ltd. (a) | | 613,000 | | 2,221,951 |
CNOOC Ltd. | | 4,760,000 | | 4,735,066 |
LUKOIL, ADR | | 138,329 | | 5,187,338 |
OGX Petroleo e Gas Participacoes SA (a) | | 2,600 | | 796,907 |
PetroChina Co., Ltd., Class H | | 6,500,000 | | 5,166,052 |
Rosneft Oil Co., GDR | | 243,000 | | 1,042,470 |
Sasol Ltd. | | 187,036 | | 5,429,918 |
Straits Asia Resources Ltd. | | 838,000 | | 454,551 |
Yanzhou Coal Mining Co., Ltd., Class H | | 992,000 | | 712,905 |
| | | | |
Oil, Gas & Consumable Fuels Total | | 25,747,158 |
| | | | |
Energy Total | | | | 26,291,391 |
| | | | |
| Financials – 21.2% |
| Commercial Banks – 13.8% |
Akbank TAS, ADR (b) | | 115,036 | | 671,086 |
Banco Bradesco SA, ADR | | 35,000 | | 346,500 |
Banco Santander Chile, ADR | | 30,100 | | 1,033,935 |
Bangkok Bank PCL, Foreign Registered Shares | | 690,000 | | 1,449,457 |
Bank of China Ltd., Class H | | 8,313,000 | | 2,767,210 |
Bank of Communications Co., Ltd., Class H | | 1,611,000 | | 1,122,416 |
Bank Rakyat Indonesia | | 2,610,500 | | 948,862 |
China Construction Bank Corp., Class H | | 8,413,000 | | 4,776,043 |
HDFC Bank Ltd., ADR | | 37,817 | | 2,304,190 |
ICICI Bank Ltd., ADR | | 194,084 | | 2,579,376 |
Industrial & Commercial Bank of China, Class H | | 2,728,000 | | 1,411,411 |
Itau Unibanco Banco Multiplo SA, ADR | | 556,937 | | 6,059,480 |
Kasikornbank PCL, Foreign Registered Shares | | 1,108,000 | | 1,398,083 |
PT Bank Central Asia Tbk | | 4,153,000 | | 1,114,176 |
Siam Commercial Bank PCL, Foreign Registered Shares | | 886,000 | | 1,361,540 |
See Accompanying Notes to Financial Statements.
75
Columbia Emerging Markets Fund
March 31, 2009
Common Stocks (continued)
| | | | |
| | | Shares | | Value ($) |
Turkiye Garanti Bankasi AS (a) | | 2,155,900 | | 3,059,945 |
Turkiye Is Bankasi, Class C | | 235,041 | | 528,674 |
| | | | |
Commercial Banks Total | | 32,932,384 |
|
Diversified Financial Services – 0.6% |
BM&F BOVESPA SA | | 442,700 | | 1,341,602 |
| | | | |
Diversified Financial Services Total | | 1,341,602 |
|
Insurance – 4.9% |
China Life Insurance Co., Ltd., Class H | | 2,013,000 | | 6,674,851 |
Ping An Insurance Group Co., Ltd., Class H | | 852,000 | | 5,100,612 |
| | | | |
Insurance Total | | 11,775,463 |
|
Real Estate Management & Development – 1.9% |
China Overseas Land & Investment Ltd. | | 1,003,440 | | 1,579,486 |
China Vanke Co., Ltd., Class B | | 2,397,980 | | 2,506,082 |
DLF Ltd. | | 152,000 | | 501,823 |
| | | | |
Real Estate Management & Development Total | | 4,587,391 |
| | | | |
Financials Total | | 50,636,840 |
| | | | |
| Health Care – 3.4% |
| Pharmaceuticals – 3.4% |
Pharmstandard, Series S, GDR (a)(b)(c) | | 25,000 | | 240,000 |
Teva Pharmaceutical Industries Ltd., ADR | | 175,600 | | 7,910,780 |
| | | | |
Pharmaceuticals Total | | 8,150,780 |
| | | | |
Health Care Total | | 8,150,780 |
| | | | |
| Industrials – 2.9% |
| Construction & Engineering – 0.5% |
Aveng Ltd. | | 128,000 | | 352,008 |
Murray & Roberts Holdings Ltd. | | 223,100 | | 953,872 |
| | | | |
Construction & Engineering Total | | 1,305,880 |
|
Electrical Equipment – 1.3% |
Bharat Heavy Electricals Ltd. | | 44,675 | | 1,329,639 |
LS Cable Ltd. | | 29,709 | | 1,670,964 |
| | | | |
Electrical Equipment Total | | 3,000,603 |
|
Machinery – 0.5% |
China South Locomotive and Rolling Stock Corp., Class H (a) | | 2,573,604 | | 1,175,465 |
| | | | |
Machinery Total | | 1,175,465 |
| | | | |
| | | Shares | | Value ($) |
Road & Rail – 0.6% |
All America Latina Logistica SA | | 324,700 | | 1,382,923 |
| | | | |
Road & Rail Total | | 1,382,923 |
| | | | |
Industrials Total | | 6,864,871 |
| | | | |
| Information Technology – 12.0% |
| Computers & Peripherals – 0.3% |
Acer, Inc. | | 415,000 | | 624,115 |
| | | | |
Computers & Peripherals Total | | 624,115 |
|
Electronic Equipment, Instruments & Components – 1.9% |
HON HAI Precision Industry Co., Ltd. | | 1,814,869 | | 4,104,755 |
Suprema, Inc. | | 17,740 | | 500,170 |
| | | | |
Electronic Equipment, Instruments & Components Total | | 4,604,925 |
|
Internet Software & Services – 0.6% |
NHN Corp. (a) | | 12,546 | | 1,369,562 |
| | | | |
Internet Software & Services Total | | 1,369,562 |
|
IT Services – 2.6% |
Infosys Technologies Ltd. | | 19,986 | | 522,350 |
Infosys Technologies Ltd., ADR | | 101,038 | | 2,690,642 |
Redecard SA | | 253,600 | | 3,066,486 |
| | | | |
IT Services Total | | 6,279,478 |
|
Semiconductors & Semiconductor Equipment – 6.6% |
Samsung Electronics Co., Ltd. | | 21,600 | | 8,869,546 |
Taiwan Semiconductor Manufacturing Co., Ltd. | | 487,881 | | 739,475 |
Taiwan Semiconductor Manufacturing Co., Ltd., ADR | | 694,048 | | 6,211,730 |
| | | | |
Semiconductors & Semiconductor Equipment Total | | 15,820,751 |
| | | | |
Information Technology Total | | 28,698,831 |
| | | | |
| Materials – 10.9% |
| Chemicals – 2.6% |
Hyosung Corp. | | 25,382 | | 1,187,215 |
Israel Chemicals Ltd. | | 527,039 | | 4,274,269 |
Sociedad Quimica y Minera de Chile SA, ADR | | 26,050 | | 691,888 |
| | | | |
Chemicals Total | | 6,153,372 |
|
Construction Materials – 1.5% |
Pretoria Portland Cement Co., Ltd. | | 146,000 | | 483,815 |
PT Indocement Tunggal Prakarsa Tbk | | 6,667,200 | | 3,029,234 |
| | | | |
Construction Materials Total | | 3,513,049 |
See Accompanying Notes to Financial Statements.
76
Columbia Emerging Markets Fund
March 31, 2009
Common Stocks (continued)
| | | | |
| | | Shares | | Value ($) |
| Metals & Mining – 6.8% |
AngloGold Ashanti Ltd., ADR | | 52,350 | | 1,924,386 |
ArcelorMittal South Africa Ltd. | | 122,900 | | 948,429 |
BHP Billiton Ltd., ADR | | 72,819 | | 3,247,727 |
Cia de Minas Buenaventura SA, ADR | | 23,500 | | 563,530 |
Cia Vale do Rio Doce | | 467,800 | | 6,251,450 |
Freeport-McMoRan Copper & Gold, Inc. | | 20,357 | | 775,805 |
Gold Fields Ltd., ADR | | 125,600 | | 1,424,304 |
Harmony Gold Mining Co., Ltd. (a) | | 103,450 | | 1,096,586 |
| | | | |
Metals & Mining Total | | 16,232,217 |
| | | | |
Materials Total | | 25,898,638 |
| | | | |
| Telecommunication Services – 12.3% |
| Diversified Telecommunication Services – 2.4% |
Chunghwa Telecom Co., Ltd., ADR | | 305,507 | | 5,569,392 |
| | | | |
Diversified Telecommunication Services Total | | 5,569,392 |
|
Wireless Telecommunication Services – 9.9% |
America Movil SAB de CV, Series L, ADR | | 106,066 | | 2,872,267 |
China Mobile Ltd., ADR | | 176,167 | | 7,666,788 |
Mobile TeleSystems OJSC, ADR | | 25,533 | | 763,947 |
MTN Group Ltd. | | 418,376 | | 4,637,580 |
Philippine Long Distance Telephone Co., ADR | | 58,930 | | 2,600,581 |
SK Telecom Co., Ltd. | | 25,957 | | 3,602,924 |
Turkcell Iletisim Hizmet AS, ADR | | 126,395 | | 1,553,395 |
| | | | |
Wireless Telecommunication Services Total | | 23,697,482 |
| | | | |
Telecommunication Services Total | | 29,266,874 |
| | | | |
| Utilities – 1.4% |
| Electric Utilities – 0.4% |
Tenaga Nasional Bhd | | 564,200 | | 944,074 |
| | | | |
Electric Utilities Total | | 944,074 |
|
Independent Power Producers & Energy Traders – 0.6% |
Datang International Power Generation Co., Ltd., Class H | | 3,446,000 | | 1,511,676 |
| | | | |
Independent Power Producers & Energy Traders Total | | 1,511,676 |
| | | | |
| | | Shares | | Value ($) |
Water Utilities – 0.4% | | | | |
Thai Tap Water Supply PCL, Foreign Registered Shares | | 6,981,800 | | 893,765 |
| | | | |
Water Utilities Total | | 893,765 |
| | | | |
Utilities Total | | 3,349,515 |
| | | | |
Total Common Stocks
(cost of $186,700,577) | | 204,778,815 |
| | |
Preferred Stocks – 7.2% | | | | |
| | | | |
| Energy – 5.1% |
| Oil, Gas & Consumable Fuels – 5.1% | | |
Petroleo Brasileiro SA | | 991,400 | | 12,201,518 |
| | | | |
Oil, Gas & Consumable Fuels Total | | 12,201,518 |
| | | | |
Energy Total | | | | 12,201,518 |
| | | | |
| Utilities – 2.1% |
| Electric Utilities – 2.1% |
Cia Energetica de Minas Gerais | | 335,451 | | 4,987,479 |
| | | | |
Electric Utilities Total | | 4,987,479 |
| | | | |
Utilities Total | | | | 4,987,479 |
| | | | |
Total Preferred Stocks
(cost of $7,074,400) | | 17,188,997 |
| | |
Investment Companies – 3.9% | | | | |
India Fund, Inc. | | 150,755 | | 2,552,282 |
iShares MSCI Emerging Markets Index Fund | | 211,360 | | 5,243,842 |
iShares MSCI South Korea Index Fund | | 50,600 | | 1,440,582 |
| | | | |
Total Investment Companies
(cost of $8,753,410) | | 9,236,706 |
See Accompanying Notes to Financial Statements.
77
Columbia Emerging Markets Fund
March 31, 2009
Short-Term Obligation – 2.5%
| | | | |
| | | Par ($) | | Value ($) |
Repurchase agreement with Fixed Income Clearing Corp., dated 03/31/09, due 04/01/09 at 0.140%, collateralized by a U.S. Government Agency Obligation maturing 01/15/13, market value $6,044,500 (repurchase proceeds $5,924,023) | | 5,924,000 | | 5,924,000 |
| | | | |
Total Short-Term Obligation
(cost of $5,924,000) | | 5,924,000 |
| | | | |
Total Investments – 99.4%
(cost of $208,452,387)(d) | | | | 237,128,518 |
| | | | |
Other Assets & Liabilities, Net – 0.6% | | 1,442,484 |
| | | | |
Net Assets – 100.0% | | | | 238,571,002 |
Notes to Investment Portfolio:
On April 1, 2008, the Fund adopted Statement of Financial Accounting Standards No. 157, Fair Value Measurements (“SFAS 157”). SFAS 157 establishes a hierarchy that prioritizes the inputs to valuation techniques used to measure fair value giving the highest priority to unadjusted quoted prices in active markets for identical securities (level 1 measurements) and the lowest priority to unobservable inputs (level 3 measurements) when market prices are not readily available or reliable. The three levels of the fair value hierarchy under SFAS 157 are described below:
| | • | | Level 1 – quoted prices in active markets for identical securities |
| | • | | Level 2 – prices determined using other significant observable inputs (including quoted prices for similar securities, interest rates, prepayment speeds, credit risk and others) |
| | • | | Level 3 – prices determined using significant unobservable inputs. In situations where quoted prices or observable inputs are unavailable or less reliable, unobservable inputs may be used. Unobservable inputs may include management’s own assumptions about the factors market participants would use in pricing an investment. |
The inputs or methodology used for valuing securities are not necessarily an indication of the risk associated with investing in those securities.
The following table summarizes the inputs used, as of March 31, 2009 in valuing the Fund’s assets:
| | | | | | |
Valuation Inputs | | Investments in
Securities | | Other Financial
Instruments |
Level 1 – Quoted Prices | | $ | 108,344,269 | | $ | — |
Level 2 – Other Significant Observable Inputs | | | 128,784,249 | | | — |
Level 3 – Significant Unobservable Inputs | | | — | | | — |
| | | | | | |
Total | | $ | 237,128,518 | | $ | — |
| | | | | | |
The Fund’s assets assigned to the Level 2 input category include certain foreign securities for which a third party statistical pricing service may be employed for purposes of fair market valuation.
The following table reconciles asset balances for the year ended March 31, 2009 in which significant unobservable inputs (Level 3) were used in determining value:
| | | | | | | |
| | | Investments in
Securities | | | Other Financial
Instruments |
Balance as of March 31, 2008 | | $ | — | | | $ | — |
Accretion of discounts/Amortization of premiums | | | — | | | | — |
Realized gain (loss) | | | — | | | | — |
Change in unrealized depreciation | | | 11,278 | | | | — |
Net sales | | | | | | | — |
Transfers out of Level 3 | | | (11,278 | ) | | | — |
| | | | | | | |
Balance as of March 31, 2009 | | $ | — | | | $ | — |
| | | | | | | |
The change in unrealized gains attributable to securities owned at March 31, 2009 which were valued using significant unobservable inputs (Level 3) amounted to $11,278. This amount is included in net change in unrealized appreciation (depreciation) on the Statements of Changes in Net Assets.
The information in the above reconciliation represents fiscal year to date activity for any securities identified as using Level 3 inputs at either the beginning or the end of the current fiscal period.
| (a) | Non-income producing security. |
| (b) | Security exempt from registration pursuant to Rule 144A under the Securities Act of 1933. These securities may be resold in transactions exempt from registration, normally to qualified institutional buyers. At March 31, 2009, these securities, which are not illiquid, amounted to $1,143,086, which represents 0.5% of net assets. |
| (c) | Represents fair value as determined in good faith under procedures approved by the Board of Trustees. |
| (d) | Cost for federal income tax purposes is $209,370,698. |
At March 31, 2009, the Fund was invested in the following countries:
| | | | | |
Country (Unaudited) | | Value | | % of Total
Investments |
Brazil | | $ | 39,338,745 | | 16.6 |
China | | | 35,321,441 | | 14.9 |
South Korea | | | 26,352,367 | | 11.1 |
South Africa | | | 18,477,946 | | 7.8 |
Taiwan | | | 17,866,948 | | 7.5 |
India | | | 16,463,659 | | 7.0 |
United States* | | | 15,936,511 | | 6.7 |
Hong Kong | | | 13,981,340 | | 5.9 |
Israel | | | 12,185,048 | | 5.1 |
Russia | | | 7,465,755 | | 3.2 |
Turkey | | | 6,830,691 | | 2.9 |
Indonesia | | | 5,723,338 | | 2.4 |
Thailand | | | 5,102,844 | | 2.2 |
Mexico | | | 4,026,614 | | 1.7 |
Australia | | | 3,247,727 | | 1.4 |
Malaysia | | | 2,918,826 | | 1.2 |
Philippines | | | 2,600,581 | | 1.1 |
Chile | | | 1,725,823 | | 0.7 |
Peru | | | 563,530 | | 0.2 |
United Kingdom | | | 544,233 | | 0.2 |
Singapore | | | 454,551 | | 0.2 |
| | | | | |
| | $ | 237,128,518 | | 100.0 |
| | | | | |
*Includes short-term obligation and investment companies.
Certain securities are listed by country of underlying exposure but may trade predominantly on another exchange.
| | |
Acronym | | Name |
| ADR | | American Depositary Receipt |
| GDR | | Global Depositary Receipt |
See Accompanying Notes to Financial Statements.
78
Investment Portfolio – Columbia International Growth Fund
March 31, 2009
Common Stocks – 98.1%
| | | | |
| | | Shares | | Value ($) |
| Consumer Discretionary – 7.5% |
| Hotels, Restaurants & Leisure – 1.0% |
OPAP SA | | 64,450 | | 1,697,152 |
| | | | |
Hotels, Restaurants & Leisure Total | | 1,697,152 |
|
Household Durables – 0.9% |
Panasonic Corp. | | 133,800 | | 1,444,989 |
| | | | |
Household Durables Total | | 1,444,989 |
|
Media – 2.0% |
Jupiter Telecommunications Co., Ltd. | | 1,021 | | 678,707 |
Pearson PLC | | 118,549 | | 1,193,251 |
Vivendi | | 58,424 | | 1,546,621 |
| | | | |
Media Total | | 3,418,579 |
|
Specialty Retail – 2.5% |
Fast Retailing Co., Ltd. | | 17,400 | | 1,963,510 |
Game Group PLC | | 559,065 | | 1,209,278 |
Hennes & Mauritz AB, Class B | | 25,129 | | 944,699 |
| | | | |
Specialty Retail Total | | 4,117,487 |
|
Textiles, Apparel & Luxury Goods – 1.1% |
Polo Ralph Lauren Corp. | | 42,727 | | 1,805,216 |
| | | | |
Textiles, Apparel & Luxury Goods Total | | 1,805,216 |
| | | | |
Consumer Discretionary Total | | 12,483,423 |
| | | | |
| Consumer Staples – 15.7% |
| Beverages – 1.0% |
Fomento Economico Mexicano SAB de CV, ADR | | 64,996 | | 1,638,549 |
| | | | |
Beverages Total | | 1,638,549 |
|
Food & Staples Retailing – 5.6% |
Carrefour SA | | 32,531 | | 1,270,688 |
FamilyMart Co., Ltd. | | 59,700 | | 1,809,365 |
Koninklijke Ahold NV | | 164,012 | | 1,797,727 |
Wm. Morrison Supermarkets PLC | | 680,357 | | 2,494,217 |
Woolworths Ltd. | | 112,313 | | 1,953,202 |
| | | | |
Food & Staples Retailing Total | | 9,325,199 |
|
Food Products – 6.6% |
Groupe Danone | | 21,830 | | 1,063,262 |
Nestle SA, Registered Shares | | 188,354 | | 6,367,269 |
Nippon Meat Packers, Inc. | | 117,000 | | 1,211,547 |
Unilever NV | | 77,918 | | 1,537,300 |
Yamazaki Baking Co., Ltd. | | 78,000 | | 832,126 |
| | | | |
Food Products Total | | 11,011,504 |
|
Household Products – 0.7% |
Reckitt Benckiser Group PLC | | 28,437 | | 1,068,626 |
| | | | |
Household Products Total | | 1,068,626 |
| | | | |
| | | Shares | | Value ($) |
Tobacco – 1.8% |
British American Tobacco PLC | | 68,516 | | 1,585,743 |
Japan Tobacco, Inc. | | 543 | | 1,436,700 |
| | | | |
Tobacco Total | | 3,022,443 |
| | | | |
Consumer Staples Total | | 26,066,321 |
| | | | |
| Energy – 10.2% |
| Oil, Gas & Consumable Fuels – 10.2% |
BG Group PLC | | 300,170 | | 4,543,873 |
BP PLC | | 452,155 | | 3,058,972 |
Royal Dutch Shell PLC, Class A | | 86,271 | | 1,944,677 |
Royal Dutch Shell PLC, Class B | | 88,734 | | 1,949,269 |
Total SA | | 108,583 | | 5,399,057 |
| | | | |
Oil, Gas & Consumable Fuels Total | | 16,895,848 |
| | | | |
Energy Total | | 16,895,848 |
| | | | |
| Financials – 10.3% |
| Capital Markets – 0.8% |
UBS AG, Registered Shares (a) | | 137,176 | | 1,289,452 |
| | | | |
Capital Markets Total | | 1,289,452 |
|
Commercial Banks – 5.9% |
Kasikornbank PCL, Foreign Registered Shares | | 1,260,500 | | 1,590,508 |
National Bank of Greece SA | | 23,163 | | 351,135 |
Standard Chartered PLC | | 92,933 | | 1,155,434 |
Sumitomo Mitsui Financial Group, Inc. | | 76,600 | | 2,638,844 |
Sumitomo Trust & Banking Co., Ltd. | | 408,000 | | 1,537,445 |
Westpac Banking Corp. | | 199,515 | | 2,648,408 |
| | | | |
Commercial Banks Total | | 9,921,774 |
|
Insurance – 2.5% |
Assicurazioni Generali SpA | | 53,576 | | 918,236 |
Brit Insurance Holdings PLC | | 578,189 | | 1,497,454 |
Platinum Underwriters Holdings Ltd. | | 61,370 | | 1,740,453 |
| | | | |
Insurance Total | | 4,156,143 |
|
Real Estate Management & Development – 1.1% |
Hongkong Land Holdings Ltd. | | 781,000 | | 1,780,680 |
| | | | |
Real Estate Management & Development Total | | | | 1,780,680 |
| | | | |
Financials Total | | | | 17,148,049 |
See Accompanying Notes to Financial Statements.
79
Columbia International Growth Fund
March 31, 2009
Common Stocks (continued)
| | | | |
| | | Shares | | Value ($) |
| Health Care – 13.0% | | | | |
| Health Care Equipment & Supplies – 1.2% | | |
Synthes, Inc. | | 17,910 | | 1,995,070 |
| | | | |
Health Care Equipment & Supplies Total | | 1,995,070 |
| | |
Pharmaceuticals – 11.8% | | | | |
Astellas Pharma, Inc. | | 31,900 | | 973,259 |
Bayer AG | | 38,218 | | 1,827,952 |
GlaxoSmithKline PLC | | 250,669 | | 3,911,437 |
Novartis AG, Registered Shares | | 114,722 | | 4,341,758 |
Novo-Nordisk A/S, Class B | | 21,744 | | 1,041,366 |
Roche Holding AG, Genusschein Shares | | 32,600 | | 4,473,443 |
Sanofi-Aventis SA, ADR | | 66,041 | | 1,844,525 |
Taisho Pharmaceutical Co., Ltd. | | 61,000 | | 1,126,514 |
| | | | |
Pharmaceuticals Total | | | | 19,540,254 |
| | | | |
Health Care Total | | | | 21,535,324 |
| | | | |
| Industrials – 10.5% | | | | |
| Aerospace & Defense – 1.7% | | | | |
BAE Systems PLC | | 579,516 | | 2,781,429 |
| | | | |
Aerospace & Defense Total | | | | 2,781,429 |
| | |
Building Products – 0.7% | | | | |
Asahi Glass Co., Ltd. | | 239,000 | | 1,253,129 |
| | | | |
Building Products Total | | | | 1,253,129 |
| |
Commercial Services & Supplies – 2.1% | | |
Secom Co., Ltd. | | 55,600 | | 2,038,976 |
Societe BIC SA | | 29,456 | | 1,447,808 |
| | | | |
Commercial Services & Supplies Total | | 3,486,784 |
| | |
Electrical Equipment – 2.1% | | | | |
ABB Ltd., Registered Shares (a) | | 105,512 | | 1,472,886 |
Alstom | | 30,422 | | 1,575,722 |
Gamesa Corp., Tecnologica SA | | 42,677 | | 547,728 |
| | | | |
Electrical Equipment Total | | | | 3,596,336 |
| | |
Industrial Conglomerates – 2.2% | | | | |
Siemens AG, Registered Shares | | 63,713 | | 3,640,757 |
| | | | |
Industrial Conglomerates Total | | | | 3,640,757 |
| | |
| Marine – 0.5% | | | | |
A.P. Moller – Maersk A/S, Class B | | 176 | | 772,267 |
| | | | |
Marine Total | | | | 772,267 |
| | |
| Road & Rail – 0.3% | | | | |
Central Japan Railway Co. | | 85 | | 475,729 |
| | | | |
Road & Rail Total | | | | 475,729 |
| | | | |
| | | Shares | | Value ($) |
Transportation Infrastructure – 0.9% | | |
Zhejiang Expressway Co., Ltd., Class H | | 2,072,000 | | 1,526,478 |
| | | | |
Transportation Infrastructure Total | | 1,526,478 |
| | | | |
Industrials Total | | | | 17,532,909 |
| | | | |
| Information Technology – 9.1% | | | | |
| Communications Equipment – 1.1% |
Nokia Oyj | | 147,369 | | 1,738,655 |
| | | | |
Communications Equipment Total | | 1,738,655 |
|
| Internet Software & Services – 0.7% |
NetEase.com, Inc., ADR (a) | | 39,447 | | 1,059,152 |
| | | | |
Internet Software & Services Total | | 1,059,152 |
|
| IT Services – 0.7% |
Redecard SA | | 93,700 | | 1,133,003 |
| | | | |
IT Services Total | | | | 1,133,003 |
|
| Office Electronics – 1.1% |
Canon, Inc. | | 65,600 | | 1,868,889 |
| | | | |
Office Electronics Total | | | | 1,868,889 |
|
| Semiconductors & Semiconductor Equipment – 2.2% |
Samsung Electronics Co., Ltd. | | 2,657 | | 1,091,036 |
Shinko Electric Industries Co., Ltd. | | 107,400 | | 1,017,742 |
Taiwan Semiconductor Manufacturing Co., Ltd. | | 1,061,000 | | 1,608,145 |
| | | | |
Semiconductors & Semiconductor Equipment Total | | 3,716,923 |
|
| Software – 3.3% |
Dassault Systemes SA | | 40,313 | | 1,567,161 |
Nintendo Co., Ltd. | | 8,700 | | 2,500,531 |
SAP AG | | 41,553 | | 1,472,931 |
| | | | |
Software Total | | | | 5,540,623 |
| | | | |
Information Technology Total | | | | 15,057,245 |
| | | | |
| Materials – 9.7% | | | | |
| Chemicals – 3.4% | | | | |
Shin-Etsu Chemical Co., Ltd. | | 44,000 | | 2,120,321 |
Syngenta AG, Registered Shares | | 11,240 | | 2,265,182 |
Tokuyama Corp. | | 209,000 | | 1,319,644 |
| | | | |
Chemicals Total | | | | 5,705,147 |
| | |
Metals & Mining – 6.3% | | | | |
BHP Billiton PLC | | 286,910 | | 5,701,668 |
Rio Tinto Ltd. | | 53,907 | | 2,120,483 |
Tokyo Steel Manufacturing Co., Ltd. | | 105,600 | | 1,048,692 |
See Accompanying Notes to Financial Statements.
80
Columbia International Growth Fund
March 31, 2009
Common Stocks (continued)
| | | | |
| | | Shares | | Value ($) |
Yamato Kogyo Co., Ltd. | | 73,000 | | 1,548,720 |
| | | | |
Metals & Mining Total | | | | 10,419,563 |
| | | | |
Materials Total | | | | 16,124,710 |
| | | | |
| Telecommunication Services – 4.9% | | |
| Diversified Telecommunication Services – 3.5% |
Nippon Telegraph & Telephone Corp. | | 45,500 | | 1,714,553 |
Telefonica SA | | 205,055 | | 4,091,990 |
| | | | |
Diversified Telecommunication Services Total | | | | 5,806,543 |
|
Wireless Telecommunication Services – 1.4% |
America Movil SAB de CV, Series L, ADR | | 41,239 | | 1,116,752 |
KDDI Corp. | | 73 | | 340,718 |
NTT DoCoMo, Inc. | | 682 | | 921,184 |
| | | | |
Wireless Telecommunication Services Total | | 2,378,654 |
| | | | |
Telecommunication Services Total | | 8,185,197 |
| | | | |
| Utilities – 7.2% | | | | |
| Electric Utilities – 2.8% | | | | |
Cia Energetica de Minas Gerais, ADR | | 105,655 | | 1,561,581 |
Fortum Oyj | | 22,963 | | 437,799 |
Iberdrola SA | | 167,791 | | 1,177,055 |
Tokyo Electric Power Co., Inc. | | 59,400 | | 1,476,224 |
| | | | |
Electric Utilities Total | | | | 4,652,659 |
| | |
Gas Utilities – 0.6% | | | | |
Gas Natural SDG SA | | 79,342 | | 1,084,708 |
| | | | |
Gas Utilities Total | | | | 1,084,708 |
|
Independent Power Producers & Energy Traders – 0.5% |
Drax Group PLC | | 113,701 | | 842,638 |
| | | | |
Independent Power Producers & Energy Traders Total | | 842,638 |
| | |
Multi-Utilities – 3.3% | | | | |
Centrica PLC | | 616,240 | | 2,013,793 |
GDF Suez | | 28,775 | | 988,257 |
National Grid PLC | | 118,958 | | 914,028 |
RWE AG | | 21,440 | | 1,504,303 |
| | | | |
Multi-Utilities Total | | 5,420,381 |
| | | | |
Utilities Total | | | | 12,000,386 |
| | | | |
Total Common Stocks
(cost of $204,574,713) | | | | 163,029,412 |
Investment Companies – 1.7%
| | | | |
| | | Shares | | Value ($) |
iShares FTSE/Xinhua China 25 Index Fund | | 82,281 | | 2,346,654 |
iShares MSCI EAFE Index Fund | | 14,971 | | 562,760 |
| | | | |
Total Investment Companies
(cost of $2,709,417) | | 2,909,414 |
| | | | |
Total Investments – 99.8%
(cost of $207,284,130)(b) | | 165,938,826 |
| | | | |
Other Assets & Liabilities, Net – 0.2% | | 290,165 |
| | | | |
Net Assets – 100.0% | | | | 166,228,991 |
Notes to Investment Portfolio:
On April 1, 2008, the Fund adopted Statement of Financial Accounting Standards No. 157, Fair Value Measurements (“SFAS 157”). SFAS 157 establishes a hierarchy that prioritizes the inputs to valuation techniques used to measure fair value giving the highest priority to unadjusted quoted prices in active markets for identical securities (level 1 measurements) and the lowest priority to unobservable inputs (level 3 measurements) when market prices are not readily available or reliable. The three levels of the fair value hierarchy under SFAS 157 are described below:
| | • | | Level 1 – quoted prices in active markets for identical securities |
| | • | | Level 2 – prices determined using other significant observable inputs (including quoted prices for similar securities, interest rates, prepayment speeds, credit risk and others) |
| | • | | Level 3 – prices determined using significant unobservable inputs. In situations where quoted prices or observable inputs are unavailable or less reliable, unobservable inputs may be used. Unobservable inputs may include management’s own assumptions about the factors market participants would use in pricing an investment. |
The inputs or methodology used for valuing securities are not necessarily an indication of the risk associated with investing in those securities.
The following table summarizes the inputs used, as of March 31, 2009 in valuing the Fund’s assets:
| | | | | | |
Valuation Inputs | | Investments in
Securities | | Other Financial
Instruments* |
Level 1 – Quoted Prices | | $ | 16,589,326 | | $ | — |
Level 2 – Other Significant Observable Inputs | | | 149,349,500 | | | 303,195 |
Level 3 – Significant Unobservable Inputs | | | — | | | — |
| | | | | | |
Total | | $ | 165,938,826 | | $ | 303,195 |
| | | | | | |
* Other financial instruments consist of forward foreign currency exchange contracts which are not included in the investment portfolio.
The Fund’s assets assigned to the Level 2 input category include certain foreign securities for which a third party statistical pricing service may be employed for purposes of fair market valuation.
| (a) | Non-income producing security. |
| (b) | Cost for federal income tax purposes is $214,793,261. |
See Accompanying Notes to Financial Statements.
81
Columbia International Growth Fund
March 31, 2009
Forward foreign currency exchange contracts outstanding on March 31, 2009 are:
| | | | | | | | | | | | |
Forward Foreign
Currency
Contracts to Buy | | Value | | Aggregate
Face
Value | | Settlement
Date | | Unrealized
Appreciation (Depreciation) | |
AUD | | $ | 3,007,349 | | $ | 2,790,966 | | 04/30/09 | | $ | 216,383 | |
AUD | | | 2,007,444 | | | 1,876,371 | | 04/30/09 | | | 131,073 | |
AUD | | | 274,783 | | | 257,439 | | 04/30/09 | | | 17,344 | |
AUD | | | 338,622 | | | 315,717 | | 04/30/09 | | | 22,905 | |
BRL | | | 802,225 | | | 782,765 | | 04/30/09 | | | 19,460 | |
CHF | | | 2,549,949 | | | 2,492,911 | | 04/30/09 | | | 57,038 | |
CHF | | | 669,790 | | | 658,772 | | 04/30/09 | | | 11,018 | |
CHF | | | 254,907 | | | 254,369 | | 04/30/09 | | | 538 | |
DKK | | | 600,117 | | | 576,147 | | 04/30/09 | | | 23,970 | |
DKK | | | 291,057 | | | 280,722 | | 04/30/09 | | | 10,335 | |
EUR | | | 1,297,956 | | | 1,247,531 | | 04/30/09 | | | 50,425 | |
EUR | | | 2,033,952 | | | 1,967,082 | | 04/30/09 | | | 66,870 | |
EUR | | | 480,921 | | | 463,070 | | 04/30/09 | | | 17,851 | |
EUR | | | 163,407 | | | 153,759 | | 04/30/09 | | | 9,648 | |
EUR | | | 336,113 | | | 340,702 | | 04/30/09 | | | (4,589 | ) |
GBP | | | 3,738,027 | | | 3,811,636 | | 04/30/09 | | | (73,609 | ) |
GBP | | | 495,055 | | | 478,377 | | 04/30/09 | | | 16,678 | |
GBP | | | 426,178 | | | 423,189 | | 04/30/09 | | | 2,989 | |
GBP | | | 170,758 | | | 173,565 | | 04/30/09 | | | (2,807 | ) |
JPY | | | 611,018 | | | 674,675 | | 04/30/09 | | | (63,657 | ) |
JPY | | | 587,219 | | | 593,574 | | 04/30/09 | | | (6,355 | ) |
JPY | | | 1,566,883 | | | 1,594,262 | | 04/30/09 | | | (27,379 | ) |
JPY | | | 1,231,879 | | | 1,268,098 | | 04/30/09 | | | (36,219 | ) |
KRW | | | 93,578 | | | 86,264 | | 04/30/09 | | | 7,314 | |
MXN | | | 543,617 | | | 513,409 | | 04/30/09 | | | 30,208 | |
MXN | | | 170,297 | | | 159,404 | | 04/30/09 | | | 10,893 | |
NOK | | | 597,146 | | | 581,838 | | 04/30/09 | | | 15,308 | |
NOK | | | 94,818 | | | 92,687 | | 04/30/09 | | | 2,131 | |
NZD | | | 205,552 | | | 187,063 | | 04/30/09 | | | 18,489 | |
SEK | | | 1,167,254 | | | 1,150,558 | | 04/30/09 | | | 16,696 | |
SGD | | | 1,910,589 | | | 1,928,637 | | 04/30/09 | | | (18,048 | ) |
THB | | | 241,027 | | | 238,169 | | 04/30/09 | | | 2,858 | |
| | | | | | | | | | | | |
| | | | | | | | | | $ | 545,759 | |
| | | | | | | | | | | | |
| | | | | | | | | | | | |
Forward Foreign
Currency
Contracts to Sell | | Value | | Aggregate
Face
Value | | Settlement
Date | | Unrealized
Appreciation (Depreciation) | |
AUD | | $ | 334,458 | | $ | 306,320 | | 04/30/09 | | $ | (28,138 | ) |
BRL | | | 2,326,152 | | | 2,291,561 | | 04/30/09 | | | (34,591 | ) |
CHF | | | 2,355,692 | | | 2,307,270 | | 04/30/09 | | | (48,422 | ) |
CHF | | | 319,952 | | | 308,828 | | 04/30/09 | | | (11,124 | ) |
CHF | | | 255,786 | | | 258,840 | | 04/30/09 | | | 3,054 | |
DKK | | | 329,556 | | | 317,343 | | 04/30/09 | | | (12,213 | ) |
EUR | | | 1,070,781 | | | 1,032,712 | | 04/30/09 | | | (38,069 | ) |
GBP | | | 2,633,121 | | | 2,612,921 | | 04/30/09 | | | (20,200 | ) |
GBP | | | 309,948 | | | 308,839 | | 04/30/09 | | | (1,109 | ) |
GBP | | | 315,688 | | | 309,243 | | 04/30/09 | | | (6,445 | ) |
JPY | | | 611,018 | | | 671,491 | | 04/30/09 | | | 60,473 | |
JPY | | | 594,899 | | | 598,414 | | 04/30/09 | | | 3,515 | |
KRW | | | 958,396 | | | 957,711 | | 04/30/09 | | | (685 | ) |
KRW | | | 95,262 | | | 93,061 | | 04/30/09 | | | (2,201 | ) |
KRW | | | 84,860 | | | 87,605 | | 04/30/09 | | | 2,745 | |
MXN | | | 3,490,495 | | | 3,400,843 | | 04/30/09 | | | (89,652 | ) |
NOK | | | 139,700 | | | 136,439 | | 04/30/09 | | | (3,261 | ) |
SEK | | | 92,446 | | | 85,952 | | 04/30/09 | | | (6,494 | ) |
SGD | | | 51,247 | | | 50,663 | | 04/30/09 | | | (584 | ) |
SGD | | | 158,997 | | | 158,066 | | 04/30/09 | | | (931 | ) |
THB | | | 1,719,796 | | | 1,732,162 | | 04/30/09 | | | 12,366 | |
THB | | | 173,082 | | | 172,368 | | 04/30/09 | | | (714 | ) |
TWD | | | 1,514,143 | | | 1,493,740 | | 04/30/09 | | | (20,403 | ) |
TWD | | | 86,264 | | | 86,783 | | 04/30/09 | | | 519 | |
| | | | | | | | | | | | |
| | | | | | | | | | $ | (242,564 | ) |
| | | | | | | | | | | | |
At March 31, 2009, the Fund was invested in the following countries:
| | | | | |
Country (Unaudited) | | Value | | % of Total
Investments |
United Kingdom | | $ | 37,865,789 | | 22.8 |
Japan | | | 35,298,056 | | 21.3 |
Switzerland | | | 20,209,989 | | 12.2 |
France | | | 16,703,102 | | 10.0 |
United States* | | | 8,450,153 | | 5.1 |
Germany | | | 8,445,943 | | 5.1 |
Spain | | | 6,901,481 | | 4.1 |
Australia | | | 6,722,092 | | 4.0 |
Netherlands | | | 3,335,027 | | 2.0 |
Mexico | | | 2,755,301 | | 1.7 |
Brazil | | | 2,694,584 | | 1.6 |
China | | | 2,585,630 | | 1.6 |
Finland | | | 2,176,454 | | 1.3 |
Greece | | | 2,048,288 | | 1.2 |
Denmark | | | 1,813,633 | | 1.1 |
Hong Kong | | | 1,780,680 | | 1.1 |
Taiwan | | | 1,608,145 | | 1.0 |
Thailand | | | 1,590,508 | | 1.0 |
South Korea | | | 1,091,036 | | 0.7 |
Sweden | | | 944,699 | | 0.6 |
Italy | | | 918,236 | | 0.5 |
| | | | | |
| | $ | 165,938,826 | | 100.0 |
| | | | | |
* Includes investment companies.
Certain securities are listed by country of underlying exposure but may trade predominantly on another exchange.
| | |
Acronym | | Name |
| ADR | | American Depositary Receipt |
| AUD | | Australian Dollar |
| BRL | | Brazilian Real |
| CHF | | Swiss Franc |
| DKK | | Danish Krone |
| EUR | | Euro |
| GBP | | Pound Sterling |
| JPY | | Japanese Yen |
| KRW | | South Korean Won |
| MXN | | Mexican Peso |
| NOK | | Norwegian Krone |
| NZD | | New Zealand Dollar |
| SEK | | Swedish Krona |
| SGD | | Singapore Dollar |
| THB | | Thailand Baht |
| TWD | | New Taiwan Dollar |
See Accompanying Notes to Financial Statements.
82
Investment Portfolio – Columbia Pacific/Asia Fund
March 31, 2009
Common Stocks – 97.3%
| | | | |
| | | Shares | | Value ($) |
| Consumer Discretionary – 11.5% | | |
| Automobiles – 3.4% | | | | |
Dongfeng Motor Group Co., Ltd., Class H | | 440,000 | | 229,350 |
Honda Motor Co., Ltd. | | 2,900 | | 67,823 |
Toyota Motor Corp. | | 17,700 | | 557,903 |
| | | | |
Automobiles Total | | | | 855,076 |
| |
| Diversified Consumer Services – 1.1% | | |
Benesse Corp. | | 7,200 | | 263,313 |
| | | | |
Diversified Consumer Services Total | | | | 263,313 |
| | |
Media – 2.7% | | | | |
BEC World PCL, Foreign Registered Shares | | 309,700 | | 162,425 |
Daiichikosho Co., Ltd. | | 28,800 | | 236,254 |
Jupiter Telecommunications Co., Ltd. | | 421 | | 279,859 |
| | | | |
Media Total | | | | 678,538 |
| | |
| Specialty Retail – 2.5% | | | | |
Fast Retailing Co., Ltd. | | 1,400 | | 157,983 |
Point, Inc. | | 5,630 | | 254,242 |
USS Co., Ltd. | | 4,680 | | 203,303 |
| | | | |
Specialty Retail Total | | | | 615,528 |
| |
| Textiles, Apparel & Luxury Goods – 1.8% | | |
LG Fashion Corp. | | 20,410 | | 268,543 |
Youngone Corp. | | 29,110 | | 182,036 |
| | | | |
Textiles, Apparel & Luxury Goods Total | | 450,579 |
| | | | |
Consumer Discretionary Total | | | | 2,863,034 |
| | | | |
| Consumer Staples – 5.6% | | | | |
| Food & Staples Retailing – 3.1% | | | | |
FamilyMart Co., Ltd. | | 7,800 | | 236,400 |
Seven & I Holdings Co., Ltd. | | 12,300 | | 268,404 |
Woolworths Ltd. | | 15,326 | | 266,530 |
| | | | |
Food & Staples Retailing Total | | | | 771,334 |
| | |
| Food Products – 0.5% | | | | |
Toyo Suisan Kaisha Ltd. | | 5,900 | | 120,700 |
| | | | |
Food Products Total | | | | 120,700 |
| | |
| Household Products – 0.8% | | | | |
Unicharm Corp. | | 3,300 | | 200,030 |
| | | | |
Household Products Total | | | | 200,030 |
| | |
| Personal Products – 0.6% | | | | |
Mandom Corp. | | 8,700 | | 143,352 |
| | | | |
Personal Products Total | | | | 143,352 |
| | | | |
| | | Shares | | Value ($) |
Tobacco – 0.6% | | | | |
KT&G Corp. | | 3,047 | | 167,632 |
| | | | |
Tobacco Total | | | | 167,632 |
| | | | |
Consumer Staples Total | | | | 1,403,048 |
| | | | |
| Energy – 4.6% | | | | |
| Energy Equipment & Services – 0.8% | | | | |
Shinko Plantech Co., Ltd. | | 35,500 | | 217,695 |
| | | | |
Energy Equipment & Services Total | | | | 217,695 |
| | |
Oil, Gas & Consumable Fuels – 3.8% | | | | |
Australian Worldwide Exploration Ltd. | | 135,220 | | 227,541 |
Inpex Corp. | | 37 | | 255,301 |
Oil & Natural Gas Corp., Ltd. | | 15,727 | | 241,229 |
Yanzhou Coal Mining Co., Ltd., Class H | | 304,000 | | 218,471 |
| | | | |
Oil, Gas & Consumable Fuels Total | | | | 942,542 |
| | | | |
Energy Total | | | | 1,160,237 |
| | | | |
| Financials – 24.8% | | | | |
| Capital Markets – 2.1% | | | | |
Macquarie Group Ltd. | | 9,862 | | 185,496 |
Tokai Tokyo Securities Co., Ltd. | | 119,000 | | 211,588 |
Woori Investment & Securities Co., Ltd. | | 9,510 | | 116,189 |
| | | | |
Capital Markets Total | | | | 513,273 |
| | |
Commercial Banks – 12.8% | | | | |
Bangkok Bank PCL, Foreign Registered Shares | | 88,300 | | 185,488 |
Bank of China Ltd., Class H | | 988,000 | | 328,883 |
China Merchants Bank Co., Ltd., Class H | | 65,000 | | 113,049 |
Commonwealth Bank of Australia | | 21,323 | | 514,940 |
DBS Group Holdings Ltd. | | 50,000 | | 277,787 |
Industrial & Commercial Bank of China, Class H | | 711,100 | | 367,908 |
Mitsubishi UFJ Financial Group, Inc. | | 59,900 | | 288,048 |
Siam Commercial Bank PCL, Foreign Registered Shares | | 168,100 | | 258,324 |
Sumitomo Mitsui Financial Group, Inc. | | 12,600 | | 434,066 |
Sumitomo Trust & Banking Co., Ltd. | | 33,400 | | 125,859 |
Westpac Banking Corp. | | 22,779 | | 302,374 |
| | | | |
Commercial Banks Total | | | | 3,196,726 |
See Accompanying Notes to Financial Statements.
83
Columbia Pacific/Asia Fund
March 31, 2009
Common Stocks (continued)
| | | | |
| | | Shares | | Value ($) |
| Consumer Finance – 0.3% | | | | |
ORIX Corp. | | 2,470 | | 79,102 |
| | | | |
Consumer Finance Total | | | | 79,102 |
| | |
Insurance – 3.5% | | | | |
Dongbu Insurance Co., Ltd. | | 13,300 | | 197,108 |
Hyundai Marine & Fire Insurance Co., Ltd. | | 23,430 | | 211,730 |
QBE Insurance Group Ltd. | | 13,718 | | 183,813 |
Tokio Marine Holdings, Inc. | | 11,700 | | 283,088 |
| | | | |
Insurance Total | | | | 875,739 |
|
Real Estate Investment Trusts (REITs) – 2.3% |
CapitaCommercial Trust | | 260,000 | | 150,432 |
Japan Retail Fund Investment Corp. | | 59 | | 224,115 |
Kiwi Income Property Trust | | 345,847 | | 189,414 |
| | | | |
Real Estate Investment Trusts (REITs) Total | | 563,961 |
|
Real Estate Management & Development – 2.8% |
Hongkong Land Holdings Ltd. | | 104,000 | | 237,120 |
Leopalace21 Corp. | | 23,400 | | 137,585 |
Mitsui Fudosan Co., Ltd. | | 8,000 | | 86,235 |
Swire Pacific Ltd., Class A | | 35,200 | | 235,027 |
| | | | |
Real Estate Management & Development Total | | 695,967 |
| | |
Thrifts & Mortgage Finance – 1.0% | | | | |
LIC Housing Finance | | 55,802 | | 247,471 |
| | | | |
Thrifts & Mortgage Finance Total | | | | 247,471 |
| | | | |
Financials Total | | | | 6,172,239 |
| | | | |
| Health Care – 3.7% | | | | |
| Health Care Providers & Services – 0.8% | | |
As One Corp. | | 11,400 | | 184,961 |
| | | | |
Health Care Providers & Services Total | | 184,961 |
| | |
Pharmaceuticals – 2.9% | | | | |
Astellas Pharma, Inc. | | 7,300 | | 222,721 |
Santen Pharmaceutical Co., Ltd. | | 6,400 | | 177,158 |
Takeda Pharmaceutical Co., Ltd. | | 9,600 | | 329,747 |
| | | | |
Pharmaceuticals Total | | | | 729,626 |
| | | | |
Health Care Total | | | | 914,587 |
| | | | |
| Industrials – 13.2% | | | | |
| Commercial Services & Supplies – 0.8% | | |
Aeon Delight Co., Ltd. | | 15,000 | | 187,604 |
| | | | |
Commercial Services & Supplies Total | | 187,604 |
| | | | |
| | | Shares | | Value ($) |
Construction & Engineering – 3.6% | | | | |
Monadelphous Group Ltd. | | 39,016 | | 225,991 |
NEC Networks & System Integration Corp. | | 27,100 | | 229,974 |
Taikisha Ltd. | | 16,000 | | 169,561 |
Toyo Engineering Corp. | | 93,000 | | 269,647 |
| | | | |
Construction & Engineering Total | | 895,173 |
|
Electrical Equipment – 2.9% |
Bharat Heavy Electricals Ltd. | | 8,719 | | 259,499 |
Harbin Power Equipment Co., Ltd., Class H | | 266,000 | | 172,972 |
Sumitomo Electric Industries Ltd. | | 34,800 | | 288,638 |
| | | | |
Electrical Equipment Total | | 721,109 |
|
Industrial Conglomerates – 1.2% |
Keppel Corp. Ltd. | | 92,000 | | 303,048 |
| | | | |
Industrial Conglomerates Total | | 303,048 |
|
Machinery – 1.7% |
Nabtesco Corp. | | 36,000 | | 247,310 |
Sintokogio Ltd. | | 30,300 | | 180,297 |
| | | | |
Machinery Total | | 427,607 |
|
Road & Rail – 0.9% |
Central Japan Railway Co. | | 27 | | 151,114 |
Transport International Holdings Ltd. | | 30,521 | | 77,970 |
| | | | |
Road & Rail Total | | 229,084 |
|
Trading Companies & Distributors – 0.7% |
Mitsubishi Corp. | | 13,500 | | 175,254 |
| | | | |
Trading Companies & Distributors Total | | 175,254 |
|
Transportation Infrastructure – 1.4% |
Sichuan Expressway Co., Ltd., Class H (a) | | 352,000 | | 65,853 |
Zhejiang Expressway Co., Ltd., Class H | | 376,000 | | 277,006 |
| | | | |
Transportation Infrastructure Total | | 342,859 |
| | | | |
Industrials Total | | 3,281,738 |
| | | | |
| Information Technology – 12.7% |
| Electronic Equipment, Instruments & Components – 3.9% |
AU Optronics Corp. | | 247,000 | | 204,304 |
FUJIFILM Holdings Corp. | | 10,400 | | 223,266 |
HON HAI Precision Industry Co., Ltd. | | 59,300 | | 134,121 |
Kyocera Corp. | | 2,500 | | 163,661 |
Nidec Corp. | | 1,800 | | 80,012 |
Venture Corp., Ltd. | | 50,000 | | 165,686 |
| | | | |
Electronic Equipment, Instruments & Components Total | | 971,050 |
See Accompanying Notes to Financial Statements.
84
Columbia Pacific/Asia Fund
March 31, 2009
Common Stocks (continued)
| | | | |
| | | Shares | | Value ($) |
Internet Software & Services – 0.8% |
NetEase.com, Inc., ADR (a) | | 7,394 | | 198,529 |
| | | | |
Internet Software & Services Total | | 198,529 |
|
Office Electronics – 1.7% |
Canon, Inc. | | 14,300 | | 407,395 |
| | | | |
Office Electronics Total | | 407,395 |
|
Semiconductors & Semiconductor Equipment – 4.0% |
Macronix International | | 664,860 | | 251,930 |
Samsung Electronics Co., Ltd. | | 1,285 | | 527,656 |
United Microelectronics Corp., ADR | | 89,181 | | 225,628 |
| | | | |
Semiconductors & Semiconductor Equipment Total | | 1,005,214 |
|
Software – 2.3% |
Nintendo Co., Ltd. | | 1,500 | | 431,126 |
NSD Co., Ltd. | | 23,200 | | 146,487 |
| | | | |
Software Total | | 577,613 |
| | | | |
Information Technology Total | | 3,159,801 |
| | | | |
| Materials – 9.7% |
| Chemicals – 2.8% |
Capro Corp. (a) | | 44,790 | | 179,710 |
Kansai Paint Co., Ltd. | | 36,000 | | 198,939 |
Nifco, Inc. | | 11,900 | | 128,275 |
Shin-Etsu Chemical Co., Ltd. | | 3,700 | | 178,300 |
| | | | |
Chemicals Total | | 685,224 |
| | |
Containers & Packaging – 1.1% | | | | |
Toyo Seikan Kaisha Ltd. | | 19,700 | | 285,395 |
| | | | |
Containers & Packaging Total | | 285,395 |
|
Metals & Mining – 5.8% |
BHP Billiton Ltd. | | 24,865 | | 551,720 |
BlueScope Steel Ltd. | | 55,989 | | 100,055 |
Freeport-McMoRan Copper & Gold, Inc. | | 6,876 | | 262,044 |
JFE Holdings, Inc. | | 6,700 | | 145,189 |
Tokyo Steel Manufacturing Co., Ltd. | | 17,100 | | 169,817 |
Yamato Kogyo Co., Ltd. | | 10,700 | | 227,004 |
| | | | |
Metals & Mining Total | | | | 1,455,829 |
| | | | |
Materials Total | | | | 2,426,448 |
| | | | |
| | | Shares | | Value ($) |
| Telecommunication Services – 6.0% | | |
| Diversified Telecommunication Services – 2.6% |
Chunghwa Telecom Co. Ltd., ADR | | 16,402 | | 299,008 |
Nippon Telegraph & Telephone Corp. | | 9,300 | | 350,447 |
| | | | |
Diversified Telecommunication Services Total | | 649,455 |
|
Wireless Telecommunication Services – 3.4% |
China Mobile Ltd., ADR | | 6,989 | | 304,161 |
NTT DoCoMo, Inc. | | 182 | | 245,829 |
Philippine Long Distance Telephone Co., ADR | | 4,642 | | 204,852 |
SK Telecom Co., Ltd. | | 737 | | 102,298 |
| | | | |
Wireless Telecommunication Services Total | | 857,140 |
| | | | |
Telecommunication Services Total | | 1,506,595 |
| | | | |
| Utilities – 5.5% | | | | |
| Electric Utilities – 1.3% | | | | |
CESC Ltd. | | 34,333 | | 141,433 |
Okinawa Electric Power Co., Inc. | | 3,400 | | 179,987 |
| | | | |
Electric Utilities Total | | | | 321,420 |
|
Gas Utilities – 1.1% |
Korea Gas Corp. | | 3,462 | | 101,113 |
Tokyo Gas Co., Ltd. | | 49,000 | | 170,784 |
| | | | |
Gas Utilities Total | | | | 271,897 |
|
Independent Power Producers & Energy Traders – 1.3% |
Energy Development Corp. | | 3,176,000 | | 256,315 |
Tanjong PLC | | 21,200 | | 80,252 |
| | | | |
Independent Power Producers & Energy Traders Total | | 336,567 |
|
Water Utilities – 1.8% |
Epure International Ltd. | | 1,088,000 | | 211,026 |
Guangdong Investment Ltd. | | 596,000 | | 242,226 |
| | | | |
Water Utilities Total | | | | 453,252 |
| | | | |
Utilities Total | | | | 1,383,136 |
| | | | |
Total Common Stocks
(cost of $32,672,312) | | | | 24,270,863 |
See Accompanying Notes to Financial Statements.
85
Columbia Pacific/Asia Fund
March 31, 2009
Investment Companies – 2.0%
| | | | |
| | | Shares | | Value ($) |
iShares MSCI Emerging Markets Index Fund | | 7,793 | | 193,344 |
iShares MSCI Japan Index Fund | | 24,581 | | 194,436 |
iShares MSCI Pacific ex-Japan Index Fund | | 3,958 | | 97,485 |
| | | | |
Total Investment Companies
(cost of $436,335) | | 485,265 |
| | | | |
Total Investments – 99.3%
(cost of $33,108,647)(b) | | 24,756,128 |
| | | | |
Other Assets & Liabilities, Net – 0.7% | | 177,349 |
| | | | |
Net Assets – 100.0% | | 24,933,477 |
Notes to Investment Portfolio:
On April 1, 2008, the Fund adopted Statement of Financial Accounting Standards No. 157, Fair Value Measurements (“SFAS 157”). SFAS 157 establishes a hierarchy that prioritizes the inputs to valuation techniques used to measure fair value giving the highest priority to unadjusted quoted prices in active markets for identical securities (level 1 measurements) and the lowest priority to unobservable inputs (level 3 measurements) when market prices are not readily available or reliable. The three levels of the fair value hierarchy under SFAS 157 are described below:
| | • | | Level 1 – quoted prices in active markets for identical securities |
| | • | | Level 2 – prices determined using other significant observable inputs (including quoted prices for similar securities, interest rates, prepayment speeds, credit risk and others) |
| | • | | Level 3 – prices determined using significant unobservable inputs. In situations where quoted prices or observable inputs are unavailable or less reliable, unobservable inputs may be used. Unobservable inputs may include management’s own assumptions about the factors market participants would use in pricing an investment. |
The inputs or methodology used for valuing securities are not necessarily an indication of the risk associated with investing in those securities.
The following table summarizes the inputs used, as of March 31, 2009 in valuing the Fund’s assets:
| | | | | | |
Valuation Inputs | | Investments in
Securities | | Other Financial
Instruments* |
Level 1 – Quoted Prices | | $ | 2,216,608 | | $ | — |
Level 2 – Other Significant Observable Inputs | | | 22,539,520 | | | 45,897 |
Level 3 – Significant Unobservable Inputs | | | — | | | — |
| | | | | | |
Total | | $ | 24,756,128 | | $ | 45,897 |
| | | | | | |
*Other financial instruments consist of forwards foreign currency exchange contracts which are not included in the investment portfolio.
The Fund’s assets assigned to the Level 2 input category include certain foreign securities for which a third party statistical pricing service may be employed for purposes of fair market valuation.
| (a) | Non-income producing security. |
| (b) | Cost for federal income tax purposes is $34,905,734. |
Forward foreign currency exchange contracts outstanding on March 31, 2009 are:
| | | | | | | | | | | | |
Forward Foreign
Currency
Contracts to Buy | | Value | | Aggregate
Face
Value | | Settlement
Date | | Unrealized
Appreciation (Depreciation) | |
AUD | | $ | 752,184 | | $ | 698,063 | | 04/30/09 | | $ | 54,121 | |
AUD | | | 58,287 | | | 54,481 | | 04/30/09 | | | 3,806 | |
AUD | | | 56,900 | | | 53,169 | | 04/30/09 | | | 3,731 | |
IDR | | | 206,770 | | | 195,167 | | 04/30/09 | | | 11,603 | |
INR | | | 54,096 | | | 55,978 | | 04/30/09 | | | (1,882 | ) |
JPY | | | 101,403 | | | 111,967 | | 04/30/09 | | | (10,564 | ) |
JPY | | | 93,713 | | | 95,539 | | 04/30/09 | | | (1,826 | ) |
JPY | | | 64,243 | | | 65,366 | | 04/30/09 | | | (1,123 | ) |
KRW | | | 55,571 | | | 52,127 | | 04/30/09 | | | 3,444 | |
MYR | | | 223,918 | | | 224,728 | | 04/30/09 | | | (810 | ) |
MYR | | | 104,970 | | | 104,115 | | 04/30/09 | | | 855 | |
THB | | | 108,542 | | | 109,237 | | 04/30/09 | | | (695 | ) |
TWD | | | 250,674 | | | 252,284 | | 04/30/09 | | | (1,610 | ) |
TWD | | | 94,324 | | | 94,902 | | 04/30/09 | | | (578 | ) |
| | | | | | | | | | | | |
| | | | | | | | | | $ | 58,472 | |
| | | | | | | | | | | | |
| | | | | | | | | | | | |
Forward Foreign
Currency
Contracts to Sell | | Value | | Aggregate
Face
Value | | Settlement
Date | | Unrealized
Appreciation (Depreciation) | |
AUD | | $ | 38,164 | | $ | 35,354 | | 04/30/09 | | $ | (2,810 | ) |
JPY | | | 49,934 | | | 54,876 | | 04/30/09 | | | 4,942 | |
JPY | | | 120,100 | | | 126,525 | | 04/30/09 | | | 6,425 | |
JPY | | | 51,470 | | | 54,224 | | 04/30/09 | | | 2,754 | |
JPY | | | 68,711 | | | 68,530 | | 04/30/09 | | | (181 | ) |
KRW | | | 166,808 | | | 166,689 | | 04/30/09 | | | (119 | ) |
KRW | | | 52,268 | | | 47,680 | | 04/30/09 | | | (4,588 | ) |
KRW | | | 50,862 | | | 44,479 | | 04/30/09 | | | (6,383 | ) |
KRW | | | 48,009 | | | 47,976 | | 04/30/09 | | | (33 | ) |
MYR | | | 47,415 | | | 47,202 | | 04/30/09 | | | (213 | ) |
NZD | | | 157,154 | | | 140,070 | | 04/30/09 | | | (17,084 | ) |
PHP | | | 168,370 | | | 169,781 | | 04/30/09 | | | 1,411 | |
PHP | | | 106,537 | | | 107,083 | | 04/30/09 | | | 546 | |
PHP | | | 52,237 | | | 51,513 | | 04/30/09 | | | (724 | ) |
SGD | | | 194,475 | | | 196,312 | | 04/30/09 | | | 1,837 | |
THB | | | 554,894 | | | 558,884 | | 04/30/09 | | | 3,990 | |
TWD | | | 54,941 | | | 54,201 | | 04/30/09 | | | (740 | ) |
TWD | | | 49,007 | | | 47,402 | | 04/30/09 | | | (1,605 | ) |
| | | | | | | | | | | | |
| | | | | | | | | | $ | (12,575 | ) |
| | | | | | | | | | | | |
At March 31, 2009, the Fund is invested in the following countries:
| | | | | |
Country (Unaudited) | | Value | | % of Total
Investments |
Japan | | $ | 11,878,145 | | 48.0 |
Australia | | | 2,558,460 | | 10.3 |
South Korea | | | 2,054,016 | | 8.3 |
China | | | 1,972,021 | | 8.0 |
Taiwan | | | 1,114,991 | | 4.5 |
Singapore | | | 1,107,979 | | 4.5 |
Hong Kong | | | 1,096,505 | | 4.4 |
India | | | 889,632 | | 3.6 |
United States* | | | 747,310 | | 3.0 |
Thailand | | | 606,238 | | 2.4 |
Philippines | | | 461,166 | | 1.9 |
New Zealand | | | 189,413 | | 0.8 |
United Kingdom | | | 80,252 | | 0.3 |
| | | | | |
| | $ | 24,756,128 | | 100.0 |
| | | | | |
*Includes investment companies.
Certain securities are listed by country of underlying exposure but may trade predominantly on another exchange.
See Accompanying Notes to Financial Statements.
86
Columbia Pacific/Asia Fund
March 31, 2009
| | |
Acronym | | Name |
| ADR | | American Depositary Receipt |
| AUD | | Australian Dollar |
| IDR | | Indonesian Rupiah |
| INR | | Indian Rupee |
| JPY | | Japanese Yen |
| KRW | | South Korean Won |
| MYR | | Malaysian Ringgit |
| NZD | | New Zealand Dollar |
| PHP | | Philippine Peso |
| SGD | | Singapore Dollar |
| THB | | Thailand Baht |
| TWD | | New Taiwan Dollar |
See Accompanying Notes to Financial Statements.
87
Statements of Assets and Liabilities – Equity Funds
March 31, 2009
| | | | | | | | | | |
| | | ($) | | ($) | | ($) | | ($) | | |
| | | Columbia
Blended
Equity
Fund | | Columbia
Energy and
Natural
Resources
Fund | | Columbia
Mid Cap
Core Fund | | Columbia
Select Large
Cap Growth
Fund | | |
Assets | | | | | | | | | | |
Unaffiliated investments, at identified cost | | 91,740,883 | | 341,003,194 | | 67,701,245 | | 979,140,081 | | |
Affiliated investments, at identified cost | | — | | — | | — | | — | | |
Repurchase agreements, at identified cost | | 2,855,000 | | 46,096,000 | | 438,000 | | 33,365,000 | | |
| | | | | | | | | | |
| | | | | |
Total investments, at identified cost | | 94,595,883 | | 387,099,194 | | 68,139,245 | | 1,012,505,081 | | |
| | | | | |
Unaffiliated investments, at value | | 137,272,655 | | 331,193,216 | | 64,769,937 | | 796,608,505 | | |
Affiliated investments, at value | | — | | — | | — | | — | | |
Repurchase agreements, at value | | 2,855,000 | | 46,096,000 | | 438,000 | | 33,365,000 | | |
| | | | | | | | | | |
| | | | | |
Total investments, at value | | 140,127,655 | | 377,289,216 | | 65,207,937 | | 829,973,505 | | |
| | | | | |
Cash | | 644 | | 189 | | 562 | | 806 | | |
Unrealized appreciation on forward foreign currency exchange contracts | | — | | — | | — | | — | | |
Foreign currency (cost of $—, $—, $—, $—, $—, $—, $—, $430,653, $181,976 and $25,894, respectively) | | — | | — | | — | | — | | |
Receivable for: | | | | | | | | | | |
Investments sold | | — | | 10,064,690 | | 2,717,689 | | — | | |
Fund shares sold | | 30,094 | | 1,237,133 | | 16,626 | | 5,677,443 | | |
Dividends | | 240,832 | | 251,250 | | 87,800 | | — | | |
Interest | | 11 | | 179 | | 2 | | 130 | | |
Foreign tax reclaims | | 14,927 | | 14,244 | | — | | 136,094 | | |
Expense reimbursement due from investment advisor | | — | | — | | — | | — | | |
Trustees’ deferred compensation plan | | 2,566 | | 4,585 | | 2,389 | | 5,468 | | |
Other assets | | 23,077 | | 46,638 | | 19,147 | | 68,529 | | |
| | | | | | | | | | |
| | | | | |
Total Assets | | 140,439,806 | | 388,908,124 | | 68,052,152 | | 835,861,975 | | |
| | | | | |
| | | | | | | | | | | |
Liabilities | | | | | | | | | | |
Payable to custodian bank | | — | | — | | — | | — | | |
Expense reimbursement due to investment advisor | | — | | — | | — | | — | | |
Unrealized depreciation on forward foreign currency exchange contracts | | — | | — | | — | | — | | |
Foreign currency overdraft, at value (cost of $—, $—, $—, $—, $260, $—, $—, $—, $— and $—, respectively) | | — | | — | | — | | — | | |
Payable for: | | | | | | | | | | |
Investments purchased | | — | | 26,716,545 | | 2,809,074 | | 16,342,671 | | |
Fund shares repurchased | | 16,738 | | 359,673 | | 53,593 | | 990,492 | | |
Investment advisory fee | | 91,778 | | 181,867 | | 40,743 | | 478,895 | | |
Administration fee | | 14,247 | | 39,821 | | 6,041 | | 87,688 | | |
Transfer agent fee | | 72,269 | | 336,356 | | 48,208 | | 183,642 | | |
Trustees’ fees | | 11,895 | | 7,672 | | 731 | | 2,445 | | |
Audit fee | | 28,963 | | 28,962 | | 32,063 | | 31,063 | | |
Pricing and bookkeeping fees | | 7,628 | | 7,806 | | 7,453 | | 11,897 | | |
Custody fee | | 7,093 | | 4,826 | | 3,641 | | 4,732 | | |
Distribution and service fees | | 72 | | 7,552 | | 542 | | 15,794 | | |
Reports to shareholders | | 11,219 | | 49,499 | | 15,742 | | 17,636 | | |
Chief compliance officer expenses | | 163 | | 263 | | 139 | | 258 | | |
Interest | | — | | — | | 1 | | — | | |
Trustees’ deferred compensation plan | | 2,566 | | 4,585 | | 2,389 | | 5,468 | | |
Other liabilities | | 64,399 | | 186,292 | | 81,840 | | 19,139 | | |
| | | | | | | | | | |
| | | | | |
Total Liabilities | | 329,030 | | 27,931,719 | | 3,102,200 | | 18,191,820 | | |
| | | | | |
| | | | | | | | | | | |
Net Assets | | 140,110,776 | | 360,976,405 | | 64,949,952 | | 817,670,155 | | |
See Accompanying Notes to Financial Statements.
88
| | | | | | | | | | | | |
| | | ($) | | ($) | | ($) | | ($) | | ($) | | ($) |
| | | Columbia
Select
Opportunities
Fund | |
Columbia
Select
Small Cap
Fund | �� | Columbia
Value and
Restructuring
Fund | | Columbia
Emerging
Markets
Fund | | Columbia
International
Growth
Fund | | Columbia
Pacific/Asia
Fund |
| | | | | | | | | | | | |
| | 141,091,154 | | 400,639,904 | | 5,846,506,533 | | 202,528,387 | | 207,284,130 | | 33,108,647 |
| | — | | 15,625,759 | | 196,126,941 | | — | | — | | — |
| | 4,083,000 | | 6,604,000 | | 3,025,000 | | 5,924,000 | | — | | — |
| | | | | | | | | | | | |
| | | | | | |
| | 145,174,154 | | 422,869,663 | | 6,045,658,474 | | 208,452,387 | | 207,284,130 | | 33,108,647 |
| | | | | | |
| | 132,569,833 | | 324,622,040 | | 4,496,778,362 | | 231,204,518 | | 165,938,826 | | 24,756,128 |
| | — | | 4,230,000 | | 85,031,250 | | — | | — | | — |
| | 4,083,000 | | 6,604,000 | | 3,025,000 | | 5,924,000 | | — | | — |
| | | | | | | | | | | | |
| | | | | | |
| | 136,652,833 | | 335,456,040 | | 4,584,834,612 | | 237,128,518 | | 165,938,826 | | 24,756,128 |
| | | | | | |
| | 640 | | 724 | | 642 | | 497,397 | | — | | 3,731 |
| | | | | | |
| | — | | — | | — | | — | | 861,094 | | 99,465 |
| | | | | | |
| | — | | — | | — | | 429,065 | | 181,804 | | 26,125 |
| | | | | | | | | | | | |
| | 8,077,235 | | 1,378,559 | | 2,603,596 | | 3,417,392 | | 3,374,365 | | 548,072 |
| | 2,657 | | 1,410,652 | | 9,361,403 | | 68,583 | | 42,827 | | 15,087 |
| | 182,242 | | 149,600 | | 10,265,568 | | 956,870 | | 719,541 | | 181,061 |
| | 16 | | 26 | | 12 | | 23 | | — | | — |
| | 27,129 | | — | | 189,823 | | 23,121 | | 531,862 | | 2,003 |
| | | | | | |
| | 38,843 | | — | | — | | — | | — | | 15,873 |
| | 2,963 | | 4,249 | | 41,905 | | 5,672 | | 3,857 | | 1,810 |
| | 24,752 | | 51,563 | | 649,161 | | 16,553 | | 43,666 | | 9,652 |
| | | | | | | | | | | | |
| | 145,009,310 | | 338,451,413 | | 4,607,946,722 | | 242,543,194 | | 171,697,842 | | 25,659,007 |
| | | | | | |
| | | | | | | | | | | | |
| | | | | | | | | | | | |
| | — | | — | | — | | — | | 999,866 | | — |
| | — | | — | | — | | 154,119 | | — | | — |
| | | | | | |
| | — | | — | | — | | — | | 557,899 | | 53,568 |
| | 262 | | — | | — | | — | | — | | — |
| | | | | | | | | | | | |
| | 8,460,006 | | 1,970,832 | | — | | 2,068,538 | | 1,404,439 | | 381,849 |
| | 518,973 | | 644,897 | | 6,113,192 | | 171,342 | | 1,584,833 | | 76,088 |
| | 93,176 | | 208,409 | | 2,276,648 | | 253,383 | | 155,667 | | 22,493 |
| | 14,737 | | 36,107 | | 586,860 | | 36,282 | | 26,528 | | 1,609 |
| | 29,111 | | 218,131 | | 4,753,273 | | 494,887 | | 127,788 | | 8,867 |
| | 2,751 | | 3,807 | | 10,532 | | 12,293 | | 2,836 | | 793 |
| | 29,963 | | 31,063 | | 36,263 | | 31,705 | | 33,537 | | 24,605 |
| | 7,431 | | 7,982 | | 12,716 | | 8,986 | | 10,139 | | 6,270 |
| | 14,393 | | 5,142 | | 65,291 | | 315,578 | | 27,139 | | 25,132 |
| | 445 | | 4,431 | | 81,466 | | 363 | | 171 | | 225 |
| | 14,994 | | 61,309 | | 279,905 | | 78,791 | | 46,787 | | 10,279 |
| | 197 | | 250 | | 1,252 | | 259 | | 253 | | 158 |
| | 298 | | 457 | | 3,047 | | 486 | | 212 | | — |
| | 2,963 | | 4,249 | | 41,905 | | 5,672 | | 3,857 | | 1,810 |
| | 14,218 | | 17,411 | | 153,300 | | 339,508 | | 486,900 | | 111,784 |
| | | | | | | | | | | | |
| | | | | | |
| | 9,203,918 | | 3,214,477 | | 14,415,650 | | 3,972,192 | | 5,468,851 | | 725,530 |
| | | | | | |
| | | | | | | | | | | | |
| | 135,805,392 | | 335,236,936 | | 4,593,531,072 | | 238,571,002 | | 166,228,991 | | 24,933,477 |
See Accompanying Notes to Financial Statements.
89
Statements of Assets and Liabilities (continued) – Equity Funds
March 31, 2009
| | | | | | | | | | | | | | | | | | |
| | | ($) | | | ($) | | | ($) | | | ($) | | | |
| | | Columbia
Blended
Equity
Fund | | | Columbia
Energy and
Natural
Resources
Fund | | | Columbia
Mid Cap
Core Fund | | | Columbia
Select Large
Cap Growth
Fund | | | |
Net Assets Consist of | | | | | | | | | | | | | | | | | | |
Paid-in capital | | | 116,201,431 | | | | 572,512,039 | | | | 83,332,033 | | | | 1,258,723,689 | | | |
Undistributed (overdistributed) net investment income | | | 127,402 | | | | 516,042 | | | | 99,722 | | | | (6,634 | ) | | |
Accumulated net realized loss | | | (21,749,742 | ) | | | (202,202,938 | ) | | | (15,550,535 | ) | | | (258,515,324 | ) | | |
Net unrealized appreciation (depreciation) on: | | | | | | | | | | | | | | | | | | |
Investments | | | 45,531,772 | | | | (9,809,978 | ) | | | (2,931,308 | ) | | | (182,531,576 | ) | | |
Foreign currency translations | | | (87 | ) | | | (38,760 | ) | | | 40 | | | | — | | | |
Foreign capital gains tax | | | — | | | | — | | | | — | | | | — | | | |
| | | | | |
| | | | | | | | | | | | | | | | | | | |
Net Assets | | | 140,110,776 | | | | 360,976,405 | | | | 64,949,952 | | | | 817,670,155 | | | |
| | | | | |
| | | | | | | | | | | | | | | | | | | |
Class A | | | | | | | | | | | | | | | | | | |
Net assets | | $ | 161,380 | | | $ | 16,841,626 | | | $ | 209,949 | | | $ | 84,492,786 | | | |
Shares outstanding | | | 9,955 | | | | 1,236,144 | | | | 22,016 | | | | 11,965,565 | | | |
Net asset value per share (a) | | $ | 16.21 | | | $ | 13.62 | | | $ | 9.54 | | | $ | 7.06 | | | |
Maximum sales charge | | | 5.75 | % | | | 5.75 | % | | | 5.75 | % | | | 5.75 | % | | |
Maximum offering price per share (b) | | $ | 17.20 | | | $ | 14.45 | | | $ | 10.12 | | | $ | 7.49 | | | |
| | | | | |
| | | | | | | | | | | | | | | | | | | |
Class C | | | | | | | | | | | | | | | | | | |
Net assets | | $ | 57,443 | | | $ | 5,842,884 | | | $ | 67,067 | | | $ | 762,954 | | | |
Shares outstanding | | | 3,552 | | | | 433,661 | | | | 7,058 | | | | 109,288 | | | |
Net asset value and offering price per share (a) | | $ | 16.17 | | | $ | 13.47 | | | $ | 9.50 | | | $ | 6.98 | | | |
| | | | | |
| | | | | | | | | | | | | | | | | | | |
Class R | | | | | | | | | | | | | | | | | | |
Net assets | | $ | — | | | $ | — | | | $ | 1,144,706 | | | $ | 23,337 | | | |
Shares outstanding | | | — | | | | — | | | | 121,460 | | | | 3,376 | | | |
Net asset value and offering price per share | | $ | — | | | $ | — | | | $ | 9.42 | | | $ | 6.91 | | | |
| | | | | |
| | | | | | | | | | | | | | | | | | | |
Class Z | | | | | | | | | | | | | | | | | | |
Net assets | | $ | 139,891,953 | | | $ | 338,291,895 | | | $ | 63,528,230 | | | $ | 732,391,078 | | | |
Shares outstanding | | | 8,632,813 | | | | 24,770,649 | | | | 6,654,897 | | | | 103,456,381 | | | |
Net asset value and offering price per share | | $ | 16.20 | | | $ | 13.66 | | | $ | 9.55 | | | $ | 7.08 | | | |
| (a) | Redemption price per share is equal to net asset value less any applicable contingent deferred sales charge. |
| (b) | On sales of $50,000 or more the offering price is reduced. |
See Accompanying Notes to Financial Statements.
90
| | | | | | | | | | | | | | | | | | | | | | | | |
| | | ($) | | | ($) | | | ($) | | | ($) | | | ($) | | | ($) | |
| | |
Columbia
Select
Opportunities
Fund | | | Columbia
Select Small
Cap Fund | | | Columbia
Value and
Restructuring
Fund | | | Columbia
Emerging
Markets Fund | | | Columbia
International
Growth Fund | | | Columbia
Pacific/Asia
Fund | |
| | | | | | | | | | | | | | | | | | | | | | | | |
| | | 276,141,778 | | | | 546,363,315 | | | | 7,366,750,307 | | | | 242,154,440 | | | | 344,074,979 | | | | 57,013,046 | |
| | | | | | |
| | | 97,364 | | | | (5,567 | ) | | | 841,775 | | | | 2,957,245 | | | | 1,542,970 | | | | 105,370 | |
| | | (131,903,862 | ) | | | (123,707,189 | ) | | | (1,313,217,732 | ) | | | (35,152,599 | ) | | | (138,313,456 | ) | | | (23,876,318 | ) |
| | | | | | | | | | | | | | | | | | | | | | | | |
| | | (8,521,321 | ) | | | (87,413,623 | ) | | | (1,460,823,862 | ) | | | 28,676,131 | | | | (41,345,304 | ) | | | (8,352,519 | ) |
| | | (8,567 | ) | | | — | | | | (19,416 | ) | | | (14,669 | ) | | | 269,802 | | | | 43,898 | |
| | | — | | | | — | | | | — | | | | (49,546 | ) | | | — | | | | — | |
| | | | | | |
| | | | | | | | | | | | | | | | | | | | | | | | |
| | | 135,805,392 | | | | 335,236,936 | | | | 4,593,531,072 | | | | 238,571,002 | | | | 166,228,991 | | | | 24,933,477 | |
| | | | | | |
| | | | | | | | | | | | | | | | | | | | | | | | |
| | | | | | | | | | | | | | | | | | | | | | | | |
| | $ | 1,097,123 | | | $ | 6,671,435 | | | $ | 163,338,350 | | | $ | 916,749 | | | $ | 225,591 | | | $ | 174,509 | |
| | | 143,935 | | | | 735,026 | | | | 6,161,201 | | | | 142,842 | | | | 24,564 | | | | 36,199 | |
| | $ | 7.62 | | | $ | 9.08 | | | $ | 26.51 | | | $ | 6.42 | | | $ | 9.18 | | | $ | 4.82 | |
| | | 5.75 | % | | | 5.75 | % | | | 5.75 | % | | | 5.75 | % | | | 5.75 | % | | | 5.75 | % |
| | $ | 8.08 | | | $ | 9.63 | | | $ | 28.13 | | | $ | 6.81 | | | $ | 9.74 | | | $ | 5.11 | |
| | | | | | |
| | | | | | | | | | | | | | | | | | | | | | | | |
| | | | | | | | | | | | | | | | | | | | | | | | |
| | $ | 239,829 | | | $ | 1,062,509 | | | $ | 40,380,117 | | | $ | 242,386 | | | $ | 157,220 | | | $ | 237,949 | |
| | | 31,634 | | | | 118,432 | | | | 1,523,009 | | | | 38,140 | | | | 17,250 | | | | 49,742 | |
| | $ | 7.58 | | | $ | 8.97 | | | $ | 26.51 | | | $ | 6.36 | | | $ | 9.11 | | | $ | 4.78 | |
| | | | | | |
| | | | | | | | | | | | | | | | | | | | | | | | |
| | | | | | | | | | | | | | | | | | | | | | | | |
| | $ | — | | | $ | 5,819,127 | | | $ | 37,636,848 | | | $ | — | | | $ | — | | | $ | — | |
| | | — | | | | 655,216 | | | | 1,420,190 | | | | — | | | | — | | | | — | |
| | $ | — | | | $ | 8.88 | | | $ | 26.50 | | | $ | — | | | $ | — | | | $ | — | |
| | | | | | |
| | | | | | | | | | | | | | | | | | | | | | | | |
| | | | | | | | | | | | | | | | | | | | | | | | |
| | $ | 134,468,440 | | | $ | 321,683,865 | | | $ | 4,352,175,757 | | | $ | 237,411,867 | | | $ | 165,846,180 | | | $ | 24,521,019 | |
| | | 17,652,546 | | | | 35,359,893 | | | | 164,281,422 | | | | 36,959,567 | | | | 18,018,495 | | | | 5,074,953 | |
| | $ | 7.62 | | | $ | 9.10 | | | $ | 26.49 | | | $ | 6.42 | | | $ | 9.20 | | | $ | 4.83 | |
See Accompanying Notes to Financial Statements.
91
Statements of Operations – Equity Funds
For the Year Ended March 31, 2009
| | | | | | | | | | | | | | |
| | | $ | | | $ | | | $ | | | $ | | | |
| | | Columbia
Blended
Equity
Fund | | | Columbia
Energy and
Natural
Resources
Fund | | | Columbia
Mid Cap
Core Fund | | | Columbia
Select Large
Cap Growth
Fund | | | |
Investment Income | | | | | | | | | | | | | | |
Dividends | | 4,259,847 | | | 5,974,945 | | | 2,596,576 | | | 5,967,191 | | | |
Dividends from affiliates | | — | | | — | | | — | | | — | | | |
Interest | | 34,188 | | | 584,697 | | | 17,893 | | | 398,327 | | | |
Foreign taxes withheld | | (62,357 | ) | | (121,969 | ) | | (66,160 | ) | | (122,097 | ) | | |
| | | | | |
| | | | | | | | | | | | | | | |
Total Investment Income | | 4,231,678 | | | 6,437,673 | | | 2,548,309 | | | 6,243,421 | | | |
| | | | | |
Expenses | | | | | | | | | | | | | | |
Investment advisory fee | | 1,672,580 | | | 3,524,919 | | | 1,037,408 | | | 7,032,799 | | | |
Administration fee | | 263,125 | | | 765,650 | | | 177,550 | | | 1,291,853 | | | |
Distribution fee: | | | | | | | | | | | | | | |
Class C | | 239 | | | 25,796 | | | 197 | | | 5,092 | | | |
Class R | | — | | | — | | | 8,260 | | | 712 | | | |
Service fee: | | | | | | | | | | | | | | |
Class A | | 175 | | | 31,640 | | | 217 | | | 55,168 | | | |
Class C | | 80 | | | 8,557 | | | 65 | | | 1,697 | | | |
Transfer agent fee | | 247,843 | | | 1,173,512 | | | 151,052 | | | 1,374,055 | | | |
Pricing and bookkeeping fees | | 82,385 | | | 116,154 | | | 66,121 | | | 140,065 | | | |
Trustees’ fees | | 23,576 | | | 38,633 | | | 13,515 | | | 39,983 | | | |
Custody fee | | 16,722 | | | 19,384 | | | 12,692 | | | 20,297 | | | |
Registration fees | | 37,814 | | | 72,398 | | | 70,298 | | | 140,002 | | | |
Reports to shareholders | | 50,009 | | | 253,643 | | | 93,164 | | | 123,342 | | | |
Chief compliance officer expenses | | 576 | | | 887 | | | 636 | | | 978 | | | |
Other expenses | | 55,521 | | | 94,184 | | | 63,748 | | | 112,313 | | | |
| | | | | |
| | | | | | | | | | | | | | | |
Expenses before interest expense | | 2,450,645 | | | 6,125,357 | | | 1,694,923 | | | 10,338,356 | | | |
Interest expense | | 38 | | | — | | | 923 | | | 932 | | | |
| | | | | |
| | | | | | | | | | | | | | | |
Total Expenses | | 2,450,683 | | | 6,125,357 | | | 1,695,846 | | | 10,339,288 | | | |
Fees waived or expenses reimbursed by investment advisor and/or administrator | | (95,811 | ) | | (254,984 | ) | | (72,331 | ) | | (394,599 | ) | | |
Expense reductions | | (8,506 | ) | | (12,029 | ) | | (6,998 | ) | | (11,024 | ) | | |
| | | | | |
| | | | | | | | | | | | | | | |
Net Expenses | | 2,346,366 | | | 5,858,344 | | | 1,616,517 | | | 9,933,665 | | | |
| | | | | |
| | | | | | | | | | | | | | | |
Net Investment Income (Loss) | | 1,885,312 | | | 579,329 | | | 931,792 | | | (3,690,244 | ) | | |
See Accompanying Notes to Financial Statements.
92
| | | | | | | | | | | | | | | | | | |
| | | $ | | | $ | | | $ | | | $ | | | $ | | | $ | |
| | |
Columbia
Select
Opportunities
Fund | | | Columbia
Select
Small Cap
Fund | | |
Columbia
Value and
Restructuring
Fund | | | Columbia
Emerging
Markets
Fund | | | Columbia
International
Growth
Fund | | | Columbia
Pacific/Asia
Fund | |
| | | | | | | | | | | | | | | | | | |
| | 4,777,560 | | | 3,263,085 | | | 178,355,800 | | | 16,586,464 | | | 13,695,084 | | | 2,119,205 | |
| | — | | | 1,000,000 | | | 3,687,115 | | | — | | | — | | | — | |
| | 40,462 | | | 46,384 | | | 1,758,667 | | | 35,487 | | | 46,306 | | | 2,781 | |
| | (75,849 | ) | | — | | | (2,041,629 | ) | | (1,641,055 | ) | | (1,097,413 | ) | | (139,701 | ) |
| | | | | | |
| | | | | | | | | | | | | | | | | | |
| | 4,742,173 | | | 4,309,469 | | | 181,759,953 | | | 14,980,896 | | | 12,643,977 | | | 1,982,285 | |
| | | | | | |
| | | | | | | | | | | | | | | | | | |
| | 2,266,417 | | | 4,041,266 | | | 45,997,660 | | | 6,822,851 | | | 3,878,459 | | | 634,182 | |
| | 370,056 | | | 690,826 | | | 11,411,391 | | | 1,001,669 | | | 687,667 | | | 85,238 | |
| | | | | | | | | | | | | | | | | | |
| | 2,017 | | | 13,597 | | | 327,407 | | | 2,411 | | | 328 | | | 626 | |
| | — | | | 32,967 | | | 211,389 | | | — | | | — | | | — | |
| | | | | | | | | | | | | | | | | | |
| | 3,460 | | | 22,573 | | | 490,668 | | | 4,088 | | | 290 | | | 145 | |
| | 672 | | | 4,532 | | | 109,135 | | | 803 | | | 110 | | | 209 | |
| | 128,842 | | | 913,375 | | | 11,567,556 | | | 856,279 | | | 629,756 | | | 23,364 | |
| | 93,693 | | | 117,550 | | | 143,296 | | | 117,814 | | | 100,912 | | | 57,548 | |
| | 22,549 | | | 32,327 | | | 268,652 | | | 52,836 | | | 28,170 | | | 13,529 | |
| | 84,167 | | | 20,328 | | | 265,600 | | | 1,072,435 | | | 180,542 | | | 160,823 | |
| | 47,914 | | | 66,331 | | | 210,466 | | | 53,068 | | | 53,306 | | | 58,662 | |
| | 62,510 | | | 214,289 | | | 1,406,426 | | | 257,117 | | | 94,687 | | | 62,533 | |
| | 736 | | | 858 | | | 4,004 | | | 881 | | | 822 | | | 626 | |
| | 75,033 | | | 102,326 | | | 556,702 | | | 105,849 | | | 102,320 | | | 66,652 | |
| | | | | | |
| | | | | | | | | | | | | | | | | | |
| | 3,158,066 | | | 6,273,145 | | | 72,970,352 | | | 10,348,101 | | | 5,757,369 | | | 1,164,137 | |
| | 2,468 | | | 6,059 | | | 28,828 | | | 57,070 | | | 21,148 | | | 5,231 | |
| | | | | | |
| | | | | | | | | | | | | | | | | | |
| | 3,160,534 | | | 6,279,204 | | | 72,999,180 | | | 10,405,171 | | | 5,778,517 | | | 1,169,368 | |
| | | | | | |
| | (671,941 | ) | | (233,138 | ) | | (3,327,593 | ) | | (962,113 | ) | | (176,347 | ) | | (67,447 | ) |
| | (1,726 | ) | | (9,905 | ) | | (65,048 | ) | | (6,976 | ) | | (4,480 | ) | | (2,060 | ) |
| | | | | | |
| | | | | | | | | | | | | | | | | | |
| | 2,486,867 | | | 6,036,161 | | | 69,606,539 | | | 9,436,082 | | | 5,597,690 | | | 1,099,861 | |
| | | | | | |
| | | | | | | | | | | | | | | | | | |
| | 2,255,306 | | | (1,726,692 | ) | | 112,153,414 | | | 5,544,814 | | | 7,046,287 | | | 882,424 | |
See Accompanying Notes to Financial Statements.
93
Statements of Operations (continued) – Equity Funds
For the Year Ended March 31, 2009
| | | | | | | | | | | | | | |
| | | $ | | | $ | | | $ | | | $ | | | |
| | | Columbia
Blended
Equity
Fund | | | Columbia
Energy and
Natural
Resources
Fund | | | Columbia
Mid Cap
Core Fund | | | Columbia
Select Large
Cap Growth
Fund | | | |
Net Realized and Unrealized Gain (Loss) on Investments, Foreign Currency and Foreign Capital Gains Tax: | | | | | | | | | | | | | | |
Net realized loss on: | | | | | | | | | | | | | | |
Unaffiliated investments | | (21,707,774 | ) | | (200,232,321 | ) | | (15,550,535 | ) | | (177,939,043 | ) | | |
Affiliated investments | | — | | | — | | | — | | | — | | | |
Foreign currency transactions and forward foreign currency exchange contracts | | (85,097 | ) | | (6,733 | ) | | (6,862 | ) | | — | | | |
| | | | | |
| | | | | | | | | | | | | | | |
Net realized loss | | (21,792,871 | ) | | (200,239,054 | ) | | (15,557,397 | ) | | (177,939,043 | ) | | |
Net change in unrealized appreciation (depreciation) on: | | | | | | | | | | | | | | |
Investments | | (82,620,947 | ) | | (127,833,382 | ) | | (80,732,279 | ) | | (309,588,130 | ) | | |
Foreign currency translations and forward foreign currency exchange contracts | | (950 | ) | | (38,452 | ) | | 40 | | | — | | | |
Foreign capital gains tax | | — | | | — | | | — | | | — | | | |
| | | | | |
| | | | | | | | | | | | | | | |
Net change in unrealized appreciation (depreciation) | | (82,621,897 | ) | | (127,871,834 | ) | | (80,732,239 | ) | | (309,588,130 | ) | | |
| | | | | |
| | | | | | | | | | | | | | | |
Net Loss | | (104,414,768 | ) | | (328,110,888 | ) | | (96,289,636 | ) | | (487,527,173 | ) | | |
| | | | | |
| | | | | | | | | | | | | | | |
Net Decrease Resulting from Operations | | (102,529,456 | ) | | (327,531,559 | ) | | (95,357,844 | ) | | (491,217,417 | ) | | |
See Accompanying Notes to Financial Statements.
94
| | | | | | | | | | | | | | | | | | |
| | | $ | | | $ | | | $ | | | $ | | | $ | | | $ | |
| | |
Columbia
Select
Opportunities
Fund | | | Columbia
Select
Small Cap
Fund | | | Columbia
Value and
Restructuring
Fund | | | Columbia
Emerging
Markets
Fund | | | Columbia
International
Growth
Fund | | | Columbia
Pacific/Asia
Fund | |
| | | | | | |
| | | | | | | | | | | | | | | | | | |
| | | | | | | | | | | | | | | | | | |
| | (131,745,376 | ) | | (122,138,321 | ) | | (1,084,763,762 | ) | | (34,978,526 | ) | | (134,065,600 | ) | | (22,897,290 | ) |
| | — | | | (286,999 | ) | | (91,987,494 | ) | | — | | | — | | | — | |
| | | | | | |
| | (63,107 | ) | | — | | | (180,689 | ) | | (1,253,177 | ) | | (5,156,328 | ) | | (713,073 | ) |
| | | | | | |
| | | | | | | | | | | | | | | | | | |
| | (131,808,483 | ) | | (122,425,320 | ) | | (1,176,931,945 | ) | | (36,231,703 | ) | | (139,221,928 | ) | | (23,610,363 | ) |
| | | | | | |
| | | | | | | | | | | | | | | | | | |
| | (46,476,912 | ) | | (155,761,126 | ) | | (3,893,749,328 | ) | | (316,128,991 | ) | | (106,359,112 | ) | | (8,448,022 | ) |
| | | | | | |
| | (12,033 | ) | | — | | | (38,235 | ) | | (1,035 | ) | | 202,889 | | | 46,241 | |
| | — | | | — | | | — | | | 293,166 | | | 272,274 | | | 81,558 | |
| | | | | | |
| | | | | | | | | | | | | | | | | | |
| | | | | | |
| | (46,488,945 | ) | | (155,761,126 | ) | | (3,893,787,563 | ) | | (315,836,860 | ) | | (105,883,949 | ) | | (8,320,223 | ) |
| | | | | | |
| | | | | | | | | | | | | | | | | | |
| | (178,297,428 | ) | | (278,186,446 | ) | | (5,070,719,508 | ) | | (352,068,563 | ) | | (245,105,877 | ) | | (31,930,586 | ) |
| | | | | | |
| | | | | | | | | | | | | | | | | | |
| | (176,042,122 | ) | | (279,913,138 | ) | | (4,958,566,094 | ) | | (346,523,749 | ) | | (238,059,590 | ) | | (31,048,162 | ) |
See Accompanying Notes to Financial Statements.
95
Statements of Changes in Net Assets – Columbia Equity Funds
| | | | | | | | | | | | | | | | |
| Increase (Decrease) in Net Assets | | Columbia Blended
Equity Fund | | | | | Columbia Energy and
Natural Resources Fund | | | |
| | | Year Ended March 31, | | | | | Year Ended March 31, | | | |
| | | 2009 ($) | | | 2008 ($) (a)(b) | | | | | 2009 ($) | | | 2008 ($) (a)(c) | | | |
Operations | | | | | | | | | | | | | | | | |
Net investment income (loss) | | 1,885,312 | | | 2,484,145 | | | | | 579,329 | | | 340,137 | | | |
Net realized gain (loss) on investments and foreign currency transactions | | (21,792,871 | ) | | 61,743,836 | | | | | (200,239,054 | ) | | 80,998,074 | | | |
Net change in unrealized appreciation (depreciation) on investments and foreign currency translations | | (82,621,897 | ) | | (55,325,660 | ) | | | | (127,871,834 | ) | | 66,202,660 | | | |
| | | | | | | | | | | | | | | | |
Net increase (decrease) resulting from operations | | (102,529,456 | ) | | 8,902,321 | | | | | (327,531,559 | ) | | 147,540,871 | | | |
| | | | | | |
Distributions to Shareholders | | | | | | | | | | | | | | | | |
From net investment income: | | | | | | | | | | | | | | | | |
Institutional Shares | | — | | | — | | | | | — | | | — | | | |
Class A Shares | | (474 | ) | | — | | | | | — | | | — | | | |
Class C Shares | | (19 | ) | | — | | | | | — | | | — | | | |
Class R Shares | | — | | | — | | | | | — | | | — | | | |
Class Z Shares | | (1,756,076 | ) | | (3,091,634 | ) | | | | — | | | (692,495 | ) | | |
From net realized gains: | | | | | | | | | | | | | | | | |
Institutional Shares | | — | | | — | | | | | — | | | — | | | |
Class A Shares | | (1,523 | ) | | — | | | | | (213,683 | ) | | (157,697 | ) | | |
Class C Shares | | (2,089 | ) | | — | | | | | (49,859 | ) | | (30,214 | ) | | |
Class R Shares | | — | | | — | | | | | — | | | — | | | |
Class Z Shares | | (21,465,963 | ) | | (70,675,685 | ) | | | | (11,867,954 | ) | | (99,593,088 | ) | | |
| | | | | | | | | | | | | | | | |
Total distributions to shareholders | | (23,226,144 | ) | | (73,767,319 | ) | | | | (12,131,496 | ) | | (100,473,494 | ) | | |
| | | | | | |
Net Capital Stock Transactions | | (26,011,260 | ) | | (44,283,689 | ) | | | | (18,201,727 | ) | | 174,033,621 | | | |
| | | | | | |
Redemption fees | | — | | | 3,518 | | | | | — | | | 64,308 | | | |
Increase from regulatory settlements | | — | | | — | | | | | — | | | — | | | |
Total increase (decrease) in net assets | | (151,766,860 | ) | | (109,145,169 | ) | | | | (357,864,782 | ) | | 221,165,306 | | | |
| | | | | | |
Net Assets | | | | | | | | | | | | | | | | |
Beginning of period | | 291,877,636 | | | 401,022,805 | | | | | 718,841,187 | | | 497,675,881 | | | |
End of period | | 140,110,776 | | | 291,877,636 | | | | | 360,976,405 | | | 718,841,187 | | | |
Undistributed (overdistributed) net investment income, at end of period | | 127,402 | | | 108,901 | | | | | 516,042 | | | (4 | ) | | |
| (a) | On March 31, 2008, the Predecessor Fund’s Shares class was reorganized into the Fund’s Class Z. The financial information of the Fund’s Class Z shares includes the financial information of the Predecessor Fund’s Shares class. | |
| (b) | The Fund’s Class A and Class C shares commenced operations on March 31, 2008. | |
| (c) | The Predecessor Fund’s Class A and Class C shares commenced operations on September 28, 2007. | |
| (d) | On March 31, 2008, the Predecessor Fund’s Retirement Shares class was reorganized into the Fund’s Class R. The financial information of the Fund’s Class R shares includes the financial information of the Predecessor Fund’s Retirement Shares class. | |
| (e) | On March 31, 2008, the Predecessor Fund’s Institutional Shares class was reorganized into the Fund’s Class Z. | |
See Accompanying Notes to Financial Statements.
96
| | | | | | | | | | | | | | | | | | |
| | | Columbia
Mid Cap Core Fund | | | Columbia Select
Large Cap Growth Fund | | | Columbia Select
Opportunities Fund | |
| | | Year Ended March 31, | | | Year Ended March 31, | | | Year Ended March 31, | |
| | | 2009 ($) | | | 2008 ($) (a)(b)(d)(e) | | | 2009 ($) | | | 2008 ($) (a)(c)(d)(e) | | | 2009 ($) | | | 2008 ($) (a)(c)(e) | |
| | | | | | | | | | | | | | | | | | |
| | 931,792 | | | 1,618,971 | | | (3,690,244 | ) | | (5,860,541 | ) | | 2,255,306 | | | 2,630,036 | |
| | | | | | |
| | (15,557,397 | ) | | 1,492,351 | | | (177,939,043 | ) | | 43,526,816 | | | (131,808,483 | ) | | 20,030,342 | |
| | | | | | |
| | (80,732,239 | ) | | (37,221,228 | ) | | (309,588,130 | ) | | 3,102,461 | | | (46,488,945 | ) | | (17,686,363 | ) |
| | | | | | | | | | | | | | | | | | |
| | (95,357,844 | ) | | (34,109,906 | ) | | (491,217,417 | ) | | 40,768,736 | | | (176,042,122 | ) | | 4,974,015 | |
| | | | | | |
| | | | | | | | | | | | | | | | | | |
| | | | | | | | | | | | | | | | | | |
| | — | | | (547,003 | ) | | — | | | — | | | — | | | (577,035 | ) |
| | (876 | ) | | — | | | — | | | — | | | (10,165 | ) | | (816 | ) |
| | (144 | ) | | — | | | — | | | — | | | (914 | ) | | — | |
| | (5,496 | ) | | (16,431 | ) | | — | | | — | | | — | | | — | |
| | (793,378 | ) | | (4,269,945 | ) | | — | | | — | | | (2,305,877 | ) | | (2,341,365 | ) |
| | | | | | | | | | | | | | | | | | |
| | — | | | (646,878 | ) | | — | | | — | | | — | | | (1,405,666 | ) |
| | (59 | ) | | — | | | — | | | — | | | (20,990 | ) | | (10,156 | ) |
| | (43 | ) | | — | | | — | | | — | | | (2,859 | ) | | (261 | ) |
| | (4,852 | ) | | (41,070 | ) | | — | | | — | | | — | | | — | |
| | (546,197 | ) | | (6,744,281 | ) | | — | | | — | | | (5,524,841 | ) | | (9,215,906 | ) |
| | | | | | | | | | | | | | | | | | |
| | (1,351,045 | ) | | (12,265,608 | ) | | — | | | — | | | (7,865,646 | ) | | (13,551,205 | ) |
| | | | | | |
| | (85,989,212 | ) | | (33,103,896 | ) | | 367,737,435 | | | 165,896,174 | | | (69,072,002 | ) | | 59,367,097 | |
| | | | | | |
| | — | | | 10,694 | | | — | | | 35,222 | | | — | | | 15,505 | |
| | — | | | — | | | 13,882 | | | — | | | — | | | — | |
| | (182,698,101 | ) | | (79,468,716 | ) | | (123,466,100 | ) | | 206,700,132 | | | (252,979,770 | ) | | 50,805,412 | |
| | | | | | |
| | | | | | | | | | | | | | | | | | |
| | 247,648,053 | | | 327,116,769 | | | 941,136,255 | | | 734,436,123 | | | 388,785,162 | | | 337,979,750 | |
| | 64,949,952 | | | 247,648,053 | | | 817,670,155 | | | 941,136,255 | | | 135,805,392 | | | 388,785,162 | |
| |
99,722 |
| | — | | | (6,634 | ) | | — | | | 97,364 | | | 253,448 | |
See Accompanying Notes to Financial Statements.
97
Statements of Changes in Net Assets (continued) – Columbia Equity Funds
| | | | | | | | | | | | | | | | |
| Increase (Decrease) in Net Assets | | Columbia Select
Small Cap Fund | | | | | Columbia Value and
Restructuring Fund | | | |
| | | Year Ended March 31, | | | | | Year Ended March 31, | | | |
| | | 2009 ($) | | | 2008 ($) (a)(b)(c) | | | | | 2009 ($) | | | 2008 ($) (a)(b)(c)(d) | | | |
Operations | | | | | | | | | | | | | | | | |
Net investment income (loss) | | (1,726,692 | ) | | (4,857,984 | ) | | | | 112,153,414 | | | 97,292,642 | | | |
Net realized gain (loss) on investments, foreign currency transactions and forward foreign currency exchange contracts | | (122,425,320 | ) | | 71,206,081 | | | | | (1,176,931,945 | ) | | 5,476,654 | | | |
Net change in unrealized appreciation (depreciation) on investments, foreign currency translations, forward foreign currency exchange contracts and foreign capital gains tax | | (155,761,126 | ) | | (140,546,087 | ) | | | | (3,893,787,563 | ) | | (322,546,411 | ) | | |
| | | | | | | | | | | | | | | | |
Net increase (decrease) resulting from operations | | (279,913,138 | ) | | (74,197,990 | ) | | | | (4,958,566,094 | ) | | (219,777,115 | ) | | |
| | | | | | |
Distributions to Shareholders | | | | | | | | | | | | | | | | |
From net investment income: | | | | | | | | | | | | | | | | |
Institutional Shares | | — | | | — | | | | | — | | | (5,668,281 | ) | | |
Class A Shares | | — | | | — | | | | | (2,899,712 | ) | | (195,819 | ) | | |
Class C Shares | | — | | | — | | | | | (292,782 | ) | | (17,109 | ) | | |
Class R Shares | | — | | | — | | | | | (480,565 | ) | | (143,448 | ) | | |
Class Z Shares | | — | | | — | | | | | (108,747,976 | ) | | (112,098,602 | ) | | |
From net realized gains: | | | | | | | | | | | | | | | | |
Institutional Shares | | — | | | — | | | | | — | | | (3,346,525 | ) | | |
Class A Shares | | (303,623 | ) | | (13,052 | ) | | | | (83,311 | ) | | (153,354 | ) | | |
Class C Shares | | (70,804 | ) | | (2,927 | ) | | | | (18,779 | ) | | (40,857 | ) | | |
Class R Shares | | (241,850 | ) | | (532,206 | ) | | | | (18,992 | ) | | (95,413 | ) | | |
Class Z Shares | | (20,518,422 | ) | | (58,484,455 | ) | | | | (3,904,858 | ) | | (79,135,130 | ) | | |
| | | | | | | | | | | | | | | | |
Total distributions to shareholders | | (21,134,699 | ) | | (59,032,640 | ) | | | | (116,446,975 | ) | | (200,894,538 | ) | | |
| | | | | | |
Net Capital Stock Transactions | | (52,896,968 | ) | | 125,629,688 | | | | | 563,439,037 | | | 1,384,047,916 | | | |
| | | | | | |
Redemption fees | | — | | | 43,881 | | | | | — | | | 524,728 | | | |
Increase from regulatory settlements | | 146,495 | | | — | | | | | 47,297 | | | — | | | |
Total increase (decrease) in net assets | | (353,798,310 | ) | | (7,557,061 | ) | | | | (4,511,526,735 | ) | | 963,900,991 | | �� | |
| | | | | | |
Net Assets | | | | | | | | | | | | | | | | |
Beginning of period | | 689,035,246 | | | 696,592,307 | | | | | 9,105,057,807 | | | 8,141,156,816 | | | |
End of period | | 335,236,936 | | | 689,035,246 | | | | | 4,593,531,072 | | | 9,105,057,807 | | | |
Undistributed (overdistributed) net investment income at end of period | | (5,567 | ) | | — | | | | | 841,775 | | | 1,979,612 | | | |
| (a) | On March 31, 2008, the Predecessor Fund’s Shares class was reorganized into the Fund’s Class Z. The financial information of Class Z shares includes the financial information of the Predecessor Fund’s Shares class. | |
| (b) | The Predecessor Fund’s Class A and Class C shares commenced operations on September 28, 2007. | |
| (c) | On March 31, 2008, the Predecessor Fund’s Retirement Shares class was reorganized into the Fund’s Class R. The financial information of the Fund’s Class R shares includes the financial information of the Predecessor Fund’s Retirement Shares class. | |
| (d) | On March 31, 2008, the Predecessor Fund’s Institutional Shares class was reorganized into the Fund’s Class Z. | |
| (e) | The Fund’s Class A and Class C shares commenced operations on March 31, 2008. | |
See Accompanying Notes to Financial Statements.
98
| | | | | | | | | | | | | | | | | | |
| | | Columbia Emerging
Markets Fund | | | Columbia International
Growth Fund | | | Columbia
Pacific/Asia Fund | |
| | | Year Ended March 31, | | | Year Ended March 31, | | | Year Ended March 31, | |
| | | 2009 ($) | | | 2008 ($) (a)(b)(d) | | | 2009 ($) | | | 2008 ($) (a)(d)(e) | | | 2009 ($) | | | 2008 ($) (a)(e) | |
| | | | | | | | | | | | | | | | | | |
| | 5,544,814 | | | 9,256,342 | | | 7,046,287 | | | 3,947,393 | | | 882,424 | | | 725,762 | |
| | | | | | |
| | (36,231,703 | ) | | 222,139,695 | | | (139,221,928 | ) | | 88,471,328 | | | (23,610,363 | ) | | 30,768,611 | |
| | | | | | |
| | (315,836,860 | ) | | (55,590,645 | ) | | (105,883,949 | ) | | (99,163,606 | ) | | (8,320,223 | ) | | (25,971,156 | ) |
| | | | | | | | | | | | | | | | | | | |
| |
(346,523,749) |
| | 175,805,392 | | | (238,059,590 | ) | | (6,744,885 | ) | | (31,048,162 | ) | | 5,523,217 | |
| | | | | | |
| | | | | | | | | | | | | | | | | | |
| | | | | | | | | | | | | | | | | | |
| | — | | | (427,310 | ) | | — | | | — | | | — | | | — | |
| | — | | | (4,765 | ) | | (289 | ) | | — | | | (594 | ) | | — | |
| | — | | | (173 | ) | | (19 | ) | | — | | | (45 | ) | | — | |
| | — | | | — | | | — | | | — | | | — | | | — | |
| | — | | | (9,063,981 | ) | | (1,132,296 | ) | | (2,909,679 | ) | | (480,114 | ) | | (1,220,208 | ) |
| | | | | | | | | | | | | | | | | | |
| | — | | | (3,358,883 | ) | | — | | | — | | | — | | | — | |
| | (513,878 | ) | | (58,024 | ) | | (3,433 | ) | | — | | | (5,615 | ) | | — | |
| | (84,665 | ) | | (5,981 | ) | | (602 | ) | | — | | | (1,401 | ) | | — | |
| | — | | | — | | | — | | | — | | | — | | | — | |
| | (137,101,297 | ) | | (84,902,977 | ) | | (35,191,377 | ) | | — | | | (14,738,370 | ) | | (34,933,953 | ) |
| | | | | | | | | | | | | | | | | | | |
| | (137,699,840 | ) | | (97,822,094 | ) | | (36,328,016 | ) | | (2,909,679 | ) | | (15,226,139 | ) | | (36,154,161 | ) |
| | | | | | |
| | (293,665,421 | ) | | (196,115,846 | ) | | (195,593,367 | ) | | 8,700,366 | | | (46,647,878 | ) | | (64,648,577 | ) |
| | | | | | |
| | 55,618 | | | 123,463 | | | 9,839 | | | 62,687 | | | 576 | | | 2,158 | |
| | — | | | — | | | 150,489 | | | — | | | — | | | — | |
| | (777,833,392 | ) | | (118,009,085 | ) | | (469,820,645 | ) | | (891,511 | ) | | (92,921,603 | ) | | (95,277,363 | ) |
| | | | | | |
| | | | | | | | | | | | | | | | | | |
| | 1,016,404,394 | | | 1,134,413,479 | | | 636,049,636 | | | 636,941,147 | | | 117,855,080 | | | 213,132,443 | |
| | 238,571,002 | | | 1,016,404,394 | | | 166,228,991 | | | 636,049,636 | | | 24,933,477 | | | 117,855,080 | |
| | | | | | |
| | 2,957,245 | | | (1,445 | ) | | 1,542,970 | | | 1,097,836 | | | 105,370 | | | 470,820 | |
See Accompanying Notes to Financial Statements.
99
Statements of Changes in Net Assets – Capital Stock Activity
| | | | | | | | | | | | | | |
| | | Columbia Blended Equity Fund | | | |
| | | Year Ended
March 31, 2009 | | | Year Ended
March 31, 2008 (a)(b) | | | |
| | | Shares | | | Dollars ($) | | | Shares | | | Dollars ($) | | | |
Class A | | | | | | | | | | | | | | |
Subscriptions | | 13,948 | | | 264,716 | | | 348 | | | 10,000 | | | |
Distributions reinvested | | 84 | | | 1,996 | | | — | | | — | | | |
Redemptions | | (4,425 | ) | | (90,083 | ) | | — | | | — | | | |
| | | | | | | | | | | | | | |
Net increase | | 9,607 | | | 176,629 | | | 348 | | | 10,000 | | | |
| | | | | |
Class C | | | | | | | | | | | | | | |
Subscriptions | | 3,298 | | | 69,597 | | | 348 | | | 10,000 | | | |
Distributions reinvested | | 79 | | | 2,108 | | | — | | | — | | | |
Redemptions | | (173 | ) | | (2,626 | ) | | — | | | — | | | |
| | | | | | | | | | | | | | |
Net increase | | 3,204 | | | 69,079 | | | 348 | | | 10,000 | | | |
| | | | | |
Class Z | | | | | | | | | | | | | | |
Subscriptions | | 1,069,699 | | | 25,352,681 | | | 342,872 | | | 11,388,278 | | | |
Distributions reinvested | | 461,476 | | | 12,021,012 | | | 1,051,349 | | | 33,102,298 | | | |
Redemptions | | (3,046,571 | ) | | (63,630,661 | ) | | (2,586,314 | ) | | (88,794,265 | ) | | |
| | | | | | | | | | | | | | |
Net increase (decrease) | | (1,515,396 | ) | | (26,256,968 | ) | | (1,192,093 | ) | | (44,303,689 | ) | | |
| (a) | The Fund’s Class A and Class C shares commenced operations on March 31, 2008. |
| (b) | On March 31, 2008, the Predecessor Fund’s Shares class was reorganized into the Fund’s Class Z. The financial information of the Fund’s Class Z shares includes the financial information of the Predecessor Fund’s Shares class. | |
| (c) | The Predecessor Fund’s Class A and Class C shares commenced operations on September 28, 2007. |
See Accompanying Notes to Financial Statements.
100
| | | | | | | | | | | | |
| | | Columbia Energy and Natural Resources Fund | |
| | | Year Ended
March 31, 2009 | | | Year Ended
March 31, 2008 (b)(c) | |
| | | Shares | | | Dollars ($) | | | Shares | | | Dollars ($) | |
| | | | | | | | | | | | |
| | 1,521,512 | | | 31,235,608 | | | 217,965 | | | 5,610,805 | |
| | 6,524 | | | 202,507 | | | 5,951 | | | 145,563 | |
| | (500,903 | ) | | (9,514,854 | ) | | (14,905 | ) | | (376,074 | ) |
| | | | | | | | | | | | |
| | 1,027,133 | | | 21,923,261 | | | 209,011 | | | 5,380,294 | |
| | | | |
| | | | | | | | | | | | |
| | 499,658 | | | 9,008,275 | | | 55,662 | | | 1,430,454 | |
| | 1,512 | | | 46,686 | | | 1,174 | | | 28,696 | |
| | (123,945 | ) | | (2,327,141 | ) | | (400 | ) | | (9,000 | ) |
| | | | | | | | | | | | |
| | 377,225 | | | 6,727,820 | | | 56,436 | | | 1,450,150 | |
| | | | |
| | | | | | | | | | | | |
| | 10,770,648 | | | 238,912,602 | | | 12,481,035 | | | 324,142,746 | |
| | 318,342 | | | 9,884,506 | | | 3,304,337 | | | 80,891,849 | |
| | (14,257,674 | ) | | (295,649,916 | ) | | (9,207,514 | ) | | (237,831,418 | ) |
| | | | | | | | | | | | |
| | (3,168,684 | ) | | (46,852,808 | ) | | 6,577,858 | | | 167,203,177 | |
See Accompanying Notes to Financial Statements.
101
Statements of Changes in Net Assets (continued) – Capital Stock Activity
| | | | | | | | | | | | | | |
| | | Columbia Mid Cap Core Fund | | | |
| | | Year Ended
March 31, 2009 | | | Year Ended
March 31, 2008 (a)(b)(c)(d) | | | |
| | | Shares | | | Dollars ($) | | | Shares | | | Dollars ($) | | | |
Institutional Shares | | | | | | | | | | | | | | |
Subscriptions | | — | | | — | | | 162,295 | | | 3,582,580 | | | |
Exchange in connection with reorganization | | — | | | — | | | (1,271,403 | ) | | (23,142,408 | ) | | |
Distributions reinvested | | — | | | — | | | 8,599 | | | 186,106 | | | |
Redemptions | | — | | | — | | | (353,811 | ) | | (7,993,675 | ) | | |
| | | | | | | | | | | | | | |
Net decrease | | — | | | — | | | (1,454,320 | ) | | (27,367,397 | ) | | |
| | | | | |
Class A Shares | | | | | | | | | | | | | | |
Subscriptions | | 29,193 | | | 324,419 | | | 547 | | | 10,000 | | | |
Distributions reinvested | | 92 | | | 917 | | | — | | | — | | | |
Redemptions | | (7,816 | ) | | (81,226 | ) | | — | | | — | | | |
| | | | | | | | | | | | | | |
Net increase | | 21,469 | | | 244,110 | | | 547 | | | 10,000 | | | |
| | | | | |
Class C Shares | | | | | | | | | | | | | | |
Subscriptions | | 7,728 | | | 79,136 | | | 547 | | | 10,000 | | | |
Distributions reinvested | | 17 | | | 187 | | | — | | | — | | | |
Redemptions | | (1,234 | ) | | (13,294 | ) | | — | | | — | | | |
| | | | | | | | | | | | | | |
Net increase | | 6,511 | | | 66,029 | | | 547 | | | 10,000 | | | |
| | | | | |
Class R Shares | | | | | | | | | | | | | | |
Subscriptions | | 42,244 | | | 582,981 | | | 78,641 | | | 1,633,794 | | | |
Distributions reinvested | | 763 | | | 10,348 | | | 2,703 | | | 57,501 | | | |
Redemptions | | (33,133 | ) | | (405,611 | ) | | (20,851 | ) | | (432,225 | ) | | |
| | | | | | | | | | | | | | |
Net increase | | 9,874 | | | 187,718 | | | 60,493 | | | 1,259,070 | | | |
| | | | | |
Class Z Shares | | | | | | | | | | | | | | |
Subscriptions | | 911,865 | | | 14,180,439 | | | 2,253,776 | | | 50,009,391 | | | |
Exchange in connection with reorganization | | — | | | — | | | 1,275,610 | | | 23,142,408 | | | |
Distributions reinvested | | 38,775 | | | 586,253 | | | 226,451 | | | 4,870,009 | | | |
Redemptions | | (7,724,000 | ) | | (101,253,761 | ) | | (3,952,063 | ) | | (85,037,377 | ) | | |
| | | | | | | | | | | | | | |
Net increase (decrease) | | (6,773,360 | ) | | (86,487,069 | ) | | (196,226 | ) | | (7,015,569 | ) | | |
| (a) | The Fund’s Class A and Class C shares commenced operations on March 31, 2008. |
| (b) | On March 31, 2008, the Predecessor Fund’s Shares class was reorganized into the Fund’s Class Z. The financial information of the Fund’s Class Z shares includes the financial information of the Predecessor Fund’s Shares class. | |
| (c) | On March 31, 2008, the Predecessor Fund’s Retirement Shares class was reorganized into the Fund’s Class R. The financial information of the Fund’s Class R shares includes the financial information of the Predecessor Fund’s Retirement Shares class. | |
| (d) | On March 31, 2008, the Predecessor Fund’s Institutional Shares class was reorganized into the Fund’s Class Z. |
| (e) | The Predecessor Fund’s Class A and Class C shares commenced operations on September 28, 2007. |
See Accompanying Notes to Financial Statements.
102
| | | | | | | | | | | | | | | | | | | | | | | | |
| | | Columbia Select Large Cap Growth Fund | | | Columbia Select Opportunities Fund | |
| | | Year Ended
March 31, 2009 | | | Year Ended
March 31, 2008(b)(c)(d)(e) | | | Year Ended
March 31, 2009 | | | Year Ended
March 31, 2008 (b)(d)(e) | |
| | | Shares | | | Dollars ($) | | | Shares | | | Dollars ($) | | | Shares | | | Dollars ($) | | | Shares | | | Dollars ($) | |
| | | | | | | | | | | | | | | | | | | | | | | | |
| | — | | | — | | | 1,157,960 | | | 13,246,958 | | | — | | | — | | | 348,960 | | | 5,184,884 | |
| | — | | | — | | | (2,391,852 | ) | | (27,022,440 | ) | | — | | | — | | | 31,247 | | | 478,615 | |
| | — | | | — | | | — | | | — | | | — | | | — | | | (1,213,557 | ) | | (18,743,629 | ) |
| | — | | | — | | | (274,346 | ) | | (3,094,714 | ) | | — | | | — | | | (3,403,888 | ) | | (47,193,849 | ) |
| | | | | | | | | | | | | | | | | | | | | | | | |
| | — | | | — | | | (1,508,238 | ) | | (16,870,196 | ) | | — | | | — | | | (4,237,238 | ) | | (60,273,979 | ) |
| | | | | | | | |
| | | | | | | | | | | | | | | | | | | | | | | | |
| | 13,464,242 | | | 95,140,472 | | | 189,595 | | | 2,289,307 | | | 245,159 | | | 3,043,457 | | | 42,317 | | | 640,063 | |
| | — | | | — | | | — | | | — | | | 2,140 | | | 25,070 | | | 716 | | | 10,973 | |
| | (1,688,190 | ) | | (12,586,524 | ) | | (82 | ) | | (978 | ) | | (126,113 | ) | | (1,000,311 | ) | | (20,284 | ) | | (310,677 | ) |
| | | | | | | | | | | | | | | | | | | | | | | | |
| | 11,776,052 | | | 82,553,948 | | | 189,513 | | | 2,288,329 | | | 121,186 | | | 2,068,216 | | | 22,749 | | | 340,359 | |
| | | | | | | | |
| | | | | | | | | | | | | | | | | | | | | | | | |
| | 144,439 | | | 1,322,856 | | | 22,882 | | | 271,251 | | | 51,047 | | | 626,053 | | | 1,919 | | | 28,343 | |
| | — | | | — | | | — | | | — | | | 216 | | | 2,718 | | | 17 | | | 261 | |
| | (56,309 | ) | | (424,734 | ) | | (1,724 | ) | | (20,534 | ) | | (21,565 | ) | | (175,467 | ) | | — | | | — | |
| | | | | | | | | | | | | | | | | | | | | | | | |
| | 88,130 | | | 898,122 | | | 21,158 | | | 250,717 | | | 29,698 | | | 453,304 | | | 1,936 | | | 28,604 | |
| | | | | | | | |
| | | | | | | | | | | | | | | | | | | | | | | | |
| | 21,445 | | | 229,371 | | | 2,747 | | | 31,514 | | | — | | | — | | | — | | | — | |
| | — | | | — | | | — | | | — | | | — | | | — | | | — | | | — | |
| | (20,076 | ) | | (138,787 | ) | | (1,034 | ) | | (11,441 | ) | | — | | | — | | | — | | | — | |
| | | | | | | | | | | | | | | | | | | | | | | | |
| | 1,369 | | | 90,584 | | | 1,713 | | | 20,073 | | | — | | | — | | | — | | | — | |
| | | | | | | | |
| | | | | | | | | | | | | | | | | | | | | | | | |
| | 70,056,832 | | | 674,697,263 | | | 26,168,371 | | | 306,071,503 | | | 6,840,043 | | | 81,210,244 | | | 8,882,662 | | | 132,520,635 | |
| | — | | | — | | | 2,400,349 | | | 27,022,440 | | | — | | | — | | | 3,403,887 | | | 47,193,849 | |
| | — | | | — | | | — | | | — | | | 192,085 | | | 2,503,567 | | | 258,954 | | | 3,968,894 | |
| | (49,639,020 | ) | | (390,502,482 | ) | | (13,281,458 | ) | | (152,886,692 | ) | | (17,201,779 | ) | | (155,307,333 | ) | | (4,336,315 | ) | | (64,411,265 | ) |
| | | | | | | | | | | | | | | | | | | | | | | | |
| | 20,417,812 | | | 284,194,781 | | | 15,287,262 | | | 180,207,251 | | | (10,169,651 | ) | | (71,593,522 | ) | | 8,209,188 | | | 119,272,113 | |
See Accompanying Notes to Financial Statements.
103
Statements of Changes in Net Assets (continued) – Capital Stock Activity
| | | | | | | | | | | | | | |
| | | Columbia Select Small Cap Fund | | | |
| | | Year Ended
March 31, 2009 | | | Year Ended
March 31, 2008 (a)(c)(d) | | | |
| | | Shares | | | Dollars ($) | | | Shares | | | Dollars ($) | | | |
Institutional Shares | | | | | | | | | | | | | | |
Subscriptions | | — | | | — | | | — | | | — | | | |
Exchange in connection with reorganization | | — | | | — | | | — | | | — | | | |
Distributions reinvested | | — | | | — | | | — | | | — | | | |
Redemptions | | — | | | — | | | — | | | — | | | |
| | | | | | | | | | | | | | |
Net decrease | | — | | | — | | | — | | | — | | | |
Class A | | | | | | | | | | | | | | |
Subscriptions | | 1,329,317 | | | 18,172,202 | | | 214,195 | | | 3,562,900 | | | |
Distributions reinvested | | 19,688 | | | 303,392 | | | 707 | | | 13,052 | | | |
Redemptions | | (826,731 | ) | | (8,579,057 | ) | | (2,150 | ) | | (36,604 | ) | | |
| | | | | | | | | | | | | | |
Net increase | | 522,274 | | | 9,896,537 | | | 212,752 | | | 3,539,348 | | | |
| | | | | |
Class C | | | | | | | | | | | | | | |
Subscriptions | | 38,874 | | | 527,059 | | | 130,390 | | | 2,190,200 | | | |
Distributions reinvested | | 4,609 | | | 70,656 | | | 159 | | | 2,927 | | | |
Redemptions | | (55,600 | ) | | (595,536 | ) | | — | | | — | | | |
| | | | | | | | | | | | | | |
Net increase (decrease) | | (12,117 | ) | | 2,179 | | | 130,549 | | | 2,193,127 | | | |
| | | | | |
Class R | | | | | | | | | | | | | | |
Subscriptions | | 343,592 | | | 4,176,248 | | | 477,053 | | | 9,323,250 | | | |
Distributions reinvested | | 15,995 | | | 241,850 | | | 29,274 | | | 532,206 | | | |
Redemptions | | (138,198 | ) | | (1,724,888 | ) | | (168,786 | ) | | (3,191,866 | ) | | |
| | | | | | | | | | | | | | |
Net increase | | 221,389 | | | 2,693,210 | | | 337,541 | | | 6,663,590 | | | |
| | | | | |
Class Z | | | | | | | | | | | | | | |
Subscriptions | | 11,301,343 | | | 145,607,901 | | | 15,301,239 | | | 294,017,699 | | | |
Exchange in connection with reorganization | | — | | | — | | | — | | | — | | | |
Distributions reinvested | | 695,997 | | | 10,732,107 | | | 1,431,298 | | | 26,450,381 | | | |
Redemptions | | (18,522,626 | ) | | (221,828,902 | ) | | (11,019,820 | ) | | (207,234,457 | ) | | |
| | | | | | | | | | | | | | |
Net increase (decrease) | | (6,525,286 | ) | | (65,488,894 | ) | | 5,712,717 | | | 113,233,623 | | | |
| (a) | On March 31, 2008, the Predecessor Fund’s Shares class was reorganized into the Fund’s Class Z. The financial information of the Fund’s Class Z shares includes the financial information of the Predecessor Fund’s Shares class. | |
| (b) | On March 31, 2008, the Predecessor Fund’s Institutional Shares class was reorganized into the Fund’s Class Z. |
| (c) | On March 31, 2008, the Predecessor Fund’s Retirement Shares class was reorganized into the Fund’s Class R. The financial information of the Fund’s Class R shares includes the financial information of the Predecessor Fund’s Retirement Shares class. | |
| (d) | The Predecessor Fund’s Class A and Class C shares commenced operations on September 28, 2007. |
See Accompanying Notes to Financial Statements.
104
| | | | | | | | | | | | |
| | | Columbia Value and Restructuring Fund | |
| | | Year Ended
March 31, 2009 | | | Year Ended
March 31, 2008 (a)(b)(c)(d) | |
| | | Shares | | | Dollars ($) | | | Shares | | | Dollars ($) | |
| | | | | | | | | | | | |
| | — | | | — | | | 2,776,479 | | | 158,664,278 | |
| | — | | | — | | | (6,755,662 | ) | | (350,726,825 | ) |
| | — | | | — | | | 133,699 | | | 7,513,733 | |
| | — | | | — | | | (2,973,501 | ) | | (171,327,024 | ) |
| | | | | | | | | | | | | |
| | — | | | — | | | (6,818,985 | ) | | (355,875,838 | ) |
| | | | | | | | | | | | |
| | 7,544,325 | | | 350,530,429 | | | 1,541,152 | | | 84,085,688 | |
| | 82,462 | | | 2,837,030 | | | 6,136 | | | 339,172 | |
| | (2,943,227 | ) | | (92,566,890 | ) | | (69,647 | ) | | (3,651,081 | ) |
| | | | | | | | | | | | | |
| | 4,683,560 | | | 260,800,569 | | | 1,477,641 | | | 80,773,779 | |
| | | | |
| | | | | | | | | | | | |
| | 1,655,495 | | | 78,563,854 | | | 270,919 | | | 14,912,558 | |
| | 8,192 | | | 252,762 | | | 1,004 | | | 56,380 | |
| | (402,283 | ) | | (12,919,203 | ) | | (10,318 | ) | | (534,261 | ) |
| | | | | | | | | | | | | |
| | 1,261,404 | | | 65,897,413 | | | 261,605 | | | 14,434,677 | |
| | | | |
| | | | | | | | | | | | |
| | 1,094,672 | | | 47,511,730 | | | 652,964 | | | 36,232,490 | |
| | 14,870 | | | 499,301 | | | 4,277 | | | 238,860 | |
| | (337,014 | ) | | (13,176,051 | ) | | (63,459 | ) | | (3,451,199 | ) |
| | | | | | | | | | | | | |
| | 772,528 | | | 34,834,980 | | | 593,782 | | | 33,020,151 | |
| | | | |
| | | | | | | | | | | | |
| | 60,774,982 | | | 2,515,699,893 | | | 48,405,334 | | | 2,730,263,337 | |
| | — | | | — | | | 6,754,362 | | | 350,726,825 | |
| | 2,397,249 | | | 88,424,717 | | | 2,791,705 | | | 157,055,127 | |
| | (70,849,326 | ) | | (2,402,218,535 | ) | | (28,957,123 | ) | | (1,626,350,142 | ) |
| | | | | | | | | | | | | |
| | (7,677,095 | ) | | 201,906,075 | | | 28,994,278 | | | 1,611,695,147 | |
See Accompanying Notes to Financial Statements.
105
Statements of Changes in Net Assets (continued) – Capital Stock Activity
| | | | | | | | | | | | | | |
| | | Columbia Emerging Markets Fund | | | |
| | | Year Ended
March 31, 2009 | | | Year Ended
March 31, 2008 (a)(b)(c) | | | |
| | | Shares | | | Dollars ($) | | | Shares | | | Dollars ($) | | | |
Institutional Shares | | | | | | | | | | | | | | |
Subscriptions | | — | | | — | | | 986,836 | | | 16,324,062 | | | |
Exchange in connection with reorganization | | — | | | — | | | (2,370,577 | ) | | (35,511,776 | ) | | |
Distributions reinvested | | — | | | — | | | 169,706 | | | 2,909,718 | | | |
Redemptions | | — | | | — | | | (1,760,412 | ) | | (29,570,897 | ) | | |
| | | | | | | | | | | | | | |
Net decrease | | — | | | — | | | (2,974,447 | ) | | (45,848,893 | ) | | |
| | | | | |
Class A | | | | | | | | | | | | | | |
Subscriptions | | 230,578 | | | 3,009,480 | | | 129,455 | | | 2,219,729 | | | |
Distributions reinvested | | 38,222 | | | 484,281 | | | 3,492 | | | 59,601 | | | |
Redemptions | | (208,280 | ) | | (1,853,707 | ) | | (50,625 | ) | | (815,648 | ) | | |
| | | | | | | | | | | | | | |
Net increase | | 60,520 | | | 1,640,054 | | | 82,322 | | | 1,463,682 | | | |
| | | | | |
Class C | | | | | | | | | | | | | | |
Subscriptions | | 36,604 | | | 332,966 | | | 31,142 | | | 497,130 | | | |
Distributions reinvested | | 6,377 | | | 80,541 | | | 350 | | | 5,992 | | | |
Redemptions | | (35,521 | ) | | (339,357 | ) | | (812 | ) | | (12,559 | ) | | |
| | | | | | | | | | | | | | |
Net increase | | 7,460 | | | 74,150 | | | 30,680 | | | 490,563 | | | |
| | | | | |
Class Z | | | | | | | | | | | | | | |
Subscriptions | | 10,504,267 | | | 91,945,466 | | | 11,947,743 | | | 197,158,252 | | | |
Exchange in connection with reorganization | | — | | | — | | | 2,380,110 | | | 35,511,776 | | | |
Distributions reinvested | | 7,919,385 | | | 100,338,612 | | | 3,803,568 | | | 64,742,476 | | | |
Redemptions | | (49,364,298 | ) | | (487,663,703 | ) | | (27,912,904 | ) | | (449,633,702 | ) | | |
| | | | | | | | | | | | | | |
Net increase (decrease) | | (30,940,646 | ) | | (295,379,625 | ) | | (9,781,483 | ) | | (152,221,198 | ) | | |
| (a) | On March 31, 2008, the Predecessor Fund’s Shares class was reorganized into the Fund’s Class Z. The financial information of the Fund’s Class Z shares includes the financial information of the Predecessor Fund’s Shares class. |
| (b) | The Predecessor Fund’s Class A and Class C shares commenced operations on September 28, 2007. |
| (c) | On March 31, 2008, the Predecessor Fund’s Institutional Shares class was reorganized in the Fund’s Class Z. |
| (d) | The Fund’s Class A and Class C shares commenced operations on March 31, 2008. |
See Accompanying Notes to Financial Statements.
106
| | | | | | | | | | | | | | | | | | | | | | | | |
| | | Columbia International Growth Fund | | | Columbia Pacific/Asia Fund | |
| | | Year Ended
March 31, 2009 | | | Year Ended
March 31, 2008 (a)(c)(d) | | | Year Ended
March 31, 2009 | | | Year Ended
March 31, 2008 (a)(d) | |
| | | Shares | | | Dollars ($) | | | Shares | | | Dollars ($) | | | Shares | | | Dollars ($) | | | Shares | | | Dollars ($) | |
| | | | | | | | | | | | | | | | | | | | | | | | |
| | — | | | — | | | — | | | — | | | — | | | — | | | — | | | — | |
| | — | | | — | | | — | | | — | | | — | | | — | | | — | | | — | |
| | — | | | — | | | — | | | — | | | — | | | — | | | — | | | — | |
| | — | | | — | | | — | | | — | | | — | | | — | | | — | | | — | |
| | | | | | | | | | | | | | | | | | | | | | | | |
| | — | | | — | | | — | | | — | | | — | | | — | | | — | | | — | |
| | | | | | | | |
| | | | | | | | | | | | | | | | | | | | | | | | |
| | 27,985 | | | 339,801 | | | 532 | | | 10,000 | | | 34,723 | | | 185,444 | | | 1,062 | | | 10,000 | |
| | 212 | | | 3,722 | | | — | | | — | | | 767 | | | 6,209 | | | — | | | — | |
| | (4,165 | ) | | (42,238 | ) | | — | | | — | | | (353 | ) | | (1,671 | ) | | — | | | — | |
| | | | | | | | | | | | | | | | | | | | | | | | |
| | 24,032 | | | 301,285 | | | 532 | | | 10,000 | | | 35,137 | | | 189,982 | | | 1,062 | | | 10,000 | |
| | | | | | | | |
| | | | | | | | | | | | | | | | | | | | | | | | |
| | 16,682 | | | 172,894 | | | 532 | | | 10,000 | | | 58,001 | | | 299,319 | | | 1,062 | | | 10,000 | |
| | 36 | | | 621 | | | — | | | — | | | 179 | | | 1,446 | | | — | | | — | |
| | — | | | — | | | — | | | — | | | (9,500 | ) | | (39,521 | ) | | — | | | — | |
| | | | | | | | | | | | | | | | | | | | | | | | |
| | 16,718 | | | 173,515 | | | 532 | | | 10,000 | | | 48,680 | | | 261,244 | | | 1,062 | | | 10,000 | |
| | | | | | | | |
| | | | | | | | | | | | | | | | | | | | | | | | |
| | 1,961,918 | | | 26,327,271 | | | 5,257,212 | | | 104,627,767 | | | 150,707 | | | 1,071,918 | | | 624,994 | | | 7,488,871 | |
| | — | | | — | | | 3,106,495 | | | 58,118,017 | | | — | | | — | | | — | | | — | |
| | 710,211 | | | 12,442,903 | | | 34,970 | | | 698,358 | | | 773,939 | | | 6,268,905 | | | 1,219,801 | | | 13,109,388 | |
| | (18,489,612 | ) | | (234,838,341 | ) | | (7,975,112 | ) | | (154,763,776 | ) | | (8,354,699 | ) | | (54,439,927 | ) | | (7,525,945 | ) | | (85,266,836 | ) |
| | | | | | | | | | | | | | | | | | | | | | | | |
| | (15,817,483 | ) | | (196,068,167 | ) | | 423,565 | | | 8,680,366 | | | (7,430,053 | ) | | (47,099,104 | ) | | (5,681,150 | ) | | (64,668,577 | ) |
See Accompanying Notes to Financial Statements.
107
Financial Highlights – Columbia Blended Equity Fund
Selected data for a share outstanding throughout each period is as follows:
| | | | | | | | |
| Class A Shares | | Year Ended
March 31,
2009 | | | Period Ended
March 31,
2008 (a) | |
Net Asset Value, Beginning of Period | | $ | 28.76 | | | $ | 28.76 | |
| | |
Income from Investment Operations: | | | | | | | | |
Net investment income (loss) (b) | | | 0.12 | | | | — | (c) |
Net realized and unrealized gain (loss) on investments and foreign currency | | | (10.40 | ) | | | — | (c) |
| | | | | | | | |
Total from investment operations | | | (10.28 | ) | | | — | (c) |
| | |
Less Distributions to Shareholders: | | | | | | | | |
From net investment income | | | (0.13 | ) | | | — | |
From net realized gains | | | (2.14 | ) | | | — | |
| | | | | | | | |
Total distributions to shareholders | | | (2.27 | ) | | | — | |
| | |
Net Asset Value, End of Period | | $ | 16.21 | | | $ | 28.76 | |
Total return (d)(e) | | | (38.73 | )% | | | 0.00 | %(f) |
| | |
Ratios to Average Net Assets/Supplemental Data: | | | | | | | | |
Net expenses before interest expense (g) | | | 1.30 | % | | | 1.35 | %(h) |
Interest expense (i) | | | — | % | | | — | %(h) |
Net expenses (g) | | | 1.30 | % | | | 1.35 | %(h) |
Waiver/Reimbursement | | | 0.05 | % | | | 0.09 | %(h) |
Net investment income (loss) (g) | | | 0.66 | % | | | (1.32 | )%(h) |
Portfolio turnover rate | | | 41 | % | | | 10 | %(f) |
Net assets, end of period (000’s) | | $ | 161 | | | $ | 10 | |
| (a) | The Fund’s Class A shares commenced operations on March 31, 2008. Per share data and total return reflect activity from that date. |
| (b) | Per share data was calculated using the average shares outstanding during the period. |
| (c) | Rounds to less than $0.01 per share. |
| (d) | Had the investment advisor and/or any of its affiliates not waived fees or reimbursed a portion of expenses, total return would have been reduced. |
| (e) | Total return at net asset value assuming all distributions reinvested and no initial sales charge or contingent deferred sales charge. |
| (g) | The benefits derived from expense reductions had an impact of less than 0.01%. |
| (i) | Rounds to less than 0.01%. |
See Accompanying Notes to Financial Statements.
108
Financial Highlights – Columbia Blended Equity Fund
Selected data for a share outstanding throughout each period is as follows:
| | | | | | | | |
| Class C Shares | | Year Ended
March 31,
2009 | | | Period Ended
March 31,
2008 (a) | |
Net Asset Value, Beginning of Period | | $ | 28.76 | | | $ | 28.76 | |
| | |
Income from Investment Operations: | | | | | | | | |
Net investment loss (b) | | | — | (c) | | | — | (c) |
Net realized and unrealized gain (loss) on investments and foreign currency | | | (10.43 | ) | | | — | (c) |
| | | | | | | | |
Total from investment operations | | | (10.43 | ) | | | — | (c) |
| | |
Less Distributions to Shareholders: | | | | | | | | |
From net investment income | | | (0.02 | ) | | | — | |
From net realized gains | | | (2.14 | ) | | | — | |
| | | | | | | | |
Total distributions to shareholders | | | (2.16 | ) | | | — | |
| | |
Net Asset Value, End of Period | | $ | 16.17 | | | $ | 28.76 | |
Total return (d)(e) | | | (39.20 | )% | | | 0.00 | %(f) |
| | |
Ratios to Average Net Assets/Supplemental Data: | | | | | | | | |
Net expenses before interest expense (g) | | | 2.05 | % | | | 2.10 | %(h) |
Interest expense (i) | | | — | % | | | — | %(h) |
Net expenses (g) | | | 2.05 | % | | | 2.10 | %(h) |
Waiver/Reimbursement | | | 0.05 | % | | | 0.09 | %(h) |
Net investment loss (g) | | | (0.02 | )% | | | (2.07 | )%(h) |
Portfolio turnover rate | | | 41 | % | | | 10 | %(f) |
Net assets, end of period (000’s) | | $ | 57 | | | $ | 10 | |
| (a) | The Fund’s Class C shares commenced operations on March 31, 2008. Per share data and total return reflect activity from that date. |
| (b) | Per share data was calculated using the average shares outstanding during the period. |
| (c) | Rounds to less than $0.01 per share. |
| (d) | Had the investment advisor and/or any of its affiliates not waived fees or reimbursed a portion of expenses, total return would have been reduced. |
| (e) | Total return at net asset value assuming all distributions reinvested and no contingent deferred sales charge. |
| (g) | The benefits derived from expense reductions had an impact of less than 0.01%. |
| (i) | Rounds to less than 0.01%. |
See Accompanying Notes to Financial Statements.
109
Financial Highlights – Columbia Blended Equity Fund
Selected data for a share outstanding throughout each period is as follows:
| | | | | | | | | | | | | | | | | | | | |
| | | Year Ended March 31, | |
| Class Z Shares | | 2009 | | | 2008 (a) | | | 2007 | | | 2006 (h) | | | 2005 (h) | |
Net Asset Value, Beginning of Period | | $ | 28.76 | | | $ | 35.36 | | | $ | 37.27 | | | $ | 36.12 | | | $ | 33.64 | |
| | | | | |
Income from Investment Operations: | | | | | | | | | | | | | | | | | | | | |
Net investment income (b) | | | 0.19 | | | | 0.23 | | | | 0.25 | | | | 0.19 | | | | 0.30 | |
Net realized and unrealized gain (loss) on investments and foreign currency | | | (10.43 | ) | | | 0.47 | | | | 3.61 | | | | 3.67 | | | | 2.66 | |
| | | | | | | | | | | | | | | | | | | | |
Total from investment operations | | | (10.24 | ) | | | 0.70 | | | | 3.86 | | | | 3.86 | | | | 2.96 | |
| | | | | |
Less Distributions to Shareholders: | | | | | | | | | | | | | | | | | | | | |
From net investment income | | | (0.18 | ) | | | (0.29 | ) | | | (0.23 | ) | | | (0.21 | ) | | | (0.28 | ) |
From net realized gains | | | (2.14 | ) | | | (7.01 | ) | | | (5.54 | ) | | | (2.50 | ) | | | (0.20 | ) |
| | | | | | | | | | | | | | | | | | | | |
Total distributions to shareholders | | | (2.32 | ) | | | (7.30 | ) | | | (5.77 | ) | | | (2.71 | ) | | | (0.48 | ) |
| | | | | |
Net Asset Value, End of Period | | $ | 16.20 | | | $ | 28.76 | | | $ | 35.36 | | | $ | 37.27 | | | $ | 36.12 | |
Total return (c)(d) | | | (38.61 | )% | | | 0.35 | %(e) | | | 10.66 | % | | | 11.10 | % | | | 8.85 | % |
| | | | | |
Ratios to Average Net Assets/Supplemental Data: | | | | | | | | | | | | | | | | | | | | |
Net expenses before interest expense (f) | | | 1.05 | % | | | 1.11 | % | | | 1.10 | % | | | 1.08 | % | | | 1.05 | % |
Interest expense | | | — | %(g) | | | 0.01 | % | | | — | | | | — | | | | — | |
Net expenses (f) | | | 1.05 | % | | | 1.10 | % | | | 1.10 | % | | | 1.08 | % | | | 1.05 | % |
Waiver/Reimbursement | | | 0.05 | % | | | 0.13 | % | | | 0.11 | % | | | 0.13 | % | | | 0.19 | % |
Net investment income (f) | | | 0.85 | % | | | 0.66 | % | | | 0.68 | % | | | 0.53 | % | | | 0.86 | % |
Portfolio turnover rate | | | 41 | % | | | 10 | % | | | 10 | % | | | 22 | % | | | 19 | % |
Net assets, end of period (000’s) | | $ | 139,892 | | | $ | 291,858 | | | $ | 401,023 | | | $ | 460,309 | | | $ | 466,903 | |
| (a) | On March 31, 2008, Shares class of Blended Equity Fund, a series of Excelsior Funds, Inc., was reorganized into Class Z. The financial information of the Fund’s Class Z includes the financial information of Blended Equity Fund’s Shares class. |
| (b) | Per share data was calculated using the average shares outstanding during the period. |
| (c) | Had the investment advisor and/or any of its affiliates not waived fees or reimbursed a portion of expenses, total return would have been reduced. |
| (d) | Total return at net asset value assuming all distributions reinvested. |
| (e) | Total return includes a voluntary reimbursement by the investment advisor for a realized investment loss due to a trading error. This reimbursement increased total return and net asset value per share by less than 0.01% and less than $0.01, respectively. |
| (f) | The benefits derived from expense reductions had an impact of less than 0.01%. |
| (g) | Rounds to less than 0.01%. |
| (h) | Per share data for the years ended March 31, 2006 and 2005 were audited by other auditors. |
See Accompanying Notes to Financial Statements.
110
Financial Highlights – Columbia Energy and Natural Resources Fund
Selected data for a share outstanding throughout each period is as follows:
| | | | | | | | |
| Class A Shares | | Year Ended
March 31,
2009 | | | Period Ended
March 31,
2008 (a) | |
Net Asset Value, Beginning of Period | | $ | 25.49 | | | $ | 27.64 | |
| | |
Income from Investment Operations: | | | | | | | | |
Net investment loss (b) | | | (0.01 | ) | | | — | (c) |
Net realized and unrealized gain (loss) on investments and foreign currency | | | (11.46 | ) | | | 1.72 | |
| | | | | | | | |
Total from investment operations | | | (11.47 | ) | | | 1.72 | |
| | |
Less Distributions to Shareholders: | | | | | | | | |
From net realized gains | | | (0.40 | ) | | | (3.87 | ) |
| | |
Net Asset Value, End of Period | | $ | 13.62 | | | $ | 25.49 | |
Total return (d)(e) | | | (45.88 | )% | | | 6.82 | %(f) |
| | |
Ratios to Average Net Assets/Supplemental Data: | | | | | | | | |
Net expenses before interest expense (g) | | | 1.24 | % | | | 1.07 | %(h) |
Interest expense | | | — | | | | — | %(h)(i) |
Net expenses (g) | | | 1.24 | % | | | 1.07 | %(h) |
Waiver/Reimbursement | | | 0.04 | % | | | 0.05 | %(h) |
Net investment loss (g) | | | (0.03 | )% | | | (0.02 | )%(h) |
Portfolio turnover rate | | | 484 | % | | | 198 | %(f) |
Net assets, end of period (000’s) | | $ | 16,842 | | | $ | 5,328 | |
| (a) | The Predecessor Fund’s Class A shares commenced operations on September 28, 2007. Per share data and total return reflect activity from that date. |
| (b) | Per share data was calculated using the average shares outstanding during the period. |
| (c) | Rounds to less than $0.01 per share. |
| (d) | Had the investment advisor and/or any of its affiliates not waived fees or reimbursed a portion of expenses, total return would have been reduced. |
| (e) | Total return at net asset value assuming all distributions reinvested and no initial sales charge or contingent deferred sales charge. |
| (g) | The benefits derived from expense reductions had an impact of less than 0.01%. |
| (i) | Rounds to less than 0.01%. |
See Accompanying Notes to Financial Statements.
111
Financial Highlights – Columbia Energy and Natural Resources Fund
Selected data for a share outstanding throughout each period is as follows:
| | | | | | | | |
| Class C Shares | | Year Ended
March 31,
2009 | | | Period Ended
March 31,
2008 (a) | |
Net Asset Value, Beginning of Period | | $ | 25.40 | | | $ | 27.64 | |
| | |
Income from Investment Operations: | | | | | | | | |
Net investment loss (b) | | | (0.13 | ) | | | (0.10 | ) |
Net realized and unrealized gain (loss) on investments and foreign currency | | | (11.40 | ) | | | 1.73 | |
| | | | | | | | |
Total from investment operations | | | (11.53 | ) | | | 1.63 | |
| | |
Less Distributions to Shareholders: | | | | | | | | |
From net realized gains | | | (0.40 | ) | | | (3.87 | ) |
| | |
Net Asset Value, End of Period | | $ | 13.47 | | | $ | 25.40 | |
Total return (c)(d) | | | (46.29 | )% | | | 6.45 | %(e) |
| | |
Ratios to Average Net Assets/Supplemental Data: | | | | | | | | |
Net expenses before interest expense (f) | | | 1.99 | % | | | 1.82 | %(g) |
Interest expense | | | — | | | | — | %(g)(h) |
Net expenses (f) | | | 1.99 | % | | | 1.82 | %(g) |
Waiver/Reimbursement | | | 0.04 | % | | | 0.05 | %(g) |
Net investment loss (f) | | | (0.73 | )% | | | (0.78 | )%(g) |
Portfolio turnover rate | | | 484 | % | | | 198 | %(e) |
Net assets, end of period (000’s) | | $ | 5,843 | | | $ | 1,433 | |
| (a) | The Predecessor Fund’s Class C shares commenced operations on September 28, 2007. Per share data and total return reflect activity from that date. |
| (b) | Per share data was calculated using the average shares outstanding during the period. |
| (c) | Had the investment advisor and/or any of its affiliates not waived fees or reimbursed a portion of expenses, total return would have been reduced. |
| (d) | Total return at net asset value assuming all distributions reinvested and no contingent deferred sales charge. |
| (f) | The benefits derived from expense reductions had an impact of less than 0.01%. |
| (h) | Rounds to less than 0.01%. |
See Accompanying Notes to Financial Statements.
112
Financial Highlights – Columbia Energy and Natural Resources Fund
Selected data for a share outstanding throughout each period is as follows:
| | | | | | | | | | | | | | | | | | | | |
| | | Year Ended March 31, | |
| Class Z Shares | | 2009 | | | 2008 (a) | | | 2007 | | | 2006 (h) | | | 2005 (h) | |
Net Asset Value, Beginning of Period | | $ | 25.49 | | | $ | 23.30 | | | $ | 25.99 | | | $ | 22.34 | | | $ | 16.45 | |
| | | | | |
Income from Investment Operations: | | | | | | | | | | | | | | | | | | | | |
Net investment income (loss) (b) | | | 0.02 | | | | 0.01 | | | | 0.06 | | | | — | (c) | | | 0.02 | |
Net realized and unrealized gain (loss) on investments and foreign currency | | | (11.45 | ) | | | 6.08 | | | | 2.50 | | | | 9.04 | | | | 6.99 | |
| | | | | | | | | | | | | | | | | | | | |
Total from investment operations | | | (11.43 | ) | | | 6.09 | | | | 2.56 | | | | 9.04 | | | | 7.01 | |
| | | | | |
Less Distributions to Shareholders: | | | | | | | | | | | | | | | | | | | | |
From net investment income | | | — | | | | (0.03 | ) | | | (0.06 | ) | | | — | | | | (0.05 | ) |
From net realized gains | | | (0.40 | ) | | | (3.87 | ) | | | (5.19 | ) | | | (5.39 | ) | | | (1.07 | ) |
| | | | | | | | | | | | | | | | | | | | |
Total distributions to shareholders | | | (0.40 | ) | | | (3.90 | ) | | | (5.25 | ) | | | (5.39 | ) | | | (1.12 | ) |
| | | | | |
Net Asset Value, End of Period | | $ | 13.66 | | | $ | 25.49 | | | $ | 23.30 | | | $ | 25.99 | | | $ | 22.34 | |
Total return (d) | | | (45.72 | )%(e) | | | 26.84 | %(e) | | | 10.84 | %(e) | | | 41.42 | % | | | 43.97 | %(e) |
| | | | | |
Ratios to Average Net Assets/Supplemental Data: | | | | | | | | | | | | | | | | | | | | |
Net expenses before interest expense (f) | | | 0.99 | % | | | 1.07 | % | | | 1.12 | % | | | 1.13 | % | | | 1.10 | % |
Interest expense | | | — | | | | — | %(g) | | | — | | | | — | | | | — | |
Net expenses (f) | | | 0.99 | % | | | 1.07 | % | | | 1.12 | % | | | 1.13 | % | | | 1.10 | % |
Waiver/Reimbursement | | | 0.04 | % | | | 0.04 | % | | | 0.01 | % | | | — | | | | 0.05 | % |
Net investment income (loss) (f) | | | 0.11 | % | | | 0.05 | % | | | 0.25 | % | | | (0.01 | )% | | | 0.12 | % |
Portfolio turnover rate | | | 484 | % | | | 198 | % | | | 279 | % | | | 234 | % | | | 111 | % |
Net assets, end of period (000’s) | | $ | 338,292 | | | $ | 712,080 | | | $ | 497,676 | | | $ | 522,506 | | | $ | 292,333 | |
| (a) | On March 31, 2008, Shares class of Energy and Natural Resources Fund, a series of Excelsior Funds, Inc., was reorganized into the Fund’s Class Z. The financial information of the Fund’s Class Z includes the financial information of Energy and Natural Resources Fund’s Shares class. |
| (b) | Per share data was calculated using the average shares outstanding during the period. |
| (c) | Rounds to less than $0.01 per share. |
| (d) | Total return at net asset value assuming all distributions reinvested. |
| (e) | Had the investment advisor and/or any of its affiliates not waived fees or reimbursed a portion of expenses, total return would have been reduced. |
| (f) | The benefits derived from expense reductions had an impact of less than 0.01%, except for the year ended March 31, 2007, which had an impact of 0.01%. |
| (g) | Rounds to less than 0.01%. |
| (h) | Per share data for the years ended March 31, 2006 and 2005 were audited by other auditors. |
See Accompanying Notes to Financial Statements.
113
Financial Highlights – Columbia Mid Cap Core Fund
Selected data for a share outstanding throughout each period is as follows:
| | | | | | | | |
| Class A Shares | | Year Ended
March 31,
2009 | | | Period Ended
March 31,
2008 (a) | |
Net Asset Value, Beginning of Period | | $ | 18.29 | | | $ | 18.29 | |
| | |
Income from Investment Operations: | | | | | | | | |
Net investment income (loss) (b) | | | 0.08 | | | | — | (c) |
Net realized and unrealized gain (loss) on investments and foreign currency | | | (8.72 | ) | | | — | (c) |
| | | | | | | | |
Total from investment operations | | | (8.64 | ) | | | — | (c) |
| | |
Less Distributions to Shareholders: | | | | | | | | |
From net investment income | | | (0.07 | ) | | | — | |
From net realized gains | | | (0.04 | ) | | | — | |
| | | | | | | | |
Total distributions to shareholders | | | (0.11 | ) | | | — | |
| | |
Net Asset Value, End of Period | | $ | 9.54 | | | $ | 18.29 | |
Total return (d)(e) | | | (47.44 | )% | | | 0.00 | %(f) |
| | |
Ratios to Average Net Assets/Supplemental Data: | | | | | | | | |
Net expenses before interest expense (g) | | | 1.26 | % | | | 1.10 | %(h) |
Interest expense (i) | | | — | % | | | — | %(h) |
Net expenses (g) | | | 1.26 | % | | | 1.10 | %(h) |
Waiver/Reimbursement | | | 0.05 | % | | | 0.05 | %(h) |
Net investment income (loss) (g) | | | 0.81 | % | | | (1.10 | )%(h) |
Portfolio turnover rate | | | 111 | % | | | 16 | %(f) |
Net assets, end of period (000’s) | | $ | 210 | | | $ | 10 | |
| (a) | The Fund’s Class A shares commenced operations on March 31, 2008. Per share data and total return reflect activity from that date. |
| (b) | Per share data was calculated using the average shares outstanding during the period. |
| (c) | Rounds to less than $0.01 per share. |
| (d) | Had the investment advisor and/or any of its affiliates not waived fees or reimbursed a portion of expenses, total return would have been reduced. |
| (e) | Total return at net asset value assuming all distributions reinvested and no initial sales charge or contingent deferred sales charge. |
| (g) | The benefits derived from expense reductions had an impact of less than 0.01%. |
| (i) | Rounds to less than 0.01%. |
See Accompanying Notes to Financial Statements.
114
Financial Highlights – Columbia Mid Cap Core Fund
Selected data for a share outstanding throughout each period is as follows:
| | | | | | | | |
| Class C Shares | | Year Ended
March 31,
2009 | | | Period Ended
March 31,
2008 (a) | |
Net Asset Value, Beginning of Period | | $ | 18.29 | | | $ | 18.29 | |
| | |
Income from Investment Operations: | | | | | | | | |
Net investment loss (b) | | | (0.01 | ) | | | — | (c) |
Net realized and unrealized loss on investments and foreign currency | | | (8.72 | ) | | | — | (c) |
| | | | | | | | |
Total from investment operations | | | (8.73 | ) | | | — | (c) |
| | |
Less Distributions to Shareholders: | | | | | | | | |
From net investment income | | | (0.02 | ) | | | — | |
From net realized gains | | | (0.04 | ) | | | — | |
| | | | | | | | |
Total distributions to shareholders | | | (0.06 | ) | | | — | |
| | |
Net Asset Value, End of Period | | $ | 9.50 | | | $ | 18.29 | |
Total return (d)(e) | | | (47.83 | )% | | | 0.00 | %(f) |
| | |
Ratios to Average Net Assets/Supplemental Data: | | | | | | | | |
Net expenses before interest expense (g) | | | 2.01 | % | | | 1.85 | %(h) |
Interest expense (i) | | | — | % | | | — | %(h) |
Net expenses (g) | | | 2.01 | % | | | 1.85 | %(h) |
Waiver/Reimbursement | | | 0.05 | % | | | 0.05 | %(h) |
Net investment loss (g) | | | (0.06 | )% | | | (1.85 | )%(h) |
Portfolio turnover rate | | | 111 | % | | | 16 | %(f) |
Net assets, end of period (000’s) | | $ | 67 | | | $ | 10 | |
| (a) | The Fund’s Class C shares commenced operations on March 31, 2008. Per share data and total return reflect activity from that date. |
| (b) | Per share data was calculated using the average shares outstanding during the period. |
| (c) | Rounds to less than $0.01 per share. |
| (d) | Had the investment advisor and/or any of its affiliates not waived fees or reimbursed a portion of expenses, total return would have been reduced. |
| (e) | Total return at net asset value assuming all distributions reinvested and no contingent deferred sales charge. |
| (g) | The benefits derived from expense reductions had an impact of less than 0.01%. |
| (i) | Rounds to less than 0.01%. |
See Accompanying Notes to Financial Statements.
115
Financial Highlights – Columbia Mid Cap Core Fund
Selected data for a share outstanding throughout each period is as follows:
| | | | | | | | | | | | | | | | | | | | |
| | | Year Ended March 31, | | | Period Ended
March 31, | |
| Class R Shares | | 2009 | | | 2008 (a) | | | 2007 | | | 2006 (k) | | | 2005 (b)(k) | |
Net Asset Value, Beginning of Period | | $ | 18.10 | | | $ | 21.48 | | | $ | 19.62 | | | $ | 16.78 | | | $ | 17.26 | |
| | | | | |
Income from Investment Operations: | | | | | | | | | | | | | | | | | | | | |
Net investment income (loss) (c) | | | 0.02 | | | | (0.03 | ) | | | 0.70 | | | | (0.06 | ) | | | (0.01 | ) |
Net realized and unrealized gain (loss) on investments and foreign currency | | | (8.61 | ) | | | (2.55 | ) | | | 1.16 | | | | 2.90 | | | | (0.47 | ) |
| | | | | | | | | | | | | | | | | | | | |
Total from investment operations | | | (8.59 | ) | | | (2.58 | ) | | | 1.86 | | | | 2.84 | | | | (0.48 | ) |
| | | | | |
Less Distributions to Shareholders: | | | | | | | | | | | | | | | | | | | | |
From net investment income | | | (0.05 | ) | | | (0.29 | ) | | | — | | | | — | | | | — | |
From net realized gains | | | (0.04 | ) | | | (0.51 | ) | | | — | (d) | | | — | | | | — | |
| | | | | | | | | | | | | | | | | | | | |
Total distributions to shareholders | | | (0.09 | ) | | | (0.80 | ) | | | — | (d) | | | — | | | | — | |
| | | | | |
Net Asset Value, End of Period | | $ | 9.42 | | | $ | 18.10 | | | $ | 21.48 | | | $ | 19.62 | | | $ | 16.78 | |
Total return (e) | | | (47.62 | )%(f) | | | (12.56 | )%(f) | | | 9.48 | %(f) | | | 16.92 | % | | | (3.01 | )%(f)(g) |
| | | | | |
Ratios to Average Net Assets/Supplemental Data: | | | | | | | | | | | | | | | | | | | | |
Net expenses before interest expense (h) | | | 1.51 | % | | | 1.60 | % | | | 1.61 | % | | | 1.46 | % | | | 1.56 | %(i) |
Interest expense | | | — | %(j) | | | — | %(j) | | | — | | | | — | | | | — | |
Net expenses (h) | | | 1.51 | % | | | 1.60 | % | | | 1.61 | % | | | 1.46 | % | | | 1.56 | %(i) |
Waiver/Reimbursement | | | 0.05 | % | | | 0.04 | % | | | 0.03 | % | | | — | | | | 0.10 | %(i) |
Net investment income (loss) (h) | | | 0.14 | % | | | (0.13 | )% | | | 3.38 | % | | | (0.34 | )% | | | (0.13 | )%(i) |
Portfolio turnover rate | | | 111 | % | | | 16 | % | | | 25 | % | | | 23 | % | | | 28 | %(g) |
Net assets, end of period (000’s) | | $ | 1,145 | | | $ | 2,020 | | | $ | 1,097 | | | $ | 1 | | | $ | 1 | |
| (a) | On March 31, 2008, Retirement Shares class of Mid Cap Value and Restructuring Fund, a series of Excelsior Funds Trust, was reorganized into the Fund’s Class R. The financial information of the Fund’s Class R includes the financial information of Mid Cap Value and Restructuring Fund’s Retirement Shares class. |
| (b) | Mid Cap Value and Restructuring Fund’s Retirement Shares commenced operations on December 31, 2004. Per share data and total return reflect activity from that date. |
| (c) | Per share data was calculated using the average shares outstanding during the period. |
| (d) | Rounds to less than $0.01 per share. |
| (e) | Total return at net asset value assuming all distributions reinvested. |
| (f) | Had the investment advisor and/or any of its affiliates not waived fees or reimbursed a portion of expenses, total return would have been reduced. |
| (h) | The benefits derived from expense reductions had an impact of less than 0.01%. |
| (j) | Rounds to less than 0.01%. |
| (k) | Per share data for the year ended March 31, 2006 and the period ended March 31, 2005 were audited by other auditors. |
See Accompanying Notes to Financial Statements.
116
Financial Highlights – Columbia Mid Cap Core Fund
Selected data for a share outstanding throughout each period is as follows:
| | | | | | | | | | | | | | | | | | | | |
| | | Year Ended March 31, | |
| Class Z Shares | | 2009 | | | 2008 (a)(b) | | | 2007 | | | 2006 (i) | | | 2005 (i) | |
Net Asset Value, Beginning of Period | | $ | 18.29 | | | $ | 21.61 | | | $ | 19.64 | | | $ | 16.77 | | | $ | 15.75 | |
| | | | | |
Income from Investment Operations: | | | | | | | | | | | | | | | | | | | | |
Net investment income (c) | | | 0.09 | | | | 0.10 | | | | 0.23 | | | | — | (d) | | | 0.23 | |
Net realized and unrealized gain (loss) on investments and foreign currency | | | (8.71 | ) | | | (2.59 | ) | | | 1.75 | | | | 2.90 | | | | 1.02 | |
| | | | | | | | | | | | | | | | | | | | |
Total from investment operations | | | (8.62 | ) | | | (2.49 | ) | | | 1.98 | | | | 2.90 | | | | 1.25 | |
| | | | | |
Less Distributions to Shareholders: | | | | | | | | | | | | | | | | | | | | |
From net investment income | | | (0.08 | ) | | | (0.32 | ) | | | (0.01 | ) | | | (0.03 | ) | | | (0.23 | ) |
From net realized gains | | | (0.04 | ) | | | (0.51 | ) | | | — | (d) | | | — | | | | — | |
| | | | | | | | | | | | | | | | | | | | |
Total distributions to shareholders | | | (0.12 | ) | | | (0.83 | ) | | | (0.01 | ) | | | (0.03 | ) | | | (0.23 | ) |
| | | | | |
Net Asset Value, End of Period | | $ | 9.55 | | | $ | 18.29 | | | $ | 21.61 | | | $ | 19.64 | | | $ | 16.77 | |
Total return (e) | | | (47.32 | )%(f) | | | (12.08 | )%(f) | | | 10.07 | % | | | 17.32 | % | | | 7.93 | %(f) |
| | | | | |
Ratios to Average Net Assets/Supplemental Data: | | | | | | | | | | | | | | | | | | | | |
Net expenses before interest expense (g) | | | 1.01 | % | | | 1.10 | % | | | 1.13 | % | | | 1.13 | % | | | 1.06 | % |
Interest expense | | | — | %(h) | | | — | %(h) | | | — | | | | — | | | | — | |
Net expenses (g) | | | 1.01 | % | | | 1.10 | % | | | 1.13 | % | | | 1.13 | % | | | 1.06 | % |
Waiver/Reimbursement | | | 0.05 | % | | | 0.04 | % | | | — | | | | — | | | | 0.10 | % |
Net investment income (g) | | | 0.59 | % | | | 0.47 | % | | | 1.12 | % | | | 0.02 | % | | | 1.42 | % |
Portfolio turnover rate | | | 111 | % | | | 16 | % | | | 25 | % | | | 23 | % | | | 28 | % |
Net assets, end of period (000’s) | | $ | 63,528 | | | $ | 245,608 | | | $ | 294,452 | | | $ | 237,531 | | | $ | 214,844 | |
| (a) | On March 31, 2008, Shares class of Mid Cap Value and Restructuring Fund, a series of Excelsior Funds Trust, was reorganized into the Fund’s Class Z. The financial information of the Fund’s Class Z includes the financial information of Mid Cap Value and Restructuring Fund’s Shares class. |
| (b) | On March 31, 2008, Mid Cap Value and Restructuring Fund’s Institutional Shares class was reorganized into the Fund’s Class Z. |
| (c) | Per share data was calculated using the average shares outstanding during the period. |
| (d) | Rounds to less than $0.01 per share. |
| (e) | Total return at net asset value assuming all distributions reinvested. |
| (f) | Had the investment advisor and/or any of its affiliates not waived fees or reimbursed a portion of expenses, total return would have been reduced. |
| (g) | The benefits derived from expense reductions had an impact of less than 0.01%. |
| (h) | Rounds to less than 0.01%. |
| (i) | Per share data for the years ended March 31, 2006 and 2005 were audited by other auditors. |
See Accompanying Notes to Financial Statements.
117
Financial Highlights – Columbia Select Large Cap Growth Fund
Selected data for a share outstanding throughout each period is as follows:
| | | | | | | | |
| Class A Shares | | Year Ended
March 31,
2009 | | | Period Ended
March 31,
2008 (a) | |
Net Asset Value, Beginning of Period | | $ | 11.30 | | | $ | 12.18 | |
| | |
Income from Investment Operations: | | | | | | | | |
Net investment loss (b) | | | (0.06 | ) | | | (0.05 | ) |
Net realized and unrealized loss on investments | | | (4.18 | ) | | | (0.83 | ) |
| | | | | | | | |
Total from investment operations | | | (4.24 | ) | | | (0.88 | ) |
| | |
Increase from Regulatory Settlements | | | — | (c) | | | — | |
| | |
Net Asset Value, End of Period | | $ | 7.06 | | | $ | 11.30 | |
Total return (d)(e) | | | (37.52 | )% | | | (7.22 | )%(f) |
| | |
Ratios to Average Net Assets/Supplemental Data: | | | | | | | | |
Net expenses before interest expense (g) | | | 1.28 | % | | | 1.16 | %(i) |
Interest expense | | | — | %(h) | | | — | |
Net expenses (g) | | | 1.28 | % | | | 1.16 | %(i) |
Waiver/Reimbursement | | | 0.05 | % | | | 0.05 | %(i) |
Net investment loss (g) | | | (0.77 | )% | | | (0.92 | )%(i) |
Portfolio turnover rate | | | 58 | % | | | 39 | %(f) |
Net assets, end of period (000’s) | | $ | 84,493 | | | $ | 2,141 | |
| (a) | The Predecessor Fund’s Class A shares commenced operations on September 28, 2007. Per share data and total return reflect activity from that date. |
| (b) | Per share data was calculated using the average shares outstanding during the period. |
| (c) | Rounds to less than $0.01 per share. |
| (d) | Had the investment advisor and/or any of its affiliates not waived fees or reimbursed a portion of expenses, total return would have been reduced. |
| (e) | Total return at net asset value assuming all distributions reinvested and no initial sales charge or contingent deferred sales charge. |
| (g) | The benefits derived from expense reductions had an impact of less than 0.01%. |
| (h) | Rounds to less than 0.01%. |
See Accompanying Notes to Financial Statements.
118
Financial Highlights – Columbia Select Large Cap Growth Fund
Selected data for a share outstanding throughout each period is as follows:
| | | | | | | | |
| Class C Shares | | Year Ended
March 31,
2009 | | | Period Ended
March 31,
2008 (a) | |
Net Asset Value, Beginning of Period | | $ | 11.26 | | | $ | 12.18 | |
| | |
Income from Investment Operations: | | | | | | | | |
Net investment loss (b) | | | (0.12 | ) | | | (0.09 | ) |
Net realized and unrealized loss on investments | | | (4.16 | ) | | | (0.83 | ) |
| | | | | | | | |
Total from investment operations | | | (4.28 | ) | | | (0.92 | ) |
| | |
Increase from Regulatory Settlements | | | — | (c) | | | — | |
| | |
Net Asset Value, End of Period | | $ | 6.98 | | | $ | 11.26 | |
Total return (d)(e) | | | (38.01 | )% | | | (7.55 | )%(f) |
| | |
Ratios to Average Net Assets/Supplemental Data: | | | | | | | | |
Net expenses before interest expense (g) | | | 2.03 | % | | | 1.91 | %(i) |
Interest expense | | | — | %(h) | | | — | |
Net expenses (g) | | | 2.03 | % | | | 1.91 | %(i) |
Waiver/Reimbursement | | | 0.05 | % | | | 0.05 | %(i) |
Net investment loss (g) | | | (1.37 | )% | | | (1.59 | )%(i) |
Portfolio turnover rate | | | 58 | % | | | 39 | %(f) |
Net assets, end of period (000’s) | | $ | 763 | | | $ | 238 | |
| (a) | The Predecessor Fund’s Class C shares commenced operations on September 28, 2007. Per share data and total return reflect activity from that date. |
| (b) | Per share data was calculated using the average shares outstanding during the period. |
| (c) | Rounds to less than $0.01 per share. |
| (d) | Had the investment advisor and/or any of its affiliates not waived fees or reimbursed a portion of expenses, total return would have been reduced. |
| (e) | Total return at net asset value assuming all distributions reinvested and no contingent deferred sales charge. |
| (g) | The benefits derived from expense reductions had an impact of less than 0.01%. |
| (h) | Rounds to less than 0.01%. |
See Accompanying Notes to Financial Statements.
119
Financial Highlights – Columbia Select Large Cap Growth Fund
Selected data for a share outstanding throughout each period is as follows:
| | | | | | | | | | | | | | | | | | | | |
| | | Year Ended March 31, | | | Period Ended
March 31, | |
| Class R Shares | | 2009 | | | 2008 (a) | | | 2007 | | | 2006 (k) | | | 2005 (b)(k) | |
Net Asset Value, Beginning of Period | | $ | 11.09 | | | $ | 10.45 | | | $ | 9.82 | | | $ | 8.02 | | | $ | 8.49 | |
| | | | | |
Income from Investment Operations: | | | | | | | | | | | | | | | | | | | | |
Net investment loss (c) | | | (0.07 | ) | | | (0.14 | ) | | | (0.12 | ) | | | (0.11 | ) | | | (0.03 | ) |
Net realized and unrealized gain (loss) on investment | | | (4.11 | ) | | | 0.78 | | | | 0.75 | | | | 1.91 | | | | (0.44 | ) |
| | | | | | | | | | | | | | | | | | | | |
Total from investment operations | | | (4.18 | ) | | | 0.64 | | | | 0.63 | | | | 1.80 | | | | (0.47 | ) |
| | | | | |
Increase from Regulatory Settlements | | | — | (d) | | | — | | | | — | | | | — | | | | — | |
| | | | | |
Net Asset Value, End of Period | | $ | 6.91 | | | $ | 11.09 | | | $ | 10.45 | | | $ | 9.82 | | | $ | 8.02 | |
Total return (e)(f) | | | (37.69 | )% | | | 6.12 | % | | | 6.42 | % | | | 22.44 | % | | | (5.54 | )%(g) |
| | | | | |
Ratios to Average Net Assets/Supplemental Data: | | | | | | | | | | | | | | | | | | | | |
Net expenses before interest expense (h) | | | 1.53 | % | | | 1.66 | % | | | 1.69 | % | | | 1.70 | % | | | 1.55 | %(j) |
Interest expense | | | — | %(i) | | | — | | | | — | | | | — | | | | — | |
Net expenses (h) | | | 1.53 | % | | | 1.66 | % | | | 1.69 | % | | | 1.70 | % | | | 1.55 | %(j) |
Waiver/Reimbursement | | | 0.05 | % | | | 0.04 | % | | | 0.01 | % | | | 0.29 | % | | | 0.23 | %(j) |
Net investment loss (h) | | | (0.80 | )% | | | (1.22 | )% | | | (1.18 | )% | | | (1.20 | )% | | | (1.45 | )%(j) |
Portfolio turnover rate | | | 58 | % | | | 39 | % | | | 33 | % | | | 24 | % | | | 25 | %(g) |
Net assets, end of period (000’s) | | $ | 23 | | | $ | 22 | | | $ | 3 | | | $ | 3 | | | $ | 1 | |
| (a) | On March 31, 2008, Retirement Shares class of Large Cap Growth Fund, a series of Excelsior Funds, Inc., was reorganized into the Fund’s Class R. The financial information of the Fund’s Class R shares includes the financial information of Large Cap Growth Fund’s Retirement Shares class. |
| (b) | Retirement Shares commenced operations on December 31, 2004. Per share data and total return reflect activity from that date. |
| (c) | Per share data was calculated using the average shares outstanding during the period. |
| (d) | Rounds to less than $0.01 per share. |
| (e) | Had the investment advisor and/or any of its affiliates not waived fees or reimbursed a portion of expenses, total return would have been reduced. |
| (f) | Total return at net asset value assuming all distributions reinvested. |
| (h) | The benefits derived from expense reductions had an impact of less than 0.01%. |
| (i) | Rounds to less than 0.01%. |
| (k) | Per share data for the year ended March 31, 2006 and the period ended March 31, 2005 were audited by other auditors. |
See Accompanying Notes to Financial Statements.
120
Financial Highlights – Columbia Select Large Cap Growth Fund
Selected data for a share outstanding throughout each period is as follows:
| | | | | | | | | | | | | | | | | | | | |
| | | Year Ended March 31, | |
| Class Z Shares | | 2009 | | | 2008 (a)(b) | | | 2007 | | | 2006 (i) | | | 2005 (i) | |
Net Asset Value, Beginning of Period | | $ | 11.30 | | | $ | 10.60 | | | $ | 9.91 | | | $ | 8.04 | | | $ | 7.71 | |
| | | | | |
Income from Investment Operations: | | | | | | | | | | | | | | | | | | | | |
Net investment loss (c) | | | (0.03 | ) | | | (0.08 | ) | | | (0.07 | ) | | | (0.04 | ) | | | (0.05 | ) |
Net realized and unrealized gain (loss) on investment | | | (4.19 | ) | | | 0.78 | | | | 0.76 | | | | 1.91 | | | | 0.38 | |
| | | | | | | | | | | | | | | | | | | | |
Total from investment operations | | | (4.22 | ) | | | 0.70 | | | | 0.69 | | | | 1.87 | | | | 0.33 | |
| | | | | |
Increase from Regulatory Settlements | | | — | (d) | | | — | | | | — | | | | — | | | | — | |
| | | | | |
Net Asset Value, End of Period | | $ | 7.08 | | | $ | 11.30 | | | $ | 10.60 | | | $ | 9.91 | | | $ | 8.04 | |
Total return (e) | | | (37.35 | )%(f) | | | 6.60 | %(f) | | | 6.96 | % | | | 23.26 | %(f) | | | 4.28 | %(f) |
| | | | | |
Ratios to Average Net Assets/Supplemental Data: | | | | | | | | | | | | | | | | | | | | |
Net expenses before interest expense (g) | | | 1.03 | % | | | 1.16 | % | | | 1.20 | % | | | 1.10 | % | | | 1.05 | % |
Interest expense | | | — | %(h) | | | — | | | | — | | | | — | | | | — | |
Net expenses (g) | | | 1.03 | % | | | 1.16 | % | | | 1.20 | % | | | 1.10 | % | | | 1.05 | % |
Waiver/Reimbursement | | | 0.05 | % | | | 0.04 | % | | | — | | | | 0.13 | % | | | 0.23 | % |
Net investment loss (g) | | | (0.38 | )% | | | (0.69 | )% | | | (0.68 | )% | | | (0.48 | )% | | | (0.59 | )% |
Portfolio turnover rate | | | 58 | % | | | 39 | % | | | 33 | % | | | 24 | % | | | 25 | % |
Net assets, end of period (000’s) | | $ | 732,391 | | | $ | 938,734 | | | $ | 718,424 | | | $ | 552,194 | | | $ | 210,060 | |
| (a) | On March 31, 2008, Shares class of Large Cap Growth Fund, a series of Excelsior Funds, Inc., was reorganized into Class Z. The financial information of Class Z includes the financial information of Large Cap Growth Fund’s Shares class. |
| (b) | On March 31, 2008, Emerging Markets Fund’s Institutional Shares class was reorganized into the Fund’s Class Z. |
| (c) | Per share data was calculated using the average shares outstanding during the period. |
| (d) | Rounds to less $0.01 per share. |
| (e) | Total return at net asset value assuming all distributions reinvested. |
| (f) | Had the investment advisor and/or any of its affiliates not waived fees or reimbursed a portion of expenses, total return would have been reduced. |
| (g) | The benefits derived from expense reductions had an impact of less than 0.01%. |
| (h) | Rounds to less than 0.01%. |
| (i) | Per share data for the years ended March 31, 2006 and 2005 were audited by other auditors. |
See Accompanying Notes to Financial Statements.
121
Financial Highlights – Columbia Select Opportunities Fund
Selected data for a share outstanding throughout each period is as follows:
| | | | | | | | |
| Class A Shares | | Year Ended
March 31,
2009 | | | Period Ended
March 31,
2008 (a) | |
Net Asset Value, Beginning of Period | | $ | 13.96 | | | $ | 15.80 | |
| | |
Income from Investment Operations: | | | | | | | | |
Net investment income (b) | | | 0.06 | | | | 0.04 | |
Net realized and unrealized loss on investments and foreign currency | | | (6.13 | ) | | | (1.43 | ) |
| | | | | | | | |
Total from investment operations | | | (6.07 | ) | | | (1.39 | ) |
| | |
Less Distributions to Shareholders: | | | | | | | | |
From net investment income | | | (0.08 | ) | | | (0.04 | ) |
From net realized gains | | | (0.19 | ) | | | (0.41 | ) |
| | | | | | | | |
Total distributions to shareholders | | | (0.27 | ) | | | (0.45 | ) |
| | |
Net Asset Value, End of Period | | $ | 7.62 | | | $ | 13.96 | |
Total return (c)(d) | | | (44.24 | )% | | | (9.07 | )%(e) |
| | |
Ratios to Average Net Assets/Supplemental Data: | | | | | | | | |
Net expenses before interest expense (f) | | | 1.07 | % | | | 1.05 | %(g) |
Interest expense | | | — | %(h) | | | — | |
Net expenses (f) | | | 1.07 | % | | | 1.05 | %(g) |
Waiver/Reimbursement | | | 0.23 | % | | | 0.17 | %(g) |
Net investment income (f) | | | 0.63 | % | | | 0.55 | %(g) |
Portfolio turnover rate | | | 63 | % | | | 27 | %(e) |
Net assets, end of period (000’s) | | $ | 1,097 | | | $ | 318 | |
| (a) | The Predecessor Fund’s Class A shares commenced operations on September 28, 2007. Per share data and total return reflect activity from that date. |
| (b) | Per share data was calculated using the average shares outstanding during the period. |
| (c) | Had the investment advisor and/or any of its affiliates not waived fees or reimbursed a portion of expenses, total return would have been reduced. |
| (d) | Total return at net asset value assuming all distributions reinvested and no initial sales charge or contingent deferred sales charge. |
| (f) | The benefits derived from expense reductions had an impact of less than 0.01%. |
| (h) | Rounds to less than 0.01%. |
See Accompanying Notes to Financial Statements.
122
Financial Highlights – Columbia Select Opportunities Fund
Selected data for a share outstanding throughout each period is as follows:
| | | | | | | | |
| Class C Shares | | Year Ended
March 31,
2009 | | | Period Ended
March 31,
2008 (a) | |
Net Asset Value, Beginning of Period | | $ | 13.93 | | | $ | 15.80 | |
| | |
Income from Investment Operations: | | | | | | | | |
Net investment income (b)(c) | | | — | | | | — | |
Net realized and unrealized loss on investments and foreign currency | | | (6.13 | ) | | | (1.46 | ) |
| | | | | | | | |
Total from Investment Operations | | | (6.13 | ) | | | (1.46 | ) |
| | |
Less Distributions to Shareholders: | | | | | | | | |
From net investment income | | | (0.03 | ) | | | — | |
From net realized gains | | | (0.19 | ) | | | (0.41 | ) |
| | | | | | | | |
Total Distributions to Shareholders | | | (0.22 | ) | | | (0.41 | ) |
| | |
Net Asset Value, End of Period | | $ | 7.58 | | | $ | 13.93 | |
Total return (d)(e) | | | (44.69 | )% | | | (9.47 | )%(f) |
| | |
Ratios to Average Net Assets/Supplemental Data: | | | | | | | | |
Net expenses before interest expense (g) | | | 1.82 | % | | | 1.80 | %(h) |
Interest expense | | | — | %(i) | | | — | |
Net expenses (g) | | | 1.82 | % | | | 1.80 | %(h) |
Waiver/Reimbursement | | | 0.23 | % | | | 0.17 | %(h) |
Net investment income (loss) (g) | | | (0.03 | )% | | | 0.01 | %(h) |
Portfolio turnover rate | | | 63 | % | | | 27 | %(f) |
Net assets, end of period (000’s) | | $ | 240 | | | $ | 27 | |
| (a) | The Predecessor Fund’s Class C shares commenced operations on September 28, 2007. Per share data and total return reflect activity from that date. |
| (b) | Per share data was calculated using the average shares outstanding during the period. |
| (c) | Rounds to less than $0.01 per share. |
| (d) | Total return at net asset value assuming all distributions reinvested and no contingent deferred sales charge. |
| (e) | Had the investment advisor and/or any of its affiliates not waived fees or reimbursed a portion of expenses, total return would have been reduced. |
| (g) | The benefits derived from expense reductions had an impact of less than 0.01%. |
| (i) | Rounds to less than 0.01%. |
See Accompanying Notes to Financial Statements.
123
Financial Highlights – Columbia Select Opportunities Fund
Selected data for a share outstanding throughout each period is as follows:
| | | | | | | | | | | | | | | | | | | | |
| | | Year Ended March 31, | |
| Class Z Shares | | 2009 | | | 2008 (a)(b) | | | 2007 | | | 2006 (h) | | | 2005 (h) | |
Net Asset Value, Beginning of Period | | $ | 13.96 | | | $ | 14.17 | | | $ | 12.70 | | | $ | 10.98 | | | $ | 10.00 | |
| | | | | |
Income from Investment Operations: | | | | | | | | | | | | | | | | | | | | |
Net investment income (c) | | | 0.09 | | | | 0.10 | | | | 0.07 | | | | 0.07 | | | | 0.08 | |
Net realized and unrealized gain (loss) on investments and foreign currency | | | (6.14 | ) | | | 0.21 | | | | 1.47 | | | | 1.70 | | | | 0.95 | |
| | | | | | | | | | | | | | | | | | | | |
Total from Investment Operations | | | (6.05 | ) | | | 0.31 | | | | 1.54 | | | | 1.77 | | | | 1.03 | |
| | | | | |
Less Distributions to Shareholders: | | | | | | | | | | | | | | | | | | | | |
From net investment income | | | (0.10 | ) | | | (0.11 | ) | | | (0.07 | ) | | | (0.05 | ) | | | (0.04 | ) |
From net realized gains | | | (0.19 | ) | | | (0.41 | ) | | | — | | | | — | | | | (0.01 | ) |
| | | | | | | | | | | | | | | | | | | | |
Total Distributions to Shareholders | | | (0.29 | ) | | | (0.52 | ) | | | (0.07 | ) | | | (0.05 | ) | | | (0.05 | ) |
| | | | | |
Net Asset Value, End of Period | | $ | 7.62 | | | $ | 13.96 | | | $ | 14.17 | | | $ | 12.70 | | | $ | 10.98 | |
Total return (d)(e) | | | (44.11 | )% | | | 1.89 | % | | | 12.18 | % | | | 16.16 | % | | | 10.30 | % |
| | | | | |
Ratios to Average Net Assets/Supplemental Data: | | | | | | | | | | | | | | | | | | | | |
Net expenses before interest expense (f) | | | 0.82 | % | | | 1.05 | % | | | 1.04 | % | | | 1.05 | % | | | 1.05 | % |
Interest expense | | | — | %(g) | | | — | | | | — | | | | — | | | | — | |
Net expenses (f) | | | 0.82 | % | | | 1.05 | % | | | 1.04 | % | | | 1.05 | % | | | 1.05 | % |
Waiver/Reimbursement | | | 0.23 | % | | | 0.17 | % | | | 0.20 | % | | | 0.26 | % | | | 0.54 | % |
Net investment income (f) | | | 0.75 | % | | | 0.64 | % | | | 0.56 | % | | | 0.57 | % | | | 0.74 | % |
Portfolio turnover rate | | | 63 | % | | | 27 | % | | | 11 | % | | | 17 | % | | | 13 | % |
Net assets, end of period (000’s) | | $ | 134,468 | | | $ | 388,441 | | | $ | 277,877 | | | $ | 132,406 | | | $ | 43,579 | |
| (a) | On March 31, 2008, Shares class of Equity Opportunities Fund, a series of Excelsior Funds Trust, was reorganized into the Fund’s Class Z. The financial information of the Fund’s Class Z includes the financial information of Equity Opportunities Fund’s Share class. |
| (b) | On March 31, 2008, Equity Opportunities Fund’s Institutional Shares class was reorganized into the Fund’s Class Z. |
| (c) | Per share data was calculated using the average shares outstanding during the period. |
| (d) | Had the investment advisor and/or any of its affiliates not waived fees or reimbursed a portion of expenses, total return would have been reduced. |
| (e) | Total return at net asset value assuming all distributions reinvested. |
| (f) | The benefits derived from expense reductions had an impact of less than 0.01% except for the year ended March 31, 2007, which had an impact of 0.01%. |
| (g) | Rounds to less than 0.01%. |
| (h) | Per share data for the years ended March 31, 2006 and 2005 were audited by other auditors. |
See Accompanying Notes to Financial Statements.
124
Financial Highlights – Columbia Select Small Cap Fund
Selected data for a share outstanding throughout each period is as follows:
| | | | | | | | |
| Class A Shares | | Year Ended
March 31,
2009 | | | Period Ended
March 31,
2008 (a) | |
Net Asset Value, Beginning of Period | | $ | 16.15 | | | $ | 21.11 | |
| | |
Income from Investment Operations: | | | | | | | | |
Net investment loss (b) | | | (0.06 | ) | | | (0.05 | ) |
Net realized and unrealized loss on investments | | | (6.53 | ) | | | (3.43 | ) |
| | | | | | | | |
Total from Investment Operations | | | (6.59 | ) | | | (3.48 | ) |
| | |
Less Distributions to Shareholders: | | | | | | | | |
From net realized gains | | | (0.48 | ) | | | (1.48 | ) |
| | |
Increase from Regulatory Settlements | | | — | (c) | | | — | |
| | |
Net Asset Value, End of Period | | $ | 9.08 | | | $ | 16.15 | |
Total return (d)(e) | | | (42.02 | )% | | | (17.38 | )%(f)(g) |
| | |
Ratios to Average Net Assets/Supplemental Data: | | | | | | | | |
Net expenses before interest expense (h) | | | 1.36 | % | | | 1.20 | %(i) |
Interest expense (j) | | | — | % | | | — | %(i) |
Net expenses (h) | | | 1.36 | % | | | 1.20 | %(i) |
Waiver/Reimbursement | | | 0.04 | % | | | 0.05 | %(i) |
Net investment loss (h) | | | (0.47 | )% | | | (0.67 | )%(i) |
Portfolio turnover rate | | | 67 | % | | | 73 | %(f) |
Net assets, end of period (000’s) | | $ | 6,671 | | | $ | 3,436 | |
| (a) | The Predecessor Fund’s Class A shares commenced operations on September 28, 2007. Per share data and total return reflect activity from that date. |
| (b) | Per share data was calculated using the average shares outstanding during the period. |
| (c) | Rounds to less than $0.01 per share. |
| (d) | Had the investment advisor and/or any of its affiliates not waived fees or reimbursed a portion of expenses, total return would have been reduced. |
| (e) | Total return at net asset value assuming all distributions reinvested and no initial sales charge or contingent deferred sales charge. |
| (g) | Total return includes a voluntary reimbursement by the investment advisor for a realized investment loss due to a trading error. This reimbursement increased total return and net asset value per share by less than 0.01% and less than $0.01, respectively. |
| (h) | The benefits derived from expense reductions had an impact of less than 0.01%. |
| (j) | Rounds to less than 0.01%. |
See Accompanying Notes to Financial Statements.
125
Financial Highlights – Columbia Select Small Cap Fund
Selected data for a share outstanding throughout each period is as follows:
| | | | | | | | |
| Class C Shares | | Year Ended
March 31,
2009 | | | Period Ended
March 31,
2008 (a) | |
Net Asset Value, Beginning of Period | | $ | 16.10 | | | $ | 21.11 | |
| | |
Income from Investment Operations: | | | | | | | | |
Net investment loss (b) | | | (0.17 | ) | | | (0.12 | ) |
Net realized and unrealized loss on investments | | | (6.48 | ) | | | (3.41 | ) |
| | | | | | | | |
Total from Investment Operations | | | (6.65 | ) | | | (3.53 | ) |
| | |
Less Distributions to Shareholders: | | | | | | | | |
From net realized gains | | | (0.48 | ) | | | (1.48 | ) |
| | |
Increase from Regulatory Settlements | | | — | (c) | | | — | |
| | |
Net Asset Value, End of Period | | $ | 8.97 | | | $ | 16.10 | |
Total return (d)(e) | | | (42.53 | )% | | | (17.63 | )%(f)(g) |
| | |
Ratios to Average Net Assets/Supplemental Data: | | | | | | | | |
Net expenses before interest expense (h) | | | 2.11 | % | | | 1.95 | %(i) |
Interest expense (j) | | | — | % | | | — | %(i) |
Net expenses (h) | | | 2.11 | % | | | 1.95 | %(i) |
Waiver/Reimbursement | | | 0.04 | % | | | 0.05 | %(i) |
Net investment loss (h) | | | (1.31 | )% | | | (1.42 | )%(i) |
Portfolio turnover rate | | | 67 | % | | | 73 | %(f) |
Net assets, end of period (000’s) | | $ | 1,063 | | | $ | 2,101 | |
| (a) | The Predecessor Fund’s Class C shares commenced operations on September 28, 2007. Per share data and total return reflect activity from that date. |
| (b) | Per share data was calculated using the average shares outstanding during the period. |
| (c) | Rounds to less than $0.01 per share. |
| (d) | Had the investment advisor and/or any of its affiliates not waived fees or reimbursed a portion of expenses, total return would have been reduced. |
| (e) | Total return at net asset value assuming all distributions reinvested and no contingent deferred sales charge. |
| (g) | Total return includes a voluntary reimbursement by the investment advisor for a realized investment loss due to a trading error. This reimbursement increased total return and net asset value per share by less than 0.01% and less than $0.01, respectively. |
| (h) | The benefits derived from expense reductions had an impact of less than 0.01%. |
| (j) | Rounds to less than 0.01%. |
See Accompanying Notes to Financial Statements.
126
Financial Highlights – Columbia Select Small Cap Fund
Selected data for a share outstanding throughout each period is as follows:
| | | | | | | | | | | | | | | | | | | | |
| | | Year Ended March 31, | | | Period Ended
March 31, | |
| Class R Shares | | 2009 | | | 2008 (a) | | | 2007 | | | 2006 (l) | | | 2005 (b)(l) | |
Net Asset Value, Beginning of Period | | $ | 15.86 | | | $ | 18.98 | | | $ | 19.12 | | | $ | 16.12 | | | $ | 17.00 | |
| | | | | |
Income from Investment Operations: | | | | | | | | | | | | | | | | | | | | |
Net investment loss (c) | | | (0.10 | ) | | | (0.21 | ) | | | (0.22 | ) | | | (0.19 | ) | | | (0.04 | ) |
Net realized and unrealized gain (loss) on investments | | | (6.40 | ) | | | (1.43 | ) | | | 1.34 | | | | 4.08 | | | | (0.84 | ) |
| | | | | | | | | | | | | | | | | | | | |
Total from Investment Operations | | | (6.50 | ) | | | (1.64 | ) | | | 1.12 | | | | 3.89 | | | | (0.88 | ) |
| | | | | |
Less Distributions to Shareholders: | | | | | | | | | | | | | | | | | | | | |
From net realized gains | | | (0.48 | ) | | | (1.48 | ) | | | (1.26 | ) | | | (0.89 | ) | | | — | |
| | | | | |
Increase from Regulatory Settlements | | | — | (d) | | | — | | | | — | | | | — | | | | — | |
| | | | | |
Net Asset Value, End of Period | | $ | 8.88 | | | $ | 15.86 | | | $ | 18.98 | | | $ | 19.12 | | | $ | 16.12 | |
Total return (e) | | | (42.22 | )%(f) | | | (9.66 | )%(f)(g) | | | 6.23 | % | | | 24.83 | % | | | (5.23 | )%(f)(h) |
| | | | | |
Ratios to Average Net Assets/Supplemental Data: | | | | | | | | | | | | | | | | | | | | |
Net expenses before interest expense (i) | | | 1.61 | % | | | 1.70 | % | | | 1.74 | % | | | 1.56 | % | | | 1.55 | %(j) |
Interest expense | | | — | %(k) | | | — | %(k) | | | — | | | | — | | | | — | |
Net expenses (i) | | | 1.61 | % | | | 1.70 | % | | | 1.74 | % | | | 1.56 | % | | | 1.55 | %(j) |
Waiver/Reimbursement | | | 0.04 | % | | | 0.04 | % | | | — | | | | — | | | | 0.03 | %(j) |
Net investment loss (i) | | | (0.80 | )% | | | (1.13 | )% | | | (1.21 | )% | | | (1.13 | )% | | | (1.28 | )%(j) |
Portfolio turnover rate | | | 67 | % | | | 73 | % | | | 52 | % | | | 65 | % | | | 61 | %(h) |
Net assets, end of period (000’s) | | $ | 5,819 | | | $ | 6,881 | | | $ | 1,827 | | | $ | 1 | | | $ | 1 | |
| (a) | On March 31, 2008, Retirement Shares class of Small Cap Fund, a series of Excelsior Funds, Inc., was reorganized into the Fund’s Class R. The financial information of the Fund’s Class R includes the financial information of Small Cap Fund’s Retirement Shares class. |
| (b) | Small Cap Fund’s Retirement Shares commenced operations on December 31, 2004. Per share data and total return reflect activity from that date. |
| (c) | Per share data was calculated using the average shares outstanding during the period. |
| (d) | Rounds to less than $0.01 per share. |
| (e) | Total return at net asset value assuming all distributions reinvested. |
| (f) | Had the investment advisor and/or any of its affiliates not waived fees or reimbursed a portion of expenses, total return would have been reduced. |
| (g) | Total return includes a voluntary reimbursement by the investment advisor for a realized investment loss due to a trading error. This reimbursement increased total return and net asset value per share by less than 0.01% and less than $0.01, respectively. |
| (i) | The benefits derived from expense reductions had an impact of less than 0.01%. |
| (k) | Rounds to less than 0.01%. |
| (l) | Per share data for the year ended March 31, 2006 and the period ended March 31, 2005 were audited by other auditors. |
See Accompanying Notes to Financial Statements.
127
Financial Highlights – Columbia Select Small Cap Fund
Selected data for a share outstanding throughout each period is as follows:
| | | | | | | | | | | | | | | | | | | | |
| | | Year Ended March 31, | |
| Class Z Shares | | 2009 | | | 2008 (a) | | | 2007 | | | 2006 (i) | | | 2005 (i) | |
Net Asset Value, Beginning of Period | | $ | 16.15 | | | $ | 19.21 | | | $ | 19.23 | | | $ | 16.14 | | | $ | 14.59 | |
| | | | | |
Income from Investment Operations: | | | | | | | | | | | | | | | | | | | | |
Net investment loss (b) | | | (0.04 | ) | | | (0.12 | ) | | | (0.12 | ) | | | (0.11 | ) | | | (0.10 | ) |
Net realized and unrealized gain (loss) on investments | | | (6.53 | ) | | | (1.46 | ) | | | 1.36 | | | | 4.09 | | | | 1.65 | |
| | | | | | | | | | | | | | | | | | | | |
Total from Investment Operations | | | (6.57 | ) | | | (1.58 | ) | | | 1.24 | | | | 3.98 | | | | 1.55 | |
| | | | | |
Less Distributions to Shareholders: | | | | | | | | | | | | | | | | | | | | |
From net realized gains | | | (0.48 | ) | | | (1.48 | ) | | | (1.26 | ) | | | (0.89 | ) | | | — | |
| | | | | |
Increase from Regulatory Settlements | | | — | (c) | | | — | | | | — | | | | — | | | | — | |
| | | | | |
Net Asset Value, End of Period | | $ | 9.10 | | | $ | 16.15 | | | $ | 19.21 | | | $ | 19.23 | | | $ | 16.14 | |
Total return (d) | | | (41.89 | )%(e) | | | (9.22 | )%(e)(f) | | | 6.83 | % | | | 25.37 | %(e) | | | 10.62 | %(e) |
| | | | | |
Ratios to Average Net Assets/Supplemental Data: | | | | | | | | | | | | | | | | | | | | |
Net expenses before interest expense (g) | | | 1.11 | % | | | 1.20 | % | | | 1.22 | % | | | 1.09 | % | | | 1.05 | % |
Interest expense | | | — | %(h) | | | — | %(h) | | | — | | | | — | | | | — | |
Net expenses (g) | | | 1.11 | % | | | 1.20 | % | | | 1.22 | % | | | 1.09 | % | | | 1.05 | % |
Waiver/Reimbursement | | | 0.04 | % | | | 0.04 | % | | | — | | | | 0.02 | % | | | 0.03 | % |
Net investment loss (g) | | | (0.31 | )% | | | (0.63 | )% | | | (0.66 | )% | | | (0.64 | )% | | | (0.64 | )% |
Portfolio turnover rate | | | 67 | % | | | 73 | % | | | 52 | % | | | 65 | % | | | 61 | % |
Net assets, end of period (000’s) | | $ | 321,684 | | | $ | 676,616 | | | $ | 694,765 | | | $ | 599,389 | | | $ | 488,221 | |
| (a) | On March 31, 2008, Shares class of Small Cap Fund, a series of Excelsior Funds, Inc., was reorganized into the Fund’s Class Z. The financial information of the Fund’s Class Z includes the financial information of Small Cap Fund’s Shares class. |
| (b) | Per share data was calculated using the average shares outstanding during the period. |
| (c) | Rounds to less than $0.01 per share. |
| (d) | Total return at net asset value assuming all distributions reinvested. |
| (e) | Had the investment advisor and/or any of its affiliates not waived fees or reimbursed a portion of expenses, total return would have been reduced. |
| (f) | Total return includes a voluntary reimbursement by the investment advisor for a realized investment loss due to a trading error. This reimbursement increased total return and net asset value per share by less than 0.01% and less than $0.01, respectively. |
| (g) | The benefits derived from expense reductions had an impact of less than 0.01%. |
| (h) | Rounds to less than 0.01%. |
| (i) | Per share data for the years ended March 31, 2006 and 2005 were audited by other auditors. |
See Accompanying Notes to Financial Statements.
128
Financial Highlights – Columbia Value and Restructuring Fund
Selected data for a share outstanding throughout each period is as follows:
| | | | | | | | |
| Class A Shares | | Year Ended
March 31,
2009 | | | Period Ended
March 31,
2008 (a) | |
Net Asset Value, Beginning of Period | | $ | 52.25 | | | $ | 58.58 | |
| | |
Income from Investment Operations: | | | | | | | | |
Net investment income (b) | | | 0.51 | | | | 0.24 | |
Net realized and unrealized loss on investments, foreign currency and written options | | | (25.72 | ) | | | (5.70 | ) |
| | | | | | | | |
Total from Investment Operations | | | (25.21 | ) | | | (5.46 | ) |
| | |
Less Distributions to Shareholders: | | | | | | | | |
From net investment income | | | (0.51 | ) | | | (0.36 | ) |
From net realized gains | | | (0.02 | ) | | | (0.51 | ) |
| | | | | | | | |
Total Distributions to Shareholders | | | (0.53 | ) | | | (0.87 | ) |
| | |
Increase from Regulatory Settlements | | | — | (c) | | | — | |
| | |
Net Asset Value, End of Period | | $ | 26.51 | | | $ | 52.25 | |
Total return (d)(e) | | | (48.51 | )% | | | (9.41 | )%(f) |
| | |
Ratios to Average Net Assets/Supplemental Data: | | | | | | | | |
Net expenses before interest expense (g) | | | 1.14 | % | | | 1.02 | %(h) |
Interest expense | | | — | %(i) | | | — | |
Net expenses (g) | | | 1.14 | % | | | 1.02 | %(h) |
Waiver/Reimbursement | | | 0.04 | % | | | 0.05 | %(h) |
Net investment income (g) | | | 1.35 | % | | | 0.83 | %(h) |
Portfolio turnover rate | | | 12 | % | | | 11 | %(f) |
Net assets, end of period (000’s) | | $ | 163,338 | | | $ | 77,209 | |
| (a) | The Predecessor Fund’s Class A shares commenced operations on September 28, 2007. Per share data and total return reflect activity from that date. |
| (b) | Per share data was calculated using the average shares outstanding during the period. |
| (c) | Rounds to less than $0.01 per share. |
| (d) | Had the investment advisor and/or any of its affiliates not waived fees or reimbursed a portion of expenses, total return would have been reduced. |
| (e) | Total return at net asset value assuming all distributions reinvested and no initial sales charge or contingent deferred sales charge. |
| (g) | The benefits derived from expense reductions had an impact of less than 0.01%. |
| (i) | Rounds to less than 0.01%. |
See Accompanying Notes to Financial Statements.
129
Financial Highlights – Columbia Value and Restructuring Fund
Selected data for a share outstanding throughout each period is as follows:
| | | | | | | | |
| Class C Shares | | Year Ended
March 31,
2009 | | | Period Ended
March 31,
2008 (a) | |
Net Asset Value, Beginning of Period | | $ | 52.23 | | | $ | 58.58 | |
| | |
Income from Investment Operations: | | | | | | | | |
Net investment income (b) | | | 0.23 | | | | 0.04 | |
Net realized and unrealized loss on investments, foreign currency and written options | | | (25.73 | ) | | | (5.68 | ) |
| | | | | | | | |
Total from Investment Operations | | | (25.50 | ) | | | (5.64 | ) |
| | |
Less Distributions to Shareholders: | | | | | | | | |
From net investment income | | | (0.20 | ) | | | (0.20 | ) |
From net realized gains | | | (0.02 | ) | | | (0.51 | ) |
| | | | | | | | |
Total Distributions to Shareholders | | | (0.22 | ) | | | (0.71 | ) |
| | |
Increase from Regulatory Settlements | | | — | (c) | | | — | |
| | |
Net Asset Value, End of Period | | $ | 26.51 | | | $ | 52.23 | |
Total return (d)(e) | | | (48.89 | )% | | | (9.72 | )%(f) |
| | |
Ratios to Average Net Assets/Supplemental Data: | | | | | | | | |
Net expenses before interest expense (g) | | | 1.89 | % | | | 1.77 | %(h) |
Interest expense | | | — | %(i) | | | — | |
Net expenses (g) | | | 1.89 | % | | | 1.77 | %(h) |
Waiver/Reimbursement | | | 0.04 | % | | | 0.05 | %(h) |
Net investment income (g) | | | 0.63 | % | | | 0.07 | %(h) |
Portfolio turnover rate | | | 12 | % | | | 11 | %(f) |
Net assets, end of period (000’s) | | $ | 40,380 | | | $ | 13,665 | |
| (a) | The Predecessor Fund’s Class C shares commenced operations on September 28, 2007. Per share data and total return reflect activity from that date. |
| (b) | Per share data was calculated using the average shares outstanding during the period. |
| (c) | Rounds to less than $0.01 per share. |
| (d) | Had the investment advisor and/or any of its affiliates not waived fees or reimbursed a portion of expenses, total return would have been reduced. |
| (e) | Total return at net asset value assuming all distributions reinvested and no contingent deferred sales charge. |
| (g) | The benefits derived from expense reductions had an impact of less than 0.01%. |
| (i) | Rounds to less than 0.01%. |
See Accompanying Notes to Financial Statements.
130
Financial Highlights – Columbia Value and Restructuring Fund
Selected data for a share outstanding throughout each period is as follows:
| | | | | | | | | | | | | | | | | | | | |
| | | Year Ended March 31, | | | Period Ended
March 31, | |
| Class R Shares | | 2009 | | | 2008 (a) | | | 2007 | | | 2006 (k) | | | 2005 (b)(k) | |
Net Asset Value, Beginning of Period | | $ | 52.23 | | | $ | 54.30 | | | $ | 49.35 | | | $ | 41.49 | | | $ | 42.43 | |
| | | | | |
Income from Investment Operations: | | | | | | | | | | | | | | | | | | | | |
Net investment income (loss) (c) | | | 0.41 | | | | 0.33 | | | | 0.22 | | | | 0.42 | | | | (0.04 | ) |
Net realized and unrealized gain (loss) on investments, foreign currency and written options | | | (25.72 | ) | | | (1.41 | ) | | | 4.98 | | | | 7.81 | | | | (0.90 | ) |
| | | | | | | | | | | | | | | | | | | | |
Total from Investment Operations | | | (25.31 | ) | | | (1.08 | ) | | | 5.20 | | | | 8.23 | | | | (0.94 | ) |
| | | | | |
Less Distributions to Shareholders: | | | | | | | | | | | | | | | | | | | | |
From net investment income | | | (0.40 | ) | | | (0.48 | ) | | | (0.25 | ) | | | (0.37 | ) | | | — | |
From net realized gains | | | (0.02 | ) | | | (0.51 | ) | | | — | | | | — | | | | — | |
| | | | | | | | | | | | | | | | | | | | |
Total Distributions to Shareholders | | | (0.42 | ) | | | (0.99 | ) | | | (0.25 | ) | | | (0.37 | ) | | | — | |
| | | | | |
Increase from Regulatory Settlements | | | — | (d) | | | — | | | | — | | | | — | | | | — | |
| | | | | |
Net Asset Value, End of Period | | $ | 26.50 | | | $ | 52.23 | | | $ | 54.30 | | | $ | 49.35 | | | $ | 41.49 | |
Total return (e) | | | (48.65 | )%(f) | | | (2.11 | )%(f) | | | 10.58 | % | | | 19.95 | % | | | (2.58 | )%(f)(g) |
| | | | | |
Ratios to Average Net Assets/Supplemental Data: | | | | | | | | | | | | | | | | | | | | |
Net expenses before interest expense (h) | | | 1.39 | % | | | 1.35 | % | | | 1.55 | % | | | 1.56 | % | | | 1.57 | %(i) |
Interest expense | | | — | %(j) | | | — | | | | — | | | | — | | | | — | |
Net expenses (h) | | | 1.39 | % | | | 1.35 | % | | | 1.55 | % | | | 1.56 | % | | | 1.57 | %(i) |
Waiver/Reimbursement | | | 0.04 | % | | | 0.04 | % | | | — | | | | — | | | | 0.02 | %(i) |
Net investment income (loss) (h) | | | 1.05 | % | | | 0.60 | % | | | 0.43 | % | | | 0.90 | % | | | (0.35 | )%(i) |
Portfolio turnover rate | | | 12 | % | | | 11 | % | | | 13 | % | | | 12 | % | | | 8 | %(g) |
Net assets, end of period (000’s) | | $ | 37,637 | | | $ | 33,826 | | | $ | 2,926 | | | $ | 896 | | | $ | 1 | |
| (a) | On March 31, 2008, Retirement Shares class of Value and Restructuring Fund, a series of Excelsior Funds, Inc., was reorganized into the Fund’s Class R. The financial information of the Fund’s Class R includes the financial information of Value and Restructuring Fund’s Retirement Shares class. |
| (b) | Value and Restructuring Fund’s Retirement Shares commenced operations on December 31, 2004. Per share data and total return reflect activity from that date. |
| (c) | Per share data was calculated using the average shares outstanding during the period. |
| (d) | Rounds to less than $0.01 per share. |
| (e) | Total return at net asset value assuming all distributions reinvested. |
| (f) | Had the investment advisor and/or any of its affiliates not waived fees or reimbursed a portion of expenses, total return would have been reduced. |
| (h) | The benefits derived from expense reductions had an impact of less than 0.01%. |
| (j) | Rounds to less than 0.01%. |
| (k) | Per share data for the year ended March 31, 2006 and period ended March 31, 2005 were audited by other auditors. |
See Accompanying Notes to Financial Statements.
131
Financial Highlights – Columbia Value and Restructuring Fund
Selected data for a share outstanding throughout each period is as follows:
| | | | | | | | | | | | | | | | | | | | |
Class Z Shares | | Year Ended March 31, | |
| | 2009 | | | 2008 (a)(b) | | | 2007 | | | 2006 (i) | | | 2005 (i) | |
Net Asset Value, Beginning of Period | | $ | 52.22 | | | $ | 54.33 | | | $ | 49.36 | | | $ | 41.40 | | | $ | 37.57 | |
| | | | | |
Income from Investment Operations: | | | | | | | | | | | | | | | | | | | | |
Net investment income (c) | | | 0.61 | | | | 0.60 | | | | 0.45 | | | | 0.53 | | | | 0.34 | |
Net realized and unrealized gain (loss) on investments, foreign currency and written options | | | (25.71 | ) | | | (1.47 | ) | | | 5.00 | | | | 7.88 | | | | 3.83 | |
| | | | | | | | | | | | | | | | | | | | |
Total from Investment Operations | | | (25.10 | ) | | | (0.87 | ) | | | 5.45 | | | | 8.41 | | | | 4.17 | |
| | | | | |
Less Distributions to Shareholders: | | | | | | | | | | | | | | | | | | | | |
From net investment income | | | (0.61 | ) | | | (0.73 | ) | | | (0.48 | ) | | | (0.45 | ) | | | (0.34 | ) |
From net realized gains | | | (0.02 | ) | | | (0.51 | ) | | | — | | | | — | | | | — | |
| | | | | | | | | | | | | | | | | | | | |
Total Distributions to Shareholders | | | (0.63 | ) | | | (1.24 | ) | | | (0.48 | ) | | | (0.45 | ) | | | (0.34 | ) |
| | | | | |
Increase from Regulatory Settlements | | | — | (d) | | | — | | | | — | | | | — | | | | — | |
| | | | | |
Net Asset Value, End of Period | | $ | 26.49 | | | $ | 52.22 | | | $ | 54.33 | | | $ | 49.36 | | | $ | 41.40 | |
Total return (e) | | | (48.39 | )%(f) | | | (1.74 | )%(f) | | | 11.14 | % | | | 20.45 | % | | | 11.16 | %(f) |
| | | | | |
Ratios to Average Net Assets/Supplemental Data: | | | | | | | | | | | | | | | | | | | | |
Net expenses before interest expense (g) | | | 0.89 | % | | | 1.02 | % | | | 1.05 | % | | | 1.05 | % | | | 1.07 | % |
Interest expense | | | — | %(h) | | | — | | | | — | | | | — | | | | — | |
Net expenses (g) | | | 0.89 | % | | | 1.02 | % | | | 1.05 | % | | | 1.05 | % | | | 1.07 | % |
Waiver/Reimbursement | | | 0.04 | % | | | 0.04 | % | | | — | | | | — | | | | 0.02 | % |
Net investment income (g) | | | 1.47 | % | | | 1.07 | % | | | 0.90 | % | | | 1.18 | % | | | 0.87 | % |
Portfolio turnover rate | | | 12 | % | | | 11 | % | | | 13 | % | | | 12 | % | | | 8 | % |
Net assets, end of period (000’s) | | $ | 4,352,176 | | | $ | 8,980,358 | | | $ | 7,767,713 | | | $ | 6,230,754 | | | $ | 4,469,075 | |
| (a) | On March 31, 2008, Shares class of Value and Restructuring Fund, a series of Excelsior Funds, Inc., was reorganized into Class Z. The financial information of Class Z includes the financial information of Value and Restructuring Fund’s Shares class. |
| (b) | On March 31, 2008, Value and Restructuring Fund’s Institutional Shares class was reorganized into the Fund’s Class Z. |
| (c) | Per share data was calculated using the average shares outstanding during the period. |
| (d) | Rounds to less than $0.01 per share. |
| (e) | Total return at net asset value assuming all distributions reinvested. |
| (f) | Had the investment advisor and/or any of its affiliates not waived fees or reimbursed a portion of expenses, total return would have been reduced. |
| (g) | The benefits derived from expense reductions had an impact of less than 0.01%. |
| (h) | Rounds to less than 0.01%. |
| (i) | Per share data for the years ended March 31, 2006 and 2005 were audited by other auditors. |
See Accompanying Notes to Financial Statements.
132
Financial Highlights – Columbia Emerging Markets Fund
Selected data for a share outstanding throughout each period is as follows:
| | | | | | | | |
| Class A Shares | | Year Ended
March 31,
2009 | | | Period Ended
March 31,
2008 (a) | |
Net Asset Value, Beginning of Period | | $ | 14.96 | | | $ | 17.77 | |
| | |
Income from Investment Operations: | | | | | | | | |
Net investment income (b) | | | 0.07 | | | | 0.04 | (c) |
Net realized and unrealized loss on investments, foreign currency
and foreign capital gains tax | | | (6.36 | ) | | | (1.63 | ) |
| | | | | | | | |
Total from Investment Operations | | | (6.29 | ) | | | (1.59 | ) |
| | |
Less Distributions to Shareholders: | | | | | | | | |
From net investment income | | | — | | | | (0.06 | ) |
From net realized gains | | | (2.26 | ) | | | (1.16 | ) |
| | | | | | | | |
Total Distributions to Shareholders | | | (2.26 | ) | | | (1.22 | ) |
| | |
Redemption Fees: | | | | | | | | |
Redemption fees added to paid-in-capital (b) | | | 0.01 | | | | — | (d) |
| | |
Net Asset Value, End of Period | | $ | 6.42 | | | $ | 14.96 | |
Total return (e)(f) | | | (49.44 | )% | | | (9.80 | )%(g) |
| | |
Ratios to Average Net Assets/Supplemental Data: | | | | | | | | |
Net expenses before interest expense (h) | | | 1.95 | % | | | 1.85 | %(i) |
Interest expense | | | 0.01 | % | | | — | %(i)(j) |
Net expenses (h) | | | 1.96 | % | | | 1.85 | %(i) |
Waiver/Reimbursement | | | 0.18 | % | | | 0.05 | %(i) |
Net investment income (h) | | | 0.71 | % | | | 0.46 | %(i) |
Portfolio turnover rate | | | 82 | % | | | 29 | %(g) |
Net assets, end of period (000’s) | | $ | 917 | | | $ | 1,231 | |
| (a) | The Predecessor Fund’s Class A shares commenced operations on September 28, 2007. Per share data and total return reflect activity from that date. |
| (b) | Per share data was calculated using the average shares outstanding during the period. |
| (c) | Net investment income per share reflects special dividends. The effect of these dividends amounted to $0.03 per share. |
| (d) | Rounds to less than $0.01 per share. |
| (e) | Had the investment advisor and/or any of its affiliates not waived fees or reimbursed a portion of expenses, total return would have been reduced. |
| (f) | Total return at net asset value assuming all distributions reinvested and no initial sales charge or contingent deferred sales charge. |
| (h) | The benefits derived from expense reductions had an impact of less than 0.01%. |
| (j) | Rounds to less than 0.01%. |
See Accompanying Notes to Financial Statements.
133
Financial Highlights – Columbia Emerging Markets Fund
Selected data for a share outstanding throughout each period is as follows:
| | | | | | | | |
| Class C Shares | | Year Ended
March 31,
2009 | | | Period Ended
March 31,
2008 (a) | |
Net Asset Value, Beginning of Period | | $ | 14.94 | | | $ | 17.77 | |
| | |
Income from Investment Operations: | | | | | | | | |
Net investment income (loss) (b) | | | — | (c) | | | (0.04 | )(d) |
Net realized and unrealized loss on investments, foreign currency
and foreign capital gains tax | | | (6.33 | ) | | | (1.61 | ) |
| | | | | | | | |
Total from Investment Operations | | | (6.33 | ) | | | (1.65 | ) |
| | |
Less Distributions to Shareholders: | | | | | | | | |
From net investment income | | | — | | | | (0.02 | ) |
From net realized gains | | | (2.26 | ) | | | (1.16 | ) |
| | | | | | | | |
Total Distributions to Shareholders | | | (2.26 | ) | | | (1.18 | ) |
| | |
Redemption Fees: | | | | | | | | |
Redemption fees added to paid-in-capital (b) | | | 0.01 | | | | — | (c) |
| | |
Net Asset Value, End of Period | | $ | 6.36 | | | $ | 14.94 | |
Total return (e)(f) | | | (49.82 | )% | | | (10.11 | )%(g) |
| | |
Ratios to Average Net Assets/Supplemental Data: | | | | | | | | |
Net expenses before interest expense (h) | | | 2.70 | % | | | 2.60 | %(i) |
Interest expense | | | 0.01 | % | | | — | %(i)(j) |
Net expenses (h) | | | 2.71 | % | | | 2.60 | %(i) |
Waiver/Reimbursement | | | 0.18 | % | | | 0.05 | %(i) |
Net investment loss (h) | | | (0.01 | )% | | | (0.44 | )%(i) |
Portfolio turnover rate | | | 82 | % | | | 29 | %(g) |
Net assets, end of period (000’s) | | $ | 242 | | | $ | 458 | |
| (a) | The Predecessor Fund’s Class C shares commenced operations on September 28, 2007. Per share data and total return reflect activity from that date. |
| (b) | Per share data was calculated using the average shares outstanding during the period. |
| (c) | Rounds to less than $0.01 per share. |
| (d) | Net investment income per share reflects special dividends. The effect of these dividends amounted to $0.03 per share. |
| (e) | Had the investment advisor and/or any of its affiliates not waived fees or reimbursed a portion of expenses, total return would have been reduced. |
| (f) | Total return at net asset value assuming all distributions reinvested and no contingent deferred sales charge. |
| (h) | The benefits derived from expense reductions had an impact of less than 0.01%. |
| (j) | Rounds to less than 0.01%. |
See Accompanying Notes to Financial Statements.
134
Financial Highlights – Columbia Emerging Markets Fund
Selected data for a share outstanding throughout each period is as follows:
| | | | | | | | | | | | | | | | | | | | |
| | | Year Ended March 31, | |
| Class Z Shares | | 2009 | | | 2008 (a)(b) | | | 2007 | | | 2006 (j) | | | 2005 (j) | |
Net Asset Value, Beginning of Period | | $ | 14.94 | | | $ | 14.06 | | | $ | 12.60 | | | $ | 8.73 | | | $ | 7.67 | |
| | | | | |
Income from Investment Operations: | | | | | | | | | | | | | | | | | | | | |
Net investment income (c) | | | 0.11 | | | | 0.12 | (e) | | | 0.07 | | | | 0.10 | | | | 0.12 | |
Net realized and unrealized gain (loss) on investments, foreign currency and foreign capital gains tax | | | (6.38 | ) | | | 2.04 | | | | 2.16 | | | | 3.87 | | | | 1.18 | |
| | | | | | | | | | | | | | | | | | | | |
Total from Investment Operations | | | (6.27 | ) | | | 2.16 | | | | 2.23 | | | | 3.97 | | | | 1.30 | |
| | | | | |
Less Distributions to Shareholders: | | | | | | | | | | | | | | | | | | | | |
From net investment income | | | — | | | | (0.12 | ) | | | (0.08 | ) | | | (0.10 | ) | | | (0.08 | ) |
From net realized gains | | | (2.26 | ) | | | (1.16 | ) | | | (0.69 | ) | | | — | | | | (0.16 | ) |
| | | | | | | | | | | | | | | | | | | | |
Total Distributions to Shareholders | | | (2.26 | ) | | | (1.28 | ) | | | (0.77 | ) | | | (0.10 | ) | | | (0.24 | ) |
| | | | | |
Redemption Fees: | | | | | | | | | | | | | | | | | | | | |
Redemption fees added to paid-in-capital (c) | | | 0.01 | | | | — | (d) | | | — | (d) | | | — | (d) | | | — | (d) |
| | | | | |
Net Asset Value, End of Period | | $ | 6.42 | | | $ | 14.94 | | | $ | 14.06 | | | $ | 12.60 | | | $ | 8.73 | |
Total return (f)(g) | | | (49.37 | )% | | | 14.31 | % | | | 17.98 | % | | | 45.85 | % | | | 17.07 | % |
| | | | | |
Ratios to Average Net Assets/Supplemental Data: | | | | | | | | | | | | | | | | | | | | |
Net expenses before interest expense (h) | | | 1.70 | % | | | 1.85 | % | | | 1.85 | % | | | 1.81 | % | | | 1.70 | % |
Interest expense | | | 0.01 | % | | | — | %(i) | | | — | | | | — | | | | — | |
Net expenses (h) | | | 1.71 | % | | | 1.85 | % | | | 1.85 | % | | | 1.81 | % | | | 1.70 | % |
Waiver/Reimbursement | | | 0.18 | % | | | 0.04 | % | | | 0.05 | % | | | 0.11 | % | | | 0.20 | % |
Net investment income (h) | | | 1.01 | % | | | 0.73 | % | | | 0.50 | % | | | 1.00 | % | | | 1.44 | % |
Portfolio turnover rate | | | 82 | % | | | 29 | % | | | 16 | % | | | 7 | % | | | 21 | % |
Net assets, end of period (000’s) | | $ | 237,412 | | | $ | 1,014,715 | | | $ | 1,092,481 | | | $ | 996,666 | | | $ | 433,168 | |
| (a) | On March 31, 2008, Shares class of Emerging Markets Fund, a series of Excelsior Funds, Inc., was reorganized into Class Z. The financial information of the Fund’s Class Z includes the financial information of Emerging Markets Fund’s Shares class. |
| (b) | On March 31, 2008, Emerging Markets Fund’s Institutional Shares class was reorganized into the Fund’s Class Z. |
| (c) | Per share data was calculated using the average shares outstanding during the period. |
| (d) | Rounds to less than $0.01 per share. |
| (e) | Net investment income per share reflects special dividends. The effect of these dividends amounted to $0.03 per share. |
| (f) | Had the investment advisor and/or any of its affiliates not waived fees or reimbursed a portion of expenses, total return would have been reduced. |
| (g) | Total return at net asset value assuming all distributions reinvested. |
| (h) | The benefits derived from expense reductions had an impact of less than 0.01%. |
| (i) | Rounds to less than 0.01%. |
| (j) | Per share data for the years ended March 31, 2006 and 2005 were audited by other auditors. |
See Accompanying Notes to Financial Statements.
135
Financial Highlights – Columbia International Growth Fund
Selected data for a share outstanding throughout each period is as follows:
| | | | | | | | |
| Class A Shares | | Year Ended
March 31,
2009 | | | Period Ended
March 31,
2008 (a) | |
Net Asset Value, Beginning of Period | | $ | 18.80 | | | $ | 18.80 | |
| | |
Income from Investment Operations: | | | | | | | | |
Net investment income (loss) (b) | | | 0.13 | | | | — | (c) |
Net realized and unrealized gain (loss) on investments, foreign currency
and foreign capital gains tax | | | (8.58 | ) | | | — | (c) |
| | | | | | | | |
Total from Investment Operations | | | (8.45 | ) | | | — | (c) |
| | |
Less Distributions to Shareholders: | | | | | | | | |
From net investment income | | | (0.04 | ) | | | — | |
From net realized gains | | | (1.13 | ) | | | — | |
| | | | | | | | |
Total Distributions to Shareholders | | | (1.17 | ) | | | — | |
| | |
Redemption Fees: | | | | | | | | |
Redemption fees added to paid-in-capital (b)(c) | | | — | | | | — | |
| | |
Increase from Regulatory Settlements | | | — | (c) | | | — | |
| | |
Net Asset Value, End of Period | | $ | 9.18 | | | $ | 18.80 | |
Total return (d)(e) | | | (47.91 | )% | | | 0.00 | %(f) |
| | |
Ratios to Average Net Assets/Supplemental Data: | | | | | | | | |
Net expenses before interest expense (h) | | | 1.68 | % | | | 1.75 | %(i) |
Interest expense | | | 0.01 | % | | | — | %(g)(i) |
Net expenses (h) | | | 1.69 | % | | | 1.75 | %(i) |
Waiver/Reimbursement | | | 0.04 | % | | | 0.06 | %(i) |
Net investment income (loss) (h) | | | 1.21 | % | | | (1.75 | )%(i) |
Portfolio turnover rate | | | 133 | % | | | 68 | %(f) |
Net assets, end of period (000’s) | | $ | 226 | | | $ | 10 | |
| (a) | The Fund’s Class A shares commenced operations on March 31, 2008. Per share data and total return reflect activity from that date. |
| (b) | Per share data was calculated using the average shares outstanding during the period. |
| (c) | Rounds to less than $0.01 per share. |
| (d) | Had the investment advisor and/or any of its affiliates not waived fees or reimbursed a portion of expenses, total return would have been reduced. |
| (e) | Total return at net asset value assuming all distributions reinvested and no initial sales charge or contingent deferred sales charge. |
| (g) | Rounds to less than 0.01%. |
| (h) | The benefits derived from expense reductions had an impact of less than 0.01%. |
See Accompanying Notes to Financial Statements.
136
Financial Highlights – Columbia International Growth Fund
Selected data for a share outstanding throughout each period is as follows:
| | | | | | | | |
| Class C Shares | | Year Ended
March 31,
2009 | | | Period Ended
March 31,
2008 (a) | |
Net Asset Value, Beginning of Period | | $ | 18.80 | | | $ | 18.80 | |
| | |
Income from Investment Operations: | | | | | | | | |
Net investment income (loss) (b) | | | 0.12 | | | | — | (c) |
Net realized and unrealized gain (loss) on investments, foreign currency
and foreign capital gains tax | | | (8.64 | ) | | | — | (c) |
| | | | | | | | |
Total from Investment Operations | | | (8.52 | ) | | | — | (c) |
| | |
Less Distributions to Shareholders: | | | | | | | | |
From net investment income | | | (0.04 | ) | | | — | |
From net realized gains | | | (1.13 | ) | | | — | |
| | | | | | | | |
Total Distributions to Shareholders | | | (1.17 | ) | | | — | |
| | |
Redemption Fees: | | | | | | | | |
Redemption fees added to paid-in-capital (b)(c) | | | — | | | | — | |
| | |
Increase from Regulatory Settlements | | | — | (c) | | | — | |
| | |
Net Asset Value, End of Period | | $ | 9.11 | | | $ | 18.80 | |
Total return (d)(e) | | | (48.31 | )% | | | 0.00 | %(f) |
| | |
Ratios to Average Net Assets/Supplemental Data: | | | | | | | | |
Net expenses before interest expense (h) | | | 2.43 | % | | | 2.50 | %(i) |
Interest expense | | | 0.01 | % | | | — | %(i)(g) |
Net expenses (h) | | | 2.44 | % | | | 2.50 | %(i) |
Waiver/Reimbursement | | | 0.04 | % | | | 0.06 | %(i) |
Net investment income (loss) (h) | | | 1.16 | % | | | (2.50 | )%(i) |
Portfolio turnover rate | | | 133 | % | | | 68 | %(f) |
Net assets, end of period (000’s) | | $ | 157 | | | $ | 10 | |
| (a) | The Fund’s Class C shares commenced operations on March 31, 2008. Per share data and total return reflect activity from that date. |
| (b) | Per share data was calculated using the average shares outstanding during the period. |
| (c) | Rounds to less than $0.01 per share. |
| (d) | Had the investment advisor and/or any of its affiliates not waived fees or reimbursed a portion of expenses, total return would have been reduced. |
| (e) | Total return at net asset value assuming all distributions reinvested and no contingent deferred sales charge. |
| (g) | Rounds to less than 0.01%. |
| (h) | The benefits derived from expense reductions had an impact of less than 0.01%. |
See Accompanying Notes to Financial Statements.
137
Financial Highlights – Columbia International Growth Fund
Selected data for a share outstanding throughout each period is as follows:
| | | | | | | | | | | | | | | | | | | | |
| | | Year Ended March 31, | |
| Class Z Shares | | 2009 | | | 2008 (a) | | | 2007 | | | 2006 (i) | | | 2005 (i) | |
Net Asset Value, Beginning of Period | | $ | 18.80 | | | $ | 19.06 | | | $ | 16.51 | | | $ | 13.05 | | | $ | 11.28 | |
| | | | | |
Income from Investment Operations: | | | | | | | | | | | | | | | | | | | | |
Net investment income (b) | | | 0.26 | | | | 0.12 | (c) | | | 0.09 | | | | 0.07 | | | | 0.06 | |
Net realized and unrealized gain (loss) on investments, foreign currency and foreign capital gains tax | | | (8.69 | ) | | | (0.30 | ) | | | 2.54 | | | | 3.51 | | | | 1.71 | |
| | | | | | | | | | | | | | | | | | | | |
Total from Investment Operations | | | (8.43 | ) | | | (0.18 | ) | | | 2.63 | | | | 3.58 | | | | 1.77 | |
| | | | | |
Less Distributions to Shareholders: | | | | | | | | | | | | | | | | | | | | |
From net investment income | | | (0.04 | ) | | | (0.08 | ) | | | (0.08 | ) | | | (0.12 | ) | | | — | (d) |
From net realized gains | | | (1.13 | ) | | | — | | | | — | | | | — | | | | — | |
| | | | | | | | | | | | | | | | | | | | |
Total Distributions to Shareholders | | | (1.17 | ) | | | (0.08 | ) | | | (0.08 | ) | | | (0.12 | ) | | | — | (d) |
| | | | | |
Redemption Fees: | | | | | | | | | | | | | | | | | | | | |
Redemption fees added to paid-in-capital (b)(d) | | | — | | | | — | | | | — | | | | — | | | | — | |
| | | | | |
Increase from Regulatory Settlements | | | — | (d) | | | — | | | | — | | | | — | | | | — | |
| | | | | |
Net Asset Value, End of Period | | $ | 9.20 | | | $ | 18.80 | | | $ | 19.06 | | | $ | 16.51 | | | $ | 13.05 | |
Total return (e)(f) | | | (47.80 | )% | | | (0.95 | )% | | | 16.03 | % | | | 27.70 | % | | | 15.71 | % |
| | | | | |
Ratios to Average Net Assets/Supplemental Data: | | | | | | | | | | | | | | | | | | | | |
Net expenses before interest expense (g) | | | 1.43 | % | | | 1.50 | % | | | 1.50 | % | | | 1.50 | % | | | 1.50 | % |
Interest expense | | | 0.01 | % | | | — | %(h) | | | — | | | | — | | | | — | |
Net expenses (g) | | | 1.44 | % | | | 1.50 | % | | | 1.50 | % | | | 1.50 | % | | | 1.50 | % |
Waiver/Reimbursement | | | 0.04 | % | | | 0.04 | % | | | 0.06 | % | | | 0.08 | % | | | 0.11 | % |
Net investment income (g) | | | 1.81 | % | | | 0.59 | % | | | 0.49 | % | | | 0.52 | % | | | 0.52 | % |
Portfolio turnover rate | | | 133 | % | | | 68 | % | | | 28 | % | | | 26 | % | | | 66 | % |
Net assets, end of period (000’s) | | $ | 165,846 | | | $ | 636,030 | | | $ | 636,941 | | | $ | 522,284 | | | $ | 240,322 | |
| (a) | On March 31, 2008, Shares class of International Fund, a series of Excelsior Funds, Inc., was reorganized into the Fund’s Class Z. The financial information of the Fund’s Class Z includes the financial information of International Fund’s Shares class. |
| (b) | Per share data was calculated using the average shares outstanding during the period. |
| (c) | Net investment income per share reflects a special dividend. The effect of this dividend amounted to $0.04 per share. |
| (d) | Rounds to less than $0.01 per share. |
| (e) | Had the investment advisor and/or any of its affiliates not waived fees or reimbursed a portion of expenses, total return would have been reduced. |
| (f) | Total return at net asset value assuming all distributions reinvested. |
| (g) | The benefits derived from expense reductions had an impact of less than 0.01%. |
| (h) | Rounds to less than 0.01%. |
| (i) | Per share data for the years ended March 31, 2006 and 2005 were audited by other auditors. |
See Accompanying Notes to Financial Statements.
138
Financial Highlights – Columbia Pacific/Asia Fund
Selected data for a share outstanding throughout each period is as follows:
| | | | | | | | |
| Class A Shares | | Year Ended
March 31,
2009 | | | Period Ended
March 31,
2008 (a) | |
Net Asset Value, Beginning of Period | | $ | 9.42 | | | $ | 9.42 | |
| | |
Income from Investment Operations: | | | | | | | | |
Net investment income (loss) (b) | | | 0.11 | | | | — | (c) |
Net realized and unrealized gain (loss) on investments, foreign currency
and foreign capital gains tax | | | (3.35 | ) | | | — | (c) |
| | | | | | | | |
Total from Investment Operations | | | (3.24 | ) | | | — | (c) |
| | |
Less Distributions to Shareholders: | | | | | | | | |
From net investment income | | | (0.04 | ) | | | — | |
From net realized gains | | | (1.32 | ) | | | — | |
| | | | | | | | |
Total Distributions to Shareholders | | | (1.36 | ) | | | — | |
| | |
Redemption Fees: | | | | | | | | |
Redemption fees added to paid-in-capital (b)(c) | | | — | | | | — | |
| | |
Net Asset Value, End of Period | | $ | 4.82 | | | $ | 9.42 | |
Total return (d)(e) | | | (40.21 | )% | | | 0.00 | %(f) |
| | |
Ratios to Average Net Assets/Supplemental Data: | | | | | | | | |
Net expenses before interest expense (g) | | | 1.90 | % | | | 1.82 | %(h) |
Interest expense | | | 0.01 | % | | | — | %(h)(i) |
Net expenses (g) | | | 1.91 | % | | | 1.82 | %(h) |
Waiver/Reimbursement | | | 0.11 | % | | | 0.05 | %(h) |
Net investment income (loss) (g) | | | 1.94 | % | | | (0.80 | )%(h) |
Portfolio turnover rate | | | 111 | % | | | 68 | %(f) |
Net assets, end of period (000’s) | | $ | 175 | | | $ | 10 | |
| (a) | The Fund’s Class A shares commenced operations on March 31, 2008. Per share data and total return reflect activity from that date. |
| (b) | Per share data was calculated using the average shares outstanding during the period. |
| (c) | Rounds to less than $0.01 per share. |
| (d) | Had the investment advisor and/or any of its affiliates not waived fees or reimbursed a portion of expenses, total return would have been reduced. |
| (e) | Total return at net asset value assuming all distributions reinvested and no initial sales charge or contingent deferred sales charge. |
| (g) | The benefits derived from expense reductions had an impact of less than 0.01%. |
| (i) | Rounds to less than 0.01%. |
See Accompanying Notes to Financial Statements.
139
Financial Highlights – Columbia Pacific/Asia Fund
Selected data for a share outstanding throughout each period is as follows:
| | | | | | | | |
| Class C Shares | | Year Ended
March 31,
2009 | | | Period Ended
March 31,
2008 (a) | |
Net Asset Value, Beginning of Period | | $ | 9.42 | | | $ | 9.42 | |
| | |
Income from Investment Operations: | | | | | | | | |
Net investment income (loss) (b) | | | 0.04 | | | | — | (c) |
Net realized and unrealized gain (loss) on investments, foreign currency
and foreign capital gains tax | | | (3.32 | ) | | | — | (c) |
| | | | | | | | |
Total from Investment Operations | | | (3.28 | ) | | | — | (c) |
| | |
Less Distributions to Shareholders: | | | | | | | | |
From net investment income | | | (0.04 | ) | | | — | |
From net realized gains | | | (1.32 | ) | | | — | |
| | | | | | | | |
Total Distributions to Shareholders | | | (1.36 | ) | | | — | |
| | |
Redemption Fees: | | | | | | | | |
Redemption fees added to paid-in-capital (b)(c) | | | — | | | | — | |
| | |
Net Asset Value, End of Period | | $ | 4.78 | | | $ | 9.42 | |
Total return (d)(e) | | | (40.69 | )% | | | 0.00 | %(f) |
| | |
Ratios to Average Net Assets/Supplemental Data: | | | | | | | | |
Net expenses before interest expense (g) | | | 2.65 | % | | | 2.57 | %(h) |
Interest expense | | | 0.01 | % | | | — | %(h)(i) |
Net expenses (g) | | | 2.66 | % | | | 2.57 | %(h) |
Waiver/Reimbursement | | | 0.11 | % | | | 0.05 | %(h) |
Net investment income (loss) (g) | | | 0.87 | % | | | (1.55 | )%(h) |
Portfolio turnover rate | | | 111 | % | | | 68 | %(f) |
Net assets, end of period (000’s) | | $ | 238 | | | $ | 10 | |
| (a) | The Fund’s Class C shares commenced operations on March 31, 2008. Per share data and total return reflect activity from that date. |
| (b) | Per share data was calculated using the average shares outstanding during the period. |
| (c) | Rounds to less than $0.01 per share. |
| (d) | Had the investment advisor and/or any of its affiliates not waived fees or reimbursed a portion of expenses, total return would have been reduced. |
| (e) | Total return at net asset value assuming all distributions reinvested and no contingent deferred sales charge. |
| (g) | The benefits derived from expense reductions had an impact of less than 0.01%. |
| (i) | Rounds to less than 0.01%. |
See Accompanying Notes to Financial Statements.
140
Financial Highlights – Columbia Pacific/Asia Fund
Selected data for a share outstanding throughout each period is as follows:
| | | | | | | | | | | | | | | | | | | | |
| | | Year Ended March 31, | |
| Class Z Shares | | 2009 | | | 2008 (a) | | | 2007 | | | 2006 (i) | | | 2005 (i) | |
Net Asset Value, Beginning of Period | | $ | 9.42 | | | $ | 11.72 | | | $ | 11.61 | | | $ | 8.88 | | | $ | 8.44 | |
| | | | | |
Income from Investment Operations: | | | | | | | | | | | | | | | | | | | | |
Net investment income (loss) (b) | | | 0.10 | | | | 0.05 | | | | — | (c) | | | 0.02 | | | | 0.03 | |
Net realized and unrealized gain (loss) on investments, foreign currency and foreign capital gains tax | | | (3.33 | ) | | | 0.11 | | | | 0.50 | | | | 2.82 | | | | 0.42 | |
| | | | | | | | | | | | | | | | | | | | |
Total from Investment Operations | | | (3.23 | ) | | | 0.16 | | | | 0.50 | | | | 2.84 | | | | 0.45 | |
| | | | | |
Less Distributions to Shareholders: | | | | | | | | | | | | | | | | | | | | |
From net investment income | | | (0.04 | ) | | | (0.08 | ) | | | — | | | | (0.11 | ) | | | (0.01 | ) |
From net realized gains | | | (1.32 | ) | | | (2.38 | ) | | | (0.39 | ) | | | — | | | | — | |
| | | | | | | | | | | | | | | | | | | | |
Total Distributions to Shareholders | | | (1.36 | ) | | | (2.46 | ) | | | (0.39 | ) | | | (0.11 | ) | | | (0.01 | ) |
| | | | | |
Redemption Fees: | | | | | | | | | | | | | | | | | | | | |
Redemption fees added to paid-in-capital (b)(c) | | | — | | | | — | | | | — | | | | — | | | | — | |
| | | | | |
Net Asset Value, End of Period | | $ | 4.83 | | | $ | 9.42 | | | $ | 11.72 | | | $ | 11.61 | | | $ | 8.88 | |
Total return (d) | | | (40.10 | )%(e) | | | (1.11 | )%(e)(f) | | | 4.40 | % | | | 32.35 | %(e) | | | 5.32 | %(e) |
| | | | | |
Ratios to Average Net Assets/Supplemental Data: | | | | | | | | | | | | | | | | | | | | |
Net expenses before interest expense (g) | | | 1.65 | % | | | 1.57 | % | | | 1.61 | % | | | 1.59 | % | | | 1.50 | % |
Interest expense | | | 0.01 | % | | | — | %(h) | | | — | | | | — | | | | — | |
Net expenses (g) | | | 1.66 | % | | | 1.57 | % | | | 1.61 | % | | | 1.59 | % | | | 1.50 | % |
Waiver/Reimbursement | | | 0.11 | % | | | 0.04 | % | | | — | | | | 0.03 | % | | | 0.14 | % |
Net investment income (loss) (g) | | | 1.33 | % | | | 0.39 | % | | | (0.04 | )% | | | 0.22 | % | | | 0.35 | % |
Portfolio turnover rate | | | 111 | % | | | 68 | % | | | 92 | % | | | 68 | % | | | 90 | % |
Net assets, end of period (000’s) | | $ | 24,521 | | | $ | 117,835 | | | $ | 213,132 | | | $ | 243,964 | | | $ | 134,579 | |
| (a) | On March 31, 2008, Shares class of Pacific/Asia Fund, a series of Excelsior Funds, Inc. was reorganized into the Fund’s Class Z. The financial information of the Fund’ Class Z includes the financial information of Pacific/Asia Fund’s Shares class. |
| (b) | Per share data was calculated using the average shares outstanding during the period. |
| (c) | Rounds to less than $0.01 per share. |
| (d) | Total return at net asset value assuming all distributions reinvested. |
| (e) | Had the investment advisor and/or any of its affiliates not waived fees or reimbursed a portion of expenses, total return would have been reduced. |
| (f) | Total return includes a voluntary reimbursement by the investment advisor for a realized investment loss due to a trading error. This reimbursement increased total return and net asset value per share by less than 0.01% and $0.01, respectively. |
| (g) | The benefits derived from expense reductions had an impact of less than 0.01%. |
| (h) | Rounds to less than 0.01%. |
| (i) | Per share data for the years ended March 31, 2006 and 2005 were audited by other auditors. |
See Accompanying Notes to Financial Statements.
141
Notes to Financial Statements – Equity Funds
March 31, 2009
Note 1. Organization
The Columbia Funds Series Trust I (the “Trust”) is a Massachusetts business trust registered under the Investment Company Act of 1940, as amended (the “1940 Act”), as an open-end management investment company. Information presented in these financial statements pertains to the following funds (each, a “Fund” and collectively, the “Funds”), each a series of the Trust:
Columbia Blended Equity Fund
Columbia Energy and Natural Resources Fund
Columbia Mid Cap Core Fund
Columbia Select Large Cap Growth Fund
Columbia Select Opportunities Fund
Columbia Select Small Cap Fund
Columbia Value and Restructuring Fund
Columbia Emerging Markets Fund
Columbia International Growth Fund
Columbia Pacific/Asia Fund
Each Fund is diversified, with the exception of Columbia Energy and Natural Resources Fund, which is non-diversified.
Effective November 1, 2008, Columbia Mid Cap Value and Restructuring Fund was renamed Columbia Mid Cap Core Fund.
Investment Objectives
Each Fund seeks long-term capital appreciation.
Fund Shares
The Trust may issue an unlimited number of shares. Columbia Blended Equity Fund, Columbia Energy and Natural Resources Fund, Columbia Select Opportunities Fund, Columbia Emerging Markets Fund, Columbia International Growth Fund and Columbia Pacific/Asia Fund each offer three classes of shares: Class A, Class C and Class Z. Columbia Mid Cap Core Fund, Columbia Select Large Cap Growth Fund, Columbia Select Small Cap Fund, and Columbia Value and Restructuring Fund each offer four classes of shares: Class A, Class C, Class R and Class Z. Each share class has its own expense structure and sales charges, as applicable.
Class A shares are subject to a maximum front-end sales charge of 5.75% based on the amount of initial investment. Class A shares purchased without an initial sales charge in accounts aggregating $1 million to $50 million at the time of purchase are subject to a 1.00% contingent deferred sales charge (“CDSC”) if the shares are sold within one year after purchase. Class C shares are subject to a 1.00% CDSC on shares sold within one year after purchase. Class R and Class Z shares are offered continuously at net asset value. There are certain restrictions on the purchase of Class R and Class Z shares, as described in each Fund’s prospectus.
Note 2. Significant Accounting Policies
The preparation of financial statements in accordance with accounting principles generally accepted in the United States of America (“GAAP”) requires management to make certain estimates and assumptions that affect the reported amounts of assets and liabilities, the disclosure of contingent assets and liabilities at the date of the financial statements and the reported amounts of revenue and expenses during the reporting period. Actual results could differ from those estimates. Certain ratios have been reclassified on the Financial Highlights to conform to the current period financial statement presentation. The changes have no effect on the ratios. The following is a summary of significant accounting policies consistently followed by the Funds in the preparation of their financial statements.
Security Valuation
Equity securities, exchange-traded funds and securities of certain investments companies are valued at the last sale price on the principal exchange on which they trade, except for securities traded on the NASDAQ, which are valued at the NASDAQ official close price. Unlisted securities or listed securities for which there were no sales during the day are valued at the closing bid price on such exchanges or over-the-counter markets.
Short-term investments maturing in 60 days or less are valued at amortized cost, which approximates market value.
Investments in other open-end investment companies are valued at net asset value.
Purchased options are valued at the last reported sale price, or in the absence of a sale, at the last quoted bid price. Written options are valued at the last reported sale price, or in the absence of a sale, at the last quoted ask price.
142
Equity Funds
March 31, 2009
Forward foreign currency exchange contracts are valued at the prevailing forward exchange rate of the underlying currencies.
Foreign securities are generally valued at the last sale price on the foreign exchange or market on which they trade. If any foreign share prices are not readily available as a result of limited share activity, the securities are valued at the last sale price of the local shares in the principal market in which such securities are normally traded.
Generally, trading in foreign securities is substantially completed each day at various times prior to the close of the New York Stock Exchange (“NYSE”). The values of such securities used in computing the net asset value of the Funds’ shares are determined as of such times. Foreign currency exchange rates are generally determined at 4:00 p.m. Eastern (U.S.) time. Occasionally, events affecting the values of such foreign securities and such exchange rates may occur between the times at which they are determined and the close of the customary trading session of the NYSE, which would not be reflected in the computation of the Funds’ net asset values. If events materially affecting the values of such foreign securities occur and it is determined that market quotations are not reliable, then these foreign securities will be valued at their fair value using procedures approved by the Board of Trustees.
Certain Funds may use a systematic fair valuation model provided by an independent third party to value securities principally traded in foreign markets in order to adjust for possible stale pricing that may occur between the close of the foreign exchanges and the time for valuation.
Investments for which market quotations are not readily available, or that have quotations which management believes are not reliable, are valued at fair value as determined in good faith under consistently applied procedures established by and under the general supervision of the Board of Trustees. If a security is valued at fair value, such value is likely to be different from the last quoted market price for the security.
Security Transactions
Security transactions are accounted for on the trade date. Cost is determined and gains (losses) are based upon the specific identification method for both financial statement and federal income tax purposes.
In March 2008, Statement of Financial Accounting Standards No. 161, Disclosures about Derivative Instruments and Hedging Activities-an amendment of FASB Statement No. 133 (“SFAS 161”), was issued. SFAS 161 is effective for fiscal years and interim periods beginning after November 15, 2008. SFAS 161 requires additional discussion about the reporting entity’s derivative instruments and hedging activities, by providing for qualitative disclosures about the objectives and strategies for using derivatives, quantitative data about the fair value of and gains and losses on derivative contracts, and details of credit-risk-related contingent features in their derivative contracts. Management is evaluating the impact the application of SFAS 161 will have on the Funds’ financial statement disclosures.
Options
Each Fund may write call and put options on securities it owns or in which it may invest. Writing put options tends to increase a Fund’s exposure to the underlying instrument. Writing call options tends to decrease a Fund’s exposure to the underlying instrument. When a Fund writes a call or put option, an amount equal to the premium received is recorded as a liability and subsequently marked-to-market to reflect the current value of the option written. Premiums received from writing options which expire are treated as realized gains. Premiums received from writing options which are exercised or closed are added to the proceeds or offset against the amounts paid on the underlying security transaction to determine the realized gain or loss. Each Fund, as a writer of an option, has no control over whether the underlying security may be sold (call) or purchased (put) and as a result bears the market risk of an unfavorable change in the price of the security underlying the written option. There is the risk that a Fund may not be able to enter into a closing transaction because of an illiquid market. The Funds’ custodian will set aside cash or liquid portfolio securities equal to the amount of the written option contract commitment in a separate account.
Each Fund may also purchase put and call options. Purchasing call options tends to increase a Fund’s exposure to the underlying instrument. Purchasing put options tends to decrease a Fund’s exposure to the underlying instrument. The Funds may pay a premium, which is included in the Funds’ Statements of Assets and Liabilities as an investment and subsequently marked-to-market to reflect the current
143
Equity Funds
March 31, 2009
value of the option. The risk associated with purchasing put and call options is limited to the premium paid. Premiums paid for purchasing options which expire are treated as realized losses. Premiums paid for purchasing options which are exercised are added to the amounts paid (call) or offset against the proceeds (put) on the underlying security to determine the realized gain or loss. If a Fund enters into a closing transaction, the Fund will realize a gain or loss, depending on whether the proceeds from the closing transaction are greater or less than the cost of the option.
Forward Foreign Currency Exchange Contracts
Forward foreign currency exchange contracts are agreements to exchange one currency for another at a future date at a specified price. These contracts are used to minimize the exposure to foreign exchange rate fluctuations during the period between trade and settlement date of the contract. Certain Funds may utilize forward foreign currency exchange contracts in connection with the settlement of purchases and sales of securities. Certain Funds may also enter into these contracts to hedge certain other foreign currency denominated assets. Contracts to buy generally are used to acquire exposure to foreign currencies, while contracts to sell are generally used to hedge the Funds’ investments against currency fluctuations. Forward foreign currency exchange contracts are valued daily at the current exchange rate of the underlying currency, resulting in unrealized gains (losses) which become realized at the time the forward foreign currency exchange contracts are closed or mature. Realized and unrealized gains (losses) arising from such transactions are included in net realized and unrealized gains (losses) on foreign currency transactions. The use of forward foreign currency exchange contracts does not eliminate fluctuations in the prices of the Funds’ portfolio securities. While the maximum potential loss from such contracts is the aggregate face value in U.S. dollars at the time the contract was opened, exposure is typically limited to the change in value of the contract (in U.S. dollars) over the period it remains open. The Funds could also be exposed to risk that counterparties of the contracts may be unable to fulfill the terms of the contracts.
Repurchase Agreements
Each Fund may engage in repurchase agreement transactions with institutions that Columbia Management Advisors, LLC (“Columbia”), the Funds’ investment advisor, has determined are creditworthy. Each Fund, through its custodian, receives delivery of the underlying securities collateralizing a repurchase agreement. Columbia is responsible for determining that the collateral is at least equal, at all times, to the value of the repurchase obligation including interest. A repurchase agreement transaction involves certain risks in the event of default or insolvency of the counterparty. These risks include possible delays in or restrictions on each Fund’s ability to dispose of the underlying securities and a possible decline in the value of the underlying securities during the period while the Funds seek to assert their rights.
Foreign Currency Translations and Transactions
The values of all assets and liabilities quoted in foreign currencies are translated into U.S. dollars at that day’s exchange rates. Net realized and unrealized gains (losses) on foreign currency transactions and translations include gains (losses) arising from the fluctuation in exchange rates between trade and settlement dates on securities transactions, gains (losses) arising from the disposition of foreign currency and currency gains (losses) between the accrual and payment dates on dividends, interest income and foreign withholding taxes.
For financial statement purposes, the Funds do not distinguish that portion of gains (losses) on investments which is due to changes in foreign exchange rates from that which is due to changes in market prices of the investments. Such fluctuations are included with the net realized and unrealized gains (losses) on investments on the Statements of Operations.
Income Recognition
Interest income is recorded on the accrual basis. Premium and discount are amortized and accreted, respectively, on all debt securities, unless otherwise noted.
Corporate actions and dividend income are recorded on the ex-date except for certain foreign securities which are recorded as soon after the ex-date as the Funds become aware of such, net of any non-reclaimable tax withholdings.
Distributions received from real estate investment trusts (REITs) in excess of their income are recorded as a reduction
144
Equity Funds
March 31, 2009
of the cost of the related investments. If the Funds no longer own the applicable securities, any distributions received in excess of income are recorded as realized gains.
Expenses
General expenses of the Trust are allocated to the Funds and other series of the Trust based upon relative net assets or other expense allocation methodologies determined by the nature of the expense. Expenses directly attributable to a Fund are charged to such Fund.
Determination of Class Net Asset Value
All income, expenses (other than class-specific expenses, as shown on the Statements of Operations) and realized and unrealized gains (losses) are allocated to each class of the Funds on a daily basis, based on the relative net assets of each class, for purposes of determining the net asset value of each class.
Federal Income Tax Status
Each Fund intends to qualify each year as a “regulated investment company” under Subchapter M of the Internal Revenue Code, as amended, and will distribute substantially all of its tax-exempt or taxable income, if any, for its tax year, and as such will not be subject to federal income taxes. In addition, each Fund intends to distribute in each calendar year substantially all of its net investment income, capital gains and certain other amounts, if any, such that each Fund should not be subject to federal excise tax. Therefore, no federal income or excise tax provision is recorded.
Foreign Capital Gains Taxes
Realized gains in certain countries may be subject to foreign taxes at the fund level, at rates ranging from approximately 10% to 15%. The Funds accrue for such foreign taxes on net realized and unrealized gains at the appropriate rate for each jurisdiction.
Distributions to Shareholders
Distributions from net investment income, if any, are declared and distributed quarterly for each Fund except Columbia Emerging Markets Fund, Columbia International Growth Fund and Columbia Pacific/Asia Fund, each of which declares and distributes from net investment income semi-annually. Net realized capital gains, if any, are distributed at least annually. Income distributions and capital gain distributions are determined in accordance with federal income tax regulations which may differ from GAAP.
Indemnification
In the normal course of business, each Fund enters into contracts that contain a variety of representations and warranties and which provide general indemnities. A Fund’s maximum exposure under these arrangements is unknown because this would involve future claims against a Fund. Also, under the Trust’s organizational documents and by contract, the Trustees and officers of the Trust are indemnified against certain liabilities that may arise out of actions relating to their duties to the Trust. However, based on experience, the Funds expect the risk of loss due to these representations, warranties and indemnities to be minimal.
Note 3. Federal Tax Information
The timing and character of income and capital gain distributions are determined in accordance with income tax regulations, which may differ from GAAP. Reclassifications are made to each Fund’s capital accounts for permanent tax differences to reflect income and gains available for distribution (or available capital loss carryforwards) under income tax regulations.
145
Equity Funds
March 31, 2009
For the year ended March 31, 2009, permanent book and tax basis differences resulting primarily from differing treatments for net operating losses, foreign currency transactions, passive foreign investment company (“PFIC”) adjustments, distribution reclassifications, foreign capital gains tax and proceeds from litigation settlements were identified and reclassified among the components of the Funds’ net assets as follows:
| | | | | | | | | | | |
| | | | | | | | | |
| | | Undistributed/
(Overdistributed)
Net Investment
Income (Loss) | | | Accumulated Net Realized
Gain (Loss) | | Paid-In
Capital | |
Columbia Blended Equity Fund | | $ | (110,242 | ) | | $ | 110,240 | | $ | 2 | |
Columbia Energy and Natural Resources Fund | | | (63,283 | ) | | | 63,283 | | | — | |
Columbia Mid Cap Core Fund | | | (32,176 | ) | | | 32,176 | | | — | |
Columbia Select Large Cap Growth Fund | | | 3,683,610 | | | | — | | | (3,683,610 | ) |
Columbia Select Opportunities Fund | | | (94,434 | ) | | | 94,434 | | | — | |
Columbia Select Small Cap Fund | | | 1,721,125 | | | | 148,470 | | | (1,869,595 | ) |
Columbia Value and Restructuring Fund | | | (870,216 | ) | | | 870,216 | | | — | |
Columbia Emerging Markets Fund | | | (2,586,124 | ) | | | 2,586,124 | | | — | |
Columbia International Growth Fund | | | (5,468,549 | ) | | | 5,468,549 | | | — | |
Columbia Pacific/Asia Fund | | | (767,121 | ) | | | 767,120 | | | 1 | |
Net investment income and net realized gains (losses), as disclosed on the Statements of Operations, and net assets were not affected by these reclassifications.
The tax character of distributions paid during the years ended March 31, 2009 and March 31, 2008 was as follows:
| | | | | | |
| | | March 31, 2009 |
| | | Ordinary
Income* | | Long-Term Capital Gains |
Columbia Blended Equity Fund | | $ | 1,781,713 | | $ | 21,444,431 |
Columbia Energy and Natural Resources Fund | | | 6,431,347 | | | 5,700,149 |
Columbia Mid Cap Core Fund | | | 825,208 | | | 525,837 |
Columbia Select Large Cap Growth Fund | | | — | | | — |
Columbia Select Opportunities Fund | | | 2,348,282 | | | 5,517,364 |
Columbia Select Small Cap Fund | | | — | | | 21,134,698 |
Columbia Value and Restructuring Fund | | | 112,804,416 | | | 3,642,559 |
Columbia Emerging Markets Fund | | | 78,116 | | | 137,621,724 |
Columbia International Growth Fund | | | 1,206,331 | | | 35,121,685 |
Columbia Pacific/Asia Fund | | | 1,153,529 | | | 14,072,610 |
| * | For tax purposes short-term capital gain distributions, if any, are considered ordinary income distributions. |
146
Equity Funds
March 31, 2009
| | | | | | |
| | | March 31, 2008 |
| | | Ordinary
Income* | | Long-Term Capital Gains |
Columbia Blended Equity Fund | | $ | 4,556,467 | | $ | 69,210,852 |
Columbia Energy and Natural Resources Fund | | | 77,399,927 | | | 23,073,567 |
Columbia Mid Cap Core Fund | | | 4,695,393 | | | 7,570,215 |
Columbia Select Opportunities Fund | | | 2,919,216 | | | 10,631,989 |
Columbia Select Small Cap Fund | | | — | | | 59,032,640 |
Columbia Value and Restructuring Fund | | | 118,123,259 | | | 82,771,279 |
Columbia Emerging Markets Fund | | | 10,407,032 | | | 87,414,862 |
Columbia International Growth Fund | | | 2,909,679 | | | — |
Columbia Pacific/Asia Fund | | | 13,992,471 | | | 22,161,690 |
| * | For tax purposes short-term capital gain distributions, if any, are considered ordinary income distributions. |
As of March 31, 2009, the components of distributable earnings on a tax basis were as follows:
| | | | | | | | | | |
| | | | | | | | |
| | | Undistributed
Ordinary Income | | Undistributed Long-Term Capital Gains | | Net Unrealized Appreciation (Depreciation)* | |
Columbia Blended Equity Fund | | $ | 130,578 | | $ | — | | $ | 44,881,646 | |
Columbia Energy and Natural Resources Fund | | | 521,598 | | | — | | | (52,035,987 | ) |
Columbia Mid Cap Core Fund | | | 102,836 | | | — | | | (3,751,081 | ) |
Columbia Select Large Cap Growth Fund | | | — | | | — | | | (184,430,069 | ) |
Columbia Select Opportunities Fund | | | 100,993 | | | — | | | (9,578,744 | ) |
Columbia Select Small Cap Fund | | | — | | | — | | | (92,637,220 | ) |
Columbia Value and Restructuring Fund | | | 892,850 | | | — | | | (1,466,213,554 | ) |
Columbia Emerging Markets Fund | | | 3,108,001 | | | — | | | 27,757,820 | |
Columbia International Growth Fund | | | 1,853,462 | | | — | | | (48,854,435 | ) |
Columbia Pacific/Asia Fund | | | 163,418 | | | — | | | (10,149,606 | ) |
| * | The differences between book-basis and tax-basis net unrealized appreciation/depreciation are primarily due to deferral of losses from wash sales and PFIC adjustments. |
147
Equity Funds
March 31, 2009
Unrealized appreciation and depreciation at March 31, 2009, based on cost of investments for federal income tax purposes were:
| | | | | | | | | | | |
| | | | | | | | | |
| | | Unrealized Appreciation | | Unrealized Depreciation | | | Net Unrealized Appreciation (Depreciation) | |
Columbia Blended Equity Fund | | $ | 49,335,896 | | $ | (4,454,250 | ) | | $ | 44,881,646 | |
Columbia Energy and Natural Resources Fund | | | 21,348,307 | | | (73,384,294 | ) | | | (52,035,987 | ) |
Columbia Mid Cap Core Fund | | | 3,334,611 | | | (7,085,692 | ) | | | (3,751,081 | ) |
Columbia Select Large Cap Growth Fund | | | 45,614,052 | | | (230,044,121 | ) | | | (184,430,069 | ) |
Columbia Select Opportunities Fund | | | 11,966,440 | | | (21,545,184 | ) | | | (9,578,744 | ) |
Columbia Select Small Cap Fund | | | 27,060,781 | | | (119,698,001 | ) | | | (92,637,220 | ) |
Columbia Value and Restructuring Fund | | | 811,527,955 | | | (2,277,741,509 | ) | | | (1,466,213,554 | ) |
Columbia Emerging Markets Fund | | | 46,336,212 | | | (18,578,392 | ) | | | 27,757,820 | |
Columbia International Growth Fund | | | 5,541,497 | | | (54,395,932 | ) | | | (48,854,435 | ) |
Columbia Pacific/Asia Fund | | | 1,305,680 | | | (11,455,286 | ) | | | (10,149,606 | ) |
The following capital loss carryforwards, determined at March 31, 2009, may be available to reduce taxable income arising from future net realized gains on investments, if any, to the extent permitted by the Internal Revenue Code:
| | | | | | | | | | | | | | | | | | |
| | | | | | | | | | | | | |
| | | Expiring in |
| | | 2011 | | 2012 | | 2013 | | 2014 | | 2017 | | Total |
Columbia Blended Equity Fund | | $ | — | | $ | — | | $ | — | | $ | — | | $ | 1,117,134 | | $ | 1,117,134 |
Columbia Energy and Natural Resources Fund | | | — | | | — | | | — | | | — | | | 62,348,309 | | | 62,348,309 |
Columbia Mid Cap Core Fund | | | — | | | — | | | — | | | — | | | 8,285,858 | | | 8,285,858 |
Columbia Select Large Cap Growth Fund | | | 58,065,667 | | | 22,030,449 | | | 480,165 | | | — | | | 98,833,717 | | | 179,409,998 |
Columbia Select Opportunities Fund | | | — | | | — | | | — | | | — | | | 21,622,838 | | | 21,622,838 |
Columbia Select Small Cap Fund | | | — | | | — | | | — | | | — | | | 13,761,705 | | | 13,761,705 |
Columbia Value and Restructuring Fund | | | — | | | — | | | — | | | — | | | 579,007,867 | | | 579,007,867 |
Columbia Emerging Markets Fund | | | — | | | 1,393,609 | | | — | | | 36,739 | | | 5,702,177 | | | 7,132,525 |
Columbia International Growth Fund | | | 2,840,733 | | | — | | | — | | | — | | | 24,554,073 | | | 27,394,806 |
Columbia Pacific/Asia Fund | | | — | | | — | | | — | | | — | | | 9,165,902 | | | 9,165,902 |
148
Equity Funds
March 31, 2009
Under current tax rules, certain currency and capital losses realized after October 31 may be deferred and treated as occurring on the first day of the following fiscal year. As of March 31, 2009, post-October capital losses deferred to April 1, 2009 were as follows:
| | | |
| | | |
| | | Post-October Loss |
Columbia Blended Equity Fund | | $ | 19,982,481 |
Columbia Energy and Natural Resources Fund | | | 97,628,620 |
Columbia Mid Cap Core Fund | | | 6,444,903 |
Columbia Select Large Cap Growth Fund | | | 77,206,833 |
Columbia Select Opportunities Fund | | | 109,223,602 |
Columbia Select Small Cap Fund | | | 104,721,886 |
Columbia Value and Restructuring Fund | | | 728,820,172 |
Columbia Emerging Markets Fund | | | 27,245,990 |
Columbia International Growth Fund | | | 103,409,517 |
Columbia Pacific/Asia Fund | | | 12,932,884 |
Under Financial Accounting Standards Board (“FASB”) Interpretation No. 48, Accounting for Uncertainty in Income Taxes — an Interpretation of FASB Statement No. 109 (“FIN 48”), management determines whether a tax position of a Fund is more likely than not to be sustained upon examination by the applicable taxing authority, including resolution of any related appeals or litigation processes, based on the technical merits of the position. The tax benefit to be recognized is measured as the largest amount of benefit that is greater than fifty percent likely of being realized upon ultimate settlement. Management has evaluated the known implications of FIN 48 on its computation of net assets for each Fund. As a result of this evaluation, management has concluded that FIN 48 did not have any effect on the Funds’ financial statements. However, management’s conclusions regarding FIN 48 may be subject to review and adjustment at a later date based on factors including, but not limited to, further implementation guidance from the FASB, new tax laws, regulations, and administrative interpretations (including relevant court decisions). The Funds’ federal tax returns for the prior three fiscal years remain subject to examination by the Internal Revenue Service. The Funds are not aware of any tax positions for which it is reasonably possible that the total amounts of unrecognized tax benefits will significantly change in the next twelve months.
149
Equity Funds
March 31, 2009
Note 4. Fees and Compensation Paid to Affiliates
Investment Advisory Fee
Columbia, an indirect, wholly owned subsidiary of Bank of America Corporation (“BOA”) provides investment advisory services to the Funds. In rendering investment advisory services to the Funds, Columbia may use the portfolio management and research resources of Columbia Management Pte. Ltd., an affiliate of Columbia. Columbia receives a monthly investment advisory fee based on each Fund’s average daily net assets at the following annual rates:
| | | | | | | | | | | | | | | | | | | | | | | | |
| | | | | | | | | | | | | | | | | | | | | | | | | |
| | | First
$500
Million | | | $500
Million to
$750
Million | | | $750
Million to
$1 Billion | | | $1 Billion to $1.5
Billion | | | $1.5
Billion to
$3 Billion | | | $3 Billion
to $6 Billion | | | $6 Billion to $10
Billion | | | Over $10
Billion | |
Columbia Blended Equity Fund | | 0.75 | % | | 0.57 | % | | 0.57 | % | | 0.52 | % | | 0.47 | % | | 0.45 | % | | 0.43 | % | | 0.43 | % |
Columbia Energy and Natural Resources Fund | | 0.60 | % | | 0.60 | % | | 0.60 | % | | 0.52 | % | | 0.47 | % | | 0.45 | % | | 0.43 | % | | 0.43 | % |
Columbia Mid Cap Core Fund | | 0.65 | % | | 0.65 | % | | 0.65 | % | | 0.57 | % | | 0.52 | % | | 0.52 | % | | 0.52 | % | | 0.52 | % |
Columbia Select Large Cap Growth Fund | | 0.75 | % | | 0.75 | % | | 0.75 | % | | 0.52 | % | | 0.47 | % | | 0.45 | % | | 0.43 | % | | 0.43 | % |
Columbia Select Opportunities Fund | | 0.75 | % | | 0.57 | % | | 0.57 | % | | 0.52 | % | | 0.47 | % | | 0.45 | % | | 0.43 | % | | 0.43 | % |
Columbia Select Small Cap Fund | | 0.75 | % | | 0.75 | % | | 0.75 | % | | 0.62 | % | | 0.62 | % | | 0.62 | % | | 0.62 | % | | 0.62 | % |
Columbia Value and Restructuring Fund | | 0.60 | % | | 0.60 | % | | 0.60 | % | | 0.60 | % | | 0.60 | % | | 0.60 | % | | 0.60 | % | | 0.43 | % |
Columbia Emerging Markets Fund | | 1.15 | % | | 1.15 | % | | 1.00 | % | | 0.67 | % | | 0.62 | % | | 0.57 | % | | 0.52 | % | | 0.52 | % |
Columbia International Growth Fund | | 0.95 | % | | 0.62 | % | | 0.62 | % | | 0.57 | % | | 0.52 | % | | 0.50 | % | | 0.48 | % | | 0.48 | % |
Columbia Pacific/Asia Fund | | 0.75 | % | | 0.75 | % | | 0.75 | % | | 0.67 | % | | 0.62 | % | | 0.57 | % | | 0.52 | % | | 0.52 | % |
Prior to November 1, 2008, Columbia was entitled to receive a monthly investment advisory fee for the following Funds at the following annual rates:
| | | | | | | | | | | | | | | | | | |
| | | | | | | | | | | | | | | | | | | |
| | | First
$500
Million | | | $500
Million to
$1 Billion | | | $1 Billion to $1.5
Billion | | | $1.5
Billion to
$3 Billion | | | $3 Billion
to $6
Billion | | | Over $6
Billion | |
Columbia Emerging Markets Fund | | 1.25 | % | | 1.25 | % | | 1.25 | % | | 0.62 | % | | 0.57 | % | | 0.52 | % |
Columbia International Growth Fund | | 1.00 | % | | 1.00 | % | | 0.57 | % | | 0.52 | % | | 0.50 | % | | 0.48 | % |
Columbia Pacific/Asia Fund | | 1.00 | % | | 0.75 | % | | 0.67 | % | | 0.62 | % | | 0.57 | % | | 0.52 | % |
150
Equity Funds
March 31, 2009
For the year period ended March 31, 2009, the effective investment advisory fee rates for the Funds, as a percentage of each Funds’ average daily net assets, were as follows:
| | | |
| | | | |
| | | Effective Fee Rate | |
Columbia Blended Equity Fund | | 0.75 | % |
Columbia Energy and Natural Resources Fund | | 0.60 | % |
Columbia Mid Cap Core Fund | | 0.65 | % |
Columbia Select Large Cap Growth Fund | | 0.75 | % |
Columbia Select Opportunities Fund | | 0.75 | % |
Columbia Select Small Cap Fund | | 0.75 | % |
Columbia Value and Restructuring Fund | | 0.60 | % |
Columbia Emerging Markets Fund | | 1.24 | % |
Columbia International Growth Fund | | 0.99 | % |
Columbia Pacific/Asia Fund | | 0.96 | % |
Administration Fee
Columbia provides administrative and other services to the Funds for a monthly administration fee based on each Fund’s average daily net assets at the annual rates less the fees payable by the Funds as described under the Pricing and Bookkeeping Fees note below:
| | | |
| | | | |
| | | Annual Fee Rate | |
Columbia Blended Equity Fund | | 0.15 | % |
Columbia Energy and Natural Resources Fund | | 0.15 | % |
Columbia Mid Cap Core Fund | | 0.15 | % |
Columbia Select Large Cap Growth Fund | | 0.15 | % |
Columbia Select Opportunities Fund | | 0.15 | % |
Columbia Select Small Cap Fund | | 0.15 | % |
Columbia Value and Restructuring Fund | | 0.15 | % |
Columbia Emerging Markets Fund | | 0.20 | % |
Columbia International Growth Fund | | 0.20 | % |
Columbia Pacific/Asia Fund | | 0.20 | % |
Prior to January 12, 2009, Columbia voluntarily waived administration fees payable by the Funds at the annual rate of 0.05% of each Fund’s average daily net assets.
Pricing and Bookkeeping Fees
The Funds have entered into a Financial Reporting Services Agreement (the “Financial Reporting Services Agreement”) with State Street Bank & Trust Company (“State Street”) and Columbia pursuant to which State Street provides financial reporting services to the Funds. The Funds have also entered into an Accounting Services Agreement (collectively with the Financial Reporting Services Agreement, the “State Street Agreements”) with State Street and Columbia pursuant to which State Street provides accounting services to the Funds. Under the State Street Agreements, each Fund pays State Street an annual fee of $38,000 paid monthly plus an additional monthly fee based on an annualized percentage rate of average daily net assets of each Fund for the month. The aggregate fee for each Fund will not exceed $140,000 per year (exclusive of out-of-pocket expenses and charges). The Funds also reimburse State Street for certain out-of-pocket expenses and charges.
The Funds have entered into a Pricing and Bookkeeping Oversight and Services Agreement (the “Services Agreement”) with Columbia. Under the Services Agreement, Columbia provides services related to Fund expenses and the requirements of the Sarbanes-Oxley Act of 2002, and provides oversight of the accounting and financial reporting services provided by State Street. Under the Services Agreement, the Funds reimburse Columbia for out-of-pocket expenses.
Transfer Agent Fee
Columbia Management Services, Inc. (the “Transfer Agent”), an affiliate of Columbia and an indirect, wholly owned subsidiary of BOA, provides shareholder services to the Funds and has contracted with Boston Financial Data Services (“BFDS”) to serve as sub-transfer agent. The Transfer Agent is entitled to receive a fee for its services, paid monthly, at the annual rate of $17.34 per open account plus reimbursement of certain sub-transfer agent fees paid by the Transfer Agent (exclusive of BFDS fees), calculated based on assets held in omnibus accounts and intended to recover the cost of payments to other parties (including affiliates of BOA) for services to those accounts. The Transfer Agent pays the fees of BFDS for services as sub-transfer agent and is not entitled to reimbursement for such fees from the Funds.
151
Equity Funds
March 31, 2009
The Transfer Agent may also retain, as additional compensation for its services, fees for wire, telephone and redemption orders, Individual Retirement Account (“IRA”) trustee agent fees and account transcript fees due to the Transfer Agent from shareholders of the Funds and credits (net of bank charges) earned with respect to balances in accounts the Transfer Agent maintains in connection with its services to the Funds. The Transfer Agent also receives reimbursement for certain out-of-pocket expenses.
An annual minimum account balance fee of $20 may apply to certain accounts with a value below each Fund’s initial minimum investment requirements to reduce the impact of small accounts on transfer agent fees. These minimum account balance fees are recorded as part of expense reductions on the Statements of Operations. For the year ended March 31, 2009, these minimum account balance fees reduced total expenses of the Funds as follows:
| | | |
| | | |
| | | Minimum Account
Balance Fee |
Columbia Blended Equity Fund | | $ | 7,816 |
Columbia Energy and Natural Resources Fund | | | 8,400 |
Columbia Mid Cap Core Fund | | | 6,837 |
Columbia Select Large Cap Growth Fund | | | 8,043 |
Columbia Select Opportunities Fund | | | 760 |
Columbia Select Small Cap Fund | | | 6,001 |
Columbia Value and Restructuring Fund | | | 58,518 |
Columbia Emerging Markets Fund | | | 5,369 |
Columbia International Growth Fund | | | 4,476 |
Columbia Pacific/Asia Fund | | | 2,060 |
Underwriting Discounts, Service and Distribution Fees
Columbia Management Distributors, Inc. (the “Distributor”) an affiliate of Columbia and an indirect, wholly owned subsidiary of BOA, is the principal underwriter of the Funds’ shares. For the year ended March 31, 2009, the Distributor has retained net underwriting discounts on the sale of Class A shares and received net CDSC fees on Class A and Class C share redemptions as follows:
| | | | | | | | | |
| | | Front-End
Sales Charge | | CDSC |
| | | Class A | | Class A | | Class C |
Columbia Blended Equity Fund | | $ | 1 | | $ | — | | $ | 26 |
Columbia Energy and Natural Resources Fund | | | 37,466 | | | 1 | | | 5,557 |
Columbia Mid Cap Core Fund | | | 339 | | | — | | | — |
Columbia Select Large Cap Growth Fund | | | 5,689 | | | 16,615 | | | 1,487 |
Columbia Select Opportunities Fund | | | 4,751 | | | — | | | 208 |
Columbia Select Small Cap Fund | | | 2,385 | | | — | | | 2,721 |
Columbia Value and Restructuring Fund | | | 239,034 | | | 88,355 | | | 53,825 |
Columbia Emerging Markets Fund | | | 4,215 | | | 230 | | | 356 |
Columbia International Growth Fund | | | 385 | | | — | | | — |
Columbia Pacific/Asia Fund | | | 109 | | | — | | | — |
The Trust has adopted distribution and shareholder servicing plans (the “Plans”) pursuant to Rule 12b-1 under the 1940 Act, which require the payment of distribution and service fees. The fees are intended to compensate the Distributor and/or eligible selling and/or servicing agents for selling shares of the Funds and providing services to investors. The Plans require the payment of a monthly service fee to the Distributor at the annual rate of 0.25% of the average daily net assets attributable to Class A and Class C shares of each Fund. The Plans also require the payment of a monthly distribution fee to the Distributor at the annual rate of 0.75% and 0.50% of the average daily net assets attributable to Class C and Class R shares, respectively, of each Fund.
Expense Limits and Fee Waivers
Columbia has contractually agreed to bear a portion of the Funds’ expenses through July 31, 2009, so that the Funds’ ordinary operating expenses (excluding any distribution and service fees, brokerage commissions, interest, taxes and extraordinary expenses, but including custodian charges relating to overdrafts, if any), after giving effect to any
152
Equity Funds
March 31, 2009
balance credits from the Funds’ custodian, do not exceed the following annual rates, based on each Fund’s average daily net assets:
| | | |
| | | | |
| | | Annual Rates | |
Columbia Blended Equity Fund | | 1.10 | % |
Columbia Energy and Natural Resources Fund | | 1.25 | % |
Columbia Mid Cap Core Fund | | 1.02 | % |
Columbia Select Large Cap Growth Fund | | 1.08 | % |
Columbia Select Opportunities Fund | | 0.82 | % |
Columbia Select Small Cap Fund | | 1.25 | % |
Columbia Value and Restructuring Fund | | 0.98 | % |
Columbia Emerging Markets Fund | | 1.70 | % |
Columbia International Growth Fund | | 1.50 | % |
Columbia Pacific/Asia Fund | | 1.65 | % |
Effective August 1, 2009, Columbia has voluntarily agreed to bear a portion of the Funds’ expenses so that the Funds’ ordinary operating expenses (excluding any distribution and service fees, brokerage commissions, interest, taxes and extraordinary expenses, but including custodian charges relating to overdrafts, if any), after giving effect to any balance credits from the Funds’ custodian, do not exceed the following annual rates, based on each Fund’s average daily net assets:
| | | |
| | |
| | | Annual Rate | |
Columbia Blended Equity Fund | | 1.00 | % |
Columbia Energy and Natural Resources Fund | | 1.20 | % |
Columbia Mid Cap Core Fund | | 1.05 | % |
Columbia Select Large Cap Growth Fund | | 1.00 | % |
Columbia Select Opportunities Fund | | 1.00 | % |
Columbia Select Small Cap Fund | | 1.10 | % |
Columbia Value and Restructuring Fund | | 1.00 | % |
Columbia Emerging Markets Fund | | 1.40 | % |
Columbia International Growth Fund | | 1.15 | % |
Columbia Pacific/Asia Fund | | 1.40 | % |
Fees Paid to Officers and Trustees
All officers of the Funds are employees of Columbia or its affiliates and, with the exception of the Funds’ Chief Compliance Officer, receive no compensation from the Funds. The Board of Trustees has appointed a Chief Compliance Officer to the Funds in accordance with federal securities regulations. The Funds, along with other affiliated funds, pay their pro-rata share of the expenses associated with the Chief Compliance Officer. Each Fund’s expenses for the Chief Compliance Officer will not exceed $15,000 per year.
The Trust’s eligible Trustees may participate in a deferred compensation plan which may be terminated at any time. Obligations of the plan will be paid solely out of the Funds’ assets.
As a result of fund mergers, certain Funds assumed the liabilities of the deferred compensation plan of the acquired fund, which are included in “Trustees’ fees” on the Statements of Assets and Liabilities. The deferred compensation plan may be terminated at any time. Any payments to plan participants are paid solely out of the Funds’ assets.
Other Related Party Transactions
In connection with the purchase and sale of its securities during the period, the Funds used several brokers that are affiliates of BOA. Total brokerage commissions paid to affiliated brokers for the year ended March 31, 2009 were as follows:
| | | | | | |
| |
| | | Broker | | | Amount |
Columbia Mid Cap Core
Fund | | Merrill Lynch | * | | $ | 673 |
Columbia Select Small Cap
Fund | | Merrill Lynch | * | | | 588 |
| * | Effective January 1, 2009, Merrill Lynch is a wholly owned subsidiary of Bank of America Corporation and an affiliate of Columbia Management. |
Note 5. Custody Credits
Each Fund has an agreement with its custodian bank under which custody fees may be reduced by balance credits. These credits are recorded as part of expense reductions on the Statements of Operations. The Funds could have invested a portion of the assets utilized in connection with the expense offset arrangement in an income-producing asset if they had not entered into such an agreement.
153
Equity Funds
March 31, 2009
For the year ended March 31, 2009, these custody credits reduced total expenses for the Funds as follows:
| | | |
| | | |
| | | Custody Credits |
Columbia Blended Equity Fund | | $ | 690 |
Columbia Energy and Natural Resources Fund | | | 3,629 |
Columbia Mid Cap Core Fund | | | 161 |
Columbia Select Large Cap Growth Fund | | | 2,981 |
Columbia Select Opportunities Fund | | | 966 |
Columbia Select Small Cap Fund | | | 3,904 |
Columbia Value and Restructuring Fund | | | 6,530 |
Columbia Emerging Markets Fund | | | 1,607 |
Columbia International Growth Fund | | | 4 |
Note 6. Portfolio Information
For the year ended March 31, 2009, the cost of purchases and proceeds from sales of securities, excluding short-term obligations, for the Funds were as follows:
| | | | | | |
| | | | | |
| | | Purchases | | Sales |
Columbia Blended Equity Fund | | $ | 91,027,439 | | $ | 135,238,260 |
Columbia Energy and Natural Resources Fund | | | 2,662,147,247 | | | 2,669,187,396 |
Columbia Mid Cap Core Fund | | | 177,370,565 | | | 263,903,252 |
Columbia Select Large Cap Growth Fund | | | 896,091,297 | | | 538,199,442 |
Columbia Select Opportunities Fund | | | 188,636,750 | | | 264,497,555 |
Columbia Select Small Cap Fund | | | 362,793,060 | | | 419,267,299 |
Columbia Value and Restructuring Fund | | | 1,587,273,938 | | | 940,700,743 |
Columbia Emerging Markets Fund | | | 455,201,670 | | | 864,505,288 |
Columbia International Growth Fund | | | 521,522,295 | | | 744,420,828 |
Columbia Pacific/Asia Fund | | | 73,724,855 | | | 133,687,244 |
Note 7. Redemption Fees
Columbia Emerging Markets Fund, Columbia International Growth Fund and Columbia Pacific/Asia Fund each may impose a 2.00% redemption fee on the proceeds of fund shares that are redeemed within 60 days of purchase. The redemption fees are designed to offset brokerage commissions and other costs associated with short term trading of the portfolio. The redemption fees, which are retained by the Funds, are accounted for as an addition to paid-in capital and are allocated to each class based on the relative net assets at the time of the redemption. For the year ended March 31, 2009, the Funds assessed redemption fees as follows:
| | | |
| | | |
Columbia Emerging Markets Fund | | $ | 55,618 |
Columbia International Growth Fund | | | 9,839 |
Columbia Pacific/Asia Fund | | | 576 |
Note 8. Regulatory Settlements
As of March 31, 2009, Columbia Select Large Cap Growth Fund, Columbia Select Small Cap Fund, Columbia Value and Restructuring Fund and Columbia International Growth were entitled to receive payments of $13,882, $146,495, $47,297 and $150,489, respectively relating to certain regulatory settlements the Funds have participated in during the year. The payments have been included in “Increase from regulatory settlements” on the Statements of Changes in Net Assets.
Note 9. Line of Credit
The Funds and other affiliated funds participate in a $280,000,000 committed, unsecured revolving line of credit provided by State Street. The maximum amount that may be borrowed by any fund is limited to the lesser of $200,000,000 and the Fund’s borrowing limit set forth in the Fund’s registration statement. Borrowings are available for short-term liquidity or temporary or emergency purposes.
Interest is charged to each participating fund based on the fund’s borrowings at a rate per annum equal to the greater of the Federal Funds Rate plus 0.50% or the overnight LIBOR Rate plus 0.50%. In addition, an annual operations agency fee of $20,000, an amendment fee of 0.02% and a commitment fee of 0.12% per annum are accrued and apportioned among the participating funds pro rata based on their relative net assets.
154
Equity Funds
March 31, 2009
Prior to October 16, 2008, the Funds and other affiliated funds participated in a $350,000,000 committed, unsecured revolving line of credit and a $150,000,000 uncommitted, unsecured line of credit, both provided by State Street. Interest on the committed line of credit was charged to each participating fund based on the fund’s borrowings at a rate per annum equal to the Federal Funds Rate plus 0.50%. In addition, a commitment fee of 0.10% per annum was accrued and apportioned among the participating funds pro rata based on their relative net assets. Interest on the uncommitted line of credit was charged to each participating fund based on the fund’s borrowings at a rate per annum equal to the Federal Funds Rate plus 0.375%. State Street charged an annual operations agency fee of $40,000 for the committed line of credit and was able to charge an annual administration fee of $15,000 for the uncommitted line of credit. The commitment fee, the operations agency fee and the administration fee were accrued and apportioned among the participating funds pro rata based on their relative net assets.
For the year ended March 31, 2009, the average daily loan balance outstanding on days where borrowing existed, and the weighted average interest rate of each Fund that borrowed were as follows:
| | | | | | |
| | | | | | |
| | | Average
Borrowing | | Weighted
Average
Interest
Rate | |
Columbia Blended Equity Fund | | $ | 1,000,000 | | 1.375 | % |
Columbia Mid Cap Core Fund | | | 1,000,000 | | 1.613 | |
Columbia Select Large Cap Growth Fund | | | 2,666,667 | | 2.223 | |
Columbia Select Opportunities Fund | | | 1,773,171 | | 1.262 | |
Columbia Select Small Cap Fund | | | 2,081,609 | | 1.169 | |
Columbia Value and Restructuring Fund | | | 10,383,962 | | 0.867 | |
Columbia Emerging Markets Fund | | | 7,323,656 | | 2.171 | |
Columbia International Growth Fund | | | 4,255,556 | | 1.149 | |
Columbia Pacific/Asia Fund | | | 2,052,632 | | 1.376 | |
Note 10. Shares of Beneficial Interest
As of March 31, 2009, the Funds had shareholders whose shares were beneficially owned by participant accounts over which BOA and/or any of its affiliates had either sole or joint investment discretion. The percentages of shares of beneficial interest outstanding held therein are as follows:
| | |
| | | |
| | | % of Shares Outstanding Held |
Columbia Blended Equity Fund | | 46.5% |
Columbia Energy and Natural Resources Fund | | 16.2 |
Columbia Mid Cap Core Fund | | 48.4 |
Columbia Select Large Cap Growth Fund | | 71.5 |
Columbia Select Opportunities Fund | | 81.2 |
Columbia Select Small Cap Fund | | 47.9 |
Columbia Value and Restructuring Fund | | 17.9 |
Columbia Emerging Markets | | 25.1 |
Columbia International Growth Fund | | 79.1 |
Columbia Pacific/Asia Fund | | 64.4 |
As of March 31, 2009, the Funds had shareholders that held greater than 5% of the shares outstanding of a Fund, over which BOA and/or any of its affiliates did not have investment discretion. The number of accounts and the percentages of shares of beneficial interest outstanding held therein are as follows:
| | | | | |
| | | | | | |
| | | Number of
Shareholders | | % of Shares Outstanding Held | |
Columbia Blended Equity Fund | | 1 | | 16.2 | % |
Columbia Energy and Natural Resources Fund | | 1 | | 32.7 | |
Columbia Mid Cap Core Fund | | 1 | | 20.5 | |
Columbia Select Opportunities Fund | | 1 | | 10.2 | |
Columbia Select Small Cap Fund | | 1 | | 10.9 | |
155
Equity Funds
March 31, 2009
| | | | | |
| | | | | | |
| | | Number of
Shareholders | | % of Shares Outstanding Held | |
Columbia Value and Restructuring Fund | | 2 | | 38.8 | % |
Columbia Emerging Markets | | 4 | | 50.8 | |
Columbia International Growth Fund | | 1 | | 8.2 | |
Columbia Pacific/Asia Fund | | 1 | | 12.4 | |
Subscription and redemption activity of these accounts may have a significant effect on the operations of the Funds.
Note 11. Significant Risks and Contingencies
Non-Diversification Risk
As a non-diversified mutual fund, Columbia Energy and Natural Resources Fund is permitted to invest a greater percentage of its total assets in the securities of fewer issuers than a diversified fund. The Fund may, therefore, have a greater risk of loss from a few issuers than a similar fund that invests more broadly.
Foreign Securities Risk
There are certain additional risks involved when investing in foreign securities. These risks may involve foreign currency exchange rate fluctuations, adverse political and economic developments and the possible prevention of currency exchange or other foreign governmental laws or restrictions. In addition, the liquidity of foreign securities may be more limited than that of domestic securities.
Investments in emerging market countries are subject to additional risk. The risk of foreign investments is typically increased in less developed countries. These countries are also more likely to experience high levels of inflation, deflation or currency devaluation which could hurt their economies and securities markets.
Geographic Concentration Risk
Because Columbia Pacific/Asia Fund’s investments are concentrated in the Asia/Pacific region, events within the region will have a greater effect on the Fund than if the Fund were more geographically diversified. In addition, events in any one country within the region may impact the other countries or the region as a whole. Markets in the region can experience significant volatility due to social, regulatory and political uncertainties.
Legal Proceedings
Columbia Management Advisors, LLC and Columbia Management Distributors, Inc. (collectively, the “Columbia Group”) are subject to a settlement agreement with the New York Attorney General (“NYAG”) (the “NYAG Settlement”) and a settlement order with the SEC (the “SEC Order”) on matters relating to mutual fund trading, each dated February 9, 2005. Under the terms of the SEC Order, the Columbia Group (or predecessor entities) agreed, among other things, to: pay disgorgement and civil money penalties collectively totaling $140 million; cease and desist from violations of the antifraud provisions and certain other provisions of the federal securities laws; maintain certain compliance and ethics oversight structures; and retain an independent consultant to review the Columbia Group’s applicable supervisory, compliance, control and other policies and procedures. The NYAG Settlement, among other things, requires Columbia Management Advisors, LLC and its affiliates to reduce management fees for certain funds in the Columbia family of mutual funds in a projected total of $160 million over five years through November 30, 2009 and to make certain disclosures to investors relating to expenses. In connection with the Columbia Group providing services to the Columbia Funds, the Columbia Funds have voluntarily undertaken to implement certain governance measures designed to maintain the independence of their boards of trustees and certain special consulting and compliance measures.
Pursuant to the SEC Order and related procedures, the $140 million in settlement amounts described above has been substantially distributed in accordance with a distribution plan that was developed by an independent distribution consultant and approved by the SEC on April 6, 2007.
In connection with the events described above, various parties have filed suit against certain funds, the Trustees of the Columbia Funds, FleetBoston Financial Corporation and its affiliated entities and/or Bank of America and its affiliated entities.
On February 20, 2004, the Judicial Panel on Multidistrict Litigation transferred these cases and cases against other
156
Equity Funds
March 31, 2009
mutual fund companies based on similar allegations to the United States District Court in Maryland for consolidated or coordinated pretrial proceedings (the “MDL”). Subsequently, additional related cases were transferred to the MDL. On September 29, 2004, the plaintiffs in the MDL filed amended and consolidated complaints. One of these amended complaints is a putative class action that includes claims under the federal securities laws and state common law, and that names Columbia Management Advisors, Inc. (which has since merged into Banc of America Capital Management, LLC (now named Columbia Management Advisors, LLC)) (“Columbia”), Columbia Funds Distributor, Inc. (now named Columbia Management Distributors, Inc.) (the “Distributor”), the Trustees of the Columbia Funds, Bank of America Corporation and others as defendants. Another of the amended complaints is a derivative action purportedly on behalf of the Columbia Funds that asserts claims under federal securities laws and state common law.
On February 25, 2005, Columbia and other defendants filed motions to dismiss the claims in the pending cases. On March 1, 2006, for reasons stated in the court’s memoranda dated November 3, 2005, the United States District Court for the District of Maryland granted in part and denied in part the defendants’ motions to dismiss. The court dismissed all of the class action claims pending against the Columbia Funds Trusts. As to Columbia and the Distributor, the claims under the Securities Act of 1933, the claims under Sections 34(b) and 36(a) of the Investment Company Act of 1940 (“ICA”) and the state law claims were dismissed. The claims under Sections 10(b) and 20(a) of the Securities Exchange Act of 1934 and claims under Section 36(b) of the ICA were not dismissed.
On March 21, 2005, a purported class action was filed in Massachusetts state court alleging that certain conduct, including market timing, entitled Class B shareholders in certain Columbia Funds to an exemption from contingent deferred sales charges upon early redemption (the “CDSC Lawsuit”). The CDSC Lawsuit was removed to federal court in Massachusetts and transferred to the MDL.
On September 14, 2007, the plaintiffs and the Columbia defendants named in the MDL, including the Columbia Funds, entered into a stipulation of settlement with respect to all Columbia-related claims in the MDL described above, including the CDSC Lawsuit. The settlement is subject to court approval.
Note 12. Business Combinations and Mergers
As of the close of business on March 31, 2008, International Equity Fund, a series of Excelsior Funds Trust, merged into Columbia International Growth Fund. Columbia International Growth Fund received a tax-free transfer of assets from International Equity Fund as follows:
| | | | |
| | | | | |
| Shares Issued | | Net Assets
Received | | Unrealized
Appreciation1 |
| 3,106,495 | | $58,118,017 | | $6,986,733 |
| | | | |
| | | | | |
Net Assets
of International
Fund Prior to
Combination | | Net Assets of
Columbia
International
Growth Fund
Immediately Prior
to Combination | | Net Assets of
Columbia
International
Growth Fund
Immediately
After
Combination |
| $576,762,592 | | $58,118,017 | | $634,880,609 |
1 | Unrealized appreciation is included in the Net Assets Received. |
157
Report of Independent Registered Public Accounting Firm
To the Board of Trustees and Shareholders of Columbia Funds Series Trust I
In our opinion, the accompanying statements of assets and liabilities, including the portfolios of investments, and the related statements of operations and of changes in net assets and the financial highlights present fairly, in all material respects, the financial position of the Columbia Blended Equity Fund, Columbia Energy and Natural Resources Fund, Columbia Mid Cap Core Fund, Columbia Select Large Cap Growth Fund, Columbia Select Opportunities Fund, Columbia Select Small Cap Fund, Columbia Value and Restructuring Fund, Columbia Emerging Markets Fund, Columbia International Growth Fund and Columbia Pacific/Asia Fund (each a series of Columbia Funds Series Trust I and hereafter collectively referred to as the “Funds”) at March 31, 2009, and the results of each of their operations for the year then ended, the changes in each of their net assets for each of the two years in the period then ended, and the financial highlights for each of the periods indicated in conformity with accounting principles generally accepted in the United States of America. These financial statements and financial highlights (hereafter referred to as “financial statements”) are the responsibility of the Funds’ management; our responsibility is to express an opinion on these financial statements based on our audits. We conducted our audits of these financial statements in accordance with the standards of the Public Company Accounting Oversight Board (United States). Those standards require that we plan and perform the audit to obtain reasonable assurance about whether the financial statements are free of material misstatement. An audit includes examining, on a test basis, evidence supporting the amounts and disclosures in the financial statements, assessing the accounting principles used and significant estimates made by management, and evaluating the overall financial statement presentation. We believe that our audits, which included confirmation of securities at March 31, 2009 by correspondence with the custodian and brokers, provide a reasonable basis for our opinion. The financial highlights of the Funds for each of the two years in the period ended March 31, 2006 were audited by other auditors whose report dated May 22, 2006 expressed an unqualified opinion on those highlights.
PricewaterhouseCoopers LLP
Boston, Massachusetts
May 22, 2009
158
Federal Income Tax Information (Unaudited) – Equity Funds
Columbia Blended Equity Fund
100.00% of the ordinary dividend income distributed by the Fund, for the year ended March 31, 2009, qualifies for the corporate dividends received deduction.
For non-corporate shareholders 100.00% or the maximum amount allowable under the Jobs and Growth Tax Relief Reconciliation Act of 2003, of ordinary income distributed by the Fund for the period April 1, 2008 to March 31, 2009 may represent qualified dividend income. Final information will be provided in your 2009 Form 1099-DIV.
Columbia Energy and Natural Resources Fund
6.95% of the ordinary dividend income distributed by the Fund, for the year ended March 31, 2009, qualifies for the corporate dividends received deduction.
For non-corporate shareholders 9.32% or the maximum amount allowable under the Jobs and Growth Tax Relief Reconciliation Act of 2003, of ordinary income distributed by the Fund for the period April 1, 2008 to March 31, 2009 may represent qualified dividend income. Final information will be provided in your 2009 Form 1099-DIV.
Columbia Mid Cap Core Fund
100.00% of the ordinary dividend income distributed by the Fund, for the year ended March 31, 2009, qualifies for the corporate dividends received deduction.
For non-corporate shareholders 100.00% or the maximum amount allowable under the Jobs and Growth Tax Relief Reconciliation Act of 2003, of ordinary income distributed by the Fund for the period April 1, 2008 to March 31, 2009 may represent qualified dividend income. Final information will be provided in your 2009 Form 1099-DIV.
Columbia Select Opportunities Fund
100.00% of the ordinary dividend income distributed by the Fund, for the year ended March 31, 2009, qualifies for the corporate dividends received deduction.
For non-corporate shareholders 100.00% or the maximum amount allowable under the Jobs and Growth Tax Relief Reconciliation Act of 2003, of ordinary income distributed by the Fund for the period April 1, 2008 to March 31, 2009 may represent qualified dividend income. Final information will be provided in your 2009 Form 1099-DIV.
Columbia Value and Restructuring Fund
100.00% of the ordinary dividend income distributed by the Fund, for the year ended March 31, 2009, qualifies for the corporate dividends received deduction.
For non-corporate shareholders 100.00% or the maximum amount allowable under the Jobs and Growth Tax Relief Reconciliation Act of 2003, of ordinary income distributed by the Fund for the period April 1, 2008 to March 31, 2009 may represent qualified dividend income. Final information will be provided in your 2009 Form 1099-DIV.
Columbia Emerging Markets Fund
Foreign taxes paid during the period ended March 31, 2009, of $1,641,055 ($0.04 per share) are expected to be passed through to shareholders. This entire amount will be eligible for shareholders to claim as a foreign tax credit.
Gross income derived from sources within foreign countries was $16,158,367 ($0.44 per share) for the period ended March 31, 2009.
Columbia International Growth Fund
Foreign taxes paid during the period ended March 31, 2009, of $1,358,942 ($0.08 per share) are expected to be passed through to shareholders. This entire amount will be eligible for shareholders to claim as a foreign tax credit.
Gross income derived from sources within foreign countries was $12,645,949 ($0.70 per share) for the period ended March 31, 2009.
4.14% of the ordinary dividend income distributed by the Fund, for the year ended March 31, 2009, qualifies for the corporate dividends received deduction.
For non-corporate shareholders 100.00% or the maximum amount allowable under the Jobs and Growth Tax Relief Reconciliation Act of 2003, of ordinary income distributed by the Fund for the period April 1, 2008 to March 31, 2009 may represent qualified dividend income. Final information will be provided in your 2009 Form 1099-DIV.
Columbia Pacific/Asia Fund
Foreign taxes paid during the period ended March 31, 2009, of $155,356 ($0.03 Per share) are expected to be passed through to shareholders. This entire amount will be eligible for shareholders to claim as a foreign tax credit.
Gross income derived from sources within foreign countries was $2,097,242 ($0.41 per share) for the period ended March 31, 2009.
For non-corporate shareholders 36.60% or the maximum
amount allowable under the Jobs and Growth Tax Relief Reconciliation Act of 2003, of ordinary income distributed by the Fund for the period April 1, 2008 to March 31, 2009 may represent qualified dividend income. Final information will be provided in your 2009 Form 1099-DIV.
159
Fund Governance– Equity Funds
The Trustees serve terms of indefinite duration. The names, addresses and ages of the Trustees and officers of the Funds in the Columbia Funds Complex, the year each was first elected or appointed to office, their principal business occupations during at least the last five years, the number of Funds overseen by each Trustee and other directorships they hold are shown below. Each officer listed below serves as an officer of each Fund in the Columbia Funds Complex.
Independent Trustees
| | |
Name, address and year of birth,
Position with funds, Year first
elected or appointed to office | | Principal occupation(s) during past five years, Number of Funds in the Columbia
Funds Complex overseen by Trustee, Other Directorships Held |
| |
| John D. Collins (Born 1938) | | |
c/o Columbia Management Advisors, LLC One Financial Center Boston, MA 02111 Trustee (since 2007) | | Retired. Consultant, KPMG, LLP (accounting and tax firm) from July 1999 to June 2000; Partner, KPMG, LLP from March 1962 to June 1999. Oversees 79, Mrs. Fields Famous Brands LLC (consumer products); Suburban Propane Partners, L.P.; and Montpelier Re (underwriting firm) |
| |
| Rodman L. Drake (Born 1943) | | |
c/o Columbia Management Advisors, LLC One Financial Center Boston, MA 02111 Trustee (since 2007) | | Co-Founder of Baringo Capital LLC (private equity) since 2002; President, Continuation Investments Group, Inc. from 1997 to 2001. Oversees 79, Jackson Hewitt Tax Service Inc. (tax preparation services); Crystal Capital River Inc. (real estate investment trust); Student Loan Corporation (student loan provider); Celgene Corporation (global biotechnology company); and The Helios Funds (exchange-traded funds) |
| |
| Douglas A. Hacker (Born 1955) | | |
c/o Columbia Management Advisors, LLC One Financial Center Boston, MA 02111 Trustee (since 1996) | | Independent business executive since May 2006; Executive Vice President–Strategy of United Airlines (airline) from December 2002 to May 2006; President of UAL Loyalty Services (airline marketing company) from September 2001 to December 2002; Executive Vice President and Chief Financial Officer of United Airlines from July 1999 to September 2001. Oversees 79, Nash Finch Company (food distributor); Aircastle Limited (aircraft leasing) |
|
| Janet Langford Kelly (Born 1957) |
c/o Columbia Management Advisors, LLC One Financial Center Boston, MA 02111 Trustee (since 1996) | | Senior Vice President, General Counsel and Corporate Secretary, ConocoPhillips (integrated energy company) since September 2007; Deputy General Counsel–Corporate Legal Services, ConocoPhillips from August 2006 to August 2007; Partner, Zelle, Hofmann, Voelbel, Mason & Gette LLP (law firm) from March 2005 to July 2006; Adjunct Professor of Law, Northwestern University, from September 2004 to June 2006; Director, UAL Corporation (airline) from February 2006 to July 2006; Oversees 79, None |
|
| Charles R. Nelson (Born 1942) |
c/o Columbia Management Advisors, LLC One Financial Center Boston, MA 02111 Trustee (since 1981) | | Professor of Economics, University of Washington, since January 1976; Ford and Louisa Van Voorhis Professor of Political Economy, University of Washington, since September 1993; Director, Institute for Economic Research, University of Washington from September 2001 to June 2003; Adjunct Professor of Statistics, University of Washington, since September 1980; Associate Editor, Journal of Money Credit and Banking, since September 1993; Consultant on econometric and statistical matters. Oversees 79, None |
160
Fund Governance (continued) – Equity Funds
Independent Trustees (continued)
| | |
Name, address and year of birth,
Position with funds, Year first
elected or appointed to office | | Principal occupation(s) during past five years, Number of Funds in the Columbia
Funds Complex overseen by Trustee, Other Directorships Held |
| |
| John J. Neuhauser (Born 1943) | | |
c/o Columbia Management Advisors, LLC One Financial Center Boston, MA 02111 Trustee (since 1985) | | President, Saint Michael’s College, since August 2007; University Professor, Boston College from November 2005 to August 2007; Academic Vice President and Dean of Faculties, Boston College from August 1999 to October 2005. Oversees 79, Liberty All-Star Equity Fund and Liberty All-Star Growth Fund, Inc. (closed-end funds) |
| |
| Jonathan Piel (Born 1938) | | |
c/o Columbia Management Advisors, LLC One Financial Center Boston, MA 02111 Trustee (since 2007) | | Cable television producer and website designer; The Editor, Scientific American from 1984 to 1994; Vice President, Scientific American, Inc., from 1984 to 1994; Member, Advisory Board, Stone Age Institute, Bloomington, Indiana (research institute that explores the effect of technology on human evolution); Member, Board of Directors of the National Institute of Social Sciences, New York City; and Member, Board of Trustees of the William Alanson White Institute, New York City (institution for training psychoanalysts). Oversees 79, None |
| |
| Patrick J. Simpson (Born 1944) | | |
c/o Columbia Management Advisors, LLC One Financial Center Boston, MA 02111 Trustee (since 2000) | | Partner, Perkins Coie LLP (law firm). Oversees 79, None |
|
| Thomas C. Theobald (Born 1937) |
c/o Columbia Management Advisors, LLC One Financial Center Boston, MA 02111 Trustee and Chairman of the Board (since 1996) | | Partner and Senior Advisor, Chicago Growth Partners (private equity investing) since September 2004; Managing Director, William Blair Capital Partners (private equity investing) from September 1994 to September 2004. Oversees 79, Anixter International (network support equipment distributor); Ventas, Inc. (real estate investment trust); Jones Lang LaSalle (real estate management services); Ambac Financial Group (financial guaranty insurance) |
| |
| Anne-Lee Verville (Born 1945) | | |
c/o Columbia Management Advisors, LLC One Financial Center Boston, MA 02111 Trustee (since 1998) | | Retired since 1997 (formerly General Manager–Global Education Industry (from 1994 to 1997), President–Application Systems Division (from 1991 to 1994), Chief Financial Officer–US Marketing & Services (from 1988 to 1991), and Chief Information Officer (from 1987 to 1988), IBM Corporation (computer and technology)). Oversees 79, None |
| |
| William E. Mayer1 (Born 1940) | | |
c/o Columbia Management Advisors, LLC One Financial Center Boston, MA 02111 Trustee (since 1994) | | Partner, Park Avenue Equity Partners (private equity) since February 1999; Dean and Professor, College of Business, University of Maryland from 1992 to 1997. Oversees 79, Lee Enterprises (print media), WR Hambrecht + Co. (financial service provider); BlackRock Kelso Capital Corporation (investment company) |
1 | Mr. Mayer is an “interested person” (as defined in the Investment Company Act of 1940) by reason of his affiliation with WR Hambrecht + Co., a registered broker/dealer that may execute portfolio transactions for or engage in principal transactions with the Funds or other funds or accounts advised/managed by the Advisor or other Bank of America affiliates. |
The Statement of Additional Information includes additional information about the Trustees of the Funds and is available, without charge, upon request by calling 1-800-345-6611.
161
Fund Governance (continued) – Equity Funds
Officers
| | |
Name, address and year of birth,
Position with Columbia Funds, Year
first elected or appointed to office | | Principal occupation(s) during past five years |
| |
| J. Kevin Connaughton (Born 1964) | | |
One Financial Center Boston, MA 02111 President (since 2009) | | Managing Director of Columbia Management Advisors, LLC since December 2004; Senior Vice President and Chief Financial Officer–Columbia Funds, from June 2008 to January 2009; Treasurer–Columbia Funds, from October 2003 to May 2008; Treasurer–the Liberty Funds, Stein Roe Funds and Liberty All-Star Funds, December 2000–December 2006; Senior Vice President–Columbia Management Advisors, LLC, from April 2003 to December 2004; President–Columbia Funds, Liberty Funds and Stein Roe Funds, February 2004 to October 2004; Treasurer–Galaxy Funds, September 2002 to December 2005; Treasurer, December 2002 to December 2004, and President, February 2004 to December 2004–Columbia Management Multi-Strategy Hedge Fund, LLC; and a senior officer of various other Bank of America-affiliated entities, including other registered and unregistered funds. |
|
| James R. Bordewick, Jr. (Born 1959) |
One Financial Center Boston, MA 02111 Senior Vice President, Secretary and Chief Legal Officer (since 2006) | | Associate General Counsel, Bank of America since April 2005; Senior Vice President and Associate General Counsel, MFS Investment Management (investment management) prior to April 2005. |
| |
| Linda J. Wondrack (Born 1964) | | |
One Financial Center Boston, MA 02111 Senior Vice President and Chief Compliance Officer (since 2007) | | Director (Columbia Management Group LLC and Investment Product Group Compliance), Bank of America since June 2005; Director of Corporate Compliance and Conflicts Officer, MFS Investment Management (investment management), August 2004 to May 2005; Managing Director, Deutsche Asset Management (investment management) prior to August 2004. |
| |
| Michael G. Clarke (Born 1969) | | |
One Financial Center Boston, MA 02111 Senior Vice President and Chief Financial Officer (since 2009) | | Director of Fund Administration of the Advisor since January 2006; Managing Director of the Advisor September 2004 to December 2005; Vice President Fund Administration June 2002 to September 2004. |
| |
| Jeffrey R. Coleman (Born 1969) | | |
One Financial Center Boston, MA 02111 Deputy Treasurer (since 2008) | | Director of Fund Administration of the Advisor since January 2006; Fund Controller of the Advisor from October 2004 to January 2006; Vice President of CDC IXIS Asset Management Services, Inc. (investment management) from August 2000 to September 2004. |
| |
| Joseph F. DiMaria (Born 1968) | | |
One Financial Center Boston, MA 02111 Chief Accounting Officer and Treasurer (since 2009) | | Director of Fund Administration of the Advisor since January 2006; Head of Tax/Compliance and Assistant Treasurer of the Advisor from November 2004 to December 2005; Director of Trustee Administration (Sarbanes-Oxley) of the Advisor from May 2003 to October 2004. |
162
Fund Governance (continued) – Equity Funds
Officers (continued)
| | |
Name, address and year of birth,
Position with Columbia Funds, Year
first elected or appointed to office | | Principal occupation(s) during past five years |
| |
| Julian Quero (Born 1967) | | |
One Financial Center Boston, MA 02111 Deputy Treasurer (since 2008) | | Senior Tax Manager of the Advisor since August 2006; Senior Compliance Manager of the Advisor from April 2002 to August 2006. |
| |
| Barry S. Vallan (Born 1969) | | |
One Financial Center Boston, MA 02111 Controller (since 2006) | | Vice President–Fund Treasury of the Advisor since October 2004; Vice President–Trustee Reporting of the Advisor from April 2002 to October 2004 |
163
Board Consideration and Approval of Advisory Agreements
The Advisory Fees and Expenses Committee of the Board of Trustees meets several times annually to review the advisory agreements (collectively, the “Agreements”) of the funds for which the Trustees serve as trustees (each a “fund”) and to determine whether to recommend that the full Board approve the continuation of the Agreements for an additional one-year period. After the Committee has made its recommendation, the full Board, including the Independent Trustees, determines whether to approve the continuation of the Agreements. In addition, the full Board, including the Independent Trustees, considers matters bearing on the Agreements at most of its other meetings throughout the year and meets regularly with senior management of the funds and Columbia, the funds’ investment adviser, including the senior manager of each investment area within Columbia. Through the Board’s Investment Oversight Committees, Trustees also meet with selected fund portfolio managers, research analysts and traders at various times throughout the year.
The Trustees receive and review all materials that they, their legal counsel or Columbia believe to be reasonably necessary for the Trustees to evaluate the Agreements and to determine whether to approve the continuation of the Agreements. Those materials generally include, among other items, (i) information on the investment performance of each fund relative to the performance of peer groups of mutual funds and the fund’s performance benchmarks, and additional information assessing performance on a risk-adjusted basis, (ii) information on each fund’s advisory fees and other expenses, including information comparing the fund’s expenses to those of peer groups of mutual funds and information about any applicable expense caps and fee “breakpoints,” (iii) information about the profitability of the Agreements to Columbia, including potential “fall-out” or ancillary benefits that Columbia and its affiliates may receive as a result of their relationships with the funds and (iv) information obtained through Columbia’s response to a questionnaire prepared at the request of the Trustees by counsel to the funds and independent legal counsel to the Independent Trustees. The Trustees also consider other information such as (v) Columbia’s financial results and financial condition, (vi) each fund’s investment objective and strategies and the size, education and experience of Columbia’s investment staffs and their use of technology, external research and trading cost measurement tools, (vii) the allocation of the funds’ brokerage and the use of “soft” commission dollars to pay for research products and services, (viii) Columbia’s resources devoted to, and its record of compliance with, the funds’ investment policies and restrictions, policies on personal securities transactions and other compliance policies and legal and regulatory requirements, (ix) Columbia’s response to various legal and regulatory proceedings since 2003 and to the recent period of volatility in the securities markets and (x) the economic outlook generally and for the mutual fund industry in particular. In addition, the Advisory Fees and Expenses Committee confers with the funds’ independent fee consultant and reviews materials relating to the funds’ relationships with Columbia provided by the independent fee consultant. Throughout the process, the Trustees have the opportunity to ask questions of and to request additional materials from Columbia and to consult with the independent fee consultant and independent legal counsel to the Independent Trustees.
The Board of Trustees most recently approved the continuation of the Agreements at its October, 2008 meeting, following meetings of the Advisory Fees and Expenses Committee held in February, April, August, September and October, 2008. In considering whether to approve the continuation of the Agreements, the Trustees, including the Independent Trustees, did not identify any single factor as determinative, and each weighed various factors as he or she deemed appropriate. The Trustees considered the following matters in connection with their approval of the continuation of the Agreements:
The nature, extent and quality of the services provided to the funds under the Agreements. The Trustees considered the nature, extent and quality of the services provided by Columbia and its affiliates to the funds and the resources dedicated to the funds by Columbia and its affiliates. Among other things, the Trustees considered (i) Columbia’s ability (including its personnel and other resources, compensation programs for personnel involved in fund management, reputation and other attributes) to attract, motivate and retain highly qualified research, advisory and supervisory investment professionals; (ii) the portfolio management services provided by those investment professionals; and (iii) the trade execution services provided on behalf of the funds. For each fund, the Trustees also considered the benefits to shareholders of investing in a mutual fund that is
164
part of a family of funds offering exposure to a variety of asset classes and investment disciplines and providing a variety of fund and shareholder services. After reviewing those and related factors, the Trustees concluded, within the context of their overall conclusions regarding each of the Agreements, that the nature, extent and quality of services provided supported the continuation of the Agreements.
Investment performance of the funds and Columbia. The Trustees reviewed information about the performance of each fund over various time periods, including information prepared by an independent third-party data provider that compared the performance of each fund to the performance of peer groups of mutual funds and performance benchmarks. The Trustees also reviewed a description of the third party’s methodology for identifying each fund’s peer group for purposes of performance and expense comparisons. The Trustees also considered additional information that the Advisory Fees and Expenses Committee requested from Columbia relating to funds that presented relatively weaker performance and/or relatively higher expenses. In the case of each fund whose performance lagged that of a relevant peer group for certain (although not necessarily all) periods, the Trustees concluded that other factors relevant to performance were sufficient, in light of other considerations, to warrant continuation of the fund’s Agreements. Those factors varied from fund to fund, but included one or more of the following: (i) that the fund’s performance, although lagging in certain recent periods, was stronger over the longer term; (ii) that the underperformance was attributable, to a significant extent, to investment decisions that were reasonable and consistent with the fund’s investment strategy and policies and that the fund was performing within a reasonable range of expectations, given those investment decisions, market conditions and the fund’s investment strategy; (iii) that the fund’s performance was competitive when compared to other relevant performance benchmarks or peer groups; (iv) that Columbia had taken or was taking steps designed to help improve the fund’s investment performance, including, but not limited to, replacing portfolio managers or modifying investment strategies; and (v) that Columbia proposed to waive advisory fees or cap the expenses of the fund.
The Trustees noted the performance of each fund through April 30, 2008 relative to that of a peer group selected by an independent third-party data provider for purposes of performance comparisons. Specifically, Columbia Blended Equity Fund’s performance was in the first quintile (where the best performance would be in the first quintile) for the one-, three-, and five-year periods, and in the second quintile for the ten-year period; Columbia Emerging Market Fund’s performance was in the fourth quintile for the one- and three-year periods, in the third quintile for the five-year period, and in the fifth quintile for the ten-year period; Columbia Energy and Natural Resources Fund’s performance was in the third quintile for the one-, three-, and ten-year periods, and in the second quintile for the five-year period; Columbia International Growth Fund’s performance was in the fourth quintile for the one- and three-year periods, in the second quintile for the five-year period, and in the fifth quintile for the ten-year period; Columbia Mid Cap Core Fund’s performance was in the third quintile for the one-year period, in the second quintile for the three-year period, in the fourth quintile for the five-year period, and in the first quintile for the ten-year period; Columbia Pacific/Asia Fund’s performance was in the second quintile for the one-year period, in the fifth quintile for the three- and five-year periods and in the fourth quintile for the ten-year period; Columbia Select Large Cap Growth Fund’s performance was in the first quintile for the one-, three- and five-year periods, and in the third quintile for the ten-year period; Columbia Select Opportunities Fund’s performance was in the first quintile for the one-, three- and five-year periods; Columbia Select Small Cap Fund’s performance was in the second quintile for the one-year period, in the first quintile for the three- and five-year periods, and in the third quintile for the ten-year period; and Columbia Value and Restructuring Fund’s performance was in the second quintile for the one-year period, and in the first quintile for the three-, five- and ten-year periods.
The Trustees also considered Columbia’s performance and reputation generally, the funds’ performance as a fund family generally, and Columbia’s historical responsiveness to Trustee concerns about performance and Columbia’s willingness to take steps intended to improve performance. After reviewing those and related factors, the Trustees concluded, within the context of their overall conclusions regarding each of the Agreements, that the performance of each fund and Columbia was sufficient, in light of other considerations, to warrant the continuation of the Agreement(s) pertaining to that fund.
165
The costs of the services provided and profits realized by Columbia and its affiliates from their relationships with the funds. The Trustees considered the fees charged to the funds for advisory services as well as the total expense levels of the funds. That information included comparisons (provided by management and by an independent third-party data provider) of each fund’s advisory fees and total expense levels to those of the fund’s peer groups and information about the advisory fees charged by Columbia to comparable institutional accounts. In considering the fees charged to those accounts, the Trustees took into account, among other things, management’s representations about the differences between managing mutual funds as compared to other types of accounts, including differences in the services provided, differences in the risk profile of such business for Columbia, and the additional resources required to manage mutual funds effectively. In evaluating each fund’s advisory fees, the Trustees also took into account the demands, complexity and quality of the investment management of the fund. The Trustees considered existing advisory fee breakpoints, and Columbia’s use of advisory fee waivers and expense caps, which benefited a number of the funds. The Trustees also noted management’s stated justification for the fees charged to the funds, which included information about the investment performance of the funds and the services provided to the funds.
The Trustees considered each fund’s total expenses and actual management fees relative to those of a peer group selected by an independent third-party data provider for purposes of expense comparisons. Specifically, Columbia Blended Equity Fund’s total expenses were in the fourth quintile and actual management fees were in the fifth quintile (where the lowest fees and expenses would be in the first quintile); Columbia Emerging Markets Fund’s total expenses were in the fourth quintile and actual management fees were in the fifth quintile; Columbia Energy and Natural Resources Fund’s total expenses and actual management fees were in the second quintile; Columbia International Growth Fund’s total expenses and actual management fees were in the fifth quintile; Columbia Mid Cap Core Fund’s total expenses were in the second quintile and actual management fees were in the third quintile; Columbia Pacific/Asia Fund’s total expenses and actual management fees were in the fifth quintile; Columbia Select Large Cap Growth Fund’s total expenses were in the fourth quintile and actual management fees were in the fifth quintile; Columbia Select Opportunities Fund’s total expenses and actual management fees were in the first quintile; Columbia Select Small Cap Fund’s total expenses were in the second quintile and actual management fees were in the third quintile; and Columbia Value and Restructuring Fund’s total expenses and actual management fees were in the fourth quintile.
The Trustees also considered the compensation directly or indirectly received by Columbia and its affiliates from their relationships with the funds. The Trustees reviewed information provided by management as to the profitability to Columbia and its affiliates of their relationships with each fund, and information about the allocation of expenses used to calculate profitability. When reviewing profitability, the Trustees also considered court cases in which adviser profitability was an issue in whole or in part, the performance of the relevant funds, the expense level of each fund, and whether Columbia had implemented breakpoints and/or expense caps with respect to the fund.
After reviewing those and related factors, the Trustees concluded, within the context of their overall conclusions regarding each of the Agreements, that the advisory fees charged to each fund, and the related profitability to Columbia and its affiliates of their relationships with the fund, supported the continuation of the Agreement(s) pertaining to that fund.
Economies of Scale. The Trustees considered the existence of any economies of scale in the provision by Columbia of services to each fund, to groups of related funds, and to Columbia’s investment advisory clients as a whole and whether those economies were shared with the funds through breakpoints in the investment advisory fees or other means, such as fee waivers/expense reductions and additional investments by Columbia in investment, trading and compliance resources. The Trustees noted that many of the funds benefited from breakpoints, fee waivers/expense caps, or both. In considering those issues, the Trustees also took note of the costs of the services provided (both on an absolute and a relative basis) and the profitability to Columbia and its affiliates of their relationships with the funds, as discussed above.
After reviewing those and related factors, the Trustees concluded, within the context of their overall conclusions regarding each of the Agreements, that the extent to which
166
economies of scale were shared with the funds supported the continuation of the Agreements.
Other Factors. The Trustees also considered other factors, which included but were not limited to the following:
| n | | the extent to which each fund had operated in accordance with its investment objective and investment restrictions, the nature and scope of the compliance programs of the funds and Columbia and the compliance-related resources that Columbia and its affiliates were providing to the funds; |
| n | | the nature, quality, cost and extent of administrative and shareholder services overseen and performed by Columbia and its affiliates, both under the Agreements and under separate agreements for the provision of transfer agency and administrative services; |
| n | | so-called “fall-out benefits” to Columbia and its affiliates, such as the engagement of its affiliates to provide distribution, brokerage and transfer agency services to the funds, and the benefits of research made available to Columbia by reason of brokerage commissions generated by the funds’ securities transactions, as well as possible conflicts of interest associated with those fall-out and other benefits, and the reporting, disclosure and other processes in place to disclose and monitor those possible conflicts of interest; and |
| n | | the report provided by the funds’ independent fee consultant, which included information about and analysis of the funds’ fees, expenses and performance. |
Based on their evaluation of all factors that they deemed to be material, including those factors described above, and assisted by the advice of independent counsel and the independent fee consultant, the Trustees, including the Independent Trustees, approved the continuance of each of the Agreements through October 31, 2009.
167
Summary of Management Fee Evaluation by Independent Fee Consultant
EXCERPTS FROM REPORT OF INDEPENDENT FEE CONSULTANT TO THE FUNDS SUPERVISED BY THE COLUMBIA ATLANTIC BOARD
Prepared Pursuant to the February 9, 2005 Assurance of Discontinuance among the Office of Attorney General of New York State, Columbia Management Advisors, LLC, and Columbia Management Distributors, Inc. November 3, 2008
I. Overview
On February 9, 2005, Columbia Management Advisors, LLC (“CMA”) and Columbia Management Distributors, Inc.1 (“CMD”) agreed to the New York Attorney General’s Assurance of Discontinuance (“AOD”). Among other things, the AOD stipulates that CMA may manage or advise a Columbia Fund (“Columbia Fund” and, together with some or all of, such funds the “Columbia Funds”) only if the Independent Members of the Columbia Fund’s Board of Trustees appoint a Senior Officer or retain an Independent Fee Consultant (“IFC”) who is to manage the process by which proposed management fees are negotiated. The AOD further stipulates that the Senior Officer or IFC is to prepare a written annual evaluation of the fee negotiation process.
With effect from January 1, 2007, the Independent Members of the Board of Trustees for certain Columbia Funds known collectively as the “Atlantic Funds” (together with the other members of that Board, the “Trustees”) retained me as IFC for the Atlantic Funds.2 In this capacity, I have prepared the fourth annual written evaluation of the fee negotiation process. As was the case with last year’s report (the “2007 Report”) my immediate predecessor as IFC, John Rea, provided invaluable assistance in the preparation of this year’s report.
A. Role of the Independent Fee Consultant
The AOD charges the IFC with “managing the process by which proposed management fees…to be charged the Columbia Fund are negotiated so that they are negotiated in a manner which is at arms’ length and reasonable and consistent with this Assurance of Discontinuance.” The AOD also provides that CMA “may manage or advise a Columbia Fund only if the reasonableness of the proposed management fees is determined by the Board of Trustees…using…an annual independent written evaluation prepared by or under the direction of…the Independent Fee Consultant.” Therefore, the AOD makes clear that the IFC does not supplant the Trustees in negotiating management fees with CMA, nor does the IFC substitute his or her judgment for that of the Trustees with respect to the reasonableness of proposed fees or any other matter that is committed to the business judgment of the Trustees.
B. Elements Involved in Managing the Fee Negotiation Process
In preparing the report required by the AOD, the IFC must consider at least the following six factors set forth in the AOD:
| 1. | The nature and quality of CMA’s services, including the Fund’s performance; |
| 2. | Management fees (including any components thereof) charged by other mutual fund companies for like services; |
| 3. | Possible economies of scale as the Fund grows larger; |
| 4. | Management fees (including any components thereof) charged to institutional and other clients of CMA for like services; |
| 5. | Costs to CMA and its affiliates of supplying services pursuant to the management fee agreements, excluding any intra-corporate profit; and |
| 6. | Profit margins of CMA and its affiliates from supplying such services. |
C. Organization of the Annual Evaluation
This report, like last year’s, focuses on the six factors and contains a section for each factor except that CMA’s costs and profits from managing the Funds have been combined into a single section. In addition to a discussion of these factors, the report offers recommendations to improve the fee review process in future years. A review of the status of
1 | CMA and CMD are subsidiaries of Columbia Management Group, LLC (“CMG”), and are the successors to the entities named in the AOD. |
2 | I have no material relationship with Bank of America, CMG or any of its affiliates, aside from serving as IFC, and I am aware of no material relationship with any of their affiliates. I retained John Rea, an independent economic consultant, to assist me with this report. |
| | Unless otherwise stated or required by the context, this report covers only the Atlantic Funds, which are also referred as the “Funds.” |
168
recommendations made in the 2007 Report is being provided separately with the materials for the October meeting.
II. Summary of Findings
A. General
| 1. | Based upon my examination of the information supplied by CMG in the light of the six factors set forth in the AOD, I conclude that the Trustees have the relevant information necessary to evaluate the reasonableness of the proposed management fees for each Atlantic Fund. |
| 2. | In my view, the process by which the proposed management fees of the Funds have been negotiated in 2008 thus far has been, to the extent practicable, at arms’ length and reasonable and consistent with the AOD. |
B. Nature and Quality of Services, Including Performance
| 3. | The performance of the Funds has been relatively strong in recent years. Based upon 1-, 3-, 5-, and 10-year returns through April 30, 2008, at least half of all the Funds were in the first and second performance quintiles in each of the four performance periods and, at most, only 11% were in the fifth quintile in any one performance period. Both equity and fixed-income funds posted strong performance relative to comparable funds. |
| 4. | Performance rankings were similar in 2007 and 2008, although last year’s were slightly stronger. Despite the stability in the distribution of rankings in the two years, at least half the Funds changed quintile rankings between the two years in at least one of the 1-, 3-, and 5-year performance periods. |
| 5. | The performance of the actively managed equity Funds against their benchmarks was very strong. At least 57% and as many as 73% posted net returns exceeding their benchmarks over the 1-, 3-, and 5-year periods. In contrast, gross and net returns of fixed-income Funds typically fell short of their benchmarks. |
| 6. | Atlantic equity Funds’ overall performance adjusted for risk also was strong. Based upon 3-year returns, nearly 80% of the equity Funds had a combination of risk-adjusted and unadjusted returns that placed them in the top half of their performance universes. Only about one-fifth of the fixed income Funds posted high returns and low risk relative to comparable funds. About two-thirds of the fixed-income Funds took on more risk than the typical fund in their performance universes. |
| 7. | The industry-standard procedure used by Lipper that includes all share classes in the performance universe tends to bias a Fund’s ranking upward within that universe. The bias occurs because either no-12b-1 fee or low-12b-1 fee share classes of the Atlantic Funds are compared with funds in performance universes that include all share classes of multi-class funds with 12b-1 fees of up to 100 basis points. Correcting this bias by limiting the performance universe to classes of comparable funds with low or no 12b-1 fees (a “filtered universe”) lowers the relative performance for the Funds, but their performance, on the whole, remains strong. The filtering process, however, did identify two Funds for further review that had not been designated review funds using unfiltered universes. |
| 8. | A small number of Funds have consistently underperformed over the past four years. The exact number depends on the criteria used to evaluate longer-term performance. For example, the one-year returns of one Fund have been in the fourth or fifth performance quintiles in each of the past four years; there are six Funds whose three-year returns have been in the fourth or fifth quintile over the past four years. |
| 9. | The services performed by CMG professionals beyond portfolio management, such as compliance, legal, information technology, risk management, finance and fund administration, are critical to the success of the Funds and appear to be of high quality. |
C. Management Fees Charged by Other Mutual Fund Companies
| 10. | The Funds’ management fees and total expenses are generally low relative to those of their peers. Only 21% of the Funds ranked in the two most expensive quintiles for actual management fees, and only 23% in those quintiles for total expenses. |
| 11. | The highest concentration of low-expense Funds is found among the equity and tax-exempt fixed income Funds. The 12 former Excelsior Funds have relatively high fees and expenses, with half of those Funds ranking in either the fourth or fifth quintiles. The higher actual management fee |
169
| | rankings of certain Excelsior Funds are due in part to fee schedules that are higher than standard Columbia Fund fee schedules at current asset levels. After discussion with the Trustees, CMA is proposing to lower the management fees on three of these Funds. |
| 12. | The distribution of expense rankings is similar in 2007 and 2008, while management fee rankings improved markedly in 2008. Part of the improvement reflects expense limitations introduced last year for the state intermediate municipal bond Funds. |
| 13. | The management fees of the Atlantic Funds are generally in line with those of Columbia Funds supervised by the Nations Board of Trustees (the “Nations Funds”). In investment categories in which the Atlantic Funds have higher average fees, the difference principally arises out of differences in asset size. |
D. Trustees’ Fee and Performance Evaluation Process
| 14. | The Trustees’ evaluation process identified 17 Funds in 2008 for further review based upon their relative performance or expenses or both. When compared in filtered universes, two more Funds met the criteria for further review. CMG provided further information about those Funds to assist the Trustees in their evaluation. |
E. Potential Economies of Scale
| 15. | CMG presented to the Trustees its analysis of the sources and sharing of potential economies of scale. CMG views economies of scale as arising at the complex level and would regard estimates of scale economies for individual funds as unreliable. In its analysis, CMG did not identify specific sources of economies of scale or provide any estimates of any economies of scale that might arise from future asset growth. CMG’s analysis included measures taken by the Trustees and CMG that seek to share any potential economies of scale through breakpoints in management fee schedules, expense reimbursements, fee waivers, enhanced shareholder services, fund mergers, and operational consolidation. |
| 16. | An examination of the contractual fee schedules for five Atlantic Funds shows that they are generally in line with those of their competitors, in terms of number and extent of fee breakpoints. A similar examination last year of five different Funds led to the same conclusion. |
F. Management Fees Charged to Institutional Clients
| 17. | CMG has provided Trustees with comparisons of mutual fund management fees and institutional fees based upon standardized fee schedules and upon actual fees. The results show that, consistent with industry practice, institutional fees are generally lower than the Funds’ management fees. However, because the services provided and risks borne by the manager are more extensive for mutual funds compared to institutional accounts, the differences are of limited value in assisting the Trustees in their review of the reasonableness of the Funds’ management fees. |
G. Revenues, Expenses, and Profits
| 18. | The activity-based cost allocation methodology (“ABC”) employed by CMG to allocate costs, both direct and indirect, for purposes of calculating Fund profitability is thoughtful and detailed. This year, CMG proposed a change to the method by which indirect expenses are allocated. Under this “hybrid” method, indirect costs relating to fund management are allocated among the Funds 50% by assets and 50% per Fund. Allocating indirect expenses equally to each Fund has an intuitive logic, as each Fund regardless of size has certain expenses, such as preparing and printing prospectuses and financial statements. |
| 19. | The materials provided on CMG’s revenues and expenses with respect to the Funds and the methodology underlying their construction form a sufficient basis for Trustees to evaluate the expenses and profitability of the Funds. |
| 20. | In 2007, CMG’s complex-wide pre-tax margins on the Atlantic Funds were slightly below industry medians, based on limited data available for publicly held mutual fund managers. However, as is to be expected in a complex now comprising 75 Funds (including former Excelsior Funds), some Atlantic Funds have relatively high pre-tax profit margins, when calculated solely with respect to management revenues and expenses, while other Atlantic Funds operate at a loss. There is a positive relationship between fund size and profitability, with smaller funds generally operating at a loss. |
| 21. | CMG pays a fixed percentage of its management fee revenues to an affiliate, U.S. Trust, Bank of America |
170
| | Private Wealth Management, to compensate it for services it performs with respect to Atlantic Fund assets held for the benefit of its customers. Based on our analysis of the services provided by this affiliate, we have concluded that all payments other than those for sub-transfer agent or sub-accounting services should be treated as a distribution expense. |
III. Recommendations
| 1) | Criteria for review. The Trustees may wish to consider modifying the criteria for classifying a fund as a “Review Fund” to include criteria that focus exclusively on performance without regard to expense or fee levels. For example, a fund whose one-year or three-year performance was median or below for four consecutive years could be treated as a Review Fund. When we applied such criteria to the Funds, several additional Funds would have been added to the list of Review Funds. |
| 2) | Profitability data. CMG should present to the Trustees each year the profitability of each Fund, each investment style and each complex (of which Atlantic is one) calculated as follows: |
| | a. | Management-only profitability should be calculated without reference to any Private Bank expense. |
| | b. | Profitability excluding distribution (which essentially covers the management and transfer agency functions) should be adjusted by removing from the expense calculation any portion of the Private Bank payment not attributable to the performance by the Private Bank of sub-transfer agency or sub-accounting functions. |
| | c. | Total profitability, including distribution: No adjustment for Private Bank expenses should be made, because all such expenses represent legitimate fund expenses to be taken into account in calculating CMG’s profit margin including distribution. |
| | d. | Distribution only: This should include all Private Bank expenses other than those attributable to sub-transfer agency services. |
Therefore, the following data need not be provided:
| | 1. | Adjusting total profitability data for Private Bank expenses |
| | 2. | Adjusting profitability excluding distribution by backing out all Private Bank expenses. |
| 3) | Potential economies of scale. CMG and the IFC should continue to work on methods for more precisely quantifying to the extent possible the sources and magnitude of any economies of scale as CMG’s mutual fund assets under management increase, to the extent that the data allows for meaningful year-over-year comparisons. The framework suggested in Section IV.D.4 may prove to be a useful model for such an analysis. |
| 4) | Competitive breakpoint analysis. As part of the annual fee evaluation process, the breakpoints of a select group of Atlantic Funds (which would differ each year) should continue to be compared to those of industry rivals to ensure that the Funds’ breakpoint schedules remain within industry norms. As breakpoint schedules change relatively little each year, performing such a comparison for each Atlantic Fund each year would not be an efficient use of Trustee and CMG resources. |
| 5) | Cost allocation methodology. CMG’s point that the current ABC system of allocating indirect expenses creates anomalous results in several cases, including sub-advised Funds, is well-taken. We would like to work with CMG over the forthcoming year on alternatives to the current system of allocating indirect expenses that (1) resolve the anomalies, (2) limit the amount of incremental effort on CMG’s part and (3) remain faithful to the general principle that expenses should be allocated by time and effort to the extent reasonably possible. |
| 6) | Management fee disparities. CMG and the Atlantic Trustees, as part of any future study of management fees, should analyze the differences in management fee schedules, principally arising out of the reorganization of the former Excelsior Funds as Atlantic Funds. As part of that analysis, CMG should provide an explanation for any significant fee differences among comparable funds across fund families managed by CMA, such as differences in the management styles of different Funds included the same Lipper category. Finally, whenever CMG proposes a management fee change or an expense cap for any mutual fund managed by CMA that is comparable to any Atlantic Fund, CMG should provide the Trustees with sufficient information about the proposal to allow the Trustees to assess the applicability of the proposed change to the relevant Atlantic Fund or Funds. |
171
| 7) | Tax-exempt Fund expense data. The expense rankings of certain tax-exempt Funds were adversely affected by including certain investment-related interest expenses that Lipper excluded in calculating the expense ratios of competitors. We recommend that CMG follow the Lipper practice and exclude such interest expenses from data submitted to Lipper to avoid unfairly disadvantaging the tax-exempt Funds. |
| 8) | Reduction of volume of paper documents submitted. The effort to rationalize and simplify the data presented to the Trustees and the process by which that data was prepared and organized was regarded as a success by all parties. We should continue to look for opportunities to reduce and simplify the presentation of 15(c) data, especially in the area of Fund profitability. The Fund “Dashboard” volume presents a large volume of Fund data on a single page. If it is continued, the Trustees may wish to consider receiving the underlying Lipper data on CD, rather than the current paper volumes. |
Respectfully submitted,
Steven E. Asher
172
Important Information About This Report – Equity Funds
Transfer Agent
Columbia Management Services, Inc.
P.O. Box 8081
Boston, MA 02266-8081
1-800-345-6611
Distributor
Columbia Management
Distributors, Inc.
One Financial Center
Boston, MA 02111
Investment Advisor
Columbia Management Advisors, LLC
100 Federal Street
Boston, MA 02110
The funds mail one shareholder report to each shareholder address. If you would like more than one report, please call shareholder services at 1-800-345-6611 and additional reports will be sent to you. This report has been prepared for shareholders of Equity Funds.
A description of the policies and procedures that each fund uses to determine how to vote proxies and a copy of each fund’s voting records are available (i) at www.columbiamanagement.com; (ii) on the Securities and Exchange Commission’s website at www.sec.gov, and (iii) without charge, upon request, by calling 1-800-368-0346. Information regarding how each fund voted proxies relating to portfolio securities during the 12-month period ended June 30 is available from the SEC’s website. Information regarding how each fund voted proxies relating to portfolio securities is also available from the funds’ website, www.columbiamanagement.com.
Each fund files a complete schedule of portfolio holdings with the SEC for the first and third quarters of each fiscal year on Form N-Q. Each fund’s Form N-Q is available on the SEC’s website at www.sec.gov and may be reviewed and copied at the SEC’s Public Reference Room in Washington, DC. Information on the operation of the Public Reference Room may be obtained by calling 1-800-SEC-0330.
Please read and consider the investment objectives, risks, charges and expenses for any fund carefully before investing. For a prospectus which contains this and other important information about a fund, contact your Columbia Management representative or financial advisor or go to www.columbiamanagement.com.
Columbia Management Group, LLC (“Columbia Management”) is the investment management division of Bank of America Corporation. Columbia Management entities furnish investment management services and products for institutional and individual investors. Columbia Funds are distributed by Columbia Management Distributors, Inc., member of FINRA, SIPC, part of Columbia Management and an affiliate of Bank of America Corporation.
173

One Financial Center
Boston, MA 02111-2621
Equity Funds
Annual Report, March 31, 2009
©2009 Columbia Management Distributors, Inc.
One Financial Center, Boston, MA 02111-2621
800.345.6611 www.columbiafunds.com
SHC-42/10646-0309 (05/09) 09/79027

Annual Report
March 31, 2009
Columbia Bond Fund
| | |
| NOT FDIC INSURED | | May Lose Value |
| NOT BANK ISSUED | | No Bank Guarantee |
Table of Contents
The views expressed in this report reflect the current views of the respective parties. These views are not guarantees of future performance and involve certain risks, uncertainties and assumptions that are difficult to predict so actual outcomes and results may differ significantly from the views expressed. These views are subject to change at any time based upon economic, market or other conditions and the respective parties disclaim any responsibility to update such views. These views may not be relied on as investment advice and, because investment decisions for a Columbia Fund are based on numerous factors, may not be relied on as an indication of trading intent on behalf of any particular Columbia Fund. References to specific securities should not be construed as a recommendation or investment advice.
President’s Message

Dear Shareholder:
Recent events have shown great volatility in the markets and uncertainty in the economy. During these challenging times, it becomes even more important to focus on long-term horizons and key investment tools that can help manage volatility. This may be the time to reflect on your investment goals and evaluate your portfolio to ensure you are positioned for any potential market rebound.
A long-term financial plan can serve as a road map and guide you through the necessary steps designed to meet your financial goals. Your financial plan should take into account your investment goals, time horizon, overall financial situation, risk tolerance and willingness to ride out market volatility. Your investment professional can be a key resource as you work through this process. The knowledge and experience of an investment professional can help as you create or reevaluate your investment strategy.
The importance of diversification
Although diversification does not ensure a profit or guarantee against loss, a diversified portfolio can be a strategy for successful long-term investing. Diversification refers to the mix of investments within a portfolio. A mutual fund can contribute to portfolio diversification given that a mutual fund’s portfolio represents several investments. Additionally, the way you allocate your money among stocks, bonds and cash, and geographically between foreign and domestic investments, can help to reduce risks. Diversification can result in multiple investments where the positive performance of certain holdings can offset any negative performance from other holdings. Having a diversified portfolio doesn’t mean that the value of the portfolio will never go down, but rather helps strike a balance between risk and reward.
Reevaluate your strategy
An annual review of your investments is a key opportunity to determine if your investment needs have changed or if you need minor adjustments to rebalance your portfolio. Life events like a birth, marriage, home improvement, or change in employment can have a major affect on your spending and goals. Ask yourself how your spending or goals have changed and factor this into your financial plan. Are you using automated investments or payroll deductions to help keep your savings on track? Are you able to set aside additional savings or increase your 401(k) plan contributions? If during your review you find that your investments in any one category (e.g., stocks, bonds or cash) have grown too large based on your diversification plan, you may want to consider redirecting future investments to get back on track.
History has shown that the U.S. stock market has been remarkably resilient¹. Volatility can lead to opportunity. Patience and a commitment to your long-term financial plan may position you to potentially benefit over your investment horizon. We appreciate your business and continued support of Columbia Funds.
Sincerely,

J. Kevin Connaughton
President, Columbia Funds
The board of trustees elected J. Kevin Connaughton president of Columbia Funds on January 16, 2009.
1 | The Dow Jones Industrial Average is the most widely used indicator of the overall condition of the stock market. The Dow Jones Industrial Average Index is a price-weighted average of 30 actively traded blue-chip stocks as selected by the editors of the Wall Street Journal. Indices are not investments, do not incur fees or expenses and are not professionally managed. It is not possible to invest directly in an index. |
Fund Profile – Columbia Bond Fund
Performance data quoted represents past performance and current performance may be lower or higher. Past performance is no guarantee of future results. The investment return and principal value will fluctuate so that shares, when redeemed, may be worth more or less than the original cost. Please visit www.columbiafunds.com for daily and most recent month-end performance updates.
Summary
1-year return as of 03/31/09
| | |
| |
 | | +1.04% Class A shares |
| | (without sales charge) |
| |
| | +3.13% Barclays Capital U.S. Aggregate Bond Index1 |
Morningstar Style Box™
Fixed Income Maturity
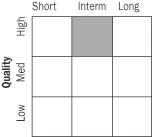
The Morningstar Style Box™ reveals a fund’s investment strategy. For fixed-income funds, the vertical axis shows the average credit quality of the bonds owned, and the horizontal axis shows interest rate sensitivity as measured by a bond’s duration (short, intermediate or long). Information shown is based on the most recent data provided by Morningstar.
Summary
| n | | For the 12-month period that ended March 31, 2009, the fund’s Class A shares returned 1.04% without sales charge. |
n | | The fund underperformed its benchmark, the Barclays Capital U.S. Aggregate Bond Index1 (formerly Lehman Brothers U.S. Aggregate Bond Index), during the period, as a result of overweight positions in securitized asset classes that lagged Treasury securities. |
| n | | The fund’s relatively conservative security selection enabled it to outperform its peer group average. |
Portfolio Management
Alexander D. Powers has co-managed the fund since 2008 and the predecessor fund since 1997. He has been with the advisor or its predecessors since 1996.
Michael Zazzarino has co-managed the fund since 2008 and the predecessor fund since 2005. He has been with the advisor or its predecessors since 2005.
1 | The Barclays Capital U.S. Aggregate Bond Index is a market value-weighted index that tracks the daily price, coupon, pay-downs and total return performance of fixed-rate, publicly placed, dollar-denominated and non-convertible investment grade debt issues with at least $250 million par amount outstanding and with at least one year to final maturity. Indices are not available for investment, and do not reflect sales charges, fees, brokerage commissions, taxes or other expenses of investing. Securities in the fund may not match those in an index. |
1
Economic Update – Columbia Bond Fund
Summary
For the 12-month period that ended March 31, 2009
| | n | | Despite volatility in many segments of the bond market, the Barclays Capital U.S. Aggregate Bond Index delivered a modest gain. High-yield bonds lost ground, as measured by the Merrill Lynch U.S. High Yield, Cash Pay Index. Municipals recovered from an early setback, as measured by the Barclays Capital Municipal Bond Index. | |
| | |
| Barclays Aggregate Index | | Merrill Lynch Index |
| |

| | 
|
3.13% | | 19.95% |
| |
Barclays
Municipal Index | | |
| |
| | |
2.27% | | |
| | n | | The broad U.S. stock market, as measured by the S&P 500 Index, returned negative 38.09%. Stock markets outside the United States returned negative 46.51%, as measured (in U.S. dollars) by the MSCI EAFE Index. | |
| | |
| S&P Index | | MSCI Index |
| |
| |
|
38.09% | | 46.51% |
Economic growth ground to a halt during the 12-month period that began April 1, 2008 and ended March 31, 2009. The National Bureau of Economic Research reported that the U.S. economy had slipped into recession late in 2007 and the downturn was even sharper than some anticipated.
A host of factors weighed on consumers and businesses alike. The most severe housing downturn in decades showed few signs of abating as inventories of homes for sale rose, home prices declined and tighter credit standards, the result of continued turmoil in the subprime mortgage market, made it more difficult for homebuyers to qualify for loans. The labor market has contracted for 15 consecutive months, driving the unemployment rate to 8.5%. More than five million jobs have been lost since the recession commenced late in 2007, with nearly two-thirds of the decrease occurring in the most recent five months. Manufacturing activity slowed and consumer spending declined, resulting in one of the weakest holiday seasons in decades.
However, in March there were a few signs that this severe recession is no longer intensifying. Weekly chain store sales and mortgage purchase applications gained some momentum near the end of the period. The trade deficit has narrowed more than expected, raising hopes that first quarter real GDP will contract at a rate well below the fourth quarter’s negative 6.3%.
A weakening economy and turmoil in the financial markets took a toll on consumer confidence, which continued to set new all-time lows during the period. However, the monthly Conference Board gauge was nearly unchanged in March, another indication that the worst could be behind us.
In an effort to restore confidence in the capital markets, loosen the reins on credit and shore up economic growth, the Federal Reserve Board (the Fed) brought a key short-term rate—the federal funds rate—down from 2.25% to a target between zero and 0.25% during the 12-month period—a record low. However, the Fed’s efforts went largely unrewarded. The one bright spot during this period of uncertainty was lower energy and commodity prices. With oil trading near $50 per barrel at the end of the period, gasoline prices have come down from $4 per gallon or more last summer to just over $2 per gallon in recent months.
Some bond market segments delivered positive returns
The U.S. bond market seesawed during the 12-month period, but several sectors managed to deliver modest gains as investors sought refuge from the volatile stock market. Treasury prices rose and yields declined as the economy faltered and stock market volatility increased. The benchmark 10-year U.S. Treasury yield ended the period at 2.70%. In this environment, the Barclays Capital U.S. Aggregate Bond Index1 (formerly the Lehman Brothers U.S. Aggregate Bond Index) returned 3.13%. High-yield bond prices fell sharply as economic prospects weakened and default fears rose. The Merrill Lynch U.S. High Yield, Cash Pay Index2 returned negative 19.95%. The municipal market suffered a setback early in 2008, then rebounded in the first quarter of 2009. The Barclays Capital Municipal Bond Index3 returned 2.27% for the 12-month period.
2
Economic Update (continued) – Columbia Bond Fund
Stocks retreat as economic outlook darkens
Against a weakening economic backdrop, the U.S. stock market lost 38.09% for the 12-month period, as measured by the S&P 500 Index.4 Losses affected the stocks of companies of all sizes and investment style categories, although growth stocks held up better than value stocks, as measured by their respective Russell indices.5 Stock markets outside the U.S. suffered even greater losses. The MSCI EAFE Index,6 a broad gauge of stock market performance in foreign developed markets, lost 46.51% (in U.S. dollars) for the period. Emerging stock markets, which generally have had a strong run over the past several years, were also caught in the downdraft. As investors backed away from risk, the MSCI Emerging Markets Index7 returned negative 47.07% (in U.S. dollars).
Past performance is no guarantee of future results.
1 | The Barclays Capital U.S. Aggregate Bond Index is a market value-weighted index that tracks the daily price, coupon, pay-downs and total return performance of fixed-rate, publicly placed, dollar-denominated and nonconvertible investment grade debt issues with at least $250 million par amount outstanding and with at least one year to final maturity. |
2 | The Merrill Lynch U.S. High Yield, Cash Pay Index tracks the performance of non-investment-grade corporate bonds. As of 01/01/2009, Merrill Lynch & Co., Inc. is a wholly-owned subsidiary of Bank of America Corporation and an affiliate of Columbia Management. |
3 | The Barlcays Capital Municipal Bond Index is considered representative of the broad market for investment-grade, tax-exempt bonds with maturities of at least one year. |
4 | The Standard & Poor’s (S&P) 500 Index tracks the performance of 500 widely held, large-capitalization U.S. stocks. |
5 | The Russell 1000 Growth Index measures the performance of those Russell 1000 Index companies with higher price-to-book ratios and higher forecasted growth values. The Russell 1000 Value Index measures the performance of those companies in the Russell 1000 Index with lower price-to-book ratios and lower forecasted growth values. The Russell 2000 Growth Index measures the performance of those Russell 2000 Index companies with higher price-to-book ratios and higher forecasted growth values. The Russell 2000 Value Index measures the performance of those Russell 2000 Index companies with lower price-to-book ratios and lower forecasted growth values. The Russell 3000 Growth Index measures the performance of those Russell 3000 Index companies with higher price-to-book ratios and higher forecasted growth values. The Russell 3000 Value Index measures the performance of those Russell 3000 Index companies with lower price-to-book ratios and lower forecasted growth values. The Russell Midcap Growth Index measures the performance of those Russell Midcap companies with higher price-to-book ratios and higher forecasted growth values. The Russell Midcap Value Index measures the performance of those Russell Midcap Index companies with lower price-to-book ratios and lower forecasted growth values. |
6 | The Morgan Stanley Capital International (MSCI) Europe, Australasia, Far East (EAFE) Index is a free float-adjusted market capitalization index that is designed to measure developed market equity performance, excluding the U.S. and Canada. |
7 | The Morgan Stanley Capital International (MSCI) Emerging Markets Index is a widely accepted index composed of a sample of companies from 25 countries representing the global emerging stock markets. |
Indices are not available for investment, and do not reflect sales charges, fees, brokerage commissions, taxes or other expenses of investing. Securities in the fund may not match those in an index.
3
Performance Information – Columbia Bond Fund
Performance data quoted represents past performance and current performance may be lower or higher. Past performance is no guarantee of future results. The investment return and principal value will fluctuate so that shares, when redeemed, may be worth more or less than the original cost. Please visit www.columbiafunds.com for daily and most recent month-end performance updates.
| | |
| Annual Operating expense ratio (%)* |
| |
Class A | | 1.14 |
Class C | | 1.89 |
Class Z | | 0.89 |
Annual Operating expense ratio
after contractual waivers (%)* |
| |
Class A | | 0.91 |
Class C | | 1.66 |
Class Z | | 0.66 |
| * | The annual operating expense ratio and annual operating expense ratio after contractual waivers are as stated in the fund’s prospectus that is current as of the date of this report. The contractual waiver expires 07/31/09. Differences in expense ratios disclosed elsewhere in this report may result from including fee waivers and expense reimbursements as well as different time periods used in calculating the ratios. |
|
| Performance of a $10,000 investment 04/01/99 – 03/31/09 |
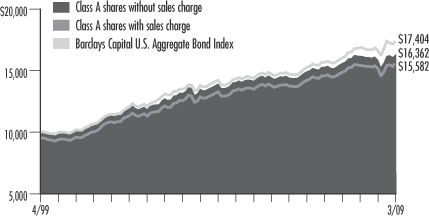
The chart above shows the change in value of a hypothetical $10,000 investment in Class A shares of Columbia Bond Fund during the stated time period, and does not reflect the deduction of taxes that a shareholder may pay on fund distributions or on the redemption of fund shares. The Barclays Capital U.S Aggregate Bond Index is a market value-weighted index that tracks the daily price, coupon, pay-downs, and total return performance of fixed-rate, publicly placed, dollar-denominated, and non-convertible investment grade debt issues with at least $250 million par amount outstanding and with at least one year to final maturity. Indices are not available for investment, and do not reflect sales charges, fees, brokerage commissions, taxes or other expenses of investing. Securities in the fund may not match those in an index.
| | | | |
| Performance of a $10,000 investment 04/01/99 – 03/31/09 ($) |
| | |
| Sales charge | | without | | with |
Class A | | 16,362 | | 15,582 |
Class C | | 16,264 | | 16,264 |
Class Z | | 16,434 | | n/a |
| | | | |
| Average annual total return as of 03/31/09 (%) | | |
| | | | | | | | | | |
| | | |
| Share class | | A | | C | | Z |
| Inception | | 03/31/08 | | 03/31/08 | | 01/09/86 |
| Sales charge | | without | | with | | without | | with | | without |
1-year | | 1.04 | | –3.72 | | 0.44 | | –0.53 | | 1.49 |
5-year | | 3.26 | | 2.26 | | 3.14 | | 3.14 | | 3.35 |
10-year | | 5.05 | | 4.54 | | 4.98 | | 4.98 | | 5.09 |
The “with sales charge” returns include the maximum initial sales charge of 4.75% for Class A shares and the applicable contingent deferred sales charge of 1.00% for Class C shares for the first year only. The “without sales charge” returns do not include the effect of sales charges. If they had, returns would be lower.
Performance results reflect any fee waivers or reimbursements of fund expenses by the investment advisor and/or any of its affiliates. Absent these fee waivers or expense reimbursement arrangements, performance results would have been lower.
All results shown assume reinvestment of distributions.
The Fund commenced operations on March 31, 2008. Class A, Class C, and Class Z share performance information includes the performance of Shares class shares of Core Bond Fund, the predecessor to the Fund and a series of Excelsior Funds, Inc. (the “Predecessor Fund”), for periods prior to March 31, 2008. These returns reflect any differences in sales charges, but have not been restated to reflect any differences in expenses between the Predecessor Fund share class and the newer share classes. If differences in expenses had been reflected, the returns shown for periods prior to March 31, 2008 would be lower for Class A and Class C shares, since these newer classes of shares are subject to higher distribution and service (Rule 12b-1) fees.
Class Z shares are sold at net asset value with no distribution and service (Rule 12b-1) fees. Class Z shares have limited eligibility and the investment minimum requirements may vary. Please see the fund’s prospectus for details. Performance for different share classes will vary based on differences in sales charges and fees associated with each class.
The tables do not reflect the deduction of taxes that a shareholder may pay on fund distributions or on the redemption of fund shares.
4
Understanding Your Expenses – Columbia Bond Fund
Estimating your actual expenses
To estimate the expenses that you paid over the period, first you will need your account balance at the end of the period:
| | n | | For shareholders who receive their account statements from Columbia Management Services, Inc., your account balance is available online at www.columbiafunds.com or by calling Shareholder Services at 800.345.6611. | |
| | n | | For shareholders who receive their account statements from their financial intermediary, contact your financial intermediary to obtain your account balance. | |
| | 1. | Divide your ending account balance by $1,000. For example, if an account balance was $8,600 at the end of the period, the result would be 8.6. | |
| | 2. | In the section of the table below titled “Expenses paid during the period,” locate the amount for your share class. You will find this number in the column labeled “Actual.” Multiply this number by the result from step 1. Your answer is an estimate of the expenses you paid on your account during the period. | |
If the value of your account falls below the minimum initial investment requirement applicable to you, your account generally will be subject to a $20 annual fee. This fee is not included in the accompanying table. If you are subject to the fee, keep it in mind when you are estimating the ongoing expenses of investing in the fund and when comparing the expenses of this fund with other funds.
As a fund shareholder, you incur two types of costs. There are transaction costs, which generally include sales charges on purchases and may include redemption fees or exchange fees. There are also ongoing costs, which generally include investment advisory fees, distribution and service (Rule 12b-1) fees and other fund expenses. The information on this page is intended to help you understand the ongoing costs of investing in the fund and to compare these costs with the ongoing costs of investing in other mutual funds.
Analyzing your fund’s expenses by share class
To illustrate these ongoing costs, we have provided an example and calculated the expenses paid by investors in each share class during the period. The information in the following table is based on an initial investment of $1,000, which is invested at the beginning of the period and held for the entire period. Expense information is calculated two ways and each method provides you with different information. The amount listed in the “Actual” column is calculated using the fund’s actual operating expenses and total return for the period. The amount listed in the “Hypothetical” column for each share class assumes that the return each year is 5% before expenses and is calculated based on the fund’s actual operating expenses. You should not use the hypothetical account values and expenses to estimate either your actual account balance at the end of the period or the expenses you paid during this period.
Compare with other funds
Since all mutual funds are required to include the same hypothetical calculations about expenses in shareholder reports, you can use this information to compare the ongoing cost of investing in the fund with other funds. To do so, compare the 5% hypothetical example with the 5% hypothetical examples that appear in the shareholder reports of other funds. As you compare hypothetical examples of other funds, it is important to note that hypothetical examples are meant to highlight the ongoing costs of investing in a fund and do not reflect any transaction costs, such as sales charges, redemption fees or exchange fees.
| | | | | | | | | | | | | | |
| 10/01/08 – 03/31/09 Columbia Bond Fund |
| | | | | | | | | | | | | | |
| | | | |
| | | Account value at the
beginning of the period ($) | | Account value at the
end of the period ($) | | Expenses paid
during the period ($) | | Fund’s annualized
expense ratio (%) |
| | | Actual | | Hypothetical | | Actual | | Hypothetical | | Actual | | Hypothetical | | Actual |
Class A | | 1,000.00 | | 1,000.00 | | 1,030.32 | | 1,020.39 | | 4.61 | | 4.58 | | 0.91 |
Class C | | 1,000.00 | | 1,000.00 | | 1,026.58 | | 1,016.65 | | 8.39 | | 8.35 | | 1.66 |
Class Z | | 1,000.00 | | 1,000.00 | | 1,031.91 | | 1,021.64 | | 3.34 | | 3.33 | | 0.66 |
Expenses paid during the period are equal to the annualized expense ratio for the share class, multiplied by the average account value over the period, then multiplied by the number of days in the fund’s most recent fiscal half-year and divided by 365.
Had the investment advisor and/or any of its affiliates not waived fees or reimbursed a portion of expenses, account value at the end of the period would have been reduced.
It is important to note that the expense amounts shown in the table are meant to highlight only ongoing costs of investing in the fund and do not reflect any transaction costs, such as sales charges, redemption fees or exchange fees. Therefore, the hypothetical examples provided may not help you determine the relative total costs of owning shares of different funds. If these transaction costs were included, your costs would have been higher.
5
Portfolio Managers’ Report – Columbia Bond Fund
Performance data quoted represents past performance and current performance may be lower or higher. Past performance is no guarantee of future results. The investment return and principal value will fluctuate so that shares, when redeemed, may be worth more or less than the original cost. Please visit www.columbiafunds.com for daily and most recent month-end performance updates.
| | |
| Net asset value per share |
| | |
| |
as of 03/31/09 ($) | | |
Class A | | 8.79 |
Class C | | 8.80 |
Class Z | | 8.80 |
| | |
| Distributions declared per share |
| | |
| |
04/01/08 – 03/31/09 ($) | | |
Class A | | 0.39 |
Class C | | 0.32 |
Class Z | | 0.42 |
| | |
| |
as of 03/31/09 ($) | | |
Class A | | 4.17 |
Class C | | 3.42 |
Class Z | | 4.43 |
The 30-day SEC yields reflect the fund’s earning power, net of expenses, expressed as an annualized percentage of the public offering price at the end of the period.
| | |
| Portfolio structure |
|
as of 03/31/09 (%) |
Mortgage-Backed Securities | | 30.6 |
Corporate Bonds | | 26.1 |
Treasuries | | 13.7 |
Commercial Mortgage-Backed Securities | | 12.3 |
Government & Agency Obligations | | 6.3 |
Asset-Backed Securities | | 6.2 |
Cash and Equivalents | | 4.8 |
For the 12-month period that ended March 31, 2009, the fund’s Class A shares returned 1.04% without sales charge. The fund’s return was lower than the return of its benchmark, the Barclays Capital U.S. Aggregate Bond Index1, which returned 3.13% for the same period. The fund outperformed the average return of the funds in its peer group, the Lipper Corporate Debt Funds A Rated Classification2, which was negative 6.21% for the 12-month period. In a risk-averse environment, performance was almost entirely determined by credit quality and risk orientation.
Overweights in CMBS and ABS hampered performance
The fund underperformed its benchmark generally because it was overweight in commercial mortgage-backed securities (CMBS) and asset-backed securities (ABS). A slowdown in the housing market, a faltering national economy and a lack of confidence in a wide range of securitized investments induced a flight to quality among investors. Against this backdrop of economic uncertainty and investor fear, Treasury securities were the instruments of choice. Investor demand pushed long-term Treasury yields to all-time lows in late 2008, and short-term rates ended just above zero following a series of interventions by the Federal Reserve Board. For the 12 months as a whole, Treasury securities outperformed virtually all other fixed-income asset classes, in some cases by a significant margin.
Conservative security selection aided performance versus peer group
Although the fund underperformed the its benchmark, it held up significantly better than many of its peers because we hedged our asset-allocation decisions with conservative security selections. Our CMBS selections were almost exclusively seasoned securities at the high end of the credit tier, minimizing the fund’s exposure to the lax credit standards that have plagued more recent issues. A concentration in high-quality agency mortgages paid off when the federal government assumed control over the operations of Fannie Mae and Freddie Mac in the summer of 2008. In the months that followed, the government announced a series of recovery-oriented plans (notably the Troubled Asset Relief Plan, or TARP, and the Term Asset-Backed Securities Loan Facility, or TALF), and we positioned the fund to potentially benefit from these capital infusions. We reintroduced some banks into the fund’s corporate bond holdings following the passage of TARP, and these positions were additive to performance for the period. In addition, some of the fund’s ABS positions rallied nicely as a result of the TALF legislation, and we took some profits in this group during the first quarter of 2009. The overall impact of security selection was sufficiently positive that the fund easily outperformed its peer group average for the period.
1 | The Barclays Capital U.S. Aggregate Bond Index is a market value-weighted index that tracks the daily price, coupon, pay-downs and total return performance of fixed-rate, publicly placed, dollar-denominated and non-convertible investment grade debt issues with at least $250 million par amount outstanding and with at least one year to final maturity. Indices are not available for investment, and do not reflect sales charges, fees, brokerage commissions, taxes or other expenses of investing. Securities in the fund may not match those in an index. |
2 | Lipper Inc., a widely respected data provider in the industry, calculates an average total return (assuming reinvestment of distributions) for mutual funds with investment objectives similar to those of the fund. Lipper makes no adjustment for the effect of sales loads. |
6
Portfolio Managers’ Report (continued) – Columbia Bond Fund
| | |
| |
as of 03/31/09 (%) | | |
0-1 year | | 11.4 |
1-5 years | | 49.2 |
5-10 years | | 33.0 |
10-20 years | | 3.5 |
20+ years | | 2.9 |
| | |
| |
as of 03/31/09 (%) | | |
AAA | | 69.7 |
AA | | 5.6 |
A | | 13.5 |
BBB | | 6.4 |
Cash and equivalents | | 4.8 |
Ratings shown in the quality breakdown represent the rating assigned to a particular bond by one of the following nationally-recognized rating agencies: Standard and Poor’s, a division of the McGraw-Hill Companies, Inc., Moody’s Investors Service, Inc. or Fitch Ratings Ltd. Ratings are relative and subjective and are not absolute standards of quality. The fund’s credit quality does not remove market risk.
The fund is actively managed and the composition of its portfolio will change over time. Portfolio structure and maturity breakdown and quality breakdown are calculated as a percentage of net assets and percentage of total investments, respectively.
Looking ahead
We plan to continue to focus on the areas of the market under active sponsorship by the federal government, hedging our decisions by investing in high-quality assets. Implicit in this strategy is a vigilance that helps us separate short-term beneficiaries of the Treasury’s largesse from those issues that make attractive long-term investments in their own right. We have been cautiously optimistic that the government’s efforts will prove successful over time, and we note the market enters the new reporting period having shed at least some of the rampant pessimism that prevailed in 2008.
Investing in fixed-income securities may involve certain risks, including the credit quality of individual issuers, possible prepayments, market or economic developments and yields and share price fluctuations due to changes in interest rates. When interest rates go up, bond prices typically drop, and vice versa.
7
Investment Portfolio – Columbia Bond Fund
March 31, 2009
Corporate Fixed-Income Bonds & Notes – 29.8%
| | | | | | |
| | | | | Par ($) | | Value ($) |
| Basic Materials – 0.5% | | | | | | |
| Iron/Steel – 0.5% | | | | | | |
| Nucor Corp. | | 5.850% 06/01/18 | | 2,680,000 | | 2,675,996 |
| | | | | | |
| | Iron/Steel Total | | | | 2,675,996 |
| | | | | | |
| Basic Materials Total | | | | | | 2,675,996 |
| | | | | | |
| Communications – 3.4% | | | | | | |
| Media – 0.9% | | | | | | |
| | | |
| Comcast Cable Holdings LLC | | 9.800% 02/01/12 | | 2,600,000 | | 2,787,016 |
| | | |
| Time Warner Companies., Inc. | | 7.250% 10/15/17 | | 1,183,000 | | 1,122,824 |
| | | |
| Viacom, Inc. | | 5.750% 04/30/11 | | 694,000 | | 676,066 |
| | | | | | |
| | Media Total | | | | 4,585,906 |
| | | |
| Telecommunication Services – 2.5% | | | | | | |
| | | |
| America Movil S.A. de C.V. | | 5.500% 03/01/14 | | 2,615,000 | | 2,507,858 |
| | | |
| AT&T, Inc. | | 5.500% 02/01/18 | | 1,850,000 | | 1,788,867 |
| | 6.550% 02/15/39 | | 600,000 | | 544,189 |
| | | |
| British Telecommunications PLC | | 5.950% 01/15/18 | | 750,000 | | 610,413 |
| | | |
| Cisco Systems, Inc. | | 5.900% 02/15/39 | | 1,040,000 | | 955,570 |
| | | |
| Deutsche Telekom International Finance, Multi-Coupon Bond | | 8.750% 06/15/30 (a) | | 500,000 | | 534,154 |
| | | |
| Telefonica Emisiones SAU | | 6.421% 06/20/16 | | 2,000,000 | | 2,067,866 |
| | | |
| Verizon Wireless Capital LLC | | 5.550% 02/01/14 (b) | | 2,145,000 | | 2,146,793 |
| | 8.500% 11/15/18 (b) | | 915,000 | | 1,045,224 |
| | | | | | |
| | Telecommunication Services Total | | | | 12,200,934 |
| | | | | | |
| Communications Total | | | | | | 16,786,840 |
| | | | | | |
| Consumer Cyclical – 0.2% | | | | | | |
| Retail – 0.2% | | | | | | |
| CVS Pass-Through Trust | | 6.036% 12/10/28 (b) | | 947,433 | | 712,006 |
| | | |
| McDonald’s Corp. | | 5.000% 02/01/19 | | 200,000 | | 208,015 |
| | | | | | |
| | Retail Total | | | | 920,021 |
| | | | | | |
| Consumer Cyclical Total | | | | | | 920,021 |
| | | | | | |
See Accompanying Notes to Financial Statements.
8
Columbia Bond Fund
March 31, 2009
Corporate Fixed-Income Bonds & Notes (continued)
| | | | | | |
| | | | | Par ($) | | Value ($) |
| Consumer Non-Cyclical – 2.4% | | | | | | |
| Beverages – 0.8% | | | | | | |
| Anheuser-Busch InBev Worldwide, Inc. | | 7.750% 01/15/19 (b) | | 1,585,000 | | 1,580,405 |
| | | |
| Bottling Group LLC | | 5.125% 01/15/19 | | 680,000 | | 684,375 |
| | 5.500% 04/01/16 | | 1,520,000 | | 1,614,907 |
| | | | | | |
| | Beverages Total | | | | 3,879,687 |
| | | |
| Food – 0.8% | | | | | | |
| Campbell Soup Co. | | 4.500% 02/15/19 | | 990,000 | | 986,780 |
| | | |
| ConAgra Foods, Inc. | | 7.000% 10/01/28 | | 1,300,000 | | 1,257,153 |
| | | |
| Kraft Foods, Inc. | | 6.500% 08/11/17 | | 750,000 | | 772,303 |
| | | |
| Kroger Co. | | 8.000% 09/15/29 | | 750,000 | | 806,106 |
| | | | | | |
| | Food Total | | | | 3,822,342 |
| | | |
| Healthcare Services – 0.4% | | | | | | |
| UnitedHealth Group, Inc. | | 6.000% 06/15/17 | | 1,600,000 | | 1,488,047 |
| | | |
| WellPoint, Inc. | | 7.000% 02/15/19 | | 635,000 | | 635,342 |
| | | | | | |
| | Healthcare Services Total | | | | 2,123,389 |
| | | |
| Household Products/Wares – 0.1% | | | | | | |
| Fortune Brands, Inc. | | 5.125% 01/15/11 | | 750,000 | | 736,072 |
| | | | | | |
| | Household Products/Wares Total | | | | 736,072 |
| | | |
| Pharmaceuticals – 0.3% | | | | | | |
| Novartis Securities Investment Ltd. | | 5.125% 02/10/19 | | 1,300,000 | | 1,319,919 |
| | | | | | |
| | Pharmaceuticals Total | | | | 1,319,919 |
| | | | | | |
| Consumer Non-Cyclical Total | | | | | | 11,881,409 |
| | | | | | |
| Energy – 2.9% | | | | | | |
| Oil & Gas – 0.7% | | | | | | |
| Devon Energy Corp. | | 6.300% 01/15/19 | | 485,000 | | 473,202 |
| | | |
| Marathon Oil Corp. | | 7.500% 02/15/19 | | 440,000 | | 443,295 |
| | | |
| Nexen, Inc. | | 5.650% 05/15/17 | | 1,000,000 | | 842,169 |
| | | |
| Talisman Energy, Inc. | | 5.850% 02/01/37 | | 750,000 | | 506,186 |
| | | |
| Valero Energy Corp. | | 6.875% 04/15/12 | | 1,300,000 | | 1,312,028 |
| | | | | | |
| | Oil & Gas Total | | | | 3,576,880 |
| | | |
| Oil & Gas Services – 1.0% | | | | | | |
| Halliburton Co. | | 5.900% 09/15/18 | | 1,500,000 | | 1,544,821 |
| | | |
| Smith International, Inc. | | 9.750% 03/15/19 | | 705,000 | | 736,420 |
| | | |
| Weatherford International Ltd. | | 5.150% 03/15/13 | | 3,000,000 | | 2,791,266 |
| | | | | | |
| | Oil & Gas Services Total | | | | 5,072,507 |
See Accompanying Notes to Financial Statements.
9
Columbia Bond Fund
March 31, 2009
Corporate Fixed-Income Bonds & Notes (continued)
| | | | | | |
| | | | | Par ($) | | Value ($) |
| Energy (continued) | | | | | | |
| Oil, Gas & Consumable Fuels – 0.4% | | | | |
| ConocoPhillips | | 4.400% 05/15/13 | | 1,965,000 | | 1,999,714 |
| | | | | | |
| | Oil, Gas & Consumable Fuels Total | | | | 1,999,714 |
| | | |
| Pipelines – 0.8% | | | | | | |
| Enbridge Energy Partners LP | | 7.500% 04/15/38 | | 750,000 | | 597,880 |
| | | |
| Energy Transfer Partners LP | | 6.000% 07/01/13 | | 1,145,000 | | 1,082,587 |
| | | |
| Kinder Morgan Energy Partners LP | | 6.950% 01/15/38 | | 750,000 | | 641,779 |
| | | |
| Plains All American Pipeline LP/PAA Finance Corp. | | 6.650% 01/15/37 | | 750,000 | | 543,603 |
| | | |
| TransCanada Pipelines Ltd. | | 7.625% 01/15/39 | | 1,000,000 | | 988,806 |
| | | | | | |
| | Pipelines Total | | | | 3,854,655 |
| | | | | | |
| Energy Total | | | | | | 14,503,756 |
| | | | | | |
| Financials – 14.7% | | | | | | |
| Banks – 6.7% | | | | | | |
| Bank One Corp. | | 7.875% 08/01/10 | | 5,700,000 | | 5,853,535 |
| | | |
| Barclays Bank PLC | | 5.926% 12/31/49 (a)(b)(c) | | 3,000,000 | | 1,006,230 |
| | | |
| Capital One Financial Corp. | | 5.700% 09/15/11 | | 750,000 | | 675,289 |
| | | |
| Citigroup, Inc. | | 5.250% 02/27/12 | | 2,605,000 | | 2,321,357 |
| | 6.500% 08/19/13 | | 1,900,000 | | 1,745,938 |
| | | |
| Comerica Bank | | 5.200% 08/22/17 | | 695,000 | | 481,992 |
| | 5.750% 11/21/16 | | 250,000 | | 184,950 |
| | | |
| Credit Suisse/New York NY | | 5.000% 05/15/13 | | 2,215,000 | | 2,140,312 |
| | | |
| Deutsche Bank AG | | 4.875% 05/20/13 | | 4,000,000 | | 3,923,440 |
| | | |
| Goldman Sachs Capital II | | 5.793% 12/29/49 (a) | | 1,940,000 | | 807,702 |
| | | |
| Goldman Sachs Group, Inc. | | 1.700% 03/15/11 (j) | | 1,525,000 | | 1,530,435 |
| | 6.250% 09/01/17 | | 1,240,000 | | 1,149,081 |
| | | |
| JPMorgan Chase Capital XXII | | 6.450% 02/02/37 | | 1,340,000 | | 847,279 |
| | | |
| KeyBank NA | | 5.800% 07/01/14 | | 700,000 | | 585,436 |
| | | |
| Keycorp | | 6.500% 05/14/13 | | 2,000,000 | | 1,951,670 |
| | | |
| National City Corp. | | 3.125% 04/30/09 | | 500,000 | | 499,570 |
| | 4.900% 01/15/15 | | 575,000 | | 528,986 |
| | | |
| Northern Trust Corp. | | 5.500% 08/15/13 | | 2,400,000 | | 2,511,835 |
| | | |
| UBS Preferred Funding Trust I | | 8.622% 10/29/49 (a)(c) | | 1,115,000 | | 447,485 |
See Accompanying Notes to Financial Statements.
10
Columbia Bond Fund
March 31, 2009
Corporate Fixed-Income Bonds & Notes (continued)
| | | | | | |
| | | | | Par ($) | | Value ($) |
| Financials (continued) | | | | | | |
| USB Capital IX | | 6.189% 04/15/49 (a) | | 320,000 | | 126,400 |
| | | |
| Wachovia Corp. | | 5.500% 05/01/13 | | 4,230,000 | | 3,900,284 |
| | | | | | |
| | Banks Total | | | | 33,219,206 |
| | | |
| Commercial Banks – 5.2% | | | | | | |
| Citibank NA | | 1.625% 03/30/11 | | 25,750,000 | | 25,793,492 |
| | | | | | |
| | Commercial Banks Total | | | | 25,793,492 |
| | |
| Diversified Financial Services – 1.4% | | | | |
| General Electric Capital Corp. | | 5.450% 01/15/13 | | 985,000 | | 948,565 |
| | 6.875% 01/10/39 | | 2,290,000 | | 1,867,701 |
| | | |
| General Electric Capital Corp., MTN | | 5.000% 11/15/11 | | 1,400,000 | | 1,392,209 |
| | | |
| International Lease Finance Corp. | | 4.875% 09/01/10 | | 900,000 | | 657,456 |
| | | |
| Lehman Brothers Holdings, Inc. | | 5.625% 01/24/13 (d)(e) | | 2,620,000 | | 334,050 |
| | | |
| Morgan Stanley | | 6.750% 04/15/11 | | 2,000,000 | | 2,001,540 |
| | | | | | |
| | Diversified Financial Services Total | | | | 7,201,521 |
| | | |
| Insurance – 1.4% | | | | | | |
| | | |
| ING Groep NV | | 5.775% 12/29/49 (a) | | 850,000 | | 233,750 |
| | | |
| MetLife, Inc. | | 7.717% 02/15/19 | | 1,370,000 | | 1,228,426 |
| | | |
| Metropolitan Life Global Funding I | | 5.125% 04/10/13 (b) | | 2,000,000 | | 1,826,582 |
| | | |
| New York Life Global Funding | | 4.650% 05/09/13 (b) | | 2,000,000 | | 1,947,562 |
| | | |
| Principal Life Income Funding Trusts | | 5.300% 04/24/13 | | 2,000,000 | | 1,837,372 |
| | | | | | |
| | Insurance Total | | | | 7,073,692 |
| | | | | | |
| Financials Total | | | | | | 73,287,911 |
| | | | | | |
| Industrials – 1.6% | | | | | | |
| Aerospace & Defense – 0.1% | | | | | | |
| Boeing Co. | | 6.000% 03/15/19 | | 755,000 | | 775,448 |
| | | | | | |
| | Aerospace & Defense Total | | | | 775,448 |
| | | |
| Machinery – 0.7% | | | | | | |
| Caterpillar Financial Services Corp. | | 4.850% 12/07/12 | | 265,000 | | 261,192 |
| | 5.850% 09/01/17 | | 2,715,000 | | 2,358,903 |
| | 7.050% 10/01/18 | | 920,000 | | 860,562 |
| | | | | | |
| | Machinery Total | | | | 3,480,657 |
| | | |
| Transportation – 0.8% | | | | | | |
| Burlington Northern Santa Fe Corp. | | 6.750% 07/15/11 | | 805,000 | | 848,968 |
| | | |
| Union Pacific Corp. | | 7.875% 01/15/19 | | 2,725,000 | | 3,005,182 |
| | | | | | |
| | Transportation Total | | | | 3,854,150 |
| | | | | | |
| Industrials Total | | | | | | 8,110,255 |
See Accompanying Notes to Financial Statements.
11
Columbia Bond Fund
March 31, 2009
Corporate Fixed-Income Bonds & Notes (continued)
| | | | | | |
| | | | | Par ($) | | Value ($) |
| Technology – 0.9% | | | | | | |
| Office/Business Equipment – 0.1% | | | | | | |
| Xerox Corp. | | 6.400% 03/15/16 | | 950,000 | | 724,339 |
| | | | | | |
| | Office/Business Equipment Total | | | | 724,339 |
| | | |
| Software – 0.8% | | | | | | |
| Oracle Corp. | | 5.250% 01/15/16 | | 3,825,000 | | 3,900,077 |
| | | | | | |
| | Software Total | | | | 3,900,077 |
| | | | | | |
| Technology Total | | | | | | 4,624,416 |
| | | | | | |
| Utilities – 3.2% | | | | | | |
| Electric – 3.0% | | | | | | |
| Commonwealth Edison Co. | | 5.950% 08/15/16 | | 1,000,000 | | 957,635 |
| | | |
Consolidated Edison Co.
of New York | | 5.850% 04/01/18 | | 2,500,000 | | 2,476,605 |
| | | |
| Duke Energy Carolinas LLC | | 5.100% 04/15/18 | | 1,000,000 | | 1,008,191 |
| | 5.250% 01/15/18 | | 2,000,000 | | 2,037,028 |
| | | |
| Georgia Power Co. | | 5.700% 06/01/17 | | 1,185,000 | | 1,225,018 |
| | | |
| Nisource Finance Corp. | | 5.250% 09/15/17 | | 685,000 | | 510,613 |
| | | |
| Oncor Electric Delivery Co. | | 5.950% 09/01/13 (b) | | 750,000 | | 726,606 |
| | | |
| Pacific Gas & Electric Co. | | 5.625% 11/30/17 (b) | | 2,500,000 | | 2,532,085 |
| | | |
| Peco Energy Co. | | 5.350% 03/01/18 | | 2,175,000 | | 2,109,572 |
| | | |
| Progress Energy, Inc. | | 7.100% 03/01/11 | | 1,300,000 | | 1,347,701 |
| | | | | | |
| | Electric Total | | | | 14,931,054 |
| | | |
| Gas – 0.2% | | | | | | |
| Atmos Energy Corp. | | 6.350% 06/15/17 | | 500,000 | | 448,618 |
| | | |
| | 8.500% 03/15/19 | | 800,000 | | 816,814 |
| | | | | | |
| | Gas Total | | | | 1,265,432 |
| | | | | | |
| Utilities Total | | | | | | 16,196,486 |
| | Total Corporate Fixed-Income Bonds & Notes
(cost of $156,813,409) | | | | 148,987,090 |
| | |
| Mortgage-Backed Securities – 29.4% | | | | |
| Federal Home Loan Mortgage Corporation | | 5.000% 03/01/21 | | 95,454 | | 99,190 |
| | 6.500% 10/01/37 | | 5,463,261 | | 5,766,101 |
| | 6.500% 01/01/39 | | 2,071,858 | | 2,186,705 |
| | 6.500% 02/01/39 | | 6,102,853 | | 6,441,147 |
| | 7.000% 12/01/35 | | 1,486,984 | | 1,585,358 |
See Accompanying Notes to Financial Statements.
12
Columbia Bond Fund
March 31, 2009
Mortgage-Backed Securities (continued)
| | | | | | |
| | | | | Par ($) | | Value ($) |
| | | | | | |
| Federal National Mortgage Association | | 4.000% 03/01/39 | | 27,433,000 | | 27,583,024 |
| | 4.500% 02/01/39 | | 47,124,899 | | 48,209,601 |
| | 5.000% 03/01/37 | | 4,188,753 | | 4,326,943 |
| | 5.000% 05/01/37 | | 5,736,878 | | 5,926,141 |
| | 5.000% 01/01/39 | | 15,585,181 | | 16,099,346 |
| | 5.500% 10/01/28 | | 168,975 | | 177,226 |
| | 5.500% 11/01/28 | | 291,763 | | 306,010 |
| | 5.500% 12/01/28 | | 5,387 | | 5,650 |
| | 5.500% 11/01/29 | | 426,273 | | 447,087 |
| | 5.500% 04/01/31 | | 251,969 | | 262,697 |
| | 5.500% 02/01/32 | | 1,113,401 | | 1,160,808 |
| | 5.500% 05/01/33 | | 48,544 | | 50,596 |
| | 5.500% 04/01/35 | | 619,054 | | 643,864 |
| | 5.500% 06/01/35 | | 553,449 | | 575,630 |
| | 6.500% 02/01/13 | | 102,617 | | 107,757 |
| | 6.500% 09/01/36 | | 1,094,678 | | 1,154,533 |
| | 6.500% 08/01/37 | | 7,332,362 | | 7,732,866 |
| | 6.500% 09/01/37 | | 2,364,222 | | 2,493,360 |
| | 6.500% 10/01/37 | | 2,719,810 | | 2,868,369 |
| | 6.500% 12/01/37 | | 2,818,761 | | 2,972,726 |
| | 6.500% 03/01/38 | | 1,182,438 | | 1,247,025 |
| | 7.500% 10/01/29 | | 60,190 | | 65,256 |
| | | |
| Government National Mortgage Association | | 4.500% 07/20/33 | | 1,459,729 | | 1,497,907 |
| | 4.500% 09/15/33 | | 665,918 | | 682,995 |
| | 5.000% 09/20/33 | | 1,335,479 | | 1,386,650 |
| | 5.375% 04/20/28 (a) | | 12,017 | | 12,230 |
| | 5.375% 06/20/28 (a) | | 96,572 | | 98,287 |
| | 6.000% 03/20/28 | | 221,675 | | 232,837 |
| | 6.500% 05/15/23 | | 2,578 | | 2,713 |
| | 6.500% 05/15/28 | | 101,551 | | 108,382 |
| | 6.500% 06/15/28 | | 44,429 | | 47,417 |
| | 6.500% 12/15/31 | | 153,362 | | 163,295 |
| | 6.500% 04/15/32 | | 22,230 | | 23,642 |
| | 7.000% 05/15/29 | | 108,921 | | 117,082 |
| | 7.500% 03/15/28 | | 44,838 | | 48,349 |
| | 8.000% 10/15/17 | | 124,627 | | 133,581 |
| | 8.000% 01/15/30 | | 176,406 | | 191,922 |
| | 8.500% 06/15/17 | | 240,368 | | 259,694 |
| | 8.500% 11/15/17 | | 105,583 | | 113,744 |
| | 8.500% 12/15/17 | | 491,620 | | 529,618 |
| | 9.000% 12/15/17 | | 448,824 | | 484,188 |
| | 9.000% 06/15/30 | | 28,261 | | 31,157 |
| | 9.500% 11/15/17 | | 367,714 | | 401,918 |
| | | | | | |
| | Total Mortgage-Backed Securities
(cost of $143,876,132) | | | | 147,062,624 |
See Accompanying Notes to Financial Statements.
13
Columbia Bond Fund
March 31, 2009
Government & Agency Obligations – 15.9%
| | | | | | |
| | | | | Par ($) | | Value ($) |
| Foreign Government Obligations – 1.4% | | | | |
| European Investment Bank | | 4.250% 07/15/13 | | 3,500,000 | | 3,683,421 |
| | | |
| International Bank for Reconstruction & Development | | 5.000% 04/01/16 | | 3,000,000 | | 3,263,724 |
| | | | | | |
| Foreign Government Obligations Total | | | | 6,947,145 |
| | | | |
| U.S. Government Agencies – 0.9% | | | | | | |
| Resolution Funding Corp., STRIPS | | (f) 01/15/21 (g) | | 7,010,000 | | 4,295,216 |
| | | | | | |
| U.S. Government Agencies Total | | | | | | 4,295,216 |
| | | | | | |
| U.S. Government Obligations – 13.6% | | | | |
| U.S. Treasury Bill | | 0.090% 04/09/09 (g) | | 21,250,000 | | 21,249,575 |
| | | |
| U.S. Treasury Bonds | | 4.500% 05/15/38 (g) | | 2,995,000 | | 3,496,663 |
| | 6.250% 05/15/30 | | 1,000,000 | | 1,387,812 |
| | | |
| U.S. Treasury Inflation Indexed Bonds | | 2.375% 01/15/27 (g) | | 4,077,481 | | 4,258,419 |
| | | |
| U.S. Treasury Inflation Indexed Notes | | 1.625% 01/15/18 | | 7,341,240 | | 7,419,241 |
| | | |
| U.S. Treasury Note/Bond | | 2.625% 02/29/16 (g) | | 7,000,000 | | 7,178,829 |
| | | |
| U.S. Treasury Notes | | 0.875% 02/28/11 (g) | | 45,000 | | 45,086 |
| | 1.875% 02/28/14 (g) | | 10,735,000 | | 10,852,441 |
| | 2.750% 02/15/19 (g) | | 8,500,000 | | 8,546,495 |
| | | |
| U.S. Treasury STRIPS | | (f) 11/15/19 (g) | | 5,230,000 | | 3,666,036 |
| | | | | | |
| U.S. Government Obligations Total | | | | | | 68,100,597 |
| | Total Government & Agency Obligations
(cost of $77,695,903) | | | | 79,342,958 |
| | |
| Commercial Mortgage-Backed Securities – 12.3% | | | | |
| Asset Securitization Corp. | | 7.212% 04/14/29 (a) | | 1,096,595 | | 1,096,829 |
| | | |
| Bank of America Commercial Mortgage, Inc. | | 4.760% 11/10/39 | | 2,497,000 | | 1,992,549 |
| | | |
| Bear Stearns Commercial Mortgage Securities | | 4.933% 02/13/42 (a) | | 2,290,000 | | 1,789,219 |
| | 5.518% 09/11/41 | | 5,000,000 | | 3,990,534 |
| | 5.742% 09/11/42 (a) | | 900,000 | | 674,018 |
| | | |
| Chase Commercial Mortgage Securities Corp. | | 5.857% 02/12/16 (a)(b) | | 4,415,000 | | 4,386,450 |
| | | |
| Credit Suisse First Boston Mortgage Securities Corp. | | 6.006% 11/15/36 (a)(b) | | 1,000,000 | | 539,304 |
See Accompanying Notes to Financial Statements.
14
Columbia Bond Fund
March 31, 2009
Commercial Mortgage-Backed Securities (continued)
| | | | | | |
| | | | | Par ($) | | Value ($) |
| | | | | | |
| GE Capital Commercial Mortgage Corp. | | 6.734% 01/15/33 (a) | | 6,775,000 | | 5,649,698 |
| | | |
| GMAC Commercial Mortgage Securities | | 6.983% 05/15/33 (a) | | 1,154,348 | | 1,152,213 |
| | | |
| Greenwich Capital Commercial Funding Corp. | | 5.317% 06/10/36 (a) | | 3,449,000 | | 2,949,186 |
| | | |
| JPMorgan Chase Commercial Mortgage Securities Corp. | | 5.440% 06/12/47 | | 1,280,000 | | 826,112 |
| | | |
| LB-UBS Commercial Mortgage Trust | | 5.611% 04/15/41 | | 1,211,235 | | 1,145,276 |
| | 6.462% 03/15/31 | | 2,360,000 | | 2,357,329 |
| | | |
| Merrill Lynch Mortgage Trust | | 4.747% 06/12/43 (a) | | 2,500,000 | | 1,812,557 |
| | | |
| Morgan Stanley Capital I | | 4.989% 08/13/42 | | 1,390,000 | | 1,118,219 |
| | 5.208% 11/14/42 (a) | | 1,220,000 | | 952,784 |
| | 5.328% 11/12/41 | | 3,000,000 | | 2,308,469 |
| | | |
Morgan Stanley Dean
Witter Capital I | | 4.740% 11/13/36 | | 1,245,000 | | 1,134,002 |
| | 5.980% 01/15/39 | | 1,790,000 | | 1,746,329 |
| | 7.500% 10/15/33 (a) | | 3,150,000 | | 3,182,434 |
| | | |
| Wachovia Bank Commercial Mortgage Trust | | 4.608% 12/15/35 | | 3,215,296 | | 3,140,534 |
| | 5.001% 07/15/41 | | 6,099,000 | | 5,875,038 |
| | 5.229% 07/15/41 (a) | | 3,905,000 | | 3,527,827 |
| | 5.609% 03/15/45 (a) | | 1,905,000 | | 925,410 |
| | 5.726% 06/15/45 | | 1,977,006 | | 1,975,214 |
| | 5.997% 06/15/45 | | 920,000 | | 785,900 |
| | 6.287% 04/15/34 | | 4,225,000 | | 4,147,119 |
| | | | | | |
| | Total Commercial Mortgage-Backed Securities
(cost of $69,174,507) | | | | 61,180,553 |
| | |
| Asset-Backed Securities – 6.2% | | | | |
| Capital Auto Receivables Asset Trust | | 4.460% 07/15/14 | | 4,690,000 | | 4,174,293 |
| | 5.210% 03/17/14 | | 2,015,000 | | 1,883,160 |
| | 5.500% 04/20/10 (b) | | 4,200,000 | | 4,161,449 |
| | | |
| Capital One Multi-Asset Execution Trust | | 0.536% 08/15/12 (a) | | 2,650,000 | | 2,605,917 |
| | 4.850% 11/15/13 | | 3,095,000 | | 3,077,994 |
| | 4.850% 02/18/14 | | 3,375,000 | | 3,341,066 |
| | | |
| Carmax Auto Owner Trust | | 5.270% 11/15/12 | | 1,500,000 | | 1,418,312 |
| | | |
| Chase Issuance Trust | | 4.260% 05/15/13 | | 2,355,000 | | 2,346,488 |
| | | |
| Daimler Chrysler Auto Trust | | 4.480% 08/08/14 | | 920 | | 687 |
See Accompanying Notes to Financial Statements.
15
Columbia Bond Fund
March 31, 2009
Asset-Backed Securities (continued)
| | | | | | | |
| | | | | Par ($) | | Value ($) | |
| | | | | | | |
| Discover Card Master Trust | | 5.100% 10/15/13 | | 2,315,000 | | 2,271,685 | |
| | | |
| Franklin Auto Trust | | 5.360% 05/20/16 | | 1,030,000 | | 987,259 | |
| | | |
| Honda Auto Receivables Owner Trust | | 4.470% 01/18/12 | | 1,635,000 | | 1,654,978 | |
| | | |
| USAA Auto Owner Trust | | 4.280% 10/15/12 | | 3,110,000 | | 3,141,273 | |
| | | | | | | |
| | Total Asset-Backed Securities
(cost of $31,873,458) | | | | 31,064,561 | |
| | |
| Collateralized Mortgage Obligations – 1.2% | | | | | |
| | | | | |
| Agency – 0.9% | | | | | | | |
| Federal Home Loan Mortgage Corporation | | 6.500% 07/15/31 | | 1,825,110 | | 1,904,540 | |
| | | |
| Federal National Mortgage Association | | 5.000% 08/25/27 | | 2,335,200 | | 2,344,906 | |
| | | | | | | |
| Agency Total | | | | | | 4,249,446 | |
| | | | | | | |
| Non-Agency – 0.3% | | | | | | | |
| Countrywide Alternative Loan Trust | | 5.500% 07/25/34 | | 1,845,772 | | 1,682,924 | |
| | | | | | | |
| Non-Agency Total | | | | | | 1,682,924 | |
| | Total Collateralized Mortgage Obligations
(cost of $6,105,881) | | | | 5,932,370 | |
| | | | | Shares | | | |
| Securities Lending Collateral – 10.7% | | | | | |
| | State Street Navigator Securities Lending Prime Portfolio (h) (7 day yield of 0.943%) | | 53,061,221 | | 53,061,221 | |
| | | | | | | |
| | Total Securities Lending Collateral
(cost of $53,061,221) | | | | 53,061,221 | |
| | | | | Par ($) | | | |
| Short-Term Obligation – 3.5% | | | | | | | |
| | Repurchase agreement with Fixed Income Clearing Corp., dated 03/31/09, due 04/01/09 at 0.140%, collateralized by a U.S. Government Agency Obligation maturing 01/22/13, market value $17,963,200 (repurchase proceeds $17,607,068) | | 17,607,000 | | 17,607,000 | |
| | | | | | | |
| | Total Short-Term Obligation (cost of $17,607,000) | | | | 17,607,000 | |
| | | | | | | |
| | Total Investments – 109.0% (cost of $556,207,511) (i) | | 544,238,377 | |
| | | | | | | |
| | Obligation to Return Collateral for Securities Loaned – (10.7)% | | | | (53,061,221 | ) |
| | | | | | | |
| | Other Assets & Liabilities, Net – 1.7% | | | | 8,313,376 | |
| | | | | | | |
| | Net Assets – 100.0% | | | | 499,490,532 | |
See Accompanying Notes to Financial Statements.
16
Columbia Bond Fund
March 31, 2009
Notes to Investment Portfolio:
| | (a) | The interest rate shown on floating rate or variable rate securities reflects the rate at March 31, 2009. |
| | (b) | Security exempt from registration pursuant to Rule 144A under the Securities Act of 1933. These securities may be resold in transactions exempt from registration, normally to qualified institutional buyers. At March 31, 2009, these securities, which are not illiquid, except for the following, amounted to $22,610,696, which represents 4.5% of net assets. |
| | | | | | | | | | | |
Security | | Acquisition
Date | | Par | | Cost | | Value |
Capital Auto Receivables Asset Trust 5.500% 04/20/10 | | 08/22/06 | | $ | 4,200,000 | | $ | 4,199,596 | | $ | 4,161,449 |
Chase Commercial Mortgage Securities Corp. 5.857% 02/12/16 | | 08/14/08 | | | 4,415,000 | | | 4,493,724 | | | 4,386,450 |
| | | | | | | | | | | |
| | | | | | | | | | $ | 8,547,899 |
| | | | | | | | | | | |
| | (c) | Perpetual Maturity. Maturity date presented represents the next call date. |
| | (d) | The issuer filed for bankruptcy protection under Chapter 11 and is in default of certain debt covenants. Income is not being accrued. At March 31, 2009, the value of this security amounted to $334,050, which represents 0.1% of net assets. |
| | (e) | Represents fair value as determined in good faith under procedures approved by the Board of Trustees. |
| | (g) | All or a portion of this security was on loan at March 31, 2009. The total market value of securities on loan at March 31, 2009 is $52,034,655. |
| | (h) | Investment made with cash collateral received from securities lending activity. |
| | (i) | Cost for federal income tax purposes is $556,432,447. |
| | (j) | Security is guaranteed by the Federal Deposit Insurance Company. |
On April 1, 2008, the Fund adopted Statement of Financial Accounting Standards No. 157, Fair Value Measurements (“SFAS 157”). SFAS 157 establishes a hierarchy that prioritizes the inputs to valuation techniques used to measure fair value giving the highest priority to unadjusted quoted prices in active markets for identical securities (level 1 measurements) and the lowest priority to unobservable inputs (level 3 measurements) when market prices are not readily available or reliable. The three levels of the fair value hierarchy under SFAS 157 are described below:
| | • | | Level 1 – quoted prices in active markets for identical securities |
| | • | | Level 2 – prices determined using other significant observable inputs (including quoted prices for similar securities, interest rates, prepayment speeds, credit risk and others) |
| | • | | Level 3 – prices determined using significant unobservable inputs. In situations where quoted prices or observable inputs are unavailable or less reliable, unobservable inputs may be used. Unobservable inputs may include management’s own assumptions about the factors market participants would use in pricing an investment. |
The inputs or methodology used for valuing securities are not necessarily an indication of the risk associated with investing in those securities.
The following table summarize the inputs used, as of March 31, 2009 in valuing each Fund’s assets:
| | | | | | |
Valuation Inputs | | Investments in
Securities | | Other Financial
Instruments |
Level 1 – Quoted Prices | | $ | 117,495,781 | | $ | — |
Level 2 – Other Significant Observable Inputs | | | 426,742,596 | | | — |
Level 3 – Significant Unobservable Inputs | | | — | | | — |
| | | | | | |
Total | | $ | 544,238,377 | | $ | — |
| | | | | | |
At March 31, 2009, the asset allocation of the Fund is as follows:
| | | |
Asset Allocation (Unaudited) | | % of Net
Assets | |
Corporate Fixed-Income Bonds & Notes | | 29.8 | |
Mortgage-Backed Securities | | 29.4 | |
Government & Agency Obligations | | 15.9 | |
Commercial Mortgage-Backed Securities | | 12.3 | |
Asset-Backed Securities | | 6.2 | |
Collateralized Mortgage Obligations | | 1.2 | |
| | | |
| | 94.8 | |
Securities Lending Collateral | | 10.7 | |
Short-Term Obligation | | 3.5 | |
Obligation to Return Collateral for Securities Loaned | | (10.7 | ) |
Other Assets & Liabilities, Net | | 1.7 | |
| | | |
| | 100.0 | % |
| | | |
| | |
Acronym | | Name |
| MTN | | Medium-Term Note |
| STRIPS | | Separate Trading of Registered Interest and Principal of Securities |
See Accompanying Notes to Financial Statements.
17
Statement of Assets and Liabilities – Columbia Bond Fund
March 31, 2009
| | | | | | |
| | | | | ($) | |
| Assets | | Investments, at cost | | | 556,207,511 | |
| | | | | | |
| | Investments at value (including securities
on loan of $52,034,655) | | | 544,238,377 | |
| | Cash | | | 1,626 | |
| | Receivable for: | | | | |
| | Investments sold | | | 11,926,374 | |
| | Fund shares sold | | | 827,653 | |
| | Interest | | | 3,290,506 | |
| | Securities lending | | | 28,848 | |
| | Foreign tax reclaims | | | 1,884 | |
| | Expense reimbursement due from
investment advisor and /or administrator | | | 74,844 | |
| | Trustees’ deferred compensation plan | | | 3,517 | |
| | Other assets | | | 39,662 | |
| | | | | | |
| | Total Assets | | | 560,433,291 | |
| | |
| Liabilities | | Collateral on securities loaned | | | 53,061,221 | |
| | Payable for: | | | | |
| | Investments purchased | | | 5,829,659 | |
| | Fund shares repurchased | | | 339,290 | |
| | Distributions | | | 1,174,651 | |
| | Investment advisory fee | | | 280,924 | |
| | Administration fee | | | 57,765 | |
| | Transfer agent fee | | | 82,242 | |
| | Trustees’ fees | | | 2,365 | |
| | Pricing and bookkeeping fees | | | 13,331 | |
| | Custody fee | | | 5,863 | |
| | Distribution and service fees | | | 1,927 | |
| | Chief compliance officer expenses | | | 197 | |
| | Trustees’ deferred compensation plan | | | 3,517 | |
| | Other liabilities | | | 89,807 | |
| | | | | | |
| | Total Liabilities | | | 60,942,759 | |
| | |
| | | | | | |
| | Net Assets | | | 499,490,532 | |
| | |
| Net Assets Consist of | | Paid-in capital | | | 511,744,983 | |
| | Undistributed net investment income | | | 560,843 | |
| | Accumulated net realized loss | | | (846,160 | ) |
| | Net unrealized appreciation (depreciation) on investments | | | (11,969,134 | ) |
| | | | | | |
| | Net Assets | | | 499,490,532 | |
| | |
| Class A | | Net assets | | $ | 5,299,030 | |
| | Shares outstanding | | | 602,990 | |
| | Net asset value per share | | $ | 8.79 | (a) |
| | Maximum sales charge | | | 4.75 | % |
| | Maximum offering price per share ($8.79/.9525) | | $ | 9.23 | (b) |
| | |
| Class C | | Net assets | | $ | 1,317,178 | |
| | Shares outstanding | | | 149,748 | |
| | Net asset value and offering price per share | | $ | 8.80 | (a) |
| | |
| Class Z | | Net assets | | $ | 492,874,324 | |
| | Shares outstanding | | | 56,033,558 | |
| | Net asset value and offering price per share | | $ | 8.80 | |
| (a) | Redemption price per share is equal to net asset value less any applicable contingent deferred sales charge. |
| (b) | On sales of $50,000 or more the offering price is reduced. |
See Accompanying Notes to Financial Statements.
18
Statement of Operations – Columbia Bond Fund
For the Year Ended March 31, 2009
| | | | | |
| | | | | ($) | |
| Investment Income | | Interest | | 27,723,356 | |
| | Securities lending | | 305,238 | |
| | | | | |
| | Total Investment Income | | 28,028,594 | |
| | |
| Expenses | | Investment advisory fee | | 3,357,269 | |
| | Administration fee | | 678,588 | |
| | Distribution fee: | | | |
| | Class C | | 1,950 | |
| | Service fee: | | | |
| | Class A | | 2,546 | |
| | Class C | | 647 | |
| | Transfer agent fee | | 246,192 | |
| | Pricing and bookkeeping fees | | 129,842 | |
| | Trustees’ fees | | 27,777 | |
| | Custody fee | | 26,355 | |
| | Chief compliance officer expenses | | 788 | |
| | Other expenses | | 213,656 | |
| | | | | |
| | Expenses before Interest Expense | | 4,685,610 | |
| | Interest expense | | 52 | |
| | | | | |
| | Total Expenses | | 4,685,662 | |
| | |
| | Fees waived or expenses reimbursed
by investment advisor and/or administrator | | (1,177,644 | ) |
| | Expense reductions | | (1,068 | ) |
| | | | | |
| | Net Expenses | | 3,506,950 | |
| | |
| | | | | |
| | Net Investment Income | | 24,521,644 | |
| | |
| Net Realized and Unrealized Gain (Loss) on Investments and Futures Contracts | | Net realized gain (loss) on: | | | |
| | Investments | | (1,965,904 | ) |
| | Futures contracts | | 1,317,884 | |
| | | | | |
| | Net realized loss | | (648,020 | ) |
| | |
| | Net change in unrealized appreciation (depreciation) on: | | | |
| | Investments | | (17,648,023 | ) |
| | Futures contracts | | (1,314 | ) |
| | | | | |
| | Net change in unrealized appreciation (depreciation) | | (17,649,337 | ) |
| | |
| | | | | |
| | Net Loss | | (18,297,357 | ) |
| | |
| | | | | |
| | Net Increase Resulting from Operations | | 6,224,287 | |
See Accompanying Notes to Financial Statements.
19
Statement of Changes in Net Assets – Columbia Bond Fund
| | | | | | | | |
| | | | | Year Ended March 31, | |
| Increase (Decrease) in Net Assets | | | | 2009 ($) | | | 2008 ($)
(a)(b)(c)(d) | |
| Operations | | Net investment income | | 24,521,644 | | | 24,982,891 | |
| | Net realized gain (loss) on investments, futures contracts and swap contracts | | (648,020 | ) | | 2,406,472 | |
| | Net change in unrealized appreciation (depreciation) on investments and futures contracts | | (17,649,337 | ) | | 4,583,516 | |
| | | | | | | | |
| | Net increase resulting from operations | | 6,224,287 | | | 31,972,879 | |
| | | |
| Distributions to Shareholders | | From net investment income: | | | | | | |
| | Class A | | (40,386 | ) | | (1 | ) |
| | Class C | | (8,574 | ) | | (1 | ) |
| | Institutional Shares | | — | | | (10,326,953 | ) |
| | Retirement Shares | | — | | | (42 | ) |
| | Class Z | | (24,282,274 | ) | | (14,316,268 | ) |
| | From net realized gains: | | | | | | |
| | Class A | | (217 | ) | | — | |
| | Class C | | (13 | ) | | — | |
| | Class Z | | (729,525 | ) | | — | |
| | | | | | | | |
| | Total distributions to shareholders | | (25,060,989 | ) | | (24,643,265 | ) |
| | | |
| | Net Capital Stock Transactions | | (28,473,745 | ) | | (12,248,408 | ) |
| | | | | | | | |
| | Total decrease in net assets | | (47,310,447 | ) | | (4,918,794 | ) |
| | | |
| Net Assets | | Beginning of period | | 546,800,979 | | | 551,719,773 | |
| | End of period | | 499,490,532 | | | 546,800,979 | |
| | Undistributed net investment income at end of period | | 560,843 | | | 360,172 | |
| (a) | The Fund’s Class A and Class C shares commenced operations on March 31, 2008. |
| (b) | On March 31, 2008, the Predecessor Fund’s Shares class was reorganized into the Fund’s Class Z shares. The financial information of Class Z shares includes the financial information of the Predecessor Fund’s Share class. |
| (c) | On March 31, 2008, the Predecessor Fund’s Institutional Shares class was reorganized into the Fund’s Class Z shares. |
| (d) | On March 25, 2008, the Retirement Shares class was fully redeemed. |
See Accompanying Notes to Financial Statements.
20
Statement of Changes in Net Assets (continued) – Columbia Bond Fund
| | | | | | | | | | | | |
| | | Year Ended March 31, | |
| | | 2009 | | | 2008 | |
| Capital Stock Activity | | Shares | | | Dollars ($) | | | Shares | | | Dollars ($)
(a)(b)(c)(d) | |
Class A | | | | | | | | | | | | |
Subscriptions | | 715,769 | | | 6,264,548 | | | 1,086 | | | 10,000 | |
Distributions reinvested | | 4,349 | | | 37,949 | | | — | | | — | |
Redemptions | | (118,214 | ) | | (1,033,619 | ) | | — | | | — | |
| | | | | | | | | | | | |
Net increase | | 601,904 | | | 5,268,878 | | | 1,086 | | | 10,000 | |
| | | | |
Class C | | | | | | | | | | | | |
Subscriptions | | 150,374 | | | 1,310,459 | | | 1,086 | | | 10,000 | |
Distributions reinvested | | 832 | | | 7,241 | | | — | | | — | |
Redemptions | | (2,544 | ) | | (22,388 | ) | | — | | | — | |
| | | | | | | | | | | | |
Net increase | | 148,662 | | | 1,295,312 | | | 1,086 | | | 10,000 | |
| | | | |
Institutional Shares | | | | | | | | | | | | |
Subscriptions | | — | | | — | | | 2,255,471 | | | 20,245,143 | |
Distributions reinvested | | — | | | — | | | 180,630 | | | 1,623,268 | |
Exchange in connection with reorganization | | — | | | — | | | (23,599,367 | ) | | (214,186,055 | ) |
Redemptions | | — | | | — | | | (5,306,613 | ) | | (47,614,408 | ) |
| | | | | | | | | | | | |
Net decrease | | — | | | — | | | (26,469,879 | ) | | (239,932,052 | ) |
| | | | |
Retirement Shares | | | | | | | | | | | | |
Distributions reinvested | | — | | | — | | | 5 | | | 39 | |
Redemptions | | — | | | — | | | (124 | ) | | (1,120 | ) |
| | | | | | | | | | | | |
Net decrease | | — | | | — | | | (119 | ) | | (1,081 | ) |
| | | | |
Class Z | | | | | | | | | | | | |
Subscriptions | | 14,064,009 | | | 123,836,901 | | | 8,925,765 | | | 80,128,049 | |
Distributions reinvested | | 1,004,751 | | | 8,815,368 | | | 698,481 | | | 6,292,953 | |
Exchange in connection with reorganization | | — | | | — | | | 23,625,387 | | | 214,186,055 | |
Redemptions | | (19,178,104 | ) | | (167,690,204 | ) | | (8,072,458 | ) | | (72,942,332 | ) |
| | | | | | | | | | | | |
Net increase (decrease) | | (4,109,344 | ) | | (35,037,935 | ) | | 25,177,175 | | | 227,664,725 | |
| (a) | The Fund’s Class A and Class C shares commenced operations on March 31, 2008. |
| (b) | On March 31, 2008, the Predecessor Fund’s Shares class was reorganized into the Fund’s Class Z shares. The financial information of Class Z shares includes the financial information of the Predecessor Fund’s Shares class. |
| (c) | On March 31, 2008, the Predecessor Fund’s Institutional Shares class was reorganized into the Fund’s Class Z shares. |
| (d) | On March 25, 2008, the Retirement Shares class was fully redeemed. |
See Accompanying Notes to Financial Statements.
21
Financial Highlights – Columbia Bond Fund
Selected data for a share outstanding throughout each period is as follows:
| | | | | | | | |
| Class A Shares | | Year Ended
March 31,
2009 | | | Period Ended
March 31,
2008 (a) | |
Net Asset Value, Beginning of Period | | $ | 9.09 | | | $ | 9.09 | |
| | |
Income from Investment Operations: | | | | | | | | |
Net investment income (b) | | | 0.35 | | | | — | (c) |
Net realized and unrealized gain (loss) on investments and futures contracts | | | (0.26 | ) | | | — | (c) |
| | | | | | | | |
Total from investment operations | | | 0.09 | | | | — | (c) |
| | |
Less Distributions to Shareholders: | | | | | | | | |
From net investment income | | | (0.38 | ) | | | — | (c) |
From net realized gains | | | (0.01 | ) | | | — | |
| | | | | | | | |
Total distributions to shareholders | | | (0.39 | ) | | | — | (c) |
| | |
Net Asset Value, End of Period | | $ | 8.79 | | | $ | 9.09 | |
Total return (d)(e) | | | 1.04 | % | | | 0.01 | %(f) |
| | |
Ratios to Average Net Assets/Supplemental Data: | | | | | | | | |
Net expenses before interest expense (h) | | | 0.91 | % | | | 0.91 | %(i) |
Interest expense | | | — | %(g) | | | — | |
Net expenses (h) | | | 0.91 | % | | | 0.91 | %(i) |
Waiver/Reimbursement | | | 0.22 | % | | | 0.14 | %(i) |
Net investment income (h) | | | 3.99 | % | | | 4.16 | %(i) |
Portfolio turnover rate | | | 209 | % | | | 49 | %(f) |
Net assets, end of period (000’s) | | $ | 5,299 | | | $ | 10 | |
| (a) | Class A shares commenced operations on March 31, 2008. Per share data and total return reflect activity from that date. |
| (b) | Per share data was calculated using the average shares outstanding during the period. |
| (c) | Rounds to less than $0.01 per share. |
| (d) | Had the investment advisor and/or any of its affiliates not waived fees or reimbursed a portion of expenses, total return would have been reduced. |
| (e) | Total return at net asset value assuming all distributions reinvested and no initial sales charge or contingent deferred sales charge. |
| (g) | Rounds to less than 0.01%. |
| (h) | The benefits derived from expense reductions had an impact of less than 0.01%. |
See Accompanying Notes to Financial Statements.
22
Financial Highlights – Columbia Bond Fund
Selected data for a share outstanding throughout each period is as follows:
| | | | | | | | |
| Class C Shares | | Year Ended
March 31,
2009 | | | Period Ended
March 31,
2008 (a) | |
Net Asset Value, Beginning of Period | | $ | 9.09 | | | $ | 9.09 | |
| | |
Income from Investment Operations: | | | | | | | | |
Net investment income (b) | | | 0.29 | | | | — | (c) |
Net realized and unrealized gain (loss) on investments and futures contracts | | | (0.26 | ) | | | — | (c) |
| | | | | | | | |
Total from investment operations | | | 0.03 | | | | — | (c) |
| | |
Less Distributions to Shareholders: | | | | | | | | |
From net investment income | | | (0.31 | ) | | | — | (c) |
From net realized gains | | | (0.01 | ) | | | — | |
| | | | | | | | |
Total distributions to shareholders | | | (0.32 | ) | | | — | (c) |
| | |
Net Asset Value, End of Period | | $ | 8.80 | | | $ | 9.09 | |
Total return (d)(e) | | | 0.44 | % | | | 0.01 | %(f) |
| | |
Ratios to Average Net Assets/Supplemental Data: | | | | | | | | |
Net expenses before interest expense (h) | | | 1.66 | % | | | 1.66 | %(i) |
Interest expense | | | — | %(g) | | | — | |
Net expenses (h) | | | 1.66 | % | | | 1.66 | %(i) |
Waiver/Reimbursement | | | 0.22 | % | | | 0.14 | %(i) |
Net investment income (h) | | | 3.32 | % | | | 3.41 | %(i) |
Portfolio turnover rate | | | 209 | % | | | 49 | %(f) |
Net assets, end of period (000’s) | | $ | 1,317 | | | $ | 10 | |
| (a) | Class C shares commenced operations on March 31, 2008. Per share data and total return reflect activity from that date. |
| (b) | Per share data was calculated using the average shares outstanding during the period. |
| (c) | Rounds to less than $0.01 per share. |
| (d) | Had the investment advisor and/or any of its affiliates not waived fees or reimbursed a portion of expenses, total return would have been reduced. |
| (e) | Total return at net asset value assuming all distributions reinvested and no contingent deferred sales charge. |
| (g) | Rounds to less than 0.01%. |
| (h) | The benefits derived from expense reductions had an impact of less than 0.01%. |
See Accompanying Notes to Financial Statements.
23
Financial Highlights – Columbia Bond Fund
Selected data for a share outstanding throughout each period is as follows:
| | | | | | | | | | | | | | | | | | | | |
| | | Year Ended March 31, | |
| Class Z Shares | | 2009 | | | 2008 (a)(b) | | | 2007 | | | 2006 (h) | | | 2005 (h) | |
Net Asset Value, Beginning of Period | | $ | 9.09 | | | $ | 8.98 | | | $ | 8.84 | | | $ | 9.15 | | | $ | 9.43 | |
| | | | | |
Income from Investment Operations: | | | | | | | | | | | | | | | | | | | | |
Net investment income (c) | | | 0.41 | | | | 0.40 | | | | 0.39 | | | | 0.37 | | | | 0.37 | |
Net realized and unrealized gain (loss) on investments, futures contracts and swap contracts | | | (0.28 | ) | | | 0.10 | | | | 0.14 | | | | (0.18 | ) | | | (0.23 | ) |
| | | | | | | | | | | | | | | | | | | | |
Total from investment operations | | | 0.13 | | | | 0.50 | | | | 0.53 | | | | 0.19 | | | | 0.14 | |
| | | | | |
Less Distributions to Shareholders: | | | | | | | | | | | | | | | | | | | | |
From net investment income | | | (0.41 | ) | | | (0.39 | ) | | | (0.39 | ) | | | (0.38 | ) | | | (0.37 | ) |
From net realized gains | | | (0.01 | ) | | | — | | | | — | | | | (0.12 | ) | | | (0.05 | ) |
| | | | | | | | | | | | | | | | | | | | |
Total distributions to shareholders | | | (0.42 | ) | | | (0.39 | ) | | | (0.39 | ) | | | (0.50 | ) | | | (0.42 | ) |
| | | | | |
Net Asset Value, End of Period | | $ | 8.80 | | | $ | 9.09 | | | $ | 8.98 | | | $ | 8.84 | | | $ | 9.15 | |
Total return (d)(e) | | | 1.49 | % | | | 5.75 | % | | | 6.08 | % | | | 2.00 | % | | | 1.55 | % |
| | | | | |
Ratios to Average Net Assets/Supplemental Data: | | | | | | | | | | | | | | | | | | | | |
Net expenses before interest expense (g) | | | 0.66 | % | | | 0.90 | % | | | 0.90 | % | | | 0.90 | % | | | 0.90 | % |
Interest expense | | | — | %(f) | | | — | | | | — | | | | — | | | | — | |
Net expenses (g) | | | 0.66 | % | | | 0.90 | % | | | 0.90 | % | | | 0.90 | % | | | 0.90 | % |
Waiver/Reimbursement | | | 0.22 | % | | | 0.22 | % | | | 0.30 | % | | | 0.40 | % | | | 0.37 | % |
Net investment income (g) | | | 4.62 | % | | | 4.45 | % | | | 4.36 | % | | | 4.05 | % | | | 3.99 | % |
Portfolio turnover rate | | | 209 | % | | | 49 | % | | | 49 | % | | | 95 | % | | | 90 | % |
Net assets, end of period (000’s) | | $ | 492,874 | | | $ | 546,781 | | | $ | 313,967 | | | $ | 281,767 | | | $ | 211,932 | |
| (a) | On March 31, 2008, Shares class of Core Bond Fund, a series of Excelsior Funds, Inc., was reorganized into the Fund’s Class Z shares. The financial information of Class Z shares includes the financial information of Core Bond Fund’s Shares class. |
| (b) | On March 31, 2008, Core Bond Fund’s Institutional Shares class were exchanged for Class Z shares of the Fund. |
| (c) | Per share data was calculated using the average shares outstanding during the period. |
| (d) | Had the investment advisor and/or any of its affiliates not waived fees or reimbursed a portion of expenses, total return would have been reduced. |
| (e) | Total return at net asset value assuming all distributions reinvested. |
| (f) | Rounds to less than 0.01%. |
| (g) | The benefits derived from expense reductions had an impact of less than 0.01%. |
| (h) | Per share data for the years ended March 31, 2006 and 2005 were audited by other auditors. |
See Accompanying Notes to Financial Statements.
24
Notes to Financial Statements – Columbia Bond Fund
March 31, 2009
Note 1. Organization
Columbia Bond Fund (the “Fund), a series of Columbia Funds Series Trust I (the “Trust”), is a diversified portfolio. The Trust is a Massachusetts business trust registered under the Investment Company Act of 1940, as amended (the “1940 Act”), as an open-end management investment company.
On March 31, 2008, the Fund acquired all assets and assumed all liabilities of the former Core Bond Fund (the “Predecessor Fund”), a series of Excelsior Funds, Inc. The information contained in this report prior to March 31, 2008 relates to the Predecessor Fund.
Investment Objective
The Fund seeks current income consistent with minimal fluctuation of principal.
Fund Shares
The Trust may issue an unlimited number of shares, and the Fund offers three classes of shares: Class A, Class C and Class Z. Each share class has its own expense structure and sales charges, as applicable.
On March 31, 2008, the Predecessor Fund’s Shares class and Institutional Shares class were reorganized into Class Z shares of the Fund. Class A and Class C shares of the Fund commenced operations and public offering on March 31, 2008. Retirement Shares class of the Predecessor Fund was fully redeemed on March 25, 2008.
Class A shares are subject to a maximum front-end sales charge of 4.75% based on the amount of initial investment. Class A shares purchased without an initial sales charge in accounts aggregating $1 million to $50 million at the time of purchase are subject to a 1.00% contingent deferred sales charge (“CDSC”) if the shares are sold within one year after purchase. Class C shares are subject to a 1.00% CDSC on shares sold within one year after purchase. Class Z shares are offered continuously at net asset value. There are certain restrictions on the purchase of Class Z shares, as described in the Fund’s prospectus.
Note 2. Significant Accounting Policies
The preparation of financial statements in accordance with accounting principles generally accepted in the United States of America (“GAAP”) requires management to make certain estimates and assumptions that affect the reported amounts of assets and liabilities, the disclosure of contingent assets and liabilities at the date of the financial statements and the reported amounts of revenue and expenses during the reporting period. Actual results could differ from those estimates. The following is a summary of significant accounting policies consistently followed by the Fund in the preparation of its financial statements.
Security Valuation
Debt securities generally are valued by pricing services approved by the Trust’s Board of Trustees, based upon market transactions for normal, institutional-size trading units of similar securities. The services may use various pricing techniques which take into account appropriate factors such as yield, quality, coupon rate, maturity, type of issue, trading characteristics and other data, as well as broker quotes. Debt securities for which quotations are readily available are valued at an over-the-counter or exchange bid quotation.
Certain debt securities, which tend to be more thinly traded and of lesser quality, are priced based on fundamental analysis of the financial condition of the issuer and the estimated value of any collateral. Valuations developed through pricing techniques may vary from the actual amounts realized upon sale of the securities, and the potential variation may be greater for those securities valued using fundamental analysis.
Short-term investments maturing in 60 days or less are valued at amortized cost, which approximates market value.
Investments in other open-end investment companies are valued at net asset value.
Futures contracts are valued at the settlement price established each day by the board of trade or exchange on which they are traded.
Investments for which market quotations are not readily available, or that have quotations which management believes are not reliable, are valued at fair value as determined in good faith under consistently applied procedures established by and under the general supervision of the Board of Trustees. If a security is valued at fair value, such value is likely to be different from the last quoted market price for the security. The determination of fair value often requires significant judgment. To determine fair value,
25
Columbia Bond Fund
March 31, 2009
management may use assumptions including but not limited to future cash flows and estimated risk premiums. Multiple inputs from various sources may be used to determine value.
Security Transactions
Security transactions are accounted for on the trade date. Cost is determined and gains (losses) are based upon the specific identification method for both financial statement and federal income tax purposes.
In March 2008, Statement of Financial Accounting Standards No. 161, Disclosures about Derivative Instruments and Hedging Activities-an amendment of FASB Statement No. 133 (“SFAS 161”), was issued. SFAS 161 is effective for fiscal years and interim periods beginning after November 15, 2008. SFAS 161 requires additional discussion about the reporting entity’s derivative instruments and hedging activities, by providing for qualitative disclosures about the objectives and strategies for using derivatives, quantitative data about the fair value of and gains and losses on derivative contracts, and details of credit-risk-related contingent features in their derivative contracts. Management is evaluating the impact the application of SFAS 161 will have on the Fund’s financial statement disclosures.
Futures Contracts
The Fund may invest in futures contracts for both hedging and non-hedging purposes, including, for example, to seek to enhance returns or as a substitute for a position in an underlying asset.
The use of futures contracts involves certain risks, which include: (1) imperfect correlation between the price movement of the instruments and the underlying securities, (2) inability to close out positions due to differing trading hours, or the temporary absence of a liquid market, for either the instruments or the underlying securities, or (3) an inaccurate prediction of the future direction of interest rates by Columbia Management Advisors, LLC (“Columbia”), the Fund’s investment advisor. Any of these risks may involve amounts exceeding the variation margin recorded in the Fund’s Statement of Assets and Liabilities at any given time.
Upon entering into a futures contract, the Fund pledges cash or securities with the broker in an amount sufficient to meet the initial margin requirement. Subsequent payments are made or received by the Fund equal to the daily change in the contract value and are recorded as variation margin receivable or payable and offset in unrealized gains or losses. The Fund recognizes a realized gain or loss when the contract is closed or expires.
Repurchase Agreements
The Fund may engage in repurchase agreement transactions with institutions that Columbia has determined are creditworthy. The Fund, through its custodian, receives delivery of the underlying securities collateralizing a repurchase agreement. Columbia is responsible for determining that the collateral is at least equal, at all times, to the value of the repurchase obligation including interest. A repurchase agreement transaction involves certain risks in the event of default or insolvency of the counterparty. These risks include possible delays in or restrictions on the Fund’s ability to dispose of the underlying securities and a possible decline in the value of the underlying securities during the period while the Fund seeks to assert its rights.
Delayed Delivery Securities
The Fund may trade securities on other than normal settlement terms, including securities purchased or sold on a “when-issued” basis. This may increase the risk if the other party to the transaction fails to deliver and causes the Fund to subsequently invest at less advantageous prices. The Fund holds until the settlement date, in a segregated account, cash or liquid securities in an amount equal to the delayed delivery commitment.
Treasury Inflation Protected Securities
The Fund may invest in treasury inflation protected securities (“TIPS”). The principal amount of TIPS is adjusted periodically for inflation based on a monthly published index. Interest payments are based on the inflation-adjusted principal at the time the interest is paid. These adjustments are recorded as interest income on the Statement of Operations.
Income Recognition
Interest income is recorded on the accrual basis. Premium and discount are amortized and accreted, respectively, on all debt securities, unless otherwise noted. Original issue discount is accreted to interest income over the life of the security with a corresponding increase in the cost basis. Corporate actions and dividend income are recorded on the ex-date.
26
Columbia Bond Fund
March 31, 2009
Expenses
General expenses of the Trust are allocated to the Fund and the other series of the Trust based upon relative net assets or other expense allocation methodologies determined by the nature of the expense. Expenses directly attributable to the Fund are charged to the Fund.
Determination of Class Net Asset Value
All income, expenses (other than class-specific expenses, as shown on the Statement of Operations) and realized and unrealized gains (losses) are allocated to each class of the Fund on a daily basis for purposes of determining the net asset value of each class. Income and expenses are allocated to each class based on the settled shares method, while realized and unrealized gains (losses) are allocated based on the relative net assets of each class.
Federal Income Tax Status
The Fund intends to qualify each year as a “regulated investment company” under Subchapter M of the Internal Revenue Code, as amended, and will distribute substantially all of its tax exempt or taxable income, if any, for its tax year, and as such will not be subject to federal income taxes. In addition, the Fund intends to distribute in each calendar year substantially all of its net investment income, capital gains and certain other amounts, if any, such that the Fund should not be subject to federal excise tax. Therefore, no federal income or excise tax provision is recorded.
Distributions to Shareholders
Distributions from net investment income are declared daily and paid monthly. Net realized capital gains, if any, are distributed at least annually. Income distributions and capital gain distributions are determined in accordance with federal income tax regulations which may differ from GAAP.
Indemnification
In the normal course of business, the Fund enters into contracts that contain a variety of representations and warranties and which provide general indemnities. The Fund’s maximum exposure under these arrangements is unknown because this would involve future claims against the Fund. Also, under the Trust’s organizational documents and by contract, the Trustees and officers of the Trust are indemnified against certain liabilities that may arise out of actions relating to their duties to the Trust. However, based on experience, the Fund expects the risk of loss due to these representations, warranties and indemnities to be minimal.
Note 3. Federal Tax Information
The timing and character of income and capital gain distributions are determined in accordance with income tax regulations, which may differ from GAAP. Reclassifications are made to the Fund’s capital accounts for permanent tax differences to reflect income and gains available for distribution (or available capital loss carryforwards) under income tax regulations.
For the year ended March 31, 2009, permanent book and tax basis differences resulting primarily from differing treatments for treasury inflation protected securities were identified and reclassified among the components of the Fund’s net assets as follows:
| | | | |
| | | | | |
Undistributed Net Investment
Income | | Accumulated Net Realized
Gain | | Paid-In Capital |
| $10,261 | | $(10,261) | | $— |
Net investment income and net realized gains (losses), as disclosed on the Statement of Operations, and net assets were not affected by this reclassification.
The tax character of distributions paid during the years ended March 31, 2009 and March 31, 2008 was as follows:
| | | | | | |
| | | March 31, 2009 | | March 31, 2008 |
| Distributions paid from: | | | | |
Ordinary Income* | | $ | 24,993,533 | | $ | 24,643,265 |
Long-Term Capital Gains | | | 67,456 | | | — |
| * | For tax purposes short-term capital gains distributions, if any, are considered ordinary income distributions. |
As of March 31, 2009, the components of distributable earnings on a tax basis were as follows:
| | | | |
| | | | | |
Undistributed
Ordinary Income | | Undistributed Long-Term Capital Gains | | Net Unrealized Depreciation* |
| $5,516,983 | | $884,218 | | $(12,194,070) |
| * | The differences between book-basis and tax-basis net unrealized depreciation are primarily due to deferral of losses from wash sales. |
27
Columbia Bond Fund
March 31, 2009
Unrealized appreciation and depreciation at March 31, 2009, based on cost of investments for federal income tax purposes were:
| | | | |
| | | | |
Unrealized appreciation | | $ | 7,025,601 | |
Unrealized depreciation | | | (19,219,671 | ) |
Net unrealized depreciation | | $ | (12,194,070 | ) |
Under current tax rules, certain currency and capital losses realized after October 31 may be deferred and treated as occurring on the first day of the following fiscal year. As of March 31, 2009, post-October capital losses of $5,049,200 attributed to security transactions were deferred to April 1, 2009.
Under Financial Accounting Standards Board (“FASB”) Interpretation No. 48, Accounting for Uncertainty in Income Taxes — an Interpretation of FASB Statement No. 109 (“FIN 48”), management determines whether a tax position of the Fund is more likely than not to be sustained upon examination by the applicable taxing authority, including resolution of any related appeals or litigation processes, based on the technical merits of the position. The tax benefit to be recognized is measured as the largest amount of benefit that is greater than fifty percent likely of being realized upon ultimate settlement. Management has evaluated the known implications of FIN 48 on its computation of net assets for the Fund. As a result of this evaluation, management has concluded that FIN 48 did not have any effect on the Fund’s financial statements. However, management’s conclusions regarding FIN 48 may be subject to review and adjustment at a later date based on factors including, but not limited to, further implementation guidance from the FASB, new tax laws, regulations, and administrative interpretations (including relevant court decisions). The Fund’s federal tax returns for the prior three fiscal years remain subject to examination by the Internal Revenue Service. The Fund is not aware of any tax positions for which it is reasonably possible that the total amounts of unrecognized tax benefits will significantly change in the next twelve months.
Note 4. Fees and Compensation Paid to Affiliates
Investment Advisory Fee
Effective March 31, 2008, Columbia, an indirect, wholly owned subsidiary of Bank of America Corporation (“BOA”) provides investment advisory services to the Fund. In rendering investment advisory services to the Fund, Columbia may use the portfolio management and research resources of Columbia Management Pte. Ltd., an affiliate of Columbia. Columbia receives a monthly investment advisory fee based on the Fund’s average daily net assets at the following annual rates:
| | | |
| | | | |
| Average Daily Net Assets | | Annual Fee Rate | |
First $500 million | | 0.65 | % |
$500 million to $1 billion | | 0.35 | % |
$1 billion to $1.5 billion | | 0.32 | % |
$1.5 billion to $3 billion | | 0.29 | % |
$3 billion to $6 billion | | 0.28 | % |
Over $6 billion | | 0.27 | % |
For the year ended March 31, 2009, the Fund’s effective investment advisory fee rate was 0.63% of the Fund’s average daily net assets.
Administration Fee
Effective March 31, 2008, Columbia provides administrative and other services to the Fund for a monthly administration fee at the annual rate of 0.15% of the Fund’s average daily net assets less the fees payable by the Fund as described under the Pricing and Bookkeeping Fees note below.
Prior to January 12, 2009, Columbia voluntarily waived administration fees payable by the Fund at the annual rate of 0.05% of the Fund’s average daily net assets.
Pricing and Bookkeeping Fees
The Fund has entered into a Financial Reporting Services Agreement (the “Financial Reporting Services Agreement”) with State Street Bank & Trust Company (“State Street”) and Columbia pursuant to which State Street provides financial reporting services to the Fund. The Fund has also entered into an Accounting Services Agreement (collectively with the Financial Reporting Services Agreement, the “State Street Agreements”) with State Street and Columbia pursuant to which State Street provides accounting services to the Fund. Under the State Street Agreements, the Fund pays State Street an annual fee of $38,000 paid monthly plus an additional monthly fee based on an annualized percentage rate of average daily net assets of the Fund for the month. The
28
Columbia Bond Fund
March 31, 2009
aggregate fee will not exceed $140,000 per year (exclusive of out-of-pocket expenses and charges). The Fund also reimburses State Street for certain out-of-pocket expenses and charges.
The Fund has entered into a Pricing and Bookkeeping Oversight and Services Agreement (the “Services Agreement”) with Columbia. Under the Services Agreement, Columbia provides services related to Fund expenses and the requirements of the Sarbanes-Oxley Act of 2002, and provides oversight of the accounting and financial reporting services provided by State Street. Under the Services Agreement, the Fund reimburses Columbia for out-of-pocket expenses.
Transfer Agent Fee
Columbia Management Services, Inc. (the “Transfer Agent”), an affiliate of Columbia and an indirect, wholly owned subsidiary of BOA, provides shareholder services to the Fund and has contracted with Boston Financial Data Services (“BFDS”) to serve as sub-transfer agent. The Transfer Agent is entitled to receive a fee for its services, paid monthly, at the annual rate of $17.34 per open account plus reimbursement of certain sub-transfer agent fees paid by the Transfer Agent (exclusive of BFDS fees), calculated based on assets held in omnibus accounts and intended to recover the cost of payments to other parties (including affiliates of BOA) for services to those accounts. The Transfer Agent pays the fees of BFDS for services as sub-transfer agent and is not entitled to reimbursement for such fees from the Fund.
The Transfer Agent may also retain, as additional compensation for its services, fees for wire, telephone and redemption orders, Individual Retirement Account (“IRA”) trustee agent fees and account transcript fees due to the Transfer Agent from shareholders of the Fund and credits (net of bank charges) earned with respect to balances in accounts the Transfer Agent maintains in connection with its services to the Fund. The Transfer Agent also receives reimbursement for certain out-of-pocket expenses.
An annual minimum account balance fee of $20 may apply to certain accounts with a value below the Fund’s initial minimum investment requirements to reduce the impact of small accounts on transfer agent fees. These minimum account balance fees are recorded as part of expense reductions on the Statement of Operations. For the year ended March 31, 2009, these minimum account balance fees reduced total expenses by $1,005.
Underwriting Discounts, Service and Distribution Fees
Columbia Management Distributors, Inc. (the “Distributor”) an affiliate of Columbia and an indirect, wholly-owned subsidiary of BOA, is the principal underwriter of the Fund’s shares. For the year ended March 31, 2009, the Distributor has retained net underwriting discounts of $3,032 on the sale of the Fund’s Class A shares.
The Fund has adopted distribution and shareholder servicing plans (the “Plans”) pursuant to Rule 12b-1 under the 1940 Act, which require the payment of distribution and service fees. The fees are intended to compensate the Distributor and/or eligible selling and/or servicing agents for selling shares of the Fund and providing services to investors. The Plans require the payment of a monthly service fee to the Distributor at the annual rate of 0.25% of the average daily net assets attributable to Class A and Class C shares. The Plans also require the payment of a monthly distribution fee to the Distributor at the annual rate of 0.75% of the average daily net assets attributable to Class C shares only.
Fee Waivers and Expense Reimbursements
Effective March 31, 2008, Columbia has contractually agreed to bear a portion of the Fund’s expenses through July 31, 2009, so that the Fund’s ordinary operating expenses (excluding any distribution and service fees, brokerage commissions, interest, taxes and extraordinary expenses, but including custodial charges relating to overdrafts, if any), after giving effect to any balance credits from the Fund’s custodian, do not exceed 0.66% annually of the Fund’s average daily net assets.
Effective August 1, 2009, Columbia has voluntarily agreed to bear a portion of the Fund’s expenses so that the Fund’s ordinary operating expenses (excluding any distribution and service fees, brokerage commissions, interest, taxes and extraordinary expenses, but including custodian charges relating to overdrafts, if any), after giving effect to any balance credits from the Fund’s custodian, do not exceed 0.70% annually of the Fund’s average daily net assets. Columbia, at its discretion, may revise or discontinue this arrangement at any time.
Fees Paid to Officers and Trustees
All officers of the Fund are employees of Columbia or its affiliates and, with the exception of the Fund’s Chief
29
Columbia Bond Fund
March 31, 2009
Compliance Officer, receive no compensation from the Fund. The Board of Trustees has appointed a Chief Compliance Officer to the Fund in accordance with federal securities regulations. The Fund, along with other affiliated funds, pays its pro-rata share of the expenses associated with the Chief Compliance Officer. The Fund’s expenses for the Chief Compliance Officer will not exceed $15,000 per year.
The Trust’s eligible Trustees may participate in a deferred compensation plan which may be terminated at any time. Obligations of the plan will be paid solely out of the Fund’s assets.
Note 5. Custody Credits
The Fund has an agreement with its custodian bank under which custody fees may be reduced by balance credits. These credits are recorded as part of expense reductions on the Statement of Operations. The Fund could have invested a portion of the assets utilized in connection with the expense offset arrangement in an income-producing asset if it had not entered into such an agreement.
For the year ended March 31, 2009, these custody credits reduced total expenses by $63 for the Fund.
Note 6. Portfolio Information
For the year ended March 31, 2009, the cost of purchases and proceeds from sales of securities, excluding short-term obligations, for the Fund were $1,071,988,631 and $1,108,888,865, respectively, of which $801,612,866 and $847,512,586, respectively, were U.S. Government securities.
Note 7. Line of Credit
The Fund and other affiliated funds participate in a $280,000,000 committed, unsecured revolving line of credit provided by State Street. The maximum amount that may be borrowed by any fund is limited to the lesser of $200,000,000 and the Fund’s borrowing limit set forth in the Fund’s registration statement. Borrowings are available for short-term liquidity or temporary or emergency purposes.
Interest is charged to each participating fund based on the fund’s borrowings at a rate per annum equal to the greater of the Federal Funds Rate plus 0.50% or the overnight LIBOR Rate plus 0.50%. In addition, an annual operations agency fee of $20,000, an amendment fee of 0.02% and a commitment fee of 0.12% per annum are accrued and apportioned among the participating funds pro rata based on their relative net assets.
Prior to October 16, 2008, the Fund and other affiliated funds participated in a $350,000,000 committed, unsecured revolving line of credit and a $150,000,000 uncommitted, unsecured line of credit, both provided by State Street. Interest on the committed line of credit was charged to each participating fund based on the fund’s borrowings at a rate per annum equal to the Federal Funds Rate plus 0.50%. In addition, a commitment fee of 0.10% per annum was accrued and apportioned among the participating funds pro rata based on their relative net assets. Interest on the uncommitted line of credit was charged to each participating fund based on the fund’s borrowings at a rate per annum equal to the Federal Funds Rate plus 0.375%. State Street charged an annual operations agency fee of $40,000 for the committed line of credit and was able to charge an annual administration fee of $15,000 for the uncommitted line of credit. The commitment fee, the operations agency fee and the administration fee were accrued and apportioned among the participating funds pro rata based on their relative net assets.
For the year ended March 31, 2009, the average daily loan balance outstanding on days where borrowing existed was $1,000,000 at a weighted average interest rate of 1.875%.
Note 8. Securities Lending
The Fund may lend its securities to certain approved brokers, dealers and other financial institutions. Each loan is collateralized by cash, in an amount at least equal to the market value of the securities loaned plus accrued income from the investment of collateral. The market value of the loaned securities is determined at the close of business of the Fund and any additional required collateral is delivered to the Fund on the next business day. The collateral received is invested and the income generated by the investment of the collateral, net of any fees remitted to State Street as the lending agent and borrower rebates, is paid to the Fund. Generally, in the event of borrower default, the Fund has the right to use the collateral to offset any losses incurred. In the event the Fund is delayed or prevented from exercising its right to dispose of the collateral, there may be a potential loss to the Fund. The Fund bears the risk of loss with respect to the investment of collateral.
30
Columbia Bond Fund
March 31, 2009
Note 9. Shares of Beneficial Interest
As of March 31, 2009, 63.8% of the Fund’s shares outstanding were beneficially owned by one participant account over which BOA and/or any of its affiliates had either sole or joint investment discretion.
As of March 31, 2009, the Fund had one shareholder that held 8.1% of the shares outstanding, over which BOA and/or any of its affiliates did not have investment discretion.
Subscription and redemption activity of these accounts may have a significant effect on the operations of the Fund.
Note 10. Significant Risks and Contingencies
Asset-Backed Securities Risk
The value of asset-backed securities may be affected by, among other factors, changes in interest rates, the market’s assessment of the quality of underlying assets, the creditworthiness of the servicer for the underlying assets, factors concerning the interests in and structure of the issuer or the originator of the underlying assets, or the creditworthiness or rating of the entities that provide any supporting letters of credit, surety bonds, derivative instruments, or other credit enhancement. The value of asset-backed securities also will be affected by the exhaustion, termination or expiration of any credit enhancement. Most asset-backed securities are subject to prepayment risk, which is the possibility that the underlying debt may be refinanced or prepaid prior to maturity during periods of declining or low interest rates, causing the Fund to have to reinvest the money received in securities that have lower yields. In addition, the impact of prepayments on the value of asset-backed securities may be difficult to predict and may result in greater volatility.
Mortgage-Backed Securities Risk
The value of the mortgage-backed securities may be affected by, among other things, changes in interest rates, factors concerning the interests in and structure of the issuer or the originator of the mortgages, the creditworthiness of the entities that provide any supporting letters of credit, surety bonds or other credit enhancements or the quality of underlying assets or the market’s assessment thereof. Mortgage-backed securities are subject to prepayment risk, which is the possibility that the underlying mortgage may be refinanced or prepaid prior to maturity during periods of declining or low interest rates, causing the Funds to have to reinvest the money received in securities that have lower yields. In addition, the impact of prepayments on the value of mortgage-backed securities may be difficult to predict and may result in greater volatility.
Legal Proceedings
Columbia Management Advisors, LLC and Columbia Management Distributors, Inc. (collectively, the “Columbia Group”) are subject to a settlement agreement with the New York Attorney General (“NYAG”) (the “NYAG Settlement”) and a settlement order with the SEC (the “SEC Order”) on matters relating to mutual fund trading, each dated February 9, 2005. Under the terms of the SEC Order, the Columbia Group (or predecessor entities) agreed, among other things, to: pay disgorgement and civil money penalties collectively totaling $140 million; cease and desist from violations of the antifraud provisions and certain other provisions of the federal securities laws; maintain certain compliance and ethics oversight structures; and retain an independent consultant to review the Columbia Group’s applicable supervisory, compliance, control and other policies and procedures. The NYAG Settlement, among other things, requires Columbia Management Advisors, LLC and its affiliates to reduce management fees for certain funds in the Columbia family of mutual funds in a projected total of $160 million over five years through November 30, 2009 and to make certain disclosures to investors relating to expenses. In connection with the Columbia Group providing services to the Columbia Funds, the Columbia Funds have voluntarily undertaken to implement certain governance measures designed to maintain the independence of their boards of trustees and certain special consulting and compliance measures.
Pursuant to the SEC Order and related procedures, the $140 million in settlement amounts described above has been substantially distributed in accordance with a distribution plan that was developed by an independent distribution consultant and approved by the SEC on April 6, 2007.
In connection with the events described above, various parties have filed suit against certain funds, the Trustees of the Columbia Funds, FleetBoston Financial Corporation and its affiliated entities and/or Bank of America and its affiliated entities.
31
Columbia Bond Fund
March 31, 2009
On February 20, 2004, the Judicial Panel on Multidistrict Litigation transferred these cases and cases against other mutual fund companies based on similar allegations to the United States District Court in Maryland for consolidated or coordinated pretrial proceedings (the “MDL”). Subsequently, additional related cases were transferred to the MDL. On September 29, 2004, the plaintiffs in the MDL filed amended and consolidated complaints. One of these amended complaints is a putative class action that includes claims under the federal securities laws and state common law, and that names Columbia Management Advisors, Inc. (which has since merged into Banc of America Capital Management, LLC (now named Columbia Management Advisors, LLC)) (“Columbia”), Columbia Funds Distributor, Inc. (now named Columbia Management Distributors, Inc.) (the “Distributor”), the Trustees of the Columbia Funds, Bank of America Corporation and others as defendants. Another of the amended complaints is a derivative action purportedly on behalf of the Columbia Funds that asserts claims under federal securities laws and state common law.
On February 25, 2005, Columbia and other defendants filed motions to dismiss the claims in the pending cases. On March 1, 2006, for reasons stated in the court’s memoranda dated November 3, 2005, the United States District Court for the District of Maryland granted in part and denied in part the defendants’ motions to dismiss. The court dismissed all of the class action claims pending against the Columbia Funds Trusts. As to Columbia and the Distributor, the claims under the Securities Act of 1933, the claims under Sections 34(b) and 36(a) of the Investment Company Act of 1940 (“ICA”) and the state law claims were dismissed. The claims under Sections 10(b) and 20(a) of the Securities Exchange Act of 1934 and claims under Section 36(b) of the ICA were not dismissed.
On March 21, 2005, a purported class action was filed in Massachusetts state court alleging that certain conduct, including market timing, entitled Class B shareholders in certain Columbia Funds to an exemption from contingent deferred sales charges upon early redemption (the “CDSC Lawsuit”). The CDSC Lawsuit was removed to federal court in Massachusetts and transferred to the MDL.
On September 14, 2007, the plaintiffs and the Columbia defendants named in the MDL, including the Columbia Funds, entered into a stipulation of settlement with respect to all Columbia-related claims in the MDL described above, including the CDSC Lawsuit. The settlement is subject to court approval.
Note 11. Business Combinations and Mergers
Under a plan of reorganization adopted by the Trust, all of the assets and liabilities of the Income Fund and Total Return Bond Fund were transferred to the Institutional Shares of Core Bond Fund. The reorganization, which qualified as a tax-free exchange for federal income tax purposes, was completed at the close of business on September 27, 2006. The following is a summary of the shares outstanding, net assets, net asset value per share issued, and unrealized appreciation/depreciation immediately before and after the reorganization.
| | | | | | | | | | | | | | | | | |
| | | Before Reorganization | | | | After
Reorganization | | |
| | | Income
Fund | | | Total Return
Bond Fund | | Core Bond
Fund | | | | Core Bond
Fund | | |
Shares: | | | | | | | | | | | | | | | | | |
Shares | | | — | | | | — | | | 32,810,661 | | | | | 32,810,661 | | |
Institutional Shares | | | 13,965,104 | | | | 18,165,949 | | | 1,824,521 | | | | | 26,973,187 | | |
Retirement Shares | | | — | | | | — | | | 117 | | | | | 117 | | |
| | | | | | |
Net Assets: | | | | | | | | | | | | | | | | | |
Shares | | $ | — | | | $ | — | | $ | 294,116,361 | | | | $ | 294,116,361 | | |
Institutional Shares | | | 96,434,781 | | | | 129,070,075 | | | 16,360,288 | | | | | 241,865,144 | | |
Retirement Shares | | | — | | | | — | | | 1,046 | | | | | 1,046 | | |
| | | | | | |
Net Asset Value: | | | | | | | | | | | | | | | | | |
Shares | | $ | — | | | $ | — | | $ | 8.96 | | | | $ | 8.96 | | |
Institutional Shares | | | 6.91 | | | | 7.11 | | | 8.97 | | | | | 8.97 | | |
Retirement Shares | | | — | | | | — | | | 8.97 | | | | | 8.97 | | |
Net unrealized appreciation/(depreciation) | | $ | (248,669 | ) | | $ | 617,540 | | $ | 740,329 | | | | $ | 1,109,200 | | |
32
Report of Independent Registered Public Accounting Firm
To the Trustees of Columbia Funds Series Trust I and Shareholders of Columbia Bond Fund
In our opinion, the accompanying statement of assets and liabilities, including the portfolio of investments, and the related statements of operations and of changes in net assets and the financial highlights present fairly, in all material respects, the financial position of the Columbia Bond Fund, a series of Columbia Funds Series Trust I at March 31, 2009, and the results of its operations for the year then ended, and the changes in its net assets for each of the two years in the period then ended and the financial highlights for each of the three years in the period then ended, in conformity with accounting principles generally accepted in the United States of America. These financial statements and financial highlights (hereafter referred to as “financial statements”) are the responsibility of the Fund’s management. Our responsibility is to express an opinion on these financial statements based on our audits. We conducted our audits of these financial statements in accordance with the standards of the Public Company Accounting Oversight Board (United States). Those standards require that we plan and perform the audits to obtain reasonable assurance about whether the financial statements are free of material misstatement. An audit includes examining, on a test basis, evidence supporting the amounts and disclosures in the financial statements, assessing the accounting principles used and significant estimates made by management, and evaluating the overall financial statement presentation. We believe that our audits, which included confirmation of securities at March 31, 2009 by correspondence with the custodian and brokers, provide a reasonable basis for our opinion. The financial highlights of the Fund for each of the two years in the period ended March 31, 2006 were audited by other auditors whose report dated May 22, 2006, expressed an unqualified opinion on those highlights.
PricewaterhouseCoopers LLP
Boston, Massachusetts
May 22, 2009
33
Federal Income Tax Information (Unaudited) – Columbia Bond Fund
The Fund hereby designates as a capital gain dividend with respect to the taxable year ended March 31, 2009, $936,458 or, if subsequently determined to be different, the net capital gain of such year.
34
Fund Governance
The Trustees serve terms of indefinite duration. The names, addresses and ages of the Trustees and officers of the Funds in Columbia Funds Series Trust I, the year each was first elected or appointed to office, their principal business occupations during at least the last five years, the number of Funds overseen by each Trustee and other directorships they hold are shown below. Each officer listed below serves as an officer of each Fund in the Columbia Funds Complex.
Independent Trustees
| | |
Name, Address and Year of Birth,
Position with Funds, Year First
Elected or Appointed to Office | | Principal Occupation(s) During Past Five Years, Number of Funds in Columbia Funds
Complex Overseen by Trustee, Other Directorships Held |
| |
| John D. Collins (Born 1938) | | |
c/o Columbia Management Advisors, LLC One Financial Center Boston, MA 02111 Trustee (since 2007) | | Retired. Consultant, KPMG, LLP (accounting and tax firm) from July 1999 to June 2000; Partner, KPMG, LLP from March 1962 to June 1999. Oversees 79; Mrs. Fields Famous Brands LLC (consumer products); Suburban Propane Partners, L.P.; and Montpelier Re (underwriting firm) |
| |
| Rodman L. Drake (Born 1943) | | |
c/o Columbia Management Advisors, LLC One Financial Center Boston, MA 02111 Trustee (since 2007) | | Co-Founder of Baringo Capital LLC (private equity) since 2002; President, Continuation Investments Group, Inc. from 1997 to 2001. Oversees 79; Jackson Hewitt Tax Service Inc. (tax preparation services); Crystal Capital River Inc. (real estate investment trust); Student Loan Corporation (student loan provider); Celgene Corporation (global biotechnology company); Apex Silver Mines Ltd. (mining); and Helios Total Return Fund, Inc. and Helios Strategic Mortgage Income Fund, Inc. (exchange-traded funds) |
| |
| Douglas A. Hacker (Born 1955) | | |
c/o Columbia Management Advisors, LLC One Financial Center Boston, MA 02111 Trustee (since 1996) | | Independent business executive since May 2006; Executive Vice President–Strategy of United Airlines (airline) from December 2002 to May 2006; President of UAL Loyalty Services (airline marketing company) from September 2001 to December 2002; Executive Vice President and Chief Financial Officer of United Airlines from July 1999 to September 2001. Oversees 79; Nash Finch Company (food distributor); Aircastle Limited (aircraft leasing) |
| |
| Janet Langford Kelly (Born 1957) | | |
c/o Columbia Management Advisors, LLC One Financial Center Boston, MA 02111 Trustee (since 1996) | | Senior Vice President, General Counsel and Corporate Secretary, ConocoPhillips (integrated energy company) since September 2007; Deputy General Counsel–Corporate Legal Services, ConocoPhillips from August 2006 to August 2007; Partner, Zelle, Hofmann, Voelbel, Mason & Gette LLP (law firm) from March 2005 to July 2006; Adjunct Professor of Law, Northwestern University, from September 2004 to June 2006; Director, UAL Corporation (airline) from February 2006 to July 2006; Oversees 79; None |
35
Fund Governance (continued)
Independent Trustees (continued)
| | |
Name, Address and Year of Birth,
Position with Funds, Year First
Elected or Appointed to Office | | Principal Occupation(s) During Past Five Years, Number of Funds in Columbia Funds
Complex Overseen by Trustee, Other Directorships Held |
| |
| Charles R. Nelson (Born 1942) | | |
c/o Columbia Management Advisors, LLC One Financial Center Boston, MA 02111 Trustee (since 1981) | | Professor of Economics, University of Washington, since January 1976; Ford and Louisa Van Voorhis Professor of Political Economy, University of Washington, since September 1993; Adjunct Professor of Statistics, University of Washington, since September 1980; Associate Editor, Journal of Money Credit and Banking from 1993 to 2008; Consultant on econometric and statistical matters. Oversees 79; None |
| |
| John J. Neuhauser (Born 1943) | | |
c/o Columbia Management Advisors, LLC One Financial Center Boston, MA 02111 Trustee (since 1985) | | President, Saint Michael’s College, since August 2007; University Professor, Boston College from November 2005 to August 2007; Academic Vice President and Dean of Faculties, Boston College from August 1999 to October 2005. Oversees 79; Liberty All-Star Equity Fund and Liberty All-Star Growth Fund, Inc. (closed-end funds) |
| |
| Jonathan Piel (Born 1938) | | |
c/o Columbia Management Advisors, LLC One Financial Center Boston, MA 02111 Trustee (since 2007) | | Cable television producer and website designer; The Editor, Scientific American from 1984 to 1994; Vice President, Scientific American, Inc., from 1984 to 1994; Member, Advisory Board, Stone Age Institute, Bloomington, Indiana (research institute that explores the effect of technology on human evolution); Member, Board of Directors of the National Institute of Social Sciences, New York City; Member, Board of Trustees of the William Alanson White Institute, New York City (institution for training psychoanalysts) and Member, Advisory Board, Mount Sinai Children’s Environmental Health Center, New York; Oversees 79; None |
| |
| Patrick J. Simpson (Born 1944) | | |
c/o Columbia Management Advisors, LLC One Financial Center Boston, MA 02111 Trustee (since 2000) | | Partner, Perkins Coie LLP (law firm). Oversees 79; None |
| |
| Thomas C. Theobald (Born 1937) | | |
c/o Columbia Management Advisors, LLC One Financial Center Boston, MA 02111 Trustee and Chairman of the Board (since 1996) | | Partner and Senior Advisor, Chicago Growth Partners (private equity investing) since September 2004; Managing Director, William Blair Capital Partners (private equity investing) from September 1994 to September 2004. Oversees 79; Anixter International (network support equipment distributor); Ventas, Inc. (real estate investment trust); Jones Lang LaSalle (real estate management services); Ambac Financial Group (financial guaranty insurance) |
| |
| Anne-Lee Verville (Born 1945) | | |
c/o Columbia Management Advisors, LLC One Financial Center Boston, MA 02111 Trustee (since 1998) | | Retired since 1997 (formerly General Manager–Global Education Industry (from 1994 to 1997), President–Application Systems Division (from 1991 to 1994), Chief Financial Officer–US Marketing & Services (from 1988 to 1991), and Chief Information Officer (from 1987 to 1988), IBM Corporation (computer and technology)). Oversees 79; None |
36
Fund Governance (continued)
Interested Trustee
| | |
Name, Address and Year of Birth,
Position with Funds, Year First
Elected or Appointed to Office | | Principal Occupation(s) During Past Five Years, Number of Funds in Columbia Funds
Complex Overseen by Trustee, Other Directorships Held |
| |
| William E. Mayer (Born 1940) | | |
c/o Columbia Management Advisors, LLC One Financial Center Boston, MA 02111 Trustee1 (since 1994) | | Partner, Park Avenue Equity Partners (private equity) since February 1999; Dean and Professor, College of Business, University of Maryland from 1992 to 1997. Oversees 79, Lee Enterprises (print media), WR Hambrecht + Co. (financial service provider); BlackRock Kelso Capital Corporation (investment company) |
1 | The Funds currently treat Mr. Mayer as an “interested person” (as defined in the Investment Company Act of 1940) by reason of his affiliation with WR Hambrecht + Co., a registered broker/dealer that may execute portfolio transactions for or engage in principal transactions with the Funds or other funds or accounts advised/managed by the Advisor or other Bank of America affiliates. |
The Statement of Additional Information includes additional information about the Trustees of the Funds and is available, without charge, upon request by calling 1-800-345-6611.
37
Fund Governance (continued)
Officers
| | |
Name, Address and Year of Birth,
Position with Columbia Funds, Year
First Elected or Appointed to Office | | Principal Occupation(s) During Past Five Years |
| |
| J. Kevin Connaughton (Born 1964) | | |
One Financial Center Boston, MA 02111 President (since 2009) | | Managing Director of Columbia Management Advisors, LLC since December 2004; Senior Vice President and Chief Financial Officer–Columbia Funds, from June 2008 to January 2009; Treasurer–Columbia Funds, from October 2003 to May 2008; Treasurer–the Liberty Funds, Stein Roe Funds and Liberty All-Star Funds, December 2000–December 2006; Senior Vice President–Columbia Management Advisors, LLC, from April 2003 to December 2004; President–Columbia Funds, Liberty Funds and Stein Roe Funds, February 2004 to October 2004; Treasurer–Galaxy Funds, September 2002 to December 2005; Treasurer, December 2002 to December 2004, and President, February 2004 to December 2004–Columbia Management Multi-Strategy Hedge Fund, LLC; and a senior officer of various other Bank of America-affiliated entities, including other registered and unregistered funds. |
| |
| James R. Bordewick, Jr. (Born 1959) | | |
One Financial Center Boston, MA 02111 Senior Vice President, Secretary and Chief Legal Officer (since 2006) | | Associate General Counsel, Bank of America since April 2005; Senior Vice President and Associate General Counsel, MFS Investment Management (investment management) prior to April 2005. |
| |
| Linda J. Wondrack (Born 1964) | | |
One Financial Center Boston, MA 02111 Senior Vice President and Chief Compliance Officer (since 2007) | | Director (Columbia Management Group LLC and Investment Product Group Compliance), Bank of America since June 2005; Director of Corporate Compliance and Conflicts Officer, MFS Investment Management (investment management), August 2004 to May 2005; Managing Director, Deutsche Asset Management (investment management) prior to August 2004. |
| |
| Michael G. Clarke (Born 1969) | | |
One Financial Center Boston, MA 02111 Senior Vice President and Chief Financial Officer (since 2009) | | Director of Fund Administration of the Advisor since January 2006; Managing Director of the Advisor September 2004 to December 2005; Vice President Fund Administration June 2002 to September 2004. |
| |
| Jeffrey R. Coleman (Born 1969) | | |
One Financial Center Boston, MA 02111 Deputy Treasurer (since 2006) | | Director of Fund Administration of the Advisor since January 2006; Fund Controller of the Advisor from October 2004 to January 2006; Vice President of CDC IXIS Asset Management Services, Inc. (investment management) from August 2000 to September 2004. |
| |
| Joseph F. DiMaria (Born 1968) | | |
One Financial Center Boston, MA 02111 Chief Accounting Officer and Treasurer (since 2009) | | Director of Fund Administration of the Advisor since January 2006; Head of Tax/Compliance and Assistant Treasurer of the Advisor from November 2004 to December 2005; Director of Trustee Administration (Sarbanes-Oxley) of the Advisor from May 2003 to October 2004. |
38
Fund Governance (continued)
Officers (continued)
| | |
Name, Address and Year of Birth,
Position with Columbia Funds, Year
First Elected or Appointed to Office | | Principal Occupation(s) During Past Five Years |
| |
| Julian Quero (Born 1967) | | |
One Financial Center Boston, MA 02111 Deputy Treasurer (since 2008) | | Senior Tax Manager of the Advisor since August 2006; Senior Compliance Manager of the Advisor from April 2002 to August 2006. |
| |
| Barry S. Vallan (Born 1969) | | |
One Financial Center Boston, MA 02111 Controller (since 2006) | | Vice President–Fund Treasury of the Advisor since October 2004; Vice President–Trustee Reporting of the Advisor from April 2002 to October 2004 |
39
Board Consideration and Approval of Advisory Agreements
The Advisory Fees and Expenses Committee of the Board of Trustees meets several times annually to review the advisory agreements (collectively, the “Agreements”) of the funds for which the Trustees serve as trustees (each a “fund”) and to determine whether to recommend that the full Board approve the continuation of the Agreements for an additional one-year period. After the Committee has made its recommendation, the full Board, including the Independent Trustees, determines whether to approve the continuation of the Agreements. In addition, the full Board, including the Independent Trustees, considers matters bearing on the Agreements at most of its other meetings throughout the year and meets regularly with senior management of the funds and Columbia, the funds’ investment adviser, including the senior manager of each investment area within Columbia. Through the Board’s Investment Oversight Committees, Trustees also meet with selected fund portfolio managers, research analysts and traders at various times throughout the year.
The Trustees receive and review all materials that they, their legal counsel or Columbia believe to be reasonably necessary for the Trustees to evaluate the Agreements and to determine whether to approve the continuation of the Agreements. Those materials generally include, among other items, (i) information on the investment performance of each fund relative to the performance of peer groups of mutual funds and the fund’s performance benchmarks, and additional information assessing performance on a risk-adjusted basis, (ii) information on each fund’s advisory fees and other expenses, including information comparing the fund’s expenses to those of peer groups of mutual funds and information about any applicable expense caps and fee “breakpoints,” (iii) information about the profitability of the Agreements to Columbia, including potential “fall-out” or ancillary benefits that Columbia and its affiliates may receive as a result of their relationships with the funds and (iv) information obtained through Columbia’s response to a questionnaire prepared at the request of the Trustees by counsel to the funds and independent legal counsel to the Independent Trustees. The Trustees also consider other information such as (v) Columbia’s financial results and financial condition, (vi) each fund’s investment objective and strategies and the size, education and experience of Columbia’s investment staffs and their use of technology, external research and trading cost measurement tools, (vii) the allocation of the funds’ brokerage and the use of “soft” commission dollars to pay for research products and services, (viii) Columbia’s resources devoted to, and its record of compliance with, the funds’ investment policies and restrictions, policies on personal securities transactions and other compliance policies and legal and regulatory requirements, (ix) Columbia’s response to various legal and regulatory proceedings since 2003 and to the recent period of volatility in the securities markets and (x) the economic outlook generally and for the mutual fund industry in particular. In addition, the Advisory Fees and Expenses Committee confers with the funds’ independent fee consultant and reviews materials relating to the funds’ relationships with Columbia provided by the independent fee consultant. Throughout the process, the Trustees have the opportunity to ask questions of and to request additional materials from Columbia and to consult with the independent fee consultant and independent legal counsel to the Independent Trustees.
The Board of Trustees most recently approved the continuation of the Agreements at its October, 2008 meeting, following meetings of the Advisory Fees and Expenses Committee held in February, April, August, September and October, 2008. In considering whether to approve the continuation of the Agreements, the Trustees, including the Independent Trustees, did not identify any single factor as determinative, and each weighed various factors as he or she deemed appropriate. The Trustees considered the following matters in connection with their approval of the continuation of the Agreements:
The nature, extent and quality of the services provided to the funds under the Agreements. The Trustees considered the nature, extent and quality of the services provided by Columbia and its affiliates to the funds and the resources dedicated to the funds by Columbia and its affiliates. Among other things, the Trustees considered (i) Columbia’s ability (including its personnel and other resources, compensation programs for personnel involved in fund management, reputation and other attributes) to attract, motivate and retain highly qualified research, advisory and supervisory investment professionals; (ii) the portfolio management services provided by those investment professionals; and (iii) the trade execution services provided on behalf of the funds. For each fund, the Trustees also considered the benefits to shareholders of investing in a mutual fund that is part of a
40
family of funds offering exposure to a variety of asset classes and investment disciplines and providing a variety of fund and shareholder services. After reviewing those and related factors, the Trustees concluded, within the context of their overall conclusions regarding each of the Agreements, that the nature, extent and quality of services provided supported the continuation of the Agreements.
Investment performance of the funds and Columbia. The Trustees reviewed information about the performance of each fund over various time periods, including information prepared by an independent third-party data provider that compared the performance of each fund to the performance of peer groups of mutual funds and performance benchmarks. The Trustees also reviewed a description of the third party’s methodology for identifying each fund’s peer group for purposes of performance and expense comparisons. The Trustees also considered additional information that the Advisory Fees and Expenses Committee requested from Columbia relating to funds that presented relatively weaker performance and/or relatively higher expenses. In the case of each fund whose performance lagged that of a relevant peer group for certain (although not necessarily all) periods, the Trustees concluded that other factors relevant to performance were sufficient, in light of other considerations, to warrant continuation of the fund’s Agreements. Those factors varied from fund to fund, but included one or more of the following: (i) that the fund’s performance, although lagging in certain recent periods, was stronger over the longer term; (ii) that the underperformance was attributable, to a significant extent, to investment decisions that were reasonable and consistent with the fund’s investment strategy and policies and that the fund was performing within a reasonable range of expectations, given those investment decisions, market conditions and the fund’s investment strategy; (iii) that the fund’s performance was competitive when compared to other relevant performance benchmarks or peer groups; (iv) that Columbia had taken or was taking steps designed to help improve the fund’s investment performance, including, but not limited to, replacing portfolio managers or modifying investment strategies; and (v) that Columbia proposed to waive advisory fees or cap the expenses of the fund.
The Trustees noted that, through April 30, 2008, Columbia Bond Fund’s performance was in the second quintile (where the best performance would be in the first quintile) for the one-, three- and five-year periods, and in the first quintile for the ten-year period, of the peer group selected by an independent third-party data provider for purposes of performance comparisons.
The Trustees also considered Columbia’s performance and reputation generally, the funds’ performance as a fund family generally, and Columbia’s historical responsiveness to Trustee concerns about performance and Columbia’s willingness to take steps intended to improve performance. After reviewing those and related factors, the Trustees concluded, within the context of their overall conclusions regarding each of the Agreements, that the performance of each fund and Columbia was sufficient, in light of other considerations, to warrant the continuation of the Agreement(s) pertaining to that fund.
The costs of the services provided and profits realized by Columbia and its affiliates from their relationships with the funds. The Trustees considered the fees charged to the funds for advisory services as well as the total expense levels of the funds. That information included comparisons (provided by management and by an independent third-party data provider) of each fund’s advisory fees and total expense levels to those of the fund’s peer groups and information about the advisory fees charged by Columbia to comparable institutional accounts. In considering the fees charged to those accounts, the Trustees took into account, among other things, management’s representations about the differences between managing mutual funds as compared to other types of accounts, including differences in the services provided, differences in the risk profile of such business for Columbia, and the additional resources required to manage mutual funds effectively. In evaluating each fund’s advisory fees, the Trustees also took into account the demands, complexity and quality of the investment management of the fund. The Trustees considered existing advisory fee breakpoints, and Columbia’s use of advisory fee waivers and expense caps, which benefited a number of the funds. The Trustees also noted management’s stated justification for the fees charged to the funds, which included information about the investment performance of the funds and the services provided to the funds.
The Trustees considered that Columbia Bond Fund’s total expenses were in the first quintile and actual management
41
fees were in the third quintile (where the lowest fees and expenses would be in the first quintile) of the peer group selected by an independent third-party data provider for purposes of expense comparisons.
The Trustees also considered the compensation directly or indirectly received by Columbia and its affiliates from their relationships with the funds. The Trustees reviewed information provided by management as to the profitability to Columbia and its affiliates of their relationships with each fund, and information about the allocation of expenses used to calculate profitability. When reviewing profitability, the Trustees also considered court cases in which adviser profitability was an issue in whole or in part, the performance of the relevant funds, the expense level of each fund, and whether Columbia had implemented breakpoints and/or expense caps with respect to the fund.
After reviewing those and related factors, the Trustees concluded, within the context of their overall conclusions regarding each of the Agreements, that the advisory fees charged to each fund, and the related profitability to Columbia and its affiliates of their relationships with the fund, supported the continuation of the Agreement(s) pertaining to that fund.
Economies of Scale. The Trustees considered the existence of any economies of scale in the provision by Columbia of services to each fund, to groups of related funds, and to Columbia’s investment advisory clients as a whole and whether those economies were shared with the funds through breakpoints in the investment advisory fees or other means, such as fee waivers/expense reductions and additional investments by Columbia in investment, trading and compliance resources. The Trustees noted that many of the funds benefited from breakpoints, fee waivers/expense caps, or both. In considering those issues, the Trustees also took note of the costs of the services provided (both on an absolute and a relative basis) and the profitability to Columbia and its affiliates of their relationships with the funds, as discussed above.
After reviewing those and related factors, the Trustees concluded, within the context of their overall conclusions regarding each of the Agreements, that the extent to which economies of scale were shared with the funds supported the continuation of the Agreements.
Other Factors. The Trustees also considered other factors, which included but were not limited to the following:
| n | | the extent to which each fund had operated in accordance with its investment objective and investment restrictions, the nature and scope of the compliance programs of the funds and Columbia and the compliance-related resources that Columbia and its affiliates were providing to the funds; |
| n | | the nature, quality, cost and extent of administrative and shareholder services overseen and performed by Columbia and its affiliates, both under the Agreements and under separate agreements for the provision of transfer agency and administrative services; |
| n | | so-called “fall-out benefits” to Columbia and its affiliates, such as the engagement of its affiliates to provide distribution, brokerage and transfer agency services to the funds, and the benefits of research made available to Columbia by reason of brokerage commissions generated by the funds’ securities transactions, as well as possible conflicts of interest associated with those fall-out and other benefits, and the reporting, disclosure and other processes in place to disclose and monitor those possible conflicts of interest; and |
| n | | the report provided by the funds’ independent fee consultant, which included information about and analysis of the funds’ fees, expenses and performance. |
Based on their evaluation of all factors that they deemed to be material, including those factors described above, and assisted by the advice of independent counsel and the independent fee consultant, the Trustees, including the Independent Trustees, approved the continuance of each of the Agreements through October 31, 2009.
42
Summary of Management Fee Evaluation by Independent Fee Consultant
EXCERPTS FROM REPORT OF INDEPENDENT FEE CONSULTANT TO THE FUNDS SUPERVISED BY THE COLUMBIA ATLANTIC BOARD
Prepared Pursuant to the February 9, 2005 Assurance of Discontinuance among the Office of Attorney General of New York State, Columbia Management Advisors, LLC, and Columbia Management Distributors, Inc. November 3, 2008
I. Overview
On February 9, 2005, Columbia Management Advisors, LLC (“CMA”) and Columbia Management Distributors, Inc.1 (“CMD”) agreed to the New York Attorney General’s Assurance of Discontinuance (“AOD”). Among other things, the AOD stipulates that CMA may manage or advise a Columbia Fund (“Columbia Fund” and, together with some or all of, such funds the “Columbia Funds”) only if the Independent Members of the Columbia Fund’s Board of Trustees appoint a Senior Officer or retain an Independent Fee Consultant (“IFC”) who is to manage the process by which proposed management fees are negotiated. The AOD further stipulates that the Senior Officer or IFC is to prepare a written annual evaluation of the fee negotiation process.
With effect from January 1, 2007, the Independent Members of the Board of Trustees for certain Columbia Funds known collectively as the “Atlantic Funds” (together with the other members of that Board, the “Trustees”) retained me as IFC for the Atlantic Funds.2 In this capacity, I have prepared the fourth annual written evaluation of the fee negotiation process. As was the case with last year’s report (the “2007 Report”) my immediate predecessor as IFC, John Rea, provided invaluable assistance in the preparation of this year’s report.
A. Role of the Independent Fee Consultant
The AOD charges the IFC with “managing the process by which proposed management fees…to be charged the Columbia Fund are negotiated so that they are negotiated in a manner which is at arms’ length and reasonable and consistent with this Assurance of Discontinuance.” The AOD also provides that CMA “may manage or advise a Columbia Fund only if the reasonableness of the proposed management fees is determined by the Board of Trustees…using…an annual independent written evaluation prepared by or under the direction of…the Independent Fee Consultant.” Therefore, the AOD makes clear that the IFC does not supplant the Trustees in negotiating management fees with CMA, nor does the IFC substitute his or her judgment for that of the Trustees with respect to the reasonableness of proposed fees or any other matter that is committed to the business judgment of the Trustees.
B. Elements Involved in Managing the Fee Negotiation Process
In preparing the report required by the AOD, the IFC must consider at least the following six factors set forth in the AOD:
| 1. | The nature and quality of CMA’s services, including the Fund’s performance; |
| 2. | Management fees (including any components thereof) charged by other mutual fund companies for like services; |
| 3. | Possible economies of scale as the Fund grows larger; |
| 4. | Management fees (including any components thereof) charged to institutional and other clients of CMA for like services; |
| 5. | Costs to CMA and its affiliates of supplying services pursuant to the management fee agreements, excluding any intra-corporate profit; and |
| 6. | Profit margins of CMA and its affiliates from supplying such services. |
C. Organization of the Annual Evaluation
This report, like last year’s, focuses on the six factors and contains a section for each factor except that CMA’s costs and profits from managing the Funds have been combined into a single section. In addition to a discussion of these factors, the report offers recommendations to improve the fee review process in future years. A review of the status of
1 | CMA and CMD are subsidiaries of Columbia Management Group, LLC (“CMG”), and are the successors to the entities named in the AOD. |
2 | I have no material relationship with Bank of America, CMG or any of its affiliates, aside from serving as IFC, and I am aware of no material relationship with any of their affiliates. I retained John Rea, an independent economic consultant, to assist me with this report. |
| | Unless otherwise stated or required by the context, this report covers only the Atlantic Funds, which are also referred as the “Funds.” |
43
recommendations made in the 2007 Report is being provided separately with the materials for the October meeting.
II. Summary of Findings
A. General
| 1. | Based upon my examination of the information supplied by CMG in the light of the six factors set forth in the AOD, I conclude that the Trustees have the relevant information necessary to evaluate the reasonableness of the proposed management fees for each Atlantic Fund. |
| 2. | In my view, the process by which the proposed management fees of the Funds have been negotiated in 2008 thus far has been, to the extent practicable, at arms’ length and reasonable and consistent with the AOD. |
B. Nature and Quality of Services, Including Performance
| 3. | The performance of the Funds has been relatively strong in recent years. Based upon 1-, 3-, 5-, and 10-year returns through April 30, 2008, at least half of all the Funds were in the first and second performance quintiles in each of the four performance periods and, at most, only 11% were in the fifth quintile in any one performance period. Both equity and fixed-income funds posted strong performance relative to comparable funds. |
| 4. | Performance rankings were similar in 2007 and 2008, although last year’s were slightly stronger. Despite the stability in the distribution of rankings in the two years, at least half the Funds changed quintile rankings between the two years in at least one of the 1-, 3-, and 5-year performance periods. |
| 5. | The performance of the actively managed equity Funds against their benchmarks was very strong. At least 57% and as many as 73% posted net returns exceeding their benchmarks over the 1-, 3-, and 5-year periods. In contrast, gross and net returns of fixed-income Funds typically fell short of their benchmarks. |
| 6. | Atlantic equity Funds’ overall performance adjusted for risk also was strong. Based upon 3-year returns, nearly 80% of the equity Funds had a combination of risk-adjusted and unadjusted returns that placed them in the top half of their performance universes. Only about one-fifth of the fixed income Funds posted high returns and low risk relative to comparable funds. About two-thirds of the fixed-income Funds took on more risk than the typical fund in their performance universes. |
| 7. | The industry-standard procedure used by Lipper that includes all share classes in the performance universe tends to bias a Fund’s ranking upward within that universe. The bias occurs because either no-12b-1 fee or low-12b-1 fee share classes of the Atlantic Funds are compared with funds in performance universes that include all share classes of multi-class funds with 12b-1 fees of up to 100 basis points. Correcting this bias by limiting the performance universe to classes of comparable funds with low or no 12b-1 fees (a “filtered universe”) lowers the relative performance for the Funds, but their performance, on the whole, remains strong. The filtering process, however, did identify two Funds for further review that had not been designated review funds using unfiltered universes. |
| 8. | A small number of Funds have consistently underperformed over the past four years. The exact number depends on the criteria used to evaluate longer-term performance. For example, the one-year returns of one Fund have been in the fourth or fifth performance quintiles in each of the past four years; there are six Funds whose three-year returns have been in the fourth or fifth quintile over the past four years. |
| 9. | The services performed by CMG professionals beyond portfolio management, such as compliance, legal, information technology, risk management, finance and fund administration, are critical to the success of the Funds and appear to be of high quality. |
C. Management Fees Charged by Other Mutual Fund Companies
| 10. | The Funds’ management fees and total expenses are generally low relative to those of their peers. Only 21% of the Funds ranked in the two most expensive quintiles for actual management fees, and only 23% in those quintiles for total expenses. |
| 11. | The highest concentration of low-expense Funds is found among the equity and tax-exempt fixed income Funds. The 12 former Excelsior Funds have relatively high fees and expenses, with half of those Funds ranking in either the fourth or fifth quintiles. The higher actual management fee |
44
| | rankings of certain Excelsior Funds are due in part to fee schedules that are higher than standard Columbia Fund fee schedules at current asset levels. After discussion with the Trustees, CMA is proposing to lower the management fees on three of these Funds. |
| 12. | The distribution of expense rankings is similar in 2007 and 2008, while management fee rankings improved markedly in 2008. Part of the improvement reflects expense limitations introduced last year for the state intermediate municipal bond Funds. |
| 13. | The management fees of the Atlantic Funds are generally in line with those of Columbia Funds supervised by the Nations Board of Trustees (the “Nations Funds”). In investment categories in which the Atlantic Funds have higher average fees, the difference principally arises out of differences in asset size. |
D. Trustees’ Fee and Performance Evaluation Process
| 14. | The Trustees’ evaluation process identified 17 Funds in 2008 for further review based upon their relative performance or expenses or both. When compared in filtered universes, two more Funds met the criteria for further review. CMG provided further information about those Funds to assist the Trustees in their evaluation. |
E. Potential Economies of Scale
| 15. | CMG presented to the Trustees its analysis of the sources and sharing of potential economies of scale. CMG views economies of scale as arising at the complex level and would regard estimates of scale economies for individual funds as unreliable. In its analysis, CMG did not identify specific sources of economies of scale or provide any estimates of any economies of scale that might arise from future asset growth. CMG’s analysis included measures taken by the Trustees and CMG that seek to share any potential economies of scale through breakpoints in management fee schedules, expense reimbursements, fee waivers, enhanced shareholder services, fund mergers, and operational consolidation. |
| 16. | An examination of the contractual fee schedules for five Atlantic Funds shows that they are generally in line with those of their competitors, in terms of number and extent of fee breakpoints. A similar examination last year of five different Funds led to the same conclusion. |
F. Management Fees Charged to Institutional Clients
| 17. | CMG has provided Trustees with comparisons of mutual fund management fees and institutional fees based upon standardized fee schedules and upon actual fees. The results show that, consistent with industry practice, institutional fees are generally lower than the Funds’ management fees. However, because the services provided and risks borne by the manager are more extensive for mutual funds compared to institutional accounts, the differences are of limited value in assisting the Trustees in their review of the reasonableness of the Funds’ management fees. |
G. Revenues, Expenses, and Profits
| 18. | The activity-based cost allocation methodology (“ABC”) employed by CMG to allocate costs, both direct and indirect, for purposes of calculating Fund profitability is thoughtful and detailed. This year, CMG proposed a change to the method by which indirect expenses are allocated. Under this “hybrid” method, indirect costs relating to fund management are allocated among the Funds 50% by assets and 50% per Fund. Allocating indirect expenses equally to each Fund has an intuitive logic, as each Fund regardless of size has certain expenses, such as preparing and printing prospectuses and financial statements. |
| 19. | The materials provided on CMG’s revenues and expenses with respect to the Funds and the methodology underlying their construction form a sufficient basis for Trustees to evaluate the expenses and profitability of the Funds. |
| 20. | In 2007, CMG’s complex-wide pre-tax margins on the Atlantic Funds were slightly below industry medians, based on limited data available for publicly held mutual fund managers. However, as is to be expected in a complex now comprising 75 Funds (including former Excelsior Funds), some Atlantic Funds have relatively high pre-tax profit margins, when calculated solely with respect to management revenues and expenses, while other Atlantic Funds operate at a loss. There is a positive relationship between fund size and profitability, with smaller funds generally operating at a loss. |
| 21. | CMG pays a fixed percentage of its management fee revenues to an affiliate, U.S. Trust, Bank of America |
45
| | Private Wealth Management, to compensate it for services it performs with respect to Atlantic Fund assets held for the benefit of its customers. Based on our analysis of the services provided by this affiliate, we have concluded that all payments other than those for sub-transfer agent or sub-accounting services should be treated as a distribution expense. |
III. Recommendations
| 1) | Criteria for review. The Trustees may wish to consider modifying the criteria for classifying a fund as a “Review Fund” to include criteria that focus exclusively on performance without regard to expense or fee levels. For example, a fund whose one-year or three-year performance was median or below for four consecutive years could be treated as a Review Fund. When we applied such criteria to the Funds, several additional Funds would have been added to the list of Review Funds. |
| 2) | Profitability data. CMG should present to the Trustees each year the profitability of each Fund, each investment style and each complex (of which Atlantic is one) calculated as follows: |
| | a. | Management-only profitability should be calculated without reference to any Private Bank expense. |
| | b. | Profitability excluding distribution (which essentially covers the management and transfer agency functions) should be adjusted by removing from the expense calculation any portion of the Private Bank payment not attributable to the performance by the Private Bank of sub-transfer agency or sub-accounting functions. |
| | c. | Total profitability, including distribution: No adjustment for Private Bank expenses should be made, because all such expenses represent legitimate fund expenses to be taken into account in calculating CMG’s profit margin including distribution. |
| | d. | Distribution only: This should include all Private Bank expenses other than those attributable to sub-transfer agency services. |
Therefore, the following data need not be provided:
| | 1. | Adjusting total profitability data for Private Bank expenses |
| | 2. | Adjusting profitability excluding distribution by backing out all Private Bank expenses. |
| 3) | Potential economies of scale. CMG and the IFC should continue to work on methods for more precisely quantifying to the extent possible the sources and magnitude of any economies of scale as CMG’s mutual fund assets under management increase, to the extent that the data allows for meaningful year-over-year comparisons. The framework suggested in Section IV.D.4 may prove to be a useful model for such an analysis. |
| 4) | Competitive breakpoint analysis. As part of the annual fee evaluation process, the breakpoints of a select group of Atlantic Funds (which would differ each year) should continue to be compared to those of industry rivals to ensure that the Funds’ breakpoint schedules remain within industry norms. As breakpoint schedules change relatively little each year, performing such a comparison for each Atlantic Fund each year would not be an efficient use of Trustee and CMG resources. |
| 5) | Cost allocation methodology. CMG’s point that the current ABC system of allocating indirect expenses creates anomalous results in several cases, including sub-advised Funds, is well-taken. We would like to work with CMG over the forthcoming year on alternatives to the current system of allocating indirect expenses that (1) resolve the anomalies, (2) limit the amount of incremental effort on CMG’s part and (3) remain faithful to the general principle that expenses should be allocated by time and effort to the extent reasonably possible. |
| 6) | Management fee disparities. CMG and the Atlantic Trustees, as part of any future study of management fees, should analyze the differences in management fee schedules, principally arising out of the reorganization of the former Excelsior Funds as Atlantic Funds. As part of that analysis, CMG should provide an explanation for any significant fee differences among comparable funds across fund families managed by CMA, such as differences in the management styles of different Funds included the same Lipper category. Finally, whenever CMG proposes a management fee change or an expense cap for any mutual fund managed by CMA that is comparable to any Atlantic Fund, CMG should provide the Trustees with sufficient information about the proposal to allow the Trustees to assess the applicability of the proposed change to the relevant Atlantic Fund or Funds. |
46
| 7) | Tax-exempt Fund expense data. The expense rankings of certain tax-exempt Funds were adversely affected by including certain investment-related interest expenses that Lipper excluded in calculating the expense ratios of competitors. We recommend that CMG follow the Lipper practice and exclude such interest expenses from data submitted to Lipper to avoid unfairly disadvantaging the tax-exempt Funds. |
| 8) | Reduction of volume of paper documents submitted. The effort to rationalize and simplify the data presented to the Trustees and the process by which that data was prepared and organized was regarded as a success by all parties. We should continue to look for opportunities to reduce and simplify the presentation of 15(c) data, especially in the area of Fund profitability. The Fund “Dashboard” volume presents a large volume of Fund data on a single page. If it is continued, the Trustees may wish to consider receiving the underlying Lipper data on CD, rather than the current paper volumes. |
Respectfully submitted,
Steven E. Asher
47
[THIS PAGE INTENTIONALLY LEFT BLANK]
48
Important Information About This Report
Transfer Agent
Columbia Management Services, Inc.
P.O. Box 8081
Boston, MA 02266-8081
1-800-345-6611
Distributor
Columbia Management
Distributors, Inc.
One Financial Center
Boston, MA 02111
Investment Advisor
Columbia Management Advisors, LLC
100 Federal Street
Boston, MA 02110
The fund mails one shareholder report to each shareholder address. If you would like more than one report, please call shareholder services at 1-800-345-6611 and additional reports will be sent to you. This report has been prepared for shareholders of Columbia Bond Fund.
A description of the policies and procedures that the fund uses to determine how to vote proxies and a copy of the fund’s voting records are available (i) at www.columbiamanagement.com; (ii) on the Securities and Exchange Commission’s website at www.sec.gov, and (iii) without charge, upon request, by calling 1-800-368-0346. Information regarding how the fund voted proxies relating to portfolio securities during the 12-month period ended June 30 is available from the SEC’s website. Information regarding how the fund voted proxies relating to portfolio securities is also available from the fund’s website, columbiamanagement.com.
The fund files a complete schedule of portfolio holdings with the SEC for the first and third quarters of each fiscal year on Form N-Q. The fund’s Form N-Q is available on the SEC’s website at www.sec.gov and may be reviewed and copied at the SEC’s Public Reference Room in Washington, D.C. Information on the operation of the Public Reference Room may be obtained by calling
1-800-SEC-0330.
Please read and consider the investment objectives, risks, charges and expenses for any fund carefully before investing. For a prospectus which contains this and other important information about the fund, contact your Columbia Management representative or financial advisor or go to www.columbiamanagement.com.
Columbia Management Group, LLC (“Columbia Management”) is the investment management division of Bank of America Corporation. Columbia Management entities furnish investment management services and products for institutional and individual investors. Columbia Funds are distributed by Columbia Management Distributors, Inc., member of FINRA, SIPC, part of Columbia Management and an affiliate of Bank of America Corporation.
49

One Financial Center
Boston, MA 02111-2621
Columbia Bond Fund
Annual Report, March 31, 2009
©2009 Columbia Management Distributors, Inc.
One Financial Center, Boston, MA 02111-2621
800.345.6611 www.columbiafunds.com
SHC-42/10749-0309 (05/09) 09/78645

Annual Report
March 31, 2009
Columbia Short-Intermediate Bond Fund
| | |
| NOT FDIC INSURED | | May Lose Value |
| NOT BANK ISSUED | | No Bank Guarantee |
Table of Contents
The views expressed in this report reflect the current views of the respective parties. These views are not guarantees of future performance and involve certain risks, uncertainties and assumptions that are difficult to predict, so actual outcomes and results may differ significantly from the views expressed. These views are subject to change at any time based upon economic, market or other conditions and the respective parties disclaim any responsibility to update such views. These views may not be relied on as investment advice and, because investment decisions for a Columbia Fund are based on numerous factors, may not be relied on as an indication of trading intent on behalf of any particular Columbia Fund. References to specific securities should not be construed as a recommendation or investment advice.
President’s Message

Dear Shareholder:
Recent events have shown great volatility in the markets and uncertainty in the economy. During these challenging times, it becomes even more important to focus on long-term horizons and key investment tools that can help manage volatility. This may be the time to reflect on your investment goals and evaluate your portfolio to ensure you are positioned for any potential market rebound.
A long-term financial plan can serve as a road map and guide you through the necessary steps designed to meet your financial goals. Your financial plan should take into account your investment goals, time horizon, overall financial situation, risk tolerance and willingness to ride out market volatility. Your investment professional can be a key resource as you work through this process. The knowledge and experience of an investment professional can help as you create or reevaluate your investment strategy.
The importance of diversification
Although diversification does not ensure a profit or guarantee against loss, a diversified portfolio can be a strategy for successful long-term investing. Diversification refers to the mix of investments within a portfolio. A mutual fund can contribute to portfolio diversification given that a mutual fund’s portfolio represents several investments. Additionally, the way you allocate your money among stocks, bonds and cash, and geographically between foreign and domestic investments, can help to reduce risks. Diversification can result in multiple investments where the positive performance of certain holdings can offset any negative performance from other holdings. Having a diversified portfolio doesn’t mean that the value of the portfolio will never go down, but rather helps strike a balance between risk and reward.
Reevaluate your strategy
An annual review of your investments is a key opportunity to determine if your investment needs have changed or if you need minor adjustments to rebalance your portfolio. Life events like a birth, marriage, home improvement, or change in employment can have a major affect on your spending and goals. Ask yourself how your spending or goals have changed and factor this into your financial plan. Are you using automated investments or payroll deductions to help keep your savings on track? Are you able to set aside additional savings or increase your 401(k) plan contributions? If during your review you find that your investments in any one category (e.g., stocks, bonds or cash) have grown too large based on your diversification plan, you may want to consider redirecting future investments to get back on track.
History has shown that the U.S. stock market has been remarkably resilient¹. Volatility can lead to opportunity. Patience and a commitment to your long-term financial plan may position you to potentially benefit over your investment horizon. We appreciate your business and continued support of Columbia Funds.
Sincerely,

J. Kevin Connaughton
President, Columbia Funds
The board of trustees elected J. Kevin Connaughton president of Columbia Funds on January 16, 2009.
1 | The Dow Jones Industrial Average is the most widely used indicator of the overall condition of the stock market. The Dow Jones Industrial Average Index is a price-weighted average of 30 actively traded blue-chip stocks as selected by the editors of the Wall Street Journal. Indices are not investments, do not incur fees or expenses and are not professionally managed. It is not possible to invest directly in an index. |
Fund Profile – Columbia Short-Intermediate Bond Fund
Performance data quoted represents past performance and current performance may be lower or higher. Past performance is no guarantee of future results. The investment return and principal value will fluctuate so that shares, when redeemed, may be worth more or less than the original cost. Please visit www.columbiafunds.com for daily and most recent month-end performance updates.
Summary
1-year return as of 03/31/09
| | |
| |
 | | –0.82% Class A shares |
| | (without sales charge) |
| |
 | | +1.96% Barclays Capital U.S. Intermediate Government/Credit Bond Index |
|
Morningstar Style BoxTM |
|
Fixed Income Maturity |
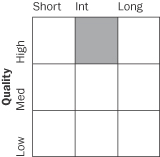
|
The Morningstar Style Box™ reveals a fund’s investment strategy. For fixed-income funds, the vertical axis shows the average credit quality of the bonds owned, and the horizontal axis shows interest rate sensitivity as measured by a bond’s duration (short, intermediate or long). Information shown is based on the most recent data provided by Morningstar.
Summary
| n | | For the 12-month period that ended March 31, 2009, the fund’s Class A shares returned negative 0.82% without sales charge. |
| n | | The fund underperformed its benchmark but outperformed its peer group average. |
| n | | The fund had less exposure than its benchmark to U.S. Treasury securities, which detracted from performance because Treasuries were the best performing asset class for the period. We believe that the fund’s focus on higher quality bonds helped it outperform its peer group. |
Portfolio Management
Alexander D. Powers, managing director of the advisor, has co-managed the fund since its inception and has been associated with the advisor or its predecessors since 1996.
Frank A. Salem, managing director of the advisor, has co-managed the fund since its inception and has been associated with the advisor or its predecessors since 1998.
1
Economic Update – Columbia Short-Intermediate Bond Fund
Summary
For the 12-month period that ended March 31, 2009
| | n | | Despite volatility in many segments of the bond market, the Barclays Capital U.S. Aggregate Bond Index delivered a modest gain. High-yield bonds lost ground, as measured by the Merrill Lynch U.S. High Yield, Cash Pay Index. Municipals recovered from an early setback, as measured by the Barclays Capital Municipal Bond Index. | |
| | |
| Barclays Aggregate Index | | Merrill Lynch Index |
| |

| | 
|
3.13% | | 19.95% |
| Barclays Municipal Index | | |
| |
| | |
2.27% | | |
| | |
| | n | | The broad U.S. stock market, as measured by the S&P 500 Index, returned negative 38.09%. Stock markets outside the United States returned negative 46.51%, as measured (in U.S. dollars) by the MSCI EAFE Index. | |
| | |
| S&P Index | | MSCI Index |
| |
| |
|
38.09% | | 46.51% |
Economic growth ground to a halt during the 12-month period that began April 1, 2008 and ended March 31, 2009. The National Bureau of Economic Research reported that the U.S. economy had slipped into recession late in 2007 and the downturn was even sharper than some anticipated.
A host of factors weighed on consumers and businesses alike. The most severe housing downturn in decades showed few signs of abating as inventories of homes for sale rose, home prices declined and tighter credit standards, the result of continued turmoil in the subprime mortgage market, made it more difficult for homebuyers to qualify for loans. The labor market has contracted for 15 consecutive months, driving the unemployment rate to 8.5%. More than five million jobs have been lost since the recession commenced late in 2007, with nearly two-thirds of the decrease occurring in the most recent five months. Manufacturing activity slowed and consumer spending declined, resulting in one of the weakest holiday seasons in decades.
However, in March there were a few signs that this severe recession is no longer intensifying. Weekly chain store sales and mortgage purchase applications gained some momentum near the end of the period. The trade deficit has narrowed more than expected, raising hopes that first quarter real GDP will contract at a rate well below the fourth quarter’s negative 6.3%.
A weakening economy and turmoil in the financial markets took a toll on consumer confidence, which continued to set new all-time lows during the period. However, the monthly Conference Board gauge was nearly unchanged in March, another indication that the worst could be behind us.
In an effort to restore confidence in the capital markets, loosen the reins on credit and shore up economic growth, the Federal Reserve Board (the Fed) brought a key short-term rate — the federal funds rate — down from 2.25% to a target between zero and 0.25% during the 12-month period — a record low. However, the Fed’s efforts went largely unrewarded. The one bright spot during this period of uncertainty was lower energy and commodity prices. With oil trading near $50 per barrel at the end of the period, gasoline prices have come down from $4 per gallon or more last summer to just over $2 per gallon in recent months.
Some bond market segments delivered positive returns
The U.S. bond market seesawed during the 12-month period, but several sectors managed to deliver modest gains as investors sought refuge from the volatile stock market. Treasury prices rose and yields declined as the economy faltered and stock market volatility increased. The benchmark 10-year U.S. Treasury yield ended the period at 2.70%. In this environment, the Barclays Capital U.S. Aggregate Bond Index1 (formerly the Lehman Brothers U.S. Aggregate Bond Index) returned 3.13%. High-yield bond prices fell sharply as economic prospects weakened and default fears rose.
The Merrill Lynch U.S. High Yield, Cash Pay Index2 returned negative 19.95%. The municipal market suffered a setback early in 2008, then rebounded in the first quarter of 2009. The Barclays Capital Municipal Bond Index3 returned 2.27% for the 12-month period.
2
Economic Update (continued) – Columbia Short-Intermediate Bond Fund
Stocks retreat as economic outlook darkens
Against a weakening economic backdrop, the U.S. stock market lost 38.09% for the 12-month period, as measured by the S&P 500 Index.4 Losses affected the stocks of companies of all sizes and investment style categories, although growth stocks held up better than value stocks, as measured by their respective Russell indices.5 Stock markets outside the U.S. suffered even greater losses. The MSCI EAFE Index6, a broad gauge of stock market performance in foreign developed markets, lost 46.51% (in U.S. dollars) for the period. Emerging stock markets, which generally have had a strong run over the past several years, were also caught in the downdraft. As investors backed away from risk, the MSCI Emerging Markets Index7 returned negative 47.07% (in U.S. dollars).
Past performance is no guarantee of future results.
1 | The Barclays Capital U.S. Aggregate Bond Index is a market value-weighted index that tracks the daily price, coupon, pay-downs and total return performance of fixed-rate, publicly placed, dollar-denominated and nonconvertible investment grade debt issues with at least $250 million par amount outstanding and with at least one year to final maturity. |
2 | The Merrill Lynch U.S. High Yield, Cash Pay Index tracks the performance of non-investment-grade corporate bonds. As of 01/01/2009, Merrill Lynch & Co., Inc. is a wholly-owned subsidiary of Bank of America Corporation and an affiliate of Columbia Management. |
3 | The Barlcays Capital Municipal Bond Index is considered representative of the broad market for investment-grade, tax-exempt bonds with maturities of at least one year. |
4 | The Standard & Poor’s (S&P) 500 Index tracks the performance of 500 widely held, large-capitalization U.S. stocks. |
5 | The Russell 1000 Growth Index measures the performance of those Russell 1000 Index companies with higher price-to-book ratios and higher forecasted growth values. The Russell 1000 Value Index measures the performance of those companies in the Russell 1000 Index with lower price-to-book ratios and lower forecasted growth values. The Russell 2000 Growth Index measures the performance of those Russell 2000 Index companies with higher price-to-book ratios and higher forecasted growth values. The Russell 2000 Value Index measures the performance of those Russell 2000 Index companies with lower price-to-book ratios and lower forecasted growth values. The Russell 3000 Growth Index measures the performance of those Russell 3000 Index companies with higher price-to-book ratios and higher forecasted growth values. The Russell 3000 Value Index measures the performance of those Russell 3000 Index companies with lower price-to-book ratios and lower forecasted growth values. The Russell Midcap Growth Index measures the performance of those Russell Midcap companies with higher price-to-book ratios and higher forecasted growth values. The Russell Midcap Value Index measures the performance of those Russell Midcap Index companies with lower price-to-book ratios and lower forecasted growth values. |
6 | The Morgan Stanley Capital International (MSCI) Europe, Australasia, Far East (EAFE) Index is a free float-adjusted market capitalization index that is designed to measure developed market equity performance, excluding the U.S. and Canada. |
7 | The Morgan Stanley Capital International (MSCI) Emerging Markets Index is a widely accepted index composed of a sample of companies from 25 countries representing the global emerging stock markets. |
Indices are not available for investment, and do not reflect sales charges, fees, brokerage commissions, taxes or other expenses of investing. Securities in the fund may not match those in an index.
3
Performance Information – Columbia Short-Intermediate Bond Fund
Performance data quoted represents past performance and current performance may be lower or higher. Past performance is no guarantee of future results. The investment return and principal value will fluctuate so that shares, when redeemed, may be worth more or less than the original cost. Please visit www.columbiafunds.com for daily and most recent month-end performance updates.
| | |
Annual operating expense
ratio (%)* |
| |
Class A | | 0.95 |
Class C | | 1.70 |
Class Z | | 0.70 |
| * | The annual operating expense ratio is as stated in the fund’s prospectus that is current as of the date of this report. Differences in expense ratios disclosed elsewhere in this report may result from including fee waivers and expense reimbursements as well as different time periods used in calculating the ratios. | |
|
| Performance of a $10,000 investment 04/01/99 – 03/31/09 |
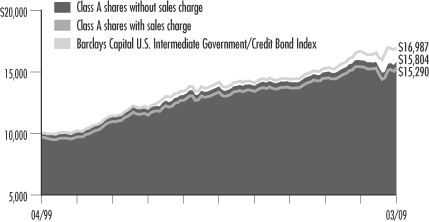
The chart above shows the change in value of a hypothetical $10,000 investment in Class A shares of Columbia Short-Intermediate Bond Fund during the stated time period, and does not reflect the deduction of taxes that a shareholder may pay on fund distributions or on the redemption of fund shares. The Barclays Capital U.S. Intermediate Government/Credit Bond Index tracks the performance of intermediate-term U.S. government and corporate bonds. Indices are not available for investment, and do not reflect sales charges, fees, brokerage commissions, taxes or other expenses of investing. Securities in the fund may not match those in an index.
| | | | |
| Performance of a $10,000 investment 04/01/99 – 03/31/09 ($) |
| | |
| Sales charge | | without | | with |
Class A | | 15,804 | | 15,290 |
Class C | | 15,711 | | 15,711 |
Class Z | | 15,850 | | n/a |
| | | | | | | | | | |
| Average annual total return as of 03/31/09 (%) |
| | | |
| Share class | | A | | C | | Z |
| Inception | | 03/31/08 | | 03/31/08 | | 12/31/92 |
| Sales charge | | without | | with | | without | | with | | without |
1-year | | –0.82 | | –4.00 | | –1.41 | | –2.36 | | –0.54 |
5-year | | 2.74 | | 2.06 | | 2.62 | | 2.62 | | 2.80 |
10-year | | 4.68 | | 4.34 | | 4.62 | | 4.62 | | 4.71 |
The “with sales charge” returns include the maximum initial sales charge of 3.25% for Class A shares and the applicable contingent deferred sales charge of 1.00% for Class C shares for the first year only. The “without sales charge” returns do not include the effect of sales charges. If they had, returns would be lower.
Performance results reflect any fee waivers or reimbursements of fund expenses by the investment advisor and/or any of its affiliates. Absent these fee waivers or expense reimbursement arrangements, performance results would have been lower.
The Fund commenced operations on March 31, 2008. Class A, Class C and Class Z share performance information includes returns of Shares class shares of Intermediate-Term Bond Fund, the predecessor to the Fund and a series of Excelsior Funds, Inc. (the “Predecessor Fund”), for periods prior to March 31, 2008. These returns shown for all share classes reflect any differences in sales charges, but have not been restated to reflect any differences in expenses between the Predecessor Fund share class and the newer share classes. If differences in expenses had been reflected, the returns shown for periods prior to March 31, 2008 would be lower for Class A and Class C shares, since these newer classes of shares are subject to higher distribution and service (Rule 12b-1) fees. Class Z shares are sold at net asset value with no distribution and service (Rule 12b-1) fees. Class Z shares have limited eligibility and the investment minimum requirements may vary. Please see the fund’s prospectus for details. Performance for different share classes will vary based on differences in sales charges and fees associated with each class.
The tables do not reflect the deduction of taxes that a shareholder may pay on fund distributions or on the redemption of fund shares.
4
Understanding Your Expenses – Columbia Short-Intermediate Bond Fund
Estimating your actual expenses
To estimate the expenses that you paid over the period, first you will need your account balance at the end of the period:
| | n | | For shareholders who receive their account statements from Columbia Management Services, Inc., your account balance is available online at www.columbiafunds.com or by calling Shareholder Services at 800.345.6611. | |
| | n | | For shareholders who receive their account statements from their financial intermediary, contact your financial intermediary to obtain your account balance. | |
| | 1. | Divide your ending account balance by $ 1,000. For example, if an account balance was $8,600 at the end of the period, the result would be 8.6. | |
| | 2. | In the section of the table below titled “Expenses paid during the period,” locate the amount for your share class. You will find this number in the column labeled “Actual.” Multiply this number by the result from step 1. Your answer is an estimate of the expenses you paid on your account during the period. | |
If the value of your account falls below the minimum initial investment requirement applicable to you, your account generally will be subject to a $20 annual fee. This fee is not included in the accompanying table. If you are subject to the fee, keep it in mind when you are estimating the ongoing expenses of investing in the fund and when comparing the expenses of this fund with other funds.
As a Fund shareholder, you incur two types of costs. There are transaction costs, which generally include sales charges on purchases and may include redemption fees or exchange fees. There are also ongoing costs, which generally include investment advisory fees, distribution and service (Rule 12b-1) fees and other fund expenses. The information on this page is intended to help you understand the ongoing costs of investing in the fund and to compare these costs with the ongoing costs of investing in other mutual funds.
Analyzing your fund’s expenses by share class
To illustrate these ongoing costs, we have provided an example and calculated the expenses paid by investors in each share class during the period. The information in the following table is based on an initial investment of $1,000, which is invested at the beginning of the period and held for the entire period. Expense information is calculated two ways and each method provides you with different information. The amount listed in the “Actual” column is calculated using the fund’s actual operating expenses and total return for the period. The amount listed in the “Hypothetical” column for each share class assumes that the return each year is 5% before expenses and is calculated based on the fund’s actual operating expenses. You should not use the hypothetical account values and expenses to estimate either your actual account balance at the end of the period or the expenses you paid during this period.
Compare with other funds
Since all mutual funds are required to include the same hypothetical calculations about expenses in shareholder reports, you can use this information to compare the ongoing cost of investing in the fund with other funds. To do so, compare the 5% hypothetical example with the 5% hypothetical examples that appear in the shareholder reports of other funds. As you compare hypothetical examples of other funds, it is important to note that hypothetical examples are meant to highlight the ongoing costs of investing in a fund and do not reflect any transaction costs, such as sales charges, redemption fees or exchange fees.
| | | | | | | | | | | | | | |
| 10/01/08 – 03/31/09 | | | | | | | | | | |
| | | | |
| | | Account value at the
beginning of the period ($) | | Account value at the
end of the period ($) | | Expenses paid
during the period ($) | | Fund’s annualized
expense ratio (%) |
| | | Actual | | Hypothetical | | Actual | | Hypothetical | | Actual | | Hypothetical | | Actual |
Class A | | 1,000.00 | | 1,000.00 | | 1,029.52 | | 1,020.44 | | 4.55 | | 4.53 | | 0.90 |
Class C | | 1,000.00 | | 1,000.00 | | 1,026.88 | | 1,016.70 | | 8.34 | | 8.30 | | 1.65 |
Class Z | | 1,000.00 | | 1,000.00 | | 1,030.92 | | 1,021.69 | | 3.29 | | 3.28 | | 0.65 |
Expenses paid during the period are equal to the annualized expense ratio for the share class, multiplied by the average account value over the period, then multiplied by the number of days in the fund’s most recent fiscal half-year and divided by 365.
Had the investment advisor and/or any of its affiliates not waived fees or reimbursed a portion of expenses, account value at the end of the period would have been reduced.
It is important to note that the expense amounts shown in the table are meant to highlight only ongoing costs of investing in the fund and do not reflect any transaction costs, such as sales charges, redemption fees or exchange fees. Therefore, the hypothetical examples provided may not help you determine the relative total costs of owning shares of different funds. If these transaction costs were included, your costs would have been higher.
5
Portfolio Managers’ Report – Columbia Short-Intermediate Bond Fund
Performance data quoted represents past performance and current performance may be lower or higher. Past performance is no guarantee of future results. The investment return and principal value will fluctuate so that shares, when redeemed, may be worth more or less than the original cost. Please visit www.columbiafunds.com for daily and most recent month-end performance updates.
| | |
| Net asset value per share |
| |
as of 03/31/09 ($) | | |
Class A | | 6.86 |
Class C | | 6.87 |
Class Z | | 6.86 |
| | |
| | |
| Distributions declared per share |
| |
04/01/08 – 03/31/09 ($) | | |
Class A | | 0.32 |
Class C | | 0.27 |
Class Z | | 0.34 |
| | |
| | |
| 30-day SEC Yields |
| |
as of 03/31/09 (%) | | |
Class A | | 3.99 |
Class C | | 3.22 |
Class Z | | 4.23 |
The 30-day SEC yields reflect the fund’s earning power, net of expenses, expressed as an annualized percentage of the public offering price at the end of the period. Had the investment advisor not waived fees or reimbursed a portion of expenses, the 30-day SEC yields would have been lower.
For the 12-month period that ended March 31, 2009, the fund’s Class A shares returned negative 0.82% without sales charge. The fund’s return was lower than the 1.96% return of its benchmark, the Barclays Capital U.S. Intermediate Government/Credit Bond Index1, for the same period. An underweight in Treasury securities and an overweight in commercial mortgage backed securities (CMBS), which underperformed Treasuries, hampered relative performance for the period. However, we believe that the portfolio’s generally high credit quality helped it outperform the negative 2.28% average return of its peer group, the Lipper Short-Intermediate Investment Grade Debt Funds Classification.2
Sector weights drove performance
Sector weights drove the fund’s performance for the period. An underweight in Treasury securities versus the benchmark hurt relative performance, as Treasuries were the best performing asset class. The fund had more exposure to CMBS than the index, which hampered its relative return. Even though we emphasized more seasoned, high quality names, there was a lack of liquidity in the marketplace for much of the year and investors did not differentiate between the high quality names and the problematic names, driving prices down across the sector. However, liquidity has begun to return and higher quality issues began to rebound in the final months of the period.
The fund had more exposure than the index to mortgage-backed securities (MBS), which benefited from the U.S. Treasury’s and Federal Reserve’s announcements that they would buy MBS to reduce mortgage rates. As MBS were purchased by these government programs, prices increased and returns benefited. The fund also held a stake in Temporary Liquidity Guaranteed Program bonds, which are issued by financial companies and guaranteed by the federal government. We purchased these bonds for their high quality and superior yield relative to Treasury issues.
Within the fund’s corporate holdings, we raised an underweight in the financial sector to a market weight in mid to late 2008, adding high quality issuers such as JPMorgan Chase & Co. and Bank of New York, Inc. We believe both firms have the potential to emerge from the economic cycle in a stronger position than the average financial company. We increased the fund’s industrial holdings during the period. We also emphasized less cyclical, more stable companies that we believe have the potential to weather an economic downturn, including Pepsico, Inc., in the consumer staples sector, and Cisco Systems, Inc. and Oracle Corp. in the technology sector.
1 | The Barclays Capital U.S. Intermediate Government/Credit Bond Index tracks the performance of intermediate term U.S. government and corporate bonds. Indices are not available for investment, and do not reflect sales charges, fees, brokerage commissions, taxes or other expenses of investing. Securities in the portfolio may not match those in an index. |
2 | Lipper Inc., a widely respected data provider in the industry, calculates an average total return (assuming reinvestment of distributions) for mutual funds with investment objectives similar to those of the fund. Lipper makes no adjustment for the effect of sales loads. |
6
Portfolio Managers’ Report (continued) –Columbia Short-Intermediate Bond Fund
| | |
| Portfolio structure |
| |
as of 03/31/09 (%) | | |
Corporate Bonds | | 42.0 |
Government & Agency Obligations | | 20.5 |
Commercial Mortgage-Backed Securities | | 14.5 |
Collateralized Mortgage Obligations | | 9.1 |
Mortgage-Backed Securities | | 5.8 |
Asset Backed-Securities | | 4.5 |
Cash & Equivalents | | 3.2 |
| | |
| Maturity Breakdown |
| |
as of 03/31/09 (%) | | |
0 – 1 year | | 5.9 |
1 – 5 years | | 59.3 |
5 – 10 years | | 33.7 |
10 – 20 years | | 1.1 |
| | |
Quality Breakdown | | |
| |
as of 03/31/09 (%) | | |
AAA | | 59.9 |
AA | | 7.0 |
A | | 22.3 |
BBB | | 6.9 |
BB | | 0.4 |
CCC | | 0.3 |
Cash & Equivalents | | 3.2 |
Ratings shown in the quality breakdown represent the rating assigned to a particular bond by one of the following nationally-recognized rating agencies: Standard and Poor’s, Moody’s Investors Service, Inc. or Fitch Ratings Ltd. Ratings are relative and subjective and are not absolute standards of quality.
The fund’s credit quality does not remove market risk. The fund is actively managed and the composition of its portfolio will change over time. Information provided is calculated as a percentage of net assets.
The fund has benefited from its relatively high credit quality, maintaining only about half the benchmark weight in BBB-rated issues for most of the period. However, we have started to increase exposure to these lower rated securities with an eye to achieving a neutral weight relative to the index within the next several months.
Looking forward
We plan to maintain the fund’s overweight in CMBS and an underweight in Treasuries. We believe the latter will suffer as the federal government increases the supply of bonds to fund its economic plans. CMBS trade at a high yield and we believe they have the potential to continue to outperform Treasury securities.
Investing in fixed-income securities may involve certain risks, including the credit quality of individual issuers, possible prepayments, market or economic developments and yields and share price fluctuations due to changes in interest rates. When interest rates go up, bond prices typically drop, and vice versa.
7
Investment Portfolio – Columbia Short-Intermediate Bond Fund
March 31, 2009
Corporate Fixed-Income Bonds & Notes – 42.0%
| | | | | | |
| | | | | Par ($) | | Value ($) |
| Basic Materials – 0.8% | | | | | | |
| Chemicals – 0.4% | | | | | | |
| EI Du Pont de Nemours & Co. | | 6.000% 07/15/18 | | 1,460,000 | | 1,466,025 |
| | | | | | |
| | Chemicals Total | | | | 1,466,025 |
| Iron/Steel – 0.4% | | | | | | |
| Nucor Corp. | | 5.850% 06/01/18 | | 1,290,000 | | 1,288,073 |
| | | | | | |
| | Iron/Steel Total | | | | 1,288,073 |
| | | | | | |
| | Basic Materials Total | | | | 2,754,098 |
| | | | | | |
| Communications – 5.0% | | | | | | |
| Media – 1.4% | | | | | | |
| Comcast Cable Holdings LLC | | 9.800% 02/01/12 | | 3,595,000 | | 3,853,585 |
| | | |
| Historic TW, Inc. | | 9.150% 02/01/23 | | 1,330,000 | | 1,322,497 |
| | | | | | |
| | Media Total | | | | 5,176,082 |
| Telecommunication Services – 3.6% | | | | | | |
| America Movil S.A. de C.V. | | 5.500% 03/01/14 | | 2,150,000 | | 2,061,910 |
| | | |
| AT&T, Inc. | | 5.500% 02/01/18 | | 1,750,000 | | 1,692,171 |
| | | |
| Cincinnati Bell, Inc. | | 8.375% 01/15/14 | | 500,000 | | 470,000 |
| | | |
| Cisco Systems, Inc. | | 5.500% 02/22/16 | | 1,580,000 | | 1,671,857 |
| | | |
| Sprint Capital Corp. | | 8.375% 03/15/12 | | 1,530,000 | | 1,377,000 |
| | | |
| Telefonica Emisiones SAU | | 6.421% 06/20/16 | | 1,125,000 | | 1,163,175 |
| | | |
| Verizon Wireless Capital LLC | | 5.550% 02/01/14 (a) | | 5,000,000 | | 5,004,180 |
| | | | | | |
| | Telecommunication Services Total | | | | 13,440,293 |
| | | | | | |
| | Communications Total | | | | 18,616,375 |
| | | | | | |
| Consumer Cyclical – 1.3% | | | | | | |
| Retail – 1.3% | | | | | | |
| CVS Lease Pass Through Trust | | 6.125% 08/15/16 | | 3,000,000 | | 3,020,199 |
| | | |
| Target Corp. | | 5.875% 07/15/16 | | 1,790,000 | | 1,856,948 |
| | | | | | |
| | Retail Total | | | | 4,877,147 |
| | | | | | |
| | Consumer Cyclical Total | | | | 4,877,147 |
| | | | | | |
| Consumer Non-Cyclical – 4.1% | | | | | | |
| Beverages – 2.0% | | | | | | |
| Bottling Group LLC | | 5.500% 04/01/16 | | 1,180,000 | | 1,253,678 |
| | | |
| Diageo Capital PLC | | 4.375% 05/03/10 | | 4,000,000 | | 4,043,416 |
| | | |
| PepsiCo, Inc. | | 3.750% 03/01/14 | | 1,850,000 | | 1,876,509 |
| | | | | | |
| | Beverages Total | | | | 7,173,603 |
| Commercial Services – 0.1% | | | | | | |
| Iron Mountain, Inc. | | 8.625% 04/01/13 | | 500,000 | | 500,000 |
| | | | | | |
| | Commercial Services Total | | | | 500,000 |
See Accompanying Notes to Financial Statements.
8
Columbia Short-Intermediate Bond Fund
March 31, 2009
Corporate Fixed-Income Bonds & Notes (continued)
| | | | | | |
| | | | | Par ($) | | Value ($) |
| | | | | |
| Food – 0.9% | | | | | | |
| HJ Heinz Co. | | 5.350% 07/15/13 | | 2,045,000 | | 2,109,477 |
| | | |
| SYSCO Corp. | | 4.200% 02/12/13 | | 1,175,000 | | 1,206,592 |
| | | | | | |
| | Food Total | | | | 3,316,069 |
| Healthcare Services – 0.5% | | | | | | |
| UnitedHealth Group, Inc. | | 6.000% 06/15/17 | | 2,130,000 | | 1,980,962 |
| | | | | | |
| | Healthcare Services Total | | | | 1,980,962 |
| Pharmaceuticals – 0.6% | | | | | | |
| Novartis Securities Investment Ltd. | | 5.125% 02/10/19 | | 2,275,000 | | 2,309,857 |
| | | | | | |
| | Pharmaceuticals Total | | | | 2,309,857 |
| | | | | | |
| | Consumer Non-Cyclical Total | | | | 15,280,491 |
| | | | | | |
| Energy – 4.3% | | | | | | |
| Oil & Gas – 0.1% | | | | | | |
| Marathon Oil Corp. | | 7.500% 02/15/19 | | 380,000 | | 382,846 |
| | | | | | |
| | Oil & Gas Total | | | | 382,846 |
| | | |
| Oil & Gas Services – 0.9% | | | | | | |
| Baker Hughes, Inc. | | 7.500% 11/15/18 | | 1,725,000 | | 1,960,463 |
| | | |
| Smith International, Inc. | | 9.750% 03/15/19 | | 1,470,000 | | 1,535,513 |
| | | | | | |
| | Oil & Gas Services Total | | | | 3,495,976 |
| | | |
| Oil, Gas & Consumable Fuels – 3.3% | | | | | | |
| Apache Corp. | | 5.250% 04/15/13 | | 1,675,000 | | 1,734,576 |
| | | |
| BP Capital Markets PLC | | 1.526% 03/17/10 (b) | | 3,900,000 | | 3,903,022 |
| | | |
| Chevron Corp. | | 3.950% 03/03/14 | | 1,250,000 | | 1,283,711 |
| | | |
| ConocoPhillips | | 4.400% 05/15/13 | | 1,290,000 | | 1,312,789 |
| | | |
| Hess Corp. | | 8.125% 02/15/19 | | 1,895,000 | | 1,953,499 |
| | | |
| Valero Energy Corp. | | 6.125% 06/15/17 | | 930,000 | | 799,708 |
| | 9.375% 03/15/19 | | 1,015,000 | | 1,047,856 |
| | | | | | |
| | Oil, Gas & Consumable Fuels Total | | | | 12,035,161 |
| | | | | | |
| | Energy Total | | | | 15,913,983 |
| | | | | | |
| Financials – 18.9% | | | | | | |
| Banks – 14.9% | | | | | | |
| American Express Credit Corp. | | 5.875% 05/02/13 | | 940,000 | | 825,299 |
| | | |
| Bank of New York Mellon Corp. | | 5.125% 08/27/13 | | 1,295,000 | | 1,325,443 |
| | | |
| Citibank NA | | 1.625% 03/30/11 | | 5,550,000 | | 5,559,374 |
See Accompanying Notes to Financial Statements.
9
Columbia Short-Intermediate Bond Fund
March 31, 2009
Corporate Fixed-Income Bonds & Notes (continued)
| | | | | | |
| | | | | Par ($) | | Value ($) |
| Financials (continued) | | | | | | |
| | | |
| Citigroup, Inc. | | 5.250% 02/27/12 | | 5,480,000 | | 4,883,316 |
| | 6.125% 05/15/18 | | 825,000 | | 712,088 |
| | | |
| Comerica Bank | | 5.200% 08/22/17 | | 1,305,000 | | 905,036 |
| | | |
| Credit Suisse/New York NY | | 5.000% 05/15/13 | | 1,225,000 | | 1,183,694 |
| | 6.000% 02/15/18 | | 1,520,000 | | 1,325,746 |
| | | |
| Deutsche Bank AG | | 4.875% 05/20/13 | | 2,730,000 | | 2,677,748 |
| | | |
| Goldman Sachs Group, Inc. | | 3.250% 06/15/12 | | 2,505,000 | | 2,614,674 |
| | 6.150% 04/01/18 | | 3,755,000 | | 3,429,885 |
| | | |
| JPMorgan Chase & Co. | | 1.650% 02/23/11 | | 1,945,000 | | 1,953,153 |
| | 2.125% 06/22/12 | | 3,140,000 | | 3,155,141 |
| | 5.150% 10/01/15 | | 4,030,000 | | 3,552,642 |
| | 6.000% 01/15/18 | | 1,395,000 | | 1,409,066 |
| | | |
| Keycorp | | 6.500% 05/14/13 | | 1,045,000 | | 1,019,748 |
| | | |
| Merrill Lynch & Co., Inc | | 6.875% 04/25/18 (c) | | 1,075,000 | | 840,750 |
| | | |
| Morgan Stanley | | 5.550% 04/27/17 | | 1,760,000 | | 1,566,124 |
| | 5.950% 12/28/17 | | 1,080,000 | | 981,075 |
| | | |
| National City Corp. | | 4.900% 01/15/15 | | 1,260,000 | | 1,159,169 |
| | | |
| Regions Bank | | 3.250% 12/09/11 | | 3,785,000 | | 3,939,023 |
| | | |
| Republic New York Corp. | | 9.500% 04/15/14 | | 2,700,000 | | 2,613,022 |
| | | |
| Sovereign Bank | | 2.750% 01/17/12 | | 1,945,000 | | 1,983,097 |
| | | |
| UBS Preferred Funding Trust I | | 8.622% 10/29/49 (b)(d) | | 1,010,000 | | 405,345 |
| | | |
| Wachovia Corp. | | 5.500% 05/01/13 | | 2,940,000 | | 2,710,836 |
| | 5.750% 02/01/18 | | 1,760,000 | | 1,559,142 |
| | | |
| Zions Bancorp. | | 5.500% 11/16/15 | | 975,000 | | 634,452 |
| | | | | | |
| | Banks Total | | | | 54,924,088 |
| | | |
| Diversified Financial Services – 3.1% | | | | | | |
| Capital One Financial Corp. | | 6.750% 09/15/17 | | 1,630,000 | | 1,359,951 |
| | | |
| Ford Motor Credit Co. | | 8.625% 11/01/10 | | 1,400,000 | | 1,115,101 |
| | | |
| General Electric Capital Corp. | | 5.250% 10/19/12 | | 2,500,000 | | 2,406,792 |
| | | |
| General Electric Capital Corp., MTN | | 6.000% 06/15/12 | | 2,770,000 | | 2,731,015 |
| | | |
| John Deere Capital Corp., MTN | | 5.650% 07/25/11 | | 3,080,000 | | 3,179,087 |
| | | |
| Lehman Brothers Holdings, Inc. | | 4.250% 01/27/10 (e)(f) | | 2,960,000 | | 377,400 |
| | 5.625% 01/24/13 (e)(f) | | 1,750,000 | | 223,125 |
| | | | | | |
| | Diversified Financial Services Total | | | | 11,392,471 |
See Accompanying Notes to Financial Statements.
10
Columbia Short-Intermediate Bond Fund
March 31, 2009
Corporate Fixed-Income Bonds & Notes (continued)
| | | | | | |
| | | | | Par ($) | | Value ($) |
| Financials (continued) | | | | | | |
| Insurance – 0.9% | | | | | | |
| MetLife, Inc. | | 7.717% 02/15/19 | | 1,660,000 | | 1,488,457 |
| | | |
| New York Life Global Funding | | 4.650% 05/09/13 (a) | | 2,000,000 | | 1,947,562 |
| | | | | | |
| | Insurance Total | | | | 3,436,019 |
| | | | | | |
| | Financials Total | | | | 69,752,578 |
| | | | | | |
| Industrials – 2.0% | | | | | | |
| Machinery – 0.4% | | | | | | |
| Caterpillar Financial Services Corp. | | 5.850% 09/01/17 | | 1,785,000 | | 1,550,881 |
| | | | | | |
| | Machinery Total | | | | 1,550,881 |
| | | |
| Transportation – 1.6% | | | | | | |
| Federal Express Corp. | | 5.500% 08/15/09 | | 2,380,000 | | 2,399,152 |
| | | |
| Norfolk Southern Corp. | | 5.750% 04/01/18 | | 1,105,000 | | 1,098,116 |
| | | |
| Union Pacific Corp. | | 7.875% 01/15/19 | | 2,120,000 | | 2,337,976 |
| | | | | | |
| | Transportation Total | | | | 5,835,244 |
| | | | | | |
| | Industrials Total | | | | 7,386,125 |
| | | | | | |
| Technology – 1.3% | | | | | | |
| Office/Business Equipment – 0.2% | | | | | | |
| Xerox Corp. | | 6.400% 03/15/16 | | 1,000,000 | | 762,462 |
| | | | | | |
| | Office/Business Equipment Total | | | | 762,462 |
| | | |
| Software – 1.1% | | | | | | |
| Oracle Corp. | | 5.250% 01/15/16 | | 4,025,000 | | 4,104,003 |
| | | | | | |
| | Software Total | | | | 4,104,003 |
| | | | | | |
| | Technology Total | | | | 4,866,465 |
| | | | | | |
| Utilities – 4.3% | | | | | | |
| Electric – 4.3% | | | | | | |
| Duke Energy Carolinas LLC | | 5.250% 01/15/18 | | 2,120,000 | | 2,159,250 |
| | | |
| Georgia Power Co. | | 5.700% 06/01/17 | | 3,140,000 | | 3,246,041 |
| | | |
| Nisource Finance Corp. | | 5.250% 09/15/17 | | 2,645,000 | | 1,971,638 |
| | | |
| Pacific Gas & Electric Co. | | 5.625% 11/30/17 | | 1,910,000 | | 1,934,513 |
| | | |
| Southern Co. | | 5.300% 01/15/12 | | 2,050,000 | | 2,137,088 |
| | | |
| Virginia Electric Power | | 5.100% 11/30/12 | | 3,140,000 | | 3,215,687 |
| | 5.400% 01/15/16 | | 1,110,000 | | 1,123,345 |
| | | | | | |
| | Electric Total | | | | 15,787,562 |
| | | | | | |
| | Utilities Total | | | | 15,787,562 |
| | | | | | |
| | Total Corporate Fixed-Income Bonds & Notes
(Cost of $164,270,708) | | | | 155,234,824 |
| | | | | | |
See Accompanying Notes to Financial Statements.
11
Columbia Short-Intermediate Bond Fund
March 31, 2009
Government & Agency Obligations – 20.5%
| | | | | | |
| | | | | Par ($) | | Value ($) |
| U.S. Government Agencies – 5.0% | | | | |
| Federal Home Loan Mortgage Corp. | | 4.000% 01/29/13 | | 7,760,000 | | 7,936,649 |
| | | |
| Federal National Mortgage Association | | 3.625% 01/29/13 | | 10,345,000 | | 10,548,548 |
| | | | | | |
| | U.S. Government Agencies Total | | | | 18,485,197 |
| | | | | | |
| U.S. Government Obligations – 15.5% | | | | | | |
| Israel Government AID Bond | | (g) 05/15/18 | | 8,355,000 | | 6,100,036 |
| | | |
| U.S. Treasury Inflation Indexed Note | | 1.625% 01/15/18 | | 4,020,803 | | 4,063,524 |
| | | |
| U.S. Treasury Note | | 2.625% 02/29/16 (h) | | 13,724,000 | | 14,074,607 |
| | 0.875% 02/28/11 (h) | | 1,785,000 | | 1,788,409 |
| | 1.375% 02/15/12 (h) | | 3,590,000 | | 3,619,169 |
| | 1.750% 01/31/14 (h) | | 670,000 | | 674,556 |
| | 2.750% 10/31/13 (h) | | 9,625,000 | | 10,151,372 |
| | 4.500% 05/15/17 | | 14,805,000 | | 17,045,411 |
| | | | | | |
| | U.S. Government Obligations Total | | | | 57,517,084 |
| | | | | | |
| | Total Government & Agency Obligations
(Cost of $74,438,730) | | | | 76,002,281 |
| | |
| Commercial Mortgage-Backed Securities – 14.5% | | | | |
| Bank of America Commercial Mortgage, Inc. | | 4.760% 11/10/39 | | 4,350,000 | | 3,471,201 |
| | | |
| Capital One Multi-Asset Execution Trust | | 4.700% 06/15/15 | | 2,665,000 | | 2,509,534 |
| | | |
| Commercial Mortgage Asset Trust | | 7.230% 01/17/32 (b) | | 2,000,000 | | 1,860,456 |
| | 7.800% 11/17/32 (b) | | 3,556,000 | | 3,246,234 |
| | | |
| Credit Suisse First Boston Mortgage Securities Corp. | | 5.881% 12/15/35 (a)(b) | | 3,325,000 | | 1,790,168 |
| | | |
| First Union National Bank Commercial Mortgage, Inc. | | 6.141% 02/12/34 | | 5,135,000 | | 5,096,060 |
| | | |
| LB-UBS Commercial Mortgage Trust | | 6.653% 11/15/27 | | 3,970,000 | | 3,998,583 |
| | | |
| Morgan Stanley Dean Witter Capital I | | 4.740% 11/13/36 | | 3,085,000 | | 2,809,956 |
| | | |
| Nomura Asset Securities Corp. | | 7.101% 03/15/30 (b) | | 4,025,000 | | 4,101,196 |
| | | |
| Salomon Brothers Mortgage Securities VII | | 4.865% 03/18/36 | | 3,320,000 | | 3,119,696 |
| | | |
| Wachovia Bank Commercial Mortgage Trust | | 4.608% 12/15/35 | | 5,826,105 | | 5,690,637 |
| | 5.001% 07/15/41 | | 1,719,000 | | 1,655,876 |
| | 5.087% 07/15/42 (b) | | 4,267,000 | | 3,642,039 |
| | 5.110% 07/15/42 (b) | | 6,150,000 | | 4,859,699 |
See Accompanying Notes to Financial Statements.
12
Columbia Short-Intermediate Bond Fund
March 31, 2009
Commercial Mortgage-Backed Securities (continued)
| | | | | | |
| | | | | Par ($) | | Value ($) |
| | | | | |
| | 5.229% 07/15/41 (b) | | 4,775,000 | | 4,313,796 |
| | 6.287% 04/15/34 | | 1,435,000 | | 1,408,548 |
| | | | | | |
| | Total Commercial Mortgage-Backed Securities
(Cost of $60,948,449) | | | | 53,573,679 |
| | |
| Collateralized Mortgage Obligations – 9.1% | | | | |
| Agency – 9.1% | | | | | | |
| Federal Home Loan Mortgage Corp. | | 4.375% 04/15/15 | | 1,940,286 | | 1,975,087 |
| | | |
| Federal National Mortgage Association | | 5.000% 09/25/33 | | 7,022,453 | | 7,339,572 |
| | 5.500% 03/25/33 | | 3,995,000 | | 4,164,737 |
| | | |
| Government National Mortgage Association | | 4.478% 08/16/32 | | 2,925,000 | | 2,997,171 |
| | 4.667% 09/16/25 | | 2,800,000 | | 2,890,144 |
| | 5.183% 05/16/28 (b) | | 10,355,000 | | 10,859,761 |
| | 5.250% 07/16/29 (b) | | 3,274,792 | | 3,377,309 |
| | | | | | |
| | Agency Total | | | | 33,603,781 |
| | | | | | |
| | Total Collateralized Mortgage Obligations
(Cost of $32,158,757) | | | | 33,603,781 |
| | |
| Mortgage-Backed Securities – 5.8% | | | | |
| Federal National Mortgage Association | | 4.000% 03/01/39 | | 15,500,000 | | 15,584,766 |
| | 4.790% 11/01/12 | | 2,630,000 | | 2,719,298 |
| | | |
| Government National Mortgage Association | | 4.500% 09/15/33 | | 1,754,604 | | 1,799,599 |
| | 4.500% 10/15/33 | | 1,037,767 | | 1,064,380 |
| | 6.000% 11/15/23 | | 208,861 | | 220,627 |
| | 8.000% 05/15/23 | | 1,299 | | 1,400 |
| | 8.500% 01/15/17 | | 10,310 | | 11,139 |
| | 8.500% 04/15/17 | | 6,649 | | 7,183 |
| | | | | | |
| | Total Mortgage-Backed Securities
(Cost of $20,926,482) | | | | 21,408,392 |
| | |
| Asset-Backed Securities – 4.5% | | | | |
| Capital Auto Receivables Asset Trust | | 4.460% 07/15/14 | | 3,655,000 | | 3,253,100 |
| | 5.500% 04/20/10 (a) | | 2,200,000 | | 2,179,807 |
| | | |
| Chase Issuance Trust | | 1.006% 01/15/12 (b) | | 4,940,000 | | 4,854,235 |
| | | |
| Discover Card Master Trust | | 5.100% 10/15/13 | | 1,265,000 | | 1,241,331 |
| | | |
| Honda Auto Receivables Owner Trust | | 4.470% 01/18/12 | | 1,270,000 | | 1,285,518 |
See Accompanying Notes to Financial Statements.
13
Columbia Short-Intermediate Bond Fund
March 31, 2009
Asset-Backed Securities (continued)
| | | | | | | |
| | | | | Par ($) | | Value ($) | |
| | | | | | |
| USAA Auto Owner Trust | | 4.280% 10/15/12 | | 995,000 | | 1,005,006 | |
| | 4.900% 02/15/12 | | 347,985 | | 351,741 | |
| | 5.070% 06/15/13 | | 2,385,000 | | 2,440,570 | |
| | | | | | | |
| | Total Asset-Backed Securities
(Cost of $16,949,928) | | | | 16,611,308 | |
| | | | | | | |
| | | | | Shares | | | |
| Securities Lending Collateral – 4.0% | | | | | | | |
| | State Street Navigator Securities Lending Prime Portfolio (i) (7 day yield of 0.943%) | | 14,732,086 | | 14,732,086 | |
| | | | | | | |
| | Total Securities Lending Collateral
(Cost of $14,732,086) | | | | 14,732,086 | |
| | | | | | | |
| | | | | Par ($) | | | |
| Short-Term Obligation – 3.2% | | | | | | | |
| | Repurchase agreement with Fixed Income Clearing Corp., dated 03/31/09, due 04/01/09 at 0.140%, collateralized by a U.S. Government Agency Obligation maturing 03/30/10, market value $12,204,413 (repurchase proceeds $11,962,047) | | 11,962,000 | | 11,962,000 | |
| | | | | | | |
| | Total Short-Term Obligation (Cost of $11,962,000) | | | | 11,962,000 | |
| | | |
| | | | | | | |
| | Total Investments – 103.6% (Cost of $396,387,140) (j) | | 383,128,351 | |
| | | |
| | | | | | | |
| | Obligation to Return Collateral for Securities Loaned – (4.0)% | | (14,732,086 | ) |
| | | |
| | | | | | | |
| | Other Assets & Liabilities, Net – 0.4% | | | | 1,630,154 | |
| | | |
| | | | | | | |
| | Net Assets – 100.0% | | | | 370,026,419 | |
Notes to Investment Portfolio:
| | (a) | Security exempt from registration pursuant to Rule 144A under the Securities Act of 1933. These securities may be resold in transactions exempt from registration, normally to qualified institutional buyers. At March 31, 2009, these securities, which are not illiquid, amounted to $10,921,717, which represents 3.0% of net assets. |
| | (b) | The interest rate shown on floating rate or variable rate securities reflects the rate at March 31, 2009. |
| | (c) | Investments in affiliates during the twelve months ended March 31, 2009: Security name: Merrill Lynch & Co., Inc., 6.875% 04/25/18 |
| | | |
Par as of 03/31/08: | | $ | — |
Par purchased: | | $ | 1,075,000 |
Par sold: | | $ | — |
Par as of 03/31/09: | | $ | 1,075,000 |
Net realized gain (loss): | | $ | — |
Interest income earned: | | $ | 50,708 |
Value at end of period: | | $ | 840,750 |
| | | As of 01/01/2009, Merrill Lynch & Co., Inc. is a wholly owned subsidiary of Bank of America Corporation and an affiliate of Columbia Management. |
| | (d) | Perpetual Maturity. Maturity date presented represents the next call date. |
| | (e) | The issuer has filed for bankruptcy protection under Chapter 11. Income is not being accrued. At March 31, 2009, the value of these securities represent 0.2% of net assets. |
| | (f) | Represents fair value as determined in good faith under procedures approved by the Board of Trustees. |
| | (h) | All or a portion of this security was on loan at March 31, 2009. The total market value of securities on loan at March 31, 2009 is $14,504,624. |
See Accompanying Notes to Financial Statements.
14
Columbia Short-Intermediate Bond Fund
March 31, 2009
| | (i) | Investment made with cash collateral received from securities lending activity. |
| | (j) | Cost for federal income tax purposes is $396,389,552. |
On April 1, 2008, the Fund adopted Statement of Financial Accounting Standards No. 157, Fair Value Measurements (“SFAS 157”). SFAS 157 establishes a hierarchy that prioritizes the inputs to valuation techniques used to measure fair value giving the highest priority to unadjusted quoted prices in active markets for identical securities (level 1 measurements) and the lowest priority to unobservable inputs (level 3 measurements) when market prices are not readily available or reliable. The three levels of the fair value hierarchy under SFAS 157 are described below:
| | • | | Level 1 – quoted prices in active markets for identical securities |
| | • | | Level 2 – prices determined using other significant observable inputs (including quoted prices for similar securities, interest rates, prepayment speeds, credit risk and others) |
| | • | | Level 3 – prices determined using significant unobservable inputs. In situations where quoted prices or observable inputs are unavailable or less reliable, unobservable inputs may be used. Unobservable inputs may include management’s own assumptions about the factors market participants would use in pricing an investment. |
The inputs or methodology used for valuing securities are not necessarily an indication of the risk associated with investing in those securities.
The following table summarizes the inputs used, as of March 31, 2009 in valuing each Fund’s assets:
| | | | | | |
Valuation Inputs | | Investments in
Securities | | Other Financial
Instruments |
Level 1 – Quoted Prices | | $ | 66,149,134 | | $ | — |
Level 2 – Other Significant Observable Inputs | | | 316,979,217 | | | — |
Level 3 – Significant Unobservable Inputs | | | — | | | — |
| | | | | | |
Total | | $ | 383,128,351 | | $ | — |
| | | | | | |
At March 31, 2009, the asset allocation of the Fund is as follows:
| | | |
Asset Allocation (Unaudited) | | % of Net Assets | |
Corporate Fixed-Income Bonds & Notes | | 42.0 | |
Government & Agency Obligations | | 20.5 | |
Commercial Mortgage-Backed Securities | | 14.5 | |
Collateralized Mortgage Obligations | | 9.1 | |
Mortgage-Backed Securities | | 5.8 | |
Asset-Backed Securities | | 4.5 | |
| | | |
| | 96.4 | |
Securities Lending Collateral | | 4.0 | |
Short-Term Obligation | | 3.2 | |
Obligation to Return Collateral for Securities Loaned | | (4.0 | ) |
Other Assets & Liabilities, Net | | 0.4 | |
| | | |
| | 100.0 | |
| | | |
| | |
Acronym | | Name |
| MTN | | Medium-Term Note |
See Accompanying Notes to Financial Statements.
15
Statement of Assets and Liabilities – Columbia Short-Intermediate Bond Fund
March 31, 2009
| | | | | | |
| | | | | ($) (a)(b) | |
| Assets | | Unaffiliated investments, at identified cost | | | 395,395,524 | |
| | Affiliated investments, at identified cost | | | 991,616 | |
| | | | | | |
| | Total investments, at identified cost | | | 396,387,140 | |
| | Unaffiliated investments, at value | | | 382,287,601 | |
| | Affiliated investments, at value | | | 840,750 | |
| | | | | | |
| | Total investments, at value
(including securities on loan of $14,504,624) | | | 383,128,351 | |
| | |
| | Cash | | | 586 | |
| | Receivable for: | | | | |
| | Fund shares sold | | | 99,043 | |
| | Interest | | | 3,196,564 | |
| | Securities lending income | | | 17,508 | |
| | Trustees’ deferred compensation plan | | | 3,072 | |
| | Other assets | | | 31,363 | |
| | | | | | |
| | Total Assets | | | 386,476,487 | |
| | |
| Liabilities | | Collateral on securities loaned | | | 14,732,086 | |
| | Payable for: | | | | |
| | Fund shares repurchased | | | 351,987 | |
| | Distributions | | | 1,066,472 | |
| | Investment advisory fee | | | 109,219 | |
| | Administration fee | | | 40,392 | |
| | Transfer agent fee | | | 68,960 | |
| | Trustees’ fees | | | 2,432 | |
| | Pricing and bookkeeping fees | | | 11,007 | |
| | Custody fee | | | 8,233 | |
| | Distribution and service fees | | | 546 | |
| | Chief compliance officer expenses | | | 180 | |
| | Trustees’ deferred compensation plan | | | 3,072 | |
| | Other liabilities | | | 55,482 | |
| | | | | | |
| | Total Liabilities | | | 16,450,068 | |
| | |
| | | | | | |
| | Net Assets | | | 370,026,419 | |
| | |
| Net Assets Consist of | | Paid-in capital | | | 389,802,584 | |
| | Undistributed net investment income | | | 38,307 | |
| | Accumulated net realized loss | | | (6,555,683 | ) |
| | Net unrealized appreciation (depreciation) on investments | | | (13,258,789 | ) |
| | | | | | |
| | Net Assets | | | 370,026,419 | |
| | |
| Class A | | Net assets | | $ | 732,164 | |
| | Shares outstanding | | | 106,704 | |
| | Net asset value per share | | $ | 6.86 | (c) |
| | Maximum sales charge | | | 3.25 | % |
| | Maximum offering price per share ($6.86/0.9675) | | $ | 7.09 | (d) |
| | |
| Class C | | Net assets | | $ | 534,380 | |
| | Shares outstanding | | | 77,831 | |
| | Net asset value and offering price per share | | $ | 6.87 | (c) |
| | |
| Class Z | | Net assets | | $ | 368,759,875 | |
| | Shares outstanding | | | 53,741,874 | |
| | Net asset value and offering price per share | | $ | 6.86 | |
| (a) | The Fund’s Class A and Class C shares commenced operations on March 31, 2008. |
| (b) | On March 31, 2008, the Predecessor Fund’s Shares class was reorganized into the Fund’s Class Z shares. |
| (c) | Redemption price per share is equal to net asset value less any applicable contingent deferred sales charge. |
| (d) | On sales of $100,000 or more the offering price is reduced. |
See Accompanying Notes to Financial Statements.
16
Statement of Operations – Columbia Short-Intermediate Bond Fund
For the Year Ended March 31, 2009
| | | | | |
| | | | | ($) | |
| Investment Income | | Interest | | 19,326,889 | |
| | Interest from affiliates | | 50,708 | |
| | Securities lending | | 289,068 | |
| | | | | |
| | Total Investment Income | | 19,666,665 | |
| | |
| Expenses | | Investment advisory fee | | 1,395,277 | |
| | Administration fee | | 500,333 | |
| | Distribution fee: | | | |
| | Class C | | 720 | |
| | Service fee: | | | |
| | Class A | | 455 | |
| | Class C | | 240 | |
| | Transfer agent fee | | 561,419 | |
| | Pricing and bookkeeping fees | | 108,892 | |
| | Trustees’ fees | | 22,680 | |
| | Custody fee | | 11,049 | |
| | Chief compliance officer expenses | | 736 | |
| | Other expenses | | 153,496 | |
| | | | | |
| | Expenses before interest expense | | 2,755,297 | |
| | Interest expense | | 71 | |
| | | | | |
| | Total Expenses | | 2,755,368 | |
| | Fees waived or expenses reimbursed by investment advisor and/or administrator | | (159,376 | ) |
| | Expense reductions | | (3,698 | ) |
| | | | | |
| | Net Expenses | | 2,592,294 | |
| | |
| | | | | |
| | Net Investment Income | | 17,074,371 | |
| | |
| Net Realized and Unrealized Gain (Loss) on Investments and Futures Contracts | | Net realized gain (loss) on: | | | |
| | Investments | | (5,669,864 | ) |
| | Futures contracts | | 61,466 | |
| | | | | |
| | Net realized loss | | (5,608,398 | ) |
| | | | | |
| | Net change in unrealized appreciation (depreciation) on investments | | (15,596,385 | ) |
| | | | | |
| | Net Loss | | (21,204,783 | ) |
| | |
| | | | | |
| | Net Decrease Resulting from Operations | | (4,130,412 | ) |
See Accompanying Notes to Financial Statements.
17
Statements of Changes in Net Assets – Columbia Short-Intermediate Bond Fund
| | | | | | | | |
| | | | | Year Ended March 31, | |
| Increase (Decrease) in Net Assets: | | 2009 ($) | | | 2008 ($) (a)(b) | |
| Operations | | Net investment income | | 17,074,371 | | | 19,452,736 | |
| | Net realized gain (loss) on investments and futures contracts | | (5,608,398 | ) | | 6,634,550 | |
| | Net change in unrealized appreciation (depreciation) on investments and futures contracts | | (15,596,385 | ) | | 1,906,501 | |
| | | | | | | | |
| | Net Increase (Decrease) Resulting from Operations | | (4,130,412 | ) | | 27,993,787 | |
| | | |
| Distributions to Shareholders | | From net investment income: | | | | | | |
| | Class A | | (7,256 | ) | | (1 | ) |
| | Class C | | (2,998 | ) | | (1 | ) |
| | Class Z | | (17,099,909 | ) | | (19,374,299 | ) |
| | From net realized gains: | | | | | | |
| | Class A | | (158 | ) | | — | |
| | Class C | | (54 | ) | | — | |
| | Class Z | | (2,310,329 | ) | | — | |
| | | | | | | | |
| | Total Distributions to Shareholders | | (19,420,704 | ) | | (19,374,301 | ) |
| | | |
| | Net Capital Stock Transactions | | (52,067,684 | ) | | (30,250,110 | ) |
| | | | | | | | |
| | Total Decrease in Net Assets | | (75,618,800 | ) | | (21,630,624 | ) |
| | | |
| Net Assets | | Beginning of period | | 445,645,219 | | | 467,275,843 | |
| | End of period | | 370,026,419 | | | 445,645,219 | |
| | Undistributed net investment income at end of period | | 38,307 | | | 73,933 | |
| (a) | The Fund’s Class A and Class C shares commenced operations on March 31, 2008. |
| (b) | On March 31, 2008, the Predecessor Fund’s Shares class was reorganized into the Fund’s Class Z shares. The financial information of Class Z shares includes the financial information of the Predecessor Fund’s Shares class. |
See Accompanying Notes to Financial Statements.
18
Statements of Changes in Net Assets – Columbia Short-Intermediate Bond Fund
| | | | | | | | | | | | |
| | | Capital Stock Activity | |
| | | Year Ended
March 31, 2009 | | | Year Ended
March 31, 2008 (a)(b) | |
| | | Shares | | | Dollars ($) | | | Shares | | | Dollars ($) | |
Class A | | | | | | | | | | | | |
Subscriptions | | 110,671 | | | 751,789 | | | 1,381 | | | 10,000 | |
Distributions reinvested | | 1,008 | | | 6,879 | | | — | | | — | |
Redemptions | | (6,356 | ) | | (43,774 | ) | | — | | | — | |
| | | | | | | | | | | | |
Net increase | | 105,323 | | | 714,894 | | | 1,381 | | | 10,000 | |
| | | | |
Class C | | | | | | | | | | | | |
Subscriptions | | 83,008 | | | 568,446 | | | 1,381 | | | 10,000 | |
Distributions reinvested | | 308 | | | 2,106 | | | — | | | — | |
Redemptions | | (6,866 | ) | | (46,753 | ) | | — | | | — | |
| | | | | | | | | | | | |
Net increase | | 76,450 | | | 523,799 | | | 1,381 | | | 10,000 | |
| | | | |
Class Z | | | | | | | | | | | | |
Subscriptions | | 10,264,770 | | | 70,878,684 | | | 10,138,315 | | | 72,060,897 | |
Distributions reinvested | | 421,890 | | | 2,916,529 | | | 357,789 | | | 2,548,290 | |
Redemptions | | (18,492,341 | ) | | (127,101,590 | ) | | (14,779,847 | ) | | (104,879,297 | ) |
| | | | | | | | | | | | |
Net decrease | | (7,805,681 | ) | | (53,306,377 | ) | | (4,283,743 | ) | | (30,270,110 | ) |
| (a) | The Fund’s Class A and Class C shares commenced operations on March 31, 2008. |
| (b) | On March 31, 2008, the Predecessor Fund’s Shares class was reorganized into the Fund’s Class Z shares. The financial information of Class Z shares includes the financial information of the Predecessor Fund’s Shares class. |
See Accompanying Notes to Financial Statements.
19
Financial Highlights – Columbia Short-Intermediate Bond Fund
Selected data for a share outstanding throughout each period is as follows:
| | | | | | | | |
| Class A Shares | | Year Ended
March 31,
2009 | | | Period Ended
March 31,
2008 (a) | |
Net Asset Value, Beginning of Period | | $ | 7.24 | | | $ | 7.24 | |
| | |
Income from Investment Operations: | | | | | | | | |
Net investment income (b) | | | 0.27 | | | | — | (c) |
Net realized and unrealized gain (loss) on investments and futures contracts | | | (0.33 | ) | | | — | (c) |
| | | | | | | | |
Total from investment operations | | | (0.06 | ) | | | — | (c) |
| | |
Less Distributions to Shareholders: | | | | | | | | |
From net investment income | | | (0.28 | ) | | | — | (c) |
From net realized gains | | | (0.04 | ) | | | — | |
| | | | | | | | |
Total distributions to shareholders | | | (0.32 | ) | | | — | (c) |
| | |
Net Asset Value, End of Period | | $ | 6.86 | | | $ | 7.24 | |
Total return (d)(e) | | | (0.82 | )% | | | 0.01 | %(f) |
| | |
Ratios to Average Net Assets/Supplemental Data: | | | | | | | | |
Net expenses before interest expense (g) | | | 0.90 | % | | | 1.00 | %(h) |
Interest expense | | | — | %(i) | | | — | |
Net expenses (g) | | | 0.90 | % | | | 1.00 | %(h) |
Waiver/Reimbursement | | | 0.04 | % | | | 0.05 | %(h) |
Net investment income (g) | | | 3.96 | % | | | 3.44 | %(h) |
Portfolio turnover rate | | | 72 | % | | | 109 | %(f) |
Net assets, end of period (000’s) | | $ | 732 | | | $ | 10 | |
| (a) | Class A shares commenced operations on March 31, 2008. Per share data and total return reflect activity from that date. |
| (b) | Per share data was calculated using the average shares outstanding during the period. |
| (c) | Rounds to less than $0.01 per share. |
| (d) | Had the investment advisor and/or any of its affiliates not waived fees or reimbursed a portion of expenses, total return would have been reduced. |
| (e) | Total return at net asset value assuming all distributions reinvested and no initial sales charge or contingent deferred sales charge. |
| (g) | The benefits derived from expense reductions had an impact of less than 0.01%. |
| (i) | Rounds to less than 0.01%. |
See Accompanying Notes to Financial Statements.
20
Financial Highlights – Columbia Short-Intermediate Bond Fund
Selected data for a share outstanding throughout each period is as follows:
| | | | | | | | |
| Class C Shares | | Year Ended
March 31,
2009 | | | Period Ended
March 31,
2008 (a) | |
Net Asset Value, Beginning of Period | | $ | 7.24 | | | $ | 7.24 | |
| | |
Income from Investment Operations: | | | | | | | | |
Net investment income (b) | | | 0.21 | | | | — | (c) |
Net realized and unrealized gain (loss) on investments and futures contracts | | | (0.31 | ) | | | — | (c) |
| | | | | | | | |
Total from investment operations | | | (0.10 | ) | | | — | (c) |
| | |
Less Distributions to Shareholders: | | | | | | | | |
From net investment income | | | (0.23 | ) | | | — | (c) |
From net realized gains | | | (0.04 | ) | | | — | |
| | | | | | | | |
Total distributions to shareholders | | | (0.27 | ) | | | — | (c) |
| | |
Net Asset Value, End of Period | | $ | 6.87 | | | $ | 7.24 | |
Total return (d)(e) | | | (1.41 | )% | | | 0.01 | %(f) |
| | |
Ratios to Average Net Assets/Supplemental Data: | | | | | | | | |
Net expenses before interest expense (g) | | | 1.65 | % | | | 1.75 | %(h) |
Interest expense | | | — | %(i) | | | — | |
Net expenses (g) | | | 1.65 | % | | | 1.75 | %(h) |
Waiver/Reimbursement | | | 0.04 | % | | | 0.05 | %(h) |
Net investment income (g) | | | 3.11 | % | | | 2.69 | %(h) |
Portfolio turnover rate | | | 72 | % | | | 109 | %(f) |
Net assets, end of period (000’s) | | $ | 534 | | | $ | 10 | |
| (a) | Class C shares commenced operations on March 31, 2008. Per share data and total return reflect activity from that date. |
| (b) | Per share data was calculated using the average shares outstanding during the period. |
| (c) | Rounds to less than $0.01 per share. |
| (d) | Had the investment advisor and/or any of its affiliates not waived fees or reimbursed a portion of expenses, total return would have been reduced. |
| (e) | Total return at net asset value assuming all distributions reinvested and no contingent deferred sales charge. |
| (g) | The benefits derived from expense reductions had an impact of less than 0.01%. |
| (i) | Rounds to less than 0.01%. |
See Accompanying Notes to Financial Statements.
21
Financial Highlights – Columbia Short-Intermediate Bond Fund
Selected data for a share outstanding throughout each period is as follows:
| | | | | | | | | | | | | | | | | | | | |
| | | Year Ended March 31, | |
| Class Z Shares | | 2009 | | | 2008 (a) | | | 2007 | | | 2006 (g) | | | 2005 (g) | |
Net Asset Value, Beginning of Period | | $ | 7.24 | | | $ | 7.10 | | | $ | 7.01 | | | $ | 7.16 | | | $ | 7.40 | |
| | | | | |
Income from Investment Operations: | | | | | | | | | | | | | | | | | | | | |
Net investment income (b) | | | 0.30 | | | | 0.31 | | | | 0.31 | | | | 0.27 | | | | 0.26 | |
Net realized and unrealized gain (loss) on investments, futures contracts and swap contracts | | | (0.34 | ) | | | 0.13 | | | | 0.09 | | | | (0.12 | ) | | | (0.23 | ) |
| | | | | | | | | | | | | | | | | | | | |
Total from investment operations | | | (0.04 | ) | | | 0.44 | | | | 0.40 | | | | 0.15 | | | | 0.03 | |
| | | | | |
Less Distributions to Shareholders: | | | | | | | | | | | | | | | | | | | | |
From net investment income | | | (0.30 | ) | | | (0.30 | ) | | | (0.31 | ) | | | (0.28 | ) | | | (0.26 | ) |
From net realized gains | | | (0.04 | ) | | | — | | | | — | | | | (0.02 | ) | | | (0.01 | ) |
| | | | | | | | | | | | | | | | | | | | |
Total distributions to shareholders | | | (0.34 | ) | | | (0.30 | ) | | | (0.31 | ) | | | (0.30 | ) | | | (0.27 | ) |
| | | | | |
Net Asset Value, End of Period | | $ | 6.86 | | | $ | 7.24 | | | $ | 7.10 | | | $ | 7.01 | | | $ | 7.16 | |
Total return (c)(d) | | | (0.54 | )% | | | 6.42 | % | | | 5.79 | % | | | 2.06 | % | | | 0.45 | % |
| | | | | |
Ratios to Average Net Assets/Supplemental Data: | | | | | | | | | | | | | | | | | | | | |
Net expenses before interest expense (e) | | | 0.65 | % | | | 0.75 | % | | | 0.75 | % | | | 0.72 | % | | | 0.60 | % |
Interest expense | | | — | %(f) | | | — | | | | — | | | | — | | | | — | |
Net expenses (e) | | | 0.65 | % | | | 0.75 | % | | | 0.75 | % | | | 0.72 | % | | | 0.60 | % |
Waiver/Reimbursement | | | 0.04 | % | | | 0.05 | % | | | 0.05 | % | | | 0.09 | % | | | 0.21 | % |
Net investment income (e) | | | 4.28 | % | | | 4.31 | % | | | 4.38 | % | | | 3.74 | % | | | 3.53 | % |
Portfolio turnover rate | | | 72 | % | | | 109 | % | | | 70 | % | | | 75 | % | | | 59 | % |
Net assets, end of period (000’s) | | $ | 368,760 | | | $ | 445,625 | | | $ | 467,276 | | | $ | 437,073 | | | $ | 410,392 | |
| (a) | On March 31, 2008, Shares class of Intermediate-Term Bond Fund, a series of Excelsior Funds, Inc., was reorganized into the Fund’s Class Z shares. The financial information of Class Z includes the financial information of Intermediate-Term Bond Fund’s Shares class. |
| (b) | Per share data was calculated using the average shares outstanding during the period. |
| (c) | Had the investment advisor and/or any of its affiliates not waived fees or reimbursed a portion of expenses, total return would have been reduced. |
| (d) | Total return at net asset value assuming all distributions reinvested. |
| (e) | The benefits derived from expense reductions had an impact of less than 0.01%. |
| (f) | Rounds to less than 0.01%. |
| (g) | Per share data for the years ended March 31, 2006 and 2005 were audited by other auditors. |
See Accompanying Notes to Financial Statements.
22
Notes to Financial Statements – Columbia Short-Intermediate Bond Fund
March 31, 2009
Note 1. Organization
Columbia Short-Intermediate Bond Fund (the “Fund”), a series of Columbia Funds Series Trust I (the “Trust”), is a diversified portfolio. The Trust is a Massachusetts business trust registered under the Investment Company Act of 1940, as amended (the “1940 Act”), as an open-end management investment company.
On March 31, 2008, the Fund acquired all assets and assumed all liabilities of the former Intermediate-Term Bond Fund (the “Predecessor Fund”), a series of Excelsior Funds, Inc. The information contained in this report prior to March 31, 2008 relates to the Predecessor Fund.
Investment Objective
The Fund seeks total return, consisting of current income and capital appreciation, consistent with minimal fluctuation of principal.
Fund Shares
The Trust may issue an unlimited number of shares, and the Fund offers three classes of shares: Class A, Class C and Class Z. Each share class has its own expense structure and sales charges, as applicable.
On March 31, 2008, the Predecessor Fund’s Shares class was reorganized into Class Z shares of the Fund. Class A and Class C shares of the Fund commenced operations and public offering on March 31, 2008.
Class A shares are subject to a maximum front-end sales charge of 3.25% based on the amount of initial investment. Class A shares purchased without an initial sales charge in accounts aggregating $1 million to $50 million at the time of purchase are subject to a 1.00% contingent deferred sales charge (“CDSC”) if the shares are sold within one year after purchase. Class C shares are subject to a 1.00% CDSC on shares sold within one year after purchase. Class Z shares are offered continuously at net asset value. There are certain restrictions on the purchase of Class Z shares, as described in the Fund’s prospectus.
Note 2. Significant Accounting Policies
The preparation of financial statements in accordance with accounting principles generally accepted in the United States of America (“GAAP”) requires management to make certain estimates and assumptions that affect the reported amounts of assets and liabilities, the disclosure of contingent assets and liabilities at the date of the financial statements and the reported amounts of revenue and expenses during the reporting period. Actual results could differ from those estimates. Certain ratios have been reclassified on the Financial Highlights to conform to the current period financial statement presentation. The changes have no effect on the ratios. The following is a summary of significant accounting policies consistently followed by the Fund in the preparation of its financial statements.
Security Valuation
Debt securities generally are valued by pricing services approved by the Trust’s Board of Trustees, based upon market transactions for normal, institutional-size trading units of similar securities. The services may use various pricing techniques which take into account appropriate factors such as yield, quality, coupon rate, maturity, type of issue, trading characteristics and other data, as well as broker quotes. Debt securities for which quotations are readily available are valued at an over-the-counter or exchange bid quotation.
Short-term investments maturing in 60 days or less are valued at amortized cost, which approximates market value.
Investments in other open-end investment companies are valued at net asset value.
Futures contracts are valued at the settlement price established each day by the board of trade or exchange on which they are traded.
Swap agreements are stated at fair value.
Investments for which market quotations are not readily available, or that have quotations which management believes are not reliable, are valued at fair value as determined in good faith under consistently applied procedures established by and under the general supervision of the Board of Trustees. If a security is valued at fair value, such value is likely to be different from the last quoted market price for the security. The determination of fair value often requires significant judgment. To determine fair value, management may use assumptions including but not limited to future cash flows and estimated risk premiums. Multiple inputs from various sources may be used to determine value.
23
Columbia Short-Intermediate Bond Fund
March 31, 2009
Security Transactions
Security transactions are accounted for on the trade date. Cost is determined and gains (losses) are based upon the specific identification method for both financial statement and federal income tax purposes.
In March 2008, Statement of Financial Accounting Standards No. 161, Disclosures about Derivative Instruments and Hedging Activities-an amendment of FASB Statement No. 133 (“SFAS 161”), was issued. SFAS 161 is effective for fiscal years and interim periods beginning after November 15, 2008. SFAS 161 requires additional discussion about the reporting entity’s derivative instruments and hedging activities, by providing for qualitative disclosures about the objectives and strategies for using derivatives, quantitative data about the fair value of and gains and losses on derivative contracts, and details of credit-risk-related contingent features in their derivative contracts. Management is evaluating the impact the application of SFAS 161 will have on the Fund’s financial statement disclosures.
In September 2008, FASB Staff Position 133-1 and FIN 45-4, Disclosures about Credit Derivatives and Certain Guarantees: An Amendment of FASB Statement No. 133 and FASB Interpretation No. 45 and Clarification of the Effective Date of FASB Statement No. 161 (“Amendment”), was issued and is effective for annual and interim reporting periods ending after November 15, 2008. The Amendment requires enhanced disclosures regarding a fund’s credit derivatives and hybrid financial instruments containing embedded credit derivatives. Management is currently evaluating the impact the adoption of the Amendment will have on the Fund’s financial statement disclosures.
Futures Contracts
The Fund may invest in futures contracts for both hedging and non-hedging purposes, including, for example, to seek to enhance returns or as a substitute for a position in an underlying asset.
The use of futures contracts involves certain risks, which include: (1) imperfect correlation between the price movement of the instruments and the underlying securities, (2) inability to close out positions due to differing trading hours, or the temporary absence of a liquid market, for either the instruments or the underlying securities, or (3) an inaccurate prediction of the future direction of interest rates by Columbia Management Advisors, LLC (“Columbia”), the Fund’s investment advisor. Any of these risks may involve amounts exceeding the variation margin recorded in the Fund’s Statement of Assets and Liabilities at any given time.
Upon entering into a futures contract, the Fund pledges cash or securities with the broker in an amount sufficient to meet the initial margin requirement. Subsequent payments are made or received by the Fund equal to the daily change in the contract value and are recorded as variation margin receivable or payable and offset in unrealized gains or losses. The Fund recognizes a realized gain or loss when the contract is closed or expires.
Repurchase Agreements
The Fund may engage in repurchase agreement transactions with institutions that Columbia has determined are creditworthy. The Fund, through its custodian, receives delivery of the underlying securities collateralizing a repurchase agreement. Columbia is responsible for determining that the collateral is at least equal, at all times, to the value of the repurchase obligation including interest. A repurchase agreement transaction involves certain risks in the event of default or insolvency of the counterparty. These risks include possible delays in or restrictions on the Fund’s ability to dispose of the underlying securities and a possible decline in the value of the underlying securities during the period while the Fund seeks to assert its rights.
Treasury Inflation Protected Securities
The Fund may invest in treasury inflation protected securities (“TIPS”). The principal amount of TIPS is adjusted periodically for inflation based on a monthly published index. Interest payments are based on the inflation-adjusted principal at the time the interest is paid. These adjustments are recorded as interest income on the Statement of Operations.
Swap Contracts
The Fund may engage in swap transactions such as interest rate and volatility swaps, consistent with its investment objective and policies to obtain a desired return at a lower cost than if the Fund had invested directly in the asset that yielded the desired return. Swaps involve the exchange by a Fund with another party of their respective commitments to pay or receive interest or total return throughout the lives of the agreements. The interest to be paid or received on swaps is included in realized gain/(loss) on investments. Unrealized gains are
24
Columbia Short-Intermediate Bond Fund
March 31, 2009
reported as an asset and unrealized losses are reported as a liability on the Statement of Assets and Liabilities. A realized gain or loss is recorded upon termination of swap agreements and is equal to the difference between the Fund’s basis in the swap and the proceeds from (or cost of) the closing transaction. Swap agreements are stated at fair value. Notional principal amounts are used to express the extent of involvement in these transactions, but the amounts potentially subject to credit risk are much smaller.
If there is a default by the counterparty to a swap contract, the Fund will be limited to contractual remedies pursuant to the agreements related to the transaction. There is no assurance that the swap contract counterparties will be able to meet their obligations pursuant to the swap contracts or that, in the event of default, the Fund will succeed in pursuing contractual remedies. The Fund thus assumes the risk that it may be delayed in or prevented from obtaining payments owed to it pursuant to the swap contracts.
The use of derivative instruments involves, to varying degrees, elements of market risk in excess of the amount recognized in the Statement of Assets and Liabilities.
Income Recognition
Interest income is recorded on the accrual basis. Premium and discount are amortized and accreted, respectively, on all debt securities, unless otherwise noted.
Original issue discount is accreted to interest income over the life of the security with a corresponding increase in the cost basis.
Corporate actions and dividend income are recorded on the ex-date.
Expenses
General expenses of the Trust are allocated to the Fund and the other series of the Trust based upon relative net assets or other expense allocation methodologies determined by the nature of the expense. Expenses directly attributable to the Fund are charged to the Fund.
Determination of Class Net Asset Value
All income, expenses (other than class-specific expenses, as shown on the Statement of Operations) and realized and unrealized gains (losses) are allocated to each class of the Fund on a daily basis for purposes of determining the net asset value of each class. Income and expenses are allocated to each class based on the settled shares method, while realized and unrealized gains (losses) are allocated based on the relative net assets of each class.
Federal Income Tax Status
The Fund intends to qualify each year as a “regulated investment company” under Subchapter M of the Internal Revenue Code, as amended, and will distribute substantially all of its tax exempt or taxable income, if any, for its tax year, and as such will not be subject to federal income taxes. In addition, the Fund intends to distribute in each calendar year substantially all of its net investment income, capital gains and certain other amounts, if any, such that the Fund should not be subject to federal excise tax. Therefore, no federal income or excise tax provision is recorded.
Distributions to Shareholders
Distributions from net investment income are declared daily and paid monthly. Net realized capital gains, if any, are distributed at least annually. Income distributions and capital gain distributions are determined in accordance with federal income tax regulations which may differ from GAAP.
Indemnification
In the normal course of business, the Fund enters into contracts that contain a variety of representations and warranties and which provide general indemnities. The Fund’s maximum exposure under these arrangements is unknown because this would involve future claims against the Fund. Also, under the Trust’s organizational documents and by contract, the Trustees and officers of the Trust are indemnified against certain liabilities that may arise out of actions relating to their duties to the Trust. However, based on experience, the Fund expects the risk of loss due to these representations, warranties and indemnities to be minimal.
Note 3. Federal Tax Information
The timing and character of income and capital gain distributions are determined in accordance with income tax regulations, which may differ from GAAP. Reclassifications are made to the Fund’s capital accounts for permanent tax differences to reflect income and gains available for distribution (or available capital loss carryforwards) under income tax regulations.
25
Columbia Short-Intermediate Bond Fund
March 31, 2009
For the year ended March 31, 2009, permanent book and tax basis differences resulting primarily from differing treatments for treasury inflation protected securities, paydown reclasses and distribution reclasses were identified and reclassified among the components of the Fund’s net assets as follows:
| | | | |
| | | |
Undistributed
Net Investment
Income | | Accumulated
Net Realized
Loss | | Paid-In Capital |
| $166 | | $(167) | | $1 |
The tax character of distributions paid during the years ended March 31, 2009 and March 31, 2008 was as follows:
| | | | | | |
| | | March 31, 2009 | | March 31, 2008 |
Distributions paid
from: | | | | |
Ordinary Income* | | $ | 18,788,797 | | $ | 19,374,301 |
Long-Term Capital Gains | | | 631,907 | | | — |
| * | For tax purposes short-term capital gain distributions, if any, are considered ordinary income distributions. |
As of March 31, 2009, the components of distributable earnings on a tax basis were as follows:
| | | | |
| | | | | |
Undistributed
Ordinary Income | | Undistributed Long-Term Capital Gains | | Net Unrealized Depreciation* |
| $1,233,375 | | $— | | $(13,261,201) |
| * | The differences between book-basis and tax-basis net unrealized depreciation are primarily due to deferral of losses from wash sales. |
Unrealized appreciation and depreciation at March 31, 2009, based on cost of investments for federal income tax purposes was:
| | | | |
| | |
Unrealized appreciation | | $ | 6,139,481 | |
Unrealized depreciation | | | (19,400,682 | ) |
Net unrealized depreciation | | $ | (13,261,201 | ) |
The following capital loss carryforwards may be available to reduce taxable income arising from future net realized gains on investments, if any, to the extent permitted by the Internal Revenue Code:
| | |
| | | |
| Year of Expiration | | Capital Loss Carryforward |
| 2017 | | $2,999,736 |
Under current tax rules, certain currency and capital losses realized after October 31 may be deferred and treated as occurring on the first day of the following fiscal year. As of March 31, 2009, post-October capital losses of $3,553,535 attributed to security transactions were deferred to April 1, 2009.
The Fund adopted Financial Accounting Standards Board (“FASB”) Interpretation No. 48, Accounting for Uncertainty in Income Taxes- an Interpretation of FASB Statement No. 109 (“FIN 48”) on September 28, 2007. FIN 48 requires management to determine whether a tax position of the Fund is more likely than not to be sustained upon examination by the applicable taxing authority, including resolution of any related appeals or litigation processes, based on the technical merits of the position. The tax benefit to be recognized is measured as the largest amount of benefit that is greater than fifty percent likely of being realized upon ultimate settlement. FIN 48 was applied to all existing tax positions upon initial adoption. Management has evaluated the known implications of FIN 48 on its computation of net assets for the Fund. As a result of this evaluation, management believes that FIN 48 does not have any effect on the Fund’s financial statements and no cumulative effect adjustment was recorded. However, management’s conclusions regarding FIN 48 may be subject to review and adjustment at a later date based on factors including, but not limited to, further implementation guidance from the FASB, new tax laws, regulations, and administrative interpretations (including relevant court decisions). The Fund’s federal tax returns for the prior three fiscal years remain subject to examination by the Internal Revenue Service. The Fund is not aware of any tax positions for which it is reasonably possible that the total amounts of unrecognized tax benefits will significantly change in the next twelve months.
Note 4. Fees and Compensation Paid to Affiliates
Investment Advisory Fee
Columbia, an indirect, wholly owned subsidiary of Bank of America Corporation (“BOA”) provides investment advisory services to the Fund. In rendering investment advisory services to the Fund, Columbia may use the portfolio management and research resources of Columbia Management Pte. Ltd., an affiliate of Columbia. Columbia receives a monthly investment advisory fee based on the Fund’s average daily net assets at the following annual rates:
26
Columbia Short-Intermediate Bond Fund
March 31, 2009
| | | |
| | | | |
| Average Daily Net Assets | | Annual Fee Rate | |
First $1 billion | | 0.35 | % |
$1 billion to $1.5 billion | | 0.30 | % |
$1.5 billion to $3 billion | | 0.29 | % |
$3 billion to $6 billion | | 0.28 | % |
Over $6 billion | | 0.27 | % |
For the year ended March 31, 2009, the Fund’s effective investment advisory fee rate was 0.35% of the Fund’s average daily net assets.
Administration Fee
Columbia provides administrative and other services to the Fund for a monthly administration fee at the annual rate of 0.15% of the Fund’s average daily net assets less the fees payable by the Fund as described under the Pricing and Bookkeeping Fees note below.
Prior to January 12, 2009, Columbia voluntarily waived administration fees payable by the Fund at the annual rate of 0.05% of the Fund’s average daily net assets.
Pricing and Bookkeeping Fees
The Fund has entered into a Financial Reporting Services Agreement (the “Financial Reporting Services Agreement”) with State Street Bank & Trust Company (“State Street”) and Columbia pursuant to which State Street provides financial reporting services to the Fund. The Fund has also entered into an Accounting Services Agreement (collectively with the Financial Reporting Services Agreement, the “State Street Agreements”) with State Street and Columbia pursuant to which State Street provides accounting services to the Fund. Under the State Street Agreements, the Fund pays State Street an annual fee of $38,000 paid monthly plus an additional monthly fee based on an annualized percentage rate of average daily net assets of the Fund for the month. The aggregate fee will not exceed $140,000 per year (exclusive of out-of-pocket expenses and charges). The Fund also reimburses State Street for certain out-of-pocket expenses and charges.
The Fund has entered into a Pricing and Bookkeeping Oversight and Services Agreement (the “Services Agreement”) with Columbia. Under the Services Agreement, Columbia provides services related to Fund expenses and the requirements of the Sarbanes-Oxley Act of 2002, and provides oversight of the accounting and financial reporting services provided by State Street. Under the Services Agreement, the Fund reimburses Columbia for out-of-pocket expenses.
Transfer Agent Fee
Columbia Management Services, Inc. (the “Transfer Agent”), an affiliate of Columbia and an indirect, wholly owned subsidiary of BOA, provides shareholder services to the Fund and has contracted with Boston Financial Data Services (“BFDS”) to serve as sub-transfer agent. The Transfer Agent is entitled to receive a fee for its services, paid monthly, at the annual rate of $17.34 per open account plus reimbursement of certain sub-transfer agent fees paid by the Transfer Agent (exclusive of BFDS fees), calculated based on assets held in omnibus accounts and intended to recover the cost of payments to other parties (including affiliates of BOA) for services to those accounts. The Transfer Agent pays the fees of BFDS for services as sub-transfer agent and is not entitled to reimbursement for such fees from the Fund.
The Transfer Agent may also retain, as additional compensation for its services, fees for wire, telephone and redemption orders, Individual Retirement Account (“IRA”) trustee agent fees and account transcript fees due to the Transfer Agent from shareholders of the Fund and credits (net of bank charges) earned with respect to balances in accounts the Transfer Agent maintains in connection with its services to the Fund. The Transfer Agent also receives reimbursement for certain out-of-pocket expenses.
An annual minimum account balance fee of $20 may apply to certain accounts with a value below the Fund’s initial minimum investment requirements to reduce the impact of small accounts on transfer agent fees. These minimum account balance fees are recorded as part of expense reductions on the Statement of Operations. For the year ended March 31, 2009, these minimum account balance fees reduced total expenses by $590.
Underwriting Discounts, Service and Distribution Fees
Columbia Management Distributors, Inc. (the “Distributor”) an affiliate of Columbia and an indirect, wholly owned subsidiary of BOA, is the principal underwriter of the Fund’s shares. For the year ended March 31, 2009, the Distributor
27
Columbia Short-Intermediate Bond Fund
March 31, 2009
has retained net underwriting discounts of $150 on the sale of the Fund’s Class A shares and received net CDSC fees of $61 on Class C share redemptions.
The Fund has adopted distribution and shareholder servicing plans (the “Plans”) pursuant to Rule 12b-1 under the 1940 Act, which require the payment of distribution and service fees. The fees are intended to compensate the Distributor and/or eligible selling and/or servicing agents for selling shares of the Fund and providing services to investors. The Plans require the payment of a monthly service fee to the Distributor at the annual rate of 0.25% of the average daily net assets attributable to Class A and Class C shares. The Plans also require the payment of a monthly distribution fee to the Distributor at the annual rate of 0.75% of the average daily net assets attributable to Class C shares only.
Fee Waivers and Expense Reimbursements
Columbia has contractually agreed to bear a portion of the Fund’s expenses through July 31, 2009, so that the Fund’s ordinary operating (excluding any distribution and service fees, brokerage commissions, interest, taxes and extraordinary expenses, but including custodial charges relating to overdrafts, if any), after giving effect to any balance credits from the Fund’s custodian, do not exceed 0.75% annually of the Fund’s average daily net assets.
Effective August 1, 2009, Columbia has voluntarily agreed to bear a portion of the Fund’s expenses so that the Fund’s ordinary operating expenses (excluding any distribution and service fees, brokerage commissions, interest, taxes and extraordinary expenses, but including custodian charges relating to overdrafts, if any), after giving effect to any balance credits from the Fund’s custodian, do not exceed 0.65% annually of the Fund’s average daily net assets. Columbia, at its discretion, may revise or discontinue this arrangement at any time.
Fees Paid to Officers and Trustees
All officers of the Fund are employees of Columbia or its affiliates and, with the exception of the Fund’s Chief Compliance Officer, receive no compensation from the Fund. The Board of Trustees has appointed a Chief Compliance Officer to the Fund in accordance with federal securities regulations. The Fund, along with other affiliated funds, pays its pro-rata share of the expenses associated with the Chief Compliance Officer. The Fund’s expenses for the Chief Compliance Officer will not exceed $15,000 per year.
The Trust’s eligible Trustees may participate in a deferred compensation plan which may be terminated at any time. Obligations of the plan will be paid solely out of the Fund’s assets.
Note 5. Custody Credits
The Fund has an agreement with its custodian bank under which custody fees may be reduced by balance credits. These credits are recorded as part of expense reductions on the Statement of Operations. The Fund could have invested a portion of the assets utilized in connection with the expense offset arrangement in an income-producing asset if it had not entered into such an agreement.
For the year ended March 31, 2009, these custody credits reduced total expenses by $3,108 for the Fund.
Note 6. Portfolio Information
For the year ended March 31, 2009, the cost of purchases and proceeds from sales of securities, excluding short-term obligations, for the Fund were $280,577,677 and $321,733,177, respectively, of which $151,395,783 and $226,245,357, respectively, were U.S. Government securities.
Note 7. Line of Credit
The Fund and other affiliated funds participate in a $280,000,000 committed, unsecured revolving line of credit provided by State Street. The maximum amount that may be borrowed by any fund is limited to the lesser of $200,000,000 and the Fund’s borrowing limit set forth in the Fund’s registration statement. Borrowings are available for short-term liquidity or temporary or emergency purposes.
Interest is charged to each participating fund based on the fund’s borrowings at a rate per annum equal to the greater of the Federal Funds Rate plus 0.50% or the overnight LIBOR Rate plus 0.50%. In addition, an annual operations agency fee of $20,000, an amendment fee of 0.02% and a commitment fee of 0.12% per annum are accrued and apportioned among the participating funds pro rata based on their relative net assets. Prior to October 16, 2008, the Fund and other affiliated funds participated in a $350,000,000 committed, unsecured revolving line of credit and a $150,000,000 uncommitted, unsecured line of credit, both provided by State Street.
28
Columbia Short-Intermediate Bond Fund
March 31, 2009
Interest on the committed line of credit was charged to each participating fund based on the fund’s borrowings at a rate per annum equal to the Federal Funds Rate plus 0.50%. In addition, a commitment fee of 0.10% per annum was accrued and apportioned among the participating funds pro rata based on their relative net assets. Interest on the uncommitted line of credit was charged to each participating fund based on the fund’s borrowings at a rate per annum equal to the Federal Funds Rate plus 0.375%. State Street charged an annual operations agency fee of $40,000 for the committed line of credit and was able to charge an annual administration fee of $15,000 for the uncommitted line of credit. The commitment fee, the operations agency fee and the administration fee were accrued and apportioned among the participating funds pro rata based on their relative net assets.
For the year ended March 31, 2009, the average daily loan balance outstanding on days where borrowing existed was $1,000,000 at a weighted average interest rate of 2.563%.
Note 8. Securities Lending
The Fund may lend its securities to certain approved brokers, dealers and other financial institutions. Each loan is collateralized by cash, in an amount at least equal to the market value of the securities loaned plus accrued income from the investment of collateral. The market value of the loaned securities is determined at the close of business of the Fund and any additional required collateral is delivered to the Fund on the next business day. The collateral received is invested and the income generated by the investment of the collateral, net of any fees remitted to State Street as the lending agent and borrower rebates, is paid to the Fund. Generally, in the event of borrower default, the Fund has the right to use the collateral to offset any losses incurred. In the event the Fund is delayed or prevented from exercising its right to dispose of the collateral, there may be a potential loss to the Fund. The Fund bears the risk of loss with respect to the investment of collateral.
Note 9. Shares of Beneficial Interest
As of March 31, 2009, the Fund had one shareholder that held 87.1% of the shares outstanding, over which BOA and/or any of its affiliates did not have investment discretion.
Subscription and redemption activity of this account may have a significant effect on the operations of the Fund.
Note 10. Significant Risks and Contingencies
Asset-Backed Securities Risk
The value of asset-backed securities may be affected by, among other factors, changes in interest rates, the market’s assessment of the quality of underlying assets, the creditworthiness of the servicer for the underlying assets, factors concerning the interests in and structure of the issuer or the originator of the underlying assets, or the creditworthiness or rating of the entities that provide any supporting letters of credit, surety bonds, derivative instruments, or other credit enhancement. The value of asset-backed securities also will be affected by the exhaustion, termination or expiration of any credit enhancement. Most asset-backed securities are subject to prepayment risk, which is the possibility that the underlying debt may be refinanced or prepaid prior to maturity during periods of declining or low interest rates, causing the Fund to have to reinvest the money received in securities that have lower yields. In addition, the impact of prepayments on the value of asset-backed securities may be difficult to predict and may result in greater volatility.
Mortgage-Backed Securities Risk
The value of mortgage-backed securities may be affected by, among other things, changes in interest rates, factors concerning the interests in and structure of the issuer or the originator of the mortgages, the creditworthiness of the entities that provide any supporting letters of credit, surety bonds or other credit enhancements or the quality of underlying assets or the market’s assessment thereof. Mortgage-backed securities are subject to prepayment risk, which is the possibility that the underlying mortgage may be refinanced or prepaid prior to maturity during periods of declining or low interest rates, causing the Funds to have to reinvest the money received in securities that have lower yields. In addition, the impact of prepayments on the value of mortgage-backed securities may be difficult to predict and may result in greater volatility.
Legal Proceedings
Columbia Management Advisors, LLC and Columbia Management Distributors, Inc. (collectively, the “Columbia Group”) are subject to a settlement agreement with the New York Attorney General (“NYAG”) (the “NYAG Settlement”) and a settlement order with the SEC (the “SEC Order”) on
29
Columbia Short-Intermediate Bond Fund
March 31, 2009
matters relating to mutual fund trading, each dated February 9, 2005. Under the terms of the SEC Order, the Columbia Group (or predecessor entities) agreed, among other things, to: pay disgorgement and civil money penalties collectively totaling $140 million; cease and desist from violations of the antifraud provisions and certain other provisions of the federal securities laws; maintain certain compliance and ethics oversight structures; and retain an independent consultant to review the Columbia Group’s applicable supervisory, compliance, control and other policies and procedures. The NYAG Settlement, among other things, requires Columbia Management Advisors, LLC and its affiliates to reduce management fees for certain funds in the Columbia family of mutual funds in a projected total of $160 million over five years through November 30, 2009 and to make certain disclosures to investors relating to expenses. In connection with the Columbia Group providing services to the Columbia Funds, the Columbia Funds have voluntarily undertaken to implement certain governance measures designed to maintain the independence of their boards of trustees and certain special consulting and compliance measures.
Pursuant to the SEC Order and related procedures, the $140 million in settlement amounts described above has been substantially distributed in accordance with a distribution plan that was developed by an independent distribution consultant and approved by the SEC on April 6, 2007.
In connection with the events described above, various parties have filed suit against certain funds, the Trustees of the Columbia Funds, FleetBoston Financial Corporation and its affiliated entities and/or Bank of America and its affiliated entities.
On February 20, 2004, the Judicial Panel on Multidistrict Litigation transferred these cases and cases against other mutual fund companies based on similar allegations to the United States District Court in Maryland for consolidated or coordinated pretrial proceedings (the “MDL”). Subsequently, additional related cases were transferred to the MDL. On September 29, 2004, the plaintiffs in the MDL filed amended and consolidated complaints. One of these amended complaints is a putative class action that includes claims under the federal securities laws and state common law, and that names Columbia Management Advisors, Inc. (which has since merged into Banc of America Capital Management, LLC (now named Columbia Management Advisors, LLC)) (“Columbia”), Columbia Funds Distributor, Inc. (now named Columbia Management Distributors, Inc.) (the “Distributor”), the Trustees of the Columbia Funds, Bank of America Corporation and others as defendants. Another of the amended complaints is a derivative action purportedly on behalf of the Columbia Funds that asserts claims under federal securities laws and state common law.
On February 25, 2005, Columbia and other defendants filed motions to dismiss the claims in the pending cases. On March 1, 2006, for reasons stated in the court’s memoranda dated November 3, 2005, the United States District Court for the District of Maryland granted in part and denied in part the defendants’ motions to dismiss. The court dismissed all of the class action claims pending against the Columbia Funds Trusts. As to Columbia and the Distributor, the claims under the Securities Act of 1933, the claims under Sections 34(b) and 36(a) of the Investment Company Act of 1940 (“ICA”) and the state law claims were dismissed. The claims under Sections 10(b) and 20(a) of the Securities Exchange Act of 1934 and claims under Section 36(b) of the ICA were not dismissed.
On March 21, 2005, a purported class action was filed in Massachusetts state court alleging that certain conduct, including market timing, entitled Class B shareholders in certain Columbia Funds to an exemption from contingent deferred sales charges upon early redemption (the “CDSC Lawsuit”). The CDSC Lawsuit was removed to federal court in Massachusetts and transferred to the MDL.
On September 14, 2007, the plaintiffs and the Columbia defendants named in the MDL, including the Columbia Funds, entered into a stipulation of settlement with respect to all Columbia-related claims in the MDL described above, including the CDSC Lawsuit. The settlement is subject to court approval.
30
Report of Independent Registered Public Accounting Firm
To the Trustees of Columbia Funds Series Trust I and Shareholders of Columbia Short-Intermediate Bond Fund
In our opinion, the accompanying statement of assets and liabilities, including the portfolio of investments, and the related statement of operations and of changes in net assets and the financial highlights present fairly, in all material respects, the financial position of the Columbia Short-Intermediate Bond Fund, a series of Columbia Funds Series Trust I (formerly Intermediate-Term Bond Fund, a series of Excelsior Funds, Inc.) at March 31, 2009, the results of its operations for the year then ended, the changes in its net assets for each of the two years in the period then ended and the financial highlights for each of the periods indicated, in conformity with accounting principles generally accepted in the United States of America. These financial statements and financial highlights (hereafter referred to as “financial statements”) are the responsibility of the Fund’s management; our responsibility is to express an opinion on these financial statements based on our audits. We conducted our audits of these financial statements in accordance with the standards of the Public Company Accounting Oversight Board (United States). Those standards require that we plan and perform the audit to obtain reasonable assurance about whether the financial statements are free of material misstatement. An audit includes examining, on a test basis, evidence supporting the amounts and disclosures in the financial statements, assessing the accounting principles used and significant estimates made by management, and evaluating the overall financial statement presentation. We believe that our audits, which included confirmation of securities at March 31, 2009 by correspondence with the custodian and brokers, provide a reasonable basis for our opinion. The financial highlights of the Fund for each of the two years in the period ended March 31, 2006 were audited by other auditors whose report dated May 22, 2006, expressed an unqualified opinion on those highlights.
PricewaterhouseCoopers LLP
Boston, Massachusetts
May 22, 2009
31
Fund Governance
The Trustees serve terms of indefinite duration. The names, addresses and ages of the Trustees and officers of the Funds in Columbia Funds Series Trust I, the year each was first elected or appointed to office, their principal business occupations during at least the last five years, the number of Funds overseen by each Trustee and other directorships they hold are shown below. Each officer listed below serves as an officer of each Fund in the Columbia Funds Complex.
Independent Trustees
| | |
Name, Address and Year of Birth,
Position with Funds, Year First
Elected or Appointed to Office | | Principal Occupation(s) During Past Five Years, Number of Funds in Columbia Funds
Complex Overseen by Trustee, Other Directorships Held |
| |
| John D. Collins (Born 1938) | | |
c/o Columbia Management Advisors, LLC One Financial Center Boston, MA 02111 Trustee (since 2007) | | Retired. Consultant, KPMG, LLP (accounting and tax firm) from July 1999 to June 2000; Partner, KPMG, LLP from March 1962 to June 1999. Oversees 79, Mrs. Fields Famous Brands LLC (consumer products); Suburban Propane Partners, L.P.; and Montpelier Re (underwriting firm) |
| |
| Rodman L. Drake (Born 1943) | | |
c/o Columbia Management Advisors, LLC
One Financial Center Boston, MA 02111 Trustee (since 2007) | | Co-Founder of Baringo Capital LLC (private equity) since 2002; President, Continuation Investments Group, Inc. from 1997 to 2001. Oversees 79, Jackson Hewitt Tax Service Inc. (tax preparation services); Crystal Capital River Inc. (real estate investment trust); Student Loan Corporation (student loan provider); Celgene Corporation (global biotechnology company); Apex Silver Mines Ltd. (mining); and Helios Total Return Fund, Inc. and Helios Strategic Mortgage Income Fund, Inc. (exchange-traded funds) |
| |
| Douglas A. Hacker (Born 1955) | | |
c/o Columbia Management Advisors, LLC One Financial Center Boston, MA 02111 Trustee (since 1996) | | Independent business executive since May 2006; Executive Vice President – Strategy of United Airlines (airline) from December 2002 to May 2006; President of UAL Loyalty Services (airline marketing company) from September 2001 to December 2002; Executive Vice President and Chief Financial Officer of United Airlines from July 1999 to September 2001. Oversees 79, Nash Finch Company (food distributor); Aircastle Limited (aircraft leasing) |
| |
| Janet Langford Kelly (Born 1957) | | |
c/o Columbia Management Advisors, LLC One Financial Center Boston, MA 02111 Trustee (since 1996) | | Senior Vice President, General Counsel and Corporate Secretary, ConocoPhillips (integrated energy company) since September 2007; Deputy General Counsel – Corporate Legal Services, ConocoPhillips from August 2006 to August 2007; Partner, Zelle, Hofmann, Voelbel, Mason & Gette LLP (law firm) from March 2005 to July 2006; Adjunct Professor of Law, Northwestern University, from September 2004 to June 2006; Director, UAL Corporation (airline) from February 2006 to July 2006; Oversees 79, None |
32
Fund Governance (continued)
Independent Trustees (continued)
| | |
Name, Address and Year of Birth,
Position with Funds, Year First
Elected or Appointed to Office | | Principal Occupation(s) During Past Five Years, Number of Funds in Columbia Funds
Complex Overseen by Trustee, Other Directorships Held |
| |
| Charles R. Nelson (Born 1942) | | |
c/o Columbia Management Advisors, LLC One Financial Center Boston, MA 02111 Trustee (since 1981) | | Professor of Economics, University of Washington, since January 1976; Ford and Louisa Van Voorhis Professor of Political Economy, University of Washington, since September 1993; Adjunct Professor of Statistics, University of Washington, since September 1980; Associate Editor, Journal of Money Credit and Banking from 1993 to 2008; Consultant on econometric and statistical matters. Oversees 79, None |
| |
| John J. Neuhauser (Born 1943) | | |
c/o Columbia Management Advisors, LLC One Financial Center Boston, MA 02111 Trustee (since 1985) | | President, Saint Michael’s College, since August 2007; University Professor, Boston College from November 2005 to August 2007; Academic Vice President and Dean of Faculties, Boston College from August 1999 to October 2005. Oversees 79, Liberty All-Star Equity Fund and Liberty All-Star Growth Fund, Inc. (closed-end funds) |
| |
| Jonathan Piel (Born 1938) | | |
c/o Columbia Management Advisors, LLC One Financial Center Boston, MA 02111 Trustee (since 2007) | | Cable television producer and website designer; The Editor, Scientific American from 1984 to 1994; Vice President, Scientific American, Inc., from 1984 to 1994; Member, Advisory Board, Stone Age Institute, Bloomington, Indiana (research institute that explores the effect of technology on human evolution); Member, Board of Directors of the National Institute of Social Sciences, New York City; Member, Board of Trustees of the William Alanson White Institute, New York City (institution for training psychoanalysts) and Member, Advisory Board, Mount Sinai Children’s Environmental Health Center, New York; Oversees 79, None |
| |
| Patrick J. Simpson (Born 1944) | | |
| c/o Columbia Management Advisors, LLC One Financial Center Boston, MA 02111 Trustee (since 2000) | | Partner, Perkins Coie LLP (law firm). Oversees 79, None |
| |
| Thomas C. Theobald (Born 1937) | | |
| c/o Columbia Management Advisors, LLC One Financial Center Boston, MA 02111 Trustee and Chairman of the Board (since 1996) | | Partner and Senior Advisor, Chicago Growth Partners (private equity investing) since September 2004; Managing Director, William Blair Capital Partners (private equity investing) from September 1994 to September 2004. Oversees 79, Anixter International (network support equipment distributor); Ventas, Inc. (real estate investment trust); Jones Lang LaSalle (real estate management services); Ambac Financial Group (financial guaranty insurance) |
| |
| Anne-Lee Verville (Born 1945) | | |
| c/o Columbia Management Advisors, LLC One Financial Center Boston, MA 02111 Trustee (since 1998) | | Retired since 1997 (formerly General Manager – Global Education Industry (from 1994 to 1997), President – Application Systems Division (from 1991 to 1994), Chief Financial Officer – US Marketing & Services (from 1988 to 1991), and Chief Information Officer (from 1987 to 1988), IBM Corporation (computer and technology)). Oversees 79, None |
33
Fund Governance (continued)
Interested Trustee
| | |
Name, Address and Year of Birth,
Position with Funds, Year First
Elected or Appointed to Office | | Principal Occupation(s) During Past Five Years, Number of Funds in Columbia Funds
Complex Overseen by Trustee, Other Directorships Held |
| |
| William E. Mayer (Born 1940) | | |
| c/o Columbia Management Advisors, LLC One Financial Center Boston, MA 02111 Trustee1 (since 1994) | | Partner, Park Avenue Equity Partners (private equity) since February 1999; Dean and Professor, College of Business, University of Maryland from 1992 to 1997. Oversees 79, Lee Enterprises (print media), WR Hambrecht + Co. (financial service provider); BlackRock Kelso Capital Corporation (investment company) |
| 1 | The Funds currently treat Mr. Mayer as an “interested person” (as defined in the Investment Company Act of 1940) by reason of his affiliation with WR Hambrecht + Co., a registered broker/dealer that may execute portfolio transactions for or engage in principal transactions with the Funds or other funds or accounts advised/managed by the Advisor or other Bank of America affiliates. |
The Statement of Additional Information includes additional information about the Trustees of the Funds and is available, without charge, upon request by calling 1-800-345-6611.
34
Fund Governance (continued)
Officers
| | |
Name, Address and Year of Birth,
Position with Columbia Funds, Year
First Elected or Appointed to Office | | Principal Occupation(s) During Past Five Years |
| |
| J. Kevin Connaughton (Born 1964) | | |
One Financial Center Boston, MA 02111 President (since 2009) | | Managing Director of Columbia Management Advisors, LLC since December 2004; Senior Vice President and Chief Financial Officer – Columbia Funds, from June 2008 to January 2009; Treasurer – Columbia Funds, from October 2003 to May 2008; Treasurer – the Liberty Funds, Stein Roe Funds and Liberty All-Star Funds, December 2000 – December 2006; Senior Vice President – Columbia Management Advisors, LLC, from April 2003 to December 2004; President – Columbia Funds, Liberty Funds and Stein Roe Funds, February 2004 to October 2004; Treasurer – Galaxy Funds, September 2002 to December 2005; Treasurer, December 2002 to December 2004, and President, February 2004 to December 2004 – Columbia Management Multi-Strategy Hedge Fund, LLC; and a senior officer of various other Bank of America-affiliated entities, including other registered and unregistered funds. |
| |
| James R. Bordewick, Jr. (Born 1959) | | |
One Financial Center Boston, MA 02111 Senior Vice President, Secretary and Chief Legal Officer (since 2006) | | Associate General Counsel, Bank of America since April 2005; Senior Vice President and Associate General Counsel, MFS Investment Management (investment management) prior to April 2005. |
| |
| Linda J. Wondrack (Born 1964) | | |
One Financial Center Boston, MA 02111 Senior Vice President and Chief Compliance Officer (since 2007) | | Director (Columbia Management Group LLC and Investment Product Group Compliance), Bank of America since June 2005; Director of Corporate Compliance and Conflicts Officer, MFS Investment Management (investment management), August 2004 to May 2005; Managing Director, Deutsche Asset Management (investment management) prior to August 2004. |
| |
| Michael G. Clarke (Born 1969) | | |
One Financial Center Boston, MA 02111 Senior Vice President and Chief Financial Officer (since 2009) | | Director of Fund Administration of the Advisor since January 2006; Managing Director of the Advisor September 2004 to December 2005; Vice President Fund Administration June 2002 to September 2004. |
| |
| Jeffrey R. Coleman (Born 1969) | | |
One Financial Center Boston, MA 02111 Deputy Treasurer (since 2006) | | Director of Fund Administration of the Advisor since January 2006; Fund Controller of the Advisor from October 2004 to January 2006; Vice President of CDC IXIS Asset Management Services, Inc. (investment management) from August 2000 to September 2004. |
| |
| Joseph F. DiMaria (Born 1968) | | |
One Financial Center Boston, MA 02111 Chief Accounting Officer and Treasurer (since 2009) | | Director of Fund Administration of the Advisor since January 2006; Head of Tax/Compliance and Assistant Treasurer of the Advisor from November 2004 to December 2005; Director of Trustee Administration (Sarbanes-Oxley) of the Advisor from May 2003 to October 2004. |
35
Fund Governance (continued)
Officers (continued)
| | |
Name, Address and Year of Birth,
Position with Columbia Funds, Year
First Elected or Appointed to Office | | Principal Occupation(s) During Past Five Years |
| |
| Julian Quero (Born 1967) | | |
One Financial Center Boston, MA 02111 Deputy Treasurer (since 2008) | | Senior Tax Manager of the Advisor since August 2006; Senior Compliance Manager of the Advisor from April 2002 to August 2006. |
| |
| Barry S. Vallan (Born 1969) | | |
One Financial Center Boston, MA 02111 Controller (since 2006) | | Vice President – Fund Treasury of the Advisor since October 2004; Vice President – Trustee Reporting of the Advisor from April 2002 to October 2004 |
36
Board Consideration and Approval of Advisory Agreements
The Advisory Fees and Expenses Committee of the Board of Trustees meets several times annually to review the advisory agreements (collectively, the “Agreements”) of the funds for which the Trustees serve as trustees (each a “fund”) and to determine whether to recommend that the full Board approve the continuation of the Agreements for an additional one-year period. After the Committee has made its recommendation, the full Board, including the Independent Trustees, determines whether to approve the continuation of the Agreements. In addition, the full Board, including the Independent Trustees, considers matters bearing on the Agreements at most of its other meetings throughout the year and meets regularly with senior management of the funds and Columbia, the funds’ investment adviser, including the senior manager of each investment area within Columbia. Through the Board’s Investment Oversight Committees, Trustees also meet with selected fund portfolio managers, research analysts and traders at various times throughout the year.
The Trustees receive and review all materials that they, their legal counsel or Columbia believe to be reasonably necessary for the Trustees to evaluate the Agreements and to determine whether to approve the continuation of the Agreements. Those materials generally include, among other items, (i) information on the investment performance of each fund relative to the performance of peer groups of mutual funds and the fund’s performance benchmarks, and additional information assessing performance on a risk-adjusted basis, (ii) information on each fund’s advisory fees and other expenses, including information comparing the fund’s expenses to those of peer groups of mutual funds and information about any applicable expense caps and fee “breakpoints,” (iii) information about the profitability of the Agreements to Columbia, including potential “fall-out” or ancillary benefits that Columbia and its affiliates may receive as a result of their relationships with the funds and (iv) information obtained through Columbia’s response to a questionnaire prepared at the request of the Trustees by counsel to the funds and independent legal counsel to the Independent Trustees. The Trustees also consider other information such as (v) Columbia’s financial results and financial condition, (vi) each fund’s investment objective and strategies and the size, education and experience of Columbia’s investment staffs and their use of technology, external research and trading cost measurement tools, (vii) the allocation of the funds’ brokerage and the use of “soft” commission dollars to pay for research products and services, (viii) Columbia’s resources devoted to, and its record of compliance with, the funds’ investment policies and restrictions, policies on personal securities transactions and other compliance policies and legal and regulatory requirements, (ix) Columbia’s response to various legal and regulatory proceedings since 2003 and to the recent period of volatility in the securities markets and (x) the economic outlook generally and for the mutual fund industry in particular. In addition, the Advisory Fees and Expenses Committee confers with the funds’ independent fee consultant and reviews materials relating to the funds’ relationships with Columbia provided by the independent fee consultant. Throughout the process, the Trustees have the opportunity to ask questions of and to request additional materials from Columbia and to consult with the independent fee consultant and independent legal counsel to the Independent Trustees.
The Board of Trustees most recently approved the continuation of the Agreements at its October, 2008 meeting, following meetings of the Advisory Fees and Expenses Committee held in February, April, August, September and October, 2008. In considering whether to approve the continuation of the Agreements, the Trustees, including the Independent Trustees, did not identify any single factor as determinative, and each weighed various factors as he or she deemed appropriate. The Trustees considered the following matters in connection with their approval of the continuation of the Agreements:
The nature, extent and quality of the services provided to the funds under the Agreements. The Trustees considered the nature, extent and quality of the services provided by Columbia and its affiliates to the funds and the resources dedicated to the funds by Columbia and its affiliates. Among other things, the Trustees considered (i) Columbia’s ability (including its personnel and other resources, compensation programs for personnel involved in fund management, reputation and other attributes) to attract, motivate and retain highly qualified research, advisory and supervisory investment professionals; (ii) the portfolio management services provided by those investment professionals; and (iii) the trade execution services provided on behalf of the funds. For each fund, the Trustees also considered the benefits to shareholders of investing in a mutual fund that is
37
part of a family of funds offering exposure to a variety of asset classes and investment disciplines and providing a variety of fund and shareholder services. After reviewing those and related factors, the Trustees concluded, within the context of their overall conclusions regarding each of the Agreements, that the nature, extent and quality of services provided supported the continuation of the Agreements.
Investment performance of the funds and Columbia. The Trustees reviewed information about the performance of each fund over various time periods, including information prepared by an independent third-party data provider that compared the performance of each fund to the performance of peer groups of mutual funds and performance benchmarks. The Trustees also reviewed a description of the third party’s methodology for identifying each fund’s peer group for purposes of performance and expense comparisons. The Trustees also considered additional information that the Advisory Fees and Expenses Committee requested from Columbia relating to funds that presented relatively weaker performance and/or relatively higher expenses. In the case of each fund whose performance lagged that of a relevant peer group for certain (although not necessarily all) periods, the Trustees concluded that other factors relevant to performance were sufficient, in light of other considerations, to warrant continuation of the fund’s Agreements. Those factors varied from fund to fund, but included one or more of the following: (i) that the fund’s performance, although lagging in certain recent periods, was stronger over the longer term; (ii) that the underperformance was attributable, to a significant extent, to investment decisions that were reasonable and consistent with the fund’s investment strategy and policies and that the fund was performing within a reasonable range of expectations, given those investment decisions, market conditions and the fund’s investment strategy; (iii) that the fund’s performance was competitive when compared to other relevant performance benchmarks or peer groups; (iv) that Columbia had taken or was taking steps designed to help improve the fund’s investment performance, including, but not limited to, replacing portfolio managers or modifying investment strategies; and (v) that Columbia proposed to waive advisory fees or cap the expenses of the fund.
The Trustees noted that, through April 30, 2008, Columbia Short-Intermediate Bond Fund’s performance was in the second quintile (where the best performance would be in the first quintile) for the one-year period, and in the first quintile for the three-, five- and ten-year periods, of the peer group selected by an independent third-party data provider for purposes of performance comparisons.
The Trustees also considered Columbia’s performance and reputation generally, the funds’ performance as a fund family generally, and Columbia’s historical responsiveness to Trustee concerns about performance and Columbia’s willingness to take steps intended to improve performance. After reviewing those and related factors, the Trustees concluded, within the context of their overall conclusions regarding each of the Agreements, that the performance of each fund and Columbia was sufficient, in light of other considerations, to warrant the continuation of the Agreement(s) pertaining to that fund.
The costs of the services provided and profits realized by Columbia and its affiliates from their relationships with the funds. The Trustees considered the fees charged to the funds for advisory services as well as the total expense levels of the funds. That information included comparisons (provided by management and by an independent third-party data provider) of each fund’s advisory fees and total expense levels to those of the fund’s peer groups and information about the advisory fees charged by Columbia to comparable institutional accounts. In considering the fees charged to those accounts, the Trustees took into account, among other things, management’s representations about the differences between managing mutual funds as compared to other types of accounts, including differences in the services provided, differences in the risk profile of such business for Columbia, and the additional resources required to manage mutual funds effectively. In evaluating each fund’s advisory fees, the Trustees also took into account the demands, complexity and quality of the investment management of the fund. The Trustees considered existing advisory fee breakpoints, and Columbia’s use of advisory fee waivers and expense caps, which benefited a number of the funds. The Trustees also noted management’s stated justification for the fees charged to the funds, which included information about the investment performance of the funds and the services provided to the funds.
The Trustees considered that Columbia Short-Intermediate Bond Fund’s total expenses were in the third quintile and actual management fees were in the second quintile (where
38
the lowest fees and expenses would be in the first quintile) of the peer group selected by an independent third-party data provider for purposes of expense comparisons.
The Trustees also considered the compensation directly or indirectly received by Columbia and its affiliates from their relationships with the funds. The Trustees reviewed information provided by management as to the profitability to Columbia and its affiliates of their relationships with each fund, and information about the allocation of expenses used to calculate profitability. When reviewing profitability, the Trustees also considered court cases in which adviser profitability was an issue in whole or in part, the performance of the relevant funds, the expense level of each fund, and whether Columbia had implemented breakpoints and/or expense caps with respect to the fund.
After reviewing those and related factors, the Trustees concluded, within the context of their overall conclusions regarding each of the Agreements, that the advisory fees charged to each fund, and the related profitability to Columbia and its affiliates of their relationships with the fund, supported the continuation of the Agreement(s) pertaining to that fund.
Economies of Scale. The Trustees considered the existence of any economies of scale in the provision by Columbia of services to each fund, to groups of related funds, and to Columbia’s investment advisory clients as a whole and whether those economies were shared with the funds through breakpoints in the investment advisory fees or other means, such as fee waivers/expense reductions and additional investments by Columbia in investment, trading and compliance resources. The Trustees noted that many of the funds benefited from breakpoints, fee waivers/expense caps, or both. In considering those issues, the Trustees also took note of the costs of the services provided (both on an absolute and a relative basis) and the profitability to Columbia and its affiliates of their relationships with the funds, as discussed above.
After reviewing those and related factors, the Trustees concluded, within the context of their overall conclusions regarding each of the Agreements, that the extent to which economies of scale were shared with the funds supported the continuation of the Agreements.
Other Factors. The Trustees also considered other factors, which included but were not limited to the following:
| n | | the extent to which each fund had operated in accordance with its investment objective and investment restrictions, the nature and scope of the compliance programs of the funds and Columbia and the compliance-related resources that Columbia and its affiliates were providing to the funds; |
| n | | the nature, quality, cost and extent of administrative and shareholder services overseen and performed by Columbia and its affiliates, both under the Agreements and under separate agreements for the provision of transfer agency and administrative services; |
| n | | so-called “fall-out benefits” to Columbia and its affiliates, such as the engagement of its affiliates to provide distribution, brokerage and transfer agency services to the funds, and the benefits of research made available to Columbia by reason of brokerage commissions generated by the funds’ securities transactions, as well as possible conflicts of interest associated with those fall-out and other benefits, and the reporting, disclosure and other processes in place to disclose and monitor those possible conflicts of interest; and |
| n | | the report provided by the funds’ independent fee consultant, which included information about and analysis of the funds’ fees, expenses and performance. |
Based on their evaluation of all factors that they deemed to be material, including those factors described above, and assisted by the advice of independent counsel and the independent fee consultant, the Trustees, including the Independent Trustees, approved the continuance of each of the Agreements through October 31, 2009.
39
Summary of Management Fee Evaluation by Independent Fee Consultant
EXCERPTS FROM REPORT OF INDEPENDENT FEE CONSULTANT TO THE FUNDS SUPERVISED BY THE COLUMBIA ATLANTIC BOARD
Prepared Pursuant to the February 9, 2005 Assurance of Discontinuance among the Office of Attorney General of New York State, Columbia Management Advisors, LLC, and Columbia Management Distributors, Inc. November 3, 2008
I. Overview
On February 9, 2005, Columbia Management Advisors, LLC (“CMA”) and Columbia Management Distributors, Inc.1 (“CMD”) agreed to the New York Attorney General’s Assurance of Discontinuance (“AOD”). Among other things, the AOD stipulates that CMA may manage or advise a Columbia Fund (“Columbia Fund” and, together with some or all of, such funds the “Columbia Funds”) only if the Independent Members of the Columbia Fund’s Board of Trustees appoint a Senior Officer or retain an Independent Fee Consultant (“IFC”) who is to manage the process by which proposed management fees are negotiated. The AOD further stipulates that the Senior Officer or IFC is to prepare a written annual evaluation of the fee negotiation process.
With effect from January 1, 2007, the Independent Members of the Board of Trustees for certain Columbia Funds known collectively as the “Atlantic Funds” (together with the other members of that Board, the “Trustees”) retained me as IFC for the Atlantic Funds.2 In this capacity, I have prepared the fourth annual written evaluation of the fee negotiation process. As was the case with last year’s report (the “2007 Report”) my immediate predecessor as IFC, John Rea, provided invaluable assistance in the preparation of this year’s report.
A. Role of the Independent Fee Consultant
The AOD charges the IFC with “managing the process by which proposed management fees…to be charged the Columbia Fund are negotiated so that they are negotiated in a manner which is at arms’ length and reasonable and consistent with this Assurance of Discontinuance.” The AOD also provides that CMA “may manage or advise a Columbia Fund only if the reasonableness of the proposed management fees is determined by the Board of Trustees…using…an annual independent written evaluation prepared by or under the direction of…the Independent Fee Consultant.” Therefore, the AOD makes clear that the IFC does not supplant the Trustees in negotiating management fees with CMA, nor does the IFC substitute his or her judgment for that of the Trustees with respect to the reasonableness of proposed fees or any other matter that is committed to the business judgment of the Trustees.
B. Elements Involved in Managing the Fee Negotiation Process
In preparing the report required by the AOD, the IFC must consider at least the following six factors set forth in the AOD:
| 1. | The nature and quality of CMA’s services, including the Fund’s performance; |
| 2. | Management fees (including any components thereof) charged by other mutual fund companies for like services; |
| 3. | Possible economies of scale as the Fund grows larger; |
| 4. | Management fees (including any components thereof) charged to institutional and other clients of CMA for like services; |
| 5. | Costs to CMA and its affiliates of supplying services pursuant to the management fee agreements, excluding any intra-corporate profit; and |
| 6. | Profit margins of CMA and its affiliates from supplying such services. |
C. Organization of the Annual Evaluation
This report, like last year’s, focuses on the six factors and contains a section for each factor except that CMA’s costs and profits from managing the Funds have been combined into a single section. In addition to a discussion of these factors, the report offers recommendations to improve the fee review process in future years. A review of the status of
1 | CMA and CMD are subsidiaries of Columbia Management Group, LLC (“CMG”), and are the successors to the entities named in the AOD. |
2 | I have no material relationship with Bank of America, CMG or any of its affiliates, aside from serving as IFC, and I am aware of no material relationship with any of their affiliates. I retained John Rea, an independent economic consultant, to assist me with this report. |
| | Unless otherwise stated or required by the context, this report covers only the Atlantic Funds, which are also referred as the “Funds.” |
40
recommendations made in the 2007 Report is being provided separately with the materials for the October meeting.
II. Summary of Findings
A. General
| 1. | Based upon my examination of the information supplied by CMG in the light of the six factors set forth in the AOD, I conclude that the Trustees have the relevant information necessary to evaluate the reasonableness of the proposed management fees for each Atlantic Fund. |
| 2. | In my view, the process by which the proposed management fees of the Funds have been negotiated in 2008 thus far has been, to the extent practicable, at arms’ length and reasonable and consistent with the AOD. |
B. Nature and Quality of Services, Including Performance
| 3. | The performance of the Funds has been relatively strong in recent years. Based upon 1-, 3-, 5-, and 10-year returns through April 30, 2008, at least half of all the Funds were in the first and second performance quintiles in each of the four performance periods and, at most, only 11% were in the fifth quintile in any one performance period. Both equity and fixed-income funds posted strong performance relative to comparable funds. |
| 4. | Performance rankings were similar in 2007 and 2008, although last year’s were slightly stronger. Despite the stability in the distribution of rankings in the two years, at least half the Funds changed quintile rankings between the two years in at least one of the 1-, 3-, and 5-year performance periods. |
| 5. | The performance of the actively managed equity Funds against their benchmarks was very strong. At least 57% and as many as 73% posted net returns exceeding their benchmarks over the 1-, 3-, and 5-year periods. In contrast, gross and net returns of fixed-income Funds typically fell short of their benchmarks. |
| 6. | Atlantic equity Funds’ overall performance adjusted for risk also was strong. Based upon 3-year returns, nearly 80% of the equity Funds had a combination of risk-adjusted and unadjusted returns that placed them in the top half of their performance universes. Only about one-fifth of the fixed income Funds posted high returns and low risk relative to comparable funds. About two-thirds of the fixed-income Funds took on more risk than the typical fund in their performance universes. |
| 7. | The industry-standard procedure used by Lipper that includes all share classes in the performance universe tends to bias a Fund’s ranking upward within that universe. The bias occurs because either no-12b-1 fee or low-12b-1 fee share classes of the Atlantic Funds are compared with funds in performance universes that include all share classes of multi-class funds with 12b-1 fees of up to 100 basis points. Correcting this bias by limiting the performance universe to classes of comparable funds with low or no 12b-1 fees (a “filtered universe”) lowers the relative performance for the Funds, but their performance, on the whole, remains strong. The filtering process, however, did identify two Funds for further review that had not been designated review funds using unfiltered universes. |
| 8. | A small number of Funds have consistently underperformed over the past four years. The exact number depends on the criteria used to evaluate longer-term performance. For example, the one-year returns of one Fund have been in the fourth or fifth performance quintiles in each of the past four years; there are six Funds whose three-year returns have been in the fourth or fifth quintile over the past four years. |
| 9. | The services performed by CMG professionals beyond portfolio management, such as compliance, legal, information technology, risk management, finance and fund administration, are critical to the success of the Funds and appear to be of high quality. |
C. Management Fees Charged by Other Mutual Fund Companies
| 10. | The Funds’ management fees and total expenses are generally low relative to those of their peers. Only 21% of the Funds ranked in the two most expensive quintiles for actual management fees, and only 23% in those quintiles for total expenses. |
| 11. | The highest concentration of low-expense Funds is found among the equity and tax-exempt fixed income Funds. The 12 former Excelsior Funds have relatively high fees and expenses, with half of those Funds ranking in either the fourth or fifth quintiles. The higher actual management fee |
41
| | rankings of certain Excelsior Funds are due in part to fee schedules that are higher than standard Columbia Fund fee schedules at current asset levels. After discussion with the Trustees, CMA is proposing to lower the management fees on three of these Funds. |
| 12. | The distribution of expense rankings is similar in 2007 and 2008, while management fee rankings improved markedly in 2008. Part of the improvement reflects expense limitations introduced last year for the state intermediate municipal bond Funds. |
| 13. | The management fees of the Atlantic Funds are generally in line with those of Columbia Funds supervised by the Nations Board of Trustees (the “Nations Funds”). In investment categories in which the Atlantic Funds have higher average fees, the difference principally arises out of differences in asset size. |
D. Trustees’ Fee and Performance Evaluation Process
| 14. | The Trustees’ evaluation process identified 17 Funds in 2008 for further review based upon their relative performance or expenses or both. When compared in filtered universes, two more Funds met the criteria for further review. CMG provided further information about those Funds to assist the Trustees in their evaluation. |
E. Potential Economies of Scale
| 15. | CMG presented to the Trustees its analysis of the sources and sharing of potential economies of scale. CMG views economies of scale as arising at the complex level and would regard estimates of scale economies for individual funds as unreliable. In its analysis, CMG did not identify specific sources of economies of scale or provide any estimates of any economies of scale that might arise from future asset growth. CMG’s analysis included measures taken by the Trustees and CMG that seek to share any potential economies of scale through breakpoints in management fee schedules, expense reimbursements, fee waivers, enhanced shareholder services, fund mergers, and operational consolidation. |
| 16. | An examination of the contractual fee schedules for five Atlantic Funds shows that they are generally in line with those of their competitors, in terms of number and extent of fee breakpoints. A similar examination last year of five different Funds led to the same conclusion. |
F. Management Fees Charged to Institutional Clients
| 17. | CMG has provided Trustees with comparisons of mutual fund management fees and institutional fees based upon standardized fee schedules and upon actual fees. The results show that, consistent with industry practice, institutional fees are generally lower than the Funds’ management fees. However, because the services provided and risks borne by the manager are more extensive for mutual funds compared to institutional accounts, the differences are of limited value in assisting the Trustees in their review of the reasonableness of the Funds’ management fees. |
G. Revenues, Expenses, and Profits
| 18. | The activity-based cost allocation methodology (“ABC”) employed by CMG to allocate costs, both direct and indirect, for purposes of calculating Fund profitability is thoughtful and detailed. This year, CMG proposed a change to the method by which indirect expenses are allocated. Under this “hybrid” method, indirect costs relating to fund management are allocated among the Funds 50% by assets and 50% per Fund. Allocating indirect expenses equally to each Fund has an intuitive logic, as each Fund regardless of size has certain expenses, such as preparing and printing prospectuses and financial statements. |
| 19. | The materials provided on CMG’s revenues and expenses with respect to the Funds and the methodology underlying their construction form a sufficient basis for Trustees to evaluate the expenses and profitability of the Funds. |
| 20. | In 2007, CMG’s complex-wide pre-tax margins on the Atlantic Funds were slightly below industry medians, based on limited data available for publicly held mutual fund managers. However, as is to be expected in a complex now comprising 75 Funds (including former Excelsior Funds), some Atlantic Funds have relatively high pre-tax profit margins, when calculated solely with respect to management revenues and expenses, while other Atlantic Funds operate at a loss. There is a positive relationship between fund size and profitability, with smaller funds generally operating at a loss. |
| 21. | CMG pays a fixed percentage of its management fee revenues to an affiliate, U.S. Trust, Bank of America |
42
| | Private Wealth Management, to compensate it for services it performs with respect to Atlantic Fund assets held for the benefit of its customers. Based on our analysis of the services provided by this affiliate, we have concluded that all payments other than those for sub-transfer agent or sub-accounting services should be treated as a distribution expense. |
III. Recommendations
| 1) | Criteria for review. The Trustees may wish to consider modifying the criteria for classifying a fund as a “Review Fund” to include criteria that focus exclusively on performance without regard to expense or fee levels. For example, a fund whose one-year or three-year performance was median or below for four consecutive years could be treated as a Review Fund. When we applied such criteria to the Funds, several additional Funds would have been added to the list of Review Funds. |
| 2) | Profitability data. CMG should present to the Trustees each year the profitability of each Fund, each investment style and each complex (of which Atlantic is one) calculated as follows: |
| | a. | Management-only profitability should be calculated without reference to any Private Bank expense. |
| | b. | Profitability excluding distribution (which essentially covers the management and transfer agency functions) should be adjusted by removing from the expense calculation any portion of the Private Bank payment not attributable to the performance by the Private Bank of sub-transfer agency or sub-accounting functions. |
| | c. | Total profitability, including distribution: No adjustment for Private Bank expenses should be made, because all such expenses represent legitimate fund expenses to be taken into account in calculating CMG’s profit margin including distribution. |
| | d. | Distribution only: This should include all Private Bank expenses other than those attributable to sub-transfer agency services. |
Therefore, the following data need not be provided:
| | 1. | Adjusting total profitability data for Private Bank expenses |
| | 2. | Adjusting profitability excluding distribution by backing out all Private Bank expenses. |
| 3) | Potential economies of scale. CMG and the IFC should continue to work on methods for more precisely quantifying to the extent possible the sources and magnitude of any economies of scale as CMG’s mutual fund assets under management increase, to the extent that the data allows for meaningful year-over-year comparisons. The framework suggested in Section IV.D.4 may prove to be a useful model for such an analysis. |
| 4) | Competitive breakpoint analysis. As part of the annual fee evaluation process, the breakpoints of a select group of Atlantic Funds (which would differ each year) should continue to be compared to those of industry rivals to ensure that the Funds’ breakpoint schedules remain within industry norms. As breakpoint schedules change relatively little each year, performing such a comparison for each Atlantic Fund each year would not be an efficient use of Trustee and CMG resources. |
| 5) | Cost allocation methodology. CMG’s point that the current ABC system of allocating indirect expenses creates anomalous results in several cases, including sub-advised Funds, is well-taken. We would like to work with CMG over the forthcoming year on alternatives to the current system of allocating indirect expenses that (1) resolve the anomalies, (2) limit the amount of incremental effort on CMG’s part and (3) remain faithful to the general principle that expenses should be allocated by time and effort to the extent reasonably possible. |
| 6) | Management fee disparities. CMG and the Atlantic Trustees, as part of any future study of management fees, should analyze the differences in management fee schedules, principally arising out of the reorganization of the former Excelsior Funds as Atlantic Funds. As part of that analysis, CMG should provide an explanation for any significant fee differences among comparable funds across fund families managed by CMA, such as differences in the management styles of different Funds included the same Lipper category. Finally, whenever CMG proposes a management fee change or an expense cap for any mutual fund managed by CMA that is comparable to any Atlantic Fund, CMG should provide the Trustees with sufficient information about the proposal to allow the Trustees to assess the applicability of the proposed change to the relevant Atlantic Fund or Funds. |
43
| 7) | Tax-exempt Fund expense data. The expense rankings of certain tax-exempt Funds were adversely affected by including certain investment-related interest expenses that Lipper excluded in calculating the expense ratios of competitors. We recommend that CMG follow the Lipper practice and exclude such interest expenses from data submitted to Lipper to avoid unfairly disadvantaging the tax-exempt Funds. |
| 8) | Reduction of volume of paper documents submitted. The effort to rationalize and simplify the data presented to the Trustees and the process by which that data was prepared and organized was regarded as a success by all parties. We should continue to look for opportunities to reduce and simplify the presentation of 15(c) data, especially in the area of Fund profitability. The Fund “Dashboard” volume presents a large volume of Fund data on a single page. If it is continued, the Trustees may wish to consider receiving the underlying Lipper data on CD, rather than the current paper volumes. |
Respectfully submitted,
Steven E. Asher
44
Important Information About This Report
Transfer Agent
Columbia Management Services, Inc.
P.O. Box 8081
Boston, MA 02266-8081
1-800-345-6611
Distributor
Columbia Management
Distributors, Inc.
One Financial Center
Boston, MA 02111
Investment Advisor
Columbia Management Advisors, LLC
100 Federal Street
Boston, MA 02110
The fund mails one shareholder report to each shareholder address. If you would like more than one report, please call shareholder services at 1-800-345-6611 and additional reports will be sent to you. This report has been prepared for shareholders of Columbia Short-Intermediate Bond Fund.
A description of the policies and procedures that the fund uses to determine how to vote proxies and a copy of the fund’s voting records are available (i) at www.columbiamanagement.com; (ii) on the Securities and Exchange Commission’s website at www.sec.gov, and (iii) without charge, upon request, by calling 1-800-368-0346. Information regarding how the fund voted proxies relating to portfolio securities during the 12-month period ended June 30 is available from the SEC’s website. Information regarding how the fund voted proxies relating to portfolio securities is also available from the fund’s website columbiamanagement.com.
The fund files a complete schedule of portfolio holdings with the SEC for the first and third quarters of each fiscal year on Form N-Q. The fund’s Form N-Q is available on the SEC’s website at www.sec.gov and may be reviewed and copied at the SEC’s Public Reference Room in Washington, D.C. Information on the operation of the Public Reference Room may be obtained by calling
1-800-SEC-0330.
Please read and consider the investment objectives, risks, charges and expenses for any fund carefully before investing. For a prospectus which contains this and other important information about the fund, contact your Columbia Management representative or financial advisor or go to www.columbiamanagement.com.
Columbia Management Group, LLC (“Columbia Management”) is the investment management division of Bank of America Corporation. Columbia Management entities furnish investment management services and products for institutional and individual investors. Columbia Funds are distributed by Columbia Management Distributors, Inc., member of FINRA, SIPC, part of Columbia Management and an affiliate of Bank of America Corporation.
45

One Financial Center
Boston, MA 02111-2621
Columbia Short-Intermediate Bond Fund
Annual Report , March 31, 2009
©2009 Columbia Management Distributors, Inc.
One Financial Center, Boston, MA 02111-2621
800.345.6611 www.columbiafunds.com
SHC-42/10750-0309 (05/09) 09/78779
Item 2. Code of Ethics.
| | (a) | The registrant has, as of the end of the period covered by this report, adopted a code of ethics that applies to the registrant’s principal executive officer, principal financial officer, principal accounting officer or controller, or persons performing similar functions, regardless of whether these individuals are employed by the registrant or a third party. |
| | (b) | During the period covered by this report, there were not any amendments to a provision of the code of ethics adopted in 2(a) above. |
| | (c) | During the period covered by this report, there were no waivers, including any implicit waivers, from a provision of the code of ethics described in 2(a) above that relates to one or more of the items set forth in paragraph (b) of this item’s instructions. |
Item 3. Audit Committee Financial Expert.
The registrant’s Board of Trustees has determined that Douglas A. Hacker, John D. Collins and Anne-Lee Verville, each of whom are members of the registrant’s Board of Trustees and Audit Committee, each qualify as an audit committee financial expert. Mr. Hacker, Mr. Collins and Ms. Verville are each independent trustees, as defined in paragraph (a)(2) of this item’s instructions.
Item 4. Principal Accountant Fees and Services.
Fee information below is disclosed for the sixteen series of the registrant whose report to stockholders are included in this annual filing.
(a) Audit Fees. Aggregate Audit Fees billed by the principal accountant for professional services rendered during the fiscal years ended March 31, 2009 and March 31, 2008 are approximately as follows:
| | |
2009 | | 2008 |
$468,600 | | $468,600 |
Audit Fees include amounts related to the audit of the registrant’s annual financial statements or services that are normally provided by the accountant in connection with statutory and regulatory filings or engagements for those fiscal years.
(b) Audit-Related Fees. Aggregate Audit-Related Fees billed to the registrant by the principal accountant for professional services rendered during the fiscal years ended March 31, 2009 and March 31, 2008 are approximately as follows:
| | |
2009 | | 2008 |
$73,600 | | $103,700 |
Audit-Related Fees include amounts for assurance and related services by the principal accountant that are reasonably related to the performance of the audit of the registrant’s financial statements and are not reported in Audit Fees above. In both fiscal years 2009 and 2008, Audit-Related Fees consist of agreed-upon procedures performed for semi-annual shareholder reports. Fiscal year 2008 also includes Audit-Related Fees for agreed-upon procedures related to fund accounting and custody conversions.
During the fiscal years ended March 31, 2009 and March 31, 2008, there were no Audit-Related Fees billed by the registrant’s principal accountant to the registrant’s investment adviser (not including any sub-adviser whose role is primarily portfolio management and is subcontracted with or overseen by another investment adviser) and any entity controlling, controlled by, or under common control with the adviser that provides ongoing services to the registrant for an engagement that related directly to the operations and financial reporting of the registrant.
(c) Tax Fees. Aggregate Tax Fees billed by the principal accountant to the registrant for professional services rendered during the fiscal years ended March 31, 2009 and March 31, 2008 are approximately as follows:
Tax Fees include amounts for the review of annual tax returns, the review of required shareholder distribution calculations and typically include amounts for professional services by the principal accountant for tax compliance, tax advice and tax planning. Fiscal year 2008 tax fees also include the review of foreign tax filings.
During the fiscal years ended March 31, 2009 and March 31, 2008, there were no Tax Fees billed by the registrant’s principal accountant to the registrant’s investment adviser (not including any sub-adviser whose role is primarily portfolio management and is subcontracted with or overseen by another investment adviser) and any entity controlling, controlled by, or under common control with the adviser that provides ongoing services to the registrant for an engagement that related directly to the operations and financial reporting of the registrant.
(d) All Other Fees. Aggregate All Other Fees billed by the principal accountant to the registrant for professional services rendered during the fiscal years ended March 31, 2009 and March 31, 2008 are approximately as follows:
All Other Fees include amounts for products and services provided by the principal accountant, other than the services reported in paragraphs (a) through (c) above.
Aggregate All Other Fees billed by the registrant’s principal accountant to the registrant’s investment adviser (not including any sub-adviser whose role is primarily portfolio management and is subcontracted with or overseen by another investment adviser) and any entity controlling, controlled by, or under common control with the adviser that provides ongoing services to the registrant for an engagement that related directly to the operations and financial reporting of the registrant during the fiscal years ended March 31, 2009 and March 31, 2008 are approximately as follows:
| | |
2009 | | 2008 |
$886,800 | | $960,800 |
In both fiscal years 2009 and 2008, All Other Fees consist of fees billed for internal control examinations of the registrant’s transfer agent and investment advisor.
(e)(1) Audit Committee Pre-Approval Policies and Procedures
The registrant’s Audit Committee is required to pre-approve the engagement of the registrant’s independent accountants to provide audit and non-audit services to the registrant and non-audit services to its investment adviser (not including any sub-adviser whose role is primarily portfolio management and is subcontracted with or overseen by another investment adviser) or any entity controlling, controlled by or under common control with such investment adviser that provides ongoing services to the registrant (“Adviser Affiliates”), if the engagement relates directly to the operations and financial reporting of the registrant.
The Audit Committee has adopted a Policy for Engagement of Independent Accountants for Audit and Non-Audit Services (“Policy”). The Policy sets forth the understanding of the Audit Committee regarding the engagement of the registrant’s independent accountants to provide (i) audit and permissible audit-related, tax and other services to the registrant (collectively “Fund Services”); (ii) non-audit services to the registrant’s investment adviser (not including any sub-adviser whose role is primarily portfolio management and is subcontracted with or overseen by another investment adviser) and Adviser Affiliates, if the engagement relates directly to the operations or financial reporting of a Fund (collectively “Fund-related Adviser Services”); and (iii) certain other audit and non-audit services to the registrant’s investment adviser (not including any sub-adviser whose role is primarily portfolio management and is subcontracted with or overseen by another investment adviser) and Adviser Affiliates. Unless a type of service receives general pre-approval under the Policy, it requires specific pre-approval by the Audit Committee if it is to be provided by the independent accountants. Pre-approval of non-audit services to the registrant, the registrant’s investment adviser (not including any sub-adviser whose role is primarily portfolio management and is subcontracted with or overseen by another investment adviser) and Adviser Affiliates may be waived provided that the “de minimis” requirements set forth under paragraph (c)(7)(i)(C) of Rule 2-01 of Regulation S-X are met.
Under the Policy, the Audit Committee may delegate pre-approval authority to any pre-designated member or members who are Independent Trustees/Directors. The member(s) to whom such authority is delegated must report, for informational purposes only, any pre-approval decisions to the Audit Committee at its next regular meeting. The Audit Committee’s responsibilities with respect to the pre-approval of services performed by the independent accountants may not be delegated to management.
The Policy requires the Fund Treasurer and/or Director of Board Administration to submit to the Audit Committee, on an annual basis, a schedule of the types of services that are subject to general pre-approval. The schedule(s) provide a description of each type of service that is subject to general pre-approval and, where possible, will provide estimated fee caps for each instance of providing each service. The Audit Committees will review and approve the types of services and review the projected fees for the next fiscal year and may add to, or subtract from, the list of general pre-approved services from time to time based on subsequent determinations. That approval acknowledges that the Audit Committee is in agreement with the specific types of services that the independent accountants will be permitted to perform.
The Fund Treasurer and/or Director of Board Administration shall report to the Audit Committee at each of its regular meetings regarding all Fund Services or Fund-related Adviser Services initiated since the last such report was rendered, including a general description of the services, actual billed and projected fees, and the means by which such Fund Services or Fund-related Adviser Services were pre-approved by the Audit Committee.
*****
(e)(2) The percentage of services described in paragraphs (b) through (d) of this Item approved pursuant to the “de minimis” exception under paragraph (c)(7)(i)(C) of Rule 2-01 of Regulation S-X during both fiscal years ended March 31, 2009 and March 31, 2008 was zero.
(f) Not applicable.
(g) The aggregate non-audit fees billed by the registrant’s accountant for services rendered to the registrant, and rendered to the registrant’s investment adviser (not including any sub-adviser whose role is primarily portfolio management and is subcontracted with or overseen by another investment adviser), and any entity controlling, controlled by, or under common control with the adviser that provides ongoing services to the registrant for the fiscal years ended March 31, 2009 and March 31, 2008 are approximately as follows:
| | |
2009 | | 2008 |
$1,034,400 | | $1,151,000 |
(h) The registrant’s Audit Committee of the Board of Directors has considered whether the provision of non-audit services that were rendered to the registrant’s adviser (not including any sub-adviser whose role is primarily portfolio management and is subcontracted with or overseen by another investment adviser), and any entity controlling, controlled by, or under common control with the investment adviser that provides ongoing services to the registrant that were not pre-approved pursuant to paragraph (c)(7)(ii) of Rule 2-01 of Regulation S-X, is compatible with maintaining the principal accountant’s independence.
Item 5. Audit Committee of Listed Registrants.
Not applicable.
Item 6. Investments
| | (a) | The registrant’s “Schedule I – Investments in securities of unaffiliated issuers” (as set forth in 17 CFR 210.12-12) is included in Item 1 of this Form N-CSR. |
Item 7. Disclosure of Proxy Voting Policies and Procedures for Closed-End Management Investment Companies.
Not applicable.
Item 8. Portfolio Managers of Closed-End Management Investment Companies.
Not applicable.
Item 9. Purchases of Equity Securities by Closed-End Management Investment Company and Affiliated Purchasers.
Not applicable.
Item 10. Submission of Matters to a Vote of Security Holders.
There have not been any material changes to the procedures by which shareholders may recommend nominees to the registrant’s board of directors, since those procedures were last disclosed in response to requirements of Item 407(c)(2)(iv) of Regulation S-K (as required by Item 22(b)(15) of Schedule 14A) or this Item.
Item 11. Controls and Procedures.
| | (a) | The registrant’s principal executive officer and principal financial officers, based on their evaluation of the registrant’s disclosure controls and procedures as of a date within 90 days of the filing of this report, have concluded that such controls |
and procedures are adequately designed to ensure that information required to be disclosed by the registrant in Form N-CSR is accumulated and communicated to the registrant’s management, including the principal executive officer and principal financial officer, or persons performing similar functions, as appropriate to allow timely decisions regarding required disclosure.
| | (b) | There was no change in the registrant’s internal control over financial reporting that occurred during the registrant’s second fiscal quarter of the period covered by this report that has materially affected, or is reasonably likely to materially affect, the registrant’s internal control over financial reporting. |
Item 12. Exhibits.
(a)(1) Code of ethics required to be disclosed under Item 2 of Form N-CSR attached hereto as Exhibit 99.CODE ETH.
(a)(2) Certifications pursuant to Rule 30a-2(a) under the Investment Company Act of 1940 (17 CFR 270.30a-2(a)) attached hereto as Exhibit 99.CERT.
(a)(3) Not applicable.
(b) Certification pursuant to Rule 30a-2(b) under the Investment Company Act of 1940 (17 CFR 270.30a-2(b)) attached hereto as Exhibit 99.906CERT.
SIGNATURES
Pursuant to the requirements of the Securities Exchange Act of 1934 and the Investment Company Act of 1940, the registrant has duly caused this report to be signed on its behalf by the undersigned, thereunto duly authorized.
| | |
(registrant) | | Columbia Funds Series Trust I |
| | |
By (Signature and Title) | | /s/ J. Kevin Connaughton |
| | J. Kevin Connaughton, President |
Pursuant to the requirements of the Securities Exchange Act of 1934 and the Investment Company Act of 1940, this report has been signed below by the following persons on behalf of the registrant and in the capacities and on the dates indicated.
| | |
By (Signature and Title) | | /s/ J. Kevin Connaughton |
| | J. Kevin Connaughton, President |
| | |
By (Signature and Title) | | /s/ Michael G. Clarke |
| | Michael G. Clarke, Chief Financial Officer |