UNITED STATES
SECURITIES AND EXCHANGE COMMISSION
Washington, D.C. 20549
FORM N-CSR
CERTIFIED SHAREHOLDER REPORT OF REGISTERED
MANAGEMENT INVESTMENT COMPANIES
Investment Company Act file number | 811-04367 |
|
Columbia Funds Series Trust I |
(Exact name of registrant as specified in charter) |
|
One Financial Center, Boston, Massachusetts | | 02111 |
(Address of principal executive offices) | | (Zip code) |
|
James R. Bordewick, Jr., Esq. Columbia Management Advisors, LLC One Financial Center Boston, MA 02111 |
(Name and address of agent for service) |
|
Registrant’s telephone number, including area code: | 1-617-426-3750 | |
|
Date of fiscal year end: | May 31 | |
|
Date of reporting period: | May 31, 2009 | |
| | | | | | | | |
Form N-CSR is to be used by management investment companies to file reports with the Commission not later than 10 days after the transmission to stockholders of any report that is required to be transmitted to stockholders under Rule 30e-1 under the Investment Company Act of 1940 (17 CFR 270.30e-1). The Commission may use the information provided on Form N-CSR in its regulatory, disclosure review, inspection, and policymaking roles.
A registrant is required to disclose the information specified by Form N-CSR, and the Commission will make this information public. A registrant is not required to respond to the collection of information contained in Form N-CSR unless the Form displays a currently valid Office of Management and Budget (“OMB”) control number. Please direct comments concerning the accuracy of the information collection burden estimate and any suggestions for reducing the burden to Secretary, Securities and Exchange Commission, 450 Fifth Street, NW, Washington, DC 20549-0609. The OMB has reviewed this collection of information under the clearance requirements of 44 U.S.C. § 3507.
Item 1. Reports to Stockholders.
Columbia Management®
Annual Report
May 31, 2009
Columbia Strategic Income Fund
| NOT FDIC INSURED | | May Lose Value | |
|
| NOT BANK ISSUED | | No Bank Guarantee | |
|
Table of contents
| Fund Profile | | | 1 | | |
|
| Economic Update | | | 2 | | |
|
| Performance Information | | | 3 | | |
|
| Understanding Your Expenses | | | 4 | | |
|
| Portfolio Managers' Report | | | 5 | | |
|
| Financial Statements | | | | | |
|
| Investment Portfolio | | | 7 | | |
|
Statement of Assets and
Liabilities | | | 24 | | |
|
| Statement of Operations | | | 26 | | |
|
Statement of Changes in
Net Assets | | | 27 | | |
|
| Financial Highlights | | | 29 | | |
|
| Notes to Financial Statements | | | 34 | | |
|
| Report of Independent Registered Public Accounting Firm | | | 45 | | |
|
| Fund Governance | | | 46 | | |
|
Important Information About
This Report | | | 53 | | |
|
The views expressed in this report reflect the current views of the respective parties. These views are not guarantees of future performance and involve certain risks, uncertainties and assumptions that are difficult to predict, so actual outcomes and results may differ significantly from the views expressed. These views are subject to change at any time based upon economic, market or other conditions and the respective parties disclaim any responsibility to update such views. These views may not be relied on as investment advice and, because investment decisions for a Columbia Fund are based on numerous factors, may not be relied on as an indication of trading intent on behalf of any particular Columbia Fund. References to specific securities should not be construed as a recommendation or investment advice.
President's Message

Dear Shareholder:
Recent events have shown great volatility in the markets and uncertainty in the economy. During these challenging times, it becomes even more important to focus on long-term horizons and key investment tools that can help manage volatility. This may be the time to reflect on your investment goals and evaluate your portfolio to ensure you are positioned for any potential market rebound.
A long-term financial plan can serve as a road map and guide you through the necessary steps designed to meet your financial goals. Your financial plan should take into account your investment goals, time horizon, overall financial situation, risk tolerance and willingness to ride out market volatility. Your investment professional can be a key resource as you work through this process. The knowledge and experience of an investment professional can help as you create or reevaluate your investment strategy.
The importance of diversification
Although diversification does not ensure a profit or guarantee against loss, a diversified portfolio can be a strategy for successful long-term investing. Diversification refers to the mix of investments within a portfolio. A mutual fund can contribute to portfolio diversification given that a mutual fund's portfolio represents several investments. Additionally, the way you allocate your money among stocks, bonds and cash, and geographically between foreign and domestic investments, can help to reduce risks. Diversification can result in multiple investments where the positive performance of certain holdings can offset any negative performance from other holdings. Having a diversified portfolio doesn't mean that the value of the portfolio will never go down, but rather helps strike a balance between risk and reward.
Reevaluate your strategy
An annual review of your investments is a key opportunity to determine if your investment needs have changed or if you need minor adjustments to rebalance your portfolio. Life events like a birth, marriage, home improvement, or change in employment can have a major effect on your spending and goals. Ask yourself how your spending or goals have changed and factor this into your financial plan. Are you using automated investments or payroll deductions to help keep your savings on track? Are you able to set aside additional savings or increase your 401(k) plan contributions? If during your review you find that your investments in any one category (e.g., stocks, bonds or cash) have grown too large based on your diversification plan, you may want to consider redirecting future investments to get back on track.
History has shown that the U.S. stock market has been remarkably resilient1. Volatility can lead to opportunity. Patience and a commitment to your long-term financial plan may position you to potentially benefit over your investment horizon. We appreciate your business and continued support of Columbia Funds.
Sincerely,

J. Kevin Connaughton
President, Columbia Funds
1The Dow Jones Industrial Average is the most widely used indicator of the overall condition of the stock market. The Dow Jones Industrial Average Index is a price-weighted average of 30 actively traded blue-chip stocks as selected by the editors of the Wall Street Journal. Indices are not investments, do not incur fees or expenses and are not professionally managed. It is not possible to invest directly in an index.
Fund Profile – Columbia Strategic Income Fund
Summary
g For the 12-month period that ended May 31, 2009, the fund's Class A shares returned negative 1.79% without sales charge.
g The fund came out behind its benchmark, the Barclays Capital U.S. Government/Credit Bond Index (formerly the Lehman Brothers U.S. Government/Credit Bond Index),1 but ahead of its peer group, the Lipper Multi-Sector Income Funds Classification.2
g High-yield debt and currency exposure hampered returns versus the fund's benchmark, while a high quality bias helped the fund outpace its peer group.
Portfolio Management
Laura A. Ostrander, lead manager of the fund, has managed or co-managed the fund since 2000 and has been associated with the advisor or its predecessors or affiliate organizations since 1996.
Kevin L. Cronk has co-managed the fund since 2005 and has been associated with the advisor or its predecessors or affiliate organizations since 1999.
1The Barclays Capital U.S. Government/Credit Bond Index is composed of high-quality, investment-grade U.S. Government and corporate fixed-income securities with maturities greater than one year. Indices are not available for investment, are not professionally managed and do not reflect sales charges, fees, brokerage commissions, taxes or other expenses of investing. Securities in the fund may not match those in an index.
2Lipper Inc., a widely respected data provider in the industry, calculates an average total return (assuming reinvestment of distributions) for mutual funds with investment objectives similar to those of the fund. Lipper makes no adjustments for the effect of sales loads.
Performance data quoted represents past performance and current performance may be lower or higher. Past performance is no guarantee of future results. The investment return and principal value will fluctuate so that shares, when redeemed, may be worth more or less than the original cost. Please visit www.columbiafunds.com for daily and most recent month-end performance updates.
Summary
1-year return as of 05/31/09
| | | –1.79% | |
|
| |  | | | Class A shares
(without sales charge) | |
|
| | | +4.47% | |
|
| |  | | | Barclays Capital U.S. Government/Credit Bond Index | |
|
Morningstar Style BoxTM
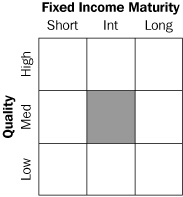
The Morningstar Style BoxTM reveals a fund's investment strategy. For fixed-income funds, the vertical axis shows the average credit quality of the bonds owned, and the horizontal axis shows interest rate sensitivity as measured by a bond's duration (short, intermediate or long). Information shown is based on the most recent data provided by Morningstar.
1
Economic Update – Columbia Strategic Income Fund
Summary
For the 12-month period that ended May 31, 2009
g Despite volatility in many segments of the bond market, the Barclays Capital U.S. Aggregate Bond Index delivered positive results. High-yield bonds lost ground, as measured by the JPMorgan Global High Yield Index
Barclays
Aggregate
Index | | JPMorgan Global
High Yield
Index | |
|
 | |  | |
|
g The broad U.S. stock market, as measured by the S&P 500 Index, returned negative 32.57%. Stock markets in foreign developed markets returned negative 36.61%, as measured (in U.S. dollars) by the MSCI EAFE Index.
| S&P Index | | MSCI Index | |
|
 | |  | |
|
During the 12-month period that began June 1, 2008 and ended May 31, 2009, the U.S. economy struggled under the weight of the worst financial crisis since the Great Depression. Economic growth contracted by more than 6% in the second half of 2008. Although the decline for the first half of 2009 appears to have been less severe, hopes for a late 2009 recovery remain in doubt. The lapse from growth has resulted in the longest—and most severe—recession in nearly three decades.
The labor market shed millions of jobs between 2008 and 2009, raising the unemployment rate to 9.4% in May. Manufacturing activity slowed and consumer spending declined. The beleaguered housing market continued to lose ground as prices fell and inventories rose. However, mortgage purchase applications increased late in the period, buoyed by low interest rates and an $8,000 first-time home buyer tax credit. Late in 2008, consumer confidence, as measured by the Conference Board, plummeted to its lowest point ever. However, it stabilized in March and turned sharply higher in both April and May of 2009.
Troubles that began in the U.S. subprime mortgage market resulted in a meltdown within the U.S. financial sector that claimed several major institutions in 2008 and led others to seek bailouts, restructuring or both. New rigorous lending standards severely limited access to credit, further hampering economic growth. In this environment, a new administration sought to stabilize the financial system, address economic woes and introduce sweeping health care reform. Stimulus spending began to flow into the economy, raising hopes that growth would be restored in the second half of 2009. However, with much of the developed world in recession, any substantial improvement in economic conditions may be longer in coming. In December 2008, the Federal Reserve Board (the Fed) lowered a key short-term borrowing rate—the federal funds rate—to between zero and 0.25%—a record low. In light of protracted economic weakness, the Fed is unlikely to tighten its reins on money until the economy and the labor markets stabilize.
Bonds outperformed stocks
As investors sought refuge from a volatile stock market, the highest quality sectors of the U.S. bond market delivered modest gains. During the first half of the period, Treasury prices rose and yields declined sharply as the economy faltered and stock market volatility increased. As hopes for a recovery materialized in the second half of the period, yields rose and Treasuries lagged riskier segments of the bond market. The benchmark 10-year U.S. Treasury yield began the period at just over 4.0%, declined to 2.2% in December 2008 then rose to end the period at 3.4%. In this environment, the Barclays Capital U.S. Aggregate Bond Index1 returned 5.36%. High-yield bond prices fell sharply as economic prospects weakened and default fears rose in 2008, then rebounded strongly in 2009. For the 12-month period, the JPMorgan Global High Yield Index2 returned negative 9.53%. For the last six months of the period, the index gained 31.70%.
Stocks retreated, then rebounded
Against a weakening economic backdrop, the U.S. stock market lost 32.57% for the 12-month period, as measured by the S&P 500 Index.3 Losses affected the stocks of companies of all sizes and investment style categories, although growth stocks held up better than value stocks, as measured by their respective Russell indices.4 Stock markets outside the U.S. suffered even greater losses. The MSCI EAFE Index,5 a broad gauge of stock market performance in foreign developed markets, lost 36.61% (in U.S. dollars) for the period. Emerging stock markets, which generally have had a strong run over the past several years, were also caught in the downdraft. As investors backed away from risk, the MSCI Emerging Markets Index6 returned negative 34.36% (in U.S. dollars).
Past performance is no guarantee of future results.
1The Barclays Capital U.S. Aggregate Bond Index is a market value-weighted index that tracks the daily price, coupon, pay-downs and total return performance of fixed-rate, publicly placed, dollar-denominated and non-convertible investment-grade debt issues with at least $250 million par amount outstanding and with at least one year to final maturity.
2The JPMorgan Global High Yield Index is designed to mirror the investable universe of the U.S. dollar global high-yield corporate debt market, including domestic and international issues.
3The Standard & Poor's (S&P) 500 Index tracks the performance of 500 widely held, large-capitalization U.S. stocks.
4The Russell 1000 Growth Index measures the performance of those Russell 1000 Index companies with higher price-to-book ratios and higher forecasted growth values. The Russell 1000 Value Index measures the performance of those companies in the Russell 1000 Index with lower price-to-book ratios and lower forecasted growth values. The Russell 2000 Growth Index measures the performance of those Russell 2000 Index companies with higher price-to-book ratios and higher forecasted growth values. The Russell 2000 Value Index measures the performance of those Russell 2000 Index companies with lower price-to-book ratios and lower forecasted growth values. The Russell 3000 Growth Index measures the performance of those Russell 3000 Index companies with higher price-to-book ratios and higher forecasted growth values. The Russell 3000 Value Index measures the performance of those Russell 3000 Index companies with lower price-to-bo ok ratios and lower forecasted growth values. The Russell Midcap Growth Index measures the performance of those Russell Midcap companies with higher price-to-book ratios and higher forecasted growth values. The Russell Midcap Value Index measures the performance of those Russell Midcap Index companies with lower price-to-book ratios and lower forecasted growth values.
5The Morgan Stanley Capital International (MSCI) Europe, Australasia, Far East (EAFE) Index is a free float-adjusted market capitalization index that is designed to measure developed market equity performance excluding the U.S. and Canada.
6The MSCI Emerging Markets Index is composed of a sample of companies from 22 countries representing the global emerging stock markets.
Indices are not available for investment, are not professionally managed and do not reflect sales charges, fees, brokerage commissions, taxes or other expenses of investing. Securities in the fund may not match those in an index.
2
Performance Information – Columbia Strategic Income Fund
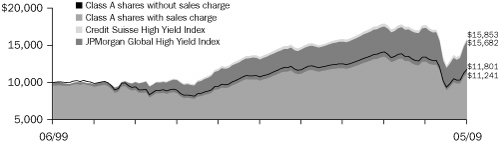
Performance of a $10,000 investment 06/01/99 – 05/31/09
The chart above shows the change in value of a hypothetical $10,000 investment in Class A shares of Columbia Strategic Income Fund during the stated time period, and does not reflect the deduction of taxes that a shareholder may pay on fund distributions or on the redemption of fund shares. The Barclays Capital U.S. Government/Credit Bond Index is composed of high-quality, investment-grade U.S. Government and corporate fixed-income securities with maturities greater than one year. Indices are not available for investment, are not professionally managed and do not reflect sales charges, fees, brokerage commissions, taxes or other expenses of investing. Securities in the fund may not match those in an index.
Performance of a $10,000 investment 06/01/99 – 05/31/09 ($)
| Sales charge | | without | | with | |
| Class A | | | 16,761 | | | | 15,965 | | |
| Class B | | | 15,578 | | | | 15,578 | | |
| Class C | | | 15,835 | | | | 15,835 | | |
| Class J | | | 16,166 | | | | 15,681 | | |
| Class Z | | | 17,113 | | | | n/a | | |
Performance data quoted represents past performance and current performance may be lower or higher. Past performance is no guarantee of future results. The investment return and principal value will fluctuate so that shares, when redeemed, may be worth more or less than the original cost. Please visit www.columbiafunds.com for daily and most recent month-end performance updates.
Annual operating expense ratio (%)*
| Class A | | | 0.96 | | |
| Class B | | | 1.71 | | |
| Class C | | | 1.71 | | |
| Class J | | | 1.39 | | |
| Class Z | | | 0.71 | | |
* The annual operating expense ratio is as stated in the fund's prospectus that is current as of the date of this report. Differences in expense ratios disclosed elsewhere in this report may result from including fee waivers and expense reimbursements as well as different time periods used in calculating the ratios.
Average annual total return as of 05/31/09 (%)
| Share class | | A | | B | | C | | J | | Z | |
| Inception | | 04/21/77 | | 05/15/92 | | 07/01/97 | | 11/02/98 | | 01/29/99 | |
| Sales charge | | without | | with | | without | | with | | without | | with | | without | | with | | without | |
| 1-year | | | –1.79 | | | | –6.46 | | | | –2.52 | | | | –7.09 | | | | –2.21 | | | | –3.12 | | | | –2.22 | | | | –5.15 | | | | –1.38 | | |
| 5-year | | | 4.88 | | | | 3.87 | | | | 4.10 | | | | 3.80 | | | | 4.29 | | | | 4.29 | | | | 4.46 | | | | 3.83 | | | | 5.15 | | |
| 10-year | | | 5.30 | | | | 4.79 | | | | 4.53 | | | | 4.53 | | | | 4.70 | | | | 4.70 | | | | 4.92 | | | | 4.60 | | | | 5.52 | | |
Average annual total return as of 06/30/09 (%)
| Share class | | A | | B | | C | | J | | Z | |
| Sales charge | | without | | with | | without | | with | | without | | with | | without | | with | | without | |
| 1-year | | | 0.42 | | | | –4.35 | | | | –0.33 | | | | –5.01 | | | | –0.19 | | | | –1.13 | | | | –0.20 | | | | –3.20 | | | | 0.67 | | |
| 5-year | | | 4.92 | | | | 3.91 | | | | 4.14 | | | | 3.84 | | | | 4.29 | | | | 4.29 | | | | 4.46 | | | | 3.83 | | | | 5.19 | | |
| 10-year | | | 5.43 | | | | 4.92 | | | | 4.65 | | | | 4.65 | | | | 4.80 | | | | 4.80 | | | | 5.01 | | | | 4.69 | | | | 5.62 | | |
The "with sales charge" returns include the maximum initial sales charge of 4.75% for Class A shares and 3.00% for Class J shares and the applicable contingent deferred sales charge of 5.00% in the first year declining to 1.00% in the sixth year and eliminated thereafter for Class B shares and 1.00% for Class C shares for the first year only. The "without sales charge" returns do not include the effect of sales charges. If they had, returns would be lower.
Performance results reflect any fee waivers or reimbursements of fund expenses by the investment advisor and/or any of its affiliates. Absent these fee waivers or expense reimbursement arrangements, performance results would have been lower.
All results shown assume reinvestment of distributions. Class Z shares are sold at net asset value with no distribution and service (Rule 12b-1) fees. Class Z shares have limited eligibility and the investment minimum requirements may vary. Please see the fund's prospectus for details. Performance for different share classes will vary based on differences in sales charges and fees associated with each class.
The tables do not reflect the deduction of taxes that a shareholder may pay on fund distributions or on the redemption of fund shares.
3
Understanding Your Expenses – Columbia Strategic Income Fund
Estimating your actual expenses
To estimate the expenses that you paid over the period, first you will need your account balance at the end of the period:
g For shareholders who receive their account statements from Columbia Management Services, Inc., your account balance is available online at www.columbiafunds.com or by calling Shareholder Services at 800.345.6611.
g For shareholders who receive their account statements from their financial intermediary, contact your financial intermediary to obtain your account balance.
1. Divide your ending account balance by $1,000. For example, if an account balance was $8,600 at the end of the period, the result would be 8.6.
2. In the section of the table below titled "Expenses paid during the period," locate the amount for your share class. You will find this number in the column labeled "Actual." Multiply this number by the result from step 1. Your answer is an estimate of the expenses you paid on your account during the period.
If the value of your account falls below the minimum initial investment requirement applicable to you, your account generally will be subject to a $20 annual fee. This fee is not included in the accompanying table. If you are subject to the fee, keep it in mind when you are estimating the ongoing expenses of investing in the fund and when comparing the expenses of this fund with other funds.
As a fund shareholder, you incur two types of costs. There are transaction costs, which generally include sales charges on purchases and may include redemption fees or exchange fees. There are also ongoing costs, which generally include investment advisory fees, distribution and service (Rule 12b-1) fees and other fund expenses. The information on this page is intended to help you understand the ongoing costs of investing in the fund and to compare these costs with the ongoing costs of investing in other mutual funds.
Analyzing your fund's expenses by share class
To illustrate these ongoing costs, we have provided an example and calculated the expenses paid by investors in each share class during the period. The information in the following table is based on an initial investment of $1,000, which is invested at the beginning of the period and held for the entire period. Expense information is calculated two ways and each method provides you with different information. The amount listed in the "Actual" column is calculated using the fund's actual operating expenses and total return for the period. The amount listed in the "Hypothetical" column for each share class assumes that the return each year is 5% before expenses and is calculated based on the fund's actual operating expenses. You should not use the hypothetical account values and expenses to estimate either your actual account balance at the end of the period or the expenses you paid during this period.
Compare with other funds
Since all mutual funds are required to include the same hypothetical calculations about expenses in shareholder reports, you can use this information to compare the ongoing cost of investing in the fund with other funds. To do so, compare the 5% hypothetical example with the 5% hypothetical examples that appear in the shareholder reports of other funds. As you compare hypothetical examples of other funds, it is important to note that hypothetical examples are meant to highlight the ongoing costs of investing in a fund and do not reflect any transaction costs, such as sales charges, redemption fees or exchange fees.
12/01/08 – 05/31/09
| | | Account value at the
beginning of the period ($) | | Account value at the
end of the period ($) | | Expenses paid
during the period ($) | | Fund's annualized
expense ratio (%) | |
| | | Actual | | Hypothetical | | Actual | | Hypothetical | | Actual | | Hypothetical | | Actual | |
| Class A | | | 1,000.00 | | | | 1,000.00 | | | | 1,114.59 | | | | 1,019.90 | | | | 5.32 | | | | 5.09 | | | | 1.01 | | |
| Class B | | | 1,000.00 | | | | 1,000.00 | | | | 1,110.50 | | | | 1,016.16 | | | | 9.26 | | | | 8.85 | | | | 1.76 | | |
| Class C | | | 1,000.00 | | | | 1,000.00 | | | | 1,113.29 | | | | 1,016.95 | | | | 8.43 | | | | 8.05 | | | | 1.60 | | |
| Class J | | | 1,000.00 | | | | 1,000.00 | | | | 1,112.69 | | | | 1,017.10 | | | | 8.27 | | | | 7.90 | | | | 1.57 | | |
| Class Z | | | 1,000.00 | | | | 1,000.00 | | | | 1,117.18 | | | | 1,021.14 | | | | 4.01 | | | | 3.83 | | | | 0.76 | | |
Expenses paid during the period are equal to the annualized expense ratio for the share class, multiplied by the average account value over the period, then multiplied by the number of days in the fund's most recent fiscal half-year and divided by 365.
Had the investment advisor and/or any of its affiliates not waived fees or reimbursed a portion of expenses for Class C shares, Class C share account value at the end of the period would have been reduced.
It is important to note that the expense amounts shown in the table are meant to highlight only ongoing costs of investing in the fund and do not reflect any transaction costs, such as sales charges, redemption fees or exchange fees. Therefore, the hypothetical examples provided may not help you determine the relative total costs of owning shares of different funds. If these transaction costs were included, your costs would have been higher.
4
Portfolio Managers' Report – Columbia Strategic Income Fund
For the 12-month period that ended May 31, 2009, the fund's Class A shares returned negative 1.79% without sales charge. The fund held up better than the negative 6.05% average return of its peer group, the Lipper Multi-Sector Income Funds Classification.1 We believe the fund outperformed its peer group average because it had a larger allocation to higher quality, interest rate sensitive securities, such as U.S. Treasuries and developed country foreign bonds, and little exposure to commercial mortgage-backed securities (CMBS) or asset-backed securities (ABS) relative to many of its peers. The fund's performance lagged the 4.47% return of its benchmark, the Barclays Capital U.S. Government/Credit Bond Index,2 because of the fund's high-yield bond and currency exposure, neither of which are represented in the index.
Shifting market conditions
During the first half of the 12-month reporting period, an unfolding economic slowdown and worsening financial crisis dominated news headlines. Investors fled to higher quality assets, including U.S. and developed market foreign government debt, while the U.S. dollar and Japanese yen strengthened against most currencies. However, the tide shifted dramatically in 2009 as signs of an economic bottom encouraged investors to move out of Treasury bonds and into riskier assets. Massive new issuance also pushed Treasury yields up and their prices down. Sectors that had been laggards in the first half of the period—including high-yield and emerging market debt—became the winners in the second half, while the U.S. dollar and Japanese yen weakened against most other currencies. Despite this reversal, higher quality assets ended the year-long reporting period ahead of lower quality bonds with the 10-year Treasury bond returning 8 .5%, compared to a roughly 10% decline for the JPMorgan Global High Yield Index.3
Biggest gains from high quality bias
The fund benefited from having a larger stake than the Lipper peer group in higher quality assets, with over 30% of assets in U.S. government bonds and cash. Within the U.S. government bond sector, the fund owned U.S. Treasuries along with some government agency mortgage-backed securities. A sizable (18% or more) stake in developed market foreign government debt also helped, as the sector held up well versus lower quality bonds. The fund's non-U.S. developed market bond returns, with the notable exception of yen-denominated Japanese bonds, however, underperformed the sector due to currency exposure.
Negative impact from high-yield and currency exposure
Even though we selectively reduced high-yield exposure in the second half of 2008, the sector accounted for just over 30% of assets at the end of the period and, in a difficult environment for high yield, detracted from returns. Currency exposure further detracted from relative performance as the value of most currencies, except the
1Lipper Inc., a widely respected data provider in the industry, calculates an average total return (assuming reinvestment of distributions) for mutual funds with investment objectives similar to those of the fund. Lipper makes no adjustments for the effect of sales loads.
2The Barclays Capital U.S Government /Credit Bond Index is composed of high-quality, investment-grade U.S. Government and corporate fixed-income securities with maturities greater than one year.
3The JPMorgan Global High Yield Index, an unmanaged index that is designed to mirror the investable universe of the U.S. dollar global high yield corporate debt market, including domestic and international issues. Indices are not available for investment, are not professionally managed and do not reflect sales charges, fees, brokerage commissions, taxes or other expenses of investing. Securities in the fund may not match those in an index.
Performance data quoted represents past performance and current performance may be lower or higher. Past performance is no guarantee of future results. The investment return and principal value will fluctuate so that shares, when redeemed, may be worth more or less than the original cost. Please visit www.columbiafunds.com for daily and most recent month-end performance updates.
Net asset value per share
as of 05/31/09 ($)
| Class A | | | 5.40 | | |
| Class B | | | 5.40 | | |
| Class C | | | 5.41 | | |
| Class J | | | 5.38 | | |
| Class Z | | | 5.35 | | |
Distributions declared per share
06/01/08 – 05/31/09 ($)
| Class A | | | 0.39 | | |
| Class B | | | 0.35 | | |
| Class C | | | 0.35 | | |
| Class J | | | 0.36 | | |
| Class Z | | | 0.40 | | |
30-day SEC yields
as of 05/31/09 (%)
| Class A | | | 5.29 | | |
| Class B | | | 4.80 | | |
| Class C | | | 4.95 | | |
| Class J | | | 4.51 | | |
| Class Z | | | 5.79 | | |
The 30-day SEC yields reflect the fund's earning power net of expenses, expressed as an annualized percentage of the public offering price per share at the end of the period.
5
Portfolio Managers' Report (continued) – Columbia Strategic Income Fund
Maturity breakdown
as of 05/31/09 (%)
| 0-1 year | | | 2.3 | | |
| 1-3 years | | | 16.2 | | |
| 3-5 years | | | 14.0 | | |
| 5-7 years | | | 23.6 | | |
| 7-10 years | | | 13.5 | | |
| 10-15 years | | | 5.3 | | |
| 15-20 years | | | 4.4 | | |
| 20-30 years | | | 12.2 | | |
| 30 years and over | | | 1.4 | | |
| Other | | | 7.1 | | |
Portfolio structure
as of 05/31/09 (%)
Corporate fixed-income
bonds & notes | | | 38.3 | | |
Foreign government
obligations | | | 31.4 | | |
U.S. government
obligations | | | 16.3 | | |
| Mortgage-backed securities | | | 7.1 | | |
| Asset-backed securities | | | 0.3 | | |
Commerical mortgage-backed
securities | | | 0.2 | | |
| Municipal bonds | | | 0.2 | | |
| U.S. government agencies | | | 0.2 | | |
| Convertible bond | | | 0.1 | | |
Collateralized mortgage
obligation | | | 0.0 | * | |
| Preferred stock | | | 0.0 | * | |
| Warrants | | | 0.0 | * | |
| Other | | | 5.9 | | |
*Round to less than 0.1%.
Quality breakdown
as of 05/31/09 (%)
| AAA | | | 44.4 | | |
| AA | | | 3.0 | | |
| A | | | 5.2 | | |
| BBB | | | 7.4 | | |
| BB | | | 16.0 | | |
| B | | | 14.0 | | |
| CCC | | | 6.2 | | |
| CC | | | 0.5 | | |
| D | | | 0.5 | | |
| Not Rated | | | 1.5 | | |
| Other | | | 1.3 | | |
The fund is actively managed and the composition of its portfolio will change over time. Maturity breakdown, portfolio structure and quality breakdown are calculated as a percentage of total investments excluding securities lending collateral. Ratings shown in the quality breakdown represent the rating assigned to a particular bond by one of the following nationally recognized rating agencies: Standard & Poor's, a division of The McGraw-Hill Companies, Inc., Moody's Investors Service, Inc. or Fitch Ratings Ltd. Ratings are relative and subjective and are not absolute standards of quality. The fund's credit quality does not remove market risk.
Japanese yen, declined against the U.S. dollar. We reduced currency exposure during the summer and fall, but still lost ground. The fund's 10%+ stake in emerging market debt posted modest gains but hampered returns versus the index as the sector underperformed higher quality issues.
Increased stake in more credit-sensitive sectors
In early 2009, we began shifting away from interest-rate sensitive sectors and toward credit-sensitive sectors. We trimmed exposure to U.S. and developed market foreign government bonds and increased investments in high-yield and emerging market debt. We also built a small position in investment-grade corporate bonds, whose prices seemed attractive relative to both U.S. Treasuries and high-yield bonds. In the foreign government bond sector, we reduced exposure to developed market debt and increased the fund's stake in emerging markets, adding exposure to markets such as Argentina, Venezuela and Indonesia.
Selective additions due to cautious outlook
Going forward, we plan to look for opportunities to add to high-yield and emerging market holdings. However, we expect to proceed with caution until we see signs that the economy has caught up with the technical forces driving the recent price increases in riskier assets. At period end, the yield difference between lower quality bonds and U.S. Treasuries had narrowed to levels indicating that economic recovery could be underway. In fact, we believe that a sustainable recovery will not occur until banks complete the task of cleaning up their balance sheets so that they are able to increase lending and consumers reduce their own debt exposure so that they can spend to fuel economic growth.
Portfolio holdings and characteristics are subject to change periodically and may not be representative of current holdings and characteristics. The outlook for the fund may differ from those presented for other Columbia Funds.
Investing in fixed-income securities may involve certain risks, including the credit quality of individual issuers, possible prepayments, market or economic developments and yield and share price fluctuations due to changes in interest rates. When interest rates go up, bond prices typically drop, and vice versa. Investing in foreign fixed-income markets carries additional risks associated with foreign political and economic developments and changes in currency exchange rates.
Investments in high-yield bonds (sometimes referred to as "junk" bonds) offer the potential for high current income and attractive total return but involve certain risks. Changes in economic conditions or other circumstances may adversely affect a junk bond issuer's ability to make principal and interest payments. Rising interest rates tend to lower the value of all bonds. High-yield bonds issued by foreign entities have greater potential risks, including less regulation, currency fluctuations, economic instability and political developments.
Investing in emerging markets may involve greater risks than investing in more developed countries. In addition, concentration of investments in a single region may result in greater volatility.
6
Investment Portfolio – Columbia Strategic Income Fund
May 31, 2009
| Government & Agency Obligations – 47.2% | |
| | | Par (a) | | Value ($) | |
| Foreign Government Obligations – 30.9% | |
| Aries Vermoegensverwaltungs GmbH | |
| 7.750% 10/25/09 (b) | | EUR | 2,750,000 | | | | 3,970,092 | | |
| 7.750% 10/25/09 | | EUR | 2,500,000 | | | | 3,609,174 | | |
| Banco Nacional de Desenvolvimento Economico e Social | |
| 6.369% 06/16/18 (b) | | | 2,850,000 | | | | 2,885,625 | | |
| Corp. Andina de Fomento | |
| 6.375% 06/18/09 | | EUR | 4,350,000 | | | | 6,140,306 | | |
| European Investment Bank | |
| 0.400% 09/21/11 (c) | | JPY | 2,715,000,000 | | | | 28,033,743 | | |
| 1.250% 09/20/12 | | JPY | 1,135,000,000 | | | | 11,997,622 | | |
| 1.400% 06/20/17 | | JPY | 1,457,000,000 | | | | 14,990,340 | | |
| 5.500% 12/07/11 | | GBP | 5,250,000 | | | | 9,196,616 | | |
| Federal Republic of Brazil | |
| 7.375% 02/03/15 | | EUR | 6,950,000 | | | | 10,955,109 | | |
| 8.250% 01/20/34 | | | 4,700,000 | | | | 5,522,500 | | |
| 8.750% 02/04/25 | | | 4,500,000 | | | | 5,445,000 | | |
| 11.000% 08/17/40 | | | 12,400,000 | | | | 16,182,000 | | |
| 12.500% 01/05/22 | | BRL | 10,275,000 | | | | 6,005,413 | | |
| Federal Republic of Germany | |
| 5.000% 07/04/12 | | EUR | 6,585,000 | | | | 10,143,501 | | |
| 6.000% 06/20/16 | | EUR | 21,500,000 | | | | 35,433,645 | | |
| Government of Canada | |
| 4.000% 06/01/16 | | CAD | 8,300,000 | | | | 8,120,201 | | |
| 8.000% 06/01/23 | | CAD | 8,215,000 | | | | 10,856,742 | | |
| 10.250% 03/15/14 | | CAD | 2,865,000 | | | | 3,540,424 | | |
| Government of Japan | |
| 1.400% 12/20/18 | | JPY | 975,000,000 | | | | 10,204,857 | | |
| Government of New Zealand | |
| 6.000% 11/15/11 | | NZD | 6,300,000 | | | | 4,264,886 | | |
| 6.000% 12/15/17 | | NZD | 1,900,000 | | | | 1,237,006 | | |
| Instituto de Credito Oficial | |
| 0.800% 09/28/09 | | JPY | 1,380,000,000 | | | | 14,491,361 | | |
| International Finance Corp. | |
| 7.500% 02/28/13 | | AUD | 9,245,000 | | | | 7,977,269 | | |
| Japan Finance Organization for Municipal Enterprises | |
| 1.900% 06/22/18 | | JPY | 910,000,000 | | | | 9,622,209 | | |
| Kingdom of Norway | |
| 4.250% 05/19/17 | | NOK | 97,185,000 | | | | 15,628,800 | | |
| 6.000% 05/16/11 | | NOK | 72,830,000 | | | | 12,426,264 | | |
| Kingdom of Sweden | |
| 6.750% 05/05/14 | | SEK | 55,300,000 | | | | 8,601,280 | | |
| Pemex Project Funding Master Trust | |
| 2.620% 06/15/10 (c) | | | 4,750,000 | | | | 4,702,500 | | |
| 5.750% 03/01/18 | | | 10,370,000 | | | | 9,747,800 | | |
| Province of British Columbia | |
| 5.700% 06/18/29 | | CAD | 4,710,000 | | | | 4,637,479 | | |
| 9.500% 01/09/12 | | CAD | 7,150,000 | | | | 7,821,154 | | |
| Province of Quebec | |
| 6.000% 10/01/12 | | CAD | 7,155,000 | | | | 7,310,388 | | |
| | | Par (a) | | Value ($) | |
| Queensland Treasury Corp. | |
| 6.500% 04/16/12 | | AUD | 8,425,000 | | | | 7,110,517 | | |
| Republic of Argentina | |
| 8.280% 12/31/33 | | | 9,777,374 | | | | 4,228,714 | | |
| Republic of Chile | |
| 7.125% 01/11/12 | | | 3,000,000 | | | | 3,296,700 | | |
| Republic of Colombia | |
| 2.654% 11/16/15 (c) | | | 600,000 | | | | 577,500 | | |
| 7.375% 03/18/19 | | | 6,150,000 | | | | 6,519,000 | | |
| 8.125% 05/21/24 | | | 8,525,000 | | | | 9,313,562 | | |
| 9.750% 04/09/11 | | | 2,312,428 | | | | 2,474,298 | | |
| Republic of Finland | |
| 4.250% 07/04/15 | | EUR | 3,275,000 | | | | 4,851,636 | | |
| Republic of France | |
| 4.000% 04/25/13 | | EUR | 9,100,000 | | | | 13,554,596 | | |
| 4.750% 10/25/12 | | EUR | 7,700,000 | | | | 11,755,997 | | |
| 5.500% 04/25/29 | | EUR | 7,000,000 | | | | 11,120,116 | | |
| Republic of Hungary | |
| 4.750% 02/03/15 | | | 2,435,000 | | | | 2,286,173 | | |
| Republic of Indonesia | |
| 10.375% 05/04/14 (b) | | EUR | 2,700,000 | | | | 3,098,250 | | |
| Republic of Italy | |
| 4.250% 02/01/15 | | EUR | 7,765,000 | | | | 11,339,629 | | |
| 5.250% 08/01/17 | | | 3,600,000 | | | | 5,494,275 | | |
| Republic of Panama | |
| 6.700% 01/26/36 | | | 9,300,000 | | | | 8,928,000 | | |
| 8.875% 09/30/27 | | | 7,270,000 | | | | 8,578,600 | | |
| Republic of Peru | |
| 7.350% 07/21/25 | | | 5,200,000 | | | | 5,571,800 | | |
| 8.375% 05/03/16 | | | 310,000 | | | | 357,430 | | |
| 9.875% 02/06/15 | | | 9,640,000 | | | | 11,809,000 | | |
| Republic of Philippines | |
| 8.875% 03/17/15 | | | 6,615,000 | | | | 7,656,862 | | |
| Republic of Poland | |
| 4.750% 04/25/12 | | PLN | 16,100,000 | | | | 4,921,148 | | |
| 5.625% 06/20/18 | | EUR | 4,280,000 | | | | 5,901,243 | | |
| 6.250% 10/24/15 | | PLN | 35,350,000 | | | | 11,240,685 | | |
| Republic of South Africa | |
| 6.500% 06/02/14 | | | 3,650,000 | | | | 3,777,750 | | |
| 6.875% 05/27/19 | | | 1,000,000 | | | | 1,005,000 | | |
| 13.000% 08/31/09 | | ZAR | 9,073,333 | | | | 1,157,852 | | |
| 13.000% 08/31/10 | | ZAR | 1,780,000 | | | | 240,043 | | |
| 13.000% 08/31/10 | | ZAR | 9,073,334 | | | | 1,227,871 | | |
| 13.000% 08/31/11 | | ZAR | 9,073,333 | | | | 1,293,009 | | |
| Republic of Turkey | |
| 7.000% 09/26/16 | | | 555,000 | | | | 560,550 | | |
| 7.375% 02/05/25 | | | 7,330,000 | | | | 7,348,325 | | |
| Republic of Uruguay | |
PIK,
7.875% 01/15/33 | | | 8,000,000 | | | | 7,920,000 | | |
See Accompanying Notes to Financial Statements.
7
Columbia Strategic Income Fund, May 31, 2009
| Government & Agency Obligations (continued) | |
| | | Par (a) | | Value ($) | |
| Republic of Venezuela | |
| 9.250% 09/15/27 | | | 20,225,000 | | | | 12,741,750 | | |
| Russian Federation | |
| 7.500% 03/31/30 | | | 26,121,600 | | | | 26,056,296 | | |
| 12.750% 06/24/28 | | | 7,430,000 | | | | 10,736,350 | | |
| State of Qatar | |
| 6.550% 04/09/19 (b) | | | 3,000,000 | | | | 3,112,500 | | |
| United Kingdom Treasury | |
| 5.000% 03/07/25 | | GBP | 4,680,000 | | | | 8,174,041 | | |
| 8.000% 09/27/13 | | GBP | 3,100,000 | | | | 6,113,649 | | |
| 9.000% 07/12/11 | | GBP | 5,350,000 | | | | 10,025,224 | | |
| United Mexican States | |
| 5.875% 02/17/14 | | | 5,000,000 | | | | 5,270,000 | | |
| 6.050% 01/11/40 | | | 5,350,000 | | | | 5,029,000 | | |
| 8.125% 12/30/19 | | | 11,020,000 | | | | 13,003,600 | | |
| 11.375% 09/15/16 | | | 7,590,000 | | | | 10,360,350 | | |
| Foreign Government Obligations Total | | | 608,840,197 | | |
| U.S. Government Agencies – 0.2% | |
| Federal Home Loan Mortgage Corp. | |
| 6.750% 03/15/31 (d) | | | 406,000 | | | | 500,981 | | |
| Federal National Mortgage Association | |
| 4.375% 07/17/13 (d) | | | 3,003,000 | | | | 3,217,129 | | |
| U.S. Government Agencies Total | | | 3,718,110 | | |
| U.S. Government Obligations – 16.1% | |
| U.S. Treasury Bonds | |
| 5.375% 02/15/31 (d) | | | 29,000,000 | | | | 33,100,774 | | |
| 7.500% 11/15/24 (d) | | | 18,400,000 | | | | 25,256,871 | | |
| 8.875% 02/15/19 (d) | | | 21,827,000 | | | | 31,212,610 | | |
| 10.625% 08/15/15 (d) | | | 29,415,000 | | | | 42,711,492 | | |
| 12.500% 08/15/14 (d) | | | 32,151,000 | | | | 32,942,204 | | |
| U.S. Treasury Notes | |
| 4.250% 09/30/12 (d) | | | 40,000,000 | | | | 43,525,000 | | |
| 5.000% 02/15/11 (d) | | | 47,600,000 | | | | 51,017,537 | | |
| 5.125% 05/15/16 | | | 46,000,000 | | | | 52,112,986 | | |
| U.S. Treasury STRIPS | |
| (e) 05/15/23 (d) | | | 4,550,000 | | | | 2,402,773 | | |
P.O.,
(e) 11/15/13 | | | 2,250,000 | | | | 2,025,423 | | |
| U.S. Government Obligations Total | | | 316,307,670 | | |
Total Government & Agency Obligations
(cost of $913,575,146) | | | 928,865,977 | | |
| Corporate Fixed-Income Bonds & Notes – 37.8% | |
| | | Par (a) | | Value ($) | |
| Basic Materials – 3.5% | |
| Chemicals – 0.8% | |
| Agricultural Chemicals – 0.1% | |
| Terra Capital, Inc. | |
| 7.000% 02/01/17 | | | 2,490,000 | | | | 2,328,150 | | |
| | | | 2,328,150 | | |
| Chemicals-Diversified – 0.6% | |
| Huntsman International LLC | |
| 6.875% 11/15/13 (b) | | EUR | 1,165,000 | | | | 1,029,350 | | |
| 7.875% 11/15/14 | | | 3,990,000 | | | | 2,733,150 | | |
| Ineos Group Holdings PLC | |
| 8.500% 02/15/16 (b) | | | 4,285,000 | | | | 1,328,350 | | |
| INVISTA | |
| 9.250% 05/01/12 (b) | | | 4,130,000 | | | | 3,861,550 | | |
| NOVA Chemicals Corp. | |
| 6.500% 01/15/12 | | | 3,050,000 | | | | 2,775,500 | | |
| | | | 11,727,900 | | |
| Chemicals-Specialty – 0.1% | |
| Chemtura Corp. | |
| 6.875% 06/01/16 (j) | | | 2,105,000 | | | | 1,473,500 | | |
| | | | 1,473,500 | | |
| Chemicals Total | | | 15,529,550 | | |
| Forest Products & Paper – 0.6% | |
| Paper & Related Products – 0.6% | |
| Cascades, Inc. | |
| 7.250% 02/15/13 | | | 2,250,000 | | | | 1,940,625 | | |
| Domtar Corp. | |
| 7.125% 08/15/15 | | | 1,915,000 | | | | 1,589,450 | | |
| Georgia-Pacific Corp. | |
| 8.000% 01/15/24 | | | 5,845,000 | | | | 4,968,250 | | |
| NewPage Corp. | |
| 10.000% 05/01/12 | | | 1,415,000 | | | | 792,400 | | |
| Westvaco Corp. | |
| 8.200% 01/15/30 | | | 2,195,000 | | | | 1,848,589 | | |
| | | | 11,139,314 | | |
| Forest Products & Paper Total | | | 11,139,314 | | |
| Iron/Steel – 0.6% | |
| Steel-Producers – 0.6% | |
| ArcelorMittal | |
| 9.850% 06/01/19 | | | 2,080,000 | | | | 2,136,135 | | |
| Nucor Corp. | |
| 5.000% 06/01/13 | | | 760,000 | | | | 782,143 | | |
See Accompanying Notes to Financial Statements.
8
Columbia Strategic Income Fund, May 31, 2009
| Corporate Fixed-Income Bonds & Notes (continued) | |
| | | Par (a) | | Value ($) | |
| Russel Metals, Inc. | |
| 6.375% 03/01/14 | | | 1,360,000 | | | | 1,098,200 | | |
| Steel Dynamics, Inc. | |
| 8.250% 04/15/16 (b) | | | 4,095,000 | | | | 3,490,988 | | |
| United States Steel Corp. | |
| 7.000% 02/01/18 | | | 5,160,000 | | | | 4,291,582 | | |
| | | | 11,799,048 | | |
| Iron/Steel Total | | | 11,799,048 | | |
| Metals & Mining – 1.5% | |
| Diversified Minerals – 0.5% | |
| FMG Finance Ltd. | |
| 10.625% 09/01/16 (b) | | | 4,265,000 | | | | 3,785,188 | | |
| Rio Tinto Finance USA Ltd. | |
| 8.950% 05/01/14 | | | 1,190,000 | | | | 1,278,905 | | |
| Teck Resources Ltd. | |
| 10.750% 05/15/19 (b) | | | 4,950,000 | | | | 5,092,312 | | |
| | | | 10,156,405 | | |
| Metal-Diversified – 0.5% | |
| Freeport-McMoRan Copper & Gold, Inc. | |
| 8.375% 04/01/17 | | | 10,435,000 | | | | 10,356,737 | | |
| | | | 10,356,737 | | |
| Mining Services – 0.1% | |
| Noranda Aluminium Holding Corp. | |
PIK,
7.163% 11/15/14 (c) | | | 2,357,546 | | | | 841,212 | | |
| | | | 841,212 | | |
| Non-Ferrous Metals – 0.4% | |
| Codelco, Inc. | |
| 5.500% 10/15/13 | | | 3,000,000 | | | | 3,161,544 | | |
| 7.500% 01/15/19 (b) | | | 4,500,000 | | | | 5,069,102 | | |
| | | | 8,230,646 | | |
| Metals & Mining Total | | | 29,585,000 | | |
| Basic Materials Total | | | 68,052,912 | | |
| Communications – 6.9% | |
| Advertising – 0.1% | |
| Advertising Agencies – 0.1% | |
| Interpublic Group of Companies, Inc. | |
| 7.250% 08/15/11 | | | 1,520,000 | | | | 1,428,800 | | |
| | | | 1,428,800 | | |
| Advertising Total | | | 1,428,800 | | |
| Media – 1.8% | |
| Cable TV – 1.4% | |
| Cablevision Systems Corp. | |
| 8.000% 04/15/12 | | | 3,299,000 | | | | 3,241,268 | | |
| | | Par (a) | | Value ($) | |
| Charter Communications Holdings II LLC | |
| 10.250% 09/15/10 (g) | | | 4,215,000 | | | | 4,080,442 | | |
| Charter Communications Operating LLC/Charter Communications Operating Capital | |
| 10.375% 04/30/14 (b)(g) | | | 4,010,000 | | | | 3,809,500 | | |
| Comcast Corp. | |
| 6.950% 08/15/37 | | | 1,330,000 | | | | 1,332,753 | | |
| CSC Holdings, Inc. | |
| 7.625% 04/01/11 | | | 2,365,000 | | | | 2,359,088 | | |
| 8.625% 02/15/19 (b) | | | 1,200,000 | | | | 1,177,500 | | |
| DirecTV Holdings LLC | |
| 6.375% 06/15/15 | | | 5,995,000 | | | | 5,455,450 | | |
| EchoStar DBS Corp. | |
| 6.625% 10/01/14 | | | 6,915,000 | | | | 6,275,362 | | |
| Time Warner Cable, Inc. | |
| 7.300% 07/01/38 | | | 745,000 | | | | 755,601 | | |
| | | | 28,486,964 | | |
| Multimedia – 0.1% | |
| News America, Inc. | |
| 6.400% 12/15/35 | | | 150,000 | | | | 124,019 | | |
| Time Warner, Inc. | |
| 6.875% 05/01/12 | | | 1,275,000 | | | | 1,342,296 | | |
| | | | 1,466,315 | | |
| Publishing-Books – 0.3% | |
| TL Acquisitions, Inc. | |
| 10.500% 01/15/15 (b) | | | 6,570,000 | | | | 5,124,600 | | |
| | | | 5,124,600 | | |
| Radio – 0.0% | |
| CMP Susquehanna Corp. | |
| 3.826% 05/15/14 (h) | | | 175,000 | | | | 78,750 | | |
| | | | 78,750 | | |
| Television – 0.0% | |
| Local TV Finance LLC | |
PIK,
9.250% 06/15/15 (b) | | | 1,885,000 | | | | 261,256 | | |
| | | | 261,256 | | |
| Media Total | | | 35,417,885 | | |
| Telecommunication Services – 5.0% | |
| Cellular Telecommunications – 1.5% | |
| Cricket Communications, Inc. | |
| 9.375% 11/01/14 | | | 4,970,000 | | | | 4,945,150 | | |
| Digicel Group Ltd. | |
| 8.875% 01/15/15 (b) | | | 6,860,000 | | | | 5,488,000 | | |
| MetroPCS Wireless, Inc. | |
| 9.250% 11/01/14 | | | 4,795,000 | | | | 4,812,981 | | |
| Nextel Communications, Inc. | |
| 7.375% 08/01/15 | | | 5,535,000 | | | | 4,386,488 | | |
See Accompanying Notes to Financial Statements.
9
Columbia Strategic Income Fund, May 31, 2009
| Corporate Fixed-Income Bonds & Notes (continued) | |
| | | Par (a) | | Value ($) | |
| Orascom Telecom Finance SCA | |
| 7.875% 02/08/14 (b) | | | 1,150,000 | | | | 943,000 | | |
| Verizon Wireless Capital LLC | |
| 5.550% 02/01/14 (b) | | | 2,280,000 | | | | 2,411,100 | | |
| 8.500% 11/15/18 (b) | | | 570,000 | | | | 691,541 | | |
| Wind Acquisition Finance SA | |
| 10.750% 12/01/15 (b) | | | 1,195,000 | | | | 1,254,750 | | |
PIK,
8.357% 12/21/11 (c)(i) | | | 4,904,087 | | | | 4,121,799 | | |
| | | | 29,054,809 | | |
| Media – 0.4% | |
| Nielsen Finance LLC/Nielsen Finance Co. | |
| 11.500% 05/01/16 (b) | | | 2,045,000 | | | | 1,942,750 | | |
| Quebecor Media, Inc. | |
| 7.750% 03/15/16 | | | 5,760,000 | | | | 5,112,000 | | |
| | | | 7,054,750 | | |
| Satellite Telecommunications – 0.7% | |
| Inmarsat Finance II PLC | |
| 10.375% 11/15/12 | | | 3,620,000 | | | | 3,737,650 | | |
| Inmarsat Finance PLC | |
| 7.625% 06/30/12 | | | 800,000 | | | | 781,000 | | |
| Intelsat Jackson Holdings Ltd. | |
| 11.250% 06/15/16 | | | 9,125,000 | | | | 9,353,125 | | |
| | | | 13,871,775 | | |
| Telecommunication Equipment – 0.2% | |
| Lucent Technologies, Inc. | |
| 6.450% 03/15/29 | | | 8,540,000 | | | | 4,867,800 | | |
| | | | 4,867,800 | | |
| Telecommunication Services – 0.6% | |
| Hellas Telecommunications Luxembourg II | |
| 6.881% 01/15/15 (b)(c) | | | 1,385,000 | | | | 263,150 | | |
| Nordic Telephone Co. Holdings ApS | |
| 8.250% 05/01/16 (b) | | EUR | 420,000 | | | | 575,941 | | |
| 8.875% 05/01/16 (b) | | | 3,115,000 | | | | 3,115,000 | | |
| Syniverse Technologies, Inc. | |
| 7.750% 08/15/13 | | | 2,415,000 | | | | 2,070,863 | | |
| Time Warner Telecom Holdings, Inc. | |
| 9.250% 02/15/14 | | | 2,705,000 | | | | 2,711,762 | | |
| West Corp. | |
| 11.000% 10/15/16 | | | 4,745,000 | | | | 4,033,250 | | |
| | | | 12,769,966 | | |
| Telephone-Integrated – 1.5% | |
| BellSouth Corp. | |
| 5.200% 09/15/14 | | | 2,205,000 | | | | 2,289,520 | | |
| Citizens Communications Co. | |
| 7.875% 01/15/27 | | | 5,105,000 | | | | 4,160,575 | | |
| | | Par (a) | | Value ($) | |
| Qwest Communications International, Inc. | |
| 7.500% 02/15/14 | | | 5,730,000 | | | | 5,271,600 | | |
| Qwest Corp. | |
| 7.500% 10/01/14 | | | 2,710,000 | | | | 2,588,050 | | |
| 7.500% 06/15/23 | | | 4,655,000 | | | | 3,700,725 | | |
| Telefonica Emisiones SAU | |
| 6.421% 06/20/16 | | | 925,000 | | | | 978,774 | | |
| Virgin Media Finance PLC | |
| 9.500% 08/15/16 | | EUR | 2,725,000 | | | | 2,673,906 | | |
| Windstream Corp. | |
| 8.625% 08/01/16 | | | 7,165,000 | | | | 7,039,613 | | |
| | | | 28,702,763 | | |
| Wireless Equipment – 0.1% | |
| Crown Castle International Corp. | |
| 9.000% 01/15/15 | | | 1,680,000 | | | | 1,696,800 | | |
| | | | 1,696,800 | | |
| Telecommunication Services Total | | | 98,018,663 | | |
| Communications Total | | | 134,865,348 | | |
| Consumer Cyclical – 3.4% | |
| Apparel – 0.2% | |
| Apparel Manufacturers – 0.2% | |
| Levi Strauss & Co. | |
| 9.750% 01/15/15 | | | 3,925,000 | | | | 3,787,625 | | |
| | | | 3,787,625 | | |
| Apparel Total | | | 3,787,625 | | |
| Auto Manufacturers – 0.0% | |
| Auto-Cars/Light Trucks – 0.0% | |
| General Motors Corp. | |
| 8.375% 07/15/33 (o) | | | 6,915,000 | | | | 622,350 | | |
| 7.200% 01/15/11 (o) | | | 2,775,000 | | | | 242,813 | | |
| | | | 865,163 | | |
| Auto Manufacturers Total | | | 865,163 | | |
| Auto Parts & Equipment – 0.4% | |
| Auto/Truck Parts & Equipment-Original – 0.1% | |
| Hayes Lemmerz Finance LLC - Luxembourg SCA | |
| 8.250% 06/15/15 (j) | | EUR | 2,050,000 | | | | 57,962 | | |
| TRW Automotive, Inc. | |
| 7.000% 03/15/14 (b) | | | 2,265,000 | | | | 1,664,775 | | |
| | | | 1,722,737 | | |
| Auto/Truck Parts & Equipment-Replacement – 0.1% | |
| Commercial Vehicle Group, Inc. | |
| 8.000% 07/01/13 | | | 2,380,000 | | | | 1,011,500 | | |
| | | | 1,011,500 | | |
See Accompanying Notes to Financial Statements.
10
Columbia Strategic Income Fund, May 31, 2009
| Corporate Fixed-Income Bonds & Notes (continued) | |
| | | Par (a) | | Value ($) | |
| Rubber-Tires – 0.2% | |
| Goodyear Tire & Rubber Co. | |
| 8.625% 12/01/11 | | | 560,000 | | | | 544,600 | | |
| 9.000% 07/01/15 | | | 3,865,000 | | | | 3,691,075 | | |
| 10.500% 05/15/16 | | | 1,045,000 | | | | 1,039,775 | | |
| | | | 5,275,450 | | |
| Auto Parts & Equipment Total | | | 8,009,687 | | |
| Entertainment – 0.2% | |
| Music – 0.2% | |
| WMG Acquisition Corp. | |
| 7.375% 04/15/14 | | | 2,465,000 | | | | 2,082,925 | | |
| 9.500% 06/15/16 (b) | | | 680,000 | | | | 679,150 | | |
| WMG Holdings Corp. | |
(k) 12/15/14
(9.500% 12/15/09) | | | 2,280,000 | | | | 1,812,600 | | |
| | | | 4,574,675 | | |
| Resorts/Theme Parks – 0.0% | |
| Six Flags, Inc. | |
| 9.625% 06/01/14 (p) | | | 1,557,000 | | | | 241,335 | | |
| | | | 241,335 | | |
| Entertainment Total | | | 4,816,010 | | |
| Home Builders – 0.5% | |
| Building-Residential/Commercial – 0.5% | |
| D.R. Horton, Inc. | |
| 5.625% 09/15/14 | | | 2,915,000 | | | | 2,477,750 | | |
| 5.625% 01/15/16 | | | 1,483,000 | | | | 1,216,060 | | |
| KB Home | |
| 5.875% 01/15/15 | | | 4,575,000 | | | | 3,911,625 | | |
| Ryland Group, Inc. | |
| 8.400% 05/15/17 | | | 1,400,000 | | | | 1,358,000 | | |
| | | | 8,963,435 | | |
| Home Builders Total | | | 8,963,435 | | |
| Home Furnishings – 0.0% | |
| Home Furnishings – 0.0% | |
| Simmons Co. | |
PIK,
8.224% 02/15/12 (c)(i) | | | 2,408,143 | | | | 24,883 | | |
| | | | 24,883 | | |
| Home Furnishings Total | | | 24,883 | | |
| Lodging – 0.9% | |
| Casino Hotels – 0.6% | |
| Boyd Gaming Corp. | |
| 6.750% 04/15/14 | | | 1,250,000 | | | | 975,000 | | |
| 7.125% 02/01/16 | | | 1,500,000 | | | | 1,065,000 | | |
| | | Par (a) | | Value ($) | |
| Harrah's Operating Co., Inc. | |
| 10.000% 12/15/18 (b) | | | 2,069,000 | | | | 1,381,057 | | |
| Jacobs Entertainment, Inc. | |
| 9.750% 06/15/14 | | | 2,165,000 | | | | 1,623,750 | | |
| Majestic Star LLC | |
| 9.750% 01/15/11 (f) | | | 2,740,000 | | | | 315,100 | | |
| MGM Mirage | |
| 7.500% 06/01/16 | | | 6,385,000 | | | | 4,150,250 | | |
| Snoqualmie Entertainment Authority | |
| 5.384% 02/01/14 (b)(c) | | | 375,000 | | | | 195,938 | | |
| 9.125% 02/01/15 (b) | | | 2,015,000 | | | | 1,078,025 | | |
| | | | 10,784,120 | | |
| Gambling (Non-Hotel) – 0.2% | |
| Mashantucket Western Pequot Tribe | |
| 8.500% 11/15/15 (b) | | | 4,265,000 | | | | 1,663,350 | | |
| Seminole Indian Tribe of Florida | |
| 7.804% 10/01/20 (b) | | | 3,215,000 | | | | 2,693,109 | | |
| | | | 4,356,459 | | |
| Hotels & Motels – 0.1% | |
| Starwood Hotels & Resorts Worldwide, Inc. | |
| 6.750% 05/15/18 | | | 3,305,000 | | | | 2,809,250 | | |
| | | | 2,809,250 | | |
| Lodging Total | | | 17,949,829 | | |
| Restaurants – 0.1% | |
| Retail-Restaurants – 0.1% | |
| McDonald's Corp. | |
| 5.700% 02/01/39 | | | 1,050,000 | | | | 1,023,501 | | |
| | | | 1,023,501 | | |
| Restaurants Total | | | 1,023,501 | | |
| Retail – 1.1% | |
| Retail-Apparel/Shoe – 0.2% | |
| Hanesbrands, Inc. | |
| 5.698% 12/15/14 (c) | | | 2,640,000 | | | | 2,125,200 | | |
| Phillips-Van Heusen Corp. | |
| 7.250% 02/15/11 | | | 725,000 | | | | 717,750 | | |
| 8.125% 05/01/13 | | | 1,760,000 | | | | 1,724,800 | | |
| | | | 4,567,750 | | |
| Retail-Computer Equipment – 0.1% | |
| GameStop Corp./GameStop, Inc. | |
| 8.000% 10/01/12 | | | 2,275,000 | | | | 2,283,531 | | |
| | | | 2,283,531 | | |
See Accompanying Notes to Financial Statements.
11
Columbia Strategic Income Fund, May 31, 2009
| Corporate Fixed-Income Bonds & Notes (continued) | |
| | | Par (a) | | Value ($) | |
| Retail-Discount – 0.2% | |
| Dollar General Corp. | |
PIK,
11.875% 07/15/17 | | | 4,445,000 | | | | 4,689,475 | | |
| | | | 4,689,475 | | |
| Retail-Drug Stores – 0.2% | |
| Rite Aid Corp. | |
| 9.500% 06/15/17 | | | 4,675,000 | | | | 3,038,750 | | |
| | | | 3,038,750 | | |
| Retail-Propane Distributors – 0.4% | |
| AmeriGas Partners LP | |
| 7.125% 05/20/16 | | | 2,910,000 | | | | 2,695,387 | | |
| 7.250% 05/20/15 | | | 1,335,000 | | | | 1,254,900 | | |
| Inergy LP/Inergy Finance Corp. | |
| 8.250% 03/01/16 | | | 1,365,000 | | | | 1,334,288 | | |
| 8.750% 03/01/15 (b) | | | 2,645,000 | | | | 2,618,550 | | |
| | | | 7,903,125 | | |
| Retail Total | | | 22,482,631 | | |
| Consumer Cyclical Total | | | 67,922,764 | | |
| Consumer Non-Cyclical – 5.7% | |
| Agriculture – 0.1% | |
| Tobacco – 0.1% | |
| Reynolds American, Inc. | |
| 7.625% 06/01/16 | | | 2,760,000 | | | | 2,709,180 | | |
| | | | 2,709,180 | | |
| Agriculture Total | | | 2,709,180 | | |
| Beverages – 0.4% | |
| Beverages-Non-Alcoholic – 0.1% | |
| Cott Beverages, Inc. | |
| 8.000% 12/15/11 | | | 2,305,000 | | | | 1,982,300 | | |
| PepsiCo, Inc. | |
| 7.900% 11/01/18 | | | 1,150,000 | | | | 1,376,940 | | |
| | | | 3,359,240 | | |
| Beverages-Wine/Spirits – 0.2% | |
| Constellation Brands, Inc. | |
| 8.125% 01/15/12 | | | 3,985,000 | | | | 3,965,075 | | |
| | | | 3,965,075 | | |
| Brewery – 0.1% | |
| Anheuser-Busch InBev Worldwide, Inc. | |
| 7.750% 01/15/19 (b) | | | 760,000 | | | | 817,492 | | |
| 8.000% 11/15/39 (b) | | | 645,000 | | | | 673,031 | | |
| | | | 1,490,523 | | |
| Beverages Total | | | 8,814,838 | | |
| | | Par (a) | | Value ($) | |
| Biotechnology – 0.2% | |
| Medical-Biomedical/Gene – 0.2% | |
| Bio-Rad Laboratories, Inc. | |
| 7.500% 08/15/13 | | | 2,625,000 | | | | 2,592,187 | | |
| 8.000% 09/15/16 (b) | | | 580,000 | | | | 581,450 | | |
| | | | 3,173,637 | | |
| Biotechnology Total | | | 3,173,637 | | |
| Commercial Services – 1.2% | |
| Commercial Services – 0.4% | |
| ARAMARK Corp. | |
| 8.500% 02/01/15 | | | 3,595,000 | | | | 3,428,731 | | |
| Iron Mountain, Inc. | |
| 8.000% 06/15/20 | | | 3,755,000 | | | | 3,473,375 | | |
| | | | 6,902,106 | | |
| Commercial Services-Finance – 0.0% | |
| ACE Cash Express, Inc. | |
| 10.250% 10/01/14 (b) | | | 1,550,000 | | | | 635,500 | | |
| | | | 635,500 | | |
| Funeral Services & Related Items – 0.2% | |
| Service Corp. International | |
| 6.750% 04/01/16 | | | 1,980,000 | | | | 1,821,600 | | |
| 7.000% 06/15/17 | | | 1,750,000 | | | | 1,596,875 | | |
| 7.375% 10/01/14 | | | 290,000 | | | | 279,125 | | |
| | | | 3,697,600 | | |
| Private Corrections – 0.3% | |
| Corrections Corp. of America | |
| 6.250% 03/15/13 | | | 2,355,000 | | | | 2,231,363 | | |
| GEO Group, Inc. | |
| 8.250% 07/15/13 | | | 2,865,000 | | | | 2,793,375 | | |
| | | | 5,024,738 | | |
| Rental Auto/Equipment – 0.3% | |
| Ashtead Holdings PLC | |
| 8.625% 08/01/15 (b) | | | 2,885,000 | | | | 2,163,750 | | |
| Rental Service Corp. | |
| 9.500% 12/01/14 | | | 2,800,000 | | | | 2,184,000 | | |
| United Rentals North America, Inc. | |
| 6.500% 02/15/12 | | | 2,650,000 | | | | 2,477,750 | | |
| | | | 6,825,500 | | |
| Commercial Services Total | | | 23,085,444 | | |
| Food – 0.9% | |
| Food-Meat Products – 0.3% | |
| JBS USA LLC/JBS USA Finance, Inc. | |
| 11.625% 05/01/14 (b) | | | 3,910,000 | | | | 3,753,600 | | |
See Accompanying Notes to Financial Statements.
12
Columbia Strategic Income Fund, May 31, 2009
| Corporate Fixed-Income Bonds & Notes (continued) | |
| | | Par (a) | | Value ($) | |
| Tyson Foods, Inc. | |
| 10.500% 03/01/14 (b) | | | 2,310,000 | | | | 2,448,600 | | |
| | | | 6,202,200 | | |
| Food-Miscellaneous/Diversified – 0.4% | |
| Campbell Soup Co. | |
| 4.500% 02/15/19 | | | 570,000 | | | | 553,795 | | |
| ConAgra Foods, Inc. | |
| 7.000% 10/01/28 | | | 855,000 | | | | 838,929 | | |
| Del Monte Corp. | |
| 6.750% 02/15/15 | | | 2,065,000 | | | | 1,956,588 | | |
| Pinnacle Foods Finance LLC | |
| 9.250% 04/01/15 | | | 4,500,000 | | | | 4,016,250 | | |
| Reddy Ice Holdings, Inc. | |
| 10.500% 11/01/12 | | | 1,875,000 | | | | 1,125,000 | | |
| | | | 8,490,562 | | |
| Food-Retail – 0.0% | |
| Kroger Co. | |
| 8.000% 09/15/29 | | | 480,000 | | | | 530,394 | | |
| | | | 530,394 | | |
| Retail-Hypermarkets – 0.2% | |
| New Albertsons, Inc. | |
| 8.000% 05/01/31 | | | 3,205,000 | | | | 2,756,300 | | |
| | | | 2,756,300 | | |
| Food Total | | | 17,979,456 | | |
| Healthcare Products – 0.4% | |
| Medical Products – 0.4% | |
| Biomet, Inc. | |
PIK,
10.375% 10/15/17 | | | 8,395,000 | | | | 7,975,250 | | |
| | | | 7,975,250 | | |
| Healthcare Products Total | | | 7,975,250 | | |
| Healthcare Services – 1.6% | |
| Dialysis Centers – 0.1% | |
| DaVita, Inc. | |
| 7.250% 03/15/15 | | | 2,460,000 | | | | 2,312,400 | | |
| | | | 2,312,400 | | |
| Medical-HMO – 0.1% | |
| Coventry Health Care, Inc. | |
| 5.875% 01/15/12 | | | 1,570,000 | | | | 1,455,558 | | |
| WellPoint, Inc. | |
| 7.000% 02/15/19 | | | 960,000 | | | | 982,894 | | |
| | | | 2,438,452 | | |
| Medical-Hospitals – 1.1% | |
| Community Health Systems, Inc. | |
| 8.875% 07/15/15 | | | 6,855,000 | | | | 6,777,881 | | |
| | | Par (a) | | Value ($) | |
| HCA, Inc. | |
| 9.250% 11/15/16 | | | 2,655,000 | | | | 2,608,538 | | |
PIK,
9.625% 11/15/16 | | | 13,400,000 | | | | 12,830,500 | | |
| | | | 22,216,919 | | |
| Physical Therapy/Rehab Centers – 0.1% | |
| Healthsouth Corp. | |
| 10.750% 06/15/16 | | | 1,825,000 | | | | 1,861,500 | | |
| | | | 1,861,500 | | |
| Physician Practice Management – 0.2% | |
| U.S. Oncology Holdings, Inc. | |
PIK,
6.904% 03/15/12 (c) | | | 1,857,000 | | | | 1,235,587 | | |
| US Oncology, Inc. | |
| 9.000% 08/15/12 | | | 1,585,000 | | | | 1,585,000 | | |
| | | | 2,820,587 | | |
| Healthcare Services Total | | | 31,649,858 | | |
| Household Products/Wares – 0.2% | |
| Consumer Products-Miscellaneous – 0.2% | |
| American Greetings Corp. | |
| 7.375% 06/01/16 | | | 2,365,000 | | | | 1,489,950 | | |
| Jostens IH Corp. | |
| 7.625% 10/01/12 | | | 2,250,000 | | | | 2,216,250 | | |
| | | | 3,706,200 | | |
| Household Products/Wares Total | | | 3,706,200 | | |
| Pharmaceuticals – 0.7% | |
| Medical-Drugs – 0.5% | |
| Elan Finance PLC | |
| 4.883% 11/15/11 (c) | | | 975,000 | | | | 843,375 | | |
| 8.875% 12/01/13 | | | 3,205,000 | | | | 2,756,300 | | |
| Novartis Securities Investment Ltd. | |
| 5.125% 02/10/19 | | | 950,000 | | | | 962,816 | | |
| Warner Chilcott Corp. | |
| 8.750% 02/01/15 | | | 3,765,000 | | | | 3,765,000 | | |
| Wyeth | |
| 5.500% 02/15/16 | | | 800,000 | | | | 828,098 | | |
| | | | 9,155,589 | | |
| Pharmacy Services – 0.2% | |
| Omnicare, Inc. | |
| 6.750% 12/15/13 | | | 3,480,000 | | | | 3,158,100 | | |
| 6.875% 12/15/15 | | | 650,000 | | | | 585,000 | | |
| | | | 3,743,100 | | |
| Pharmaceuticals Total | | | 12,898,689 | | |
| Consumer Non-Cyclical Total | | | 111,992,552 | | |
See Accompanying Notes to Financial Statements.
13
Columbia Strategic Income Fund, May 31, 2009
| Corporate Fixed-Income Bonds & Notes (continued) | |
| | | Par (a) | | Value ($) | |
| Energy – 5.6% | |
| Coal – 0.4% | |
| Coal – 0.4% | |
| Arch Western Finance LLC | |
| 6.750% 07/01/13 | | | 4,115,000 | | | | 3,744,650 | | |
| Massey Energy Co. | |
| 6.875% 12/15/13 | | | 5,585,000 | | | | 4,942,725 | | |
| | | | 8,687,375 | | |
| Coal Total | | | 8,687,375 | | |
| Energy-Alternate Sources – 0.1% | |
| Energy-Alternate Sources – 0.1% | |
| Power Sector Assets & Liabilities Management Corp. | |
| 7.250% 05/27/19 (b) | | | 2,500,000 | | | | 2,543,750 | | |
| | | | 2,543,750 | | |
| Energy-Alternate Sources Total | | | 2,543,750 | | |
| Oil & Gas – 2.9% | |
| Oil Companies-Exploration & Production – 2.3% | |
| Chesapeake Energy Corp. | |
| 6.375% 06/15/15 | | | 7,875,000 | | | | 6,752,812 | | |
| 9.500% 02/15/15 | | | 650,000 | | | | 641,875 | | |
| Cimarex Energy Co. | |
| 7.125% 05/01/17 | | | 2,675,000 | | | | 2,320,563 | | |
| Compton Petroleum Corp. | |
| 7.625% 12/01/13 | | | 2,875,000 | | | | 1,437,500 | | |
| KCS Energy, Inc. | |
| 7.125% 04/01/12 | | | 1,630,000 | | | | 1,519,975 | | |
| Newfield Exploration Co. | |
| 6.625% 04/15/16 | | | 5,680,000 | | | | 5,140,400 | | |
| Nexen, Inc. | |
| 5.875% 03/10/35 | | | 960,000 | | | | 761,944 | | |
| OPTI Canada, Inc. | |
| 8.250% 12/15/14 | | | 5,075,000 | | | | 3,501,750 | | |
| Pemex Finance Ltd. | |
| 9.150% 11/15/18 | | | 2,485,000 | | | | 2,591,603 | | |
| 10.610% 08/15/17 | | | 1,650,000 | | | | 1,827,309 | | |
| Pioneer Natural Resources Co. | |
| 5.875% 07/15/16 | | | 2,060,000 | | | | 1,792,200 | | |
| Quicksilver Resources, Inc. | |
| 7.125% 04/01/16 | | | 5,430,000 | | | | 3,963,900 | | |
| Range Resources Corp. | |
| 7.500% 05/15/16 | | | 4,110,000 | | | | 3,945,600 | | |
| Ras Laffan Liquefied Natural Gas Co., Ltd. III | |
| 5.832% 09/30/16 (b) | | | 4,200,000 | | | | 4,170,390 | | |
| Southwestern Energy Co. | |
| 7.500% 02/01/18 (b) | | | 4,185,000 | | | | 3,986,213 | | |
| XTO Energy, Inc. | |
| 7.500% 04/15/12 | | | 340,000 | | | | 356,603 | | |
| | | | 44,710,637 | | |
| | | Par (a) | | Value ($) | |
| Oil Company-Integrated – 0.0% | |
| Marathon Oil Corp. | |
| 7.500% 02/15/19 | | | 480,000 | | | | 506,301 | | |
| | | | 506,301 | | |
| Oil Refining & Marketing – 0.3% | |
| Frontier Oil Corp. | |
| 8.500% 09/15/16 | | | 1,840,000 | | | | 1,821,600 | | |
| Tesoro Corp. | |
| 6.625% 11/01/15 | | | 3,180,000 | | | | 2,706,975 | | |
| United Refining Co. | |
| 10.500% 08/15/12 | | | 2,145,000 | | | | 1,608,750 | | |
| Valero Energy Corp. | |
| 6.625% 06/15/37 | | | 960,000 | | | | 787,812 | | |
| | | | 6,925,137 | | |
| Oil-Field Services – 0.3% | |
| Gazprom International SA | |
| 7.201% 02/01/20 | | | 5,381,315 | | | | 5,044,983 | | |
| | | | 5,044,983 | | |
| Oil & Gas Total | | | 57,187,058 | | |
| Oil & Gas Services – 0.2% | |
| Oil-Field Services – 0.1% | |
| Halliburton Co. | |
| 5.900% 09/15/18 | | | 960,000 | | | | 1,003,864 | | |
| Smith International, Inc. | |
| 9.750% 03/15/19 | | | 315,000 | | | | 348,020 | | |
| Weatherford International Ltd. | |
| 5.150% 03/15/13 | | | 855,000 | | | | 820,681 | | |
| | | | 2,172,565 | | |
| Seismic Data Collection – 0.1% | |
| Seitel, Inc. | |
| 9.750% 02/15/14 | | | 1,530,000 | | | | 761,175 | | |
| | | | 761,175 | | |
| Oil & Gas Services Total | | | 2,933,740 | | |
| Oil, Gas & Consumable Fuels – 0.9% | |
| Oil Companies-Exploration & Production – 0.5% | |
| Forest Oil Corp. | |
| 8.500% 02/15/14 (b) | | | 4,010,000 | | | | 3,869,650 | | |
| PetroHawk Energy Corp. | |
| 7.875% 06/01/15 | | | 4,965,000 | | | | 4,605,038 | | |
| Talisman Energy, Inc. | |
| 7.750% 06/01/19 | | | 1,094,000 | | | | 1,146,909 | | |
| | | | 9,621,597 | | |
| Oil Company-Integrated – 0.4% | |
| Petrobras Energia SA | |
| 5.875% 05/15/17 (b) | | | 4,000,000 | | | | 3,560,000 | | |
See Accompanying Notes to Financial Statements.
14
Columbia Strategic Income Fund, May 31, 2009
| Corporate Fixed-Income Bonds & Notes (continued) | |
| | | Par (a) | | Value ($) | |
| Petrobras International Finance Co. | |
| 5.875% 03/01/18 | | | 4,150,000 | | | | 4,054,894 | | |
| | | | 7,614,894 | | |
| Oil, Gas & Consumable Fuels Total | | | 17,236,491 | | |
| Pipelines – 1.1% | |
| Pipelines – 1.1% | |
| Atlas Pipeline Partners LP | |
| 8.125% 12/15/15 | | | 3,125,000 | | | | 1,921,875 | | |
| El Paso Corp. | |
| 6.875% 06/15/14 | | | 2,970,000 | | | | 2,812,777 | | |
| 7.250% 06/01/18 | | | 3,035,000 | | | | 2,795,427 | | |
| Energy Transfer Partners LP | |
| 8.500% 04/15/14 | | | 1,700,000 | | | | 1,891,952 | | |
| Kinder Morgan Energy Partners LP | |
| 6.950% 01/15/38 | | | 670,000 | | | | 620,860 | | |
| Kinder Morgan Finance Co. ULC | |
| 5.700% 01/05/16 | | | 4,000,000 | | | | 3,420,000 | | |
| MarkWest Energy Partners LP | |
| 6.875% 11/01/14 | | | 2,800,000 | | | | 2,296,000 | | |
| 8.500% 07/15/16 | | | 1,905,000 | | | | 1,609,725 | | |
| Plains All American Pipeline LP | |
| 6.500% 05/01/18 | | | 1,520,000 | | | | 1,468,165 | | |
| TransCanada Pipelines Ltd. | |
| 6.350% 05/15/67 (c) | | | 950,000 | | | | 627,000 | | |
| 7.625% 01/15/39 | | | 575,000 | | | | 631,764 | | |
| Williams Companies, Inc. | |
| 7.625% 07/15/19 | | | 1,375,000 | | | | 1,340,625 | | |
| 7.875% 09/01/21 | | | 1,030,000 | | | | 999,100 | | |
| 8.125% 03/15/12 | | | 135,000 | | | | 138,059 | | |
| | | | 22,573,329 | | |
| Pipelines Total | | | 22,573,329 | | |
| Energy Total | | | 111,161,743 | | |
| Financials – 5.7% | |
| Banks – 2.5% | |
| Commercial Banks-Central US – 0.1% | |
| Northern Trust Co. | |
| 6.500% 08/15/18 | | | 1,500,000 | | | | 1,588,135 | | |
| | | | 1,588,135 | | |
| Commercial Banks-Non US – 0.2% | |
| ANZ National International Ltd. | |
| 6.200% 07/19/13 (b) | | | 3,200,000 | | | | 3,266,330 | | |
| | | | 3,266,330 | | |
| Commercial Banks-Western U.S. – 1.0% | |
| Citibank NA | |
| 1.875% 05/07/12 | | | 20,000,000 | | | | 20,046,420 | | |
| | | | 20,046,420 | | |
| | | Par (a) | | Value ($) | |
| Diversified Banking Institutional – 0.3% | |
| Citigroup, Inc. | |
| 6.500% 08/19/13 | | | 1,580,000 | | | | 1,565,741 | | |
| 8.500% 05/22/19 | | | 3,150,000 | | | | 3,261,478 | | |
| Goldman Sachs Group, Inc. | |
| 6.250% 09/01/17 | | | 665,000 | | | | 644,542 | | |
| | | | 5,471,761 | | |
| Diversified Financial Services – 0.0% | |
| JPMorgan Chase & Co. | |
| 6.300% 04/23/19 | | | 605,000 | | | | 601,920 | | |
| | | | 601,920 | | |
| Fiduciary Banks – 0.3% | |
| Bank of New York Mellon Corp. | |
| 5.450% 05/15/19 | | | 4,905,000 | | | | 4,914,330 | | |
| Northern Trust Corp. | |
| 5.500% 08/15/13 | | | 570,000 | | | | 594,988 | | |
| | | | 5,509,318 | | |
| Money Center Banks – 0.1% | |
| Comerica Bank | |
| 5.200% 08/22/17 | | | 500,000 | | | | 384,688 | | |
| Deutsche Bank AG London | |
| 4.875% 05/20/13 | | | 2,280,000 | | | | 2,304,366 | | |
| | | | 2,689,054 | | |
| Special Purpose Entity – 0.1% | |
| Goldman Sachs Capital II | |
| 5.793% 12/29/49 (c) | | | 1,335,000 | | | | 774,509 | | |
| JPMorgan Chase Capital XX | |
| 6.550% 09/29/36 | | | 950,000 | | | | 748,374 | | |
| | | | 1,522,883 | | |
| Super-Regional Banks-US – 0.4% | |
| Capital One Financial Corp. | |
| 5.700% 09/15/11 | | | 1,920,000 | | | | 1,951,133 | | |
| 7.375% 05/23/14 | | | 2,155,000 | | | | 2,220,391 | | |
| Keycorp | |
| 6.500% 05/14/13 | | | 1,780,000 | | | | 1,683,565 | | |
| National City Corp. | |
| 4.900% 01/15/15 | | | 1,440,000 | | | | 1,271,087 | | |
| USB Capital IX | |
| 6.189% 04/15/49 (c) | | | 775,000 | | | | 505,687 | | |
| Wachovia Capital Trust III | |
| 5.800% 03/15/42 (c) | | | 480,000 | | | | 292,800 | | |
| | | | 7,924,663 | | |
| Banks Total | | | 48,620,484 | | |
See Accompanying Notes to Financial Statements.
15
Columbia Strategic Income Fund, May 31, 2009
| Corporate Fixed-Income Bonds & Notes (continued) | |
| | | Par (a) | | Value ($) | |
| Diversified Financial Services – 2.2% | |
| Diversified Financial Services – 0.1% | |
| General Electric Capital Corp. | |
| 6.875% 01/10/39 | | | 1,260,000 | | | | 1,158,391 | | |
| 5.900% 05/13/14 | | | 1,215,000 | | | | 1,224,290 | | |
| | | | 2,382,681 | | |
| Finance-Auto Loans – 1.0% | |
| Ford Motor Credit Co. | |
| 8.000% 12/15/16 | | | 3,310,000 | | | | 2,658,069 | | |
| 7.800% 06/01/12 | | | 8,100,000 | | | | 6,916,954 | | |
| GMAC LLC | |
| 6.875% 09/15/11 (b) | | | 5,800,000 | | | | 5,191,000 | | |
| 8.000% 11/01/31 (b) | | | 6,853,000 | | | | 5,139,750 | | |
| | | | 19,905,773 | | |
| Finance-Consumer Loans – 0.3% | |
| Sears Roebuck Acceptance Corp. | |
| 7.000% 02/01/11 | | | 1,275,000 | | | | 1,169,813 | | |
| SLM Corp. | |
| 6.500% 06/15/10 | | NZD | 7,865,000 | | | | 4,351,373 | | |
| | | | 5,521,186 | | |
| Finance-Investment Banker/Broker – 0.1% | |
| Lazard Group LLC | |
| 7.125% 05/15/15 | | | 3,205,000 | | | | 2,796,568 | | |
| | | | 2,796,568 | | |
| Investment Management/Advisor Service – 0.1% | |
| Nuveen Investments, Inc. | |
| 10.500% 11/15/15 (b) | | | 3,045,000 | | | | 1,629,075 | | |
| | | | 1,629,075 | | |
| Special Purpose Entity – 0.6% | |
| CDX North America High Yield | |
| 8.875% 06/29/13 (b) | | | 12,740,000 | | | | 11,243,050 | | |
| | | | 11,243,050 | | |
| Diversified Financial Services Total | | | 43,478,333 | | |
| Insurance – 0.8% | |
| Insurance Brokers – 0.1% | |
| HUB International Holdings, Inc. | |
| 10.250% 06/15/15 (b) | | | 2,205,000 | | | | 1,367,100 | | |
| USI Holdings Corp. | |
| 9.750% 05/15/15 (b) | | | 1,485,000 | | | | 813,037 | | |
| | | | 2,180,137 | | |
| Life/Health Insurance – 0.2% | |
| New York Life Global Funding | |
| 4.650% 05/09/13 (b) | | | 2,955,000 | | | | 2,915,468 | | |
| | | Par (a) | | Value ($) | |
| Principal Life Income Funding Trusts | |
| 5.300% 04/24/13 | | | 960,000 | | | | 927,701 | | |
| | | | 3,843,169 | | |
| Multi-Line Insurance – 0.2% | |
| MetLife, Inc. | |
| 6.750% 06/01/16 | | | 2,230,000 | | | | 2,269,243 | | |
| Metropolitan Life Global Funding I | |
| 5.125% 04/10/13 (b) | | | 1,350,000 | | | | 1,332,697 | | |
| | | | 3,601,940 | | |
| Property/Casualty Insurance – 0.3% | |
| Asurion Corp. | |
| 6.882% 07/02/15 (c)(i) | | | 3,810,000 | | | | 3,241,949 | | |
| Crum & Forster Holdings Corp. | |
| 7.750% 05/01/17 | | | 3,640,000 | | | | 3,021,200 | | |
| | | | 6,263,149 | | |
| Insurance Total | | | 15,888,395 | | |
| Real Estate Investment Trusts (REITs) – 0.1% | |
| REITS-Hotels – 0.1% | |
| Host Marriott LP | |
| 6.750% 06/01/16 | | | 2,795,000 | | | | 2,403,700 | | |
| | | | 2,403,700 | | |
| REITS-Office Property – 0.0% | |
| Highwood Realty LP | |
| 5.850% 03/15/17 | | | 140,000 | | | | 101,479 | | |
| | | | 101,479 | | |
| Real Estate Investment Trusts (REITs) Total | | | 2,505,179 | | |
| Savings & Loans – 0.1% | |
| Savings & Loans/Thrifts-Western US – 0.1% | |
| Wachovia Mortgage FSB | |
| 4.125% 12/15/09 | | | 850,000 | | | | 858,921 | | |
| | | | 858,921 | | |
| Savings & Loans Total | | | 858,921 | | |
| Financials Total | | | 111,351,312 | | |
| Industrials – 4.1% | |
| Aerospace & Defense – 0.6% | |
| Aerospace/Defense – 0.0% | |
| Boeing Co. | |
| 6.000% 03/15/19 | | | 840,000 | | | | 896,251 | | |
| | | | 896,251 | | |
| Aerospace/Defense-Equipment – 0.4% | |
| BE Aerospace, Inc. | |
| 8.500% 07/01/18 | | | 4,530,000 | | | | 4,280,850 | | |
See Accompanying Notes to Financial Statements.
16
Columbia Strategic Income Fund, May 31, 2009
| Corporate Fixed-Income Bonds & Notes (continued) | |
| | | Par (a) | | Value ($) | |
| Moog, Inc. | |
| 7.250% 06/15/18 (b) | | | 1,155,000 | | | | 1,085,700 | | |
| Sequa Corp. | |
| 11.750% 12/01/15 (b) | | | 4,615,000 | | | | 2,053,675 | | |
| United Technologies Corp. | |
| 6.125% 02/01/19 | | | 120,000 | | | | 129,149 | | |
| | | | 7,549,374 | | |
| Electronics-Military – 0.2% | |
| L-3 Communications Corp. | |
| 6.375% 10/15/15 | | | 4,260,000 | | | | 3,876,600 | | |
| | | | 3,876,600 | | |
| Aerospace & Defense Total | | | 12,322,225 | | |
| Building Materials – 0.1% | |
| Building & Construction Products-Miscellaneous – 0.1% | |
| Owens Corning | |
| 6.500% 12/01/16 | | | 2,400,000 | | | | 2,088,146 | | |
| | | | 2,088,146 | | |
| Building Products-Cement/Aggregation – 0.0% | |
| Texas Industries, Inc. | |
| 7.250% 07/15/13 (b) | | | 405,000 | | | | 348,300 | | |
| | | | 348,300 | | |
| Building Materials Total | | | 2,436,446 | | |
| Electrical Components & Equipment – 0.3% | |
| Wire & Cable Products – 0.3% | |
| Belden, Inc. | |
| 7.000% 03/15/17 | | | 2,520,000 | | | | 2,233,350 | | |
| General Cable Corp. | |
| 3.583% 04/01/15 (c) | | | 860,000 | | | | 696,600 | | |
| 7.125% 04/01/17 | | | 2,765,000 | | | | 2,529,975 | | |
| | | | 5,459,925 | | |
| Electrical Components & Equipment Total | | | 5,459,925 | | |
| Electronics – 0.2% | |
| Electronic Components-Miscellaneous – 0.2% | |
| Flextronics International Ltd. | |
| 2.664% 10/01/14 (c)(i) | | | 77,666 | | | | 62,210 | | |
| 2.668% 10/04/14 (c)(i) | | | 646,480 | | | | 517,830 | | |
| 3.381% 10/01/14 (c)(i) | | | 455,038 | | | | 364,486 | | |
| 3.458% 10/01/14 (c)(i) | | | 790,816 | | | | 633,444 | | |
| 6.250% 11/15/14 | | | 2,480,000 | | | | 2,219,600 | | |
| | | | 3,797,570 | | |
| Electronics Total | | | 3,797,570 | | |
| | | Par (a) | | Value ($) | |
| Engineering & Construction – 0.1% | |
| Building & Construction-Miscellaneous – 0.1% | |
| Esco Corp. | |
| 8.625% 12/15/13 (b) | | | 1,515,000 | | | | 1,272,600 | | |
| | | | 1,272,600 | | |
| Engineering & Construction Total | | | 1,272,600 | | |
| Environmental Control – 0.1% | |
| Non-Hazardous Waste Disposal – 0.1% | |
| Allied Waste North America, Inc. | |
| 7.875% 04/15/13 | | | 1,660,000 | | | | 1,689,050 | | |
| | | | 1,689,050 | | |
| Environmental Control Total | | | 1,689,050 | | |
| Machinery – 0.0% | |
| Finance-Commercial – 0.0% | |
| Caterpillar Financial Services Corp. | |
| 4.250% 02/08/13 | | | 580,000 | | | | 569,857 | | |
| | | | 569,857 | | |
| Machinery-Construction & Mining – 0.0% | |
| Caterpillar, Inc. | |
| 8.250% 12/15/38 | | | 150,000 | | | | 173,687 | | |
| | | | 173,687 | | |
| Machinery Total | | | 743,544 | | |
| Machinery-Construction & Mining – 0.2% | |
| Machinery-Construction & Mining – 0.2% | |
| Terex Corp. | |
| 8.000% 11/15/17 | | | 3,990,000 | | | | 3,231,900 | | |
| | | | 3,231,900 | | |
| Machinery-Construction & Mining Total | | | 3,231,900 | | |
| Machinery-Diversified – 0.2% | |
| Machinery-General Industry – 0.2% | |
| Manitowoc Co., Inc. | |
| 7.125% 11/01/13 | | | 3,230,000 | | | | 2,309,450 | | |
| Westinghouse Air Brake Technologies Corp. | |
| 6.875% 07/31/13 | | | 1,440,000 | | | | 1,411,200 | | |
| | | | 3,720,650 | | |
| Machinery-Diversified Total | | | 3,720,650 | | |
| Miscellaneous Manufacturing – 0.7% | |
| Diversified Manufacturing Operators – 0.5% | |
| Bombardier, Inc. | |
| 6.300% 05/01/14 (b) | | | 4,875,000 | | | | 4,265,625 | | |
| Koppers Holdings, Inc. | |
(k) 11/15/14
(9.875% 11/15/09) | | | 2,960,000 | | | | 2,604,800 | | |
See Accompanying Notes to Financial Statements.
17
Columbia Strategic Income Fund, May 31, 2009
| Corporate Fixed-Income Bonds & Notes (continued) | |
| | | Par (a) | | Value ($) | |
| Trinity Industries, Inc. | |
| 6.500% 03/15/14 | | | 3,025,000 | | | | 2,601,500 | | |
| | | | 9,471,925 | | |
| Miscellaneous Manufacturing – 0.2% | |
| American Railcar Industries, Inc. | |
| 7.500% 03/01/14 | | | 2,390,000 | | | | 2,067,350 | | |
| TriMas Corp. | |
| 9.875% 06/15/12 | | | 2,481,000 | | | | 1,718,092 | | |
| | | | 3,785,442 | | |
| Miscellaneous Manufacturing Total | | | 13,257,367 | | |
| Packaging & Containers – 0.8% | |
| Containers-Metal/Glass – 0.5% | |
| BWAY Corp. | |
| 10.000% 04/15/14 (b) | | | 2,195,000 | | | | 2,192,256 | | |
| Crown Americas LLC & Crown Americas Capital Corp. | |
| 7.750% 11/15/15 | | | 2,440,000 | | | | 2,379,000 | | |
| Crown Americas LLC & Crown Americas Capital Corp. II | |
| 7.625% 05/15/17 (b) | | | 1,265,000 | | | | 1,239,700 | | |
| Owens-Brockway Glass Container, Inc. | |
| 8.250% 05/15/13 | | | 3,940,000 | | | | 3,940,000 | | |
| Silgan Holdings, Inc. | |
| 6.750% 11/15/13 | | | 985,000 | | | | 960,375 | | |
| | | | 10,711,331 | | |
| Containers-Paper/Plastic – 0.3% | |
| Berry Plastics Holding Corp. | |
| 8.875% 09/15/14 | | | 3,280,000 | | | | 2,607,600 | | |
| Solo Cup Co. | |
| 8.500% 02/15/14 | | | 2,740,000 | | | | 2,192,000 | | |
| Temple-Inland, Inc. | |
| 6.625% 01/15/16 | | | 1,605,000 | | | | 1,409,555 | | |
| | | | 6,209,155 | | |
| Packaging & Containers Total | | | 16,920,486 | | |
| Transportation – 0.8% | |
| Transportation-Marine – 0.3% | |
| Navios Maritime Holdings, Inc. | |
| 9.500% 12/15/14 | | | 3,115,000 | | | | 2,382,975 | | |
| Ship Finance International Ltd. | |
| 8.500% 12/15/13 | | | 2,500,000 | | | | 1,875,000 | | |
| Stena AB | |
| 7.500% 11/01/13 | | | 3,070,000 | | | | 2,394,600 | | |
| | | | 6,652,575 | | |
| Transportation-Railroad – 0.3% | |
| Burlington Northern Santa Fe Corp. | |
| 6.200% 08/15/36 | | | 500,000 | | | | 470,026 | | |
| TFM SA de CV | |
| 9.375% 05/01/12 | | | 3,310,000 | | | | 2,970,725 | | |
| | | Par (a) | | Value ($) | |
| Union Pacific Corp. | |
| 5.700% 08/15/18 | | | 1,440,000 | | | | 1,373,450 | | |
| | | | 4,814,201 | | |
| Transportation-Services – 0.2% | |
| Bristow Group, Inc. | |
| 7.500% 09/15/17 | | | 2,235,000 | | | | 1,944,450 | | |
| PHI, Inc. | |
| 7.125% 04/15/13 | | | 1,910,000 | | | | 1,556,650 | | |
| | | | 3,501,100 | | |
| Transportation Total | | | 14,967,876 | | |
| Industrials Total | | | 79,819,639 | | |
| Technology – 0.6% | |
| Computers – 0.3% | |
| Computer Services – 0.2% | |
| Sungard Data Systems, Inc. | |
| 9.125% 08/15/13 | | | 4,085,000 | | | | 3,931,812 | | |
| | | | 3,931,812 | | |
| Computers-Memory Devices – 0.1% | |
| Seagate Technology International | |
| 10.000% 05/01/14 (b) | | | 1,080,000 | | | | 1,090,800 | | |
| | | | 1,090,800 | | |
| Computers Total | | | 5,022,612 | | |
| Networking & Telecom Equipment – 0.0% | |
| Networking Products – 0.0% | |
| Cisco Systems, Inc. | |
| 5.900% 02/15/39 | | | 755,000 | | | | 731,309 | | |
| | | | 731,309 | | |
| Networking & Telecom Equipment Total | | | 731,309 | | |
| Office/Business Equipment – 0.0% | |
| Office Automation & Equipment – 0.0% | |
| Xerox Corp. | |
| 6.400% 03/15/16 | | | 545,000 | | | | 504,850 | | |
| | | | 504,850 | | |
| Office/Business Equipment Total | | | 504,850 | | |
| Semiconductors – 0.2% | |
| Electronic Components-Semiconductors – 0.2% | |
| Amkor Technology, Inc. | |
| 9.250% 06/01/16 | | | 2,425,000 | | | | 2,164,313 | | |
| Freescale Semiconductor, Inc. | |
| 12.500% 12/15/14 (i) | | | 1,854,702 | | | | 1,358,570 | | |
| | | | 3,522,883 | | |
| Semiconductors Total | | | 3,522,883 | | |
See Accompanying Notes to Financial Statements.
18
Columbia Strategic Income Fund, May 31, 2009
| Corporate Fixed-Income Bonds & Notes (continued) | |
| | | Par (a) | | Value ($) | |
| Software – 0.1% | |
| Enterprise Software/Services – 0.1% | |
| Oracle Corp. | |
| 6.500% 04/15/38 | | | 1,140,000 | | | | 1,196,658 | | |
| 5.000% 01/15/11 | | | 665,000 | | | | 699,502 | | |
| | | | 1,896,160 | | |
| Software Total | | | 1,896,160 | | |
| Technology Total | | | 11,677,814 | | |
| Utilities – 2.3% | |
| Electric – 2.0% | |
| Electric-Generation – 0.6% | |
| AES Corp. | |
| 7.750% 03/01/14 | | | 3,675,000 | | | | 3,500,437 | | |
| 8.000% 10/15/17 | | | 1,445,000 | | | | 1,343,850 | | |
| Edison Mission Energy | |
| 7.000% 05/15/17 | | | 2,615,000 | | | | 1,895,875 | | |
| Intergen NV | |
| 9.000% 06/30/17 (b) | | | 5,360,000 | | | | 5,118,800 | | |
| | | | 11,858,962 | | |
| Electric-Integrated – 0.9% | |
| CMS Energy Corp. | |
| 6.875% 12/15/15 | | | 2,275,000 | | | | 2,053,756 | | |
| Commonwealth Edison Co. | |
| 4.700% 04/15/15 | | | 1,920,000 | | | | 1,805,453 | | |
| 5.950% 08/15/16 | | | 950,000 | | | | 954,475 | | |
| Consolidated Edison Co. of New York, Inc. | |
| 6.750% 04/01/38 | | | 1,040,000 | | | | 1,133,798 | | |
| Energy Future Holdings Corp. | |
PIK,
11.250% 11/01/17 | | | 7,722,100 | | | | 3,962,402 | | |
| Ipalco Enterprises, Inc. | |
| 7.250% 04/01/16 (b) | | | 2,565,000 | | | | 2,462,400 | | |
| Kansas City Power & Light Co. | |
| 7.150% 04/01/19 | | | 835,000 | | | | 863,632 | | |
| Mirant Mid Atlantic LLC | |
| 8.625% 06/30/12 | | | 342,242 | | | | 335,397 | | |
| Texas Competitive Electric Holdings Co., LLC | |
PIK,
10.500% 11/01/16 | | | 9,405,906 | | | | 3,680,060 | | |
| | | | 17,251,373 | | |
| Independent Power Producer – 0.5% | |
| Dynegy Holdings, Inc. | |
| 7.125% 05/15/18 | | | 5,400,000 | | | | 3,456,000 | | |
| Mirant North America LLC | |
| 7.375% 12/31/13 | | | 1,005,000 | | | | 962,288 | | |
| | | Par (a) | | Value ($) | |
| NRG Energy, Inc. | |
| 7.375% 02/01/16 | | | 1,890,000 | | | | 1,778,962 | | |
| 7.375% 01/15/17 | | | 2,320,000 | | | | 2,180,800 | | |
| NSG Holdings LLC/NSG Holdings, Inc. | |
| 7.750% 12/15/25 (b) | | | 2,810,000 | | | | 2,262,050 | | |
| | | | 10,640,100 | | |
| Electric Total | | | 39,750,435 | | |
| Gas – 0.1% | |
| Gas-Distribution – 0.1% | |
| Atmos Energy Corp. | |
| 8.500% 03/15/19 | | | 580,000 | | | | 642,213 | | |
| Centerpoint Energy, Inc. | |
| 5.950% 02/01/17 | | | 480,000 | | | | 405,628 | | |
| 6.500% 05/01/18 | | | 1,140,000 | | | | 976,028 | | |
| Sempra Energy | |
| 6.500% 06/01/16 | | | 310,000 | | | | 316,285 | | |
| | | | 2,340,154 | | |
| Gas Total | | | 2,340,154 | | |
| Other Industrial Development Bonds – 0.2% | |
| Electric-Integrated – 0.2% | |
| Mirant Americas Generation LLC | |
| 8.500% 10/01/21 | | | 4,280,000 | | | | 3,552,400 | | |
| | | | 3,552,400 | | |
| Other Industrial Development Bonds Total | | | 3,552,400 | | |
| Utilities Total | | | 45,642,989 | | |
Total Corporate Fixed-Income Bonds & Notes
(cost of $790,804,636) | | | 742,487,073 | | |
| Mortgage-Backed Securities – 7.0% | |
| Federal Home Loan Mortgage Corp. | |
| 5.000% 05/01/21 | | | 12,807,024 | | | | 13,298,742 | | |
| 7.500% 03/01/16 | | | 475 | | | | 501 | | |
| 8.000% 05/01/10 | | | 27 | | | | 28 | | |
| 8.000% 05/01/16 | | | 105 | | | | 108 | | |
| 9.000% 12/01/18 | | | 536 | | | | 590 | | |
| 9.000% 01/01/22 | | | 16,426 | | | | 18,351 | | |
| 9.250% 05/01/16 | | | 44,207 | | | | 49,349 | | |
| 9.500% 08/01/16 | | | 477 | | | | 533 | | |
| 9.750% 09/01/16 | | | 1,122 | | | | 1,237 | | |
| 10.000% 07/01/09 | | | 12 | | | | 12 | | |
| 10.000% 11/01/16 | | | 1,323 | | | | 1,360 | | |
| 10.000% 10/01/19 | | | 2,306 | | | | 2,586 | | |
| 10.000% 11/01/19 | | | 4,610 | | | | 5,191 | | |
| 10.500% 01/01/20 | | | 5,186 | | | | 5,766 | | |
| 10.750% 05/01/10 | | | 1,260 | | | | 1,286 | | |
| 10.750% 07/01/11 | | | 9,532 | | | | 10,022 | | |
See Accompanying Notes to Financial Statements.
19
Columbia Strategic Income Fund, May 31, 2009
| Mortgage-Backed Securities (continued) | |
| | | Par (a) | | Value ($) | |
| 10.750% 09/01/13 | | | 1,568 | | | | 1,601 | | |
| 11.250% 08/01/13 | | | 748 | | | | 765 | | |
| 11.250% 09/01/15 | | | 5,721 | | | | 6,611 | | |
| Federal National Mortgage Association | |
| 4.000% 01/01/39 | | | 19,254,369 | | | | 19,037,709 | | |
| 5.000% 09/01/37 | | | 12,594,323 | | | | 12,913,248 | | |
| 5.500% 11/01/36 | | | 9,611,941 | | | | 9,951,863 | | |
| 6.000% 10/01/36 | | | 3,951,725 | | | | 4,145,195 | | |
| 6.000% 02/01/37 | | | 11,904,621 | | | | 12,487,451 | | |
| 6.000% 08/01/37 | | | 17,972,612 | | | | 18,838,480 | | |
| 6.500% 12/01/31 | | | 18,375 | | | | 19,819 | | |
| 6.500% 05/01/32 | | | 24,602 | | | | 26,504 | | |
| 6.500% 01/01/33 | | | 12,120 | | | | 13,057 | | |
| 6.500% 05/01/33 | | | 62,989 | | | | 67,938 | | |
| 6.500% 11/01/36 | | | 26,757,474 | | | | 28,546,044 | | |
| 6.500% 11/01/37 | | | 16,290,153 | | | | 17,378,132 | | |
| 8.500% 06/01/15 | | | 334 | | | | 355 | | |
| 8.500% 09/01/21 | | | 3,528 | | | | 3,595 | | |
| 9.000% 04/01/10 | | | 12 | | | | 12 | | |
| 9.000% 05/01/12 | | | 3,922 | | | | 4,090 | | |
| 9.000% 09/01/13 | | | 6 | | | | 6 | | |
| 9.000% 07/01/14 | | | 550 | | | | 595 | | |
| 9.000% 04/01/16 | | | 42 | | | | 43 | | |
| 9.000% 12/01/16 | | | 1 | | | | 1 | | |
| 9.000% 08/01/21 | | | 20,315 | | | | 20,701 | | |
| 10.000% 04/01/14 | | | 38,828 | | | | 42,599 | | |
| 10.000% 03/01/16 | | | 474 | | | | 486 | | |
| 10.500% 07/01/14 | | | 16,510 | | | | 16,875 | | |
| 10.500% 01/01/16 | | | 315 | | | | 326 | | |
| 10.500% 03/01/16 | | | 107,138 | | | | 120,634 | | |
| Government National Mortgage Association | |
| 9.000% 05/15/16 | | | 20,047 | | | | 21,716 | | |
| 9.000% 06/15/16 | | | 17,505 | | | | 18,963 | | |
| 9.000% 07/15/16 | | | 43,594 | | | | 47,227 | | |
| 9.000% 08/15/16 | | | 35,297 | | | | 38,237 | | |
| 9.000% 09/15/16 | | | 72,611 | | | | 78,557 | | |
| 9.000% 10/15/16 | | | 10,248 | | | | 11,101 | | |
| 9.000% 11/15/16 | | | 29,435 | | | | 31,738 | | |
| 9.000% 12/15/16 | | | 29,517 | | | | 31,975 | | |
| 9.000% 01/15/17 | | | 2,145 | | | | 2,320 | | |
| 9.000% 02/15/17 | | | 4,729 | | | | 5,116 | | |
| 9.000% 04/15/17 | | | 8,803 | | | | 9,522 | | |
| 9.000% 07/15/17 | | | 24,536 | | | | 26,540 | | |
| 9.000% 10/15/17 | | | 7,804 | | | | 8,441 | | |
| 9.000% 12/15/17 | | | 8,669 | | | | 9,592 | | |
| 9.500% 08/15/09 | | | 198 | | | | 201 | | |
| 9.500% 09/15/09 | | | 2,234 | | | | 2,268 | | |
| 9.500% 10/15/09 | | | 4,622 | | | | 4,687 | | |
| 9.500% 11/15/09 | | | 1,537 | | | | 1,560 | | |
| 9.500% 10/15/16 | | | 6,276 | | | | 6,888 | | |
| 9.500% 08/15/17 | | | 5,109 | | | | 5,604 | | |
| | | Par (a) | | Value ($) | |
| 9.500% 09/15/17 | | | 1,818 | | | | 1,994 | | |
| 10.000% 11/15/09 | | | 1,082 | | | | 1,102 | | |
| 10.000% 01/15/10 | | | 123 | | | | 125 | | |
| 10.000% 09/15/17 | | | 21,735 | | | | 23,725 | | |
| 10.000% 11/15/17 | | | 3,088 | | | | 3,370 | | |
| 10.000% 02/15/18 | | | 11,463 | | | | 12,513 | | |
| 10.000% 08/15/18 | | | 251 | | | | 275 | | |
| 10.000% 09/15/18 | | | 2,628 | | | | 2,870 | | |
| 10.000% 11/15/18 | | | 6,646 | | | | 7,256 | | |
| 10.000% 03/15/19 | | | 8,390 | | | | 9,122 | | |
| 10.000% 06/15/19 | | | 1,586 | | | | 1,731 | | |
| 10.000% 08/15/19 | | | 1,438 | | | | 1,563 | | |
| 10.000% 11/15/20 | | | 1,491 | | | | 1,622 | | |
| 10.500% 12/15/10 | | | 18 | | | | 19 | | |
| 10.500% 10/15/15 | | | 4,701 | | | | 5,215 | | |
| 10.500% 12/15/15 | | | 622 | | | | 690 | | |
| 10.500% 01/15/16 | | | 2,811 | | | | 3,137 | | |
| 10.500% 10/15/17 | | | 7,712 | | | | 8,582 | | |
| 10.500% 12/15/17 | | | 2,631 | | | | 2,929 | | |
| 10.500% 01/15/18 | | | 4,694 | | | | 5,238 | | |
| 10.500% 07/15/18 | | | 922 | | | | 1,029 | | |
| 10.500% 12/15/18 | | | 875 | | | | 976 | | |
| 10.500% 05/15/19 | | | 72 | | | | 73 | | |
| 10.500% 06/15/19 | | | 1,589 | | | | 1,774 | | |
| 10.500% 07/15/19 | | | 738 | | | | 824 | | |
| 11.000% 09/15/15 | | | 43,548 | | | | 48,761 | | |
| 11.000% 10/15/15 | | | 27,175 | | | | 30,422 | | |
| 11.750% 08/15/13 | | | 5,140 | | | | 5,667 | | |
| 12.000% 05/15/14 | | | 213 | | | | 237 | | |
Total Mortgage-Backed Securities
(cost of $133,509,793) | | | 137,585,491 | | |
| Asset-Backed Securities – 0.3% | |
| Equity One ABS, Inc. | |
| 4.205% 04/25/34 | | | 5,050,000 | | | | 4,315,765 | | |
| First Plus Home Loan Trust | |
| 7.720% 05/10/24 | | | 2,930 | | | | 2,928 | | |
| GMAC Mortgage Corp. | |
| 4.865% 09/25/34 (c) | | | 3,912,454 | | | | 2,341,408 | | |
Total Asset-Backed Securities
(cost of $8,929,169) | | | 6,660,101 | | |
| Commercial Mortgage-Backed Security – 0.2% | |
| Commercial Mortgage-Backed Security – 0.2% | |
| Wachovia Bank Commercial Mortgage Trust | |
| 5.726% 06/15/45 | | | 3,182,748 | | | | 3,189,178 | | |
| Commercial Mortgage-Backed Security Total | | | 3,189,178 | | |
Total Commercial Mortgage-Backed Security
(cost of $3,085,277) | | | 3,189,178 | | |
See Accompanying Notes to Financial Statements.
20
Columbia Strategic Income Fund, May 31, 2009
| Municipal Bonds – 0.2% | |
| | | Par (a) | | Value ($) | |
| California – 0.1% | |
| CA Cabazon Band Mission Indians | |
Series 2004,
13.000% 10/01/11 | | | 2,820,000 | | | | 2,149,940 | | |
| California Total | | | 2,149,940 | | |
| Virginia – 0.1% | |
| VA Tobacco Settlement Financing Corp. | |
Series 2007 A1,
6.706% 06/01/46 | | | 2,455,000 | | | | 1,337,729 | | |
| Virginia Total | | | 1,337,729 | | |
Total Municipal Bonds
(cost of $5,274,754) | | | 3,487,669 | | |
| Convertible Bond – 0.1% | |
| Communications – 0.1% | |
| Telecommunications – 0.1% | |
| Telecom Services – 0.1% | |
| Virgin Media, Inc. | |
| 6.500% 11/15/16 (b) | | | 3,030,000 | | | | 2,344,463 | | |
| | | | 2,344,463 | | |
| Telecom Services Total | | | 2,344,463 | | |
| Communications Total | | | 2,344,463 | | |
Total Convertible Bond
(cost of $1,388,226) | | | 2,344,463 | | |
| Collateralized Mortgage Obligation – 0.0% | |
| Agency – 0.0% | |
| Federal Home Loan Mortgage Corp. | |
I.O.,
5.500% 05/15/27 | | | 51,610 | | | | 507 | | |
| Agency Total | | | 507 | | |
Total Collateralized Mortgage Obligation
(cost of $6) | | | 507 | | |
| Preferred Stock – 0.0% | |
| | | Shares | | | |
| Communications – 0.0% | |
| Media – 0.0% | |
| Radio – 0.0% | |
| CMP Susquehanna Radio Holdings Corp., | |
| Series A (b)(h)(l) | | | 40,765 | | | | 408 | | |
| Radio Total | | | 408 | | |
| Communications Total | | | 408 | | |
Total Preferred Stock
(cost of $408) | | | 408 | | |
| Warrants – 0.0% | |
| | | Units | | Value ($) | |
| Financials – 0.0% | |
| Banks – 0.0% | |
| CNB Capital Trust I | |
| Expires 03/23/19 (h)(l) | | | 46,584 | | | | 466 | | |
| Banks Total | | | 466 | | |
| Financials Total | | | 466 | | |
Total Warrants
(cost of $466) | | | 466 | | |
| Securities Lending Collateral – 10.9% | |
| | | Shares | | | |
State Street Navigator
Securities Lending
Prime Portfolio
(7 day yield of 0.850%) (m) | | | 215,396,043 | | | | 215,396,043 | | |
Total Securities Lending Collateral
(cost of $215,396,043) | | | 215,396,043 | | |
| Short-Term Obligation – 5.9% | |
| | | Par ($) | | | |
Repurchase agreement with
Fixed Income Clearing Corp.,
dated 05/29/09, due 06/01/09
at 0.120%, collateralized by a
U.S. Government Agency
obligation maturing 07/18/11,
market value $117,581,625
(repurchase proceeds
$115,276,153) | | | 115,275,000 | | | | 115,275,000 | | |
Total Short-Term Obligation
(cost of $115,275,000) | | | 115,275,000 | | |
Total Investments – 109.6%
(cost of $2,187,238,924)(n) | | | 2,155,292,376 | | |
Obligation to Return Collateral for
Securities Loaned – (10.9)% | | | (215,396,043 | ) | |
| Other Assets & Liabilities, Net – 1.3% | | | 26,501,806 | | |
| Net Assets – 100.0% | | | 1,966,398,139 | | |
See Accompanying Notes to Financial Statements.
21
Columbia Strategic Income Fund, May 31, 2009
Notes to Investment Portfolio:
(a) Principal amount is stated in U.S. dollars unless otherwise noted.
(b) Security exempt from registration pursuant to Rule 144A under the Securities Act of 1933. These securities may be resold in transactions exempt from registration, normally to qualified institutional buyers. At May 31, 2009, these securities, which are not illiquid except for the following, amounted to $163,593,059, which represents 8.3% of net assets.
| Security | | Acquisition
Date | | Par/Unit | | Cost | | Value | |
Local TV
Finance LLC PIK, 05/02/07 -
9.250% 06/15/15 | | 06/18/08 | | $ | 1,885,000 | | | $ | 1,801,331 | | | $ | 261,256 | | |
Orascom Telecom
Finance SCA
7.875% 02/08/14 | | 02/01/07 | | | 1,150,000 | | | | 1,150,000 | | | | 943,000 | | |
Seminole Indian
Tribe of Florida 09/26/07 -
7.804% 10/01/20 | | 10/04/07 | | | 3,215,000 | | | | 3,265,055 | | | | 2,693,109 | | |
| | | $ | 3,897,365 | | |
(c) The interest rate shown on floating rate or variable rate securities reflects the rate at May 31, 2009.
(d) All or a portion of this security was on loan at May 31, 2009. The total market value of securities on loan at May 31, 2009 is $213,085,043.
(e) Zero coupon bond.
(f) The issuer is in default of certain debt covenants. Income is not being accrued. At May 31, 2009, the value of this security amounted to $315,100, which represents less than 0.1% of net assets.
(g) The issuer has filed for bankruptcy protection under Chapter 11, and is in default of certain covenants. Income is being accrued. At May 31, 2009, the value of these securities amounted to $7,889,942, which represents 0.4% of net assets.
(h) Represents fair value as determined in good faith under procedures approved by the Board of Trustees. The value of these securities amounted to $79,624, which represents less than 0.1% of net assets.
(i) Loan participation agreement.
(j) The issuer has filed for bankruptcy protection under Chapter 11, and is in default of certain debt covenants. Income is not being accrued. At May 31, 2009, the value of these securities amounted to $1,531,462, which represents 0.1% of net assets.
(k) Step bond. This security is currently not paying coupon. Shown parenthetically is the next interest rate to be paid and the date the Fund will begin accruing at this rate.
(l) Non-income producing security.
(m) Investment made with cash collateral received from securities lending activity.
(n) Cost for federal income tax purposes is $2,214,068,237.
(o) The issuer filed for bankruptcy protection under Chapter 11 on June 1, 2009. At May 31, 2009, the value of these securities amounted to $865,163, which represents less than 0.1% of net assets.
(p) The issuer filed for bankruptcy protection on June 13, 2009. At May 31, 2009, the value of this security amounted to $241,335, which represents less than 0.1% of net assets.
The following table summarizes the inputs used, as of May 31, 2009, in valuing the Fund's assets:
| Valuation Inputs | | Investments in
Securities | | Other Financial
Instruments* | |
| Level 1 – Quoted Prices | | $ | 527,275,517 | | | $ | – | | |
Level 2 – Other Significant
Observable Inputs | | | 1,627,601,838 | | | | (5,957,506 | ) | |
Level 3 – Significant
Unobservable Inputs | | | 415,021 | | | | – | | |
| Total | | $ | 2,155,292,376 | | | $ | (5,957,506 | ) | |
* Other financial instruments consist of forward foreign currency exchange contracts which are not included in the investment portfolio.
The Fund's assets assigned to the Level 2 input category include certain foreign securities for which a third party statistical pricing service may be employed for purposes of fair market valuation.
The following table reconciles asset balances for the year ended May 31, 2009, in which significant unobservable inputs (Level 3) were used in determining value:
| | | Investments in
Securities | | Other Financial
Instruments | |
| Balance as of May 31, 2008 | | $ | 3,135,365 | | | $ | – | | |
Accretion of Discounts/
Amortization of Premiums | | | – | | | | – | | |
| Realized loss | | | (4,358 | ) | | | – | | |
| Change in unrealized depreciation | | | (2,758,049 | ) | | | – | | |
| Net purchases | | | 100,025 | | | | – | | |
| Transfers out of Level 3 | | | (57,962 | ) | | | – | | |
| Balance as of May 31, 2009 | | $ | 415,021 | | | $ | – | | |
The information in the above reconciliation represents fiscal year to date activity for any securities identified as using Level 3 inputs at either the beginning or the end of the current fiscal period.
The change in unrealized losses attributable to securities owned at May 31, 2009 which were valued using significant unobservable inputs (Level 3) amounted to $2,758,049. This amount is included in net change in unrealized depreciation on the Statement of Changes in Net Assets.
For more information on valuation inputs, and their aggregation into the levels used in the tables above, please refer to the Security Valuation section in the accompanying Notes to Financial Statements.
Forward foreign currency exchange contracts outstanding on May 31, 2009 are:
Forward
Foreign
Currency
Exchange
Contracts
to Buy | |
Value | |
Aggregate
Face Value | |
Settlement
Date | |
Unrealized
Appreciation | |
| CAD | | | | $ | 6,183,348 | | | $ | 5,935,391 | | | 06/17/09 | | $ | 247,957 | | |
| EUR | | | | | 720,871 | | | | 708,237 | | | 06/24/09 | | | 12,634 | | |
| GBP | | | | | 137,375 | | | | 134,963 | | | 06/24/09 | | | 2,412 | | |
| JPY | | | | | 11,860,628 | | | | 11,832,832 | | | 06/08/09 | | | 27,796 | | |
| | | $ | 290,799 | | |
Forward
Foreign
Currency
Exchange
Contracts
to Sell | |
Value | |
Aggregate
Face Value | |
Settlement
Date | |
Unrealized
Depreciation | |
| CAD | | | | $ | 9,114,713 | | | $ | 8,598,267 | | | 06/17/09 | | $ | (516,446 | ) | |
| CAD | | | | | 9,114,713 | | | | 8,593,959 | | | 06/17/09 | | | (520,754 | ) | |
| CAD | | | | | 10,580,855 | | | | 10,276,989 | | | 06/24/09 | | | (303,866 | ) | |
| EUR | | | | | 7,322,909 | | | | 6,793,984 | | | 06/03/09 | | | (528,925 | ) | |
| EUR | | | | | 7,322,909 | | | | 6,797,092 | | | 06/03/09 | | | (525,817 | ) | |
| EUR | | | | | 14,136,890 | | | | 13,126,550 | | | 06/03/09 | | | (1,010,340 | ) | |
| EUR | | | | | 4,622,290 | | | | 4,404,559 | | | 06/17/09 | | | (217,731 | ) | |
| EUR | | | | | 11,018,578 | | | | 10,526,212 | | | 06/17/09 | | | (492,366 | ) | |
| EUR | | | | | 10,629,853 | | | | 10,131,621 | | | 06/17/09 | | | (498,232 | ) | |
| EUR | | | | | 8,940,210 | | | | 8,605,384 | | | 06/24/09 | | | (334,826 | ) | |
| EUR | | | | | 8,940,210 | | | | 8,602,127 | | | 06/24/09 | | | (338,083 | ) | |
| EUR | | | | | 3,505,587 | | | | 3,372,970 | | | 06/24/09 | | | (132,617 | ) | |
| GBP | | | | | 9,179,918 | | | | 8,804,000 | | | 06/24/09 | | | (375,918 | ) | |
| GBP | | | | | 137,375 | | | | 131,478 | | | 06/24/09 | | | (5,897 | ) | |
| JPY | | | | | 11,860,628 | | | | 11,414,141 | | | 06/08/09 | | | (446,487 | ) | |
| | | $ | (6,248,305 | ) | |
See Accompanying Notes to Financial Statements.
22
Columbia Strategic Income Fund, May 31, 2009
At May 31, 2009, the asset allocation of the Fund is as follows:
| Asset Allocation (Unaudited) | | % of
Net Assets | |
| Government & Agency Obligations | | | 47.2 | | |
| Corporate Fixed-Income Bonds & Notes | | | 37.8 | | |
| Mortgage-Backed Securities | | | 7.0 | | |
| Asset-Backed Securities | | | 0.3 | | |
| Commercial Mortgage-Backed Security | | | 0.2 | | |
| Municipal Bonds | | | 0.2 | | |
| Convertible Bond | | | 0.1 | | |
| Collateralized Mortgage Obligation | | | 0.0 | * | |
| Preferred Stock | | | 0.0 | * | |
| Warrants | | | 0.0 | * | |
| | | | 92.8 | | |
| Securities Lending Collateral | | | 10.9 | | |
| Short-Term Obligation | | | 5.9 | | |
| Obligation to Return Collateral for Securities Loaned | | | (10.9 | ) | |
| Other Assets & Liabilities, Net | | | 1.3 | | |
| | | | 100.0 | | |
* Rounds to less than 0.1%.
| Acronym | | Name | |
| AUD | | Australian Dollar | |
|
| BRL | | Brazilian Real | |
|
| CAD | | Canadian Dollar | |
|
| EUR | | Euro | |
|
| GBP | | Pound Sterling | |
|
| I.O. | | Interest Only | |
|
| JPY | | Japanese Yen | |
|
| NOK | | Norwegian Krone | |
|
| NZD | | New Zealand Dollar | |
|
| PIK | | Payment-In-Kind | |
|
| PLN | | Polish Zloty | |
|
| P.O. | | Principal Only | |
|
| SEK | | Swedish Krona | |
|
| STRIPS | | Separate Trading of Registered Interest and Principal of Securities | |
|
| ZAR | | South African Rand | |
|
See Accompanying Notes to Financial Statements.
23
Statement of Assets and Liabilities – Columbia Strategic Income Fund
May 31, 2009
| | | | | ($) | |
| Assets | | Investments, at cost | | | 2,187,238,924 | | |
| | | Investments at value (including securities on loan of $213,085,043) | | | 2,155,292,376 | | |
| | | Cash | | | 361 | | |
| | | Cash collateral held for forward foreign currency exchange contracts | | | 300,000 | | |
| | | Foreign currency (cost of $1,833,353) | | | 1,843,445 | | |
| | | Unrealized appreciation on forward foreign currency exchange contracts | | | 290,799 | | |
| | | Receivable for: | | | | | |
| | | Investments sold | | | 7,317,016 | | |
| | | Fund shares sold | | | 6,445,031 | | |
| | | Interest | | | 34,658,525 | | |
| | | Securities lending | | | 66,788 | | |
| | | Foreign tax reclaims | | | 3,254 | | |
| | | Trustees' deferred compensation plan | | | 84,393 | | |
| | | Prepaid expenses | | | 40,117 | | |
| | | Total Assets | | | 2,206,342,105 | | |
| Liabilities | | Collateral on securites loaned | | | 215,396,043 | | |
| | | Unrealized depreciation on forward foreign currency exchange contracts | | | 6,248,305 | | |
| | | Payable for: | | | | | |
| | | Investments purchased | | | 13,586,335 | | |
| | | Fund shares repurchased | | | 2,777,359 | | |
| | | Investment advisory fee | | | 877,595 | | |
| | | Transfer agent fee | | | 339,588 | | |
| | | Trustees' fees | | | 34,112 | | |
| | | Pricing and bookkeeping fees | | | 20,907 | | |
| | | Custody fee | | | 38,077 | | |
| | | Distribution and service fees | | | 432,027 | | |
| | | Chief compliance officer expenses | | | 200 | | |
| | | Trustees' deferred compensation plan | | | 84,393 | | |
| | | Other liabilities | | | 109,025 | | |
| | | Total Liabilities | | | 239,943,966 | | |
| | | Net Assets | | | 1,966,398,139 | | |
| Net Assets Consist of | | Paid-in capital | | | 2,310,311,882 | | |
| | | Overdistributed net investment income | | | (36,718,149 | ) | |
| | | Accumulated net realized loss | | | (269,757,205 | ) | |
| | | Net unrealized appreciation (depreciation) on: | | | | | |
| | | Investments | | | (31,946,548 | ) | |
| | | Foreign currency translations | | | (5,491,841 | ) | |
| | | Net Assets | | | 1,966,398,139 | | |
See Accompanying Notes to Financial Statements.
24
Statement of Assets and Liabilities – Columbia Strategic Income Fund
May 31, 2009 (continued)
| Class A | | Net assets | | $ | 913,086,664 | | |
| | | Shares outstanding | | | 168,947,598 | | |
| | | Net asset value per share | | $ | 5.40 | (a) | |
| | | Maximum sales charge | | | 4.75 | % | |
| | | Maximum offering price per share ($5.40/0.9525) | | $ | 5.67 | (b) | |
| Class B | | Net assets | | $ | 122,915,215 | | |
| | | Shares outstanding | | | 22,757,425 | | |
| | | Net asset value and offering price per share | | $ | 5.40 | (a) | |
| Class C | | Net assets | | $ | 157,492,375 | | |
| | | Shares outstanding | | | 29,130,226 | | |
| | | Net asset value and offering price per share | | $ | 5.41 | (a) | |
| Class J | | Net assets | | $ | 68,786,009 | | |
| | | Shares outstanding | | | 12,782,816 | | |
| | | Net asset value and redemption price per share | | $ | 5.38 | | |
| | | Maximum sales charge | | | 3.00 | % | |
| | | Maximum offering price per share ($5.38/0.9700) | | $ | 5.55 | (c) | |
| Class Z | | Net assets | | $ | 704,117,876 | | |
| | | Shares outstanding | | | 131,672,845 | | |
| | | Net asset value, offering and redemption price per share | | $ | 5.35 | | |
(a) Redemption price per share is equal to net asset value less any applicable contingent deferred sales charge.
(b) On sales of $50,000 or more the offering price is reduced.
(c) On sales of 10,000 or more shares the offering price is reduced.
See Accompanying Notes to Financial Statements.
25
Statement of Operations – Columbia Strategic Income Fund
For the Year Ended May 31, 2009
| | | | | ($) | |
| Investment Income | | Interest | | | 114,294,444 | | |
| | | Dividends | | | 17,252 | | |
| | | Securities lending | | | 3,211,010 | | |
| | | Foreign taxes withheld | | | (61 | ) | |
| | | Total Investment Income | | | 117,522,645 | | |
| Expenses | | Investment advisory fee | | | 9,937,336 | | |
| | | Distribution fee: | | | | | |
| | | Class B | | | 1,036,496 | | |
| | | Class C | | | 941,608 | | |
| | | Class J | | | 280,063 | | |
| | | Printing fee—Class J | | | 61,828 | | |
| | | Legal fee—Class J | | | 49,085 | | |
| | | Service fee: | | | | | |
| | | Class A | | | 2,003,867 | | |
| | | Class B | | | 340,820 | | |
| | | Class C | | | 309,870 | | |
| | | Class J | | | 197,288 | | |
| | | Transfer agent fee | | | 2,367,472 | | |
| | | Pricing & bookkeeping fees | | | 181,682 | | |
| | | Trustees' fees | | | 67,458 | | |
| | | Custody fee | | | 237,188 | | |
| | | Chief compliance officer expenses | | | 1,217 | | |
| | | Other expenses | | | 600,373 | | |
| | | Total Expenses | | | 18,613,651 | | |
| | | Fees waived by distributor—Class C | | | (188,819 | ) | |
| | | Expense reductions | | | (20,670 | ) | |
| | | Net Expenses | | | 18,404,162 | | |
| | | Net Investment Income | | | 99,118,483 | | |
| Net Realized and Unrealized Gain (Loss) on Investments, Foreign Currency and Credit Default Swap Contracts | |
| | | Net realized gain (loss) on: | | | | | |
| | | Investments | | | (86,015,968 | ) | |
| | | Credit default swap contracts | | | (566,072 | ) | |
| | | Foreign currency transactions and foreign currency exchange contracts | | | 20,441,653 | | |
| | | Net realized loss | | | (66,140,387 | ) | |
| | | Net change in unrealized appreciation (depreciation) on: | | | | | |
| | | Investments | | | (65,646,888 | ) | |
| | | Foreign currency translations and foreign currency exchange contracts | | | (4,973,158 | ) | |
| | | Net change in unrealized appreciation (depreciation) | | | (70,620,046 | ) | |
| | | Net Loss | | | (136,760,433 | ) | |
| | | Net Decrease Resulting from Operations | | | (37,641,950 | ) | |
See Accompanying Notes to Financial Statements.
26
Statement of Changes in Net Assets – Columbia Strategic Income Fund
| | | | | Year Ended May 31, | |
| Increase (Decrease) in Net Assets | | | | 2009 ($) | | 2008 ($) | |
| Operations | | Net investment income | | | 99,118,483 | | | | 97,386,195 | | |
| | | Net realized loss on investments,
foreign currency transactions, forward foreign | | | | | | | | | |
| | | currency exchange contracts, futures contracts
and credit default swap contracts | | | (66,140,387 | ) | | | (18,111,351 | ) | |
| | | Net change in unrealized appreciation (depreciation)
on investments, foreign currency translations, forward
foreign currency exchange contracts and futures contracts | | | (70,620,046 | ) | | | 2,202,382 | | |
| | | Net increase (decrease) resulting from operations | | | (37,641,950 | ) | | | 81,477,226 | | |
| Distributions to Shareholders | | From net investment income: | | | | | | | | | |
| | | Class A | | | (57,060,432 | ) | | | (50,892,739 | ) | |
| | | Class B | | | (8,611,936 | ) | | | (9,849,548 | ) | |
| | | Class C | | | (7,993,115 | ) | | | (6,352,948 | ) | |
| | | Class J | | | (5,287,255 | ) | | | (6,462,217 | ) | |
| | | Class Z | | | (49,353,292 | ) | | | (39,628,577 | ) | |
| | | From return of capital: | | | | | | | | | |
| | | Class A | | | (702,945 | ) | | | — | | |
| | | Class B | | | (119,557 | ) | | | — | | |
| | | Class C | | | (108,706 | ) | | | — | | |
| | | Class J | | | (69,207 | ) | | | — | | |
| | | Class Z | | | (579,621 | ) | | | — | | |
| | | Total distributions to shareholders | | | (129,886,066 | ) | | | (113,186,029 | ) | |
| | | Net Capital Stock Transactions | | | 141,335,342 | | | | 210,069,602 | | |
| | | Total increase (decrease) in net assets | | | (26,192,674 | ) | | | 178,360,799 | | |
| Net Assets | | Beginning of period | | | 1,992,590,813 | | | | 1,814,230,014 | | |
| | | End of period | | | 1,966,398,139 | | | | 1,992,590,813 | | |
| | | Overdistibuted net investment income, at end of period | | | (36,718,149 | ) | | | (22,792,169 | ) | |
See Accompanying Notes to Financial Statements.
27
Statement of Changes in Net Assets (continued) – Columbia Strategic Income Fund
| | | Capital Stock Activity | |
| | | Year Ended
May 31, 2009 | | Year Ended
May 31, 2008 | |
| | | Shares | | Dollars ($) | | Shares | | Dollars ($) | |
| Class A | |
| Subscriptions | | | 53,577,581 | | | | 283,555,235 | | | | 31,848,528 | | | | 189,657,562 | | |
| Distributions reinvested | | | 8,141,052 | | | | 43,338,175 | | | | 6,012,418 | | | | 35,665,784 | | |
| Redemptions | | | (39,168,426 | ) | | | (208,915,943 | ) | | | (30,569,080 | ) | | | (181,842,631 | ) | |
| Net increase | | | 22,550,207 | | | | 117,977,467 | | | | 7,291,866 | | | | 43,480,715 | | |
| Class B | |
| Subscriptions | | | 4,621,544 | | | | 24,896,368 | | | | 3,662,880 | | | | 21,783,584 | | |
| Distributions reinvested | | | 1,030,847 | | | | 5,497,354 | | | | 1,015,372 | | | | 6,018,471 | | |
| Redemptions | | | (11,507,422 | ) | | | (61,525,583 | ) | | | (12,253,467 | ) | | | (72,884,532 | ) | |
| Net decrease | | | (5,855,031 | ) | | | (31,131,861 | ) | | | (7,575,215 | ) | | | (45,082,477 | ) | |
| Class C | |
| Subscriptions | | | 13,411,529 | | | | 71,085,228 | | | | 7,741,845 | | | | 46,095,457 | | |
| Distributions reinvested | | | 1,024,271 | | | | 5,457,973 | | | | 728,030 | | | | 4,320,524 | | |
| Redemptions | | | (7,365,007 | ) | | | (39,434,647 | ) | | | (4,114,663 | ) | | | (24,491,364 | ) | |
| Net increase | | | 7,070,793 | | | | 37,108,554 | | | | 4,355,212 | | | | 25,924,617 | | |
| Class J | |
| Subscriptions | | | 38,700 | | | | 204,097 | | | | 52,960 | | | | 314,315 | | |
| Redemptions | | | (4,516,219 | ) | | | (24,428,285 | ) | | | (4,437,920 | ) | | | (26,328,075 | ) | |
| Net decrease | | | (4,477,519 | ) | | | (24,224,188 | ) | | | (4,384,960 | ) | | | (26,013,760 | ) | |
| Class Z | |
| Subscriptions | | | 41,547,367 | | | | 220,065,372 | | | | 50,836,758 | | | | 299,913,954 | | |
| Distributions reinvested | | | 1,571,363 | | | | 8,280,720 | | | | 948,121 | | | | 5,570,944 | | |
| Redemptions | | | (35,525,281 | ) | | | (186,740,722 | ) | | | (15,895,913 | ) | | | (93,724,391 | ) | |
| Net increase | | | 7,593,449 | | | | 41,605,370 | | | | 35,888,966 | | | | 211,760,507 | | |
See Accompanying Notes to Financial Statements.
28
Financial Highlights – Columbia Strategic Income Fund
Selected data for a share outstanding throughout each period is as follows:
| | | Year Ended May 31, | |
| Class A Shares | | 2009 | | 2008 | | 2007 | | 2006 | | 2005 | |
| Net Asset Value, Beginning of Period | | $ | 5.91 | | | $ | 6.01 | | | $ | 5.88 | | | $ | 6.15 | | | $ | 6.02 | | |
| Income from Investment Operations: | |
| Net investment income (a) | | | 0.29 | | | | 0.31 | | | | 0.33 | | | | 0.34 | | | | 0.36 | | |
Net realized and unrealized gain (loss) on investments,
foreign currency, futures contracts and credit default
swap contracts | | | (0.41 | ) | | | (0.05 | ) | | | 0.16 | | | | (0.15 | ) | | | 0.25 | | |
| Total from investment operations | | | (0.12 | ) | | | 0.26 | | | | 0.49 | | | | 0.19 | | | | 0.61 | | |
| Less Distributions to Shareholders: | |
| From net investment income | | | (0.38 | ) | | | (0.36 | ) | | | (0.36 | ) | | | (0.46 | ) | | | (0.48 | ) | |
| From return of capital | | | (0.01 | ) | | | — | | | | — | | | | — | | | | — | | |
| Total distributions to shareholders | | | (0.39 | ) | | | (0.36 | ) | | | (0.36 | ) | | | (0.46 | ) | | | (0.48 | ) | |
| Net Asset Value, End of Period | | $ | 5.40 | | | $ | 5.91 | | | $ | 6.01 | | | $ | 5.88 | | | $ | 6.15 | | |
| Total return (b) | | | (1.79 | )% | | | 4.47 | % | | | 8.57 | %(c)(d) | | | 3.24 | %(c) | | | 10.37 | % | |
| Ratios to Average Net Assets/Supplemental Data: | |
| Net expenses (e) | | | 0.98 | % | | | 0.95 | % | | | 0.95 | % | | | 0.99 | % | | | 1.09 | % | |
| Waiver/Reimbursement | | | — | | | | — | | | | 0.01 | % | | | 0.01 | % | | | — | | |
| Net investment income (e) | | | 5.46 | % | | | 5.24 | % | | | 5.49 | % | | | 5.56 | % | | | 5.81 | % | |
| Portfolio turnover rate | | | 43 | % | | | 41 | % | | | 49 | % | | | 56 | % | | | 57 | % | |
| Net assets, end of period (000's) | | $ | 913,087 | | | $ | 865,282 | | | $ | 835,878 | | | $ | 703,746 | | | $ | 615,772 | | |
(a) Per share data was calculated using the average shares outstanding during the period.
(b) Total return at net asset value assuming all distributions reinvested and no initial sales charge or contingent deferred sales charge.
(c) Had the investment advisor and/or any of its affiliates not waived fees or reimbursed a portion of expenses, total return would have been reduced.
(d) Total return includes a voluntary reimbursement by the investment advisor for a realized investment loss due to a trading error. This reimbursement increased total return and net asset value per share by less than 0.01% and less than $0.01, respectively.
(e) The benefits derived from expense reductions had an impact of less than 0.01%.
See Accompanying Notes to Financial Statements.
29
Financial Highlights – Columbia Strategic Income Fund
Selected data for a share outstanding throughout each period is as follows:
| | | Year Ended May 31, | |
| Class B Shares | | 2009 | | 2008 | | 2007 | | 2006 | | 2005 | |
| Net Asset Value, Beginning of Period | | $ | 5.91 | | | $ | 6.00 | | | $ | 5.88 | | | $ | 6.15 | | | $ | 6.02 | | |
| Income from Investment Operations: | |
| Net investment income (a) | | | 0.25 | | | | 0.27 | | | | 0.28 | | | | 0.29 | | | | 0.32 | | |
Net realized and unrealized gain (loss) on investments,
foreign currency, futures contracts and credit default
swap contracts | | | (0.41 | ) | | | (0.05 | ) | | | 0.16 | | | | (0.14 | ) | | | 0.25 | | |
| Total from investment operations | | | (0.16 | ) | | | 0.22 | | | | 0.44 | | | | 0.15 | | | | 0.57 | | |
| Less Distributions to Shareholders: | |
| From net investment income | | | (0.34 | ) | | | (0.31 | ) | | | (0.32 | ) | | | (0.42 | ) | | | (0.44 | ) | |
| From return of capital | | | (0.01 | ) | | | — | | | | — | | | | — | | | | — | | |
| Total distributions to shareholders | | | (0.35 | ) | | | (0.31 | ) | | | (0.32 | ) | | | (0.42 | ) | | | (0.44 | ) | |
| Net Asset Value, End of Period | | $ | 5.40 | | | $ | 5.91 | | | $ | 6.00 | | | $ | 5.88 | | | $ | 6.15 | | |
| Total return (b) | | | (2.52 | )% | | | 3.86 | % | | | 7.59 | %(c)(d) | | | 2.48 | %(c) | | | 9.55 | % | |
| Ratios to Average Net Assets/Supplemental Data: | |
| Net expenses (e) | | | 1.73 | % | | | 1.70 | % | | | 1.70 | % | | | 1.74 | % | | | 1.84 | % | |
| Waiver/Reimbursement | | | — | | | | — | | | | 0.01 | % | | | 0.01 | % | | | — | | |
| Net investment income (e) | | | 4.71 | % | | | 4.50 | % | | | 4.75 | % | | | 4.82 | % | | | 5.06 | % | |
| Portfolio turnover rate | | | 43 | % | | | 41 | % | | | 49 | % | | | 56 | % | | | 57 | % | |
| Net assets, end of period (000's) | | $ | 122,915 | | | $ | 169,001 | | | $ | 217,270 | | | $ | 295,983 | | | $ | 349,975 | | |
(a) Per share data was calculated using the average shares outstanding during the period.
(b) Total return at net asset value assuming all distributions reinvested and no contingent deferred sales charge.
(c) Had the investment advisor and/or any of its affiliates not waived fees or reimbursed a portion of expenses, total return would have been reduced.
(d) Total return includes a voluntary reimbursement by the investment advisor for a realized investment loss due to a trading error. This reimbursement increased total return and net asset value per share by less than 0.01% and less than $0.01, respectively.
(e) The benefits derived from expense reductions had an impact of less than 0.01%.
See Accompanying Notes to Financial Statements.
30
Financial Highlights – Columbia Strategic Income Fund
Selected data for a share outstanding throughout each period is as follows:
| | | Year Ended May 31, | |
| Class C Shares | | 2009 | | 2008 | | 2007 | | 2006 | | 2005 | |
| Net Asset Value, Beginning of Period | | $ | 5.91 | | | $ | 6.01 | | | $ | 5.89 | | | $ | 6.15 | | | $ | 6.02 | | |
| Income from Investment Operations: | |
| Net investment income (a) | | | 0.26 | | | | 0.28 | | | | 0.29 | | | | 0.30 | | | | 0.32 | | |
Net realized and unrealized gain (loss) on investments,
foreign currency, futures contracts and credit default
swap contracts | | | (0.41 | ) | | | (0.06 | ) | | | 0.15 | | | | (0.13 | ) | | | 0.26 | | |
| Total from investment operations | | | (0.15 | ) | | | 0.22 | | | | 0.44 | | | | 0.17 | | | | 0.58 | | |
| Less Distributions to Shareholders: | |
| From net investment income | | | (0.34 | ) | | | (0.32 | ) | | | (0.32 | ) | | | (0.43 | ) | | | (0.45 | ) | |
| From return of capital | | | (0.01 | ) | | | — | | | | — | | | | — | | | | — | | |
| Total distributions to shareholders | | | (0.35 | ) | | | (0.32 | ) | | | (0.32 | ) | | | (0.43 | ) | | | (0.45 | ) | |
| Net Asset Value, End of Period | | $ | 5.41 | | | $ | 5.91 | | | $ | 6.01 | | | $ | 5.89 | | | $ | 6.15 | | |
| Total return (b)(c) | | | (2.21 | )% | | | 3.84 | % | | | 7.74 | %(d) | | | 2.79 | % | | | 9.71 | % | |
| Ratios to Average Net Assets/Supplemental Data: | |
| Net expenses (e) | | | 1.58 | % | | | 1.55 | % | | | 1.55 | % | | | 1.59 | % | | | 1.69 | % | |
| Waiver/Reimbursement | | | 0.15 | % | | | 0.15 | % | | | 0.16 | % | | | 0.16 | % | | | 0.15 | % | |
| Net investment income (e) | | | 4.85 | % | | | 4.63 | % | | | 4.89 | % | | | 4.95 | % | | | 5.21 | % | |
| Portfolio turnover rate | | | 43 | % | | | 41 | % | | | 49 | % | | | 56 | % | | | 57 | % | |
| Net assets, end of period (000's) | | $ | 157,492 | | | $ | 130,420 | | | $ | 106,401 | | | $ | 72,221 | | | $ | 51,488 | | |
(a) Per share data was calculated using the average shares outstanding during the period.
(b) Total return at net asset value assuming all distributions reinvested and no contingent deferred sales charge.
(c) Had the investment advisor and/or any of its affiliates not waived fees or reimbursed a portion of expenses, total return would have been reduced.
(d) Total return includes a voluntary reimbursement by the investment advisor for a realized investment loss due to a trading error. This reimbursement increased total return and net asset value per share by less than 0.01% and less than $0.01, respectively.
(e) The benefits derived from expense reductions had an impact of less than 0.01%.
See Accompanying Notes to Financial Statements.
31
Financial Highlights – Columbia Strategic Income Fund
Selected data for a share outstanding throughout each period is as follows:
| | | Year Ended May 31, | |
| Class J Shares | | 2009 | | 2008 | | 2007 | | 2006 | | 2005 | |
| Net Asset Value, Beginning of Period | | $ | 5.89 | | | $ | 5.99 | | | $ | 5.87 | | | $ | 6.14 | | | $ | 6.01 | | |
| Income from Investment Operations: | |
| Net investment income (a) | | | 0.27 | | | | 0.29 | | | | 0.30 | | | | 0.31 | | | | 0.34 | | |
Net realized and unrealized gain (loss) on investments,
foreign currency, futures contracts and credit default
swap contracts | | | (0.42 | ) | | | (0.05 | ) | | | 0.16 | | | | (0.14 | ) | | | 0.25 | | |
| Total from investment operations | | | (0.15 | ) | | | 0.24 | | | | 0.46 | | | | 0.17 | | | | 0.59 | | |
| Less Distributions to Shareholders: | |
| From net investment income | | | (0.35 | ) | | | (0.34 | ) | | | (0.34 | ) | | | (0.44 | ) | | | (0.46 | ) | |
| From return of capital | | | (0.01 | ) | | | — | | | | — | | | | — | | | | — | | |
| Total distributions to shareholders | | | (0.36 | ) | | | (0.34 | ) | | | (0.34 | ) | | | (0.44 | ) | | | (0.46 | ) | |
| Net Asset Value, End of Period | | $ | 5.38 | | | $ | 5.89 | | | $ | 5.99 | | | $ | 5.87 | | | $ | 6.14 | | |
| Total return (b) | | | (2.22 | )% | | | 4.09 | % | | | 8.00 | %(c)(d) | | | 2.88 | %(c) | | | 10.01 | % | |
| Ratios to Average Net Assets/Supplemental Data: | |
| Net expenses (e) | | | 1.47 | % | | | 1.38 | % | | | 1.31 | % | | | 1.37 | % | | | 1.44 | % | |
| Waiver/Reimbursement | | | — | | | | — | | | | 0.01 | % | | | 0.01 | % | | | — | | |
| Net investment income (e) | | | 4.97 | % | | | 4.82 | % | | | 5.14 | % | | | 5.19 | % | | | 5.46 | % | |
| Portfolio turnover rate | | | 43 | % | | | 41 | % | | | 49 | % | | | 56 | % | | | 57 | % | |
| Net assets, end of period (000's) | | $ | 68,786 | | | $ | 101,670 | | | $ | 129,706 | | | $ | 173,101 | | | $ | 212,131 | | |
(a) Per share data was calculated using the average shares outstanding during the period.
(b) Total return at net asset value assuming all distributions reinvested and no initial sales charge.
(c) Had the investment advisor and/or any of its affiliates not waived fees or reimbursed a portion of expenses, total return would have been reduced.
(d) Total return includes a voluntary reimbursement by the investment advisor for a realized investment loss due to a trading error. This reimbursement increased total return and net asset value per share by less than 0.01% and less than $0.01, respectively.
(e) The benefits derived from expense reductions had an impact of less than 0.01%.
See Accompanying Notes to Financial Statements.
32
Financial Highlights – Columbia Strategic Income Fund
Selected data for a share outstanding throughout each period is as follows:
| | | Year Ended May 31, | |
| Class Z Shares | | 2009 | | 2008 | | 2007 | | 2006 | | 2005 | |
| Net Asset Value, Beginning of Period | | $ | 5.85 | | | $ | 5.95 | | | $ | 5.83 | | | $ | 6.10 | | | $ | 5.98 | | |
| Income from Investment Operations: | |
| Net investment income (a) | | | 0.30 | | | | 0.32 | | | | 0.34 | | | | 0.34 | | | | 0.37 | | |
Net realized and unrealized gain (loss) on investments,
foreign currency, futures contracts and credit default
swap contracts | | | (0.40 | ) | | | (0.05 | ) | | | 0.15 | | | | (0.13 | ) | | | 0.25 | | |
| Total from investment operations | | | (0.10 | ) | | | 0.27 | | | | 0.49 | | | | 0.21 | | | | 0.62 | | |
| Less Distributions to Shareholders: | |
| From net investment income | | | (0.39 | ) | | | (0.37 | ) | | | (0.37 | ) | | | (0.48 | ) | | | (0.50 | ) | |
| From return of capital | | | (0.01 | ) | | | — | | | | — | | | | — | | | | — | | |
| Total distributions to shareholders | | | (0.40 | ) | | | (0.37 | ) | | | (0.37 | ) | | | (0.48 | ) | | | (0.50 | ) | |
| Net Asset Value, End of Period | | $ | 5.35 | | | $ | 5.85 | | | $ | 5.95 | | | $ | 5.83 | | | $ | 6.10 | | |
| Total return (b) | | | (1.38 | )% | | | 4.77 | % | | | 8.73 | %(c)(d) | | | 3.51 | %(c) | | | 10.53 | % | |
| Ratios to Average Net Assets/Supplemental Data: | |
| Net expenses (e) | | | 0.73 | % | | | 0.70 | % | | | 0.71 | % | | | 0.75 | % | | | 0.85 | % | |
| Waiver/Reimbursement | | | — | | | | — | | | | 0.01 | % | | | 0.01 | % | | | — | | |
| Net investment income (e) | | | 5.71 | % | | | 5.47 | % | | | 5.73 | % | | | 5.76 | % | | | 6.05 | % | |
| Portfolio turnover rate | | | 43 | % | | | 41 | % | | | 49 | % | | | 56 | % | | | 57 | % | |
| Net assets, end of period (000's) | | $ | 704,118 | | | $ | 726,217 | | | $ | 524,975 | | | $ | 308,295 | | | $ | 46,698 | | |
(a) Per share data was calculated using the average shares outstanding during the period.
(b) Total return at net asset value assuming all distributions reinvested.
(c) Had the investment advisor and/or any of its affiliates not waived fees or reimbursed a portion of expenses, total return would have been reduced.
(d) Total return includes a voluntary reimbursement by the investment advisor for a realized investment loss due to a trading error. This reimbursement increased total return and net asset value per share by less than 0.01% and less than $0.01, respectively.
(e) The benefits derived from expense reductions had an impact of less than 0.01%.
See Accompanying Notes to Financial Statements.
33
Notes to Financial Statements – Columbia Strategic Income Fund
May 31, 2009
Note 1. Organization
Columbia Strategic Income Fund (the "Fund"), a series of Columbia Funds Series Trust I (the "Trust"), is a diversified portfolio. The Trust is registered under the Investment Company Act of 1940, as amended (the "1940 Act"), as an open-end management investment company organized as a Massachusetts business trust.
Investment Objective
The Fund seeks total return, consisting of current income and capital appreciation.
Fund Shares
The Trust may issue an unlimited number of shares, and the Fund offers five classes of shares: Class A, Class B, Class C, Class J and Class Z. Each share class has its own expense structure and sales charges, as applicable. As of the close of business on June 12, 2009, Class J shares of the Fund were closed to new investments in connection with the liquidation and termination of the Fund's Class J shares which will take place on or about July 27, 2009. Effective June 22, 2009, the Fund no longer accepts investments in Class B shares from new or existing investors in the Fund's Class B shares, except in connection with the reinvestment of any dividend and/or capital gain distributions in Class B shares of the Fund and exchanges by existing Class B shareholders of the other Columbia Funds.
Class A shares are subject to a maximum front-end sales charge of 4.75% based on the amount of initial investment. Class A shares purchased without an initial sales charge in accounts aggregating $1 million to $50 million at the time of purchase are subject to a 1.00% contingent deferred sales charge ("CDSC") if the shares are sold within one year after purchase. Class B shares are subject to a maximum CDSC of 5.00% based upon the holding period after purchase. Class B shares will convert to Class A shares eight years after purchase. Class C shares are subject to a 1.00% CDSC on shares sold within one year after purchase. Class J shares are subject to a 3.00% front-end sales charge and are available for purchase only by residents or citizens of Japan. Class Z shares are offered continuously at net asset value. There are certain restrictions on the purchase of Class Z shares, as described in the Fund's prospectus.
Note 2. Significant Accounting Policies
The preparation of financial statements in accordance with accounting principles generally accepted in the United States of America ("GAAP") requires management to make certain estimates and assumptions that affect the reported amounts of assets and liabilities, the disclosure of contingent assets and liabilities at the date of the financial statements and the reported amounts of revenue and expenses during the reporting period. Actual results could differ from those estimates. The following is a summary of significant accounting policies consistently followed by the Fund in the preparation of its financial statements.
Security Valuation
Debt securities generally are valued by pricing services approved by the Trust's Board of Trustees, based upon market transactions for normal, institutional-size trading units of similar securities. The services may use various pricing techniques which take into account appropriate factors such as yield, quality, coupon rate, maturity, type of issue, trading characteristics and other data, as well as broker quotes. Debt securities for which quotations are readily available are valued at an over-the-counter or exchange bid quotation.
Certain debt securities, which tend to be more thinly traded and of lesser quality, are priced based on fundamental analysis of the financial condition of the issuer and the estimated value of any collateral. Valuations developed through pricing techniques may vary from the actual amounts realized upon sale of the securities, and the potential variation may be greater for those securities valued using fundamental analysis.
Short-term investments maturing in 60 days or less are valued at amortized cost, which approximates market value.
Futures contracts are valued at the settlement price established each day by the board of trade or exchange on which they are traded.
Forward foreign currency exchange contracts are valued at the prevailing forward exchange rate of the underlying currencies.
Credit default swap contracts are marked to market daily based upon quotations from market makers. Quotations obtained from independent pricing services use information provided by market makers.
34
Columbia Strategic Income Fund, May 31, 2009
Foreign securities are generally valued at the last sale price on the foreign exchange or market on which they trade. If any foreign share prices are not readily available as a result of limited share activity, the securities are valued at the last sale price of the local shares in the principal market in which such securities are normally traded.
Generally, trading in foreign securities is substantially completed each day at various times prior to the close of the New York Stock Exchange ("NYSE"). The values of such securities used in computing the net asset value of the Fund's shares are determined as of such times. Foreign currency exchange rates are generally determined at 4:00 p.m. Eastern (U.S.) time. Occasionally, events affecting the values of such foreign securities and such exchange rates may occur between the times at which they are determined and the close of the customary trading session of the NYSE, which would not be reflected in the computation of the Fund's net asset value. If events materially affecting the values of such foreign securities occur and it is determined that market quotations are not reliable, then these foreign securities will be valued at their fair value using procedures approved by the Board of Trustees.
Investments for which market quotations are not readily available, or that have quotations which management believes are not reliable, are valued at fair value as determined in good faith under consistently applied procedures established by and under the general supervision of the Board of Trustees. If a security is valued at fair value, such value is likely to be different from the last quoted market price for the security. The determination of fair value often requires significant judgment. To determine fair value, management may use assumptions including but not limited to future cash flows and estimated risk premiums. Multiple inputs from various sources may be used to determine value.
On June 1, 2008, the Fund adopted Financial Accounting Standards Board ("FASB") Statement of Financial Accounting Standards No. 157, Fair Value Measurements ("SFAS 157"). SFAS 157 establishes a hierarchy that prioritizes the inputs to valuation techniques used to measure fair value giving the highest priority to unadjusted quoted prices in active markets for identical securities (level 1 measurements) and the lowest priority to unobservable inputs (level 3 measurements) when market prices are not readily available or reliable. The three levels of the fair value hierarchy under SFAS 157 are described below:
• Level 1 – quoted prices in active markets for identical securities
• Level 2 – prices determined using other significant observable inputs (including quoted prices for similar securities, interest rates, prepayment speeds, credit risk and others)
• Level 3 – prices determined using significant unobservable inputs. In situations where quoted prices or observable inputs are unavailable or less reliable, unobservable inputs may be used. Unobservable inputs may include management's own assumptions about the factors market participants would use in pricing an investment.
The inputs or methodology used for valuing securities are not necessarily an indication of the risk associated with investing in those securities.
In April 2009, FASB issued new FASB Staff Position 157-4, Determining Fair Value When the Value and Level of Activity for the Asset or Liability Have Significantly Decreased and Identifying Transactions That Are Not Orderly ("FSP FAS 157-4"), which amends SFAS 157 and is effective for interim and annual periods ending after June 15, 2009. FSP FAS 157-4 provides additional guidance when the volume and level of activity for the asset or liability measured at fair value has significantly decreased. Additionally, FSP FAS 157-4 expands disclosure requirements for reporting entities with respect to categories of assets and liabilities car ried at fair value. Management is evaluating the impact that the application of FSP FAS 157-4 will have on the Fund's financial statement disclosures.
Security Transactions
Security transactions are accounted for on the trade date. Cost is determined and gains (losses) are based upon the specific identification method for both financial statement and federal income tax purposes.
In September 2008, FASB Staff Position 133-1 and FIN 45-4, Disclosures about Credit Derivatives and Certain Guarantees: An Amendment of FASB Statement No. 133 and FASB Interpretation No. 45 and Clarification of the Effective Date of FASB Statement No. 161 ("Amendment") was issued and is effective for annual and interim reporting periods ending after November 15, 2008.
35
Columbia Strategic Income Fund, May 31, 2009
The Amendment requires enhanced disclosures regarding a fund's credit derivatives and hybrid financial instruments containing embedded credit derivatives. The amendments to FAS 133 include required disclosure for (i) the nature and terms of the credit derivative, reasons for entering into the credit derivative, the events or circumstances that would require the seller to perform under the credit derivative, and the current status of the payment/performance risk of the credit derivative, (ii) the maximum potential amount of future payments (undiscounted) the seller could be required to make under the credit derivative, (iii) the fair value of the credit derivative, and (iv) the nature of any recourse provisions and assets held either as collateral or by third parties. The amendments to FIN 45 require additional disclosures about the current status of the payment/performance risk of a guarantee.
During the reporting period, the Fund entered into a credit default swap contract as a protection provider. At May 31, 2009, the Fund did not have any open credit default swap contracts. Additional information regarding credit default swap transactions is disclosed in the Notes to the Financial Statements and in Note 6.
On December 1, 2008, the Fund adopted Statement of Financial Accounting Standards No. 161, Disclosures about Derivative Instruments and Hedging Activities-an amendment of FASB Statement No. 133 ("SFAS 161"). SFAS 161 requires additional discussion about the reporting entity's derivative instruments and hedging activities, by providing for qualitative disclosures about the objectives and strategies for using derivatives, quantitative data about the fair value of and gains and losses on derivative contracts, and details of credit-risk-related contingent features in their derivative contracts. For additional information on derivative instruments, please see Note 6.
Futures Contracts
The Fund may invest in futures contracts for both hedging and non-hedging purposes, including, for example, to seek to enhance returns or as a substitute for a position in an underlying asset.
The use of futures contracts involves certain risks, which include: (1) imperfect correlation between the price movement of the instruments and the underlying securities, (2) inability to close out positions due to differing trading hours, or the temporary absence of a liquid market, for either the instruments or the underlying securities, or (3) an inaccurate prediction of the future direction of interest rates by Columbia Management Advisors, LLC ("Columbia"), the Fund's investment advisor. Any of these risks may involve amounts exceeding the variation margin recorded in the Fund's Statement of Assets and Liabilities at any given time.
Upon entering into a futures contract, the Fund pledges cash or securities with the broker in an amount sufficient to meet the initial margin requirement. Subsequent payments are made or received by the Fund equal to the daily change in the contract value and are recorded as variation margin receivable or payable and offset in unrealized gains or losses. The Fund recognizes a realized gain or loss when the contract is closed or expires.
Forward Foreign Currency Exchange Contracts
Forward foreign currency exchange contracts are agreements to exchange one currency for another at a future date at a specified price. These contracts are used to minimize the exposure to foreign exchange rate fluctuations during the period between the trade and settlement dates of the contract. The Fund may utilize forward foreign currency exchange contracts in connection with the settlement of purchases and sales of securities. The Fund may also enter into these contracts to reduce the exposure to adverse price movements in certain other foreign currency denominated assets. Contracts to buy generally are used to acquire exposure to foreign currencies, while contracts to sell are generally used to reduce the exposure to foreign exchange rate fluctuations. Forward foreign currency exchange contracts are valued daily at the current exchange rate of the underlying currency, resulting in unrealized gains (losses) which become reali zed at the time the forward foreign currency exchange contracts are closed or mature. Realized and unrealized gains (losses) arising from such transactions are included in net realized and unrealized gains (losses) on foreign currency transactions. The use of forward foreign currency exchange contracts does not eliminate fluctuations in the prices of the Fund's portfolio securities. While the maximum potential loss from such contracts is the aggregate face value in U.S. dollars at the time the contract was opened, exposure is typically limited to the change in value of the contract (in U.S. dollars) over the period it remains open. The Fund could also be exposed to risk that counterparties of the contracts may be unable to fulfill the terms of the contracts.
36
Columbia Strategic Income Fund, May 31, 2009
Repurchase Agreements
The Fund may engage in repurchase agreement transactions with institutions that Columbia has determined are creditworthy. The Fund, through its custodian, receives delivery of the underlying securities collateralizing a repurchase agreement. Columbia is responsible for determining that the collateral is at least equal, at all times, to the value of the repurchase obligation including interest. A repurchase agreement transaction involves certain risks in the event of default or insolvency of the counterparty. These risks include possible delays in or restrictions on the Fund's ability to dispose of the underlying securities and a possible decline in the value of the underlying securities during the period while the Fund seeks to assert its rights.
Loan Participations and Commitments
The Fund may invest in loan participations. When the Fund purchases a loan participation, the Fund typically enters into a contractual relationship with the lender or third party selling such participation ("Selling Participant"), but not the borrower. However, the Fund assumes the credit risk of the borrower, Selling Participant and any other persons interpositioned between the Fund and the borrower. The Fund may not directly benefit from the collateral supporting the senior loan which it has purchased from the Selling Participant.
Credit Default Swaps
The Fund may enter into credit default swap transactions to increase exposure to a credit or basket of credits that could not be established efficiently through purchases of individual bonds. Credit default swaps are agreements in which one party pays fixed periodic payments to a counterparty in consideration for a guarantee from the counterparty to make a specific payment should a negative credit event take place. The Fund may receive an upfront payment as the protection seller or make an upfront payment as the protection buyer. Credit default swaps are marked to market daily based on quotations from market makers and any change is recorded as unrealized appreciation/depreciation on the Statement of Assets and Liabilities. Periodic payments received or made are recorded as a realized gain or loss and premiums received or made are amortized on the Statement of Operations.
If the Fund is a buyer of protection and a credit event occurs, as defined under the terms of that particular swap agreement, the Fund will either (i) receive from the seller of protection an amount equal to the notional amount of the swap and deliver the referenced obligation or underlying securities comprising the referenced index or (ii) receive a net settlement amount in the form of cash or securities equal to the notional amount of the swap less the recovery value of the referenced obligation or underlying securities comprising the referenced index.
If the Fund is a seller of protection and a credit event occurs, as defined under the terms of that particular swap agreement, the Fund will either (i) pay to the buyer of protection an amount equal to the notional amount of the swap and take delivery of the referenced obligation or underlying securities comprising the referenced index or (ii) pay a net settlement amount in the form of cash or securities equal to the notional amount of the swap less the recovery value of the referenced obligation or underlying securities comprising the referenced index.
Stripped Securities
Stripped mortgage-backed securities are derivative multi-class mortgage securities structured so that one class receives most, if not all, of the principal from the underlying mortgage assets, while the other class receives most, if not all, of the interest and the remainder of the principal. If the underlying mortgage assets experience greater than anticipated prepayments of principal, the Fund may fail to fully recoup its initial investment in an interest-only security. The market value of these securities can be extremely volatile in response to changes in interest rates. Credit risk reflects the risk that the Fund may not receive all or part of its principal because the issuer or credit enhancer has defaulted on its obligation.
Foreign Currency Transactions and Translations
The values of all assets and liabilities quoted in foreign currencies are translated into U.S. dollars at that day's exchange rates. Net realized and unrealized gains (losses) on foreign currency transactions and translations include gains (losses) arising from the fluctuation in exchange rates between trade and settlement dates on securities transactions, gains (losses) arising from the disposition of foreign currency and currency gains (losses) between the
37
Columbia Strategic Income Fund, May 31, 2009
accrual and payment dates on dividends, interest income and foreign withholding taxes.
For financial statement purposes, the Fund does not distinguish that portion of gains (losses) on investments which is due to changes in foreign exchange rates from that which is due to changes in market prices of the investments. Such fluctuations are included with the net realized and unrealized gains (losses) on investments on the Statement of Operations.
Income Recognition
Interest income is recorded on the accrual basis. Premium and discount are amortized and accreted, respectively, on all debt securities, unless otherwise noted.
The value of additional securities received as an income payment is recorded as income and as the cost basis of such securities.
Expenses
General expenses of the Trust are allocated to the Fund and other series of the Trust based upon relative net assets or other expense allocation methodologies determined by the nature of the expense. Expenses directly attributable to the Fund are charged to the Fund.
Determination of Class Net Asset Value
All income, expenses (other than class-specific expenses, as shown on the Statement of Operations) and realized and unrealized gains (losses) are allocated to each class of the Fund on a daily basis for purposes of determining the net asset value of each class. Income and expenses are allocated to each class based on the settled shares method, while realized and unrealized gains (losses) are allocated based on the relative net assets of each class.
Federal Income Tax Status
The Fund intends to qualify each year as a "regulated investment company" under Subchapter M of the Internal Revenue Code, as amended, and will distribute substantially all of its tax exempt or taxable income, if any, for its tax year, and as such will not be subject to federal income taxes. In addition, the Fund intends to distribute in each calendar year substantially all of its net investment income, capital gains and certain other amounts, if any, such that the Fund should not be subject to federal excise tax. Therefore, no federal income or excise tax provision is recorded.
Distributions to Shareholders
Distributions from net investment income are declared and paid monthly. Net realized capital gains, if any, are distributed at least annually. Income distributions and capital gain distributions are determined in accordance with federal income tax regulations which may differ from GAAP.
Indemnification
In the normal course of business, the Fund enters into contracts that contain a variety of representations and warranties and which provide general indemnities. The Fund's maximum exposure under these arrangements is unknown because this would involve future claims against the Fund. Also, under the Trust's organizational documents and by contract, the Trustees and officers of the Trust are indemnified against certain liabilities that may arise out of actions relating to their duties to the Trust. However, based on experience, the Fund expects the risk of loss due to these representations, warranties and indemnities to be minimal.
Note 3. Federal Tax Information
The timing and character of income and capital gain distributions are determined in accordance with income tax regulations, which may differ from GAAP. Reclassifications are made to the Fund's capital accounts for permanent tax differences to reflect income and gains available for distribution (or available capital loss carryforwards) under income tax regulations.
For the year ended May 31, 2009, permanent book and tax differences resulting primarily from differing treatments for discount accretion/premium amortization on debt securities, Section 988 bond bifurcation, expired capital loss carryforward, paydowns and market discounts, were identified and reclassified among the components of the Fund's net assets as follows:
Overdistributed
Net Investment
Income | | Accumulated
Net Realized
Loss | | Paid-In Capital | |
| $ | 15,261,567 | | | $ | 123,579,572 | | | $ | (138,841,139 | ) | |
38
Columbia Strategic Income Fund, May 31, 2009
Net investment income and net realized gains (losses), as disclosed on the Statement of Operations, and net assets were not affected by this reclassification.
The tax character of distributions paid during the years ended May 31, 2009 and May 31, 2008 was as follows:
| | | May 31, | |
| Distributions paid from | | 2009 | | 2008 | |
| Ordinary Income* | | $ | 128,306,030 | | | $ | 113,186,029 | | |
| Tax return of capital | | | 1,580,036 | | | | — | | |
* For tax purposes short-term capital gain distributions, if any, are considered ordinary income distributions.
As of May 31, 2009, the components of distributable earnings on a tax basis were as follows:
Undistributed
Ordinary
Income | | Undistributed
Long-Term
Capital Gains | | Net
Unrealized
Depreciation* | |
| $ | — | | | $ | — | | | $ | (58,775,861 | ) | |
* The differences between book-basis and tax-basis net unrealized appreciation/depreciation are primarily due to deferral of losses from wash sales and discount accretion/premium amortization on debt securities.
Unrealized appreciation and depreciation at May 31, 2009, based on cost of investments for federal income tax purposes were:
| Unrealized appreciation | | $ | 75,770,851 | | |
| Unrealized depreciation | | | (134,546,712 | ) | |
| Net unrealized depreciation | | $ | (58,775,861 | ) | |
The following capital loss carryforwards, determined as of May 31, 2009, may be available to reduce taxable income arising from future net realized gains on investments, if any, to the extent permitted by the Internal Revenue Code:
| Year of Expiration | | Capital Loss
Carryforward | |
| | 2010 | | | $ | 138,626,928 | | |
| | 2011 | | | | 318,608 | | |
| | 2013 | | | | 234,018 | | |
| | 2014 | | | | 8,752,148 | | |
| | 2015 | | | | 703,478 | | |
| | 2016 | | | | 3,552,128 | | |
| | 2017 | | | | 44,798,651 | | |
| | Total | | | $ | 196,985,959 | | |
Capital loss carryforwards of $138,841,137 expired during the year ended May 31, 2009.
Under current tax rules, certain currency and capital losses realized after October 31 may be deferred and treated as occurring on the first day of the following fiscal year. As of May 31, 2009, post-October capital losses of $72,260,901 and post-October currency losses of $15,036,718 attributed to security transactions were deferred to June 1, 2009.
Under Financial Accounting Standards Board ("FASB") Interpretation No. 48, Accounting for Uncertainty in Income Taxes—an Interpretation of FASB Statement No. 109 ("FIN 48"), management determines whether a tax position of the Fund is more likely than not to be sustained upon examination by the applicable taxing authority, including resolution of any related appeals or litigation processes, based on the technical merits of the position. The tax benefit to be recognized is measured as the largest amount of benefit that is greater than fifty percent likely of being realized upon ultimate settlement. Management has evaluated the known implications of FIN 48 on the computation of net assets for the Fund. As a result of this evaluation, management has concluded that FIN 48 did not have any effect on the Fund's financial statements. However, management's conclusions regarding FIN 48 may be subject to review and adjustment at a later date based on factors including, but not limited to, further implementation guidance from the FASB, new tax laws, regulations, and administrative interpretations (including relevant court decisions). The Fund's federal tax returns for the prior three fiscal years remain subject to examination by the Internal
39
Columbia Strategic Income Fund, May 31, 2009
Revenue Service. The Fund is not aware of any tax positions for which it is reasonably possible that the total amounts of unrecognized tax benefits will significantly change in the next twelve months.
Note 4. Fees and Compensation Paid to Affiliates
Investment Advisory Fee
Columbia, an indirect, wholly owned subsidiary of Bank of America Corporation ("BOA"), provides investment advisory, administrative and other services to the Fund. In rendering investment advisory services to the Fund, Columbia may use the portfolio management and research resources of Columbia Management Pte. Ltd., an affiliate of Columbia. Columbia receives a monthly investment advisory fee based on the Fund's average daily net assets at the following annual rates:
| Average Daily Net Assets | | Annual Fee Rate | |
| First $500 million | | | 0.60 | % | |
| $500 million to $1 billion | | | 0.55 | % | |
| $1 billion to $1.5 billion | | | 0.52 | % | |
| Over $1.5 billion | | | 0.49 | % | |
For the year ended May 31, 2009, the Fund's effective investment advisory fee rate was 0.54% of the Fund's average daily net assets.
Pricing and Bookkeeping Fees
The Fund has entered into a Financial Reporting Services Agreement (the "Financial Reporting Services Agreement") with State Street Bank & Trust Company ("State Street") and Columbia pursuant to which State Street provides financial reporting services to the Fund. The Fund has also entered into an Accounting Services Agreement (collectively with the Financial Reporting Services Agreement, the "State Street Agreements") with State Street and Columbia pursuant to which State Street provides accounting services to the Fund. Under the State Street Agreements, the Fund pays State Street an annual fee of $38,000 paid monthly plus an additional monthly fee based on an annualized percentage rate of average daily net assets of the Fund for the month. The aggregate fee will not exceed $140,000 per year (exclusive of out-of-pocket expenses and charges). The Fund also reimburses State Street for certain out-of-pocket expenses and charge s.
The Fund has entered into a Pricing and Bookkeeping Oversight and Services Agreement (the "Services Agreement") with Columbia. Under the Services Agreement, Columbia provides services related to Fund expenses and the requirements of the Sarbanes-Oxley Act of 2002, and provides oversight of the accounting and financial reporting services provided by State Street. Under the Services Agreement, the Fund reimburses Columbia for out-of-pocket expenses.
Transfer Agent Fee
Columbia Management Services, Inc. (the "Transfer Agent"), an affiliate of Columbia and an indirect, wholly owned subsidiary of BOA, provides shareholder services to the Fund and has contracted with Boston Financial Data Services ("BFDS") to serve as sub-transfer agent. The Transfer Agent is entitled to receive a fee for its services, paid monthly, at the annual rate of $17.34 per open account plus reimbursement of certain sub-transfer agent fees paid by the Transfer Agent (exclusive of BFDS fees), calculated based on assets held in omnibus accounts and intended to recover the cost of payments to other parties (including affiliates of BOA) for services to those accounts. The Transfer Agent pays the fees of BFDS for services as sub-transfer agent and is not entitled to reimbursement for such fees from the Fund.
The Transfer Agent may also retain, as additional compensation for its services, fees for wire, telephone and redemption orders, Individual Retirement Account ("IRA") trustee agent fees and account transcript fees due to the Transfer Agent from shareholders of the Fund and credits (net of bank charges) earned with respect to balances in accounts the Transfer Agent maintains in connection with its services to the Fund. The Transfer Agent also receives reimbursement for certain out-of-pocket expenses.
An annual minimum account balance fee of $20 may apply to certain accounts with a value below the Fund's initial minimum investment requirements to reduce the impact of small accounts on transfer agent fees. These minimum account balance fees are recorded as part of expense reductions on the Statement of Operations. For the year ended May 31, 2009, these minimum account balance fees reduced total expenses by $19,772.
40
Columbia Strategic Income Fund, May 31, 2009
Underwriting Discounts, Service and Distribution Fees
Columbia Management Distributors, Inc. (the "Distributor"), an affiliate of Columbia and an indirect, wholly owned subsidiary of BOA, is the principal underwriter of the Fund's shares. For the year ended May 31, 2009, the Distributor retained net underwriting discounts of $172,022 on sales of the Fund's Class A shares and received net CDSC fees of $2,575, $254,576 and $38,358 on Class A, Class B and Class C shares redemptions, respectively.
The Fund has adopted distribution and shareholder servicing plans (the "Plans") pursuant to Rule 12b-1 under the 1940 Act, which require the payment of distribution and service fees. The fees are intended to compensate the Distributor and/or eligible selling and/or servicing agents for selling shares of the Fund and providing services to investors. The service fee is equal to 0.15% annually of the average daily net assets attributable to outstanding Class A and Class B shares of the Fund issued prior to January 1, 1993 and 0.25% annually of the average daily net assets attributable to outstanding Class A, Class B, Class C and Class J shares issued thereafter. This arrangement results in an annual rate of service fee for shares that is a blend between the 0.15% and 0.25% rates. For the year ended May 31, 2009, the Fund's effective service fee rate was 0.25% of the Fund's average daily net assets attributable to Class A, Class B, Class C and Class J shares.
The Plans also require the payment of a monthly distribution fee to the Distributor equal to 0.75% annually of the average daily net assets attributable to Class B and Class C shares and 0.35% annually of the average daily net assets attributable to Class J shares. The Distributor has voluntarily agreed to waive a portion of the distribution fee for Class C shares so that the fee will not exceed 0.60% annually of Class C shares average daily net assets. This arrangement may be modified or terminated by the Distributor at any time.
Fee Waivers and Expense Reimbursements
Effective January 1, 2009, Columbia has voluntarily agreed to reimburse a portion of the Fund's expenses so that the Fund's ordinary operating expenses (excluding any distribution and service fees, brokerage commissions, interest, taxes and extraordinary expenses, but including custodial charges relating to overdrafts, if any), after giving effect to any balance credits from the Fund's custodian, do not exceed 0.80% of the Fund's average daily net assets on an annualized basis. Columbia, in its discretion, may revise or discontinue this arrangement any time.
Fees Paid to Officers and Trustees
All officers of the Fund are employees of Columbia or its affiliates and, with the exception of the Fund's Chief Compliance Officer, receive no compensation from the Fund. The Board of Trustees has appointed a Chief Compliance Officer to the Fund in accordance with federal securities regulations. The Fund, along with other affiliated funds, pays its pro-rata share of the expenses associated with the Chief Compliance Officer. The Fund's expenses for the Chief Compliance Officer will not exceed $15,000 per year.
The Trust's eligible Trustees may participate in a deferred compensation plan which may be terminated at any time. Obligations of the plan will be paid solely out of the Fund's assets.
Note 5. Custody Credits
The Fund has an agreement with its custodian bank under which custody fees may be reduced by balance credits. These credits are recorded as part of expense reductions on the Statement of Operations. The Fund could have invested a portion of the assets utilized in connection with the expense offset arrangement in an income-producing asset if it had not entered into such an agreement.
For the year ended May 31, 2009, these custody credits reduced total expenses by $898 for the Fund.
41
Columbia Strategic Income Fund, May 31, 2009
Note 6. Derivative Instruments
| Derivatives not accounted for as hedging instruments under Statement 133: | |
| | | Fair Value of Derivative Instruments | |
| | | Asset | | Liability | |
| | | Statement of
Assets and
Liabilities
Location | | Fair
Value | | Statement of
Assets and
Liabilities
Location | | Fair
Value | |
| Forward foreign currency exchange contracts | | Unrealized appreciation
on forward foreign
currency exchange
contracts | |
$290,799 | | Unrealized depreciation
on forward foreign
currency exchange
contracts | |
$6,248,305 | |
| Total | | | | $290,799 | | | | $6,248,305 | |
| | | Amount of Realized Gain or (Loss)
on Derivatives Recognized in Income | |
| | | Credit Default
Swap Contracts | | Forward Foreign
Currency Exchange
Contracts | | Total | |
| Net realized gain (loss) on credit default swap contracts | | $ | (566,072 | ) | | $ | — | | | $ | (566,072 | ) | |
| Net realized gain (loss) on foreign currency transactions | | | — | | | | 23,545,546 | | | | 23,545,546 | | |
| Total | | $ | (566,072 | ) | | $ | 23,545,546 | | | $ | 22,979,474 | | |
| | | Change in Unrealized Appreciation or (Depreciation)
on Derivatives Recognized in Income | |
| | | Credit Default
Swap Contracts | | Forward Foreign
Currency Exchange
Contracts | | Total | |
Net change in unrealized appreciation (depreciation) on
credit default swap contracts | | $ | — | | | $ | — | | | $ | — | | |
Net change in unrealized appreciation (depreciation) on
foreign currency translations | | | — | | | | (5,957,506 | ) | | | (5,957,506 | ) | |
| Total | | $ | — | | | $ | (5,957,506 | ) | | $ | (5,957,506 | ) | |
Note 7. Portfolio Information
For the year ended May 31, 2009, the cost of purchases and proceeds from sales of securities, excluding short-term obligations, for the Fund were $832,612,272 and $739,678,234, respectively, of which $33,699,071 and $68,659,598, respectively, were U.S. Government securities.
Note 8. Line of Credit
The Fund and other affiliated funds participate in a $280,000,000 committed, unsecured revolving line of credit provided by State Street. The maximum amount that may be borrowed by any fund is limited to the lesser of $200,000,000 and the Fund's borrowing limit set forth in the Fund's
42
Columbia Strategic Income Fund, May 31, 2009
registration statement. Borrowings are available for short-term liquidity or temporary or emergency purposes.
Interest is charged to each participating fund based on the fund's borrowings at a rate per annum equal to the greater of the Federal Funds Rate plus 0.50% or the overnight LIBOR Rate plus 0.50%. In addition, an annual operations agency fee of $20,000, an amendment fee of 0.02% and a commitment fee of 0.12% per annum are accrued and apportioned among the participating funds pro rata based on their relative net assets. Prior to October 16, 2008, the Fund and other affiliated funds participated in a $350,000,000 committed, unsecured revolving line of credit and a $150,000,000 uncommitted, unsecured line of credit, both provided by State Street. Interest on the committed line of credit was charged to each participating fund based on the fund's borrowings at a rate per annum equal to the Federal Funds Rate plus 0.50%. In addition, a commitment fee of 0.10% per annum was accrued and apportioned among the participating funds pro rata based on their relative net assets. Interest on the uncommitted line of credit was charged to each participating fund based on the fund's borrowings at a rate per annum equal to the Federal Funds Rate plus 0.375%. State Street charged an annual operations agency fee of $40,000 for the committed line of credit and was able to charge an annual administration fee of $15,000 for the uncommitted line of credit. The commitment fee, the operations agency fee and the administration fee were accrued and apportioned among the participating funds pro rata based on their relative net assets.
For the year ended May 31, 2009, the Fund did not borrow under these arrangements.
Note 9. Securities Lending
The Fund may lend its securities to certain approved brokers, dealers and other financial institutions. Each loan is collateralized by cash, in an amount at least equal to the market value of the securities loaned plus accrued income from the investment of collateral. The market value of the loaned securities is determined at the close of business of the Fund and any additional required collateral is delivered to the Fund on the next business day. The collateral received is invested and the income generated by the investment of the collateral, net of any fees remitted to State Street as the lending agent and borrower rebates, is paid to the Fund. Generally, in the event of borrower default, the Fund has the right to use the collateral to offset any losses incurred. In the event the Fund is delayed in or prevented from exercising its right to dispose of the collateral, there may be a potential loss to the Fund. The Fund bears the risk of loss with respect to the investment of collateral.
Note 10. Shares of Beneficial Interest
As of May 31, 2009, 27.7% of the Fund's shares outstanding were beneficially owned by one participant account over which BOA and/or any of its affiliates had either sole or joint investment discretion.
As of May 31, 2009, the Fund had one shareholder that held 9.7% of the shares outstanding, over which BOA and/or any of its affiliates did not have investment discretion.
Subscription and redemption activity in these accounts may have a significant effect on the operations of the Fund.
Note 11. Significant Risks and Contingencies
Sector Focus Risk
The Fund may focus its investments in certain sectors, subjecting it to greater risk than a fund that is less focused.
High-Yield Securities Risk
Investing in high-yield securities may involve greater credit risk and considerations not typically associated with investing in U.S. Government bonds and other higher quality fixed income securities. These securities are non-investment grade securities, often referred to as "junk" bonds. Economic downturns may disrupt the high yield market and impair the ability of issuers to repay principal and interest. Also, an increase in interest rates would likely have an adverse impact on the value of such obligations. Moreover, high-yield securities may be less liquid to the extent that there is no established secondary market.
Foreign Securities Risk
There are certain additional risks involved when investing in foreign securities. These risks may involve foreign currency exchange rate fluctuations, adverse political and economic developments and the possible prevention of currency exchange or other foreign governmental laws or restrictions. In addition, the liquidity of foreign securities may be more limited than that of domestic securities.
43
Columbia Strategic Income Fund, May 31, 2009
Investments in emerging market countries are subject to additional risk. The risk of foreign investments is typically increased in less developed countries. These countries are also more likely to experience high levels of inflation, deflation or currency devaluation which could hurt their economies and securities markets.
Legal Proceedings
Columbia Management Advisors, LLC and Columbia Management Distributors, Inc. (collectively, the "Columbia Group") are subject to a settlement agreement with the New York Attorney General ("NYAG") (the "NYAG Settlement") and a settlement order with the SEC (the "SEC Order") on matters relating to mutual fund trading, each dated February 9, 2005. Under the terms of the SEC Order, the Columbia Group (or predecessor entities) agreed, among other things, to: pay disgorgement and civil money penalties collectively totaling $140 million; cease and desist from violations of the antifraud provisions and certain other provisions of the federal securities laws; maintain certain compliance and ethics oversight structures; and retain an independent consultant to review the Columbia Group's applicable supervisory, compliance, control and other polici es and procedures. The NYAG Settlement, among other things, requires Columbia Management Advisors, LLC and its affiliates to reduce management fees for certain funds in the Columbia family of mutual funds in a projected total of $160 million over five years through November 30, 2009 and to make certain disclosures to investors relating to expenses. In connection with the Columbia Group providing services to the Columbia Funds, the Columbia Funds have voluntarily undertaken to implement certain governance measures designed to maintain the independence of their boards of trustees and certain special consulting and compliance measures.
Pursuant to the SEC Order and related procedures, the $140 million in settlement amounts described above has been substantially distributed in accordance with a distribution plan that was developed by an independent distribution consultant and approved by the SEC on April 6, 2007.
In connection with the events described above, various parties have filed suit against certain funds, the Trustees of the Columbia Funds, FleetBoston Financial Corporation and its affiliated entities and/or Bank of America and its affiliated entities.
On February 20, 2004, the Judicial Panel on Multidistrict Litigation transferred these cases and cases against other mutual fund companies based on similar allegations to the United States District Court in Maryland for consolidated or coordinated pretrial proceedings (the "MDL"). Subsequently, additional related cases were transferred to the MDL. On September 29, 2004, the plaintiffs in the MDL filed amended and consolidated complaints. One of these amended complaints is a putative class action that includes claims under the federal securities laws and state common law, and that names Columbia Management Advisors, Inc. (which has since merged into Banc of America Capital Management, LLC (now named Columbia Management Advisors, LLC)) ("Columbia"), Columbia Funds Distributor, Inc. (now named Columbia Management Distributors, Inc.) (the "Distributor"), the Trustees of the Columbia Funds, Bank of America Corporation and others as d efendants. Another of the amended complaints is a derivative action purportedly on behalf of the Columbia Funds that asserts claims under federal securities laws and state common law.
On February 25, 2005, Columbia and other defendants filed motions to dismiss the claims in the pending cases. On March 1, 2006, for reasons stated in the court's memoranda dated November 3, 2005, the United States District Court for the District of Maryland granted in part and denied in part the defendants' motions to dismiss. The court dismissed all of the class action claims pending against the Columbia Funds Trusts. As to Columbia and the Distributor, the claims under the Securities Act of 1933, the claims under Sections 34(b) and 36(a) of the Investment Company Act of 1940 ("ICA") and the state law claims were dismissed. The claims under Sections 10(b) and 20(a) of the Securities Exchange Act of 1934 and claims under Section 36(b) of the ICA were not dismissed.
On March 21, 2005, a purported class action was filed in Massachusetts state court alleging that certain conduct, including market timing, entitled Class B shareholders in certain Columbia Funds to an exemption from contingent deferred sales charges upon early redemption (the "CDSC Lawsuit"). The CDSC Lawsuit was removed to federal court in Massachusetts and transferred to the MDL.
On September 14, 2007, the plaintiffs and the Columbia defendants named in the MDL, including the Columbia Funds, entered into a stipulation of settlement with respect to all Columbia-related claims in the MDL described above, including the CDSC Lawsuit. The settlement is subject to court approval.
44
Report of Independent Registered Public Accounting Firm
To the Trustees of Columbia Funds Series Trust I and the Shareholders of Columbia Strategic Income Fund
In our opinion, the accompanying statement of assets and liabilities, including the investment portfolio, and the related statements of operations and of changes in net assets and the financial highlights present fairly, in all material respects, the financial position of Columbia Strategic Income Fund (the "Fund")(a series of Columbia Funds Series Trust I) at May 31, 2009, the results of its operations for the year then ended, the changes in its net assets for each of the two years in the period then ended and the financial highlights for each of the five years in the period then ended, in conformity with accounting principles generally accepted in the United States of America. These financial statements and financial highlights (hereafter referred to as "financial statements") are the responsibility of the Fund's management. Our responsibility is to express an opinion on these financial statements based on our audits. We condu cted our audits of these financial statements in accordance with the standards of the Public Company Accounting Oversight Board (United States). Those standards require that we plan and perform the audit to obtain reasonable assurance about whether the financial statements are free of material misstatement. An audit includes examining, on a test basis, evidence supporting the amounts and disclosures in the financial statements, assessing the accounting principles used and significant estimates made by management, and evaluating the overall financial statement presentation. We believe that our audits, which included confirmation of securities at May 31, 2009 by correspondence with the custodian and brokers, provide a reasonable basis for our opinion.
PricewaterhouseCoopers LLP
Boston, Massachusetts
July 21, 2009
45
Fund Governance – Columbia Strategic Income Fund
The Trustees serve terms of indefinite duration. The names, addresses and ages of the Trustees and officers of the Funds in the Columbia Funds Complex, the year each was first elected or appointed to office, their principal business occupations during at least the last five years, the number of Funds overseen by each Trustee and other directorships they hold are shown below. Each officer listed below serves as an officer of each Fund in the Columbia Funds Complex.
Independent Trustees
Name, Address and Year of Birth,
Position with Funds, Year First
Elected or Appointed to Office | | Principal Occupation(s) During Past Five Years, Number of Funds in the Columbia
Funds Complex Overseen by Trustee, Other Directorships Held
| |
| John D. Collins (Born 1938) | |
|
c/o Columbia Management
Advisors, LLC
One Financial Center
Boston, MA 02111
Trustee (since 2007) | | Retired. Consultant, KPMG, LLP (accounting and tax firm) from July 1999 to June 2000; Partner, KPMG, LLP from March 1962 to June 1999. Oversees 79, Mrs. Fields Famous Brands LLC (consumer products); Suburban Propane Partners, L.P.; and Montpelier Re (underwriting firm) | |
|
| Rodman L. Drake (Born 1943) | |
|
c/o Columbia Management
Advisors, LLC
One Financial Center
Boston, MA 02111
Trustee (since 2007) and Chairman of the Board (since 2009) | | Co-Founder of Baringo Capital LLC (private equity) since 2002; President, Continuation Investments Group, Inc. from 1997 to 2001. Oversees 79, Jackson Hewitt Tax Service Inc. (tax preparation services); Crystal Capital River Inc. (real estate investment trust); Student Loan Corporation (student loan provider); Celgene Corporation (global biotechnology company); and The Helios Funds (exchange-traded funds) | |
|
| Douglas A. Hacker (Born 1955) | |
|
c/o Columbia Management
Advisors, LLC
One Financial Center
Boston, MA 02111
Trustee (since 1996) | | Independent business executive since May 2006; Executive Vice President—Strategy of United Airlines (airline) from December 2002 to May 2006; President of UAL Loyalty Services (airline marketing company) from September 2001 to December 2002; Executive Vice President and Chief Financial Officer of United Airlines from July 1999 to September 2001. Oversees 79, Nash Finch Company (food distributor); Aircastle Limited (aircraft leasing) | |
|
| Janet Langford Kelly (Born 1957) | |
|
c/o Columbia Management
Advisors, LLC
One Financial Center
Boston, MA 02111
Trustee (since 1996) | | Senior Vice President, General Counsel and Corporate Secretary, ConocoPhillips (integrated energy company) since September 2007; Deputy General Counsel—Corporate Legal Services, ConocoPhillips from August 2006 to August 2007; Partner, Zelle, Hofmann, Voelbel, Mason & Gette LLP (law firm) from March 2005 to July 2006; Adjunct Professor of Law, Northwestern University, from September 2004 to June 2006; Director, UAL Corporation (airline) from February 2006 to July 2006; Oversees 79, None | |
|
| Charles R. Nelson (Born 1942) | |
|
c/o Columbia Management
Advisors, LLC
One Financial Center
Boston, MA 02111
Trustee (since 1981) | | Professor of Economics, University of Washington, since January 1976; Ford and Louisa Van Voorhis Professor of Political Economy, University of Washington, since September 1993; Adjunct Professor of Statistics, University of Washington, since September 1980; Associate Editor, Journal of Money Credit and Banking, 1993—2008; Consultant on econometric and statistical matters. Oversees 79, None | |
|
46
Fund Governance (continued) – Columbia Strategic Income Fund
Independent Trustees (continued)
Name, Address and Year of Birth,
Position with Funds, Year First
Elected or Appointed to Office | | Principal Occupation(s) During Past Five Years, Number of Funds in the Columbia
Funds Complex Overseen by Trustee, Other Directorships Held
| |
| John J. Neuhauser (Born 1943) | |
|
c/o Columbia Management
Advisors, LLC
One Financial Center
Boston, MA 02111
Trustee (since 1985) | | President, Saint Michael's College, since August 2007; University Professor, Boston College from November 2005 to August 2007; Academic Vice President and Dean of Faculties, Boston College from August 1999 to October 2005. Oversees 79, Liberty All-Star Equity Fund and Liberty All-Star Growth Fund, Inc. (closed-end funds) | |
|
| Jonathan Piel (Born 1938) | |
|
c/o Columbia Management
Advisors, LLC
One Financial Center
Boston, MA 02111
Trustee (since 2007) | | Cable television producer and website designer; The Editor, Scientific American from 1984 to 1994; Vice President, Scientific American, Inc., from 1984 to 1994; Member, Advisory Board, Stone Age Institute, Bloomington, Indiana (research institute that explores the effect of technology on human evolution); Member, Board of Directors of the National Institute of Social Sciences, New York City; Member, Board of Trustees of the William Alanson White Institute, New York City (institution for training psychoanalysts); Member, Advisory Board, Mount Sinai Children's Environmental Health Center, New York. Oversees 79, None | |
|
| Patrick J. Simpson (Born 1944) | |
|
c/o Columbia Management
Advisors, LLC
One Financial Center
Boston, MA 02111
Trustee (since 2000) | | Partner, Perkins Coie LLP (law firm). Oversees 79, None | |
|
| Thomas C. Theobald (Born 1937) | |
|
c/o Columbia Management
Advisors, LLC
One Financial Center
Boston, MA 02111
Trustee (since 1996) | | Partner and Senior Advisor, Chicago Growth Partners (private equity investing) since September 2004; Managing Director, William Blair Capital Partners (private equity investing) from September 1994 to September 2004. Oversees 79, Anixter International (network support equipment distributor); Ventas, Inc. (real estate investment trust); Jones Lang LaSalle (real estate management services); Ambac Financial Group (financial guaranty insurance) | |
|
| Anne-Lee Verville (Born 1945) | |
|
c/o Columbia Management
Advisors, LLC
One Financial Center
Boston, MA 02111
Trustee (since 1998) | | Retired since 1997 (formerly General Manager—Global Education Industry (from 1994 to 1997), President—Application Systems Division (from 1991 to 1994), Chief Financial Officer—US Marketing & Services (from 1988 to 1991), and Chief Information Officer (from 1987 to 1988), IBM Corporation (computer and technology)). Oversees 79, None | |
|
47
Fund Governance (continued) – Columbia Strategic Income Fund
Interested Trustee
Name, Address and Year of Birth,
Position with Funds, Year First
Elected or Appointed to Office | | Principal Occupation(s) During Past Five Years, Number of Funds in the Columbia
Funds Complex Overseen by Trustee, Other Directorships Held
| |
| William E. Mayer1 (Born 1940) | |
|
c/o Columbia Management
Advisors, LLC
One Financial Center
Boston, MA 02111
Trustee (since 1994) | | Partner, Park Avenue Equity Partners (private equity) since February 1999; Dean and Professor, College of Business, University of Maryland from 1992 to 1997. Oversees 79, Lee Enterprises (print media), WR Hambrecht + Co. (financial service provider); BlackRock Kelso Capital Corporation (investment company) | |
|
1 The Funds currently treat Mr. Mayer as an "interested person" (as defined in the Investment Company Act of 1940) by reason of his affiliation with WR Hambrecht + Co., a registered broker/dealer that may execute portfolio transactions for or engage in principal transactions with the Funds or other funds or accounts advised/managed by the Advisor or other Bank of America affiliates.
The Statement of Additional Information includes additional information about the Trustees of the Funds and is available, without charge, upon request by calling 1-800-345-6611.
Officers
Name, Address and Year of Birth,
Position with Funds, Year First
Elected or Appointed to Office | | Principal Occupation(s) During Past Five Years | |
| J. Kevin Connaughton (Born 1964) | |
|
One Financial Center
Boston, MA 02111
President (since 2009) | | Managing Director of Columbia Management Advisors, LLC since December 2004; Senior Vice President and Chief Financial Officer—Columbia Funds, from June 2008 to January 2009; Treasurer—Columbia Funds, from October 2003 to May 2008; Treasurer—the Liberty Funds, Stein Roe Funds and Liberty All-Star Funds, December 2000—December 2006; Senior Vice President—Columbia Management Advisors, LLC, from April 2003 to December 2004; President—Columbia Funds, Liberty Funds and Stein Roe Funds, February 2004 to October 2004; Treasurer—Galaxy Funds, September 2002 to December 2005; Treasurer, December 2002 to December 2004, and President, February 2004 to December 2004—Columbia Management Multi-Strategy Hedge Fund, LLC; and a senior officer of various other Bank of America-affiliated entities, including other registered and unregistered funds. | |
|
| James R. Bordewick, Jr. (Born 1959) | |
|
One Financial Center
Boston, MA 02111
Senior Vice President, Secretary and Chief Legal Officer (since 2006) | | Associate General Counsel, Bank of America since April 2005; Senior Vice President and Associate General Counsel, MFS Investment Management (investment management) prior to April 2005. | |
|
| Linda J. Wondrack (Born 1964) | |
|
One Financial Center
Boston, MA 02111
Senior Vice President and Chief Compliance Officer (since 2007) | | Director (Columbia Management Group LLC and Investment Product Group Compliance), Bank of America since June 2005; Director of Corporate Compliance and Conflicts Officer, MFS Investment Management (investment management), August 2004 to May 2005; Managing Director, Deutsche Asset Management (investment management) prior to August 2004. | |
|
48
Fund Governance (continued) – Columbia Strategic Income Fund
Officers (continued)
Name, Address and Year of Birth,
Position with Funds, Year First
Elected or Appointed to Office | | Principal Occupation(s) During Past Five Years | |
| Michael G. Clarke (Born 1969) | |
|
One Financial Center
Boston, MA 02111
Senior Vice President and Chief Financial Officer (since 2009) | | Director of Fund Administration of the Advisor since January 2006; Managing Director of the Advisor September 2004 to December 2005; Vice President Fund Administration June 2002 to September 2004. | |
|
| Jeffrey R. Coleman (Born 1969) | |
|
One Financial Center
Boston, MA 02111
Deputy Treasurer (since 2008) | | Director of Fund Administration of the Advisor since January 2006; Fund Controller of the Advisor from October 2004 to January 2006; Vice President of CDC IXIS Asset Management Services, Inc. (investment management) from August 2000 to September 2004. | |
|
| Joseph F. DiMaria (Born 1968) | |
|
One Financial Center
Boston, MA 02111
Chief Accounting Officer and Treasurer (since 2009) | | Director of Fund Administration of the Advisor since January 2006; Head of Tax/Compliance and Assistant Treasurer of the Advisor from November 2004 to December 2005; Director of Trustee Administration (Sarbanes-Oxley) of the Advisor from May 2003 to October 2004. | |
|
| Julian Quero (Born 1967) | |
|
One Financial Center
Boston, MA 02111
Deputy Treasurer (since 2008) | | Senior Tax Manager of the Advisor since August 2006; Senior Compliance Manager of the Advisor from April 2002 to August 2006. | |
|
| Barry S. Vallan (Born 1969) | |
|
One Financial Center
Boston, MA 02111
Controller (since 2006) | | Vice President—Fund Treasury of the Advisor since October 2004; Vice President—Trustee Reporting of the Advisor from April 2002 to October 2004 | |
|
| Stephen T. Welsh (Born 1957) | |
|
One Financial Center
Boston, MA 02111
Vice President (since 1996) | | President, Columbia Management Services, Inc. since July 2004; Senior Vice President and Controller, Columbia Management Services, Inc. prior to July 2004. | |
|
49
This page intentionally left blank.
This page intentionally left blank.
This page intentionally left blank.
Important Information About This Report
The fund mails one shareholder report to each shareholder address. If you would like more than one report, please call shareholder services at 1-800-345-6611 and additional reports will be sent to you. This report has been prepared for shareholders of Columbia Strategic Income Fund.
A description of the policies and procedures that the fund uses to determine how to vote proxies and a copy of the fund's voting records are available (i) at www.columbiamanagement.com; (ii) on the Securities and Exchange Commission's website at www.sec.gov, and (iii) without charge, upon request, by calling 1-800-368-0346. Information regarding how the fund voted proxies relating to portfolio securities during the 12-month period ended June 30 is available from the SEC's website. Information regarding how the fund voted proxies relating to portfolio securities is also available from the fund's website, www.columbiamanagement.com.
The fund files a complete schedule of portfolio holdings with the SEC for the first and third quarters of each fiscal year on Form N-Q. The fund's Form N-Q is available on the SEC's website at www.sec.gov and may be reviewed and copied at the SEC's Public Reference Room in Washington, DC. Information on the operation of the Public Reference Room may be obtained by calling 1-800-SEC-0330.
Please read and consider the investment objectives, risks, charges and expenses for any fund carefully before investing. For a prospectus which contains this and other important information about the fund, contact your Columbia Management representative or financial advisor or go to www.columbiamanagement.com.
Columbia Management Group, LLC ("Columbia Management") is the investment management division of Bank of America Corporation. Columbia Management entities furnish investment management services and products for institutional and individual investors. Columbia Funds are distributed by Columbia Management Distributors, Inc., member of FINRA, SIPC, part of Columbia Management and an affiliate of Bank of America Corporation.
| Transfer Agent | |
|
Columbia Management Services, Inc.
P.O. Box 8081
Boston, MA 02266-8081
1-800-345-6611 | |
|
| Distributor | |
|
Columbia Management
Distributors, Inc.
One Financial Center
Boston, MA 02111 | |
|
| Investment Advisor | |
|
Columbia Management Advisors, LLC
100 Federal Street
Boston, MA 02110 | |
|
53
Columbia Management®
One Financial Center
Boston, MA 02111-2621
PRSRT STD
U.S. Postage
PAID
Holliston, MA
Permit NO. 20
Columbia Management®
Columbia Strategic Income Fund
Annual Report, May 31, 2009
©2009 Columbia Management Distributors, Inc.
One Financial Center, Boston, MA 02111-2621
800-345-6611 www.columbiafunds.com
SHC-42/16611-0509 (07/09) 09/82448
Columbia Management®
Annual Report
May 31, 2009
Columbia High Yield Opportunity Fund
| NOT FDIC INSURED | | May Lose Value | |
|
| NOT BANK ISSUED | | No Bank Guarantee | |
|
Table of Contents
| Fund Profile | | | 1 | | |
|
| Economic Update | | | 2 | | |
|
| Performance Information | | | 4 | | |
|
| Understanding Your Expenses | | | 5 | | |
|
| Portfolio Manager's Report | | | 6 | | |
|
| Financial Statements | |
|
| Investment Portfolio | | | 8 | | |
|
Statement of Assets and
Liabilities | | | 20 | | |
|
| Statement of Operations | | | 22 | | |
|
Statement of Changes in
Net Assets | | | 23 | | |
|
| Financial Highlights | | | 25 | | |
|
| Notes to Financial Statements | | | 29 | | |
|
| Report of Independent Registered Public Accounting Firm | | | 40 | | |
|
| Fund Governance | | | 41 | | |
|
Important Information About
This Report | | | 45 | | |
|
The views expressed in this report reflect the current views of the respective parties. These views are not guarantees of future performance and involve certain risks, uncertainties and assumptions that are difficult to predict, so actual outcomes and results may differ significantly from the views expressed. These views are subject to change at any time based upon economic, market or other conditions and the respective parties disclaim any responsibility to update such views. These views may not be relied on as investment advice and, because investment decisions for a Columbia Fund are based on numerous factors, may not be relied on as an indication of trading intent on behalf of any particular Columbia Fund. References to specific securities should not be construed as a recommendation or investment advice.
President's Message

Dear Shareholder:
Recent events have shown great volatility in the markets and uncertainty in the economy. During these challenging times, it becomes even more important to focus on long-term horizons and key investment tools that can help manage volatility. This may be the time to reflect on your investment goals and evaluate your portfolio to ensure you are positioned for any potential market rebound.
A long-term financial plan can serve as a road map and guide you through the necessary steps designed to meet your financial goals. Your financial plan should take into account your investment goals, time horizon, overall financial situation, risk tolerance and willingness to ride out market volatility. Your investment professional can be a key resource as you work through this process. The knowledge and experience of an investment professional can help as you create or reevaluate your investment strategy.
The importance of diversification
Although diversification does not ensure a profit or guarantee against loss, a diversified portfolio can be a strategy for successful long-term investing. Diversification refers to the mix of investments within a portfolio. A mutual fund can contribute to portfolio diversification given that a mutual fund's portfolio represents several investments. Additionally, the way you allocate your money among stocks, bonds and cash, and geographically between foreign and domestic investments, can help to reduce risks. Diversification can result in multiple investments where the positive performance of certain holdings can offset any negative performance from other holdings. Having a diversified portfolio doesn't mean that the value of the portfolio will never go down, but rather helps strike a balance between risk and reward.
Reevaluate your strategy
An annual review of your investments is a key opportunity to determine if your investment needs have changed or if you need minor adjustments to rebalance your portfolio. Life events like a birth, marriage, home improvement, or change in employment can have a major effect on your spending and goals. Ask yourself how your spending or goals have changed and factor this into your financial plan. Are you using automated investments or payroll deductions to help keep your savings on track? Are you able to set aside additional savings or increase your 401(k) plan contributions? If during your review you find that your investments in any one category (e.g., stocks, bonds or cash) have grown too large based on your diversification plan, you may want to consider redirecting future investments to get back on track.
History has shown that the U.S. stock market has been remarkably resilient1. Volatility can lead to opportunity. Patience and a commitment to your long-term financial plan may position you to potentially benefit over your investment horizon. We appreciate your business and continued support of Columbia Funds.
Sincerely,

J. Kevin Connaughton
President, Columbia Funds
1The Dow Jones Industrial Average is the most widely used indicator of the overall condition of the stock market. The Dow Jones Industrial Average Index is a price-weighted average of 30 actively traded blue-chip stocks as selected by the editors of the Wall Street Journal. Indices are not investments, do not incur fees or expenses and are not professionally managed. It is not possible to invest directly in an index.
Fund Profile – Columbia High Yield Opportunity Fund
Summary
g For the 12-month period that ended May 31, 2009, the fund's Class A shares returned negative 12.04% without sales charge.
g The fund performed in line with its peer group, the Lipper High Current Yield Funds Classification,1 but lagged its benchmarks, the JPMorgan Global High Yield Index2 and Credit Suisse High Yield Index.3
g The fund's higher quality positioning caused it to fall behind its benchmarks during the second half of the period as investors shifted into riskier assets.
Portfolio Management
Kevin L. Cronk, CFA has managed the fund since February 2003 and has been associated with the advisor or its predecessors since 1999.
1Lipper Inc., a widely respected data provider in the industry, calculates an average total return (assuming reinvestment of distributions) for mutual funds with investment objectives similar to those of the fund. Lipper makes no adjustment for the effect of sales loads.
2The JPMorgan Global High Yield Index is designed to mirror the investable universe of the U.S. dollar global high-yield corporate debt market, including domestic and international issues.
3The Credit Suisse High Yield Index is a broad-based index that tracks the performance of high-yield bonds.
Indices are not available for investment, are not professionally managed and do not reflect sales charges, fees, brokerage commissions, taxes or other expenses of investing. Securities in the fund may not match those in an index.
Performance data quoted represents past performance and current performance may be lower or higher. Past performance is no guarantee of future results. The investment return and principal value will fluctuate so that shares, when redeemed, may be worth more or less than the original cost. Please visit www.columbiafunds.com for daily and most recent month-end performance updates.
Summary
1-year return as of 05/31/09
| | | –12.04 | % | |
|
 | | | Class A shares
(without sales charge) | | |
|
| | | –9.53 | % | |
|
 | | | JPMorgan Global
High Yield Index | | |
|
| | | –10.50 | % | |
|
 | | | Credit Suisse
High Yield Index | | |
|
Morningstar Style BoxTM
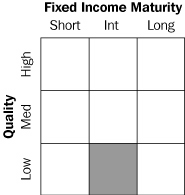
The Morningstar Style BoxTM reveals a fund's investment strategy. For fixed-income funds, the vertical axis shows the average credit quality of the bonds owned, and the horizontal axis shows interest rate sensitivity as measured by a bond's duration (short, intermediate or long). Information shown is based on the most recent data provided by Morningstar.
1
Economic Update – Columbia High Yield Opportunity Fund
Summary
For the 12-month period that ended May 31, 2009
g Despite volatility in many segments of the bond market, the Barclays Capital U.S. Aggregate Bond Index delivered positive results. High-yield bonds lost ground, as measured by the JPMorgan Global High Yield Index.
Barclays
Aggregate
Index | | JPMorgan Global
High Yield
Index | |
|
 | |  | |
|
g The broad U.S. stock market, as measured by the S&P 500 Index, returned negative 32.57%. Developed stock markets outside the United States returned negative 36.61%, as measured (in U.S. dollars) by the MSCI EAFE Index.
| S&P Index | | MSCI Index | |
|
 | |  | |
|
During the 12-month period that began June 1, 2008 and ended May 31, 2009, the U.S. economy struggled under the weight of the worst financial crisis since the Great Depression. Economic growth contracted by more than 6% in the second half of 2008. Although the decline for the first half of 2009 appears to have been less severe, hopes for a late 2009 recovery remain in doubt. The lapse from growth has resulted in the longest—and most severe—recession in nearly three decades.
The labor market shed millions of jobs between 2008 and 2009, raising the unemployment rate to 9.4% in May 2009. Manufacturing activity slowed and consumer spending declined. The beleaguered housing market continued to lose ground as prices fell and inventories rose. However, mortgage purchase applications increased late in the period, buoyed by low interest rates and an $8,000 first-time home buyer tax credit. Late in 2008, consumer confidence, as measured by the Conference Board, plummeted to its lowest point ever. However, it stabilized in March of 2009 and turned sharply higher in both April and May of 2009.
Troubles that began in the U.S. subprime mortgage market led to a meltdown within the U.S. financial sector that claimed several major institutions in 2008 and led others to seek bailouts, restructuring or both. New rigorous lending standards severely limited access to credit, further hampering economic growth. In this environment, a new administration sought to stabilize the financial system, address economic woes and introduce sweeping health care reform. Stimulus spending began to flow into the economy, raising hopes that growth would be restored in the second half of 2009. However, with much of the developed world in recession, any substantial improvement in economic conditions may be longer in coming. In December 2008, the Federal Reserve Board (the Fed) lowered a key short-term borrowing rate—the federal funds rate—to between zero and 0.25%—a record low. In light of protracted economic weakness, the Fed is u nlikely to tighten its reins on money until the economy and the labor markets stabilize.
Bonds outperformed stocks
As investors sought refuge from a volatile stock market, the highest quality sectors of the U.S. bond market delivered modest gains. During the first half of the period, Treasury prices rose and yields declined sharply as the economy faltered and stock market volatility increased. As hopes for a recovery materialized in the second half of the period, yields rose and Treasuries lagged riskier segments of the bond market. The benchmark 10-year U.S. Treasury yield began the period at just over 4.0%, declined to 2.2% in December 2008 then rose to end the period at 3.4%. In this environment, the Barclays Capital U.S. Aggregate Bond Index1 (formerly the Lehman Brothers U.S.
1The Barclays Capital U.S. Aggregate Bond Index is a market value-weighted index that tracks the daily price, coupon, pay-downs, and total return performance of fixed-rate, publicly placed, dollar-denominated, and non-convertible investment-grade debt issues with a least $250 million par amount outstanding and with at least one year to final maturity. Indices are not available for investment, are not professionally managed and do not reflect sales charges, fees, brokerage commissions, taxes or other expenses of investing. Securities in the fund may not match those in an index.
2
Economic Update (continued) – Columbia High Yield Opportunity Fund
Aggregate Bond Index) returned 5.36%. High-yield bond prices fell sharply as economic prospects weakened and default fears rose in 2008, then rebounded strongly in 2009. For the 12-month period, the JPMorgan Global High Yield Index2 returned negative 9.53%. For the last six months of the period, the index gained 31.70%.
Stocks retreated, then rebounded
Against a weakening economic backdrop, the U.S. stock market lost 32.57% for the 12-month period, as measured by the S&P 500 Index.3 Losses affected the stocks of companies of all sizes and investment style categories, although growth stocks held up better than value stocks, as measured by their respective Russell indices.4 Stock markets outside the U.S. suffered even greater losses. The MSCI EAFE Index,5 a broad gauge of stock market performance in foreign developed markets, lost 36.61% (in U.S. dollars) for the period. Emerging stock markets, which generally have had a strong run over the past several years, were also caught in the downdraft. As investors backed away from risk, the MSCI Emerging Markets Index6 returned negative 34.36% (in U.S. dollars).
Past performance is no guarantee of future results.
2The JPMorgan Global High Yield Index is designed to mirror the investable universe of the U.S. dollar global high-yield corporate debt market, including domestic and international issues.
3The Standard & Poor's (S&P) 500 Index tracks the performance of 500 widely held, large-capitalization U.S. stocks.
4The Russell 1000 Index measures the performance of 1,000 of the largest U.S. companies, based on market capitalization. The Russell Midcap Index measures the performance of the 800 smallest companies in the Russell 1000 Index, as ranked by total market capitalization. The Russell 2000 Index measures the performance of the 2,000 smallest of the 3,000 largest U.S. companies, based on market capitalization. The Russell 1000 Growth Index measures the performance of those Russell 1000 Index companies with higher price-to-book ratios and higher forecasted growth values. The Russell 1000 Value Index measures the performance of those companies in the Russell 1000 Index with lower price-to-book ratios and lower forecasted growth values. The Russell 2000 Growth Index measures the performance of those Russell 2000 Index companies with higher price-to-book ratios and higher forecasted growth values. The Russell 2000 Value Index measures the performance of those Russell 2000 Index companies with lower price-to-book ratios and lower forecasted growth values. The Russell 3000 Growth Index measures the performance of those Russell 3000 Index companies with higher price-to-book ratios and higher forecasted growth values. The Russell 3000 Value Index measures the performance of those Russell 3000 Index companies with lower price-to-book ratios and lower forecasted growth values. The Russell Midcap Growth Index measures the performance of those Russell Midcap Index companies with higher price-to-book ratios and higher forecasted growth values. The Russell Midcap Value Index measures the performance of those Russell Midcap Index companies with lower price-to-book ratios and lower forecasted growth values.
5The Morgan Stanley Capital International (MSCI) Europe, Australasia, Far East (EAFE) Index is a free float-adjusted market capitalization index that is designed to measure developed market equity performance, excluding the U.S. and Canada.
6The Morgan Stanley Capital International (MSCI) Emerging Markets Index is composed of a sample of companies from 22 countries representing the global emerging stock markets.
Indices are not available for investment, are not professionally managed and do not reflect sales charges, fees, brokerage commissions, taxes or other expenses of investing. Securities in the fund may not match those in an index.
3
Performance Information – Columbia High Yield Opportunity Fund
Performance data quoted represents past performance and current performance may be lower or higher. Past performance is no guarantee of future results. The investment return and principal value will fluctuate so that shares, when redeemed, may be worth more or less than the original cost. Please visit www.columbiafunds.com for daily and most recent month-end performance updates.
Annual operating expense ratio (%)*
| Class A | | | 1.11 | | |
| Class B | | | 1.86 | | |
| Class C | | | 1.86 | | |
| Class Z | | | 0.86 | | |
* The annual operating expense ratio is as stated in the fund's prospectus that is current as of the date of this report. Differences in expense ratios disclosed elsewhere in this report may result from including fee waivers and expense reimbursements as well as different time periods used in calculating the ratios.
Performance of a $10,000 investment 06/01/99 – 05/31/09
The chart above shows the change in value of a hypothetical $10,000 investment in Class A shares of Columbia High Yield Opportunity Fund during the stated time period, and does not reflect the deduction of taxes that a shareholder may pay on fund distributions on the redemption of fund shares. The Credit Suisse High Yield Index is a broad-based index that tracks the performance of high-yield bonds. The JPMorgan Global High Yield Index is designed to mirror the investable universe of the US dollar global high-yield corporate debt market, including domestic and international issues. Indices are not available for investment, and do not reflect sales charges, fees, brokerage commissions, taxes or other expenses of investing. Securities in the fund may not match those in an index.
Performance of a $10,000 investment 06/01/99 – 05/31/09 ($)
| Sales charge | | without | | with | |
| Class A | | | 11,801 | | | | 11,241 | | |
| Class B | | | 10,956 | | | | 10,956 | | |
| Class C | | | 11,121 | | | | 11,121 | | |
| Class Z | | | 12,098 | | | | n/a | | |
Average annual total return as of 05/31/09 (%)
| Share class | | A | | B | | C | | Z | |
| Inception | | 10/21/71 | | 06/08/92 | | 01/15/96 | | 01/08/99 | |
| Sales charge | | without | | with | | without | | with | | without | | with | | without | |
| 1-year | | | –12.04 | | | | –16.22 | | | | –12.69 | | | | –16.68 | | | | –12.57 | | | | –13.36 | | | | –11.83 | | |
| 5-year | | | 1.87 | | | | 0.88 | | | | 1.12 | | | | 0.83 | | | | 1.26 | | | | 1.26 | | | | 2.12 | | |
| 10-year | | | 1.67 | | | | 1.18 | | | | 0.92 | | | | 0.92 | | | | 1.07 | | | | 1.07 | | | | 1.92 | | |
Average annual total return as of 06/30/09 (%)
| Share class | | A | | B | | C | | Z | |
| Sales charge | | without | | with | | without | | with | | without | | with | | without | |
| 1-year | | | –7.24 | | | | –11.65 | | | | –7.93 | | | | –12.15 | | | | –7.80 | | | | –8.64 | | | | –7.02 | | |
| 5-year | | | 2.17 | | | | 1.18 | | | | 1.41 | | | | 1.13 | | | | 1.56 | | | | 1.56 | | | | 2.42 | | |
| 10-year | | | 1.91 | | | | 1.42 | | | | 1.16 | | | | 1.16 | | | | 1.31 | | | | 1.31 | | | | 2.17 | | |
The "with sales charge" returns include the maximum initial sales charge of 4.75% for Class A shares, the applicable contingent deferred sales charge of 5.00% in the first year, declining to 1.00% in the sixth year and eliminated thereafter for Class B shares and 1.00% for Class C shares for the first year only. The "without sales charge" returns do not include the effect of sales charges. If they had, returns would be lower.
Performance results reflect any fee waivers or reimbursements of fund expenses by the investment advisor and/or any of its affiliates. Absent these fee waivers or expense reimbursement arrangements, performance results would have been lower.
All results shown assume reinvestment of distributions. Class Z shares are sold at net asset value with no distribution and service (Rule 12b-1) fees. Class Z shares have limited eligibility and the investment minimum requirements may vary. Please see the fund's prospectus for details. Performance for different share classes will vary based on differences in sales charges and fees associated with each class.
The tables do not reflect the deduction of taxes that a shareholder may pay on fund distributions or the redemption of fund shares.
4
Understanding Your Expenses – Columbia High Yield Opportunity Fund
As a fund shareholder, you incur two types of costs. There are transaction costs, which generally include sales charges on purchases and may include redemption fees or exchange fees. There are also ongoing costs, which generally include investment advisory fees, distribution and service (Rule 12b-1) fees and other fund expenses. The information on this page is intended to help you understand the ongoing costs of investing in the fund and to compare these costs with the ongoing costs of investing in other mutual funds.
Analyzing your fund's expenses by share class
To illustrate these ongoing costs, we have provided an example and calculated the expenses paid by investors in each share class during the period. The information in the following table is based on an initial investment of $1,000, which is invested at the beginning of the period and held for the entire period. Expense information is calculated two ways and each method provides you with different information. The amount listed in the "Actual" column is calculated using the fund's actual operating expenses and total return for the period. The amount listed in the "Hypothetical" column for each share class assumes that the return each year is 5% before expenses and is calculated based on the fund's actual operating expenses. You should not use the hypothetical account values and expenses to estimate either your actual account balance at the end of the period or the expenses you paid during this period.
Compare with other funds
Since all mutual funds are required to include the same hypothetical calculations about expenses in shareholder reports, you can use this information to compare the ongoing cost of investing in the fund with other funds. To do so, compare the 5% hypothetical example with the 5% hypothetical examples that appear in the shareholder reports of other funds. As you compare hypothetical examples of other funds, it is important to note that hypothetical examples are meant to highlight the ongoing costs of investing in a fund and do not reflect any transaction costs, such as sales charges, redemption fees or exchange fees.
Estimating your actual expenses
To estimate the expenses that you paid over the period, first you will need your account balance at the end of the period:
g For shareholders who receive their account statements from Columbia Management Services, Inc., your account balance is available online at www.columbiafunds.com or by calling Shareholder Services at 800.345.6611.
g For shareholders who receive their account statements from their financial intermediary, contact your financial intermediary to obtain your account balance.
1. Divide your ending account balance by $1,000. For example, if an account balance was $8,600 at the end of the period, the result would be 8.6.
2. In the section of the table below titled "Expenses paid during the period," locate the amount for your share class. You will find this number in the column labeled "Actual." Multiply this number by the result from step 1. Your answer is an estimate of the expenses you paid on your account during the period.
If the value of your account falls below the minimum initial investment requirement applicable to you, your account generally will be subject to a $20 annual fee. This fee is not included in the accompanying table. If you are subject to the fee, keep it in mind when you are estimating the ongoing expenses of investing in the fund and when comparing the expenses of this fund with other funds.
12/01/08 – 05/31/09
| | | Account value at the
beginning of the period ($) | | Account value at the
end of the period ($) | | Expenses paid
during the period ($) | | Fund's annualized
expense ratio (%) | |
| | | Actual | | Hypothetical | | Actual | | Hypothetical | | Actual | | Hypothetical | | Actual | |
| Class A | | | 1,000.00 | | | | 1,000.00 | | | | 1,259.99 | | | | 1,019.55 | | | | 6.09 | | | | 5.44 | | | | 1.08 | | |
| Class B | | | 1,000.00 | | | | 1,000.00 | | | | 1,255.40 | | | | 1,015.76 | | | | 10.35 | | | | 9.25 | | | | 1.84 | | |
| Class C | | | 1,000.00 | | | | 1,000.00 | | | | 1,256.20 | | | | 1,016.55 | | | | 9.45 | | | | 8.45 | | | | 1.68 | | |
| Class Z | | | 1,000.00 | | | | 1,000.00 | | | | 1,261.38 | | | | 1,020.74 | | | | 4.74 | | | | 4.23 | | | | 0.84 | | |
Expenses paid during the period are equal to the annualized expense ratio for the share class, multiplied by the average account value over the period, then multiplied by the number of days in the fund's most recent fiscal half-year and divided by 365.
Had the investment advisor and/or any of its affiliates not waived fees or reimbursed a portion of expenses for Class C shares, the account value at the end of the period for Class C shares would have been reduced.
It is important to note that the expense amounts shown in the table are meant to highlight only ongoing costs of investing in the fund and do not reflect any transaction costs, such as sales charges, redemption fees or exchange fees. Therefore, the hypothetical examples provided may not help you determine the relative total costs of owning shares of different funds. If these transaction costs were included, your costs would have been higher.
5
Portfolio Manager's Report – Columbia High Yield Opportunity Fund
Performance data quoted represents past performance and current performance may be lower or higher. Past performance is no guarantee of future results. The investment return and principal value will fluctuate so that shares, when redeemed, may be worth more or less than the original cost. Please visit www.columbiafunds.com for daily and most recent month-end performance updates.
Net asset value per share
as of 05/31/09 ($)
| Class A | | | 3.33 | | |
| Class B | | | 3.33 | | |
| Class C | | | 3.33 | | |
| Class Z | | | 3.33 | | |
Distributions declared per share
06/01/08 – 05/31/09 ($)
| Class A | | | 0.32 | | |
| Class B | | | 0.29 | | |
| Class C | | | 0.30 | | |
| Class Z | | | 0.33 | | |
Top 10 issuers
as of 05/31/09 (%)
| HCA, Inc. | | | 2.6 | | |
Freeport-McMoRan
Copper & Gold, Inc. | | | 1.7 | | |
| GMAC LLC | | | 1.6 | | |
| Intelsat Jackson Holdings Ltd. | | | 1.5 | | |
| Ford Motor Credit Co. | | | 1.4 | | |
| Biomet, Inc. | | | 1.3 | | |
| Chesapeake Energy Corp. | | | 1.2 | | |
| Charter Communications | | | 1.2 | | |
| Qwest Corp. | | | 1.2 | | |
| Windstream Corp. | | | 1.1 | | |
The fund is actively managed and the composition of its portfolio will change over time. Top 10 issuers is calculated as a percentage of net assets.
Holdings discussed in this report
as of 5/31/09 (%)
| General Motors | | | 0.1 | | |
| Freescale Semiconductor | | | 0.2 | | |
| Texas Competitive Electric | | | 0.6 | | |
| Energy Future Holdings | | | 0.7 | | |
| Nextel Communications | | | 0.6 | | |
| Rite Aid | | | 0.4 | | |
| Intelsat | | | 1.5 | | |
| GMAC LLC | | | 1.6 | | |
Information provided is calculated as a percentage of net assets.
For the 12-month period that ended May 31, 2009, the fund's Class A shares returned negative 12.04% without sales charge. The fund's benchmarks, the Credit Suisse High Yield Index and the JPMorgan Global High Yield Index, returned negative 10.50% and negative 9.53%, respectively. The average return of the fund's peer group, the Lipper High Current Yield Funds Classification, was negative 12.32% for the same period. The fund had an underweight in low quality, CCC-rated bonds, which hampered returns versus the benchmarks during the second half of the period, as investors flocked to these riskier assets.
Shift in risk tolerance
During last summer and fall, a financial crisis ballooned into a global recession, and investors became increasingly risk averse. Prices on high-yield bonds plunged, while yields rose. From May 31, 2008, until the sector's bottom on December 16, 2008, the JPMorgan Global High Yield Index declined 33%, with the biggest losses coming from lower-quality, CCC-rated bonds. The fund's underweight in CCC-rated bonds helped contain losses during that downturn. As the new year began and the economy and financial institutions started to show signs of stabilization, investors began to take on more risk. Yields on high-yield bonds fell sharply and bond prices rallied, led by the lowest quality and most distressed credits and industries. From the December bottom until May 31, 2009, the high-yield sector climbed 35%, despite the fact that the economy remained weak and default rates neared record highs. In this environment, we maintained a hig her quality bias because of our concerns that economic deterioration would continue to hinder the weakest issuers. While this strategy may have given up some return in this period, we believe that it is a prudent approach going forward.
Lost ground from financials and automotive
An underweight in the financials sector and an overweight in the automotive industry further pressured performance relative to the benchmarks. Detractors included auto giant General Motors' bonds, which suffered as car sales plummeted and a federal bailout proved insufficient to avoid bankruptcy. Among other disappointments were bonds issued by Freescale Semiconductor, a semiconductor ("chip") manufacturer, which declined as the company's largest customer, wireless equipment maker Motorola (which was not in the portfolio), lost market share, and the recession slowed demand from many other end markets. Bonds issued by non-regulated electric utilities Texas Competitive Electric and Energy Future Holdings (formerly TXU) further detracted from performance as investors became concerned about high debt levels at both companies as well as the future for electricity demand and rates in Texas.
6
Portfolio Manager's Report (continued) – Columbia High Yield Opportunity Fund
Winners from wireless telecommunications
An overweight in the wireless telecommunications sector and an underweight in broadcasting, diversified media and information technology aided returns. In addition, a number of bonds appreciated nicely from distressed levels. Among standouts were bonds issued by wireless telecom provider Nextel Communications, as well as drugstore chain Rite Aid. Both issues benefited because the companies had liquidity to allow for improved financial and operating results. Satellite company Intelsat's bonds also did well as the company's business proved resilient to economic pressures. Finally, bonds issued by GMAC, the financial services unit of GM appreciated nicely, after GMAC received capital infusions from the U.S. Treasury.
Encouraging economic signs
We are encouraged by "green shoots" in the economy, which suggest the worst of the recession and financial crisis may be behind us. In addition, we are seeing significant improvements in the high-yield bond market, including a near record level of new issuance in May and increased refinancing by high-yield issuers wanting to bolster liquidity. In our opinion, high-yield bonds continue to offer compelling long-term values at current levels. However, we expect default rates to rise throughout 2009 and, therefore, remain cautious on low-quality CCC-rated bonds and the distressed industries that have rallied so sharply in recent months. Going forward, we may add selectively to certain low quality credits that we believe offer attractive value and also have sufficient liquidity to withstand continued weakness in the economy.
Investing in fixed-income securities may involve certain risks, including the credit quality of individual issuers, possible prepayments, market or economic developments and yield and share price fluctuations due to changes in interest rates. When interest rates go up, bond prices typically drop, and vice versa.
Investing in high-yield or "junk" bonds offers the potential for higher income than investments in investment-grade bonds, but also has a higher degree of risk. Changes in economic conditions or other circumstances may adversely affect a high-yield bond issuer's ability to make timely principal and interest payments. Rising interest rates tend to lower the value of all bonds. International investing involves special risks, including foreign taxation, currency fluctuations, risks associated with possible differences in financial standards and other monetary and political risks.
Portfolio structure
as of 05/31/09 (%)
| Corporate Fixed-Income | |
| Bonds & Notes | | | 91.3 | | |
| Municipal Bonds | | | 1.0 | | |
| Convertible Bond | | | 0.3 | | |
| Common Stocks | | | 0.0 | * | |
| Preferred Stocks | | | 0.0 | * | |
| Warrants | | | 0.0 | * | |
| Short-Term Obligation | | | 6.0 | | |
*Rounds to less than 0.01%
The fund is actively managed and the composition of its portfolio will change over time. Portfolio structure is calculated as a percentage of total net assets.
Maturity breakdown
as of 05/31/09 (%)
| 1-3 years | | | 8.6 | | |
| 3-5 years | | | 20.7 | | |
| 5-7 years | | | 37.0 | | |
| 7-10 years | | | 25.5 | | |
| 10-15 years | | | 3.8 | | |
| 15-20 years | | | 1.9 | | |
| 20-30 years | | | 2.1 | | |
| Other | | | 0.4 | | |
Maturity breakdown is based on weighted average life and calculated as a percentage of total net assets. Swaps are not calculated in maturity years.
Quality breakdown
as of 05/31/09 (%)
| *A & Above | | | 5.3 | | |
| BBB | | | 1.4 | | |
| BB | | | 31.1 | | |
| B | | | 41.2 | | |
| CCC | | | 20.5 | | |
| Other | | | 0.5 | | |
*Repurchase agreement included.
Quality breakdown is calculated as a percentage of total net assets.
Ratings shown in the quality breakdown represent the rating assigned to a particular bond by one of the following nationally-recognized rating agencies: Standard & Poor's, a division of The McGraw-Hill Companies, Inc., Moody's Investors Service, Inc. or Fitch Ratings Ltd. Ratings are relative and subjective and are not absolute standards of quality. The fund's credit quality does not remove market risk.
30-day SEC yields
as of 05/31/09 (%)
| Class A | | | 9.40 | | |
| Class B | | | 9.14 | | |
| Class C | | | 9.28 | | |
| Class Z | | | 10.14 | | |
The 30-day SEC yields reflect the fund's earning power, net of expenses, expressed as an annualized percentage of the public offering price per share at the end of the period. Had the investment advisor and/or any of its affiliates not waived fees or reimbursed a portion of expenses for Class C shares, the 30-day SEC yields for Class C shares would have been lower.
7
Investment Portfolio – Columbia High Yield Opportunity Fund
May 31, 2009
| Corporate Fixed-Income Bonds & Notes – 91.3% | |
| | | | | Par (a) | | Value ($) | |
| Basic Materials – 9.2% | |
| Chemicals – 2.3% | |
| Agricultural Chemicals – 0.3% | |
| Terra Capital, Inc. | |
| 7.000% 02/01/17 | | | | | 1,020,000 | | | | 953,700 | | |
| | | 953,700 | | |
| Chemicals-Diversified – 1.8% | |
| Huntsman International LLC | |
| 6.875% 11/15/13 (b) | | EUR | | | 800,000 | | | | 706,850 | | |
| 7.875% 11/15/14 | | | | | 1,705,000 | | | | 1,167,925 | | |
| Ineos Group Holdings PLC | |
| 8.500% 02/15/16 (b) | | | | | 2,485,000 | | | | 770,350 | | |
| INVISTA | |
| 9.250% 05/01/12 (b) | | | | | 1,980,000 | | | | 1,851,300 | | |
| NOVA Chemicals Corp. | |
| 6.500% 01/15/12 | | | | | 1,460,000 | | | | 1,328,600 | | |
| | | 5,825,025 | | |
| Chemicals-Specialty – 0.2% | |
| Chemtura Corp. | |
| 6.875% 06/01/16 (h) | | | | | 955,000 | | | | 668,500 | | |
| | | 668,500 | | |
| Chemicals Total | | | 7,447,225 | | |
| Forest Products & Paper – 1.6% | |
| Paper & Related Products – 1.6% | |
| Cascades, Inc. | |
| 7.250% 02/15/13 | | | | | 1,065,000 | | | | 918,562 | | |
| Domtar Corp. | |
| 7.125% 08/15/15 | | | | | 800,000 | | | | 664,000 | | |
| Georgia-Pacific Corp. | |
| 8.000% 01/15/24 | | | | | 2,780,000 | | | | 2,363,000 | | |
| NewPage Corp. | |
| 10.000% 05/01/12 | | | | | 755,000 | | | | 422,800 | | |
| Westvaco Corp. | |
| 8.200% 01/15/30 | | | | | 960,000 | | | | 808,495 | | |
| | | 5,176,857 | | |
| Forest Products & Paper Total | | | 5,176,857 | | |
| Iron/Steel – 1.8% | |
| Steel-Producers – 1.8% | |
| ArcelorMittal | |
| 9.850% 06/01/19 | | | | | 1,055,000 | | | | 1,083,472 | | |
| Russel Metals, Inc. | |
| 6.375% 03/01/14 | | | | | 765,000 | | | | 617,738 | | |
| Steel Dynamics, Inc. | |
| 8.250% 04/15/16 (b) | | | | | 2,070,000 | | | | 1,764,675 | | |
| | | | | Par (a) | | Value ($) | |
| United States Steel Corp. | |
| 7.000% 02/01/18 | | | | | 2,600,000 | | | | 2,162,425 | | |
| | | 5,628,310 | | |
| Iron/Steel Total | | | 5,628,310 | | |
| Metals & Mining – 3.5% | |
| Diversified Minerals – 1.6% | |
| FMG Finance Ltd. | |
| 10.625% 09/01/16 (b) | | | | | 2,255,000 | | | | 2,001,312 | | |
| Rio Tinto Finance USA Ltd. | |
| 8.950% 05/01/14 | | | | | 605,000 | | | | 650,200 | | |
| Teck Resources Ltd. | |
| 10.750% 05/15/19 (b) | | | | | 2,490,000 | | | | 2,561,587 | | |
| | | 5,213,099 | | |
| Metal-Diversified – 1.7% | |
| Freeport-McMoRan Copper & Gold, Inc. | |
| 8.375% 04/01/17 | | | | | 5,300,000 | | | | 5,260,250 | | |
| | | 5,260,250 | | |
| Mining Services – 0.2% | |
| Noranda Aluminium Holding Corp. | |
PIK,
7.163% 11/15/14 (d) | | | | | 1,484,575 | | | | 529,721 | | |
| | | 529,721 | | |
| Metals & Mining Total | | | 11,003,070 | | |
| Basic Materials Total | | | 29,255,462 | | |
| Communications – 19.1% | |
| Advertising – 0.2% | |
| Advertising Agencies – 0.2% | |
| Interpublic Group of Companies, Inc. | |
| 7.250% 08/15/11 | | | | | 640,000 | | | | 601,600 | | |
| | | 601,600 | | |
| Advertising Total | | | 601,600 | | |
| Media – 4.8% | |
| Cable TV – 3.9% | |
| Cablevision Systems Corp. | |
| 8.000% 04/15/12 | | | | | 1,630,000 | | | | 1,601,475 | | |
| Charter Communications Holdings II LLC | |
| 10.250% 09/15/10 (e) | | | | | 1,885,000 | | | | 1,827,565 | | |
| Charter Communications Operating LLC/Charter Communications Operating Capital | |
| 10.375% 04/30/14 (b)(e) | | | | | 1,960,000 | | | | 1,862,000 | | |
| CSC Holdings, Inc. | |
| 7.625% 04/01/11 | | | | | 1,020,000 | | | | 1,017,450 | | |
| 8.625% 02/15/19 (b) | | | | | 550,000 | | | | 539,687 | | |
| DirecTV Holdings LLC | |
| 6.375% 06/15/15 | | | | | 2,690,000 | | | | 2,447,900 | | |
See Accompanying Notes to Financial Statements.
8
Columbia High Yield Opportunity Fund
May 31, 2009
| Corporate Fixed-Income Bonds & Notes (continued) | |
| | | | | Par (a) | | Value ($) | |
| EchoStar DBS Corp. | |
| 6.625% 10/01/14 | | | | | 3,390,000 | | | | 3,076,425 | | |
| | | 12,372,502 | | |
| Publishing-Books – 0.8% | |
| TL Acquisitions, Inc. | |
| 10.500% 01/15/15 (b) | | | | | 3,175,000 | | | | 2,476,500 | | |
| | | 2,476,500 | | |
| Radio – 0.0% | |
| CMP Susquehanna Corp. | |
| 3.826% 05/15/14 (f) | | | | | 112,000 | | | | 50,400 | | |
| | | 50,400 | | |
| Television – 0.1% | |
| Local TV Finance LLC | |
PIK,
9.250% 06/15/15 (b) | | | | | 1,030,000 | | | | 142,756 | | |
| | | 142,756 | | |
| Media Total | | | 15,042,158 | | |
| Telecommunication Services – 14.1% | |
| Cellular Telecommunications – 4.0% | |
| Cricket Communications, Inc. | |
| 9.375% 11/01/14 | | | | | 2,285,000 | | | | 2,273,575 | | |
| Digicel Group Ltd. | |
| 8.875% 01/15/15 (b) | | | | | 3,290,000 | | | | 2,632,000 | | |
| MetroPCS Wireless, Inc. | |
| 9.250% 11/01/14 | | | | | 2,450,000 | | | | 2,459,187 | | |
| Nextel Communications, Inc. | |
| 7.375% 08/01/15 | | | | | 2,580,000 | | | | 2,044,650 | | |
| Orascom Telecom Finance SCA | |
| 7.875% 02/08/14 (b) | | | | | 855,000 | | | | 701,100 | | |
| Wind Acquisition Finance SA | |
| 10.750% 12/01/15 (b) | | | | | 200,000 | | | | 210,000 | | |
PIK,
8.357% 12/21/11 (d)(g) | | | | | 2,927,996 | | | | 2,460,929 | | |
| | | 12,781,441 | | |
| Media – 1.1% | |
| Nielsen Finance LLC/Nielsen Finance Co. | |
| 11.500% 05/01/16 (b) | | | | | 955,000 | | | | 907,250 | | |
| Quebecor Media, Inc. | |
| 7.750% 03/15/16 | | | | | 2,880,000 | | | | 2,556,000 | | |
| | | 3,463,250 | | |
| Satellite Telecommunications – 2.2% | |
| Inmarsat Finance II PLC | |
| 10.375% 11/15/12 | | | | | 1,440,000 | | | | 1,486,800 | | |
| Inmarsat Finance PLC | |
| 7.625% 06/30/12 | | | | | 795,000 | | | | 776,119 | | |
| | | | | Par (a) | | Value ($) | |
| Intelsat Jackson Holdings Ltd. | |
| 11.250% 06/15/16 | | | | | 4,520,000 | | | | 4,633,000 | | |
| | | 6,895,919 | | |
| Telecommunication Equipment – 0.7% | |
| Lucent Technologies, Inc. | |
| 6.450% 03/15/29 | | | | | 4,000,000 | | | | 2,280,000 | | |
| | | 2,280,000 | | |
| Telecommunication Services – 1.9% | |
| Hellas Telecommunications Luxembourg II | |
| 6.881% 01/15/15 (b)(d) | | | | | 900,000 | | | | 171,000 | | |
| Nordic Telephone Co. Holdings ApS | |
| 8.250% 05/01/16 (b) | | EUR | | | 450,000 | | | | 617,080 | | |
| 8.875% 05/01/16 (b) | | | | | 1,250,000 | | | | 1,250,000 | | |
| Syniverse Technologies, Inc. | |
| 7.750% 08/15/13 | | | | | 1,095,000 | | | | 938,963 | | |
| Time Warner Telecom Holdings, Inc. | |
| 9.250% 02/15/14 | | | | | 1,225,000 | | | | 1,228,062 | | |
| West Corp. | |
| 11.000% 10/15/16 | | | | | 2,285,000 | | | | 1,942,250 | | |
| | | | 6,147,355 | | |
| Telephone-Integrated – 4.0% | |
| Citizens Communications Co. | |
| 7.875% 01/15/27 | | | | | 2,430,000 | | | | 1,980,450 | | |
| Qwest Communications International, Inc. | |
| 7.500% 02/15/14 | | | | | 2,520,000 | | | | 2,318,400 | | |
| Qwest Corp. | |
| 7.500% 10/01/14 | | | | | 1,215,000 | | | | 1,160,325 | | |
| 7.500% 06/15/23 | | | | | 3,140,000 | | | | 2,496,300 | | |
| Virgin Media Finance PLC | |
| 9.500% 08/15/16 | | | | | 1,285,000 | | | | 1,260,906 | | |
| Windstream Corp. | |
| 8.625% 08/01/16 | | | | | 3,465,000 | | | | 3,404,363 | | |
| | | | 12,620,744 | | |
| Wireless Equipment – 0.2% | |
| Crown Castle International Corp. | |
| 9.000% 01/15/15 | | | | | 760,000 | | | | 767,600 | | |
| | | 767,600 | | |
| Telecommunication Services Total | | | 44,956,309 | | |
| Communications Total | | | 60,600,067 | | |
| Consumer Cyclical – 10.6% | |
| Apparel – 0.6% | |
| Apparel Manufacturers – 0.6% | |
| Levi Strauss & Co. | |
| 9.750% 01/15/15 | | | | | 1,925,000 | | | | 1,857,625 | | |
| | | 1,857,625 | | |
| Apparel Total | | | 1,857,625 | | |
See Accompanying Notes to Financial Statements.
9
Columbia High Yield Opportunity Fund
May 31, 2009
| Corporate Fixed-Income Bonds & Notes (continued) | |
| | | | | Par (a) | | Value ($) | |
| Auto Manufacturers – 0.1% | |
| Auto-Cars/Light Trucks – 0.1% | |
| General Motors Corp. | |
| 7.200% 01/15/11 (n) | | | | | 1,330,000 | | | | 116,375 | | |
| 8.375% 07/15/33 (n) | | | | | 3,185,000 | | | | 286,650 | | |
| | | 403,025 | | |
| Auto Manufacturers Total | | | 403,025 | | |
| Auto Parts & Equipment – 1.2% | |
| Auto/Truck Parts & Equipment-Original – 0.2% | |
| Hayes Lemmerz Finance LLC - Luxembourg SCA | |
| 8.250% 06/15/15 (h) | | EUR | | | 1,290,000 | | | | 36,473 | | |
| TRW Automotive, Inc. | |
| 7.000% 03/15/14 (b) | | | | | 1,050,000 | | | | 771,750 | | |
| | | 808,223 | | |
| Auto/Truck Parts & Equipment-Replacement – 0.2% | |
| Commercial Vehicle Group, Inc. | |
| 8.000% 07/01/13 | | | | | 1,155,000 | | | | 490,875 | | |
| | | 490,875 | | |
| Rubber-Tires – 0.8% | |
| Goodyear Tire & Rubber Co. | |
| 8.625% 12/01/11 | | | | | 423,000 | | | | 411,368 | | |
| 9.000% 07/01/15 | | | | | 1,638,000 | | | | 1,564,290 | | |
| 10.500% 05/15/16 | | | | | 535,000 | | | | 532,325 | | |
| | | 2,507,983 | | |
| Auto Parts & Equipment Total | | | 3,807,081 | | |
| Entertainment – 0.9% | |
| Music – 0.8% | |
| WMG Acquisition Corp. | |
| 7.375% 04/15/14 | | | | | 1,440,000 | | | | 1,216,800 | | |
| 9.500% 06/15/16 (b) | | | | | 355,000 | | | | 354,556 | | |
| WMG Holdings Corp. | |
(i) 12/15/14
(9.500% 12/15/09) | | | | | 1,325,000 | | | | 1,053,375 | | |
| | | | 2,624,731 | | |
| Resorts/Theme Parks – 0.1% | |
| Six Flags, Inc. | |
| 9.625% 06/01/14 (o) | | | | | 950,000 | | | | 147,250 | | |
| | | 147,250 | | |
| Entertainment Total | | | 2,771,981 | | |
| Home Builders – 1.3% | |
| Building-Residential/Commercial – 1.3% | |
| D.R. Horton, Inc. | |
| 5.625% 09/15/14 | | | | | 1,365,000 | | | | 1,160,250 | | |
| 5.625% 01/15/16 | | | | | 720,000 | | | | 590,400 | | |
| | | | | Par (a) | | Value ($) | |
| KB Home | |
| 5.875% 01/15/15 | | | | | 2,120,000 | | | | 1,812,600 | | |
| Ryland Group, Inc. | |
| 8.400% 05/15/17 | | | | | 680,000 | | | | 659,600 | | |
| | | 4,222,850 | | |
| Home Builders Total | | | 4,222,850 | | |
| Home Furnishings – 0.0% | |
| Simmons Co. | |
PIK,
8.224% 02/15/12 (d)(g) | | | | | 1,779,932 | | | | 18,392 | | |
| | | 18,392 | | |
| Home Furnishings Total | | | 18,392 | | |
| Lodging – 3.2% | |
| Casino Hotels – 1.9% | |
| Boyd Gaming Corp. | |
| 6.750% 04/15/14 | | | | | 500,000 | | | | 390,000 | | |
| 7.125% 02/01/16 | | | | | 1,000,000 | | | | 710,000 | | |
| Harrah's Operating Co., Inc. | |
| 10.000% 12/15/18 (b) | | | | | 1,178,000 | | | | 786,315 | | |
| Jacobs Entertainment, Inc. | |
| 9.750% 06/15/14 | | | | | 1,225,000 | | | | 918,750 | | |
| Majestic Star LLC | |
| 9.750% 01/15/11 (c) | | | | | 3,195,000 | | | | 367,425 | | |
| MGM Mirage | |
| 7.500% 06/01/16 | | | | | 3,295,000 | | | | 2,141,750 | | |
| Snoqualmie Entertainment Authority | |
| 5.384% 02/01/14 (b)(d) | | | | | 280,000 | | | | 146,300 | | |
| 9.125% 02/01/15 (b) | | | | | 1,115,000 | | | | 596,525 | | |
| | | 6,057,065 | | |
| Gambling (Non-Hotel) – 0.9% | |
| Mashantucket Western Pequot Tribe | |
| 8.500% 11/15/15 (b) | | | | | 2,420,000 | | | | 943,800 | | |
| Seminole Indian Tribe of Florida | |
| 7.804% 10/01/20 (b) | | | | | 2,000,000 | | | | 1,675,340 | | |
| | | 2,619,140 | | |
| Hotels & Motels – 0.4% | |
| Starwood Hotels & Resorts Worldwide, Inc. | |
| 6.750% 05/15/18 | | | | | 1,550,000 | | | | 1,317,500 | | |
| | | 1,317,500 | | |
| Lodging Total | | | 9,993,705 | | |
| Retail – 3.3% | |
| Retail-Apparel/Shoe – 0.7% | |
| Hanesbrands, Inc. | |
| 5.698% 12/15/14 (d) | | | | | 1,190,000 | | | | 957,950 | | |
See Accompanying Notes to Financial Statements.
10
Columbia High Yield Opportunity Fund
May 31, 2009
| Corporate Fixed-Income Bonds & Notes (continued) | |
| | | | | Par (a) | | Value ($) | |
| Phillips-Van Heusen Corp. | |
| 8.125% 05/01/13 | | | | | 1,180,000 | | | | 1,156,400 | | |
| | | 2,114,350 | | |
| Retail-Computer Equipment – 0.3% | |
| GameStop Corp./GameStop, Inc. | |
| 8.000% 10/01/12 | | | | | 1,070,000 | | | | 1,074,013 | | |
| | | 1,074,013 | | |
| Retail-Discount – 0.7% | |
| Dollar General Corp. | |
PIK,
11.875% 07/15/17 | | | | | 2,085,000 | | | | 2,199,675 | | |
| | | 2,199,675 | | |
| Retail-Drug Stores – 0.4% | |
| Rite Aid Corp. | |
| 9.500% 06/15/17 | | | | | 1,920,000 | | | | 1,248,000 | | |
| | | 1,248,000 | | |
| Retail-Propane Distributors – 1.2% | |
| AmeriGas Partners LP | |
| 7.125% 05/20/16 | | | | | 1,405,000 | | | | 1,301,381 | | |
| 7.250% 05/20/15 | | | | | 655,000 | | | | 615,700 | | |
| Inergy LP/Inergy Finance Corp. | |
| 8.250% 03/01/16 | | | | | 710,000 | | | | 694,025 | | |
| 8.750% 03/01/15 (b) | | | | | 1,210,000 | | | | 1,197,900 | | |
| | | 3,809,006 | | |
| Retail Total | | | 10,445,044 | | |
| Consumer Cyclical Total | | | 33,519,703 | | |
| Consumer Non-Cyclical – 16.3% | |
| Agriculture – 0.4% | |
| Tobacco – 0.4% | |
| Reynolds American, Inc. | |
| 7.625% 06/01/16 | | | | | 1,380,000 | | | | 1,354,590 | | |
| | | 1,354,590 | | |
| Agriculture Total | | | 1,354,590 | | |
| Beverages – 0.8% | |
| Beverages-Non-Alcoholic – 0.3% | |
| Cott Beverages, Inc. | |
| 8.000% 12/15/11 | | | | | 1,005,000 | | | | 864,300 | | |
| | | 864,300 | | |
| Beverages-Wine/Spirits – 0.5% | |
| Constellation Brands, Inc. | |
| 8.125% 01/15/12 | | | | | 1,775,000 | | | | 1,766,125 | | |
| | | 1,766,125 | | |
| Beverages Total | | | 2,630,425 | | |
| | | | | Par (a) | | Value ($) | |
| Biotechnology – 0.5% | |
| Medical-Biomedical/Gene – 0.5% | |
| Bio-Rad Laboratories, Inc. | |
| 7.500% 08/15/13 | | | | | 1,420,000 | | | | 1,402,250 | | |
| 8.000% 09/15/16 (b) | | | | | 300,000 | | | | 300,750 | | |
| | | 1,703,000 | | |
| Biotechnology Total | | | 1,703,000 | | |
| Commercial Services – 3.7% | |
| Commercial Services – 1.0% | |
| ARAMARK Corp. | |
| 8.500% 02/01/15 | | | | | 1,600,000 | | | | 1,526,000 | | |
| Iron Mountain, Inc. | |
| 8.000% 06/15/20 | | | | | 1,690,000 | | | | 1,563,250 | | |
| | | 3,089,250 | | |
| Commercial Services-Finance – 0.1% | |
| ACE Cash Express, Inc. | |
| 10.250% 10/01/14 (b) | | | | | 1,025,000 | | | | 420,250 | | |
| | | 420,250 | | |
| Funeral Services & Related Items – 0.7% | |
| Service Corp. International | |
| 6.750% 04/01/16 | | | | | 645,000 | | | | 593,400 | | |
| 7.000% 06/15/17 | | | | | 1,500,000 | | | | 1,368,750 | | |
| 7.375% 10/01/14 | | | | | 135,000 | | | | 129,938 | | |
| | | 2,092,088 | | |
| Private Corrections – 0.8% | |
| Corrections Corp. of America | |
| 6.250% 03/15/13 | | | | | 1,155,000 | | | | 1,094,362 | | |
| GEO Group, Inc. | |
| 8.250% 07/15/13 | | | | | 1,475,000 | | | | 1,438,125 | | |
| | | 2,532,487 | | |
| Rental Auto/Equipment – 1.1% | |
| Ashtead Holdings PLC | |
| 8.625% 08/01/15 (b) | | | | | 1,615,000 | | | | 1,211,250 | | |
| Rental Service Corp. | |
| 9.500% 12/01/14 | | | | | 1,800,000 | | | | 1,404,000 | | |
| United Rentals North America, Inc. | |
| 6.500% 02/15/12 | | | | | 965,000 | | | | 902,275 | | |
| | | 3,517,525 | | |
| Commercial Services Total | | | 11,651,600 | | |
| Food – 2.4% | |
| Food-Meat Products – 0.9% | |
| JBS USA LLC/JBS USA Finance, Inc. | |
| 11.625% 05/01/14 (b) | | | | | 1,890,000 | | | | 1,814,400 | | |
| Tyson Foods, Inc. | |
| 10.500% 03/01/14 (b) | | | | | 1,065,000 | | | | 1,128,900 | | |
| | | 2,943,300 | | |
See Accompanying Notes to Financial Statements.
11
Columbia High Yield Opportunity Fund
May 31, 2009
| Corporate Fixed-Income Bonds & Notes (continued) | |
| | | | | Par (a) | | Value ($) | |
| Food-Miscellaneous/Diversified – 1.1% | |
| Del Monte Corp. | |
| 6.750% 02/15/15 | | | | | 965,000 | | | | 914,337 | | |
| Pinnacle Foods Finance LLC | |
| 9.250% 04/01/15 | | | | | 2,090,000 | | | | 1,865,325 | | |
| Reddy Ice Holdings, Inc. | |
| 10.500% 11/01/12 | | | | | 1,185,000 | | | | 711,000 | | |
| | | 3,490,662 | | |
| Retail-Hypermarkets – 0.4% | |
| New Albertsons, Inc. | |
| 8.000% 05/01/31 | | | | | 1,445,000 | | | | 1,242,700 | | |
| | | 1,242,700 | | |
| Food Total | | | 7,676,662 | | |
| Healthcare Products – 1.3% | |
| Medical Products – 1.3% | |
| Biomet, Inc. | |
PIK,
10.375% 10/15/17 | | | | | 4,155,000 | | | | 3,947,250 | | |
| | | 3,947,250 | | |
| Healthcare Products Total | | | 3,947,250 | | |
| Healthcare Services – 4.9% | |
| Dialysis Centers – 0.3% | |
| DaVita, Inc. | |
| 7.250% 03/15/15 | | | | | 1,075,000 | | | | 1,010,500 | | |
| | | 1,010,500 | | |
| Medical-HMO – 0.2% | |
| Coventry Health Care, Inc. | |
| 5.875% 01/15/12 | | | | | 715,000 | | | | 662,882 | | |
| | | 662,882 | | |
| Medical-Hospitals – 3.6% | |
| Community Health Systems, Inc. | |
| 8.875% 07/15/15 | | | | | 3,260,000 | | | | 3,223,325 | | |
| HCA, Inc. | |
| 9.250% 11/15/16 | | | | | 1,555,000 | | | | 1,527,788 | | |
PIK,
9.625% 11/15/16 | | | | | 7,121,000 | | | | 6,818,357 | | |
| | | 11,569,470 | | |
| Physical Therapy/Rehab Centers – 0.3% | |
| Healthsouth Corp. | |
| 10.750% 06/15/16 | | | | | 875,000 | | | | 892,500 | | |
| | | 892,500 | | |
| Physician Practice Management – 0.5% | |
| U.S. Oncology Holdings, Inc. | |
PIK,
6.904% 03/15/12 (d) | | | | | 1,140,000 | | | | 758,519 | | |
| | | | | Par (a) | | Value ($) | |
| US Oncology, Inc. | |
| 9.000% 08/15/12 | | | | | 690,000 | | | | 690,000 | | |
| | | | 1,448,519 | | |
| Healthcare Services Total | | | 15,583,871 | | |
| Household Products/Wares – 0.6% | |
| Consumer Products-Miscellaneous – 0.6% | |
| American Greetings Corp. | |
| 7.375% 06/01/16 | | | | | 1,220,000 | | | | 768,600 | | |
| Jostens IH Corp. | |
| 7.625% 10/01/12 | | | | | 1,185,000 | | | | 1,167,225 | | |
| | | 1,935,825 | | |
| Household Products/Wares Total | | | 1,935,825 | | |
| Pharmaceuticals – 1.7% | |
| Medical-Drugs – 1.2% | |
| Elan Finance PLC | |
| 4.883% 11/15/11 (d) | | | | | 455,000 | | | | 393,575 | | |
| 8.875% 12/01/13 | | | | | 1,580,000 | | | | 1,358,800 | | |
| Warner Chilcott Corp. | |
| 8.750% 02/01/15 | | | | | 1,918,000 | | | | 1,918,000 | | |
| | | 3,670,375 | | |
| Pharmacy Services – 0.5% | |
| Omnicare, Inc. | |
| 6.750% 12/15/13 | | | | | 1,750,000 | | | | 1,588,125 | | |
| 6.875% 12/15/15 | | | | | 180,000 | | | | 162,000 | | |
| | | 1,750,125 | | |
| Pharmaceuticals Total | | | 5,420,500 | | |
| Consumer Non-Cyclical Total | | | 51,903,723 | | |
| Energy – 11.7% | |
| Coal – 1.3% | |
| Arch Western Finance LLC | |
| 6.750% 07/01/13 | | | | | 1,830,000 | | | | 1,665,300 | | |
| Massey Energy Co. | |
| 6.875% 12/15/13 | | | | | 2,840,000 | | | | 2,513,400 | | |
| | | 4,178,700 | | |
| Coal Total | | | 4,178,700 | | |
| Oil & Gas – 6.2% | |
| Oil Companies-Exploration & Production – 5.3% | |
| Chesapeake Energy Corp. | |
| 6.375% 06/15/15 | | | | | 3,955,000 | | | | 3,391,412 | | |
| 9.500% 02/15/15 | | | | | 380,000 | | | | 375,250 | | |
| Cimarex Energy Co. | |
| 7.125% 05/01/17 | | | | | 1,270,000 | | | | 1,101,725 | | |
See Accompanying Notes to Financial Statements.
12
Columbia High Yield Opportunity Fund
May 31, 2009
| Corporate Fixed-Income Bonds & Notes (continued) | |
| | | | | Par (a) | | Value ($) | |
| Compton Petroleum Corp. | |
| 7.625% 12/01/13 | | | | | 1,505,000 | | | | 752,500 | | |
| KCS Energy, Inc. | |
| 7.125% 04/01/12 | | | | | 695,000 | | | | 648,088 | | |
| Newfield Exploration Co. | |
| 6.625% 04/15/16 | | | | | 2,785,000 | | | | 2,520,425 | | |
| OPTI Canada, Inc. | |
| 8.250% 12/15/14 | | | | | 2,610,000 | | | | 1,800,900 | | |
| Pioneer Natural Resources Co. | |
| 5.875% 07/15/16 | | | | | 1,005,000 | | | | 874,350 | | |
| Quicksilver Resources, Inc. | |
| 7.125% 04/01/16 | | | | | 2,550,000 | | | | 1,861,500 | | |
| Range Resources Corp. | |
| 7.500% 05/15/16 | | | | | 1,975,000 | | | | 1,896,000 | | |
| Southwestern Energy Co. | |
| 7.500% 02/01/18 (b) | | | | | 1,810,000 | | | | 1,724,025 | | |
| | | 16,946,175 | | |
| Oil Refining & Marketing – 0.9% | |
| Frontier Oil Corp. | |
| 8.500% 09/15/16 | | | | | 910,000 | | | | 900,900 | | |
| Tesoro Corp. | |
| 6.625% 11/01/15 | | | | | 1,480,000 | | | | 1,259,850 | | |
| United Refining Co. | |
| 10.500% 08/15/12 | | | | | 925,000 | | | | 693,750 | | |
| | | 2,854,500 | | |
| Oil & Gas Total | | | 19,800,675 | | |
| Oil & Gas Services – 0.2% | |
| Seismic Data Collection – 0.2% | |
| Seitel, Inc. | |
| 9.750% 02/15/14 | | | | | 880,000 | | | | 437,800 | | |
| | | 437,800 | | |
| Oil & Gas Services Total | | | 437,800 | | |
| Oil, Gas & Consumable Fuels – 1.4% | |
| Oil Companies-Exploration & Production – 1.4% | |
| Forest Oil Corp. | |
| 8.500% 02/15/14 (b) | | | | | 1,925,000 | | | | 1,857,625 | | |
| PetroHawk Energy Corp. | |
| 7.875% 06/01/15 | | | | | 2,645,000 | | | | 2,453,238 | | |
| | | 4,310,863 | | |
| Oil, Gas & Consumable Fuels Total | | | 4,310,863 | | |
| Pipelines – 2.6% | |
| Pipelines – 2.6% | |
| Atlas Pipeline Partners LP | |
| 8.125% 12/15/15 | | | | | 1,430,000 | | | | 879,450 | | |
| El Paso Corp. | |
| 6.875% 06/15/14 | | | | | 2,340,000 | | | | 2,216,127 | | |
| 7.250% 06/01/18 | | | | | 560,000 | | | | 515,795 | | |
| | | | | Par (a) | | Value ($) | |
| Kinder Morgan Finance Co. ULC | |
| 5.700% 01/05/16 | | | | | 1,900,000 | | | | 1,624,500 | | |
| MarkWest Energy Partners LP | |
| 6.875% 11/01/14 | | | | | 1,360,000 | | | | 1,115,200 | | |
| 8.500% 07/15/16 | | | | | 905,000 | | | | 764,725 | | |
| Williams Companies, Inc. | |
| 7.625% 07/15/19 | | | | | 720,000 | | | | 702,000 | | |
| 7.875% 09/01/21 | | | | | 545,000 | | | | 528,650 | | |
| 8.125% 03/15/12 | | | | | 30,000 | | | | 30,680 | | |
| | | 8,377,127 | | |
| Pipelines Total | | | 8,377,127 | | |
| Energy Total | | | 37,105,165 | | |
| Financials – 5.5% | |
| Banks – 0.2% | |
| Special Purpose Entity – 0.2% | |
| Goldman Sachs Capital II | |
| 5.793% 12/29/49 (d) | | | | | 850,000 | | | | 493,134 | | |
| | | 493,134 | | |
| Banks Total | | | 493,134 | | |
| Diversified Financial Services – 3.8% | |
| Finance-Auto Loans – 2.9% | |
| Ford Motor Credit Co. | |
| 7.800% 06/01/12 | | | | | 3,795,000 | | | | 3,240,721 | | |
| 8.000% 12/15/16 | | | | | 1,550,000 | | | | 1,244,715 | | |
| GMAC LLC | |
| 6.875% 09/15/11 (b) | | | | | 2,706,000 | | | | 2,421,870 | | |
| 8.000% 11/01/31 (b) | | | | | 3,328,000 | | | | 2,496,000 | | |
| | | | 9,403,306 | | |
| Finance-Consumer Loans – 0.2% | |
| Sears Roebuck Acceptance Corp. | |
| 7.000% 02/01/11 | | | | | 595,000 | | | | 545,913 | | |
| | | 545,913 | | |
| Finance-Investment Banker/Broker – 0.4% | |
| Lazard Group LLC | |
| 7.125% 05/15/15 | | | | | 1,375,000 | | | | 1,199,775 | | |
| | | 1,199,775 | | |
| Investment Management/Advisor Service – 0.3% | |
| Nuveen Investments, Inc. | |
| 10.500% 11/15/15 (b) | | | | | 1,715,000 | | | | 917,525 | | |
| | | 917,525 | | |
| Diversified Financial Services Total | | | 12,066,519 | | |
See Accompanying Notes to Financial Statements.
13
Columbia High Yield Opportunity Fund
May 31, 2009
| Corporate Fixed-Income Bonds & Notes (continued) | |
| | | | | Par (a) | | Value ($) | |
| Insurance – 1.1% | |
| Insurance Brokers – 0.4% | |
| HUB International Holdings, Inc. | |
| 10.250% 06/15/15 (b) | | | | | 1,335,000 | | | | 827,700 | | |
| USI Holdings Corp. | |
| 9.750% 05/15/15 (b) | | | | | 905,000 | | | | 495,487 | | |
| | | 1,323,187 | | |
| Property/Casualty Insurance – 0.7% | |
| Asurion Corp. | |
| 6.882% 07/02/15 (d)(g) | | | | | 713,879 | | | | 642,491 | | |
6.882% 07/02/15,
2nd lien (d)(g) | | | | | 976,121 | | | | 795,539 | | |
| Crum & Forster Holdings Corp. | |
| 7.750% 05/01/17 | | | | | 1,055,000 | | | | 875,650 | | |
| | | 2,313,680 | | |
| Insurance Total | | | 3,636,867 | | |
| Real Estate Investment Trusts (REITs) – 0.4% | |
| REITS-Hotels – 0.4% | |
| Host Marriott LP | |
| 6.750% 06/01/16 | | | | | 1,300,000 | | | | 1,118,000 | | |
| | | 1,118,000 | | |
| Real Estate Investment Trusts (REITs) Total | | | 1,118,000 | | |
| Financials Total | | | 17,314,520 | | |
| Industrials – 11.3% | |
| Aerospace & Defense – 1.6% | |
| Aerospace/Defense-Equipment – 1.1% | |
| BE Aerospace, Inc. | |
| 8.500% 07/01/18 | | | | | 2,080,000 | | | | 1,965,600 | | |
| Moog, Inc. | |
| 7.250% 06/15/18 (b) | | | | | 550,000 | | | | 517,000 | | |
| Sequa Corp. | |
| 11.750% 12/01/15 (b) | | | | | 2,130,000 | | | | 947,850 | | |
| | | 3,430,450 | | |
| Electronics-Military – 0.5% | |
| L-3 Communications Corp. | |
| 6.375% 10/15/15 | | | | | 2,000,000 | | | | 1,820,000 | | |
| | | 1,820,000 | | |
| Aerospace & Defense Total | | | 5,250,450 | | |
| Building Materials – 0.4% | |
| Building & Construction Products-Miscellaneous – 0.3% | |
| Owens Corning | |
| 6.500% 12/01/16 | | | | | 1,120,000 | | | | 974,468 | | |
| | | 974,468 | | |
| | | | | Par (a) | | Value ($) | |
| Building Products-Cement/Aggregation – 0.1% | |
| Texas Industries, Inc. | |
| 7.250% 07/15/13 (b) | | | | | 190,000 | | | | 163,400 | | |
| | | 163,400 | | |
| Building Materials Total | | | 1,137,868 | | |
| Electrical Components & Equipment – 0.9% | |
| Wire & Cable Products – 0.9% | |
| Belden, Inc. | |
| 7.000% 03/15/17 | | | | | 1,225,000 | | | | 1,085,656 | | |
| General Cable Corp. | |
| 3.583% 04/01/15 (d) | | | | | 635,000 | | | | 514,350 | | |
| 7.125% 04/01/17 | | | | | 1,330,000 | | | | 1,216,950 | | |
| | | 2,816,956 | | |
| Electrical Components & Equipment Total | | | 2,816,956 | | |
| Electronics – 0.6% | |
| Electronic Components-Miscellaneous – 0.6% | |
| Flextronics International Ltd. | |
| 2.664% 10/01/14 (d)(g) | | | | | 38,833 | | | | 31,105 | | |
| 2.668% 10/04/14 (g) | | | | | 323,240 | | | | 258,915 | | |
| 3.381% 10/01/14 (d)(g) | | | | | 219,866 | | | | 176,113 | | |
| 3.381% 10/01/14 (d)(g) | | | | | 7,653 | | | | 6,130 | | |
| 3.458% 10/01/14 (d)(g) | | | | | 395,408 | | | | 316,722 | | |
| 6.250% 11/15/14 | | | | | 1,095,000 | | | | 980,025 | | |
| | | 1,769,010 | | |
| Electronics Total | | | 1,769,010 | | |
| Engineering & Construction – 0.2% | |
| Building & Construction-Miscellaneous – 0.2% | |
| Esco Corp. | |
| 8.625% 12/15/13 (b) | | | | | 945,000 | | | | 793,800 | | |
| | | 793,800 | | |
| Engineering & Construction Total | | | 793,800 | | |
| Environmental Control – 0.2% | |
| Non-Hazardous Waste Disposal – 0.2% | |
| Allied Waste North America, Inc. | |
| 7.875% 04/15/13 | | | | | 580,000 | | | | 590,150 | | |
| | | 590,150 | | |
| Environmental Control Total | | | 590,150 | | |
| Machinery-Construction & Mining – 0.5% | |
| Terex Corp. | |
| 8.000% 11/15/17 | | | | | 1,970,000 | | | | 1,595,700 | | |
| | | 1,595,700 | | |
| Machinery-Construction & Mining Total | | | 1,595,700 | | |
See Accompanying Notes to Financial Statements.
14
Columbia High Yield Opportunity Fund
May 31, 2009
| Corporate Fixed-Income Bonds & Notes (continued) | |
| | | | | Par (a) | | Value ($) | |
| Machinery-Diversified – 0.6% | |
| Machinery-General Industry – 0.6% | |
| Manitowoc Co., Inc. | |
| 7.125% 11/01/13 | | | | | 1,725,000 | | | | 1,233,375 | | |
| Westinghouse Air Brake Technologies Corp. | |
| 6.875% 07/31/13 | | | | | 720,000 | | | | 705,600 | | |
| | | 1,938,975 | | |
| Machinery-Diversified Total | | | 1,938,975 | | |
| Miscellaneous Manufacturing – 2.0% | |
| Diversified Manufacturing Operators – 1.4% | |
| Bombardier, Inc. | |
| 6.300% 05/01/14 (b) | | | | | 2,276,000 | | | | 1,991,500 | | |
| Koppers Holdings, Inc. | |
(i) 11/15/14
(9.875% 11/15/09) | | | | | 1,300,000 | | | | 1,144,000 | | |
| Trinity Industries, Inc. | |
| 6.500% 03/15/14 | | | | | 1,421,000 | | | | 1,222,060 | | |
| | | 4,357,560 | | |
| Miscellaneous Manufacturing – 0.6% | |
| American Railcar Industries, Inc. | |
| 7.500% 03/01/14 | | | | | 1,205,000 | | | | 1,042,325 | | |
| TriMas Corp. | |
| 9.875% 06/15/12 | | | | | 1,431,000 | | | | 990,968 | | |
| | | 2,033,293 | | |
| Miscellaneous Manufacturing Total | | | 6,390,853 | | |
| Packaging & Containers – 2.4% | |
| Containers-Metal/Glass – 1.5% | |
| BWAY Corp. | |
| 10.000% 04/15/14 (b) | | | | | 990,000 | | | | 988,762 | | |
| Crown Americas LLC & Crown Americas Capital Corp. | |
| 7.750% 11/15/15 | | | | | 1,135,000 | | | | 1,106,625 | | |
| Crown Americas LLC & Crown Americas Capital Corp. II | |
| 7.625% 05/15/17 (b) | | | | | 595,000 | | | | 583,100 | | |
| Owens-Brockway Glass Container, Inc. | |
| 8.250% 05/15/13 | | | | | 1,595,000 | | | | 1,595,000 | | |
| Silgan Holdings, Inc. | |
| 6.750% 11/15/13 | | | | | 525,000 | | | | 511,875 | | |
| | | | 4,785,362 | | |
| Containers-Paper/Plastic – 0.9% | |
| Berry Plastics Holding Corp. | |
| 8.875% 09/15/14 | | | | | 1,390,000 | | | | 1,105,050 | | |
| Solo Cup Co. | |
| 8.500% 02/15/14 | | | | | 1,255,000 | | | | 1,004,000 | | |
| Temple-Inland, Inc. | |
| 6.625% 01/15/16 | | | | | 690,000 | | | | 605,977 | | |
| | | 2,715,027 | | |
| Packaging & Containers Total | | | 7,500,389 | | |
| | | | | Par (a) | | Value ($) | |
| Transportation – 1.9% | |
| Transportation-Marine – 0.8% | |
| Navios Maritime Holdings, Inc. | |
| 9.500% 12/15/14 | | | | | 1,700,000 | | | | 1,300,500 | | |
| Ship Finance International Ltd. | |
| 8.500% 12/15/13 | | | | | 1,255,000 | | | | 941,250 | | |
| Stena AB | |
| 7.500% 11/01/13 | | | | | 695,000 | | | | 542,100 | | |
| | | 2,783,850 | | |
| Transportation-Railroad – 0.5% | |
| TFM SA de CV | |
| 9.375% 05/01/12 | | | | | 1,770,000 | | | | 1,588,575 | | |
| | | 1,588,575 | | |
| Transportation-Services – 0.6% | |
| Bristow Group, Inc. | |
| 7.500% 09/15/17 | | | | | 1,090,000 | | | | 948,300 | | |
| PHI, Inc. | |
| 7.125% 04/15/13 | | | | | 1,085,000 | | | | 884,275 | | |
| | | | 1,832,575 | | |
| Transportation Total | | | 6,205,000 | | |
| Industrials Total | | | 35,989,151 | | |
| Technology – 1.4% | |
| Computers – 0.8% | |
| Computer Services – 0.6% | |
| Sungard Data Systems, Inc. | |
| 9.125% 08/15/13 | | | | | 2,120,000 | | | | 2,040,500 | | |
| | | 2,040,500 | | |
| Computers-Memory Devices – 0.2% | |
| Seagate Technology International | |
| 10.000% 05/01/14 (b) | | | | | 555,000 | | | | 560,550 | | |
| | | 560,550 | | |
| Computers Total | | | 2,601,050 | | |
| Office/Business Equipment – 0.1% | |
| Office Automation & Equipment – 0.1% | |
| Xerox Corp. | |
| 6.400% 03/15/16 | | | | | 250,000 | | | | 231,583 | | |
| | | 231,583 | | |
| Office/Business Equipment Total | | | 231,583 | | |
| Semiconductors – 0.5% | |
| Electronic Components-Semiconductors – 0.5% | |
| Amkor Technology, Inc. | |
| 9.250% 06/01/16 | | | | | 1,095,000 | | | | 977,288 | | |
See Accompanying Notes to Financial Statements.
15
Columbia High Yield Opportunity Fund
May 31, 2009
| Corporate Fixed-Income Bonds & Notes (continued) | |
| | | | | Par (a) | | Value ($) | |
| Freescale Semiconductor, Inc. | |
| 12.500% 12/15/14 (g) | | | | | 1,060,006 | | | | 776,454 | | |
| | | 1,753,742 | | |
| Semiconductors Total | | | 1,753,742 | | |
| Technology Total | | | 4,586,375 | | |
| Utilities – 6.2% | |
| Electric – 5.4% | |
| Electric-Generation – 1.7% | |
| AES Corp. | |
| 7.750% 03/01/14 | | | | | 1,460,000 | | | | 1,390,650 | | |
| 8.000% 10/15/17 | | | | | 915,000 | | | | 850,950 | | |
| Edison Mission Energy | |
| 7.000% 05/15/17 | | | | | 1,110,000 | | | | 804,750 | | |
| Intergen NV | |
| 9.000% 06/30/17 (b) | | | | | 2,475,000 | | | | 2,363,625 | | |
| | | 5,409,975 | | |
| Electric-Integrated – 1.9% | |
| CMS Energy Corp. | |
| 6.875% 12/15/15 | | | | | 1,235,000 | | | | 1,114,896 | | |
| Energy Future Holdings Corp. | |
PIK,
11.250% 11/01/17 | | | | | 4,049,200 | | | | 2,077,746 | | |
| Ipalco Enterprises, Inc. | |
| 7.250% 04/01/16 (b) | | | | | 1,170,000 | | | | 1,123,200 | | |
| Texas Competitive Electric Holdings Co., LLC | |
PIK,
10.500% 11/01/16 | | | | | 4,615,812 | | | | 1,805,937 | | |
| | | 6,121,779 | | |
| Independent Power Producer – 1.8% | |
| Dynegy Holdings, Inc. | |
| 7.125% 05/15/18 | | | | | 2,660,000 | | | | 1,702,400 | | |
| Mirant North America LLC | |
| 7.375% 12/31/13 | | | | | 515,000 | | | | 493,113 | | |
| NRG Energy, Inc. | |
| 7.375% 02/01/16 | | | | | 1,065,000 | | | | 1,002,431 | | |
| 7.375% 01/15/17 | | | | | 1,195,000 | | | | 1,123,300 | | |
| NSG Holdings LLC/NSG Holdings, Inc. | |
| 7.750% 12/15/25 (b) | | | | | 1,535,000 | | | | 1,235,675 | | |
| | | 5,556,919 | | |
| Electric Total | | | 17,088,673 | | |
| Gas – 0.2% | |
| Gas-Distribution – 0.2% | |
| Centerpoint Energy, Inc. | |
| 5.950% 02/01/17 | | | | | 235,000 | | | | 198,588 | | |
| 6.500% 05/01/18 | | | | | 565,000 | | | | 483,733 | | |
| | | 682,321 | | |
| Gas Total | | | 682,321 | | |
| | | | | Par (a) | | Value ($) | |
| Other Industrial Development Bonds – 0.6% | |
| Electric-Integrated – 0.6% | |
| Mirant Americas Generation LLC | |
| 8.500% 10/01/21 | | | | | 2,180,000 | | | | 1,809,400 | | |
| | | 1,809,400 | | |
| Other Industrial Development Bonds Total | | | 1,809,400 | | |
| Utilities Total | | | 19,580,394 | | |
Total Corporate Fixed-Income Bonds & Notes
(cost of $336,496,558) | | | 289,854,560 | | |
| Municipal Bonds – 1.0% | |
| California – 0.8% | |
| CA Cabazon Band Mission Indians | |
| Series 2004, | | | | | | | | | | | |
| 13.000% 10/01/11 | | | | | 3,250,000 | | | | 2,477,767 | | |
| California Total | | | 2,477,767 | | |
| Virginia – 0.2% | |
| VA Tobacco Settlement Financing Corp. | |
| Series 2007 A1, | | | | | | | | | | | |
| 6.706% 06/01/46 | | | | | 1,555,000 | | | | 847,320 | | |
| Virginia Total | | | 847,320 | | |
Total Municipal Bonds
(cost of $4,804,868) | | | 3,325,087 | | |
| Convertible Bond – 0.3% | |
| Communications – 0.3% | |
| Telecommunications – 0.3% | |
| Telecom Services – 0.3% | |
| Virgin Media, Inc. | |
| 6.500% 11/15/16 (b) | | | | | 1,395,000 | | | | 1,079,381 | | |
| Telecommunications Total | | | 1,079,381 | | |
| Communications Total | | | 1,079,381 | | |
Total Convertible Bond
(cost of $654,079) | | | 1,079,381 | | |
| Common Stocks – 0.0% | |
| | | | | Shares | | | |
| Industrials – 0.0% | |
| Commercial Services & Supplies – 0.0% | |
| Fairlane Management Corp. (f)(j)(k) | | | | | 50,004 | | | | – | | |
| Commercial Services & Supplies Total | | | – | | |
| Total Industrials | | | – | | |
See Accompanying Notes to Financial Statements.
16
Columbia High Yield Opportunity Fund
May 31, 2009
| Common Stocks (continued) | |
| | | | | Shares | | Value ($) | |
| Materials – 0.0% | |
| Metals & Mining – 0.0% | |
| Ormet Corp. (j) | | | | | 380 | | | | 114 | | |
| Metals & Mining Total | | | 114 | | |
| Total Materials | | | 114 | | |
Total Common Stocks
(cost of $3,040) | | | 114 | | |
| Preferred Stocks – 0.0% | |
| Communications – 0.0% | |
| Media – 0.0% | |
| PTV Inc. | |
Series A,
10.000% 01/10/23 | | | | | 18 | | | | 4 | | |
| CMP Susquehanna Radio Holdings Corp., | |
| Series A (b)(f)(j) | | | | | 26,213 | | | | 262 | | |
| Media Total | | | 266 | | |
| Communications Total | | | 266 | | |
| U.S. Government Agency – 0.0% | |
| Federal Home Loan Mortgage Corp. | |
| 5.160% (d) | | | | | 189,100 | | | | 122,915 | | |
| U.S. Government Agency Total | | | 122,915 | | |
Total Preferred Stocks
(cost of $274,457) | | | 123,181 | | |
| Warrants – 0.0% | |
| | | | | Units | | | |
| Communications – 0.0% | |
| Media – 0.0% | |
| Broadcast Services/Programs – 0.0% | |
| Sirius XM Radio, Inc. | |
| Expires 03/15/10 (f)(j)(l) | | | | | 2,435 | | | | 487 | | |
| | | 487 | | |
| Media Total | | | 487 | | |
| Telecommunication Services – 0.0% | |
| Jazztel PLC | |
| Expires 07/15/10 (b)(f)(j)(k) | | | | | 1,435 | | | | – | | |
| Telecommunication Services Total | | | – | | |
| Communications Total | | | 487 | | |
| | | | | Units | | Value ($) | |
| Consumer Non-Cyclical – 0.0% | |
| Food – 0.0% | |
| Food-Retail – 0.0% | |
| Pathmark Stores Inc. | |
| Expires 09/19/10 (f)(j) | | | | | 58,758 | | | | 7 | | |
| Food Total | | | 7 | | |
| Consumer Non-Cyclical Total | | | 7 | | |
| Financials – 0.0% | |
| Banks – 0.0% | |
| CNB Capital Trust I | |
| Expires 03/23/19 (f)(j) | | | | | 29,954 | | | | 300 | | |
| Banks Total | | | 300 | | |
| Financials Total | | | 300 | | |
Total Warrants
(cost of $7,581,796) | | | 794 | | |
| Short-Term Obligation – 6.0% | |
| | | | | Par ($) | | | |
Repurchase agreement with
Fixed Income Clearing Corp.,
dated 05/29/09, due 06/01/09
at 0.120%, collateralized by a
U.S. Government Agency
obligation maturing
04/18/36, market value
$19,280,592 (repurchase
p roceeds $18,901,189) | | | | | 18,901,000 | | | | 18,901,000 | | |
Total Short-Term Obligation
(Cost of $18,901,000) | | | 18,901,000 | | |
Total Investments – 98.6%
(cost of $368,715,798)(m) | | | 313,284,117 | | |
| Other Assets & Liabilities, Net – 1.4% | | | 4,397,425 | | |
| Net Assets – 100.0% | | | 317,681,542 | | |
See Accompanying Notes to Financial Statements.
17
Columbia High Yield Opportunity Fund
May 31, 2009
Notes to Investment Portfolio:
(a) Principal amount is stated in United States dollars unless otherwise noted.
(b) Security exempt from registration pursuant to Rule 144A under the Securities Act of 1933. These securities may be resold in transactions exempt from registration, normally to qualified institutional buyers. At May 31, 2009, these securities, which are not illiquid except for the following, amounted to $55,601,820, which represents 17.5% of net assets.
| Security | | Acquisition
Date | | Par/Units | | Cost | | Value | |
Jazztel PLC
Expires 07/15/10 | |
10/21/02 | | | 1,435 | | | $ | 2,467 | | | $ | - | | |
Local TV Finance LLC, PIK
9.250% 06/15/15
| |
05/02/07 -
06/23/08 | | $ | 1,030,000 |
| | $ | 1,011,169 |
| | $ | 142,756 |
| |
Orascom Telecom
Finance SCA
7.875% 02/08/14 | |
02/01/07 | | $ | 855,000 | | | $ | 855,000 | | | $ | 701,100 | | |
Seminole Indian
Tribe of Florida
7.804% 10/01/20
| |
09/26/07 -
10/04/07 | | $ | 2,000,000 |
| | $ | 2,028,200 |
| | $ | 1,675,340 |
| |
| | | | | | | $ | 2,519,196 | | |
(c) The issuer is in default of certain debt covenants. Income is not being accrued. At May 31, 2009, the value of this security amounted to $367,425, which represents 0.1% of net assets.
(d) The interest rate shown on floating rate or variable rate securities reflects the rate at May 31, 2009.
(e) The issuer has filed for bankruptcy protection under Chapter 11 and is in default of certain covenants. Income is being accrued. At May 31, 2009, the value of these securities amounted to $3,689,565 which represents 1.2% of net assets.
(f) Represents fair value as determined in good faith under procedures approved by the Board of Trustees. The value of these securities amounted to $51,456, which represents less than 0.1% of net assets.
(g) Loan participation agreement.
(h) The issuer has filed for bankruptcy protection under Chapter 11, and is in default of certain debt covenants. Income is not being accrued. At May 31, 2009, the value of these securities amounted to $704,973, which represents 0.2% of net assets.
(i) Step bond. This security is currently not paying coupon. Shown parenthetically is the next coupon rate to be paid and the date the security will begin accruing at this rate.
(j) Non-income producing security.
(k) Security has no value.
(l) Denotes a restricted security, which is subject to restrictions on resale under federal securities laws or in transactions exempt from registration. At May 31, 2009, the value of this security represents less than 0.1% of net assets.
(m) Cost for federal income tax purposes is $369,495,212.
(n) The issuer filed for bankruptcy protection under Chapter 11 on June 1, 2009. At May 31, 2009, the value of these securities amounted to $403,025, which represents 0.1% of net assets.
(o) The issuer filed for bankruptcy protection under Chapter 11 on June 13, 2009. At May 31, 2009, the value of this security amounted to $147,250, which represents less than 0.1% of net assets.
The following table summarizes the inputs used, as of May 31, 2009, in valuing the Fund's assets:
| Valuation Inputs | | Investments in
Securities | | Other Financial
Instruments* | |
| Level 1 – Quoted Prices | | $ | 123,033 | | | $ | – | | |
Level 2 – Other Significant
Observable Inputs | | | 313,110,115 | | | | (81,996 | ) | |
Level 3 – Significant
Unobservable Inputs | | | 50,969 | | | | – | | |
| Total | | $ | 313,284,117 | | | $ | (81,996 | ) | |
* Other financial instruments consist of forward foreign currency exchange contracts which are not included in the investment portfolio.
The Fund's assets assigned to the Level 2 input category include certain foreign securities for which a third party statistical pricing service may be employed for purposes of fair market valuation.
The following table reconciles asset balances for the year ended May 31, 2009, in which significant unobservable inputs (Level 3) were used in determining value:
| | | Investments in
Securities | | Other Financial
Instruments | |
| Balance as of May 31, 2008 | | $ | 1,711,588 | | | $ | – | | |
Accretion of Discounts/
Amortization of Premiums | | | 318 | | | | – | | |
| Realized gain (loss) | | | – | | | | – | | |
| Change in unrealized depreciation | | | (1,725,913 | ) | | | – | | |
| Net purchases | | | 101,449 | | | | – | | |
| Transfers out of Level 3 | | | (36,473 | ) | | | – | | |
| Balance as of May 31, 2009 | | $ | 50,969 | | | $ | – | | |
The information in the above reconciliation represents fiscal year to date activity for any securities identified as using Level 3 inputs at either the beginning or the end of the current fiscal period.
The change in unrealized losses attributable to securities owned at May 31, 2009 which were valued using significant unobservable inputs (Level 3) amounted to $1,725,913. This amount is included in net change in unrealized depreciation on the Statement of Changes in Net Assets.
For more information on valuation inputs, and their aggregation into the levels used in the tables above, please refer to the Security Valuation section in the accompanying Notes to Financial Statements.
See Accompanying Notes to Financial Statements.
18
Columbia High Yield Opportunity Fund
May 31, 2009
Forward foreign currency exchange contracts outstanding on May 31, 2009 are:
Forward
Foreign
Currency
Exchange
Contract
to Buy | | Value | | Aggregate
Face Value | | Settlement
Date | | Unrealized
Appreciation | |
| EUR | | | | $ | 325,099 | | | $ | 319,401 | | | 06/24/09 | | $ | 5,698 | | |
Forward
Foreign
Currency
Exchange
Contract to Sell | | Aggregate
Value | | Settlement
Face Value | | Unrealized
Date | | Depreciation | |
| EUR | | | | $ | 2,318,094 | | | $ | 2,230,400 | | | 06/24/09 | | $ | (87,694 | ) | |
At May 31, 2009, the asset allocation of the Fund is as follows:
| Asset Allocation (Unaudited) | | % of
Net Assets | |
| Corporate Fixed-Income Bonds & Notes | | | 91.3 | | |
| Municipal Bonds | | | 1.0 | | |
| Convertible Bond | | | 0.3 | | |
| Common Stocks | | | 0.0 | * | |
| Preferred Stocks | | | 0.0 | * | |
| Warrants | | | 0.0 | * | |
| | | | 92.6 | | |
| Short-Term Obligation | | | 6.0 | | |
| Other Assets & Liabilities, Net | | | 1.4 | | |
| | | | 100.0 | | |
* Rounds to less than 0.01%.
| Acronym | | Name | |
| | EUR | | | Euro | |
|
| | PIK | | | Payment-In-Kind | |
|
See Accompanying Notes to Financial Statements.
19
Statement of Assets and Liabilities – Columbia High Yield Opportunity Fund
May 31, 2009
| | | | | ($) | |
| Assets | | Investments, at cost | | | 368,715,798 | | |
| | | Investments, at value | | | 313,284,117 | | |
| | | Cash | | | 15 | | |
| | | Unrealized appreciation on forward foreign currency exchange contract | | | 5,698 | | |
| | | Receivable for: | | | | | |
| | | Investments sold | | | 3,629,258 | | |
| | | Fund shares sold | | | 1,003,345 | | |
| | | Interest | | | 7,547,963 | | |
| | | Trustees' deferred compensation plan | | | 43,488 | | |
| | | Prepaid expenses | | | 10,893 | | |
| | | Total Assets | | | 325,524,777 | | |
| Liabilities | | Unrealized depreciation on forward foreign currency exchange contract | | | 87,694 | | |
| | | Payable for: | | | | | |
| | | Investments purchased | | | 5,725,740 | | |
| | | Fund shares repurchased | | | 529,564 | | |
| | | Distributions | | | 1,050,002 | | |
| | | Investment advisory fee | | | 160,230 | | |
| | | Transfer agent fee | | | 72,780 | | |
| | | Trustees' fees | | | 26 | | |
| | | Audit fee | | | 50,000 | | |
| | | Pricing and bookkeeping fees | | | 11,307 | | |
| | | Custody fee | | | 3,418 | | |
| | | Distribution and service fees | | | 76,991 | | |
| | | Chief compliance officer expenses | | | 134 | | |
| | | Trustees' deferred compensation plan | | | 43,488 | | |
| | | Other liabilities | | | 31,861 | | |
| | | Total Liabilities | | | 7,843,235 | | |
| | | Net Assets | | | 317,681,542 | | |
| Net Assets Consist of | | Paid-in capital | | | 659,926,779 | | |
| | | Undistributed net investment income | | | 406,326 | | |
| | | Accumulated net realized loss | | | (287,138,412 | ) | |
| | | Net unrealized appreciation (depreciation) on: | | | | | |
| | | Investments | | | (55,431,681 | ) | |
| | | Foreign currency translations | | | (81,470 | ) | |
| | | Net Assets | | | 317,681,542 | | |
See Accompanying Notes to Financial Statements.
20
Statement of Assets and Liabilities – Columbia High Yield Opportunity Fund
May 31, 2009 (continued)
| Class A | | Net assets | | $ | 170,320,878 | | |
| | | Shares outstanding | | | 51,114,776 | | |
| | | Net asset value per share | | $ | 3.33 | (a) | |
| | | Maximum sales charge | | | 4.75 | % | |
| | | Maximum offering price per share ($3.33/0.9525) | | $ | 3.50 | (b) | |
| Class B | | Net assets | | $ | 23,665,486 | | |
| | | Shares outstanding | | | 7,102,686 | | |
| | | Net asset value and offering price per share | | $ | 3.33 | (a) | |
| Class C | | Net assets | | $ | 11,658,242 | | |
| | | Shares outstanding | | | 3,498,882 | | |
| | | Net asset value and offering price per share | | $ | 3.33 | (a) | |
| Class Z | | Net assets | | $ | 112,036,936 | | |
| | | Shares outstanding | | | 33,624,348 | | |
| | | Net asset value, offering and redemption price per share | | $ | 3.33 | | |
(a) Redemption price per share is equal to net asset value less any applicable contingent deferred sales charge.
(b) On sales of $50,000 or more the offering price is reduced.
See Accompanying Notes to Financial Statements.
21
Statement of Operations – Columbia High Yield Opportunity Fund
For the Year Ended May 31, 2009
| | | | | ($) | |
| Investment Income | | Interest | | | 31,448,474 | | |
| | | Dividends | | | 15,537 | | |
| | | Total Investment Income | | | 31,464,011 | | |
| Expenses | | Investment advisory fee | | | 1,848,657 | | |
| | | Distribution fee: | | | | | |
| | | Class B | | | 228,408 | | |
| | | Class C | | | 86,517 | | |
| | | Service fee: | | | | | |
| | | Class A | | | 401,468 | | |
| | | Class B | | | 76,229 | | |
| | | Class C | | | 28,916 | | |
| | | Transfer agent fee | | | 414,608 | | |
| | | Pricing and bookkeeping fees | | | 97,616 | | |
| | | Trustees' fees | | | 18,582 | | |
| | | Custody fee | | | 12,911 | | |
| | | Chief compliance officer expenses | | | 733 | | |
| | | Other expenses | | | 250,003 | | |
| | | Total Expenses | | | 3,464,648 | | |
| | | Fees waived by distributor—Class C | | | (17,328 | ) | |
| | | Expense reductions | | | (9,328 | ) | |
| | | Net Expenses | | | 3,437,992 | | |
| | | Net Investment Income | | | 28,026,019 | | |
| Net Realized and Unrealized Gain (Loss) on Investments, Foreign Currency and Credit Default Swap Contracts | |
| | Net realized gain (loss) on: | | | | | |
| | Investments | | | (50,530,665 | ) | |
| | Foreign currency transactions | | | 682,015 | | |
| | Credit default swap contracts | | | (1,087,544 | ) | |
| | | Net realized loss | | | (50,936,194 | ) | |
| | | Net change in unrealized appreciation (depreciation) on: | | | | | |
| | | Investments | | | (26,467,219 | ) | |
| | | Foreign currency translations | | | (119,454 | ) | |
| | | Credit default swap contracts | | | 67,808 | | |
| | | Net change in unrealized appreciation (depreciation) | | | (26,518,865 | ) | |
| | | Net Loss | | | (77,455,059 | ) | |
| | | Net Decrease Resulting from Operations | | | (49,429,040 | ) | |
See Accompanying Notes to Financial Statements.
22
Statement of Changes in Net Assets – Columbia High Yield Opportunity Fund
| | | | | Year Ended May 31, | |
| Increase (Decrease) in Net Assets | | | | 2009 ($) | | 2008 ($) | |
| Operations | | Net investment income | | | 28,026,019 | | | | 25,848,294 | | |
| | | Net realized loss on investments, foreign currency
transactions and credit default swap contracts | | | (50,936,194 | ) | | | (14,837,609 | ) | |
| | | Net change in unrealized appreciation (depreciation)
on investments, foreign currency translations and
credit default swap contracts | | | (26,518,865 | ) | | | (28,018,821 | ) | |
| | | Net decrease resulting from operations | | | (49,429,040 | ) | | | (17,008,136 | ) | |
| Distributions to Shareholders | | From net investment income: | | | | | | | | | |
| | | Class A | | | (15,203,927 | ) | | | (16,611,706 | ) | |
| | | Class B | | | (2,672,149 | ) | | | (4,128,494 | ) | |
| | | Class C | | | (1,026,219 | ) | | | (1,155,259 | ) | |
| | | Class Z | | | (10,359,634 | ) | | | (3,948,285 | ) | |
| | | Total distributions to shareholders | | | (29,261,929 | ) | | | (25,843,744 | ) | |
| | | Net Capital Stock Transactions | | | 5,521,355 | | | | 22,860,442 | | |
| | | Increase from regulatory settlements | | | 821,549 | | | | — | | |
| | | Total decrease in net assets | | | (72,348,065 | ) | | | (19,991,438 | ) | |
| Net Assets | | Beginning of period | | | 390,029,607 | | | | 410,021,045 | | |
| | | End of period | | | 317,681,542 | | | | 390,029,607 | | |
| | | Undistributed (overdistributed) net investment
income at end of period | | | 406,326 | | | | (445,618 | ) | |
See Accompanying Notes to Financial Statements.
23
Statement of Changes in Net Assets (continued) – Columbia High Yield Opportunity Fund
| | | Capital Stock Activity | |
| | | Year Ended
May 31, 2009 | | Year Ended
May 31, 2008 | |
| | | Shares | | Dollars ($) | | Shares | | Dollars ($) | |
| Class A | |
| Subscriptions | | | 12,818,180 | | | | 39,971,078 | | | | 12,299,836 | | | | 54,352,652 | | |
| Distributions reinvested | | | 2,840,215 | | | | 9,319,400 | | | | 2,077,408 | | | | 8,972,971 | | |
| Redemptions | | | (13,799,446 | ) | | | (44,568,251 | ) | | | (22,488,918 | ) | | | (99,550,216 | ) | |
| Net increase (decrease) | | | 1,858,949 | | | | 4,722,227 | | | | (8,111,674 | ) | | | (36,224,593 | ) | |
| Class B | |
| Subscriptions | | | 461,001 | | | | 1,434,268 | | | | 503,592 | | | | 2,244,545 | | |
| Distributions reinvested | | | 442,379 | | | | 1,464,723 | | | | 506,374 | | | | 2,195,896 | | |
| Redemptions | | | (5,010,704 | ) | | | (16,819,376 | ) | | | (8,601,692 | ) | | | (37,589,715 | ) | |
| Net decrease | | | (4,107,324 | ) | | | (13,920,385 | ) | | | (7,591,726 | ) | | | (33,149,274 | ) | |
| Class C | |
| Subscriptions | | | 630,374 | | | | 1,984,895 | | | | 285,522 | | | | 1,248,070 | | |
| Distributions reinvested | | | 190,993 | | | | 625,997 | | | | 154,770 | | | | 669,392 | | |
| Redemptions | | | (969,194 | ) | | | (3,241,767 | ) | | | (1,275,290 | ) | | | (5,562,715 | ) | |
| Net decrease | | | (147,827 | ) | | | (630,875 | ) | | | (834,998 | ) | | | (3,645,253 | ) | |
| Class Z | |
| Subscriptions | | | 17,063,143 | | | | 56,882,748 | | | | 10,621,856 | | | | 45,506,444 | | |
| Proceeds received in connection with merger | | | — | | | | — | | | | 16,005,215 | | | | 64,553,210 | | |
| Distributions reinvested | | | 417,658 | | | | 1,373,247 | | | | 187,362 | | | | 801,915 | | |
| Redemptions | | | (13,306,620 | ) | | | (42,905,607 | ) | | | (3,554,231 | ) | | | (14,982,007 | ) | |
| Net increase | | | 4,174,181 | | | | 15,350,388 | | | | 23,260,202 | | | | 95,879,562 | | |
See Accompanying Notes to Financial Statements.
24
Financial Highlights – Columbia High Yield Opportunity Fund
Selected data for a share outstanding throughout each period is as follows:
| | | Year Ended May 31, | |
| Class A Shares | | 2009 | | 2008 | | 2007 | | 2006 | | 2005 | |
| Net Asset Value, Beginning of Period | | $ | 4.17 | | | $ | 4.72 | | | $ | 4.50 | | | $ | 4.56 | | | $ | 4.54 | | |
| Income from Investment Operations: | |
| Net investment income (a) | | | 0.30 | | | | 0.31 | | | | 0.33 | | | | 0.33 | | | | 0.35 | | |
Net realized and unrealized gain (loss) on investments,
foreign currency and credit default swap contracts | | | (0.83 | ) | | | (0.55 | ) | | | 0.23 | | | | (0.03 | ) | | | 0.05 | | |
| Total from investment operations | | | (0.53 | ) | | | (0.24 | ) | | | 0.56 | | | | 0.30 | | | | 0.40 | | |
| Less Distributions to Shareholders: | |
| From net investment income | | | (0.32 | ) | | | (0.31 | ) | | | (0.34 | ) | | | (0.36 | ) | | | (0.38 | ) | |
| Increase from regulatory settlements | | | 0.01 | | | | — | | | | — | | | | — | | | | — | | |
| Net Asset Value, End of Period | | $ | 3.33 | | | $ | 4.17 | | | $ | 4.72 | | | $ | 4.50 | | | $ | 4.56 | | |
| Total return (b) | | | (12.04 | )% | | | (5.03 | )%(c) | | | 12.98 | % | | | 6.70 | %(c) | | | 8.93 | %(d) | |
| Ratios to Average Net Assets/Supplemental Data: | |
| Net expenses before interest expense (e) | | | 1.10 | % | | | 1.13 | % | | | 1.12 | % | | | 1.12 | % | | | 1.15 | % | |
| Interest expense | | | — | | | | — | %(f) | | | — | %(f) | | | — | | | | — | | |
| Net expenses (e) | | | 1.10 | % | | | 1.13 | % | | | 1.12 | % | | | 1.12 | % | | | 1.15 | % | |
| Waiver/Reimbursement | | | — | | | | 0.01 | % | | | — | | | | 0.02 | % | | | — | | |
| Net investment income (e) | | | 9.08 | % | | | 7.23 | % | | | 7.19 | % | | | 7.28 | % | | | 7.55 | % | |
| Portfolio turnover rate | | | 44 | % | | | 50 | % | | | 75 | % | | | 61 | % | | | 67 | % | |
| Net assets, end of period (000's) | | $ | 170,321 | | | $ | 205,330 | | | $ | 270,866 | | | $ | 245,713 | | | $ | 273,104 | | |
(a) Per share data was calculated using the average shares outstanding during the period.
(b) Total return at net asset value assuming all distributions reinvested and no initial sales charge or contingent deferred sales charge.
(c) Had the investment advisor and/or any of its affiliates not waived fees or reimbursed a portion of expenses, total return would have been reduced.
(d) Total return includes a voluntary reimbursement by the investment advisor for a realized investment loss. This reimbursement had an impact of less than 0.01% on the Fund's total return.
(e) The benefits derived from expense reductions had an impact of less than 0.01%.
(f) Rounds to less than 0.01%.
See Accompanying Notes to Financial Statements.
25
Financial Highlights – Columbia High Yield Opportunity Fund
Selected data for a share outstanding throughout each period is as follows:
| | | Year Ended May 31, | |
| Class B Shares | | 2009 | | 2008 | | 2007 | | 2006 | | 2005 | |
| Net Asset Value, Beginning of Period | | $ | 4.17 | | | $ | 4.72 | | | $ | 4.50 | | | $ | 4.56 | | | $ | 4.54 | | |
| Income from Investment Operations: | |
| Net investment income (a) | | | 0.28 | | | | 0.28 | | | | 0.29 | | | | 0.30 | | | | 0.32 | | |
Net realized and unrealized gain (loss) on investments,
foreign currency and credit default swap contracts | | | (0.84 | ) | | | (0.55 | ) | | | 0.24 | | | | (0.04 | ) | | | 0.05 | | |
| Total from investment operations | | | (0.56 | ) | | | (0.27 | ) | | | 0.53 | | | | 0.26 | | | | 0.37 | | |
| Less Distributions to Shareholders: | |
| From net investment income | | | (0.29 | ) | | | (0.28 | ) | | | (0.31 | ) | | | (0.32 | ) | | | (0.35 | ) | |
| Increase from regulatory settlements | | | 0.01 | | | | — | | | | — | | | | — | | | | — | | |
| Net Asset Value, End of Period | | $ | 3.33 | | | $ | 4.17 | | | $ | 4.72 | | | $ | 4.50 | | | $ | 4.56 | | |
| Total return (b) | | | (12.69 | )% | | | (5.73 | )%(c) | | | 12.15 | % | | | 5.91 | %(c) | | | 8.13 | %(d) | |
| Ratios to Average Net Assets/Supplemental Data: | |
| Net expenses before interest expense (e) | | | 1.85 | % | | | 1.88 | % | | | 1.87 | % | | | 1.87 | % | | | 1.90 | % | |
| Interest expense | | | — | | | | — | %(f) | | | — | %(f) | | | — | | | | — | | |
| Net expenses (e) | | | 1.85 | % | | | 1.88 | % | | | 1.87 | % | | | 1.87 | % | | | 1.90 | % | |
| Waiver/Reimbursement | | | — | | | | 0.01 | % | | | — | | | | 0.02 | % | | | — | | |
| Net investment income (e) | | | 8.35 | % | | | 6.47 | % | | | 6.46 | % | | | 6.55 | % | | | 6.80 | % | |
| Portfolio turnover rate | | | 44 | % | | | 50 | % | | | 75 | % | | | 61 | % | | | 67 | % | |
| Net assets, end of period (000's) | | $ | 23,665 | | | $ | 46,732 | | | $ | 88,774 | | | $ | 135,122 | | | $ | 194,460 | | |
(a) Per share data was calculated using the average shares outstanding during the period.
(b) Total return at net asset value assuming all distributions reinvested and no contingent deferred sales charge.
(c) Had the investment advisor and/or any of its affiliates not waived fees or reimbursed a portion of expenses, total return would have been reduced.
(d) Total return includes a voluntary reimbursement by the investment advisor for a realized investment loss. This reimbursement had an impact of less than 0.01% on the Fund's total return.
(e) The benefits derived from expense reductions had an impact of less than 0.01%.
(f) Rounds to less than 0.01%.
See Accompanying Notes to Financial Statements.
26
Financial Highlights – Columbia High Yield Opportunity Fund
Selected data for a share outstanding throughout each period is as follows:
| | | Year Ended May 31, | |
| Class C Shares | | 2009 | | 2008 | | 2007 | | 2006 | | 2005 | |
| Net Asset Value, Beginning of Period | | $ | 4.17 | | | $ | 4.72 | | | $ | 4.50 | | | $ | 4.56 | | | $ | 4.54 | | |
| Income from Investment Operations: | |
| Net investment income (a) | | | 0.28 | | | | 0.29 | | | | 0.30 | | | | 0.31 | | | | 0.33 | | |
Net realized and unrealized gain (loss) on investments,
foreign currency and credit default swap contracts | | | (0.83 | ) | | | (0.55 | ) | | | 0.23 | | | | (0.04 | ) | | | 0.04 | | |
| Total from investment operations | | | (0.55 | ) | | | (0.26 | ) | | | 0.53 | | | | 0.27 | | | | 0.37 | | |
| Less Distributions to Shareholders: | |
| From net investment income | | | (0.30 | ) | | | (0.29 | ) | | | (0.31 | ) | | | (0.33 | ) | | | (0.35 | ) | |
| Increase from regulatory settlements | | | 0.01 | | | | — | | | | — | | | | — | | | | — | | |
| Net Asset Value, End of Period | | $ | 3.33 | | | $ | 4.17 | | | $ | 4.72 | | | $ | 4.50 | | | $ | 4.56 | | |
| Total return (b) | | | (12.57 | )% | | | (5.59 | )%(c) | | | 12.31 | %(c) | | | 6.07 | %(c) | | | 8.29 | %(c)(d) | |
| Ratios to Average Net Assets/Supplemental Data: | |
| Net expenses before interest expense (e) | | | 1.70 | % | | | 1.73 | % | | | 1.72 | % | | | 1.72 | % | | | 1.75 | % | |
| Interest expense | | | — | | | | — | %(f) | | | — | %(f) | | | — | | | | — | | |
| Net expenses (e) | | | 1.70 | % | | | 1.73 | % | | | 1.72 | % | | | 1.72 | % | | | 1.75 | % | |
| Waiver/Reimbursement | | | 0.15 | % | | | 0.16 | % | | | 0.15 | % | | | 0.17 | % | | | 0.15 | % | |
| Net investment income (e) | | | 8.49 | % | | | 6.63 | % | | | 6.60 | % | | | 6.70 | % | | | 6.95 | % | |
| Portfolio turnover rate | | | 44 | % | | | 50 | % | | | 75 | % | | | 61 | % | | | 67 | % | |
| Net assets, end of period (000's) | | $ | 11,658 | | | $ | 15,202 | | | $ | 21,161 | | | $ | 23,084 | | | $ | 30,366 | | |
(a) Per share data was calculated using the average shares outstanding during the period.
(b) Total return at net asset value assuming all distributions reinvested and no contingent deferred sales charge.
(c) Had the investment advisor and/or any of its affiliates not waived fees or reimbursed a portion of expenses, total return would have been reduced.
(d) Total return includes a voluntary reimbursement by the investment advisor for a realized investment loss. This reimbursement had an impact of less than 0.01% on the Fund's total return.
(e) The benefits derived from expense reductions had an impact of less than 0.01%.
(f) Rounds to less than 0.01%.
See Accompanying Notes to Financial Statements.
27
Financial Highlights – Columbia High Yield Opportunity Fund
Selected data for a share outstanding throughout each period is as follows:
| | | Year Ended May 31, | |
| Class Z Shares | | 2009 | | 2008 | | 2007 | | 2006 | | 2005 | |
| Net Asset Value, Beginning of Period | | $ | 4.17 | | | $ | 4.72 | | | $ | 4.50 | | | $ | 4.56 | | | $ | 4.54 | | |
| Income from Investment Operations: | |
| Net investment income (a) | | | 0.31 | | | | 0.31 | | | | 0.34 | | | | 0.34 | | | | 0.37 | | |
Net realized and unrealized gain (loss) on investments,
foreign currency and credit default swap contracts | | | (0.83 | ) | | | (0.54 | ) | | | 0.23 | | | | (0.03 | ) | | | 0.04 | | |
| Total from investment operations | | | (0.52 | ) | | | (0.23 | ) | | | 0.57 | | | | 0.31 | | | | 0.41 | | |
| Less Distributions to Shareholders: | |
| From net investment income | | | (0.33 | ) | | | (0.32 | ) | | | (0.35 | ) | | | (0.37 | ) | | | (0.39 | ) | |
| Increase from regulatory settlements | | | 0.01 | | | | — | | | | — | | | | — | | | | — | | |
| Net Asset Value, End of Period | | $ | 3.33 | | | $ | 4.17 | | | $ | 4.72 | | | $ | 4.50 | | | $ | 4.56 | | |
| Total return (b) | | | (11.83 | )% | | | (4.79 | )%(c) | | | 13.26 | % | | | 6.97 | %(c) | | | 9.21 | %(d) | |
| Ratios to Average Net Assets/Supplemental Data: | |
| Net expenses before interest expense (e) | | | 0.85 | % | | | 0.88 | % | | | 0.87 | % | | | 0.87 | % | | | 0.90 | % | |
| Interest expense | | | — | | | | — | %(f) | | | — | %(f) | | | — | | | | — | | |
| Net expenses (e) | | | 0.85 | % | | | 0.88 | % | | | 0.87 | % | | | 0.87 | % | | | 0.90 | % | |
| Waiver/Reimbursement | | | — | | | | 0.01 | % | | | — | | | | 0.02 | % | | | — | | |
| Net investment income (e) | | | 9.39 | % | | | 7.47 | % | | | 7.44 | % | | | 7.53 | % | | | 7.80 | % | |
| Portfolio turnover rate | | | 44 | % | | | 50 | % | | | 75 | % | | | 61 | % | | | 67 | % | |
| Net assets, end of period (000's) | | $ | 112,037 | | | $ | 122,766 | | | $ | 29,220 | | | $ | 11,190 | | | $ | 12,829 | | |
(a) Per share data was calculated using the average shares outstanding during the period.
(b) Total return at net asset value assuming all distributions reinvested.
(c) Had the investment advisor and/or any of its affiliates not waived fees or reimbursed a portion of expenses, total return would have been reduced.
(d) Total return includes a voluntary reimbursement by the investment advisor for a realized investment loss. This reimbursement had an impact of less than 0.01% on the Fund's total return.
(e) The benefits derived from expense reductions had an impact of less than 0.01%.
(f) Rounds to less than 0.01%.
See Accompanying Notes to Financial Statements.
28
Notes to Financial Statements – Columbia High Yield Opportunity Fund
May 31, 2009
Note 1. Organization
Columbia High Yield Opportunity Fund (the "Fund"), a series of Columbia Funds Series Trust I (the "Trust"), is a diversified portfolio. The Trust is registered under the Investment Company Act of 1940, as amended (the "1940 Act"), as an open-end management investment company organized as a Massachusetts business trust.
Investment Objective
The Fund seeks total return, consisting of current income and capital appreciation.
Fund Shares
The Trust may issue an unlimited number of shares, and the Fund offers four classes of shares: Class A, Class B, Class C and Class Z. Each share class has its own expense structure and sales charges, as applicable. Effective June 22, 2009, the Fund no longer accepts investments in Class B shares from new or existing investors in the Fund's Class B shares, except in connection with the reinvestment of any dividend and/or capital gain distributions in Class B shares of the Fund and exchanges by existing Class B shareholders of the other Columbia Funds.
Class A shares are subject to a maximum front-end sales charge of 4.75% based on the amount of initial investment. Class A shares purchased without an initial sales charge in accounts aggregating $1 million to $50 million at the time of purchase are subject to a 1.00% contingent deferred sales charge ("CDSC") if the shares are sold within one year after purchase. Class B shares are subject to a maximum CDSC of 5.00% based upon the holding period after purchase. Class B shares will convert to Class A shares eight years after purchase. Class C shares are subject to a 1.00% CDSC on shares sold within one year after purchase. Class Z shares are offered continuously at net asset value. There are certain restrictions on the purchase of Class Z shares, as described in the Fund's prospectus.
Note 2. Significant Accounting Policies
The preparation of financial statements in accordance with accounting principles generally accepted in the United States of America ("GAAP") requires management to make certain estimates and assumptions that affect the reported amounts of assets and liabilities, the disclosure of contingent assets and liabilities at the date of the financial statements and the reported amounts of revenue and expenses during the reporting period. Actual results could differ from those estimates. The following is a summary of significant accounting policies consistently followed by the Fund in the preparation of its financial statements.
Security Valuation
Debt securities generally are valued by pricing services approved by the Trust's Board of Trustees, based upon market transactions for normal, institutional-size trading units of similar securities. The services may use various pricing techniques which take into account appropriate factors such as yield, quality, coupon rate, maturity, type of issue, trading characteristics and other data, as well as broker quotes. Debt securities for which quotations are readily available are valued at an over-the-counter or exchange bid quotation.
Certain debt securities, which tend to be more thinly traded and of lesser quality, are priced based on fundamental analysis of the financial condition of the issuer and the estimated value of any collateral. Valuations developed through pricing techniques may vary from the actual amounts realized upon sale of the securities, and the potential variation may be greater for those securities valued using fundamental analysis.
Equity securities are valued at the last sale price on the principal exchange on which they trade, except for securities traded on the NASDAQ, which are valued at the NASDAQ official close price. Unlisted securities or listed securities for which there were no sales during the day are valued at the closing bid price on such exchanges or over-the-counter markets.
Short-term investments maturing in 60 days or less are valued at amortized cost, which approximates market value.
Forward foreign currency exchange contracts are valued at the prevailing forward exchange rate of the underlying currencies.
Credit default swap contracts are marked to market daily based upon quotations from market makers. Quotations obtained from independent pricing services use information provided by market makers.
Foreign securities are generally valued at the last sale price on the foreign exchange or market on which they trade. If any
29
Columbia High Yield Opportunity Fund, May 31, 2009
foreign share prices are not readily available as a result of limited share activity, the securities are valued at the last sale price of the local shares in the principal market in which such securities are normally traded.
Generally, trading in foreign securities is substantially completed each day at various times prior to the close of the New York Stock Exchange ("NYSE"). The values of such securities used in computing the net asset value of the Fund's shares are determined as of such times. Foreign currency exchange rates are generally determined at 4:00 p.m. Eastern (U.S.) time. Ocassionally, events affecting the values of such foreign securities and such exchange rates may occur between the times at which they are determined and the close of the customary trading session of the NYSE, which would not be reflected in the computation of the Fund's net asset value. If events materially affecting the values of such foreign securities occur and it is determined that market quotations are not reliable, then these foreign securities will be valued at their fair value using procedures approved by the Board of Trustees.
Investments for which market quotations are not readily available, or that have quotations which management believes are not reliable, are valued at fair value as determined in good faith under consistently applied procedures established by and under the general supervision of the Board of Trustees. If a security is valued at fair value, such value is likely to be different from the last quoted market price for the security. The determination of fair value often requires significant judgment. To determine fair value, management may use assumptions including but not limited to future cash flows and estimated risk premiums. Multiple inputs from various sources may be used to determine value.
On June 1, 2008, the Fund adopted Financial Accounting Standards Board ("FASB") Statement of Financial Accounting Standards No. 157, Fair Value Measurements ("SFAS 157"). SFAS 157 establishes a hierarchy that prioritizes the inputs to valuation techniques used to measure fair value giving the highest priority to unadjusted quoted prices in active markets for identical securities (level 1 measurements) and the lowest priority to unobservable inputs (level 3 measurements) when market prices are not readily available or reliable. The three levels of the fair value hierarchy under SFAS 157 are described below:
• Level 1 – quoted prices in active markets for identical securities
• Level 2 – prices determined using other significant observable inputs (including quoted prices for similar securities, interest rates, prepayment speeds, credit risk and others)
• Level 3 – prices determined using significant unobservable inputs. In situations where quoted prices or observable inputs are unavailable or less reliable, unobservable inputs may be used. Unobservable inputs may include management's own assumptions about the factors market participants would use in pricing an investment.
The inputs or methodology used for valuing securities are not necessarily an indication of the risk associated with investing in those securities.
In April 2009, FASB issued new FASB Staff Position 157-4, Determining Fair Value When the Value and Level of Activity for the Asset or Liability Have Significantly Decreased and Identifying Transactions That Are Not Orderly ("FSP FAS 157-4"), which amends SFAS 157 and is effective for interim and annual periods ending after June 15, 2009. FSP FAS 157-4 provides additional guidance when the volume and level of activity for the asset or liability measured at fair value has significantly decreased. Additionally, FSP FAS 157-4 expands disclosure requirements for reporting entities with respect to categories of assets and liabilities carried at fair value. Management is evaluating the impact that the application of FSP FAS 157-4 will have on the Fund's financial statement disclosures.
Security Transactions
Security transactions are accounted for on the trade date. Cost is determined and gains (losses) are based upon the specific identification method for both financial statement and federal income tax purposes.
In September 2008, FASB Staff Position 133-1 and FIN 45-4, Disclosures about Credit Derivatives and Certain Guarantees: An Amendment of FASB Statement No. 133 and FASB Interpretation No. 45 and Clarification of the Effective Date of FASB Statement No. 161 ("Amendment") was issued and is effective for annual and interim reporting periods ending after November 15, 2008.
30
Columbia High Yield Opportunity Fund, May 31, 2009
The Amendment requires enhanced disclosures regarding a fund's credit derivatives and hybrid financial instruments containing embedded credit derivatives. The amendments to FAS 133 include required disclosure for (i) the nature and terms of the credit derivative, reasons for entering into the credit derivative, the events or circumstances that would require the seller to perform under the credit derivative, and the current status of the payment/performance risk of the credit derivative, (ii) the maximum potential amount of future payments (undiscounted) the seller could be required to make under the credit derivative, (iii) the fair value of the credit derivative, and (iv) the nature of any recourse provisions and assets held either as collateral or by third parties. The amendments to FIN 45 require additional disclosures about the current status of the payment/ performance risk of a guarantee.
During the reporting period, the Fund entered into a credit default swap contract as a protection provider. At May 31, 2009, the Fund did not have any open credit default swap contracts. Additional information regarding credit default swap transactions is disclosed in the Notes to the Financial Statements and in Note 6.
On December 1, 2008, the Fund adopted Statement of Financial Accounting Standards No. 161, Disclosures about Derivative Instruments and Hedging Activities—an amendment of FASB Statement No. 133 ("SFAS 161"). SFAS 161 requires additional discussion about the reporting entity's derivative instruments and hedging activities, by providing for qualitative disclosures about the objectives and strategies for using derivatives, quantitative data about the fair value of and gains and losses on derivative contracts, and details of credit-risk-related contingent features in their derivative contracts. For additional information on derivative instruments, please see Note 6.
Forward Foreign Currency Exchange Contracts
Forward foreign currency exchange contracts are agreements to exchange one currency for another at a future date at a specified price. These contracts are used to minimize the exposure to foreign exchange rate fluctuations during the period between the trade and settlement dates of the contract. The Fund may utilize forward foreign currency exchange contracts in connection with the settlement of purchases and sales of securities. The Fund may also enter into these contracts to reduce the exposure to adverse price movements in certain other foreign currency denominated assets. Contracts to buy generally are used to acquire exposure to foreign currencies, while contracts to sell are generally used to reduce the exposure to foreign exchange rate fluctuations. Forward foreign currency exchange contracts are valued daily at the current exchange rate of the underlying currency, resulting in unrealized gains (losses) which become reali zed at the time the forward foreign currency exchange contracts are closed or mature. Realized and unrealized gains (losses) arising from such transactions are included in net realized and unrealized gains (losses) on foreign currency transactions. The use of forward foreign currency exchange contracts does not eliminate fluctuations in the prices of the Fund's portfolio securities. While the maximum potential loss from such contracts is the aggregate face value in U.S. dollars at the time the contract was opened, exposure is typically limited to the change in value of the contract (in U.S. dollars) over the period it remains open. The Fund could also be exposed to risk that counterparties of the contracts may be unable to fulfill the terms of the contracts.
Repurchase Agreements
The Fund may engage in repurchase agreement transactions with institutions that Columbia Management Advisors, LLC ("Columbia"), the Fund's investment advisor, has determined are creditworthy. The Fund, through its custodian, receives delivery of the underlying securities collateralizing a repurchase agreement. Columbia is responsible for determining that the collateral is at least equal, at all times, to the value of the repurchase obligation including interest. A repurchase agreement transaction involves certain risks in the event of default or insolvency of the counterparty. These risks include possible delays in or restrictions on the Fund's ability to dispose of the underlying securities and a possible decline in the value of the underlying securities during the period while the Fund seeks to assert its rights.
Loan Participations and Commitments
The Fund may invest in loan participations. When the Fund purchases a loan participation, the Fund typically enters into a contractual relationship with the lender or third party selling such participation ("Selling Participant"), but not the borrower. However, the Fund assumes the credit risk of the borrower, Selling Participant and any other persons interpositioned
31
Columbia High Yield Opportunity Fund, May 31, 2009
between the Fund and the borrower. The Fund may not directly benefit from the collateral supporting the senior loan which it has purchased from the Selling Participant.
Credit Default Swaps
The Fund may enter into credit default swap transactions to increase exposure to a credit or basket of credits that could not be established efficiently through purchases of individual bonds. Credit default swaps are agreements in which one party pays fixed periodic payments to a counterparty in consideration for a guarantee from the counterparty to make a specific payment should a negative credit event take place. The Fund may receive an upfront payment as the protection seller or make an upfront payment as the protection buyer. Credit default swaps are marked to market daily based on quotations from market makers and any change is recorded as unrealized appreciation/depreciation on the Statement of Assets and Liabilities. Periodic payments received or made are recorded as a realized gain or loss and premiums received or made are amortized on the Statement of Operations.
If the Fund is a buyer of protection and a credit event occurs, as defined under the terms of that particular swap agreement, the Fund will either (i) receive from the seller of protection an amount equal to the notional amount of the swap and deliver the referenced obligation or underlying securities comprising the referenced index or (ii) receive a net settlement amount in the form of cash or securities equal to the notional amount of the swap less the recovery value of the referenced obligation or underlying securities comprising the referenced index.
If the Fund is a seller of protection and a credit event occurs, as defined under the terms of that particular swap agreement, the Fund will either (i) pay to the buyer of protection an amount equal to the notional amount of the swap and take delivery of the referenced obligation or underlying securities comprising the referenced index or (ii) pay a net settlement amount in the form of cash or securities equal to the notional amount of the swap less the recovery value of the referenced obligation or underlying securities comprising the referenced index.
Foreign Currency Transactions and Translations
The values of all assets and liabilities quoted in foreign currencies are translated into U.S. dollars at that day's exchange rates. Net realized and unrealized gains (losses) on foreign currency transactions and translations include gains (losses) arising from the fluctuation in exchange rates between trade and settlement dates on securities transactions, gains (losses) arising from the disposition of foreign currency and currency gains (losses) between the accrual and payment dates on dividends, interest income and foreign withholding taxes.
For financial statement purposes, the Fund does not distinguish that portion of gains (losses) on investments which is due to changes in foreign exchange rates from that which is due to changes in market prices of the investments. Such fluctuations are included with the net realized and unrealized gains (losses) on investments on the Statement of Operations.
Income Recognition
Interest income is recorded on the accrual basis. Premium and discount are amortized and accreted, respectively, on all debt securities, unless otherwise noted. Corporate actions and dividend income are recorded on the ex-date.
The value of additional securities received as an income payment is recorded as income and as the cost basis of such securities.
Expenses
General expenses of the Trust are allocated to the Fund and other series of the Trust based upon relative net assets or other expense allocation methodologies determined by the nature of the expense. Expenses directly attributable to the Fund are charged to the Fund.
Determination of Class Net Asset Value
All income, expenses (other than class-specific expenses, as shown on the Statement of Operations) and realized and unrealized gains (losses) are allocated to each class of the Fund on a daily basis for purposes of determining the net asset value of each class. Income and expenses are allocated to each class based on the settled shares method, while realized and unrealized gains (losses) are allocated based on the relative net assets of each class.
32
Columbia High Yield Opportunity Fund, May 31, 2009
Federal Income Tax Status
The Fund intends to qualify each year as a "regulated investment company" under Subchapter M of the Internal Revenue Code, as amended, and will distribute substantially all of its tax exempt or taxable income, if any, for its tax year, and as such will not be subject to federal income taxes. In addition, the Fund intends to distribute in each calendar year substantially all of its net investment income, capital gains and certain other amounts, if any, such that the Fund should not be subject to federal excise tax. Therefore, no federal income or excise tax provision is recorded.
Distributions to Shareholders
Distributions from net investment income are declared daily and paid monthly. Net realized capital gains, if any, are distributed at least annually. Income distributions and capital gain distributions are determined in accordance with federal income tax regulations which may differ from GAAP.
Indemnification
In the normal course of business, the Fund enters into contracts that contain a variety of representations and warranties and which provide general indemnities. The Fund's maximum exposure under these arrangements is unknown because this would involve future claims against the Fund. Also, under the Trust's organizational documents and by contract, the Trustees and officers of the Trust are indemnified against certain liabilities that may arise out of actions relating to their duties to the Trust. However, based on experience, the Fund expects the risk of loss due to these representations, warranties and indemnities to be minimal.
Note 3. Federal Tax Information
The timing and character of income and capital gain distributions are determined in accordance with income tax regulations, which may differ from GAAP. Reclassifications are made to the Fund's capital accounts for permanent tax differences to reflect income and gains available for distribution (or available capital loss carryforwards) under income tax regulations.
For the year ended May 31, 2009, permanent book and tax differences resulting primarily from differing treatments for post-October loss deferral, paydowns, discount accretion/premium amortization on debt securities, Section 988 bond bifurcation and expired capital loss carryforwards were identified and reclassified among the components of the Fund's net assets as follows:
Undistributed
Net Investment
Income | | Accumulated
Net Realized
Loss | | Paid-In Capital | |
| $ | 2,087,854 | | | $ | 160,013,218 | | | $ | (162,101,072 | ) | |
Net investment income and net realized gains (losses), as disclosed on the Statement of Operations, and net assets were not affected by this reclassification.
The tax character of distributions paid during the years ended May 31, 2009 and May 31, 2008 was as follows:
| | | May 31, | |
| Distributions paid from | | 2009 | | 2008 | |
| Ordinary Income* | | $ | 29,261,929 | | | $ | 25,843,744 | | |
* For tax purposes short-term capital gain distributions, if any, are considered ordinary income distributions.
As of May 31, 2009, the components of distributable earnings on a tax basis were as follows:
Undistributed
Ordinary
Income | | Undistributed
Long-term
Capital Gains | | Net Unrealized
Depreciation* | |
| $ | 2,997,692 | | | $ | — | | | $ | (56,211,095 | ) | |
* The differences between book-basis and tax-basis net unrealized depreciation are primarily due to deferral of losses from wash sales and discount accretion/premium amortization on debt securities.
Unrealized appreciation and depreciation at May 31, 2009, based on cost of investments for federal income tax purposes were:
| Unrealized appreciation | | $ | 7,793,041 | | |
| Unrealized depreciation | | | (64,004,136 | ) | |
| Net unrealized depreciation | | $ | (56,211,095 | ) | |
33
Columbia High Yield Opportunity Fund, May 31, 2009
The following capital loss carryforwards determined as of May 31, 2009 may be available to reduce taxable income arising from future net realized gains on investments, if any, to the extent permitted by the Internal Revenue Code:
| Year of Expiration | | Capital Loss
Carryforwards | |
| 2010 | | $ | 176,655,717 | | |
| 2011 | | | 21,117,010 | | |
| 2012 | | | 1,461,417 | | |
| 2013 | | | 3,844,857 | | |
| 2014 | | | 7,033,993 | | |
| 2015 | | | 6,703,180 | | |
| 2016 | | | 378,711 | | |
| 2017 | | | 25,681,397 | | |
| Total | | $ | 242,876,282 | | |
Capital loss carryforwards of $161,251,744 expired during the year ended May 31, 2009.
The availability of a portion of the capital loss carryforwards acquired by the Fund as a result of its merger with High Yield Fund has been limited in certain years and has been excluded from the schedule of available loss carryforwards above.
Of the capital loss carryforwards attributable to the Fund, $65,039,225 ($17,456,849 expiring May 31, 2010, $40,103,941 expiring May 31, 2011, $1,461,417 expiring May 31, 2012 and $6,017,018 expiring May 31, 2013) was obtained in the merger with High Yield Fund (see Note 12). Utilization of these losses could be subject to limitations imposed by the Internal Revenue Code.
Under current tax rules, certain currency and capital losses realized after October 31 may be deferred and treated as occurring on the first day of the following fiscal year. As of May 31, 2009, post-October capital losses of $44,115,253 attributed to security transactions were deferred to June 1, 2009.
Under Financial Accounting Standards Board ("FASB") Interpretation No. 48, Accounting for Uncertainty in Income Taxes—an Interpretation of FASB Statement No. 109 ("FIN 48"), management determines whether a tax position of the Fund is more likely than not to be sustained upon examination by the applicable taxing authority, including resolution of any related appeals or litigation processes, based on the technical merits of the position. The tax benefit to be recognized is measured as the largest amount of benefit that is greater than fifty percent likely of being realized upon ultimate settlement. Management has evaluated the known implications of FIN 48 on the computation of net assets for the Fund. As a result of this evaluation, management has concluded that FIN 48 did not have any effect on the Fund's financial statements. However, management's conclusions regarding FIN 48 may be subject to review and adjustment at a later date based on factors including, but not limited to, further implementation guidance from the FASB, new tax laws, regulations, and administrative interpretations (including relevant court decisions). The Fund's federal tax returns for the prior three fiscal years remain subject to examination by the Internal Revenue Service. The Fund is not aware of any tax positions for which it is reasonably possible that the total amounts of unrecognized tax benefits will significantly change in the next twelve months.
Note 4. Fees and Compensation Paid to Affiliates
Investment Advisory Fee
Columbia, an indirect, wholly owned subsidiary of Bank of America Corporation ("BOA"), provides investment advisory, administrative and other services to the Fund. In rendering investment advisory services to the Fund, Columbia may use the portfolio management and research resources of Columbia Management Pte. Ltd., an affiliate of Columbia. Columbia receives a monthly investment advisory fee based on the Fund's average daily net assets at the following annual rates:
| Average Daily Net Assets | | Annual Fee Rate | |
| First $500 million | | | 0.60 | % | |
| $500 million to $1 billion | | | 0.55 | % | |
| $1 billion to $1.5 billion | | | 0.52 | % | |
| Over $1.5 billion | | | 0.49 | % | |
For the year ended May 31, 2009, the Fund's effective investment advisory fee rate was 0.60% of the Fund's average daily net assets.
34
Columbia High Yield Opportunity Fund, May 31, 2009
Pricing and Bookkeeping Fees
The Fund has entered into a Financial Reporting Services Agreement (the "Financial Reporting Services Agreement") with State Street Bank & Trust Company ("State Street") and Columbia pursuant to which State Street provides financial reporting services to the Fund. The Fund has also entered into an Accounting Services Agreement (collectively with the Financial Reporting Services Agreement, the "State Street Agreements") with State Street and Columbia pursuant to which State Street provides accounting services to the Fund. Under the State Street Agreements, the Fund pays State Street an annual fee of $38,000 paid monthly plus an additional monthly fee based on an annualized percentage rate of average daily net assets of the Fund for the month. The aggregate fee will not exceed $140,000 per year (exclusive of out-of-pocket expenses and charges). The Fund also reimburses State Street for certain out-of-pocket expenses and charge s.
The Fund has entered into a Pricing and Bookkeeping Oversight and Services Agreement (the "Services Agreement") with Columbia. Under the Services Agreement, Columbia provides services related to Fund expenses and the requirements of the Sarbanes-Oxley Act of 2002, and provides oversight of the accounting and financial reporting services provided by State Street. Under the Services Agreement, the Fund reimburses Columbia for out-of-pocket expenses.
Transfer Agent Fee
Columbia Management Services, Inc. (the "Transfer Agent"), an affiliate of Columbia and an indirect, wholly owned subsidiary of BOA, provides shareholder services to the Fund and has contracted with Boston Financial Data Services ("BFDS") to serve as sub-transfer agent. The Transfer Agent is entitled to receive a fee for its services, paid monthly, at the annual rate of $17.34 per open account plus reimbursement of certain sub-transfer agent fees paid by the Transfer Agent (exclusive of BFDS fees), calculated based on assets held in omnibus accounts and intended to recover the cost of payments to other parties (including affiliates of BOA) for services to those accounts. The Transfer Agent pays the fees of BFDS for services as sub-transfer agent and is not entitled to reimbursement for such fees from the Fund.
The Transfer Agent may also retain, as additional compensation for its services, fees for wire, telephone and redemption orders, Individual Retirement Account ("IRA") trustee agent fees and account transcript fees due to the Transfer Agent from shareholders of the Fund and credits (net of bank charges) earned with respect to balances in accounts the Transfer Agent maintains in connection with its services to the Fund. The Transfer Agent also receives reimbursement for certain out-of-pocket expenses.
An annual minimum account balance fee of $20 may apply to certain accounts with a value below the Fund's initial minimum investment requirements to reduce the impact of small accounts on transfer agent fees. These minimum account balance fees are recorded as part of expense reductions on the Statement of Operations. For the year ended May 31, 2009, these minimum account balance fees reduced total expenses by $9,001.
Underwriting Discounts, Service and Distribution Fees
Columbia Management Distributors, Inc. (the "Distributor"), an affiliate of Columbia and an indirect, wholly owned subsidiary of BOA, is the principal underwriter of the Fund's shares. For the year ended May 31, 2009, the Distributor retained net underwriting discounts of $6,357 on sales of the Fund's Class A shares and net CDSC fees of $40, $37,832 and $2,372 on Class A, Class B and Class C shares redemptions, respectively.
The Fund has adopted distribution and shareholder servicing plans (the "Plans") pursuant to Rule 12b-1 under the 1940 Act, which require the payment of distribution and service fees. The Plans require the payment of a monthly service fee to the Distributor equal at the annual rate of 0.25% of the average daily net assets attributable to Class A, Class B and Class C shares of the Fund. The Plans also require the payment of a monthly distribution fee to the Distributor at the annual rate of 0.75% of the average daily net assets attributable to Class B and Class C shares only. The Distributor has voluntarily agreed to waive a portion of the distribution fee for Class C shares so that the fee will not exceed 0.60% annually of Class C shares average daily net assets. This arrangement may be modified or terminated by the Distributor at any time.
35
Columbia High Yield Opportunity Fund, May 31, 2009
The CDSC and the distribution fees received from the plans are used principally as repayment to the Distributor for amounts paid by the Distributor to dealers who sold such shares.
Fee Waivers and Expense Reimbursements
Columbia has contractually agreed to bear a portion of the Fund's expenses through September 30, 2009, so that the Fund's ordinary operating expenses (excluding any distribution and service fees, brokerage commissions, interest, taxes and extraordinary expenses, but including custodial charges relating to overdrafts, if any), after giving effect to any balance credits from the Fund's custodian, do not exceed 0.87% of the Fund's average daily net assets on an annualized basis.
Effective October 1, 2009, Columbia will voluntarily reimburse a portion of the Fund's expenses so that the Fund's ordinary operating expenses (excluding any distribution and service fees, brokerage commissions, interest, taxes and extraordinary expenses, but including custodial charges relating to overdrafts, if any), after giving effect to any balance credits from the Fund's custodian, will not exceed 0.80% annually of the Fund's average daily net assets.
Fees Paid to Officers and Trustees
All officers of the Fund are employees of Columbia or its affiliates and, with the exception of the Fund's Chief Compliance Officer, receive no compensation from the Fund. The Board of Trustees has appointed a Chief Compliance Officer to the Fund in accordance with federal securities regulations. The Fund, along with other affiliated funds, pays its pro-rata share of the expenses associated with the Chief Compliance Officer. The Fund's expenses for the Chief Compliance Officer will not exceed $15,000 per year.
The Trust's eligible Trustees may participate in a deferred compensation plan which may be terminated at any time. Obligations of the plan will be paid solely out of the Fund's assets.
Note 5. Custody Credits
The Fund has an agreement with its custodian bank under which custody fees may be reduced by balance credits. These credits are recorded as part of expense reductions on the Statement of Operations. The Fund could have invested a portion of the assets utilized in connection with the expense offset arrangement in an income-producing asset if it had not entered into such an agreement.
For the year ended May 31, 2009, these custody credits reduced total expenses by $327 for the Fund.
Note 6. Derivative Instruments
Derivatives not accounted for as hedging instruments under Statement 133:
| | | Fair Value of Derivative Instruments | |
| | | Asset | | Liability | |
| | | Statement of
Assets and
Liabilities
Location | | Fair
Value | | Statement of
Assets and
Liabilities
Location | | Fair
Value | |
Forward foreign currency exchange contracts
| | Unrealized
appreciation on
forward foreign
currency exchange
contract | |
$5,698 | | Unrealized
depreciation on
forward foreign
currency exchange
contract | |
$87,694 | |
| Total | | | | $5,698 | | | | $87,694 | |
36
Columbia High Yield Opportunity Fund, May 31, 2009
| | | Amount of Realized Gain or (Loss)
on Derivatives Recognized in Income | |
| | | Credit Default
Swap Contracts | | Forward Foreign
Currency Exchange
Contracts | | Total | |
| Net realized gain (loss) on credit default swap contracts | | $ | (1,087,544 | ) | | $ | — | | | $ | (1,087,544 | ) | |
| Net realized gain (loss) on foreign currency transactions | | | — | | | | 698,877 | | | | 698,877 | | |
| Total | | $ | (1,087,544 | ) | | $ | 698,877 | | | $ | (388,667 | ) | |
| | | Change in Unrealized Appreciation or (Depreciation)
on Derivatives Recognized in Income | |
| | | Credit Default
Swap Contracts | | Forward Foreign
Currency Exchange
Contracts | | Total | |
Net change in unrealized appreciation (depreciation) on
credit default swap contracts | | $ | 67,808 | | | $ | — | | | $ | 67,808 | | |
Net change in unrealized appreciation (depreciation) on
foreign currency translations | | | — | | | | (119,983 | ) | | | (119,983 | ) | |
| Total | | $ | 67,808 | | | $ | (119,983 | ) | | $ | (52,175 | ) | |
Note 7. Portfolio Information
For the year ended May 31, 2009, the cost of purchases and proceeds from sales of securities, excluding short-term obligations, for the Fund were $134,815,286 and $126,444,448, respectively.
Note 8. Regulatory Settlements
As of May 31, 2009, the Fund had received payments of $821,549 relating to certain regulatory settlements the Fund had participated in during the year. The payments have been included in "Increase from regulatory settlements" on the Statement of Changes in Net Assets.
Note 9. Line of Credit
The Fund and other affiliated funds participate in a $280,000,000 committed, unsecured revolving line of credit provided by State Street. The maximum amount that may be borrowed by any fund is limited to the lesser of $200,000,000 and the Fund's borrowing limit set forth in the Fund's registration statement. Borrowings are available for short-term liquidity or temporary or emergency purposes.
Interest is charged to each participating fund based on the fund's borrowings at a rate per annum equal to the greater of the Federal Funds Rate plus 0.50% or the overnight LIBOR Rate plus 0.50%. In addition, an annual operations agency fee of $20,000, an amendment fee of 0.02% and a commitment fee of 0.12% per annum are accrued and apportioned among the participating funds pro rata based on their relative net assets. Prior to October 16, 2008, the Fund and other affiliated funds participated in a $350,000,000 committed, unsecured revolving line of credit and a $150,000,000 uncommitted, unsecured line of credit, both provided by State Street. Interest on the committed line of credit was charged to each participating fund based on the fund's borrowings at a rate per annum equal to the Federal Funds Rate plus 0.50%. In addition, a commitment fee of 0.10% per annum was accrued and apportioned among the participating funds pro rata based on their relative net assets. Interest on the uncommitted line of credit was charged to each participating fund based on the fund's borrowings at a rate per annum equal to the Federal
37
Columbia High Yield Opportunity Fund, May 31, 2009
Funds Rate plus 0.375%. State Street charged an annual operations agency fee of $40,000 for the committed line of credit and was able to charge an annual administration fee of $15,000 for the uncommitted line of credit. The commitment fee, the operations agency fee and the administration fee were accrued and apportioned among the participating funds pro rata based on their relative net assets.
For the year ended May 31, 2009, the Fund did not borrow under these arrangements.
Note 10. Shares of Beneficial Interest
As of May 31, 2009, 29.6% of the Fund's shares outstanding were beneficially owned by one participant account over which BOA and/or any of its affiliates had either sole or joint investment discretion.
Subscription and redemption activity in this account may have a significant effect on the operations of the Fund.
Note 11. Significant Risks and Contingencies
Sector Focus Risk
The Fund may focus its investments in certain sectors, subjecting it to greater risk than a fund that is less focused.
High-Yield Securities Risk
Investing in high-yield securities may involve greater credit risk and considerations not typically associated with investing in U.S. Government bonds and other higher quality fixed income securities. These securities are non-investment grade securities, often referred to as "junk" bonds. Economic downturns may disrupt the high yield market and impair the ability of issuers to repay principal and interest. Also, an increase in interest rates would likely have an adverse impact on the value of such obligations. Moreover, high-yield securities may be less liquid to the extent that there is no established secondary market.
Foreign Securities Risk
There are certain additional risks involved when investing in foreign securities. These risks may involve foreign currency exchange rate fluctuations, adverse political and economic developments and the possible prevention of currency exchange or other foreign governmental laws or restrictions. In addition, the liquidity of foreign securities may be more limited than that of domestic securities.
Legal Proceedings
Columbia Management Advisors, LLC and Columbia Management Distributors, Inc. (collectively, the "Columbia Group") are subject to a settlement agreement with the New York Attorney General ("NYAG") (the "NYAG Settlement") and a settlement order with the SEC (the "SEC Order") on matters relating to mutual fund trading, each dated February 9, 2005. Under the terms of the SEC Order, the Columbia Group (or predecessor entities) agreed, among other things, to: pay disgorgement and civil money penalties collectively totaling $140 million; cease and desist from violations of the antifraud provisions and certain other provisions of the federal securities laws; maintain certain compliance and ethics oversight structures; and retain an independent consultant to review the Columbia Group's applicable supervisory, compliance, control and other policies and procedures. The NYAG Settlement, among other things, requires Columbia Management Advis ors, LLC and its affiliates to reduce management fees for certain funds in the Columbia family of mutual funds in a projected total of $160 million over five years through November 30, 2009 and to make certain disclosures to investors relating to expenses. In connection with the Columbia Group providing services to the Columbia Funds, the Columbia Funds have voluntarily undertaken to implement certain governance measures designed to maintain the independence of their boards of trustees and certain special consulting and compliance measures.
Pursuant to the SEC Order and related procedures, the $140 million in settlement amounts described above has been substantially distributed in accordance with a distribution plan that was developed by an independent distribution consultant and approved by the SEC on April 6, 2007.
In connection with the events described above, various parties have filed suit against certain funds, the Trustees of the Columbia Funds, FleetBoston Financial Corporation and its affiliated entities and/or Bank of America and its affiliated entities.
38
Columbia High Yield Opportunity Fund, May 31, 2009
On February 20, 2004, the Judicial Panel on Multidistrict Litigation transferred these cases and cases against other mutual fund companies based on similar allegations to the United States District Court in Maryland for consolidated or coordinated pretrial proceedings (the "MDL"). Subsequently, additional related cases were transferred to the MDL. On September 29, 2004, the plaintiffs in the MDL filed amended and consolidated complaints. One of these amended complaints is a putative class action that includes claims under the federal securities laws and state common law, and that names Columbia Management Advisors, Inc. (which has since merged into Banc of America Capital Management, LLC (now named Columbia Management Advisors, LLC)) ("Columbia"), Columbia Funds Distributor, Inc. (now named Columbia Management Distributors, Inc.) (the "Distributor"), the Trustees of the Columbia Funds, Bank of America Corporation and others as d efendants. Another of the amended complaints is a derivative action purportedly on behalf of the Columbia Funds that asserts claims under federal securities laws and state common law.
On February 25, 2005, Columbia and other defendants filed motions to dismiss the claims in the pending cases. On March 1, 2006, for reasons stated in the court's memoranda dated November 3, 2005, the United States District Court for the District of Maryland granted in part and denied in part the defendants' motions to dismiss. The court dismissed all of the class action claims pending against the Columbia Funds Trusts. As to Columbia and the Distributor, the claims under the Securities Act of 1933, the claims under Sections 34(b) and 36(a) of the Investment Company Act of 1940 ("ICA") and the state law claims were dismissed. The claims under Sections 10(b) and 20(a) of the Securities Exchange Act of 1934 and claims under Section 36(b) of the ICA were not dismissed.
On March 21, 2005, a purported class action was filed in Massachusetts state court alleging that certain conduct, including market timing, entitled Class B shareholders in certain Columbia Funds to an exemption from contingent deferred sales charges upon early redemption (the "CDSC Lawsuit"). The CDSC Lawsuit was removed to federal court in Massachusetts and transferred to the MDL.
On September 14, 2007, the plaintiffs and the Columbia defendants named in the MDL, including the Columbia Funds, entered into a stipulation of settlement with respect to all Columbia-related claims in the MDL described above, including the CDSC Lawsuit. The settlement is subject to court approval.
Note 12. Business Combinations and Mergers
As of March 24, 2008, High Yield Fund, a series of Excelsior Funds Trust merged into Columbia High Yield Opportunity Fund. Columbia High Yield Opportunity Fund received a tax-free transfer of assets from High Yield Fund as follows:
Class Z Shares
Issued | | Net Assets
Received | | Unrealized
Appreciation* | |
| | 16,005,215 | | | $ | 64,553,210 | | | $ | 4,926,140 | | |
Net Assets
of Columbia
High Yield
Opportunity Fund
Prior to
Combination | | Net Assets
of High Yield
Fund
Immediately
Prior to
Combination | | Net Assets
of Columbia
High Yield
Opportunity Fund
Immediately
After
Combination | |
| $ | 376,627,791 | | | $ | 64,553,210 | | | $ | 441,181,001 | | |
* Unrealized appreciation is included in the Net Assets Received.
39
Report of Independent Registered Public Accounting Firm
To the Trustees of Columbia Funds Series Trust I and the Shareholders of Columbia High Yield Opportunity Fund
In our opinion, the accompanying statement of assets and liabilities, including the investment portfolio, and the related statements of operations and of changes in net assets and the financial highlights present fairly, in all material respects, the financial position of Columbia High Yield Opportunity Fund (the "Fund")(a series of Columbia Funds Series Trust I) at May 31, 2009, the results of its operations for the year then ended, the changes in its net assets for each of the two years in the period then ended and the financial highlights for each of the five years in the period then ended, in conformity with accounting principles generally accepted in the United States of America. These financial statements and financial highlights (hereafter referred to as "financial statements") are the responsibility of the Fund's management. Our responsibility is to express an opinion on these financial statements based on our audits. We conducted our audits of these financial statements in accordance with the standards of the Public Company Accounting Oversight Board (United States). Those standards require that we plan and perform the audit to obtain reasonable assurance about whether the financial statements are free of material misstatement. An audit includes examining, on a test basis, evidence supporting the amounts and disclosures in the financial statements, assessing the accounting principles used and significant estimates made by management, and evaluating the overall financial statement presentation. We believe that our audits, which included confirmation of securities at May 31, 2009 by correspondence with the custodian and brokers, provide a reasonable basis for our opinion.
PricewaterhouseCoopers LLP
Boston, Massachusetts
July 21, 2009
40
Fund Governance
The Trustees serve terms of indefinite duration. The names, addresses and ages of the Trustees and officers of the Funds in the Columbia Funds Series Trust I, the year each was first elected or appointed to office, their principal business occupations during at least the last five years, the number of Funds overseen by each Trustee and other directorships they hold are shown below. Each officer listed below serves as an officer of each Fund in the Columbia Funds Complex.
Independent Trustees
Name, Address and Year of Birth,
Position with Funds, Year First
Elected or Appointed to Office | | Principal Occupation(s) During Past Five Years, Number of Funds in Columbia
Funds Complex Overseen by Trustee, Other Directorships Held
| |
| John D. Collins (Born 1938) | |
|
c/o Columbia Management
Advisors, LLC
One Financial Center
Boston, MA 02111
Trustee (since 2007) | | Retired. Consultant, KPMG, LLP (accounting and tax firm) from July 1999 to June 2000; Partner, KPMG, LLP from March 1962 to June 1999. Oversees 79; Mrs. Fields Famous Brands LLC (consumer products); Suburban Propane Partners, L.P.; and Montpelier Re (underwriting firm) | |
|
| Rodman L. Drake (Born 1943) | |
|
c/o Columbia Management
Advisors, LLC
One Financial Center
Boston, MA 02111
Trustee (since 2007) and Chairman of the Board (since 2009) | | Co-Founder of Baringo Capital LLC (private equity) since 2002; President, Continuation Investments Group, Inc. from 1997 to 2001. Oversees 79; Jackson Hewitt Tax Service Inc. (tax preparation services); Crystal Capital River Inc. (real estate investment trust); Student Loan Corporation (student loan provider); Celgene Corporation (global biotechnology company); Apex Silver Mines Ltd. (mining); and Helios Total Return Fund, Inc. and Helios Strategic Mortgage Income Fund, Inc. (exchange-traded funds) | |
|
| Douglas A. Hacker (Born 1955) | |
|
c/o Columbia Management
Advisors, LLC
One Financial Center
Boston, MA 02111
Trustee (since 1996) | | Independent business executive since May 2006; Executive Vice President—Strategy of United Airlines (airline) from December 2002 to May 2006; President of UAL Loyalty Services (airline marketing company) from September 2001 to December 2002; Executive Vice President and Chief Financial Officer of United Airlines from July 1999 to September 2001. Oversees 79; Nash Finch Company (food distributor); Aircastle Limited (aircraft leasing) | |
|
| Janet Langford Kelly (Born 1957) | |
|
c/o Columbia Management
Advisors, LLC
One Financial Center
Boston, MA 02111
Trustee (since 1996) | | Senior Vice President, General Counsel and Corporate Secretary, ConocoPhillips (integrated energy company) since September 2007; Deputy General Counsel—Corporate Legal Services, ConocoPhillips from August 2006 to August 2007; Partner, Zelle, Hofmann, Voelbel, Mason & Gette LLP (law firm) from March 2005 to July 2006; Adjunct Professor of Law, Northwestern University, from September 2004 to June 2006; Director, UAL Corporation (airline) from February 2006 to July 2006; Oversees 79; None | |
|
| Charles R. Nelson (Born 1942) | |
|
c/o Columbia Management Advisors, LLC
One Financial Center
Boston, MA 02111
Trustee (since 1981) | | Professor of Economics, University of Washington, since January 1976; Ford and Louisa Van Voorhis Professor of Political Economy, University of Washington, since September 1993; Adjunct Professor of Statistics, University of Washington, since September 1980; Associate Editor, Journal of Money Credit and Banking from 1993 to 2008; Consultant on econometric and statistical matters. Oversees 79; None | |
|
41
Fund Governance (continued)
Independent Trustees (continued)
Name, Address and Year of Birth,
Position with Funds, Year First
Elected or Appointed to Office | | Principal Occupation(s) During Past Five Years, Number of Funds in Columbia
Funds Complex Overseen by Trustee, Other Directorships Held
| |
| John J. Neuhauser (Born 1943) | |
|
c/o Columbia Management
Advisors, LLC
One Financial Center
Boston, MA 02111
Trustee (since 1985) | | President, Saint Michael's College, since August 2007; University Professor, Boston College from November 2005 to August 2007; Academic Vice President and Dean of Faculties, Boston College from August 1999 to October 2005. Oversees 79; Liberty All-Star Equity Fund and Liberty All-Star Growth Fund, Inc. (closed-end funds) | |
|
| Jonathan Piel (Born 1938) | |
|
c/o Columbia Management
Advisors, LLC
One Financial Center
Boston, MA 02111
Trustee (since 2007) | | Cable television producer and website designer; The Editor, Scientific American from 1984 to 1994; Vice President, Scientific American, Inc., from 1984 to 1994; Member, Advisory Board, Stone Age Institute, Bloomington, Indiana (research institute that explores the effect of technology on human evolution); Member, Board of Directors of the National Institute of Social Sciences, New York City; Member, Board of Trustees of the William Alanson White Institute, New York City (institution for training psychoanalysts); and Member, Advisory Board, Mount Sinai Children's Environmental Health Center, New York. Oversees 79; None | |
|
| Patrick J. Simpson (Born 1944) | |
|
c/o Columbia Management
Advisors, LLC
One Financial Center
Boston, MA 02111
Trustee (since 2000) | | Partner, Perkins Coie LLP (law firm). Oversees 79; None | |
|
| Thomas C. Theobald (Born 1937) | |
|
c/o Columbia Management
Advisors, LLC
One Financial Center
Boston, MA 02111
Trustee (since 1996) | | Partner and Senior Advisor, Chicago Growth Partners (private equity investing) since September 2004; Managing Director, William Blair Capital Partners (private equity investing) from September 1994 to September 2004. Oversees 79; Anixter International (network support equipment distributor); Ventas, Inc. (real estate investment trust); Jones Lang LaSalle (real estate management services); Ambac Financial Group (financial guaranty insurance) | |
|
| Anne-Lee Verville (Born 1945) | |
|
c/o Columbia Management
Advisors, LLC
One Financial Center
Boston, MA 02111
Trustee (since 1998) | | Retired since 1997 (formerly General Manager–Global Education Industry (from 1994 to 1997), President–Application Systems Division (from 1991 to 1994), Chief Financial Officer–US Marketing & Services (from 1988 to 1991), and Chief Information Officer (from 1987 to 1988), IBM Corporation (computer and technology)). Oversees 79; None | |
|
42
Fund Governance (continued)
Interested Trustee
Name, Address and Year of Birth,
Position with Funds, Year First
Elected or Appointed to Office | | Principal Occupation(s) During Past Five Years, Number of Funds in Columbia
Funds Complex Overseen by Trustee, Other Directorships Held
| |
| William E. Mayer1 (Born 1940) | |
|
c/o Columbia Management
Advisors, LLC
One Financial Center
Boston, MA 02111
Trustee (since 1994) | | Partner, Park Avenue Equity Partners (private equity) since February 1999; Dean and Professor, College of Business, University of Maryland from 1992 to 1997. Oversees 79; Lee Enterprises (print media); WR Hambrecht + Co. (financial service provider); BlackRock Kelso Capital Corporation (investment company) | |
|
1 Mr. Mayer is deemed to be an "interested person" (as defined in the Investment Company Act of 1940) by reason of his affiliation with WR Hambrecht + Co., a registered broker/dealer that may execute portfolio transactions for or engage in principal transactions with the Funds or other funds or accounts advised/managed by the Advisor or other Bank of America affiliates.
The Statement of Additional Information includes additional information about the Trustees of the Funds and is available, without charge, upon request by calling 1-800-345-6611.
Officers
Name, Address and Year of Birth,
Position with Funds, Year First
Elected or Appointed to Office | | Principal Occupation(s) During Past Five Years | |
| J. Kevin Connaughton (Born 1964) | |
|
One Financial Center
Boston, MA 02111
President (since 2009) | | Managing Director of Columbia Management Advisors, LLC since December 2004; Senior Vice President and Chief Financial Officer–Columbia Funds, from June 2008 to January 2009; Treasurer–Columbia Funds, from October 2003 to May 2008; Treasurer–the Liberty Funds, Stein Roe Funds and Liberty All-Star Funds, December 2000–December 2006; Senior Vice President–Columbia Management Advisors, LLC, from April 2003 to December 2004; President–Columbia Funds, Liberty Funds and Stein Roe Funds, February 2004 to October 2004; Treasurer–Galaxy Funds, September 2002 to December 2005; Treasurer, December 2002 to December 2004, and President, February 2004 to December 2004–Columbia Management Multi-Strategy Hedge Fund, LLC; and a senior officer of various other Bank of America-affiliated entities, including other registered and unregistered funds. | |
|
| James R. Bordewick, Jr. (Born 1959) | |
|
One Financial Center
Boston, MA 02111
Senior Vice President, Secretary and
Chief Legal Officer (since 2006) | | Associate General Counsel, Bank of America since April 2005; Senior Vice President and Associate General Counsel, MFS Investment Management (investment management) prior to April 2005. | |
|
| Linda J. Wondrack (Born 1964) | |
|
One Financial Center
Boston, MA 02111
Senior Vice President and Chief
Compliance Officer (since 2007) | | Director (Columbia Management Group LLC and Investment Product Group Compliance), Bank of America since June 2005; Director of Corporate Compliance and Conflicts Officer, MFS Investment Management (investment management), August 2004 to May 2005; Managing Director, Deutsche Asset Management (investment management) prior to August 2004. | |
|
43
Fund Governance (continued)
Officers (continued)
Name, Address and Year of Birth,
Position with Funds, Year First
Elected or Appointed to Office | | Principal Occupation(s) During Past Five Years | |
| Michael G. Clarke (Born 1969) | |
|
One Financial Center
Boston, MA 02111
Senior Vice President and Chief
Financial Officer (since 2009) | | Director of Fund Administration of the Advisor since January 2006; Managing Director of the Advisor September 2004 to December 2005; Vice President Fund Administration June 2002 to September 2004. | |
|
| Jeffrey R. Coleman (Born 1969) | |
|
One Financial Center
Boston, MA 02111
Deputy Treasurer (since 2006) | | Director of Fund Administration of the Advisor since January 2006; Fund Controller of the Advisor from October 2004 to January 2006; Vice President of CDC IXIS Asset Management Services, Inc. (investment management) from August 2000 to September 2004. | |
|
| Joseph F. DiMaria (Born 1968) | |
|
One Financial Center
Boston, MA 02111
Chief Accounting Officer and
Treasurer (since 2009) | | Director of Fund Administration of the Advisor since January 2006; Head of Tax/Compliance and Assistant Treasurer of the Advisor from November 2004 to December 2005; Director of Trustee Administration (Sarbanes-Oxley) of the Advisor from May 2003 to October 2004. | |
|
| Julian Quero (Born 1967) | |
|
One Financial Center
Boston, MA 02111
Deputy Treasurer (since 2008) | | Senior Tax Manager of the Advisor since August 2006; Senior Compliance Manager of the Advisor from April 2002 to August 2006. | |
|
| Barry S. Vallan (Born 1969) | |
|
One Financial Center
Boston, MA 02111
Controller (since 2006) | | Vice President–Fund Treasury of the Advisor since October 2004; Vice President–Trustee Reporting of the Advisor from April 2002 to October 2004 | |
|
| Stephen T. Welsh (Born 1957) | |
|
One Financial Center
Boston, MA 02111
Vice President (since 1996) | | President, Columbia Management Services, Inc. since July 2004; Senior Vice President and Controller, Columbia Management Services, Inc. prior to July 2004. | |
|
44
Important Information About This Report
The fund mails one shareholder report to each shareholder address. If you would like more than one report, please call shareholder services at 1-800-345-6611 and additional reports will be sent to you. This report has been prepared for shareholders of Columbia High Yield Opportunity Fund.
A description of the policies and procedures that the fund uses to determine how to vote proxies and a copy of the fund's voting records are available (i) at www.columbiamanagement.com; (ii) on the Securities and Exchange Commission's website at www.sec.gov, and (iii) without charge, upon request, by calling 1-800-368-0346. Information regarding how the fund voted proxies relating to portfolio securities during the 12-month period ended June 30 is available from the SEC's website. Information regarding how the fund voted proxies relating to portfolio securities is also available from the fund's website, www.columbiamanagement.com.
The fund files a complete schedule of portfolio holdings with the SEC for the first and third quarters of each fiscal year on Form N-Q. The fund's Form N-Q is available on the SEC's website at www.sec.gov and may be reviewed and copied at the SEC's Public Reference Room in Washington, DC. Information on the operation of the Public Reference Room may be obtained by calling 1-800-SEC-0330.
Please read and consider the investment objectives, risks, charges and expenses for any fund carefully before investing. For a prospectus which contains this and other important information about the fund, contact your Columbia Management representative or financial advisor or go to www.columbiamanagement.com.
Columbia Management Group, LLC ("Columbia Management") is the investment management division of Bank of America Corporation. Columbia Management entities furnish investment management services and products for institutional and individual investors. Columbia Funds are distributed by Columbia Management Distributors, Inc., member of FINRA, SIPC, part of Columbia Management and an affiliate of Bank of America Corporation.
| Transfer Agent | |
|
Columbia Management Services, Inc.
P.O. Box 8081
Boston, MA 02266-8081
1-800-345-6611 | |
|
| Distributor | |
|
Columbia Management
Distributors, Inc.
One Financial Center
Boston, MA 02111 | |
|
| Investment Advisor | |
|
Columbia Management Advisors, LLC
100 Federal Street
Boston, MA 02110 | |
|
45
Columbia Management®
One Financial Center
Boston, MA 02111-2621
PRSRT STD
U.S. Postage
PAID
Holliston, MA
Permit NO. 20
Columbia Management®
Columbia High Yield Opportunity Fund
Annual Report, May 31, 2009
©2009 Columbia Management Distributors, Inc.
One Financial Center, Boston, MA 02111-2621
800-345-6611 www.columbiafunds.com
SHC-42/16717-0509 (07/09) 09/82449

Annual Report
May 31, 2009
Columbia International Bond Fund
| | |
| NOT FDIC INSURED | | May Lose Value |
| NOT BANK ISSUED | | No Bank Guarantee |
Table of Contents
The views expressed in this report reflect the current views of the respective parties. These views are not guarantees of future performance and involve certain risks, uncertainties and assumptions that are difficult to predict, so actual outcomes and results may differ significantly from the views expressed. These views are subject to change at any time based upon economic, market or other conditions and the respective parties disclaim any responsibility to update such views. These views may not be relied on as investment advice and, because investment decisions for a Columbia Fund are based on numerous factors, may not be relied on as an indication of trading intent on behalf of any particular Columbia Fund. References to specific securities should not be construed as a recommendation or investment advice.
President’s Message

Dear Shareholder:
Recent events have shown great volatility in the markets and uncertainty in the economy. During these challenging times, it becomes even more important to focus on long-term horizons and key investment tools that can help manage volatility. This may be the time to reflect on your investment goals and evaluate your portfolio to ensure you are positioned for any potential market rebound.
A long-term financial plan can serve as a road map and guide you through the necessary steps designed to meet your financial goals. Your financial plan should take into account your investment goals, time horizon, overall financial situation, risk tolerance and willingness to ride out market volatility. Your investment professional can be a key resource as you work through this process. The knowledge and experience of an investment professional can help as you create or reevaluate your investment strategy.
The importance of diversification
Although diversification does not ensure a profit or guarantee against loss, a diversified portfolio can be a strategy for successful long-term investing. Diversification refers to the mix of investments within a portfolio. A mutual fund can contribute to portfolio diversification given that a mutual fund’s portfolio represents several investments. Additionally, the way you allocate your money among stocks, bonds and cash, and geographically between foreign and domestic investments, can help to reduce risks. Diversification can result in multiple investments where the positive performance of certain holdings can offset any negative performance from other holdings. Having a diversified portfolio doesn’t mean that the value of the portfolio will never go down, but rather helps strike a balance between risk and reward.
Reevaluate your strategy
An annual review of your investments is a key opportunity to determine if your investment needs have changed or if you need minor adjustments to rebalance your portfolio. Life events like a birth, marriage, home improvement, or change in employment can have a major effect on your spending and goals. Ask yourself how your spending or goals have changed and factor this into your financial plan. Are you using automated investments or payroll deductions to help keep your savings on track? Are you able to set aside additional savings or increase your 401(k) plan contributions? If during your review you find that your investments in any one category (e.g., stocks, bonds or cash) have grown too large based on your diversification plan, you may want to consider redirecting future investments to get back on track.
History has shown that the U.S. stock market has been remarkably resilient.¹ Volatility can lead to opportunity. Patience and a commitment to your long-term financial plan may position you to potentially benefit over your investment horizon. We appreciate your business and continued support of Columbia Funds.
Sincerely,

J. Kevin Connaughton
President, Columbia Funds
| 1 | The Dow Jones Industrial Average is the most widely used indicator of the overall condition of the stock market. The Dow Jones Industrial Average Index is a price-weighted average of 30 actively traded blue-chip stocks as selected by the editors of the Wall Street Journal. Indices are not available for investment, and do not reflect sales charges, fees, brokerage commissions, taxes or other expenses of investing. It is not possible to invest directly in an index. |
Fund Profile – Columbia International Bond Fund
Performance data quoted represents past performance and current performance may be lower or higher. Past performance is no guarantee of future results. The investment return and principal value will fluctuate so that shares, when redeemed, may be worth more or less than the original cost. Please visit www.columbiafunds.com for daily and most recent month-end performance updates.
Summary
Life (cumulative) return as of 05/31/09
| | |
| |
 | | +4.35% Class A shares |
| | (without sales charge) |
| |
| | +6.95% Citigroup Non-U.S. World Government Bond Index – Unhedged |
Morningstar Style Box™
Fixed Income Maturity
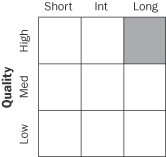
The Morningstar Style Box™ reveals a fund’s investment strategy. For fixed-income funds, the vertical axis shows the average credit quality of the bonds owned, and the horizontal axis shows interest rate sensitivity as measured by a bond’s duration (short, intermediate or long). Information shown is based on the most recent data provided by Morningstar.
Summary
| n | | For the six-month period from its inception on December 1, 2008 through May 31, 2009, the fund’s Class A shares returned 4.35% without sales charge. |
| n | | The fund underperformed its benchmark, the Citigroup Non-U.S. World Government Bond Index-Unhedged1 and its peer group, the Lipper International Income Funds Classification.2 |
| n | | An underweight in European government debt and euro currency exposure hampered returns versus the Citigroup Index, while we believe that a below-average weight in emerging market debt cost the fund relative to its peer group. |
Portfolio Management
Laura A. Ostrander has managed the fund since its inception in December 2008 and has been associated with the advisor or its predecessors since 1996.
| 1 | The Citigroup Non-U.S. World Government Bond Index-Unhedged is calculated on a market-weighted basis and includes all fixed-rate bonds with a remaining maturity of one year or longer and with amounts outstanding of at least the equivalent of U.S. $25 million. The index excludes floating or variable rate bonds, securities aimed principally at non-institutional investors and private placement-type securities. Indices are not available for investment, and do not reflect sales charges, fees, brokerage commissions, taxes or other expenses of investing. Securities in the fund may not match those in an index. |
| 2 | Lipper Inc., a widely respected data provider in the industry, calculates an average total return (assuming reinvestment of distributions) for mutual funds with investment objectives similar to those of the fund. Lipper makes no adjustments for the effect of sales loads. |
1
Economic Update – Columbia International Bond Fund
Summary
For the 6-month period that ended May 31, 2009
| | n | | Bond markets across the world gained ground, as measured by the Barclays Capital U.S. Aggregate Bond Index and the Citigroup Non-U.S. World Government Bond Index-Unhedged. | |
| | |
| Barclays Index | | Citigroup Index |
| |

| |
|
5.10% | | 6.95% |
The pace of economic growth slowed around the world during the six-month period that began December 1, 2008 and ended May 31, 2009. Most major developed economies slipped into recession late in 2007 or early in 2008, with little relief in sight. In the United States, the downturn was even sharper than anticipated. First quarter 2009 growth was reported at negative 5.5%, on the heels of the worst quarter on record for the U.S. economy since 1982. The United Kingdom, Germany, Japan, South Korea and Singapore are also in recession. Although emerging markets have largely avoided recession, the global slowdown has taken the steam out of their economic growth as exports to developed markets fell off sharply.
Global financial system entangled
Fallout from troubles that began in the U.S. subprime mortgage market spread across Europe and continued to entangle the world’s financial systems. A meltdown within the U.S. financial sector claimed several major institutions in 2008 and led others to seek bailouts, restructuring or both. Central banks around the world stepped in to infuse liquidity as credit dried up. In the first half of 2009, conditions eased, but more rigorous lending standards have severely limited access to credit in both developed and emerging markets, further hampering economic growth.
In the United States, unemployment rose sharply over the six-month period, putting pressure on consumer spending. Western Europe and Japan, which rely heavily on exports, have experienced sharp declines in export trade. A weak housing market prevails in the United States and the United Kingdom. Even China’s economy has exhibited signs of weakness. The pace of annualized growth fell from 13% in 2007 to 6.8% in the last quarter of 2008.1 According to moodys.com, an estimated 20 million jobs have been lost in China and India reported a loss of 3 million jobs in the first half of 2009 due to shrinking exports.
Many central banks have reduced short-term borrowing rates while governments have increased spending in an effort to stimulate economic growth. However, these efforts may not be rewarded until later this year or next. The only other spark in this otherwise dark outlook is that commodity prices generally are down from one year ago, easing one heavy burden on consumer budgets.
2
Economic Update (continued) – Columbia International Bond Fund
Bond markets delivered solid returns
Against this weak economic backdrop, stock markets around the world lost ground while global bond markets delivered solid returns. The Barclays Capital U.S. Aggregate Bond Index2, a broad measure of domestic investment grade bonds, returned 5.10%. The Citigroup Non-U.S. World Government Bond Index-Unhedged3 returned 6.95%, measured in U.S. dollars. After a year of double-digit losses in 2008, high yield bonds bounced back strongly in the U.S. and foreign markets as investors found riskier assets more appealing at lower prices. The JPMorgan Global High Yield Index4 returned 31.70%. Emerging market bonds gained 21.85% as measured by the JPMorgan Emerging Markets Bond Index Global.5
Past performance is no guarantee of future results.
| 1 | UBS Investment Research, Asian Economic Monitor, March 2009. |
| 2 | The Barclays Capital U.S. Aggregate Bond Index is a market value-weighted index that tracks the daily price, coupon, pay-downs and total return performance of fixed-rate, publicly placed, dollar-denominated and non-convertible investment grade debt issues with at least $250 million par amount outstanding and with at least one year to final maturity. |
| 3 | The Citigroup Non-U.S. World Government Bond Index-Unhedged is calculated on a market-weighted basis and includes all fixed-rate bonds with a remaining maturity of one year or longer and with amounts outstanding of at least the equivalent of U.S. $25 million. The index excludes floating or variable rate bonds, securities aimed principally at non-institutional investors and private placement-type securities. |
| 4 | The JPMorgan Global High Yield Index is designed to mirror the investable universe of the U.S. dollar global high-yield corporate debt market, including domestic and international issues. |
| 5 | The JPMorgan Emerging Markets Bond Index Global (“EMBI Global”) tracks total returns for traded external debt instruments in the emerging markets and is an expanded version of the JPMorgain Emerging Markets Bond Index Plus (“EMBI+”). As with EMBI+, the EMBI Global includes U.S. dollar-denominated Brady bonds, loans and Eurobonds with an outstanding face value of at least $500 million. It covers more of the eligible instruments than the EMBI+ by relaxing somewhat the strict EMBI+ limits on secondary market trading liquidity. |
Indices are not available for investment and do not reflect sales charges, fees, brokerage commissions, taxes or other expenses of investing. Securities in the fund may not match those in an index.
3
Performance Information – Columbia International Bond Fund
Performance data quoted represents past performance and current performance may be lower or higher. Past performance is no guarantee of future results. The investment return and principal value will fluctuate so that shares, when redeemed, may be worth more or less than the original cost. Please visit www.columbiafunds.com for daily and most recent month-end performance updates.
| | |
| Annual operating expense ratio (%)* |
| |
Class A | | 1.97 |
Class C | | 2.72 |
Class Z | | 1.72 |
| | |
Annual operating expense ratio
after contractual waivers (%)* |
| |
Class A | | 1.05 |
Class C | | 1.80 |
Class Z | | 0.80 |
| * | The annual operating expense ratio and annual operating expense ratio after contractual waivers are as stated in the fund’s prospectus that is current as of the date of this report. The contractual waivers expire 09/30/10. Differences in expense ratios disclosed elsewhere in this report may result from including fee waivers and expense reimbursements as well as different time periods used in calculating the ratios. |
|
| Performance of a $10,000 investment 12/01/08 – 05/31/09 |
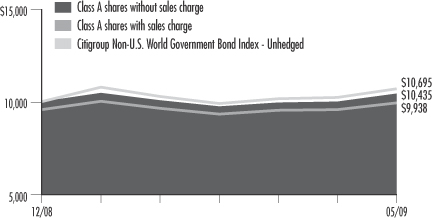
The chart above shows the change in value of a hypothetical $10,000 investment in Class A shares of Columbia International Bond Fund during the stated time period, and does not reflect the deduction of taxes that a shareholder may pay on fund distributions or on the redemption of fund shares. The Citigroup Non-U.S. World Government Bond Index-Unhedged is calculated on a market-weighted basis and includes all fixed-rate bonds with a remaining maturity of one year or longer and with amounts outstanding of at least the equivalent of U.S. $25 million. The index excludes floating or variable rate bonds, securities aimed principally at non-institutional investors and private placement-type securities. Indices are not available for investment, and do not reflect sales charges, fees, brokerage commissions, taxes or other expenses of investing. Securities in the fund may not match those in an index.
| | | | |
| Performance of a $10,000 investment 12/01/08 – 05/31/09 ($) |
| | |
| Sales charge | | without | | with |
Class A | | 10,435 | | 9,938 |
Class C | | 10,397 | | 10,297 |
Class Z | | 10,448 | | n/a |
| | | | | | | | | | |
| Average annual total return as of 05/31/09 (%) |
| | | |
| Share class | | A | | C | | Z |
| Inception | | 12/01/08 | | 12/01/08 | | 12/01/08 |
| Sales charge | | without | | with | | without | | with | | without |
Life (cumulative) | | 4.35 | | –0.62 | | 3.97 | | 2.97 | | 4.48 |
| | | | | | | | | | |
| Average annual total return as of 06/30/09 (%) |
| | | |
| Share class | | A | | C | | Z |
| Sales charge | | without | | with | | without | | with | | without |
Life (cumulative) | | 4.53 | | –0.45 | | 4.09 | | 3.09 | | 4.68 |
The “with sales charge” returns include the maximum initial sales charge of 4.75% for Class A shares and a contingent deferred sales charge of 1.00% for Class C shares for the first year only. The “without sales charge” returns do not include the effect of sales charges. If they had, returns would be lower.
Performance results reflect any fee waivers or reimbursements of fund expenses by the investment advisor and/or any of its affiliates. Absent these fee waivers or expense reimbursement arrangements, performance results would have been lower.
All results shown assume reinvestment of distributions. Class Z shares are sold at net asset value with no distribution and service (Rule 12b-1) fees. Class Z shares have limited eligibility and the investment minimum requirements may vary. Please see the fund’s prospectus for details. Performance for different share classes will vary based on differences in sales charges and fees associated with each class.
The tables do not reflect the deduction of taxes that a shareholder may pay on fund distributions or on the redemption of fund shares.
4
Understanding Your Expenses – Columbia International Bond Fund
Estimating your actual expenses
To estimate the expenses that you paid over the period, first you will need your account balance at the end of the period:
| | n | | For shareholders who receive their account statements from Columbia Management Services, Inc., your account balance is available online at www.columbiafunds.com or by calling Shareholder Services at 800.345.6611. | |
| | n | | For shareholders who receive their account statements from their financial intermediary, contact your financial intermediary to obtain your account balance. | |
| | 1. | Divide your ending account balance by $1,000. For example, if an account balance was $8,600 at the end of the period, the result would be 8.6. | |
| | 2. | In the section of the table below titled “Expenses paid during the period,” locate the amount for your share class. You will find this number in the column labeled “Actual.” Multiply this number by the result from step 1. Your answer is an estimate of the expenses you paid on your account during the period. | |
If the value of your account falls below the minimum initial investment requirement applicable to you, your account generally will be subject to a $20 annual fee. This fee is not included in the accompanying table. If you are subject to the fee, keep it in mind when you are estimating the ongoing expenses of investing in the fund and when comparing the expenses of this fund with other funds.
As a fund shareholder, you incur two types of costs. There are transaction costs, which generally include sales charges on purchases and may include redemption fees or exchange fees. There are also ongoing costs, which generally include investment advisory fees, distribution and service (Rule 12b-1) fees and other fund expenses. The information on this page is intended to help you understand the ongoing costs of investing in the fund and to compare these costs with the ongoing costs of investing in other mutual funds.
Analyzing your fund’s expenses by share class
To illustrate these ongoing costs, we have provided an example and calculated the expenses paid by investors in each share class during the period. The information in the following table is based on an initial investment of $1,000, which is invested at the beginning of the period and held for the entire period. Expense information is calculated two ways and each method provides you with different information. The amount listed in the “Actual” column is calculated using the fund’s actual operating expenses and total return for the period. The amount listed in the “Hypothetical” column for each share class assumes that the return each year is 5% before expenses and is calculated based on the fund’s actual operating expenses. You should not use the hypothetical account values and expenses to estimate either your actual account balance at the end of the period or the expenses you paid during this period.
Compare with other funds
Since all mutual funds are required to include the same hypothetical calculations about expenses in shareholder reports, you can use this information to compare the ongoing costs of investing in the fund with other funds. To do so, compare the 5% hypothetical example with the 5% hypothetical examples that appear in the shareholder reports of other funds. As you compare hypothetical examples of other funds, it is important to note that hypothetical examples are meant to highlight the ongoing costs of investing in a fund and do not reflect any transaction costs, such as sales charges, redemption fees or exchange fees.
| | | | | | | | | | | | | | |
| | | | |
| | | Account value at the
beginning of the period ($) | | Account value at the
end of the period ($) | | Expenses paid
during the period ($) | | Fund’s annualized
expense ratio (%) |
| | | Actual | | Hypothetical | | Actual | | Hypothetical | | Actual | | Hypothetical | | Actual |
Class A | | 1,000.00 | | 1,000.00 | | 1,043.48 | | 1,019.70 | | 5.35 | | 5.29 | | 1.05 |
Class C | | 1,000.00 | | 1,000.00 | | 1,039.69 | | 1,015.96 | | 9.15 | | 9.05 | | 1.80 |
Class Z | | 1,000.00 | | 1,000.00 | | 1,044.78 | | 1,020.94 | | 4.08 | | 4.03 | | 0.80 |
Expenses paid during the period are equal to the annualized expense ratio for the share class, multiplied by the average account value over the period, then multiplied by the number of days in the fund’s most recent fiscal half-year and divided by 365.
Had the investment advisor and/or any of its affiliates not waived fees or reimbursed a portion of expenses, account value at the end of the period would have been reduced.
It is important to note that the expense amounts shown in the table are meant to highlight only ongoing costs of investing in the fund and do not reflect any transaction costs, such as sales charges, redemption fees or exchange fees. Therefore, the hypothetical examples provided may not help you determine the relative total costs of owning shares of different funds. If these transaction costs were included, your costs would have been higher.
5
Portfolio Manager’s Report – Columbia International Bond Fund
Performance data quoted represents past performance and current performance may be lower or higher. Past performance is no guarantee of future results. The investment return and principal value will fluctuate so that shares, when redeemed, may be worth more or less than the original cost. Please visit www.columbiafunds.com for daily and most recent month-end performance updates.
| | |
| Net asset value per share |
| |
as of 05/31/09 ($) | | |
Class A | | 10.39 |
Class C | | 10.39 |
Class Z | | 10.39 |
| | |
| Distributions declared per share |
| |
12/01/08 – 05/31/09 ($) | | |
Class A | | 0.04 |
Class C | | 0.01 |
Class Z | | 0.06 |
| | |
| Portfolio structure | | |
| |
as of 05/31/09 (%) | | |
Foreign Government Obligations | | 94.0 |
Cash & Equivalents | | 2.6 |
U.S. Government Obligations | | 2.1 |
Corporate Fixed-Income Bonds & Notes | | 1.2 |
Other Assets & Liabilities, net | | 0.1 |
The fund is actively managed and the composition of its portfolio will change over time. Portfolio structure is calculated as a percentage of net assets.
For the six-month period from inception on December 1, 2008, through May 31, 2009, the fund’s Class A shares returned 4.35% without sales charge. The fund’s benchmark, the Citigroup Non-U.S. World Government Bond Index-Unhedged1 returned 6.95% over the same period. The average return of the fund’s peer group, the Lipper International Income Funds Classification2, was 9.79%. The fund trailed the Citigroup index largely because of an underweight in European government bonds and below-average exposure to the euro. We believe that the fund’s small stake in strong performing emerging market external and local currency debt, as well as an overweight in yen-denominated Japanese bonds, detracted from returns versus the Lipper peer group.
Strongest performance from higher-yielding, lower-rated bonds
During the past six months, investors took on more risk, pushing higher-yielding, lower-rated government bonds ahead of higher quality issues. Emerging market debt posted some of the strongest gains, while government bonds from most other developed markets outperformed U.S. Treasuries. In Europe, lower-rated government bonds, such as those in Italy, Belgium, Greece, Portugal and Spain, outpaced the higher-rated debt of Germany and France. The bond market’s positive returns came even as yields rose across the globe, driven by signs of economic stabilization as well as the U.S. government’s decision to issue massive amounts of debt to restore liquidity in the financial markets. In most cases, currency returns more than compensated for the losses posted by bonds as interest rates rose. Most of the index’s return came from the decline in the U.S. dollar against most other currencies. An exception was the Japanese yen, which weakened against the U.S. dollar during the six-month period.
Lost ground from underweight in Europe
An underweight in European government bonds and the euro was the biggest detractor from performance versus the index. In addition, positioning within Europe was less than optimal. The fund had an overweight in the higher quality core countries of Germany and France, which were weaker performers, and an underweight in some of the better performers, including Italy, Portugal and Greece. A small, out-of-benchmark stake in U.S. Treasuries and U.S. bank bonds guaranteed by the Federal Deposit Insurance Corporation (FDIC) further hampered returns, as did underweights in Canada and the United Kingdom.
Gains from emerging market debt
Approximately 2.6% of assets, an underweight versus the Lipper peer group, were in U.S. dollar denominated emerging market bonds, including issues from Brazil, Mexico, Peru, the Philippines, Turkey and Venezuela. These securities, which were strong performers, aided performance versus the benchmark, which has no emerging market debt, but hampered returns versus the Lipper peer group. By contrast, the fund’s exposure to Japanese government bonds was lower than its benchmark index, which aided performance relative to that measure. In addition, being less sensitive than the index to interest rate changes helped as interest rates rose and bond prices fell.
| 1 | The Citigroup Non-U.S. World Government Bond Index-Unhedged is calculated on a market-weighted basis and includes all fixed-rate bonds with a remaining maturity of one year or longer and with amounts outstanding of at least the equivalent of U.S. $25 million. The index excludes floating or variable rate bonds, securities aimed principally at non-institutional investors and private placement-type securities. Indices are not available for investment, and do not reflect sales charges, fees, brokerage commissions, taxes or other expenses of investing. Securities in the fund may not match those in an index. |
| 2 | Lipper Inc., a widely respected data provider in the industry, calculates an average total return (assuming reinvestment of distributions) for mutual funds with investment objectives similar to those of the fund. Lipper makes no adjustment for the effect of sales loads. |
6
Portfolio Manager’s Report (continued) – Columbia International Bond Fund
| | |
| Quality breakdown |
| |
as of 05/31/09 (%) | | |
AAA | | 60.6 |
AA | | 24.7 |
A | | 8.5 |
BBB | | 0.6 |
BB | | 1.3 |
B | | 0.7 |
Not Rated | | 3.6 |
| | |
| Maturity breakdown |
| |
as of 05/31/09 (%) | | |
0-1 year | | 17.9 |
1-3 years | | 4.9 |
3-5 years | | 22.2 |
5-7 years | | 13.6 |
7-10 years | | 26.5 |
10-15 years | | 3.4 |
15-20 years | | 8.2 |
20-30 years | | 0.7 |
Repurchase Agreement | | 2.6 |
Quality and maturity breakdowns are calculated as a percentage of total investments. Ratings shown in the quality breakdown represent the rating assigned to a particular bond by one of the following nationally-recognized rating agencies: Standard & Poor’s, a division of The McGraw-Hill Companies, Inc., Moody’s Investors Service, Inc. or Fitch Ratings Ltd. Ratings are relative and subjective and are not absolute standards of quality. The fund’s credit quality does not remove market risk.
| | |
| 30-day SEC yields |
| |
as of 05/31/09 (%) | | |
Class A | | 1.35 |
Class C | | 0.67 |
Class Z | | 1.66 |
The 30-day SEC yields reflect the fund’s earning power net of expenses, expressed as an annualized percentage of the public offering price per share at the end of the period.
Moving ahead with caution
Going forward, we plan to look for opportunities to add to emerging market exposure. However, we remain cautious, as the massive yield difference narrowed between emerging market bonds and developed market debt. The flood of money that has come into the bond market has caused yields to narrow to levels that suggest an economic recovery is already underway. The path to economic growth could take some time, given that banks and consumers are still in the midst of repairing their balance sheets, which means that lending and spending are unlikely to pick up in a big way any time soon. We plan to monitor the global economy to determine market allocations but expect to wait for economic prospects to improve further before making significant changes.
Portfolio holdings and characteristics are subject to change periodically and may not be representative of current holdings and characteristics. The outlook for the fund may differ from that presented for other Columbia Funds.
Investing in fixed-income securities may involve certain risks, including the credit quality of individual issuers, possible prepayments, market or economic developments and yield and share price fluctuations due to changes in interest rates. When interest rates go up, bond prices typically drop, and vice versa.
Investments in high-yield bonds (sometimes referred to as “junk” bonds) offer the potential for high current income and attractive total return but involve certain risks. Changes in economic conditions or other circumstances may adversely affect a junk bond issuer’s ability to make principal and interest payments. Rising interest rates tend to lower the value of all bonds. High-yield bonds issued by foreign entities have greater potential risks, including less regulation, currency fluctuations, economic instability and political developments.
International investing may involve certain risks, including currency fluctuations, risks associated with possible differences in financial accounting standards and other monetary and political risks. Significant levels of foreign taxes, including potentially confiscatory levels of taxation and withholding taxes, may also apply to some foreign investments.
Investing in emerging markets may involve greater risks than investing in more developed countries. In addition, concentration of investments in a single region may result in greater volatility.
The fund is non-diversified, which generally means that it may invest a greater percentage of its total assets in the securities of fewer issuers than a “diversified” fund. This increases the risk that a change in the value of any one investment held by the fund could affect the overall value of the fund more than it would affect that of a diversified fund holding a greater number of investments. Accordingly, the fund’s value will likely be more volatile than the value of more diversified funds.
7
Investment Portfolio – Columbia International Bond Fund
May 31, 2009
Government & Agency Obligations – 96.1%
| | | | | | |
| | | | | Par (a) | | Value ($) |
| Foreign Government Obligations – 94.0% |
| African Development Bank |
1.950% 03/23/10 | | JPY | | 40,000,000 | | 424,066 |
|
| Asian Development Bank |
2.350% 06/21/27 | | JPY | | 20,000,000 | | 201,005 |
|
| Eksportfinans A/S |
1.600% 03/20/14 | | JPY | | 26,000,000 | | 257,992 |
|
| Eurofima |
4.375% 10/21/19 | | EUR | | 100,000 | | 140,637 |
|
| European Investment Bank |
1.250% 09/20/12 | | JPY | | 9,000,000 | | 95,135 |
1.400% 06/20/17 | | JPY | | 39,000,000 | | 401,251 |
|
| Federative Republic of Brazil |
8.250% 01/20/34 | | | | 50,000 | | 58,750 |
|
| Federal Republic of Germany |
4.250% 07/04/14 | | EUR | | 280,000 | | 424,704 |
4.250% 07/04/17 | | EUR | | 340,000 | | 508,690 |
|
| Government of Belgium |
3.250% 09/28/16 | | EUR | | 130,000 | | 177,275 |
|
| Government of Canada |
4.000% 06/01/16 | | CAD | | 195,000 | | 190,776 |
|
| Government of Denmark |
5.000% 11/15/13 | | DKK | | 380,000 | | 78,331 |
|
| Government of Japan |
1.400% 12/20/18 | | JPY | | 25,000,000 | | 261,663 |
1.500% 09/20/14 | | JPY | | 34,000,000 | | 367,792 |
1.900% 09/20/23 | | JPY | | 29,000,000 | | 306,482 |
|
| Government of New Zealand |
6.500% 04/15/13 | | NZD | | 105,000 | | 71,839 |
|
| Instituto de Credito Oficial |
0.800% 09/28/09 | | JPY | | 35,000,000 | | 367,535 |
|
| Inter-American Development Bank |
1.900% 07/08/09 | | JPY | | 23,000,000 | | 241,683 |
| |
| International Bank for Reconstruction & Development | | |
4.250% 06/01/10 | | EUR | | 120,000 | | 174,760 |
4.500% 01/25/10 | | GBP | | 60,000 | | 99,284 |
| |
| Japan Finance Organization for Municipal Enterprises | | |
1.900% 06/22/18 | | JPY | | 10,000,000 | | 105,739 |
|
| Kingdom of Netherlands |
4.000% 07/15/16 | | EUR | | 185,000 | | 268,358 |
| | | | | | |
| | | | | Par (a) | | Value ($) |
| Kingdom of Norway |
4.250% 05/19/17 | | NOK | | 240,000 | | 38,596 |
5.000% 05/15/15 | | NOK | | 240,000 | | 40,751 |
|
| Kingdom of Sweden |
3.000% 07/12/16 | | SEK | | 285,000 | | 36,678 |
5.500% 10/08/12 | | SEK | | 275,000 | | 40,168 |
|
| Province of Ontario |
1.875% 01/25/10 | | JPY | | 20,000,000 | | 210,740 |
|
| Province of Quebec |
1.600% 05/09/13 | | JPY | | 9,000,000 | | 89,967 |
|
| Queensland Treasury Corp. |
5.500% 05/14/10 | | AUD | | 100,000 | | 81,852 |
|
| Republic of Finland |
4.250% 07/04/15 | | EUR | | 120,000 | | 177,770 |
|
| Republic of France |
3.500% 07/12/11 | | EUR | | 100,000 | | 146,979 |
4.000% 04/25/13 | | EUR | | 200,000 | | 297,903 |
4.250% 10/25/18 | | EUR | | 180,000 | | 260,904 |
5.500% 04/25/29 | | EUR | | 120,000 | | 190,631 |
|
| Republic of Greece |
4.300% 07/20/17 | | EUR | | 95,000 | | 128,231 |
|
| Republic of Ireland |
4.500% 10/18/18 | | EUR | | 50,000 | | 66,330 |
|
| Republic of Italy |
4.250% 08/01/13 | | EUR | | 105,000 | | 154,841 |
5.250% 08/01/17 | | EUR | | 185,000 | | 282,345 |
|
| Republic of Peru |
8.375% 05/03/16 | | | | 30,000 | | 34,590 |
|
| Republic of Philippines |
8.875% 03/17/15 | | | | 25,000 | | 28,937 |
|
| Republic of Poland |
4.750% 04/25/12 | | PLN | | 160,000 | | 48,906 |
5.625% 06/20/18 | | EUR | | 40,000 | | 55,152 |
|
| Republic of Turkey |
7.375% 02/05/25 | | | | 25,000 | | 25,063 |
|
| Republic of Venezuela |
9.250% 09/15/27 | | | | 50,000 | | 31,500 |
|
| Switzerland Government Bond |
2.500% 03/12/16 | | CHF | | 50,000 | | 48,519 |
|
| United Kingdom Treasury |
4.000% 09/07/16 | | GBP | | 120,000 | | 206,645 |
5.000% 09/07/14 | | GBP | | 75,000 | | 135,735 |
5.000% 03/07/25 | | GBP | | 160,000 | | 279,454 |
See Accompanying Notes to Financial Statements.
8
Columbia International Bond Fund
May 31, 2009
Government & Agency Obligations (continued)
| | | | | | |
| | | | | Par (a) | | Value ($) |
| Foreign Government Obligations (continued) |
| United Mexican States |
5.625% 01/15/17 | | | | 50,000 | | 51,000 |
| | | | | | |
Foreign Government Obligations Total | | 8,413,934 |
| | | | | | |
| U.S. Government Obligations – 2.1% |
| U.S. Treasury Notes | | | | | | |
2.000% 11/30/13 | | | | 100,000 | | 99,359 |
3.750% 11/15/18 | | | | 90,000 | | 91,983 |
| | | | | | |
U.S. Government Obligations Total | | 191,342 |
| | | | | | |
Total Government & Agency Obligations (cost of $8,373,143) | | 8,605,276 |
|
Corporate Fixed-Income Bonds & Notes – 1.2% |
| | | | | | |
| Financials – 1.2% | | | | | | |
| Banks – 1.2% | | | | | | |
| Citigroup, Inc. | | | | | | |
2.875% 12/09/11 (b) | | | | 50,000 | | 51,556 |
| JPMorgan Chase & Co. | | | | | | |
3.125% 12/01/11 (b) | | | | 50,000 | | 51,826 |
| | | | | | |
Banks Total | | | | | | 103,382 |
| | | | | | |
Financials Total | | | | | | 103,382 |
| | | | | | |
Total Corporate Fixed-Income Bonds & Notes
(cost of $101,517) | | 103,382 |
|
Short-Term Obligation – 2.6% |
Repurchase agreement with State Street Bank & Trust Co., dated 05/29/09, due 06/01/09 at 0.050%, collateralized by a U.S. Treasury obligation maturing 11/19/09, market value $239,664 (repurchase proceeds $233,001) | | | | 233,000 | | 233,000 |
| | | | | | |
Total Short-Term Obligation (cost of $233,000) | | | | | | 233,000 |
| | | | | | |
Total Investments – 99.9% (cost of $8,707,660) (c) | | | | | | 8,941,658 |
| | | | | | |
Other Assets & Liabilities, Net – 0.1% | | 11,188 |
| | | | | | |
Net Assets – 100.0% | | | | | | 8,952,846 |
Notes to Investment Portfolio:
| (a) | Principal amount is stated in United States dollars unless otherwise noted. |
| (b) | Security is guaranteed by the Federal Deposit Insurance Corp. |
| (c) | Cost for federal income tax purposes is $8,726,100. |
The following table summarizes the inputs used, as of May 31, 2009, in valuing the Fund’s assets:
| | | | | | | |
Valuation Inputs | | Investments in
Securities | | Other Financial
Instruments* | |
Level 1 – Quoted Prices | | $ | 191,342 | | $ | — | |
Level 2 – Other Significant Observable Inputs | | | 8,750,316 | | | (1,514 | ) |
Level 3 – Significant Unobservable Inputs | | | — | | | — | |
| | | | | | | |
Total | | $ | 8,941,658 | | $ | (1,514 | ) |
| | | | | | | |
* Other financial instruments consist of forward foreign currency exchange contracts which are not included in the investment portfolio.
For more information on valuation inputs, and their aggregation into the levels used in the tables above, please refer to the Security Valuation section in the accompanying Notes to Financial Statements.
Forward foreign currency exchange contracts outstanding on May 31, 2009 are:
| | | | | | | | | | | | |
Forward
Foreign
Currency Exchange
Contracts
to Sell | | Value | | Aggregate
Face
Value | | Settlement
Date | | Unrealized
Depreciation | |
CHF | | $ | 49,553 | | $ | 48,039 | | 06/24/09 | | $ | (1,514 | ) |
See Accompanying Notes to Financial Statements.
9
Columbia International Bond Fund
May 31, 2009
At May 31, 2009, the Fund was invested in the following countries:
| | | | | |
Country (Unaudited) | | Value | | % of Total Investments |
United States* | | $ | 1,043,451 | | 11.7 |
Japan | | | 1,041,676 | | 11.6 |
Germany | | | 933,394 | | 10.4 |
France | | | 896,417 | | 10.0 |
Spain | | | 791,601 | | 8.9 |
United Kingdom | | | 621,834 | | 7.0 |
Luxembourg | | | 496,387 | | 5.6 |
Canada | | | 491,482 | | 5.4 |
Italy | | | 437,185 | | 4.9 |
Norway | | | 337,339 | | 3.8 |
Netherlands | | | 268,358 | | 3.0 |
Philippines | | | 229,943 | | 2.6 |
Switzerland | | | 189,157 | | 2.1 |
Finland | | | 177,770 | | 2.0 |
Belgium | | | 177,275 | | 2.0 |
Greece | | | 128,231 | | 1.4 |
Poland | | | 104,058 | | 1.2 |
Australia | | | 81,852 | | 0.9 |
Denmark | | | 78,331 | | 0.9 |
Sweden | | | 76,846 | | 0.9 |
New Zealand | | | 71,839 | | 0.8 |
Ireland | | | 66,330 | | 0.7 |
Brazil | | | 58,750 | | 0.6 |
Mexico | | | 51,000 | | 0.6 |
Peru | | | 34,590 | | 0.4 |
Turkey | | | 25,062 | | 0.3 |
Venezuela | | | 31,500 | | 0.3 |
| | | | | |
| | $ | 8,941,658 | | 100.0 |
| | | | | |
* Includes short-term obligation.
Securities are listed by country of domicile.
| | |
Acronym | | Name |
| AUD | | Australian Dollar |
| CAD | | Canadian Dollar |
| CHF | | Swiss Franc |
| DKK | | Danish Krone |
| EUR | | Euro |
| GBP | | Pound Sterling |
| JPY | | Japanese Yen |
| NOK | | Norwegian Krone |
| NZD | | New Zealand Dollar |
| PLN | | Polish Zloty |
| SEK | | Swedish Krona |
See Accompanying Notes to Financial Statements.
10
Statement of Assets and Liabilities – Columbia International Bond Fund
May 31, 2009
| | | | | | |
| | | | | ($) | |
| Assets | | Investments, at cost | | | 8,707,660 | |
| | | | | | |
| | Investments, at value | | | 8,941,658 | |
| | Cash | | | 573 | |
| | Receivable for: | | | | |
| | Fund shares sold | | | 30,924 | |
| | Interest | | | 136,586 | |
| | Prepaid expense | | | 106 | |
| | | | | | |
| | Total Assets | | | 9,109,847 | |
| | |
| Liabilities | | Unrealized depreciation on forward foreign currency exchange contracts | | | 1,514 | |
| | Expense reimbursement due to investment advisor | | | 53,410 | |
| | Payable for: | | | | |
| | Fund shares repurchased | | | 11,293 | |
| | Investment advisory fee | | | 3,938 | |
| | Administration fee | | | 358 | |
| | Transfer agent fee | | | 3,456 | |
| | Pricing and bookkeeping fees | | | 9,098 | |
| | Trustees’ fees | | | 265 | |
| | Audit fee | | | 36,822 | |
| | Custody fee | | | 2,117 | |
| | Distribution and service fees | | | 52 | |
| | Reports to shareholders | | | 29,292 | |
| | Chief compliance officer expenses | | | 101 | |
| | Other liabilities | | | 5,285 | |
| | | | | | |
| | Total Liabilities | | | 157,001 | |
| | |
| | | | | | |
| | Net Assets | | | 8,952,846 | |
| | |
| Net Assets Consist of | | Paid-in capital | | | 8,696,433 | |
| | Undistributed net investment income | | | 14,051 | |
| | Accumulated net realized gain | | | 2,267 | |
| | Net unrealized appreciation on: | | | | |
| | Investments | | | 233,998 | |
| | Foreign currency translations | | | 6,097 | |
| | | | | | |
| | Net Assets | | | 8,952,846 | |
| | |
| Class A | | Net assets | | $ | 131,256 | |
| | Shares outstanding | | | 12,632 | |
| | Net asset value per share | | $ | 10.39 | (a)(b) |
| | Maximum sales charge | | | 4.75 | % |
| | Maximum offering price per share ($10.39/0.9525) | | $ | 10.91 | (c) |
| | |
| Class C | | | | | | |
| | Net assets | | $ | 31,724 | |
| | Shares outstanding | | | 3,053 | |
| | Net asset value and offering price per share | | $ | 10.39 | (a)(b) |
| | |
| Class Z | | | | | | |
| | Net assets | | $ | 8,789,866 | |
| | Shares outstanding | | | 845,832 | |
| | Net asset value, offering and redemption price per share | | $ | 10.39 | (b) |
| (a) | Redemption price per share is equal to net asset value less any applicable contingent deferred sales charge. |
| (b) | Redemption price per share is equal to net asset value less any applicable redemption fees. |
| (c) | On sales of $50,000 or more the offering price is reduced. |
See Accompanying Notes to Financial Statements.
11
Statement of Operations – Columbia International Bond Fund
For the period December 1, 2008 through May 31, 2009
| | | | | |
| | | | | ($)(a) | |
| Investment Income | | Interest | | 85,932 | |
| | Foreign taxes withheld | | (2 | ) |
| | | | | |
| | Total Investment Income | | 85,930 | |
| | |
| Expenses | | Investment advisory fee | | 20,485 | |
| | Administration fee | | 1,862 | |
| | Distribution fee – Class C | | 66 | |
| | Service fee: | | | |
| | Class A | | 81 | |
| | Class C | | 22 | |
| | Transfer agent fee | | 3,574 | |
| | Pricing and bookkeeping fees | | 26,617 | |
| | Trustees’ fees | | 1,870 | |
| | Custody fee | | 5,945 | |
| | Audit fee | | 37,404 | |
| | Reports to shareholders | | 60,831 | |
| | Chief compliance officer expenses | | 292 | |
| | Other expenses | | 13,494 | |
| | | | | |
| | Total Expenses | | 172,543 | |
| | |
| | Fees waived or expenses reimbursed by investment advisor | | (142,545 | ) |
| | Expense reductions | | (2 | ) |
| | | | | |
| | Net Expenses | | 29,996 | |
| | |
| | | | | |
| | Net Investment Income | | 55,934 | |
| | |
| Net Realized and Unrealized Gain (Loss) on Investments and Foreign Currency and Forward Foreign Currency Exchange Contracts | | Net realized gain (loss) on: | | | |
| | Investments | | 13,831 | |
| | Foreign currency transactions and forward foreign currency exchange contracts | | (10,885 | ) |
| | | | | |
| | Net realized gain | | 2,946 | |
| | |
| | Net change in unrealized appreciation (depreciation) on: | | | |
| | Investments | | 233,998 | |
| | Foreign currency translations and forward foreign currency exchange contracts | | 6,097 | |
| | | | | |
| | Net change in unrealized appreciation (depreciation) | | 240,095 | |
| | | | | |
| | Net Gain | | 243,041 | |
| | |
| | | | | |
| | Net Increase Resulting from Operations | | 298,975 | |
| (a) | The Fund commenced operations on December 1, 2008. Amounts shown reflect activity for the period December 1, 2008 through May 31, 2009. |
See Accompanying Notes to Financial Statements.
12
Statement of Changes in Net Assets – Columbia International Bond Fund
| | | | | |
| Increase (Decrease) in Net Assets | | | | Period Ended
May 31,
2009 ($)(a) | |
| Operations | | Net investment income | | 55,934 | |
| | Net realized gain on investments, foreign currency transactions and forward foreign currency exchange contracts | | 2,946 | |
| | Net change in unrealized appreciation (depreciation) on investments, foreign currency translations and forward foreign currency exchange contracts | | 240,095 | |
| | | | | |
| | Net increase resulting from operations | | 298,975 | |
| | |
| Distributions to Shareholders | | From net investment income: | | | |
| | Class A | | (291 | ) |
| | Class C | | (15 | ) |
| | Class Z | | (42,256 | ) |
| | | | | |
| | Total distributions to shareholders | | (42,562 | ) |
| | |
| | Net Capital Stock Transactions | | 8,695,709 | |
| | Redemption fees | | 724 | |
| | | | | |
| | Total increase in net assets | | 8,952,846 | |
| | |
| Net Assets | | Beginning of period | | — | |
| | End of period | | 8,952,846 | |
| | Undistributed net investment income at end of period | | 14,051 | |
| (a) | The Fund commenced operations on December 1, 2008. |
See Accompanying Notes to Financial Statements.
13
Statement of Changes in Net Assets (continued) – Columbia International Bond Fund
| | | | | | |
| | | Capital Stock Activity | |
| | | Period Ended May 31, 2009 (a) | |
| | | Shares | | | Dollars ($) | |
Class A | | | | | | |
Subscriptions | | 12,607 | | | 125,589 | |
Distributions reinvested | | 29 | | | 291 | |
Redemptions | | (4 | ) | | (44 | ) |
| | | | | | |
Net increase | | 12,632 | | | 125,836 | |
| | |
Class C | | | | | | |
Subscriptions | | 3,052 | | | 30,264 | |
Distributions reinvested | | 1 | | | 11 | |
| | | | | | |
Net increase | | 3,053 | | | 30,275 | |
| | |
Class Z | | | | | | |
Subscriptions | | 856,503 | | | 8,646,596 | |
Distributions reinvested | | 2,765 | | | 28,076 | |
Redemptions | | (13,436 | ) | | (135,074 | ) |
| | | | | | |
Net increase | | 845,832 | | | 8,539,598 | |
| (a) | The Fund commenced operations on December 1, 2008. |
See Accompanying Notes to Financial Statements.
14
Financial Highlights – Columbia International Bond Fund
Selected data for a share outstanding throughout the period is as follows:
| | | | |
| Class A Shares | | Period Ended
May 31,
2009 (a) | |
Net Asset Value, Beginning of Period | | $ | 10.00 | |
| |
Income from Investment Operations: | | | | |
Net investment income (b) | | | 0.07 | |
Net realized and unrealized gain on investments and foreign currency | | | 0.36 | |
| | | | |
Total from investment operations | | | 0.43 | |
| |
Less Distributions to Shareholders: | | | | |
From net investment income | | | (0.04 | ) |
| |
Redemption Fees: | | | | |
Redemption fees added to paid-in-capital (b)(c) | | | — | |
| |
Net Asset Value, End of Period | | $ | 10.39 | |
Total return (d)(e)(f) | | | 4.35 | % |
| |
Ratios to Average Net Assets/Supplemental Data: | | | | |
Net expenses (g)(h) | | | 1.05 | % |
Waiver/Reimbursement (h) | | | 3.82 | % |
Net investment income (g)(h) | | | 1.41 | % |
Portfolio turnover rate (f) | | | 4 | % |
Net assets, end of period (000’s) | | $ | 131 | |
| (a) | Class A shares commenced operations on December 1, 2008. Per share data and total return reflect activity from that date. |
| (b) | Per share data was calculated using the average shares outstanding during the period. |
| (c) | Rounds to less than $0.01 per share. |
| (d) | Total return at net asset value assuming all distributions reinvested and no initial sales charge or contingent deferred sales charge. |
| (e) | Had the investment advisor and/or any of its affiliates not waived fees or reimbursed a portion of expenses, total return would have been reduced. |
| (g) | The benefits derived from expense reductions had an impact of less than 0.01%. |
See Accompanying Notes to Financial Statements.
15
Financial Highlights – Columbia International Bond Fund
Selected data for a share outstanding throughout the period is as follows:
| | | | |
| Class C Shares | | Period Ended
May 31,
2009 (a) | |
Net Asset Value, Beginning of Period | | $ | 10.00 | |
| |
Income from Investment Operations: | | | | |
Net investment income (b) | | | 0.03 | |
Net realized and unrealized gain on investments and foreign currency | | | 0.37 | |
| | | | |
Total from investment operations | | | 0.40 | |
| |
Less Distributions to Shareholders: | | | | |
From net investment income | | | (0.01 | ) |
| |
Redemption Fees: | | | | |
Redemption fees added to paid-in-capital (b)(c) | | | — | |
| |
Net Asset Value, End of Period | | $ | 10.39 | |
Total return (d)(e)(f) | | | 3.97 | % |
| |
Ratios to Average Net Assets/Supplemental Data: | | | | |
Net expenses (g)(h) | | | 1.80 | % |
Waiver/Reimbursement (h) | | | 3.82 | % |
Net investment income (g)(h) | | | 0.59 | % |
Portfolio turnover rate (f) | | | 4 | % |
Net assets, end of period (000’s) | | $ | 32 | |
| (a) | Class C shares commenced operations on December 1, 2008. Per share data and total return reflect activity from that date. |
| (b) | Per share data was calculated using the average shares outstanding during the period. |
| (c) | Rounds to less than $0.01 per share. |
| (d) | Total return at net asset value assuming all distributions reinvested and no contingent deferred sales charge. |
| (e) | Had the investment advisor and/or any of its affiliates not waived fees or reimbursed a portion of expenses, total return would have been reduced. |
| (g) | The benefits derived from expense reductions had an impact of less than 0.01%. |
See Accompanying Notes to Financial Statements.
16
Financial Highlights – Columbia International Bond Fund
Selected data for a share outstanding throughout the period is as follows:
| | | | |
| Class Z Shares | | Period Ended
May 31,
2009 (a) | |
Net Asset Value, Beginning of Period | | $ | 10.00 | |
| |
Income from Investment Operations: | | | | |
Net investment income (b) | | | 0.07 | |
Net realized and unrealized gain on investments and foreign currency | | | 0.38 | |
| | | | |
Total from investment operations | | | 0.45 | |
| |
Less Distributions to Shareholders: | | | | |
From net investment income | | | (0.06 | ) |
| |
Redemption Fees: | | | | |
Redemption fees added to paid-in-capital (b)(c) | | | — | |
| |
Net Asset Value, End of Period | | $ | 10.39 | |
Total return (d)(e)(f) | | | 4.48 | % |
| |
Ratios to Average Net Assets/Supplemental Data: | | | | |
Net expenses (g)(h) | | | 0.80 | % |
Waiver/Reimbursement (h) | | | 3.82 | % |
Net investment income (g)(h) | | | 1.50 | % |
Portfolio turnover rate (f) | | | 4 | % |
Net assets, end of period (000’s) | | $ | 8,790 | |
| (a) | Class Z shares commenced operations on December 1, 2008. Per share data and total return reflect activity from that date. |
| (b) | Per share data was calculated using the average shares outstanding during the period. |
| (c) | Rounds to less than $0.01 per share. |
| (d) | Total return at net asset value assuming all distributions reinvested. |
| (e) | Had the investment advisor and/or any of its affiliates not waived fees or reimbursed a portion of expenses, total return would have been reduced. |
| (g) | The benefits derived from expense reductions had an impact of less than 0.01%. |
See Accompanying Notes to Financial Statements.
17
Notes to Financial Statements – Columbia International Bond Fund
May 31, 2009
Note 1. Organization
Columbia International Bond Fund (the “Fund”), a series of Columbia Funds Series Trust I (the “Trust”), is a non-diversified portfolio. The Trust is registered under the Investment Company Act of 1940, as amended (the “1940 Act”), as an open-end management investment company organized as a Massachusetts business trust.
Investment Objective
The Fund seeks total return, consisting of current income and capital appreciation.
Fund Shares
The Trust may issue an unlimited number of shares, and the Fund offers three classes of shares: Class A, Class C and Class Z. Each share class has its own expense structure and sales charges, as applicable. The Fund commenced operations on December 1, 2008.
Class A shares are subject to a maximum front-end sales charge of 4.75% based on the amount of initial investment. Class A shares purchased without an initial sales charge in accounts aggregating $1 million to $50 million at the time of purchase are subject to a 1.00% contingent deferred sales charge (“CDSC”) if the shares are sold within one year after purchase. Class C shares are subject to a 1.00% CDSC on shares sold within one year after purchase. Class Z shares are offered continuously at net asset value. There are certain restrictions on the purchase of Class Z shares, as described in the Fund’s prospectus.
Note 2. Significant Accounting Policies
The preparation of financial statements in accordance with accounting principles generally accepted in the United States of America (“GAAP”) requires management to make certain estimates and assumptions that affect the reported amounts of assets and liabilities, the disclosure of contingent assets and liabilities at the date of the financial statements and the reported amounts of revenue and expenses during the reporting period. Actual results could differ from those estimates. The following is a summary of significant accounting policies consistently followed by the Fund in the preparation of its financial statements.
Security Valuation
Debt securities generally are valued by pricing services approved by the Trust’s Board of Trustees, based upon market transactions for normal, institutional-size trading units of similar securities. The services may use various pricing techniques which take into account appropriate factors such as yield, quality, coupon rate, maturity, type of issue, trading characteristics and other data, as well as broker quotes. Debt securities for which quotations are readily available are valued at an over-the-counter or exchange bid quotation.
Certain debt securities, which tend to be more thinly traded and of lesser quality, are priced based on fundamental analysis of the financial condition of the issuer and the estimated value of any collateral. Valuations developed through pricing techniques may vary from the actual amounts realized upon sale of the securities, and the potential variation may be greater for those securities valued using fundamental analysis.
Short-term investments maturing in 60 days or less are valued at amortized cost, which approximates market value.
Forward foreign currency exchange contracts are valued at the prevailing forward exchange rate of the underlying currencies.
Foreign securities are generally valued at the last sale price on the foreign exchange or market on which they trade. If any foreign share prices are not readily available as a result of limited share activity, the securities are valued at the last sale price of the local shares in the principal market in which such securities are normally traded.
Investments for which market quotations are not readily available, or that have quotations which management believes are not reliable, are valued at fair value as determined in good faith under consistently applied procedures established by and under the general supervision of the Board of Trustees. If a security is valued at fair value, such value is likely to be different from the last quoted market price for the security. The determination of fair value often requires significant judgment. To determine fair value, management may use assumptions including but not limited to future cash flows and estimated risk premiums. Multiple inputs from various sources may be used to determine value.
18
Columbia International Bond Fund
May 31, 2009
The Fund is subject to Financial Accounting Standards Board “(FASB”) Statement of Financial Accounting Standards No. 157, Fair Value Measurements (“SFAS 157”). SFAS 157 establishes a hierarchy that prioritizes the inputs to valuation techniques used to measure fair value giving the highest priority to unadjusted quoted prices in active markets for identical securities (level 1 measurements) and the lowest priority to unobservable inputs (level 3 measurements) when market prices are not readily available or reliable. The three levels of the fair value hierarchy under SFAS 157 are described below:
| | • | | Level 1 – quoted prices in active markets for identical securities | |
| | • | | Level 2 – prices determined using other significant observable inputs (including quoted prices for similar securities, interest rates, prepayment speeds, credit risk, and others) | |
| | • | | Level 3 – prices determined using significant unobservable inputs. In situations where quoted prices or observable inputs are unavailable or less reliable, unobservable inputs may be used. Unobservable inputs may include management’s own assumptions about the factors market participants would use in pricing an investment. | |
The inputs or methodology used for valuing securities are not necessarily an indication of the risk associated with investing in those securities.
In April 2009, FASB issued FASB Staff Position 157-4, Determining Fair Value When the Value and Level of Activity for the Asset or Liability Have Significantly Decreased and Identifying Transactions That Are Not Orderly (“FSP FAS 157-4”), which amends SFAS 157 and is effective for interim and annual periods ending after June 15, 2009. FSP FAS 157-4 provides additional guidance when the volume and level of activity for the asset or liability measured at fair value has significantly decreased. Additionally, FSP FAS 157-4 expands disclosure requirements for reporting entities with respect to categories of assets and liabilities carried at fair value. Management is evaluating the impact that the application of FSP FAS 157-4 will have on the Fund’s financial statement disclosures.
Security Transactions
Security transactions are accounted for on the trade date. Cost is determined and gains (losses) are based upon the specific identification method for both financial statement and federal income tax purposes.
On December 1, 2008, the Fund adopted Statement of Financial Accounting Standards No. 161, Disclosures about Derivative Instruments and Hedging Activities-an amendment of FASB Statement No. 133 (“SFAS 161”). SFAS 161 requires additional discussion about the reporting entity’s derivative instruments and hedging activities, by providing for qualitative disclosures about the objectives and strategies for using derivatives, quantitative data about the fair value of and gains and losses on derivative contracts, and details of credit-risk-related contingent features in their derivative contracts. For additional information on derivative instruments, please see Note 6.
Forward Foreign Currency Exchange Contracts
Forward foreign currency exchange contracts are agreements to exchange one currency for another at a future date at a specified price. These contracts are used to minimize the exposure to foreign exchange rate fluctuations during the period between the trade and settlement dates of the contract. The Fund may utilize forward foreign currency exchange contracts in connection with the settlement of purchases and sales of securities. The Fund may also enter into these contracts to reduce the exposure to adverse price movements in certain other foreign currency denominated assets. Contracts to buy generally are used to acquire exposure to foreign currencies, while contracts to sell are generally used to reduce the exposure to foreign exchange rate fluctuations. Forward foreign currency exchange contracts are valued daily at the current exchange rate of the underlying currency, resulting in unrealized gains (losses) which become realized at the time the forward foreign currency exchange contracts are closed or mature. Realized and unrealized gains (losses) arising from such transactions are included in net realized and unrealized gains (losses) on foreign currency transactions. The use of forward foreign currency exchange contracts does not eliminate fluctuations in the prices of the Fund’s portfolio securities. While the maximum potential loss from such contracts is the aggregate face value in U.S. dollars at the time the contract was opened, exposure is typically limited to the change in value of the contract (in U.S. dollars) over the period it remains open. The Fund could also be exposed to risk that counterparties of the contracts may be unable to fulfill the terms of the contracts.
19
Columbia International Bond Fund
May 31, 2009
Repurchase Agreements
The Fund may engage in repurchase agreement transactions with institutions that Columbia Management Advisors, LLC (“Columbia”), the Fund’s investment advisor, has determined are creditworthy. The Fund, through its custodian, receives delivery of the underlying securities collateralizing a repurchase agreement. Columbia is responsible for determining that the collateral is at least equal, at all times, to the value of the repurchase obligation including interest. A repurchase agreement transaction involves certain risks in the event of default or insolvency of the counterparty. These risks include possible delays in or restrictions on the Fund’s ability to dispose of the underlying securities and a possible decline in the value of the underlying securities during the period while the Fund seeks to assert its rights.
Foreign Currency Transactions and Translations
The values of all assets and liabilities quoted in foreign currencies are translated into U.S. dollars at that day’s exchange rates. Net realized and unrealized gains (losses) on foreign currency transactions and translations include gains (losses) arising from the fluctuation in exchange rates between trade and settlement dates on securities transactions, gains (losses) arising from the disposition of foreign currency and currency gains (losses) between the accrual and payment dates on dividends, interest income and foreign withholding taxes.
For financial statement purposes, the Fund does not distinguish that portion of gains (losses) on investments which is due to changes in foreign exchange rates from that which is due to changes in market prices of the investments. Such fluctuations are included with the net realized and unrealized gains (losses) on investments on the Statement of Operations.
Income Recognition
Interest income is recorded on the accrual basis. Premium and discount are amortized and accreted, respectively, on all debt securities, unless otherwise noted.
Expenses
General expenses of the Trust are allocated to the Fund and other series of the Trust based upon relative net assets or other expense allocation methodologies determined by the nature of the expense. Expenses directly attributable to the Fund are charged to the Fund.
Determination of Class Net Asset Value
All income, expenses (other than class-specific expenses, as shown on the Statement of Operations) and realized and unrealized gains (losses) are allocated to each class of the Fund on a daily basis, based on the relative net assets of each class, for purposes of determining the net asset value of each class.
Federal Income Tax Status
The Fund intends to qualify each year as a “regulated investment company” under Subchapter M of the Internal Revenue Code, as amended, and will distribute substantially all of its taxable income, if any, for its tax year, and as such will not be subject to federal income taxes. In addition, the Fund intends to distribute in each calendar year substantially all of its net investment income, capital gains and certain other amounts, if any, such that the Fund should not be subject to federal excise tax. Therefore, no federal income or excise tax provision is recorded.
Foreign Capital Gains Taxes
Realized gains in certain countries may be subject to foreign taxes at the fund level, at rates ranging from approximately 10% to 15%. The Fund accrues for such foreign taxes on net realized and unrealized gains at the appropriate rate for each jurisdiction.
Distributions to Shareholders
Distributions from net investment income are declared and paid monthly. Net realized capital gains, if any, are distributed at least annually. Income distributions and capital gain distributions are determined in accordance with federal income tax regulations which may differ from GAAP.
Indemnification
In the normal course of business, the Fund enters into contracts that contain a variety of representations and warranties and which provide general indemnities. The Fund’s maximum exposure under these arrangements is unknown because this would involve future claims against the Fund. Also, under the Trust’s organizational documents and
20
Columbia International Bond Fund
May 31, 2009
by contract, the Trustees and officers of the Trust are indemnified against certain liabilities that may arise out of actions relating to their duties to the Trust. However, based on experience, the Fund expects the risk of loss due to these representations, warranties and indemnities to be minimal.
Note 3. Federal Tax Information
The timing and character of income and capital gain distributions are determined in accordance with income tax regulations, which may differ from GAAP. Reclassifications are made to the Fund’s capital accounts for permanent tax differences to reflect income and gains available for distribution (or available capital loss carryforwards) under income tax regulations.
For the period ended May 31, 2009, permanent book and tax basis differences resulting primarily from differing treatments for foreign currency transactions and discount accretion/premium amortization on debt securities were identified and reclassified among the components of the Fund’s net assets as follows:
| | | | |
| |
Undistributed
Net Investment
Income | | Accumulated
Net Realized Gain | | Paid-In Capital |
| $679 | | $(679) | | $— |
Net investment income and net realized gains (losses), as disclosed on the Statement of Operations, and net assets were not affected by this reclassification.
The tax character of distributions paid during the period ended May 31, 2009 was as follows:
| | | |
| | | |
Ordinary Income* | | $ | 42,562 |
Long-Term Capital Gains | | | — |
| * | For tax purposes short-term capital gain distributions, if any, are considered ordinary income distributions. |
As of May 31, 2009, the components of distributable earnings on a tax basis were as follows:
| | | | |
| | | | | |
Undistributed
Ordinary
Income | | Undistributed
Long-Term Capital
Gains | | Net Unrealized
Appreciation* |
| $33,440 | | $— | | $215,558 |
| * | The differences between book-basis and tax-basis net unrealized depreciation are primarily due to deferral of losses from wash sales. |
Unrealized appreciation and depreciation at May 31, 2009, based on cost of investments for federal income tax purposes were:
| | | | |
| | | | |
Unrealized appreciation | | $ | 356,858 | |
Unrealized depreciation | | | (141,300 | ) |
Net unrealized appreciation | | $ | 215,558 | |
The Fund has adopted Financial Accounting Standards Board (“FASB”) Interpretation No. 48, Accounting for Uncertainty in Income Taxes – an Interpretation of FASB Statement No. 109 (“FIN 48”). FIN 48 requires management to determine whether a tax position of the Fund is more likely than not to be sustained upon examination by the applicable taxing authority, including resolution of any related appeals or litigation processes, based on the technical merits of the position. The tax benefit to be recognized is measured as the largest amount of benefit that is greater than fifty percent likely of being realized upon ultimate settlement. The Fund is not aware of any tax positions for which it is reasonably possible that the total amounts of unrecognized tax benefits will significantly change in the next twelve months.
Note 4. Fees and Compensation Paid to Affiliates
Investment Advisory Fee
Columbia, an indirect, wholly owned subsidiary of Bank of America Corporation (“BOA”) provides investment advisory services to the Fund. In rendering investment advisory services to the Fund, Columbia may use the portfolio management and research resources of Columbia Management Pte. Ltd., an affiliate of Columbia. Columbia receives a monthly investment advisory fee based on the Fund’s average daily net assets at the following annual rates:
| | | |
| | | | |
| Average Daily Net Assets | | Annual Fee Rate | |
First $500 million | | 0.55 | % |
$500 million to $1 billion | | 0.50 | % |
$1 billion to $1.5 billion | | 0.47 | % |
Over $1.5 billion | | 0.44 | % |
For the period ended May 31, 2009, the Fund’s annualized effective investment advisory fee rate was 0.55%.
21
Columbia International Bond Fund
May 31, 2009
Administration Fee
Columbia provides administrative and other services to the Fund for a monthly administration fee at the annual rate of 0.05% of the Fund’s average daily net assets.
Pricing and Bookkeeping Fees
The Fund has entered into a Financial Reporting Services Agreement (the “Financial Reporting Services Agreement”) with State Street Bank & Trust Company (“State Street”) and Columbia pursuant to which State Street provides financial reporting services to the Fund. The Fund has also entered into an Accounting Services Agreement (collectively with the Financial Reporting Services Agreement, the “State Street Agreements”) with State Street and Columbia pursuant to which State Street provides accounting services to the Fund. Under the State Street Agreements, the Fund pays State Street an annual fee of $38,000 paid monthly plus an additional monthly fee based on an annualized percentage rate of average daily net assets of the Fund for the month. The aggregate fee will not exceed $140,000 per year (exclusive of out-of-pocket expenses and charges). The Fund also reimburses State Street for certain out-of-pocket expenses and charges.
The Fund has entered into a Pricing and Bookkeeping Oversight and Services Agreement (the “Services Agreement”) with Columbia. Under the Services Agreement, Columbia provides services related to Fund expenses and the requirements of the Sarbanes-Oxley Act of 2002, and provides oversight of the accounting and financial reporting services provided by State Street. Under the Services Agreement, the Fund reimburses Columbia for out-of-pocket expenses.
Transfer Agent Fee
Columbia Management Services, Inc. (the “Transfer Agent”), an affiliate of Columbia and an indirect, wholly owned subsidiary of BOA, provides shareholder services to the Fund and has contracted with Boston Financial Data Services (“BFDS”) to serve as sub-transfer agent. The Transfer Agent is entitled to receive a fee for its services, paid monthly, at the annual rate of $17.34 per open account plus reimbursement of certain sub-transfer agent fees paid by the Transfer Agent (exclusive of BFDS fees), calculated based on assets held in omnibus accounts and intended to recover the cost of payments to other parties (including affiliates of BOA) for services to those accounts. The Transfer Agent pays the fees of BFDS for services as sub-transfer agent and is not entitled to reimbursement for such fees from the Fund.
The Transfer Agent may also retain, as additional compensation for its services, fees for wire, telephone and redemption orders, Individual Retirement Account (“IRA”) trustee agent fees and account transcript fees due to the Transfer Agent from shareholders of the Fund and credits (net of bank charges) earned with respect to balances in accounts the Transfer Agent maintains in connection with its services to the Fund. The Transfer Agent also receives reimbursement for certain out-of-pocket expenses.
An annual minimum account balance fee of $20 may apply to certain accounts with a value below the Fund’s initial minimum investment requirements to reduce the impact of small accounts on transfer agent fees. These minimum account balance fees are recorded as part of expense reductions on the Statement of Operations. For the period ended May 31, 2009, no minimum account balance fees were charged by the Fund.
Underwriting Discounts, Service and Distribution Fees
Columbia Management Distributors, Inc. (the “Distributor”), an affiliate of Columbia and an indirect, wholly owned subsidiary of BOA, is the principal underwriter of the Fund’s shares. For the period ended May 31, 2009, the Distributor retained net underwriting discounts of $1 on sales of the Fund’s Class A shares and received net CDSC fees of $—and $— on Class A and Class C share redemptions, respectively.
The Fund has adopted distribution and shareholder servicing plans (the “Plans”) pursuant to Rule 12b-1 under the 1940 Act, which require the payment of distribution and service fees. The Plans require the payment of a monthly service fee to the Distributor equal at the annual rate of 0.25% of the average daily net assets attributable to Class A and Class C shares of the Fund. The Plans also require the payment of a monthly distribution fee to the Distributor at the annual rate of 0.75% of the average daily net assets attributable to Class C shares only.
The CDSC and the distribution fees are used principally as repayment to the Distributor of amounts previously paid by the Distributor to dealers who sold such shares.
22
Columbia International Bond Fund
May 31, 2009
Fee Waivers and Expense Reimbursements
Columbia has contractually agreed to waive fees and/or reimburse a portion of the Fund’s expenses through September 30, 2010, so that the Fund’s ordinary operating expenses (excluding any distribution and service fees, brokerage commissions, interest, taxes and extraordinary expenses, but including custodial charges relating to overdrafts, if any), after giving effect to any balance credits from the Fund’s custodian, do not exceed the annual rate of 0.80% of the Fund’s average daily net assets.
Columbia is entitled to recover from the Fund any fees waived or expenses reimbursed for a three year period following the date of such fee waiver or reimbursement under this arrangement if such recovery does not cause the Fund’s expenses to exceed the expense limitations in effect at the time of recovery.
At May 31, 2009, the amounts potentially recoverable by Columbia pursuant to this arrangement are as follows:
| | | | | | | | | | | | |
| |
Amount of Potential
Recovery Expiring May 31: | | Total
Potential
Recovery | | Amount
Recovered
During the
Period Ended 05/31/09 |
| 2012 | | 2011 | | 2010 | | |
| $142,545 | | $ | — | | $ | — | | $ | 142,545 | | $ | — |
Fees Paid to Officers and Trustees
All officers of the Fund are employees of Columbia or its affiliates and, with the exception of the Fund’s Chief Compliance Officer, receive no compensation from the Fund. The Board of Trustees has appointed a Chief Compliance Officer to the Fund in accordance with federal securities regulations. The Fund, along with other affiliated funds, pays its pro-rata share of the expenses associated with the Chief Compliance Officer. The Fund’s expenses for the Chief Compliance Officer will not exceed $15,000 per year.
The Trust’s eligible Trustees may participate in a deferred compensation plan which may be terminated at any time. Obligations of the plan will be paid solely out of the Fund’s assets.
Note 5. Custody Credits
The Fund has an agreement with its custodian bank under which custody fees may be reduced by balance credits. These credits are recorded as part of expense reductions on the Statement of Operations. The Fund could have invested a portion of the assets utilized in connection with the expense offset arrangement in an income-producing asset if it had not entered into such an agreement.
For the period ended May 31, 2009, these custody credits reduced total expenses by $2 for the Fund.
Note 6. Derivative Instruments
Derivatives not accounted for as hedging instruments under Statement 133:
Fair Value of Derivative Instruments
| | | | | | | | |
| | | Asset | | Liability |
| | | Statement of
Assets and
Liabilities
Location | | Fair
Value | | Statement of
Assets and
Liabilities
Location | | Fair
Value |
Forward foreign currency exchange contracts | | Unrealized appreciation on forward foreign currency exchange contracts | | $�� | | Unrealized depreciation on forward foreign currency exchange contracts | | $1,514 |
Total | | | | $— | | | | $1,514 |
Amount of Realized Gain or (Loss) on Derivatives Recognized in Income
| | | | | | |
| | | Forward Foreign
Currency Exchange
Contracts | | Total | |
Net realized gain (loss) on foreign currency transactions | | $(3,230) | | $ | (3,230 | ) |
Change in Unrealized Appreciation or (Depreciation) on Derivatives Recognized in Income
| | | | | | | | |
| | | Forward Foreign Currency Exchange
Contracts | | | Total | |
Net change in unrealized appreciation (depreciation) on foreign currency translations | | $ | (1,514 | ) | | $ | (1,514 | ) |
23
Columbia International Bond Fund
May 31, 2009
Note 7. Portfolio Information
For the period ended May 31, 2009, the cost of purchases and proceeds from sales of securities, excluding short-term obligations, for the Fund were $8,732,581 and $253,186, respectively, of which $204,741 and $—, respectively, were U.S. Government securities.
Note 8. Redemption Fees
The Fund may impose a 2.00% redemption fee on the proceeds of fund shares that are redeemed within 60 days of purchase. The redemption fee is designed to offset brokerage commissions and other costs associated with short-term trading of the portfolio. The redemption fees, which are retained by the Fund, are accounted for as an addition to paid-in capital and are allocated to each class based on the relative net assets at the time of the redemption. For the period ended May 31, 2009, the Fund received redemption fees as follows:
| | | |
| | | |
| | | Redemption Fees |
Class A shares | | $ | 8 |
Class C shares | | | 2 |
Class Z shares | | | 714 |
Note 9. Line of Credit
The Fund and other affiliated funds participate in a $280,000,000 committed, unsecured revolving line of credit provided by State Street. The maximum amount that may be borrowed by any fund is limited to the lesser of $200,000,000 and the Fund’s borrowing limit set forth in the Fund’s registration statement. Borrowings are available for short-term liquidity or temporary or emergency purposes.
Interest is charged to each participating fund based on the fund’s borrowings at a rate per annum equal to the greater of the Federal Funds Rate plus 0.50% or the overnight LIBOR Rate plus 0.50%. In addition, an annual operations agency fee of $20,000, an amendment fee of 0.02% and a commitment fee of 0.12% per annum are accrued and apportioned among the participating funds pro rata based on their relative net assets.
For the period ended May 31, 2009, the Fund did not borrow under these arrangements.
Note 10. Shares of Beneficial Interest
As of May 31, 2009, 38.4% of the Fund’s shares outstanding were beneficially owned by three participant accounts over which BOA and/or any of its affiliates had either sole or joint investment discretion.
As of May 31, 2009, the Fund had one shareholder that held 58.4% of the shares outstanding, over which BOA and/or any of its affiliates did not have investment discretion.
Subscription and redemption activity in these accounts may have a significant effect on the operations of the Fund.
Note 11. Significant Risks and Contingencies
Non-Diversification Risk
As a non-diversified mutual fund, the Fund is permitted to invest a greater percentage of its total assets in the securities of fewer issuers than a diversified fund. The Fund may, therefore, have a greater risk of loss from a few issuers than a similar fund that invests more broadly.
Foreign Securities Risk
There are certain additional risks involved when investing in foreign securities. These risks may involve foreign currency exchange rate fluctuations, adverse political and economic developments and the possible prevention of currency exchange or other foreign governmental laws or restrictions. In addition, the liquidity of foreign securities may be more limited than that of domestic securities.
Investments in emerging market countries are subject to additional risk. The risk of foreign investments is typically increased in less developed countries. These countries are also more likely to experience high levels of inflation, deflation or currency devaluation which could hurt their economies and securities markets.
Legal Proceedings
The Columbia International Bond Fund is not a party to any regulatory proceedings or litigation.
Columbia Management Advisors, LLC and Columbia Management Distributors, Inc. (collectively, the “Columbia Group”) are subject to a settlement agreement with the New York Attorney General (“NYAG”) (the “NYAG Settlement”) and a settlement order with the SEC (the “SEC Order”) on
24
Columbia International Bond Fund
May 31, 2009
matters relating to mutual fund trading, each dated February 9, 2005. Under the terms of the SEC Order, the Columbia Group (or predecessor entities) agreed, among other things, to: pay disgorgement and civil money penalties collectively totaling $140 million; cease and desist from violations of the antifraud provisions and certain other provisions of the federal securities laws; maintain certain compliance and ethics oversight structures; and retain an independent consultant to review the Columbia Group’s applicable supervisory, compliance, control and other policies and procedures. The NYAG Settlement, among other things, requires Columbia Management Advisors, LLC and its affiliates to reduce management fees for certain funds in the Columbia family of mutual funds in a projected total of $160 million over five years through November 30, 2009 and to make certain disclosures to investors relating to expenses. In connection with the Columbia Group providing services to the Columbia Funds, the Columbia Funds have voluntarily undertaken to implement certain governance measures designed to maintain the independence of their boards of trustees and certain special consulting and compliance measures.
Pursuant to the SEC Order and related procedures, the $140 million in settlement amounts described above has been substantially distributed in accordance with a distribution plan that was developed by an independent distribution consultant and approved by the SEC on April 6, 2007.
In connection with the events described above, various parties have filed suit against certain funds, the Trustees of the Columbia Funds, FleetBoston Financial Corporation and its affiliated entities and/or Bank of America and its affiliated entities.
On February 20, 2004, the Judicial Panel on Multidistrict Litigation transferred these cases and cases against other mutual fund companies based on similar allegations to the United States District Court in Maryland for consolidated or coordinated pretrial proceedings (the “MDL”). Subsequently, additional related cases were transferred to the MDL. On September 29, 2004, the plaintiffs in the MDL filed amended and consolidated complaints. One of these amended complaints is a putative class action that includes claims under the federal securities laws and state common law, and that names Columbia Management Advisors, Inc. (which has since merged into Banc of America Capital Management, LLC (now named Columbia Management Advisors, LLC)) (“Columbia”), Columbia Funds Distributor, Inc. (now named Columbia Management Distributors, Inc.) (the “Distributor”), the Trustees of the Columbia Funds, Bank of America Corporation and others as defendants. Another of the amended complaints is a derivative action purportedly on behalf of the Columbia Funds that asserts claims under federal securities laws and state common law.
On February 25, 2005, Columbia and other defendants filed motions to dismiss the claims in the pending cases. On March 1, 2006, for reasons stated in the court’s memoranda dated November 3, 2005, the United States District Court for the District of Maryland granted in part and denied in part the defendants’ motions to dismiss. The court dismissed all of the class action claims pending against the Columbia Funds Trusts. As to Columbia and the Distributor, the claims under the Securities Act of 1933, the claims under Sections 34(b) and 36(a) of the Investment Company Act of 1940 (“ICA”) and the state law claims were dismissed. The claims under Sections 10(b) and 20(a) of the Securities Exchange Act of 1934 and claims under Section 36(b) of the ICA were not dismissed.
On March 21, 2005, a purported class action was filed in Massachusetts state court alleging that certain conduct, including market timing, entitled Class B shareholders in certain Columbia Funds to an exemption from contingent deferred sales charges upon early redemption (the “CDSC Lawsuit”). The CDSC Lawsuit was removed to federal court in Massachusetts and transferred to the MDL.
On September 14, 2007, the plaintiffs and the Columbia defendants named in the MDL, including the Columbia Funds, entered into a stipulation of settlement with respect to all Columbia-related claims in the MDL described above, including the CDSC Lawsuit. The settlement is subject to court approval.
25
Report of Independent Registered Public Accounting Firm
To the Trustees of Columbia Funds Series Trust I and the Shareholders of Columbia International Bond Fund
In our opinion, the accompanying statement of assets and liabilities, including the investment portfolio, and the related statements of operations and of changes in net assets and the financial highlights present fairly, in all material respects, the financial position of Columbia International Bond Fund (the “Fund”) (a series of Columbia Funds Series Trust I) at May 31, 2009, the results of its operations, the changes in its net assets, and the financial highlights for the period December 1, 2008 (commencement of operations) through May 31, 2009, in conformity with accounting principles generally accepted in the United States of America. These financial statements and financial highlights (hereafter referred to as “financial statements”) are the responsibility of the Fund’s management. Our responsibility is to express an opinion on these financial statements based on our audit. We conducted our audit of these financial statements in accordance with the standards of the Public Company Accounting Oversight Board (United States). Those standards require that we plan and perform the audit to obtain reasonable assurance about whether the financial statements are free of material misstatement. An audit includes examining, on a test basis, evidence supporting the amounts and disclosures in the financial statements, assessing the accounting principles used and significant estimates made by management, and evaluating the overall financial statement presentation. We believe that our audit, which included confirmation of securities at May 31, 2009 by correspondence with the custodian and brokers, provides a reasonable basis for our opinion.
PricewaterhouseCoopers LLP
Boston, Massachusetts
July 21, 2009
26
Fund Governance – Columbia International Bond Fund
The Trustees serve terms of indefinite duration. The names, addresses and ages of the Trustees and officers of the Funds in the Columbia Funds Complex, the year each was first elected or appointed to office, their principal business occupations during at least the last five years, the number of Funds overseen by each Trustee and other directorships they hold are shown below. Each officer listed below serves as an officer of each Fund in the Columbia Funds Complex.
Independent Trustees
| | |
Name, address and year of birth,
Position with funds, Year first
elected or appointed to office | | Principal occupation(s) during past five years, Number of Funds in the Columbia
Funds Complex overseen by Trustee, Other Directorships Held |
| |
| John D. Collins (Born 1938) | | |
c/o Columbia Management Advisors, LLC One Financial Center Boston, MA 02111 Trustee (since 2007) | | Retired. Consultant, KPMG, LLP (accounting and tax firm) from July 1999 to June 2000; Partner, KPMG, LLP from March 1962 to June 1999. Oversees 79, Mrs. Fields Famous Brands LLC (consumer products); Suburban Propane Partners, L.P.; and Montpelier Re (underwriting firm) |
| |
| Rodman L. Drake (Born 1943) | | |
c/o Columbia Management Advisors, LLC One Financial Center Boston, MA 02111 Trustee (since 2007)
and Chairman of the Board
(since 2009) | | Co-Founder of Baringo Capital LLC (private equity) since 2002; President, Continuation Investments Group, Inc. from 1997 to 2001. Oversees 79, Jackson Hewitt Tax Service Inc. (tax preparation services); Crystal Capital River Inc. (real estate investment trust); Student Loan Corporation (student loan provider); Celgene Corporation (global biotechnology company); and The Helios Funds (exchange-traded funds) |
| |
| Douglas A. Hacker (Born 1955) | | |
c/o Columbia Management Advisors, LLC One Financial Center Boston, MA 02111 Trustee (since 1996) | | Independent business executive since May 2006; Executive Vice President–Strategy of United Airlines (airline) from December 2002 to May 2006; President of UAL Loyalty Services (airline marketing company) from September 2001 to December 2002; Executive Vice President and Chief Financial Officer of United Airlines from July 1999 to September 2001. Oversees 79, Nash Finch Company (food distributor); Aircastle Limited (aircraft leasing) |
|
| Janet Langford Kelly (Born 1957) |
c/o Columbia Management Advisors, LLC One Financial Center Boston, MA 02111 Trustee (since 1996) | | Senior Vice President, General Counsel and Corporate Secretary, ConocoPhillips (integrated energy company) since September 2007; Deputy General Counsel–Corporate Legal Services, ConocoPhillips from August 2006 to August 2007; Partner, Zelle, Hofmann, Voelbel, Mason & Gette LLP (law firm) from March 2005 to July 2006; Adjunct Professor of Law, Northwestern University, from September 2004 to June 2006; Director, UAL Corporation (airline) from February 2006 to July 2006; Oversees 79, None |
| |
| Charles R. Nelson (Born 1942) | | |
c/o Columbia Management Advisors, LLC One Financial Center Boston, MA 02111 Trustee (since 1981) | | Professor of Economics, University of Washington, since January 1976; Ford and Louisa Van Voorhis Professor of Political Economy, University of Washington, since September 1993; Adjunct Professor of Statistics, University of Washington, since September 1980; Associate Editor, Journal of Money Credit and Banking, 1993-2008 Consultant on econometric and statistical matters. Oversees 79, None |
27
Fund Governance (continued) – Columbia International Bond Fund
Independent Trustees (continued)
| | |
Name, address and year of birth,
Position with funds, Year first
elected or appointed to office | | Principal occupation(s) during past five years, Number of Funds in the Columbia
Funds Complex overseen by Trustee, Other Directorships Held |
| |
| John J. Neuhauser (Born 1943) | | |
c/o Columbia Management Advisors, LLC One Financial Center Boston, MA 02111 Trustee (since 1985) | | President, Saint Michael’s College, since August 2007; University Professor, Boston College from November 2005 to August 2007; Academic Vice President and Dean of Faculties, Boston College from August 1999 to October 2005. Oversees 79, Liberty All-Star Equity Fund and Liberty All-Star Growth Fund, Inc. (closed-end funds) |
| |
| Jonathan Piel (Born 1938) | | |
c/o Columbia Management Advisors, LLC One Financial Center Boston, MA 02111 Trustee (since 2007) | | Cable television producer and website designer; The Editor, Scientific American from 1984 to 1994; Vice President, Scientific American, Inc., from 1984 to 1994; Member, Advisory Board, Stone Age Institute, Bloomington, Indiana (research institute that explores the effect of technology on human evolution); Member, Board of Directors of the National Institute of Social Sciences, New York City; Member, Board of Trustees of the William Alanson White Institute, New York City (institution for training psychoanalysts); and Member, Advisory Board, Mount Sinai Children’s Environmental Health Center, New York. Oversees 79, None |
| |
| Patrick J. Simpson (Born 1944) | | |
c/o Columbia Management Advisors, LLC One Financial Center Boston, MA 02111 Trustee (since 2000) | | Partner, Perkins Coie LLP (law firm). Oversees 79, None |
|
| Thomas C. Theobald (Born 1937) |
c/o Columbia Management Advisors, LLC One Financial Center Boston, MA 02111 Trustee (since 1996) | | Partner and Senior Advisor, Chicago Growth Partners (private equity investing) since September 2004; Managing Director, William Blair Capital Partners (private equity investing) from September 1994 to September 2004. Oversees 79, Anixter International (network support equipment distributor); Ventas, Inc. (real estate investment trust); Jones Lang LaSalle (real estate management services); Ambac Financial Group (financial guaranty insurance) |
| |
| Anne-Lee Verville (Born 1945) | | |
c/o Columbia Management Advisors, LLC One Financial Center Boston, MA 02111 Trustee (since 1998) | | Retired since 1997 (formerly General Manager–Global Education Industry (from 1994 to 1997), President–Application Systems Division (from 1991 to 1994), Chief Financial Officer–US Marketing & Services (from 1988 to 1991), and Chief Information Officer (from 1987 to 1988), IBM Corporation (computer and technology)). Oversees 79, None |
Interested Trustee
| | |
| |
| William E. Mayer1 (Born 1940) | | |
c/o Columbia Management Advisors, LLC One Financial Center Boston, MA 02111 Trustee (since 1994) | | Partner, Park Avenue Equity Partners (private equity) since February 1999; Dean and Professor, College of Business, University of Maryland from 1992 to 1997. Oversees 79, Lee Enterprises (print media), WR Hambrecht + Co. (financial service provider); BlackRock Kelso Capital Corporation (investment company) |
| 1 | Mr. Mayer is an “interested person” (as defined in the Investment Company Act of 1940) by reason of his affiliation with WR Hambrecht + Co., a registered broker/dealer that may execute portfolio transactions for or engage in principal transactions with the Funds or other funds or accounts advised/managed by the Advisor or other Bank of America affiliates. |
The Statement of Additional Information includes additional information about the Trustees of the Funds and is available, without charge, upon request by calling 1-800-345-6611.
28
Fund Governance (continued) – Columbia International Bond Fund
Officers
| | |
Name, address and year of birth,
Position with funds, Year first
elected or appointed to office | | Principal occupation(s) during past five years |
|
| J. Kevin Connaughton (Born 1964) |
One Financial Center Boston, MA 02111 President (since 2009) | | Managing Director of Columbia Management Advisors, LLC since December 2004; Senior Vice President and Chief Financial Officer–Columbia Funds, from June 2008 to January 2009; Treasurer–Columbia Funds, from October 2003 to May 2008; Treasurer–the Liberty Funds, Stein Roe Funds and Liberty All-Star Funds, December 2000–December 2006; Senior Vice President–Columbia Management Advisors, LLC, from April 2003 to December 2004; President–Columbia Funds, Liberty Funds and Stein Roe Funds, February 2004 to October 2004; Treasurer–Galaxy Funds, September 2002 to December 2005; Treasurer, December 2002 to December 2004, and President, February 2004 to December 2004–Columbia Management Multi-Strategy Hedge Fund, LLC; and a senior officer of various other Bank of America-affiliated entities, including other registered and unregistered funds. |
|
| James R. Bordewick, Jr. (Born 1959) |
One Financial Center Boston, MA 02111 Senior Vice President, Secretary and Chief Legal Officer (since 2006) | | Associate General Counsel, Bank of America since April 2005; Senior Vice President and Associate General Counsel, MFS Investment Management (investment management) prior to April 2005. |
| |
| Linda J. Wondrack (Born 1964) | | |
One Financial Center Boston, MA 02111 Senior Vice President and Chief Compliance Officer (since 2007) | | Director (Columbia Management Group LLC and Investment Product Group Compliance), Bank of America since June 2005; Director of Corporate Compliance and Conflicts Officer, MFS Investment Management (investment management), August 2004 to May 2005; Managing Director, Deutsche Asset Management (investment management) prior to August 2004. |
| |
| Michael G. Clarke (Born 1969) | | |
One Financial Center Boston, MA 02111 Senior Vice President and Chief Financial Officer (since 2009) | | Director of Fund Administration of the Advisor since January 2006; Managing Director of the Advisor September 2004 to December 2005; Vice President Fund Administration June 2002 to September 2004. |
| |
| Jeffrey R. Coleman (Born 1969) | | |
One Financial Center Boston, MA 02111 Deputy Treasurer (since 2008) | | Director of Fund Administration of the Advisor since January 2006; Fund Controller of the Advisor from October 2004 to January 2006; Vice President of CDC IXIS Asset Management Services, Inc. (investment management) from August 2000 to September 2004. |
| |
| Joseph F. DiMaria (Born 1968) | | |
One Financial Center Boston, MA 02111 Chief Accounting Officer and Treasurer (since 2009) | | Director of Fund Administration of the Advisor since January 2006; Head of Tax/Compliance and Assistant Treasurer of the Advisor from November 2004 to December 2005; Director of Trustee Administration (Sarbanes-Oxley) of the Advisor from May 2003 to October 2004. |
29
Fund Governance (continued) – Columbia International Bond Fund
Officers (continued)
| | |
Name, address and year of birth,
Position with funds, Year first
elected or appointed to office | | Principal occupation(s) during past five years |
| |
| Julian Quero (Born 1967) | | |
One Financial Center Boston, MA 02111 Deputy Treasurer (since 2008) | | Senior Tax Manager of the Advisor since August 2006; Senior Compliance Manager of the Advisor from April 2002 to August 2006. |
| |
| Barry S. Vallan (Born 1969) | | |
One Financial Center Boston, MA 02111 Controller (since 2006) | | Vice President–Fund Treasury of the Advisor since October 2004; Vice President–Trustee Reporting of the Advisor from April 2002 to October 2004. |
| |
| Stephen T. Welsh (Born 1957) | | |
One Financial Center Boston, MA 02111 Vice President (since 1996) | | President, Columbia Management Services, Inc. since July 2004; Senior Vice President and Controller, Columbia Management Services, Inc. prior to July 2004. |
30
Board Consideration and Approval of Advisory Agreements
The Advisory Fees and Expenses Committee of the Board of Trustees meets several times annually to review the advisory agreements (collectively, the “Agreements”) of the funds for which the Trustees serve as trustees (each a “fund”) and to determine whether to recommend that the full Board approve the continuation of the Agreements for an additional one-year period. After the Committee has made its recommendation, the full Board, including the Independent Trustees, determines whether to approve the continuation of the Agreements. In addition, the full Board, including the Independent Trustees, considers matters bearing on the Agreements at most of its other meetings throughout the year and meets regularly with senior management of the funds and Columbia, the funds’ investment adviser, including the senior manager of each investment area within Columbia. Through the Board’s Investment Oversight Committees, Trustees also meet with selected fund portfolio managers, research analysts and traders at various times throughout the year.
The Trustees receive and review all materials that they, their legal counsel or Columbia believe to be reasonably necessary for the Trustees to evaluate the Agreements and to determine whether to approve the continuation of the Agreements. Those materials generally include, among other items, (i) information on the investment performance of each fund relative to the performance of peer groups of mutual funds and the fund’s performance benchmarks, and additional information assessing performance on a risk-adjusted basis, (ii) information on each fund’s advisory fees and other expenses, including information comparing the fund’s expenses to those of peer groups of mutual funds and information about any applicable expense caps and fee “breakpoints,” (iii) information about the profitability of the Agreements to Columbia, including potential “fall-out” or ancillary benefits that Columbia and its affiliates may receive as a result of their relationships with the funds and (iv) information obtained through Columbia’s response to a questionnaire prepared at the request of the Trustees by counsel to the funds and independent legal counsel to the Independent Trustees. The Trustees also consider other information such as (v) Columbia’s financial results and financial condition, (vi) each fund’s investment objective and strategies and the size, education and experience of Columbia’s investment staffs and their use of technology, external research and trading cost measurement tools, (vii) the allocation of the funds’ brokerage and the use of “soft” commission dollars to pay for research products and services, (viii) Columbia’s resources devoted to, and its record of compliance with, the funds’ investment policies and restrictions, policies on personal securities transactions and other compliance policies and legal and regulatory requirements, (ix) Columbia’s response to various legal and regulatory proceedings since 2003 and to the recent period of volatility in the securities markets and (x) the economic outlook generally and for the mutual fund industry in particular. In addition, the Advisory Fees and Expenses Committee confers with the funds’ independent fee consultant and reviews materials relating to the funds’ relationships with Columbia provided by the independent fee consultant. Throughout the process, the Trustees have the opportunity to ask questions of and to request additional materials from Columbia and to consult with the independent fee consultant and independent legal counsel to the Independent Trustees.
Columbia International Bond Fund is a newly-established fund. At their October 2008 meetings, the Advisory Fees and Expenses Committee recommended for approval, and the Board approved an amendment adding Columbia International Bond Fund to the management agreement between Columbia Funds Series Trust I and Columbia (the Management Agreement). It was also at the October 2008 meeting that the Fees and Expenses Committee most recently recommended for approval and the Board of Trustees most recently approved the continuation of all of the funds’ Agreements, following meetings of the Advisory Fees and Expenses Committee held in February, April, August, September and October, 2008. In considering whether to approve the addition of the Columbia International Bond Fund to the Management Agreement and the continuation of the Agreements, the Trustees, including the Independent Trustees, did not identify any single factor as determinative, and each weighed various factors as he or she deemed appropriate. The Trustees considered the following matters in connection with their initial approval and their approval of the continuation of the Agreements:
The nature, extent and quality of the services provided to the funds under the Agreements. The Trustees considered the nature, extent and quality of the services provided by Columbia and its affiliates to the funds (and proposed to be provided to Columbia International Bond Fund) and the
31
resources dedicated to the funds (and proposed to be dedicated to Columbia International Bond Fund) by Columbia and its affiliates. Among other things, the Trustees considered (i) Columbia’s ability (including its personnel and other resources, compensation programs for personnel involved in fund management, reputation and other attributes) to attract, motivate and retain highly qualified research, advisory and supervisory investment professionals; (ii) the portfolio management services provided by those investment professionals; and (iii) the trade execution services provided on behalf of the funds. For each fund, the Trustees also considered the benefits to shareholders of investing in a mutual fund that is part of a family of funds offering exposure to a variety of asset classes and investment disciplines and providing a variety of fund and shareholder services. After reviewing those and related factors, the Trustees concluded, within the context of their overall conclusions regarding each of the Agreements, that the nature, extent and quality of services provided supported the approval and continuation of the Agreements.
Investment performance of the funds and Columbia. The Trustees reviewed information about the performance of each fund (other than Columbia International Bond Fund) over various time periods, including information prepared by management and an independent third-party data provider that compared the performance of each such fund to the performance of peer groups of mutual funds and performance benchmarks. The Trustees also reviewed a description of the third party’s methodology for identifying each fund’s peer group for purposes of performance and expense comparisons. For Columbia International Bond Fund, which commenced investment operations on December 1, 2008, the Trustees reviewed information about the performance of an account managed by Columbia in the substantially the same style as Columbia International Bond Fund over various time periods, including information provided by Columbia that compared the performance of such account to the performance of a peer group of mutual funds and a performance benchmark. The Trustees noted that, through June 30, 2008, the account had outperformed its benchmark and its peer group average for the one-year period, and had outperformed its benchmark and underperformed its peer group average for the year-to-date.
The Trustees also considered Columbia’s performance and reputation generally, the funds’ performance as a fund family generally, and Columbia’s historical responsiveness to Trustee concerns about performance and Columbia’s willingness to take steps intended to improve performance. After reviewing those and related factors, the Trustees concluded, within the context of their overall conclusions regarding each of the Agreements, that the performance of each fund and Columbia was sufficient, in light of other considerations, to warrant the approval and continuation of the Agreement pertaining to that fund.
The costs of the services provided and profits realized by Columbia and its affiliates from their relationships with the funds. The Trustees considered the fees charged (and proposed to be charged) to the funds for advisory services as well as the total expense levels of the funds. That information included comparisons (provided by Columbia Management) of the proposed advisory fees and expected total expense levels of Columbia International Bond Fund to those of a peer group for the purposes of expense comparisons. The Trustees considered that the proposed net total expenses for the Columbia International Bond Fund were in the third quintile and proposed net actual management fees were in the first quintile (where lowest fees and expenses would be in the first quintile) of the peer group selected by Columbia for purposes of expense comparisons. In connection with the continuation of the Agreements, the Trustees reviewed information about the advisory fees charged by Columbia to comparable institutional accounts. In considering the fees charged to those accounts, the Trustees took into account, among other things, management’s representations about the differences between managing mutual funds as compared to other types of accounts, including differences in the services provided, differences in the risk profile of such business for Columbia, and the additional resources required to manage mutual funds effectively. In evaluating each fund’s advisory fees, the Trustees also took into account the demands, complexity and quality of the investment management of the fund. The Trustees considered existing advisory fee breakpoints, and Columbia’s use of advisory fee waivers and expense caps, which benefited a number of the funds. The Trustees also noted management’s stated justification for the fees charged to the funds, which included information about the investment performance of the funds and the services provided to the funds.
The Trustees also considered the compensation directly or indirectly received by Columbia and its affiliates from their
32
relationships with the funds. The Trustees reviewed information provided by management as to the profitability to Columbia and its affiliates of their relationships with each fund, and information about the allocation of expenses used to calculate profitability. When reviewing profitability, the Trustees also considered court cases in which adviser profitability was an issue in whole or in part, the performance of the relevant funds, the expense level of each fund, and whether Columbia had implemented breakpoints and/or expense caps with respect to the fund.
After reviewing those and related factors, the Trustees concluded, within the context of their overall conclusions regarding each of the Agreements, that the advisory fees charged and proposed to be charged to each fund, and the related profitability (expected profitability, for Columbia International Bond Fund) to Columbia and its affiliates of their relationships with the fund, supported the approval and continuation of the Agreement pertaining to that fund.
Economies of Scale. The Trustees considered the existence of any economies of scale in the provision by Columbia of services to each fund, to groups of related funds, and to Columbia’s investment advisory clients as a whole and whether those economies were shared with the funds through breakpoints in the investment advisory fees or other means, such as fee waivers/expense reductions and additional investments by Columbia in investment, trading and compliance resources. The Trustees noted that many of the funds benefited from breakpoints, fee waivers/expense caps, or both. In considering those issues, the Trustees also took note of the costs of the services provided (both on an absolute and a relative basis) and the profitability to Columbia and its affiliates of their relationships with the funds, as discussed above.
After reviewing those and related factors, the Trustees concluded, within the context of their overall conclusions regarding each of the Agreements, that the extent to which economies of scale were shared with the funds supported the approval and continuation of the Agreements.
Other Factors. The Trustees also considered other factors, which included but were not limited to the following:
| n | | the extent to which each fund had operated in accordance with its investment objective and investment restrictions, the nature and scope of the compliance programs of the funds and Columbia and the compliance-related resources that Columbia and its affiliates were providing to the funds; |
| n | | the nature, quality, cost and extent of administrative and shareholder services overseen and performed by Columbia and its affiliates, both under the Agreements and under separate agreements for the provision of transfer agency and administrative services; and |
| n | | so-called “fall-out benefits” to Columbia and its affiliates, such as the engagement of its affiliates to provide distribution, brokerage and transfer agency services to the funds, and the benefits of research made available to Columbia by reason of brokerage commissions generated by the funds’ securities transactions, as well as possible conflicts of interest associated with those fall-out and other benefits, and the reporting, disclosure and other processes in place to disclose and monitor those possible conflicts of interest; |
Based on their evaluation of all factors that they deemed to be material, including those factors described above, and assisted by the advice of independent counsel and the independent fee consultant, the Trustees, including the Independent Trustees, approved the addition of the Columbia International Bond Fund to the Management Agreement and the continuance of each of the Agreements through October 31, 2009.
33
Summary of Management Fee Evaluation by Independent Fee Consultant
EXCERPTS FROM REPORT OF INDEPENDENT FEE CONSULTANT TO THE FUNDS SUPERVISED BY THE COLUMBIA ATLANTIC BOARD
Prepared Pursuant to the February 9, 2005 Assurance of Discontinuance among the Office of Attorney General of New York State, Columbia Management Advisors, LLC, and Columbia Management Distributors, Inc. November 3, 2008
I. Overview
On February 9, 2005, Columbia Management Advisors, LLC (“CMA”) and Columbia Management Distributors, Inc.1 (“CMD”) agreed to the New York Attorney General’s Assurance of Discontinuance (“AOD”). Among other things, the AOD stipulates that CMA may manage or advise a Columbia Fund (“Columbia Fund” and, together with some or all of, such funds the “Columbia Funds”) only if the Independent Members of the Columbia Fund’s Board of Trustees appoint a Senior Officer or retain an Independent Fee Consultant (“IFC”) who is to manage the process by which proposed management fees are negotiated. The AOD further stipulates that the Senior Officer or IFC is to prepare a written annual evaluation of the fee negotiation process.
With effect from January 1, 2007, the Independent Members of the Board of Trustees for certain Columbia Funds known collectively as the “Atlantic Funds” (together with the other members of that Board, the “Trustees”) retained me as IFC for the Atlantic Funds.2 In this capacity, I have prepared the fourth annual written evaluation of the fee negotiation process. As was the case with last year’s report (the “2007 Report”) my immediate predecessor as IFC, John Rea, provided invaluable assistance in the preparation of this year’s report.
A. Role of the Independent Fee Consultant
The AOD charges the IFC with “managing the process by which proposed management fees…to be charged the Columbia Fund are negotiated so that they are negotiated in a manner which is at arms’ length and reasonable and consistent with this Assurance of Discontinuance.” The AOD also provides that CMA “may manage or advise a Columbia Fund only if the reasonableness of the proposed management fees is determined by the Board of Trustees…using…an annual independent written evaluation prepared by or under the direction of…the Independent Fee Consultant.” Therefore, the AOD makes clear that the IFC does not supplant the Trustees in negotiating management fees with CMA, nor does the IFC substitute his or her judgment for that of the Trustees with respect to the reasonableness of proposed fees or any other matter that is committed to the business judgment of the Trustees.
B. Elements Involved in Managing the Fee Negotiation Process
In preparing the report required by the AOD, the IFC must consider at least the following six factors set forth in the AOD:
| 1. | The nature and quality of CMA’s services, including the Fund’s performance; |
| 2. | Management fees (including any components thereof) charged by other mutual fund companies for like services; |
| 3. | Possible economies of scale as the Fund grows larger; |
| 4. | Management fees (including any components thereof) charged to institutional and other clients of CMA for like services; |
| 5. | Costs to CMA and its affiliates of supplying services pursuant to the management fee agreements, excluding any intra-corporate profit; and |
| 6. | Profit margins of CMA and its affiliates from supplying such services. |
C. Organization of the Annual Evaluation
This report, like last year’s, focuses on the six factors and contains a section for each factor except that CMA’s costs and profits from managing the Funds have been combined into a single section. In addition to a discussion of these factors, the report offers recommendations to improve the fee review process in future years. A review of the status of
| 1 | CMA and CMD are subsidiaries of Columbia Management Group, LLC (“CMG”), and are the successors to the entities named in the AOD. |
| 2 | I have no material relationship with Bank of America, CMG or any of its affiliates, aside from serving as IFC, and I am aware of no material relationship with any of their affiliates. I retained John Rea, an independent economic consultant, to assist me with this report. |
| | Unless otherwise stated or required by the context, this report covers only the Atlantic Funds, which are also referred as the “Funds.” |
34
recommendations made in the 2007 Report is being provided separately with the materials for the October meeting.
II. Summary of Findings
A. General
| 1. | Based upon my examination of the information supplied by CMG in the light of the six factors set forth in the AOD, I conclude that the Trustees have the relevant information necessary to evaluate the reasonableness of the proposed management fees for each Atlantic Fund. |
| 2. | In my view, the process by which the proposed management fees of the Funds have been negotiated in 2008 thus far has been, to the extent practicable, at arms’ length and reasonable and consistent with the AOD. |
B. Nature and Quality of Services, Including Performance
| 3. | The performance of the Funds has been relatively strong in recent years. Based upon 1-, 3-, 5-, and 10-year returns through April 30, 2008, at least half of all the Funds were in the first and second performance quintiles in each of the four performance periods and, at most, only 11% were in the fifth quintile in any one performance period. Both equity and fixed-income funds posted strong performance relative to comparable funds. |
| 4. | Performance rankings were similar in 2007 and 2008, although last year’s were slightly stronger. Despite the stability in the distribution of rankings in the two years, at least half the Funds changed quintile rankings between the two years in at least one of the 1-, 3-, and 5-year performance periods. |
| 5. | The performance of the actively managed equity Funds against their benchmarks was very strong. At least 57% and as many as 73% posted net returns exceeding their benchmarks over the 1-, 3-, and 5-year periods. In contrast, gross and net returns of fixed-income Funds typically fell short of their benchmarks. |
| 6. | Atlantic equity Funds’ overall performance adjusted for risk also was strong. Based upon 3-year returns, nearly 80% of the equity Funds had a combination of risk-adjusted and unadjusted returns that placed them in the top half of their performance universes. Only about one-fifth of the fixed income Funds posted high returns and low risk relative to comparable funds. About two-thirds of the fixed-income Funds took on more risk than the typical fund in their performance universes. |
| 7. | The industry-standard procedure used by Lipper that includes all share classes in the performance universe tends to bias a Fund’s ranking upward within that universe. The bias occurs because either no-12b-1 fee or low-12b-1 fee share classes of the Atlantic Funds are compared with funds in performance universes that include all share classes of multi-class funds with 12b-1 fees of up to 100 basis points. Correcting this bias by limiting the performance universe to classes of comparable funds with low or no 12b-1 fees (a “filtered universe”) lowers the relative performance for the Funds, but their performance, on the whole, remains strong. The filtering process, however, did identify two Funds for further review that had not been designated review funds using unfiltered universes. |
| 8. | A small number of Funds have consistently underperformed over the past four years. The exact number depends on the criteria used to evaluate longer-term performance. For example, the one-year returns of one Fund have been in the fourth or fifth performance quintiles in each of the past four years; there are six Funds whose three-year returns have been in the fourth or fifth quintile over the past four years. |
| 9. | The services performed by CMG professionals beyond portfolio management, such as compliance, legal, information technology, risk management, finance and fund administration, are critical to the success of the Funds and appear to be of high quality. |
C. Management Fees Charged by Other Mutual Fund Companies
| 10. | The Funds’ management fees and total expenses are generally low relative to those of their peers. Only 21% of the Funds ranked in the two most expensive quintiles for actual management fees, and only 23% in those quintiles for total expenses. |
| 11. | The highest concentration of low-expense Funds is found among the equity and tax-exempt fixed income Funds. The 12 former Excelsior Funds have relatively high fees and expenses, with half of those Funds ranking in either the fourth or fifth quintiles. The higher actual management fee |
35
| | rankings of certain Excelsior Funds are due in part to fee schedules that are higher than standard Columbia Fund fee schedules at current asset levels. After discussion with the Trustees, CMA is proposing to lower the management fees on three of these Funds. |
| 12. | The distribution of expense rankings is similar in 2007 and 2008, while management fee rankings improved markedly in 2008. Part of the improvement reflects expense limitations introduced last year for the state intermediate municipal bond Funds. |
| 13. | The management fees of the Atlantic Funds are generally in line with those of Columbia Funds supervised by the Nations Board of Trustees (the “Nations Funds”). In investment categories in which the Atlantic Funds have higher average fees, the difference principally arises out of differences in asset size. |
D. Trustees’ Fee and Performance Evaluation Process
| 14. | The Trustees’ evaluation process identified 17 Funds in 2008 for further review based upon their relative performance or expenses or both. When compared in filtered universes, two more Funds met the criteria for further review. CMG provided further information about those Funds to assist the Trustees in their evaluation. |
E. Potential Economies of Scale
| 15. | CMG presented to the Trustees its analysis of the sources and sharing of potential economies of scale. CMG views economies of scale as arising at the complex level and would regard estimates of scale economies for individual funds as unreliable. In its analysis, CMG did not identify specific sources of economies of scale or provide any estimates of any economies of scale that might arise from future asset growth. CMG’s analysis included measures taken by the Trustees and CMG that seek to share any potential economies of scale through breakpoints in management fee schedules, expense reimbursements, fee waivers, enhanced shareholder services, fund mergers, and operational consolidation. |
| 16. | An examination of the contractual fee schedules for five Atlantic Funds shows that they are generally in line with those of their competitors, in terms of number and extent of fee breakpoints. A similar examination last year of five different Funds led to the same conclusion. |
F. Management Fees Charged to Institutional Clients
| 17. | CMG has provided Trustees with comparisons of mutual fund management fees and institutional fees based upon standardized fee schedules and upon actual fees. The results show that, consistent with industry practice, institutional fees are generally lower than the Funds’ management fees. However, because the services provided and risks borne by the manager are more extensive for mutual funds compared to institutional accounts, the differences are of limited value in assisting the Trustees in their review of the reasonableness of the Funds’ management fees. |
G. Revenues, Expenses, and Profits
| 18. | The activity-based cost allocation methodology (“ABC”) employed by CMG to allocate costs, both direct and indirect, for purposes of calculating Fund profitability is thoughtful and detailed. This year, CMG proposed a change to the method by which indirect expenses are allocated. Under this “hybrid” method, indirect costs relating to fund management are allocated among the Funds 50% by assets and 50% per Fund. Allocating indirect expenses equally to each Fund has an intuitive logic, as each Fund regardless of size has certain expenses, such as preparing and printing prospectuses and financial statements. |
| 19. | The materials provided on CMG’s revenues and expenses with respect to the Funds and the methodology underlying their construction form a sufficient basis for Trustees to evaluate the expenses and profitability of the Funds. |
| 20. | In 2007, CMG’s complex-wide pre-tax margins on the Atlantic Funds were slightly below industry medians, based on limited data available for publicly held mutual fund managers. However, as is to be expected in a complex now comprising 75 Funds (including former Excelsior Funds), some Atlantic Funds have relatively high pre-tax profit margins, when calculated solely with respect to management revenues and expenses, while other Atlantic Funds operate at a loss. There is a positive relationship between fund size and profitability, with smaller funds generally operating at a loss. |
| 21. | CMG pays a fixed percentage of its management fee revenues to an affiliate, U.S. Trust, Bank of America |
36
| | Private Wealth Management, to compensate it for services it performs with respect to Atlantic Fund assets held for the benefit of its customers. Based on our analysis of the services provided by this affiliate, we have concluded that all payments other than those for sub-transfer agent or sub-accounting services should be treated as a distribution expense. |
III. Recommendations
| 1) | Criteria for review. The Trustees may wish to consider modifying the criteria for classifying a fund as a “Review Fund” to include criteria that focus exclusively on performance without regard to expense or fee levels. For example, a fund whose one-year or three-year performance was median or below for four consecutive years could be treated as a Review Fund. When we applied such criteria to the Funds, several additional Funds would have been added to the list of Review Funds. |
| 2) | Profitability data. CMG should present to the Trustees each year the profitability of each Fund, each investment style and each complex (of which Atlantic is one) calculated as follows: |
| | a. | Management-only profitability should be calculated without reference to any Private Bank expense. |
| | b. | Profitability excluding distribution (which essentially covers the management and transfer agency functions) should be adjusted by removing from the expense calculation any portion of the Private Bank payment not attributable to the performance by the Private Bank of sub-transfer agency or sub-accounting functions. |
| | c. | Total profitability, including distribution: No adjustment for Private Bank expenses should be made, because all such expenses represent legitimate fund expenses to be taken into account in calculating CMG’s profit margin including distribution. |
| | d. | Distribution only: This should include all Private Bank expenses other than those attributable to sub-transfer agency services. |
Therefore, the following data need not be provided:
| | 1. | Adjusting total profitability data for Private Bank expenses |
| | 2. | Adjusting profitability excluding distribution by backing out all Private Bank expenses. |
| 3) | Potential economies of scale. CMG and the IFC should continue to work on methods for more precisely quantifying to the extent possible the sources and magnitude of any economies of scale as CMG’s mutual fund assets under management increase, to the extent that the data allows for meaningful year-over-year comparisons. The framework suggested in Section IV.D.4 may prove to be a useful model for such an analysis. |
| 4) | Competitive breakpoint analysis. As part of the annual fee evaluation process, the breakpoints of a select group of Atlantic Funds (which would differ each year) should continue to be compared to those of industry rivals to ensure that the Funds’ breakpoint schedules remain within industry norms. As breakpoint schedules change relatively little each year, performing such a comparison for each Atlantic Fund each year would not be an efficient use of Trustee and CMG resources. |
| 5) | Cost allocation methodology. CMG’s point that the current ABC system of allocating indirect expenses creates anomalous results in several cases, including sub-advised Funds, is well-taken. We would like to work with CMG over the forthcoming year on alternatives to the current system of allocating indirect expenses that (1) resolve the anomalies, (2) limit the amount of incremental effort on CMG’s part and (3) remain faithful to the general principle that expenses should be allocated by time and effort to the extent reasonably possible. |
| 6) | Management fee disparities. CMG and the Atlantic Trustees, as part of any future study of management fees, should analyze the differences in management fee schedules, principally arising out of the reorganization of the former Excelsior Funds as Atlantic Funds. As part of that analysis, CMG should provide an explanation for any significant fee differences among comparable funds across fund families managed by CMA, such as differences in the management styles of different Funds included the same Lipper category. Finally, whenever CMG proposes a management fee change or an expense cap for any mutual fund managed by CMA that is comparable to any Atlantic Fund, CMG should provide the Trustees with sufficient information about the proposal to allow the Trustees to assess the applicability of the proposed change to the relevant Atlantic Fund or Funds. |
37
| 7) | Tax-exempt Fund expense data. The expense rankings of certain tax-exempt Funds were adversely affected by including certain investment-related interest expenses that Lipper excluded in calculating the expense ratios of competitors. We recommend that CMG follow the Lipper practice and exclude such interest expenses from data submitted to Lipper to avoid unfairly disadvantaging the tax-exempt Funds. |
| 8) | Reduction of volume of paper documents submitted. The effort to rationalize and simplify the data presented to the Trustees and the process by which that data was prepared and organized was regarded as a success by all parties. We should continue to look for opportunities to reduce and simplify the presentation of 15(c) data, especially in the area of Fund profitability. The Fund “Dashboard” volume presents a large volume of Fund data on a single page. If it is continued, the Trustees may wish to consider receiving the underlying Lipper data on CD, rather than the current paper volumes. |
Respectfully submitted,
Steven E. Asher
38
[THIS PAGE INTENTIONALLY LEFT BLANK]
39
[THIS PAGE INTENTIONALLY LEFT BLANK]
40
Important Information About This Report – Columbia International Bond Fund
The fund mails one shareholder report to each shareholder address. If you would like more than one report, please call shareholder services at 1-800-345-6611 and additional reports will be sent to you. This report has been prepared for shareholders of Columbia International Bond Fund.
A description of the policies and procedures that the fund uses to determine how to vote proxies and a copy of the fund’s voting records are available (i) at www.columbiamanagement.com; (ii) on the Securities and Exchange Commission’s website at www.sec.gov, and (iii) without charge, upon request, by calling 1-800-368-0346. Information regarding how the fund voted proxies relating to portfolio securities during the 12-month period ended June 30 is available from the SEC’s website. Information regarding how the fund voted proxies relating to portfolio securities is also available from the fund’s website, www.columbiamanagement.com.
The fund files a complete schedule of portfolio holdings with the SEC for the first and third quarters of each fiscal year on Form N-Q. The fund’s Form N-Q is available on the SEC’s website at www.sec.gov and may be reviewed and copied at the SEC’s Public Reference Room in Washington, D.C. Information on the operation of the Public Reference Room may be obtained by calling
1-800-SEC-0330.
Please read and consider the investment objectives, risks, charges and expenses for any fund carefully before investing. For a prospectus which contains this and other important information about a fund, contact your Columbia Management representative or financial advisor or go to www.columbiamanagement.com.
Columbia Management Group, LLC (“Columbia Management”) is the investment management division of Bank of America Corporation. Columbia Management entities furnish investment management services and products for institutional and individual investors. Columbia Funds are distributed by Columbia Management Distributors, Inc., member of FINRA, SIPC, part of Columbia Management and an affiliate of Bank of America Corporation.
Transfer Agent
Columbia Management Services, Inc.
P.O. Box 8081
Boston, MA 02266-8081
1-800-345-6611
Distributor
Columbia Management
Distributors, Inc.
One Financial Center
Boston, MA 02111
Investment Advisor
Columbia Management Advisors, LLC
100 Federal Street
Boston, MA 02110
41

One Financial Center
Boston, MA 02111-2621
Columbia International Bond Fund
Annual Report, May 31, 2009
©2009 Columbia Management Distributors, Inc.
One Financial Center, Boston, MA 02111-2621
800.345.6611 www.columbiafunds.com
SHC 42/16612-0509 (07/09) 09/82450
Item 2. Code of Ethics.
(a) The registrant has, as of the end of the period covered by this report, adopted a code of ethics that applies to the registrant’s principal executive officer, principal financial officer, principal accounting officer or controller, or persons performing similar functions, regardless of whether these individuals are employed by the registrant or a third party.
(b) During the period covered by this report, there were not any amendments to a provision of the code of ethics adopted in 2(a) above.
(c) During the period covered by this report, there were no waivers, including any implicit waivers, from a provision of the code of ethics described in 2(a) above that relates to one or more of the items set forth in paragraph (b) of this item’s instructions.
Item 3. Audit Committee Financial Expert.
The registrant’s Board of Trustees has determined that John D. Collins, Douglas A. Hacker, Charles R. Nelson and Anne-Lee Verville, each of whom are members of the registrant’s Board of Trustees and Audit Committee, each qualify as an audit committee financial expert. Mr. Collins, Mr. Hacker, Mr. Nelson and Ms. Verville are each independent trustees, as defined in paragraph (a)(2) of this item’s instructions.
Item 4. Principal Accountant Fees and Services.
Fee information below is disclosed for the three series of the registrant whose report to stockholders is included in this annual filing. Fee information for fiscal year ended May 31, 2009 also includes fees for one series that commenced operations during the period. Fee information for fiscal year ended May 31, 2008 also includes fees for one series that merged into the registrant during the period.
(a) Audit Fees. Aggregate Audit Fees billed by the principal accountant for professional services rendered during the fiscal years ended May 31, 2009 and May 31, 2008 are approximately as follows:
2009 | | 2008 | |
$ | 146,400 | | $ | 109,900 | |
| | | | | |
Audit Fees include amounts related to the audit of the registrant’s annual financial statements or services that are normally provided by the accountant in connection with statutory and regulatory filings or engagements for those fiscal years. Audit fees for fiscal year 2009 also includes fees for the review of and provision of consent in connection with filing Form N-1A for one new series. Fiscal year 2009 and 2008 also includes Audit Fees for the review of and re-issuance of an audit opinion in conjunction with the filing of a Securities Registration Statement in Japan.
(b) Audit-Related Fees. Aggregate Audit-Related Fees billed to the registrant by the principal accountant for professional services rendered during the fiscal years ended May 31, 2009 and May 31, 2008 are approximately as follows:
Audit-Related Fees include amounts for assurance and related services by the principal accountant that are reasonably related to the performance of the audit of the registrant’s financial statements and are not reported in Audit Fees above. In both fiscal years 2009 and 2008, Audit-Related Fees consist of agreed-upon procedures performed for semi-annual shareholder reports. Fiscal year 2008 also includes Audit-Related Fees for agreed-upon procedures related to a fund merger and a fund accounting and custody conversion.
During the fiscal years ended May 31, 2009 and May 31, 2008, there were no Audit-Related Fees billed by the registrant’s principal accountant to the registrant’s investment adviser (not including any sub-adviser whose role is primarily portfolio management and is subcontracted with or overseen by another investment adviser) and any entity controlling, controlled by, or under common control with the adviser that provides ongoing services to the registrant for an engagement that related directly to the operations and financial reporting of the registrant.
(c) Tax Fees. Aggregate Tax Fees billed by the principal accountant to the registrant for professional services rendered during the fiscal years ended May 31, 2009 and May 31, 2008 are approximately as follows:
2009 | | 2008 | |
$ | 10,500 | | $ | 23,300 | |
| | | | | |
Tax Fees include amounts for the review of annual tax returns, the review of required shareholder distribution calculations and typically include amounts for professional services by the principal accountant for tax compliance, tax advice and tax planning. In fiscal year 2008, Tax Fees also include agreed-upon procedures related to a fund merger and the review of a final tax return.
During the fiscal years ended May 31, 2009 and May 31, 2008, there were no Tax Fees billed by the registrant’s principal accountant to the registrant’s investment adviser (not
including any sub-adviser whose role is primarily portfolio management and is subcontracted with or overseen by another investment adviser) and any entity controlling, controlled by, or under common control with the adviser that provides ongoing services to the registrant for an engagement that related directly to the operations and financial reporting of the registrant.
(d) All Other Fees. Aggregate All Other Fees billed by the principal accountant to the registrant for professional services rendered during the fiscal years ended May 31, 2009 and May 31, 2008 are approximately as follows:
All Other Fees include amounts for products and services provided by the principal accountant, other than the services reported in paragraphs (a) through (c) above.
Aggregate All Other Fees billed by the registrant’s principal accountant to the registrant’s investment adviser (not including any sub-adviser whose role is primarily portfolio management and is subcontracted with or overseen by another investment adviser) and any entity controlling, controlled by, or under common control with the adviser that provides ongoing services to the registrant for an engagement that related directly to the operations and financial reporting of the registrant during the fiscal years ended May 31, 2009 and May 31, 2008 are approximately as follows:
2009 | | 2008 | |
$ | 711,800 | | $ | 1,210,800 | |
| | | | | |
In both fiscal years 2009 and 2008, All Other Fees consist of fees billed for internal control examinations of the registrant’s transfer agent and investment advisor.
(e)(1) Audit Committee Pre-Approval Policies and Procedures
The registrant’s Audit Committee is required to pre-approve the engagement of the registrant’s independent accountants to provide audit and non-audit services to the registrant and non-audit services to its investment adviser (not including any sub-adviser whose role is primarily portfolio management and is subcontracted with or overseen by another investment adviser) or any entity controlling, controlled by or under common control with such investment adviser that provides ongoing services to the registrant (“Adviser Affiliates”), if the engagement relates directly to the operations and financial reporting of the registrant.
The Audit Committee has adop ted a Policy for Engagement of Independent Accountants for Audit and Non-Audit Services (“Policy”). The Policy sets forth the understanding of the Audit Committee regarding the engagement of the registrant’s independent accountants to provide (i) audit and permissible audit-related, tax and other services to the registrant (collectively “Fund Services”); (ii) non-audit services to the
registrant’s investment adviser (not including any sub-adviser whose role is primarily portfolio management and is subcontracted with or overseen by another investment adviser) and Adviser Affiliates, if the engagement relates directly to the operations or financial reporting of a Fund (collectively “Fund-related Adviser Services”); and (iii) certain other audit and non-audit services to the registrant’s investment adviser (not including any sub-adviser whose role is primarily portfolio management and is subcontracted with or overseen by another investment adviser) and Adviser Affiliates. Unless a type of service receives general pre-approval under the Policy, it requires specific pre-approval by the Audit Committee if it is to be provided by the independent accountants. Pre-approval of non-audit services to the registrant, the registrant’s investment adviser (not including a ny sub-adviser whose role is primarily portfolio management and is subcontracted with or overseen by another investment adviser) and Adviser Affiliates may be waived provided that the “de minimis” requirements set forth under paragraph (c)(7)(i)(C) of Rule 2-01 of Regulation S-X are met.
Under the Policy, the Audit Committee may delegate pre-approval authority to any pre-designated member or members who are Independent Trustees/Directors. The member(s) to whom such authority is delegated must report, for informational purposes only, any pre-approval decisions to the Audit Committee at its next regular meeting. The Audit Committee’s responsibilities with respect to the pre-approval of services performed by the independent accountants ma y not be delegated to management.
The Policy requires the Fund Treasurer and/or Director of Board Administration to submit to the Audit Committee, on an annual basis, a schedule of the types of services that are subject to general pre-approval. The schedule(s) provide a description of each type of service that is subject to general pre-approval and, where possible, will provide estimated fee caps for each instance of providing each service. The Audit Committees will review and approve the types of services and review the projected fees for the next fiscal year and may add to, or subtract from, the list of general pre-approved services from time to time based on subsequent determinations. That approval acknowledges that the Audit Committee is in agreement with the specific types of services that the independent accountants will be permitted to perform.
The Fund Treasurer and/or Director of Board Administration shall report to the Audit Committee at each of its regular meetings regarding all Fund Services or Fund-related Adviser Services initiated since the last such report was rendered, including a general description of the services, actual billed and projected fees, and the means by which such Fund Services or Fund-related Adviser Services were pre-approved by the Audit Committee.
*****
(e)(2) The percentage of services described in paragraphs (b) through (d) of this Item approved pursuant to the “de minimis” exception under paragraph (c)(7)(i)(C) of Rule 2-01 of Regulation S-X during both fiscal years ended May 31, 2009 and May 31, 2008 was zero.
(f) Not applicable.
(g) The aggregate non-audit fees billed by the registrant’s accountant for services rendered to the registrant, and rendered to the registrant’s investment adviser (not including any sub-adviser whose role is primarily portfolio management and is subcontracted with or overseen by another investment adviser), and any entity controlling, controlled by, or under common control with the adviser that provides ongoing services to the registrant for the fiscal years ended May 31, 2009 and May 31, 2008 are approximately as follows:
2009 | | 2008 | |
$ | 731,500 | | $ | 1,259,100 | |
| | | | | |
(h) The registrant’s Audit Committee of the Board of Directors has considered whether the provision of non-audit services that were rendered to the registrant’s adviser (not including any sub-adviser whose role is primarily portfolio management and is subcontracted with or overseen by another investment adviser), and any entity controlling, controlled by, or under common control with the investment adviser that provides ongoing services to the registrant that were not pre-approved pursuant to paragraph (c)(7)(ii) of Rule 2-01 of Regulation S-X, is compatible with maintaining the principal accountant’s independence.
Item 5. Audit Committee of Listed Registrants.
Not applicable.
Item 6. Investments
(a) The registrant’s “Schedule I — Investments in securities of unaffiliated issuers” (as set forth in 17 CFR 210.12-12) is included in Item 1 of this Form N-CSR.
(b) Not applicable.
Item 7. Disclosure of Proxy Voting Policies and Procedures for Closed-End Management Investment Companies.
Not applicable.
Item 8. Portfolio Managers of Closed-End Management Investment Companies.
Not applicable.
Item 9. Purchases of Equity Securities by Closed-End Management Investment Company and Affiliated Purchasers.
Not applicable.
Item 10. Submission of Matters to a Vote of Security Holders.
There have not been any material changes to the procedures by which shareholders may recommend nominees to the registrant’s board of directors, since those procedures were last disclosed in response to requirements of Item 407(c)(2)(iv) of Regulation S-K (as required by Item 22(b)(15) of Schedule 14A) or this Item.
Item 11. Controls and Procedures.
(a) The registrant’s principal executive officer and principal financial officers, based on their evaluation of the registrant’s disclosure controls and procedures as of a date within 90 days of the filing of this report, have concluded that such controls and procedures are adequately designed to ensure that information required to be disclosed by the registrant in Form N-CSR is accumulated and communicated to the registrant’s management, including the principal executive officer and principal financial officer, or persons performing similar functions, as appropriate to allow timely decisions regarding required disclosure.
(b) There was no change in the registrant’s internal control over financial reporting that occurred during the registrant’s second fiscal quarter of the period covered by this report that has materially affected, or is reasonably likely to materially affect, the registrant’s internal control over financial reporting.
Item 12. Exhibits.
(a)(1) Code of ethics required to be disclosed under Item 2 of Form N-CSR attached hereto as Exhibit 99.CODE ETH.
(a)(2) Certifications pursuant to Rule 30a-2(a) under the Investment Company Act of 1940 (17 CFR 270.30a-2(a)) attached hereto as Exhibit 99.CERT.
(a)(3) Not applicable.
(b) Certification pursuant to Rule 30a-2(b) under the Investment Company Act of 1940 (17 CFR 270.30a-2(b)) attached hereto as Exhibit 99.906CERT.
SIGNATURES
Pursuant to the requirements of the Securities Exchange Act of 1934 and the Investment Company Act of 1940, the registrant has duly caused this report to be signed on its behalf by the undersigned, thereunto duly authorized.
(registrant) | | Columbia Funds Series Trust I | |
| | |
| | |
By (Signature and Title) | | /s/ J. Kevin Connaughton | |
| J. Kevin Connaughton, President | |
| | |
| | |
Date | | July 22, 2009 | |
| | | | | |
Pursuant to the requirements of the Securities Exchange Act of 1934 and the Investment Company Act of 1940, this report has been signed below by the following persons on behalf of the registrant and in the capacities and on the dates indicated.
By (Signature and Title) | | /s/ J. Kevin Connaughton | |
| J. Kevin Connaughton, President | |
| | |
| | |
Date | | July 22, 2009 | |
| | |
| | |
By (Signature and Title) | | /s/ Michael G. Clarke | |
| Michael G. Clarke, Chief Financial Officer | |
| | |
| | |
Date | | July 22, 2009 | |
| | | | | |